Exhibit 99.2
| SCBT Financial Corporation 1st Quarter 2013 Earnings Conference Call April 26, 2013 |
| Forward Looking Statements and Non-GAAP Measures 2 Cautionary Statement Regarding Forward Looking Statements Statements included in this report which are not historical in nature are intended to be, and are hereby identified as, forward looking statements for purposes of the safe harbor provided by Section 21E of the Securities Exchange Act of 1934. Forward looking statements generally include words such as “expects,” “projects,” “anticipates,” “believes,” “intends,” “estimates,” “strategy,” “plan,” “potential,” “possible” and other similar expressions. The Company cautions readers that forward looking statements are subject to certain risks and uncertainties that could cause actual results to differ materially from forecasted results. Such risks and uncertainties, include, among others, the following possibilities: (1) the occurrence of any event, change or other circumstances that could give rise to the termination of the definitive merger agreement between the Company and First Financial Holdings, Inc. (“First Financial”); (2) the outcome of any legal proceedings that may be instituted against the Company or First Financial; (3) the inability to complete the transactions contemplated by the Merger Agreement due to the failure to satisfy each transaction’s respective conditions to completion, including the receipt of regulatory approval; (4) credit risk associated with an obligor’s failure to meet the terms of any contract with the bank or otherwise fail to perform as agreed; (5) interest risk involving the effect of a change in interest rates on both the bank’s earnings and the market value of the portfolio equity; (6) liquidity risk affecting the bank’s ability to meet its obligations when they come due; (7) price risk focusing on changes in market factors that may affect the value of traded instruments in “mark-to-market” portfolios; (8) transaction risk arising from problems with service or product delivery; (9) compliance risk involving risk to earnings or capital resulting from violations of or nonconformance with laws, rules, regulations, prescribed practices, or ethical standards; (10) strategic risk resulting from adverse business decisions or improper implementation of business decisions; (11) reputation risk that adversely affects earnings or capital arising from negative public opinion; (12) terrorist activities risk that results in loss of consumer confidence and economic disruptions; (13) cybersecurity risk related to our dependence on internal computer systems and the technology of outside service providers, as well as the potential impacts of third-party security breaches, subjects the company to potential business disruptions or financial losses resulting from deliberate attacks or unintentional events; (14) economic downturn risk resulting in deterioration in the credit markets; (15) greater than expected noninterest expenses; (16) excessive loan losses; (17) failure to realize synergies and other financial benefits from, and to limit liabilities associates with, mergers and acquisitions, including mergers with Peoples Bancorporation (“Peoples”), The Savannah Bancorp, Inc. (“Savannah”), and First Financial, within the expected time frame; (18) potential deposit attrition, higher than expected costs, customer loss and business disruption associated with the integration of Savannah and First Financial, including, without limitation, potential difficulties in maintaining relationships with key personnel and other integration related-matters; (19) the risks of fluctuations in market prices for Company Common Stock that may or may not reflect economic condition or performance of the Company; (20) the payment of dividends on Company Common Stock is subject to regulatory supervision as well as the discretion of the board of directors of the Company; and (21) other factors, which could cause actual results to differ materially from future results expressed or implied by such forward looking statements. Non-GAAP Measures Statements included in this presentation include non-GAAP measures and should be read along with the accompanying tables to the earnings release which provide a reconciliation of non-GAAP measures to GAAP measures. Management believes that these non-GAAP measures provide additional useful information. Non-GAAP measures should not be considered as an alternative to any measure of performance or financial condition as promulgated under GAAP, and investors should consider the company's performance and financial condition as reported under GAAP and all other relevant information when assessing the performance or financial condition of the company. Non-GAAP measures have limitations as analytical tools, and investors should not consider them in isolation or as a substitute for analysis of the company's results or financial condition as reported under GAAP. |

| 1st Quarter 2013 Highlights Savannah Bancorp system conversion complete Announcement of First Financial Holdings merger Net Income of $10.6 Million or $0.63 per diluted share Operating income of $12.0 Million or $0.71 per diluted share Net Interest Margin increased to 4.94% Continued Asset Quality Improvement NPAs down $4.7 Million Classified assets down $2.3 Million Net charge off rate reduced to an annualized 56 basis points ALLL represents 1.60% of total non-acquired loans Non-acquired loan growth of $33 Million (annualized 5%) 3 |
| Loans $33 Million in legacy loan growth came primarily in Upstate South Carolina, Savannah & Northeast Georgia markets Growth in commercial real estate and C&I loans New loan growth of ~ $20 Million out of the Savannah market since Dec-12 closing Acquired loans have declined $79 Million in 1st quarter Deposits: Non-Interest bearing deposits in excess of $1 Billion Continued decrease certificates of deposit Total cost of funds declined to 0.21% Core deposits total 76% of total deposits Trust and Investment Services Assets under management: $ 1.8 Billion Income up $570,000 linked quarter First full quarter impact of Minis & Co. Mortgage Income down from very robust 4th Quarter March production: 60% refinance and 40% purchase money Current pipeline of $ 210 million 1st Quarter 2013 Highlights 4 |
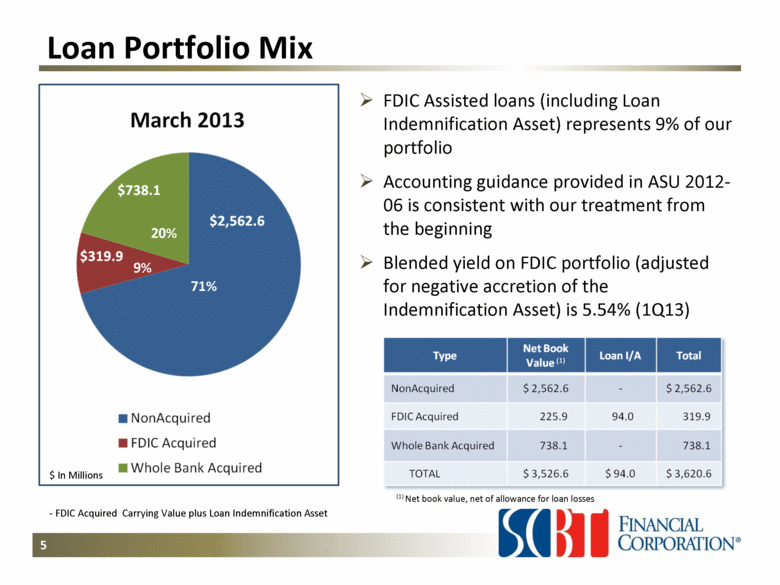
| FDIC Assisted loans (including Loan Indemnification Asset) represents 9% of our portfolio Accounting guidance provided in ASU 2012-06 is consistent with our treatment from the beginning Blended yield on FDIC portfolio (adjusted for negative accretion of the Indemnification Asset) is 5.54% (1Q13) Loan Portfolio Mix 5 - FDIC Acquired Carrying Value plus Loan Indemnification Asset $ In Millions 20% 71% 9% (1) Net book value, net of allowance for loan losses March 2013 $738.1 20% $2,562.6 $319.9 9% 71% NonAcquired FDIC Acquired Whole Bank Acquired Type Net Book Value(1) Loan I/A Total NonAcquired $ 2,562.6 - $ 2,562.6 FDIC Acquired 225.9 94.0 319.9 Whole Bank Acquired 738.1 - 738.1 TOTAL $ 3,526.6 $94.0 $ 3,620.6 |
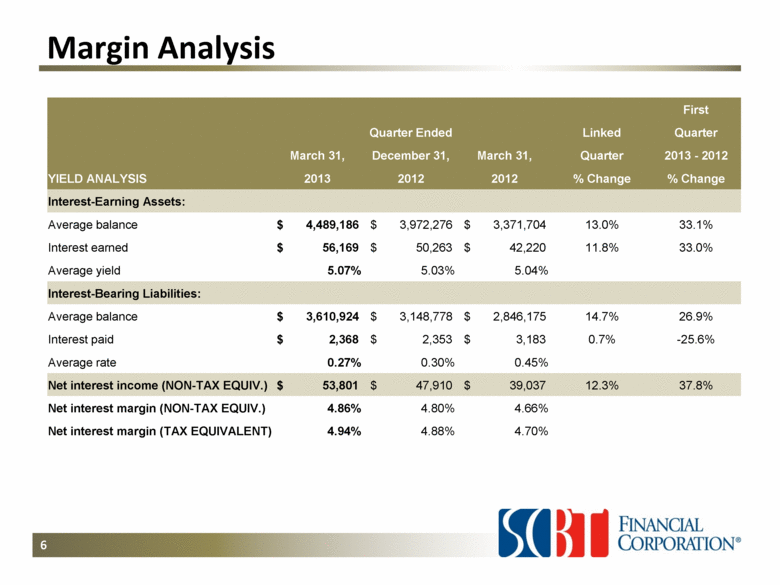
| Margin Analysis 6 First Quarter Ended Linked Quarter March 31, December 31, March 31, Quarter 2013 - 2012 YIELD ANALYSIS 2013 2012 2012 % Change % Change Interest-Earning Assets: Average balance $ 4,489,186 $ 3,972,276 $ 3,371,704 13.0% 33.1% Interest earned $ 56,169 $ 50,263 $ 42,220 11.8% 33.0% Average yield 5.07% 5.03% 5.04% Interest-Bearing Liabilities: Average balance $ 3,610,924 $ 3,148,778 $ 2,846,175 14.7% 26.9% Interest paid $ 2,368 $ 2,353 $ 3,183 0.7% -25.6% Average rate 0.27% 0.30% 0.45% Net interest income (NON-TAX EQUIV.) $ 53,801 $ 47,910 $ 39,037 12.3% 37.8% Net interest margin (NON-TAX EQUIV.) 4.86% 4.80% 4.66% Net interest margin (TAX EQUIVALENT) 4.94% 4.88% 4.70% |
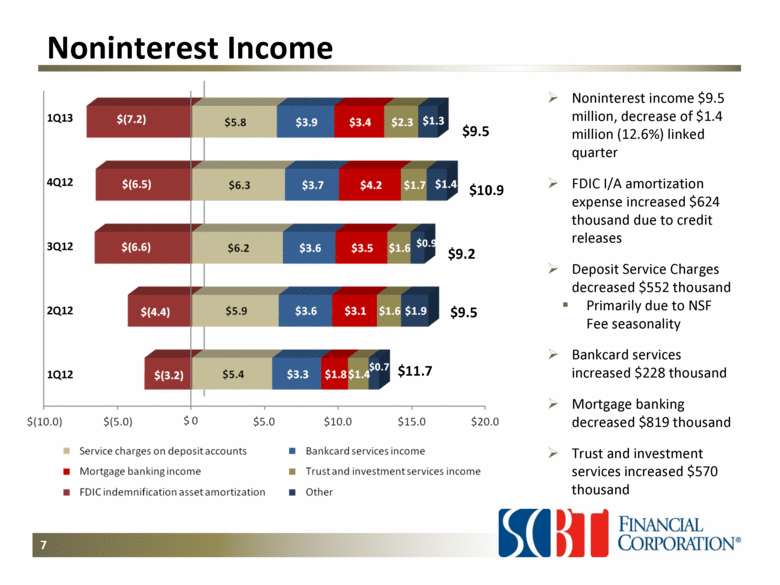
| Noninterest income $9.5 million, decrease of $1.4 million (12.6%) linked quarter FDIC I/A amortization expense increased $624 thousand due to credit releases Deposit Service Charges decreased $552 thousand Primarily due to NSF Fee seasonality Bankcard services increased $228 thousand Mortgage banking decreased $819 thousand Trust and investment services increased $570 thousand Noninterest Income 7 $9.5 $9.2 $11.7 $10.9 $9.5 1Q13 4Q12 3Q12 2Q12 1Q12 |
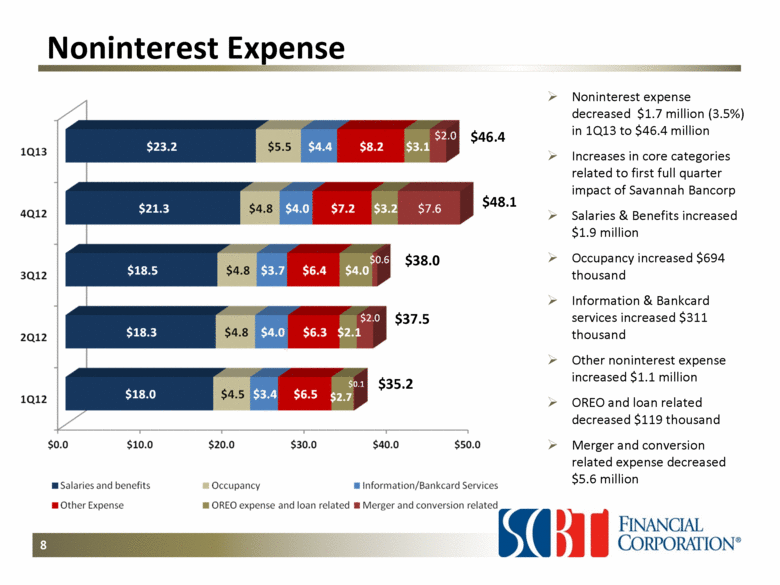
| Noninterest Expense Noninterest expense decreased $1.7 million (3.5%) in 1Q13 to $46.4 million Increases in core categories related to first full quarter impact of Savannah Bancorp Salaries & Benefits increased $1.9 million Occupancy increased $694 thousand Information & Bankcard services increased $311 thousand Other noninterest expense increased $1.1 million OREO and loan related decreased $119 thousand Merger and conversion related expense decreased $5.6 million 8 $37.5 $38.0 $46.4 $48.1 $35.2 1Q13 4Q12 3Q12 2Q12 1Q12 $0.0 $10.0 $20.0 $30.0 $40.0 $50.0 $5.5 $4.8 $4.8 $4.8 $4.5 |
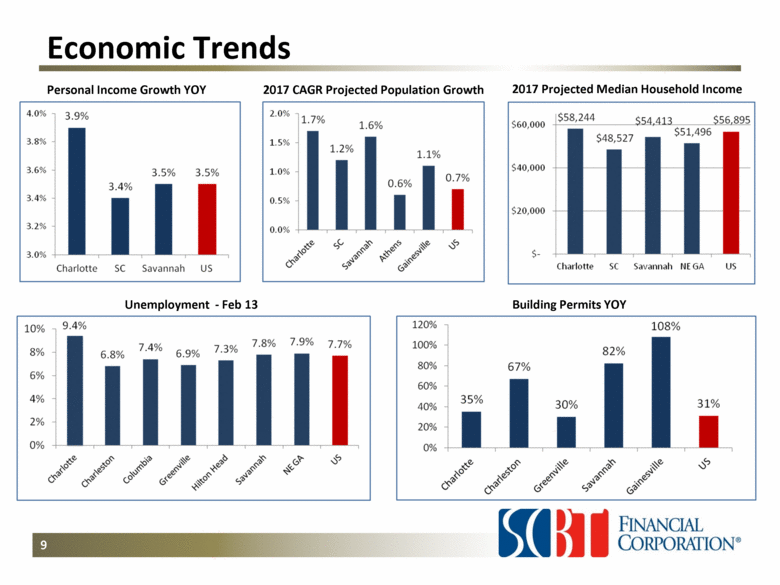
| 9 Economic Trends 2017 CAGR Projected Population Growth Unemployment - Feb 13 Building Permits YOY Personal Income Growth YOY 2017 Projected Median Household Income 4.0% |
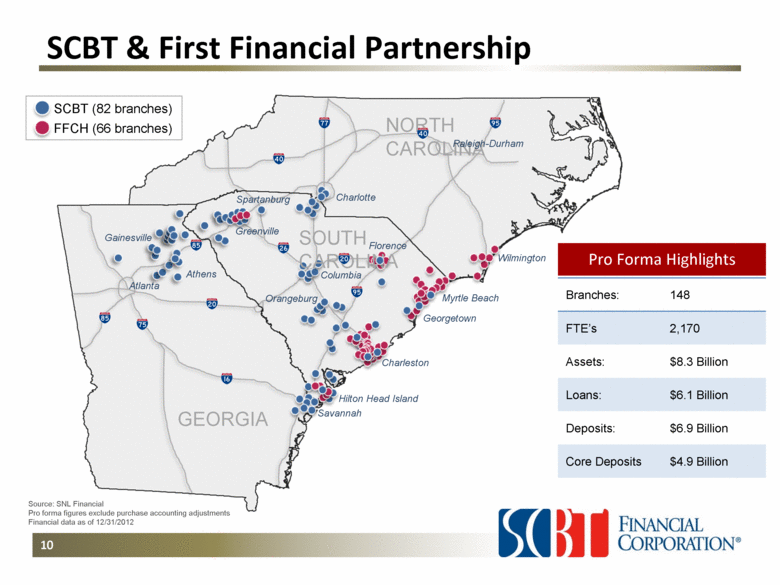
| Source: SNL Financial Pro forma figures exclude purchase accounting adjustments Financial data as of 12/31/2012 SCBT (82 branches) FFCH (66 branches) NORTH CAROLINA SOUTH CAROLINA GEORGIA Charlotte Wilmington Myrtle Beach Hilton Head Island Savannah Atlanta Florence Columbia Spartanburg Greenville Athens Gainesville Orangeburg Georgetown Charleston Raleigh-Durham Branches: 148 FTE’s 2,170 Assets: $8.3 Billion Loans: $6.1 Billion Deposits: $6.9 Billion Core Deposits $4.9 Billion Pro Forma Highlights SCBT & First Financial Partnership 10 |