Exhibit 99.1
| Gulf South Conference May 14, 2013 |
| Cautionary Statement Regarding Forward Looking Statements Statements included in this report which are not historical in nature are intended to be, and are hereby identified as, forward looking statements for purposes of the safe harbor provided by Section 21E of the Securities Exchange Act of 1934. Forward looking statements generally include words such as “expects,” “projects,” “anticipates,” “believes,” “intends,” “estimates,” “strategy,” “plan,” “potential,” “possible” and other similar expressions. The Company cautions readers that forward looking statements are subject to certain risks and uncertainties that could cause actual results to differ materially from forecasted results. Such risks and uncertainties, include, among others, the following possibilities: (1) the occurrence of any event, change or other circumstances that could give rise to the termination of the definitive merger agreement between the Company and First Financial Holdings, Inc. (“First Financial”); (2) the outcome of any legal proceedings that may be instituted against the Company or First Financial; (3) the inability to complete the transactions contemplated by the Merger Agreement due to the failure to satisfy each transaction’s respective conditions to completion, including the receipt of regulatory approval; (4) credit risk associated with an obligor’s failure to meet the terms of any contract with the bank or otherwise fail to perform as agreed; (5) interest risk involving the effect of a change in interest rates on both the bank’s earnings and the market value of the portfolio equity; (6) liquidity risk affecting the bank’s ability to meet its obligations when they come due; (7) price risk focusing on changes in market factors that may affect the value of traded instruments in “mark-to-market” portfolios; (8) transaction risk arising from problems with service or product delivery; (9) compliance risk involving risk to earnings or capital resulting from violations of or nonconformance with laws, rules, regulations, prescribed practices, or ethical standards; (10) strategic risk resulting from adverse business decisions or improper implementation of business decisions; (11) reputation risk that adversely affects earnings or capital arising from negative public opinion; (12) terrorist activities risk that results in loss of consumer confidence and economic disruptions; (13) cybersecurity risk related to our dependence on internal computer systems and the technology of outside service providers, as well as the potential impacts of third-party security breaches, subjects the company to potential business disruptions or financial losses resulting from deliberate attacks or unintentional events; (14) economic downturn risk resulting in deterioration in the credit markets; (15) greater than expected noninterest expenses; (16) excessive loan losses; (17) failure to realize synergies and other financial benefits from, and to limit liabilities associates with, mergers and acquisitions, including mergers with Peoples Bancorporation (“Peoples”), The Savannah Bancorp, Inc. (“Savannah”), and First Financial, within the expected time frame; (18) potential deposit attrition, higher than expected costs, customer loss and business disruption associated with the integration of Savannah and First Financial, including, without limitation, potential difficulties in maintaining relationships with key personnel and other integration related-matters; (19) the risks of fluctuations in market prices for Company Common Stock that may or may not reflect economic condition or performance of the Company; (20) the payment of dividends on Company Common Stock is subject to regulatory supervision as well as the discretion of the board of directors of the Company; and (21) other factors, which could cause actual results to differ materially from future results expressed or implied by such forward looking statements. Non-GAAP Measures Statements included in this presentation include non-GAAP measures and should be read along with the accompanying tables to the earnings release which provide a reconciliation of non-GAAP measures to GAAP measures. Management believes that these non-GAAP measures provide additional useful information. Non-GAAP measures should not be considered as an alternative to any measure of performance or financial condition as promulgated under GAAP, and investors should consider the company's performance and financial condition as reported under GAAP and all other relevant information when assessing the performance or financial condition of the company. Non-GAAP measures have limitations as analytical tools, and investors should not consider them in isolation or as a substitute for analysis of the company's results or financial condition as reported under GAAP. SCBT will file a registration statement and other relevant documents concerning the transaction with the Securities and Exchange Commission and appropriate state and federal banking authorities as soon as is practical. SCBT and First Financial will prepare a proxy statement and other relevant documents concerning the proposed transaction for its shareholders. Both SCBT and First Financial shareholders are urged to read such proxy and registration statements regarding the proposed transaction as they become available and any other relevant documents filed with the SEC, as well as any amendments or supplements to those documents because these will contain important information. You will be able to obtain a free copy of the registration statement, as well as other filings containing information about SCBT Financial Corporation and First Financial Holdings, Inc., at the SEC’s internet site (http://www.sec.gov). The documents can also be obtained, without charge, by directing a written request to either SCBT Financial Corporation, P. O. Box 1030, Columbia, SC 29202, Attention: Richard C. Mathis, Executive Vice President and Treasurer, or First Financial Holdings, Inc., 2440 Mall Drive, Charleston, SC 29406, Attention: Blaise B. Bettendorf, Chief Financial Officer. SCBT Financial Corporation, First Financial Holdings, Inc., and their respective directors and executive officers may be deemed to be participants in the solicitation of proxies from the shareholders of SCBT and First Financial in connection with the merger. Information about the directors and executive officers of First Financial and their respective ownership of FFCH common stock is set forth in First Financial’s most recent proxy statement as filed with the SEC, which is available at the SEC’s Internet site (http://www.sec.gov) and at First Financial’s address above. Information about the directors and executive officers of SCBT Financial Corporation and their ownership of SCBT stock is set forth in SCBT’s most recent proxy statement filed with the SEC and available at the SEC’s internet site and from SCBT at the address set forth above. Additional information regarding the interests of these participants may be obtained by reading the proxy statement/prospectus regarding the proposed transaction when it becomes available. 2 |
| Data as of 3/31/2013 SCBT FINANCIAL CORPORATION LARGEST PUBLICLY TRADED HOLDING COMPANY HEADQUARTERED IN SC Serving the banking needs of customers within the Carolinas for 80 years and Georgia for 113 years 3 Market Cap $845.2 million Branches 81 FTE’s 1,312 Asset Size $5.1 billion Deposits $4.2 billion Loans $3.6 billion Customers 336,000 |
| HIGHLIGHTS OF SCBT Consistent Organic Growth Large and Low Cost Deposit Base Fee Income Growth and Diversity 4 Fortress Balance Sheet Organic Revenue And Profit Growth Strategic Expansion Building Tangible Book Value per Share Quality Loan and Deposit Relationships Simple Business Model and Balance Sheet Well Defined M&A Strategy Focus on integration and execution of First Financial Holdings through 2014 1Q 2013 Earnings Net Income = $10.6 Million Net Operating Earnings = $12.0 Million Pre-Tax, Pre-Credit = $21.9 Million |

| HOW WE OPERATE THE COMPANY 5 |
| MARKET PERFORMANCE See endnotes (1) Price Performance since 12/31/08 6 Pricing data as of 5/3/13 20.0 60.0 100.0 140.0 180.0 SCBT Total Return SCBT Carolina Peers Georgia Peers KRX 54.0% 40.2% (0.1%) (40.7%) (44.4%) |
| February 20, 2013 Strategic Partnership of SCBT Financial Corporation and First Financial Holdings, Inc. |
| 8 PARTNERSHIP RATIONALE A natural partnership between two culturally similar South Carolina community banks Significant franchise accretion Forms continuous coastal presence from Savannah, GA to Wilmington, NC Enhances market share in all combined markets Strategic Value Financially Attractive Low Risk Profile Partnership epitomizes highly selective M&A criteria Double digit EPS accretion (excluding one-time merger costs) Expected to be accretive to tangible book value in 3 to 3.5 years Similar markets for 80 years Comprehensive due diligence process and thorough review of loan portfolio Cohesive culture with familiar customer base Strong pro forma capital ratios SOUNDNESS PROFITABILITY GROWTH |
| 100% Stock (tax-free exchange) Fixed exchange ratio of 0.4237x $18.30 (1) $302.4 million (1) Initially will retain First Financial’s $65.0 million of preferred equity outstanding No additional capital required to complete the transaction 5 First Financial Board members will join the Board of SCBT Customary regulatory approval and shareholder approval from both SCBT & First Financial 3rd Quarter 2013 TRANSACTION TERMS 9 Consideration: Implied Price Per Share: Aggregate Value: Preferred Equity: Capital Raise: Board Seats: Required Approvals: Expected Closing: Based on SCBT’s closing stock price of $43.18 as of 2/19/13 and a fixed exchange ratio of 0.4237x (1) |
| STRATEGICALLY ATTRACTIVE 10 Pro Forma Company At closing and pending shareholder approval, holding company name will be changed to First Financial Holdings, Inc. Consensus 2013 mean EPS estimate of $1.18 per SNL FactSet Research Based upon First Financial’s stated tangible book value per share of $13.71 as of 12/31/12 Holding Company Name SCBT Financial Corporation Headquarters Columbia, SC Expanded Operations & Support Center Charleston, SC Proposed Holding Company Name First Financial Holdings, Inc. (1) Price/Tangible Book Value Per Share 133% (2) Price/Estimated 2013 EPS 15.5x (3) Pro Forma Ownership First Financial pro forma ownership will be approximately 29.3 % Transaction Multiples (1) (2) (3) |
| Overall credit mark of $217.9 million NonAcquired mark 5.3%, $118.2 million FDIC Acquired: Gross mark of $99.7 million TBV accretive ~ 3 to 3.5 years Double digit EPS accretive (excluding one-time merger costs) Assumes preferred equity remains outstanding Projected Close in 3rd Quarter 2013 Cost savings ~ 30% 30% realized in 2013 80% realized in 2014 100% realized thereafter No revenue synergies assumed One-time merger related expenses ~ $24 to 30 million (after-tax) FINANCIAL IMPACT Assumptions 11 Pro Forma Capital Ratios SCBT Tier 1 Leverage Ratio ~ 8.9 % Tier 1 Risk-Based Ratio ~ 12.9 Tangible Common Equity / Tangible Assets ~ 7.0 |
| Comprehensive credit due diligence process to review First Financial’s loan and OREO portfolios Conservative credit mark of 5.3% for NonAcquired / NonFDIC $118.2 63% Commercial loans were reviewed. All loans greater than $650K with additional selective review Review of Consumer portfolio was complemented with an experienced 3rd Party vendor FDIC Acquired gross credit mark of $99.7 million CREDIT DUE DILIGENCE NonAcquired Credit Adjustments (1) Diligence Highlights Excludes mark to covered loan and OREO portfolios, and corresponding write-up to the indemnification asset Excludes covered net charge-offs and OREO costs 12 Implied cumulative losses ~ 20.7% Pre-mark losses of 15.4% through cycle Cumulative losses of 20.7% including non-acquired mark 12/31/12 Loan Balance Estimated Mark % Estimated Mark $ Fair Value $ Loans Losses as a % 20.7% (1) (2) |
| LOGICAL IN-MARKET EXPANSION 13 SCBT Branches as of 2/15/2013 Financial data as of 12/31/2012 SCBT (82 branches) FFCH (66 branches) NORTH CAROLINA SOUTH CAROLINA GEORGIA Charlotte Wilmington Myrtle Beach Hilton Head Island Savannah Atlanta Florence Columbia Spartanburg Greenville Athens Gainesville Orangeburg Georgetown Charleston Raleigh-Durham Branches: 148 FTE’s 2,170 Assets: $8.3 Billion Loans: $6.1 Billion Deposits: $6.9 Billion Core Deposits $4.9 Billion Pro Forma Highlights See endnotes (2) |
| MSA SCBT Rank FFCH Rank Pro Forma Hilton Head 2 7 1 Georgetown 8 3 1 Charleston 10 2 2 Florence 10 7 4 Greenville 7 14 5 Myrtle Beach 19 6 6 FRANCHISES THAT COMPLEMENT EACH OTHER 14 Market Share Mortgage Banking - ProForma Mortgage Market Share #4 in South Carolina Wealth Management - Assets Under Management $2.35 Billion Our Teams Our Facilities |
| Data as of 6/30/12 FDIC Summary of Deposits SOUTH CAROLINA #5 MARKET SHARE 15 Deposit Market Share in South Carolina Deposits Market Rank Institution ($mm) Share Branches 1 Wells Fargo & Co. $12,167 18.12 % 145 2 Bank of America Corp. 9,105 13.56 106 3 BB&T Corp. 6,939 10.34 116 4 First Citizens Bancorp. Inc. 6,148 9.16 171 Pro Forma 5,021 7.48 115 5 Toronto-Dominion Bank 3,489 5.20 81 6 Synovus Financial Corp. 2,743 4.09 42 7 SCBT Financial Corp. 2,599 3.87 53 8 First Financial Holdings Inc. 2,422 3.61 62 9 SunTrust Banks Inc. 1,987 2.96 65 10 Palmetto Bancshares Inc. 1,023 1.52 29 |
| Long-term, dedicated teams Like-minded management and business culture Retention of key management will reinforce continuity Tenured & committed Board of Directors BENEFITS TO OUR STAKEHOLDERS Unlocks shareholder value for both companies Benefit from increased liquidity and dividends for First Financial shareholders Implied annual dividend per FFCH share $0.31 (1) Substantially reduces downside risk and significantly increases long term growth potential 16 Both banks operate under the community banking model and strong service levels Mortgage, wealth management, retail and commercial scale Convenience of expanded network of nearly150 locations, including branches across all major South Carolina markets Continuity in retaining First Financial board members to local Advisory Board Shareholders Customers Employees Based on SCBT’s most recent quarterly dividend of $0.18 per share (1) |
| SUMMARY Ideal combination of strategic and financial attractiveness to all parties Will create long-term value for both First Financial & SCBT shareholders Creates an incredibly valuable Southeastern bank Powerful transaction due to the size, scale and diversity of the combined company Low risk, in-market merger Positions company well for the future 17 |
| SUPPLEMENTAL INFORMATION |

| Financial data as of 12/31/12 FIRST FINANCIAL HOLDINGS, INC. 19 Corporation Highlights Headquarters Charleston, SC Bank Subsidiary First Federal Bank Investment Advisory Subsidiary First Southeast 401(k) Fiduciaries, Inc. Broker-Dealer First Southeast Investor Services, Inc. Date Established 1934 Ticker FFCH (NASDAQ) Branches 66 Total Assets ($mm) $3,216 Total Loans ($mm) 2,506 Total Deposits ($mm) 2,595 TCE / TA 7.07 % NPAs + 90 days PD / L + O 1.94 Net Interest Margin 4.69 Efficiency Ratio 66.71 |
| LOAN & DEPOSIT COMPOSITION SCBT Loans FFCH Loans SCBT Deposits FFCH Deposits Total Loans $3.6 billion Loan Yield 5.89% Dollars in millions Data as of 12/31/12 (1) Excludes purchase accounting adjustments $6.1 billion Total Loans (1) $6.9 billion Total Deposits (1) 20 Total Loans $2.5 billion Loan Yield 5.96% Total Deposits $4.3 billion Cost of Deposits 0.18% Total Deposits $2.6 billion Cost of Deposits 0.52% C&D $273 7% Residential $690 19% CRE $1,074 29% C&I $280 8% Consumer & Other $254 7% Acquired non - covered loans $792 22% Acquired covered loans $2838% Demand Deposits $982 23% NOW Accounts $837 19% Money Market & Savings $1,416 33% Retail Time Deposits $1,063 25% C&D $104 4% Residential $1,500 59% CRE $261 10% C&I $69 3% Consumer & Other $400 16% Acquired covered loans $217 9% |
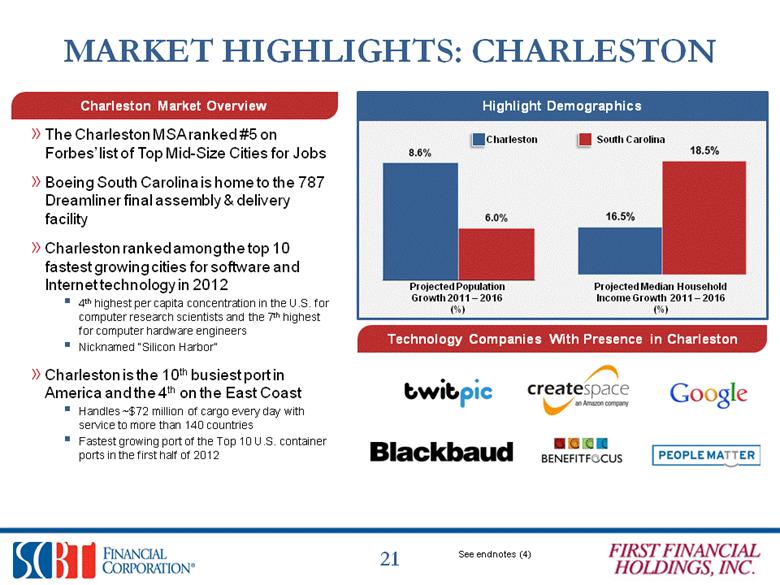
| MARKET HIGHLIGHTS: CHARLESTON The Charleston MSA ranked #5 on Forbes’ list of Top Mid-Size Cities for Jobs Boeing South Carolina is home to the 787 Dreamliner final assembly & delivery facility Charleston ranked among the top 10 fastest growing cities for software and Internet technology in 2012 4th highest per capita concentration in the U.S. for computer research scientists and the 7th highest for computer hardware engineers Nicknamed “Silicon Harbor” Charleston is the 10th busiest port in America and the 4th on the East Coast Handles ~$72 million of cargo every day with service to more than 140 countries Fastest growing port of the Top 10 U.S. container ports in the first half of 2012 Charleston Market Overview Charleston South Carolina Technology Companies With Presence in Charleston Projected Population Growth 2011 – 2016 (%) 21 Highlight Demographics Projected Median Household Income Growth 2011 – 2016 (%) See endnotes (4) |
| First Financial currently operates 7 branches in the Wilmington, NC MSA North Carolina ranked as Forbes 4th Best State for Business in 2012 Highest net migration rate in the US Low cost of construction attracts future development opportunities in the region Port of Wilmington was recently approved for the development of a state-of-the-art cold storage facility Projected median household income in 2016 of $50,119 in the Wilmington, NC MSA 22 Wilmington, NC Market Overview First Financial’s Presence in the Wilmington, NC MSA Projected Population Growth 2011 – 2016 (%) Projected Median Household Income Growth 2011 – 2016 (%) Demographics FFCH Branch Wilmington North Carolina NORTH CAROLINA MARKET HIGHLIGHTS See endnotes (5) 9.0% 6.6% 23.3% 19.2% |
| Myrtle Beach, SC MSA Charleston, SC MSA N. Charleston Charleston North Myrtle Beach Myrtle Beach Garden City Beach EXPANSION IN ATTRACTIVE MARKETS 23 NC GA SC SCBT FFCH Hilton Head Pro Forma Map Charleston Myrtle Beach Greenville Greenville, SC MSA Hilton Head-Beaufort, SC MSA Hilton Head Island Savannah Beaufort Greenville Easley Pro Forma Deposit Market Share #5 #5 #1 #6 #2 |
| Strength in Numbers: Combined Assets Under Management of $2.35 Billion Combined revenues of over $12.8 Million Combined team of over 60 members Nationally top-ranking among trust and fiduciary services institutions Competitive platform of fully integrated Wealth Management solutions: Full Service Broker-Dealer Registered Investment Advisory Firm WEALTH MANAGEMENT STRATEGIES 24 Wealth Management Corporate Retirement Planning Services Trust and Asset Management Services |

| Pro Forma Mortgage Market Share #4 in SC SCBT #5 / First Financial #8 (6) Platform of integrated Mortgage Banking products: Retail Mortgage: 70 originators covering 12 regional markets Wholesale Mortgage: $600 million in annual production Portfolio Servicing: $2.9 billion in mortgages Sell Direct: Ability to deal directly with FNMA & FHLMC MORTGAGE BANKING STRATEGIES 25 See endnotes (6) |
| SOUNDNESS |

| CREDIT QUALITY (NON-ACQUIRED) 27 See endnotes (7) |
| CAPITAL 28 See endnotes (7) As of December 31, 2012 |
| PROFITABILITY |

| PROFITABILITY 30 In Millions See endnotes (8) |
| CONSISTENT LONG-TERM EARNINGS POWER In Millions |
| 32 NET INTEREST MARGIN |
| OPERATING EFFICIENCY RATIO - QTD 33 See endnotes (10) |
| DIVIDENDS 34 See endnotes (11) |
| GROWTH |

| LEGACY LOAN PORTFOLIO MIX 36 4.4 % 5 YR CAGR (2007 �� 2012) Organic Loan Growth In Millions See endnotes (12) |
| GROWTH – CORE & TOTAL DEPOSITS 37 In Millions Growth – Core Deposits* 35.1% 5 YR CAGR (2007 – 2012) Growth – Total Deposits 36.9% 5 YR CAGR (2007 – 2012) Acquired Deposits $3,004 $2,350 $3,254 See endnotes (13) $4,298 $4,219 |
| Habersham Bank SUPPLEMENTAL INFORMATION |

| INDEX – SUPPLEMENTAL INFORMATION Largest Relationships....40 ALLL Trend.........41 Credit Trends..42 Investment Portfolio...43 Fee Income by Type..44 CD Re-pricing....45 Market Demographics..46 Analyst Recommendations.....51 39 |
| 40 LARGEST CREDIT RELATIONSHIPS (NON-ACQUIRED) Number of Loan Relationships Total Relationship Balance Top 25 Top 50 Top 100 Top 200 Total Loans Outstanding (Non-Acq) $ 184.7 7.1% $ 304.7 11.7% $ 462.2 17.7% $ 692.5 26.6% $ 2,604.3 100.0% |
| ALLL TREND DATA (NON-ACQUIRED LOANS) 41 2.00 % 1.91 % See endnotes (15) 1.84 % 1.73 % 1.60 % |
| 42 CREDIT TRENDS (NON-ACQUIRED LOANS) See endnotes (21) (in millions) Mar-12 Jun-12 Sep-12 Dec-12 Mar-13 Total nonperforming assets 91.4 $ 83.1 $ 81.8 $ 81.1 $ 76.4 $ Texas Ratio (21) 25.41% 21.23% 20.43% 19.15% 17.74% Criticized Loans (21) 162.0 $ 151.0 $ 144.5 $ 153.1 $ 147.3 $ Classified Assets (21) 177.5 $ 160.6 $ 157.5 $ 143.2 $ 140.9 $ Classified Assets / Tier 1 Capital + ALLL 43.72% 36.76% 35.46% 29.98% 29.07% |
| BANK INVESTMENT PORTFOLIO MIX 43 Bank Fixed Income Investment Portfolio (AFS & HTM) As of 3/31/13 Tax Equivalent Yield 3.15% Weighted Average Life 4.17 years Modified Duration 3.71 Total Carrying Value(16) $ 525,038 See endnotes (16) State and Municipal - HTM 3% State and Municipal - AFS 27% U.S. Agency/GSE Debentures 14% SBA 3% Mortgage - Backed Securities 53% |
| FEE INCOME BY TYPE 44 24% of Total Income $ 1.8 Billion in Assets Under Management Focused on growing Wealth Management Checking Accounts Secondary Mortgage 1Q2013: $17 Million See endnotes (17) |
| CONTINUED CD REPRICING OPPORTUNITIES 45 Average CD Price in past 30 days ~ 15 BPS Upcoming Maturities (in millions) Amount Yield 2nd Quarter 2013 249.7 $ 0.37% 3rd Quarter 2013 237.0 $ 0.35% 4th Quarter 2013 144.5 $ 0.32% |
| NORTHEAST GEORGIA DEPOSIT MARKET SHARE 46 43 FDIC Insured Institutions, $10.6 Billion Total Deposits Rank Institution (in Millions) Deposit Share 1 Wells Fargo 1,315 12.4% 2 Regions Bank 1,152 10.9% 3 SunTrust Bank 893 8.4% 4 United Community Bank 873 8.3% 5 SCBT 842 8.0 % 6 Synovus 818 7.7% 7 BB&T 573 5.4% 8 Bank of America 545 5.2% 9 First American Bank & Trust 351 3.3% 10 Community Southern Bank 347 3.3% See endnotes (18,19 ) |
| UNEMPLOYMENT DATA 47 |
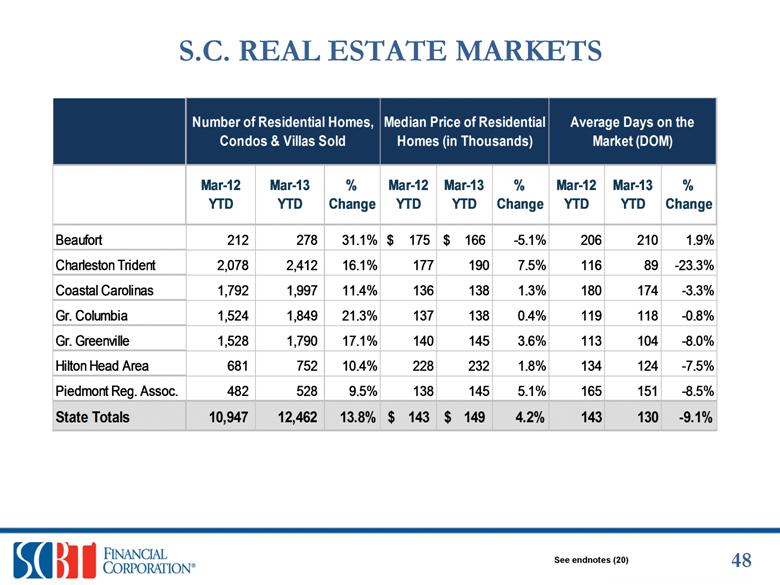
| Number of Residential Homes, Condos & Villas Sold Median Price of Residential Homes (in Thousands) Average Days on the Market (DOM) Mar-12 YTD Mar-13 YTD % Change Mar-12 YTD Mar-13 YTD % Change Mar-12 YTD Mar-13 YTD % Change Beaufort 212 278 31.1% $175 $166 -5.1% 206 210 1.9% Charleston Trident 2,078 2,412 16.1% 177 190 7.5% 116 89 -23.3% Coastal Carolinas 1,792 1,997 11.4% 136 138 1.3% 180 174 -3.3% Gr. Columbia 1,524 1,849 21.3% 137 138 0.4% 119 118 -0.8% Gr. Greenville 1,528 1,790 17.1% 140 145 3.6% 113 104 -8.0% Hilton Head Area 681 752 10.4% 228 232 1.8% 134 124 -7.5% Piedmont Reg. Assoc. 482 528 9.5% 138 145 5.1% 165 151 -8.5% State Totals 10,947 12,462 13.8% $143 $149 4.2% 143 130 -9.1% 48See endnotes (20) |
| DEMOGRAPHIC HIGHLIGHTS IN KEY MARKETS 49 See endnotes (19) |
| $84,000-$120,000 $70,001-84,000 $41,000-$70,000 (Median) $27,001-$41,000 $8,889-$27,000 MEDIAN HOUSEHOLD INCOME 50 See endnotes (19) Demographic Data as of 12/31/2012 |
| ANALYST RECOMMENDATIONS 51 ANALYST First Quarter 2013 RECOMMENDATION BB&T Capital Markets BUY FIG Partners OUTPERFORM Keefe, Bruyette & Woods OUTPERFORM Raymond James STRONG BUY Sandler O’Neill + Partners BUY Sterne Agee OUTPERFORM SunTrust Robinson Humphrey BUY Wunderlich Securities BUY |
| Investor Contacts Robert R. Hill, Jr. Chief Executive Officer John C. Pollok Senior Executive Vice President and Chief Financial Officer / Chief Operating Officer 52 520 Gervais Street Columbia, South Carolina 29201 800-277-2175 www.scbtonline.com |
| ENDNOTES Source: SNL Financial. Pricing data as of 5/313. KRX is a composition of 50 regionally diversified mid and small-cap banking institutions in the U.S and is calculated using and equal-weighted method . Carolina Peers include all major exchange traded banks and thrifts in North Carolina and South Carolina with assets between $500 million and $10.0 billion; excludes merger targets Georgia Peers include all major exchange traded banks and thrifts in Georgia with assets between $500 million and $10.0 billion. Total return includes distribution of dividends Source: SNL Financial. Pro forma figures exclude purchase accounting adjustments Excludes purchase accounting adjustments Source: SNL Financial, Condé Nast, 2012 Statistical Abstract of the US, Fast Company, City of Charleston, Charleston Magazine Source: SNL Financial, Forbes, North Carolina State Ports Authority, Wilmington Business Development Source: SNL Mortgage Market Share as of 2011 Source: SNL Financial and Company filings. Data as of 12/31/12. KRX is a composition of 50 regionally diversified mid- & small-cap banking institutions in the U.S. The index is calculated using an equal-weighted method and components comply with the GICS and ICS classification standards. Carolina’s includes all publicly traded banks and thrifts in North and South Carolina with assets between $500 million and $10.0 billion. Per share data reflect a five percent stock dividend distributed on January 1, 2005 and on March 23, 2007. For 2008, the loss related to the disposal of Freddie Mac Preferred Stock is added back. For 2009, the dividend paid on the preferred stock is added back. Excludes Merger & OREO / Loan-related expenses Efficiency ratio = NIE / Net Int Inc + Non Int Inc less securities gain/(loss) Operating efficiency ratio (exc’l) = same as above except exc’l merger cost & OREO related cost from NIE Dividend paid for 148 consecutive quarters since 1976, Prior to 1976, dividends were paid semi-annually, 1st Quarter 2013 includes dividends declared on 4/23/2013, record date of 5/17/2013, payable on 5/24/2013. Dividends paid per share increased to $0.18 per share in 4th Quarter 2012. Acquired loans are net of purchase accounting adjustments. Core deposits decreased $25 million since Dec-12; Legacy SCBT +$33 million / Acquired - $25.8 million. 1Q2013 # Transaction account growth for Legacy SCBT 5.72% annualized. Total YTD $ Balance growth for core SCBT Legacy 7.1 % annualized . *Core Deposits exclude all certificates of deposits. Loans Note: Net charge-offs excludes the impact of loan participations and a BHC loan. Fair value for AFS securities; amortized/accreted cost for HTM securities. Does not include : FHLB stock, BHC stocks, or investment in unconsolidated subsidiaries. Total Income= Net Interest Income + Noninterest Income (excluding negative accretion of indemnification asset and securities gains (losses). Fees generated from services provided by SCBT. Note: NE Georgia Deposit Market Share includes the following counties: Barrow, Cherokee, Clarke, Habersham, Hall, Jackson, Rabun, Stephens, White. Source: SNL Financial, Demographic Data as of 12/31/2012, Unemployment data as of 3/31/2013, NE GA unemployment data as of 2/28/2013. Source: Rates from S.C. Realtors MLS Stats. Texas ratio – Delinquent loans + nonperforming assets / Tangible Common Equity + ALLL. Criticized Loans – Special Mention. Classified Assets (Classified loans & OREO). Excludes all acquired assets. 53 |