Exhibit 99.2
| Earnings Call 3Q 2020 Friday, October 30, 2020 Exhibit 99.2 |

| 2 Disclaimer Statements included in this communication, whic h are not historical in nature are intended to be, and are hereby identif ied as, forward looking statements for purposes of the safe harbor prov ided by Section 27A of the Securities Act of 1933 and Section 21E of the S ecurities Exchange Act of 1934. Forward looking statements are based on, among other things, management’s beliefs, assum ptions, current expectations, estimates and projections about the financial services industry, the economy and South State. Words and phrases such as “may,” “approximately,” “continue,” “should,” “expects,” “proj ects,” “anticipates,” “is likely,” “look ahead,” “look forward,” “believ es,” “will,” “intends, ” “estimates, ” “strategy,” “plan,” “c ould,” “potential,” “possible” and variations of such words and similar expressions are intended to identify such forward- looking statements. South S tate cautions readers that forward looking statements are subject to certain risks, uncertainties and assumptions that are difficult to predict w ith regard to, among other things, tim ing, extent, likelihood and degree of occurrence, which c ould cause actual results to differ materially from anticipated results. Such risks, uncertainties and assumptions, include, among others, the following:(1) economic downturn risk, potentially resulting in deterioration in the credit markets, greater than expected noninterest expenses, excessiv e loan losses and other negative consequences, w hich risks could be exacerbated by potential negativ e economic developments resulting from federal spending cuts and/or one or more federal budget-related impasses or actions;(2) controls and procedures risk, including the potential failure or circumvention of our controls and procedures orfailure to comply with regulations related to controls and procedures;(3) potential deterioration in real estate values;(4) the impact of competition with other financial institutions, including pricing pressures (including those resulting from the CARES Act) and the resulting impact, including as a result of compression to net interest margin;(5) credit risks associated with an obligor’s failure to meet the terms of any contract w ith the bank or otherwise fail to perform as agreed under the terms of any loan-related document;(6) interest risk involv ing the effect of a change in interest rates on the bank’s earnings, the market value of the bank’s loan and securities portf olios, and the market value of South State’s equity;(7) liquidity risk affecting the bank’s ability to meet its obligations when they come due;(8) risks assoc iated w ith an anticipated increase in South S tate’s investm ent securities portfolio, including risks associated w ith acquiring and holding investment securities or potentially determining that the amount of investment securities South State desires to ac quire are not av ailable on terms acceptable to South State;(9) price risk focusing on changes in market factors that may aff ect the value of traded instruments in “mark- to-market” portfolios;(10) transaction risk arising from problems with service or produc t deliv ery;(11) compliance risk involving risk to earnings or capital resulting from violations of or nonconformance with laws, rules, regulations, prescribed practices, or ethical standards;(12) regulatory change risk resulting from new law s, rules, regulations, accounting principles, proscribed practic es or ethical standards, including, without limitation, the possibility that regulatory agencies may require higher lev els of capital above the current regulatory-mandated minimums and including the impact of the recently enacted CARES Act, the C onsumer Financial Protection Bureau rules and regulations, and the possibility of changes in accounting standards, policies, principles and practices, including changes in accounting principles relating to loan loss rec ognition (CECL);(13) strategic risk resulting from adv erse business decisions or improper implementation of business decisions;(14) reputation risk that adversely affects earnings orcapital arising from negativ e public opinion; (15) terrorist activities risk that results in loss of consumer c onfidence and economic disruptions;(16) cy bersecurity risk related to the dependenc e of South S tate on internal computer systems and the technology of outside service providers, asw ell as the potential impacts of third party security breac hes, subj ects each c ompany to potential business disruptions orfinancial losses resulting from deliberate attacks or unintentional events;(17) greater than expected noninterest expenses;(18) noninterest inc ome risk resulting from the effect of regulations that prohibit financial institutions from charging consumer fees for paying ov erdrafts on ATM and one-time debit card transactions, unless the consum er consents or opts-in to the overdraft service for those ty pes of transactions;(19) excessive loan losses;(20) failure torealize synergies and other financial benefits from, and to lim it liabilities associated w ith, the merger with CSFL w ithin the expected time frame, and ownership dilution risk associated w ith potential acquisitions inw hich South State’s stock may be issued as consideration for an acquired company;(21) potential deposit attrition, higher than expec ted costs, custom er loss and business disruption associated w ith the merger w ith CSFL integration, including, without limitation, and potential difficulties in maintaining relationships with key personnel;(22) the risks of fluctuations in market prices for South S tate common stock that may or may not reflect economic condition or performance of South State;(23) the payment of div idends on South State c ommon stock is subject to regulatory supervision as well as the discretion of the board of directors of South State, South State’s performance and other factors;(24) operational, technological, cultural, regulatory, legal, credit and other risks associated w ith the exploration, consummation and integration of potential future acquisition, whether involving stock or cash consideration;(25) maj or catastrophes such as earthquakes, floods or other natural or human disasters, including infectious disease outbreaks, including the recent outbreak of the COVID-19coronavirus, and the related disruption to local, regional and global economic activity and financial markets, and the impact that any of the foregoing may have on South State and its customers and other constituencies; and (26) other risks related to the merger of South State and CSFL including, among others, (i) the risk that the cost savings and any revenue synergies from the merger may not be fully realiz ed or may take longer than anticipated to be realized, (ii) the risk that the integration of each party’s operations will bematerially delayed or will be more c ostly or difficult than expected or that the parties are otherwise unable to successfully integrate each party’s businesses into the other’s businesses, ( iii) the amount of the costs, fees, expenses and charges related to the merger, (iv) reputational risk and the reaction of each company's c ustom ers, suppliers, employees or other business partners to the merger, and (27) other factors that may affect f uture results of South State and CenterState, as disclosed in S outh S tate’ s Annual Report on Form 10-K, as amended, Quarterly Reports on Form 10-Q, and Current Reports on Form 8-K, and CenterS tate’s Annual Report on Form 10-K, Quarterly Reports on Form 10-Q, and Current Reports on Form 8-K, in eac h case filed by South State or CenterState, as applicable, with the U.S. Sec urities and Exchange C ommission (“SEC”) and available on the SEC’s website at http://w ww.sec.gov, any of which could cause actual results to differ materially from future results expressed, implied or otherwise anticipated by such forward-looking statements. All forward-looking statements speak only as of the date they are made and are based on inf ormation available at that tim e. South State does not undertake any obligation to update or otherwise revise any forward- looking statements, whether as a result of new information, future events, or otherw ise, except as required by federal securities laws. As forward-looking statements inv olve significant risks and uncertainties, caution should be exercised against placing undue reliance on such statements. The com bined historical information referred to in this presentation asthe “Combined Business Basis” is presented based on the reported GAAP results of the Company and CenterState f or the applicable periods without adjustment. The Combined Business Basis financial information included in this release has not been prepared in accordance with Article 11 of Regulation S-X, and therefore does not reflect any of the pro forma adjustments that would be required thereby. All Combined Business Basis f inancial information should be reviewed in connection the historical inf ormation of the C ompany and C enterState, as applicable, inc luded in the Appendix to this presentation. |
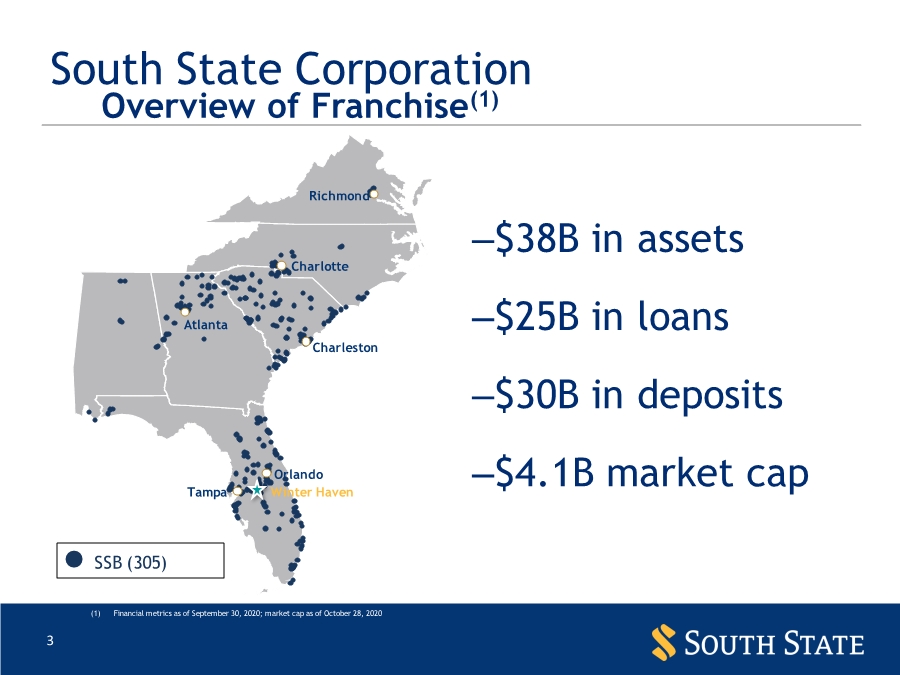
| 3 South State Corporation Winter Haven Tampa Orlando Charleston Atlanta Charlotte Richmond SSB (305) –$38B in assets –$25B in loans –$30B in deposits –$4.1B market cap Overview of Franchise(1) (1) Financial metrics as of September 30, 2020; market cap as of October 28, 2020 |
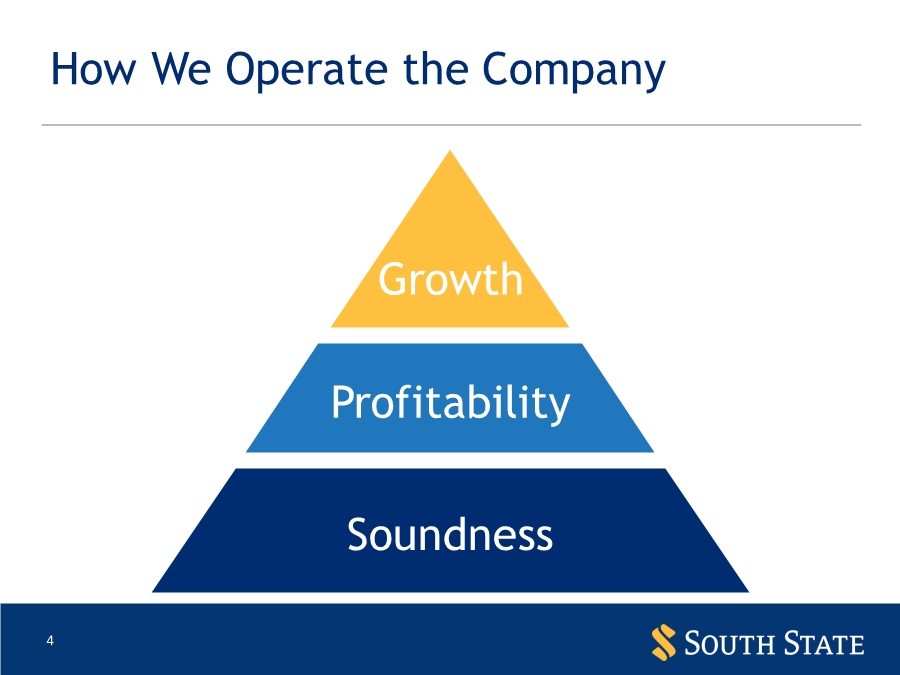
| 4 How We Operate the Company Soundness Profitability Growth |
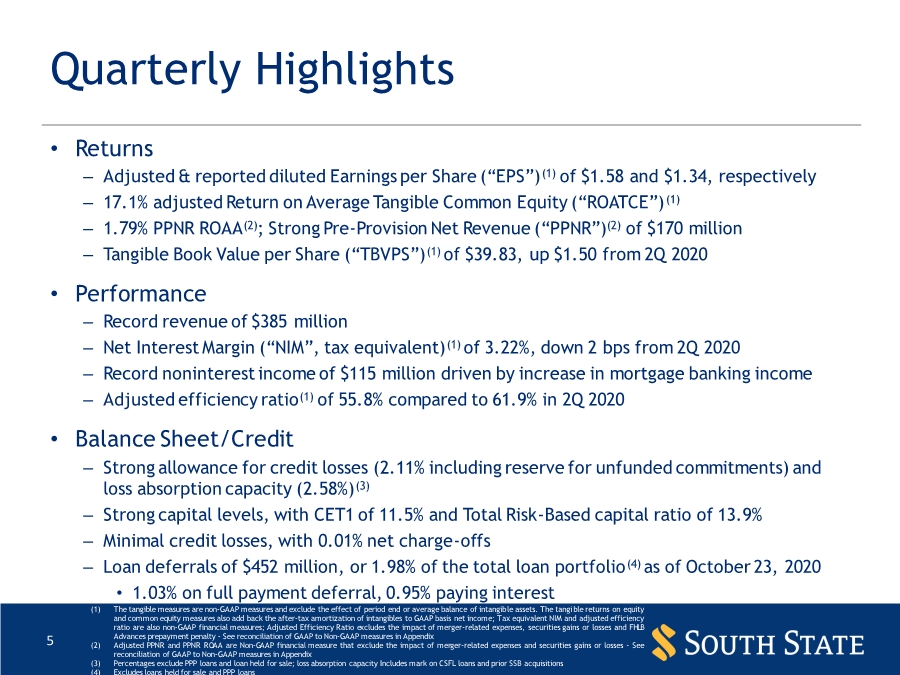
| 5 Quarterly Highlights • Returns – Adjusted & reported diluted Earnings per Share (“EPS”)(1) of $1.58 and $1.34, respectively – 17.1% adjusted Return on Average Tangible Common Equity (“ROATCE”)(1) – 1.79% PPNR ROAA(2); Strong Pre-Provision Net Revenue (“PPNR”)(2) of $170 million – Tangible Book Value per Share (“TBVPS”)(1) of $39.83, up $1.50 from 2Q 2020 • Performance – Record revenue of $385 million – Net Interest Margin (“NIM”, tax equivalent)(1) of 3.22%, down 2 bps from 2Q 2020 – Record noninterest income of $115 million driven by increase in mortgage banking income – Adjusted efficiency ratio(1) of 55.8% compared to 61.9% in 2Q 2020 • Balance Sheet/Credit – Strong allowance for credit losses (2.11% including reserve for unfunded commitments) and loss absorption capacity (2.58%)(3) – Strong capital levels, with CET1 of 11.5% and Total Risk-Based capital ratio of 13.9% – Minimal credit losses, with 0.01% net charge-offs – Loan deferrals of $452 million, or 1.98% of the total loan portfolio(4) as of October 23, 2020 • 1.03% on full payment deferral, 0.95% paying interest (1) The tangible measures are non-GAAP measures and exclude the effect of period end or average balance of intangible assets. The tangible returns on equity and common equity measures also add back the after-tax amortization of intangibles to GAAP basis net income; Tax equivalent NIM and adjusted efficiency ratio are also non-GAAP financial measures; Adjusted Efficiency Ratio excludes the impact of merger-related expenses, securities gains or losses and FHLB Advances prepayment penalty - See reconciliation of GAAP to Non-GAAP measures in Appendix (2) Adjusted PPNR and PPNR ROAA are Non-GAAP financial measure that exclude the impact of merger-related expenses and securities gains or losses - See reconciliation of GAAP to Non-GAAP measures in Appendix (3) Percentages exclude PPP loans and loan held for sale; loss absorption capacity Includes mark on CSFL loans and prior SSB acquisitions (4) Excludes loans held for sale and PPP loans |
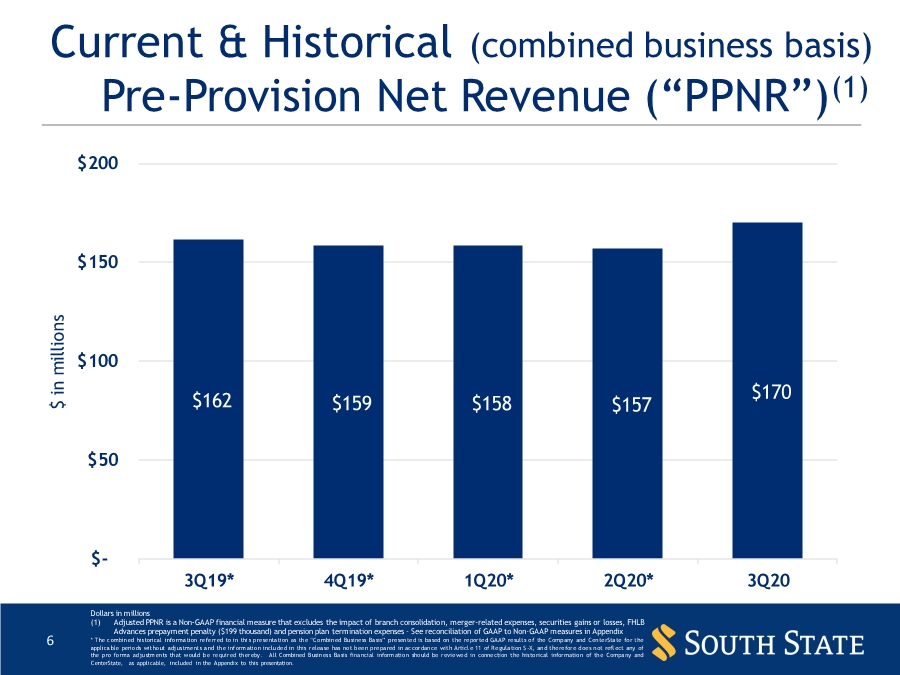
| 6 Current & Historical (combined business basis) Pre-Provision Net Revenue (“PPNR”)(1) Dollars in millions (1) Adjusted PPNR is a Non-GAAP financial measure that excludes the impact of branch consolidation, merger-related expenses, securities gains or losses, FHLB Advances prepayment penalty ($199 thousand) and pension plan termination expenses - See reconciliation of GAAP to Non-GAAP measures in Appendix * The c ombined historical informa tion referred to in thi s presenta tion as the “Combined Business Ba sis” presented is ba sed on the reported GAAP results of the Company and CenterSta te for the applica ble periods without adjustments a nd the inform ation included in this relea se has not been prepa red in ac cordance with Articl e 11 of Regula tion S-X, and therefore does not refl ect any of the pro forma adjustm ents that would be required thereby . All Combined Business Ba sis fina ncial inform ation sho uld be reviewed in connection the historical information of the Compa ny and CenterState, as applicable, included in the Appendix to this presentation. $162 $159 $158 $157 $170 $- $50 $100 $150 $200 3Q19* 4Q19* 1Q20* 2Q20* 3Q20 $ in millions |
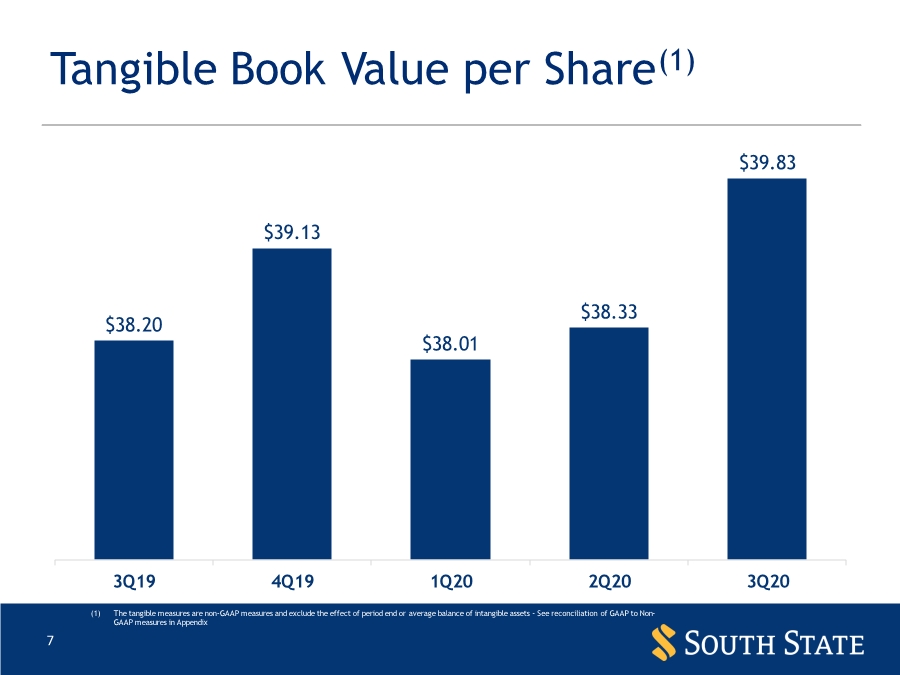
| 7 Tangible Book Value per Share(1) $38.20 $39.13 $38.01 $38.33 $39.83 3Q19 4Q19 1Q20 2Q20 3Q20 (1) The tangible measures are non-GAAP measures and exclude the effect of period end or average balance of intangible assets - See reconciliation of GAAP to Non- GAAP measures in Appendix |
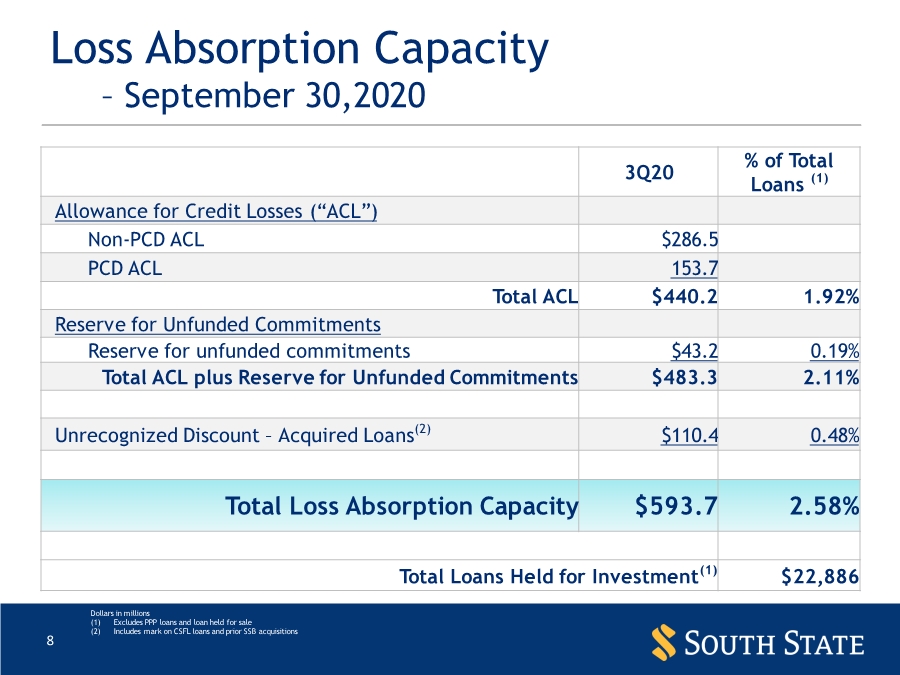
| 8 Loss Absorption Capacity – September 30,2020 Dollars in millions (1) Excludes PPP loans and loan held for sale (2) Includes mark on CSFL loans and prior SSB acquisitions 3Q20 % of Total Loans (1) Allowance for Credit Losses (“ACL”) Non-PCD ACL $286.5 PCD ACL 153.7 Total ACL $440.2 1.92% Reserve for Unfunded Commitments Reserve for unfunded commitments $43.2 0.19% Total ACL plus Reserve for Unfunded Commitments $483.3 2.11% Unrecognized Discount – Acquired Loans(2) $110.4 0.48% Total Loss Absorption Capacity $593.7 2.58% Total Loans Held for Investment(1) $22,886 |
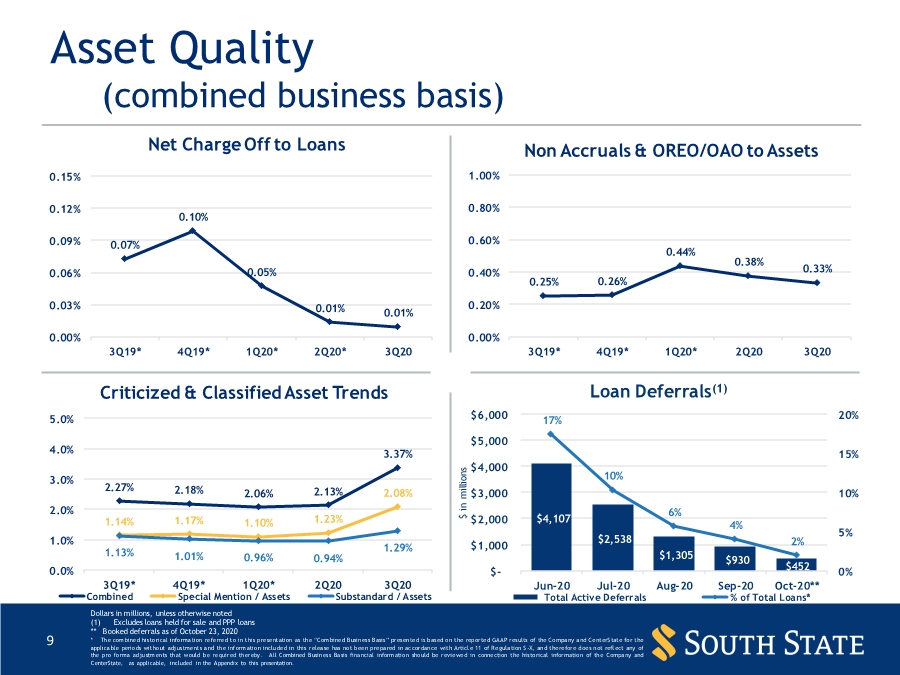
| 9 Asset Quality (combined business basis) Dollars in millions, unless otherwise noted (1) Excludes loans held for sale and PPP loans ** Booked deferrals as of October 23, 2020 * The com bined historical informa tion referred to in this presentation as the “Com bined Business Basis” presented is based on the reported GAAP results of the Compa ny a nd CenterS tate for the applica ble periods without adjustments a nd the inform ation included in this relea se has not been prepa red in ac cordance with Articl e 11 of Regula tion S-X, and therefore does not refl ect any of the pro forma adjustm ents that would be required thereby . All Combined Business Ba sis fina ncial inform ation sho uld be reviewed in connection the historical information of the Compa ny and CenterState, as applicable, included in the Appendix to this presentation. 0.07% 0.10% 0.05% 0.01% 0.01% 0.00% 0.03% 0.06% 0.09% 0.12% 0.15% 3Q19* 4Q19* 1Q20* 2Q20* 3Q20 Net Charge Off to Loans 2.27% 2.18% 2.06% 2.13% 3.37% 1.14% 1.17% 1.10% 1.23% 2.08% 1.13% 1.01% 0.96% 0.94% 1.29% 0.0% 1.0% 2.0% 3.0% 4.0% 5.0% 3Q19* 4Q19* 1Q20* 2Q20 3Q20 Criticized & Classified Asset Trends Combined Special Mention / Assets Substandard / Assets $4,107 $2,538 $1,305 $930 $452 17% 10% 6% 4% 2% 0% 5% 10% 15% 20% $- $1,000 $2,000 $3,000 $4,000 $5,000 $6,000 Jun-20 Jul-20 Aug-20 Sep-20 Oct-20** $ in millions Loan Deferrals(1) Total Active Deferrals % of Total Loans* 0.25% 0.26% 0.44% 0.38% 0.33% 0.00% 0.20% 0.40% 0.60% 0.80% 1.00% 3Q19* 4Q19* 1Q20* 2Q20 3Q20 Non Accruals & OREO/OAO to Assets |
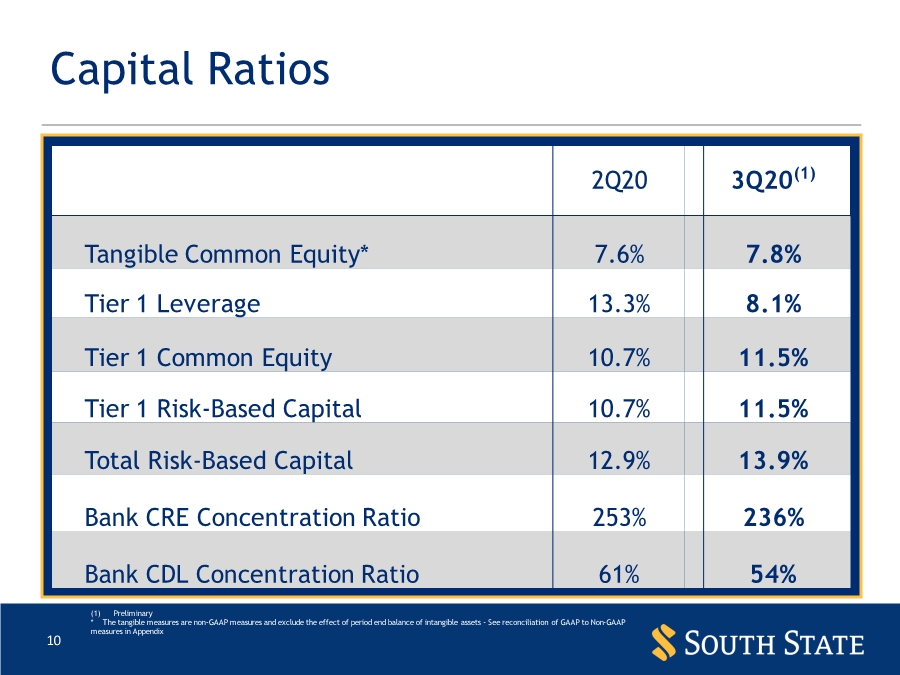
| 10 Capital Ratios (1) Preliminary * The tangible measures are non-GAAP measures and exclude the effect of period end balance of intangible assets - See reconciliation of GAAP to Non-GAAP measures in Appendix 2Q20 3Q20(1) Tangible Common Equity* 7.6% 7.8% Tier 1 Leverage 13.3% 8.1% Tier 1 Common Equity 10.7% 11.5% Tier 1 Risk-Based Capital 10.7% 11.5% Total Risk-Based Capital 12.9% 13.9% Bank CRE Concentration Ratio 253% 236% Bank CDL Concentration Ratio 61% 54% |
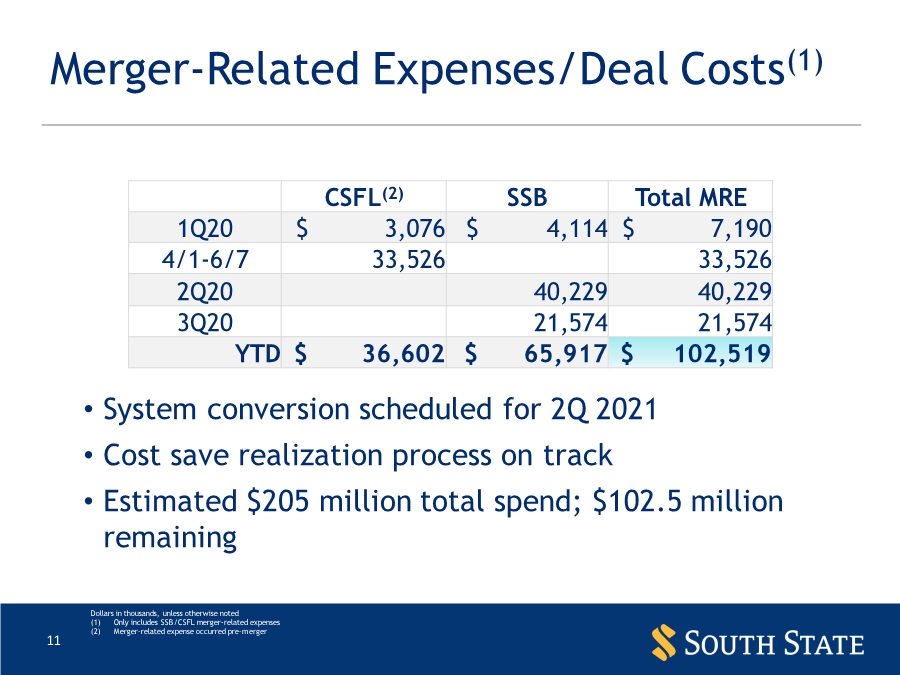
| 11 Merger-Related Expenses/Deal Costs(1) • System conversion scheduled for 2Q 2021 • Cost save realization process on track • Estimated $205 million total spend; $102.5 million remaining Dollars in thousands, unless otherwise noted (1) Only includes SSB/CSFL merger-related expenses (2) Merger-related expense occurred pre-merger CSFL(2) SSB Total MRE 1Q20 $ 3,076 $ 4,114 $ 7,190 4/1-6/7 33,526 33,526 2Q20 40,229 40,229 3Q20 21,574 21,574 YTD $ 36,602 $ 65,917 $ 102,519 |
| Financial Highlights - Reported |

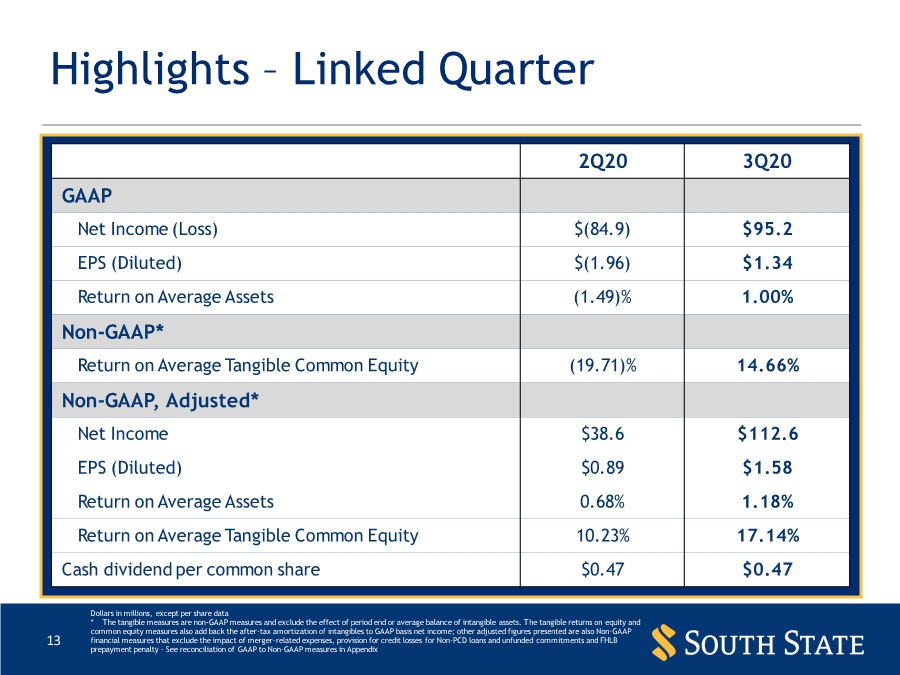
| 13 2Q20 3Q20 GAAP Net Income (Loss) $(84.9) $95.2 EPS (Diluted) $(1.96) $1.34 Return on Average Assets (1.49)% 1.00% Non-GAAP* Return on Average Tangible Common Equity (19.71)% 14.66% Non-GAAP, Adjusted* Net Income $38.6 $112.6 EPS (Diluted) $0.89 $1.58 Return on Average Assets 0.68% 1.18% Return on Average Tangible Common Equity 10.23% 17.14% Cash dividend per common share $0.47 $0.47 Highlights – Linked Quarter Dollars in millions, except per share data * The tangible measures are non-GAAP measures and exclude the effect of period end or average balance of intangible assets. The tangible returns on equity and common equity measures also add back the after-tax amortization of intangibles to GAAP basis net income; other adjusted figures presented are also Non-GAAP financial measures that exclude the impact of merger-related expenses, provision for credit losses for Non-PCD loans and unfunded commitments and FHLB prepayment penalty - See reconciliation of GAAP to Non-GAAP measures in Appendix |
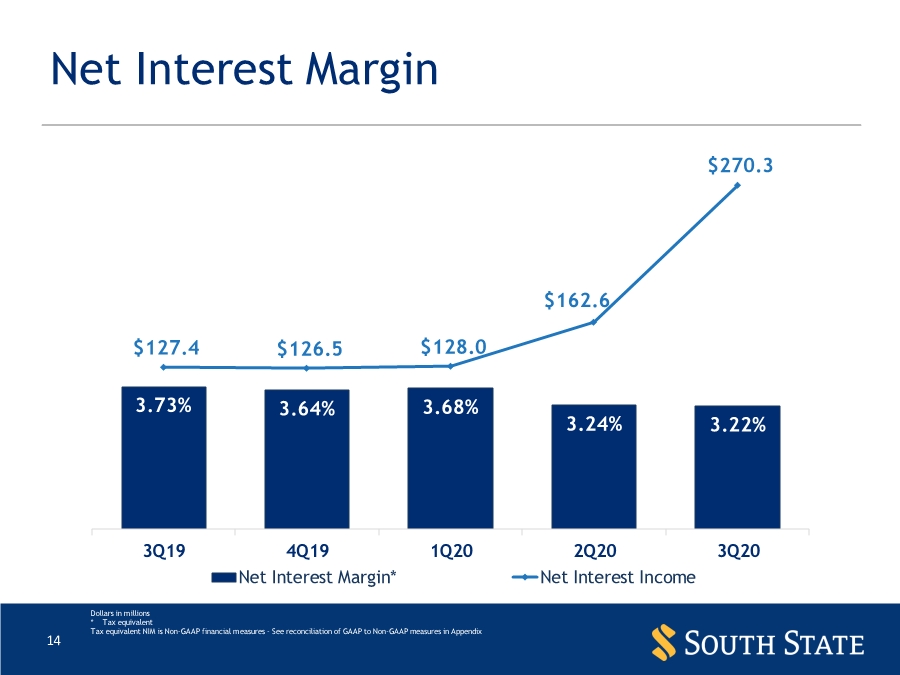
| 14 Net Interest Margin Dollars in millions * Tax equivalent Tax equivalent NIM is Non-GAAP financial measures - See reconciliation of GAAP to Non-GAAP measures in Appendix 3.73% 3.64% 3.68% 3.24% 3.22% $127.4 $126.5 $128.0 $162.6 $270.3 0.00% 1.00% 2.00% 3.00% 4.00% 5.00% 6.00% 7.00% 8.00% 9.00% 10.00% $- $10.0 $20.0 $30.0 $40.0 $50.0 $60.0 $70.0 $80.0 $90.0 $100.0 $110.0 $120.0 $130.0 $140.0 $150.0 $160.0 $170.0 $180.0 $190.0 $200.0 $210.0 $220.0 $230.0 $240.0 $250.0 $260.0 $270.0 $280.0 $290.0 $300.0 3Q19 4Q19 1Q20 2Q20 3Q20 Net Interest Margin* Net Interest Income |
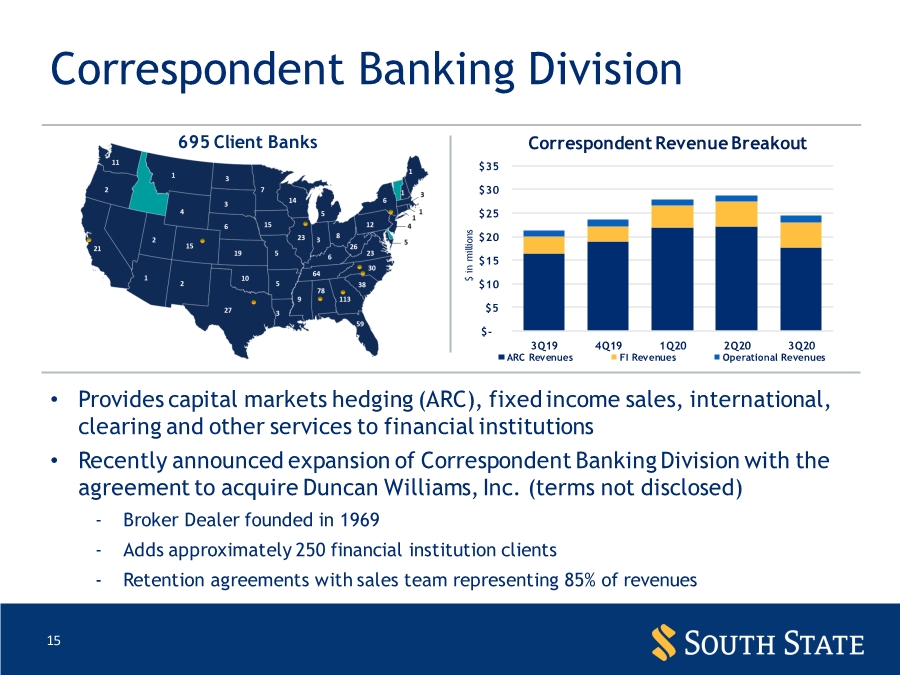
| 15 Correspondent Banking Division • Provides capital markets hedging (ARC), fixed income sales, international, clearing and other services to financial institutions • Recently announced expansion of Correspondent Banking Division with the agreement to acquire Duncan Williams, Inc. (terms not disclosed) - Broker Dealer founded in 1969 - Adds approximately 250 financial institution clients - Retention agreements with sales team representing 85% of revenues 695 Client Banks $- $5 $10 $15 $20 $25 $30 $35 3Q19 4Q19 1Q20 2Q20 3Q20 $ in millions Correspondent Revenue Breakout ARC Revenues FI Revenues Operational Revenues |
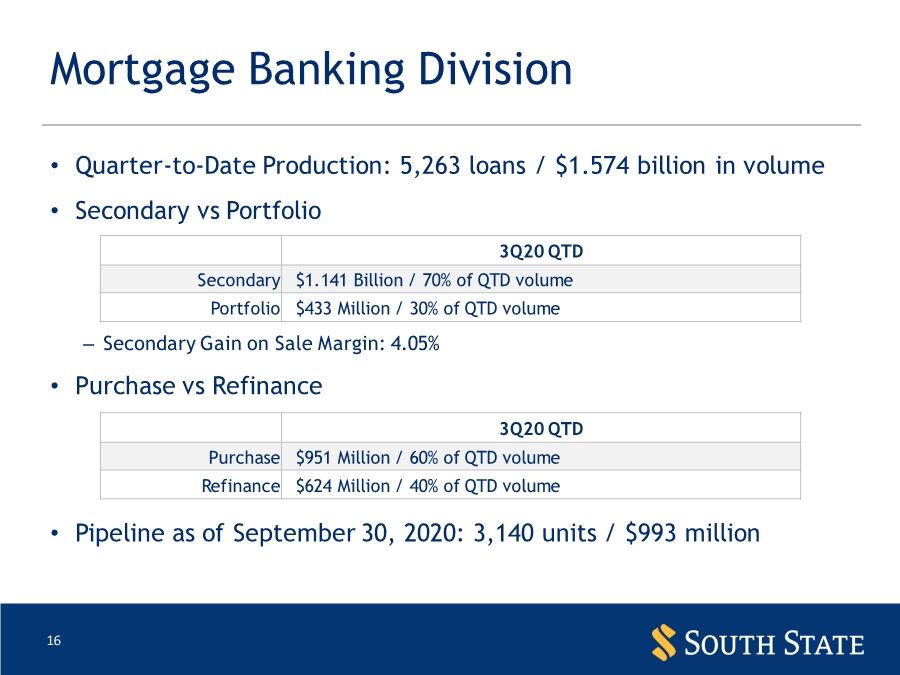
| 16 Mortgage Banking Division • Quarter-to-Date Production: 5,263 loans / $1.574 billion in volume • Secondary vs Portfolio – Secondary Gain on Sale Margin: 4.05% • Purchase vs Refinance • Pipeline as of September 30, 2020: 3,140 units / $993 million 3Q20 QTD Secondary $1.141 Billion / 70% of QTD volume Portfolio $433 Million / 30% of QTD volume 3Q20 QTD Purchase $951 Million / 60% of QTD volume Refinance $624 Million / 40% of QTD volume |
| Combined Business Basis Performance |
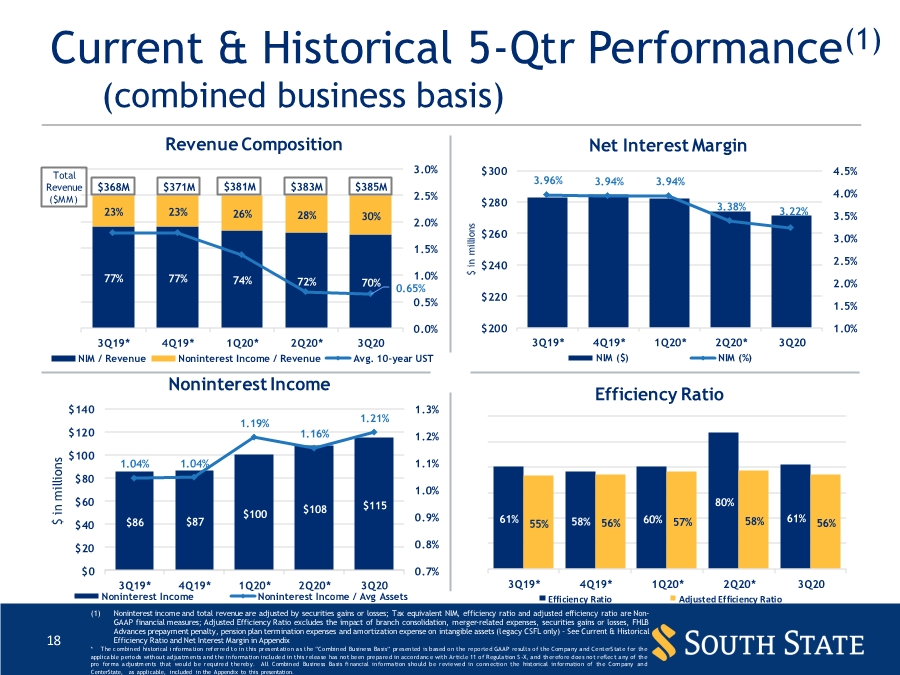
| 18 (1) Noninterest income and total revenue are adjusted by securities gains or losses; Tax equivalent NIM, efficiency ratio and adjusted efficiency ratio are Non- GAAP financial measures; Adjusted Efficiency Ratio excludes the impact of branch consolidation, merger-related expenses, securities gains or losses, FHLB Advances prepayment penalty, pension plan termination expenses and amortization expense on intangible assets (legacy CSFL only) – See Current & Historical Efficiency Ratio and Net Interest Margin in Appendix * The c ombined historical i nforma tion referred to in this presentation asthe “Combined Business Ba sis” presented is based on the repo rted GAAP results of the Com pa ny a nd CenterS tate for the applica ble periods without adjustm ents a nd the informa tion included in this relea se has not been prepa red in accordanc e with Article 11 of Regula tion S-X, a nd therefore does not reflec t a ny of the pro forma a djustm ents that would be required thereby. All Combined Business Ba sis fi nancial informa tion should be reviewed in connection the historical information of the Com pany and CenterState, as applicable, included in the Appendix to this presentation. 61% 58% 60% 80% 61% 55% 56% 57% 58% 56% 0% 15% 30% 45% 60% 75% 90% 3Q19* 4Q19* 1Q20* 2Q20* 3Q20 Efficiency Ratio Efficiency Ratio Adjusted Efficiency Ratio 3.96% 3.94% 3.94% 3.38% 3.22% 1.0% 1.5% 2.0% 2.5% 3.0% 3.5% 4.0% 4.5% $200 $220 $240 $260 $280 $300 3Q19* 4Q19* 1Q20* 2Q20* 3Q20 $ in millions Net Interest Margin NIM ($) NIM (%) Current & Historical 5-Qtr Performance(1) (combined business basis) 77% 77% 74% 72% 70% 23% 23% 26% 28% 30% $368M $371M $381M $383M $385M 0.65% 0.0% 0.5% 1.0% 1.5% 2.0% 2.5% 3.0% 0% 20% 40% 60% 80% 100% 120% 3Q19* 4Q19* 1Q20* 2Q20* 3Q20 Total Revenue ($MM) Revenue Composition NIM / Revenue Noninterest Income / Revenue Avg. 10-year UST $86 $87 $100 $108 $115 1.04% 1.04% 1.19% 1.16% 1.21% $0 $20 $40 $60 $80 $100 $120 $140 3Q19* 4Q19* 1Q20* 2Q20* 3Q20 0.7% 0.8% 0.9% 1.0% 1.1% 1.2% 1.3% $ in millions Noninterest Income Noninterest Income Noninterest Income / Avg Assets |
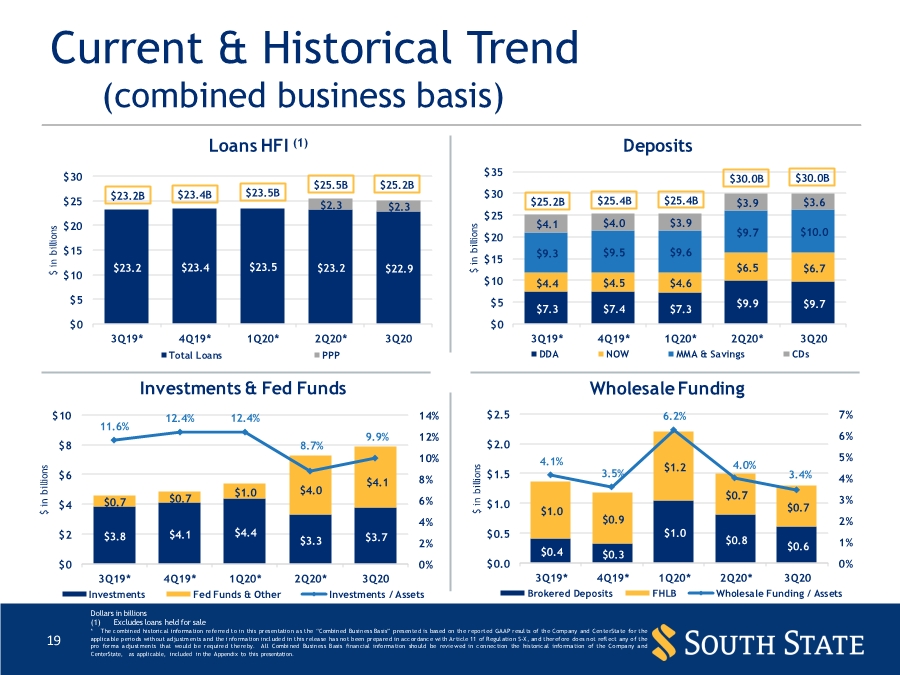
| 19 Dollars in billions (1) Excludes loans held for sale * The c ombined historic al informa tion referred to in this presentation asthe “Combined Business Ba sis” presented is based on the repo rted GAAP resul ts of the Company and CenterSta te for the applica ble periods without adjustm ents a nd the i nforma tion incl uded in this relea se ha s not been prepa red in acc ordanc e wi th Article 11 of Regul ation S-X, and therefore does not refl ect any of the pro forma a djustments that would be required thereby. All Combi ned Business Basis financial informa tion should be reviewed in c onnec tion the historic al informa tion of the Compa ny a nd CenterState, as applicable, included in the Appendix to this presentation. Current & Historical Trend (combined business basis) $3.8 $4.1 $4.4 $3.3 $3.7 $0.7 $0.7 $1.0 $4.0 $4.1 11.6% 12.4% 12.4% 8.7% 9.9% $0 $2 $4 $6 $8 $10 3Q19* 4Q19* 1Q20* 2Q20* 3Q20 0% 2% 4% 6% 8% 10% 12% 14% $ in billions Investments & Fed Funds Investments Fed Funds & Other Investments / Assets $0.4 $0.3 $1.0 $0.8 $0.6 $1.0 $0.9 $1.2 $0.7 $0.7 4.1% 3.5% 6.2% 4.0% 3.4% $0.0 $0.5 $1.0 $1.5 $2.0 $2.5 3Q19* 4Q19* 1Q20* 2Q20* 3Q20 0% 1% 2% 3% 4% 5% 6% 7% $ in billions Wholesale Funding Brokered Deposits FHLB Wholesale Funding / Assets $23.2 $23.4 $23.5 $23.2 $22.9 $2.3 $2.3 $23.2B $23.4B $23.5B $25.5B $25.2B $0 $5 $10 $15 $20 $25 $30 3Q19* 4Q19* 1Q20* 2Q20* 3Q20 $ in billions Loans HFI (1) Total Loans PPP $7.3 $7.4 $7.3 $9.9 $9.7 $4.4 $4.5 $4.6 $6.5 $6.7 $9.3 $9.5 $9.6 $9.7 $10.0 $4.1 $4.0 $3.9 $3.9 $3.6 $25.2B $25.4B $25.4B $30.0B $30.0B $0 $5 $10 $15 $20 $25 $30 $35 3Q19* 4Q19* 1Q20* 2Q20* 3Q20 $ in billions Deposits DDA NOW MMA & Savings CDs |
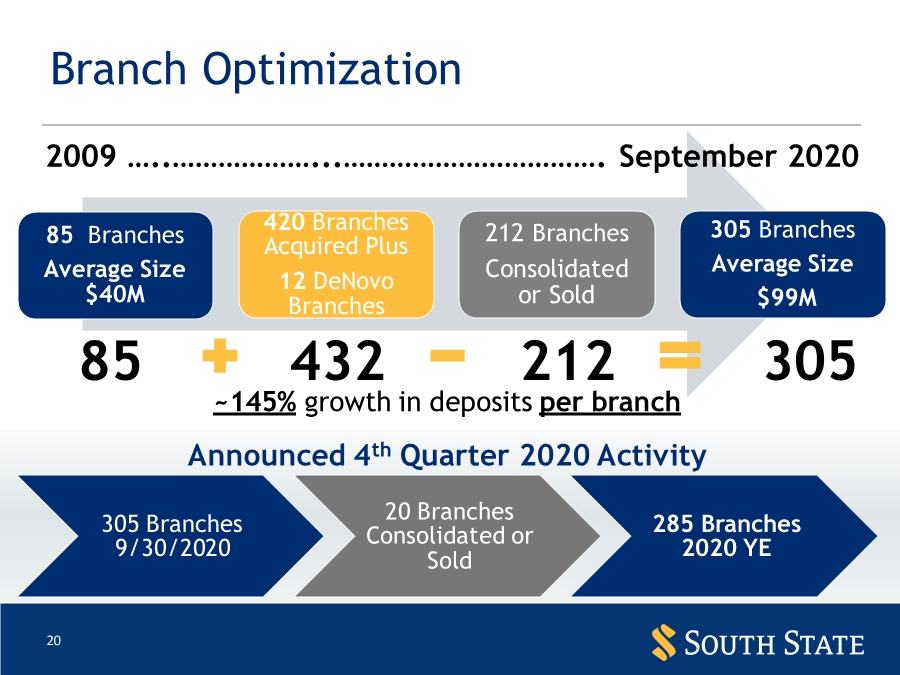
| 20 Branch Optimization 305 Branches 9/30/2020 20 Branches Consolidated or Sold 285 Branches 2020 YE 85 Branches Average Size $40M 420 Branches Acquired Plus 12 DeNovo Branches 212 Branches Consolidated or Sold 305 Branches Average Size $99M ~145% growth in deposits per branch 85 432 212 305 2009 …..………………...……………………………. September 2020 Announced 4th Quarter 2020 Activity |
| Appendix |

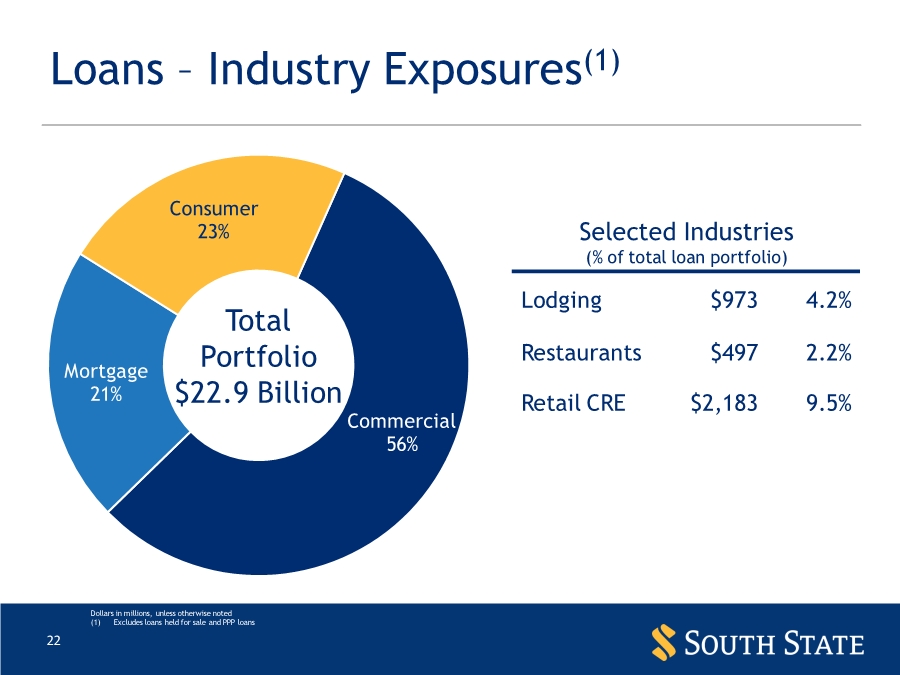
| 22 Loans – Industry Exposures(1) Selected Industries (% of total loan portfolio) Lodging $973 4.2% Restaurants $497 2.2% Retail CRE $2,183 9.5% Dollars in millions, unless otherwise noted (1) Excludes loans held for sale and PPP loans Total Portfolio $22.9 Billion Commercial 56% Mortgage 21% Consumer 23% |
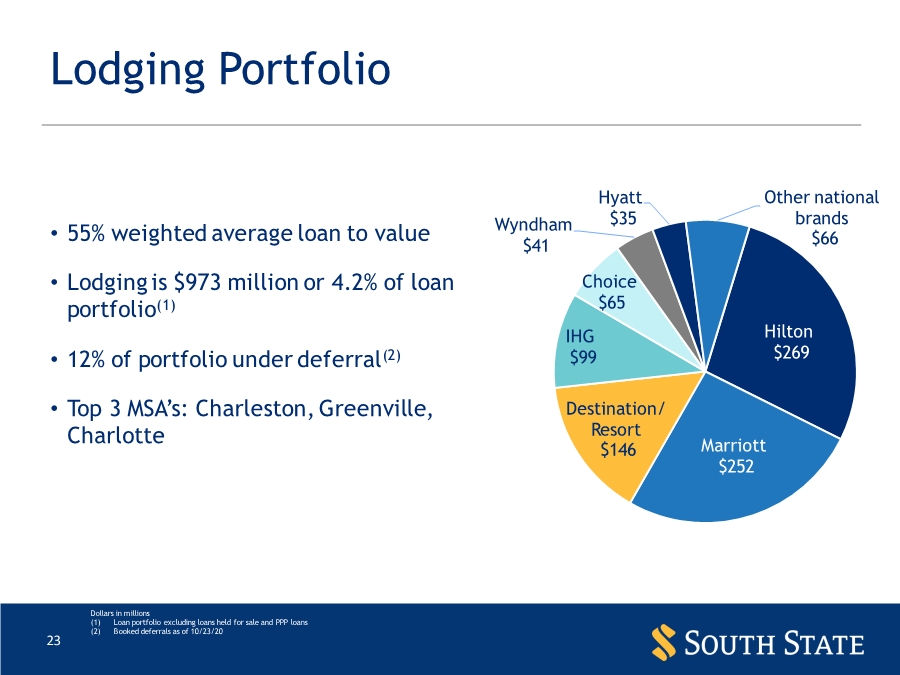
| 23 Lodging Portfolio • 55% weighted average loan to value • Lodging is $973 million or 4.2% of loan portfolio(1) • 12% of portfolio under deferral(2) • Top 3 MSA’s: Charleston, Greenville, Charlotte Dollars in millions (1) Loan portfolio excluding loans held for sale and PPP loans (2) Booked deferrals as of 10/23/20 Hilton $269 Marriott $252 Destination/ Resort $146 IHG $99 Choice $65 Wyndham $41 Hyatt $35 Other national brands $66 |
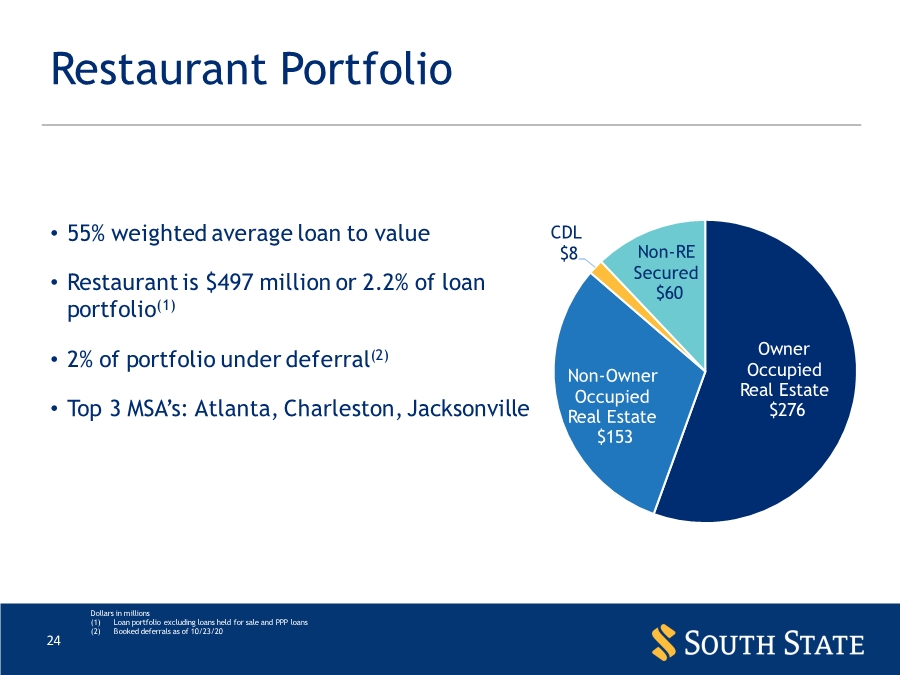
| 24 Restaurant Portfolio • 55% weighted average loan to value • Restaurant is $497 million or 2.2% of loan portfolio(1) • 2% of portfolio under deferral(2) • Top 3 MSA’s: Atlanta, Charleston, Jacksonville Dollars in millions (1) Loan portfolio excluding loans held for sale and PPP loans (2) Booked deferrals as of 10/23/20 Owner Occupied Real Estate $276 Non-Owner Occupied Real Estate $153 CDL $8 Non-RE Secured $60 |
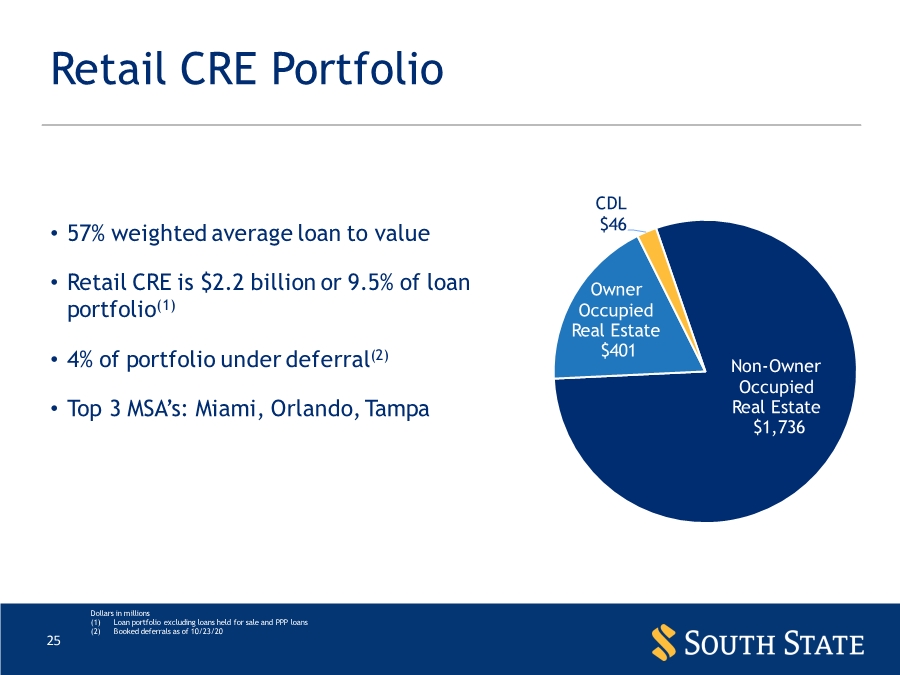
| 25 Retail CRE Portfolio • 57% weighted average loan to value • Retail CRE is $2.2 billion or 9.5% of loan portfolio(1) • 4% of portfolio under deferral(2) • Top 3 MSA’s: Miami, Orlando, Tampa Dollars in millions (1) Loan portfolio excluding loans held for sale and PPP loans (2) Booked deferrals as of 10/23/20 Non-Owner Occupied Real Estate $1,736 Owner Occupied Real Estate $401 CDL $46 |
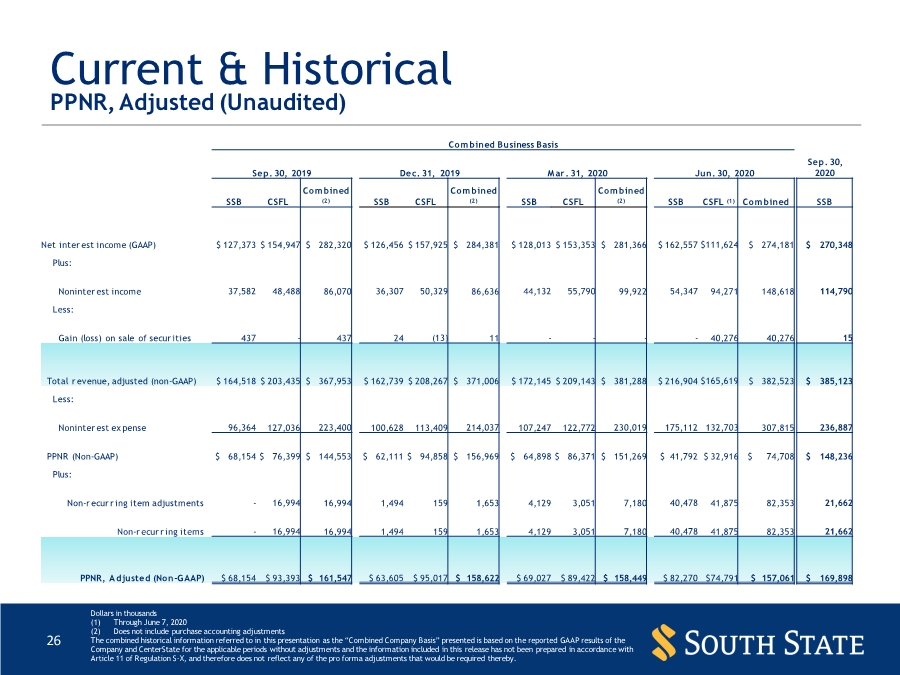
| 26 Current & Historical PPNR, Adjusted (Unaudited) Dollars in thousands (1) Through June 7, 2020 (2) Does not include purchase accounting adjustments The combined historical information referred to in this presentation as the “Combined Company Basis” presented is based on the reported GAAP results of the Company and CenterState for the applicable periods without adjustments and the information included in this release has not been prepared in accordance with Article 11 of Regulation S-X, and therefore does not reflect any of the pro forma adjustments that would be required thereby. Combined Business Basis Sep. 30, 2019 Dec. 31, 2019 M ar. 31, 2020 Jun. 30, 2020 Sep. 30, 2020 SSB CSFL Com bined (2) SSB CSFL Com bined (2) SSB CSFL Com bined (2) SSB CSFL (1) Com bined SSB Net inter est income (GAAP) $ 127,373 $ 154,947 $ 282,320 $ 126,456 $ 157,925 $ 284,381 $ 128,013 $ 153,353 $ 281,366 $ 162,557 $111,624 $ 274,181 $ 270,348 Plus: Noninter est income 37,582 48,488 86,070 36,307 50,329 86,636 44,132 55,790 99,922 54,347 94,271 148,618 114,790 Less: Gain (loss) on sale of secur ities 437 - 437 24 (13) 11 ---- 40,276 40,276 15 Total r evenue, adjusted (non-GAAP) $ 164,518 $ 203,435 $ 367,953 $ 162,739 $ 208,267 $ 371,006 $ 172,145 $ 209,143 $ 381,288 $ 216,904 $165,619 $ 382,523 $ 385,123 Less: Noninter est ex pense 96,364 127,036 223,400 100,628 113,409 214,037 107,247 122,772 230,019 175,112 132,703 307,815 236,887 PPNR (Non-GAAP) $ 68,154 $ 76,399 $ 144,553 $ 62,111 $ 94,858 $ 156,969 $ 64,898 $ 86,371 $ 151,269 $ 41,792 $ 32,916 $ 74,708 $ 148,236 Plus: Non-recurring item adjustments - 16,994 16,994 1,494 159 1,653 4,129 3,051 7,180 40,478 41,875 82,353 21,662 Non-recurring items - 16,994 16,994 1,494 159 1,653 4,129 3,051 7,180 40,478 41,875 82,353 21,662 PPNR, A djusted (Non-GAAP) $ 68,154 $ 93,393 $ 161,547 $ 63,605 $ 95,017 $ 158,622 $ 69,027 $ 89,422 $ 158,449 $ 82,270 $74,791 $ 157,061 $ 169,898 |
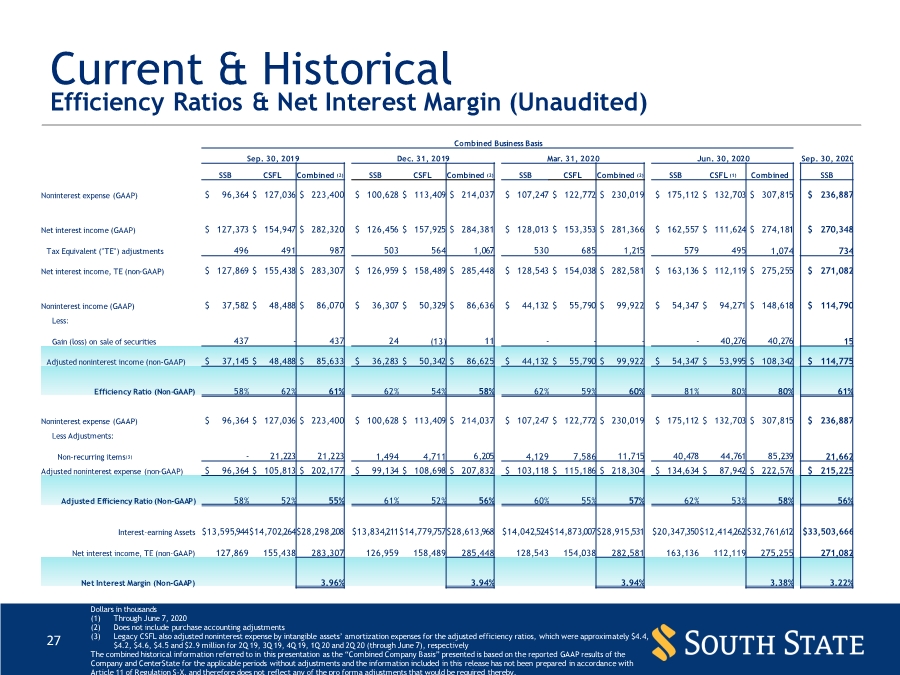
| 27 Current & Historical Efficiency Ratios & Net Interest Margin (Unaudited) Dollars in thousands (1) Through June 7, 2020 (2) Does not include purchase accounting adjustments (3) Legacy CSFL also adjusted noninterest expense by intangible assets’ amortization expenses for the adjusted efficiency ratios, which were approximately $4.4, $4.2, $4.6, $4.5 and $2.9 million for 2Q 19, 3Q 19, 4Q 19, 1Q 20 and 2Q 20 (through June 7), respectively The combined historical information referred to in this presentation as the “Combined Company Basis” presented is based on the reported GAAP results of the Company and CenterState for the applicable periods without adjustments and the information included in this release has not been prepared in accordance with Article 11 of Regulation S-X, and therefore does not reflect any of the pro forma adjustments that would be required thereby. Combined Business Basis Sep. 30, 2019 Dec. 31, 2019 Mar. 31, 2020 Jun. 30, 2020 Sep. 30, 2020 SSB CSFL Combined (2) SSB CSFL Combined (2) SSB CSFL Combined (2) SSB CSFL (1) Combined SSB Noninterest expense (GAAP) $ 96,364 $ 127,036 $ 223,400 $ 100,628 $ 113,409 $ 214,037 $ 107,247 $ 122,772 $ 230,019 $ 175,112 $ 132,703 $ 307,815 $ 236,887 Net interest income (GAAP) $ 127,373 $ 154,947 $ 282,320 $ 126,456 $ 157,925 $ 284,381 $ 128,013 $ 153,353 $ 281,366 $ 162,557 $ 111,624 $ 274,181 $ 270,348 Tax Equivalent ("TE") adjustments 496 491 987 503 564 1,067 530 685 1,215 579 495 1,074 734 Net interest income, TE (non-GAAP) $ 127,869 $ 155,438 $ 283,307 $ 126,959 $ 158,489 $ 285,448 $ 128,543 $ 154,038 $ 282,581 $ 163,136 $ 112,119 $ 275,255 $ 271,082 Noninterest income (GAAP) $ 37,582 $ 48,488 $ 86,070 $ 36,307 $ 50,329 $ 86,636 $ 44,132 $ 55,790 $ 99,922 $ 54,347 $ 94,271 $ 148,618 $ 114,790 Less: Gain (loss) on sale of securities 437 - 437 24 (13) 11 ---- 40,276 40,276 15 Adjusted noninterest income (non-GAAP) $ 37,145 $ 48,488 $ 85,633 $ 36,283 $ 50,342 $ 86,625 $ 44,132 $ 55,790 $ 99,922 $ 54,347 $ 53,995 $ 108,342 $ 114,775 Efficiency Ratio (Non-GAAP) 58% 62% 61% 62% 54% 58% 62% 59% 60% 81% 80% 80% 61% Noninterest expense (GAAP) $ 96,364 $ 127,036 $ 223,400 $ 100,628 $ 113,409 $ 214,037 $ 107,247 $ 122,772 $ 230,019 $ 175,112 $ 132,703 $ 307,815 $ 236,887 Less Adjustments: Non-recurring items(3) - 21,223 21,223 1,494 4,711 6,205 4,129 7,586 11,715 40,478 44,761 85,239 21,662 Adjusted noninterest expense (non-GAAP) $ 96,364 $ 105,813 $ 202,177 $ 99,134 $ 108,698 $ 207,832 $ 103,118 $ 115,186 $ 218,304 $ 134,634 $ 87,942 $ 222,576 $ 215,225 Adjusted Efficiency Ratio (Non-GAAP) 58% 52% 55% 61% 52% 56% 60% 55% 57% 62% 53% 58% 56% Interest-earning Assets $13,595,944 $14,702,264 $28,298,208 $13,834,211 $14,779,757 $28,613,968 $14,042,524 $14,873,007 $28,915,531 $20,347,350 $12,414,262 $32,761,612 $33,503,666 Net interest income, TE (non-GAAP) 127,869 155,438 283,307 126,959 158,489 285,448 128,543 154,038 282,581 163,136 112,119 275,255 271,082 Net Interest Margin (Non-GAAP) 3.96% 3.94% 3.94% 3.38% 3.22% |
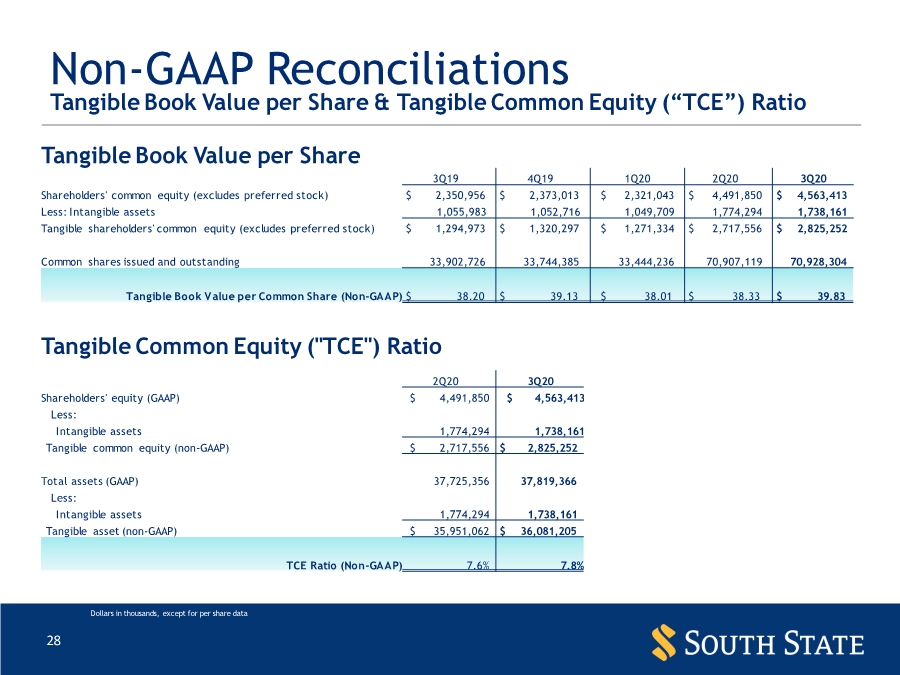
| 28 Non-GAAP Reconciliations Tangible Book Value per Share & Tangible Common Equity (“TCE”) Ratio Dollars in thousands, except for per share data Tangible Book Value per Share 3Q19 4Q19 1Q20 2Q20 3Q20 Shareholders' common equity (excludes preferred stock) $ 2,350,956 $ 2,373,013 $ 2,321,043 $ 4,491,850 $ 4,563,413 Less: Intangible assets 1,055,983 1,052,716 1,049,709 1,774,294 1,738,161 Tangible shareholders' common equity (excludes preferred stock) $ 1,294,973 $ 1,320,297 $ 1,271,334 $ 2,717,556 $ 2,825,252 Common shares issued and outstanding 33,902,726 33,744,385 33,444,236 70,907,119 70,928,304 Tangible Book Value per Common Share (Non-GAAP) $ 38.20 $ 39.13 $ 38.01 $ 38.33 $ 39.83 Tangible Common Equity ("TCE") Ratio 2Q20 3Q20 Shareholders' equity (GAAP) $ 4,491,850 $ 4,563,413 Less: Intangible assets 1,774,294 1,738,161 Tangible common equity (non-GAAP) $ 2,717,556 $ 2,825,252 Total assets (GAAP) 37,725,356 37,819,366 Less: Intangible assets 1,774,294 1,738,161 Tangible asset (non-GAAP) $ 35,951,062 $ 36,081,205 TCE Ratio (Non-GAAP) 7.6% 7.8% |
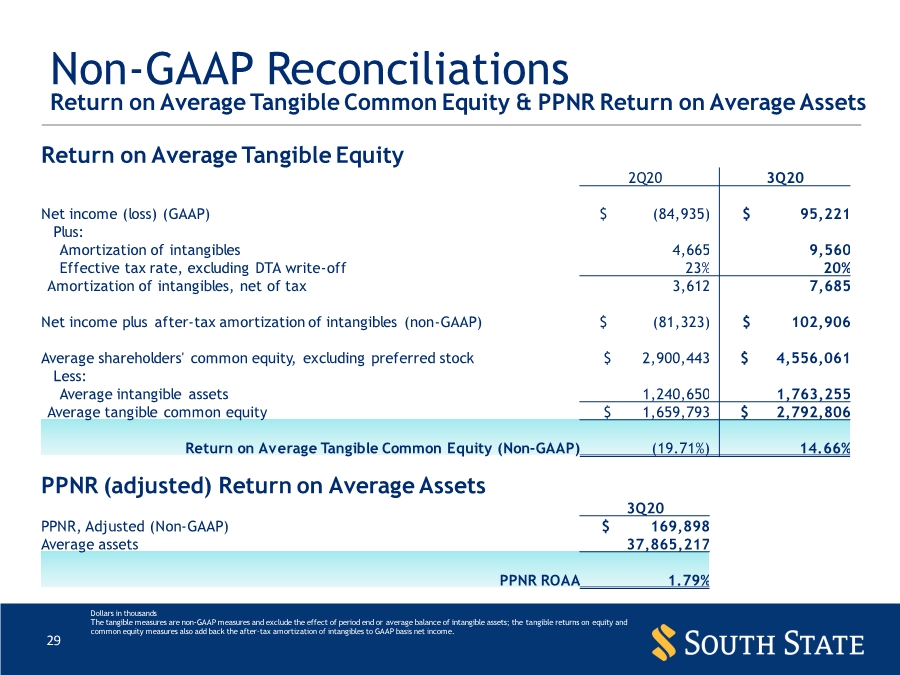
| 29 Non-GAAP Reconciliations Return on Average Tangible Common Equity & PPNR Return on Average Assets Dollars in thousands The tangible measures are non-GAAP measures and exclude the effect of period end or average balance of intangible assets; the tangible returns on equity and common equity measures also add back the after-tax amortization of intangibles to GAAP basis net income. Return on Average Tangible Equity 2Q20 3Q20 Net income (loss) (GAAP) $ (84,935) $ 95,221 Plus: Amortization of intangibles 4,665 9,560 Effective tax rate, excluding DTA write-off 23% 20% Amortization of intangibles, net of tax 3,612 7,685 Net income plus after-tax amortization of intangibles (non-GAAP) $ (81,323) $ 102,906 Average shareholders' common equity, excluding preferred stock $ 2,900,443 $ 4,556,061 Less: Average intangible assets 1,240,650 1,763,255 Average tangible common equity $ 1,659,793 $ 2,792,806 Return on Average Tangible Common Equity (Non-GAAP) (19.71%) 14.66% PPNR (adjusted) Return on Average Assets 3Q20 PPNR, Adjusted (Non-GAAP) $ 169,898 Average assets 37,865,217 PPNR ROAA 1.79% |
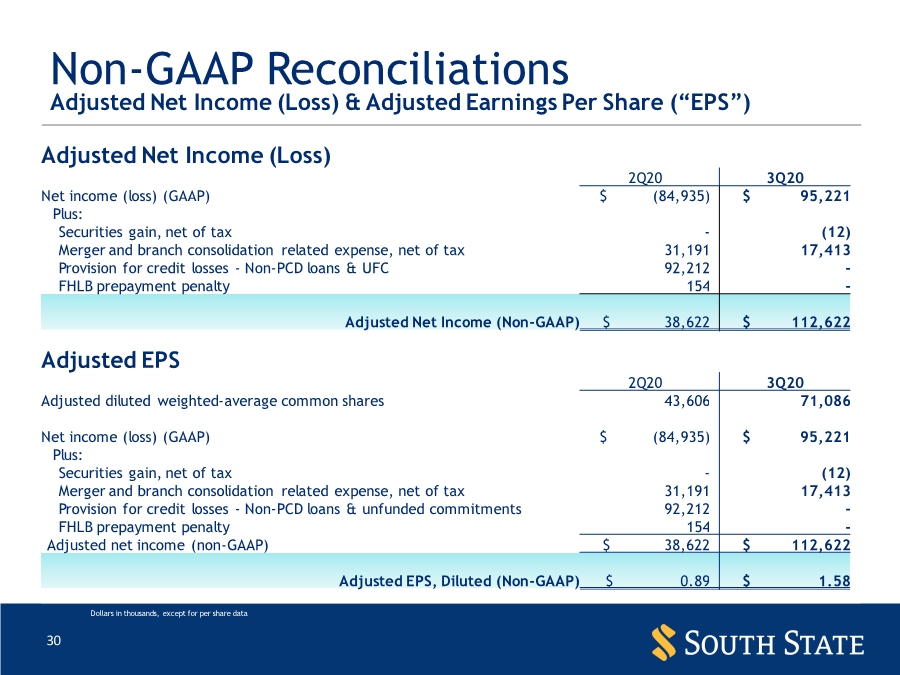
| 30 Non-GAAP Reconciliations Adjusted Net Income (Loss) & Adjusted Earnings Per Share (“EPS”) Dollars in thousands, except for per share data Adjusted Net Income (Loss) 2Q20 3Q20 Net income (loss) (GAAP) $ (84,935) $ 95,221 Plus: Securities gain, net of tax -(12) Merger and branch consolidation related expense, net of tax 31,191 17,413 Provision for credit losses - Non-PCD loans & UFC 92,212 - FHLB prepayment penalty 154 - Adjusted Net Income (Non-GAAP) $ 38,622 $ 112,622 Adjusted EPS 2Q20 3Q20 Adjusted diluted weighted-average common shares 43,606 71,086 Net income (loss) (GAAP) $ (84,935) $ 95,221 Plus: Securities gain, net of tax -(12) Merger and branch consolidation related expense, net of tax 31,191 17,413 Provision for credit losses - Non-PCD loans & unfunded commitments 92,212 - FHLB prepayment penalty 154 - Adjusted net income (non-GAAP) $ 38,622 $ 112,622 Adjusted EPS, Diluted (Non-GAAP) $ 0.89 $ 1.58 |
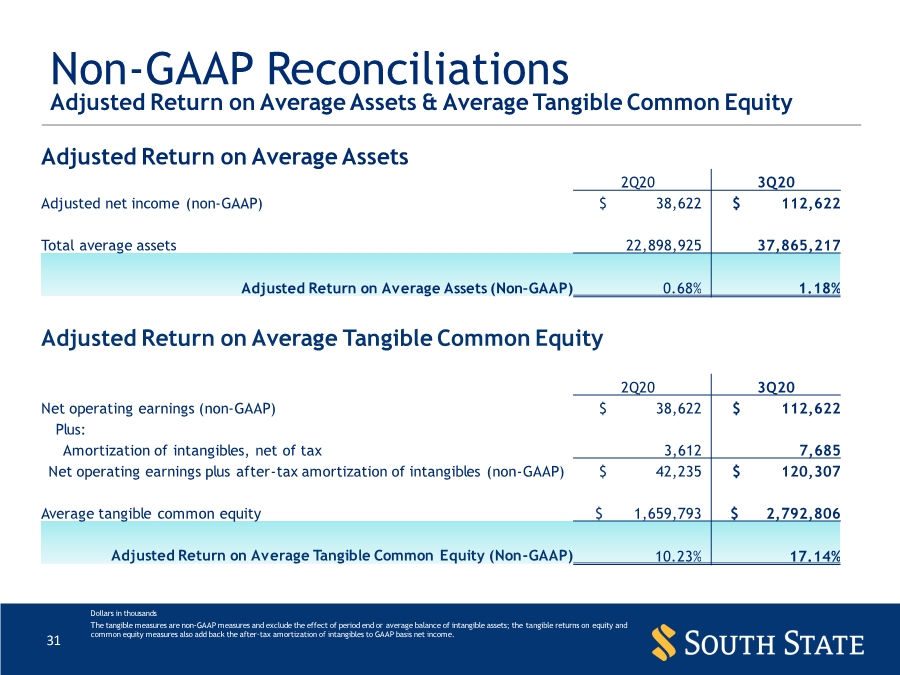
| 31 Non-GAAP Reconciliations Adjusted Return on Average Assets & Average Tangible Common Equity Dollars in thousands The tangible measures are non-GAAP measures and exclude the effect of period end or average balance of intangible assets; the tangible returns on equity and common equity measures also add back the after-tax amortization of intangibles to GAAP basis net income. Adjusted Return on Average Assets 2Q20 3Q20 Adjusted net income (non-GAAP) $ 38,622 $ 112,622 Total average assets 22,898,925 37,865,217 Adjusted Return on Average Assets (Non-GAAP) 0.68% 1.18% Adjusted Return on Average Tangible Common Equity 2Q20 3Q20 Net operating earnings (non-GAAP) $ 38,622 $ 112,622 Plus: Amortization of intangibles, net of tax 3,612 7,685 Net operating earnings plus after-tax amortization of intangibles (non-GAAP) $ 42,235 $ 120,307 Average tangible common equity $ 1,659,793 $ 2,792,806 Adjusted Return on Average Tangible Common Equity (Non-GAAP) 10.23% 17.14% |
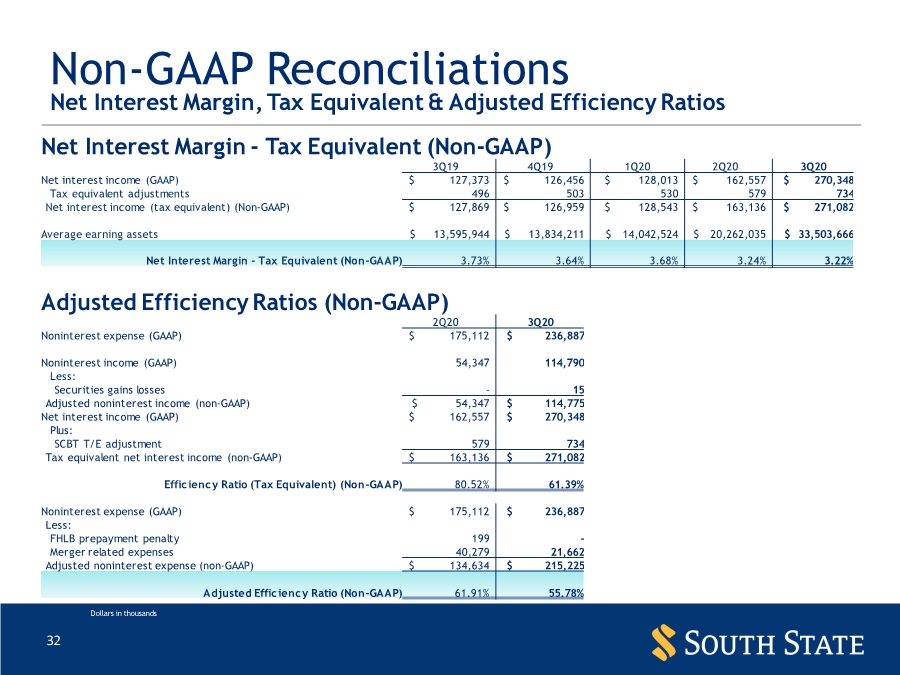
| 32 Non-GAAP Reconciliations Net Interest Margin, Tax Equivalent & Adjusted Efficiency Ratios Dollars in thousands Net Interest Margin - Tax Equivalent (Non-GAAP) 3Q19 4Q19 1Q20 2Q20 3Q20 Net interest income (GAAP) $ 127,373 $ 126,456 $ 128,013 $ 162,557 $ 270,348 Tax equivalent adjustments 496 503 530 579 734 Net interest income (tax equivalent) (Non-GAAP) $ 127,869 $ 126,959 $ 128,543 $ 163,136 $ 271,082 Average earning assets $ 13,595,944 $ 13,834,211 $ 14,042,524 $ 20,262,035 $ 33,503,666 Net Interest Margin - Tax Equivalent (Non-GAAP) 3.73% 3.64% 3.68% 3.24% 3.22% Adjusted Efficiency Ratios (Non-GAAP) 2Q20 3Q20 Noninterest expense (GAAP) $ 175,112 $ 236,887 Noninterest income (GAAP) 54,347 114,790 Less: Securities gains losses - 15 Adjusted noninterest income (non-GAAP) $ 54,347 $ 114,775 Net interest income (GAAP) $ 162,557 $ 270,348 Plus: SCBT T/E adjustment 579 734 Tax equivalent net interest income (non-GAAP) $ 163,136 $ 271,082 Efficiency Ratio (Tax Equivalent) (Non-GAAP) 80.52% 61.39% Noninterest expense (GAAP) $ 175,112 $ 236,887 Less: FHLB prepayment penalty 199 - Merger related expenses 40,279 21,662 Adjusted noninterest expense (non-GAAP) $ 134,634 $ 215,225 Adjusted Efficiency Ratio (Non-GAAP) 61.91% 55.78% |
|