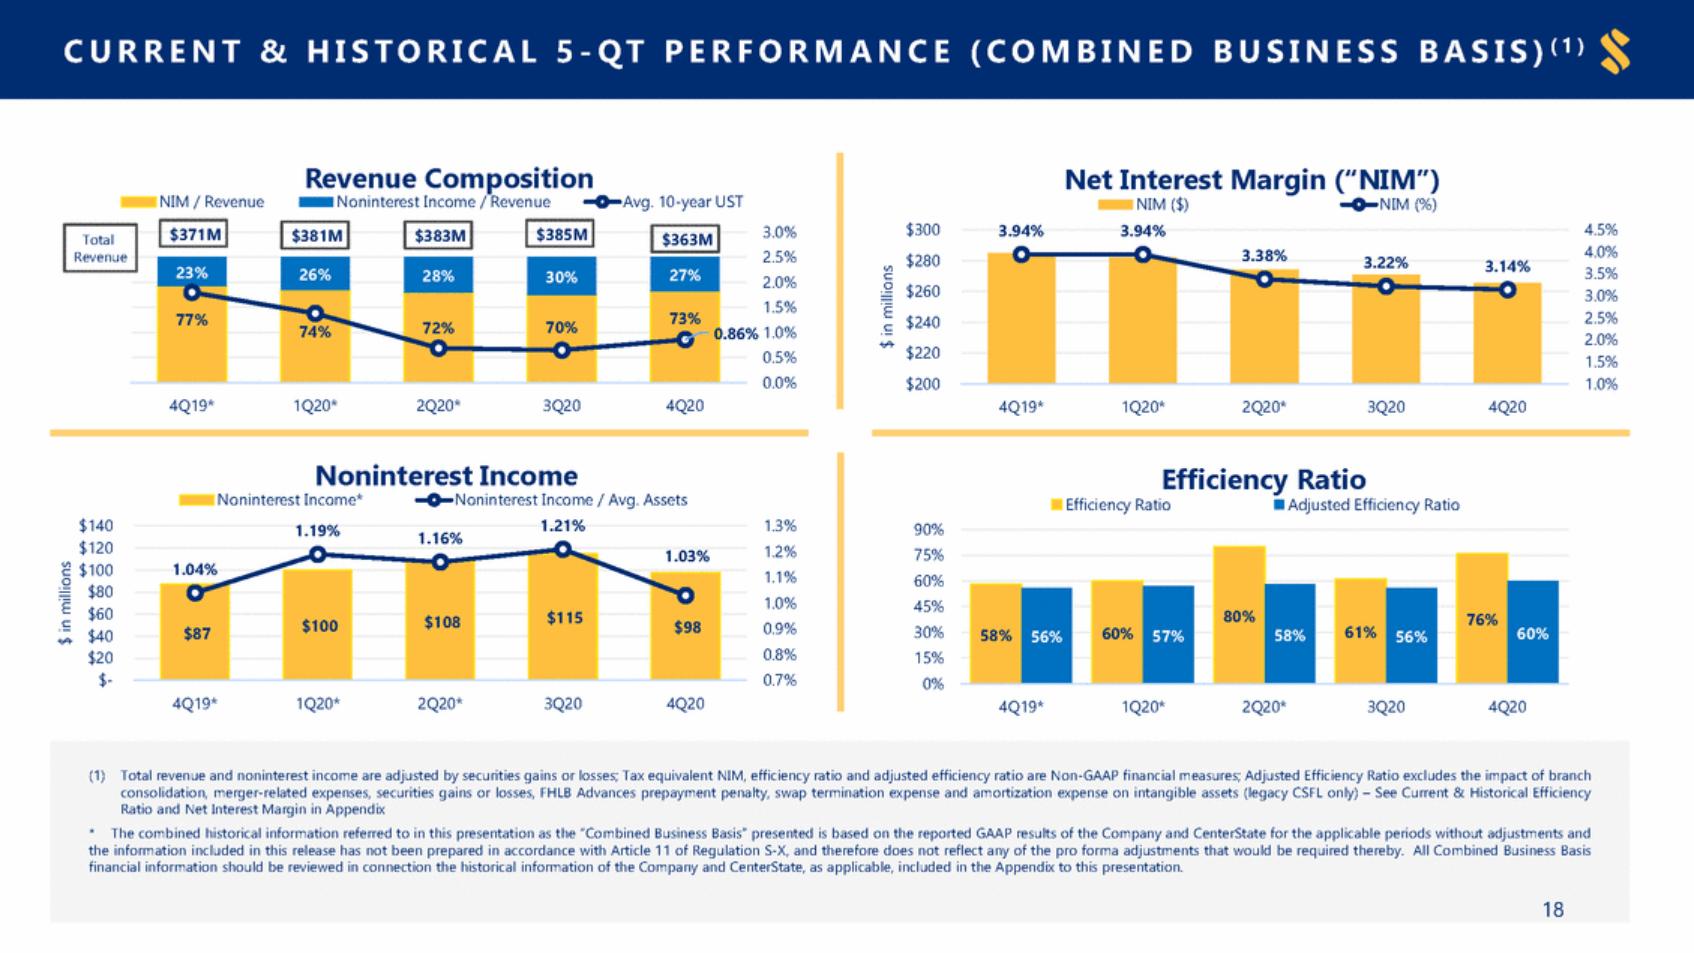
| C URRE NT&HI S T O RI C AL–E FFI C I E NC YR A TI O S&NE TI NTE RE S T MA R GIN ( U N A U DIT E D) Combined Business Basis Dec. 31, 2019 Mar. 31, 2020 Jun. 30, 2020 Sep. 30, 2020Dec. 31, 2020 Dollars in thousands (1) Does not include purchase accounting adjustments (2) Through June 7, 2020 (3) Legacy CSFL also adjusted noninterest expense by intangible assets’ amortization expenses for the adjusted efficiency ratios, which were approximately $4.6, $4.5 and $2.9 million for 4Q 19, 1Q 20 and 2Q 20 (through June 7), respectively The combined historical information referred to in this presentation as the “Combined Company Basis” presented is based on the reported GAAP results of the Company and CenterState for the applicable periods without adjustments and the information included in this release has not been prepared in accordance with Article 11 of Regulation S-X, and therefore does not reflect any of the pro forma adjustments that would be required thereby.28 Noninterest expense (GAAP) Net interest income (GAAP) Tax Equivalent ("TE") adjustments Net interest income, TE (non-GAAP) Noninterest income (GAAP) Less: Gain (loss) on sale of securities Adjusted noninterest income (non-GAAP) Efficiency Ratio (Non-GAPP) Noninterest expense (GAAP) Less Adjustments: Non-recurring items(3) Adjusted noninterest expense (non-GAAP) SSBCSFL Combined (1) SSBCSFL Combined (1) SSBCSFL (2) Combined SSB SSB $100,628 $113,409 $126,456 $157,925 503564 $214,037 $284,381 1,067 $107,247 $122,772 $128,013 $153,353 530685 $230,019 $281,366 1,215 $175,112 $132,703 $162,557 $111,624 579495 $307,815 $274,181 1,074 $236,887 $270,348 734 $278,398 $265,547 1,662 $126,959 $158,489 $36,307 $50,329 24(13) $285,448 $86,636 11 $128,543 $154,038 $44,132 $55,790 --$282,581 $99,922 - $163,136 $112,119 $54,347 $94,271 -40,276 $275,255 $148,618 40,276 $271,082 $114,790 15 $267,209 $97,871 35 $36,283 $50,342 $86,625 $44,132 $55,790 $99,922 $54,347 $53,995 $108,342 $114,775 $97,836 62%54% 58% 62%59% 60% 81%80% 80% 61% 76% $100,628 $113,409 1,4944,711 $214,037 6,205 $107,247 $122,772 4,1297,586 $230,019 11,715 $175,112 $132,703 40,47844,761 $307,815 85,239 $236,887 21,662 $278,398 58,679 $99,134 $108,698 $207,832 $103,118 $115,186 $218,304 $134,634 $87,942 $222,576 $215,225 $219,719 Adjusted Efficiency Ratio (Non-GAPP)61%52% 56% 60%55% 57% 62%53% 58% 56% 60% Interest-earning Assets$ 13,834,211 $ 14,779,757 Net interest income, TE (non-GAAP)126,959158,489 $ 28,613,968 285,448 $ 14,042,524 $ 14,873,007 128,543154,038 $ 28,915,531 282,581 $ 20,347,350 $ 12,414,262 163,136112,119 $ 32,761,612 275,255 $ 33,503,666 271,082 $ 33,853,006 267,209 Net Interest Margin (Non-GAPP) 3.94% 3.94% 3.38% 3.22% 3.14% |