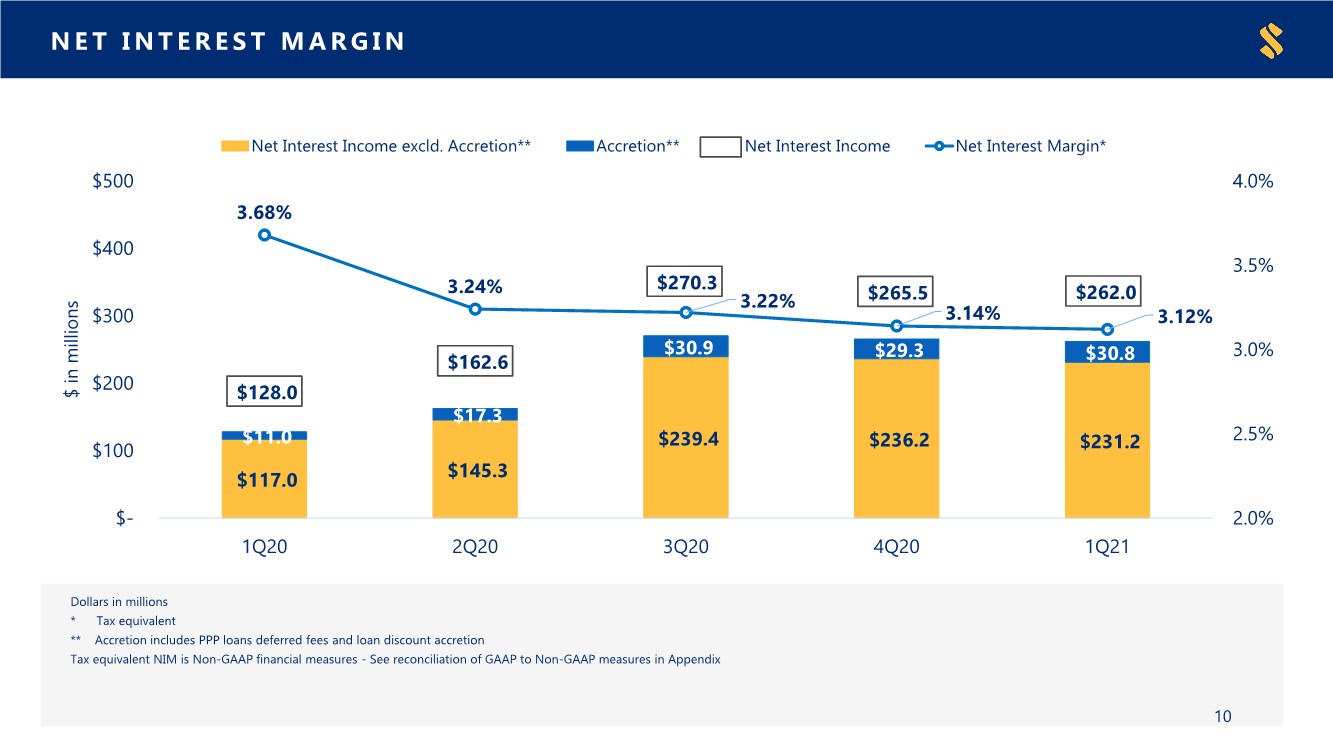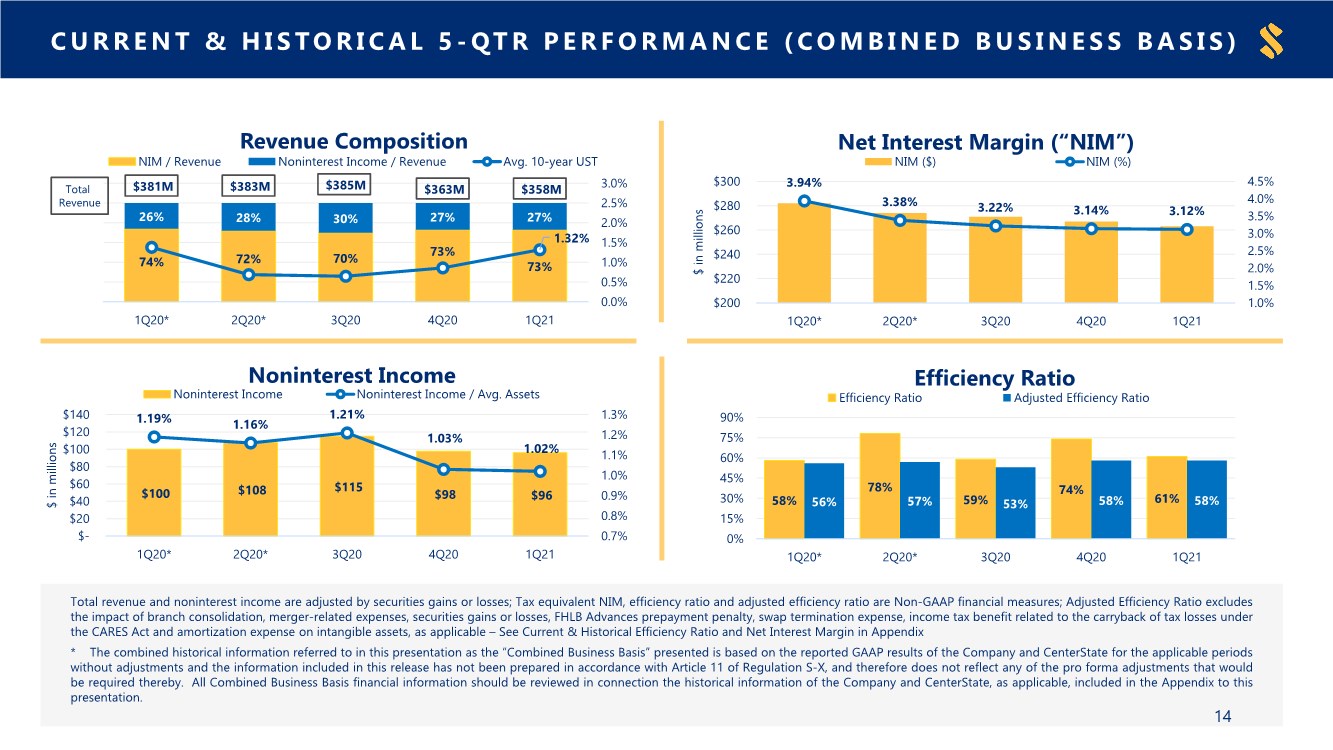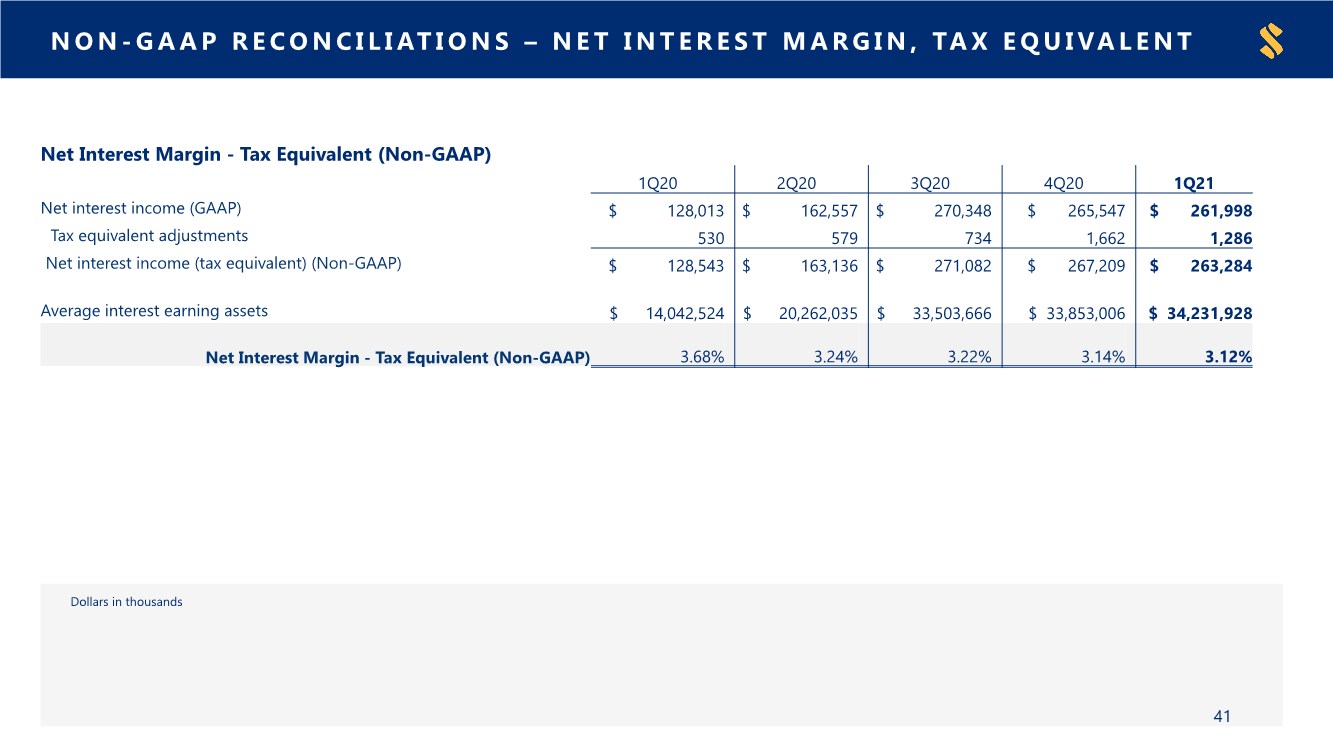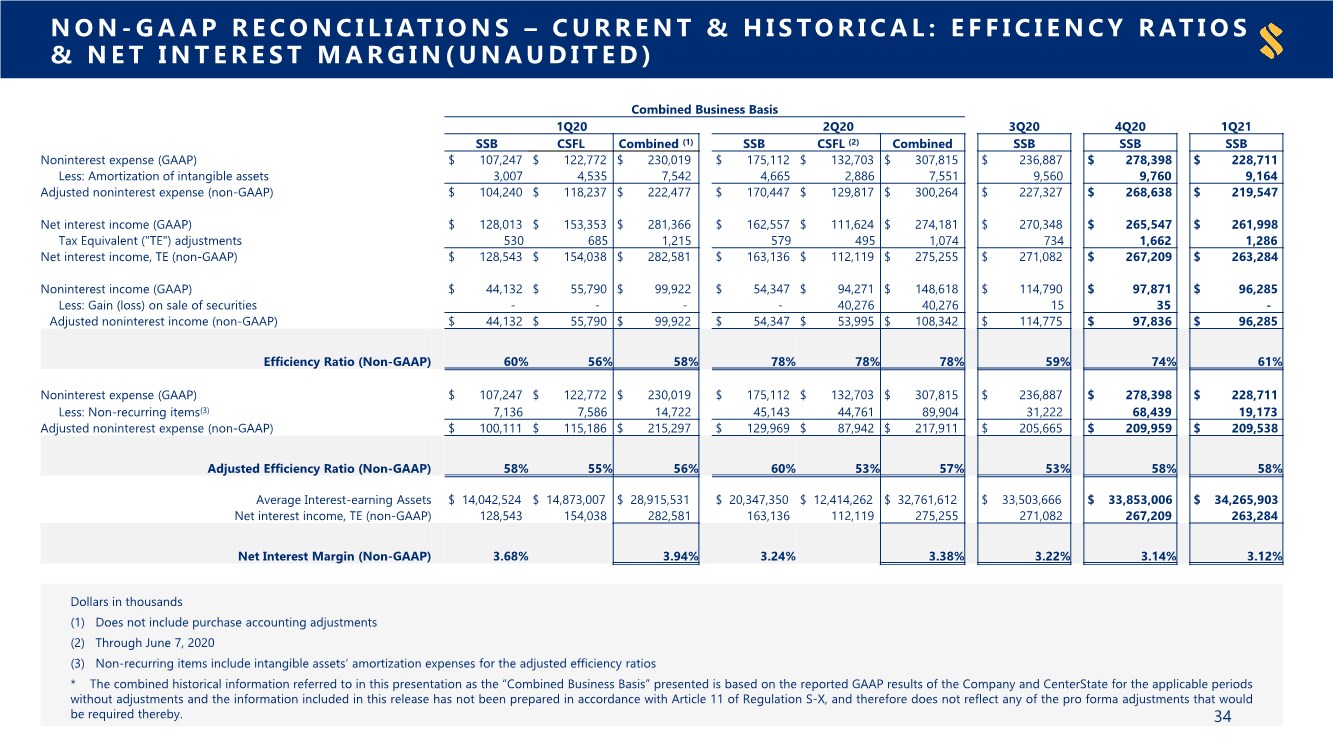
| NON- GAAP RECONCILIATIONS – CURRENT & HISTORICAL: EFFICIENCY RATIOS & NET INTEREST MARGIN(UNAUDITED) Dollars in thousands (1) Does not include purchase accounting adjustments (2) Through June 7, 2020 (3) Non-recurring items include intangible assets’ amortization expenses for the adjusted efficiency ratios * The combined historical information referred to in this presentation as the “Combined Business Basis” presented is based on the reported GAAP results of the Company and CenterState for the applicable periods without adjustments and the information included in this release has not been prepared in accordance with Article 11 of Regulation S-X, and therefore does not reflect any of the pro forma adjustments that would be required thereby. 34 Combined Business Basis 1Q20 2Q20 3Q20 4Q20 1Q21 SSB CSFL Combined (1) SSB CSFL (2) Combined SSB SSB SSB Noninterest expense (GAAP) $ 107,247 $ 122,772 $ 230,019 $ 175,112 $ 132,703 $ 307,815 $ 236,887 $ 278,398 $ 228,711 Less: Amortization of intangible assets 3,007 4,535 7,542 4,665 2,886 7,551 9,560 9,760 9,164 Adjusted noninterest expense (non-GAAP) $ 104,240 $ 118,237 $ 222,477 $ 170,447 $ 129,817 $ 300,264 $ 227,327 $ 268,638 $ 219,547 Net interest income (GAAP) $ 128,013 $ 153,353 $ 281,366 $ 162,557 $ 111,624 $ 274,181 $ 270,348 $ 265,547 $ 261,998 Tax Equivalent ("TE") adjustments 530 685 1,215 579 495 1,074 734 1,662 1,286 Net interest income, TE (non-GAAP) $ 128,543 $ 154,038 $ 282,581 $ 163,136 $ 112,119 $ 275,255 $ 271,082 $ 267,209 $ 263,284 Noninterest income (GAAP) $ 44,132 $ 55,790 $ 99,922 $ 54,347 $ 94,271 $ 148,618 $ 114,790 $ 97,871 $ 96,285 Less: Gain (loss) on sale of securities - - - - 40,276 40,276 15 35 - Adjusted noninterest income (non-GAAP) $ 44,132 $ 55,790 $ 99,922 $ 54,347 $ 53,995 $ 108,342 $ 114,775 $ 97,836 $ 96,285 Efficiency Ratio (Non-GAAP) 60% 56% 58% 78% 78% 78% 59% 74% 61% Noninterest expense (GAAP) $ 107,247 $ 122,772 $ 230,019 $ 175,112 $ 132,703 $ 307,815 $ 236,887 $ 278,398 $ 228,711 Less: Non-recurring items(3) 7,136 7,586 14,722 45,143 44,761 89,904 31,222 68,439 19,173 Adjusted noninterest expense (non-GAAP) $ 100,111 $ 115,186 $ 215,297 $ 129,969 $ 87,942 $ 217,911 $ 205,665 $ 209,959 $ 209,538 Adjusted Efficiency Ratio (Non-GAAP) 58% 55% 56% 60% 53% 57% 53% 58% 58% Average Interest-earning Assets $ 14,042,524 $ 14,873,007 $ 28,915,531 $ 20,347,350 $ 12,414,262 $ 32,761,612 $ 33,503,666 $ 33,853,006 $ 34,265,903 Net interest income, TE (non-GAAP) 128,543 154,038 282,581 163,136 112,119 275,255 271,082 267,209 263,284 Net Interest Margin (Non-GAAP) 3.68% 3.94% 3.24% 3.38% 3.22% 3.14% 3.12% |