| Earnings Call 1Q 2022 Friday, April 29, 2022 Exhibit 99.2 |
| DISCLAIMER2Statementsincludedinthiscommunication,whicharenothistoricalinnatureareintendedtobe,andareherebyidentifiedas,forward-lookingstatementsforpurposesofthesafeharborprovidedbySection27AoftheSecuritiesActof1933andSection21EoftheSecuritiesExchangeActof1934.Forward-lookingstatementsarebasedon,amongotherthings,management’sbeliefs,assumptions,currentexpectations,estimatesandprojectionsaboutthefinancialservicesindustry,theeconomyandSouthState.Wordsandphrasessuchas“may,”“approximately,”“continue,”“should,”“expects,”“projects,”“anticipates,”“islikely,”“lookahead,”“lookforward,”“believes,”“will,”“intends,”“estimates,”“strategy,”“plan,”“could,”“potential,”“possible”andvariationsofsuchwordsandsimilarexpressionsareintendedtoidentifysuchforward-lookingstatements. SouthStatecautionsreadersthatforward-lookingstatementsaresubjecttocertainrisks,uncertaintiesandassumptionsthataredifficulttopredictwithregardto,amongotherthings,timing,extent,likelihoodanddegreeofoccurrence,whichcouldcauseactualresultstodiffermateriallyfromanticipatedresults.Suchrisks,uncertaintiesandassumptions,include,amongothers,thefollowing:(1)economicdownturnrisk,potentiallyresultingindeteriorationinthecreditmarkets,inflation,greaterthanexpectednoninterestexpenses,excessiveloanlossesandothernegativeconsequences,whichriskscouldbeexacerbatedbypotentialcontinuednegativeeconomicdevelopmentsresultingfromtheCovid19pandemic,orfromfederalspendingcutsand/oroneormorefederalbudget-relatedimpassesoractions;(2)interestrateriskprimarilyresultingfromtheinterestrateenvironment,risinginterestrates,andtheirimpactontheBank’searnings,includingfromthecorrespondentandmortgagedivisions,housingdemand,themarketvalueofthebank’sloanandsecuritiesportfolios,andthemarketvalueofSouthState’sequity;(3)risksrelatedtothemergerandintegrationofSouthStateandCSFLincluding,amongothers,(i)theriskthatthecostsavingsandanyrevenuesynergiesfromthemergermaynotbefullyrealizedormaytakelongerthananticipatedtoberealized,(ii)theriskthatthepartiesareunabletosuccessfullyintegrateeachparty’sbusinessesintotheother’sbusinesses,(iii)theamountofthecosts,fees,expensesandchargesrelatedtothemerger,and(iv)reputationalriskandthereactionofeachcompany'scustomers,suppliers,employeesorotherbusinesspartnerstothemerger;(4)risksrelatedtothemergerandintegrationofSouthStateandAtlanticCapitalincluding,amongothers,(i)theriskthatthecostsavingsandanyrevenuesynergiesfromthemergermaynotbefullyrealizedormaytakelongerthananticipatedtoberealized,(ii)theriskthattheintegrationofAtlanticCapital’soperationsintoSouthState’soperationswillbemateriallydelayedorwillbemorecostlyordifficultthanexpectedorthatthepartiesareotherwiseunabletosuccessfullyintegrateAtlanticCapital’sbusinessesintoSouthState’sbusinesses,(iii)theamountofthecosts,fees,expensesandchargesrelatedtothemerger,and(iv)reputationalriskandthereactionofeachcompany'scustomers,suppliers,employeesorotherbusinesspartnerstothemerger;(5)risksrelatingtothe continuedimpactoftheCovid19pandemicontheCompany,includingpossibleimpacttotheCompanyanditsemployeesfromcontactingCovid19,andtoefficienciesandthecontrolenvironmentduetothechangingworkenvironmentandtoourresultsofoperationsduetogovernmentstimulusandotherinterventionstomitigatetheimpactofthepandemic;(6)theimpactofincreasingdigitizationofthebankingindustryandmovementofcustomerstoon-lineplatforms,andthepossibleimpactontheBank’sresultsofoperations,customerbase,expenses,suppliersandoperations;(7)controlsandproceduresrisk,includingthepotentialfailureorcircumventionofourcontrolsandproceduresorfailuretocomplywithregulationsrelatedtocontrolsandprocedures;(8)potentialdeteriorationinrealestatevalues;(9)theimpactofcompetitionwithotherfinancialinstitutions,includingpricingpressures(includingthoseresultingfromtheCARESAct)andtheresultingimpact,includingasaresultofcompressiontonetinterestmargin;(10)risksrelatingtotheabilitytoretainourcultureandattractandretainqualifiedpeople;(11)creditrisksassociatedwithanobligor’sfailuretomeetthetermsofanycontractwiththebankorotherwisefailtoperformasagreedunderthetermsofanyloan-relateddocument;(12)risksrelatedtotheabilityofthecompanytopursueitsstrategicplanswhichdependuponcertaingrowthgoalsinourlinesofbusiness;(13)liquidityriskaffectingtheBank’sabilitytomeetitsobligationswhentheycomedue;(14)risksassociatedwithananticipatedincreaseinSouthState’sinvestmentsecuritiesportfolio,includingrisksassociatedwithacquiringandholdinginvestmentsecuritiesorpotentiallydeterminingthattheamountofinvestmentsecuritiesSouthStatedesirestoacquirearenotavailableontermsacceptabletoSouthState;(15)priceriskfocusingonchangesinmarketfactorsthatmayaffectthevalueoftradedinstrumentsin“mark-to-market”portfolios;(16)transactionriskarisingfromproblemswithserviceorproductdelivery;(17)complianceriskinvolvingrisktoearningsorcapitalresultingfromviolationsofornonconformancewithlaws,rules,regulations,prescribedpractices,orethicalstandards;(18)regulatorychangeriskresultingfromnewlaws,rules,regulations,accounting principles,proscribedpracticesorethicalstandards,including,withoutlimitation,thepossibilitythatregulatoryagenciesmayrequirehigherlevelsofcapitalabovethecurrentregulatory-mandatedminimumsandincludingtheimpactoftheCARESAct,theConsumerFinancialProtectionBureauregulations,andthepossibilityofchangesinaccountingstandards,policies,principlesandpractices,includingchangesinaccountingprinciplesrelatingtoloanlossrecognition(CECL);(19)strategicriskresultingfromadversebusinessdecisionsorimproperimplementationofbusinessdecisions;(20)reputationriskthatadverselyaffectsearningsorcapitalarisingfromnegativepublicopinion;(21)cybersecurityriskrelatedtothedependenceofSouthStateoninternalcomputersystemsandthetechnologyofoutsideserviceproviders,aswellasthepotentialimpactsofinternalorexternalsecuritybreaches,whichmaysubjectthecompanytopotentialbusinessdisruptionsorfinanciallossesresultingfromdeliberateattacksorunintentionalevents;(22)reputationalandoperationalrisksassociatedwithenvironment,socialandgovernance(ESG)matters,includingtheimpactofrecentlyissuedproposedregulatoryguidanceandregulationrelatingtoclimatechange;(23)greaterthanexpectednoninterestexpenses;(24)excessiveloanlosses;(25)potentialdepositattrition,higherthanexpectedcosts,customerlossandbusinessdisruptionassociatedwiththeAtlanticCapitalintegration,andpotentialdifficultiesinmaintainingrelationshipswithkeypersonnel;(26)reputationalriskandpossiblehigherthanestimatedreducedrevenuefromannouncedchangesintheBank’sconsumeroverdraftprograms;(27)therisksoffluctuationsinmarketpricesforSouthStatecommonstockthatmayormaynotreflecteconomicconditionorperformanceofSouthState;(28)thepaymentofdividendsonSouthStatecommonstock,whichissubjecttolegalandregulatorylimitationsaswellasthediscretionoftheboardofdirectorsofSouthState,SouthState’sperformanceandotherfactors;(29)ownershipdilutionriskassociatedwithpotentialacquisitionsinwhichSouthState’sstockmaybeissuedasconsiderationforanacquiredcompany;(30)operational,technological,cultural,regulatory,legal,creditandotherrisksassociatedwiththeexploration,consummationandintegrationofpotentialfutureacquisitions,whetherinvolvingstockorcashconsideration;(31)majorcatastrophessuchashurricanes,tornados,earthquakes,floodsorothernaturalorhumandisasters,includinginfectiousdiseaseoutbreaks,suchastheongoingCovid19pandemic, andtherelateddisruptiontolocal,regionalandglobaleconomicactivityandfinancialmarkets,andtheimpactthatanyoftheforegoingmayhaveonSouthStateanditscustomersandotherconstituencies;(32)terroristactivitiesriskthatresultsinlossofconsumerconfidenceandeconomicdisruptions;and(33)otherfactorsthatmayaffectfutureresultsofSouthState,asdisclosedinSouthState’sAnnualReportonForm10-K,QuarterlyReportsonForm10-Q,andCurrentReportsonForm8-K,filedbySouthStatewiththeU.S.SecuritiesandExchangeCommission(“SEC”)andavailableontheSEC’swebsiteathttp://www.sec.gov,anyofwhichcouldcauseactualresultstodiffermateriallyfromfutureresultsexpressed,impliedorotherwiseanticipatedbysuchforward-lookingstatements. Allforward-lookingstatementsspeakonlyasofthedatetheyaremadeandarebasedoninformationavailableatthattime.SouthStatedoesnotundertakeanyobligationtoupdateorotherwisereviseanyforward-lookingstatements,whetherasaresultofnewinformation,futureevents,orotherwise,exceptasrequiredbyfederalsecuritieslaws.Asforward-lookingstatementsinvolvesignificantrisksanduncertainties,cautionshouldbeexercisedagainstplacingunduerelianceonsuchstatements. |
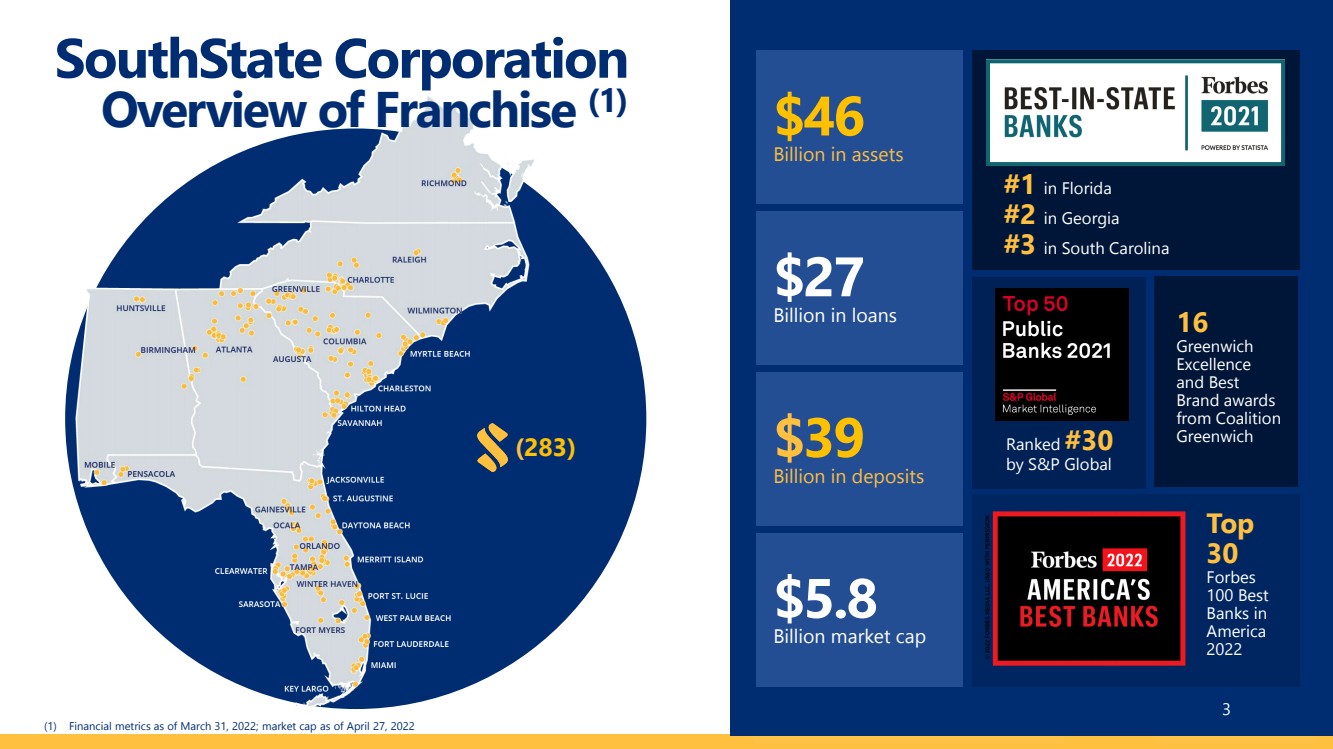
| $39Billion in deposits $27Billion in loans $46Billion in assets $5.8Billion market cap(1)FinancialmetricsasofMarch31,2022;marketcapasofApril27,2022SouthState CorporationOverview of Franchise (1)3 (283) #1 in Florida#2 in Georgia #3 in South CarolinaTop 30Forbes 100 Best Banks in America 2022 Ranked #30by S&P Global 16Greenwich Excellence and Best Brand awards from Coalition Greenwich |
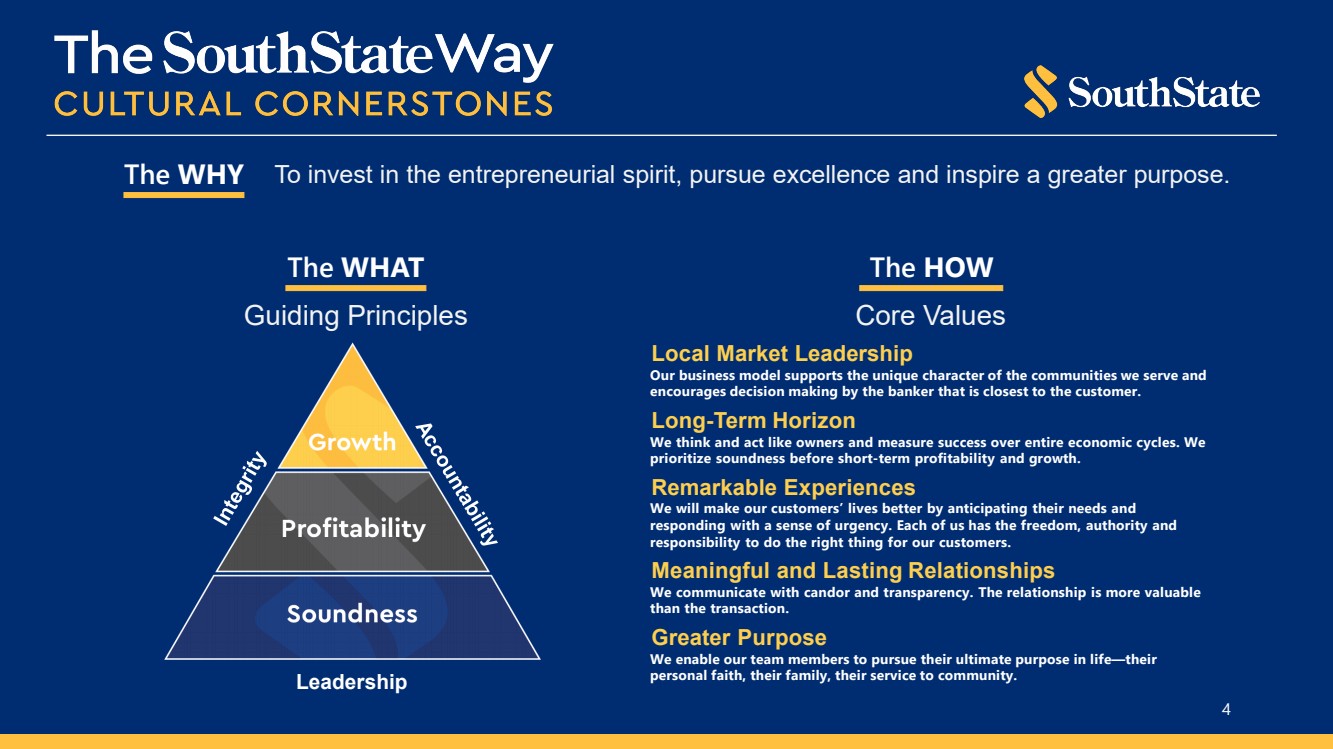
| Local MarketLeadershipOur business model supports the unique character of the communities we serve and encourages decision making by the banker that is closest to the customer.Long-TermHorizonWe think and act like owners and measure success over entire economic cycles. We prioritize soundness before short-term profitability and growth.RemarkableExperiencesWe will make our customers’ lives better by anticipating their needs and responding with a sense of urgency. Each of us has the freedom, authority and responsibility to do the right thing for our customers.Meaningful and LastingRelationshipsWe communicate with candor and transparency. The relationship is more valuable than the transaction.Greater PurposeWe enable our team members to pursue their ultimate purpose in life—their personal faith, their family, their service to community.The WHATThe HOW Guiding PrinciplesCore Values Leadership The WHY To invest in the entrepreneurial spirit, pursue excellence and inspire a greater purpose.4 |
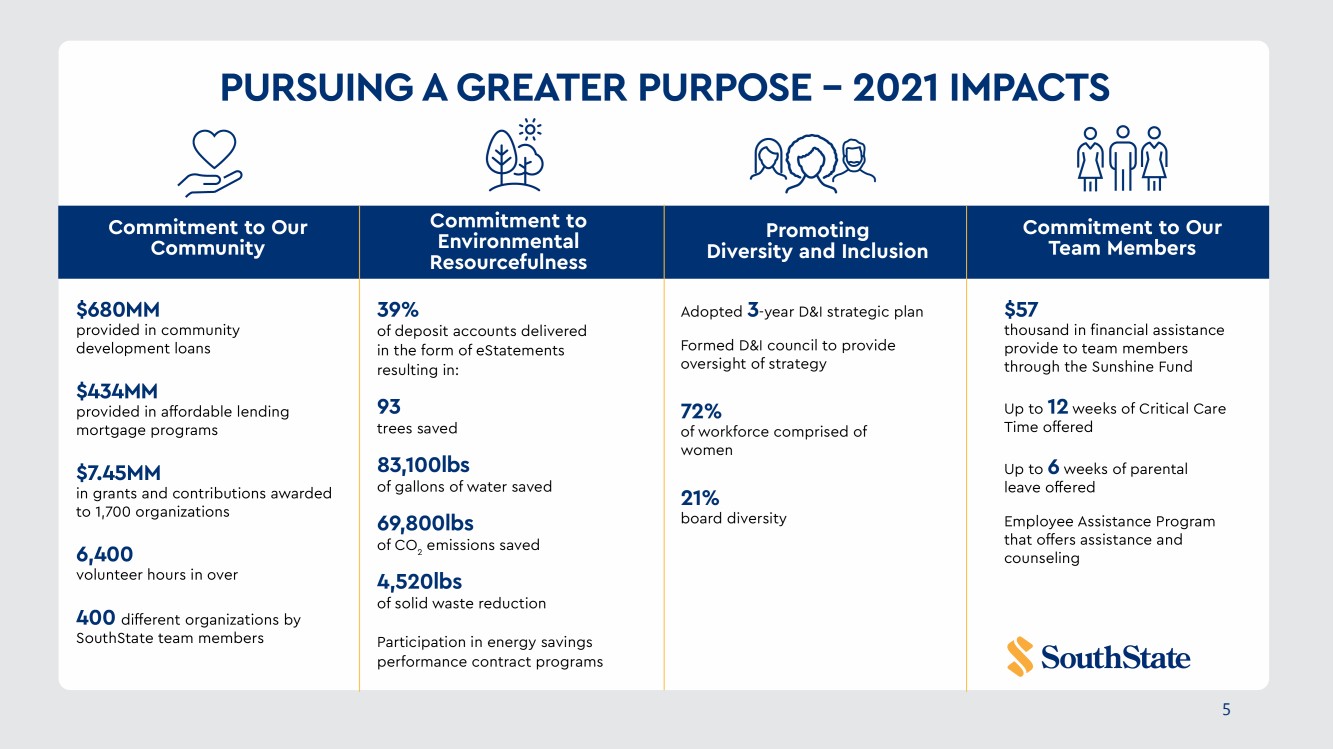
| 5 5 |
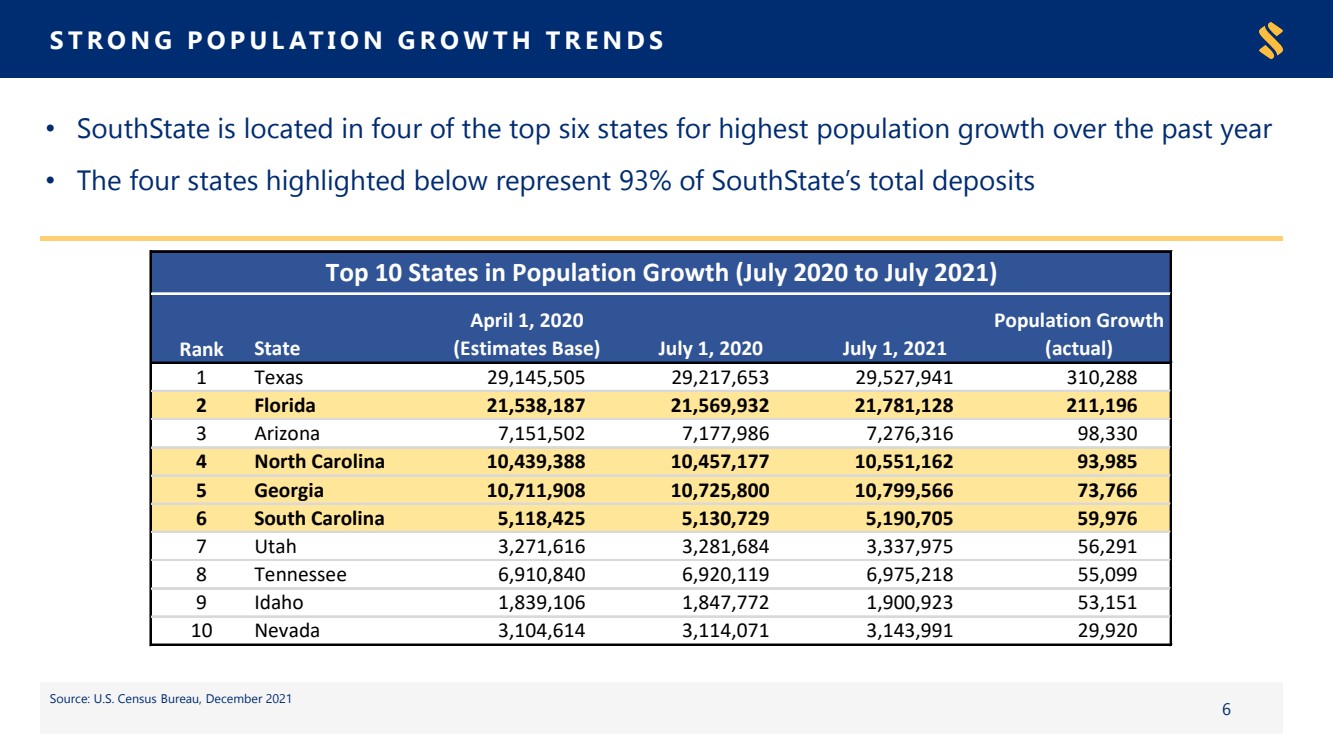
| STRONG POPULATION GROWTH TRENDS6•SouthState is located in four of the top six states for highest population growth over the past year•The four states highlighted below represent 93% of SouthState’s total deposits Source: U.S. Census Bureau, December 20216 Rank State April 1, 2020 (Estimates Base) July 1, 2020July 1, 2021 Population Growth (actual) 1Texas29,145,50529,217,65329,527,941310,288 2Florida21,538,18721,569,93221,781,128211,196 3Arizona7,151,5027,177,9867,276,31698,330 4North Carolina10,439,38810,457,17710,551,16293,985 5Georgia10,711,90810,725,80010,799,56673,766 6South Carolina5,118,4255,130,7295,190,70559,976 7Utah3,271,6163,281,6843,337,97556,291 8Tennessee6,910,8406,920,1196,975,21855,099 9Idaho1,839,1061,847,7721,900,92353,151 10Nevada3,104,6143,114,0713,143,99129,920 Top 10 States in Population Growth (July 2020 to July 2021) |
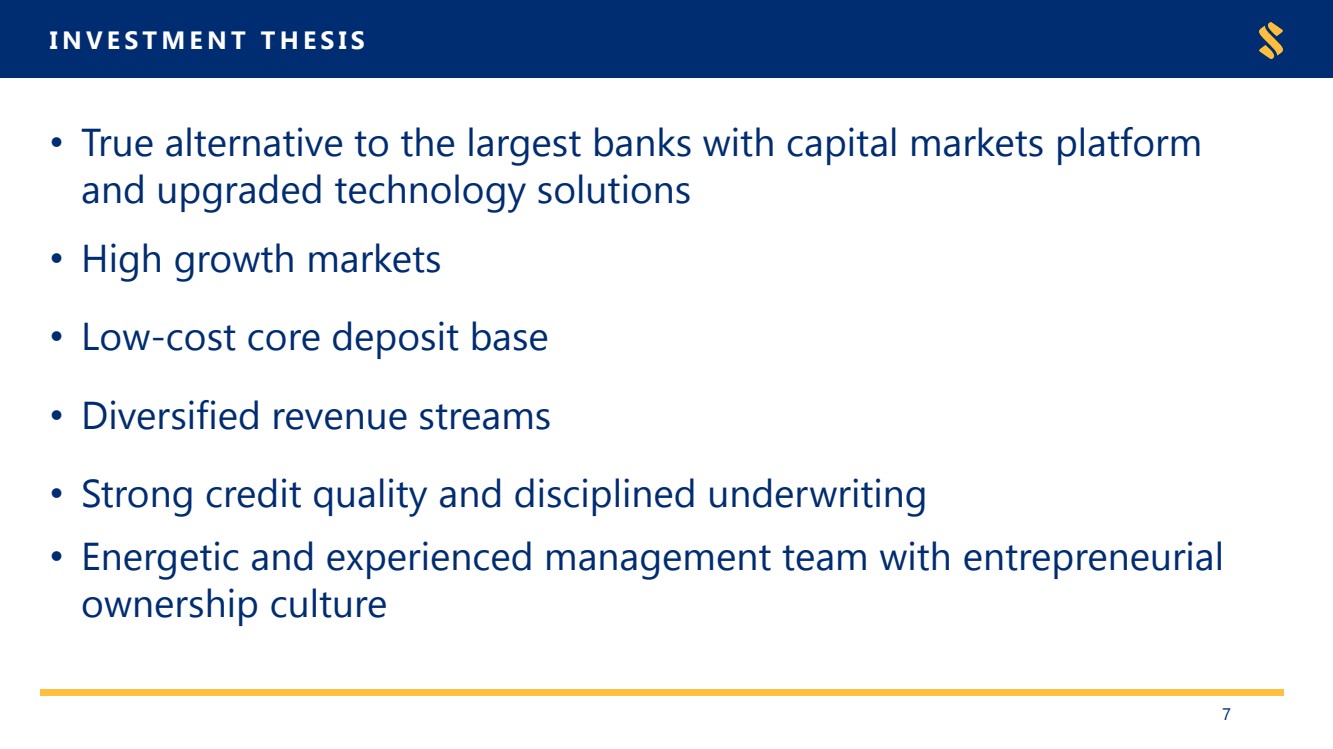
| INVESTMENT THESIS7 •True alternative to the largest banks with capital markets platform and upgraded technology solutions•High growth markets•Low-cost core deposit base•Diversified revenue streams •Strong credit quality and disciplined underwriting •Energetic and experienced management team with entrepreneurial ownership culture |
| Quarterly Results |

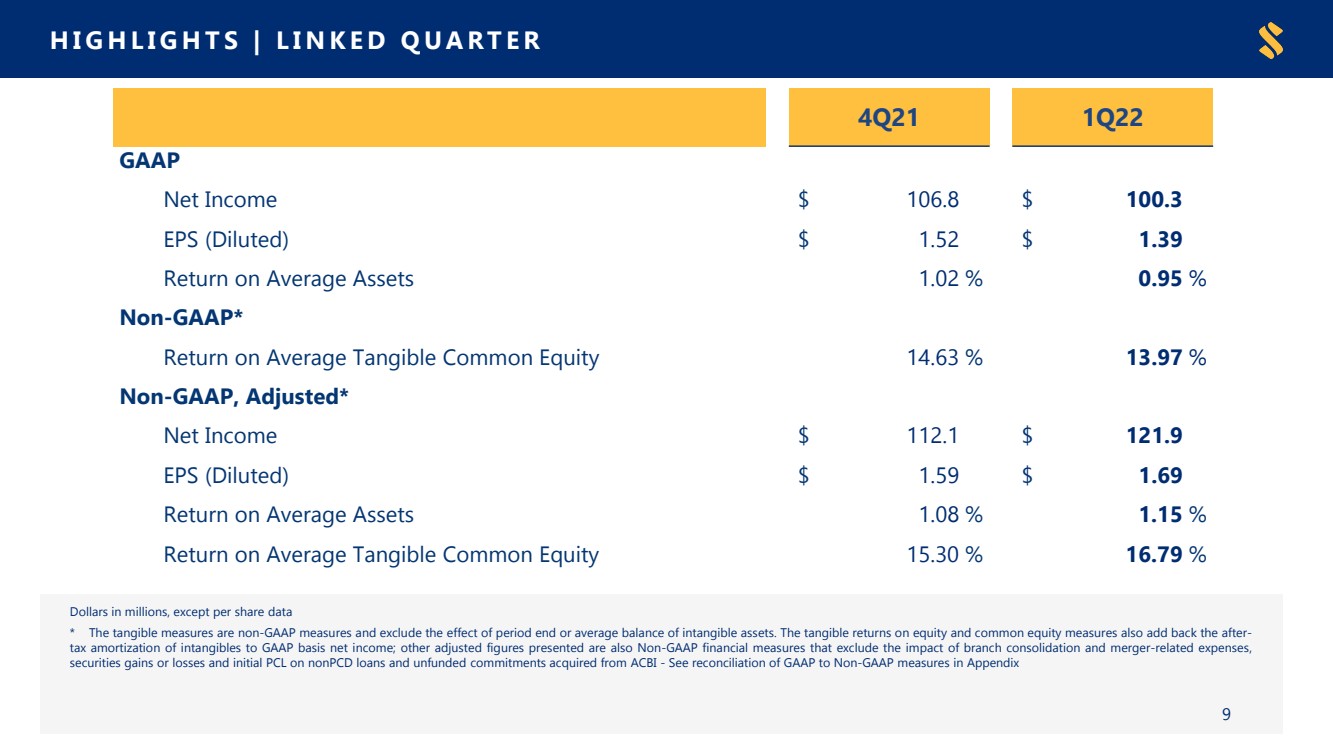
| HIGHLIGHTS | LINKED QUARTER Dollars in millions, except per share data*Thetangiblemeasuresarenon-GAAPmeasuresandexcludetheeffectofperiodendoraveragebalanceofintangibleassets.Thetangiblereturnsonequityandcommonequitymeasuresalsoaddbacktheafter-taxamortizationofintangiblestoGAAPbasisnetincome;otheradjustedfigurespresentedarealsoNon-GAAPfinancialmeasuresthatexcludetheimpactofbranchconsolidationandmerger-relatedexpenses,securitiesgainsorlossesandinitialPCLonnonPCDloansandunfundedcommitmentsacquiredfromACBI-SeereconciliationofGAAPtoNon-GAAPmeasuresinAppendix9 4Q211Q22GAAPNet Income$106.8$100.3EPS (Diluted)$1.52$1.39Return on AverageAssets1.02%0.95%Non-GAAP*Return on AverageTangible Common Equity14.63%13.97%Non-GAAP,Adjusted*Net Income$112.1$121.9EPS (Diluted)$1.59$1.69Return on AverageAssets1.08%1.15%Return on AverageTangible Common Equity15.30%16.79% |
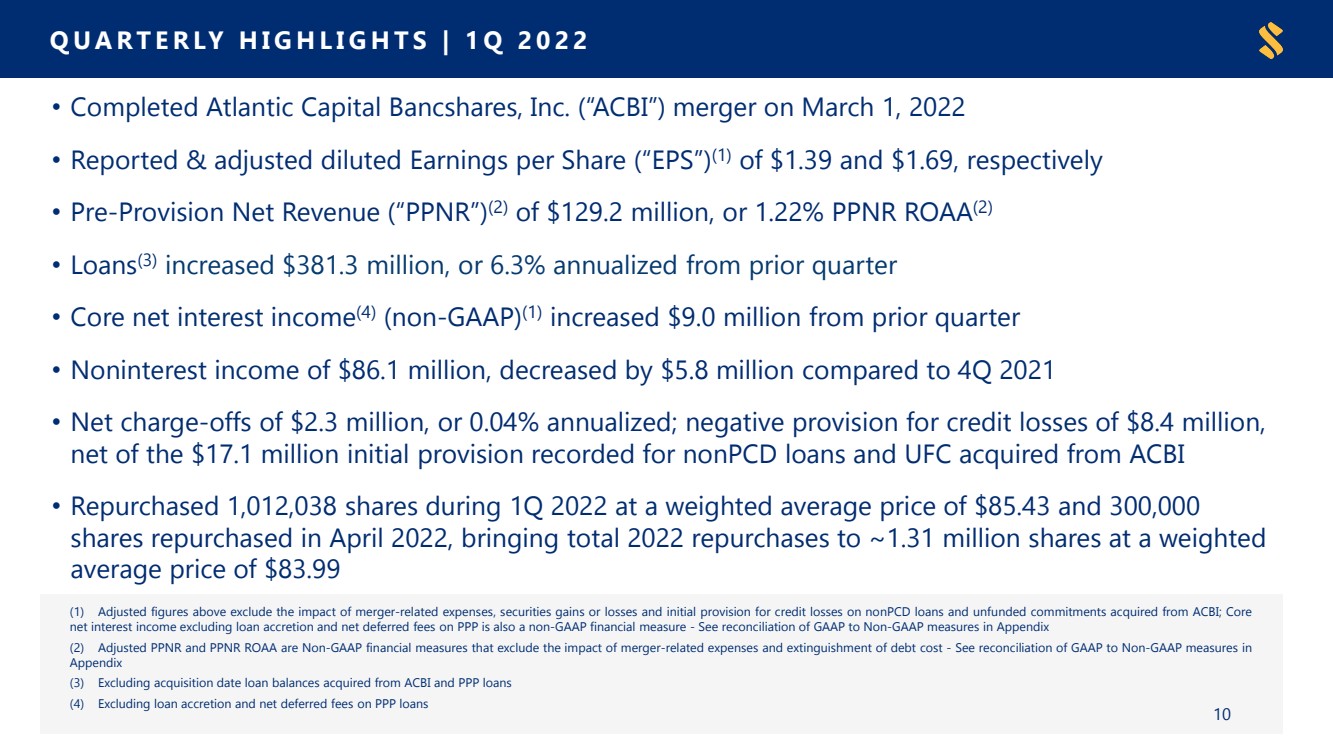
| (1)Adjustedfiguresaboveexcludetheimpactofmerger-relatedexpenses,securitiesgainsorlossesandinitialprovisionforcreditlossesonnonPCDloansandunfundedcommitmentsacquiredfromACBI;CorenetinterestincomeexcludingloanaccretionandnetdeferredfeesonPPPisalsoanon-GAAPfinancialmeasure-SeereconciliationofGAAPtoNon-GAAPmeasuresinAppendix(2)AdjustedPPNRandPPNRROAAareNon-GAAPfinancialmeasuresthatexcludetheimpactofmerger-relatedexpensesandextinguishmentofdebtcost-SeereconciliationofGAAPtoNon-GAAPmeasuresinAppendix(3)ExcludingacquisitiondateloanbalancesacquiredfromACBIandPPPloans(4)ExcludingloanaccretionandnetdeferredfeesonPPPloans10•Completed Atlantic Capital Bancshares, Inc. (“ACBI”) merger on March 1, 2022•Reported & adjusted diluted Earnings per Share (“EPS”)(1)of $1.39 and $1.69, respectively•Pre-Provision Net Revenue (“PPNR”)(2)of $129.2 million, or 1.22% PPNR ROAA(2)•Loans(3)increased $381.3 million, or 6.3% annualized from prior quarter•Corenet interest income(4)(non-GAAP)(1)increased $9.0 million from prior quarter•Noninterest income of $86.1 million, decreased by $5.8 million compared to 4Q 2021 •Net charge-offs of $2.3 million, or 0.04% annualized; negative provision for credit losses of $8.4 million, net of the $17.1 million initial provision recorded for nonPCD loans and UFC acquired from ACBI•Repurchased 1,012,038 shares during 1Q 2022 at a weighted average price of $85.43 and 300,000 shares repurchased in April 2022, bringing total 2022 repurchases to ~1.31 million shares at a weighted average price of $83.99QUARTERLY HIGHLIGHTS | 1Q 2022 |
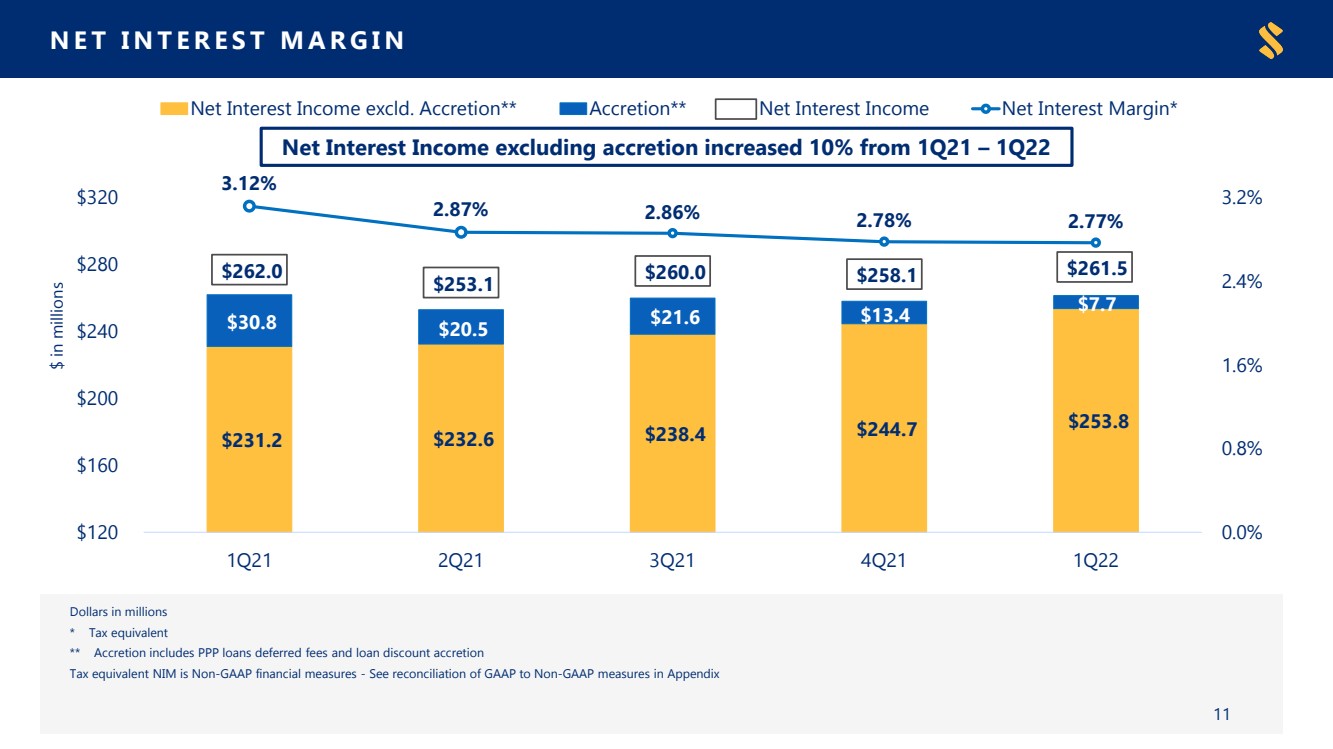
| $231.2 $232.6 $238.4 $244.7 $253.8 $30.8 $20.5 $21.6 $13.4 $7.7 $262.0 $253.1 $260.0 $258.1 $261.5 3.12%2.87%2.86%2.78%2.77%0.0%0.8% 1.6%2.4%3.2% $120 $160 $200 $240 $280 $3201Q212Q213Q214Q211Q22$ in millions Net Interest Income excld. Accretion** Accretion**Net Interest Income Net Interest Margin* Net Interest Income excluding accretion increased 10% from 1Q21 –1Q22 NET INTEREST MARGIN Dollarsinmillions*Taxequivalent**AccretionincludesPPPloansdeferredfeesandloandiscountaccretionTaxequivalentNIMisNon-GAAPfinancialmeasures-SeereconciliationofGAAPtoNon-GAAPmeasuresinAppendix11 |
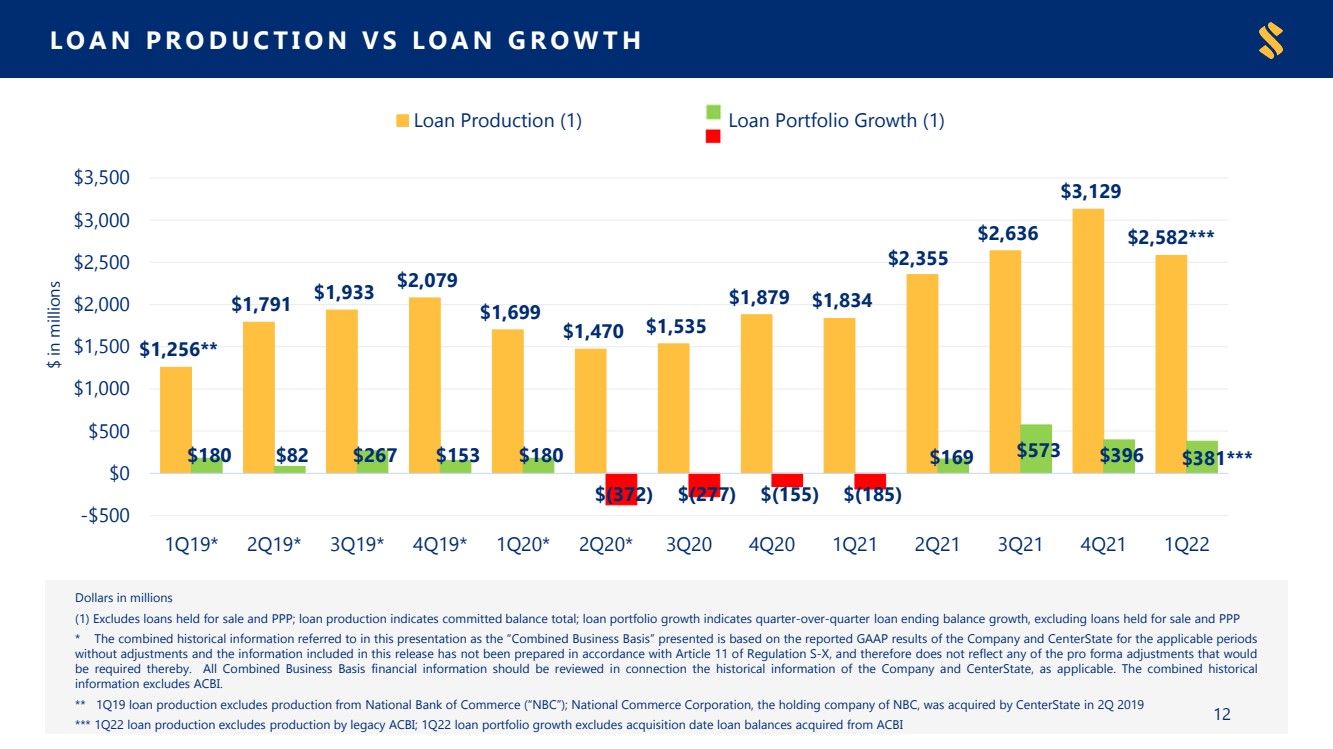
| LOAN PRODUCTION VS LOAN GROWTH Dollarsinmillions(1)ExcludesloansheldforsaleandPPP;loanproductionindicatescommittedbalancetotal;loanportfoliogrowthindicatesquarter-over-quarterloanendingbalancegrowth,excludingloansheldforsaleandPPP*Thecombinedhistoricalinformationreferredtointhispresentationasthe“CombinedBusinessBasis”presentedisbasedonthereportedGAAPresultsoftheCompanyandCenterStatefortheapplicableperiodswithoutadjustmentsandtheinformationincludedinthisreleasehasnotbeenpreparedinaccordancewithArticle11ofRegulationS-X,andthereforedoesnotreflectanyoftheproformaadjustmentsthatwouldberequiredthereby.AllCombinedBusinessBasisfinancialinformationshouldbereviewedinconnectionthehistoricalinformationoftheCompanyandCenterState,asapplicable.ThecombinedhistoricalinformationexcludesACBI.**1Q19loanproductionexcludesproductionfromNationalBankofCommerce(“NBC”);NationalCommerceCorporation,theholdingcompanyofNBC,wasacquiredbyCenterStatein2Q2019***1Q22loanproductionexcludesproductionbylegacyACBI;1Q22loanportfoliogrowthexcludesacquisitiondateloanbalancesacquiredfromACBI12 $1,256**$1,791 $1,933 $2,079 $1,699 $1,470 $1,535 $1,879 $1,834 $2,355 $2,636 $3,129 $2,582***$180 $82 $267 $153 $180 $(372)$(277)$(155)$(185)$169 $573 $396 $381***-$500$0$500$1,000$1,500$2,000$2,500 $3,000$3,5001Q19*2Q19*3Q19*4Q19*1Q20*2Q20*3Q204Q201Q212Q213Q214Q211Q22$ in millions Loan Production (1) Loan Portfolio Growth (1) |
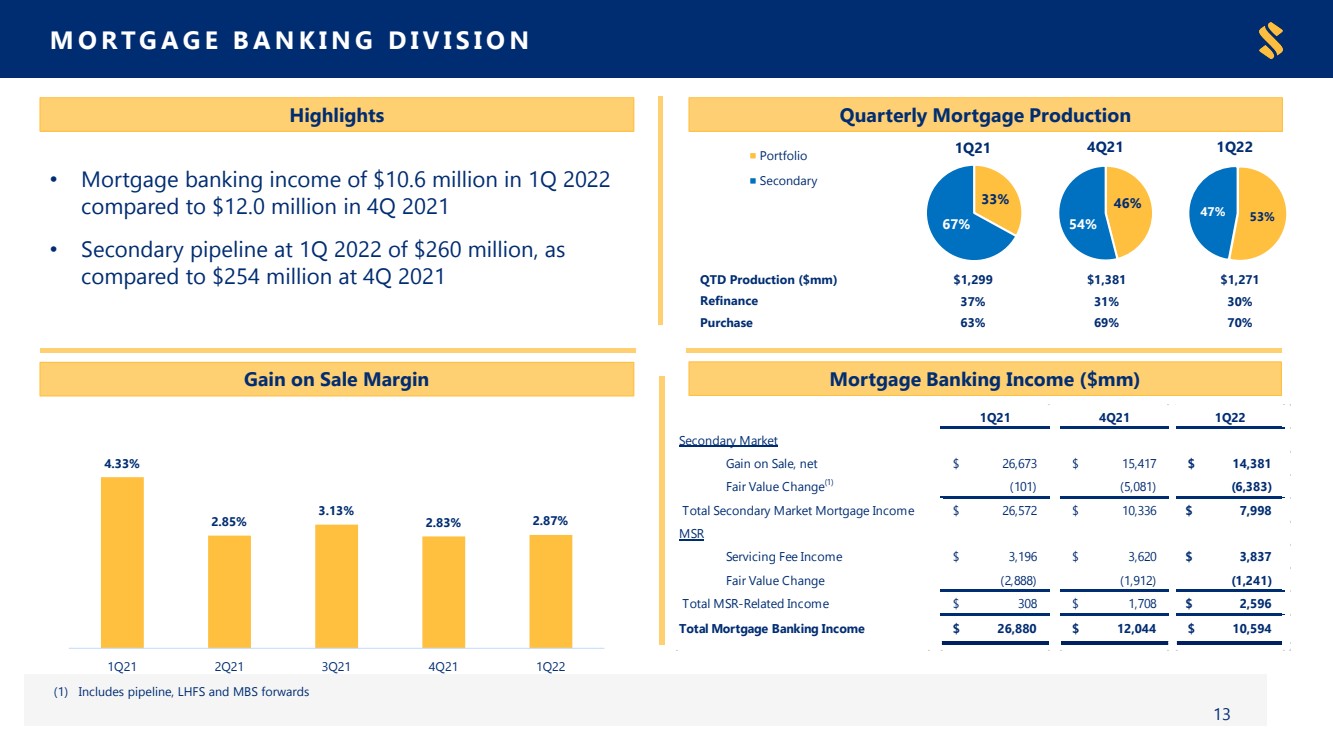
| QTD Production ($mm)$1,299$1,381$1,271 Refinance37%31%30% Purchase63%69%70%MORTGAGE BANKING DIVISION (1)Includes pipeline, LHFS and MBS forwards13 Highlights Quarterly Mortgage Production Gain on Sale Margin•Mortgage banking income of $10.6 million in 1Q 2022 compared to $12.0 million in 4Q 2021•Secondary pipeline at 1Q 2022 of $260 million, as compared to $254million at 4Q 2021 4.33%2.85%3.13%2.83%2.87%1Q212Q213Q214Q211Q22 Mortgage Banking Income ($mm) 53%47%1Q22 33%67%1Q21 Portfolio Secondary 46%54%4Q21 1Q214Q211Q22 Secondary Market Gain on Sale, net $ 26,673 $ 15,417 $ 14,381 Fair Value Change(1) (101) (5,081) (6,383) Total Secondary Market Mortgage Income $ 26,572 $ 10,336 $ 7,998 MSR Servicing Fee Income $ 3,196 $ 3,620 $ 3,837 Fair Value Change (2,888) (1,912) (1,241) Total MSR-Related Income $ 308 $ 1,708 $ 2,596 Total Mortgage Banking Income $ 26,880 $ 12,044 $ 10,594 |
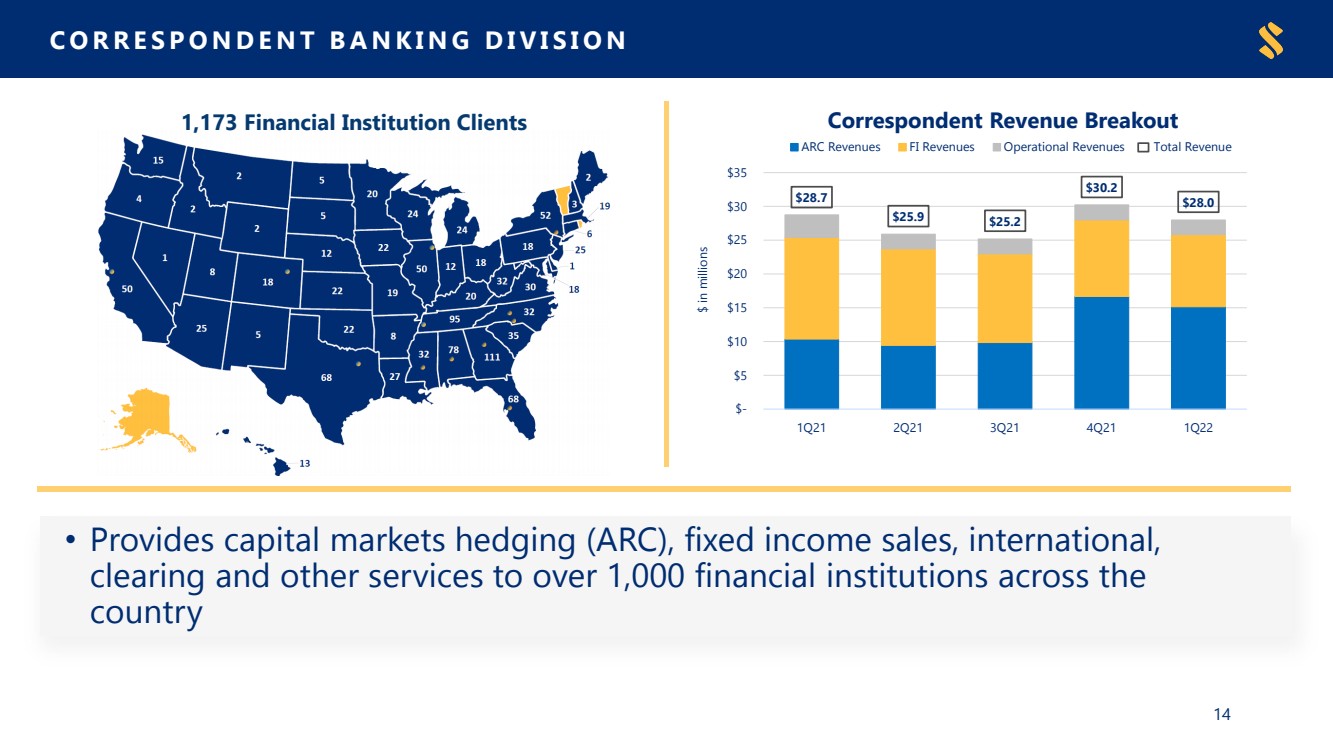
| •Provides capital markets hedging (ARC), fixed income sales, international, clearing and other services to over 1,000 financial institutions across the country CORRESPONDENT BANKING DIVISION1,173 Financial Institution Clients14 $28.7 $25.9 $25.2 $30.2 $28.0 $0.0$5.0$10.0$15.0$20.0$25.0$30.0$35.0 $- $5 $10 $15 $20 $25 $30 $351Q212Q213Q214Q211Q22$ in millionsCorrespondent Revenue Breakout ARC Revenues FI Revenues Operational RevenuesTotal Revenue |
| Interest Rate Sensitivity |
| CASH & SECURITIES Dollarsinbillions*Thecombinedhistoricalinformationreferredtointhispresentationasthe“CombinedBusinessBasis”presentedisbasedonthereportedGAAPresultsoftheCompanyandCenterStatefortheapplicableperiodswithoutadjustmentsandtheinformationincludedinthisreleasehasnotbeenpreparedinaccordancewithArticle11ofRegulationS-X,andthereforedoesnotreflectanyoftheproformaadjustmentsthatwouldberequiredthereby.AllCombinedBusinessBasisfinancialinformationshouldbereviewedinconnectionthehistoricalinformationoftheCompanyandCenterState,asapplicable,includedintheAppendixtothispresentation.ThecombinedhistoricalinformationexcludesACBI.16 $4.1 $4.4 $3.3 $3.7 $4.5 $5.3 $5.7 $6.4 $7.1 $8.9 $0.6 $2.0 $4.0 $4.1 $4.2 $5.6 $5.9 $5.7 $6.4 $5.4 $4.7B $6.4B $7.3B $7.8B $8.7B $10.9B $11.6B $12.1B $13.5B $14.4B 1.80%1.38%0.69%0.65%0.86%1.32%1.59%1.33%1.53%1.98%0.0%0.5%1.0% 1.5% 2.0% 2.5%3.0% $- $3.0 $6.0 $9.0 $12.0 $15.04Q19*1Q20*2Q203Q204Q201Q212Q213Q214Q211Q22$ in billions Investments ($) Fed Funds & Int. Earning Cash ($) Avg. 10-Yr Treasury |

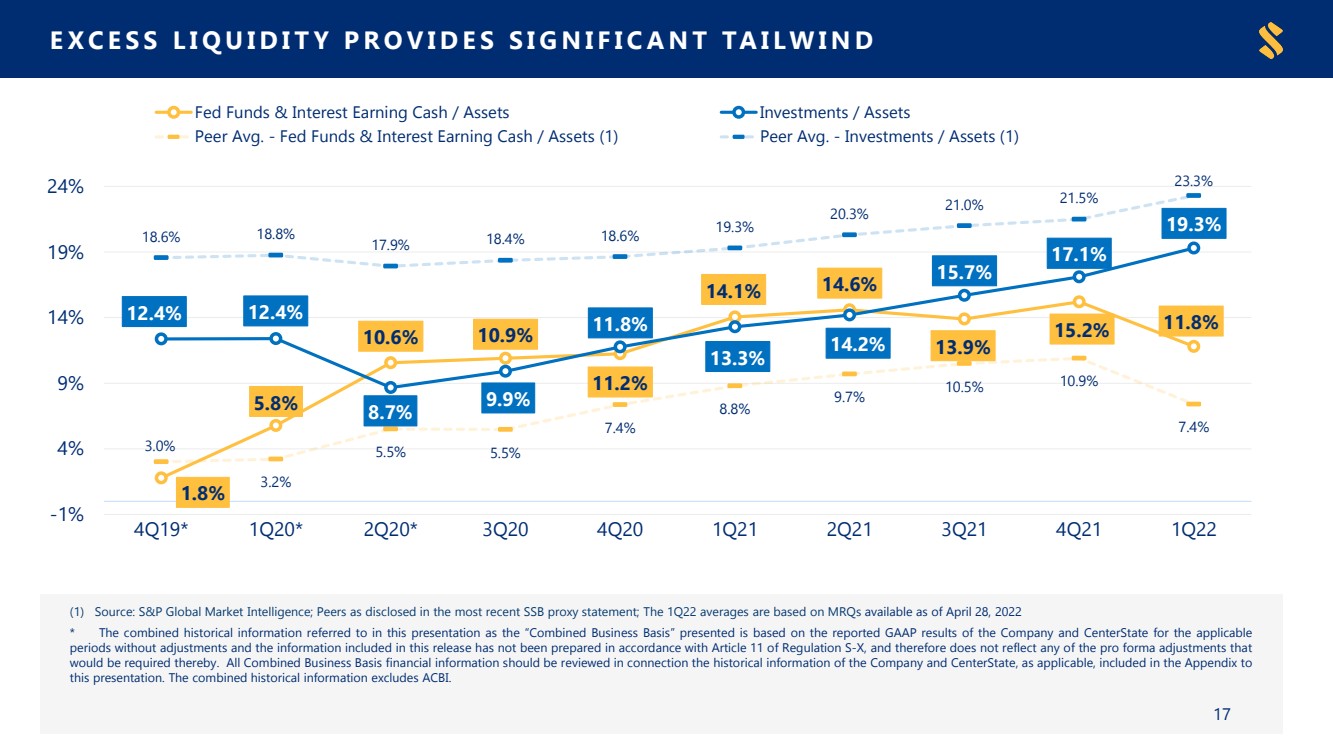
| EXCESS LIQUIDITY PROVIDES SIGNIFICANT TAILWIND (1)Source:S&PGlobalMarketIntelligence;PeersasdisclosedinthemostrecentSSBproxystatement;The1Q22averagesarebasedonMRQsavailableasofApril28,2022*Thecombinedhistoricalinformationreferredtointhispresentationasthe“CombinedBusinessBasis”presentedisbasedonthereportedGAAPresultsoftheCompanyandCenterStatefortheapplicableperiodswithoutadjustmentsandtheinformationincludedinthisreleasehasnotbeenpreparedinaccordancewithArticle11ofRegulationS-X,andthereforedoesnotreflectanyoftheproformaadjustmentsthatwouldberequiredthereby.AllCombinedBusinessBasisfinancialinformationshouldbereviewedinconnectionthehistoricalinformationoftheCompanyandCenterState,asapplicable,includedintheAppendixtothispresentation.ThecombinedhistoricalinformationexcludesACBI.17 1.8% 5.8% 10.6% 10.9% 11.2% 14.1% 14.6% 13.9% 15.2% 11.8% 12.4% 12.4% 8.7% 9.9% 11.8% 13.3% 14.2% 15.7% 17.1% 19.3%3.0%3.2%5.5%5.5%7.4%8.8%9.7%10.5%10.9%7.4%18.6%18.8%17.9%18.4%18.6%19.3%20.3%21.0%21.5%23.3%-1.0%3.0%7.0%11.0%15.0% 19.0%23.0%-1%4%9%14% 19% 24%4Q19*1Q20*2Q20*3Q204Q201Q212Q213Q214Q211Q22 Fed Funds & Interest Earning Cash / Assets Investments / Assets Peer Avg. - Fed Funds & Interest Earning Cash / Assets (1) Peer Avg. - Investments / Assets (1) |
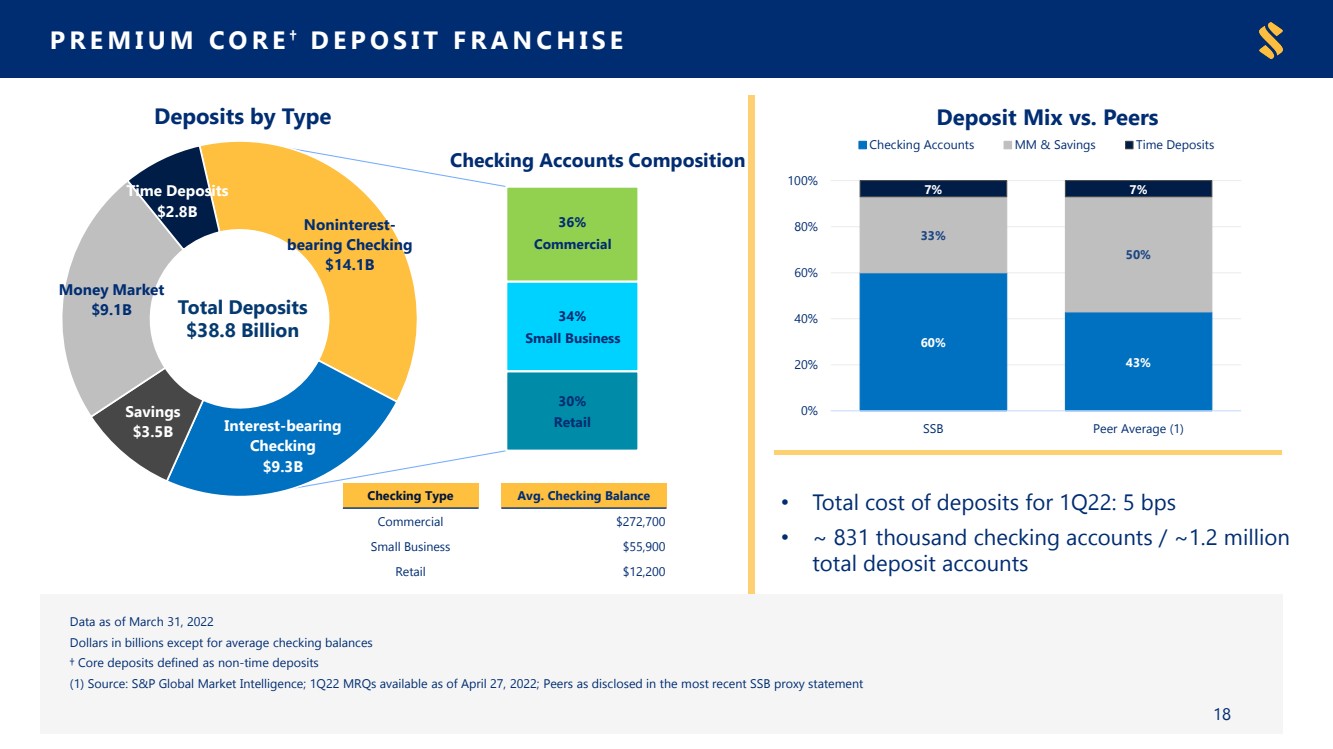
| 36%34%30%Checking Accounts CompositionCommercialSmall BusinessRetail Noninterest-bearing Checking$14.1BInterest-bearing Checking$9.3BSavings$3.5BMoney Market$9.1BTime Deposits$2.8B Data as of March 31, 2022Dollars in billions except for average checking balances† Core deposits defined as non-time deposits(1) Source: S&P Global Market Intelligence; 1Q22 MRQs available as of April 27, 2022; Peers as disclosed in the most recent SSB proxy statement 60%43%33%50%7%7%0%20%40% 60% 80%100%SSBPeer Average (1)Deposit Mix vs. Peers Checking Accounts MM & Savings Time DepositsPREMIUM CORE†DEPOSIT FRANCHISE18Total Deposits$38.8 BillionDeposits by Type•Total cost of deposits for 1Q22: 5 bps•~ 831 thousand checking accounts / ~1.2 million total deposit accounts Checking TypeAvg. Checking BalanceCommercial$272,700Small Business$55,900Retail$12,200 |
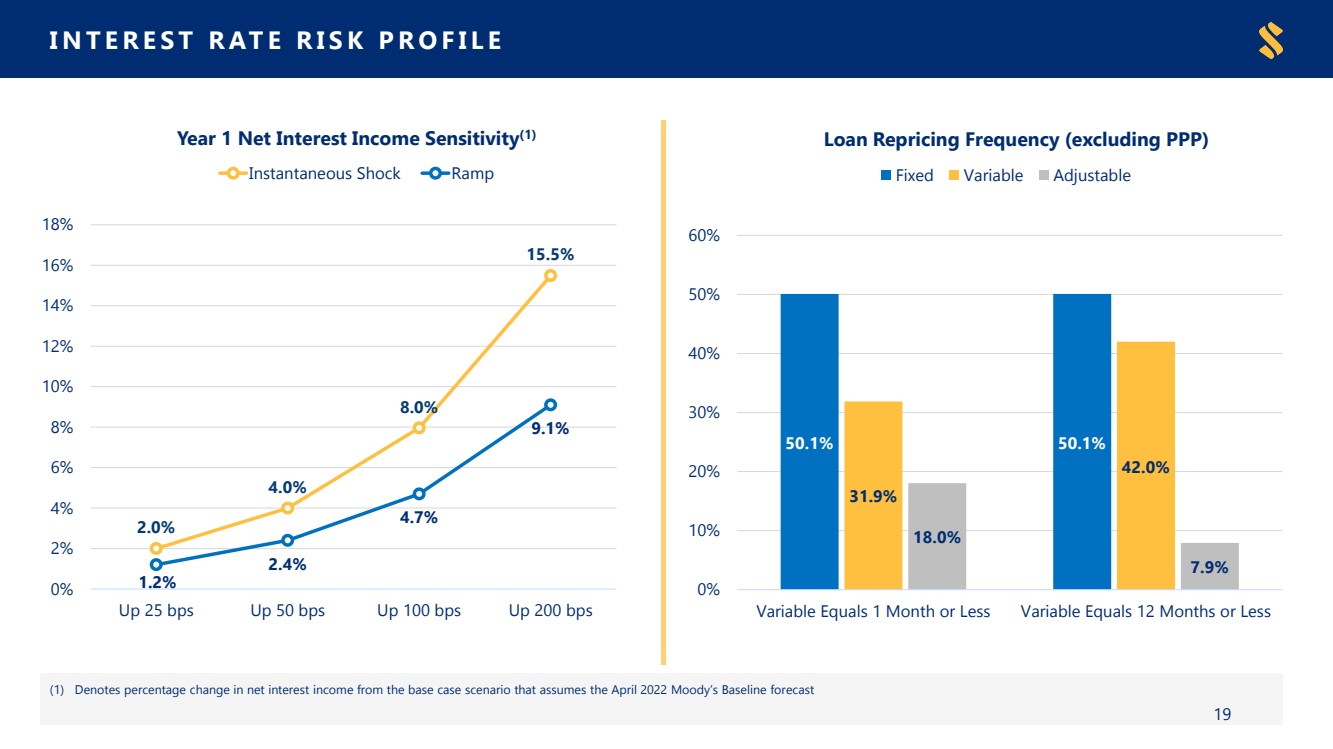
| INTEREST RATE RISK PROFILE 2.0%4.0%8.0%15.5%1.2%2.4%4.7%9.1%0%2%4%6%8%10% 12% 14% 16% 18%Up 25 bpsUp 50 bpsUp 100 bpsUp 200 bpsYear 1 Net Interest Income Sensitivity(1) Instantaneous Shock Ramp19 50.1%50.1%31.9%42.0%18.0%7.9%0%10%20%30%40%50% 60% Variable Equals 1 Month or Less Variable Equals 12 Months or LessLoan Repricing Frequency (excluding PPP) Fixed Variable Adjustable (1)Denotes percentage change in net interest income from the base case scenario that assumes the April 2022 Moody’s Baseline forecast19 |
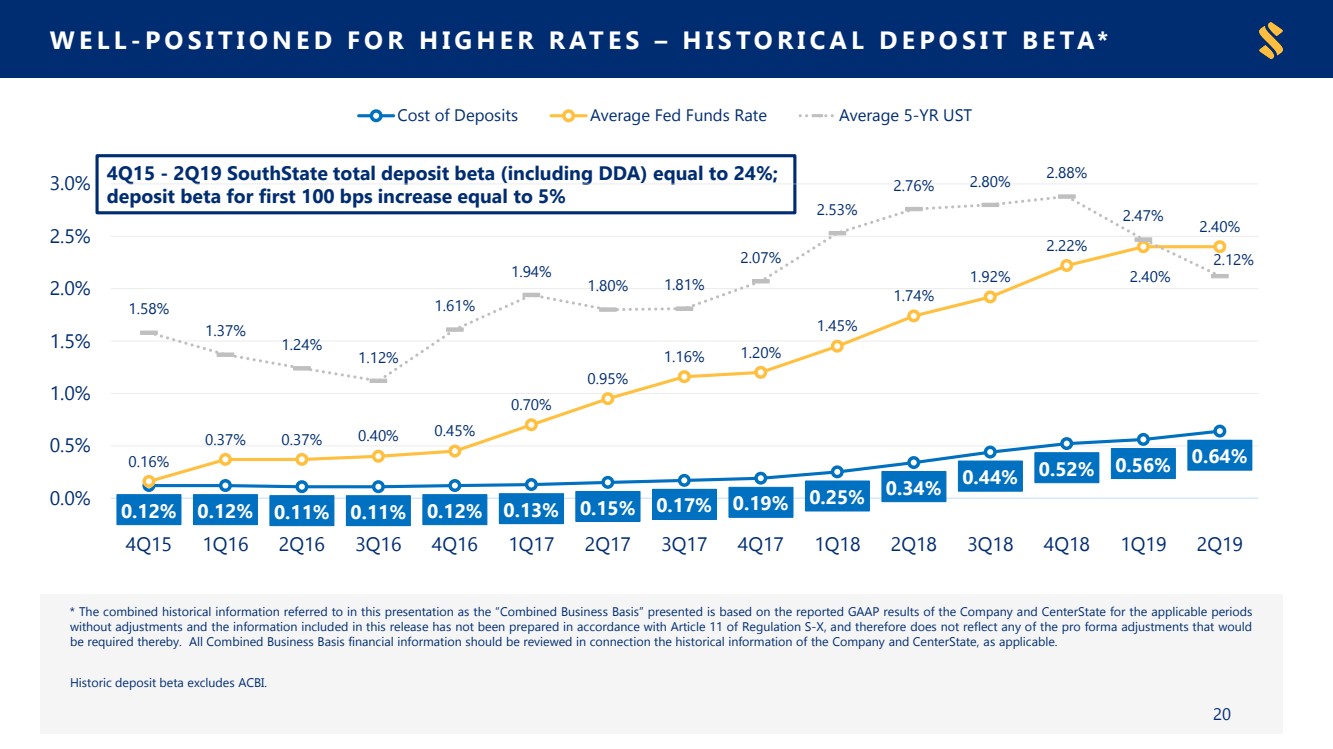
| 4Q15 -2Q19 SouthState total deposit beta (including DDA) equal to 24%; deposit beta for first 100 bps increase equal to 5%WELL-POSITIONED FOR HIGHER RATES –HISTORICAL DEPOSIT BETA* *Thecombinedhistoricalinformationreferredtointhispresentationasthe“CombinedBusinessBasis”presentedisbasedonthereportedGAAPresultsoftheCompanyandCenterStatefortheapplicableperiodswithoutadjustmentsandtheinformationincludedinthisreleasehasnotbeenpreparedinaccordancewithArticle11ofRegulationS-X,andthereforedoesnotreflectanyoftheproformaadjustmentsthatwouldberequiredthereby.AllCombinedBusinessBasisfinancialinformationshouldbereviewedinconnectionthehistoricalinformationoftheCompanyandCenterState,asapplicable.HistoricdepositbetaexcludesACBI.20 0.12% 0.12% 0.11% 0.11% 0.12% 0.13% 0.15% 0.17% 0.19% 0.25% 0.34% 0.44% 0.52% 0.56% 0.64%0.16%0.37%0.37%0.40%0.45%0.70%0.95%1.16%1.20%1.45%1.74%1.92%2.22%2.40%2.40%1.58%1.37%1.24%1.12%1.61%1.94%1.80%1.81%2.07%2.53%2.76%2.80%2.88%2.47%2.12%0.0%0.5% 1.0%1.5%2.0%2.5%3.0%4Q151Q162Q163Q164Q161Q172Q173Q174Q171Q182Q183Q184Q181Q192Q19 Cost of Deposits Average Fed Funds Rate Average 5-YR UST |
| Balance Sheet Strength |

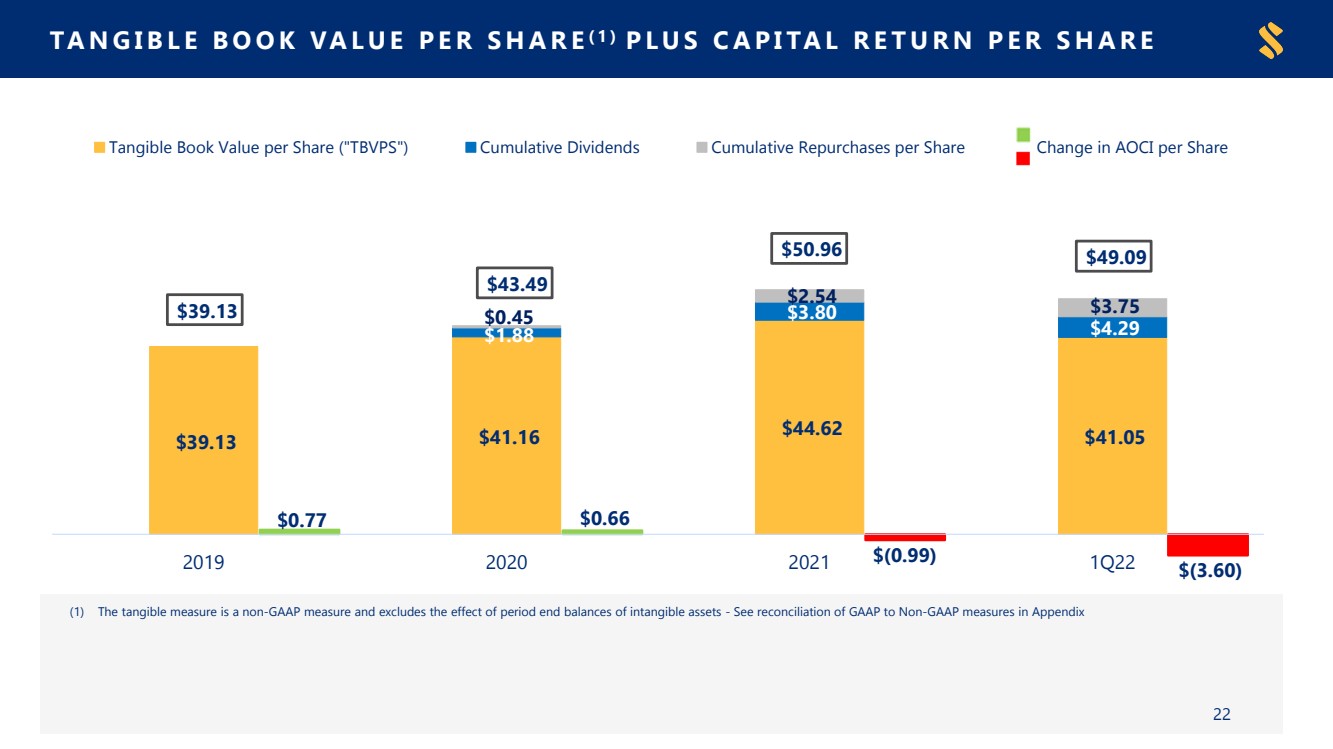
| $0.77 $0.66 $(0.99)$(3.60) $(9.00) $11.00 $31.00 $51.00 $39.13 $41.16 $44.62 $41.05 $1.88 $3.80 $4.29 $0.45 $2.54 $3.75 $39.13 $43.49 $50.96 $49.09 2019202020211Q22 Tangible Book Value per Share ("TBVPS") Cumulative Dividends Cumulative Repurchases per ShareChange in AOCI per Share (1)Thetangiblemeasureisanon-GAAPmeasureandexcludestheeffectofperiodendbalancesofintangibleassets-SeereconciliationofGAAPtoNon-GAAPmeasuresinAppendix22TANGIBLE BOOK VALUE PER SHARE(1) PLUS CAPITAL RETURN PER SHARE |
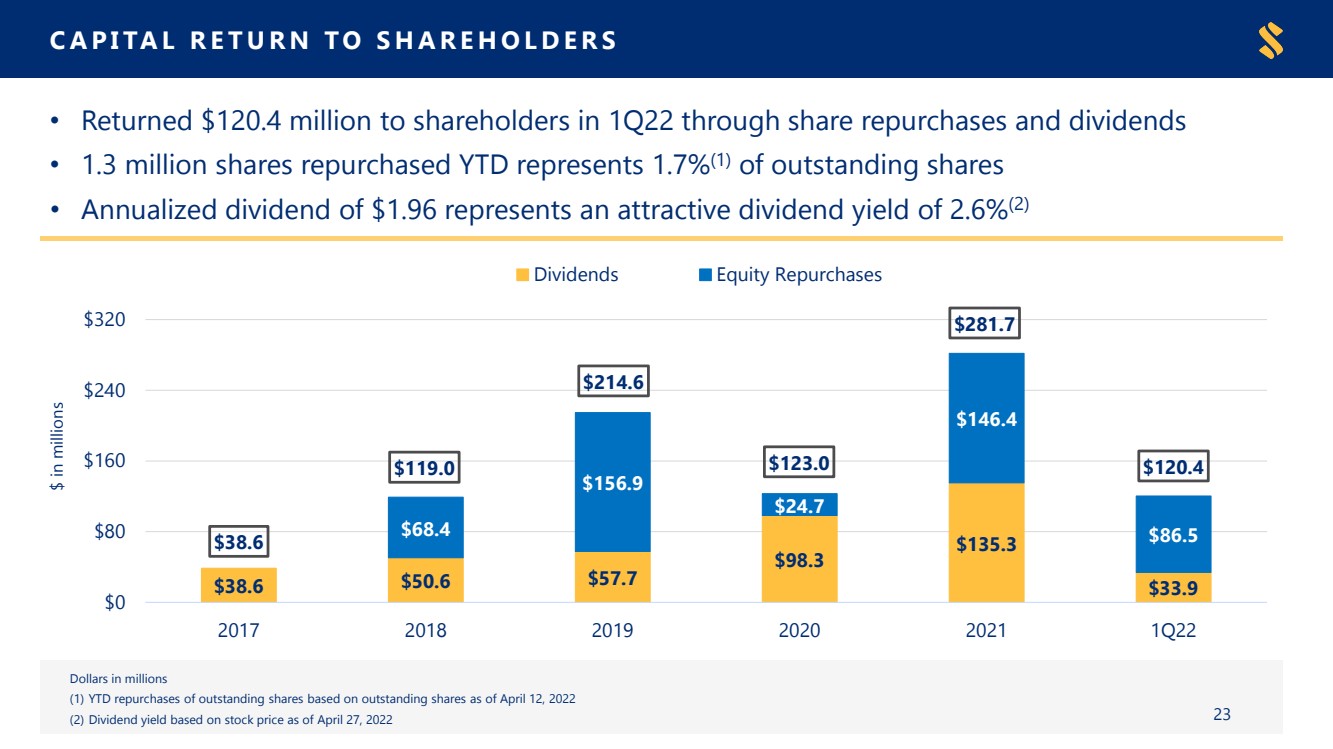
| CAPITAL RETURN TO SHAREHOLDERS $38.6$50.6$57.7$98.3$135.3$33.9$68.4$156.9$24.7$146.4$86.5 $38.6 $119.0 $214.6 $123.0 $281.7 $120.4 $0$80$160$240$320201720182019202020211Q22$ in millions Dividends Equity Repurchases23•Returned $120.4 million to shareholders in 1Q22 through share repurchases and dividends•1.3 million shares repurchased YTD represents 1.7%(1)of outstanding shares •Annualized dividend of $1.96 represents an attractive dividend yield of2.6%(2) Dollars in millions(1)YTD repurchases of outstanding shares based on outstanding shares as of April 12, 2022(2)Dividend yield based on stock price as of April 27, 202223 |
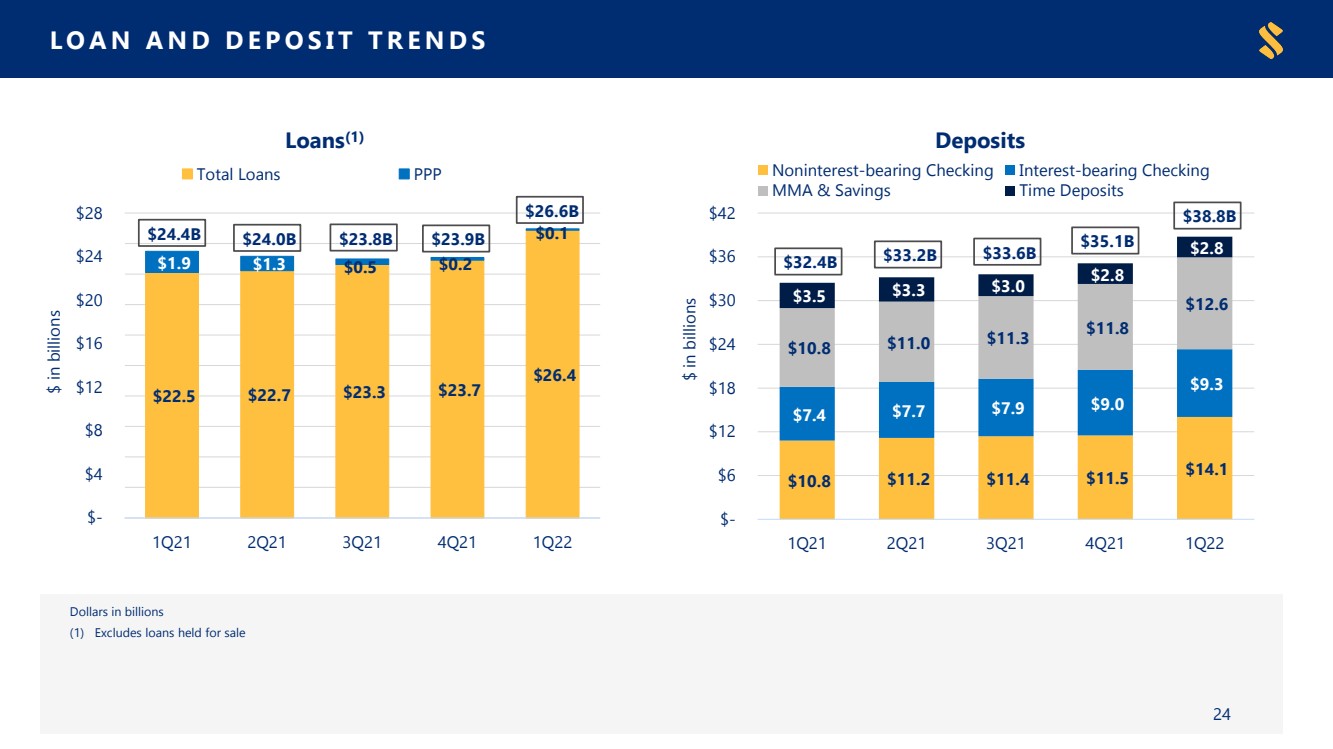
| LOAN AND DEPOSIT TRENDS $22.5 $22.7 $23.3 $23.7 $26.4 $1.9 $1.3 $0.5 $0.2 $0.1 $24.4B $24.0B $23.8B $23.9B $26.6B $22.0B $22.5B $23.0B $23.5B $24.0B $24.5B $25.0B $25.5B $26.0B $26.5B $27.0B $- $4 $8 $12 $16 $20 $24 $281Q212Q213Q214Q211Q22$ in billionsLoans(1) Total Loans PPP Dollarsinbillions(1)Excludesloansheldforsale24 $10.8 $11.2 $11.4 $11.5 $14.1 $7.4 $7.7 $7.9 $9.0 $9.3 $10.8 $11.0 $11.3 $11.8 $12.6 $3.5 $3.3 $3.0 $2.8 $2.8 $32.4B $33.2B $33.6B $35.1B $38.8B $- $50,000,000.0B $100,000,000.0B $150,000,000.0B $200,000,000.0B $250,000,000.0B $300,000,000.0B $350,000,000.0B $- $6 $12 $18 $24 $30 $36 $421Q212Q213Q214Q211Q22$ in billionsDeposits Noninterest-bearing Checking Interest-bearing Checking MMA & Savings Time Deposits |
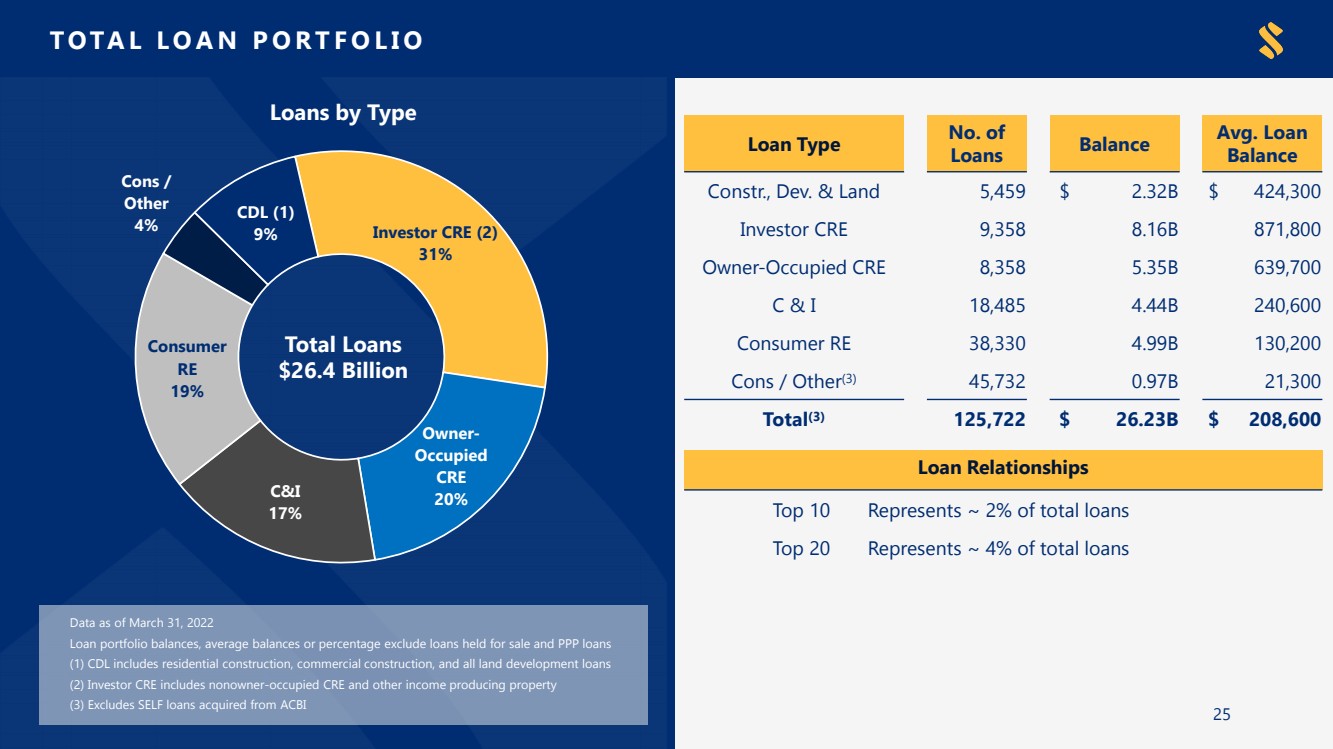
| Investor CRE (2)31%Owner-Occupied CRE20%C&I17%Consumer RE19%Cons / Other4%CDL (1)9%TOTAL LOAN PORTFOLIO25 Data as of March 31, 2022Loan portfolio balances, average balances or percentage exclude loans held for sale and PPP loans(1) CDL includes residential construction, commercial construction, and all land development loans (2) Investor CRE includes nonowner-occupied CRE and other income producing property(3) Excludes SELF loans acquired from ACBI Loan TypeNo. of LoansBalanceAvg. Loan BalanceConstr., Dev. & Land5,459$2.32B$424,300Investor CRE9,3588.16B871,800Owner-Occupied CRE8,3585.35B639,700C & I18,4854.44B240,600Consumer RE38,3304.99B130,200Cons / Other(3)45,7320.97B21,300Total(3)125,722$26.23B$208,600 Loan RelationshipsTop 10Represents ~ 2% of total loansTop 20Represents ~ 4% of total loansLoans by TypeTotal Loans$26.4 Billion |
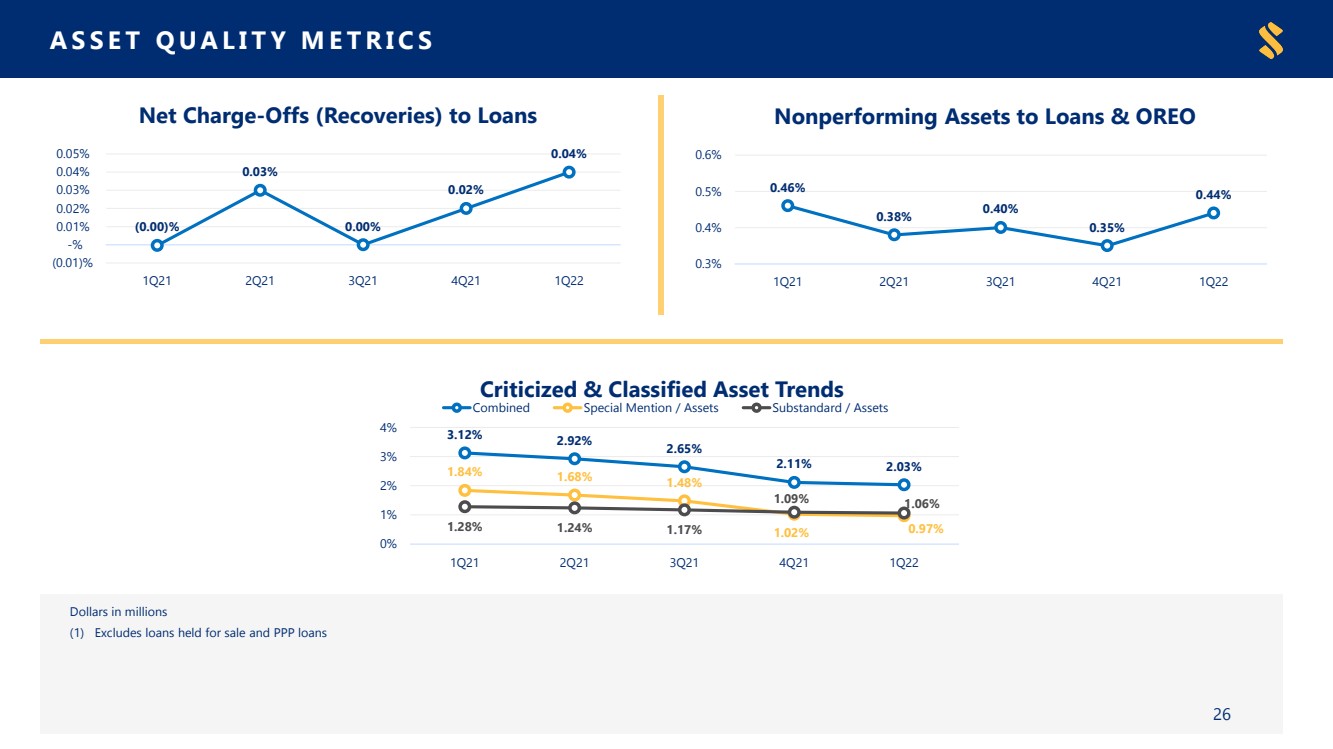
| ASSET QUALITY METRICS (0.00)%0.03%0.00%0.02%0.04% (0.01)% -% 0.01% 0.02% 0.03% 0.04% 0.05%1Q212Q213Q214Q211Q22Net Charge-Offs (Recoveries) to Loans Dollarsinmillions(1)ExcludesloansheldforsaleandPPPloans 3.12%2.92%2.65%2.11%2.03%1.84%1.68%1.48%1.02%0.97%1.28%1.24%1.17%1.09%1.06%0%1%2%3% 4%1Q212Q213Q214Q211Q22Criticized & Classified Asset Trends Combined Special Mention / Assets Substandard / Assets 0.46%0.38%0.40%0.35%0.44% 0.3% 0.4% 0.5% 0.6%1Q212Q213Q214Q211Q22Nonperforming Assets to Loans & OREO26 |
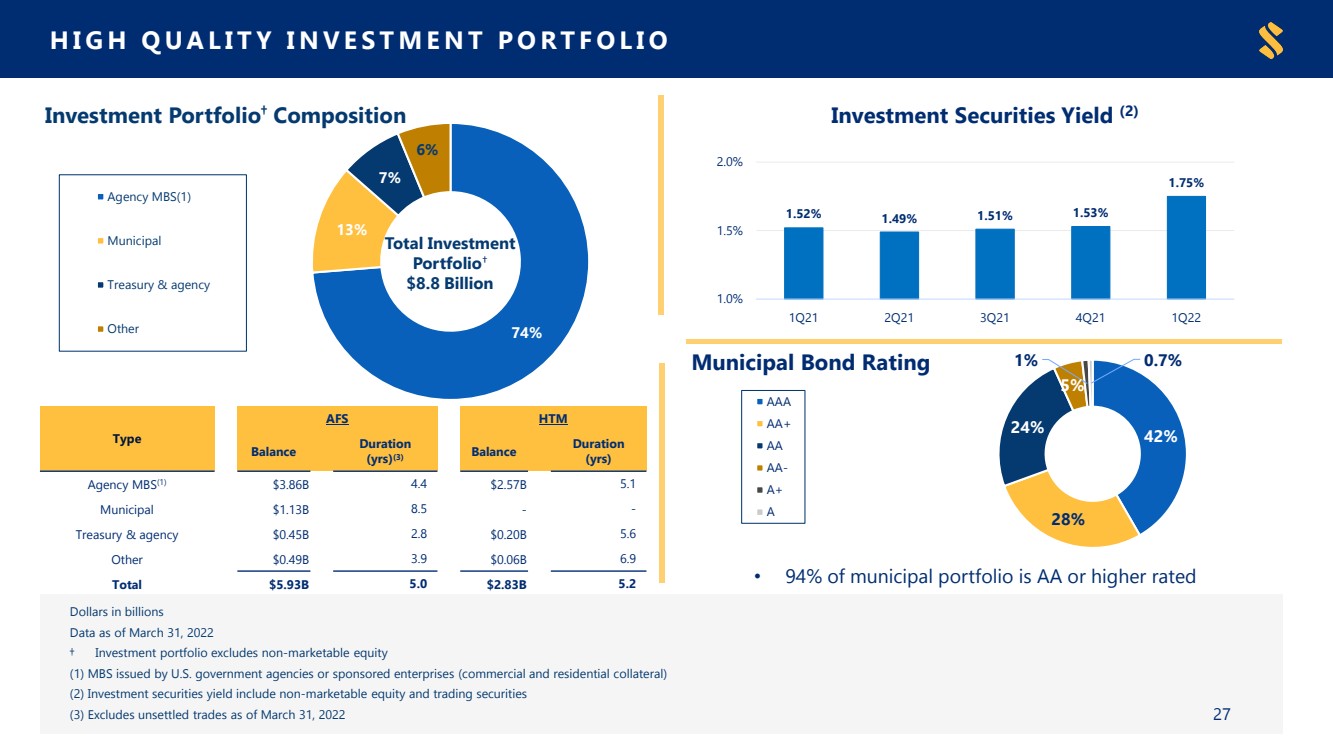
| Dollars in billionsData as of March 31, 2022† Investment portfolio excludes non-marketable equity(1)MBS issued by U.S. government agencies or sponsored enterprises (commercial and residential collateral)(2)Investment securities yield include non-marketable equity and trading securities(3)Excludes unsettled trades as of March 31, 2022 1.52%1.49%1.51%1.53%1.75% 1.0% 1.5% 2.0%1Q212Q213Q214Q211Q22Investment Securities Yield (2)HIGH QUALITY INVESTMENT PORTFOLIO 74%13%7%6%Investment Portfolio†Composition Agency MBS(1) Municipal Treasury & agency Other27Total InvestmentPortfolio†$8.8 Billion TypeAFS HTM BalanceDuration (yrs)(3)BalanceDuration (yrs)Agency MBS(1) $3.86B4.4$2.57B5.1Municipal$1.13B8.5--Treasury & agency$0.45B2.8$0.20B5.6Other $0.49B3.9$0.06B6.9Total$5.93B5.0$2.83B5.2 42%28%24%5%1%0.7%Municipal Bond Rating AAA AA+ AA AA- A+ A•94% of municipal portfolio is AA or higher rated |
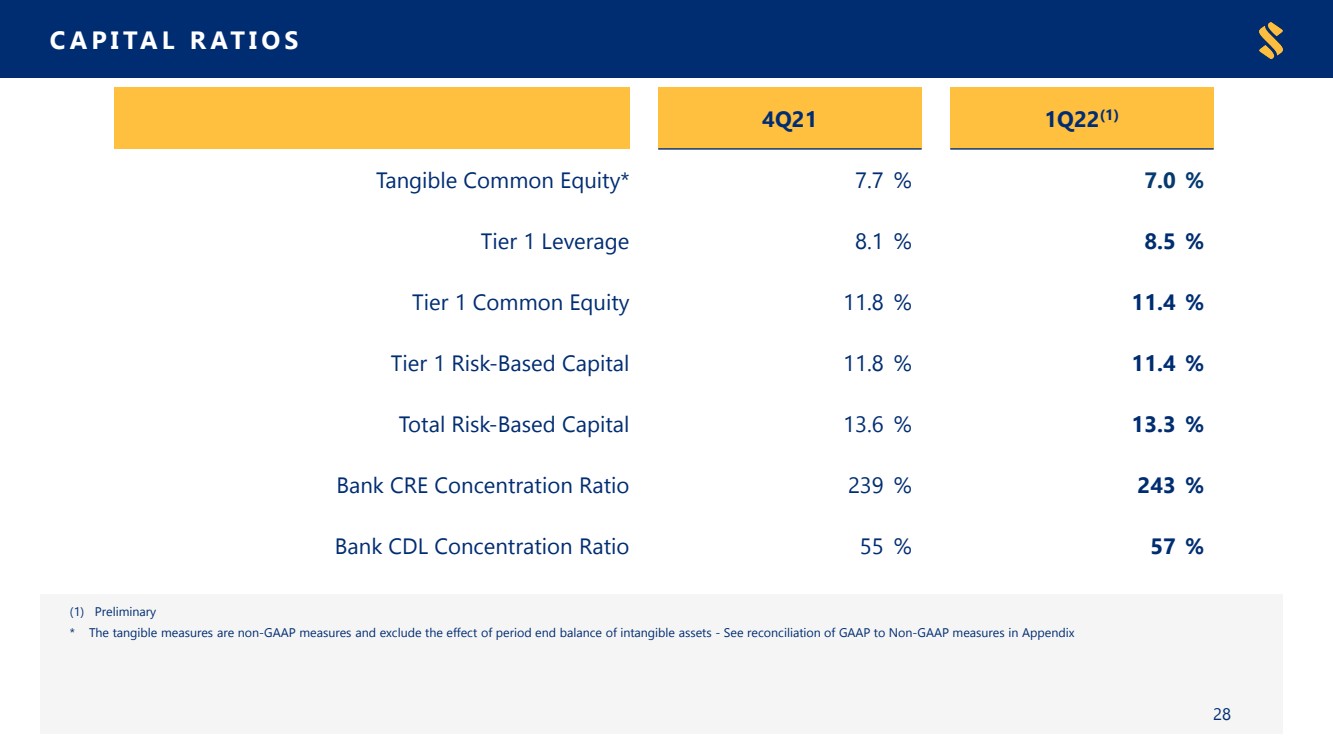
| CAPITAL RATIOS (1)Preliminary* The tangible measures are non-GAAP measures and exclude the effect of period end balance of intangible assets -See reconciliation of GAAP to Non-GAAP measures in Appendix28 4Q211Q22(1) Tangible Common Equity * 7.7 %7.0% Tier 1 Leverage 8.1 %8.5% Tier 1 Common Equity 11.8 %11.4% Tier 1 Risk- Based Capital 11.8 %11.4% Total Risk- Based Capital 13.6 %13.3% Bank CRE Concentration Ratio 239 %243% Bank CDL Concentration Ratio 55 %57% |
| Appendix |

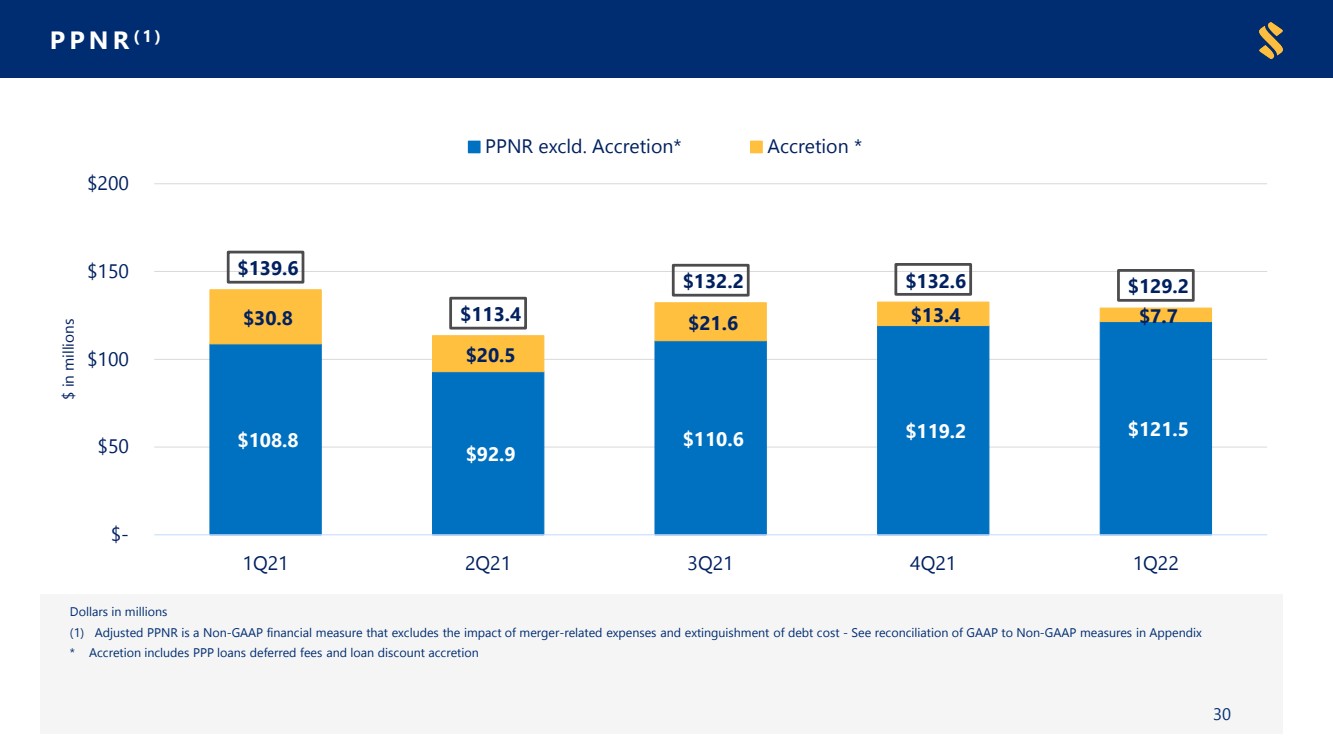
| Dollarsinmillions(1)AdjustedPPNRisaNon-GAAPfinancialmeasurethatexcludestheimpactofmerger-relatedexpensesandextinguishmentofdebtcost-SeereconciliationofGAAPtoNon-GAAPmeasuresinAppendix*AccretionincludesPPPloansdeferredfeesandloandiscountaccretionPPNR(1)30 $108.8 $92.9 $110.6 $119.2 $121.5 $30.8 $20.5 $21.6 $13.4 $7.7 $139.6 $113.4 $132.2 $132.6 $129.2 $- $50 $100 $150 $2001Q212Q213Q214Q211Q22$ in millions PPNR excld. Accretion* Accretion * |
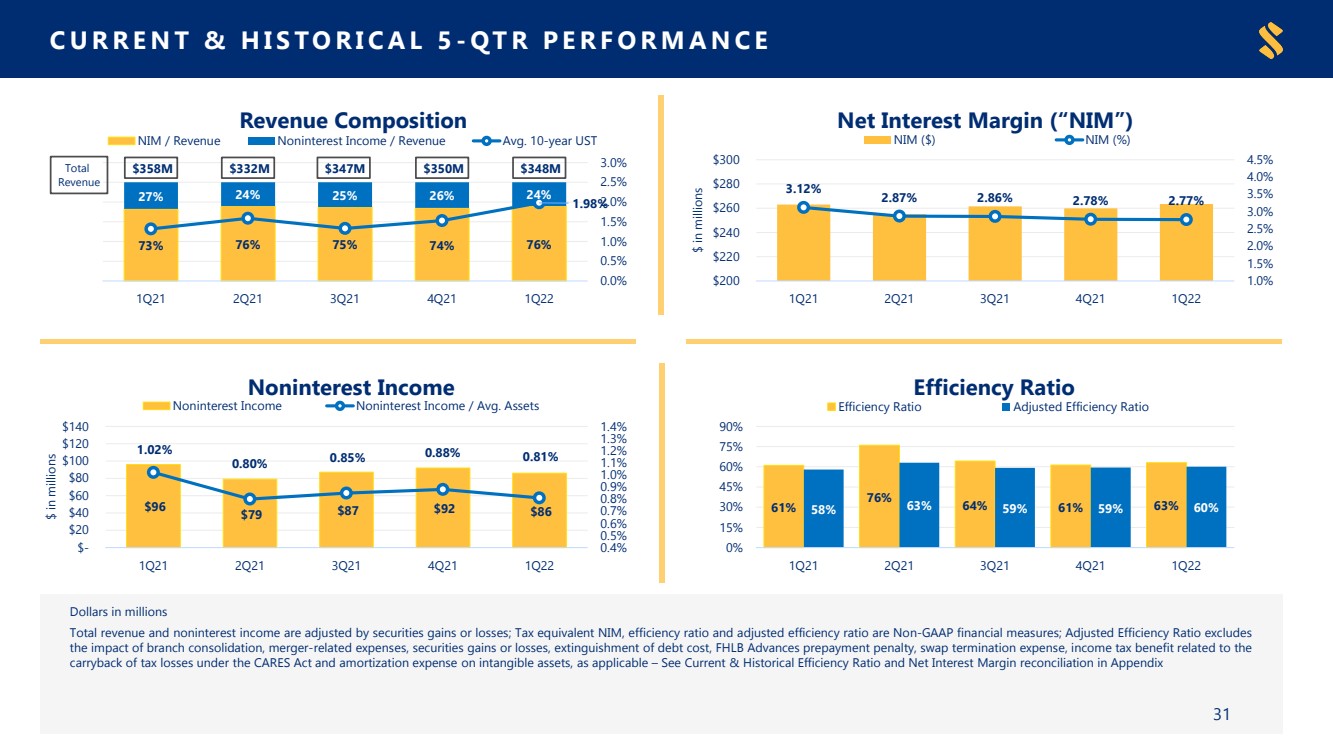
| CURRENT & HISTORICAL 5-QTR PERFORMANCE DollarsinmillionsTotalrevenueandnoninterestincomeareadjustedbysecuritiesgainsorlosses;TaxequivalentNIM,efficiencyratioandadjustedefficiencyratioareNon-GAAPfinancialmeasures;AdjustedEfficiencyRatioexcludestheimpactofbranchconsolidation,merger-relatedexpenses,securitiesgainsorlosses,extinguishmentofdebtcost,FHLBAdvancesprepaymentpenalty,swapterminationexpense,incometaxbenefitrelatedtothecarrybackoftaxlossesundertheCARESActandamortizationexpenseonintangibleassets,asapplicable–SeeCurrent&HistoricalEfficiencyRatioandNetInterestMarginreconciliationinAppendix31 3.12%2.87%2.86%2.78%2.77%1.0%1.5% 2.0% 2.5%3.0%3.5%4.0%4.5% $200 $220 $240 $260 $280 $3001Q212Q213Q214Q211Q22$ in millionsNet Interest Margin (“NIM”) NIM ($) NIM (%) 73%76%75%74%76%27%24%25%26%24% $358M $332M $347M $350M $348M 1.98%0.0%0.5% 1.0%1.5%2.0% 2.5%3.0% 0% 20% 40% 60% 80% 100% 120%1Q212Q213Q214Q211Q22Revenue Composition NIM / Revenue Noninterest Income / Revenue Avg. 10-year UST Total Revenue $96 $79 $87 $92 $86 1.02%0.80%0.85%0.88%0.81%0.4%0.5%0.6%0.7% 0.8%0.9%1.0%1.1%1.2% 1.3%1.4% $- $20 $40 $60 $80 $100 $120 $1401Q212Q213Q214Q211Q22$ in millionsNoninterest Income Noninterest Income Noninterest Income / Avg. Assets 61%76%64%61%63%58%63%59%59%60% 0% 15% 30% 45% 60% 75% 90%1Q212Q213Q214Q211Q22Efficiency Ratio Efficiency Ratio Adjusted Efficiency Ratio |
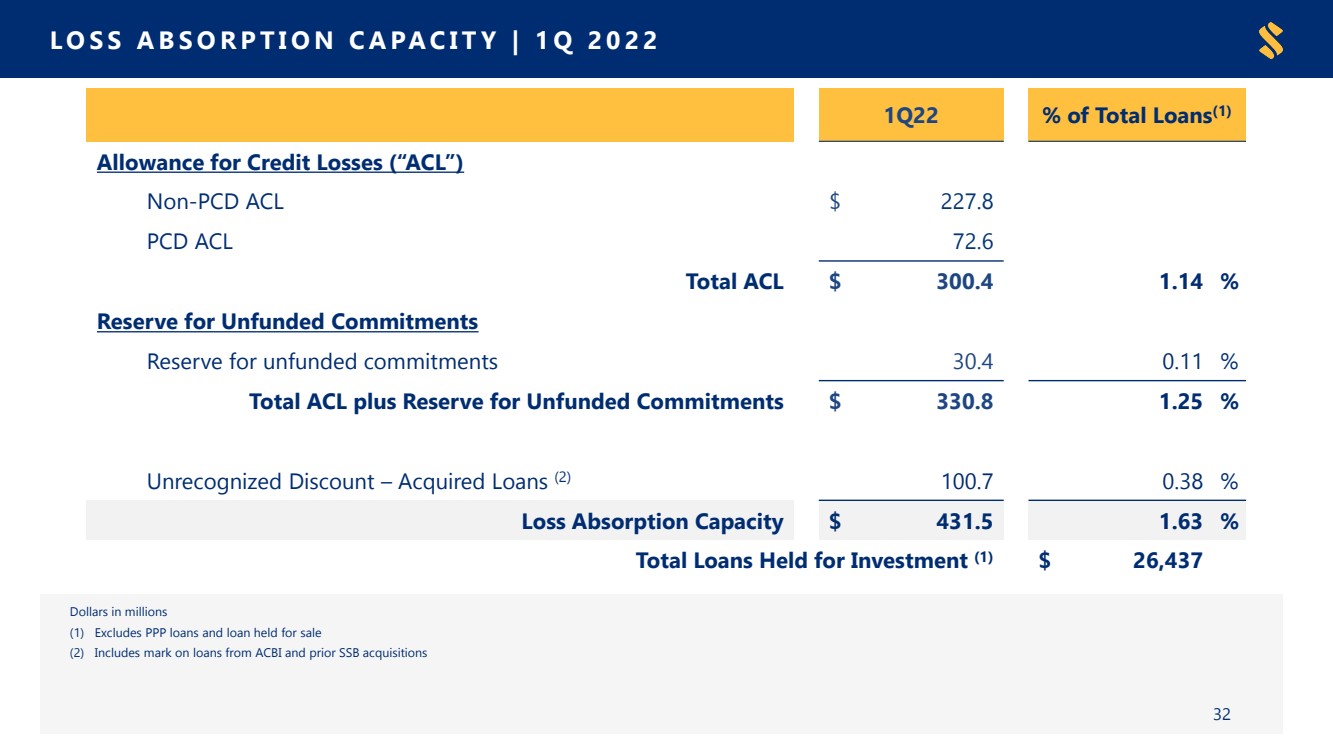
| LOSS ABSORPTION CAPACITY | 1Q 2022 Dollars in millions(1)Excludes PPP loans and loan held for sale(2)Includes mark on loans from ACBI and prior SSB acquisitions32 1Q22% of Total Loans(1)Allowance for Credit Losses (“ACL”) Non-PCD ACL$227.8PCD ACL72.6Total ACL$300.41.14%Reserve for Unfunded Commitments Reserve for unfunded commitments30.40.11%Total ACL plus Reserve for Unfunded Commitments$330.81.25%Unrecognized Discount –Acquired Loans (2)100.70.38%Loss Absorption Capacity$431.51.63%Total Loans Held for Investment (1)$26,437 |
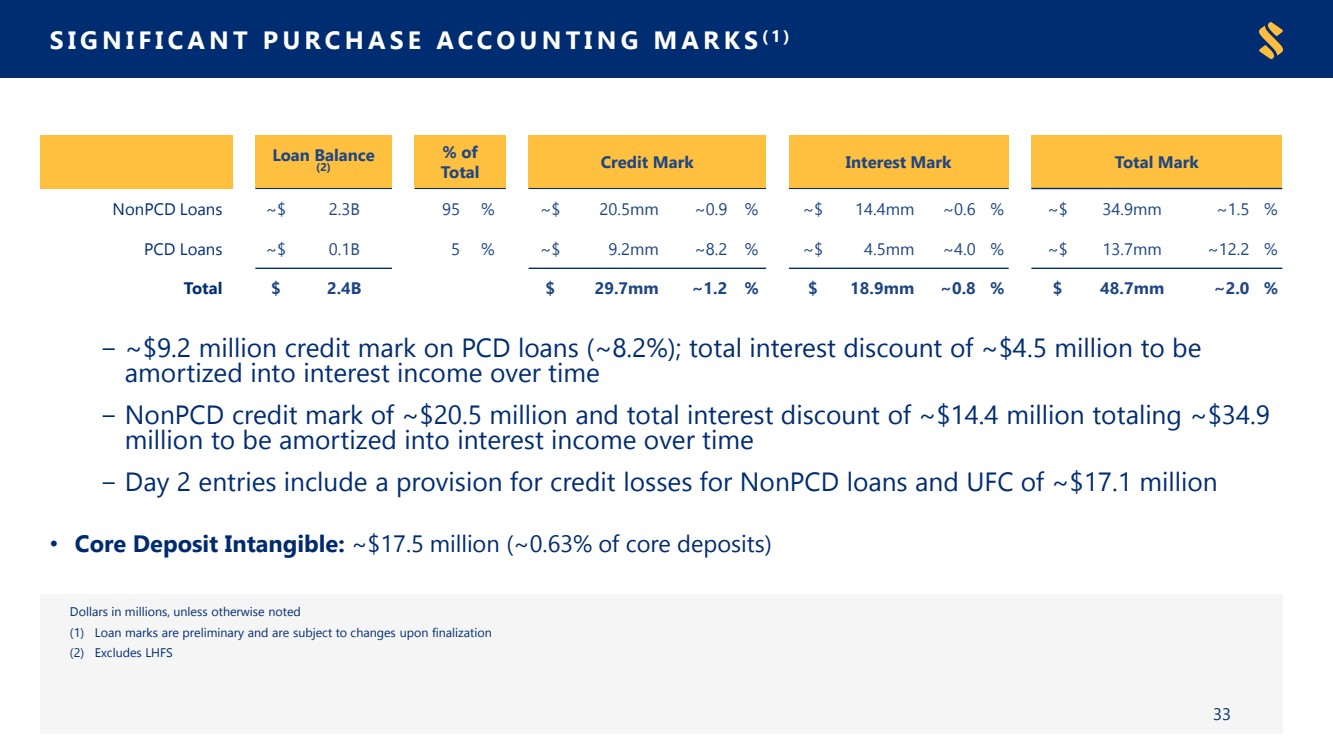
| SIGNIFICANT PURCHASE ACCOUNTING MARKS(1) Dollars in millions, unless otherwise noted(1)Loan marks are preliminary and are subject to changes upon finalization(2)Excludes LHFS33 Loan Balance (2)% of TotalCredit MarkInterest MarkTotal MarkNonPCD Loans~$2.3B95%~$20.5mm~0.9%~$14.4mm~0.6%~$34.9mm~1.5%PCD Loans~$0.1B5%~$9.2mm~8.2%~$4.5mm~4.0%~$13.7mm~12.2%Total$2.4B$29.7mm~1.2%$18.9mm~0.8%$48.7mm~2.0%−~$9.2 million credit mark on PCD loans (~8.2%); total interest discount of ~$4.5 million to be amortized into interest income over time−NonPCD credit mark of ~$20.5 million and total interest discount of ~$14.4 million totaling ~$34.9 million to be amortized into interest income over time−Day 2 entries include a provision for credit losses for NonPCD loans and UFC of ~$17.1 million•Core Deposit Intangible: ~$17.5 million (~0.63% of core deposits) |
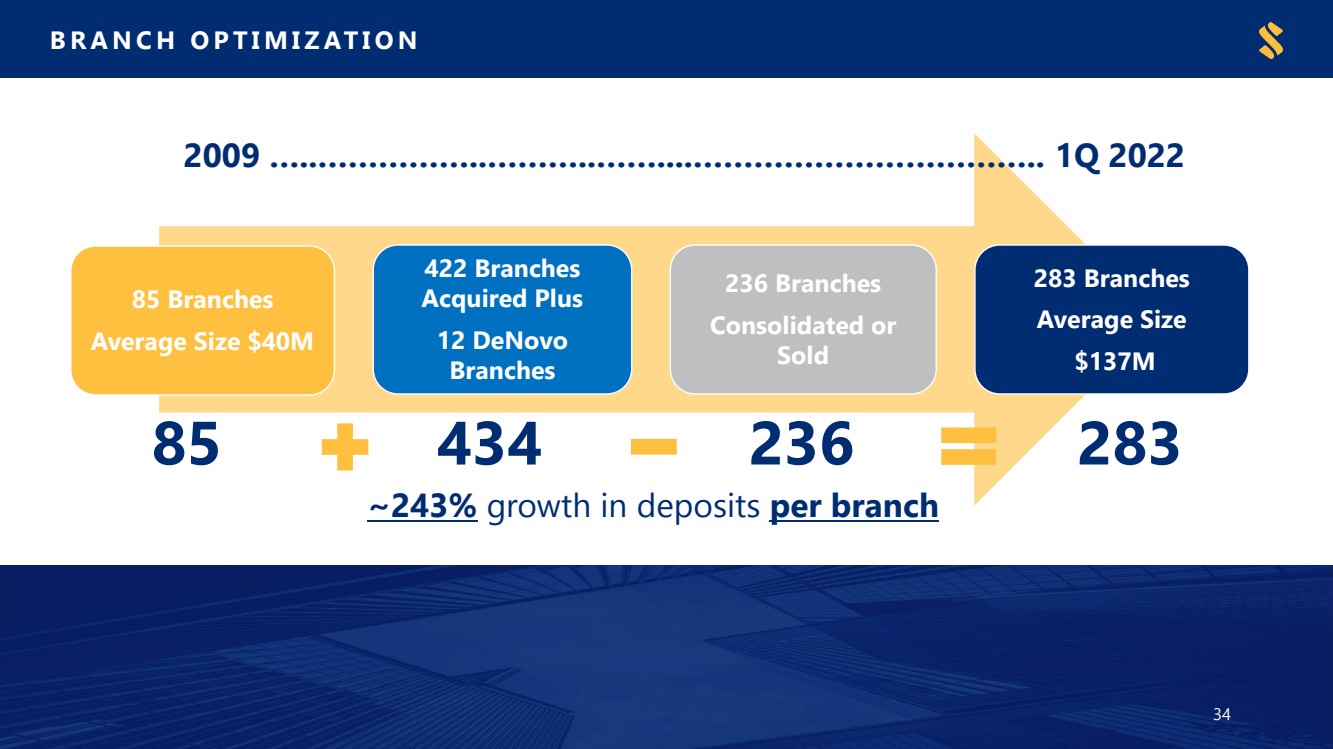
| BRANCH OPTIMIZATION 85 BranchesAverage Size $40M 422 Branches Acquired Plus12 DeNovo Branches 236 Branches Consolidated or Sold 283 BranchesAverage Size $137M ~ 243% growth in deposits per branch 854342362832009 …..……………..………..……....…………………………….. 1Q 202234 |
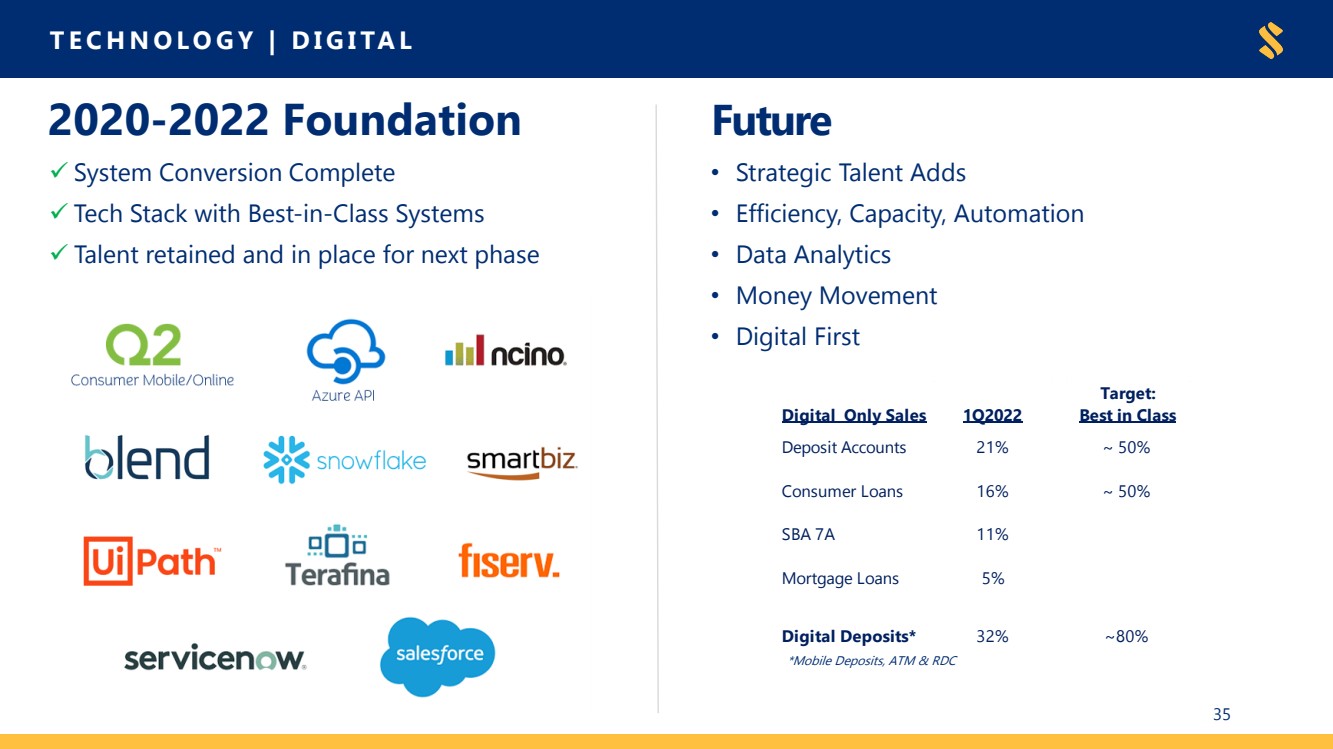
| TECHNOLOGY | DIGITAL352020-2022 Foundation System Conversion CompleteTech Stack with Best-in-Class SystemsTalent retained and in place for next phaseFuture•Strategic Talent Adds•Efficiency, Capacity, Automation•Data Analytics•Money Movement•Digital First *Mobile Deposits, ATM & RDC Target: Digital Only Sales Best in Class ~ 50% ~ 50% 1Q2022 Consumer Loans SBA 7A Mortgage Loans 21% Deposit Accounts 16% 11% 5% ~80% Digital Deposits* 32% |
| DollarsinthousandsThetangiblemeasuresarenon-GAAPmeasuresandexcludetheeffectofperiodendoraveragebalanceofintangibleassets;thetangiblereturnsonequityandcommonequitymeasuresalsoaddbacktheafter-taxamortizationofintangiblestoGAAPbasisnetincome.36NON-GAAP RECONCILIATIONS –RETURN ON AVG. TANGIBLE COMMON EQUITY & PPNR RETURN ON AVG. ASSETS Return on Average Tangible Equity4Q211Q22Net income (GAAP)106,846$ 100,329$ Plus:Amortization of intangibles8,517 8,494 Effective tax rate, excluding DTA write-off21% 21% Amortization of intangibles, net of tax6,735 6,688 Net income plus after-tax amortization of intangibles (non-GAAP)113,581$ 107,017$ Average shareholders' common equity, excluding preferred stock4,794,414$ 4,937,165$ Less:Average intangible assets1,713,8881,831,250Average tangible common equity3,080,526$ 3,105,915$ Return on Average Tangible Common Equity (Non-GAAP)14.6%14.0%PPNR Return on Average Assets 4Q211Q22PPNR, Adjusted (Non-GAAP)132,604$ 129,240$ Average assets 41,359,708 42,946,332 PPNR ROAA1.27%1.22% |

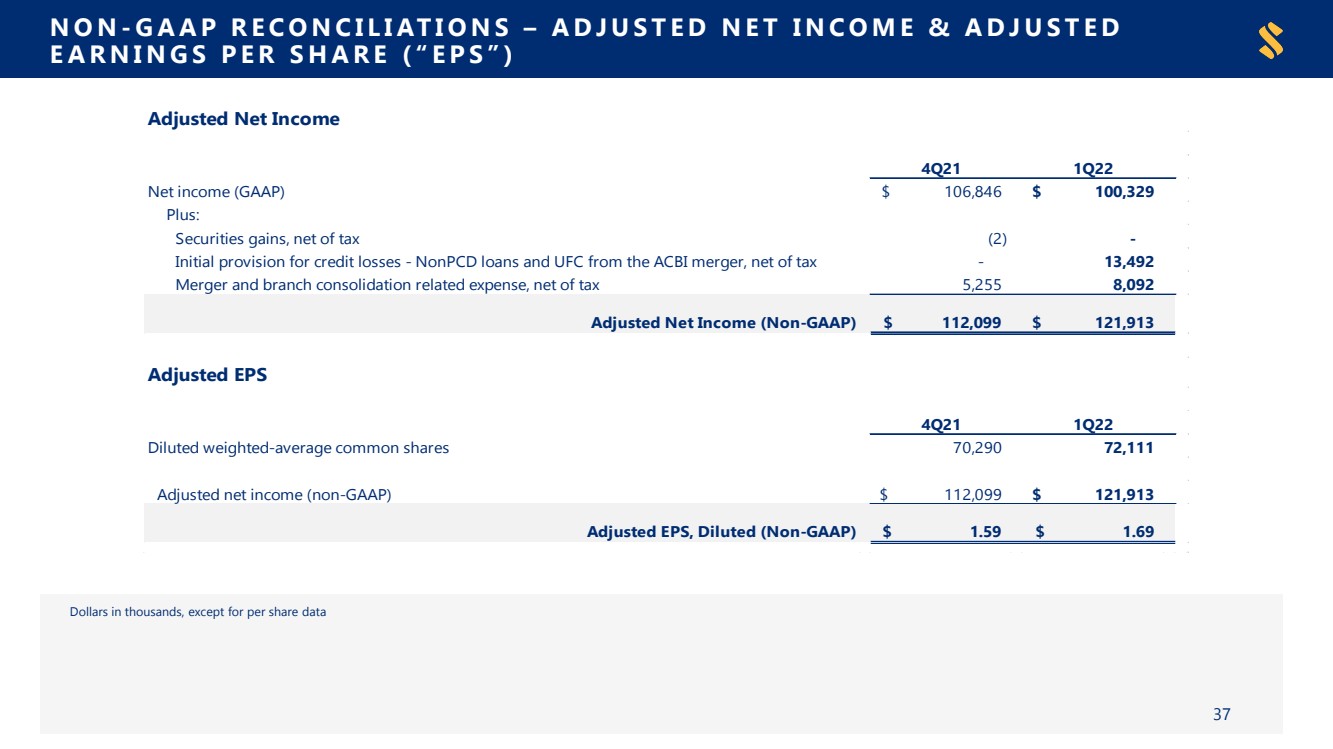
| NON-GAAP RECONCILIATIONS –ADJUSTED NET INCOME & ADJUSTED EARNINGS PER SHARE (“EPS”) Dollarsinthousands,exceptforpersharedata37 Adjusted Net Income4Q211Q22Net income (GAAP)106,846$ 100,329$ Plus:Securities gains, net of tax(2) - Initial provision for credit losses - NonPCD loans and UFC from the ACBI merger, net of tax- 13,492 Merger and branch consolidation related expense, net of tax5,255 8,092 Adjusted Net Income (Non-GAAP)112,099$ 121,913$ Adjusted EPS 4Q211Q22Diluted weighted-average common shares70,290 72,111 Adjusted net income (non-GAAP)112,099$ 121,913$ Adjusted EPS, Diluted (Non-GAAP)1.59$ 1.69$ |
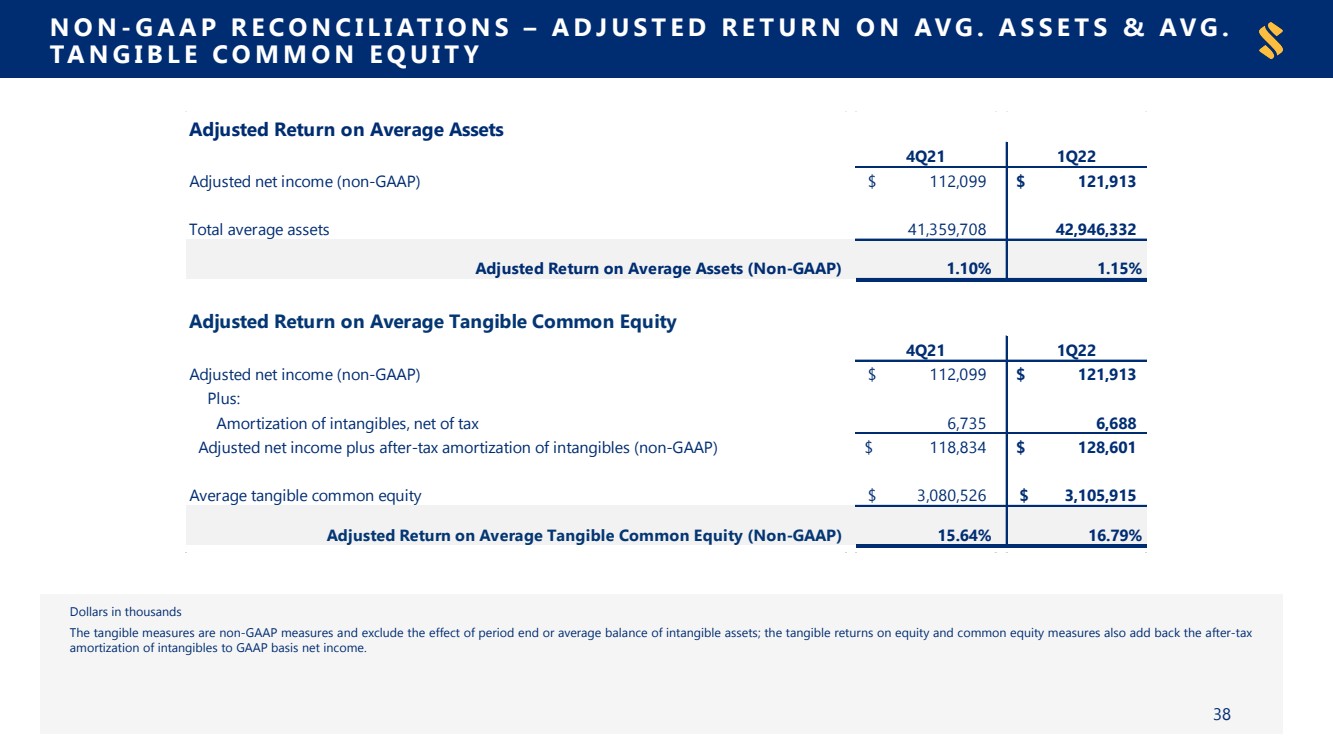
| NON-GAAP RECONCILIATIONS –ADJUSTED RETURN ON AVG. ASSETS & AVG. TANGIBLE COMMON EQUITY DollarsinthousandsThetangiblemeasuresarenon-GAAPmeasuresandexcludetheeffectofperiodendoraveragebalanceofintangibleassets;thetangiblereturnsonequityandcommonequitymeasuresalsoaddbacktheafter-taxamortizationofintangiblestoGAAPbasisnetincome.Dollars in thousands, except for per share data38 Adjusted Return on Average Assets4Q211Q22Adjusted net income (non-GAAP)112,099$ 121,913$ Total average assets41,359,708 42,946,332 Adjusted Return on Average Assets (Non-GAAP)1.10%1.15%Adjusted Return on Average Tangible Common Equity4Q211Q22Adjusted net income (non-GAAP)112,099$ 121,913$ Plus:Amortization of intangibles, net of tax6,735 6,688 Adjusted net income plus after-tax amortization of intangibles (non-GAAP)118,834$ 128,601$ Average tangible common equity3,080,526$ 3,105,915$ Adjusted Return on Average Tangible Common Equity (Non-GAAP)15.64%16.79% |
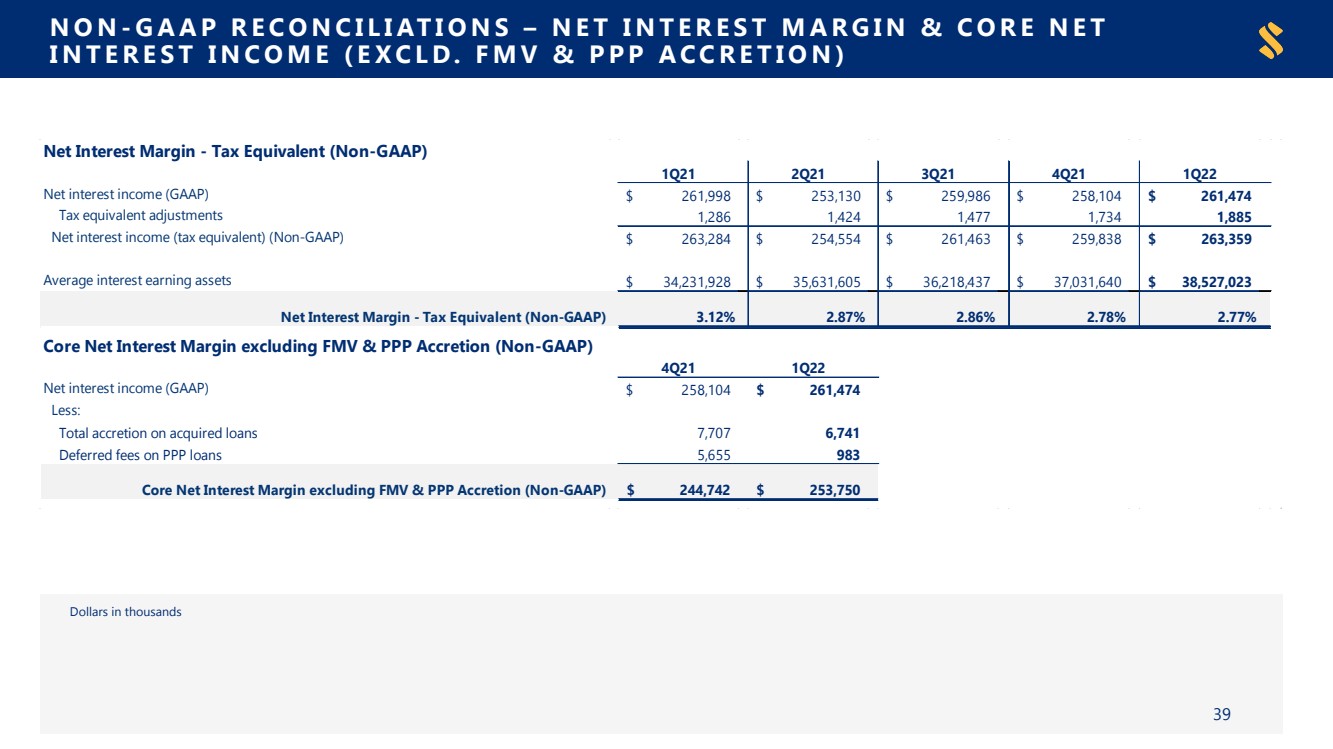
| NON-GAAP RECONCILIATIONS –NET INTEREST MARGIN & CORE NET INTEREST INCOME (EXCLD. FMV & PPP ACCRETION) DollarsinthousandsDollars in thousands, except for per share data39 Net Interest Margin - Tax Equivalent (Non-GAAP)1Q212Q213Q214Q211Q22Net interest income (GAAP)261,998$ 253,130$ 259,986$ 258,104$ 261,474$ Tax equivalent adjustments1,286 1,424 1,477 1,734 1,885 Net interest income (tax equivalent) (Non-GAAP)263,284$ 254,554$ 261,463$ 259,838$ 263,359$ Average interest earning assets34,231,928$ 35,631,605$ 36,218,437$ 37,031,640$ 38,527,023$ Net Interest Margin - Tax Equivalent (Non-GAAP)3.12%2.87%2.86%2.78%2.77%Core Net Interest Margin excluding FMV & PPP Accretion (Non-GAAP)4Q211Q22Net interest income (GAAP)258,104$ 261,474$ Less: Total accretion on acquired loans7,707 6,741 Deferred fees on PPP loans5,655 983 Core Net Interest Margin excluding FMV & PPP Accretion (Non-GAAP)244,742$ 253,750$ |
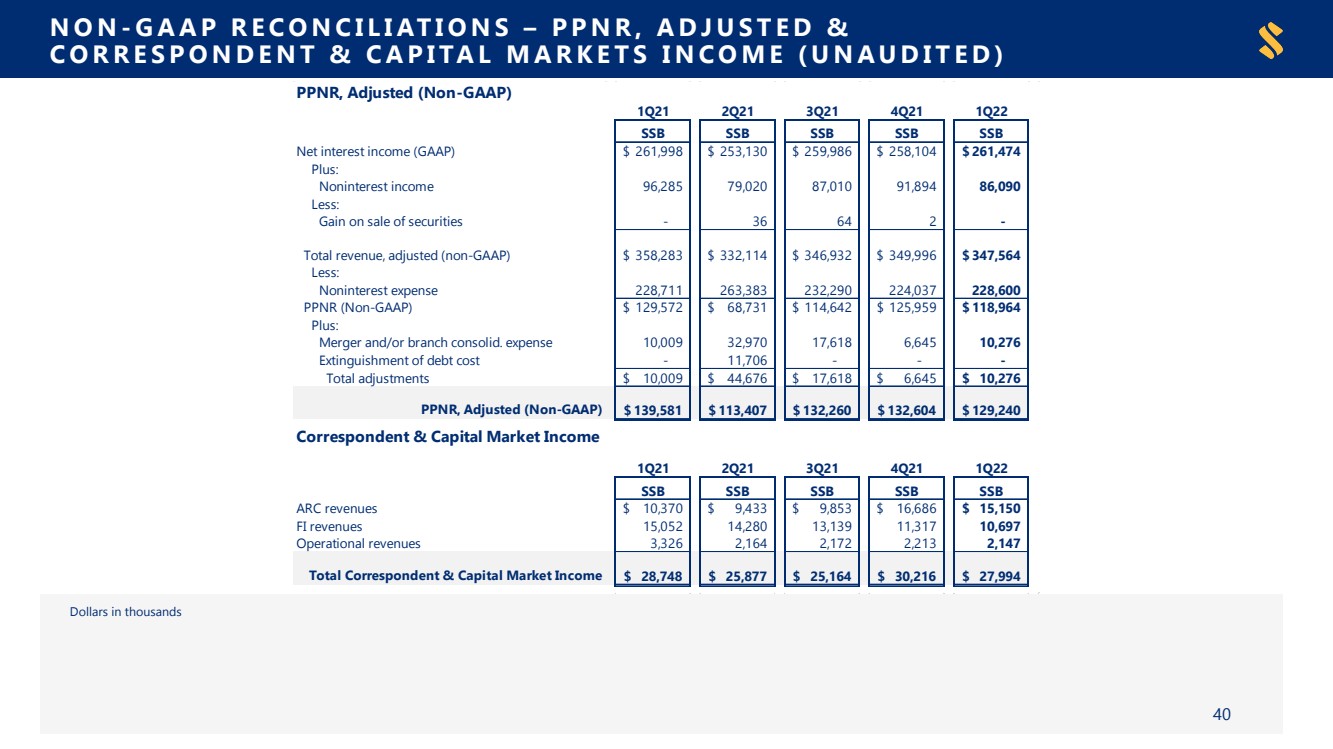
| NON-GAAP RECONCILIATIONS –PPNR, ADJUSTED & CORRESPONDENT & CAPITAL MARKETS INCOME (UNAUDITED) Dollarsinthousands40 PPNR, Adjusted (Non-GAAP) 1Q212Q213Q214Q211Q22 SSBSSBSSBSSBSSB Net interest income (GAAP)261,998$ 253,130$ 259,986$ 258,104$ 261,474$ Plus: Noninterest income 96,285 79,020 87,010 91,894 86,090 Less: Gain on sale of securities- 36 64 2 - Total revenue, adjusted (non-GAAP)358,283$ 332,114$ 346,932$ 349,996$ 347,564$ Less: Noninterest expense228,711 263,383 232,290 224,037 228,600 PPNR (Non-GAAP)129,572$ 68,731$ 114,642$ 125,959$ 118,964$ Plus: Merger and/or branch consolid. expense10,009 32,970 17,618 6,645 10,276 Extinguishment of debt cost- 11,706 - - - Total adjustments10,009$ 44,676$ 17,618$ 6,645$ 10,276$ PPNR, Adjusted (Non-GAAP)139,581$ 113,407$ 132,260$ 132,604$ 129,240$ 1Q212Q213Q214Q211Q22SSBSSBSSBSSBSSB ARC revenues10,370$ 9,433$ 9,853$ 16,686$ 15,150$ FI revenues15,052 14,280 13,139 11,317 10,697 Operational revenues3,326 2,164 2,172 2,213 2,147 Total Correspondent & Capital Market Income28,748$ 25,877$ 25,164$ 30,216$ 27,994$ Correspondent & Capital Market Income |
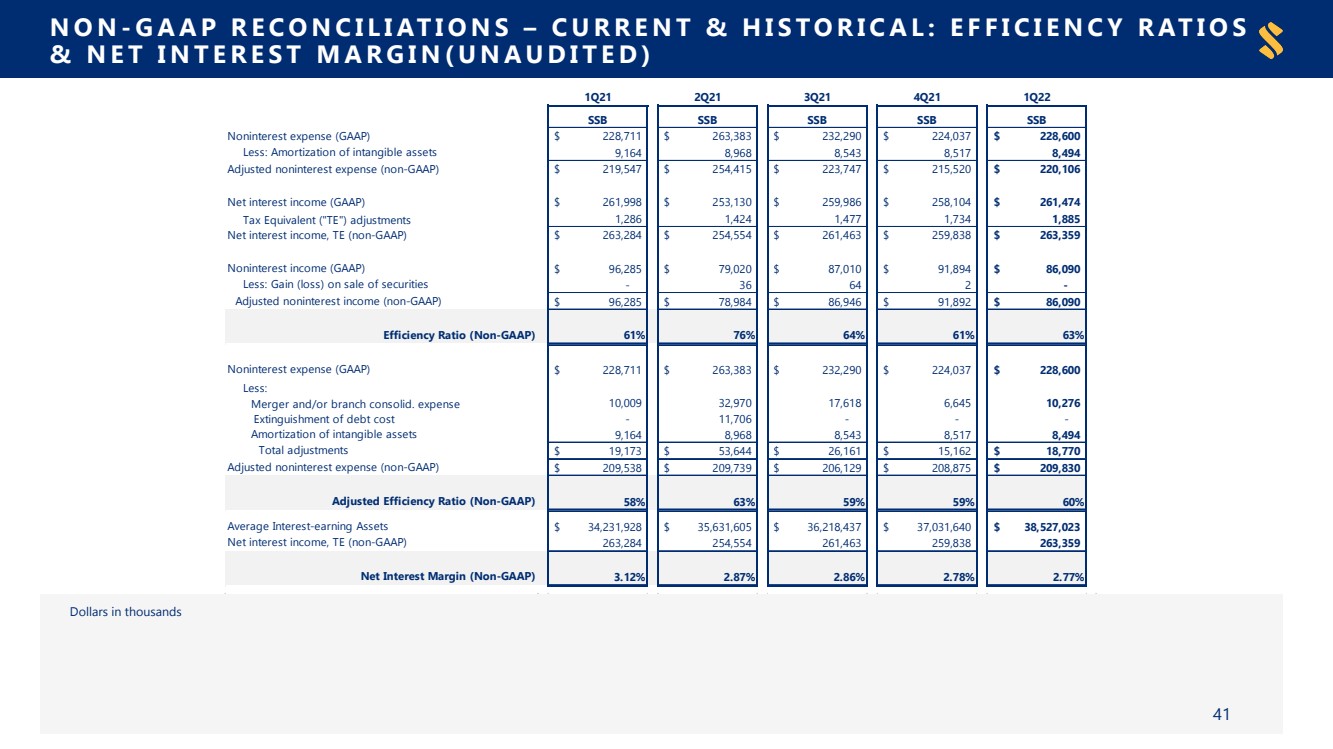
| NON-GAAP RECONCILIATIONS –CURRENT & HISTORICAL: EFFICIENCY RATIOS & NET INTEREST MARGIN(UNAUDITED) Dollarsinthousands41 1Q212Q213Q214Q211Q22 SSBSSBSSBSSBSSB Noninterest expense (GAAP)228,711$ 263,383$ 232,290$ 224,037$ 228,600$ Less: Amortization of intangible assets9,164 8,968 8,543 8,517 8,494 Adjusted noninterest expense (non-GAAP)219,547$ 254,415$ 223,747$ 215,520$ 220,106$ Net interest income (GAAP)261,998$ 253,130$ 259,986$ 258,104$ 261,474$ Tax Equivalent ("TE") adjustments1,286 1,424 1,477 1,734 1,885 Net interest income, TE (non-GAAP)263,284$ 254,554$ 261,463$ 259,838$ 263,359$ Noninterest income (GAAP)96,285$ 79,020$ 87,010$ 91,894$ 86,090$ Less: Gain (loss) on sale of securities- 36 64 2 - Adjusted noninterest income (non-GAAP)96,285$ 78,984$ 86,946$ 91,892$ 86,090$ Efficiency Ratio (Non-GAAP)61%76%64%61%63% Noninterest expense (GAAP)228,711$ 263,383$ 232,290$ 224,037$ 228,600$ Less: Merger and/or branch consolid. expense10,009 32,970 17,618 6,645 10,276 Extinguishment of debt cost- 11,706 - - - Amortization of intangible assets9,164 8,968 8,543 8,517 8,494 Total adjustments19,173$ 53,644$ 26,161$ 15,162$ 18,770$ Adjusted noninterest expense (non-GAAP)209,538$ 209,739$ 206,129$ 208,875$ 209,830$ Adjusted Efficiency Ratio (Non-GAAP)58%63%59%59%60% Average Interest-earning Assets34,231,928$ 35,631,605$ 36,218,437$ 37,031,640$ 38,527,023$ Net interest income, TE (non-GAAP)263,284 254,554 261,463 259,838 263,359 Net Interest Margin (Non-GAAP)3.12%2.87%2.86%2.78%2.77% |
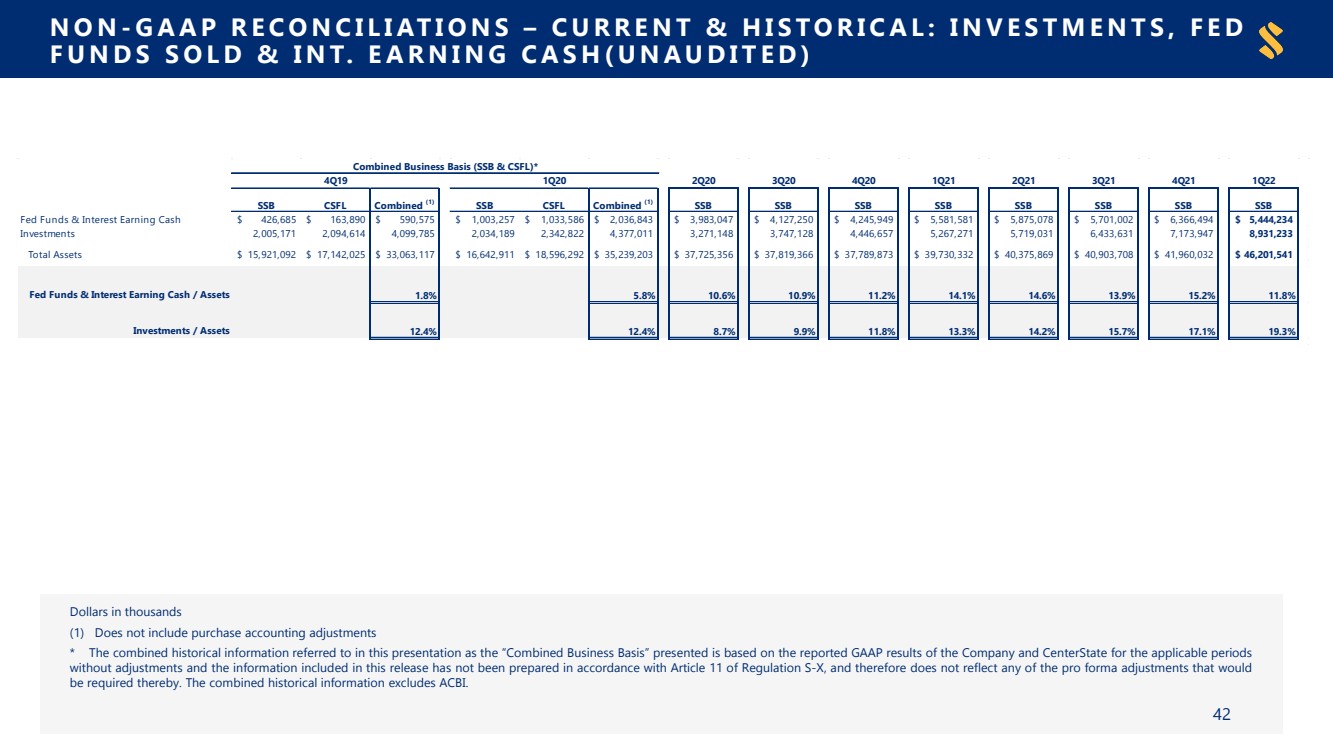
| NON-GAAP RECONCILIATIONS –CURRENT & HISTORICAL: INVESTMENTS, FED FUNDS SOLD & INT. EARNING CASH(UNAUDITED) Dollarsinthousands(1)Doesnotincludepurchaseaccountingadjustments*Thecombinedhistoricalinformationreferredtointhispresentationasthe“CombinedBusinessBasis”presentedisbasedonthereportedGAAPresultsoftheCompanyandCenterStatefortheapplicableperiodswithoutadjustmentsandtheinformationincludedinthisreleasehasnotbeenpreparedinaccordancewithArticle11ofRegulationS-X,andthereforedoesnotreflectanyoftheproformaadjustmentsthatwouldberequiredthereby.ThecombinedhistoricalinformationexcludesACBI.42 2Q203Q204Q201Q212Q213Q214Q211Q22 SSBCSFL Combined (1)SSBCSFL Combined (1)SSBSSBSSBSSBSSBSSBSSBSSB Fed Funds & Interest Earning Cash426,685$ 163,890$ 590,575$ 1,003,257$ 1,033,586$ 2,036,843$ 3,983,047$ 4,127,250$ 4,245,949$ 5,581,581$ 5,875,078$ 5,701,002$ 6,366,494$ 5,444,234$ Investments2,005,171 2,094,614 4,099,785 2,034,189 2,342,822 4,377,011 3,271,148 3,747,128 4,446,657 5,267,271 5,719,031 6,433,631 7,173,947 8,931,233 Total Assets15,921,092$ 17,142,025$ 33,063,117$ 16,642,911$ 18,596,292$ 35,239,203$ 37,725,356$ 37,819,366$ 37,789,873$ 39,730,332$ 40,375,869$ 40,903,708$ 41,960,032$ 46,201,541$ Fed Funds & Interest Earning Cash / Assets1.8%5.8%10.6%10.9%11.2%14.1%14.6%13.9%15.2%11.8% Investments / Assets12.4%12.4%8.7%9.9%11.8%13.3%14.2%15.7%17.1%19.3% Combined Business Basis (SSB & CSFL)* 4Q19 1Q20 |
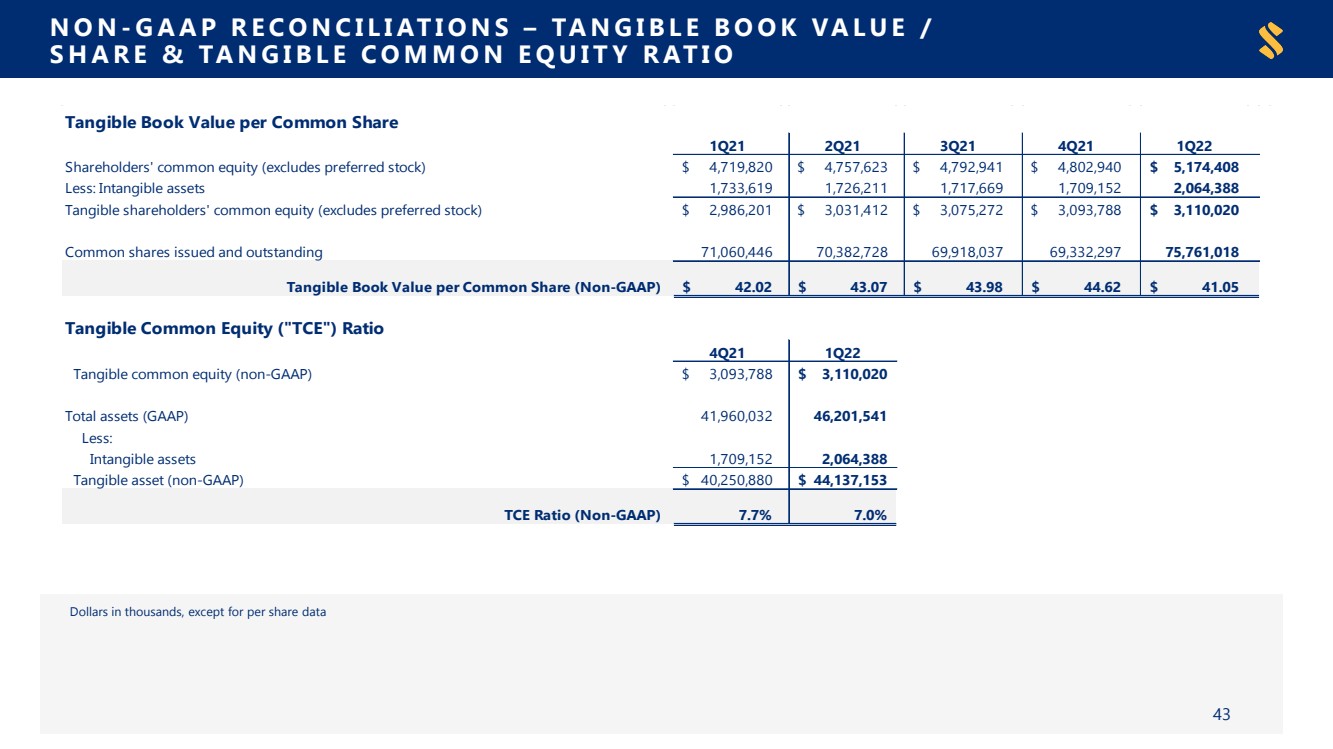
| NON-GAAP RECONCILIATIONS –TANGIBLE BOOK VALUE / SHARE & TANGIBLE COMMON EQUITY RATIO Dollarsinthousands,exceptforpersharedata43 Tangible Book Value per Common Share1Q212Q213Q214Q211Q22Shareholders' common equity (excludes preferred stock)4,719,820$ 4,757,623$ 4,792,941$ 4,802,940$ 5,174,408$ Less: Intangible assets1,733,619 1,726,211 1,717,669 1,709,152 2,064,388 Tangible shareholders' common equity (excludes preferred stock)2,986,201$ 3,031,412$ 3,075,272$ 3,093,788$ 3,110,020$ Common shares issued and outstanding71,060,446 70,382,728 69,918,037 69,332,297 75,761,018 Tangible Book Value per Common Share (Non-GAAP)42.02$ 43.07$ 43.98$ 44.62$ 41.05$ Tangible Common Equity ("TCE") Ratio4Q211Q22Tangible common equity (non-GAAP)3,093,788$ 3,110,020$ Total assets (GAAP)41,960,032 46,201,541 Less:Intangible assets1,709,152 2,064,388 Tangible asset (non-GAAP)40,250,880$ 44,137,153$ TCE Ratio (Non-GAAP)7.7%7.0% |
|