UNITED STATES
SECURITIES AND EXCHANGE COMMISSION
WASHINGTON, D.C. 20549
FORM N-CSR
CERTIFIED SHAREHOLDER REPORT OF REGISTERED MANAGEMENT
INVESTMENT COMPANIES
Investment Company Act file number 811-04244
SOUND SHORE FUND, INC.
Three Canal Plaza, Suite 600
Portland, Maine 04101
John P. DeGulis, President
8 Sound Shore Drive
Greenwich, Connecticut 06830
Date of fiscal year end: December 31
Date of reporting period: January 1, 2024 – December 31, 2024
Item 1. Reports to Stockholders.
(a) A copy of the report transmitted to stockholders pursuant to Rule 30e-1 under the Investment Company Act, as amended (“Act”), is attached hereto.
Annual Shareholder Report - December 31, 2024
This annual shareholder report contains important information about the Sound Shore Fund for the period of January 1, 2024, to December 31, 2024. You can find additional information about the Fund at https://soundshorefund.com/investor-resources-documents/. You can also request this information by contacting us at (800) 551-1980.
What were the Fund's costs for the last year?
(based on a hypothetical $10,000 investment)
| Class Name | Costs of a $10,000 investment | Costs paid as a percentage of a $10,000 investment |
|---|
| Institutional Class | $84 | 0.75% |
|---|
How did the Fund perform in the last year?
It was a strong year for Sound Shore’s portfolio, finishing substantially ahead of the Russell 1000 Value Index. Within the widely followed Standard & Poor’s 500 Index, the year featured familiar winners, which got even bigger as the “Magnificent 7” now represents 33% of the cap-weighted S&P 500 Index and accounted for over 50% of that Index’s return.
In stark contrast to these concentrated, passive indices, this year our performance was driven by 18 stocks (from 8 different sectors) that rose 20% or more. While many investors are focused on the exciting, high-growth potential of artificial intelligence (AI) and technology, we see compelling value in out-of-favor companies undergoing fundamental transformations, regardless of the drivers. High quality, overlooked businesses can often trade at discounted valuations, setting the stage for substantial returns as the market recognizes their true potential.
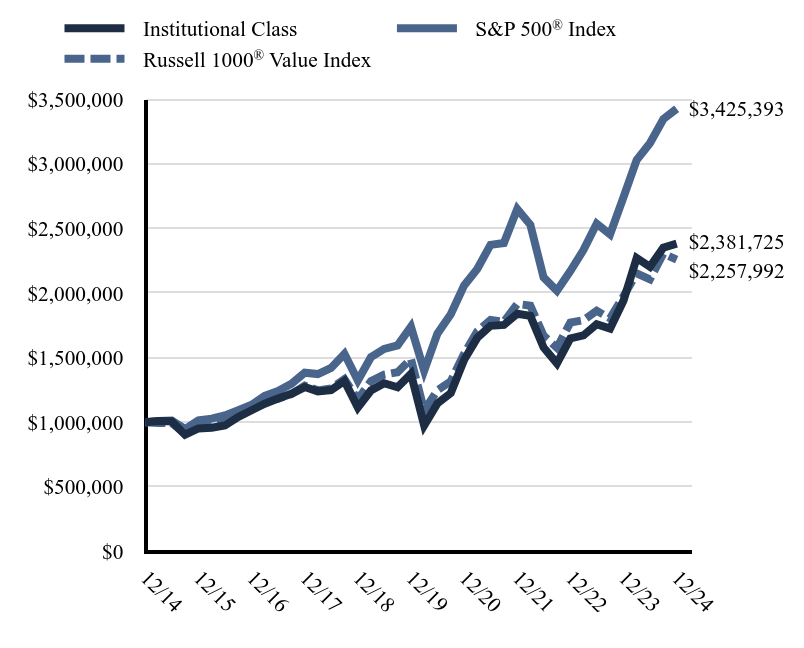
Total Return Based on a $1,000,000 Investment
| Date | Institutional Class | S&P 500® Index | Russell 1000® Value Index |
|---|
| 12/14 | $1,000,000 | $1,000,000 | $1,000,000 |
|---|
| 3/15 | $1,009,413 | $1,009,505 | $992,781 |
|---|
| 6/15 | $1,006,668 | $1,012,312 | $993,856 |
|---|
| 9/15 | $902,956 | $947,136 | $910,423 |
|---|
| 12/15 | $951,645 | $1,013,838 | $961,732 |
|---|
| 3/16 | $957,394 | $1,027,503 | $977,484 |
|---|
| 6/16 | $973,950 | $1,052,731 | $1,022,285 |
|---|
| 9/16 | $1,040,608 | $1,093,282 | $1,057,866 |
|---|
| 12/16 | $1,092,459 | $1,135,092 | $1,128,499 |
|---|
| 3/17 | $1,142,531 | $1,203,949 | $1,165,378 |
|---|
| 6/17 | $1,183,386 | $1,241,129 | $1,181,048 |
|---|
| 9/17 | $1,219,126 | $1,296,736 | $1,217,844 |
|---|
| 12/17 | $1,271,695 | $1,382,901 | $1,282,697 |
|---|
| 3/18 | $1,238,288 | $1,372,403 | $1,246,355 |
|---|
| 6/18 | $1,248,929 | $1,419,529 | $1,261,009 |
|---|
| 9/18 | $1,319,240 | $1,528,986 | $1,332,933 |
|---|
| 12/18 | $1,112,765 | $1,322,269 | $1,176,655 |
|---|
| 3/19 | $1,245,316 | $1,502,733 | $1,317,083 |
|---|
| 6/19 | $1,301,616 | $1,567,407 | $1,367,717 |
|---|
| 9/19 | $1,270,031 | $1,594,027 | $1,386,258 |
|---|
| 12/19 | $1,374,245 | $1,738,604 | $1,488,955 |
|---|
| 3/20 | $973,732 | $1,397,872 | $1,090,958 |
|---|
| 6/20 | $1,144,812 | $1,685,042 | $1,246,862 |
|---|
| 9/20 | $1,225,241 | $1,835,506 | $1,316,597 |
|---|
| 12/20 | $1,483,587 | $2,058,487 | $1,530,583 |
|---|
| 3/21 | $1,652,224 | $2,185,598 | $1,702,849 |
|---|
| 6/21 | $1,745,667 | $2,372,441 | $1,791,536 |
|---|
| 9/21 | $1,752,311 | $2,386,249 | $1,777,562 |
|---|
| 12/21 | $1,839,284 | $2,649,384 | $1,915,681 |
|---|
| 3/22 | $1,822,467 | $2,527,552 | $1,901,550 |
|---|
| 6/22 | $1,578,069 | $2,120,588 | $1,669,358 |
|---|
| 9/22 | $1,455,276 | $2,017,048 | $1,575,583 |
|---|
| 12/22 | $1,648,043 | $2,169,558 | $1,771,280 |
|---|
| 3/23 | $1,671,255 | $2,332,211 | $1,789,102 |
|---|
| 6/23 | $1,757,784 | $2,536,096 | $1,861,999 |
|---|
| 9/23 | $1,723,738 | $2,453,079 | $1,803,069 |
|---|
| 12/23 | $1,939,161 | $2,739,883 | $1,974,317 |
|---|
| 3/24 | $2,270,771 | $3,029,103 | $2,151,721 |
|---|
| 6/24 | $2,202,172 | $3,158,863 | $2,105,115 |
|---|
| 9/24 | $2,350,677 | $3,344,812 | $2,303,625 |
|---|
| 12/24 | $2,381,725 | $3,425,393 | $2,257,992 |
|---|
The above chart represents historical performance of a hypothetical $1,000,000 investment over the past 10 years. Updated performance can be found at www.soundshorefund.com. Effective May 1, 2024, the Fund changed its primary benchmark index from the Russell 1000 Value Index to the S&P 500 Index due to regulatory requirements. The Fund retained the Russell 1000 Value Index as a secondary benchmark because the Russell 1000 Value Index more closely aligns with the Fund's investment strategies and restrictions.
The Fund’s past performance is not a good predictor of how the Fund will perform in the future. The graph and table do not reflect the deduction of taxes that a shareholder would pay on Fund distributions or redemption of Fund shares.
Average Annual Total Returns
| | One Year | Five Year | Ten Year |
|---|
| Institutional Class | 22.82% | 11.62% | 9.06% |
|---|
S&P 500® Index | 25.02% | 14.53% | 13.10% |
|---|
Russell 1000® Value Index | 14.37% | 8.68% | 8.49% |
|---|
| Total Net Assets | $998,549,149 |
|---|
| # of Portfolio Holdings | 41 |
|---|
| Portfolio Turnover Rate | 77% |
|---|
| Investment Advisory Fees Paid (Net of Expense Reimbursements) | $7,029,769 |
|---|
What did the Fund invest in?
The Adviser seeks to meet the Fund’s investment objective of growth of capital by employing a value investment strategy to its selection of predominantly large cap and mid cap common stocks for the portfolio.
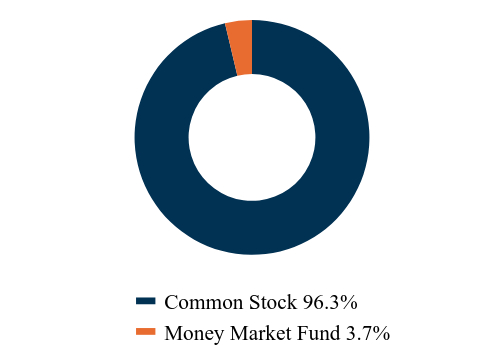
Asset Class Weightings
(% of total investments)
| Value | Value |
|---|
| Common Stock | 96.3% |
| Money Market Fund | 3.7% |
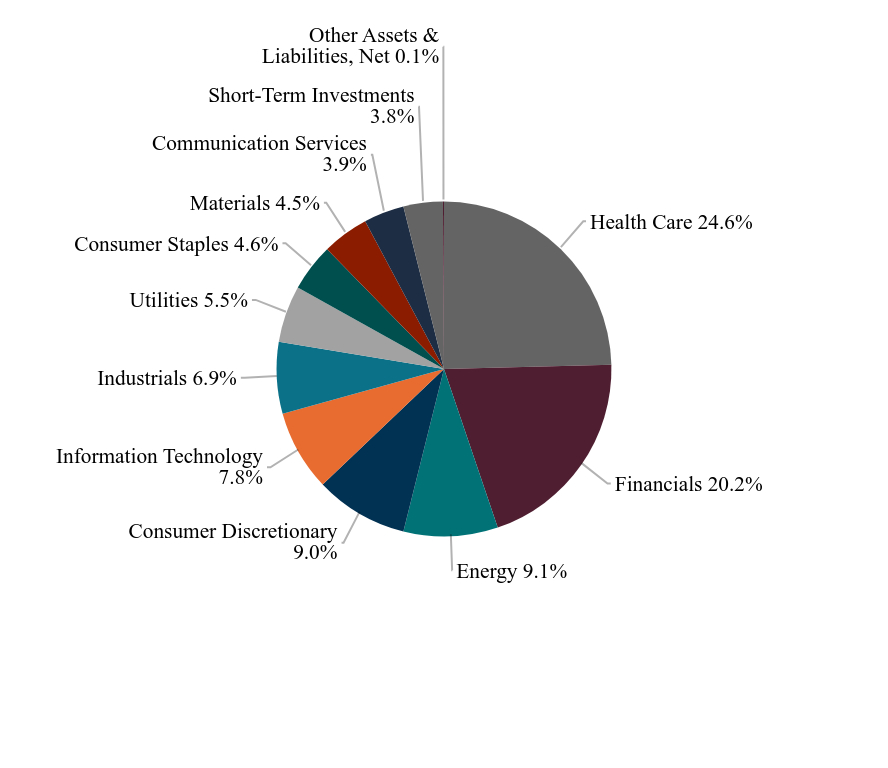
Sector Weightings
(% of total net assets)
| Value | Value |
|---|
| Health Care | 24.6% |
| Financials | 20.2% |
| Energy | 9.1% |
| Consumer Discretionary | 9.0% |
| Information Technology | 7.8% |
| Industrials | 6.9% |
| Utilities | 5.5% |
| Consumer Staples | 4.6% |
| Materials | 4.5% |
| Communication Services | 3.9% |
| Short-Term Investments | 3.8% |
| Other Assets & Liabilities, Net | 0.1% |
Top Ten Holdings
(% of total net assets)
| Capital One Financial Corp. | 3.92% |
| Wells Fargo & Co. | 3.35% |
| Teva Pharmaceutical Industries, Ltd., ADR | 3.26% |
| Avantor, Inc. | 3.19% |
| Coterra Energy, Inc. | 3.13% |
| NXP Semiconductors NV | 2.90% |
| Willis Towers Watson PLC | 2.87% |
| Check Point Software Technologies, Ltd. | 2.85% |
| PVH Corp. | 2.84% |
| Bath & Body Works, Inc. | 2.79% |
Where can I find additional information about the fund?
Additional information is available by scanning the QR code or at https://soundshorefund.com/investor-resources-documents/, including its:
prospectus
financial information
holdings
proxy voting information
Annual Shareholder Report - December 31, 2024
Annual Shareholder Report - December 31, 2024
This annual shareholder report contains important information about the Sound Shore Fund for the period of January 1, 2024, to December 31, 2024. You can find additional information about the Fund at https://soundshorefund.com/investor-resources-documents/. You can also request this information by contacting us at (800) 551-1980.
What were the Fund's costs for the last year?
(based on a hypothetical $10,000 investment)
| Class Name | Costs of a $10,000 investment | Costs paid as a percentage of a $10,000 investment |
|---|
| Investor Class | $105 | 0.95% |
|---|
How did the Fund perform in the last year?
It was a strong year for Sound Shore’s portfolio, finishing substantially ahead of the Russell 1000 Value Index. Within the widely followed Standard & Poor’s 500 Index, the year featured familiar winners, which got even bigger as the “Magnificent 7” now represents 33% of the cap-weighted S&P 500 Index and accounted for over 50% of that Index’s return.
In stark contrast to these concentrated, passive indices, this year our performance was driven by 18 stocks (from 8 different sectors) that rose 20% or more. While many investors are focused on the exciting, high-growth potential of artificial intelligence (AI) and technology, we see compelling value in out-of-favor companies undergoing fundamental transformations, regardless of the drivers. High quality, overlooked businesses can often trade at discounted valuations, setting the stage for substantial returns as the market recognizes their true potential.
Total Return Based on a $10,000 Investment
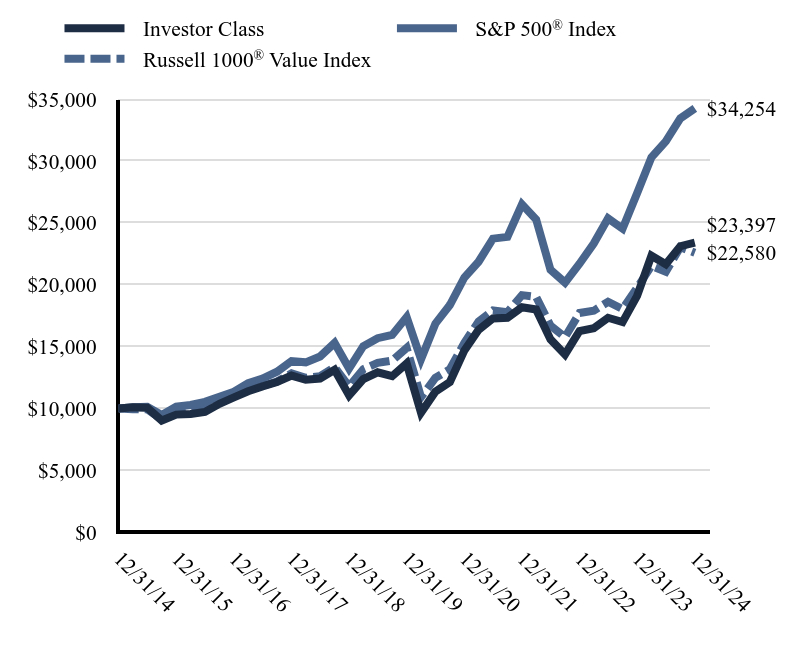
| Date | Investor Class | S&P 500® Index | Russell 1000® Value Index |
|---|
| 12/31/14 | $10,000 | $10,000 | $10,000 |
|---|
| 03/31/15 | $10,090 | $10,095 | $9,928 |
|---|
| 06/30/15 | $10,058 | $10,123 | $9,939 |
|---|
| 09/30/15 | $9,017 | $9,471 | $9,104 |
|---|
| 12/31/15 | $9,498 | $10,138 | $9,617 |
|---|
| 03/31/16 | $9,553 | $10,275 | $9,775 |
|---|
| 06/30/16 | $9,714 | $10,527 | $10,223 |
|---|
| 09/30/16 | $10,376 | $10,933 | $10,579 |
|---|
| 12/31/16 | $10,887 | $11,351 | $11,285 |
|---|
| 03/31/17 | $11,383 | $12,039 | $11,654 |
|---|
| 06/30/17 | $11,783 | $12,411 | $11,810 |
|---|
| 09/30/17 | $12,135 | $12,967 | $12,178 |
|---|
| 12/31/17 | $12,653 | $13,829 | $12,827 |
|---|
| 03/31/18 | $12,317 | $13,724 | $12,464 |
|---|
| 06/30/18 | $12,417 | $14,195 | $12,610 |
|---|
| 09/30/18 | $13,114 | $15,290 | $13,329 |
|---|
| 12/31/18 | $11,054 | $13,223 | $11,767 |
|---|
| 03/31/19 | $12,368 | $15,027 | $13,171 |
|---|
| 06/30/19 | $12,921 | $15,674 | $13,677 |
|---|
| 09/30/19 | $12,603 | $15,940 | $13,863 |
|---|
| 12/31/19 | $13,629 | $17,386 | $14,890 |
|---|
| 03/31/20 | $9,654 | $13,979 | $10,910 |
|---|
| 06/30/20 | $11,345 | $16,850 | $12,469 |
|---|
| 09/30/20 | $12,137 | $18,355 | $13,166 |
|---|
| 12/31/20 | $14,689 | $20,585 | $15,306 |
|---|
| 03/31/21 | $16,353 | $21,856 | $17,028 |
|---|
| 06/30/21 | $17,270 | $23,724 | $17,915 |
|---|
| 09/30/21 | $17,326 | $23,862 | $17,776 |
|---|
| 12/31/21 | $18,177 | $26,494 | $19,157 |
|---|
| 03/31/22 | $18,000 | $25,276 | $19,016 |
|---|
| 06/30/22 | $15,579 | $21,206 | $16,694 |
|---|
| 09/30/22 | $14,363 | $20,170 | $15,756 |
|---|
| 12/31/22 | $16,256 | $21,696 | $17,713 |
|---|
| 03/31/23 | $16,478 | $23,322 | $17,891 |
|---|
| 06/30/23 | $17,325 | $25,361 | $18,620 |
|---|
| 09/30/23 | $16,976 | $24,531 | $18,031 |
|---|
| 12/31/23 | $19,092 | $27,399 | $19,743 |
|---|
| 03/31/24 | $22,341 | $30,291 | $21,517 |
|---|
| 06/30/24 | $21,658 | $31,589 | $21,051 |
|---|
| 09/30/24 | $23,109 | $33,448 | $23,036 |
|---|
| 12/31/24 | $23,397 | $34,254 | $22,580 |
|---|
The above chart represents historical performance of a hypothetical $10,000 investment over the past 10 years. Updated performance can be found at www.soundshorefund.com. Effective May 1, 2024, the Fund changed its primary benchmark index from the Russell 1000 Value Index to the S&P 500 Index due to regulatory requirements. The Fund retained the Russell 1000 Value Index as a secondary benchmark because the Russell 1000 Value Index more closely aligns with the Fund's investment strategies and restrictions.
The Fund’s past performance is not a good predictor of how the Fund will perform in the future. The graph and table do not reflect the deduction of taxes that a shareholder would pay on Fund distributions or redemption of Fund shares.
Average Annual Total Returns
| | One Year | Five Year | Ten Year |
|---|
| Investor Class | 22.54% | 11.41% | 8.87% |
|---|
S&P 500® Index | 25.02% | 14.53% | 13.10% |
|---|
Russell 1000® Value Index | 14.37% | 8.68% | 8.49% |
|---|
| Total Net Assets | $998,549,149 |
|---|
| # of Portfolio Holdings | 41 |
|---|
| Portfolio Turnover Rate | 77% |
|---|
| Investment Advisory Fees Paid (Net of Expense Reimbursements) | $7,029,769 |
|---|
What did the Fund invest in?
The Adviser seeks to meet the Fund’s investment objective of growth of capital by employing a value investment strategy to its selection of predominantly large cap and mid cap common stocks for the portfolio.
Asset Class Weightings
(% of total investments)
| Value | Value |
|---|
| Common Stock | 96.3% |
| Money Market Fund | 3.7% |
Sector Weightings
(% of total net assets)
| Value | Value |
|---|
| Health Care | 24.6% |
| Financials | 20.2% |
| Energy | 9.1% |
| Consumer Discretionary | 9.0% |
| Information Technology | 7.8% |
| Industrials | 6.9% |
| Utilities | 5.5% |
| Consumer Staples | 4.6% |
| Materials | 4.5% |
| Communication Services | 3.9% |
| Short-Term Investments | 3.8% |
| Other Assets & Liabilities, Net | 0.1% |
Top Ten Holdings
(% of total net assets)
| Capital One Financial Corp. | 3.92% |
| Wells Fargo & Co. | 3.35% |
| Teva Pharmaceutical Industries, Ltd., ADR | 3.26% |
| Avantor, Inc. | 3.19% |
| Coterra Energy, Inc. | 3.13% |
| NXP Semiconductors NV | 2.90% |
| Willis Towers Watson PLC | 2.87% |
| Check Point Software Technologies, Ltd. | 2.85% |
| PVH Corp. | 2.84% |
| Bath & Body Works, Inc. | 2.79% |
Where can I find additional information about the fund?
Additional information is available by scanning the QR code or at https://soundshorefund.com/investor-resources-documents/, including its:
prospectus
financial information
holdings
proxy voting information
Annual Shareholder Report - December 31, 2024
(b) Not applicable.
Item 2. Code of Ethics.
(a) As of the end of the period covered by this report, Sound Shore Fund, Inc. (the “Registrant”) has adopted a code of ethics, which applies to its Principal Executive Officer and Principal Financial Officer (the “Code of Ethics”).
(c) There have been no amendments to the Registrant’s Code of Ethics during the period covered by this report.
(d) There have been no waivers to the Registrant’s Code of Ethics during the period covered by this report.
(e) Not applicable.
(f)(1) A copy of the Code of Ethics is being filed under Item 19(a)(1) hereto.
Item 3. Audit Committee Financial Expert.
(a)(1) The Board of Trustees has determined that the Registrant has an audit committee financial expert, as defined in Item 3 of Form N-CSR, serving on its audit committee.
(a)(2) The audit committee financial expert, Mr. David Blair Kelso, is a non-“interested” Trustee (as defined in Item 3(a)(2) of Form N-CSR.
Item 4. Principal Accountant Fees and Services.
(a) Audit Fees – The aggregate fees billed for each of the last two fiscal years (the “Reporting Periods”) for professional services rendered by the Registrant’s principal accountant for the audit of the Registrant’s annual financial statements, or services that are normally provided by the principal accountant in connection with the statutory and regulatory filings or engagements for the Reporting Periods, were $22,200 in 2024 and $20,300 in 2023.
(b) Audit-Related Fees – The aggregate fees billed in the Reporting Periods for assurance and related services rendered by the principal accountant that were reasonably related to the performance of the audit of the Registrant’s financial statements and are not reported under paragraph (a) of this item 4 were $0 in 2024 and $0 in 2023.
(c) Tax Fees – The aggregate fees billed in the Reporting Periods for professional services rendered by the principal accountant to the Registrant for tax compliance, tax advice and tax planning (“Tax Fees”) were $3,000 in 2024 and $3,000 in 2023. These services consisted of review or preparation of U.S. federal, state, local and excise tax returns.
(d) All Other Fees – There were no other fees billed in the Reporting Periods for products and services provided by the principal accountant to the Registrant, other than the services reported in paragraphs (a) through (c) of this Item.
(e)(1) Pre-Approval Requirements for Audit and Non-Audit Services. The Audit Committee reviews and approves in advance all audit and “permissible non-audit services” to be provided to Sound Shore Management, Inc. (“Sound Shore Management”), the Fund’s investment adviser, by the Fund’s independent auditor if the engagement relates to the operations and financial reporting of the Fund. The Audit Committee considers whether fees paid by Sound Shore Management for audit and permissible non-audit services are consistent with the independent auditor’s independence. Pre-approval of any permissible non-audit services provided to the Fund is not required so long as: (i) the aggregate amount of all such permissible non-audit services provided to the Fund constitutes not more than 5% of the total amount of revenues paid by the Fund to its auditor during the fiscal year in which the permissible non-audit services are provided; (ii) the permissible non-audit services were not recognized by the Fund at the time of engagement to be non-audit services; and (iii) such services are promptly brought to the attention of the Audit Committee and approved prior to the completion of the audit by the Audit Committee or its authorized delegate(s). Pre-approval of permissible non-audit services rendered to Sound Shore Management is not required if provided. The Audit Committee may delegate to one or more of its members authority to pre-approve permissible non-audit services to be provided to the Fund. Any pre-approval determination of a delegate will be presented to the full Audit Committee at its next meeting.
(e)(2) No services included in (b) - (d) above were approved pursuant to paragraph (c)(7)(i)(C) of Rule 2- 01 of Regulation S-X.
(f) Not applicable as less than 50%.
(g) The aggregate fees billed in the Reporting Periods for Non-Audit Services by the principal accountant to the Registrant were $4,650 in 2024 and $4,650 in 2023. The non-audit fees billed by the Registrant’s principal accountant for non-audit services provided to the Sound Shore Management (not including any sub-adviser whose role is primarily portfolio management and is subcontracted with or overseen by another investment adviser) and any entity controlling, controlled by, or under common control with the adviser that provides ongoing services to the registrant affiliated were $21,150 in 2024 and $21,150 in 2023.
(h) The Registrant’s Audit Committee considers the provision of any non-audit services rendered to the investment adviser, to the extent applicable, in evaluating the independence of the Registrant’s principal accountant. Any services provided by the principal accountant to the Registrant or to Sound Shore Management requiring pre-approval were pre-approved.
(i) Not applicable. The Registrant has not retained, for the preparation of the audit report on the financial statements included in the Form N-CSR, a registered public accounting firm that has a branch or office that is located in a foreign jurisdiction and that the Public Company Accounting Oversight Board (the “PCAOB”) has determined that the PCAOB is unable to inspect or investigate completely because of a position taken by an authority in the foreign jurisdiction.
(j) Not applicable. The Registrant is not a “foreign issuer,” as defined in 17 CFR 240.3b-4.
Item 5. Audit Committee of Listed Registrants.
Not applicable.
Item 6. Investments.
| (a) | Included as part of financial statements filed under Item 7(a). |
Item 7. Financial Statements and Financial Highlights for Open-End Management Investment Companies
(a)
Annual
Financials
and
Other
Information
207-ANR-1224
This
report
is
submitted
for
the
general
information
of
the
shareholders
of
the
Fund.
It
is
not
authorized
for
distribution
to
prospective
investors
in
the
Fund
unless
preceded
or
accompanied
by
an
effective
prospectus,
which
includes
information
regarding
the
Fund’s
objectives
and
policies,
experience
of
its
management,
and
other
information.
SOUND
SHORE
FUND,
INC.
Three
Canal
Plaza
Portland,
ME
04101
www.soundshorefund.com
(800)
551-1980
See
Notes
to
Financial
Statements.
Sound
Shore
Fund,
Inc.
SCHEDULE
OF
INVESTMENTS
December
31,
2024
Sound
Shore
Fund,
Inc.
SCHEDULE
OF
INVESTMENTS
December
31,
2024
Share
Amount
Value
Common
Stock
(96.1%)
(a)
Communication
Services
(
3.9%
)
Match
Group,
Inc.
(b)
387,995
$
12,691,317
The
Walt
Disney
Co.
233,875
26,041,981
38,733,298
Consumer
Discretionary
(
9.0%
)
Bath
&
Body
Works,
Inc.
717,905
27,833,177
General
Motors
Co.
316,890
16,880,730
Lennar
Corp.,
Class A
125,935
17,173,756
PVH
Corp.
268,795
28,425,071
90,312,734
Consumer
Staples
(
4.6%
)
Nestle
SA,
ADR
246,575
20,145,178
The
Kroger
Co.
417,720
25,543,578
45,688,756
Energy
(
9.1%
)
Baker
Hughes
Co.
504,520
20,695,410
Coterra
Energy,
Inc.
1,222,390
31,219,841
EOG
Resources,
Inc.
164,705
20,189,539
Kinder
Morgan,
Inc.
696,265
19,077,661
91,182,451
Financials
(
20.2%
)
Berkshire
Hathaway,
Inc.,
Class B
(b)
50,275
22,788,652
Capital
One
Financial
Corp.
219,590
39,157,289
Citigroup,
Inc.
384,160
27,041,022
Fidelity
National
Information
Services,
Inc.
284,755
22,999,661
PayPal
Holdings,
Inc.
(b)
322,865
27,556,528
Wells
Fargo
&
Co.
475,335
33,387,530
Willis
Towers
Watson
PLC
91,445
28,644,232
201,574,914
Health
Care
(
24.6%
)
Avantor,
Inc.
(b)
1,514,380
31,907,987
Baxter
International,
Inc.
786,370
22,930,549
Bristol-Myers
Squibb
Co.
417,675
23,623,698
See
Notes
to
Financial
Statements.
Sound
Shore
Fund,
Inc.
SCHEDULE
OF
INVESTMENTS
(Continued)
December
31,
2024
Sound
Shore
Fund,
Inc.
SCHEDULE
OF
INVESTMENTS
(Continued)
December
31,
2024
Share
Amount
Value
Health
Care
(24.6%)
(continued)
GE
HealthCare
Technologies,
Inc.
230,515
$
18,021,663
Hologic,
Inc.
(b)
284,425
20,504,198
Incyte
Corp.
(b)
374,885
25,893,307
Organon
&
Co.
1,491,355
22,251,017
Perrigo
Co.
PLC
870,395
22,377,855
Teva
Pharmaceutical
Industries,
Ltd.,
ADR
(b)
1,476,070
32,532,583
Zimmer
Biomet
Holdings,
Inc.
246,375
26,024,591
246,067,448
Industrials
(
6.9%
)
CSX
Corp.
667,650
21,545,066
FedEx
Corp.
71,830
20,207,934
Southwest
Airlines
Co.
807,010
27,131,676
68,884,676
Information
Technology
(
7.8%
)
Check
Point
Software
Technologies,
Ltd.
(b)
152,375
28,448,413
Flex,
Ltd.
(b)
535,760
20,567,826
NXP
Semiconductors
NV
139,645
29,025,213
78,041,452
Materials
(
4.5%
)
Barrick
Gold
Corp.
1,437,500
22,281,250
CF
Industries
Holdings,
Inc.
260,970
22,265,960
44,547,210
Utilities
(
5.5%
)
Public
Service
Enterprise
Group,
Inc.
156,595
13,230,712
The
AES
Corp.
1,697,890
21,851,844
Vistra
Corp.
143,605
19,798,821
54,881,377
Total
Common
Stock
(96.1%)
(cost
$748,563,731)
959,914,316
See
Notes
to
Financial
Statements.
Sound
Shore
Fund,
Inc.
SCHEDULE
OF
INVESTMENTS
(Concluded)
December
31,
2024
Share
Amount
Value
Short-Term
Investments
(3.8%)
Money
Market
Fund
(
3.8%
)
First
American
Government
Obligations
Fund,
Class X,
4.
41
%
(c)
37,286,030
$
37,286,030
Total
Short-Term
Investments
(3.8%)
(cost
$37,286,030)
37,286,030
Investments,
at
value
(99.9%)
(cost
$785,849,761)
$
997,200,346
Other
Assets
Less
Liabilities
(0.1%)
1,348,803
Net
Assets
(100.0%)
$
998,549,149
(a)
More
narrow
industries
are
utilized
for
compliance
purposes,
whereas
broad
sectors
are
utilized
for
reporting
purposes.
(b)
Non-income
producing
security.
(c)
Percentage
disclosed
reflects
the
money
market
fund’s
C
lass
X
shares
7-day
yield
as
of
December
31,
2024.
ADR
American
Depositary
Receipt
PLC
Public
Limited
Company
See
Notes
to
Financial
Statements.
Sound
Shore
Fund,
Inc.
STATEMENT
OF
ASSETS
AND
LIABILITIES
December
31,
2024
Sound
Shore
Fund,
Inc.
STATEMENT
OF
ASSETS
AND
LIABILITIES
December
31,
2024
ASSETS
Investments,
at
value
(Cost
$785,849,761)
$
997,200,346
Receivables:
Capital
shares
sold
2,430,494
Dividends
933,132
Foreign
tax
reclaims
93,825
Prepaid
expenses
47,615
Total
Assets
1,000,705,412
LIABILITIES
Payables:
Capital
shares
redeemed
1,363,382
Accrued
liabilities:
Advisory
fees
616,874
Administrator
fees
12,867
Transfer
agent
fees
and
expenses
55,529
Custodian
fees
13,187
Compliance
and
Treasurer
Services
fees
and
expenses
12,500
Professional
fees
46,300
Other
accrued
liabilities
35,624
Total
Liabilities
2,156,263
Net
Assets
$
998,549,149
COMPONENTS
OF
NET
ASSETS
Common
stock,
at
Par
Value
$
25,777
Paid-in
Capital
786,926,402
Distributable
earnings
211,596,970
Net
Assets
$
998,549,149
NET
ASSET
VALUE
Net
Assets
-
Investor
Class
Shares
$
533,076,885
Shares
Outstanding
-
Investor
Class
(100,000,000
shares
authorized,
par
value
$0.001)
13,874,575
Net
Asset
Value
(offering
&
redemption
price
per
share)
-
Investor
Class
Shares
$
38.42
Net
Assets
-
Institutional
Class
Shares
$
465,472,264
Shares
Outstanding
-
Institutional
Class
(100,000,000
shares
authorized,
par
value
$0.001)
11,902,584
Net
Asset
Value
(offering
&
redemption
price
per
share)
-
Institutional
Class
Shares
$
39.11
See
Notes
to
Financial
Statements.
Sound
Shore
Fund,
Inc.
STATEMENT
OF
OPERATIONS
FOR
THE
YEAR
ENDED
DECEMBER
31,
2024
Sound
Shore
Fund,
Inc.
STATEMENT
OF
OPERATIONS
FOR
THE
YEAR
ENDED
DECEMBER
31,
2024
INVESTMENT
INCOME
Income:
Di
vidend
income
(net
of
foreign
withholding
taxes
of
$281,723)
$
19,121,382
Total
Income
19,121,382
Expenses:
Advisory
fees
(Note
3
)
7,499,736
Administrator
fees
152,077
Transfer
agent
fees
and
expenses
-
Investor
Class
Shares
570,359
Transfer
agent
fees
and
expenses
-
Institutional
Class
Shares
56,438
Custodian
fees
80,856
Compliance
and
Treasurer
Services
fees
and
expenses
(Note
3
)
151,095
Directors’
fees
and
expenses
(Note
3
)
191,207
Professional
fees
112,300
Registration
fees
-
Investor
Class
Shares
26,575
Registration
fees
-
Institutional
Class
Shares
27,283
Printing
and
postage
fees
-
Investor
Class
Shares
43,623
Printing
and
postage
fees
-
Institutional
Class
Shares
33,254
Miscellaneous
85,828
Total
Expenses
9,030,631
Expense
Reimbursements
-
Institutional
Class
Shares
(Note
3
)
(469,967)
Net
Expenses
8,560,664
Net
Investment
Income
10,560,718
REALIZED
AND
UNREALIZED
GAIN
(LOSS)
ON
INVESTMENTS
Net
realized
gain
on
investments
214,262,782
Net
change
in
unrealized
appreciation
(depreciation)
on
investments
(24,985,733)
Net
realized
and
unrealized
gain
on
investments
189,277,049
Net
increase
in
net
assets
from
operations
$
199,837,767
See
Notes
to
Financial
Statements.
Sound
Shore
Fund,
Inc.
STATEMENTS
OF
CHANGES
IN
NET
ASSETS
Sound
Shore
Fund,
Inc.
STATEMENTS
OF
CHANGES
IN
NET
ASSETS
For
the
Year
Ended
December
31,
2024
2023
Operations:
Net
investment
income
$
10,560,718
$
8,792,618
Net
realized
gain
on
investments
214,262,782
35,751,231
Net
change
in
unrealized
appreciation
(
depreciation
)
on
investments
(24,985,733)
97,315,104
Increase
in
net
assets
from
operations
199,837,767
141,858,953
Distributions
to
shareholders
:
Investor
Class
Shares
(113,996,541)
(22,054,579)
Institutional
Class
Shares
(96,536,807)
(17,868,996)
Total
distributions
to
shareholders
(210,533,348)
(39,923,575)
Net
capital
share
transactions
(Note
6
):
Investor
Class
Shares
39,521,488
(77,275,519)
Institutional
Class
Shares
64,176,432
(19,448,325)
Total
capital
share
transactions
103,697,920
(96,723,844)
Total
increase
in
net
assets
93,002,339
5,211,534
NET
ASSETS
Beginning
of
the
year
905,546,810
900,335,276
End
of
the
year
$
998,549,149
$
905,546,810
Sound
Shore
Fund,
Inc.
NOTES
TO
FINANCIAL
STATEMENTS
December
31,
2024
1.
Organization
Sound
Shore
Fund,
Inc.
(the
“Fund”)
was
incorporated
under
the
laws
of
the
State
of
Maryland
on
February
15,
1985
and
is
registered
as
a
diversified,
open-end
management
investment
company
under
the
Investment
Company
Act
of
1940
(the
“Act”).
The
investment
objective
of
the
Fund
is
growth
of
capital.
The
Fund
qualifies
as
an
investment
company
as
defined
in
Financial
Accounting
Standards
Codification
946
—
Financial
Services
—
Investment
Companies.
The
total
number
of
shares
of
common
stock
which
the
Fund
is
authorized
to
issue
is
200,000,000,
par
value
$0.001
per
share
of
which
100,000,000
shares
are
designated
to
the
Investor
Class
and
100,000,000
shares
are
designated
to
the
Institutional
Class.
The
Board
of
Directors
(the
“Board”)
may,
without
shareholder
approval,
classify
or
reclassify
any
unissued
shares
into
other
classes
or
series
of
shares.
Each
share
of
the
Fund
has
equal
dividend,
distribution,
liquidation
and
voting
rights
(except
as
to
matters
relating
exclusively
to
one
class
of
shares),
and
fractional
shares
have
those
rights
proportionately.
2.
Significant
Accounting
Policies
These
financial
statements
are
prepared
in
accordance
with
accounting
principles
generally
accepted
in
the
United
States
of
America
(“GAAP”),
which
require
management
to
make
estimates
and
assumptions
that
affect
the
reported
amounts
of
assets
and
liabilities,
disclosure
of
contingent
liabilities,
if
any,
at
the
date
of
the
financial
statements,
and
the
reported
amounts
of
increase
and
decrease
in
net
assets
from
operations
during
the
fiscal
period.
Actual
results
could
differ
from
those
estimates.
The
following
represents
the
significant
accounting
policies
of
the
Fund:
a.
Security
Valuation
Exchange-traded
securities
including
those
traded
on
the
National
Association
of
Securities
Dealers’
Automated
Quotation
system
(“NASDAQ”),
are
valued
at
the
last
quoted
sale
price
or
official
closing
price
as
provided
by
independent
pricing
services
as
of
the
close
of
trading
on
the
system
or
exchange
on
which
they
are
primarily
traded,
on
each
Fund
business
day.
In
the
absence
of
a
sale,
such
securities
are
valued
at
the
mean
of
the
last
bid
and
asked
prices.
Non-exchange-traded
securities
for
which
over-the-counter
market
quotations
are
readily
available
are
generally
valued
at
the
mean
between
the
current
bid
and
asked
prices
provided
by
independent
pricing
services.
Investments
in
other
open-end
regulated
investment
companies
are
valued
at
their
publicly
traded
net
asset
value
(“NAV”).
Pursuant
to
Rule
2a-5
under
the
Investment
Company
Act,
the
Board
has
designated
the
Adviser,
as
defined
in
Note
3,
as
the
Fund's
valuation
designee
to
perform
any
fair
value
determinations
for
securities
and
other
assets
held
by
the
Fund.
The
Adviser
is
subject
to
the
oversight
of
the
Board
and
certain
reporting
and
other
requirements
intended
to
provide
the
Board
the
information
needed
to
oversee
the
Adviser's
fair
value
determinations.
The
Adviser
is
responsible
for
determining
the
fair
value
of
investments
for
which
market
quotations
are
not
readily
available
in
accordance
with
Sound
Shore
Fund,
Inc.
NOTES
TO
FINANCIAL
STATEMENTS
(Continued)
December
31,
2024
policies
and
procedures
that
have
been
approved
by
the
Board.
Under
these
procedures,
the
Adviser
convenes
on
a
regular
and
ad
hoc
basis
to
review
such
investments
and
considers
a
number
of
factors,
including
valuation
methodologies
and
significant
unobservable
inputs,
when
arriving
at
fair
value.
The
Board
has
approved
the
Adviser’s
fair
valuation
procedures
as
a
part
of
the
Fund’s
compliance
program
and
will
review
any
changes
made
to
the
procedures.
The
Adviser
provides
fair
valuation
inputs
pursuant
to
its
fair
valuation
procedures
if
market
quotations
are
not
readily
available
(including
a
short
and
temporary
lapse
in
the
provision
of
a
price
by
the
regular
pricing
source)
or,
if
in
the
judgment
of
the
Adviser
the
prices
or
values
available
do
not
represent
the
fair
value
of
the
instrument.
Factors
which
may
cause
the
Adviser
to
make
such
a
judgment
include,
but
are
not
limited
to,
the
following:
(i)
only
a
bid
price
or
an
asked
price
is
available,
(ii)
the
spread
between
the
bid
price
and
the
asked
price
is
substantial,
(iii)
the
frequency
of
sales,
(iv)
the
thinness
of
the
market,
(v)
the
size
of
reported
trades,
and
(vi)
actions
of
the
securities
markets,
such
as
the
suspension
or
limitation
of
trading.
Fair
valuation
is
based
on
subjective
factors
and,
as
a
result,
the
fair
value
price
of
a
security
may
differ
from
the
security’s
market
price
and
may
not
be
the
price
at
which
the
security
may
be
sold.
Fair
valuation
could
result
in
a
NAV
different
from
one
determined
by
using
market
quotations.
Valuation
inputs
used
to
determine
the
value
of
the
Fund’s
investments
are
summarized
in
the
three
broad
levels
listed
below:
Level
1
-
quoted
prices
in
active
markets
for
identical
assets
Level
2
-
other
significant
observable
inputs
(including
quoted
prices
of
similar
securities,
interest
rates,
prepayment
speeds,
credit
risk,
etc.)
Level
3
-
significant
unobservable
inputs
(including
the
Fund’s
own
assumptions
in
determining
the
fair
value
of
investments)
The
inputs
or
methodology
used
for
valuing
securities
are
not
necessarily
an
indication
of
the
risk
associated
with
investing
in
those
securities.
Pursuant
to
the
valuation
procedures
noted
previously,
equity
securities
(including
exchange-traded
securities
and
other
open-end
regulated
investment
companies)
are
generally
categorized
as
Level
1
securities
in
the
fair
value
hierarchy.
Investments
for
which
there
are
no
quotations,
or
for
which
quotations
do
not
appear
reliable,
are
valued
at
fair
value
as
determined
in
good
faith
by
the
Adviser
under
the
Adviser’s
fair
valuation
procedures.
These
valuations
are
typically
categorized
as
Level
2
or
Level
3
in
the
fair
value
hierarchy.
The
following
table
summarizes
the
Fund’s
investments
categorized
in
the
fair
value
hierarchy
as
of
December
31,
2024:
Sound
Shore
Fund,
Inc.
NOTES
TO
FINANCIAL
STATEMENTS
(Continued)
December
31,
2024
At
December
31,
2024,
all
equity
securities
and
open-end
regulated
investment
companies
were
included
in
Level
1
in
the
table
above.
Please
refer
to
the
Schedule
of
Investments
to
view
equity
securities
categorized
by
sector/industry
type.
b.
Security
Transactions
Security
transactions
are
recorded
on
a
trade
date
basis.
Realized
gain
and
loss
on
investments
sold
are
recorded
on
the
basis
of
identified
cost.
Dividend
income
is
recorded
on
the
ex-dividend
date.
Interest
income
is
recorded
on
an
accrual
basis.
Foreign
dividend
income
is
recorded
on
the
ex-dividend
date
or
as
soon
as
practicable
after
the
Fund
determines
the
existence
of
a
dividend
declaration
after
exercising
reasonable
due
diligence.
Income
and
capital
gains
on
some
foreign
securities
may
be
subject
to
foreign
withholding
tax,
which
is
accrued
as
applicable.
Investment
income,
realized
and
unrealized
gains
and
losses
and
certain
Fund-level
expenses
are
allocated
to
each
class
based
on
relative
average
daily
net
assets.
Certain
expenses
are
incurred
at
the
class
level
and
charged
directly
to
that
particular
class.
Class
level
expenses
are
denoted
as
such
on
the
Fund’s
Statement
of
Operations.
c.
Dividends
and
Distributions
to
Shareholders
Dividends
are
declared
separately
for
each
class.
No
class
has
preferential
dividend
rights;
differences
in
per-share
dividend
rates
are
generally
due
to
class-specific
fee
waivers
and
expenses.
Dividends
and
distributions
payable
to
shareholders
are
recorded
by
the
Fund
on
the
ex-dividend
date.
Dividends
from
net
investment
income,
if
any,
are
declared
and
paid
semiannually.
Capital
gains,
if
any,
are
distributed
to
shareholders
at
least
annually.
The
Fund
determines
its
net
investment
income
and
capital
gains
distributions
in
accordance
with
income
tax
regulations,
which
may
differ
from
GAAP.
These
differences
are
due
primarily
to
differing
treatments
of
income
and
gains
on
various
securities
held
by
the
Fund,
timing
differences
and
differing
characterizations
of
distributions
made
by
the
Fund.
To
the
extent
distributions
exceed
net
investment
income
and
net
realized
capital
gains
for
tax
purposes,
they
are
reported
as
a
return
of
capital.
d.
Federal
Taxes
The
Fund
intends
to
continue
to
qualify
each
year
as
a
regulated
investment
company
and
to
distribute
substantially
all
of
its
taxable
income.
In
addition,
by
distributing
in
each
calendar
year
substantially
all
of
its
net
investment
income,
capital
gain
and
certain
other
amounts,
if
any,
the
Fund
will
not
be
subject
to
federal
taxation.
Therefore,
no
federal
income
or
excise
tax
provision
is
required.
For
all
open
tax
years
and
all
major
taxing
jurisdictions,
management
of
the
Fund
has
concluded
that
there
are
no
significant
uncertain
tax
positions
that
would
require
the
Fund
to
record
a
tax
liability
or
would
otherwise
require
recognition
in
the
financial
statements.
Open
tax
years
are
those
that
are
open
for
Security
Type
Level
1
Level
2
Level
3
Total
Investments
in
Securities
Common
Stock
$
959
,
914
,
316
$
–
$
–
$
959,914,316
Short-Term
Investments
37,286,030
–
–
37,286,030
Total
Investments
$
997,200,346
$
–
$
–
$
997,200,346
Sound
Shore
Fund,
Inc.
NOTES
TO
FINANCIAL
STATEMENTS
(Continued)
December
31,
2024
examination
by
taxing
authorities
(i.e.,
generally,
the
last
three
tax
year-ends
2021
–
2023,
and
the
interim
tax
year
since
then).
3.
Fees
and
Expenses
Investment
Adviser
The
Fund’s
investment
adviser
is
Sound
Shore
Management,
Inc.
(the
“Adviser”).
Pursuant
to
an
investment
advisory
agreement,
the
Adviser
receives
an
advisory
fee,
accrued
daily
and
paid
monthly
at
an
annual
rate
of
0.75%
of
the
Fund’s
average
daily
net
assets.
Pursuant
to
an
expense
limitation
agreement
between
the
Adviser
and
the
Fund,
the
Adviser
has
agreed
to
reimburse
all
of
the
ordinary
expenses
of
the
Institutional
Class,
excluding
advisory
fees,
interest,
taxes,
securities
lending
costs,
brokerage
commissions,
acquired
fund
fees
and
expenses,
extraordinary
expenses
and
all
litigation
costs
until
at
least
May
1,
2025.
This
reimbursement
is
shown
on
the
Statement
of
Operations
as
a
reduction
of
expenses,
and
such
amounts
are
not
subject
to
future
recoupment
by
the
Adviser.
Other
Services
Atlantic
Fund
Administration,
LLC,
a
wholly
owned
subsidiary
of
Apex
U.S.
Holdings
LLC
(d/b/a
Apex
Fund
Services)
(“Apex”),
provides
certain
administration
and
portfolio
accounting
services
to
the
Fund.
U.S.
Bank,
N.A.
(“U.S.
Bank”)
serves
as
custodian
to
the
Fund.
Apex
provides
transfer
agency
services
to
the
Fund.
The
Fund
also
has
agreements
with
various
financial
intermediaries
and
“mutual
fund
supermarkets”
under
which
customers
of
these
intermediaries
may
purchase
and
hold
Fund
shares.
These
intermediaries
effectively
provide
sub-transfer
agent
services
that
the
Fund’s
transfer
agent
would
have
otherwise
had
to
provide.
In
recognition
of
this,
the
transfer
agent,
the
Fund
and
the
Fund’s
Adviser
have
entered
into
an
agreement
whereby
the
transfer
agent
agrees
to
pay
financial
intermediaries
a
portion
of
the
amount
denoted
on
the
Statement
of
Operations
as
“Transfer
agent
fees
and
expenses
—
Investor
Class
Shares”
that
it
receives
from
the
Fund
for
its
services
as
transfer
agent
for
the
Investor
Class
and
the
Adviser
agrees
to
pay
the
excess,
if
any,
charged
by
a
financial
intermediary
for
that
class.
Foreside
Fund
Services,
LLC,
a
wholly
owned
subsidiary
of
Foreside
Financial
Group,
LLC
(d/b/a
ACA
Group),
is
the
Fund’s
distributor
(the
“Distributor”).
The
Distributor
is
not
affiliated
with
the
Adviser,
Apex,
U.S.
Bank,
or
its
affiliated
companies.
The
Distributor
receives
no
compensation
from
the
Fund
for
its
distribution
services.
Pursuant
to
a
Compliance
Services
Agreement
with
the
Fund,
Foreside
Fund
Officer
Services,
LLC
(“FFOS”),
an
affiliate
of
the
Distributor,
provides
a
Chief
Compliance
Officer
and
Anti-Money
Laundering
Officer
to
the
Fund
as
well
as
some
additional
compliance
support
functions.
Under
a
Treasurer
Services
Agreement
with
the
Fund,
Foreside
Management
Services,
LLC
(“FMS”),
an
affiliate
of
the
Distributor,
provides
a
Treasurer
to
the
Fund.
Neither
the
Distributor,
FFOS,
FMS,
nor
their
employees
that
serve
as
officers
of
the
Fund,
have
any
role
in
determining
the
investment
policies
of
or
securities
to
be
purchased
or
sold
by
the
Fund.
The
Fund
pays
each
director
who
is
not
an
“interested
person”
of
the
Fund,
as
defined
in
Section
2(a)(19)
of
the
Act
(“Independent
Director”),
quarterly
fees
of
$5,000,
plus
$10,000
per
quarterly
meeting
attended
in-person
or
telephonically,
Sound
Shore
Fund,
Inc.
NOTES
TO
FINANCIAL
STATEMENTS
(Continued)
December
31,
2024
and
$2,000
per
special
meeting
attended
in
person
or
telephonically.
In
addition,
the
Chairman
of
the
Audit
Committee
receives
a
quarterly
fee
of
$2,500.
Certain
Officers
and
Directors
of
the
Fund
are
officers,
directors,
or
employees
of
the
aforementioned
companies.
4.
Purchases
and
Sales
of
Securities
The
cost
of
securities
purchased
and
proceeds
from
sales
of
securities
(excluding
short-term
investments)
for
the
fiscal
year
ended
December
31,
2024,
aggregated
$747,141,492
and
$842,821,897,
respectively.
5.
Federal
Income
Tax
Cost
for
federal
income
tax
purposes
is
$785,681,169
and
net
unrealized
appreciation
consists
of:
Distributions
during
the
fiscal
years
ended
December
31,
2024
and
December
31,
2023
were
characterized
for
tax
purposes
as
follows:
Equalization
debits
(amounts
not
included
in
the
above
distributions)
were
as
follows:
On
the
Statement
of
Assets
and
Liabilities,
primarily
as
a
result
of
equalization
and
prior
year
adjustments,
the
following
amounts
have
been
reclassified
for
the
year
ended
December
31,
2024:
Components
of
net
assets
on
a
federal
income
tax
basis
at
December
31,
2024,
were
as
follows:
Gross
Unrealized
Appreciation
$
229,187,316
Gross
Unrealized
Depreciation
(17,668,139)
Net
Unrealized
Appreciation
$
211,519,177
2024
2023
Ordinary
Income
$
59,003,941
$
6,
596
,
105
Long-Term
Capital
Gain
151,529,407
33,
327
,
470
Total
Taxable
Distributions
$
210,533,348
$
39,923,575
2024
2023
Ordinary
Income
$
338,092
$
783
,
876
Long-Term
Capital
Gain
12,806,777
69,422
Total
Taxable
Distributions
$
13,144,869
$
853
,
298
Paid-in-Capital
$
13,170,832
Distributable
Earnings
$
(13,170,832)
Sound
Shore
Fund,
Inc.
NOTES
TO
FINANCIAL
STATEMENTS
(Continued)
December
31,
2024
At
December
31,
2024,
the
Fund,
for
federal
income
tax
purposes,
had
no
capital
loss
carryforwards.
6.
Capital
Stock
Transactions
in
capital
stock
for
the
years
ended
December
31,
2024
and
December
31,
2023,
were
as
follows:
7.
Segment
Reporting
In
this
reporting
period,
the
Fund
adopted
FASB
Accounting
Standards
Update
2023-07,
Segment
Reporting
(Topic
280)
-
Improvements
to
Reportable
Segment
Disclosures
("ASU
2023-07").
Adoption
did
not
affect
the
Fund’s
financial
position
or
its
results
from
operations.
The
intent
of
ASU
2023-07
is
to
enable
investors
to
better
understand
an
entity's
overall
performance
and
to
assess
its
potential
future
cash
flows.
The
Fund’s
Principal
Executive
Officer
acts
as
the
Fund’s
chief
operating
decision
maker
(CODM).
The
Fund
is
party
to
the
expense
agreements
as
disclosed
in
the
notes
to
the
financial
statements
and
resources
are
not
allocated
to
the
Fund
based
on
performance
measurements.
The
CODM
has
determined
the
Fund
to
be
an
individual
reporting
segment,
not
part
of
a
consolidated
reporting
entity.
The
objective
and
strategy
of
the
Fund,
along
with
the
terms
of
its
prospectus
are
used
by
the
Adviser
to
inform
investment
decisions.
The
financial
information
provided
to
and
reviewed
by
the
CODM
is
consistent
with
that
presented
in
the
Fund’s
Portfolio
of
Investments,
Statement
of
Changes
in
Net
Assets
and
Financial
Highlights.
Par
Value
+
Paid-in
Capital
$
786,952,179
Undistributed
Ordinary
Income
12
,
154
Undistributed
Long-Term
Gain
65,639
Net
Unrealized
Appreciation
211,519,177
Net
Assets
$
998,549,149
For
the
Year
Ended
December
31,
2024
Investor
Class
Institutional
Class
Shares
Amount
Shares
Amount
Sale
of
shares
716,867
$
32,083,068
1,211,023
$
53,588,094
Reinvestment
of
dividends
2,804,766
108,887,064
2,381,970
94,143,367
Redemption
of
shares
(2,308,262)
(101,448,644)
(1,864,092)
(83,555,029)
Net
increase
from
capital
transactions
1,213,371
$
39,521,488
1,728,901
$
64,176,432
For
the
Year
Ended
December
31,
2023
Investor
Class
Institutional
Class
Shares
Amount
Shares
Amount
Sale
of
shares
285,351
$
10,513,301
762,184
$
28,620,764
Reinvestment
of
dividends
534,041
20,953,937
439,919
17,481,706
Redemption
of
shares
(2,951,328)
(108,742,757)
(1,764,562)
(65,550,795)
Net
decrease
from
capital
transactions
(2,131,936)
$
(77,275,519)
(562,459)
$
(19,448,325)
Sound
Shore
Fund,
Inc.
NOTES
TO
FINANCIAL
STATEMENTS
(Concluded)
December
31,
2024
8.
Subsequent
Events
Subsequent
events
occurring
after
the
date
of
this
report
have
been
evaluated
for
potential
impact
to
this
report
through
the
date
the
report
was
issued.
Management
has
evaluated
the
need
for
additional
disclosures
and/or
adjustments
resulting
from
subsequent
events.
Based
on
this
evaluation,
no
additional
disclosures
or
adjustments
were
required
to
the
financial
statements
as
of
the
date
the
financial
statements
were
issued.
Sound
Shore
Fund,
Inc.
FINANCIAL
HIGHLIGHTS
These
financial
highlights
reflect
selected
data
for
a
share
outstanding
throughout
each
year.
For
the
Year
Ended
December
31,
2024
2023
2022
2021
2020
Investor
Class
Shares
Net
Asset
Value,
Beginning
of
Year
$
39.43
$
35.10
$
41.16
$
42.29
$
42.41
Investment
Operations
Net
investment
income
(a)
0.44
0.33
0.36
0.41
0.30
Net
realized
and
unrealized
gain
(loss)
on
investments
8.50
5.78
(4.75)
9.66
2.90
Total
from
Investment
Operations
8.94
6.11
(4.39)
10.07
3.20
Distributions
from
Net
investment
income
(0.50)
(0.27)
(0.35)
(0.44)
(0.32)
Net
realized
gains
(9.45)
(1.51)
(1.32)
(10.76)
(3.00)
Total
Distributions
(9.95)
(1.78)
(1.67)
(11.20)
(3.32)
Net
Asset
Value,
End
of
Year
$
38.42
$
39.43
$
35.10
$
41.16
$
42.29
Total
Return
22.5
4
%
17.45%
(10.59)%
23.76%
7.78%
Ratios/Supplemental
Data
Net
Assets
at
End
of
Year
(in
thousands)
$533,077
$499,178
$519,227
$671,380
$641,165
Ratios
to
Average
Net
Assets:
Expenses
0.95%
0.96%
0.94%
0.93%
0.93%
Net
Investment
Income
0.97%
0.90%
0.94%
0.85%
0.80%
Portfolio
Turnover
Rate
(b)
77%
69%
72%
44%
77%
(a)
Calculated
based
on
average
shares
outstanding
during
each
year.
(b)
Portfolio
turnover
is
calculated
on
the
basis
of
the
Fund,
as
a
whole,
without
distinguishing
between
the
classes
of
shares
issued.
Sound
Shore
Fund,
Inc.
FINANCIAL
HIGHLIGHTS
(Concluded)
These
financial
highlights
reflect
selected
data
for
a
share
outstanding
throughout
each
year.
For
the
Year
Ended
December
31,
2024
2023
2022
2021
2020
Institutional
Class
Shares
Net
Asset
Value,
Beginning
of
Year
$
39.94
$
35.50
$
41.56
$
42.59
$
42.65
Investment
Operations
Net
investment
income
(a)
0.53
0.41
0.43
0.51
0.37
Net
realized
and
unrealized
gain
(loss)
on
investments
8.63
5.84
(4.78)
9.70
2.93
Total
from
Investment
Operations
9.16
6.25
(4.35)
10.21
3.30
Distributions
from
Net
investment
income
(0.54)
(0.30)
(0.39)
(0.48)
(0.36)
Net
realized
gains
(9.45)
(1.51)
(1.32)
(10.76)
(3.00)
Total
Distributions
(9.99)
(1.81)
(1.71)
(11.24)
(3.36)
Net
Asset
Value,
End
of
Year
$
39.11
$
39.94
$
35.50
$
41.56
$
42.59
Total
Return
22.82%
17.67%
(10.40)%
23.95%
7.98%
Ratios/Supplemental
Data
Net
Assets
at
End
of
Year
(in
thousands)
$465,472
$406,369
$381,109
$575,184
$517,449
Ratios
to
Average
Net
Assets:
Expenses
(gross)
(b)
0.85%
0.86%
0.85%
0.83%
0.84%
Expenses
(net)
0.75%
0.75%
0.75%
0.75%
0.75%
Net
Investment
Income
1.16%
1.11%
1.13%
1.03%
0.98%
Portfolio
Turnover
Rate
(c)
77%
69%
72%
44%
77%
(a)
Calculated
based
on
average
shares
outstanding
during
each
year.
(b)
Reflects
the
expense
ratio
excluding
any
waivers
and/or
reimbursements.
Expense
waivers
and/or
reimbursements
would
decrease
the
total
return
had
such
reductions
not
occurred.
(c)
Portfolio
turnover
is
calculated
on
the
basis
of
the
Fund,
as
a
whole,
without
distinguishing
between
the
classes
of
shares
issued.
REPORT
OF
INDEPENDENT
REGISTERED
PUBLIC
ACCOUNTING
FIRM
To
the
Board
of
Directors
and
the
Shareholders
of
Sound
Shore
Fund,
Inc.
Opinion
on
the
Financial
Statements
We
have
audited
the
accompanying
statement
of
assets
and
liabilities,
including
the
schedule
of
investments,
of
Sound
Shore
Fund,
Inc.
(the
“Fund”)
as
of
December
31,
2024,
the
related
statement
of
operations
for
the
year
then
ended,
and
the
statements
of
changes
in
net
assets
and
the
financial
highlights
for
each
of
the
two
years
in
the
period
then
ended,
and
the
related
notes
(collectively
referred
to
as
the
“financial
statements”).
In
our
opinion,
the
financial
statements
present
fairly,
in
all
material
respects,
the
financial
position
of
the
Fund
as
of
December
31,
2024,
the
results
of
its
operations
for
the
year
then
ended,
and
the
changes
in
net
assets
and
the
financial
highlights
for
each
of
the
two
years
in
the
period
then
ended,
in
conformity
with
accounting
principles
generally
accepted
in
the
United
States
of
America.
The
Fund’s
financial
highlights
for
the
years
ended
December
31,
2022,
and
prior,
were
audited
by
other
auditors
whose
report
dated
February
23,
2023,
expressed
an
unqualified
opinion
on
those
financial
highlights.
Basis
for
Opinion
We
have
audited
the
accompanying
statement
of
assets
and
liabilities,
including
the
schedule
of
investments,
of
Sound
Shore
Fund,
Inc.
(the
“Fund”)
as
of
December
31,
2024,
the
related
statement
of
operations
for
the
year
then
ended,
and
the
statements
of
changes
in
net
assets
and
the
financial
highlights
for
each
of
the
two
years
in
the
period
then
ended,
and
the
related
notes
(collectively
referred
to
as
the
“financial
statements”).
In
our
opinion,
the
financial
statements
present
fairly,
in
all
material
respects,
the
financial
position
of
the
Fund
as
of
December
31,
2024,
the
results
of
its
operations
for
the
year
then
ended,
and
the
changes
in
net
assets
and
the
financial
highlights
for
each
of
the
two
years
in
the
period
then
ended,
in
conformity
with
accounting
principles
generally
accepted
in
the
United
States
of
America.
The
Fund’s
financial
highlights
for
the
years
ended
December
31,
2022,
and
prior,
were
audited
by
other
auditors
whose
report
dated
February
23,
2023,
expressed
an
unqualified
opinion
on
those
financial
highlights.
We
have
served
as
the
Fund’s
auditor
since
2023.
Cohen
&
Company,
Ltd.
Philadelphia,
Pennsylvania
February
21,
2025
Sound
Shore
Fund,
Inc.
IMPORTANT
TAX
INFORMATION
(Unaudited)
December
31,
2024
Federal
Tax
Status
of
Dividends
Declared
during
the
Fiscal
Year
Income
Dividends
-
For
federal
income
tax
purposes,
dividends
from
short-term
capital
gains
are
classified
as
ordinary
income.
The
Fund
paid
ordinary
income
dividends
of
$59,003,941
for
the
tax
year
ended
December
31,
2024.
The
Fund
designated
26.68%
of
its
income
dividend
distributed
as
qualifying
for
the
corporate
dividends
received
deductions
(DRD)
and
31.45%
for
the
qualified
dividend
rate
(QDI)
as
defined
in
Section
1(h)(11)
of
the
Internal
Revenue
Code.
The
Fund
also
designates
0%
of
its
income
dividends
as
qualified
interest
income
(QII)
and
80.99%
as
qualified
short-term
capital
gain
dividends
exempt
from
U.S.
tax
for
foreign
shareholders
(QSD).
Capital
Gain
and
other
distributions
-
The
Fund
paid
long-term
capital
gain
dividends
of
$151,529,407.
Sound
Shore
Fund,
Inc.
OTHER
INFORMATION
(Unaudited)
December
31,
2024
Changes
in
and
Disagreements
with
Accountants
for
Open-End
Management
Investment
Companies
(Item
8
of
Form
N-CSR)
Not
applicable.
Proxy
Disclosures
for
Open-End
Management
Investment
Companies
(Item
9
of
Form
N-CSR)
Not
applicable.
Remuneration
Paid
to
Directors,
Officers,
and
Others
of
Open-End
Management
Investment
Companies
(Item
10
of
Form
N-CSR)
Please
see
financial
statements
in
Item
7(a).
Statement
Regarding
Basis
for
Approval
of
Investment
Advisory
Contract
(Item
11
of
Form
N-CSR)
Not
applicable.
Investment
Adviser
Sound
Shore
Management,
Inc.
Greenwich,
Connecticut
Administrator
Apex
Fund
Services
Portland,
Maine
Distributor
Foreside
Fund
Services,
LLC
Portland,
Maine
www.acaglobal.com
Transfer
and
Distribution
Paying
Agent
Apex
Fund
Services
Portland,
Maine
Custodian
U.S.
Bank,
N.A.
Milwaukee,
Wisconsin
Fund
Counsel
Sullivan
and
Worcester
LLP
New
York,
New
York
Independent
Registered
Public
Accounting
Firm
Cohen
&
Company,
Ltd.
Philadelphia,
Pennsylvania
| (b) | Included as part of financial statements filed under Item 7(a). |
Item 8. Changes in and Disagreements with Accountants for Open-End Management Investment Companies
Not applicable.
Item 9. Proxy Disclosures for Open-End Management Investment Companies
Not applicable.
Item 10. Remuneration Paid to Directors, Officers and Others of Open-End Management Investment Companies.
Included as part of financial statements filed under Item 7(a).
Item 11. Statement Regarding Basis for Approval of Investment Advisory Contract.
Not applicable.
Item 12. Disclosure of Proxy Voting Policies and Procedures for Closed-End Management Investment Companies.
Not applicable.
Item 13. Portfolio Managers of Closed-End Management Investment Companies.
Not applicable.
Item 14. Purchases of Equity Securities by Closed-End Management Investment Company and Affiliated Purchasers.
Not applicable.
Item 15. Submission of Matters to a Vote of Security Holders.
Not applicable.
Item 16. Controls and Procedures.
(a) The Registrant’s principal executive officer and principal financial officer concluded that the registrant’s disclosure controls and procedures (as defined in Rule 30a-3(c) under the Investment Company Act of 1940 (the “Act”)) were effective as of a date within 90 days of the filing date of this report (the “Evaluation Date”) based on their evaluation of the registrant’s disclosure controls and procedures as of the Evaluation Date.
(b) There were no changes in the Registrant’s internal control over financial reporting (as defined in Rule 30a-3(d) under the Act) that occurred during the period covered by this report that have materially affected, or are reasonably likely to materially affect, the Registrant’s internal control over financial reporting.
Item 17. Disclosure of Securities Lending Activities for Closed-End Management Investment Companies
Not applicable.
Item 18. Recovery of Erroneously Awarded Compensation
Not applicable.
Item 19. Exhibits.
(a)(2) Not applicable.
(a)(4) Not applicable.
(a)(5) Not applicable.
SIGNATURES
Pursuant to the requirements of the Securities Exchange Act of 1934 and the Investment Company Act of 1940, the registrant has duly caused this report to be signed on its behalf by the undersigned, thereunto duly authorized.
SOUND SHORE FUND, INC.
| By | /s/ John P. DeGulis | |
| | John P. DeGulis, President | |
| | | |
| Date | February 26, 2025 | |
Pursuant to the requirements of the Securities Exchange Act of 1934 and the Investment Company Act of 1940, this report has been signed below by the following persons on behalf of the registrant and in the capacities and on the dates indicated.
| By | /s/ John P. DeGulis | |
| | John P. DeGulis, President | |
| | | |
| Date | February 26, 2025 | |
| By | /s/ Charles S. Todd | |
| | Charles S. Todd, Treasurer | |
| | | |
| Date | February 26, 2025 | |