 2009 CAGNY Presentation Exhibit 99.2 |
 Safe Harbor Statement Statements in this presentation that are not reported financial results or other historical information are “forward-looking statements” within the meaning of the Private Securities Litigation Reform Act of 1995. Such forward-looking statements are based on current plans, estimates and expectations, and are not guarantees of future performance. They are based on management’s expectations that involve a number of business risks and uncertainties, any of which could cause actual results to differ materially from those expressed in or implied by the forward-looking statements. The Company undertakes no obligation to publicly update or revise any forward-looking statement. The risks and uncertainties relating to the forward-looking statements in this presentation include those described under the caption “Cautionary Factors that May Affect Future Results” in the Company’s Annual Report and its Quarterly Reports on Form 10-Q Reconciliations of non-GAAP measures included in this presentation to the most comparable GAAP measures are available on the Company’s website at www.altria.com |
 Mike Szymanczyk Chairman and Chief Executive Officer Altria Group |
 Agenda Total tobacco platform strategies External tobacco environment Altria and its operating companies business results |
 Altria’s Mission, Strategies and Values Invest in Leadership We will invest in excellent people, leading brands and external stakeholders important to our business success. Align with Society We will actively participate in resolving societal concerns that are relevant to our business. Satisfy Adult Consumers We will convert our deep understanding of adult tobacco consumer needs into better, more creative and more satisfying products. Create Substantial Value for Shareholders We will execute our business plans to create sustainable growth and generate substantial returns for shareholders. Integrity, Trust and Respect Passion to Succeed Executing with Quality Driving Creativity into Everything We Do Sharing with Others Our Mission is to own and develop financially disciplined businesses that are leaders in responsibly providing adult tobacco consumers with superior branded products. |
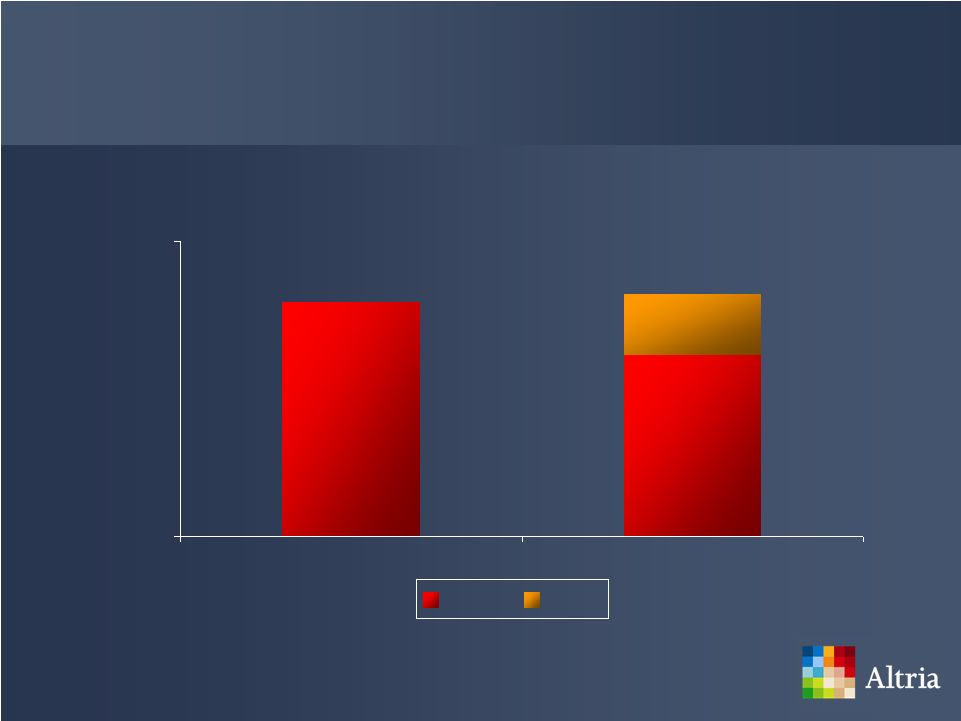
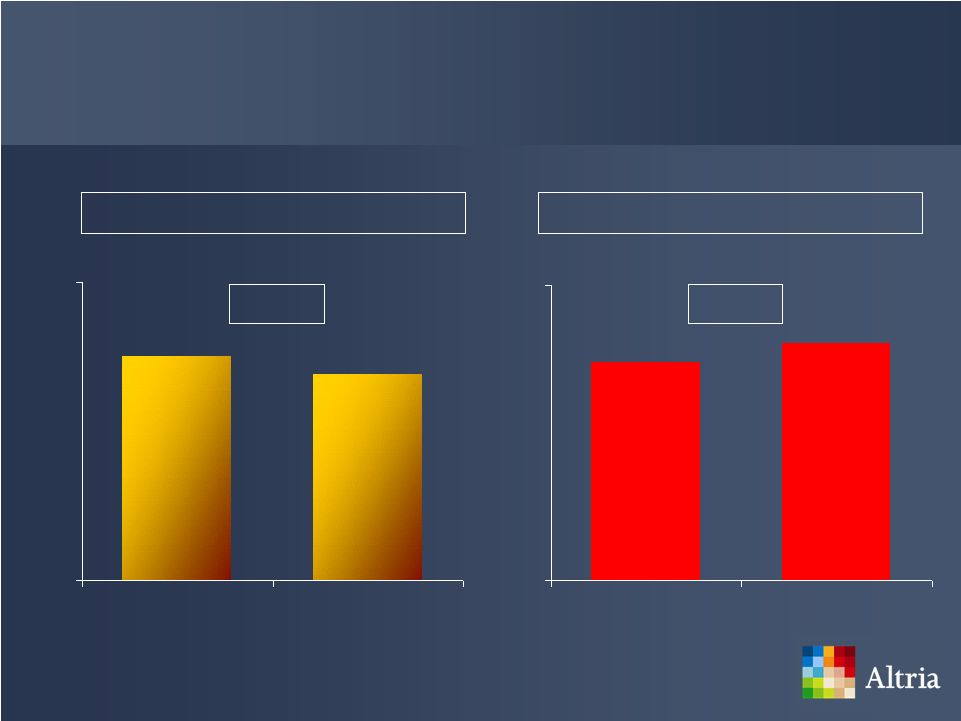
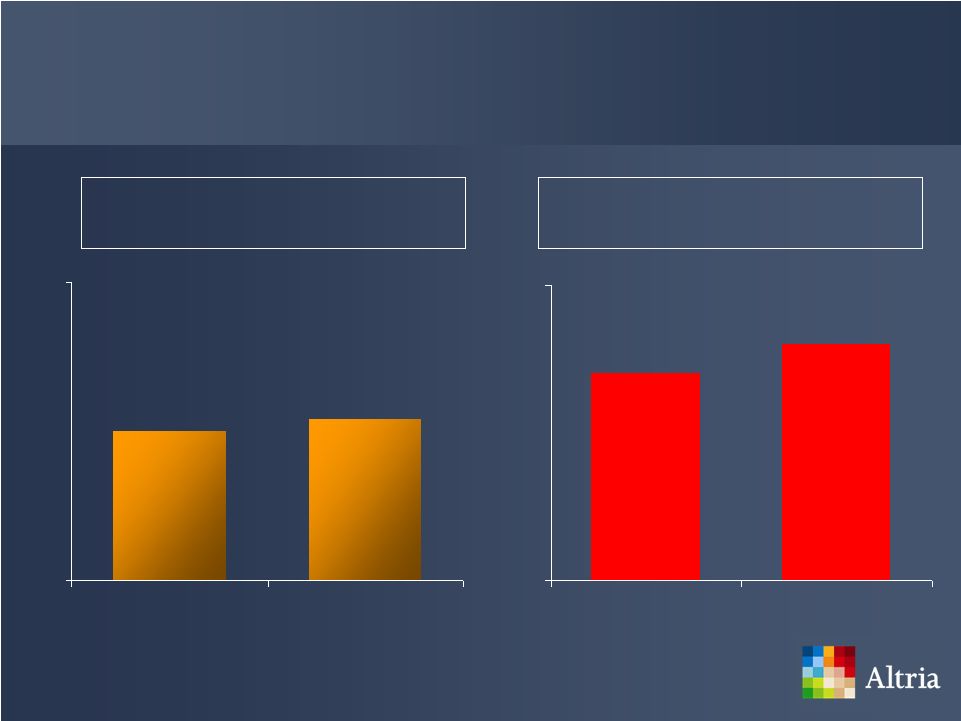 Adult Tobacco Consumers Source: ASPS, ending Q4 2008, US Census Bureau Adult Population Estimates; MICR Internal Estimates Estimated Number of Adult Tobacco Consumers (Millions) Estimated Annual Consumer Tobacco Expenditures (Billions) $80.0 $79.0 $72 $82 2007 2008 60.4 60.0 55 65 2007 2008 |
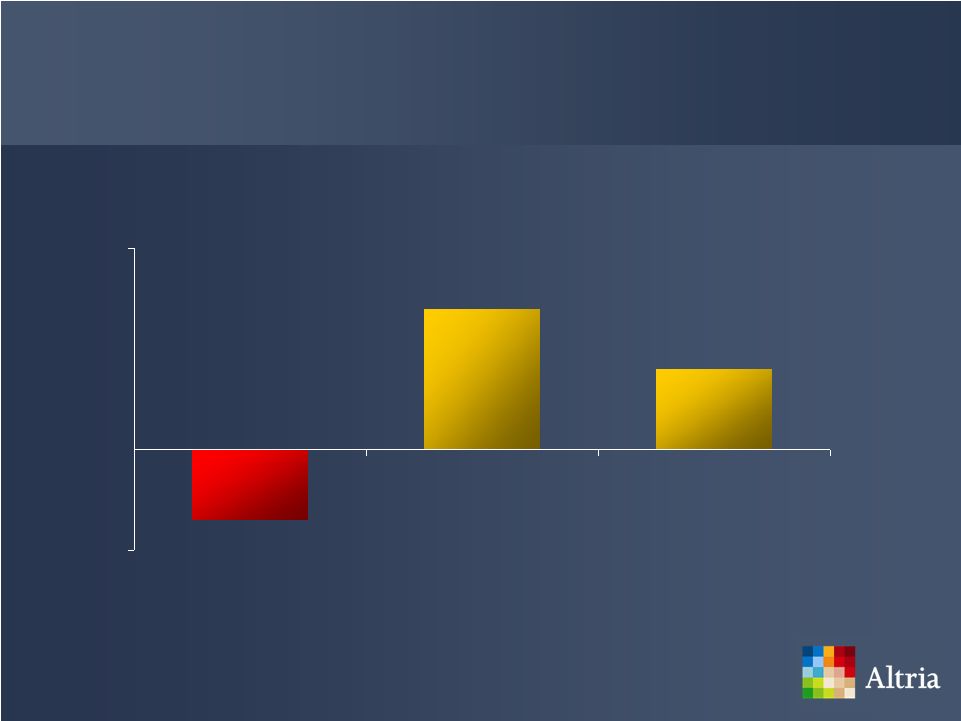 Tobacco Segments’ Volume Performance Source: ALCS MICR Industry Estimates 12/08; TTB all other tobacco segments ~7% ~4% (~4%) -5% 10% Cigarettes MST Machine-Made Large Cigars |
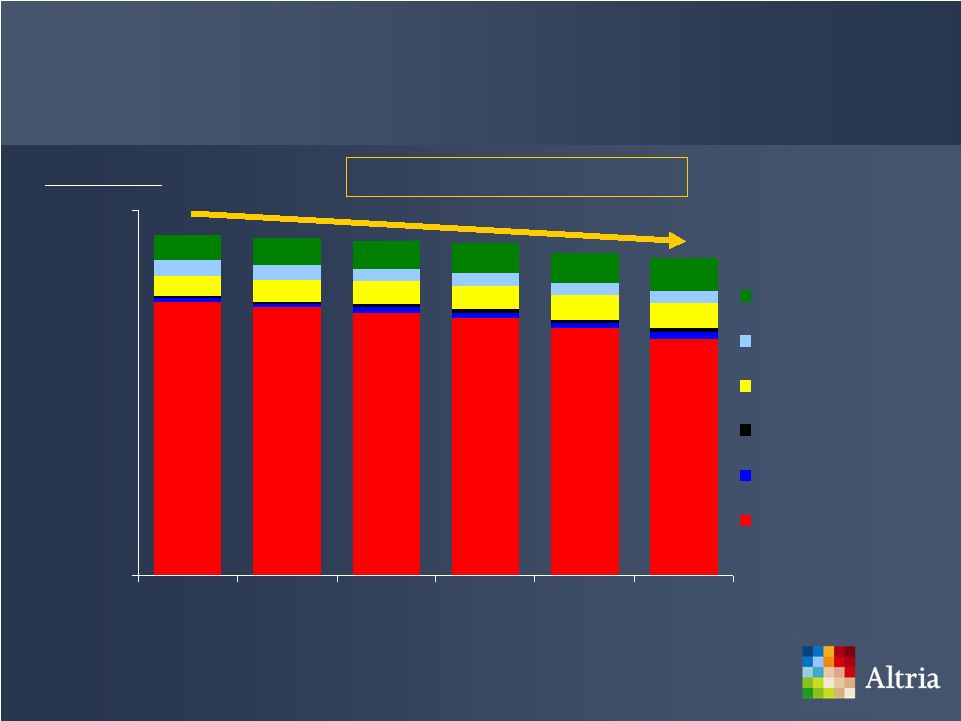 Total Tobacco Volume 5 year CAGR (~1%) 0 1,100 2003 2004 2005 2006 2007 2008 Snuff Chewing Tobacco Large Cigars Small Cigars RYO Cigarettes Source: ALCS MICR Industry Estimates 8/08 for Cigarettes; TTB all other tobacco segments; Cigarettes, Small Cigars & RYO based on 0.0325 oz./stick; 2008 data estimated with TTB data through 10/08 Millions of pounds |
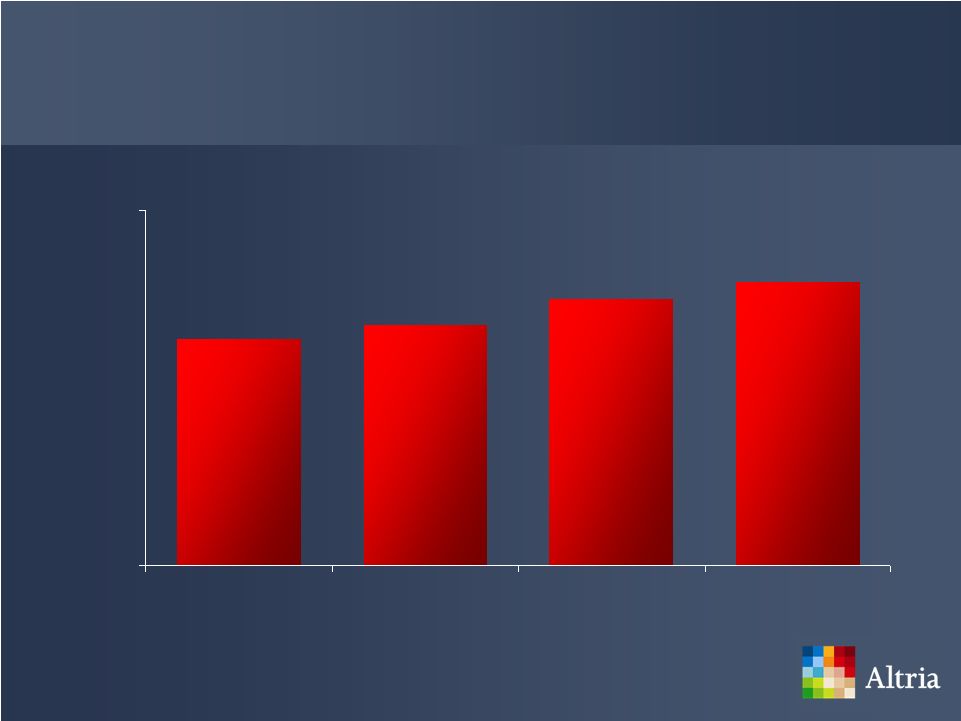 Manufacturer Tobacco Profit Pool Source: Company Reports; ALCS MICR Internal Estimates (Billions) $10.1 $10.4 $11.0 $11.4 $5 $13 2005 2006 2007 2008 |
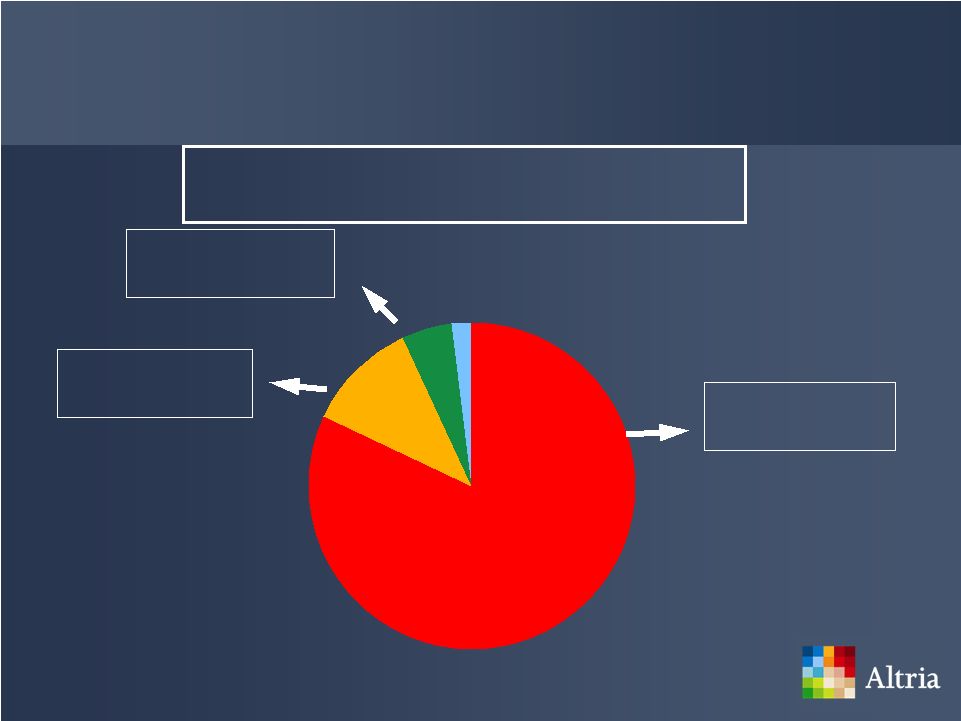 Cigarettes MST Cigars* Other Three Largest Tobacco Categories $70 billion sales ~$9 billion profit $4 billion sales $1.2 billion profit $3.4 billion sales $550 million profit Three categories represent ~95% of the total tobacco manufacturers’ profit pool *Machine-made large cigars Source: TTB Company Reports as of Oct. 2008; IRI/Capstone – Total Retail Panel – Cigarettes; IRI Syndicated – MST & Cigars; ALCS MICR Internal Estimates |
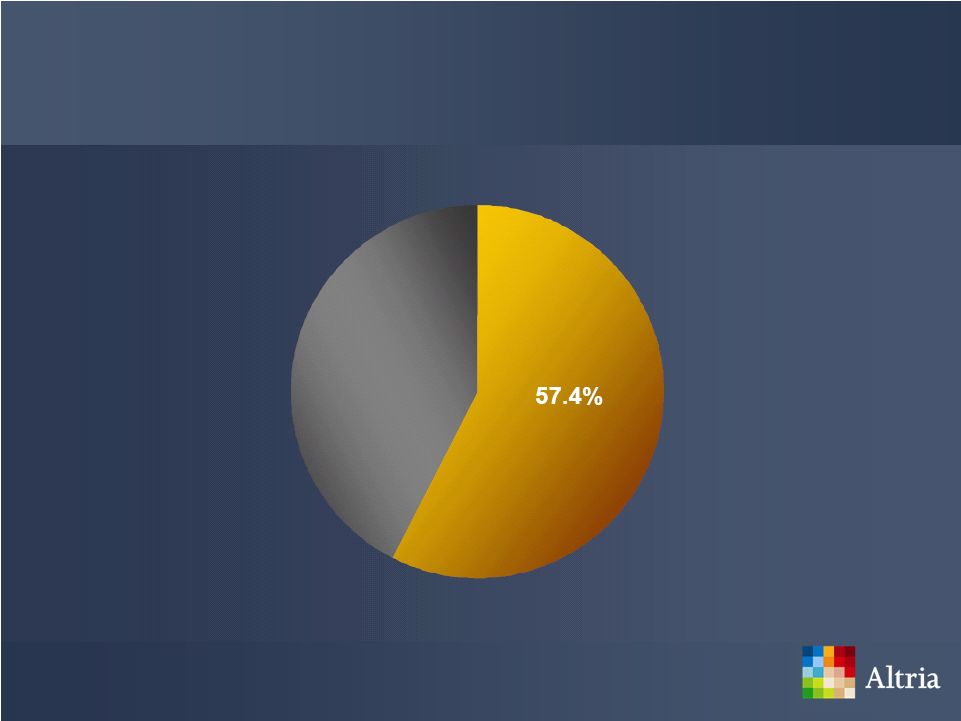
 Note: Profit refers to Manufacturers’ Profit 2008 Share of Tobacco Categories 57.4% 72% 0% 100% Share Profit 56% 50.7% 0% 100% Retail Share Profit 29.1% 33% 0% 100% Retail Share Profit Source: IRI/Capstone – Total Retail Panel; IRI Cigar, USSTC RAD/SVT 12/27/08; MICR Internal Estimates |
 Altria’s Estimated Share of Total Tobacco Profit Pool Retail Share Altria 48% Altria 53% Source: IRI/Capstone – Total Retail Panel; IRI Cigar, USSTC RAD/SVT 12/27/08; Company reports; ALCS MICR Internal Estimates |
 Altria’s Tobacco Category Profitability Altria’s Category Margins Profitability per Adult Tobacco Consumer Source: Company Reports; ALCS-MICR & S&BD Estimates; 2008 annual estimates $0 $350 Marlboro Premium MST 0% 100% Cigars Cigarettes MST |
 Leading Brands - Common Characteristics Sizeable retail share Strong demographic profiles among adult tobacco consumers High brand loyalty sustaining premium pricing |
 |
 Marlboro vs. Competition Source: IRI/Capstone –Database ending 12/27/08 (FY 2008) 41.1% 41.6% Marlboro is larger than the next 17 competitive brands combined 0 45 |
 Black & Mild’s 2008 Share Performance Source: IRI Cigar Database for Food, Drug, Mass Merchandise and Convenience trade classes |
 Taste Aroma Quality Black & Mild Adult Consumer Perceptions *Machine-made large cigars Source: GFK Cigar Category Awareness and Usage Study, February 2009 Black & Mild #1 among leading brands * |
 |
 |
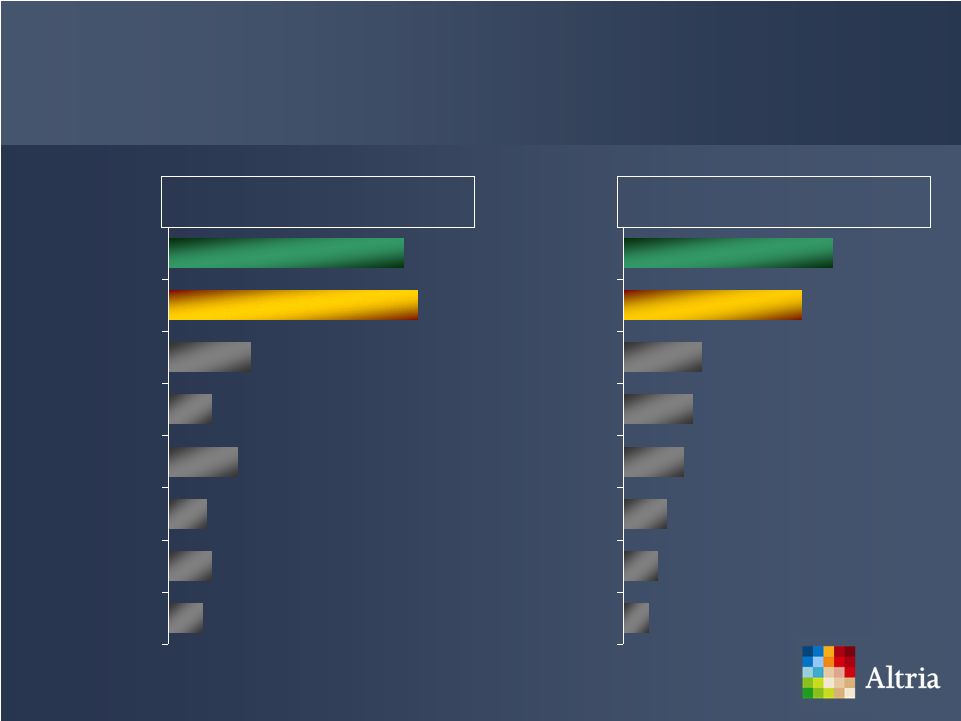 Copenhagen & Skoal Adult Consumer Research Overall Quality Skoal Copenhagen Kodiak Grizzly Red Seal Longhorn Timber Wolf Husky Skoal Copenhagen Kodiak Grizzly Red Seal Longhorn Timber Wolf Husky Source: MST Attitudes and Usage Study (11/2008) – Among 1000 Adult MST users ages 21-54 |
 A Brand’s Value Equation Promotion Promotion Packaging Packaging Price Price Product Product Positioning Positioning |
 Brand Building Infrastructure Sales and distribution system Adult consumer engagement system |
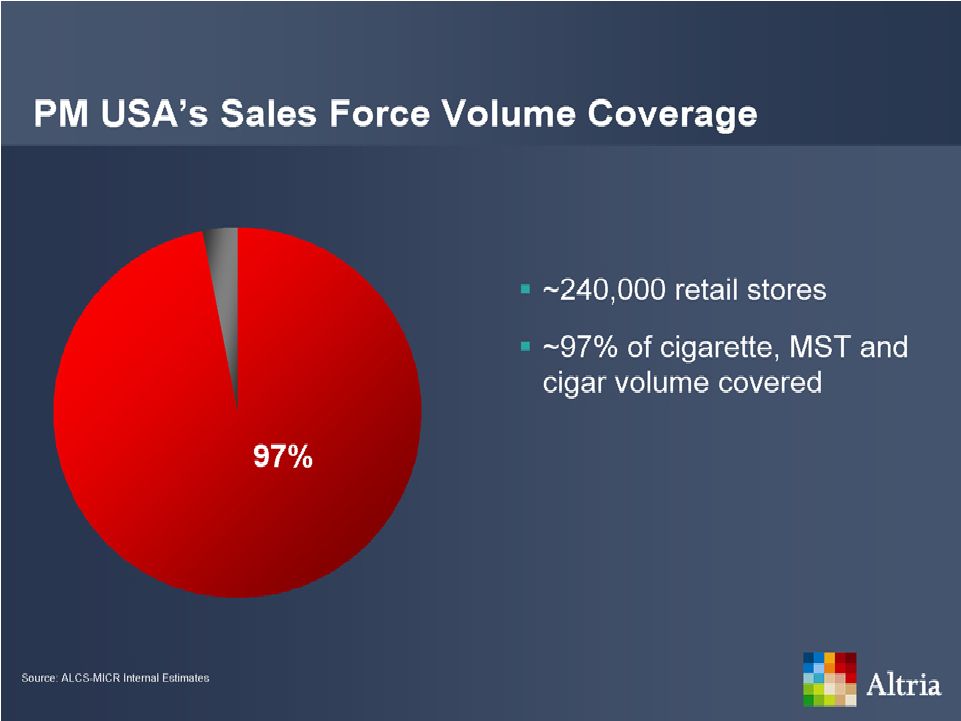
 Sales and Distribution System Distributed through wholesalers and retailers Field Sales Force calls on 240,000 retailers at least once a month |
 |
 Altria’s Cost Management Strategies Leverage key services across operating companies Reduce cigarette related infrastructure ahead of cigarette volume declines |
 Historic Altria Operating Companies |
 Focus on brand management and manufacturing Altria Client Services Altria Sales & Distribution Services Altria Consumer Engagement Services Certain subsidiaries are held by intermediate holding companies. Altria’s Tobacco Operating Companies |
 Altria Client Services Central provider of general and administrative support functions Planning to lower costs and improve effectiveness |
 Altria Sales and Distribution Services Planning to combine PM USA and U.S. Smokeless’ sales organizations Plan for one organization to represent all tobacco products Improved retail execution |
 Leveraged Shared Services Benefits Greater organizational and cost efficiencies Supports additional revenue streams |
 Altria’s Projected Headcount Source: ALCS Internal Estimates Note: UST Inc includes U.S. Smokeless and Ste. Michelle Wine Estates 0 13,000 2008YE 2009E Altria UST |
 Leveraged Services Model Allows the company to sustain sales and marketing infrastructure, and retain talented employees, despite cigarette volume declines Our tobacco businesses should become more competitive |
 Altria’s Cost Management Strategies Leverage key services across operating companies Reduce cigarette related infrastructure ahead of volume declines |
 Altria’s Cost Management Program (Millions) Planned Future Savings 2009 -2011 Source: Altria Q4 & FY 2008 Earnings Release $372 $188 $300 $640 $1,500 $0 $1,500 2007- 2008 Savings Corporate General & Administrative UST Integration Manufacturing Optimization 2007 - 2011 |
 External Tobacco Environment Tobacco Excise Taxes Litigation Environment |
 Excessive Increases in Tobacco Excise Taxes Encourage illegal activity such as smuggling or contraband trade Cost jobs, and harm legitimate retailers and small businesses Unfairly burden adult tobacco consumers while failing to address systemic governmental financing problems |
 Federal Excise Tax Signed bill to increase FET on tobacco products April 1, 2009 Legislation harmonized tax rates on cigarettes, little cigars and roll-your-own Little cigars and roll-your-own tobacco products previously had a significant federal tax advantage over cigarettes |
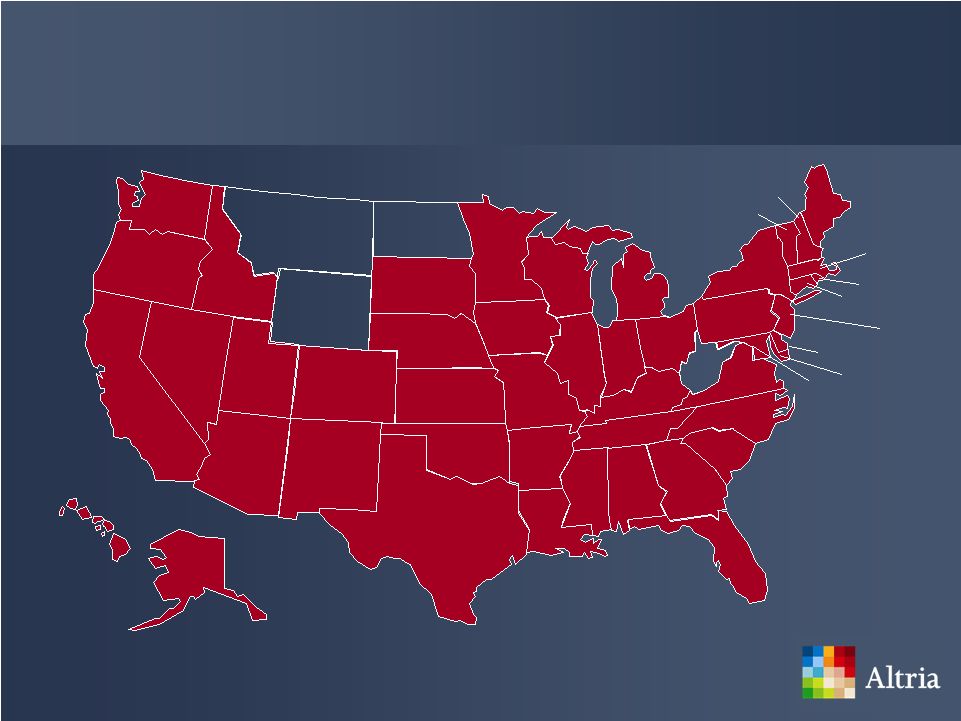 Forty-six States Facing Budget Deficits NJ HI WA ID OK LA AL IL IN OH ME NY CA OR MT IA NM MI UT NE CO KY TN GA MA AZ CT DE FL TX MS MN DC AR ND KS SC MO NC PA AK MD RI VA WV WI WY NV SD VT NH Source: http://www.cbpp.org/9-8-08sfp.htm [Includes states with shortfalls in fiscal 2009 or projected shortfalls for fiscal 2010] |
 State Excise Tax Activity Source: Altria Government Affairs NJ HI WA ID OK LA AL IL IN OH ME VT NY CA OR MT IA NM MI UT NE CO KY TN GA MA AZ NH CT DE FL TX MS MN DC AR ND KS SC MO NC PA AK MD RI VA WV WI WY NV SD Proposed Passed Defeated |
 Altria’s State Legislative Priority Conversion of MST excise taxes from ad valorem to weight- based Consistent with cigarette excise taxes and Federal MST tax methodology |
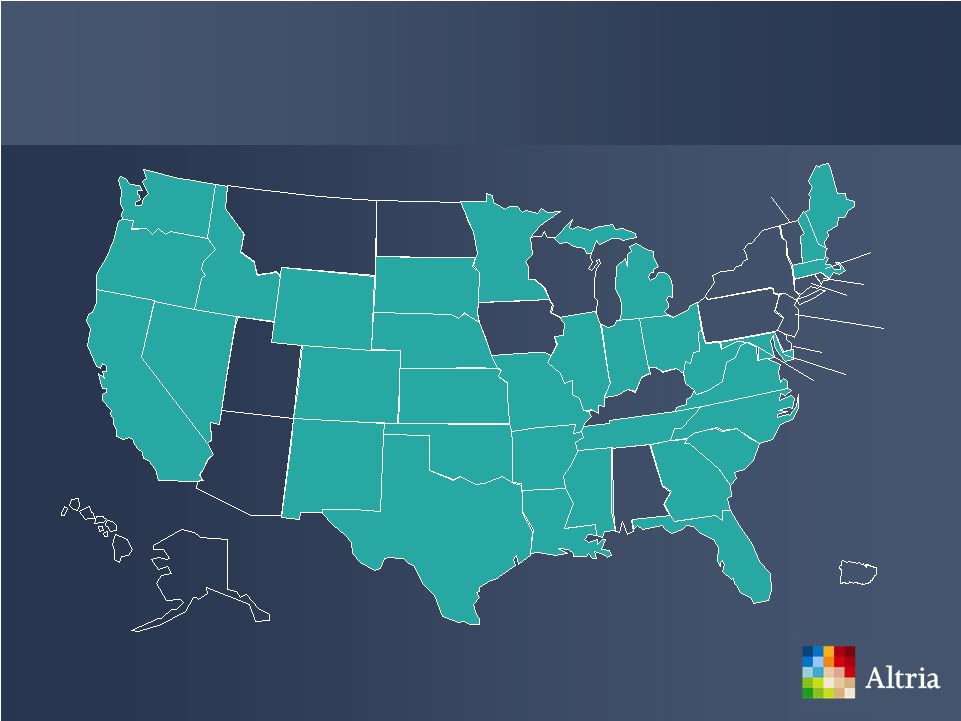 Thirty-five States Using Ad Valorem Taxation Methodology NJ HI WA ID OK LA AL IL IN OH ME VT NY CA OR MT IA NM MI UT NE CO KY TN GA MA AZ NH CT DE FL TX MS MN DC AR ND KS SC MO NC PA AK MD RI VA WV WI WY NV SD PR Source: ALCS Government Affairs |
 Ad Valorem MST Taxation Creates an unfair competitive advantage for discount MST manufacturers Potentially less tax revenue to the state in comparison to the weight-based approach Under our approach, MST cans of equal weight pay equal taxes |
 Altria’s Preparation for Taxation Environment Offering adult tobacco consumers a diverse tobacco product portfolio Optimizing marketing spending Appropriately aligning cost structures |
 Litigation Environment Litigation environment remained manageable in 2008 Sharp downward trend in individual cases – Excludes the Engle progeny cases No case tried to verdict against any U.S. cigarette manufacturer in 2008 |
 Judgments on Appeal: 2003 v. 2008 $84.4 Billion $370 Million Source: ALCS/PM USA Litigation Records (totals exclude interest) 99.6 % Reduction $0 $100 2003 2008 |
 “Lights” Litigation U.S. Supreme Court decided in Good that federal law does not preempt certain state law consumer protection claims Good decision did not address the merits of the litigation State and federal courts have increasingly denied class certification Have won ten cases on the ground that class certification was improper |
 State Certified “Lights” Class Action Cases Source: PM USA Litigation Records MA MO MN Craft Aspinall Curtis |
 Engle Progeny Florida Supreme Court decertified the Engle class but allowed former class members to file individual lawsuits Between 8,000 and 9,000 smokers have filed claims Believe individual suits are manageable Vast majority are stayed or inactive Expect a number to go to trial this year Source: PM USA Litigation Records |
 Litigation Environment Environment remains stable PM USA plans to continue vigorously defending claims |
 Dave Beran Executive Vice President and Chief Financial Officer Altria Group |
 Agenda 2008 business results 2009 strategies Balance sheet Commitment to return cash to shareholders |
 * Adjusted; for reconciliation of non-GAAP to GAAP numbers visit www.altria.com Altria’s 2008 Business Results Net revenues up 3.7% to $19.4 billion Adjusted OCI increased 4.6% to $5.3 billion* Corporate expense and SG&A reductions totaled $239 million Adjusted diluted EPS from continuing operations increased 10% |
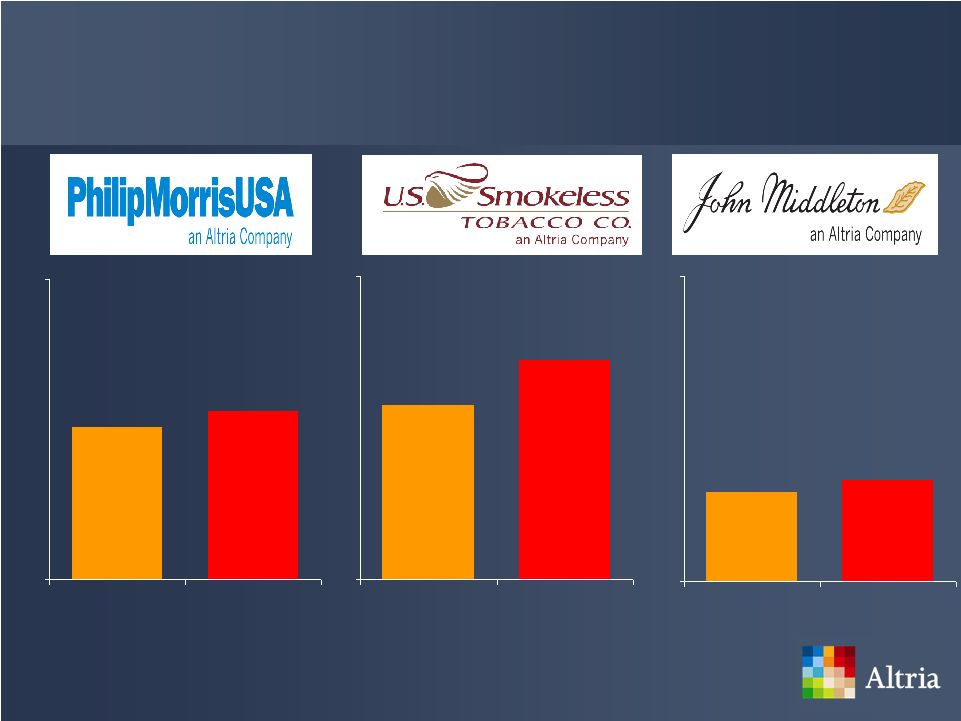
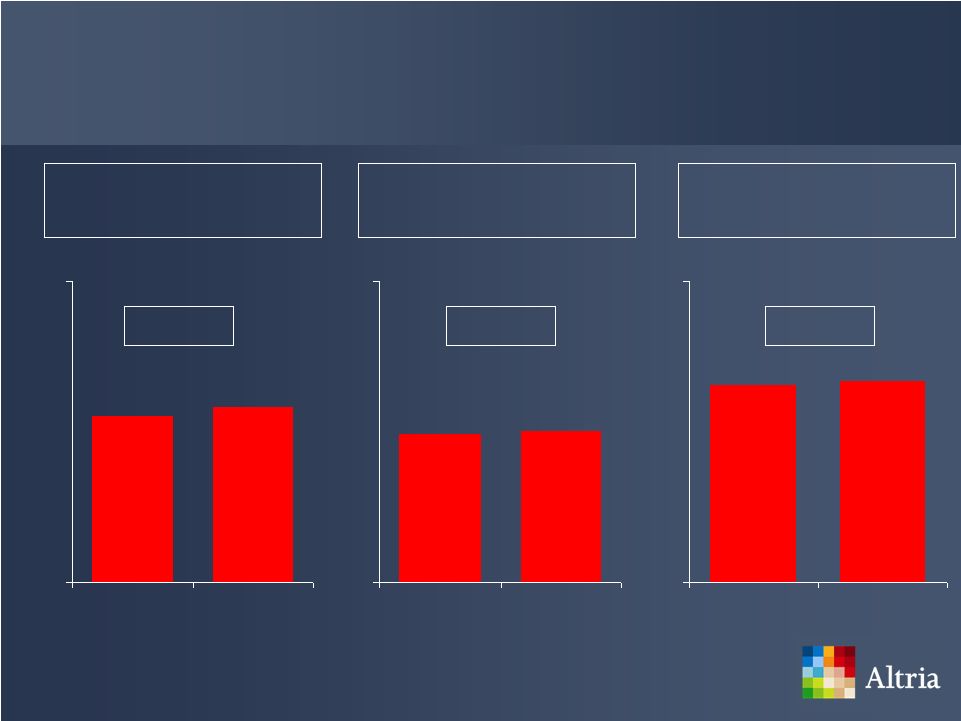 PM USA’s 2008 Business Results Source: Altria Q4 & FY 2008 Earnings Release Net Revenues ($ in Billions) +1.5% Operating Margins* +0.6pp OCI* ($ in Billions) +2.5% $4.9 $5.0 $0.0 $10.0 2007 2008 32.7% 33.3% 0% 50% 2007 2008 $18.5 $18.8 $13.0 $23.0 2007 2008 * Adjusted; for reconciliation of non-GAAP to GAAP numbers visit www.altria.com |
 PM USA’s 2008 Volume Declined 3.2% to 169.4 billion units Estimated to be down ~4% when adjusted for changes in trade inventories and calendar differences Source: Altria Q4 & FY 2008 Earnings Release |
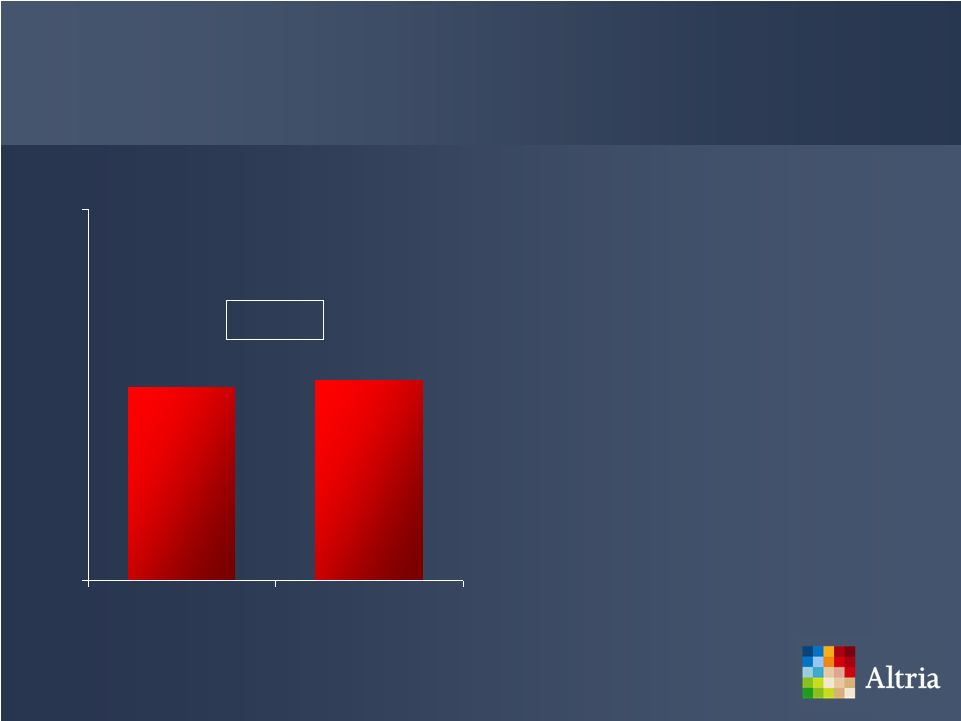 PM USA’s Retail Share Performance +0.1pp 50.6% 50.7% 48% 53% 2007 2008 Source: IRI/Capstone Total Retail Panel |
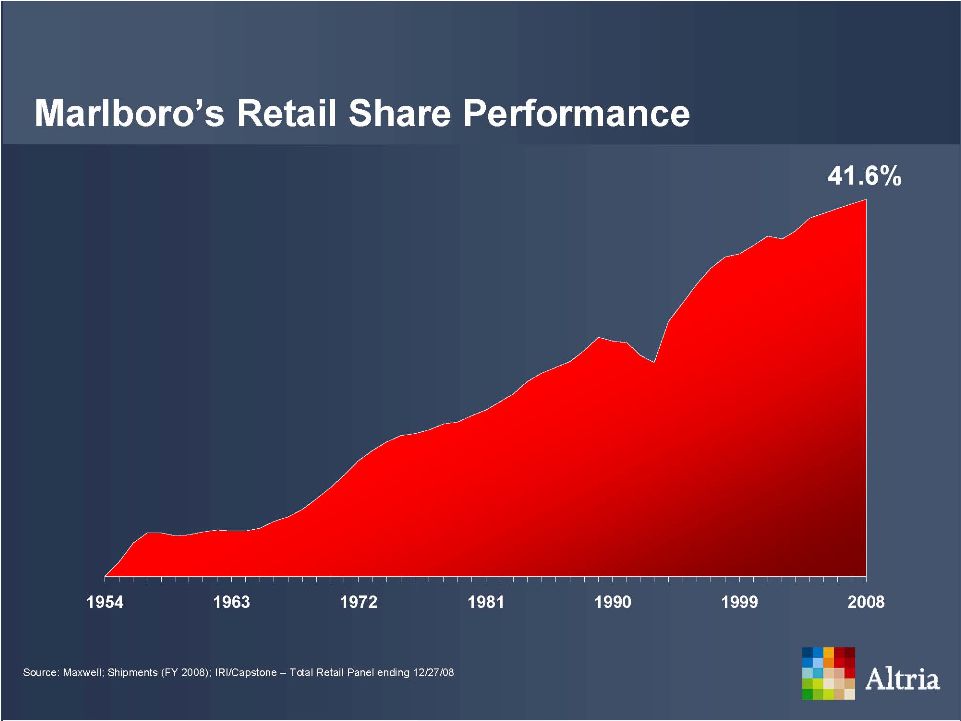
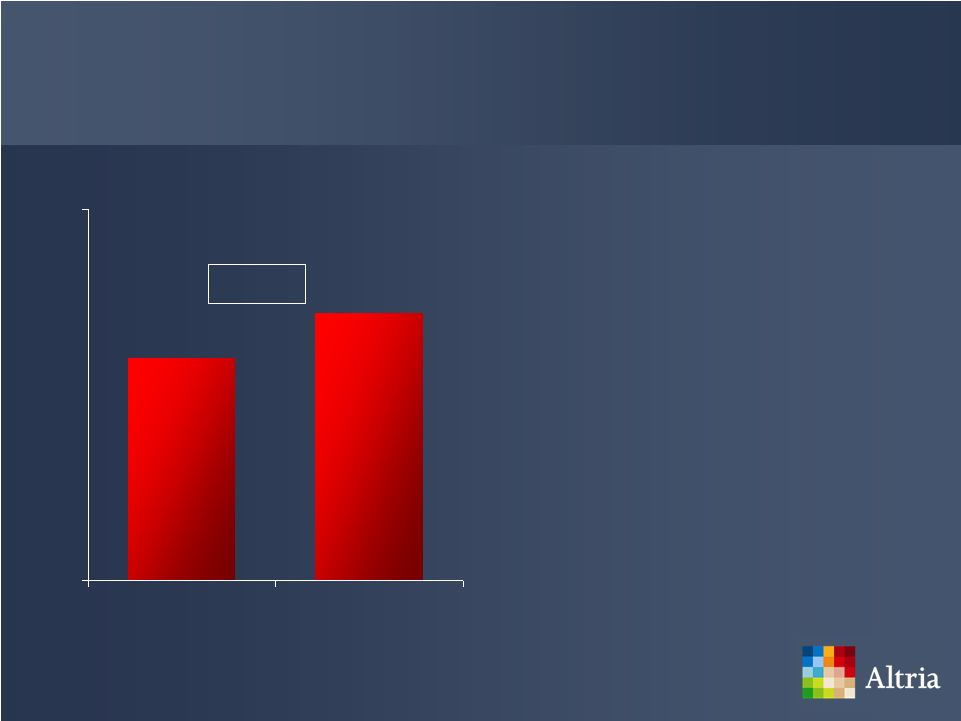 Marlboro’s Retail Share Performance +0.6pp 41.0% 41.6% 38% 43% 2007 2008 Source: IRI/Capstone Total Retail Panel |
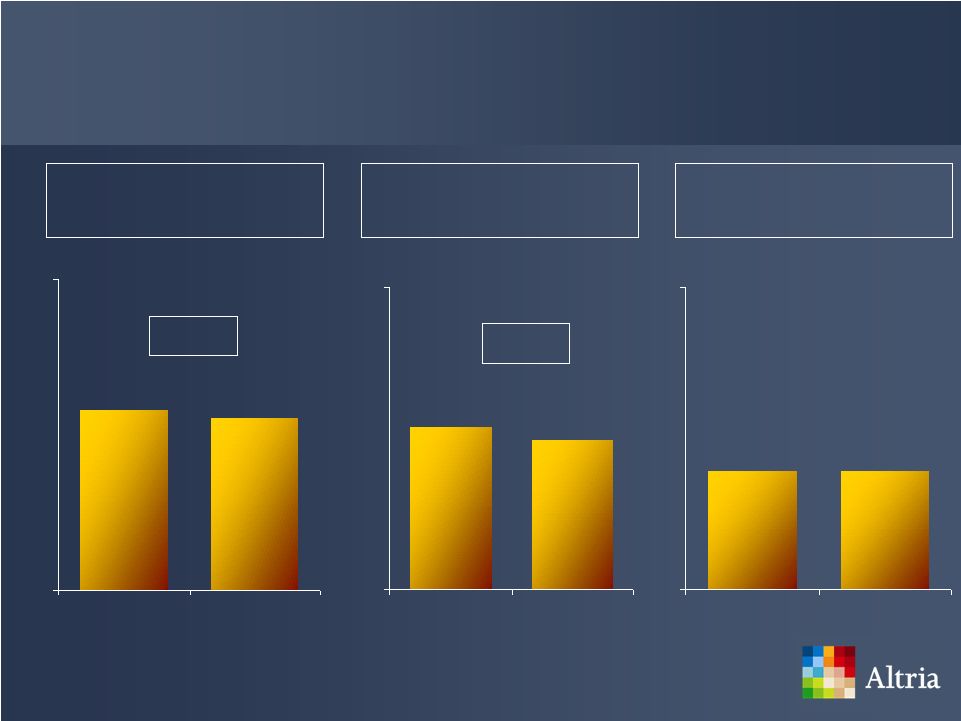
 Non-Menthol Menthol +0.3pp +0.3pp Marlboro’s Retail Share Performance 4.9% 5.2% 2% 6% 2007 2008 36.1% 36.4% 33% 37% 2007 2008 Source: IRI/Capstone - Total Retail Panel |
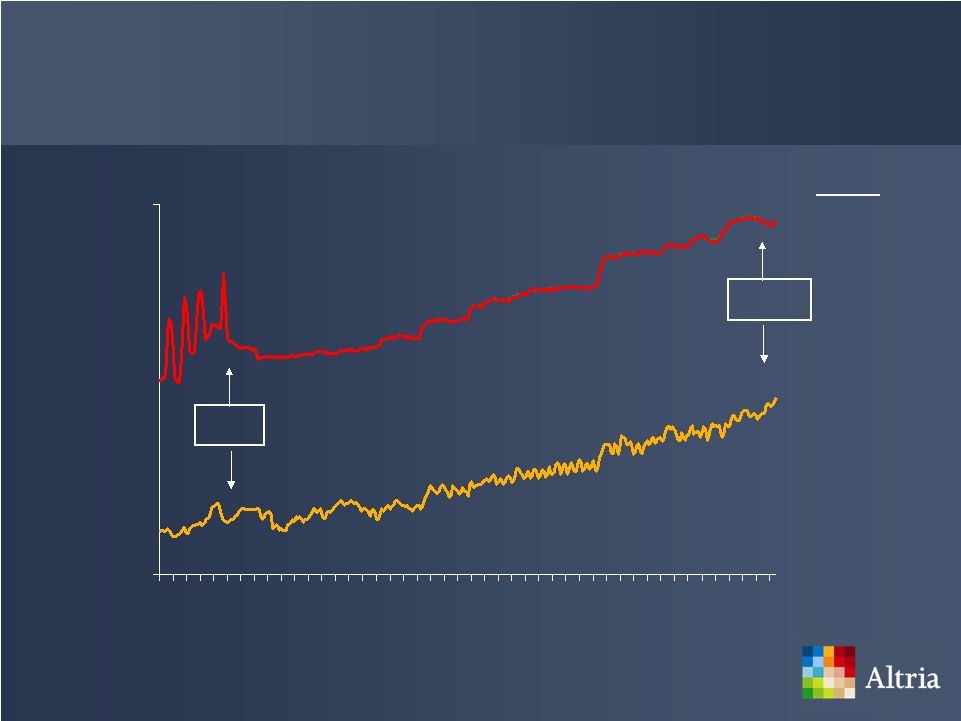 Marlboro’s Price Gap Lowest Effective Marlboro 4Q 08 75% ~40% Note: Marlboro excludes Marlboro 72mm $3.31 $4.39 $3.12 $2.29 $2.00 $4.50 1/5/02 10/4/03 7/2/05 3/31/07 12/27/08 Source: IRI/Capstone Inventory and Price Gap in C-Stores |
 PM USA’s 2009 Strategies Balance overall income and Marlboro’s retail share growth Maximize long-term profitability from portfolio brands Continue reducing costs ahead of volume declines |
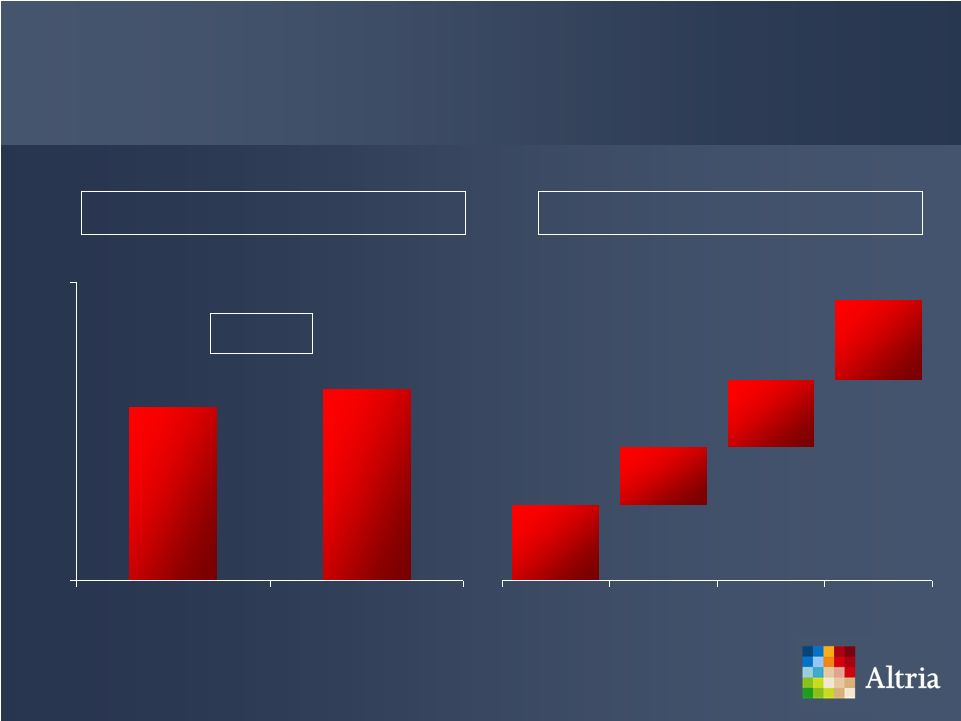
 * Adjusted; For reconciliation of non-GAAP to GAAP numbers visit www.altria.com Source: Q4 & FY 2008 UST Company reports U.S. Smokeless’ 2008 Business Results MST Volume (Cans in Millions) Operating Income* ($ in Millions) -1.5% Net Revenues ($ in Billions) -3.1% $1.50 $1.55 $0.5 $2.3 2007 2008 $861 $848 $700 $1,000 2007 2008 659 659 620 720 2007 2008 |
 U.S. Smokeless’ Volume Performance Premium (Millions) Discount (Millions) -1.1% +6.1% 104 110 30 130 2007 2008 555 549 480 580 2007 2008 Source: Q4 & FY 2008 UST Company reports |
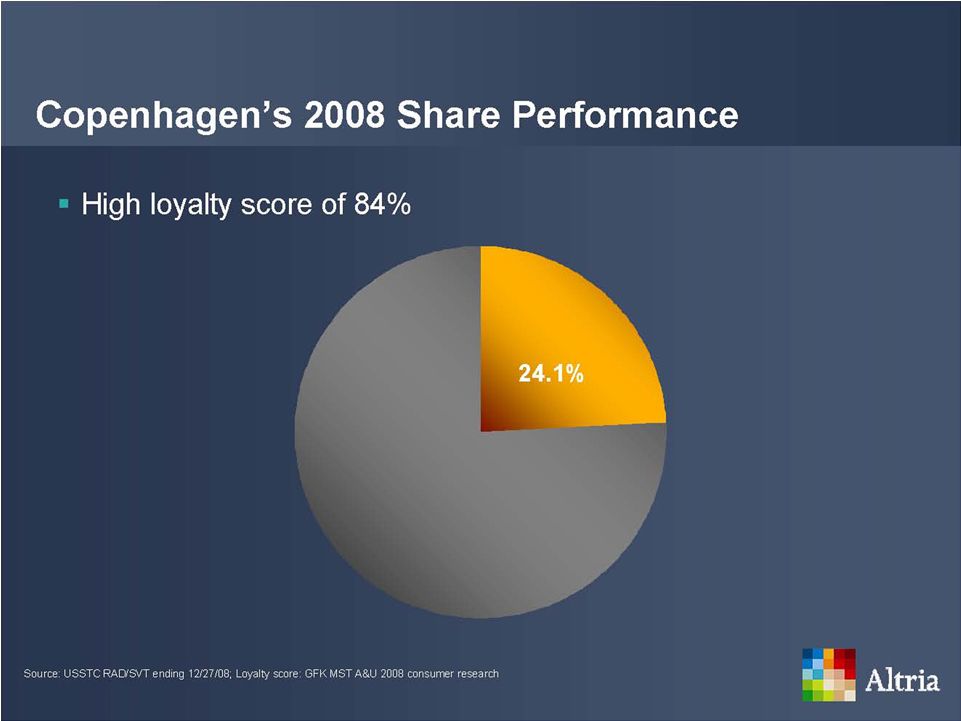
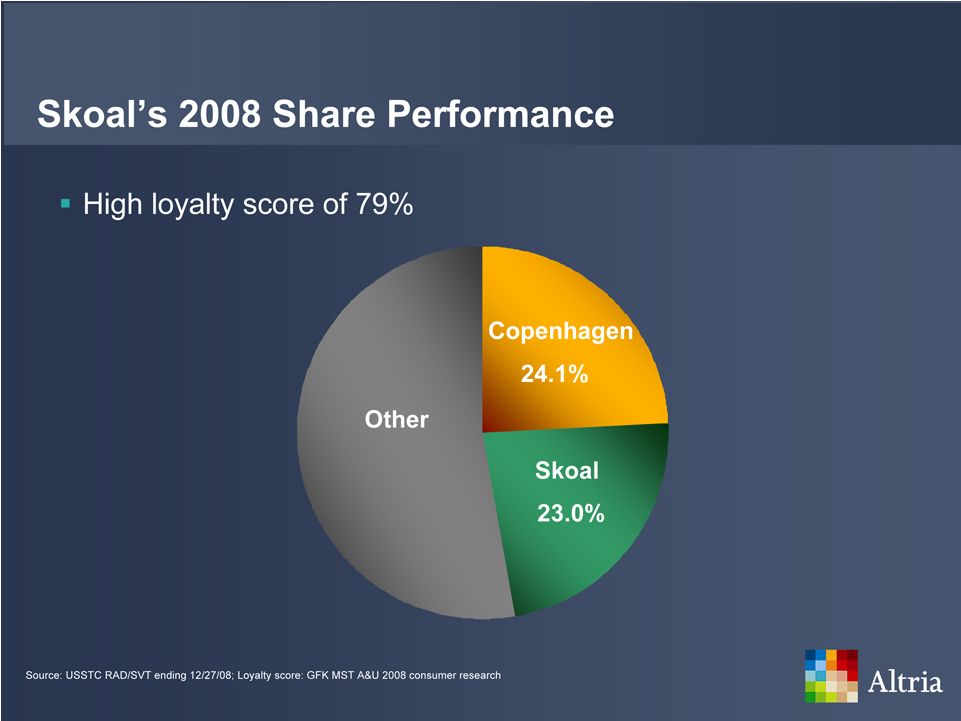
 U.S. Smokeless’ 2008 Share Performance Source: USSTC RAD/SVT ending 12/27/08 |
 U.S. Smokeless’ 2009 Strategies Enhance value equation on Copenhagen and Skoal Complete the integration into the Altria family of companies Realize integration cost savings as quickly as possible |
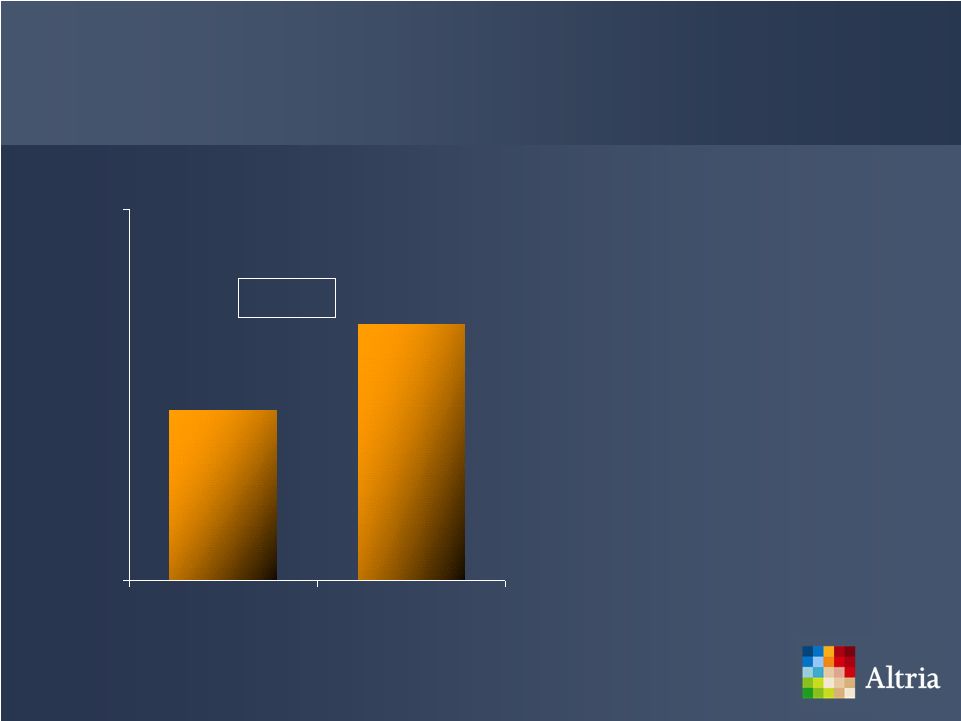
 John Middleton’s 2008 Business Results OCI * ($ in Millions) Volume (in Billions) +6.2% Net Revenues ($ in Millions) $387 $0 $500 2008 1.2 1.3 0.5 2.0 2007 2008 $182 $0 $500 2008 Source: Altria Q4 & FY 2008 Earnings Release * Adjusted; for reconciliation of non-GAAP to GAAP numbers visit www.altria.com |
 Black & Mild’s 2008 Retail Share Performance +2.8pp 25.5% 28.3% 20% 32% 2007 2008 Source: IRI Cigar Database for Food, Drug Mass Merchandise and Convenience trade classes |
 Black & Mild’s 2008 Results Distribution* Source: STARS OTP Distributor Level Database ending 12/27/08; FLR Data through 12/12/08 Visibility 0 75 4/4/2008 12/12/2008 40 100 1Q08 4Q08 *Distribution numbers are for Black & Mild - Original |
 John Middleton’s 2009 Strategies Establishing new retail merchandising platform Building brand equity Accelerating new product introductions |
 * Adjusted; For reconciliation of non-GAAP to GAAP numbers visit www.altria.com Source: Q4 & FY 2008 UST Company reports Ste. Michelle Estates’ 2008 Business Results Operating Income * ($ in Millions) +19.1% Unit Volume (Cases in Millions) +14.9% Net Revenues ($ in Millions) +19.0% $421 $354 $330 $430 2007 2008 5.3 6.1 4.5 6.5 2007 2008 $61 $73 $40 $80 2007 2008 |
 Ste. Michelle Wine Estates’ 2009 Strategies Increase unit volume and margins Expand distribution both domestically and internationally with a focus on top selling products |
 Altria’s Economic Interest in SABMiller plc SABMiller economic interest of 28.5% |
 Altria’s Economic Interest in SABMiller plc Source: Bloomberg [Market values are shown on a pre-tax basis] (Billions) $3.4 $7.1 $0.0 $8.0 2002 Jan-09 |
 SABMiller Investment Benefits Altria Contributing $2.8 billion in equity earnings to Altria since 2002 Paying $1.1 billion in dividends to Altria since 2002 Continuing to be a strong component of our balance sheet Source: Altria company filings |
 Philip Morris Capital Corporation 2008 Operating Companies Income of $71 million Results include a $100 million non-cash allowance for losses Source: Altria Q4 & FY 2008 Earnings Release |
 Philip Morris Capital Corporation’s Portfolio ~74% of portfolio is rated investment grade by Moody’s Investor Services and Standard & Poor’s Net Finance Receivables totaled $5.8 billion at year-end 2008, down from $6.2 billion at year-end 2007 No longer making new investments Source: Altria company filings |
 Altria’s Balance Sheet and Capital Structure Completed financing of the UST acquisition Issued $11.0 billion in long-term notes Weighted average coupon of 9.3% Maturities range from 18 months to 30 years Represents Pro-Forma debt to EBITDA ratio of 2.0 to 1 Source: Altria company reports, reconciliation between GAAP and non-GAAP financial measures. |
 Altria’s Balance Sheet Management Maintain current investment grade credit rating – Access to long-term debt – Access to short-term debt Preserve and protect cash flow to support – Business operations – Dividends – Capital expenditures – Debt service |
 Altria’s Financial Liquidity Historically, in mid-April large cash outflows for tobacco settlement payments, taxes and dividends Supplement liquidity needs with commercial paper Backstopped with a $3.5 billion revolving credit facility |
 Altria’s Dividends Committed to returning a large amount of cash to shareholders in the form of dividends Maintain a targeted dividend payout ratio ~75% of net earnings Note: Payments of future dividends are at the discretion of Altria’s Board of Directors |
 Note: Annualized Dividend Rate Source: Altria company filings Historical Increase Altria’s Dividends 2008 Increase +10.3% $1.16 $1.28 0.0 2.0 Mar-08 Dec-08 9.6% 7.5% 8.7% 10.3% 2005 2006 2007 2008 |
 Altria’s Share Repurchase Program Repurchased $1.2 billion in 2008 Not planning to repurchase shares in 2009 Plan to evaluate share repurchase plan again in first quarter of 2010 Source: Altria company filings |
 Altria’s 2009 Guidance 2009 Guidance reflects the following assumptions: Increased tobacco excise taxes Increased investment spending on smokeless brands Delivering savings in-line with our cost management programs Increased pension expenses No share repurchases 2009 adjusted EPS is expected to increase to $1.70 to $1.75 3% to 6% growth rate* Source: Altria company filings * Adjusted; for reconciliation of non-GAAP to GAAP numbers visit www.altria.com |
 Compelling Investment 2009 EPS growth 3% to 6% Dividend yield ~7.5% Source: Altria company filings |
 Altria’s Competitive Advantages Four strong brands: Marlboro, Copenhagen, Skoal and Black & Mild Superior brand-building infrastructure Financially disciplined with aggressive cost management strategies Strong balance sheet with continuing commitment to return cash to shareholders |
 For full reconciliation, visit www.altria.com/investors Regulation G Disclosure |
 Illustrative EPS for Year Ended December 31, 2007 Altria reported diluted EPS $1.48 Tax Items (0.09) PMCC recoveries from airline industry exposures (0.06) Interest on tax reserve transfers to Kraft 0.02 Asset impairment, exit and 0.15 implementations costs Altria adjusted diluted EPS from continuing operations $1.50 Source: Altria Finance, reconciliation between GAAP and non-GAAP financial measures. |
 Illustrative EPS for Year Ended December 31, 2008 Altria reported diluted EPS $1.48 Tax Items (0.03) Gain on sale of building (0.12) Loss on extinguishment of debt 0.12 SABMiller intangible asset impairments 0.03 Financing fees 0.02 Asset impairment, exit, integration and implementation costs 0.15 Altria adjusted diluted EPS from continuing operations $1.65 Source: Altria Finance, reconciliation between GAAP and non-GAAP financial measures. |
 Illustrative Altria Operating Companies Income for Year Ended December 31, 2007 (dollars in millions) Altria reported operating companies income (OCI) $4,898 Asset impairment and exit costs 344 Implementation costs 27 Recoveries from airline exposure (214) Altria adjusted OCI $5,055 Source: Altria Finance, reconciliation between GAAP and non-GAAP financial measures. |
 Illustrative Altria Operating Companies Income for Year Ended December 31, 2008 (dollars in millions) Altria reported operating companies income (OCI) $5,101 Asset impairment and exit costs 99 Integration costs 18 Implementation costs 69 Altria adjusted OCI $5,287 Source: Altria Finance, reconciliation between GAAP and non-GAAP financial measures. |
 Illustrative PM USA Operating Companies Income for Year Ended December 31, 2007 (dollars in millions) PM USA reported operating companies income (OCI) $4,511 Asset impairment and exit costs 344 Implementation costs 27 Provision for Scott case 26 PM USA Adjusted OCI $4,908 Source: Altria Finance, reconciliation between GAAP and non-GAAP financial measures. |
 Illustrative PM USA Operating Companies Income for Year Ended December 31, 2008 (dollars in millions) PM USA reported operating companies income (OCI) $4,866 Asset impairment and exit costs 97 Implementation costs 69 PM USA adjusted OCI $5,032 Source: Altria Finance, reconciliation between GAAP and non-GAAP financial measures. |
 Illustrative PM USA Operating Margin Year Ended December 31, 2007 (dollars in millions) Adjusted operating companies income $4,908 Net revenues excluding excise taxes and contract volume manufactured for Philip Morris International $15,021 Operating companies income margin 32.7% Source: Altria Finance, reconciliation between GAAP and non-GAAP financial measures. |
 Illustrative PM USA Operating Margin Year Ended December 31, 2008 (dollars in millions) Adjusted operating companies income $5,032 Net revenues excluding excise taxes and contract volume manufactured for Philip Morris International $15,117 Operating companies income margin 33.3% Source: Altria Finance, reconciliation between GAAP and non-GAAP financial measures. |
 Illustrative U.S. Smokeless Operating Profit for Year Ended December 31, 2007 (dollars in millions) U.S. Smokeless reported operating profit $716 Antitrust litigation & restructuring charge 145 U.S. Smokeless adjusted operating profit $861 Source: Altria Finance, reconciliation between GAAP and non-GAAP financial measures. |
 Illustrative U.S. Smokeless Operating Profit for Year Ended December 31, 2008 (dollars in millions) U.S. Smokeless Reported Operating Profit $838 Antitrust litigation & restructuring charge 10 U.S. Smokeless Adjusted Operating Profit $848 Source: Altria Finance, reconciliation between GAAP and non-GAAP financial measures. |
 Illustrative Ste. Michelle Wine Estates Operating Profit for Year Ended December 31, 2008 (dollars in millions) Ste. Michelle Wine Estates Reported Operating Profit $72 Restructuring charges 1 Ste. Michelle Wine Estates Adjusted Operating Profit $73 Source: Altria Finance, reconciliation between GAAP and non-GAAP financial measures. |
 Illustrative John Middleton Operating Companies Income for Year Ended December 31, 2008 (dollars in millions) John Middleton reported operating companies income (OCI) $164 Integration costs 18 John Middleton adjusted OCI $182 Source: Altria Finance, reconciliation between GAAP and non-GAAP financial measures. |
 Illustrative Pro-Forma Altria Total Debt Year Ended December 31, 2008 (dollars in millions) UST Debt $1,140 Current portion of Long-term debt 135 Long-term debt 11,101 Financial services debt 500 Total debt $12,876 Source: Altria Finance, reconciliation between GAAP and non-GAAP financial measures. |
 Illustrative Pro-Forma UST EBITDA Year Ended December 31, 2008 (dollars in millions) UST – Operating income $890 UST – Depreciation & Amortization 53 Pro-Forma Adjustment – Pension 12 UST Pro-Forma EBITDA $955 Source: Altria Finance, reconciliation between GAAP and non-GAAP financial measures. |
 Illustrative Pro-Forma Altria EBITDA Year Ended December 31, 2008 (dollars in millions) Altria consolidated net earnings $4,930 Earnings from discontinued operations, net of income taxes and minority interest (1,840) Equity earnings and minority interest, net (471) Dividends from less than 50% owned affiliates 249 Provision for income taxes 1,699 Depreciation & Amortization 215 Gain on sale of building (404) Loss on early extinguishment of debt 393 Asset impairment and exit costs 449 Interest and other debt expense (income), net 167 Consolidated Earnings before interest, taxes, depreciation and amortization (EBITDA) for Altria $5,387 UST Pro-Forma EBITDA 955 Consolidated EBITDA – Altria and UST $6,342 Source: Altria Finance, reconciliation between GAAP and non-GAAP financial measures. |
 Illustrative Pro-Forma Altria Total Debt to EBITDA Ratio Year Ended December 31, 2008 (dollars in millions) Total debt $12,876 EBITDA $6,342 Debt to EBITDA ratio 2.03 Source: Altria Finance, reconciliation between GAAP and non-GAAP financial measures. |