EXHIBIT 99.1
CONTACT: James E. Adams
Executive Vice President and Chief Financial Officer
423-278-3050
GREEN BANKSHARES REPORTS FIRST QUARTER EARNINGS
GREENEVILLE, Tenn. (April 16, 2009) – Green Bankshares, Inc. (NASDAQ:GRNB), the holding company for GreenBank, today reported financial results for the first quarter ended March 31, 2009. The Company reported net income available to common shareholders of $3,548,000 or $0.27 per diluted share for the quarter, after deducting $1,232,000 in TARP-related costs, compared with net income available to common shareholders of $7,178,000 or $0.56 per diluted share for the first quarter of 2008.
Stan Puckett, Chairman and Chief Executive Officer, stated, "Although net income for the first quarter was below the level reported in the same period last year, reflecting the increasing intensity of the nation's economic recession during the intervening time, we are pleased that the Company returned to profitability in the first quarter. This rebound was made possible in part by our efforts and actions in the fourth quarter of last year to aggressively identify the credit quality challenges in our loan portfolio, which in turn allowed our first quarter loan loss provision to return to a more historical level. During the first quarter, gross charge-offs totaled $3,736,000 and were offset by recoveries of $2,994,000, resulting in a net charge-off ratio for the first quarter of 0.03%. On an annualized basis, the net charge-off ratio was 0.13% compared with 1.63% for the full year 2008. Clearly, we cannot predict the further effects of the current recession or how long it may last, so we remain cautious in our outlook for the year knowing that tougher conditions probably lie ahead."
Puckett noted that the Company continues to focus on capital strength and liquidity. Tangible common equity to tangible assets improved to 5.95% at March 31, 2009, from 5.50% at year-end 2008. At the end of the first quarter of 2009, the Bank's Tier 1 leverage ratio was 11.63%, its Tier 1 risk-based capital ratio was 13.74%, and the Bank's total risk-based capital ratio was 15.00% – all well above the required minimums of 5%, 6% and 10%, respectively, to be deemed a 'well capitalized' institution."
The following information graphically displays the Bank-only loan portfolio breakdown, by purpose code, at March 31, 2009, and does not include overdraft reclassifications:
-MORE-
Green Bankshares, Inc. ▪ 100 North Main Street ▪ Greeneville, TN 37743 ▪ (423) 639-5111
GRNB Reports First Quarter 2009 Results
Page 2
April 16, 2009
Total Loan Portfolio
$2,203
($ in millions)
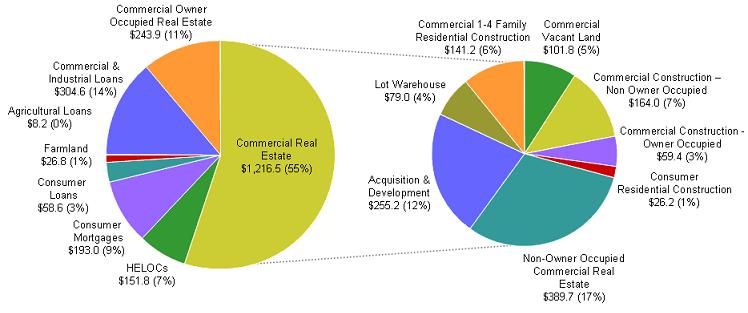
At March 31, 2009, non-performing assets (NPAs) totaled $121,272,000 or 4.34% of total assets compared with $76,806,000 or 2.61% of total assets at December 31, 2008, and $39,354,000 or 1.35% of total assets at March 31, 2008. At March 31, 2009, non-performing loans totaled $104,563,000 and OREO balances were $12,651,000. The increase for the first quarter from the comparable period in 2008 primarily reflected continued weakness in the Company's real estate acquisition and development segment of the loan portfolio, which comprises approximately 12% of the total portfolio and, to a lesser degree, deterioration in the commercial 1-4 family residential construction portfolio, which comprises approximately 6% of the loan portfolio.
The Company's allowance for loan losses totaled $49,054,000 or 2.19% of total loans at March 31, 2009, compared with $48,811,000 or 2.20% of total loans at December 31, 2008, and $33,927,000 or 1.45% of total loans as of March 31, 2008. During the first quarter, the Company's provision for loan losses was $985,000, up from $888,000 for the first quarter of 2008, but down significantly from $32,283,000 in the fourth quarter of 2008.
Net interest income for the first quarter of 2009 totaled $19,429,000, net of interest reversals of almost $519,000, compared with net interest income of $24,472,000 in the same period a year ago. Net interest margin contracted to 3.23% in the current quarter from 3.30% for the fourth quarter of 2008 and 3.86% in the first quarter of 2008, reflecting the combination of significant rate reductions by the Federal Reserve in the second half of 2008, interest reversals and the impact on net interest income of carrying a higher level of average non-accrual loans.
- MORE - -
GRNB Reports First Quarter 2009 Results
Page 3
April 16, 2009
Non-interest income totaled $6,943,000 for the first quarter, down 5% from $7,306,000 in the first quarter of 2008 primarily because of lower mortgage banking and other income. The Company's High Performance Checking program continued to contribute to a high level of non-interest income – 26% of total revenue versus 23% in the year-earlier quarter, adding more than $5.4 million to non-interest income compared with $5.5 million last year.
Non-interest expense totaled $17,831,000 in the first quarter of 2009, down 9% from $19,561,000 in the first quarter last year, reflecting lower personnel expense, reduced advertising expense, and lower equipment expense. Non-interest expense for the first quarter of 2009 included OREO losses of $81,000, down significantly from $4,006,000 in the fourth quarter of 2008 following the Company's efforts then to aggressively liquidate OREO. The efficiency ratio for the first quarter was 67.61% compared with 77.26% for the fourth quarter of 2008 and 61.56% for the first quarter of 2008.
At March 31, 2009, the Company's total assets declined slightly to $2,795,839,000 compared with $2,912,615,000 at March 31, 2008, and were down from $2,944,671,000 at December 31, 2008. Net loans of $2,244,848,000 at March 31, 2009, declined 4% from $2,335,979,000 at March 31, 2008, but were up slightly from $2,223,390,000 at December 31, 2008. Deposits declined slightly to $2,038,520,000 at March 31, 2009, from $2,059,382,000 at March 31, 2008, and were down 7% from $2,184,147,000 as of December 31, 2008.
Greeneville, Tennessee-based Green Bankshares, Inc., with total assets of approximately $2.796 billion, is the holding company for GreenBank. GreenBank, which traces its origin to 1890, has 63 branches across East and Middle Tennessee, and one branch each in Bristol, Virginia, and Hot Springs, North Carolina. It also provides wealth management services through its GreenWealth Division and residential mortgage lending through its Mortgage Division. In addition, GreenBank conducts separate businesses through three wholly owned subsidiaries: Superior Financial Services, Inc., a consumer finance company; GCB Acceptance Corporation, a consumer finance company specializing in automobile lending; and Fairway Title Co., a title insurance company.
Certain matters discussed in this news release are not historical facts but are "forward-looking statements" within the meaning of and are furnished pursuant to the Private Securities Litigation Reform Act of 1995. All forward-looking statements involve risk and uncertainty and actual results could differ materially from the anticipated results or other expectations expressed in the forward-looking statements. Risks and uncertainties related to the Company's business are discussed in the Company's SEC filings, including its Annual Report on Form 10-K for the year ended December 31, 2008, and include, but are not limited to, (1) unanticipated deterioration in the financial condition of borrowers resulting in significant increases in loan losses and provisions for those losses; (2) continued deterioration in the residential real estate market; (3) lack of sustained growth in the economy in the markets that the Company serves; (4) changes in the legislative and regulatory environment; (5) the Company's inability to successfully implement its growth strategy; and (6) the loss of key personnel. The Company undertakes no obligation to update forward-looking statements.
- MORE - -
GRNB Reports First Quarter 2009 Results
Page 4
April 16, 2009
GREEN BANKSHARES, INC.
Unaudited Financial Highlights
(In thousands, except per share amounts)
| Three Months Ended | ||||||||||||
March 31, 2009 | Dec. 31, 2008 | March 31, 2008 | ||||||||||
| Interest income | $ | 35,380 | $ | 39,147 | $ | 46,109 | ||||||
| Interest expense | 15,951 | 18,022 | 21,637 | |||||||||
| Net interest income | 19,429 | 21,125 | 24,472 | |||||||||
| Provision for loan losses | 985 | 32,283 | 888 | |||||||||
| Net interest income (loss) after provision for loan losses | 18,444 | (11,158 | ) | 23,584 | ||||||||
| Non-interest income | 6,943 | 10,186 | 7,306 | |||||||||
| Non-interest expense | 17,831 | 24,192 | 19,561 | |||||||||
| Income (loss) before income taxes | 7,556 | (25,164 | ) | 11,329 | ||||||||
| Income tax (benefit) provision | 2,776 | (9,930 | ) | 4,151 | ||||||||
| Income (loss) | 4,780 | (15,234 | ) | 7,178 | ||||||||
| Preferred stock dividends and related cost | 1,232 | 92 | -- | |||||||||
| Net income (loss) available to common shareholders | $ | 3,548 | $ | (15,326 | ) | $ | 7,178 | |||||
| Comprehensive income (loss) | $ | 5,668 | $ | (16,008 | ) | $ | 9,186 | |||||
| Earnings (loss) per share: | ||||||||||||
Basic | $ | 0.27 | $ | (1.18 | ) | $ | 0.56 | |||||
Diluted | $ | 0.27 | $ | (1.18 | ) | $ | 0.56 | |||||
| Weighted average shares: | ||||||||||||
Basic | 13,063 | 12,936 | 12,931 | |||||||||
Diluted | 13,142 | 12,999 | 12,963 | |||||||||
| Dividends declared per share | $ | 0.13 | $ | 0.13 | $ | 0.13 | ||||||
March 31, 2009 | Dec. 31, 2008 | March 31, 2008 | ||||||||||
| Total assets | $ | 2,795,839 | $ | 2,944,671 | $ | 2,912,615 | ||||||
| Cash and cash equivalents | 77,831 | 198,358 | 57,517 | |||||||||
| Investment and other securities | 206,948 | 217,249 | 245,354 | |||||||||
| Loans, net of unearned interest | 2,244,848 | 2,223,390 | 2,335,979 | |||||||||
| Allowance for loan losses | 49,054 | 48,811 | 33,927 | |||||||||
| Deposits | 2,038,520 | 2,184,147 | 2,059,382 | |||||||||
| Shareholders' equity | 384,474 | 381,231 | 330,165 | |||||||||
Common shareholders' equity 1 | 312,196 | 308,951 | 330,165 | |||||||||
Tangible common shareholders' equity 2 | 157,526 | 153,477 | 172,993 | |||||||||
Common book value per share 1 | 23.69 | 23.56 | 25.40 | |||||||||
Tangible common book value per share 2 | 11.95 | 11.70 | 13.31 | |||||||||
1 Common shareholders' equity is shareholders' equity less preferred stock of $72,278.
2 Tangible common shareholders' equity is shareholders' equity less goodwill, intangible assets and preferred stock of $72,278.
- END - -
| GREEN BANKSHARES, INC. | ||||||||||||
| Consolidated Balance Sheets | ||||||||||||
| March 31, 2009, December 31, 2008 and March 31, 2008 | ||||||||||||
| (Dollars in thousands) | ||||||||||||
| (Unaudited) | (Unaudited) | |||||||||||
| March 31, | December 31, | March 31, | ||||||||||
| 2009 | 2008* | 2008 | ||||||||||
| ASSETS | ||||||||||||
| Cash and due from banks | $ | 71,804 | $ | 193,095 | 57,517 | |||||||
| Federal funds sold | 6,027 | 5,263 | - | |||||||||
| Cash and cash equivalents | 77,831 | 198,358 | 57,517 | |||||||||
| Securities available-for-sale ("AFS") | 193,271 | 203,562 | 231,349 | |||||||||
| Securities held-to-maturity (with a market value of $595, $601 and $1,084 | ||||||||||||
| on March 31, 2009, December 31, 2008 and March 31, 2008) | 647 | 657 | 1,118 | |||||||||
| FHLB and other stock, at cost | 13,030 | 13,030 | 12,887 | |||||||||
| Loans held for sale | 595 | 442 | 2,350 | |||||||||
| Loans, net of unearned income | 2,244,848 | 2,223,390 | 2,335,979 | |||||||||
| Allowance for loan losses | (49,054 | ) | (48,811 | ) | (33,927 | ) | ||||||
| Other real estate owned and repossessed assets | 12,651 | 45,371 | 9,252 | |||||||||
| Bank premises and equipment, net | 84,639 | 83,359 | 82,685 | |||||||||
| Cash surrender value of life insurance | 29,844 | 29,539 | 28,728 | |||||||||
| Goodwill | 143,389 | 143,389 | 143,140 | |||||||||
| Core deposit and other intangibles | 11,281 | 12,085 | 14,032 | |||||||||
| Other assets | 32,867 | 40,300 | 27,505 | |||||||||
| Total assets | $ | 2,795,839 | $ | 2,944,671 | 2,912,615 | |||||||
| LIABILITIES AND SHAREHOLDERS' EQUITY | ||||||||||||
| Noninterest-bearing deposits | $ | 168,178 | $ | 176,685 | 192,093 | |||||||
| Interest-bearing deposits | 1,707,625 | 1,649,744 | 1,665,777 | |||||||||
| Brokered deposits | 162,717 | 357,718 | 201,512 | |||||||||
| Total deposits | 2,038,520 | 2,184,147 | 2,059,382 | |||||||||
| Federal funds purchased | - | - | 39,839 | |||||||||
| Repurchase agreements | 31,018 | 35,302 | 92,957 | |||||||||
| FHLB advances and notes payable | 229,252 | 229,349 | 272,342 | |||||||||
| Subordinated debentures | 88,662 | 88,662 | 88,662 | |||||||||
| Accrued interest payable and other liabilities | 23,913 | 25,980 | 29,268 | |||||||||
| Total liabilities | 2,411,365 | 2,563,440 | 2,582,450 | |||||||||
| SHAREHOLDERS' EQUITY | ||||||||||||
| Preferred stock: no par value, 1,000,000 shares authorized; | ||||||||||||
| 72,278, 72,278 and -0- shares outstanding | 65,694 | 65,346 | - | |||||||||
| Common stock: $2 par value, 20,000,000 shares authorized; | ||||||||||||
| 13,176,681, 13,112,687 and 13,000,987 shares outstanding | 26,353 | 26,225 | 26,002 | |||||||||
| Common stock warrants | 6,934 | 6,934 | - | |||||||||
| Additional paid in capital | 187,783 | 187,742 | 185,222 | |||||||||
| Retained earnings | 97,485 | 95,647 | 115,426 | |||||||||
| Accumulated other comprehensive income (loss) | 225 | (663 | ) | 3,515 | ||||||||
| Total shareholders' equity | 384,474 | 381,231 | 330,165 | |||||||||
| Total liabilities & shareholders' equity | $ | 2,795,839 | $ | 2,944,671 | 2,912,615 | |||||||
| * Derived from Audited Consolidated Financial Statements. | ||||||||||||
| GREEN BANKSHARES, INC. | ||||||||||||
| Consolidated Statements of Income and Comprehensive Income | ||||||||||||
| Three Months Ended March 31, 2009, December 31, 2008 and March 31, 2008 | ||||||||||||
| (Unaudited) | ||||||||||||
| (Dollars in thousands except share and per share data) | ||||||||||||
| Three Months Ended | ||||||||||||
| March 31, | December 31, | March 31, | ||||||||||
| 2009 | 2008 | 2008 | ||||||||||
| Interest income: | ||||||||||||
| Interest and fees on loans | $ | 32,645 | $ | 34,974 | $ | 42,749 | ||||||
| Taxable securities | 2,220 | 3,636 | 2,863 | |||||||||
| Nontaxable securities | 320 | 320 | 333 | |||||||||
| FHLB and other stock | 150 | 154 | 160 | |||||||||
| Federal funds sold and other | 45 | 63 | 4 | |||||||||
| Total interest income | 35,380 | 39,147 | 46,109 | |||||||||
| Interest expense: | ||||||||||||
| Deposits | 12,653 | 14,433 | 15,935 | |||||||||
| Federal funds purchased and repurchase agreements | 9 | 57 | 1,092 | |||||||||
| FHLB advances and notes payable | 2,443 | 2,467 | 3,178 | |||||||||
| Subordinated debentures | 846 | 1,065 | 1,432 | |||||||||
| Total interest expense | 15,951 | 18,022 | 21,637 | |||||||||
| Net interest income | 19,429 | 21,125 | 24,472 | |||||||||
| Provision for loan losses | 985 | 32,283 | 888 | |||||||||
| Net interest income (loss) after provision for loan losses | 18,444 | (11,158 | ) | 23,584 | ||||||||
| Noninterest income: | ||||||||||||
| Service charges on deposit accounts | 5,356 | 5,651 | 5,467 | |||||||||
| Other charges and fees | 449 | 681 | 504 | |||||||||
| Trust and investment services income | 388 | 480 | 286 | |||||||||
| Mortgage banking income | 55 | 115 | 257 | |||||||||
| Net gain on the sale of securities | - | 2,589 | - | |||||||||
| Other income | 695 | 670 | 792 | |||||||||
| Total noninterest income | 6,943 | 10,186 | 7,306 | |||||||||
| Noninterest expense: | ||||||||||||
| Employee compensation | 7,692 | 7,995 | 8,590 | |||||||||
| Employee benefits | 1,295 | 1,145 | 1,259 | |||||||||
| Occupancy expense | 1,787 | 1,790 | 1,715 | |||||||||
| Equipment expense | 742 | 989 | 1,102 | |||||||||
| Computer hardware/software expense | 637 | 686 | 632 | |||||||||
| Professional services | 529 | 641 | 454 | |||||||||
| Advertising | 64 | 1,140 | 874 | |||||||||
| Loss on OREO and repossessed assets | 81 | 4,006 | 14 | |||||||||
| Core deposit and other intangible amortization | 804 | 644 | 654 | |||||||||
| Other expenses | 4,200 | 5,156 | 4,267 | |||||||||
| Total noninterest expense | 17,831 | 24,192 | 19,561 | |||||||||
| Income (loss) before income taxes | 7,556 | (25,164 | ) | 11,329 | ||||||||
| Income taxes provision (benefit) | 2,776 | (9,930 | ) | 4,151 | ||||||||
| Net income (loss) | 4,780 | (15,234 | ) | 7,178 | ||||||||
| Preferred stock dividends and accretion of discount on warrants | 1,232 | 92 | - | |||||||||
| Net income (loss) available to common shareholders | $ | 3,548 | $ | (15,326 | ) | $ | 7,178 | |||||
| Comprehensive income | $ | 5,668 | $ | (16,008 | ) | $ | 9,186 | |||||
| Per share of common stock: | ||||||||||||
| Basic earnings | $ | 0.27 | $ | (1.18 | ) | $ | 0.56 | |||||
| Diluted earnings | $ | 0.27 | $ | (1.18 | ) | $ | 0.56 | |||||
| Dividends | $ | 0.13 | $ | 0.13 | $ | 0.13 | ||||||
| Weighted average shares outstanding: | ||||||||||||
| Basic | 13,062,881 | 12,935,665 | 12,931,169 | |||||||||
| Diluted | 13,141,840 | 12,998,685 | 12,963,487 | |||||||||
| GREEN BANKSHARES, INC. |
| Consolidated Financial Highlights |
| (UNAUDITED) |
| (Dollars in thousands except share and per share data) |
| March 31, | December 31, | % | ||||||||||
| 2009 | 2008 | Change | ||||||||||
| Financial Condition Data: | ||||||||||||
| Assets | $ | 2,795,839 | $ | 2,944,671 | -5.05 | % | ||||||
| Loans, net of unearned interest | 2,244,848 | 2,223,390 | 0.97 | % | ||||||||
| Cash and investments | 284,779 | 415,607 | -31.48 | % | ||||||||
| Federal funds sold | 6,027 | 5,263 | 14.52 | % | ||||||||
| Deposits | 2,038,520 | 2,184,147 | -6.67 | % | ||||||||
| FHLB advances and notes payable | 229,252 | 229,349 | -0.04 | % | ||||||||
| Subordinated debentures | 88,662 | 88,662 | 0.00 | % | ||||||||
| Repurchase agreements | 31,018 | 35,302 | -12.14 | % | ||||||||
| Shareholders' equity | 384,474 | 381,231 | 0.85 | % | ||||||||
| Common shareholders' equity (1) | 312,196 | 308,953 | 1.05 | % | ||||||||
| Tangible common shareholders' equity (2) | 157,526 | 153,479 | 2.64 | % | ||||||||
| Tangible shareholders' equity (3) | 229,804 | 225,757 | 1.79 | % | ||||||||
| Ratios: | ||||||||||||
| Common book value per share (1) | $ | 23.69 | $ | 23.56 | 0.55 | % | ||||||
| Tangible common book value per share (2) | 1195.00 | % | 1170.00 | % | 2.14 | % | ||||||
| Total tangible equity to tangible assets (3)(4) | 8.70 | % | 8.09 | % | 7.50 | % | ||||||
| Tangible common equity to tangible assets (2)(4) | 5.95 | % | 5.50 | % | 8.15 | % | ||||||
| Average equity to average assets | 13.52 | % | 11.24 | % | 20.28 | % | ||||||
| Dividend payout ratio | 48.15 | % | 123.81 | % | N/A | |||||||
| (1) Common shareholders' equity is shareholders' equity less preferred stock of $72,278. | ||||||||||||
| (2) Tangible common shareholders' equity is shareholders' equity less goodwill, intangible assets and preferred stock of $72,278. | ||||||||||||
| (3) Tangible shareholders' equity is shareholders' equity less goodwill and intangible assets. | ||||||||||||
| (4) Tangible assets is total assets less goodwill and intangible assets. | ||||||||||||
| Three Months Ended | ||||||||
| March 31, | ||||||||
| 2009 | 2008 | % Change | ||||||
| Operating Data: | ||||||||
| Total Interest Income | $ | 35,380 | $ | 46,109 | -23.27% | |||
| Total Interest Expense | 15,951 | 21,637 | -26.28% | |||||
| Net Interest Income | 19,429 | 24,472 | -20.61% | |||||
| Provision for Loan Losses | 985 | 888 | 10.92% | |||||
| Net Interest Income After Provision for Loan Losses | 18,444 | 23,584 | -21.79% | |||||
| Non-Interest Income | 6,943 | 7,306 | -4.97% | |||||
| Non-Interest Expense | 17,831 | 19,561 | -8.84% | |||||
| Income Before Income Taxes | 7,556 | 11,329 | -33.30% | |||||
| Income Tax Expense | 2,776 | 4,151 | -33.12% | |||||
| Net income | 4,780 | 7,178 | -33.41% | |||||
| Preferred stock dividend and accretion of discount on warrants | 1,232 | 0 | 100.00% | |||||
| Net income available to common shareholders | $ | 3,548 | $ | 7,178 | -50.57% | |||
| Comprehensive Income | $ | 5,668 | $ | 9,186 | -38.30% | |||
| Per Share of Common Stock: | ||||||||
| Basic Earnings | $0.27 | $ | 0.56 | -51.79% | ||||
| Diluted Earnings | $0.27 | $ | 0.56 | -51.79% | ||||
| Dividends | $0.13 | $ | 0.13 | 0.00% | ||||
| Weighted Average Shares Outstanding: | ||||||||
| Basic | 13,062,881 | 12,931,169 | ||||||
| Diluted | 13,141,840 | 12,963,487 | ||||||
| Three Months Ended | ||||||||||||
| March 31, | December 31, | March 31, | ||||||||||
| 2009 | 2008 | 2008 | ||||||||||
| Key Financial Ratios: | ||||||||||||
| Return on Average Assets | 0.51 | % | -2.07 | % | 0.99 | % | ||||||
| Return on Average Shareholders' Equity | 3.74 | % | -18.11 | % | 8.78 | % | ||||||
| Return on Average Common Shareholders' Equity (1) | 4.60 | % | -18.50 | % | 8.78 | % | ||||||
| Return on Average Common Tangible Shareholders' Equity (2) | 9.14 | % | -35.08 | % | 16.86 | % | ||||||
| Interest Rate Spread | 3.01 | % | 3.11 | % | 3.60 | % | ||||||
| Net Interest Margin | 3.23 | % | 3.30 | % | 3.86 | % | ||||||
| Efficiency Ratio | 67.61 | % | 77.26 | % | 61.56 | % | ||||||
| (1) Common shareholders' equity is shareholders' equity less preferred stock of $72,278. | ||||||||||||
| (2) Tangible common shareholders' equity is shareholders' equity less goodwill, intangible assets and preferred stock of $72,278. | ||||||||||||
| March 31, | December 31, | March 31, | ||||||||||
| 2009 | 2008 | 2008 | ||||||||||
| Asset Quality Ratios: | ||||||||||||
| Nonperforming Loans as a Percentage of Total Loans, | 4.84 | % | 1.41 | % | 1.29 | % | ||||||
| net of Unearned Income | ||||||||||||
| Nonperforming Assets as a Percentage of Total Assets | 4.34 | % | 2.61 | % | 1.35 | % | ||||||
| Allowance for Loan Losses as a Percentage of Total Loans, | ||||||||||||
| net of Unearned Income | 2.19 | % | 2.20 | % | 1.45 | % | ||||||
| Allowance for Loan Losses as a Percentage of | ||||||||||||
| Nonperforming Loans | 45.16 | % | 155.28 | % | 112.71 | % | ||||||
| Net Charge-Offs to Average Total Loans, Net of | ||||||||||||
| Unearned Income | 0.03 | % | 1.63 | % | 0.05 | % | ||||||
| GREEN BANKSHARES, INC. |
| Consolidated Financial Highlights |
| March 31, 2009 |
| (UNAUDITED) |
| Nonperforming Assets and Net Charge-offs | ||||||||||||
| As of and for the three months ended March 31, 2009 | Bank | Other | Total | |||||||||
| Loans past due 90 days and still accruing | $ | 4,058 | $ | - | $ | 4,058 | ||||||
| Nonaccrual loans | 103,711 | 852 | 104,563 | |||||||||
| Other real estate owned and repossessed assets | 12,536 | 115 | 12,651 | |||||||||
| Total nonperforming assets | $ | 120,305 | $ | 967 | $ | 121,272 | ||||||
| YTD net charge-offs | $ | 214 | $ | 528 | $ | 742 | ||||||
| As of and for the three months ended March 31, 2008 | Bank | Other | Total | |||||||||
| Loans past due 90 days and still accruing | $ | 201 | $ | - | $ | 201 | ||||||
| Nonaccrual loans | 29,363 | 538 | 29,901 | |||||||||
| Other real estate owned and repossessed assets | 8,845 | 407 | 9,252 | |||||||||
| Total nonperforming assets | $ | 38,409 | $ | 945 | $ | 39,354 | ||||||
| YTD net charge-offs | $ | 682 | $ | 390 | $ | 1,072 | ||||||
| As of and for the year ended December 31, 2008 | Bank | Other | Total | |||||||||
| Loans past due 90 days and still accruing | $ | 509 | $ | - | $ | 509 | ||||||
| Nonaccrual loans | 29,956 | 970 | 30,926 | |||||||||
| Other real estate owned and repossessed assets | 45,054 | 317 | 45,371 | |||||||||
| Total nonperforming assets | $ | 75,519 | $ | 1,287 | $ | 76,806 | ||||||
| Net charge-offs | $ | 35,564 | $ | 2,546 | $ | 38,110 | ||||||
| Asset Quality Ratios | ||||||||||||
| As of and for the three months ended March 31, 2009 | Bank | Other | Consolidated | |||||||||
| Nonperforming loans as a percentage of total loans, net of unearned income | 4.83 | % | 2.05 | % | 4.84 | % | ||||||
| Nonperforming assets as a percentage of total assets | 4.31 | % | 1.98 | % | 4.34 | % | ||||||
| Allowance for loan losses as a percentage of total loans, net of unearned income | 2.05 | % | 8.09 | % | 2.19 | % | ||||||
| Allowance for loan losses as a percentage of nonperforming loans | 42.41 | % | 393.66 | % | 45.16 | % | ||||||
| YTD net charge-offs to average total loans, net of unearned income | 0.01 | % | 1.29 | % | 0.03 | % | ||||||
| As of and for the three months ended March 31, 2008 | Bank | Other | Consolidated | |||||||||
| Nonperforming loans as a percentage of total loans, net of unearned income | 1.27 | % | 1.37 | % | 1.29 | % | ||||||
| Nonperforming assets as a percentage of total assets | 1.32 | % | 1.83 | % | 1.35 | % | ||||||
| Allowance for loan losses as a percentage of total loans, net of unearned income | 1.32 | % | 8.00 | % | 1.45 | % | ||||||
| Allowance for loan losses as a percentage of nonperforming loans | 104.16 | % | 582.16 | % | 112.71 | % | ||||||
| YTD net charge-offs to average total loans, net of unearned income | 0.03 | % | 1.01 | % | 0.05 | % | ||||||
| As of and for the year ended December 31, 2008 | Bank | Other | Consolidated | |||||||||
| Nonperforming loans as a percentage of total loans, net of unearned income | 1.38 | % | 2.48 | % | 1.41 | % | ||||||
| Nonperforming assets as a percentage of total assets | 2.58 | % | 2.57 | % | 2.61 | % | ||||||
| Allowance for loan losses as a percentage of total loans, net of unearned income | 2.06 | % | 8.27 | % | 2.20 | % | ||||||
| Allowance for loan losses as a percentage of nonperforming loans | 149.59 | % | 333.81 | % | 155.28 | % | ||||||
| Net charge-offs to average total loans, net of unearned income | 1.53 | % | 6.42 | % | 1.63 | % | ||||||
| GREEN BANKSHARES, INC. |
| Condensed Average Balances, Interest Rates and Yields |
| March 31, 2009 |
| Three Months Ended | ||||||||||||||||||||||||
| March 31, | ||||||||||||||||||||||||
| 2009 | 2008 | |||||||||||||||||||||||
| Average | Average | Average | Average | |||||||||||||||||||||
| Balance | Interest | Rate | Balance | Interest | Rate | |||||||||||||||||||
| Interest-earning assets: | ||||||||||||||||||||||||
| Loans(1)(2) | 2,175,543 | 32,655 | 6.09 | % | 2,324,362 | 42,766 | 7.40 | % | ||||||||||||||||
| Investment securities (2) | 216,757 | 2,862 | 5.35 | % | 245,863 | 3,536 | 5.78 | % | ||||||||||||||||
| Other short-term investments | 70,459 | 45 | 0.26 | % | 458 | 3 | 2.63 | % | ||||||||||||||||
| Total interest-earning assets | 2,462,759 | 35,562 | 5.86 | % | 2,570,683 | 46,305 | 7.24 | % | ||||||||||||||||
| Non-interest earning assets | 384,013 | 357,408 | ||||||||||||||||||||||
| Total assets | 2,846,772 | 2,928,091 | ||||||||||||||||||||||
| Interest-bearing liabilities: | ||||||||||||||||||||||||
| Deposits: | ||||||||||||||||||||||||
| Interest checking, money market and savings | 623,708 | 1,852 | 1.20 | % | 697,444 | 3,325 | 1.92 | % | ||||||||||||||||
| Time deposits | 1,296,277 | 10,799 | 3.38 | % | 1,137,188 | 12,610 | 4.46 | % | ||||||||||||||||
| Total interest bearing-deposits | 1,919,985 | 12,651 | 2.67 | % | 1,834,632 | 15,935 | 3.49 | % | ||||||||||||||||
| Securities sold under repurchase and short-term borrowings | 33,076 | 9 | 0.11 | % | 153,059 | 1,092 | 2.87 | % | ||||||||||||||||
| Notes payable | 317,944 | 3,291 | 4.20 | % | 399,530 | 4,610 | 4.64 | % | ||||||||||||||||
| Total interest-bearing liabilities | 2,271,005 | 15,951 | 2.85 | % | 2,387,221 | 21,637 | 3.65 | % | ||||||||||||||||
| Non-interest bearing liabilities: | ||||||||||||||||||||||||
| Demand Deposits | 168,109 | 186,454 | ||||||||||||||||||||||
| Other Liabilities | 22,734 | 25,640 | ||||||||||||||||||||||
| Total non-interest bearing liabilities | 190,843 | 212,094 | ||||||||||||||||||||||
| Total liabilities | 2,461,848 | 2,599,315 | ||||||||||||||||||||||
| Shareholders' equity | 384,924 | 328,776 | ||||||||||||||||||||||
| Total liabilities & shareholders' equity | 2,846,772 | 2,928,091 | ||||||||||||||||||||||
| Net interest income | 19,611 | 24,668 | ||||||||||||||||||||||
| Interest rate spread | 3.01 | % | 3.60 | % | ||||||||||||||||||||
| Net yield on interest-earning assets (net interest margin) | 3.23 | % | 3.86 | % | ||||||||||||||||||||
(1)Average loan balances exclude nonaccrual loans for the periods presented. | ||||||||||||||||||||||||
| (2)Fully Taxable Equivalent (“FTE”) at the rate of 35%. The FTE basis adjusts for the tax benefits of income on certain tax-exempt loans and investments using the federal statutory rate of 35% for each period presented. The Company believes this measure to be the preferred industry measurement of net interest income and provides relevant comparison between taxable and non-taxable amounts. | ||||||||||||||||||||||||
| GREEN BANKSHARES, INC. |
| Consolidated Financial Highlights |
| March 31, 2009 |
| (UNAUDITED) |
| March 31, 2009 | December 31, 2008 | |||||||||||||||||||
| Loans | Balance | % | Balance | % | % Change | |||||||||||||||
| Commercial | $ | 311,696 | 13.80 | % | $ | 315,099 | 14.08 | % | -1.08 | % | ||||||||||
| Commercial real estate | 1,460,343 | 64.63 | % | 1,430,225 | 63.92 | % | 2.11 | % | ||||||||||||
| Residential real estate | 396,000 | 17.53 | % | 397,922 | 17.78 | % | -0.48 | % | ||||||||||||
| Consumer | 87,720 | 3.88 | % | 89,733 | 4.01 | % | -2.24 | % | ||||||||||||
| Other | 3,598 | 0.16 | % | 4,656 | 0.21 | % | -22.72 | % | ||||||||||||
| Total loans | 2,259,357 | 100.00 | % | 2,237,635 | 100.00 | % | 0.97 | % | ||||||||||||
| Less: Unearned income | (14,509 | ) | (14,245 | ) | ||||||||||||||||
| Loans, net of unearned income | $ | 2,244,848 | $ | 2,223,390 | ||||||||||||||||
| Loan Balances by Geographical Region and Operating Subsidiaries | ||||||||||||||||||||
| March 31, 2009 | December 31, 2008 | |||||||||||||||||||
| Loan | % to | Loan | % to | |||||||||||||||||
| Balance | Total Loans | Balance | Total Loans | % Change | ||||||||||||||||
| Northeastern Tennessee Region1 | $ | 532,727 | 23.73 | % | $ | 524,535 | 23.59 | % | 1.56 | % | ||||||||||
| East Tennessee Region | 776,550 | 34.59 | % | 755,147 | 33.96 | % | 2.83 | % | ||||||||||||
| Middle Tennessee Region | 894,101 | 39.83 | % | 903,165 | 40.63 | % | -1.00 | % | ||||||||||||
| GCB Acceptance Corporation | 18,138 | 0.81 | % | 16,672 | 0.75 | % | 8.79 | % | ||||||||||||
| Superior Financial Services, Inc. | 23,332 | 1.04 | % | 23,871 | 1.07 | % | -2.26 | % | ||||||||||||
| Loans, net of unearned income | $ | 2,244,848 | 100.00 | % | $ | 2,223,390 | 100.00 | % | 0.97 | % | ||||||||||
| 1 Includes one branch located in Southwestern Virginia and one branch located in Northwestern North Carolina | ||||||||||||||||||||
| March 31, 2009 | December 31, 2008 | |||||||||||||||||||
| Deposits | Balance | % | Balance | % | % Change | |||||||||||||||
| Non-interest bearing demand | $ | 168,178 | 8.25 | % | $ | 176,685 | 8.09 | % | -4.81 | % | ||||||||||
| Interest bearing demand | 487,868 | 23.93 | % | 445,927 | 20.42 | % | 9.41 | % | ||||||||||||
| Money market and savings | 170,033 | 8.34 | % | 148,286 | 6.79 | % | 14.67 | % | ||||||||||||
| Retail time | 645,510 | 31.67 | % | 646,009 | 29.57 | % | -0.08 | % | ||||||||||||
| Jumbo time | 566,931 | 27.81 | % | 767,240 | 35.13 | % | -26.11 | % | ||||||||||||
| Total | $ | 2,038,520 | 100.00 | % | $ | 2,184,147 | 100.00 | % | -6.67 | % | ||||||||||
| Deposit Balances by Geographical Region | ||||||||||||||||||||
| March 31, 2009 | December 31, 2008 | |||||||||||||||||||
| Balance | % | Balance | % | % Change | ||||||||||||||||
| Northeastern Tennessee Region1 | $ | 809,366 | 39.70 | % | $ | 996,712 | 45.63 | % | -18.80 | % | ||||||||||
| East Tennessee Region | 273,726 | 13.43 | % | 257,716 | 11.80 | % | 6.21 | % | ||||||||||||
| Middle Tennessee Region | 955,428 | 46.87 | % | 929,719 | 42.57 | % | 2.77 | % | ||||||||||||
| Total | $ | 2,038,520 | 100.00 | % | $ | 2,184,147 | 100.00 | % | -6.67 | % | ||||||||||
| 1 Includes one branch located in Southwestern Virginia and one branch located in Northwestern North Carolina | ||||||||||||||||||||