| EXHIBIT 99.1 |
| CONTACT: | James E. Adams |
| | Executive Vice President and Chief Financial Officer |
| | 423-278-3050 |
GREEN BANKSHARES REPORTS LOSS FOR SECOND QUARTER OF 2009
DRIVEN PRIMARILY BY NON-CASH GOODWILL IMPAIRMENT CHARGE
GREENEVILLE, Tenn. (July 21, 2009) – Green Bankshares, Inc. (NASDAQ:GRNB), the holding company for GreenBank, today reported a net loss for the second quarter and six months ended June 30, 2009. The net loss of $151.4 million or $11.58 per diluted share for the second quarter of 2009 was primarily driven by an after-tax, non-cash goodwill impairment charge of $137.4 million or $10.51 per diluted share. This charge had no impact on the Company's cash, liquidity, tangible equity ratio, or its strong regulatory capital ratios. Excluding goodwill impairment, the Company's net operating loss totaled $14.0 million or $1.07 per diluted share for the quarter. (Please refer to the reconciliation of non-GAAP measures included on page four of this press release.)
Stan Puckett, Chairman and Chief Executive Officer, commented, "As a result of continued deterioration in real estate market conditions and the further weakening in the economic environment, the Company has experienced a sharp decline in its stock price, not only from year-end 2008, but also from the end of the first quarter of 2009. This decline resulted in the market price of the Company's common stock trading at a deep discount from both net book value and tangible book value per share over an extended period, which in turn led to the non-cash charge associated with the write off of the entire amount of non-amortizing goodwill on our balance sheet."
Puckett added, "Despite the second quarter net loss of $151.4 million and net operating loss of $14.0 million, the Company's capital ratios remain extremely strong. At June 30, 2009, GreenBank's Tier 1 Leverage Ratio was 10.85%, its Tier 1 Risk-based Capital Ratio was 13.46%, and its Total Risk-based Capital Ratio was 14.72% – all well above the required minimums of 5%, 6% and 10%, respectively, to be deemed a 'well capitalized' financial institution. Additionally, the Company's ratio of tangible equity to tangible assets was 5.98% at June 30, 2009."
For the six months ended June 30, 2009, the Company reported a net loss of $147.9 million or $11.32 per diluted share, including the after-tax, non-cash goodwill impairment charge of $137.4 million or $10.52 per diluted share. Excluding the goodwill impairment charge, the net operating loss was $10.5 million or $0.80 per diluted share. For the three and six month periods ended June 30, 2008, the Company reported net income of almost $1.5 million and $8.6 million, respectively, and net income per diluted share of $0.11 and $0.67, respectively.
The net operating loss of $14.0 million during the second quarter of 2009 was primarily influenced by a loan loss provision of $24.4 million, accompanied by approximately $3.3 million in net write-offs related to foreclosed properties. In addition, the one-time assessment, levied against all banks by the FDIC, increased the Company's FDIC deposit insurance costs to $2.6 million for the quarter.
Green Bankshares, Inc. ▪ 100 North Main Street ▪ Greeneville, TN 37743 ▪ (423) 639-5111
GRNB Reports Second Quarter Loss
Page 2
July 21, 2009
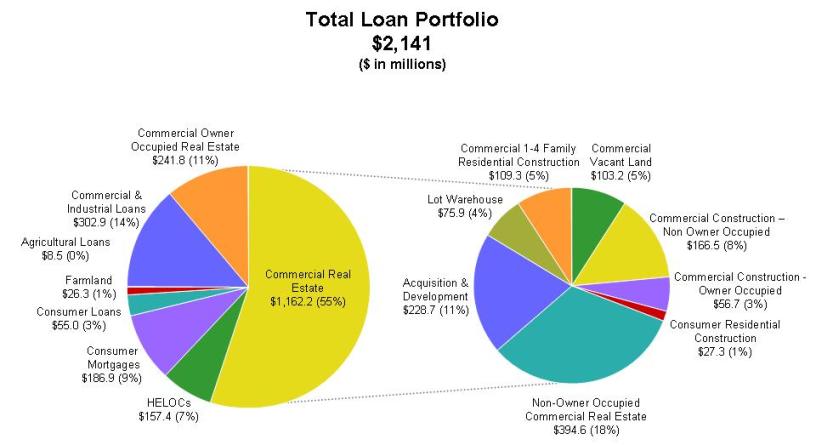
The following information graphically displays the Bank-only loan portfolio breakdown, by purpose code, at June 30, 2009, and does not include overdraft reclassifications:
During the second quarter, the Company increased its loan loss reserve to $50,157,000, which represented 2.30% of loans at June 30, 2009, compared with 2.19% at March 31, 2009, and 1.51% of loans at June 30, 2008. As economic conditions continued to deteriorate during the second quarter of 2009, the Company's net loan charge-offs totaled $23,281,000 and a loan loss provision of $24,384,000 was deemed necessary. For the year-to-date period, the Company's provision for loan losses totaled $25,369,000 versus $11,907,000 for the first six months of 2008.
At June 30, 2009, non-performing assets (NPAs) totaled $129,177,000 or 4.91% of total assets compared with $121,272,000 or 4.34% of total assets at March 31, 2009. At the end of the second quarter, loans past due 90 days and still accruing interest totaled $820,000, declining from $4,058,000 at March 31, 2009. The following table reflects the movement in non-accrual loan and other real-estate owned (OREO) balances from March 31, 2009, to June 30, 2009:
| | | Non-accrual Loans | | | OREO Balances | |
| Balance at March 31, 2009 | | $ | 104,563,000 | | | $ | 12,651,000 | |
| Loan foreclosures | | | (31,420,000 | ) | | | 31,420,000 | |
| Loan charge-offs | | | (24,631,000 | ) | | | N/A | |
| Loans added to non-accrual, net | | | 45,377,000 | | | | N/A | |
| OREO sales | | | N/A | | | | (6,257,000 | ) |
| OREO write-downs, net | | | N/A | | | | (3,346,000 | ) |
| Balance at June 30, 2009 | | $ | 93,889,000 | | | $ | 34,468,000 | |
Puckett added, "As we conducted our loan impairment analysis during the quarter, we identified loans totaling approximately $6,200,000 that were currently performing in all respects, but given our increasingly cautious stance in the current economic environment, we proactively placed these loans on non-accrual status, taking a partial charge-off of $2,300,000."
GRNB Reports Second Quarter Loss
Page 3
July 21, 2009
Net interest income totaled $20,180,000 for the second quarter of 2009, increasing $751,000 from the first quarter of 2009, net of interest reversals of $740,646. The increase primarily resulted from a widening of the net interest margin to 3.43% from 3.23% for the first quarter of 2009. Compared with the second quarter of 2008, net interest income declined $4,864,000 primarily due to the higher level of non-accrual loans.
Non-interest income for the second quarter of 2009 totaled $7,541,000, which represented an increase of $598,000 or almost 9% from the first quarter of the year. Improvements were realized in deposit revenues as well as wealth management income and mortgage banking income. Given the current environment, GreenBank's High Performance Checking account product continues to perform well, with the Company adding 4,418 net new accounts during the second quarter for a new account opening ratio of 2.31 for every account closed. Compared with the second quarter of 2008, non-interest income declined $571,000 or 7%, reflecting general weakness in the economy.
Non-interest expense totaled $169,143,000 for the second quarter of 2009 and included the $143,389,000 non-cash goodwill impairment charge. Operating expenses, excluding the goodwill impairment charge, totaled $25,754,000 for the current quarter, an increase of $7,923,000 from the first quarter of 2009. (Please refer to the reconciliation of non-GAAP measures included on page four of this release.) The large expense items associated with the second quarter increase were higher advertising costs associated with the High Performance Checking product, which rose $615,000; an increase of $3,265,000 in OREO related costs; the increase of $1,850,000 in FDIC deposit insurance costs associated with the one-time special assessment levied against all banks; higher collection costs of $413,000; and a write-down of $524,000 taken in connection with two investments held in the securities portfolio.
Puckett concluded, "Although many economists have indicated that the economy has bottomed, none are projecting, at this time, how long the bottom will last before we see signs of economic improvement. We are cautiously optimistic that, as the economy begins to turn, given our strong capital levels, we will be positioned to actively participate in the economic recovery cycle."
Greeneville, Tennessee-based Green Bankshares, Inc., with total assets of approximately $2.630 billion, is the holding company for GreenBank. GreenBank, which traces its origin to 1890, has 63 branches across East and Middle Tennessee, and one branch each in Bristol, Virginia, and Hot Springs, North Carolina. It also provides wealth management services through its GreenWealth Division and residential mortgage lending through its Mortgage Division. In addition, GreenBank conducts separate businesses through three wholly owned subsidiaries: Superior Financial Services, Inc., a consumer finance company; GCB Acceptance Corporation, a consumer finance company specializing in automobile lending; and Fairway Title Co., a title insurance company.
GRNB Reports Second Quarter Loss
Page 4
July 21, 2009
GREEN BANKSHARES, INC.
Reconciliation of Non-GAAP Measures Presented in Earnings Release
(Dollars in thousands)
| | | Three Months Ended | | | Six Months Ended | |
| | | June 30, 2009 | | | March 31, 2009 | | | June 30, 2008 | | | June 30, 2009 | | | June 30, 2008 | |
| Total non-interest expense | | $ | 169,143 | | | $ | 17,831 | | | $ | 20,140 | | | $ | 186,974 | | | $ | 39,701 | |
| Goodwill impairment charge | | | (143,389 | ) | | | -- | | | | -- | | | | (143,389 | ) | | | -- | |
| Operating expenses | | $ | 25,754 | | | $ | 17,831 | | | $ | 20,140 | | | $ | 43,585 | | | $ | 39,701 | |
| | | | | | | | | | | | | | | | | | | | | |
| Net income (loss) available to common shareholders | | $ | (151,400 | ) | | $ | 3,548 | | | $ | 1,462 | | | $ | (147,852 | ) | | $ | 8,640 | |
| Goodwill impairment charge, net of tax | | | 137,414 | | | | -- | | | | -- | | | | 137,414 | | | | -- | |
| Net operating income (loss) | | $ | (13,986 | ) | | $ | 3,548 | | | $ | 1,462 | | | $ | (10,438 | ) | | $ | 8,640 | |
| | | | | | | | | | | | | | | | | | | | | |
| Per Diluted Share: | | | | | | | | | | | | | | | | | | | | |
| Net income (loss) available to common shareholders | | $ | (11.58 | ) | | $ | 0.27 | | | $ | 0.11 | | | $ | (11.32 | ) | | $ | 0.67 | |
| Goodwill impairment charge, net of tax | | | 10.51 | | | | -- | | | | -- | | | | 10.52 | | | | -- | |
| Net operating income (loss) | | $ | (1.07 | ) | | $ | 0.27 | | | $ | 0.11 | | | $ | (0.80 | ) | | $ | 0.67 | |
Use of Non-GAAP financial measures
The above table presents computations and other financial information excluding the goodwill impairment charge (non-GAAP). The goodwill impairment charge is included in the financial results presented in accordance with generally accepted accounting principles (GAAP). The Company believes that the exclusion of goodwill impairment in expressing net operating income (loss), operating expenses and earnings (loss) per share data provides a more meaningful base for period to period comparisons which will assist investors in analyzing the operating results of the Company and predicting operating performance. The Company utilizes these non-GAAP financial measures to compare the operating performance with comparable periods in prior years and with internally prepared projections. Non-GAAP financial measures have inherent limitations, are not required to be uniformly applied and are not audited. To mitigate these limitations, the Company has policies in place to address goodwill impairment from other normal operating expenses to ensure that the Company's operating results are properly reflected for period to period comparisons.
Certain matters discussed in this news release are not historical facts but are "forward-looking statements" within the meaning of and are furnished pursuant to the Private Securities Litigation Reform Act of 1995. All forward-looking statements involve risk and uncertainty and actual results could differ materially from the anticipated results or other expectations expressed in the forward-looking statements. Risks and uncertainties related to the Company's business are discussed in the Company's SEC filings, including its Annual Report on Form 10-K for the year ended December 31, 2008, and include, but are not limited to, (1) unanticipated deterioration in the financial condition of borrowers resulting in significant increases in loan losses and provisions for those losses; (2) continued deterioration in the residential real estate market; (3) further decline in the economy in the markets that the Company serves; (4) changes in the legislative and regulatory environment; (5) the Company's inability to successfully implement its growth strategy; and (6) the loss of key personnel. The Company undertakes no obligation to update forward-looking statements.
GRNB Reports Second Quarter Loss
Page 5
July 21, 2009
GREEN BANKSHARES, INC.
Unaudited Financial Highlights
(In thousands, except per share amounts)
| | | Three Months Ended | | | Six Months Ended | |
| | | June 30, 2009 | | | March 31, 2009 | | | June 30, 2008 | | | June 30, 2009 | | | June 30, 2008 | |
| Interest income | | $ | 34,856 | | | $ | 35,380 | | | $ | 42,694 | | | $ | 70,236 | | | $ | 88,803 | |
| Interest expense | | | 14,676 | | | | 15,951 | | | | 17,650 | | | | 30,627 | | | | 39,287 | |
| Net interest income | | | 20,180 | | | | 19,429 | | | | 25,044 | | | | 39,609 | | | | 49,516 | |
| Provision for loan losses | | | 24,384 | | | | 985 | | | | 11,019 | | | | 25,369 | | | | 11,907 | |
| Net interest income after provision for loan losses | | | (4,204 | ) | | | 18,444 | | | | 14,025 | | | | 14,240 | | | | 37,609 | |
| Non-interest income | | | 7,541 | | | | 6,943 | | | | 8,112 | | | | 14,484 | | | | 15,418 | |
| Non-interest expense | | | 169,143 | | | | 17,831 | | | | 20,140 | | | | 186,974 | | | | 39,701 | |
| Income (loss) before income taxes | | | (165,806 | ) | | | 7,556 | | | | 1,997 | | | | (158,250 | ) | | | 13,326 | |
| Income taxes provision (benefit) | | | (15,656 | ) | | | 2,776 | | | | 535 | | | | (12,880 | ) | | | 4,686 | |
| Income (loss) | | | (150,150 | ) | | | 4,780 | | | | 1,462 | | | | (145,370 | ) | | | 8,640 | |
| Preferred stock dividends and related costs | | | 1,250 | | | | 1,232 | | | | -- | | | | 2,482 | | | | -- | |
| Net income (loss) available to common shareholders | | $ | (151,400 | ) | | $ | 3,548 | | | $ | 1,462 | | | $ | 147,852 | ) | | $ | 8,640 | |
| Comprehensive income (loss) | | $ | (150,557 | ) | | $ | 5,668 | | | $ | (2,225 | ) | | $ | (144,889 | ) | | $ | 6,931 | |
| | | | | | | | | | | | | | | | | | | | | |
| Earnings (loss) per share: | | | | | | | | | | | | | | | | | | | | |
| Basic | | $ | (11.58 | ) | | $ | 0.27 | | | $ | 0.11 | | | $ | (11.32 | ) | | $ | 0.67 | |
Diluted | | $ | (11.58 | ) | | $ | 0.27 | | | $ | 0.11 | | | $ | (11.32 | ) | | $ | 0.67 | |
| | | | | | | | | | | | | | | | | | | | | |
| Weighted average shares: | | | | | | | | | | | | | | | | | | | | |
| Basic | | | 13,070 | | | | 13,063 | | | | 12,932 | | | | 13,067 | | | | 12,931 | |
Diluted 1 | | | 13,070 | | | | 13,142 | | | | 12,958 | | | | 13,067 | | | | 12,940 | |
| | | | | | | | | | | | | | | | | | | | | |
| Dividends declared per share | | $ | 0.00 | | | $ | 0.13 | | | $ | 0.13 | | | $ | 0.13 | | | $ | 0.26 | |
| | | | | | | | | | | | | | | | | | | | | |
| | | | | | | | | | | June 30, 2009 | | | Dec. 31, 2008 | | | June 30, 2008 | |
| Total assets | | | | | | | | | | $ | 2,629,834 | | | $ | 2,944,671 | | | $ | 3,018,536 | |
| Cash and cash equivalents | | | | | | | | | | | 107,573 | | | | 198,358 | | | | 94,158 | |
| Investment securities | | | | | | | | | | | 181,234 | | | | 217,249 | | | | 290,388 | |
| Loans, net of unearned interest | | | | | | | | | | | 2,183,754 | | | | 2,223,390 | | | | 2,347,241 | |
| Allowance for loan losses | | | | | | | | | | | (50,157 | ) | | | (48,811 | ) | | | (35,351 | ) |
| Deposits | | | | | | | | | | | 2,026,722 | | | | 2,184,147 | | | | 2,260,950 | |
| Shareholders' equity | | | | | | | | | | | 233,192 | | | | 381,231 | | | | 326,427 | |
Common shareholders' equity 2 | | | | | | | | | | | 167,151 | | | | 315,885 | | | | 326,427 | |
Tangible common shareholders' equity 3 | | | | | | | | | | | 156,522 | | | | 160,411 | | | | 169,909 | |
Common book value per share 2 | | | | | | | | | | | 12.69 | | | | 24.09 | | | | 25.11 | |
Tangible common book value per share 3 | | | | | | | | | | | 11.88 | | | | 12.23 | | | | 13.07 | |
1 Diluted weighted average shares outstanding for the three- and six-month periods ended June 30, 2009, exclude 105,734 and 92,420 restricted average shares, respectively, because their impact would be anti-dilutive.
2 Common shareholders' equity is shareholders' equity less preferred stock.
3 Tangible common shareholders' equity is shareholders' equity less goodwill, intangible assets and preferred stock.
| GREEN BANKSHARES, INC. | |
| Consolidated Balance Sheets | |
| June 30, 2009, December 31, 2008 and June 30, 2008 | |
| (Dollars in thousands) | |
| | | | | | | | | | | |
| | | (Unaudited) | | | | | | (Unaudited) |
| | | June 30, | | | December 31, | June 30, |
| | | 2009 | | | 2008* | | 2008 |
| ASSETS | | | | | | |
| | | | | | | | | | | |
| Cash and due from banks | $ | 103,454 | | | $ | 193,095 | | | 59,823 | |
| Federal funds sold | | 4,119 | | | | 5,263 | | | 34,335 | |
| Cash and cash equivalents | | 107,573 | | | | 198,358 | | | 94,158 | |
| | | | | | | | | | | |
| Securities available-for-sale ("AFS") | | 167,853 | | | | 203,562 | | | 276,378 | |
| Securities held-to-maturity (with a market value of $629, $601 and $942 | | | | | | | | |
| on June 30, 2009, December 31, 2008 and June 30, 2008) | | 647 | | | | 657 | | | 968 | |
| FHLB and other stock, at cost | | 12,734 | | | | 13,030 | | | 13,042 | |
| Loans held for sale | | 3,634 | | | | 442 | | | 2,540 | |
| Loans, net of unearned income | | 2,183,754 | | | | 2,223,390 | | | 2,347,241 | |
| Allowance for loan losses | | (50,157 | ) | | | (48,811 | ) | | (35,351 | ) |
| Other real estate owned and repossessed assets | | 34,468 | | | | 45,371 | | | 20,632 | |
| Bank premises and equipment, net | | 83,448 | | | | 83,359 | | | 83,010 | |
| Cash surrender value of life insurance | | 30,113 | | | | 29,539 | | | 29,001 | |
| Goodwill | | - | | | | 143,389 | | | 143,140 | |
| Core deposit and other intangibles | | 10,629 | | | | 12,085 | | | 13,378 | |
| Other assets | | 45,138 | | | | 40,300 | | | 30,399 | |
| Total assets | $ | 2,629,834 | | | $ | 2,944,671 | | | 3,018,536 | |
| | | | | | | | | | | |
| LIABILITIES AND SHAREHOLDERS' EQUITY | | | | | | | | | | |
| | | | | | | | | | | |
| Non-interest-bearing deposits | $ | 165,735 | | | $ | 176,685 | | | 195,104 | |
| Interest-bearing deposits | | 1,746,895 | | | | 1,645,115 | | | 1,735,772 | |
| Brokered deposits | | 114,092 | | | | 362,347 | | | 330,074 | |
| Total deposits | | 2,026,722 | | | | 2,184,147 | | | 2,260,950 | |
| | | | | | | | | | | |
| Repurchase agreements | | 25,990 | | | | 35,302 | | | 91,641 | |
| FHLB advances and notes payable | | 229,154 | | | | 229,349 | | | 230,010 | |
| Subordinated debentures | | 88,662 | | | | 88,662 | | | 88,662 | |
| Accrued interest payable and other liabilities | | 26,114 | | | | 25,980 | | | 20,846 | |
| Total liabilities | | 2,396,642 | | | | 2,563,440 | | | 2,692,109 | |
| | | | | | | | | | | |
| SHAREHOLDERS' EQUITY | | | | | | | | | | |
| | | | | | | | | | | |
| Preferred stock: no par value, 1,000,000 shares authorized; | | | | | | | | | | |
| 72,278, 72,278 and -0- shares outstanding | | 66,041 | | | | 65,346 | | | - | |
| Common stock: $2 par value, 20,000,000 shares authorized; | | | | | | | | | | |
| 13,175,817, 13,112,687 and 13,001,2226 shares outstanding | | 26,351 | | | | 26,225 | | | 26,003 | |
| Common stock warrants | | 6,934 | | | | 6,934 | | | - | |
| Additional paid in capital | | 187,966 | | | | 187,742 | | | 185,428 | |
| Retained earnings (deficit) | | (53,918 | ) | | | 95,647 | | | 115,198 | |
| Accumulated other comprehensive income (loss) | | (182 | ) | | | (663 | ) | | (202 | ) |
| Total shareholders' equity | | 233,192 | | | | 381,231 | | | 326,427 | |
| | | | | | | | | | | |
| Total liabilities & shareholders' equity | $ | 2,629,834 | | | $ | 2,944,671 | | | 3,018,536 | |
| | | | | | | | | | | |
| * Derived from Audited Consolidated Financial Statements. | | | | | | | | | | |
| GREEN BANKSHARES, INC. |
| Consolidated Statements of Income and Comprehensive Income |
| Three Months Ended June 30, 2009, March 31, 2009 and June 30, 2008 and Six Months Ended June 30 , 2009 and 2008 |
| (Unaudited) |
| | | | | | | | | | | | | | | | |
| (Dollars in thousands except share and per share data) |
| | | | | | | | | | | | | | | | |
| | | Three Months Ended | | | Six Months Ended | |
| | | June 30, | | | March 31, | | June 30, | | | June 30, | | | June 30, | |
| | | 2009 | | | 2009 | | | 2008 | | | 2009 | | | 2008 | |
| | | | | | | | | | | | | | | | |
| Interest income: | | | | | | | | | | | | | | | |
| Interest and fees on loans | | $ | 32,528 | | | $ | 32,645 | | | $ | 39,407 | | | $ | 65,173 | | | $ | 82,156 | |
| Taxable securities | | | 1,843 | | | | 2,220 | | | | 2,784 | | | | 4,063 | | | | 5,647 | |
| Nontaxable securities | | | 314 | | | | 320 | | | | 324 | | | | 634 | | | | 657 | |
| FHLB and other stock | | | 135 | | | | 150 | | | | 157 | | | | 285 | | | | 317 | |
| Federal funds sold and other | | | 36 | | | | 45 | | | | 22 | | | | 81 | | | | 26 | |
| Total interest income | | | 34,856 | | | | 35,380 | | | | 42,694 | | | | 70,236 | | | | 88,803 | |
| | | | | | | | | | | | | | | | | | | | | |
| Interest expense: | | | | | | | | | | | | | | | | | | | | |
| Deposits | | | 11,511 | | | | 12,653 | | | | 13,377 | | | | 24,164 | | | | 29,312 | |
| Federal funds purchased and repurchase agreements | | | 7 | | | | 9 | | | | 700 | | | | 16 | | | | 1,792 | |
| FHLB advances and notes payable | | | 2,469 | | | | 2,443 | | | | 2,565 | | | | 4,912 | | | | 5,743 | |
| Subordinated debentures | | | 689 | | | | 846 | | | | 1,008 | | | | 1,535 | | | | 2,440 | |
| Total interest expense | | | 14,676 | | | | 15,951 | | | | 17,650 | | | | 30,627 | | | | 39,287 | |
| | | | | | | | | | | | | | | | | | | | | |
| Net interest income | | | 20,180 | | | | 19,429 | | | | 25,044 | | | | 39,609 | | | | 49,516 | |
| | | | | | | | | | | | | | | | | | | | | |
| Provision for loan losses | | | 24,384 | | | | 985 | | | | 11,019 | | | | 25,369 | | | | 11,907 | |
| | | | | | | | | | | | | �� | | | | | | | | |
| Net interest income (loss) after provision for loan losses | | | (4,204 | ) | | | 18,444 | | | | 14,025 | | | | 14,240 | | | | 37,609 | |
| | | | | | | | | | | | | | | | | | | | | |
| Non-interest income: | | | | | | | | | | | | | | | | | | | | |
| Service charges on deposit accounts | | | 5,795 | | | | 5,356 | | | | 5,988 | | | | 11,151 | | | | 11,455 | |
| Other charges and fees | | | 505 | | | | 449 | | | | 505 | | | | 954 | | | | 1,009 | |
| Trust and investment services income | | | 489 | | | | 388 | | | | 548 | | | | 877 | | | | 834 | |
| Mortgage banking income | | | 110 | | | | 55 | | | | 293 | | | | 165 | | | | 550 | |
| Other income | | | 642 | | | | 695 | | | | 778 | | | | 1,337 | | | | 1,570 | |
| Total non-interest income | | | 7,541 | | | | 6,943 | | | | 8,112 | | | | 14,484 | | | | 15,418 | |
| Non-interest expense: | | | | | | | | | | | | | | | | | | | | |
| Employee compensation | | | 8,064 | | | | 7,692 | | | | 8,069 | | | | 15,756 | | | | 16,659 | |
| Employee benefits | | | 1,229 | | | | 1,295 | | | | 1,187 | | | | 2,524 | | | | 2,446 | |
| Occupancy expense | | | 1,712 | | | | 1,787 | | | | 1,649 | | | | 3,499 | | | | 3,364 | |
| Equipment expense | | | 895 | | | | 742 | | | | 745 | | | | 1,637 | | | | 1,847 | |
| Computer hardware/software expense | | | 651 | | | | 637 | | | | 719 | | | | 1,288 | | | | 1,351 | |
| Professional services | | | 446 | | | | 529 | | | | 504 | | | | 975 | | | | 958 | |
| Advertising | | | 679 | | | | 64 | | | | 814 | | | | 743 | | | | 1,688 | |
| Loss on OREO and repossessed assets | | | 3,346 | | | | 81 | | | | 1,066 | | | | 3,427 | | | | 1,080 | |
| FDIC insurance | | | 2,550 | | | | 700 | | | | 366 | | | | 3,250 | | | | 763 | |
| Core deposit and other intangible amortization | | | 652 | | | | 804 | | | | 655 | | | | 1,456 | | | | 1,309 | |
| Goodwill impairment | | | 143,389 | | | | - | | | | - | | | | 143,389 | | | | - | |
| Other expenses | | | 5,530 | | | | 3,500 | | | | 4,366 | | | | 9,030 | | | | 8,236 | |
| Total non-interest expense | | | 169,143 | | | | 17,831 | | | | 20,140 | | | | 186,974 | | | | 39,701 | |
| | | | | | | | | | | | | | | | | | | | | |
| Income (loss) before income taxes | | | (165,806 | ) | | | 7,556 | | | | 1,997 | | | | (158,250 | ) | | | 13,326 | |
| | | | | | | | | | | | | | | | | | | | | |
| Income taxes provision (benefit) | | | (15,656 | ) | | | 2,776 | | | | 535 | | | | (12,880 | ) | | | 4,686 | |
| | | | | | | | | | | | | | | | | | | | | |
| Net income (loss) | | | (150,150 | ) | | | 4,780 | | | | 1,462 | | | | (145,370 | ) | | | 8,640 | |
| | | | | | | | | | | | | | | | | | | | | |
| Preferred stock dividends and accretion of discount on warrants | | | 1,250 | | | | 1,232 | | | | - | | | | 2,482 | | | | - | |
| | | | | | | | | | | | | | | | | | | | | |
| Net income (loss) available to common shareholders | | $ | (151,400 | ) | | $ | 3,548 | | | $ | 1,462 | | | $ | (147,852 | ) | | $ | 8,640 | |
| | | | | | | | | | | | | | | | | | | | | |
| Comprehensive income (loss) | | $ | (150,557 | ) | | $ | 5,668 | | | $ | (2,255 | ) | | $ | (144,889 | ) | | $ | 6,931 | |
| | | | | | | | | | | | | | | | | | | | | |
| Per share of common stock: | | | | | | | | | | | | | | | | | | | | |
| Basic earnings (loss) | | $ | (11.58 | ) | | $ | 0.27 | | | $ | 0.11 | | | $ | (11.32 | ) | | $ | 0.67 | |
| Diluted earnings (loss) | | $ | (11.58 | ) | | $ | 0.27 | | | $ | 0.11 | | | $ | (11.32 | ) | | $ | 0.67 | |
| Dividends | | $ | 0.00 | | | $ | 0.13 | | | $ | 0.13 | | | $ | 0.13 | | | $ | 0.26 | |
| | | | | | | | | | | | | | | | | | | | | |
| Weighted average shares outstanding: | | | | | | | | | | | | | | | | | | | | |
| Basic | | | 13,070,216 | | | | 13,062,881 | | | | 12,931,669 | | | | 13,066,569 | | | | 12,931,419 | |
| Diluted1 | | | 13,070,216 | | | | 13,141,840 | | | | 12,958,439 | | | | 13,066,569 | | | | 12,939,638 | |
| 1Diluted weighted average shares outstanding for the three and six months ended June 30, 2009 excludes 105,734 and 92,420 shares, respectively, because they are anti-dilutive. |
| | | | | | | | | | | | | | | | | | | | | |
| Non-GAAP Measures Presented in Earnings Release | | | | | | | | | | | | | | | | |
| Total non-interest expense | | $ | 169,143 | | | $ | 17,831 | | | $ | 20,140 | | | $ | 186,974 | | | $ | 39,701 | |
| Goodwill impairment charge | | | (143,389 | ) | | | - | | | | - | | | | (143,389 | ) | | | - | |
| Operating expenses | | $ | 25,754 | | | $ | 17,831 | | | $ | 20,140 | | | $ | 43,585 | | | $ | 39,701 | |
| | | | | | | | | | | | | | | | | | | | | |
| Net income (loss) available to common shareholders | | $ | (151,400 | ) | | $ | 3,548 | | | $ | 1,462 | | | $ | (147,852 | ) | | $ | 8,640 | |
| Goodwill impairment charge, net of tax | | | 137,414 | | | | - | | | | - | | | | 137,414 | | | | - | |
| Net operating income (loss) | | $ | (13,986 | ) | | $ | 3,548 | | | $ | 1,462 | | | $ | (10,438 | ) | | $ | 8,640 | |
| | | | | | | | | | | | | | | | | | | | | |
| GREEN BANKSHARES, INC. |
| Consolidated Financial Highlights |
| (UNAUDITED) |
| | | | | | | | | | | | | | | | | | | |
| (Dollars in thousands except share and per share data) |
| | | | | | | | | | | | | | | | | | | |
| | | June 30, | | December 31, | | % | | | | | | | | | | |
| | | 2009 | | | 2008 | | | Change | | | | | | | | | | |
| Financial Condition Data: | | | | | | | | | | | | | | | | | | |
| | | | | | | | | | | | | | | | | | | |
| Assets | | $ | 2,629,834 | | | $ | 2,944,671 | | | | -10.69 | % | | | | | | | | | |
| Loans, net of unearned interest | | | 2,183,754 | | | | 2,223,390 | | | | -1.78 | % | | | | | | | | | |
| Cash and investments | | | 288,807 | | | | 415,607 | | | | -30.51 | % | | | | | | | | | |
| Federal funds sold | | | 4,119 | | | | 5,263 | | | | -21.74 | % | | | | | | | | | |
| Deposits | | | 2,026,722 | | | | 2,184,147 | | | | -7.21 | % | | | | | | | | | |
| FHLB advances and notes payable | | | 229,154 | | | | 229,349 | | | | -0.09 | % | | | | | | | | | |
| Subordinated debentures | | | 88,662 | | | | 88,662 | | | | 0.00 | % | | | | | | | | | |
| Repurchase agreements | | | 25,990 | | | | 35,302 | | | | -26.38 | % | | | | | | | | | |
| Shareholders' equity | | | 233,192 | | | | 381,231 | | | | -38.83 | % | | | | | | | | | |
| Common shareholders' equity (1) | | | 167,151 | | | | 315,885 | | | | -47.08 | % | | | | | | | | | |
| Tangible common shareholders' equity (2) | | | 156,522 | | | | 160,411 | | | | -2.42 | % | | | | | | | | | |
| Tangible shareholders' equity (3) | | | 222,563 | | | | 225,757 | | | | -1.41 | % | | | | | | | | | |
| | | | | | | | | | | | | | | | | | | | | | |
| Ratios: | | | | | | | | | | | | | | | | | | | | | |
| Common book value per share (1) | | $ | 12.69 | | | $ | 24.09 | | | | -47.32 | % | | | | | | | | | |
| Tangible common book value per share (2) | | $ | 11.88 | | | $ | 12.23 | | | | -2.86 | % | | | | | | | | | |
| Total tangible equity to tangible assets (3)(4) | | | 8.50 | % | | | 8.09 | % | | | 4.98 | % | | | | | | | | | |
| Tangible common equity to tangible assets (2)(4) | | | 5.98 | % | | | 5.75 | % | | | 3.91 | % | | | | | | | | | |
| Average equity to average assets | | | 13.63 | % | | | 11.24 | % | | | 21.26 | % | | | | | | | | | |
| (1) Common shareholders' equity is shareholders' equity less preferred stock. | | | | | | | | | | | |
| (2) Tangible common shareholders' equity is shareholders' equity less goodwill, intangible assets and preferred stock. | | | | | | | | | | |
| (3) Tangible shareholders' equity is shareholders' equity less goodwill and intangible assets. | | | | | | | | | | | |
| (4) Tangible assets is total assets less goodwill and intangible assets. | | | | | | | | | | | | | |
| | | | | | | | | | | | | | | | | | | | | | |
| | | | | | | | | | | | | | | | | | | | | | |
| | | Three Months Ended | | | | | | | Six Months Ended | | | | |
| | | June 30, | | | | | | | June 30, | | | | |
| | | 2009 | | | 2008 | | | % Change | | 2009 | | | 2008 | | | % Change |
| Operating Data: | | | | | | | | | | | | | | | | | | | | | |
| | | | | | | | | | | | | | | | | | | | | | |
| Total interest income | | $ | 34,856 | | | $ | 42,694 | | | | -18.36 | % | | $ | 70,236 | | | $ | 88,803 | | | | -20.91 | % |
| Total interest expense | | | 14,676 | | | | 17,650 | | | | -16.85 | % | | | 30,627 | | | | 39,287 | | | | -22.04 | % |
| Net interest income | | | 20,180 | | | | 25,044 | | | | -19.42 | % | | | 39,609 | | | | 49,516 | | | | -20.01 | % |
| Provision for loan losses | | | 24,384 | | | | 11,019 | | | | 121.29 | % | | | 25,369 | | | | 11,907 | | | | 113.06 | % |
| Net interest income (loss) after provision for loan losses | | | (4,204 | ) | | | 14,025 | | | | -129.98 | % | | | 14,240 | | | | 37,609 | | | | -62.14 | % |
| Non-interest income | | | 7,541 | | | | 8,112 | | | | -7.04 | % | | | 14,484 | | | | 15,418 | | | | -6.06 | % |
| Non-interest expense | | | 169,143 | | | | 20,140 | | | | 739.84 | % | | | 186,974 | | | | 39,701 | | | | 370.96 | % |
| Income (loss) before income taxes | | | (165,806 | ) | | | 1,997 | | | | N/M | | | | (158,250 | ) | | | 13,326 | | | | N/M | |
| Income tax expense (benefit) | | | (15,656 | ) | | | 535 | | | | N/M | | | | (12,880 | ) | | | 4,686 | | | | N/M | |
| Net income (loss) | | | (150,150 | ) | | | 1,462 | | | | N/M | | | | (145,370 | ) | | | 8,640 | | | | N/M | |
| Preferred stock dividend and accretion of discount on warrants | | | 1,250 | | | | - | | | | 100.00 | % | | | 2,482 | | | | - | | | | 100.00 | % |
| Net income (loss) available to common shareholders | | $ | (151,400 | ) | | $ | 1,462 | | | | N/M | | | $ | (147,852 | ) | | $ | 8,640 | | | | N/M | |
| | | | | | | | | | | | | | | | | | | | | | | | | |
| Comprehensive income (loss) | | $ | (150,557 | ) | | $ | (2,255 | ) | | | N/M | | | $ | (144,889 | ) | | $ | 6,931 | | | | N/M | |
| | | | | | | | | | | | | | | | | | | | | | | | | |
| Per Share of Common Stock: | | | | | | | | | | | | | | | | | | | | | | | | |
| Basic earnings (loss) | | $ | (11.58 | ) | | $ | 0.11 | | | | N/M | | | $ | (11.32 | ) | | $ | 0.67 | | | | N/M | |
| Diluted earnings (loss) | | $ | (11.58 | ) | | $ | 0.11 | | | | N/M | | | $ | (11.32 | ) | | $ | 0.67 | | | | N/M | |
| Dividends | | $ | 0.00 | | | $ | 0.13 | | | | -100.00 | % | | $ | 0.13 | | | $ | 0.26 | | | | -50.00 | % |
| | | | | | | | | | | | | | | | | | | | | | | | | |
| Weighted Average Shares Outstanding: | | | | | | | | | | | | | | | | | | | | | |
| Basic | | | 13,070,216 | | | | 12,931,669 | | | | | | | | 13,066,569 | | | | 12,931,419 | | | | | |
| Diluted | | | 13,070,216 | | | | 12,958,439 | | | | | | | | 13,066,569 | | | | 12,939,638 | | | | | |
| | | | | | | | | | | | | | | | | | | | | | | | | |
| | | Three Months Ended | | | Six Months Ended | | | | | |
| | | June 30, | | March 31, | | June 30, | | June 30, | | | | | |
| | | 2009 | | | 2009 | | | 2008 | | | 2009 | | | 2008 | | | | | |
| Key Financial Ratios: | | | | | | | | | | | | | | | | | | | | | | | | |
| | | | | | | | | | | | | | | | | | | | | | | | | |
| Return on average assets | | | -21.67 | % | | | 0.51 | % | | | 0.20 | % | | | -10.56 | % | | | 0.59 | % | | | | |
| Return on average shareholders' equity | | | -157.41 | % | | | 3.74 | % | | | 1.76 | % | | | -77.37 | % | | | 5.25 | % | | | | |
| Return on average common shareholders' equity (1) | | | -189.79 | % | | | 4.52 | % | | | 1.76 | % | | | -93.47 | % | | | 5.25 | % | | | | |
| Return on average common tangible shareholders' equity (2) | | | -363.33 | % | | | 8.84 | % | | | 3.33 | % | | | -180.70 | % | | | 9.99 | % | | | | |
| Interest rate spread | | | 3.26 | % | | | 3.01 | % | | | 3.70 | % | | | 3.13 | % | | | 3.65 | % | | | | |
| Net interest margin | | | 3.43 | % | | | 3.23 | % | | | 3.92 | % | | | 3.33 | % | | | 3.89 | % | | | | |
| (1) Common shareholders' equity is shareholders' equity less preferred stock. | | | | | | | | | | | | | |
| (2) Tangible common shareholders' equity is shareholders' equity less goodwill, intangible assets and preferred stock. | | | | | | | |
| | | | | | | | | | | | | | | | | | | | | | | | | |
| | | | | | | | | | | | | |
| | | | | | | | | | | | | | | | | | | | | | | | | |
| | | June 30, | | December 31, | | June 30, | | | | | | | | | | | | | |
| | | 2009 | | | 2008 | | | 2008 | | | | | | | | | | | | | |
| Asset Quality Ratios: | | | | | | | | | | | | | | | | | | | | | | | | |
| Nonperforming loans as a percentage of total loans, | | | | | | | | | | | | | | | | | |
| net of unearned income | | | 4.34 | % | | | 1.41 | % | | | 1.73 | % | | | | | | | | | | | | |
| Nonperforming assets as a percentage of total assets | | 4.91 | % | | | 2.61 | % | | | 2.03 | % | | | | | | | | | | | | |
| Allowance for loan losses as a percentage of total loans, | | | | | | | | | | | | | | | | |
| net of unearned income | | | 2.30 | % | | | 2.20 | % | | | 1.51 | % | | | | | | | | | | | | |
| Allowance for loan losses as a percentage of | | | | | | | | | | | | | | | | | | | | |
| nonperforming loans | | | 52.96 | % | | | 155.28 | % | | | 87.11 | % | | | | | | | | | | | | |
| Net charge-offs to average total loans, net of | | | | | | | | | | | | | | | | | | | | |
| unearned income | | | 1.08 | % | | | 1.63 | % | | | 0.45 | % | | | | | | | | | | | | |
| | | | | | | | | | | | | |
| GREEN BANKSHARES, INC. |
| Consolidated Financial Highlights |
| June 30, 2009 |
| (UNAUDITED) |
| | | | | | | | | | | | | | | | | | | | |
| Nonperforming Assets and Net Charge-offs | | | | | | | | Asset Quality Ratios | | | | | | | | | |
| | | | | | | | | | | | | | | | | | | | |
As of and for the three months ended June 30, 2009 | | Bank | | | Other | | | Total | | As of and for the three months ended June 30, 2009 | | Bank | | | Other | | | Consolidated |
| Loans past due 90 days and still accruing | | $ | 809 | | | $ | 11 | | | $ | 820 | | Nonperforming loans as a percentage of total loans, net of unearned income | | | 4.33 | % | | | 1.89 | % | | | 4.34 | % |
| Nonaccrual loans | | | 93,086 | | | | 803 | | | | 93,889 | | Nonperforming assets as a percentage of total assets | | | 4.88 | % | | | 2.00 | % | | | 4.91 | % |
| Other real estate owned and repossessed assets | | | 34,248 | | | | 220 | | | | 34,468 | | Allowance for loan losses as a percentage of total loans, net of unearned income | | | 2.15 | % | | | 8.11 | % | | | 2.30 | % |
| Total nonperforming assets | | $ | 128,143 | | | $ | 1,034 | | | $ | 129,177 | | Allowance for loan losses as a percentage of nonperforming loans | | | 49.70 | % | | | 428.99 | % | | | 52.96 | % |
| | | | | | | | | | | | | | YTD net charge-offs to average total loans, net of unearned income | | | 1.04 | % | | | 2.71 | % | | | 1.08 | % |
| YTD net charge-offs | | $ | 22,893 | | | $ | 1,130 | | | $ | 24,023 | | | | | | | | | | | | | | |
| | | | | | | | | | | | | | | | | | | | | | | | | | |
As of and for the three months ended June 30, 2008 | | Bank | | | Other | | | Total | | As of and for the three months ended June 30, 2008 | | Bank | | | Other | | | Consolidated |
| Loans past due 90 days and still accruing | | $ | 161 | | | $ | - | | | $ | 161 | | Nonperforming loans as a percentage of total loans, net of unearned income | | | 1.71 | % | | | 1.51 | % | | | 1.73 | % |
| Nonaccrual loans | | | 39,809 | | | | 610 | | | | 40,419 | | Nonperforming assets as a percentage of total assets | | | 2.00 | % | | | 2.13 | % | | | 2.03 | % |
| Other real estate owned and repossessed assets | | | 20,201 | | | | 431 | | | | 20,632 | | Allowance for loan losses as a percentage of total loans, net of unearned income | | | 1.37 | % | | | 8.02 | % | | | 1.51 | % |
| Total nonperforming assets | | $ | 60,171 | | | $ | 1,041 | | | $ | 61,212 | | Allowance for loan losses as a percentage of nonperforming loans | | | 80.34 | % | | | 530.82 | % | | | 87.11 | % |
| | | | | | | | | | | | | | YTD net charge-offs to average total loans, net of unearned income | | | 0.42 | % | | | 2.04 | % | | | 0.45 | % |
| YTD net charge-offs | | $ | 9,865 | | | $ | 802 | | | $ | 10,667 | | | | | | | | | | | | | | |
| | | | | | | | | | | | | | | | | | | | | | | | | | |
As of and for the year ended December 31, 2008 | | Bank | | | Other | | | Total | | As of and for the year ended December 31, 2008 | | Bank | | | Other | | | Consolidated |
| Loans past due 90 days and still accruing | | $ | 509 | | | $ | - | | | $ | 509 | | Nonperforming loans as a percentage of total loans, net of unearned income | | | 1.38 | % | | | 2.48 | % | | | 1.41 | % |
| Nonaccrual loans | | | 29,956 | | | | 970 | | | | 30,926 | | Nonperforming assets as a percentage of total assets | | | 2.58 | % | | | 2.57 | % | | | 2.61 | % |
| Other real estate owned and repossessed assets | | | 45,054 | | | | 317 | | | | 45,371 | | Allowance for loan losses as a percentage of total loans, net of unearned income | | | 2.06 | % | | | 8.27 | % | | | 2.20 | % |
| Total nonperforming assets | | $ | 75,519 | | | $ | 1,287 | | | $ | 76,806 | | Allowance for loan losses as a percentage of nonperforming loans | | | 149.59 | % | | | 333.81 | % | | | 155.28 | % |
| | | | | | | | | | | | | | Net charge-offs to average total loans, net of unearned income | | | 1.53 | % | | | 6.42 | % | | | 1.63 | % |
| Net charge-offs | | $ | 35,564 | | | $ | 2,546 | | | $ | 38,110 | | | | | | | | | | | | | | |
| | | | | | | | | | | | | | | | | | | | | | | | | | |
| | | | | | | | | | | | | | | | | | | | | | | | | | |
| GREEN BANKSHARES, INC. |
| Condensed Average Balances, Interest Rates and Yields |
| June 30, 2009 |
| | | | | | | | | | | | | | | | | | | | | | | | | | | | | | | | | | | | | |
| | | Three Months Ended | | | Six Months Ended | |
| | | June 30, | | | June 30, | |
| | | 2009 | | | 2008 | | | 2009 | | | 2008 | |
| | | | | | | | | | | | | | | | | | | | | | | | | | | | | | | | | | | | | |
| | | Average | | | | | | Average | | | Average | | | | | | Average | | | Average | | | | | | Average | | | Average | | | | | | Average | |
| | | Balance | | | Interest | | | Rate | | | Balance | | | Interest | | | Rate | | | Balance | | | Interest | | | Rate | | | Balance | | | Interest | | | Rate | |
| Interest-earning assets: | | | | | | | | | | | | | | | | | | | | | | | | | | | | | | | | | | | | |
| | | | | | | | | | | | | | | | | | | | | | | | | | | | | | | | | | | | | |
Loans(1)(2) | | | 2,127,104 | | | | 32,538 | | | | 6.14 | % | | | 2,340,923 | | | | 39,421 | | | | 6.77 | % | | | 2,151,190 | | | | 65,193 | | | | 6.11 | % | | | 2,332,642 | | | | 82,187 | | | | 7.09 | % |
Investment securities (2) | | | 195,390 | | | | 2,461 | | | | 5.05 | % | | | 246,541 | | | | 3,439 | | | | 5.61 | % | | | 206,015 | | | | 5,323 | | | | 5.21 | % | | | 246,202 | | | | 6,975 | | | | 5.70 | % |
| Other short-term investments | | | 59,883 | | | | 36 | | | | 0.24 | % | | | 4,358 | | | | 22 | | | | 2.03 | % | | | 65,141 | | | | 81 | | | | 0.25 | % | | | 2,408 | | | | 25 | | | | 2.09 | % |
Total interest-earning assets | | | 2,382,377 | | | | 35,035 | | | | 5.90 | % | | | 2,591,822 | | | | 42,882 | | | | 6.65 | % | | | 2,422,346 | | | | 70,597 | | | | 5.88 | % | | | 2,581,252 | | | | 89,187 | | | | 6.95 | % |
| | | | | | | | | | | | | | | | | | | | | | | | | | | | | | | | | | | | | | | | | | | | | | | | | |
| Non-interest earning assets | | | 420,404 | | | | | | | | | | | | 352,299 | | | | | | | | | | | | 402,244 | | | | | | | | | | | | 355,007 | | | | | | | | | |
| Total assets | | | 2,802,781 | | | | | | | | | | | | 2,944,121 | | | | | | | | | | | | 2,824,590 | | | | | | | | | | | | 2,936,259 | | | | | | | | | |
| | | | | | | | | | | | | | | | | | | | | | | | | | | | | | | | | | | | | | | | | | | | | | | | | |
| | | | | | | | | | | | | | | | | | | | | | | | | | | | | | | | | | | | | | | | | | | | | | | | | |
| Interest-bearing liabilities: | | | | | | | | | | | | | | | | | | | | | | | | | | | | | | | | | | | | | | | | | | | | | | | | |
Deposits: | | | | | | | | | | | | | | | | | | | | | | | | | | | | | | | | | | | | | | | | | | | | | | | | |
| Interest checking, money market and savings | | | 731,422 | | | | 2,542 | | | | 1.39 | % | | | 675,467 | | | | 2,255 | | | | 1.34 | % | | | 677,863 | | | | 4,394 | | | | 1.31 | % | | | 686,444 | | | | 5,580 | | | | 1.63 | % |
| Time deposits | | | 1,155,533 | | | | 8,969 | | | | 3.11 | % | | | 1,233,075 | | | | 11,122 | | | | 3.63 | % | | | 1,225,516 | | | | 19,770 | | | | 3.25 | % | | | 1,185,132 | | | | 23,732 | | | | 4.03 | % |
| Total interest bearing-deposits | | | 1,886,955 | | | | 11,511 | | | | 2.45 | % | | | 1,908,542 | | | | 13,377 | | | | 2.82 | % | | | 1,903,379 | | | | 24,164 | | | | 2.56 | % | | | 1,871,576 | | | | 29,312 | | | | 3.15 | % |
| | | | | | | | | | | | | | | | | | | | | | | | | | | | | | | | | | | | | | | | | | | | | | | | | |
| Securities sold under repurchase and short-term borrowings | | | 28,171 | | | | 7 | | | | 0.10 | % | | | 157,317 | | | | 700 | | | | 1.79 | % | | | 30,609 | | | | 16 | | | | 0.11 | % | | | 155,188 | | | | 1,792 | | | | 2.32 | % |
| Notes payable | | | 317,827 | | | | 3,158 | | | | 3.99 | % | | | 335,438 | | | | 3,573 | | | | 4.28 | % | | | 317,885 | | | | 6,447 | | | | 4.09 | % | | | 367,484 | | | | 8,183 | | | | 4.48 | % |
| Total interest-bearing liabilities | | | 2,232,953 | | | | 14,676 | | | | 2.64 | % | | | 2,401,297 | | | | 17,650 | | | | 2.96 | % | | | 2,251,873 | | | | 30,627 | | | | 2.74 | % | | | 2,394,248 | | | | 39,287 | | | | 3.30 | % |
| | | | | | | | | | | | | | | | | | | | | | | | | | | | | | | | | | | | | | | | | | | | | | | | | |
Non-interest bearing liabilities: | | | | | | | | | | | | | | | | | | | | | | | | | | | | | | | | | | | | | | | | | | | | | | | | |
| Demand Deposits | | | 162,458 | | | | | | | | | | | | 186,136 | | | | | | | | | | | | 165,268 | | | | | | | | | | | | 186,295 | | | | | | | | | |
| Other Liabilities | | | 21,597 | | | | | | | | | | | | 23,311 | | | | | | | | | | | | 22,098 | | | | | | | | | | | | 24,639 | | | | | | | | | |
| Total non-interest bearing liabilities | | | 184,055 | | | | | | | | | | | | 209,447 | | | | | | | | | | | | 187,366 | | | | | | | | | | | | 210,934 | | | | | | | | | |
| | | | | | | | | | | | | | | | | | | | | | | | | | | | | | | | | | | | | | | | | | | | | | | | | |
| Total liabilities | | | 2,417,008 | | | | | | | | | | | | 2,610,744 | | | | | | | | | | | | 2,439,239 | | | | | | | | | | | | 2,605,182 | | | | | | | | | |
| | | | | | | | | | | | | | | | | | | | | | | | | | | | | | | | | | | | | | | | | | | | | | | | | |
| Shareholders' equity | | | 385,773 | | | | | | | | | | | | 333,377 | | | | | | | | | | | | 385,351 | | | | | | | | | | | | 331,077 | | | | | | | | | |
| | | | | | | | | | | | | | | | | | | | | | | | | | | | | | | | | | | | | | | | | | | | | | | | | |
| Total liabilities & shareholders' equity | | | 2,802,781 | | | | | | | | | | | | 2,944,121 | | | | | | | | | | | | 2,824,590 | | | | | | | | | | | | 2,936,259 | | | | | | | | | |
| | | | | | | | | | | | | | | | | | | | | | | | | | | | | | | | | | | | | | | | | | | | | | | | | |
| Net interest income | | | | | | | 20,359 | | | | | | | | | | | | 25,232 | | | | | | | | | | | | 39,970 | | | | | | | | | | | | 49,900 | | | | | |
| | | | | | | | | | | | | | | | | | | | | | | | | | | | | | | | | | | | | | | | | | | | | | | | | |
| Interest rate spread | | | | | | | | | | | 3.26 | % | | | | | | | | | | | 3.70 | % | | | | | | | | | | | 3.13 | % | | | | | | | | | | | 3.65 | % |
| | | | | | | | | | | | | | | | | | | | | | | | | | | | | | | | | | | | | | | | | | | | | | | | | |
Net yield on interest-earning assets (net interest margin) | | | | 3.43 | % | | | | | | | | | | | 3.92 | % | | | | | | | | | | | 3.33 | % | | | | | | | | | | | 3.89 | % |
| | | | | | | | | | | | | | | | | | | | | | | | | | | | | | | | | | | | | | | | | | | | | | | | | |
(1)Average loan balances exclude nonaccrual loans for the periods presented. | | | | | | | | | | | | | | | | | | | | | | | | | | | |
| | | | | | | | | | | | | | | | | | | | | | | | | | | | | | | | | | | | | | | | | | | | | | | | | |
(2)Fully Taxable Equivalent (“FTE”) at the rate of 35%. The FTE basis adjusts for the tax benefits of income on certain tax-exempt loans and investments using the federal statutory rate of 35% for each period presented. The Company believes this measure to be the preferred industry measurement of net interest income and provides relevant comparison between taxable and non-taxable amounts. |
| GREEN BANKSHARES, INC. | |
| Consolidated Financial Highlights | |
| June 30, 2009 | |
| (UNAUDITED) | |
| | | | | | | | | | | | | | | | |
| | | June 30, 2009 | | | March 31, 2009 | | | | |
| Loans | | Balance | | | % | | | Balance | | | % | | | % Change | |
| Commercial | | $ | 300,325 | | | | 13.66 | % | | $ | 311,696 | | | | 13.80 | % | | | -3.65 | % |
| Commercial real estate | | | 1,409,007 | | | | 64.08 | % | | | 1,460,343 | | | | 64.63 | % | | | -3.52 | % |
| Residential real estate | | | 400,207 | | | | 18.20 | % | | | 396,000 | | | | 17.53 | % | | | 1.06 | % |
| Consumer | | | 86,491 | | | | 3.93 | % | | | 87,720 | | | | 3.88 | % | | | -1.40 | % |
| Other | | | 2,933 | | | | 0.13 | % | | | 3,598 | | | | 0.16 | % | | | -18.48 | % |
| Total loans | | | 2,198,963 | | | | 100.00 | % | | | 2,259,357 | | | | 100.00 | % | | | -2.67 | % |
| | | | | | | | | | | | | | | | | | | | | |
| Less: Unearned income | | | (15,209 | ) | | | | | | | (14,509 | ) | | | | | | | | |
| Loans, net of unearned income | | $ | 2,183,754 | | | | | | | $ | 2,244,848 | | | | | | | | | |
| | | | | | | | | | | | | | | | | | | | | |
| Loan Balances by Geographical Region and Operating Subsidiaries | | | | | | | | | | | | | |
| | | | | | | | | | | | | | | | | | | | | |
| | | June 30, 2009 | | | March 31, 2009 | | | | | |
| | | Loan | | | % to | | | Loan | | | % to | | | | | |
| | | Balance | | | Total Loans | | | Balance | | | Total Loans | | | % Change | |
| | | | | | | | | | | | | | | | | | | | | |
| Northeastern Tennessee Region1 | | $ | 529,615 | | | | 24.25 | % | | $ | 532,727 | | | | 23.73 | % | | | -0.58 | % |
| East Tennessee Region | | | 745,853 | | | | 34.15 | % | | | 776,550 | | | | 34.59 | % | | | -3.95 | % |
| Middle Tennessee Region | | | 865,204 | | | | 39.63 | % | | | 894,101 | | | | 39.83 | % | | | -3.23 | % |
| | | | | | | | | | | | | | | | | | | | | |
| GCB Acceptance Corporation | | | 19,081 | | | | 0.87 | % | | | 18,138 | | | | 0.81 | % | | | 5.20 | % |
| Superior Financial Services, Inc. | | | 24,001 | | | | 1.10 | % | | | 23,332 | | | | 1.04 | % | | | 2.87 | % |
| | | | | | | | | | | | | | | | | | | | | |
| Loans, net of unearned income | | $ | 2,183,754 | | | | 100.00 | % | | $ | 2,244,848 | | | | 100.00 | % | | | -2.72 | % |
| 1 Includes one branch located in Southwestern Virginia and one branch located in Northwestern North Carolina | | | | | |
| | | June 30, 2009 | | | March 31, 2009 | | | | | |
| Deposits | | Balance | | | % | | | Balance | | | % | | | % Change | |
| Non-interest bearing demand | | $ | 165,735 | | | | 8.18 | % | | $ | 168,178 | | | | 8.25 | % | | | -1.45 | % |
| Interest bearing demand | | | 585,149 | | | | 28.87 | % | | | 487,868 | | | | 23.93 | % | | | 19.94 | % |
| Money market and savings | | | 216,004 | | | | 10.66 | % | | | 170,033 | | | | 8.34 | % | | | 27.04 | % |
| Retail time | | | 606,192 | | | | 29.91 | % | | | 645,510 | | | | 31.67 | % | | | -6.09 | % |
| Jumbo time | | | 453,642 | | | | 22.38 | % | | | 566,931 | | | | 27.81 | % | | | -19.98 | % |
| Total | | $ | 2,026,722 | | | | 100.00 | % | | $ | 2,038,520 | | | | 100.00 | % | | | -0.58 | % |
| | | | | | | | | | | | | | | | | | | | | |
| Deposit Balances by Geographical Region | | | | | | | | | | | | | | | | | | | | |
| | | | | | | | | | | | | | | | | | | | | |
| | | June 30, 2009 | | | March 31, 2009 | | | | | |
| | | Balance | | | % | | | Balance | | | % | | | % Change | |
| Northeastern Tennessee Region1 | | $ | 782,706 | | | | 38.62 | % | | $ | 809,366 | | | | 39.70 | % | | | -3.29 | % |
| East Tennessee Region | | | 290,683 | | | | 14.34 | % | | | 273,726 | | | | 13.43 | % | | | 6.19 | % |
| Middle Tennessee Region | | | 953,333 | | | | 47.04 | % | | | 955,428 | | | | 46.87 | % | | | -0.22 | % |
| | | | | | | | | | | | | | | | | | | | | |
| Total | | $ | 2,026,722 | | | | 100.00 | % | | $ | 2,038,520 | | | | 100.00 | % | | | -0.58 | % |
| 1 Includes one branch located in Southwestern Virginia and one branch located in Northwestern North Carolina | |
| | | | | | | | | | | | | | | | | | | | | |