Exhibit 99.1
![logo](https://capedge.com/proxy/8-K/0001157523-10-000207/logo.jpg)
CONTACT: | James E. Adams |
Executive Vice President and Chief Financial Officer | |
423-278-3050 |
GREEN BANKSHARES REPORTS FOURTH QUARTER RESULTS
GREENEVILLE, Tenn. (January 19, 2010) – Green Bankshares, Inc. (NASDAQ:GRNB), the holding company for GreenBank, today reported a net loss available to common shareholders for the fourth quarter of 2009 of $76,000 compared with a net loss for the third quarter of 2009 of $7.7 million and a net loss of $15.3 million for the fourth quarter of 2008. On a diluted per share basis, the net loss for the fourth quarter of 2009 was $0.01 compared with a net loss of $0.59 for the third quarter of 2009 and a net loss of $1.18 for the year-earlier quarter. Excluding preferred stock dividends paid and accretion of discount on common stock warrants issued to the U.S. Treasury, the Company reported net income of $1.2 million for the fourth quarter of 2009 compared with a net loss of $6.5 million for the third quarter of 2009 and a net loss of $15.2 million for the fourth quarter of 2008. Highlights for the quarter include:
● | Credit Quality (000’s omitted): |
4Q09 | 3Q09 | 2Q09 | 1Q09 | 4Q08 | ||||||||||||||||
Net charge-offs | $ | 6,437 | $ | 18,436 | $ | 23,281 | $ | 742 | $ | 18,328 | ||||||||||
New non-accrual loans added | $ | 31,111 | $ | 47,931 | $ | 57,292 | $ | 58,073 | $ | 59,660 | ||||||||||
Reserves to total loans | 2.45 | % | 2.39 | % | 2.30 | % | 2.19 | % | 2.20 | % | ||||||||||
Non-performing assets | $ | 132,726 | $ | 125,091 | $ | 129,177 | $ | 121,272 | $ | 76,806 |
● | Credit costs were reduced; net loan charge-offs totaled $6.4 million for the fourth quarter of 2009, declining from $18.5 million in the third quarter of the year and $18.3 million in the fourth quarter of 2008; |
● | Non-performing assets (NPAs) totaled $132.7 million at December 31, 2009, versus $125.0 million at September 30, 2009; the ratio of NPAs to total assets was 5.07% at December 31, 2009, compared with 4.48% at September 30, 2009; NPAs were written down 28%, on average, at December 31, 2009; |
● | GreenBank's estimated regulatory capital levels remained strong at December 31, 2009, with Tier 1 Leverage at 10.71%, Tier 1 Risk-Based Capital at 13.62%, and Total Risk-Based Capital at 14.88%; the Company’s tangible common equity to tangible assets ratio was 5.77% at December 31, 2009(please refer to the non-GAAP measurement reconciliation on page 5). |
Risk Based Capital Ratios:
12/31/09 | 9/30/09 | 12/31/08 | ||||||||||
Tier 1 Leverage | 10.70 | % | 10.49 | % | 10.98 | % | ||||||
Tier 1 Risk Based | 13.61 | % | 13.17 | % | 13.29 | % | ||||||
Total Risk Based | 14.87 | % | 14.43 | % | 14.55 | % |
-MORE-
Green Bankshares, Inc. ▪ 100 North Main Street ▪ Greeneville, TN 37743 ▪ (423) 639-5111
GRNB Reports Fourth Quarter Results
Page 2
January 19, 2010
● | Net interest margin: |
Dec. 09 | Nov. 09 | Oct. 09 | ||||||||||
Net interest margin by month | 3.53% | 3.40% | 3.18% |
● | Net interest margin for the fourth quarter of 2009 was 3.37%, including the impact of interest reversals of $421,860, improving from 3.33% for the third quarter of 2009 and 3.30% for the year-earlier quarter. |
For the year ended December 31, 2009, the Company reported a net loss available to common shareholders of $155.7 million or $11.91 per diluted share, which was affected significantly by an after-tax, non-recurring, non-cash goodwill impairment charge of $137.4 million or $10.51 per diluted share recorded in the second quarter of 2009. Excluding the goodwill impairment charge, the Company’s net operating loss for 2009 was $18.3 million or $1.40 per diluted share versus net income of $5.5 million or $0.42 per diluted share for the year ended December 31, 2008 (please refer to the non-GAAP measures reconciliation on page 5).
Stan Puckett, Chairman and Chief Executive Officer, commented, "Although the economic climate in which we operate remains under considerable pressure, we were pleased to see stabilization in several areas of our business as 2009 came to an end. While NPAs remain elevated, we believe that the credit cycle crested in 2009 and credit costs now have begun to moderate, as seen by lower net loan charge-offs and OREO costs. Also, lower funding costs have continued to drive improvements in net interest income and net interest margin. Although we are cautiously optimistic about these positive developments, we will continue to work aggressively to identify and address problem loans in 2010 and build on the trends that are now emerging in our business."
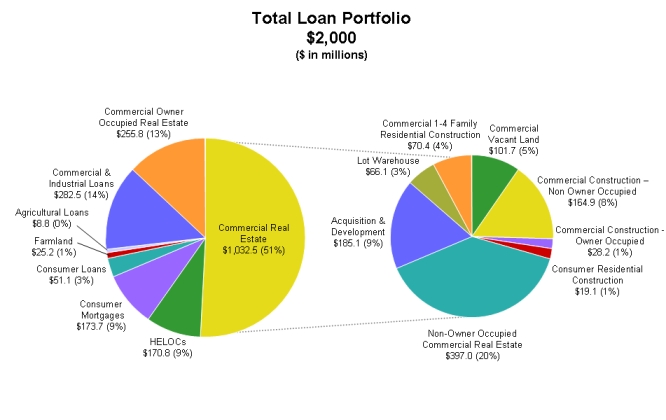
The following information graphically displays the Bank only loan portfolio detail, by purpose code, at December 31, 2009:
![graphic](https://capedge.com/proxy/8-K/0001157523-10-000207/graphic.jpg)
-MORE-
GRNB Reports Fourth Quarter Results
Page 3
January 19, 2010
The following is a breakdown of the Bank's commercial real estate portfolio, by purpose code, between the periods presented:
December 31, 2009 from December 31, 2008 | ||||||||||||||||||||
(Dollars in thousands) | Dec. 31, 2009 | Sept. 30, 2009 | Dec. 31, 2008 | Change | % Change | |||||||||||||||
Commercial Real Estate Portfolio | ||||||||||||||||||||
Acquisition & development | $ | 185,087 | $ | 190,826 | $ | 242,343 | $ | (57,256 | ) | -23.63 | % | |||||||||
Lot warehouse | 66,104 | 68,948 | 79,555 | (13,451 | ) | -16.91 | % | |||||||||||||
Commercial 1-4 family construction | 70,434 | 83,155 | 160,786 | (90,352 | ) | -56.19 | % | |||||||||||||
Total speculative 1-4 family | 321,625 | 342,929 | 482,684 | (161,059 | ) | -33.37 | % | |||||||||||||
Commercial vacant land | 101,679 | 102,312 | 103,160 | (1,481 | ) | -1.44 | % | |||||||||||||
Commercial construction non-owner occupied | 164,887 | 174,199 | 144,344 | 20,543 | 14.23 | % | ||||||||||||||
Commercial construction owner occupied | 28,213 | 37,034 | 55,305 | (27,092 | ) | -48.99 | % | |||||||||||||
Consumer residential construction | 19,073 | 23,833 | 27,632 | (8,559 | ) | -30.97 | % | |||||||||||||
Total construction and development | 313,852 | 337,378 | 330,441 | (16,589 | ) | -5.02 | % | |||||||||||||
Non-owner occupied commercial real estate | 397,028 | 396,889 | 381,168 | 15,860 | 4.16 | % | ||||||||||||||
Total commercial real estate | $ | 1,032,505 | $ | 1,077,196 | $ | 1,194,293 | $ | (161,788 | ) | -13.55 | % |
The following table reflects the changes in NPA balances from September 30, 2009 through December 31, 2009:
(Dollars in thousands) | Non-Accrual Loans | OREO Balances | Past Due > 90 days | Total | ||||||||||||
September 30, 2009 | $ | 67,147 | $ | 56,413 | $ | 1,531 | $ | 125,091 | ||||||||
Loan foreclosures | (5,577 | ) | 5,577 | n/a | n/a | |||||||||||
Gross loan charge-offs | (7,299 | ) | n/a | n/a | (7,299 | ) | ||||||||||
New non-accrual loans | 31,111 | n/a | n/a | 31,111 | ||||||||||||
Reduction of non-accrual loans | (9,971 | ) | n/a | n/a | (9,971 | ) | ||||||||||
OREO sales proceeds | n/a | (3,672 | ) | n/a | (3,672 | ) | ||||||||||
OREO write-downs, net | n/a | (1,150 | ) | n/a | (1,150 | ) | ||||||||||
Decrease in 90 day past due loans | n/a | n/a | (1,384 | ) | (1,384 | ) | ||||||||||
December 31, 2009 | $ | 75,411 | $ | 57,168 | $ | 147 | $ | 132,726 |
-MORE-
GRNB Reports Fourth Quarter Results
Page 4
January 19, 2010
Non-interest income totaled $8.1 million for the three months ended December 31, 2009, down from $9.2 million for the third quarter of 2009 and $10.2 million in the year-earlier quarter. The sequential quarter decline primarily reflected lower other income relating to non-recurring items totaling $468,000 associated with insurance proceeds received and a gain on the sale of undeveloped land adjacent to a branch facility, service charges on deposit accounts, and securities gains, while the year-over-year quarterly decline was due primarily to lower securities gains. For the year, non-interest income declined to $31.6 million from $33.6 million in 2008, primarily due to lower securities gains, including other than temporary impairment charges, which were offset to some extent by higher service charges. The ongoing success of GreenBank's High Performance Checking product added 15,810 net new checking account customers during the year, for a new account opening ratio of 2.18 new accounts opened for each account closed and increasing deposit service charge revenues by $562,000.
Non-interest expense totaled $20.5 million for the fourth quarter ended December 31, 2009, compared with $22.4 million for the third quarter of 2009 and $24.2 million for the fourth quarter of 2008. The decline in non-interest expense of $1.9 million or 8% from the third quarter was principally due to lower losses on OREO, while the year-over-year quarterly decline reflected lower OREO losses offset somewhat by higher FDIC insurance. Non-interest expense for 2009 totaled $229.6 million, including a one-time, non-cash goodwill impairment charge of $143.4 million. Excluding this impairment charge, non-interest expense for 2009 was $86.2 million, up $361,000 or less than 1% from 2008 (please refer to the non-GAAP measurement reconciliation on page 5).
Greeneville, Tennessee-based Green Bankshares, Inc., with total assets of approximately $2.619 billion, is the holding company for GreenBank. GreenBank, which traces its origin to 1890, has 63 branches across East and Middle Tennessee, and one branch each in Bristol, Virginia, and Hot Springs, North Carolina. It also provides wealth management services through its GreenWealth Division and residential mortgage lending through its Mortgage Division. In addition, GreenBank conducts separate businesses through three wholly owned subsidiaries: Superior Financial Services, Inc., a consumer finance company; GCB Acceptance Corporation, a consumer finance company specializing in automobile lending; and Fairway Title Co., a title insurance company.
Certain matters discussed in this news release are not historical facts but are "forward-looking statements" within the meaning of and are furnished pursuant to the Private Securities Litigation Reform Act of 1995. All forward-looking statements involve risk and uncertainty and actual results could differ materially from the anticipated results or other expectations expressed in the forward-looking statements. Risks and uncertainties related to the Company's business are discussed in the Company's SEC filings, including its Annual Report on Form 10-K for the year ended December 31, 2008 and further updated in its Quarterly Report on Form 10-Q for the quarter ended September 30, 2009, and include, but are not limited to, (1) deterioration in the financial condition of borrowers resulting in significant increases in loan losses and provisions for those losses; (2) continuation of the historically low short-term interest rate environment; (3) changes in loan underwriting, credit review or loss reserve policies associated with economic conditions, examination conclusions, or regulatory developments; (4) increased competition with other financial institutions in the markets that GreenBank serves; (5) greater than anticipated deterioration or lack of sustained growth in the national or local economies; (6) rapid fluctuations or unanticipated changes in interest rates; (7) the impact of governmental restrictions on entities participating in the Capital Purchase Program of the United States Department of the Treasury; (8) changes in state and federal legislation, regulations or policies applicable to banks or other financial service providers, including regulatory or legislative developments arising out of current unsettled conditions in the economy and (9) the loss of key personnel. The Company undertakes no obligation to update forward-looking statements.
-MORE-
GRNB Reports Fourth Quarter Results
Page 5
January 19, 2010
GREEN BANKSHARES, INC.
Reconciliation of Non-GAAP Measures Presented in Earnings Release
(Dollars in thousands)
Year Ended | ||||||||
Dec. 31, 2009 | Dec. 31, 2008 | |||||||
Total non-interest expense | $ | 229,587 | $ | 85,837 | ||||
Goodwill impairment charge | (143,389 | ) | – | |||||
Operating expenses | $ | 86,198 | $ | 85,837 | ||||
Net income (loss) available to common shareholders | $ | (155,676 | ) | $ | (5,452 | ) | ||
Goodwill impairment charge, net of tax of $5,975 | 137,414 | – | ||||||
Net operating income (loss) | $ | (18,262 | ) | $ | (5,452 | ) | ||
Per Diluted Share: | ||||||||
Net income (loss) available to common shareholders | $ | (11.91 | ) | $ | (0.42 | ) | ||
Goodwill impairment charge, net of tax | 10.51 | – | ||||||
Net operating income (loss) | $ | (1.40 | ) | $ | (0.42 | ) | ||
Total shareholders' equity | $ | 226,769 | $ | 381,231 | ||||
Less: | ||||||||
Goodwill | – | (143,389 | ) | |||||
Core deposit and other intangibles | (9,335 | ) | (12,085 | ) | ||||
Preferred stock | (66,735 | ) | (65,346 | ) | ||||
Tangible common equity | $ | 150,699 | $ | 160,411 | ||||
Total assets | $ | 2,619,139 | $ | 2,944,671 | ||||
Less: | ||||||||
Goodwill | – | (143,389 | ) | |||||
Core deposit and other intangibles | (9,335 | ) | (12,085 | ) | ||||
Total tangible assets | $ | 2,609,804 | $ | 2,789,197 |
Use of Non-GAAP financial measures
The above table presents computations and other financial information excluding the goodwill impairment charge (non-GAAP). The goodwill impairment charge is included in the financial results presented in accordance with generally accepted accounting principles (GAAP). The Company believes that the exclusion of goodwill impairment in expressing net operating income (loss), operating expenses and earnings (loss) per diluted share data provides a more meaningful base for period to period comparisons which will assist investors in analyzing the operating results of the Company and predicting operating performance. The Company utilizes these non-GAAP financial measures to compare the operating performance with comparable periods in prior years and with internally prepared projections. Non-GAAP financial measures have inherent limitations, are not required to be uniformly applied and are not audited. To mitigate these limitations, the Company has policies in place to address goodwill impairment from other normal operating expenses to ensure that the Company's operating results are properly reflected for period to period comparisons.
-MORE-
GRNB Reports Fourth Quarter Results
Page 6
January 19, 2010
GREEN BANKSHARES, INC.
Unaudited Financial Highlights
(In thousands, except per share amounts)
Three Months Ended | Year Ended | |||||||||||||||||||
Dec. 31, 2009 | Sept. 30, 2009 | Dec. 31, 2008 | Dec. 31, 2009 | Dec. 31, 2008 | ||||||||||||||||
Interest income | $ | 33,424 | $ | 34,796 | $ | 39,147 | $ | 138,456 | $ | 170,516 | ||||||||||
Interest expense | 12,846 | 14,458 | 18,022 | 57,931 | 75,491 | |||||||||||||||
Net interest income | 20,578 | 20,338 | 21,125 | 80,525 | 95,025 | |||||||||||||||
Provision for loan losses | 6,402 | 18,475 | 32,283 | 50,246 | 52,810 | |||||||||||||||
Net interest income (loss) after provision for loan losses | 14,176 | 1,863 | (11,158 | ) | 30,279 | 42,215 | ||||||||||||||
Non-interest income | 8,134 | 9,189 | 10,186 | 31,578 | 33,614 | |||||||||||||||
Non-interest expense | 20,477 | 22,365 | 24,192 | 229,587 | 85,837 | |||||||||||||||
Income (loss) before income taxes | 1,833 | (11,313 | ) | (25,164 | ) | (167,730 | ) | (10,008 | ) | |||||||||||
Provision (benefit) for income taxes | 659 | (4,815 | ) | (9,930 | ) | (17,036 | ) | (4,648 | ) | |||||||||||
Net income (loss) | 1,174 | (6,498 | ) | (15,234 | ) | (150,694 | ) | (5,360 | ) | |||||||||||
Preferred stock dividends and related costs | 1,250 | 1,250 | 92 | 4,982 | 92 | |||||||||||||||
Net income (loss) available to common shareholders | $ | (76 | ) | $ | (7,748 | ) | $ | (15,326 | ) | $ | (155,676 | ) | $ | (5,452 | ) | |||||
Comprehensive income (loss) | $ | 120 | $ | (5,073 | ) | $ | (16,008 | ) | $ | (149,962 | ) | $ | (7,530 | ) | ||||||
Earnings (loss) per share: | ||||||||||||||||||||
Basic | $ | (0.01 | ) | $ | (0.59 | ) | $ | (1.18 | ) | $ | (11.91 | ) | $ | (0.42 | ) | |||||
Diluted | $ | (0.01 | ) | $ | (0.59 | ) | $ | (1.18 | ) | $ | (11.91 | ) | $ | (0.42 | ) | |||||
Weighted average shares: | ||||||||||||||||||||
Basic | 13,070 | 13,070 | 12,936 | 13,068 | 12,933 | |||||||||||||||
Diluted 1 | 13,070 | 13,070 | 12,999 | 13,068 | 12,991 | |||||||||||||||
Dividends declared per share | $ | 0.00 | $ | 0.00 | $ | 0.13 | $ | 0.13 | $ | 0.52 |
Dec. 31, 2009 | Sept. 30, 2009 | Dec. 31, 2008 | ||||||||||
Total assets | $ | 2,619,139 | $ | 2,794,217 | $ | 2,944,671 | ||||||
Cash and cash equivalents | 210,494 | 346,131 | 198,358 | |||||||||
Investment securities | 161,084 | 168,307 | 217,249 | |||||||||
Loans, net of unearned interest | 2,043,807 | 2,099,267 | 2,223,390 | |||||||||
Allowance for loan losses | (50,161 | ) | (50,196 | ) | (48,811 | ) | ||||||
Deposits | 2,084,096 | 2,214,761 | 2,184,147 | |||||||||
Shareholders' equity | 226,769 | 227,388 | 381,231 | |||||||||
Common shareholders' equity 2 | 160,034 | 161,000 | 315,885 | |||||||||
Tangible common shareholders' equity 3 | 150,699 | 151,019 | 160,411 | |||||||||
Common book value per share 2 | 12.15 | 12.22 | 24.09 | |||||||||
Tangible common book value per share 3 | 11.44 | 11.47 | 12.23 |
1 | Diluted weighted average shares outstanding exclude 101,258 and 101,636 restricted average shares for the three-month periods ended December 31, 2009, and September 30, 2009, respectively, because their impact would be anti-dilutive. Diluted weighted average shares outstanding also exclude 96,971 restricted average shares for the year ended December 31, 2009. |
2 | Common shareholders' equity is shareholders' equity less preferred stock. |
3 | Tangible common shareholders' equity is shareholders' equity less goodwill, intangible assets and preferred stock. |
-END-
GREEN BANKSHARES, INC. | ||||||||||||
Consolidated Balance Sheets | ||||||||||||
December 31, 2009, September 30, 2009 and December 31, 2008 | ||||||||||||
(Dollars in thousands) | ||||||||||||
(Unaudited) | (Unaudited) | |||||||||||
December 31, | September 30, | December 31, | ||||||||||
2009 | 2009 | 2008* | ||||||||||
ASSETS | ||||||||||||
Cash and due from banks | $ | 206,701 | $ | 345,209 | $ | 193,095 | ||||||
Federal funds sold | 3,793 | 922 | 5,263 | |||||||||
Cash and cash equivalents | 210,494 | 346,131 | 198,358 | |||||||||
Interest earning deposits in other banks | 11,000 | 1,000 | - | |||||||||
Securities available-for-sale ("AFS") | 147,724 | 154,937 | 203,562 | |||||||||
Securities held-to-maturity (with a market value of $638, $601 and $644 | ||||||||||||
on December 31, 2009, September 30, 2009 and December 31, 2008) | 626 | 636 | 657 | |||||||||
FHLB and other stock, at cost | 12,734 | 12,734 | 13,030 | |||||||||
Loans held for sale | 1,533 | 1,064 | 442 | |||||||||
Loans, net of unearned income | 2,043,807 | 2,099,267 | 2,223,390 | |||||||||
Allowance for loan losses | (50,161 | ) | (50,196 | ) | (48,811 | ) | ||||||
Other real estate owned and repossessed assets | 57,168 | 56,413 | 45,371 | |||||||||
Bank premises and equipment, net | 81,818 | 82,551 | 83,359 | |||||||||
Cash surrender value of life insurance | 30,277 | 29,997 | 29,539 | |||||||||
Goodwill | - | - | 143,389 | |||||||||
Core deposit and other intangibles | 9,335 | 9,981 | 12,085 | |||||||||
Other assets | 62,784 | 49,702 | 40,300 | |||||||||
Total assets | $ | 2,619,139 | $ | 2,794,217 | $ | 2,944,671 | ||||||
LIABILITIES AND SHAREHOLDERS' EQUITY | ||||||||||||
Non-interest-bearing deposits | $ | 177,602 | $ | 156,797 | $ | 176,685 | ||||||
Interest-bearing deposits | 1,899,910 | 1,998,157 | 1,645,115 | |||||||||
Brokered deposits | 6,584 | 59,807 | 362,347 | |||||||||
Total deposits | 2,084,096 | 2,214,761 | 2,184,147 | |||||||||
Federal funds purchased | - | - | - | |||||||||
Repurchase agreements | 24,449 | 25,294 | 35,302 | |||||||||
FHLB advances and notes payable | 171,999 | 216,578 | 229,349 | |||||||||
Subordinated debentures | 88,662 | 88,662 | 88,662 | |||||||||
Accrued interest payable and other liabilities | 23,164 | 21,534 | 25,980 | |||||||||
Total liabilities | 2,392,370 | 2,566,829 | 2,563,440 | |||||||||
SHAREHOLDERS' EQUITY | ||||||||||||
Preferred stock: no par value, 1,000,000 shares authorized; | ||||||||||||
72,278, 72,278 and -0- shares outstanding | 66,735 | 66,388 | 65,346 | |||||||||
Common stock: $2 par value, 20,000,000 shares authorized; | ||||||||||||
13,171,474, 13,171,474 and 13,112,687 shares outstanding | 26,343 | 26,343 | 26,225 | |||||||||
Common stock warrants | 6,934 | 6,934 | 6,934 | |||||||||
Additional paid in capital | 188,310 | 188,146 | 187,742 | |||||||||
Retained earnings (deficit) | (61,742 | ) | (61,666 | ) | 95,647 | |||||||
Accumulated other comprehensive income (loss) | 189 | 1,243 | (663 | ) | ||||||||
Total shareholders' equity | 226,769 | 227,388 | 381,231 | |||||||||
Total liabilities & shareholders' equity | $ | 2,619,139 | $ | 2,794,217 | $ | 2,944,671 | ||||||
* Derived from Audited Consolidated Financial Statements. |
GREEN BANKSHARES, INC. |
Consolidated Statements of Income and Comprehensive Income |
Three Months Ended December 31, 2009, September 30, 2009 and December 31, 2008 and Twelve Months Ended December 31, 2009 and 2008 |
(Unaudited) |
Three Months Ended | Twelve Months Ended | |||||||||||||||||||
December 31, | September 30, | December 31, | December 31, | December 31, | ||||||||||||||||
2009 | 2009 | 2008 | 2009 | 2008 | ||||||||||||||||
Interest income: | ||||||||||||||||||||
Interest and fees on loans | $ | 31,480 | $ | 32,559 | $ | 34,974 | $ | 129,212 | $ | 155,627 | ||||||||||
Taxable securities | 1,303 | 1,669 | 3,636 | 7,035 | 12,770 | |||||||||||||||
Nontaxable securities | 311 | 315 | 320 | 1,260 | 1,297 | |||||||||||||||
FHLB and other stock | 137 | 151 | 154 | 573 | 647 | |||||||||||||||
Federal funds sold and other | 193 | 102 | 63 | 376 | 175 | |||||||||||||||
Total interest income | 33,424 | 34,796 | 39,147 | 138,456 | 170,516 | |||||||||||||||
Interest expense: | ||||||||||||||||||||
Deposits | 10,124 | 11,480 | 14,433 | 45,768 | 58,090 | |||||||||||||||
Federal funds purchased and repurchase agreements | 7 | 6 | 57 | 29 | 2,111 | |||||||||||||||
FHLB advances and notes payable | 2,229 | 2,416 | 2,467 | 9,557 | 10,735 | |||||||||||||||
Subordinated debentures | 486 | 556 | 1,065 | 2,577 | 4,555 | |||||||||||||||
Total interest expense | 12,846 | 14,458 | 18,022 | 57,931 | 75,491 | |||||||||||||||
Net interest income | 20,578 | 20,338 | 21,125 | 80,525 | 95,025 | |||||||||||||||
Provision for loan losses | 6,402 | 18,475 | 32,283 | 50,246 | 52,810 | |||||||||||||||
Net interest income (loss) after provision for loan losses | 14,176 | 1,863 | (11,158 | ) | 30,279 | 42,215 | ||||||||||||||
Non-interest income: | ||||||||||||||||||||
Service charges on deposit accounts | 6,141 | 6,446 | 5,651 | 23,738 | 23,176 | |||||||||||||||
Other charges and fees | 540 | 505 | 681 | 1,999 | 2,192 | |||||||||||||||
Trust and investment services income | 505 | 595 | 480 | 1,977 | 1,878 | |||||||||||||||
Mortgage banking income | 91 | 127 | 115 | 383 | 804 | |||||||||||||||
Other income | 619 | 1,086 | 670 | 3,042 | 2,903 | |||||||||||||||
Securities gains (losses), net | ||||||||||||||||||||
Realized gains (losses), net | 482 | 933 | 2,589 | 1,415 | 2,661 | |||||||||||||||
Other-than-temporary impairment | (946 | ) | (503 | ) | - | (1,678 | ) | - | ||||||||||||
Less non-credit portion recognized in other comprehensive income | 702 | - | - | 702 | - | |||||||||||||||
Total securities gains (losses), net | 238 | 430 | 2,589 | 439 | 2,661 | |||||||||||||||
Total non-interest income | 8,134 | 9,189 | 10,186 | 31,578 | 33,614 | |||||||||||||||
Non-interest expense: | ||||||||||||||||||||
Employee compensation | 7,540 | 7,315 | 7,995 | 30,611 | 33,615 | |||||||||||||||
Employee benefits | 785 | 526 | 1,145 | 3,835 | 4,788 | |||||||||||||||
Occupancy expense | 1,695 | 1,762 | 1,790 | 6,956 | 6,900 | |||||||||||||||
Equipment expense | 694 | 761 | 989 | 3,092 | 3,555 | |||||||||||||||
Computer hardware/software expense | 793 | 735 | 686 | 2,816 | 2,752 | |||||||||||||||
Professional services | 676 | 457 | 641 | 2,108 | 2,069 | |||||||||||||||
Advertising | 473 | 678 | 1,140 | 1,894 | 3,538 | |||||||||||||||
Loss on OREO and repossessed assets | 1,151 | 3,578 | 4,006 | 8,156 | 7,028 | |||||||||||||||
FDIC insurance | 891 | 819 | 450 | 4,960 | 1,631 | |||||||||||||||
Core deposit and other intangible amortization | 646 | 648 | 644 | 2,750 | 2,602 | |||||||||||||||
Goodwill impairment | - | - | - | 143,389 | - | |||||||||||||||
Other expenses | 5,133 | 5,086 | 4,706 | 19,020 | 17,359 | |||||||||||||||
Total non-interest expense | 20,477 | 22,365 | 24,192 | 229,587 | 85,837 | |||||||||||||||
Income (loss) before income taxes | 1,833 | (11,313 | ) | (25,164 | ) | (167,730 | ) | (10,008 | ) | |||||||||||
Income taxes provision (benefit) | 659 | (4,815 | ) | (9,930 | ) | (17,036 | ) | (4,648 | ) | |||||||||||
Net income (loss) | 1,174 | (6,498 | ) | (15,234 | ) | (150,694 | ) | (5,360 | ) | |||||||||||
Preferred stock dividends and accretion of discount on warrants | 1,250 | 1,250 | 92 | 4,982 | 92 | |||||||||||||||
Net income (loss) available to common shareholders | $ | (76 | ) | $ | (7,748 | ) | $ | (15,326 | ) | $ | (155,676 | ) | $ | (5,452 | ) | |||||
Comprehensive income (loss) | $ | 120 | $ | (5,073 | ) | $ | (16,008 | ) | $ | (149,842 | ) | $ | (7,530 | ) | ||||||
Per share of common stock: | ||||||||||||||||||||
Basic earnings (loss) | $ | (0.01 | ) | $ | (0.59 | ) | $ | (1.18 | ) | $ | (11.91 | ) | $ | (0.42 | ) | |||||
Diluted earnings (loss) | $ | (0.01 | ) | $ | (0.59 | ) | $ | (1.18 | ) | $ | (11.91 | ) | $ | (0.42 | ) | |||||
Dividends | $ | 0.00 | $ | 0.00 | $ | 0.13 | $ | 0.13 | $ | 0.52 | ||||||||||
Weighted average shares outstanding: | ||||||||||||||||||||
Basic | 13,070,216 | 13,070,216 | 12,935,665 | 13,068,407 | 12,932,576 | |||||||||||||||
Diluted(1) | 13,070,216 | 13,070,216 | 12,998,685 | 13,068,407 | 12,990,790 | |||||||||||||||
(1) Diluted weighted average shares outstanding for the three and twelve months ended December 31, 2009 excludes 101,258 and 96,971 shares, respectively, because they are anti-dilutive. | ||||||||||||||||||||
Non-GAAP Measures Presented in Earnings Release | ||||||||||||||||||||
Total non-interest expense | $ | 20,477 | $ | 22,365 | $ | 24,192 | $ | 229,587 | $ | 85,837 | ||||||||||
Goodwill impairment charge | - | - | - | (143,389 | ) | - | ||||||||||||||
Operating expenses | $ | 20,477 | $ | 22,365 | $ | 24,192 | $ | 86,198 | $ | 85,837 | ||||||||||
Net income (loss) available to common shareholders | $ | (76 | ) | $ | (7,748 | ) | $ | (15,326 | ) | $ | (155,676 | ) | $ | (5,452 | ) | |||||
Goodwill impairment charge, net of tax | - | - | - | 137,414 | - | |||||||||||||||
Net operating income (loss) | $ | (76 | ) | $ | (7,748 | ) | $ | (15,326 | ) | $ | (18,262 | ) | $ | (5,452 | ) | |||||
GREEN BANKSHARES, INC. |
Consolidated Financial Highlights |
(UNAUDITED) |
December 31, | December 31, | % | ||||||||||
2009 | 2008 | Change | ||||||||||
Financial Condition Data: | ||||||||||||
Assets | $ | 2,619,139 | $ | 2,944,671 | -11.05 | % | ||||||
Loans, net of unearned interest | 2,043,807 | 2,223,390 | -8.08 | % | ||||||||
Cash and investments | 382,578 | 415,607 | -7.95 | % | ||||||||
Federal funds sold | 3,793 | 5,263 | -27.93 | % | ||||||||
Deposits | 2,084,096 | 2,184,147 | -4.58 | % | ||||||||
FHLB advances and notes payable | 171,999 | 229,349 | -25.01 | % | ||||||||
Subordinated debentures | 88,662 | 88,662 | 0.00 | % | ||||||||
Repurchase agreements | 24,449 | 35,302 | -30.74 | % | ||||||||
Shareholders' equity | 226,769 | 381,231 | -40.52 | % | ||||||||
Common shareholders' equity (1) | 160,034 | 315,885 | -49.34 | % | ||||||||
Tangible common shareholders' equity (2) | 150,699 | 160,411 | -6.05 | % | ||||||||
Tangible shareholders' equity (3) | 217,434 | 225,757 | -3.69 | % | ||||||||
Ratios: | ||||||||||||
Common book value per share (1) | $ | 12.15 | $ | 24.09 | -49.56 | % | ||||||
Tangible common book value per share (2) | $ | 11.44 | $ | 12.23 | -6.46 | % | ||||||
Total tangible equity to tangible assets (3)(4) | 8.33 | % | 8.09 | % | 2.93 | % | ||||||
Tangible common equity to tangible assets (2)(4) | 5.77 | % | 5.75 | % | 0.40 | % | ||||||
Average equity to average assets | 11.09 | % | 11.24 | % | -1.33 | % | ||||||
(1) Common shareholders' equity is shareholders' equity less preferred stock. | ||||||||||||
(2) Tangible common shareholders' equity is shareholders' equity less goodwill, intangible assets and preferred stock. | ||||||||||||
(3) Tangible shareholders' equity is shareholders' equity less goodwill and intangible assets. | ||||||||||||
(4) Tangible assets is total assets less goodwill and intangible assets. | ||||||||||||
Three Months Ended | Twelve Months Ended | |||||||||||||||||||||||
December 31, | December 31, | |||||||||||||||||||||||
2009 | 2008 | % Change | 2009 | 2008 | % Change | |||||||||||||||||||
Operating Data: | ||||||||||||||||||||||||
Total interest income | $ | 33,424 | $ | 39,147 | -14.62 | % | $ | 138,456 | $ | 170,516 | �� | -18.80 | % | |||||||||||
Total interest expense | 12,846 | 18,022 | -28.72 | % | 57,931 | 75,491 | -23.26 | % | ||||||||||||||||
Net interest income | 20,578 | 21,125 | -2.59 | % | 80,525 | 95,025 | -15.26 | % | ||||||||||||||||
Provision for loan losses | 6,402 | 32,283 | -80.17 | % | 50,246 | 52,810 | -4.86 | % | ||||||||||||||||
Net interest income after provision for loan losses | 14,176 | (11,158 | ) | -227.05 | % | 30,279 | 42,215 | -28.27 | % | |||||||||||||||
Non-interest income | 8,134 | 10,186 | -20.15 | % | 31,578 | 33,614 | -6.06 | % | ||||||||||||||||
Non-interest expense | 20,477 | 24,192 | -15.36 | % | 229,587 | 85,837 | 167.47 | % | ||||||||||||||||
Income (loss) before income taxes | 1,833 | (25,164 | ) | -107.28 | % | (167,730 | ) | (10,008 | ) | N/M | ||||||||||||||
Income tax expense (benefit) | 659 | (9,930 | ) | -106.64 | % | (17,036 | ) | (4,648 | ) | N/M | ||||||||||||||
Net income (loss) | 1,174 | (15,234 | ) | -107.71 | % | (150,694 | ) | (5,360 | ) | N/M | ||||||||||||||
Preferred stock dividend and accretion of discount on warrants | 1,250 | 92 | 100.00 | % | 4,982 | 92 | 100.00 | % | ||||||||||||||||
Net income (loss) available to common shareholders | $ | (76 | ) | $ | (15,326 | ) | -99.50 | % | $ | (155,676 | ) | $ | (5,452 | ) | N/M | |||||||||
Comprehensive income (loss) | $ | 120 | $ | (16,008 | ) | -100.75 | % | $ | (149,842 | ) | $ | (7,530 | ) | N/M | ||||||||||
Per Share of Common Stock: | ||||||||||||||||||||||||
Basic earnings (loss) | $ | (0.01 | ) | $ | (1.18 | ) | -99.15 | % | $ | (11.91 | ) | $ | (0.42 | ) | N/M | |||||||||
Diluted earnings (loss) | $ | (0.01 | ) | $ | (1.18 | ) | -99.15 | % | $ | (11.91 | ) | $ | (0.42 | ) | N/M | |||||||||
Dividends | $ | 0.00 | $ | 0.13 | -100.00 | % | $ | 0.13 | $ | 0.52 | -75.00 | % | ||||||||||||
Weighted Average Shares Outstanding: | ||||||||||||||||||||||||
Basic | 13,070,216 | 12,935,665 | 13,068,407 | 12,932,576 | ||||||||||||||||||||
Diluted | 13,070,216 | 12,998,685 | 13,068,407 | 12,990,790 | ||||||||||||||||||||
Three Months Ended | Twelve Months Ended | |||||||||||||||||||
December 31, | September 30, | December 31, | December 31, | |||||||||||||||||
2009 | 2009 | 2008 | 2009 | 2008 | ||||||||||||||||
Key Financial Ratios: | ||||||||||||||||||||
Return on average assets | -0.01 | % | -1.12 | % | -2.07 | % | -5.59 | % | -0.18 | % | ||||||||||
Return on average shareholders' equity | -0.13 | % | -12.97 | % | -18.11 | % | -50.44 | % | -1.64 | % | ||||||||||
Return on average common shareholders' equity (1) | -0.19 | % | -18.00 | % | -18.50 | % | -64.25 | % | -1.65 | % | ||||||||||
Return on average common tangible shareholders' equity (2) | -0.20 | % | -19.16 | % | -35.08 | % | -96.77 | % | -3.14 | % | ||||||||||
Interest rate spread | 3.26 | % | 3.22 | % | 3.11 | % | 3.19 | % | 3.48 | % | ||||||||||
Net interest margin | 3.37 | % | 3.33 | % | 3.30 | % | 3.34 | % | 3.70 | % | ||||||||||
(1) Common shareholders' equity is shareholders' equity less preferred stock. | ||||||||||||||||||||
(2) Tangible common shareholders' equity is shareholders' equity less goodwill, intangible assets and preferred stock. | ||||||||||||||||||||
December 31, | September 30, | December 31, | ||||||||||
2009 | 2009 | 2008 | ||||||||||
Asset Quality Ratios: | ||||||||||||
Nonperforming loans as a percentage of total loans, | ||||||||||||
net of unearned income | 3.70 | % | 3.27 | % | 1.41 | % | ||||||
Nonperforming assets as a percentage of total assets | 5.07 | % | 4.48 | % | 2.61 | % | ||||||
Allowance for loan losses as a percentage of total loans, | ||||||||||||
net of unearned income | 2.45 | % | 2.39 | % | 2.20 | % | ||||||
Allowance for loan losses as a percentage of | ||||||||||||
nonperforming loans | 66.39 | % | 73.09 | % | 155.28 | % | ||||||
Net charge-offs to average total loans, net of | ||||||||||||
unearned income | 2.25 | % | 1.93 | % | 1.63 | % |
GREEN BANKSHARES, INC. | |
Consolidated Financial Highlights | |
December 31, 2009 | |
(UNAUDITED) |
Nonperforming Assets and Net Charge-offs | Asset Quality Ratios | ||||||||||||||||||||||||
As of and for the year ended December 31, 2009 | Bank | Other | Total | As of and for year ended December 31, 2009 | Bank | Other | Consolidated | ||||||||||||||||||
Loans past due 90 days and still accruing | $ | 147 | $ | - | $ | 147 | Nonperforming loans as a percentage of total loans, net of unearned income | 3.69 | % | 1.50 | % | 3.70 | % | ||||||||||||
Nonaccrual loans | 74,761 | 650 | 75,411 | Nonperforming assets as a percentage of total assets | 5.04 | % | 2.02 | % | 5.07 | % | |||||||||||||||
Other real estate owned and repossessed assets | 56,799 | 369 | 57,168 | Allowance for loan losses as a percentage of total loans, net of unearned income | 2.30 | % | 8.05 | % | 2.45 | % | |||||||||||||||
Total nonperforming assets | $ | 131,707 | $ | 1,019 | $ | 132,726 | Allowance for loan losses as a percentage of nonperforming loans | 62.29 | % | 538.31 | % | 66.39 | % | ||||||||||||
YTD net charge-offs to average total loans, net of unearned income | 2.15 | % | 5.88 | % | 2.25 | % | |||||||||||||||||||
YTD net charge-offs | $ | 46,394 | $ | 2,502 | $ | 48,896 | |||||||||||||||||||
As of and for the year ended December 31, 2008 | Bank | Other | Total | As of and for the year ended December 31, 2008 | Bank | Other | Consolidated | ||||||||||||||||||
Loans past due 90 days and still accruing | $ | 509 | $ | - | $ | 509 | Nonperforming loans as a percentage of total loans, net of unearned income | 1.38 | % | 2.48 | % | 1.41 | % | ||||||||||||
Nonaccrual loans | 29,956 | 970 | 30,926 | Nonperforming assets as a percentage of total assets | 2.58 | % | 2.57 | % | 2.61 | % | |||||||||||||||
Other real estate owned and repossessed assets | 45,054 | 317 | 45,371 | Allowance for loan losses as a percentage of total loans, net of unearned income | 2.06 | % | 8.27 | % | 2.20 | % | |||||||||||||||
Total nonperforming assets | $ | 75,519 | $ | 1,287 | $ | 76,806 | Allowance for loan losses as a percentage of nonperforming loans | 149.59 | % | 333.81 | % | 155.28 | % | ||||||||||||
Net charge-offs to average total loans, net of unearned income | 1.53 | % | 6.42 | % | 1.63 | % | |||||||||||||||||||
Net charge-offs | $ | 35,564 | $ | 2,546 | $ | 38,110 | |||||||||||||||||||
GREEN BANKSHARES, INC. |
Condensed Average Balances, Interest Rates and Yields |
December 31, 2009 |
Three Months Ended | Twelve Months Ended | |||||||||||||||||||||||||||||||||||||||||||||||
December 31, | December 31, | |||||||||||||||||||||||||||||||||||||||||||||||
2009 | 2008 | 2009 | 2008 | |||||||||||||||||||||||||||||||||||||||||||||
Average | Average | Average | Average | Average | Average | Average | Average | |||||||||||||||||||||||||||||||||||||||||
Balance | Interest | Rate | Balance | Interest | Rate | Balance | Interest | Rate | Balance | Interest | Rate | |||||||||||||||||||||||||||||||||||||
Interest-earning assets: | ||||||||||||||||||||||||||||||||||||||||||||||||
Loans(1)(2) | 2,009,041 | 31,502 | 6.22 | % | 2,228,605 | 34,986 | 6.25 | % | 2,096,181 | 129,272 | 6.17 | % | 2,298,905 | 155,683 | 6.77 | % | ||||||||||||||||||||||||||||||||
Investment securities (2) | 161,588 | 1,918 | 4.71 | % | 293,860 | 4,282 | 5.80 | % | 189,377 | 9,546 | 5.04 | % | 273,343 | 15,412 | 5.64 | % | ||||||||||||||||||||||||||||||||
Other short-term investments | 275,243 | 193 | 0.28 | % | 49,493 | 64 | 0.51 | % | 147,918 | 376 | 0.25 | % | 17,941 | 175 | 0.98 | % | ||||||||||||||||||||||||||||||||
Total interest-earning assets | 2,445,872 | 33,613 | 5.45 | % | 2,571,958 | 39,332 | 6.08 | % | 2,433,476 | 139,194 | 5.72 | % | 2,590,189 | 171,270 | 6.61 | % | ||||||||||||||||||||||||||||||||
Non-interest earning assets | 290,294 | 379,429 | 349,179 | 366,091 | ||||||||||||||||||||||||||||||||||||||||||||
Total assets | 2,736,166 | 2,951,387 | 2,782,655 | 2,956,280 | ||||||||||||||||||||||||||||||||||||||||||||
Interest-bearing liabilities: | ||||||||||||||||||||||||||||||||||||||||||||||||
Deposits: | ||||||||||||||||||||||||||||||||||||||||||||||||
Interest checking, money market and savings | 907,257 | 2,521 | 1.10 | % | 591,785 | 1,862 | 1.25 | % | 784,135 | 10,078 | 1.29 | % | 645,636 | 9,588 | 1.49 | % | ||||||||||||||||||||||||||||||||
Time deposits | 1,096,099 | 7,603 | 2.75 | % | 1,455,619 | 12,571 | 3.44 | % | 1,166,640 | 35,690 | 3.06 | % | 1,317,362 | 48,502 | 3.68 | % | ||||||||||||||||||||||||||||||||
Total interest bearing-deposits | 2,003,356 | 10,124 | 2.00 | % | 2,047,404 | 14,433 | 2.80 | % | 1,950,775 | 45,768 | 2.35 | % | 1,962,998 | 58,090 | 2.96 | % | ||||||||||||||||||||||||||||||||
Securities sold under repurchase and short-term borrowings | 25,631 | 7 | 0.11 | % | 41,540 | 57 | 0.55 | % | 28,049 | 29 | 0.10 | % | 106,309 | 2,111 | 1.99 | % | ||||||||||||||||||||||||||||||||
Notes payable | 206,324 | 2,229 | 4.29 | % | 229,569 | 2,467 | 4.28 | % | 221,282 | 9,557 | 4.32 | % | 254,154 | 10,735 | 4.22 | % | ||||||||||||||||||||||||||||||||
Subordinated debentures | 88,662 | 486 | 2.17 | % | 88,662 | 1,065 | 4.78 | % | 88,662 | 2,577 | 2.91 | % | 88,662 | 4,555 | 5.14 | % | ||||||||||||||||||||||||||||||||
Total interest-bearing liabilities | 2,323,973 | 12,846 | 2.19 | % | 2,407,175 | 18,022 | 2.98 | % | 2,288,768 | 57,931 | 2.53 | % | 2,412,123 | 75,491 | 3.13 | % | ||||||||||||||||||||||||||||||||
Non-interest bearing liabilities: | ||||||||||||||||||||||||||||||||||||||||||||||||
Demand Deposits | 159,951 | 182,057 | 162,765 | 187,058 | ||||||||||||||||||||||||||||||||||||||||||||
Other Liabilities | 22,834 | 25,447 | 22,477 | 24,832 | ||||||||||||||||||||||||||||||||||||||||||||
Total non-interest bearing liabilities | 182,785 | 207,504 | 185,242 | 211,890 | ||||||||||||||||||||||||||||||||||||||||||||
Total liabilities | 2,506,758 | 2,614,679 | 2,474,010 | 2,624,013 | ||||||||||||||||||||||||||||||||||||||||||||
Shareholders' equity | 229,408 | 336,708 | 308,645 | 332,267 | ||||||||||||||||||||||||||||||||||||||||||||
Total liabilities & shareholders' equity | 2,736,166 | 2,951,387 | 2,782,655 | 2,956,280 | ||||||||||||||||||||||||||||||||||||||||||||
Net interest income | 20,767 | 21,310 | 81,263 | 95,779 | ||||||||||||||||||||||||||||||||||||||||||||
Interest rate spread | 3.26 | % | 3.11 | % | 3.19 | % | 3.48 | % | ||||||||||||||||||||||||||||||||||||||||
Net yield on interest-earning assets (net interest margin) | 3.37 | % | 3.30 | % | 3.34 | % | 3.70 | % | ||||||||||||||||||||||||||||||||||||||||
(1) Average loan balances exclude nonaccrual loans for the periods presented. | ||||||||||||||||||||||||||||||||||||||||||||||||
(2) Fully Taxable Equivalent (“FTE”) at the rate of 35%. The FTE basis adjusts for the tax benefits of income on certain tax-exempt loans and investments using the federal statutory rate of 35% for each period presented. The Company believes this measure to be the preferred industry measurement of net interest income and provides relevant comparison between taxable and non-taxable amounts. | ||||||||||||||||||||||||||||||||||||||||||||||||
GREEN BANKSHARES, INC. |
Consolidated Financial Highlights |
December 31, 2009 |
(UNAUDITED) |
December 31, 2009 | September 30, 2009 | |||||||||||||||||||
Loans | Balance | % | Balance | % | % Change | |||||||||||||||
Commercial | $ | 274,346 | 13.33 | % | $ | 291,432 | 13.78 | % | -5.86 | % | ||||||||||
Commercial real estate | 1,306,398 | 63.46 | % | 1,331,367 | 62.96 | % | -1.88 | % | ||||||||||||
Residential real estate | 392,365 | 19.06 | % | 404,778 | 19.14 | % | -3.07 | % | ||||||||||||
Consumer | 83,382 | 4.05 | % | 84,614 | 4.00 | % | -1.46 | % | ||||||||||||
Other | 2,117 | 0.10 | % | 2,466 | 0.12 | % | -14.15 | % | ||||||||||||
Total loans | 2,058,608 | 100.00 | % | 2,114,657 | 100.00 | % | -2.65 | % | ||||||||||||
Less: Unearned income | (14,801 | ) | (15,390 | ) | ||||||||||||||||
Loans, net of unearned income | $ | 2,043,807 | $ | 2,099,267 | ||||||||||||||||
Loan Balances by Geographical Region and Operating Subsidiaries | ||||||||||||||||||||
December 31, 2009 | September 30, 2009 | |||||||||||||||||||
Loan | % to | Loan | % to | |||||||||||||||||
Balance | Total Loans | Balance | Total Loans | % Change | ||||||||||||||||
Northeastern Tennessee Region(1) | $ | 521,145 | 25.50 | % | $ | 533,270 | 25.40 | % | -2.27 | % | ||||||||||
East Tennessee Region | 695,533 | 34.03 | % | 698,009 | 33.25 | % | -0.35 | % | ||||||||||||
Middle Tennessee Region | 783,676 | 38.34 | % | 824,549 | 39.28 | % | -4.96 | % | ||||||||||||
GCB Acceptance Corporation | 19,143 | 0.94 | % | 19,441 | 0.93 | % | -1.53 | % | ||||||||||||
Superior Financial Services, Inc. | 24,310 | 1.19 | % | 23,998 | 1.14 | % | 1.30 | % | ||||||||||||
Loans, net of unearned income | $ | 2,043,807 | 100.00 | % | $ | 2,099,267 | 100.00 | % | -2.64 | % | ||||||||||
(1) Includes one branch located in Southwestern Virginia and one branch located in Northwestern North Carolina |
December 31, 2009 | September 30, 2009 | |||||||||||||||||||
Deposits | Balance | % | Balance | % | % Change | |||||||||||||||
Non-interest bearing demand | $ | 177,602 | 8.52 | % | $ | 156,797 | 7.08 | % | 13.27 | % | ||||||||||
Interest bearing demand | 645,462 | 30.97 | % | 609,336 | 27.51 | % | 5.93 | % | ||||||||||||
Money market and savings | 278,157 | 13.35 | % | 293,867 | 13.27 | % | -5.35 | % | ||||||||||||
Retail time | 590,020 | 28.31 | % | 659,540 | 29.78 | % | -10.54 | % | ||||||||||||
Jumbo time | 392,855 | 18.85 | % | 495,221 | 22.36 | % | -20.67 | % | ||||||||||||
Total | $ | 2,084,096 | 100.00 | % | $ | 2,214,761 | 100.00 | % | -5.90 | % | ||||||||||
Deposit Balances by Geographical Region | ||||||||||||||||||||
December 31, 2009 | September 30, 2009 | |||||||||||||||||||
Balance | % | Balance | % | % Change | ||||||||||||||||
Northeastern Tennessee Region(1) | $ | 751,972 | 36.08 | % | $ | 791,705 | 35.75 | % | -5.02 | % | ||||||||||
East Tennessee Region | 322,791 | 15.49 | % | 352,581 | 15.92 | % | -8.45 | % | ||||||||||||
Middle Tennessee Region | 1,009,333 | 48.43 | % | 1,070,475 | 48.33 | % | -5.71 | % | ||||||||||||
Total | $ | 2,084,096 | 100.00 | % | $ | 2,214,761 | 100.00 | % | -5.90 | % | ||||||||||
(1) Includes one branch located in Southwestern Virginia and one branch located in Northwestern North Carolina |