Exhibit 99.1
| CONTACT: | | James E. Adams |
| | | Executive Vice President and Chief Financial Officer |
| | | 423-278-3050 |
GREEN BANKSHARES POSTS FIRST QUARTER EARNINGS OF $1.9 MILLION
GREENEVILLE, Tenn. (April 21, 2010) – Green Bankshares, Inc. (NASDAQ:GRNB), the holding company for GreenBank, today reported net income available to common shareholders of $1,946,000 for the first quarter of 2010 compared with a net loss available to common shareholders of $76,000 for the fourth quarter of 2009 and net income available to common shareholders of $3,548,000 in the year-earlier quarter. Net income available to common shareholders was $0.15 per diluted share compared with a net loss of $0.01 per diluted share for the fourth quarter of 2009 and net income of $0.27 per diluted share in the first quarter of 2009.
Excluding preferred stock dividends paid and the accretion of discount on common stock warrants issued to the U.S. Treasury, the Company reported net income of $3,196,000 for the first quarter of 2010 compared with net income of $1,174,000 for the fourth quarter of 2009 and $4,780,000 in the year-earlier quarter.
Other highlights for the quarter included:
Improving credit quality ($000):
| | | 1Q10 | | 4Q09 | | 3Q09 | | 2Q09 | | 1Q09 |
| Net loan charge-offs | | $ | 3,882 | | | $ | 6,437 | | | $ | 18,436 | | | $ | 23,281 | | | $ | 742 | |
| New non-accrual loans added | | $ | 14,442 | | | $ | 31,111 | | | $ | 47,931 | | | $ | 57,292 | | | $ | 58,073 | |
| Reserves to total loans | | | 2.52 | % | | | 2.45 | % | | | 2.39 | % | | | 2.30 | % | | | 2.19 | % |
| Non-performing assets | | $ | 135,366 | | | $ | 132,726 | | | $ | 125,091 | | | $ | 129,177 | | | $ | 121,272 | |
| · | Net loan charge-offs declined as further signs of economic stabilization in the Company's markets continued through the first quarter of 2010. |
| · | Non-performing assets (NPAs) rose modestly during the first quarter of 2010 while the level of new loans added to non-accrual continued to decline. |
| · | On average, all NPAs have been written down by 28%. |
GRNB Reports First Quarter Results
Page 2
April 21, 2010
The following table reflects the changes in NPA balances from December 31, 2009 through March 31, 2010:
| (dollars in thousands) | | | | | | | | |
| December 31, 2009 | | $ | 75,411 | | | $ | 57,168 | | | $ | 147 | | | $ | 132,726 | |
| Loan foreclosures | | | (18,540 | ) | | | 18,540 | | | | n/a | | | | n/a | |
| Gross loan charge-offs | | | (4,733 | ) | | | n/a | | | | n/a | | | | (4,733 | ) |
| New non-accrual loans | | | 14,442 | | | | n/a | | | | n/a | | | | 14,442 | |
| Reduction of non-accrual loans | | | (3,109 | ) | | | n/a | | | | n/a | | | | (3,109 | ) |
| OREO sales proceeds | | | n/a | | | | (3,453 | ) | | | n/a | | | | (3,453 | ) |
| OREO write-downs, net | | | n/a | | | | (509 | ) | | | n/a | | | | (509 | ) |
| Change in past due > 90 days | | | n/a | | | | n/a | | | | 2 | | | | 2 | |
| March 31, 2010 | | $ | 63,471 | | | $ | 71,746 | | | $ | 149 | | | $ | 135,366 | |
Strong capital:
| Consolidated: | | 1Q10 | | 4Q09 | | 3Q09 | | 2Q09 | | 1Q09 |
| Tangible common book value per share | | $ | 11.71 | | | $ | 11.44 | | | $ | 11.47 | | | $ | 11.88 | | | $ | 11.95 | |
| Tangible common equity to tangible assets ratio | | | 6.03 | % | | | 5.77 | % | | | 5.42 | % | | | 5.98 | % | | | 5.95 | % |
| Bank Regulatory Ratios: | | | | | | | | | | | | | | | | | | | | |
| Tier 1 leverage ratio | | | 11.55 | % | | | 10.70 | % | | | 10.49 | % | | | 10.85 | % | | | 11.63 | % |
| Tier 1 risk-based capital ratio | | | 14.06 | % | | | 13.61 | % | | | 13.17 | % | | | 13.45 | % | | | 13.71 | % |
| Total risk-based capital ratio | | | 15.33 | % | | | 14.87 | % | | | 14.43 | % | | | 14.72 | % | | | 14.97 | % |
| · | All capital ratios continued to improve over the last three quarters (please refer to the non-GAAP measurement reconciliation on page 5). As indicated in the minutes of the Federal Open Market Committee Meeting, the recession began reaching the bottom late in the second quarter of 2009 and remained at depressed levels throughout the third quarter of 2009 until modest signs of economic improvement began to appear in the fourth quarter of 2009. These economic conditions also were reflected in the Company's capital ratios as indicated above. |
Increasing net interest income/margin:
| ($000's omitted) | | 1Q10 | | 4Q09 | | 1Q09 |
| Net interest income | | $ | 21,659 | | | $ | 20,578 | | | $ | 19,429 | |
| Net interest margin | | | 3.90 | % | | | 3.37 | % | | | 3.23 | % |
| Average earning assets | | $ | 2,271,550 | | | $ | 2,445,872 | | | $ | 2,462,759 | |
| · | Net interest income and net interest margin, including loan interest reversals of $282,519 for the first quarter of 2010, continued to improve from both the fourth and first quarter 2009 levels. |
GRNB Reports First Quarter Results
Page 3
April 21, 2010
Stephen M. Rownd, newly appointed Chairman and Chief Executive Officer, commented, “The solid underpinnings of our company's core earnings potential are beginning to become more evident as we emerge from this recessionary cycle. After having recently visited with our management and bankers in all three of our operating regions, I am impressed by the caliber of our team and their drive and determination to move GreenBank forward in these challenging times. I am cautiously optimistic that with the further hard work and dedication of our employees and management, we will continue to make further strides in improving the Company's performance as this year continues to unfold."
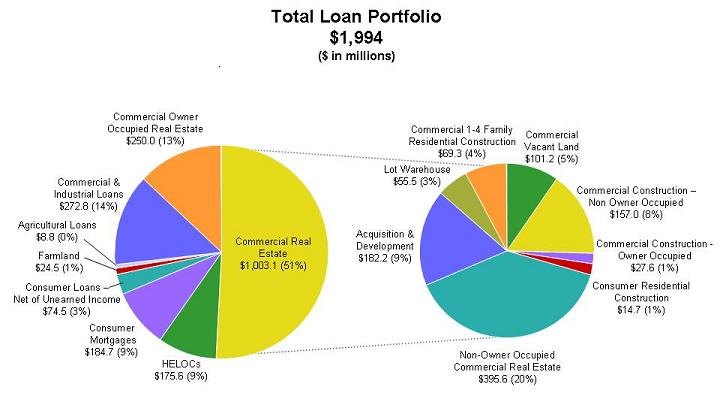
The following information graphically displays the consolidated loan portfolio by purpose code as of March 31, 2010:
The following is a breakdown of the Company's commercial real estate portfolio by purpose code as of March 31, 2010.
| (Dollars in thousands) | | | | | | | | | |
| Commercial Real Estate Portfolio | | | | | | | | | |
| Acquisition & development | | $ | 182,181 | | | $ | 185,087 | | | $ | 255,198 | |
| Lot warehouse | | | 55,499 | | | | 66,104 | | | | 78,957 | |
| Commercial 1-4 family construction | | | 69,328 | | | | 70,434 | | | | 141,161 | |
| Total speculative 1-4 family | | | 307,008 | | | | 321,625 | | | | 475,316 | |
| | | | | | | | | | | | | |
| Commercial vacant land | | | 101,218 | | | | 101,679 | | | | 101,796 | |
| Commercial construction non-owner occupied | | | 156,970 | | | | 164,887 | | | | 164,052 | |
| Commercial construction owner occupied | | | 27,614 | | | | 28,213 | | | | 59,361 | |
| Consumer residential construction | | | 14,701 | | | | 19,073 | | | | 26,220 | |
| Total construction and development | | | 300,503 | | | | 313,852 | | | | 351,429 | |
| | | | | | | | | | | | | |
| Non-owner occupied commercial real estate | | | 395,638 | | | | 397,028 | | | | 389,701 | |
| | | | | | | | | | | | | |
| Total commercial real estate | | $ | 1,003,149 | | | $ | 1,032,505 | | | $ | 1,216,446 | |
GRNB Reports First Quarter Results
Page 4
April 21, 2010
Non-interest income totaled approximately $7.7 million for the first quarter of 2010 compared with $8.1 million on a linked quarter basis and $6.9 million for the first quarter of 2009. Non-interest income for the fourth quarter of 2009 included approximately $238,000 of net securities gains. Deposit service charges increased $584,000 from first quarter 2009 levels due to the continued success of the Company's High Performance Checking product and its strong attraction to new customers. The decline in deposit service charges from the fourth quarter of 2009 reflected historical seasonal patterns relating to the impact of income tax refunds on customer account balances.
Non-interest expenses totaled approximately $20.5 million in the first quarter of 2010 and were relatively flat compared with the fourth quarter of 2009 despite FICA and other employment tax increases that seasonally impact non-interest expense levels. The temporary increases associated with payroll taxes were partially offset by a reduction of $642,000 in losses incurred on the disposition of OREO properties versus the fourth quarter of 2009. Compared with the first quarter of 2009, non-interest expenses increased $2.7 million or 15%. Although payroll-related costs declined approximately $345,000, this decrease was more than offset by higher product advertising costs of $53 4,000, increased losses on the disposition of OREO property of $428,000, and elevated collection and repossession costs of almost $990,000.
Greeneville, Tennessee-based Green Bankshares, Inc., with total assets of approximately $2.570 billion, is the holding company for GreenBank. GreenBank, which traces its origin to 1890, has 63 branches across East and Middle Tennessee, and one branch each in Bristol, Virginia, and Hot Springs, North Carolina. It also provides wealth management services through its GreenWealth Division and residential mortgage lending through its Mortgage Division. In addition, GreenBank conducts separate businesses through three wholly owned subsidiaries: Superior Financial Services, Inc., a consumer finance company; GCB Acceptance Corporation, a consumer finance company specializing in automobile lending; and Fairway Title Co., a title insurance comp any.
Certain matters discussed in this news release are not historical facts but are "forward-looking statements" within the meaning of and are furnished pursuant to the Private Securities Litigation Reform Act of 1995. All forward-looking statements involve risk and uncertainty and actual results could differ materially from the anticipated results or other expectations expressed in the forward-looking statements. Risks and uncertainties related to the Company's business are discussed in the Company's SEC filings, including its Annual Report on Form 10-K for the year ended December 31, 2009, and include, but are not limited to, (1) deterioration in the financial condition of borrowers resu lting in significant increases in loan losses and provisions for those losses; (2) continuation of the historically low short-term interest rate environment; (3) changes in loan underwriting, credit review or loss reserve policies associated with economic conditions, examination conclusions, or regulatory developments; (4) increased competition with other financial institutions in the markets that GreenBank serves; (5) greater than anticipated deterioration or lack of sustained growth in the national or local economies; (6) rapid fluctuations or unanticipated changes in interest rates; (7) the impact of governmental restrictions on entities participating in the Capital Purchase Program of the United States Department of the Treasury; (8) changes in state and federal legislation, regulations or policies applicable to banks or other financial service providers, including regulatory or legislative developments arising out of current unsettled conditions in the economy and (9) the loss of key personnel. � 60;The Company undertakes no obligation to update forward-looking statements.
GRNB Reports First Quarter ResultsPage 5
April 21, 2010
GREEN BANKSHARES, INC.
Reconciliation of Non-GAAP Measures Presented in Earnings Release
(Dollars in thousands)
| | | 1Q10 | | 4Q09 | | 3Q09 | | 2Q09 | | 1Q09 |
| Total shareholders' equity | | $ | 230,189 | | | $ | 226,769 | | | $ | 227,388 | | | $ | 233,192 | | | $ | 384,474 | |
| Less: | | | | | | | | | | | | | | | | | | | | |
| Goodwill | | | -- | | | | -- | | | | -- | | | | -- | | | | (143,389 | ) |
| Core deposit and other intangibles | | | (8,684 | ) | | | (9,335 | ) | | | (9,981 | ) | | | (10,629 | ) | | | (11,281 | ) |
| Preferred stock | | | (67,081 | ) | | | (66,735 | ) | | | (66,388 | ) | | | (66,041 | ) | | | (65,694 | ) |
| Tangible common equity | | $ | 154,424 | | | $ | 150,699 | | | $ | 151,019 | | | $ | 156,522 | | | $ | 164,110 | |
| | | | | | | | | | | | | | | | | | | | | |
| Total assets | | $ | 2,569,732 | | | $ | 2,619,139 | | | $ | 2,794,217 | | | $ | 2,629,834 | | | $ | 2,795,839 | |
| Less: | | | | | | | | | | | | | | | | | | | | |
| Goodwill | | | -- | | | | -- | | | | -- | | | | -- | | | | (143,389 | ) |
| Core deposit and other intangibles | | | (8,684 | ) | | | (9,335 | ) | | | (9,981 | ) | | | (10,629 | ) | | | (11,281 | ) |
| Total tangible assets | | $ | 2,561,048 | | | $ | 2,609,804 | | | $ | 2,784,236 | | | $ | 2,619,205 | | | $ | 2,641,169 | |
Use of Non-GAAP financial measures
The above table presents computations and other financial information excluding our core deposit intangible, preferred stock and for the first quarter of 2009, goodwill (non-GAAP). Non-GAAP financial measures have inherent limitations, are not required to be uniformly applied and are not audited. To mitigate these limitations, the Company has policies in place to address goodwill impairment from other normal operating expenses to ensure that the Company's operating results are properly reflected for period to period comparisons.
GRNB Reports First Quarter ResultsPage 6
April 21, 2010
GREEN BANKSHARES, INC.
Unaudited Financial Highlights
(In thousands, except per share amounts)
| | | | |
| | | | | | | | | | |
| Interest income | | $ | 31,892 | | | $ | 33,434 | | | $ | 35,380 | |
| Interest expense | | | 10,233 | | | | 12,846 | | | | 15,951 | |
| Net interest income | | | 21,659 | | | | 20,578 | | | | 19,429 | |
| Provision for loan losses | | | 3,889 | | | | 6,402 | | | | 985 | |
| Net interest income after provision for loan losses | | | 17,770 | | | | 14,176 | | | | 18,444 | |
| Non-interest income | | | 7,686 | | | | 8,134 | | | | 6,943 | |
| Non-interest expense | | | 20,546 | | | | 20,477 | | | | 17,831 | |
| Income before income taxes | | | 4,910 | | | | 1,833 | | | | 7,556 | |
| Income tax provision | | | 1,714 | | | | 659 | | | | 2,776 | |
| Income | | | 3,196 | | | | 1,174 | | | | 4,780 | |
| Preferred stock dividends and related cost | | | 1,250 | | | | 1,250 | | | | 1,232 | |
| Net income (loss) available to common shareholders | | $ | 1,946 | | | $ | (76 | ) | | $ | 3,548 | |
| Comprehensive income | | $ | 4,166 | | | $ | 120 | | | $ | 5,668 | |
| | | | | | | | | | | | | |
Earnings (loss) per share: Basic | | $ | 0.15 | | | $ | (0.01 | ) | | $ | 0.27 | |
Diluted | | $ | 0.15 | | | $ | (0.01 | ) | | $ | 0.27 | |
| | | | | | | | | | | | | |
Weighted average shares: Basic | | | 13,082 | | | | 13,070 | | | | 13,063 | |
Diluted | | | 13,082 | | | | 13,070 | | | | 13,142 | |
| | | | | | | | | | | | | |
| Dividends declared per share | | $ | 0.00 | | | $ | 0.00 | | | $ | 0.13 | |
| | | | | | | | | | | | | |
| | | | | | | | | | |
| Total assets | | $ | 2,569,732 | | | $ | 2,619,139 | | | $ | 2,795,839 | |
| Cash and cash equivalents | | | 177,541 | | | | 210,494 | | | | 77,831 | |
| Investment and other securities | | | 198,066 | | | | 173,617 | | | | 206,948 | |
| Loans, net of unearned interest | | | 1,994,039 | | | | 2,043,807 | | | | 2,244,848 | |
| Allowance for loan losses | | | 50,167 | | | | 50,161 | | | | 49,054 | |
| Deposits | | | 2,037,865 | | | | 2,084,096 | | | | 2,038,520 | |
| Shareholders' equity | | | 230,189 | | | | 226,769 | | | | 384,474 | |
Common shareholders' equity 1 | | | 163,108 | | | | 160,034 | | | | 318,780 | |
Tangible common shareholders' equity 2 | | | 154,424 | | | | 150,699 | | | | 164,110 | |
Common book value per share 1 | | | 12.36 | | | | 12.15 | | | | 23.69 | |
Tangible common book value per share 2 | | | 11.71 | | | | 11.44 | | | | 11.95 | |
| | 1 Common shareholders' equity is shareholders' equity less preferred stock. |
| | 2 Tangible common shareholders' equity is shareholders' equity less goodwill, intangible assets and preferred stock. |
| GREEN BANKSHARES, INC. |
| Consolidated Balance Sheets |
| March 31, 2010, December 31, 2009 and March 31, 2009 |
| (Dollars in thousands) |
| | | (Unaudited) | | | | | (Unaudited) |
| | | March 31, | | December 31, | | March 31, |
| | | 2010 | | 2009* | | | 2009 |
ASSETS | | | | | | | | | | | |
| | | | | | | | | | | | |
| Cash and due from banks | | $ | 176,469 | | | $ | 206,701 | | | $ | 71,804 | |
| Federal funds sold | | | 1,072 | | | | 3,793 | | | | 6,027 | |
| Cash and cash equivalents | | | 177,541 | | | | 210,494 | | | | 77,831 | |
| | | | | | | | | | | | | |
| Interest earning deposits in other banks | | | 11,000 | | | | 11,000 | | | | - | |
| Securities available-for-sale ("AFS") | | | 173,716 | | | | 147,724 | | | | 193,271 | |
| Securities held-to-maturity (with a market value of $628, $638 and $595 | | | | | | | | | |
| on March 31, 2010, December 31, 2009 and March 31, 2009) | | | 616 | | | | 626 | | | | 647 | |
| FHLB and other stock, at cost | | | 12,734 | | | | 12,734 | | | | 13,030 | |
| Loans held for sale | | | 590 | | | | 1,533 | | | | 595 | |
| Loans, net of unearned income | | | 1,994,039 | | | | 2,043,807 | | | | 2,244,848 | |
| Allowance for loan losses | | | (50,167 | ) | | | (50,161 | ) | | | (49,054 | ) |
| Other real estate owned and repossessed assets | | | 71,746 | | | | 57,168 | | | | 12,651 | |
| Bank premises and equipment, net | | | 81,204 | | | | 81,818 | | | | 84,639 | |
| Cash surrender value of life insurance | | | 30,542 | | | | 30,277 | | | | 29,844 | |
| Goodwill | | | - | | | | - | | | | 143,389 | |
| Core deposit and other intangibles | | | 8,684 | | | | 9,335 | | | | 11,281 | |
| Other assets | | | 57,487 | | | | 62,784 | | | | 32,867 | |
| Total assets | | $ | 2,569,732 | | | $ | 2,619,139 | | | $ | 2,795,839 | |
| | | | | | | | | | | | | |
| LIABILITIES AND SHAREHOLDERS' EQUITY | | | | | | | | | | | | |
| | | | | | | | | | | | | |
| Non-interest-bearing deposits | | $ | 166,369 | | | $ | 177,602 | | | $ | 168,178 | |
| Interest-bearing deposits | | | 1,870,097 | | | | 1,899,910 | | | | 1,707,625 | |
| Brokered deposits | | | 1,399 | | | | 6,584 | | | | 162,717 | |
| Total deposits | | | 2,037,865 | | | | 2,084,096 | | | | 2,038,520 | |
| | | | | | | | | | | | | |
| Federal funds purchased | | | - | | | | - | | | | - | |
| Repurchase agreements | | | 23,830 | | | | 24,449 | | | | 31,018 | |
| FHLB advances and notes payable | | | 171,919 | | | | 171,999 | | | | 229,252 | |
| Subordinated debentures | | | 88,662 | | | | 88,662 | | | | 88,662 | |
| Accrued interest payable and other liabilities | | | 17,267 | | | | 23,164 | | | | 23,913 | |
| Total liabilities | | | 2,339,543 | | | | 2,392,370 | | | | 2,411,365 | |
| | | | | | | | | | | | | |
| SHAREHOLDERS' EQUITY | | | | | | | | | | | | |
| | | | | | | | | | | | | |
| Preferred stock: no par value, 1,000,000 shares authorized; | | | | | | | | | | | | |
| 72,278, 72,278 and 72,278 shares outstanding | | | 67,081 | | | | 66,735 | | | | 65,694 | |
| Common stock: $2 par value, 20,000,000 shares authorized; | | | | | | | | | | | | |
| 13,192,875, 13,171,474 and 13,176,681 shares outstanding | | | 26,386 | | | | 26,343 | | | | 26,353 | |
| Common stock warrants | | | 6,934 | | | | 6,934 | | | | 6,934 | |
| Additional paid in capital | | | 188,423 | | | | 188,310 | | | | 187,783 | |
| Retained earnings (deficit) | | | (59,794 | ) | | | (61,742 | ) | | | 97,485 | |
| Accumulated other comprehensive income | | | 1,159 | | | | 189 | | | | 225 | |
| Total shareholders' equity | | | 230,189 | | | | 226,769 | | | | 384,474 | |
| | | | | | | | | | | | | |
| Total liabilities & shareholders' equity | | $ | 2,569,732 | | | $ | 2,619,139 | | | $ | 2,795,839 | |
| | | | | | | | | | | | | |
| * Derived from Audited Consolidated Financial Statements. | | | | | | | | | | | | |
| GREEN BANKSHARES, INC. |
| Consolidated Statements of Income and Comprehensive Income |
| Three Months Ended March 31, 2010, December 31, 2009 and March 31, 2009 |
| (Unaudited) |
| |
| (Dollars in thousands except share and per share data) |
| | | Three Months Ended | |
| | | March 31, | | | December 31, | | | March 31, | |
| | | 2010 | | | 2009 | | | 2009 | |
| | | | | | | | | | |
| Interest income: | | | | | | | | | |
| Interest and fees on loans | | $ | 30,060 | | | $ | 31,480 | | | $ | 32,645 | |
| Taxable securities | | | 1,288 | | | | 1,303 | | | | 2,220 | |
| Nontaxable securities | | | 312 | | | | 311 | | | | 320 | |
| FHLB and other stock | | | 138 | | | | 137 | | | | 150 | |
| Federal funds sold and other | | | 94 | | | | 193 | | | | 45 | |
| Total interest income | | | 31,892 | | | | 33,424 | | | | 35,380 | |
| | | | | | | | | | | | | |
| Interest expense: | | | | | | | | | | | | |
| Deposits | | | 8,061 | | | | 10,124 | | | | 12,653 | |
| Federal funds purchased and repurchase agreements | | | 6 | | | | 7 | | | | 9 | |
| FHLB advances and notes payable | | | 1,694 | | | | 2,229 | | | | 2,443 | |
| Subordinated debentures | | | 472 | | | | 486 | | | | 846 | |
| Total interest expense | | | 10,233 | | | | 12,846 | | | | 15,951 | |
| | | | | | | | | | | | | |
| Net interest income | | | 21,659 | | | | 20,578 | | | | 19,429 | |
| | | | | | | | | | | | | |
| Provision for loan losses | | | 3,889 | | | | 6,402 | | | | 985 | |
| | | | | | | | | | | | | |
| Net interest income after provision for loan losses | | | 17,770 | | | | 14,176 | | | | 18,444 | |
| | | | | | | | | | | | | |
| Non-interest income: | | | | | | | | | | | | |
| Service charges on deposit accounts | | | 5,940 | | | | 6,141 | | | | 5,356 | |
| Other charges and fees | | | 356 | | | | 540 | | | | 449 | |
| Trust and investment services income | | | 582 | | | | 505 | | | | 388 | |
| Mortgage banking income | | | 118 | | | | 91 | | | | 55 | |
| Other income | | | 690 | | | | 619 | | | | 695 | |
| Securities gains (losses), net | | | | | | | | | | | | |
| Realized gains (losses), net | | | - | | | | 482 | | | | - | |
| Other-than-temporary impairment | | | - | | | | (946 | ) | | | - | |
| Less non-credit portion recognized in other comprehensive income | | | - | | | | 702 | | | | - | |
| Total securities gains (losses), net | | | - | | | | 238 | | | | - | |
| Total non-interest income | | | 7,686 | | | | 8,134 | | | | 6,943 | |
| Non-interest expense: | | | | | | | | | | | | |
| Employee compensation | | | 7,665 | | | | 7,540 | | | | 7,692 | |
| Employee benefits | | | 977 | | | | 785 | | | | 1,295 | |
| Occupancy expense | | | 1,699 | | | | 1,695 | | | | 1,787 | |
| Equipment expense | | | 708 | | | | 694 | | | | 742 | |
| Computer hardware/software expense | | | 824 | | | | 793 | | | | 637 | |
| Professional services | | | 607 | | | | 676 | | | | 529 | |
| Advertising | | | 598 | | | | 473 | | | | 64 | |
| OREO maintenance expense | | | 445 | | | | 411 | | | | 143 | |
| Collection and repossession expense | | | 1,287 | | | | 1,255 | | | | 298 | |
| Loss on OREO and repossessed assets | | | 509 | | | | 1,151 | | | | 81 | |
| FDIC insurance | | | 851 | | | | 891 | | | | 700 | |
| Core deposit and other intangible amortization | | | 651 | | | | 646 | | | | 804 | |
| Other expenses | | | 3,725 | | | | 3,467 | | | | 3,059 | |
| Total non-interest expense | | | 20,546 | | | | 20,477 | | | | 17,831 | |
| | | | | | | | | | | | | |
| Income before income taxes | | | 4,910 | | | | 1,833 | | | | 7,556 | |
| | | | | | | | | | | | | |
| Income taxes provision (benefit) | | | 1,714 | | | | 659 | | | | 2,776 | |
| | | | | | | | | | | | | |
| Net income | | | 3,196 | | | | 1,174 | | | | 4,780 | |
| | | | | | | | | | | | | |
| Preferred stock dividends and accretion of discount on warrants | | | 1,250 | | | | 1,250 | | | | 1,232 | |
| | | | | | | | | | | | | |
| Net income (loss) available to common shareholders | | $ | 1,946 | | | $ | (76 | ) | | $ | 3,548 | |
| | | | | | | | | | | | | |
| Comprehensive income | | $ | 4,166 | | | $ | 120 | | | $ | 5,668 | |
| | | | | | | | | | | | | |
| Per share of common stock: | | | | | | | | | | | | |
| Basic earnings (loss) | | $ | 0.15 | | | $ | (0.01 | ) | | $ | 0.27 | |
| Diluted earnings (loss) | | $ | 0.15 | | | $ | (0.01 | ) | | $ | 0.27 | |
| Dividends | | $ | 0.00 | | | $ | 0.00 | | | $ | 0.13 | |
| | | | | | | | | | | | | |
| Weighted average shares outstanding: | | | | | | | | | | | | |
| Basic | | | 13,082,347 | | | | 13,070,216 | | | | 13,062,881 | |
| Diluted(1) | | | 13,082,347 | | | | 13,070,216 | | | | 13,141,840 | |
| (1) Diluted weighted average shares outstanding for the three months ended March 31, 2010 and December 31, 2009 excludes 90,380 and 101,258 shares, respectively, because they are anti-dilutive. | |
| GREEN BANKSHARES, INC. |
| Consolidated Financial Highlights |
| (UNAUDITED) |
(Dollars in thousands except share and per share data)
| | | March 31, | | December 31, | | % |
| | | 2010 | | 2009 | | Change |
| Financial Condition Data: | | | | | | | | | |
| | | | | | | | | | |
| Assets | | $ | 2,569,732 | | | $ | 2,619,139 | | | | -1.89 | % |
| Loans, net of unearned interest | | | 1,994,039 | | | | 2,043,807 | | | | -2.44 | % |
| Cash and investments | | | 375,607 | | | | 382,578 | | | | -1.82 | % |
| Federal funds sold | | | 1,072 | | | | 3,793 | | | | -71.74 | % |
| Deposits | | | 2,037,865 | | | | 2,084,096 | | | | -2.22 | % |
| FHLB advances and notes payable | | | 171,919 | | | | 171,999 | | | | -0.05 | % |
| Subordinated debentures | | | 88,662 | | | | 88,662 | | | | 0.00 | % |
| Repurchase agreements | | | 23,830 | | | | 24,449 | | | | -2.53 | % |
| Shareholders' equity | | | 230,189 | | | | 226,769 | | | | 1.51 | % |
| Common shareholders' equity (1) | | | 163,108 | | | | 160,034 | | | | 1.92 | % |
| Tangible common shareholders' equity (2) | | | 154,424 | | | | 150,699 | | | | 2.47 | % |
| Tangible shareholders' equity (3) | | | 221,505 | | | | 217,434 | | | | 1.87 | % |
| | | | | | | | | | | | | |
Ratios: | | | | | | | | | | | | |
| Common book value per share (1) | | $ | 12.36 | | | $ | 12.15 | | | | 1.73 | % |
| Tangible common book value per share (2) | | $ | 11.71 | | | $ | 11.44 | | | | 2.36 | % |
| Total tangible equity to tangible assets (3)(4) | | | 8.65 | % | | | 8.33 | % | | | 3.81 | % |
| Tangible common equity to tangible assets (2)(4) | | | 6.03 | % | | | 5.77 | % | | | 4.42 | % |
| Average equity to average assets | | | 8.94 | % | | | 11.09 | % | | | -19.39 | % |
| (1) Common shareholders' equity is shareholders' equity less preferred stock. |
| (2) Tangible common shareholders' equity is shareholders' equity less goodwill, intangible assets and preferred stock. |
| (3) Tangible shareholders' equity is shareholders' equity less goodwill and intangible assets. |
| (4) Tangible assets is total assets less goodwill and intangible assets. |
| | | Three Months Ended | | | |
| | | March 31, | | December 31, | | | |
| | | 2010 | | 2009 | | % Change |
| Operating Data: | | | | | | | | | |
| | | | | | | | | | |
| Total interest income | | $ | 31,892 | | | $ | 33,424 | | | | -4.58 | % |
| Total interest expense | | | 10,233 | | | | 12,846 | | | | -20.34 | % |
| Net interest income | | | 21,659 | | | | 20,578 | | | | 5.25 | % |
| Provision for loan losses | | | 3,889 | | | | 6,402 | | | | -39.25 | % |
| Net interest income after provision for loan losses | | | 17,770 | | | | 14,176 | | | | 25.35 | % |
| Non-interest income | | | 7,686 | | | | 8,134 | | | | -5.51 | % |
| Non-interest expense | | | 20,546 | | | | 20,477 | | | | 0.34 | % |
| Income (loss) before income taxes | | | 4,910 | | | | 1,833 | | | | 167.87 | % |
| Income tax expense (benefit) | | | 1,714 | | | | 659 | | | | 160.09 | % |
| Net income (loss) | | | 3,196 | | | | 1,174 | | | | 172.23 | % |
| Preferred stock dividend and accretion of discount on warrants | | | 1,250 | | | | 1,250 | | | | 0.00 | % |
| Net income (loss) available to common shareholders | | $ | 1,946 | | | $ | (76 | ) | | | 2660.53 | % |
| | | | | | | | | | | | | |
| Comprehensive income (loss) | | $ | 4,166 | | | $ | 120 | | | | 3371.67 | % |
| | | | | | | | | | | | | |
| Per Share of Common Stock: | | | | | | | | | | | | |
| Basic earnings (loss) | | $ | 0.15 | | | $ | (0.01 | ) | | | -1600.00 | % |
| Diluted earnings (loss) | | $ | 0.15 | | | $ | (0.01 | ) | | | -1600.00 | % |
| Dividends | | $ | 0.00 | | | $ | 0.00 | | | | 0.00 | % |
| | | | | | | | | | | | | |
| Weighted Average Shares Outstanding: | | | | | | | | | |
| Basic | | | 13,082,347 | | | | 13,070,216 | | | | | |
| Diluted | | | 13,082,347 | | | | 13,070,216 | | | | | |
| | | | | | | | | | | | | |
| | | Three Months Ended |
| | | March 31, | | December 31, | | March 31, |
| | | 2010 | | 2009 | | 2009 |
| Key Financial Ratios: | | | | | | | | | |
| | | | | | | | | | |
| Return on average assets | | | 0.31 | % | | | -0.01 | % | | | 0.51 | % |
| Return on average shareholders' equity | | | 3.43 | % | | | -0.13 | % | | | 3.74 | % |
| Return on average common shareholders' equity (1) | | | 4.83 | % | | | -0.19 | % | | | 4.52 | % |
| Return on average common tangible shareholders' equity (2) | | | 5.11 | % | | | -0.20 | % | | | 8.84 | % |
| Interest rate spread | | | 3.81 | % | | | 3.26 | % | | | 3.01 | % |
| Net interest margin | | | 3.90 | % | | | 3.37 | % | | | 3.23 | % |
| (1) Common shareholders' equity is shareholders' equity less preferred stock. |
| (2) Tangible common shareholders' equity is shareholders' equity less goodwill, intangible assets and preferred stock. |
| | | March 31, | | December 31, | | March 31, |
| | | 2010 | | 2009 | | 2009 |
| Asset Quality Ratios: | | | | | | | | | |
| Nonperforming loans as a percentage of total loans, | | | |
| net of unearned income | | | 3.19 | % | | | 3.70 | % | | | 4.84 | % |
| Nonperforming assets as a percentage of total assets | | | 5.27 | % | | | 5.07 | % | | | 4.34 | % |
| Allowance for loan losses as a percentage of total loans, | | | | |
| net of unearned income | | | 2.52 | % | | | 2.45 | % | | | 2.19 | % |
| Allowance for loan losses as a percentage of | | | | | | | | |
| nonperforming loans | | | 78.85 | % | | | 66.39 | % | | | 45.16 | % |
| Net charge-offs to average total loans, net of | | | | | | | | |
| unearned income | | | 0.19 | % | | | 2.25 | % | | | 0.03 | % |
| GREEN BANKSHARES, INC. |
| Consolidated Financial Highlights |
| March 31, 2010 |
| (UNAUDITED) |
| Nonperforming Assets and Net Charge-offs | | | | | | | | Asset Quality Ratios | | | | | | | | | |
| | | | | | | | | | | | | | | | | | | | |
| As of and for the three months ended March 31, 2010 | | Bank | | | Other | | | Total | | As of and for the three months ended March 31, 2010 | | Bank | | Other | | Consolidated |
| Loans past due 90 days and still accruing | | $ | 137 | | | $ | 12 | | | $ | 149 | | Nonperforming loans as a percentage of total loans, net of unearned income | | | 3.19 | % | | | 1.23 | % | | | 3.19 | % |
| Nonaccrual loans | | | 62,955 | | | | 516 | | | | 63,471 | | Nonperforming assets as a percentage of total assets | | | 5.25 | % | | | 1.37 | % | | | 5.27 | % |
| Other real estate owned and repossessed assets | | | 71,586 | | | | 160 | | | | 71,746 | | Allowance for loan losses as a percentage of total loans, net of unearned income | | | 2.36 | % | | | 8.13 | % | | | 2.52 | % |
| Total nonperforming assets | | $ | 134,678 | | | $ | 688 | | | $ | 135,366 | | Allowance for loan losses as a percentage of nonperforming loans | | | 73.98 | % | | | 661.74 | % | | | 78.85 | % |
| | | | | | | | | | | | | | YTD net charge-offs to average total loans, net of unearned income | | | 0.17 | % | | | 1.25 | % | | | 0.19 | % |
| YTD net charge-offs | | $ | 3,345 | | | $ | 537 | | | $ | 3,882 | | | | | | | | | | | | | | |
| | | | | | | | | | | | | | | | | | | | | | | | | | |
| As of and for the three months ended March 31, 2009 | | Bank | | | Other | | | Total | | As of and for the three months ended March 31, 2009 | | Bank | | Other | | Consolidated |
| Loans past due 90 days and still accruing | | $ | 4,058 | | | $ | - | | | $ | 4,058 | | Nonperforming loans as a percentage of total loans, net of unearned income | | | 4.83 | % | | | 2.05 | % | | | 4.84 | % |
| Nonaccrual loans | | | 103,711 | | | | 852 | | | | 104,563 | | Nonperforming assets as a percentage of total assets | | | 4.31 | % | | | 1.98 | % | | | 4.34 | % |
| Other real estate owned and repossessed assets | | | 12,536 | | | | 115 | | | | 12,651 | | Allowance for loan losses as a percentage of total loans, net of unearned income | | | 2.05 | % | | | 8.09 | % | | | 2.19 | % |
| Total nonperforming assets | | $ | 120,305 | | | $ | 967 | | | $ | 121,272 | | Allowance for loan losses as a percentage of nonperforming loans | | | 42.41 | % | | | 393.66 | % | | | 45.16 | % |
| | | | | | | | | | | | | | YTD net charge-offs to average total loans, net of unearned income | | | 0.01 | % | | | 1.29 | % | | | 0.03 | % |
| YTD net charge-offs | | $ | 214 | | | $ | 528 | | | $ | 742 | | | | | | | | | | | | | | |
| | | | | | | | | | | | | | | | | | | | | | | | | | |
| As of and for the year ended December 31, 2009 | | Bank | | | Other | | | Total | | As of and for the year ended December 31, 2009 | | Bank | | Other | | Consolidated |
| Loans past due 90 days and still accruing | | $ | 147 | | | $ | - | | | $ | 147 | | Nonperforming loans as a percentage of total loans, net of unearned income | | | 3.69 | % | | | 1.50 | % | | | 3.70 | % |
| Nonaccrual loans | | | 74,761 | | | | 650 | | | | 75,411 | | Nonperforming assets as a percentage of total assets | | | 5.04 | % | | | 2.02 | % | | | 5.07 | % |
| Other real estate owned and repossessed assets | | | 56,799 | | | | 369 | | | | 57,168 | | Allowance for loan losses as a percentage of total loans, net of unearned income | | | 2.30 | % | | | 8.05 | % | | | 2.45 | % |
| Total nonperforming assets | | $ | 131,707 | | | $ | 1,019 | | | $ | 132,726 | | Allowance for loan losses as a percentage of nonperforming loans | | | 62.29 | % | | | 538.31 | % | | | 66.39 | % |
| | | | | | | | | | | | | | Net charge-offs to average total loans, net of unearned income | | | 2.15 | % | | | 5.88 | % | | | 2.25 | % |
| Net charge-offs | | $ | 46,394 | | | $ | 2,502 | | | $ | 48,896 | | | | | | | | | | | | | | |
| | | | | | | | | | | | | | | | | | | | | | | | | | |
| GREEN BANKSHARES, INC. |
| Condensed Average Balances, Interest Rates and Yields |
| March 31, 2010 |
| | | Three Months Ended |
| | | March 31, |
| | | 2010 | | 2009 |
| | | | | | | | | | | | | | | | | | | |
| | | Average | | | | | Average | | Average | | | | Average |
| | | Balance | | Interest | | Rate | | Balance | | Interest | | Rate |
| Interest-earning assets: | | | | | | | | | | | | | | | | | | |
| | | | | | | | | | | | | | | | | | | |
| Loans(1)(2) | | | 1,954,136 | | | | 30,080 | | | | 6.24 | % | | | 2,175,543 | | | | 32,655 | | | | 6.09 | % |
| Investment securities (2) | | | 169,020 | | | | 1,906 | | | | 4.57 | % | | | 216,757 | | | | 2,862 | | | | 5.35 | % |
| Other short-term investments | | | 148,394 | | | | 94 | | | | 0.26 | % | | | 70,459 | | | | 45 | | | | 0.26 | % |
| Total interest-earning assets | | | 2,271,550 | | | | 32,080 | | | | 5.73 | % | | | 2,462,759 | | | | 35,562 | | | | 5.86 | % |
| | | | | | | | | | | | | | | | | | | | | | | | | |
| Non-interest earning assets | | | 306,586 | | | | | | | | | | | | 384,013 | | | | | | | | | |
| Total assets | | | 2,578,136 | | | | | | | | | | | | 2,846,772 | | | | | | | | | |
| | | | | | | | | | | | | | | | | | | | | | | | | |
| | | | | | | | | | | | | | | | | | | | | | | | | |
| Interest-bearing liabilities: | | | | | | | | | | | | | | | | | | | | | | | | |
Deposits: | | | | | | | | | | | | | | | | | | | | | | | | |
| Interest checking, money market and savings | | | 941,888 | | | | 2,398 | | | | 1.03 | % | | | 623,708 | | | | 1,852 | | | | 1.20 | % |
| Time deposits | | | 940,388 | | | | 5,663 | | | | 2.44 | % | | | 1,296,277 | | | | 10,799 | | | | 3.38 | % |
| Total interest bearing-deposits | | | 1,882,276 | | | | 8,061 | | | | 1.74 | % | | | 1,919,985 | | | | 12,651 | | | | 2.67 | % |
| | | | | | | | | | | | | | | | | | | | | | | | | |
| Securities sold under repurchase and short-term borrowings | | | 23,615 | | | | 6 | | | | 0.10 | % | | | 33,076 | | | | 9 | | | | 0.11 | % |
| Notes payable | | | 171,946 | | | | 1,694 | | | | 4.00 | % | | | 229,282 | | | | 2,445 | | | | 4.32 | % |
| Subordinated debentures | | | 88,662 | | | | 472 | | | | 2.16 | % | | | 88,662 | | | | 846 | | | | 3.87 | % |
| Total interest-bearing liabilities | | | 2,166,499 | | | | 10,233 | | | | 1.92 | % | | | 2,271,005 | | | | 15,951 | | | | 2.85 | % |
| | | | | | | | | | | | | | | | | | | | | | | | | |
Non-interest bearing liabilities: | | | | | | | | | | | | | | | | | | | | | | | | |
| Demand Deposits | | | 163,173 | | | | | | | | | | | | 168,109 | | | | | | | | | |
| Other Liabilities | | | 18,098 | | | | | | | | | | | | 22,734 | | | | | | | | | |
| Total non-interest bearing liabilities | | | 181,271 | | | | | | | | | | | | 190,843 | | | | | | | | | |
| | | | | | | | | | | | | | | | | | | | | | | | | |
| Total liabilities | | | 2,347,770 | | | | | | | | | | | | 2,461,848 | | | | | | | | | |
| | | | | | | | | | | | | | | | | | | | | | | | | |
| Shareholders' equity | | | 230,366 | | | | | | | | | | | | 384,924 | | | | | | | | | |
| | | | | | | | | | | | | | | | | | | | | | | | | |
| Total liabilities & shareholders' equity | | | 2,578,136 | | | | | | | | | | | | 2,846,772 | | | | | | | | | |
| | | | | | | | | | | | | | | | | | | | | | | | | |
| Net interest income | | | | | | | 21,847 | | | | | | | | | | | | 19,611 | | | | | |
| | | | | | | | | | | | | | | | | | | | | | | | | |
| Interest rate spread | | | | | | | | | | | 3.81 | % | | | | | | | | | | | 3.01 | % |
| | | | | | | | | | | | | | | | | | | | | | | | | |
| Net yield on interest-earning assets (net interest margin) | | | | | | | | | | | 3.90 | % | | | | | | | | | | | 3.23 | % |
| | | | | | | | | | | | | | | | | | | | | | | | | |
(1) Average loan balances exclude nonaccrual loans for the periods presented.
(2) Fully Taxable Equivalent (FTE) at the rate of 35%. The FTE basis adjusts for the tax benefits of income on certain tax-exempt loans and investments using the federal statutory rate of 35% for each period presented. The Company believes this measure to be the preferred industry measurement of net interest income and provides relevant comparison between taxable and non-taxable amounts.
| GREEN BANKSHARES, INC. |
| Consolidated Financial Highlights |
| March 31, 2010 |
| (UNAUDITED) |
| | | March 31, 2010 | | December 31, 2009 | | | |
| Loans | | Balance | | % | | Balance | | % | | % Change |
| Commercial | | $ | 268,834 | | | | 13.38 | % | | $ | 274,346 | | | | 13.33 | % | | | -2.01 | % |
| Commercial real estate | | | 1,271,094 | | | | 63.28 | % | | | 1,306,398 | | | | 63.46 | % | | | -2.70 | % |
| Residential real estate | | | 386,664 | | | | 19.25 | % | | | 392,365 | | | | 19.06 | % | | | -1.45 | % |
| Consumer | | | 79,476 | | | | 3.96 | % | | | 83,382 | | | | 4.05 | % | | | -4.68 | % |
| Other | | | 2,709 | | | | 0.13 | % | | | 2,117 | | | | 0.10 | % | | | 27.96 | % |
| Total loans | | | 2,008,777 | | | | 100.00 | % | | | 2,058,608 | | | | 100.00 | % | | | -2.42 | % |
| | | | | | | | | | | | | | | | | | | | | |
| Less: Unearned income | | | (14,738 | ) | | | | | | | (14,801 | ) | | | | | | | | |
| Loans, net of unearned income | | $ | 1,994,039 | | | | | | | $ | 2,043,807 | | | | | | | | | |
| | | | | | | | | | | | | | | | | | | | | |
| Loan Balances by Geographical Region and Operating Subsidiaries | | | | | | | | | | | | | |
| | | | | | | | | | | | | | | | | | | | | |
| | | March 31, 2010 | | December 31, 2009 | | | | |
| | | Loan | | % to | | Loan | | % to | | | | |
| | | Balance | | Total Loans | | Balance | | Total Loans | | % Change |
| | | | | | | | | | | | | | | | | | | | | |
| Northeastern Tennessee Region(1) | | $ | 517,105 | | | | 25.93 | % | | $ | 521,145 | | | | 25.50 | % | | | -0.78 | % |
| East Tennessee Region | | | 685,808 | | | | 34.39 | % | | | 695,533 | | | | 34.03 | % | | | -1.40 | % |
| Middle Tennessee Region | | | 748,126 | | | | 37.52 | % | | | 783,676 | | | | 38.34 | % | | | -4.54 | % |
| | | | | | | | | | | | | | | | | | | | | |
| GCB Acceptance Corporation | | | 19,099 | | | | 0.96 | % | | | 19,143 | | | | 0.94 | % | | | -0.23 | % |
| Superior Financial Services, Inc. | | | 23,901 | | | | 1.20 | % | | | 24,310 | | | | 1.19 | % | | | -1.68 | % |
| | | | | | | | | | | | | | | | | | | | | |
| Loans, net of unearned income | | $ | 1,994,039 | | | | 100.00 | % | | $ | 2,043,807 | | | | 100.00 | % | | | -2.44 | % |
| (1)Includes one branch located in Southwestern Virginia and one branch located in Northwestern North Carolina | | | |
| | | March 31, 2010 | | December 31, 2009 | | | | |
| Deposits | | Balance | | % | | Balance | | % | | % Change |
| Non-interest bearing demand | | $ | 166,369 | | | | 8.16 | % | | $ | 177,602 | | | | 8.52 | % | | | -6.32 | % |
| Interest bearing demand | | | 669,243 | | | | 32.84 | % | | | 645,462 | | | | 30.97 | % | | | 3.68 | % |
| Money market and savings | | | 290,313 | | | | 14.25 | % | | | 278,157 | | | | 13.35 | % | | | 4.37 | % |
| Retail time | | | 552,366 | | | | 27.11 | % | | | 590,020 | | | | 28.31 | % | | | -6.38 | % |
| Jumbo time | | | 359,574 | | | | 17.64 | % | | | 392,855 | | | | 18.85 | % | | | -8.47 | % |
| Total | | $ | 2,037,865 | | | | 100.00 | % | | $ | 2,084,096 | | | | 100.00 | % | | | -2.22 | % |
| | | | | | | | | | | | | | | | | | | | | |
| Deposit Balances by Geographical Region | | | | | | | | | | | | | | | | | | | | |
| | | | | | | | | | | | | | | | | | | | | |
| | | March 31, 2010 | | December 31, 2009 | | | | |
| | | Balance | | % | | Balance | | % | | % Change |
| Northeastern Tennessee Region(1) | | $ | 747,586 | | | | 36.68 | % | | $ | 751,972 | | | | 36.08 | % | | | -0.58 | % |
| East Tennessee Region | | | 322,361 | | | | 15.82 | % | | | 322,791 | | | | 15.49 | % | | | -0.13 | % |
| Middle Tennessee Region | | | 967,918 | | | | 47.50 | % | | | 1,009,333 | | | | 48.43 | % | | | -4.10 | % |
| | | | | | | | | | | | | | | | | | | | | |
| Total | | $ | 2,037,865 | | | | 100.00 | % | | $ | 2,084,096 | | | | 100.00 | % | | | -2.22 | % |
(1) Includes one branch located in Southwestern Virginia and one branch located in Northwestern North Carolina | |