GREEN BANKSHARES REPORTS SECOND QUARTER NET INCOME
OF $1,561,000 OR $0.12 PER DILUTED SHARE
GREENEVILLE, Tenn. (July 21, 2010) – Green Bankshares, Inc. (NASDAQ:GRNB), the holding company for GreenBank, today reported net income available to common shareholders of $1,561,000 for the second quarter of 2010 compared with net income available to common shareholders of $1,946,000 for the first quarter of 2010 and a net loss available to common shareholders of $151,400,000 for the second quarter of 2009. The net loss for the second quarter of 2009 primarily reflected a non-cash, one-time goodwill impairment charge totaling $143,389,000; excluding this impairment charge, the net operating loss for the year-earlier quarter was $13,986,000 (please refer to the non-GAAP measurement reconciliation on page 5). For the six months ended June 30, 2010, net income available to common shareholders totaled $3,507,00 0 compared with a net loss available to common shareholders of $10,438,000 for the same period a year ago after excluding the onetime, non-cash, after-tax goodwill impairment charge of $137,414,000.
On a diluted per share basis, net income available to common shareholders totaled $0.12 for the second quarter of 2010 and $0.15 for the first quarter of 2010 compared with a net loss available to common shareholders of $1.07 after excluding the impact of the non-cash after-tax goodwill impairment charge of $10.51 for the second quarter of 2009. On a year-to-date basis, diluted per share net income available to common shareholders totaled $0.27 compared with a net loss available to common shareholders of $0.80 per diluted share for the first six months of 2009 after excluding the impact of the non-cash, after-tax goodwill impairment charge of $10.52.
Excluding preferred stock dividends paid to the U.S. Treasury and the accretion of discount on common stock warrants issued to the U.S. Treasury, the Company reported net income of $2,811,000 for the second quarter of 2010 and $6,007,000 for the six months ended June 30, 2010, compared with a net loss of $150,150,000 and $145,370,000, respectively, for the comparable periods in 2009.
Other highlights of the quarter included improving capital levels, higher year-over-year net interest income and generally stable credit quality conditions.
Improving capital levels:
| Consolidated: | | 2Q10 | | 1Q10 | | 4Q09 | | 3Q09 | | 2Q09 |
| Tangible common book value per share | | $ | 11.95 | | | $ | 11.71 | | | $ | 11.44 | | | $ | 11.47 | | | $ | 11.88 | |
| Tangible common equity to assets ratio | | | 6.25 | % | | | 6.03 | % | | | 5.77 | % | | | 5.42 | % | | | 5.98 | % |
| Bank Regulatory Ratios: | | | | | | | | | | | | | | | | | | | | |
| Tier 1 leverage ratio | | | 11.86 | % | | | 11.55 | % | | | 10.70 | % | | | 10.49 | % | | | 10.85 | % |
| Tier 1 risk-based capital ratio | | | 14.73 | % | | | 14.06 | % | | | 13.61 | % | | | 13.17 | % | | | 13.45 | % |
| Total risk-based capital ratio | | | 15.99 | % | | | 15.33 | % | | | 14.87 | % | | | 14.43 | % | | | 14.72 | % |
| · | All capital ratios continued to improve as profitability of the Company modestly improves given the lingering stress apparent in this phase of the economic cycle (see the non-GAAP measurement reconciliation on page 5 regarding tangible equity and book value per share). |
GRNB Reports Second Quarter Results
Page 2
July 21, 2010
Net interest income:
| (dollars in thousands) | | 2Q10 | | 1Q10 | | 4Q09 | | 3Q09 | | 2Q09 |
| Net interest income | | $ | 21,473 | | | $ | 21,659 | | | $ | 20,578 | | | $ | 20,338 | | | $ | 20,180 | |
| Net interest margin | | | 3.86 | % | | | 3.90 | % | | | 3.37 | % | | | 3.33 | % | | | 3.43 | % |
| Average earning assets | | $ | 2,248,240 | | | $ | 2,271,550 | | | $ | 2,445,872 | | | $ | 2,442,977 | | | $ | 2,382,377 | |
| · | Both net interest income and the net interest margin were negatively affected during the second quarter of 2010 by loan interest reversals totaling approximately $610,000 as $22,415,000 of loans were moved to non-accrual status. |
Credit quality:
Summary:
| (dollars in thousands) | | 2Q10 | | 1Q10 | | 4Q09 | | 3Q09 | | 2Q09 |
| Net loan charge-offs | | $ | 4,868 | | | $ | 3,882 | | | $ | 6,437 | | | $ | 18,436 | | | $ | 23,281 | |
| New non-accrual loans added | | $ | 22,415 | | | $ | 14,442 | | | $ | 31,111 | | | $ | 47,931 | | | $ | 57,292 | |
| Reserves to total loans | | | 2.60 | % | | | 2.52 | % | | | 2.45 | % | | | 2.39 | % | | | 2.30 | % |
| Non-performing assets | | $ | 141,915 | | | $ | 135,366 | | | $ | 132,726 | | | $ | 125,091 | | | $ | 129,177 | |
Changes in non-performing assets:
| (dollars in thousands) | | | | | | | | |
| March 31, 2010 | | $ | 63,471 | | | $ | 71,746 | | | $ | 149 | | | $ | 135,366 | |
| Loan foreclosures | | | (12,338 | ) | | | 12,338 | | | | n/a | | | | n/a | |
| Gross loan charge-offs | | | (5,316 | ) | | | n/a | | | | n/a | | | | (5,316 | ) |
| New non-accrual loans | | | 22,415 | | | | n/a | | | | n/a | | | | 22,415 | |
| Reduction of non-accrual loans | | | (3,890 | ) | | | n/a | | | | n/a | | | | (3,890 | ) |
| OREO sales proceeds | | | n/a | | | | (6,270 | ) | | | n/a | | | | (6,270 | ) |
| OREO write-downs, net | | | n/a | | | | (882 | ) | | | n/a | | | | (882 | ) |
| Change in past due > 90 days | | | n/a | | | | n/a | | | | 492 | | | | 492 | |
| June 30, 2010 | | $ | 64,342 | | | $ | 76,932 | | | $ | 641 | | | $ | 141,915 | |
(1) On average, all non-performing assets have been written down by 26%.
Loan portfolio migration:
| (Dollars in thousands) | | 2Q10 | | 1Q10 | | 2Q09 |
| Commercial real estate portfolio: | | | | | | | | | | | | |
| Acquisition & development | | $ | 176,152 | | | $ | 182,181 | | | $ | 228,680 | |
| Lot warehouse | | | 52,520 | | | | 55,499 | | | | 75,909 | |
| Commercial 1-4 family construction | | | 49,539 | | | | 69,328 | | | | 109,319 | |
| Total speculative 1-4 family | | | 278,211 | | | | 307,008 | | | | 413,908 | |
| Commercial vacant land | | | 100,163 | | | | 101,218 | | | | 103,219 | |
| Commercial construction non-owner occupied | | | 123,330 | | | | 156,970 | | | | 166,486 | |
| Commercial construction owner occupied | | | 6,519 | | | | 27,614 | | | | 56,721 | |
| Consumer residential construction | | | 13,511 | | | | 14,701 | | | | 27,267 | |
| Total construction and development | | | 243,523 | | | | 300,503 | | | | 353,693 | |
| | | | | | | | | | | | | |
| Non-owner occupied commercial real estate | | | 434,238 | | | | 395,638 | | | | 394,586 | |
| | | | | | | | | | | | | |
| Total commercial real estate | | $ | 955,972 | | | $ | 1,003,149 | | | $ | 1,162,187 | |
GRNB Reports Second Quarter Results
Page 3
July 21, 2010
Stephen M. Rownd, Chairman and Chief Executive Officer, commented, "While the outlook for economic recovery remains uncertain, we have taken a number of strategic steps that include the continued reduction in our construction and development portfolios, as indicated in the foregoing loan migration table, coupled with accelerated problem asset resolution through the segregation of staffing in our special assets area and by transferring additional resources into this area. At June 30, 2010, our loan loss reserves to total loans was 2.60% and our loan loss reserves were approximately 2.8 times annualized net charge-offs. Our non-performing asset and charge-off levels may remain elevated over the next few quarters based on trends in general economic conditions and as we realize the results of our strategic actions."
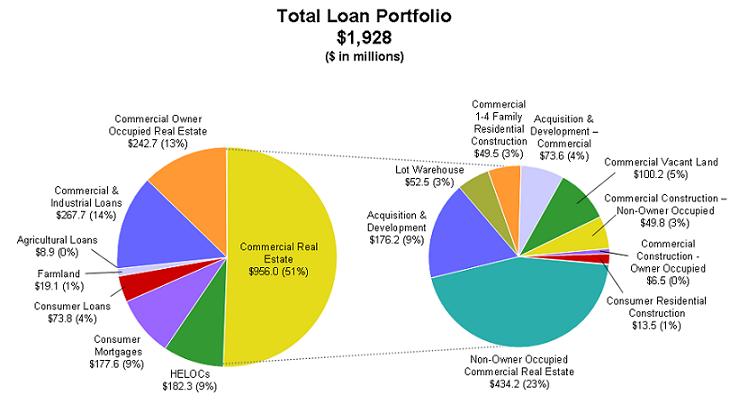
The following information graphically displays the consolidated loan portfolio by purpose code as of June 30, 2010:
Non-interest income totaled approximately $8.8 million during the second quarter of 2010, rising 14% on a linked quarter basis and up 29% compared with the second quarter of 2009. During the second quarter of 2010 and 2009, the Company reported net Other-Than-Temporary Impairment (OTTI) charges taken on securities of $93,000 and $733,000, respectively. For the first six months of 2010, non-interest income, including OTTI charges, totaled almost $16.4 million compared with $13.8 million for the same period a year ago, an increase of 20%. Excluding year-to-date OTTI charges of $93,000 in 2010 and $733,000 in 2009, non-interest income improved 14% in the first six months of 2010. The principal contributors to both the quarterly and year-to-date improvements in non-interest income were higher se rvice charge revenues on deposits together with increased annuity sales activity. The ongoing success of GreenBank's High Performance Checking product added 3,562 net new checking account customers during the second quarter of 2010 for a new account opening ratio of 2.02 new accounts opened for each account closed.
GRNB Reports Second Quarter Results
Page 4
July 21, 2010
Non-interest expenses totaled approximately $21.3 million for the second quarter of 2010, increasing less than 4% from the first quarter of 2010. Excluding the one-time, non-cash, goodwill impairment charge of $143.4 million recorded during the second quarter of 2009, non-interest expenses declined 15% from the year-earlier quarter. Driving the second quarter 2010 increase in non-interest expenses were normal non-executive compensation increases along with annuity sales commissions; higher advertising costs associated with a proactive program implemented to solicit customers to participate in the "opt-in" provisions of the Bank's overdraft program; higher FDIC insurance expenses and increased losses on the disposition of OREO-related properties.
Greeneville, Tennessee-based Green Bankshares, Inc., with total assets of approximately $2.5 billion, is the holding company for GreenBank. GreenBank, which traces its origin to 1890, has 63 branches across East and Middle Tennessee, and one branch each in Bristol, Virginia, and Hot Springs, North Carolina. It also provides wealth management services through its GreenWealth Division and residential mortgage lending through its Mortgage Division. In addition, GreenBank conducts separate businesses through three wholly owned subsidiaries: Superior Financial Services, Inc., a consumer finance company; GCB Acceptance Corporation, a consumer finance company specializing in automobile lending; and Fairway Title Co., a title insurance company.
Certain matters discussed in this news release are not historical facts but are "forward-looking statements" within the meaning of and are furnished pursuant to the Private Securities Litigation Reform Act of 1995. All forward-looking statements involve risk and uncertainty and actual results could differ materially from the anticipated results or other expectations expressed in the forward-looking statements. Risks and uncertainties related to the Company's business are discussed in the Company's SEC filings, including its Annual Report on Form 10-K for the year ended December 31, 2009, and include, but are not limited to, (1) deterioration in the financial condition of borrowers resulting in significant increases in loan losses and provisions for those losses; (2) continuation of the historically low short - -term interest rate environment; (3) changes in loan underwriting, credit review or loss reserve policies associated with economic conditions, examination conclusions, or regulatory developments; (4) increased levels of non-performing and repossessed assets and the ability to resolve these may result in future losses; (5) greater than anticipated deterioration or lack of sustained growth in the national or local economies; (6) rapid fluctuations or unanticipated changes in interest rates; (7) the impact of governmental restrictions on entities participating in the Capital Purchase Program of the United States Department of the Treasury; (8) changes in state and federal legislation, regulations or policies applicable to banks or other financial service providers, including regulatory or legislative developments arising out of current unsettled conditions in the economy and (9) the loss of key personnel. The Company undertakes no obligation to update forward-looking statements.
GRNB Reports Second Quarter Results
Page 5
July 21, 2010
GREEN BANKSHARES, INC.
Reconciliation of Non-GAAP Measures Presented in Earnings Release
(Dollars in thousands)
| | | | | |
| | | | | | | | | | | |
| Total non-interest expense | | $ | 21,274 | | | $ | 20,546 | | | $ | 168,410 | | | $ | 41,820 | | | $ | 186,241 | |
| Goodwill impairment charge | | | -- | | | | -- | | | | (143,389 | ) | | | -- | | | | (143,389 | ) |
Operating expenses | | $ | 21,274 | | | $ | 20,546 | | | $ | 25,021 | | | $ | 41,820 | | | $ | 42,852 | |
| | | | | | | | | | | | | | | | | | | | | |
| Net income (loss) available to common shareholders | | $ | 1,561 | | | $ | 1,946 | | | $ | (151,400 | ) | | $ | 3,507 | | | $ | (147,852 | ) |
| Goodwill impairment charge, net of tax | | | -- | | | | -- | | | | 137,414 | | | | -- | | | | 137,414 | |
Net operating income (loss) | | $ | 1,561 | | | $ | 1,946 | | | $ | (13,986 | ) | | $ | 3,507 | | | $ | (10,438 | ) |
| | | | | | | | | | | | | | | | | | | | | |
| Per Diluted Share: | | | | | | | | | | | | | | | | | | | | |
| Net income (loss) available to common shareholders | | $ | 0.12 | | | $ | 0.15 | | | $ | (11.58 | ) | | $ | 0.27 | | | $ | (11.32 | ) |
| Goodwill impairment charge, net of tax | | | -- | | | | -- | | | | 10.51 | | | | -- | | | | 10.52 | |
Net operating income (loss) | | $ | 0.12 | | | $ | 0.15 | | | $ | (1.07 | ) | | $ | 0.27 | | | $ | (0.80 | ) |
| | | 2Q10 | | 1Q10 | | 4Q09 | | 3Q09 | | 2Q09 |
| Total shareholders' equity | | $ | 233,150 | | | $ | 230,189 | | | $ | 226,769 | | | $ | 227,388 | | | $ | 233,192 | |
| Less: | | | | | | | | | | | | | | | | | | | | |
| Core deposit and other intangibles | | | (8,044 | ) | | | (8,684 | ) | | | (9,335 | ) | | | (9,981 | ) | | | (10,629 | ) |
| Preferred stock | | | (67,428 | ) | | | (67,081 | ) | | | (66,735 | ) | | | (66,388 | ) | | | (66,041 | ) |
| Tangible common equity | | $ | 157,678 | | | $ | 154,424 | | | $ | 150,699 | | | $ | 151,019 | | | $ | 156,522 | |
| | | | | | | | | | | | | | | | | | | | | |
| Total assets | | $ | 2,529,332 | | | $ | 2,569,732 | | | $ | 2,619,139 | | | $ | 2,794,217 | | | $ | 2,629,834 | |
| Less: | | | | | | | | | | | | | | | | | | | | |
| Core deposit and other intangibles | | | (8,044 | ) | | | (8,684 | ) | | | (9,335 | ) | | | (9,981 | ) | | | (10,629 | ) |
| Total tangible assets | | $ | 2,521,288 | | | $ | 2,561,048 | | | $ | 2,609,804 | | | $ | 2,784,236 | | | $ | 2,619,205 | |
Use of Non-GAAP financial measures
The above table presents computations and other financial information excluding the goodwill impairment charge incurred by the Company in the second quarter of 2009 (non-GAAP). The goodwill impairment charge is included in the financial results presented in accordance with generally accepted accounting principles (GAAP). The Company believes that the exclusion of goodwill impairment in expressing net operating income (loss), operating expenses and earnings (loss) per share data provides a more meaningful base for period to period comparisons which will assist investors in analyzing the operating results of the Company and predicting operating performance. The Company utilizes these non-GAAP financial measures to compare the operating performance with comparable periods in prior years and with internally prepared projections. Non-GAAP financial measures have inherent limitations, are not required to be uniformly applied and are not audited. To mitigate these limitations, the Company has policies in place to address goodwill impairment from other normal operating expenses to ensure that the Company's operating results are properly reflected for period to period comparisons.
GRNB Reports Second Quarter Results
Page 6
July 21, 2010
GREEN BANKSHARES, INC.
Unaudited Financial Highlights
(In thousands, except per share amounts)
| | | | | |
| | | | | | | | | | | |
| Interest income | | $ | 31,304 | | | $ | 31,892 | | | $ | 34,856 | | | $ | 63,196 | | | $ | 70,236 | |
| Interest expense | | | 9,831 | | | | 10,233 | | | | 14,676 | | | | 20,064 | | | | 30,627 | |
| Net interest income | | | 21,473 | | | | 21,659 | | | | 20,180 | | | | 43,132 | | | | 39,609 | |
| Provision for loan losses | | | 4,749 | | | | 3,889 | | | | 24,384 | | | | 8,638 | | | | 25,369 | |
| Net interest income (loss) after provision for loan losses | | | 16,724 | | | | 17,770 | | | | (4,204 | ) | | | 34,494 | | | | 14,240 | |
| Non-interest income | | | 8,771 | | | | 7,686 | | | | 6,808 | | | | 16,457 | | | | 13,751 | |
| Non-interest expense | | | 21,274 | | | | 20,546 | | | | 168,410 | | | | 41,820 | | | | 186,241 | |
| Income (loss) before income taxes | | | 4,221 | | | | 4,910 | | | | (165,806 | ) | | | 9,131 | | | | (158,250 | ) |
| Income tax provision (benefit) | | | 1,410 | | | | 1,714 | | | | (15,656 | ) | | | 3,124 | | | | (12,880 | ) |
| Income (loss) | | | 2,811 | | | | 3,196 | | | | (150,150 | ) | | | 6,007 | | | | (145,370 | ) |
| Preferred stock dividends and related cost | | | 1,250 | | | | 1,250 | | | | 1,250 | | | | 2,500 | | | | 2,482 | |
| Net income (loss) available to common shareholders | | $ | 1,561 | | | $ | 1,946 | | | $ | (151,400 | ) | | $ | 3,507 | | | $ | (147,852 | ) |
| Comprehensive income (loss) | | $ | 3,705 | | | $ | 4,166 | | | $ | (150,557 | ) | | $ | 7,871 | | | $ | (144,889 | ) |
| | | | | | | | | | | | | | | | | | | | | |
| Earnings (loss) per common share: | | | | | | | | | | | | | | | | | | | | |
Basic | | $ | 0.12 | | | $ | 0.15 | | | $ | (11.58 | ) | | $ | 0.27 | | | $ | (11.32 | ) |
Diluted 1 | | $ | 0.12 | | | $ | 0.15 | | | $ | (11.58 | ) | | $ | 0.27 | | | $ | (11.32 | ) |
| | | | | | | | | | | | | | | | | | | | | |
| Weighted average common shares: | | | | | | | | | | | | | | | | | | | | |
Basic | | | 13,098 | | | | 13,082 | | | | 13,070 | | | | 13,090 | | | | 13,067 | |
Diluted | | | 13,158 | | | | 13,173 | | | | 13,070 | | | | 13,148 | | | | 13,067 | |
| | | | | | | | | | | | | | | | | | | | | |
| Dividends declared per common share | | $ | 0.00 | | | $ | 0.00 | | | $ | 0.00 | | | $ | 0.00 | | | $ | 0.13 | |
| | | | | | | |
| Total assets | | $ | 2,529,332 | | | $ | 2,569,732 | | | $ | 2,629,834 | |
| Cash and cash equivalents | | | 208,155 | | | | 177,541 | | | | 107,573 | |
| Investment and other securities | | | 190,471 | | | | 198,066 | | | | 181,234 | |
| Loans, net of unearned interest | | | 1,928,174 | | | | 1,994,039 | | | | 2,183,754 | |
| Allowance for loan losses | | | (50,049 | ) | | | (50,167 | ) | | | (50,157 | ) |
| Deposits | | | 1,991,839 | | | | 2,037,865 | | | | 2,026,722 | |
| Shareholders' equity | | | 233,150 | | | | 230,189 | | | | 233,192 | |
Common shareholders' equity 2 | | | 165,722 | | | | 163,108 | | | | 167,151 | |
Tangible common shareholders' equity 3 | | | 157,678 | | | | 154,424 | | | | 156,522 | |
Common book value per share 2 | | | 12.56 | | | | 12.36 | | | | 12.69 | |
Tangible common book value per share 3 | | | 11.95 | | | | 11.71 | | | | 11.88 | |
| 1 | Diluted weighted average shares outstanding for the three- and six-month periods ended June 30, 2009, exclude 105,734 and 92,420 restricted average shares, respectively, because their impact would be anti-dilutive. |
| 2 | Common shareholders' equity is shareholders' equity less preferred stock. |
| 3 | Tangible common shareholders' equity is shareholders' equity less goodwill, intangible assets and preferred stock. |