Exhibit 99.1

| CONTACT: | James E. Adams |
| | Executive Vice President and Chief Financial Officer |
| | 423-278-3050 |
GREEN BANKSHARES REPORTS NET LOSS FOR THE THIRD QUARTER OF 2010
GREENEVILLE, Tenn. (October 20, 2010) – Green Bankshares, Inc. (NASDAQ:GRNB), the holding company for GreenBank, today reported a net loss available to common shareholders of $36.4 million or $2.78 per diluted share for the third quarter of 2010 compared with a net loss available to common shareholders of $7.7 million or $0.59 per diluted share for the year-earlier quarter. The third quarter of 2010 reflected higher costs related to loan charge-offs, coupled with losses incurred on Other Real Estate Owned (OREO) resulting from sales completed and updated property appraisals received. For the first nine months of 2010, net loss available to common shareholders was $32.9 million or $2.51 per diluted share compared with $155.6 million or $11.91 per diluted share for the first nine months of 2009 .
Commenting on the announcement, Stephen M. Rownd, Chairman and Chief Executive Officer, said, "For the most part, the credit and impairment charges incurred during the third quarter resulted principally from a handful of events that occurred in the second half of the quarter. We continue to aggressively focus on dealing with our problem assets through our Special Assets Group and, depending upon economic conditions, envision the possibility of further credit challenges through the remainder of 2010. While credit quality remains a major obstacle, the core performance of our company is improving. Our net interest margin, excluding interest reversals, continues to expand, and non-interest income is also growing with our increasing core deposit base. Despite the challenging environment and the losses we incurred this quarter, our regulatory capital ratios remain quite strong."
Capital levels: (see the non-GAAP measurement reconciliation on page 5 regarding tangible equity and book value per share)
| Consolidated: | | | 3Q10 | | | | 2Q10 | | | | 1Q10 | | | | 4Q09 | | | | 3Q09 | |
| Tangible common book value per share | | $ | 9.30 | | | $ | 11.95 | | | $ | 11.71 | | | $ | 11.44 | | | $ | 11.47 | |
| Tangible common equity to assets ratio | | | 5.09 | % | | | 6.25 | % | | | 6.03 | % | | | 5.77 | % | | | 5.42 | % |
| Bank Regulatory Ratios: | | | | | | | | | | | | | | | | | | | | |
| Tier 1 leverage ratio | | | 11.09 | % | | | 11.86 | % | | | 11.55 | % | | | 10.70 | % | | | 10.49 | % |
| Tier 1 risk-based capital ratio | | | 13.98 | % | | | 14.73 | % | | | 14.06 | % | | | 13.61 | % | | | 13.17 | % |
| Total risk-based capital ratio | | | 15.25 | % | | | 15.99 | % | | | 15.33 | % | | | 14.87 | % | | | 14.43 | % |
Net interest income:
| (dollars in thousands) | | | 3Q10 | | | | 2Q10 | | | | 1Q10 | | | | 4Q09 | | | | 3Q09 | |
| Net interest income | | $ | 20,747 | | | $ | 21,473 | | | $ | 21,659 | | | $ | 20,578 | | | $ | 20,338 | |
| Net interest margin | | | 3.90 | % | | | 3.86 | % | | | 3.90 | % | | | 3.37 | % | | | 3.33 | % |
| Average earning assets | | $ | 2,130,339 | | | $ | 2,248,240 | | | $ | 2,271,550 | | | $ | 2,445,872 | | | $ | 2,442,977 | |
| · | Both net interest income and the net interest margin were negatively affected during the third quarter of 2010 by loan interest reversals totaling approximately $1,398,000 as $111,868,000 of loans were moved to non-accrual status. Of these new non-accrual loans, nine relationships represented $73,500,000 or two-thirds of the non-accrual loans added. Excluding interest reversals, net interest margin would have been 4.16% for the 2010 third quarter. |
-MORE-
Green Bankshares, Inc. ▪ 100 North Main Street ▪ Greeneville, TN 37743 ▪ (423) 639-5111
GRNB Reports Third Quarter Results
Page 2
October 20, 2010
Credit quality:
Summary:
| (dollars in thousands) | | | 3Q10 | | | | 2Q10 | | | | 1Q10 | | | | 4Q09 | | | | 3Q09 | |
| Net loan charge-offs | | $ | 36,549 | | | $ | 4,868 | | | $ | 3,882 | | | $ | 6,437 | | | $ | 18,436 | |
| New non-accrual loans added | | $ | 111,868 | | | $ | 22,415 | | | $ | 14,442 | | | $ | 31,111 | | | $ | 47,931 | |
| Reserves to total loans | | | 2.74 | % | | | 2.60 | % | | | 2.52 | % | | | 2.45 | % | | | 2.39 | % |
| Non-performing assets | | $ | 197,159 | | | $ | 141,915 | | | $ | 135,366 | | | $ | 132,726 | | | $ | 125,091 | |
As the economy remained stubbornly sluggish during the third quarter of 2010, highlighted by the lack of meaningful improvement in employment statistics and the residential real estate construction and development environment in the Company's markets, a number of the Bank's borrowers experienced further stress, prompting the Company to engage an independent third-party loan reviewer. This review contributed to the asset quality-impact reflected in our third quarter results.
Changes in non-performing assets:
| (dollars in thousands) | | | | | | | | | | | | |
| June 30, 2010 | | $ | 64,342 | | | $ | 76,932 | | | $ | 641 | | | $ | 141,915 | |
| Loan foreclosures | | | (8,317 | ) | | | 8,317 | | | | n/a | | | | n/a | |
| Gross loan charge-offs | | | (37,199 | ) | | | n/a | | | | n/a | | | | (37,199 | ) |
| New non-accrual loans | | | 111,868 | | | | n/a | | | | n/a | | | | 111,868 | |
| Reduction of non-accrual loans | | | (8,204 | ) | | | n/a | | | | n/a | | | | (8,204 | ) |
| OREO sales proceeds | | | n/a | | | | (4,968 | ) | | | n/a | | | | (4,968 | ) |
| OREO write-downs, net | | | n/a | | | | (6,582 | ) | | | n/a | | | | (6,582 | ) |
| Change in past due > 90 days | | | n/a | | | | n/a | | | | 329 | | | | 329 | |
| September 30, 2010 | | $ | 122,490 | | | $ | 73,699 | | | $ | 970 | | | $ | 197,159 | |
(1) On average, all non-performing assets have been written down almost 30%.
Loan portfolio migration:
| (Dollars in thousands) | | | 3Q10 | | | | 2Q10 | | | | 1Q10 | | | | 3Q09 | |
| Commercial real estate portfolio: | | | | | | | | | | | | | | | | |
| Acquisition & development | | $ | 145,500 | | | $ | 176,152 | | | $ | 182,181 | | | $ | 190,826 | |
| Lot warehouse | | | 46,306 | | | | 52,520 | | | | 55,499 | | | | 68,948 | |
| Commercial 1-4 family construction | | | 41,847 | | | | 49,539 | | | | 69,328 | | | | 83,155 | |
| Total speculative 1-4 family | | | 233,653 | | | | 278,211 | | | | 307,008 | | | | 342,929 | |
| Commercial vacant land | | | 84,321 | | | | 100,163 | | | | 101,218 | | | | 102,312 | |
| Commercial construction non-owner occupied | | | 100,364 | | | | 123,330 | | | | 156,970 | | | | 174,199 | |
| Commercial construction owner occupied | | | 5,454 | | | | 6,519 | | | | 27,614 | | | | 37,034 | |
| Consumer residential construction | | | 13,801 | | | | 13,511 | | | | 14,701 | | | | 23,833 | |
| Total construction and development | | | 203,940 | | | | 243,523 | | | | 300,503 | | | | 337,378 | |
| | | | | | | | | | | | | | | | | |
| Non-owner occupied commercial real estate | | | 439,519 | | | | 434,238 | | | | 395,638 | | | | 396,889 | |
| | | | | | | | | | | | | | | | | |
| Total commercial real estate | | $ | 877,112 | | | $ | 955,972 | | | $ | 1,003,149 | | | $ | 1,077,196 | |
-MORE-
GRNB Reports Third Quarter Results
Page 3
October 20, 2010
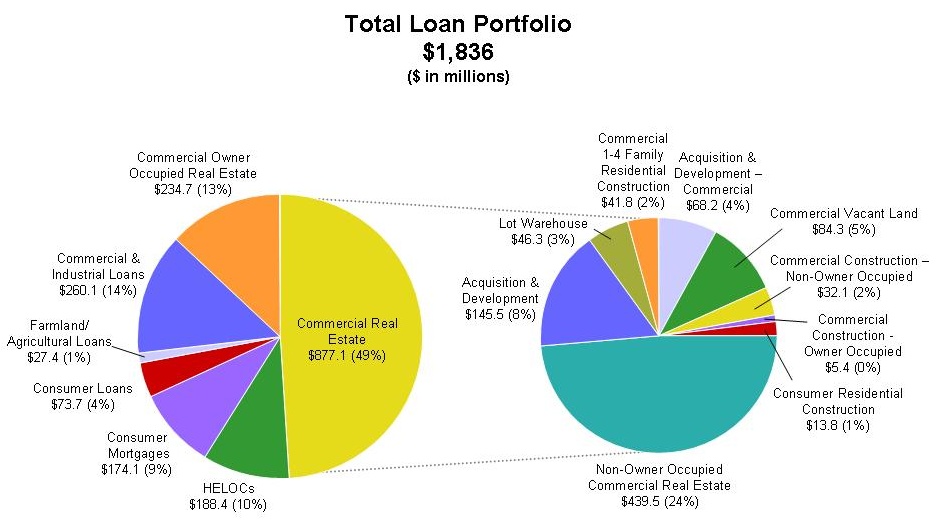
"Efforts to reduce our commercial real estate exposure continued through the third quarter," Rownd continued. "Since the third quarter of 2009, we have reduced our overall exposure to commercial real estate by more than 18%. Over the last year, the higher risk concentrations in the speculative 1-4 family residential real estate portfolio have declined almost 32% and construction and development loans have declined by more than 39%, as indicated in the foregoing loan portfolio migration table. Accelerating our problem asset resolution remains our top priority through the focused efforts of our Special Assets Group. We continue to seek to resolve these issues in the best interests of our shareholders, with a goal of returning to profitability in 2011. Depending on general economic conditions, our non-performing asset and charge-off levels may remain elevated over the next few quarters as we realize the results of our strategic actions." Rownd also noted that the Company's loan loss reserve to total loans was 2.74% at September 30, 2010.
The following information graphically displays the consolidated loan portfolio by purpose code as of September 30, 2010:
Non-interest income totaled approximately $9.0 million for the third quarter of 2010, increasing modestly from the second quarter of 2010. Excluding net securities gains taken of $430,000 during the third quarter of 2009, non-interest income for the third quarter of 2010 was up 3% compared with the year-earlier period. On a year-to-date basis, non-interest income totaled $25.5 million for the first nine months of 2010 compared with $23.4 million for the same period last year, an increase of almost 9%. The principal contributors to both the quarterly and year-to-date improvements in non-interest income were higher service charge revenues on deposits, together with increased annuity sales activity. The ongoing success of GreenBank's High Performance Checking product added 3,463 net new checking account c ustomers during the third quarter of 2010, for a new account opening ratio of 1.96 new accounts for each account closed.
-MORE-
GRNB Reports Third Quarter Results
Page 4
October 20, 2010
Non-interest expenses totaled approximately $27.0 million for the third quarter of 2010, increasing $5.7 million from the second quarter of 2010 primarily as a result of losses incurred on OREO. Excluding the one-time, non-cash, goodwill impairment charge of $143.4 million recorded during 2009, year-to-date 2010 non-interest expenses increased $3.1 million, or 5%, over the first nine months of 2009. Driving the year-to-date 2010 increase in non-interest expenses were normal, non-executive compensation increases along with annuity sales commissions; higher advertising costs associated with a proactive program implemented to solicit customers to participate in the "opt-in" provisions of the Bank's overdraft program; higher FDIC insurance expense; and increased expenses associated with losses incurr ed on OREO-related properties.
Greeneville, Tennessee-based Green Bankshares, Inc., with total assets of approximately $2.4 billion, is the holding company for GreenBank. GreenBank, which traces its origin to 1890, has 63 branches across East and Middle Tennessee, and one branch each in Bristol, Virginia, and Hot Springs, North Carolina. It also provides wealth management services through its GreenWealth Division and residential mortgage lending through its Mortgage Division. In addition, GreenBank conducts separate businesses through three wholly owned subsidiaries: Superior Financial Services, Inc., a consumer finance company; GCB Acceptance Corporation, a consumer finance company specializing in automobile lending; and Fairway Title Co., a title insurance company.
Certain matters discussed in this news release are not historical facts but are "forward-looking statements" within the meaning of and are furnished pursuant to the Private Securities Litigation Reform Act of 1995. All forward-looking statements involve risk and uncertainty and actual results could differ materially from the anticipated results or other expectations expressed in the forward-looking statements. Risks and uncertainties related to the Company's business are discussed in the Company's SEC filings, including its Annual Report on Form 10-K for the year ended December 31, 2009, and include, but are not limited to, (1) deterioration in the financial condition of borrowers resulting in significant increases in loan losses and provisions for those losses; (2) continuation of the historically low short-term interest rate environment; (3) changes in loan underwriting, credit review or loss reserve policies associated with economic conditions, examination conclusions, or regulatory developments; (4) increased levels of non-performing and repossessed assets and the ability to resolve these may result in future losses; (5) greater than anticipated deterioration or lack of sustained growth in the national or local economies; (6) rapid fluctuations or unanticipated changes in interest rates; (7) the impact of governmental restrictions on entities participating in the Capital Purchase Program of the United States Department of the Treasury; (8) changes in state and federal legislation, regulations or policies applicable to banks or other financial service providers, including regulatory or legislative developments, like the Dodd-Frank Wall Street Reform and Consumer Protection Act, arising out of current unsettled conditions in the economy and (9) the lo ss of key personnel. The Company undertakes no obligation to update forward-looking statements.
-MORE-
GRNB Reports Third Quarter Results
Page 5
October 20, 2010
GREEN BANKSHARES, INC.
Reconciliation of Non-GAAP Measures Presented in Earnings Release
(Dollars in thousands)
| | | | | | | |
| | | | | | | | | | | | | | | | |
| Total non-interest expense | | $ | 27,009 | | | $ | 21,274 | | | $ | 22,365 | | | $ | 68,829 | | | $ | 209,109 | |
| Goodwill impairment charge | | | -- | | | | -- | | | | -- | | | | -- | | | | (143,389 | ) |
Operating expenses | | $ | 27,009 | | | $ | 21,274 | | | $ | 22,365 | | | $ | 68,829 | | | $ | 65,720 | |
| | | | | | | | | | | | | | | | | | | | | |
| Net income (loss) available to common shareholders | | $ | (36,405 | ) | | $ | 1,561 | | | $ | (7,748 | ) | | $ | (32,898 | ) | | $ | (155,600 | ) |
| Goodwill impairment charge, net of tax | | | -- | | | | -- | | | | -- | | | | -- | | | | 137,414 | |
Net operating income (loss) | | $ | (36,405 | ) | | $ | 1,561 | | | $ | (7,748 | ) | | $ | (32,898 | ) | | $ | (18,186 | ) |
| | | | | | | | | | | | | | | | | | | | | |
| Per Diluted Share: | | | | | | | | | | | | | | | | | | | | |
| Net income (loss) available to common shareholders | | $ | (2.78 | ) | | $ | 0.12 | | | $ | (0.59 | ) | | $ | (2.51 | ) | | $ | (11.91 | ) |
| Goodwill impairment charge, net of tax | | | -- | | | | -- | | | | -- | | | | -- | | | | 10.52 | |
Net operating income (loss) | | $ | (2.78 | ) | | $ | 0.12 | | | $ | (0.59 | ) | | $ | (2.51 | ) | | $ | (1.39 | ) |
| | | | | | | | | | | | | | | | |
| Total shareholders' equity | | $ | 197,824 | | | $ | 233,150 | | | $ | 230,189 | | | $ | 226,769 | | | $ | 227,388 | |
| Less: | | | | | | | | | | | | | | | | | | | | |
| Core deposit and other intangibles | | | (7,398 | ) | | | (8,044 | ) | | | (8,684 | ) | | | (9,335 | ) | | | (9,981 | ) |
| Preferred stock | | | (67,775 | ) | | | (67,428 | ) | | | (67,081 | ) | | | (66,735 | ) | | | (66,388 | ) |
| Tangible common equity | | $ | 122,651 | | | $ | 157,678 | | | $ | 154,424 | | | $ | 150,699 | | | $ | 151,019 | |
| | | | | | | | | | | | | | | | | | | | | |
| Total assets | | $ | 2,415,014 | | | $ | 2,529,332 | | | $ | 2,569,732 | | | $ | 2,619,139 | | | $ | 2,794,217 | |
| Less: | | | | | | | | | | | | | | | | | | | | |
| Core deposit and other intangibles | | | (7,398 | ) | | | (8,044 | ) | | | (8,684 | ) | | | (9,335 | ) | | | (9,981 | ) |
| Total tangible assets | | $ | 2,407,616 | | | $ | 2,521,288 | | | $ | 2,561,048 | | | $ | 2,609,804 | | | $ | 2,784,236 | |
Use of Non-GAAP financial measures
The above table presents computations and other financial information excluding the goodwill impairment charge incurred by the Company in the second quarter of 2009 and excluding the Company's preferred stock and intangible assets (non-GAAP). The goodwill impairment charge is included in the financial results presented in accordance with generally accepted accounting principles (GAAP). The Company believes that the exclusion of goodwill impairment in expressing net operating income (loss), operating expenses and earnings (loss) per share data provides a more meaningful base for period to period comparisons which will assist investors in analyzing the operating results of the Company and predicting operating performance. The Company utilizes these non-GAAP financial measures to compare the operating per formance with comparable periods in prior years and with internally prepared projections. Non-GAAP financial measures have inherent limitations, are not required to be uniformly applied and are not audited. To mitigate these limitations, the Company has policies in place to address goodwill impairment from other normal operating expenses to ensure that the Company's operating results are properly reflected for period to period comparisons.
-MORE-
GRNB Reports Third Quarter Results
Page 6
October 20, 2010
GREEN BANKSHARES, INC.
Unaudited Financial Highlights
(In thousands, except per share amounts)
| | | | | | | |
| | | | | | | | | | | | | | | | |
| Interest income | | $ | 29,455 | | | $ | 31,304 | | | $ | 34,796 | | | $ | 92,651 | | | $ | 105,032 | |
| Interest expense | | | 8,708 | | | | 9,831 | | | | 14,458 | | | | 28,772 | | | | 45,085 | |
| Net interest income | | | 20,747 | | | | 21,473 | | | | 20,338 | | | | 63,879 | | | | 59,947 | |
| Provision for loan losses | | | 36,823 | | | | 4,749 | | | | 18,475 | | | | 45,461 | | | | 43,844 | |
| Net interest income (loss) after provision for loan losses | | | (16,076 | ) | | | 16,724 | | | | 1,863 | | | | 18,418 | | | | 16,103 | |
| Non-interest income | | | 9,029 | | | | 8,771 | | | | 9,189 | | | | 25,486 | | | | 23,443 | |
| Non-interest expense | | | 27,009 | | | | 21,274 | | | | 22,365 | | | | 68,829 | | | | 209,109 | |
| Income (loss) before income taxes | | | (34,056 | ) | | | 4,221 | | | | (11,313 | ) | | | (24,925 | ) | | | (169,563 | ) |
| Income tax provision (benefit) | | | 1,098 | | | | 1,410 | | | | (4,815 | ) | | | 4,222 | | | | (17,695 | ) |
| Income (loss) | | | (35,154 | ) | | | 2,811 | | | | (6,498 | ) | | | (29,147 | ) | | | (151,868 | ) |
| Preferred stock dividends and related cost | | | 1,251 | | | | 1,250 | | | | 1,250 | | | | 3,751 | | | | 3,732 | |
| Net income (loss) available to common shareholders | | $ | (36,405 | ) | | $ | 1,561 | | | $ | (7,748 | ) | | $ | (32,898 | ) | | $ | (155,600 | ) |
| Comprehensive income (loss) | | $ | (34,583 | ) | | $ | 3,705 | | | $ | (5,073 | ) | | $ | (26,712 | ) | | $ | (149,962 | ) |
| | | | | | | | | | | | | | | | | | | | | |
| Earnings (loss) per common share: | | | | | | | | | | | | | | | | | | | | |
Basic | | $ | (2.78 | ) | | $ | 0.12 | | | $ | (0.59 | ) | | $ | (2.51 | ) | | $ | (11.91 | ) |
Diluted 1 | | $ | (2.78 | ) | | $ | 0.12 | | | $ | (0.59 | ) | | $ | (2.51 | ) | | $ | (11.91 | ) |
| | | | | | | | | | | | | | | | | | | | | |
| Weighted average common shares: | | | | | | | | | | | | | | | | | | | | |
Basic | | | 13,098 | | | | 13,098 | | | | 13,070 | | | | 13,093 | | | | 13,068 | |
Diluted | | | 13,098 | | | | 13,158 | | | | 13,070 | | | | 13,093 | | | | 13,068 | |
| | | | | | | | | | | | | | | | | | | | | |
| Dividends declared per common share | | $ | 0.00 | | | $ | 0.00 | | | $ | 0.00 | | | $ | 0.00 | | | $ | 0.13 | |
| | | | | | | | | | |
| Total assets | | $ | 2,415,014 | | | $ | 2,529,332 | | | $ | 2,794,217 | |
| Cash and cash equivalents | | | 206,391 | | | | 208,155 | | | | 346,131 | |
| Investment and other securities | | | 178,307 | | | | 190,471 | | | | 169,307 | |
| Loans, net of unearned interest | | | 1,835,591 | | | | 1,928,174 | | | | 2,099,267 | |
| Allowance for loan losses | | | (50,322 | ) | | | (50,049 | ) | | | (50,196 | ) |
| Deposits | | | 1,916,544 | | | | 1,991,839 | | | | 2,214,761 | |
| Shareholders' equity | | | 197,824 | | | | 233,150 | | | | 227,388 | |
Common shareholders' equity 2 | | | 130,049 | | | | 165,722 | | | | 161,000 | |
Tangible common shareholders' equity 3 | | | 122,651 | | | | 157,678 | | | | 151,019 | |
Common book value per share 2 | | | 9.86 | | | | 12.56 | | | | 12.22 | |
Tangible common book value per share 3 | | | 9.30 | | | | 11.95 | | | | 11.47 | |
| 1 | Diluted weighted average shares outstanding exclude 94,267 and 101,636 restricted average shares for the three-month periods ended September 30, 2010 and 2009, and exclude 93,242 and 95,526 restricted average shares for the nine-month periods ended September 30, 2010 and 2009, because their impact would be anti-dilutive. |
| 2 | Common shareholders' equity is shareholders' equity less preferred stock. |
| 3 | Tangible common shareholders' equity is shareholders' equity less goodwill, intangible assets and preferred stock. |
-END-
| GREEN BANKSHARES, INC. | |
| Consolidated Balance Sheets | |
| September 30, 2010, December 31, 2009 and September 30, 2009 | |
| (Dollars in thousands) | |
| | | | | | | | | | | | | |
| | | | (Unaudited) | | | | | | | (Unaudited) |
| | | | September 30, | | | December 31, | | | September 30, |
| | | | 2010 | | | 2009* | | | 2009 |
ASSETS | | | | | | | | | | | | |
| | | | | | | | | | | | | |
| Cash and due from banks | | $ | 202,709 | | | $ | 206,701 | | | $ | 345,209 | |
| Federal funds sold | | | 3,682 | | | | 3,793 | | | | 922 | |
| Cash and cash equivalents | | | 206,391 | | | | 210,494 | | | | 346,131 | |
| | | | | | | | | | | | | |
| Interest earning deposits in other banks | | | 1,014 | | | | 11,000 | | | | 1,000 | |
| Securities available-for-sale ("AFS") | | | 163,964 | | | | 147,724 | | | | 154,937 | |
| Securities held-to-maturity (with a market value of $603, $638 and $644 | | | | | | | | | | | | |
| on September 30, 2010, December 31, 2009 and September 30, 2009) | | | 595 | | | | 626 | | | | 636 | |
| FHLB and other stock, at cost | | | 12,734 | | | | 12,734 | | | | 12,734 | |
| Loans held for sale | | | 2,091 | | | | 1,533 | | | | 1,064 | |
| Loans, net of unearned income | | | 1,835,591 | | | | 2,043,807 | | | | 2,099,267 | |
| Allowance for loan losses | | | (50,322 | ) | | | (50,161 | ) | | | (50,196 | ) |
| Other real estate owned and repossessed assets | | | 73,699 | | | | 57,168 | | | | 56,413 | |
| Bank premises and equipment, net | | | 79,657 | | | | 81,818 | | | | 82,551 | |
| Cash surrender value of life insurance | | | 31,171 | | | | 30,277 | | | | 29,997 | |
| Goodwill | | | - | | | | - | | | | - | |
| Core deposit and other intangibles | | | 7,398 | | | | 9,335 | | | | 9,981 | |
| Other assets | | | 51,031 | | | | 62,784 | | | | 49,702 | |
| Total assets | | $ | 2,415,014 | | | $ | 2,619,139 | | | $ | 2,794,217 | |
| | | | | | | | | | | | | |
| LIABILITIES AND SHAREHOLDERS' EQUITY | | | | | | | | | | | | |
| | | | | | | | | | | | | |
| Non-interest-bearing deposits | | $ | 165,642 | | | $ | 177,602 | | | $ | 156,797 | |
| Interest-bearing deposits | | | 1,749,503 | | | | 1,899,910 | | | | 1,998,157 | |
| Brokered deposits | | | 1,399 | | | | 6,584 | | | | 59,807 | |
| Total deposits | | | 1,916,544 | | | | 2,084,096 | | | | 2,214,761 | |
| | | | | | | | | | | | | |
| Repurchase agreements | | | 22,641 | | | | 24,449 | | | | 25,294 | |
| FHLB advances and notes payable | | | 170,884 | | | | 171,999 | | | | 216,578 | |
| Subordinated debentures | | | 88,662 | | | | 88,662 | | | | 88,662 | |
| Accrued interest payable and other liabilities | | | 18,459 | | | | 23,164 | | | | 21,534 | |
| Total liabilities | | | 2,217,190 | | | | 2,392,370 | | | | 2,566,829 | |
| | | | | | | | | | | | | |
| SHAREHOLDERS' EQUITY | | | | | | | | | | | | |
| | | | | | | | | | | | | |
| Preferred stock: no par value, 1,000,000 shares authorized; | | | | | | | | | | | | |
| 72,278, 72,278 and 72,278 shares outstanding | | | 67,775 | | | | 66,735 | | | | 66,388 | |
| Common stock: $2 par value, 20,000,000 shares authorized; | | | | | | | | | | | | |
| 13,190,300, 13,171,474 and 13,171,474 shares outstanding | | | 26,381 | | | | 26,343 | | | | 26,343 | |
| Common stock warrants | | | 6,934 | | | | 6,934 | | | | 6,934 | |
| Additional paid in capital | | | 188,749 | | | | 188,310 | | | | 188,146 | |
| Retained earnings (deficit) | | | (94,638 | ) | | | (61,742 | ) | | | (61,666 | ) |
| Accumulated other comprehensive income | | | 2,623 | | | | 189 | | | | 1,243 | |
| Total shareholders' equity | | | 197,824 | | | | 226,769 | | | | 227,388 | |
| | | | | | | | | | | | | |
| Total liabilities & shareholders' equity | | $ | 2,415,014 | | | $ | 2,619,139 | | | $ | 2,794,217 | |
| | | | | | | | | | | | | |
| * Derived from Audited Consolidated Financial Statements. | | | | | | | | | | | | |
| GREEN BANKSHARES, INC. | |
| Consolidated Statements of Income and Comprehensive Income | |
| Three Months Ended September 30, 2010, June 30, 2010 and September 30, 2009 and Nine Months Ended September 30, 2010 and 2009 | |
| (Unaudited) | |
| | | | | | | | | | | | | | | | | | | | | |
| (Dollars in thousands except share and per share data) | |
| | | | | | | | | | | | | | | | | | | | | |
| | | | Three Months Ended | | | | Nine Months Ended | |
| | | | September 30, | | | June 30, | | | September 30, | | | September 30, | | | September 30, |
| | | | 2010 | | | 2010 | | | 2009 | | | 2010 | | | 2009 |
| | | | | | | | | | | | | | | | | | | | | |
| Interest income: | | | | | | | | | | | | | | | | | | | | |
| Interest and fees on loans | | $ | 27,744 | | | $ | 29,374 | | | $ | 32,559 | | | $ | 87,178 | | | $ | 97,732 | |
| Taxable securities | | | 1,181 | | | | 1,391 | | | | 1,669 | | | | 3,860 | | | | 5,732 | |
| Nontaxable securities | | | 304 | | | | 306 | | | | 315 | | | | 922 | | | | 949 | |
| FHLB and other stock | | | 136 | | | | 134 | | | | 151 | | | | 408 | | | | 436 | |
| Federal funds sold and other | | | 90 | | | | 99 | | | | 102 | | | | 283 | | | | 183 | |
| Total interest income | | | 29,455 | | | | 31,304 | | | | 34,796 | | | | 92,651 | | | | 105,032 | |
| | | | | | | | | | | | | | | | | | | | | |
| Interest expense: | | | | | | | | | | | | | | | | | | | | |
| Deposits | | | 6,444 | | | | 7,626 | | | | 11,480 | | | | 22,131 | | | | 35,644 | |
| Federal funds purchased and repurchase agreements | | | 6 | | | | 5 | | | | 6 | | | | 17 | | | | 22 | |
| FHLB advances and notes payable | | | 1,726 | | | | 1,712 | | | | 2,416 | | | | 5,132 | | | | 7,328 | |
| Subordinated debentures | | | 532 | | | | 488 | | | | 556 | | | | 1,492 | | | | 2,091 | |
| Total interest expense | | | 8,708 | | | | 9,831 | | | | 14,458 | | | | 28,772 | | | | 45,085 | |
| | | | | | | | | | | | | | | | | | | | | |
| Net interest income | | | 20,747 | | | | 21,473 | | | | 20,338 | | | | 63,879 | | | | 59,947 | |
| | | | | | | | | | | | | | | | | | | | | |
| Provision for loan losses | | | 36,823 | | | | 4,749 | | | | 18,475 | | | | 45,461 | | | | 43,844 | |
| | | | | | | | | | | | | | | | | | | | | |
| Net interest income (loss) after provision for loan losses | | | (16,076 | ) | | | 16,724 | | | | 1,863 | | | | 18,418 | | | | 16,103 | |
| | | | | | | | | | | | | | | | | | | | | |
| Non-interest income: | | | | | | | | | | | | | | | | | | | | |
| Service charges on deposit accounts | | | 6,651 | | | | 6,692 | | | | 6,446 | | | | 19,283 | | | | 17,597 | |
| Other charges and fees | | | 417 | | | | 383 | | | | 505 | | | | 1,156 | | | | 1,459 | |
| Trust and investment services income | | | 1,021 | | | | 757 | | | | 595 | | | | 2,360 | | | | 1,472 | |
| Mortgage banking income | | | 212 | | | | 123 | | | | 127 | | | | 453 | | | | 292 | |
| Other income | | | 728 | | | | 909 | | | | 1,086 | | | | 2,327 | | | | 2,423 | |
| Securities gains (losses), net | | | - | | | | - | | | | - | | | | - | | | | | |
| Realized gains (losses), net | | | - | | | | - | | | | 933 | | | | - | | | | 933 | |
| Other-than-temporary impairment | | | - | | | | (553 | ) | | | (503 | ) | | | (553 | ) | | | (960 | ) |
| Less non-credit portion recognized in other comprehensive income | | | - | | | | 460 | | | | - | | | | 460 | | | | 227 | |
| Total securities gains (losses), net | | | - | | | | (93 | ) | | | 430 | | | | (93 | ) | | | 200 | |
| Total non-interest income | | | 9,029 | | | | 8,771 | | | | 9,189 | | | | 25,486 | | | | 23,443 | |
| Non-interest expense: | | | | | | | | | | | | | | | | | | | | |
| Employee compensation | | | 8,266 | | | | 7,972 | | | | 7,315 | | | | 23,903 | | | | 23,071 | |
| Employee benefits | | | 816 | | | | 816 | | | | 526 | | | | 2,609 | | | | 3,050 | |
| Occupancy expense | | | 1,792 | | | | 1,684 | | | | 1,762 | | | | 5,175 | | | | 5,261 | |
| Equipment expense | | | 742 | | | | 668 | | | | 761 | | | | 2,118 | | | | 2,398 | |
| Computer hardware/software expense | | | 916 | | | | 886 | | | | 735 | | | | 2,626 | | | | 2,023 | |
| Professional services | | | 741 | | | | 576 | | | | 457 | | | | 1,924 | | | | 1,432 | |
| Advertising | | | 657 | | | | 806 | | | | 678 | | | | 2,061 | | | | 1,421 | |
| OREO maintenance expense | | | 712 | | | | 554 | | | | 531 | | | | 1,711 | | | | 811 | |
| Collection and repossession expense | | | 508 | | | | 534 | | | | 775 | | | | 2,329 | | | | 1,784 | |
| Loss on OREO and repossessed assets | | | 6,538 | | | | 926 | | | | 3,578 | | | | 7,973 | | | | 7,005 | |
| FDIC insurance | | �� | 1,099 | | | | 1,209 | | | | 819 | | | | 3,159 | | | | 4,069 | |
| Core deposit and other intangible amortization | | | 646 | | | | 640 | | | | 648 | | | | 1,937 | | | | 2,104 | |
| Goodwill impairment | | | - | | | | - | | | | - | | | | - | | | | 143,389 | |
| Other expenses | | | 3,576 | | | | 4,003 | | | | 3,780 | | | | 11,304 | | | | 11,291 | |
| Total non-interest expense | | | 27,009 | | | | 21,274 | | | | 22,365 | | | | 68,829 | | | | 209,109 | |
| | | | | | | | | | | | | | | | | | | | | |
| Income (loss) before income taxes | | | (34,056 | ) | | | 4,221 | | | | (11,313 | ) | | | (24,925 | ) | | | (169,563 | ) |
| | | | | | | | | | | | | | | | | | | | | |
| Income taxes provision (benefit) | | | 1,098 | | | | 1,410 | | | | (4,815 | ) | | | 4,222 | | | | (17,695 | ) |
| | | | | | | | | | | | | | | | | | | | | |
| Net income (loss) | | | (35,154 | ) | | | 2,811 | | | | (6,498 | ) | | | (29,147 | ) | | | (151,868 | ) |
| | | | | | | | | | | | | | | | | | | | | |
| Preferred stock dividends and accretion of discount on warrants | | | 1,251 | | | | 1,250 | | | | 1,250 | | | | 3,751 | | | | 3,732 | |
| | | | | | | | | | | | | | | | | | | | | |
| Net income (loss) available to common shareholders | | $ | (36,405 | ) | | $ | 1,561 | | | $ | (7,748 | ) | | $ | (32,898 | ) | | $ | (155,600 | ) |
| | | | | | | | | | | | | | | | | | | | | |
| Comprehensive income (loss) | | $ | (34,583 | ) | | $ | 3,705 | | | $ | (5,073 | ) | | $ | (26,712 | ) | | $ | (149,962 | ) |
| | | | | | | | | | | | | | | | | | | | | |
| Per share of common stock: | | | | | | | | | | | | | | | | | | | | |
| Basic earnings (loss) | | | ($2.78 | ) | | | $0.12 | | | | ($0.59 | ) | | | ($2.51 | ) | | | ($11.91 | ) |
| Diluted earnings (loss) | | | ($2.78 | ) | | | $0.12 | | | | ($0.59 | ) | | | ($2.51 | ) | | | ($11.91 | ) |
| Dividends | | | $0.00 | | | | $0.00 | | | | $0.00 | | | | $0.00 | | | | $0.13 | |
| | | | | | | | | | | | | | | | | | | | | |
| Weighted average shares outstanding: | | | | | | | | | | | | | | | | | | | | |
| Basic | | | 13,097,611 | | | | 13,097,611 | | | | 13,070,216 | | | | 13,092,579 | | | | 13,067,798 | |
Diluted(1) | | | 13,097,611 | | | | 13,158,131 | | | | 13,070,216 | | | | 13,092,579 | | | | 13,067,798 | |
| | | | | | | | | | | | | | | | | | | | | |
(1)Diluted weighted average shares outstanding exclude 94,267 and 101,636 of the restricted average shares for the three month periods ended September 30, 2010 and 2009 and exclude 93,242 and 95,526 of the restricted average shares for the nine month periods ended September 30, 2010 and 2009 because their impact would be anti-dilutive. | |
Consolidated Financial Highlights
(UNAUDITED)
(Dollars in thousands except share and per share data)
| | | | | | | | | | | | | |
| | | | September 30, | | | December 31, | | | % | | | |
| | | | 2010 | | | 2009 | | | Change | | | |
| | Financial Condition Data: | | | | | | | | | | | |
| | | | | | | | | | | | | |
| | Assets | | $ | 2,415,014 | | | $ | 2,619,139 | | | | -7.79 | % | | |
| | Loans, net of unearned interest | | | 1,835,591 | | | | 2,043,807 | | | | -10.19 | % | | |
| | Cash and investments | | | 384,698 | | | | 382,578 | | | | 0.55 | % | | |
| | Federal funds sold | | | 3,682 | | | | 3,793 | | | | -2.93 | % | | |
| | Deposits | | | 1,916,544 | | | | 2,084,096 | | | | -8.04 | % | | |
| | FHLB advances and notes payable | | | 170,884 | | | | 171,999 | | | | -0.65 | % | | |
| | Subordinated debentures | | | 88,662 | | | | 88,662 | | | | 0.00 | % | | |
| | Repurchase agreements | | | 22,641 | | | | 24,449 | | | | -7.39 | % | | |
| | Shareholders' equity | | | 197,824 | | | | 226,769 | | | | -12.76 | % | | |
| | Common shareholders' equity (1) | | | 130,049 | | | | 160,034 | | | | -18.74 | % | | |
| | Tangible common shareholders' equity (2) | | | 122,651 | | | | 150,699 | | | | -18.61 | % | | |
| | Tangible shareholders' equity (3) | | | 190,426 | | | | 217,434 | | | | -12.42 | % | | |
| | | | | | | | | | | | | | | | |
| | Ratios: | | | | | | | | | | | | | | |
| | Common book value per share (1) | | | $9.86 | | | | $12.15 | | | | -18.85 | % | | |
| | Tangible common book value per share (2) | | | $9.30 | | | | $11.44 | | | | -18.71 | % | | |
| | Total tangible equity to tangible assets (3)(4) | | | 7.91 | % | | | 8.33 | % | | | -5.07 | % | | |
| | Tangible common equity to tangible assets (2)(4) | | | 5.09 | % | | | 5.77 | % | | | -11.78 | % | | |
| | Average equity to average assets | | | 9.17 | % | | | 11.09 | % | | | -17.31 | % | | |
| | | | | | | | | | | | | | | | |
| | (1) Common shareholders' equity is shareholders' equity less preferred stock. | | | |
| | (2) Tangible common shareholders' equity is shareholders' equity less goodwill, intangible assets and preferred stock. | | | |
| | (3) Tangible shareholders' equity is shareholders' equity less goodwill and intangible assets. | | | |
| | (4) Tangible assets is total assets less goodwill and intangible assets. | | | |
| | | | | |
| | | | | | | | | | | | | | | |
| | | | Three Months Ended | | | | | | | Nine Months Ended | | | | |
| | | | September 30, | | | | | | | September 30, | | | | |
| | | | 2010 | | | 2009 | | | % Change | | | | 2010 | | | 2009 | | | % Change | |
| | Operating Data: | | | | | | | | | | | | | | | | | | | |
| | | | | | | | | | | | | | | | | | | | | |
| | Total interest income | | $ | 29,455 | | | $ | 34,796 | | | | -15.35 | % | | | $ | 92,651 | | | $ | 105,032 | | | | -11.79 | % |
| | Total interest expense | | | 8,708 | | | | 14,458 | | | | -39.77 | % | | | | 28,772 | | | | 45,085 | | | | -36.18 | % |
| | Net interest income | | | 20,747 | | | | 20,338 | | | | 2.01 | % | | | | 63,879 | | | | 59,947 | | | | 6.56 | % |
| | Provision for loan losses | | | 36,823 | | | | 18,475 | | | | 99.31 | % | | | | 45,461 | | | | 43,844 | | | | 3.69 | % |
| | Net interest income (loss) after provision for loan losses | | | (16,076 | ) | | | 1,863 | | | | -962.91 | % | | | | 18,418 | | | | 16,103 | | | | 14.38 | % |
| | Non-interest income | | | 9,029 | | | | 9,189 | | | | -1.74 | % | | | | 25,486 | | | | 23,443 | | | | 8.71 | % |
| | Non-interest expense | | | 27,009 | | | | 22,365 | | | | 20.76 | % | | | | 68,829 | | | | 209,109 | | | | -67.08 | % |
| | Income (loss) before income taxes | | | (34,056 | ) | | | (11,313 | ) | | | -201.03 | % | | | | (24,925 | ) | | | (169,563 | ) | | | 85.30 | % |
| | Income tax expense (benefit) | | | 1,098 | | | | (4,815 | ) | | | 122.80 | % | | | | 4,222 | | | | (17,695 | ) | | | 123.86 | % |
| | Net income (loss) | | | (35,154 | ) | | | (6,498 | ) | | | -441.00 | % | | | | (29,147 | ) | | | (151,868 | ) | | | 80.81 | % |
| | Preferred stock dividend and accretion of discount on warrants | | | 1,251 | | | | 1,250 | | | | 0.08 | % | | | | 3,751 | | | | 3,732 | | | | 0.51 | % |
| | Net income (loss) available to common shareholders | | $ | (36,405 | ) | | $ | (7,748 | ) | | | -369.86 | % | | | $ | (32,898 | ) | | $ | (155,600 | ) | | | 78.86 | % |
| | | | | | | | | | | | | | | | | | | | | | | | | | | |
| | Comprehensive income (loss) | | $ | (34,583 | ) | | $ | (5,073 | ) | | | -581.71 | % | | | $ | (26,712 | ) | | $ | (149,962 | ) | | | 82.19 | % |
| | | | | | | | | | | | | | | | | | | | | | | | | | | |
| | Per Share of Common Stock: | | | | | | | | | | | | | | | | | | | | | | | | | |
| | Basic earnings (loss) | | $ | (2.78 | ) | | $ | (0.59 | ) | | | -371.19 | % | | | $ | (2.51 | ) | | $ | (11.91 | ) | | | 78.93 | % |
| | Diluted earnings (loss) | | $ | (2.78 | ) | | $ | (0.59 | ) | | | -371.19 | % | | | $ | (2.51 | ) | | $ | (11.91 | ) | | | 78.93 | % |
| | Dividends | | $ | 0.00 | | | $ | 0.00 | | | | 0.00 | % | | | $ | 0.00 | | | $ | 0.13 | | | | -100.00 | % |
| | | | | | | | | | | | | | | | | | | | | | | | | | | |
| | Weighted Average Shares Outstanding: | | | | | | | | | | | | | | | | | | | | | | | | | |
| | Basic | | | 13,097,611 | | | | 13,070,216 | | | | | | | | | 13,092,579 | | | | 13,067,798 | | | | | |
| | Diluted | | | 13,097,611 | | | | 13,070,216 | | | | | | | | | 13,092,579 | | | | 13,067,798 | | | | | |
| | | | | | | | | | | | | | | | | | | | | | | | | | | |
| | | | | | | | | |
| | | | Three Months Ended | | | Nine Months Ended | | |
| | | | September 30, | | June 30, | | September 30, | | | September 30, | | |
| | | | 2010 | | 2010 | | 2009 | | | 2010 | | 2009 | | |
| | Key Financial Ratios: | | | | | | | | | | | | | |
| | | | | | | | | | | | | | | |
| | Return on average assets | | -5.86% | | 0.25% | | -1.12% | | | -1.74% | | -7.43% | | |
| | Return on average shareholders' equity | | -62.23% | | 2.68% | | -12.97% | | | -18.95% | | -62.04% | | |
| | Return on average common shareholders' equity (1) | | -87.78% | | 3.76% | | -18.00% | | | -26.68% | | -77.32% | | |
| | Return on average common tangible shareholders' equity (2) | | -91.91% | | 3.96% | | -19.16% | | | -28.09% | | -127.26% | | |
| | Interest rate spread | | 3.83% | | 3.77% | | 3.22% | | | 3.80% | | 3.16% | | |
| | Net interest margin | | 3.90% | | 3.86% | | 3.33% | | | 3.89% | | 3.33% | | |
| | Efficiency Ratio | | 90.71% | | 70.34% | | 75.74% | | | 77.02% | | 251.68% | | |
| | | | | | | | | | | | | | | |
| | (1) Common shareholders' equity is shareholders' equity less preferred stock. | | | | | | | |
| | (2) Tangible common shareholders' equity is shareholders' equity less goodwill, intangible assets and preferred stock. | | | | | | | |
| | | | | | | | | | | | | | | |
| | | | | | | | | | |
| | | | September 30, | | December 31, | | September 30, | | |
| | | | 2010 | | 2009 | | 2009 | | |
| | Asset Quality Ratios: | | | | | | | | |
| | Nonperforming loans as a percentage of total loans, | | | | | | | | |
| | net of unearned income | | 6.73% | | 3.70% | | 3.27% | | |
| | Nonperforming assets as a percentage of total assets | | 8.16% | | 5.07% | | 4.48% | | |
| | Allowance for loan losses as a percentage of total loans, | | | | | | | | |
| | | | | | | | | | |
| | Allowance for loan losses as a percentage of | | | | | | | | |
| | nonperforming loans | | 40.76% | | 66.39% | | 73.09% | | |
| | Net charge-offs to average total loans, net of | | | | | | | | |
| | unearned income | | 2.31% | | 2.25% | | 1.93% | | |
| | | | | | | | | | |
GREEN BANKSHARES, INC.
Consolidated Financial Highlights
(UNAUDITED)
| | | | | | | | | | | | | | | | | | | | | |
| | Nonperforming Assets and Net Charge-offs | | | | | | | | | | | | Asset Quality Ratios | | | | | | | |
| | | | | | | | | | | | | | | | | | | | | | | |
| | As of and for the three months ended September 30, 2010 | | Bank | | | Other | | | Total | | | | As of and for the three months ended September 30, 2010 | | Bank | | Other | | Consolidated | |
| | | Loans past due 90 days and still accruing | $ | 970 | | $ | - | | $ | 970 | | | | | Nonperforming loans as a percentage of total loans, net of unearned income | | 6.75% | | 1.50% | | 6.73% | |
| | | Nonaccrual loans | | 121,837 | | | 653 | | | 122,490 | | | | | Nonperforming assets as a percentage of total assets | | 8.13% | | 1.54% | | 8.16% | |
| | | Other real estate owned and repossessed assets | | 73,527 | | | 172 | | | 73,699 | | | | | Allowance for loan losses as a percentage of total loans, net of unearned income | | 2.58% | | 7.80% | | 2.74% | |
| | | Total nonperforming assets | $ | 196,334 | | $ | 825 | | $ | 197,159 | | | | | Allowance for loan losses as a percentage of nonperforming loans | | 38.22% | | 518.99% | | 40.76% | |
| | | | | | | | | | | | | | | | YTD net charge-offs to average total loans, net of unearned income | | 2.26% | | 3.06% | | 2.31% | |
| | | YTD net charge-offs | $ | 43,973 | | $ | 1,326 | | $ | 45,299 | | | | | | | | | | | | |
| | | | | | | | | | | | | | | | | | | | | | | |
| | As of and for the three months ended September 30, 2009 | | Bank | | | Other | | | Total | | | | As of and for the three months ended September 30, 2009 | | Bank | | Other | | Consolidated | |
| | | Loans past due 90 days and still accruing | $ | 1,522 | | $ | 9 | | $ | 1,531 | | | | | Nonperforming loans as a percentage of total loans, net of unearned income | | 3.24% | | 2.70% | | 3.27% | |
| | | Nonaccrual loans | | 65,984 | | | 1,163 | | | 67,147 | | | | | Nonperforming assets as a percentage of total assets | | 4.43% | | 2.89% | | 4.48% | |
| | | Other real estate owned and repossessed assets | | 56,039 | | | 374 | | | 56,413 | | | | | Allowance for loan losses as a percentage of total loans, net of unearned income | | 2.24% | | 8.12% | | 2.39% | |
| | | Total nonperforming assets | $ | 123,545 | | $ | 1,546 | | $ | 125,091 | | | | | Allowance for loan losses as a percentage of nonperforming loans | | 69.13% | | 301.11% | | 73.09% | |
| | | | | | | | | | | | | | | | YTD net charge-offs to average total loans, net of unearned income | | 1.86% | | 4.25% | | 1.93% | |
| | | YTD net charge-offs | $ | 40,662 | | $ | 1,797 | | $ | 42,459 | | | | | | | | | | | | |
| | | | | | | | | | | | | | | | | | | | | | | |
| | As of and for the year ended December 31, 2009 | | Bank | | | Other | | | Total | | | | As of and for the year ended December 31, 2009 | | Bank | | Other | | Consolidated | |
| | | Loans past due 90 days and still accruing | $ | 147 | | $ | - | | $ | 147 | | | | | Nonperforming loans as a percentage of total loans, net of unearned income | | 3.69% | | 1.50% | | 3.70% | |
| | | Nonaccrual loans | | 74,761 | | | 650 | | | 75,411 | | | | | Nonperforming assets as a percentage of total assets | | 5.04% | | 2.02% | | 5.07% | |
| | | Other real estate owned and repossessed assets | | 56,799 | | | 369 | | | 57,168 | | | | | Allowance for loan losses as a percentage of total loans, net of unearned income | | 2.30% | | 8.05% | | 2.45% | |
| | | Total nonperforming assets | $ | 131,707 | | $ | 1,019 | | $ | 132,726 | | | | | Allowance for loan losses as a percentage of nonperforming loans | | 62.29% | | 538.31% | | 66.39% | |
| | | | | | | | | | | | | | | | Net charge-offs to average total loans, net of unearned income | | 2.15% | | 5.88% | | 2.25% | |
| | | Net charge-offs | $ | 46,394 | | $ | 2,502 | | $ | 48,896 | | | | | | | | | | | | |
| | | | | | | | | | | | | | | | | | | | | | | |
| GREEN BANKSHARES, INC. | |
| Condensed Average Balances, Interest Rates and Yields | |
| September 30, 2010 | |
| | | | | | | | | | | | | | | | | | | | | | | | | | | | | |
| | | Three Months Ended | | | Nine Months Ended | |
| | | September 30, | | | September 30, |
| | | 2010 | | 2009 | | 2010 | | 2009 |
| | | | | | | | | | | | | | | | | | | | | | | | | | | | | |
| | | Average | | | | Average | | Average | | | | Average | | Average | | | | Average | | Average | | | | Average |
| | | Balance | | Interest | | Rate | | Balance | | Interest | | Rate | | Balance | | Interest | | Rate | | Balance | | Interest | | Rate |
| Interest-earning assets: | | | | | | | | | | | | | | | | | | | | | | | | | | | | |
| | | | | | | | | | | | | | | | | | | | | | | | | | | | | |
Loans(1)(2) | | 1,812,154 | | 27,759 | | 6.08 | % | | 2,075,096 | | 32,577 | | 6.23 | % | | 1,886,937 | | 87,230 | | 6.18 | % | | 2,125,547 | | 97,771 | | 6.15 | % |
Investment securities (2) | | 179,586 | | 1,785 | | 3.94 | % | | 184,433 | | 2,305 | | 4.96 | % | | 180,894 | | 5,686 | | 4.20 | % | | 198,741 | | 7,628 | | 5.13 | % |
| Other short-term investments | | 138,599 | | 90 | | 0.26 | % | | 183,448 | | 102 | | 0.22 | % | | 148,365 | | 283 | | 0.26 | % | | 105,011 | | 183 | | 0.23 | % |
| Total interest-earning assets | | 2,130,339 | | 29,634 | | 5.52 | % | | 2,442,977 | | 34,984 | | 5.68 | % | | 2,216,196 | | 93,199 | | 5.62 | % | | 2,429,299 | | 105,582 | | 5.81 | % |
| | | | | | | | | | | | | | | | | | | | | | | | | | | | | |
| Non-interest earning assets | | 333,199 | | | | | | | 303,665 | | | | | | | 315,147 | | | | | | | 369,023 | | | | | |
| Total assets | | 2,463,538 | | | | | | | 2,746,642 | | | | | | | 2,531,343 | | | | | | | 2,798,322 | | | | | |
| | | | | | | | | | | | | | | | | | | | | | | | | | | | | |
| | | | | | | | | | | | | | | | | | | | | | | | | | | | | |
| Interest-bearing liabilities: | | | | | | | | | | | | | | | | | | | | | | | | | | | | |
Deposits: | | | | | | | | | | | | | | | | | | | | | | | | | | | | |
| Interest checking, money market and savings | | 992,222 | | 2,522 | | 1.01 | % | | 870,091 | | 3,163 | | 1.44 | % | | 968,322 | | 7,407 | | 1.02 | % | | 742,643 | | 7,557 | | 1.36 | % |
| Time deposits | | 765,960 | | 3,922 | | 2.03 | % | | 1,121,349 | | 8,317 | | 2.94 | % | | 862,823 | | 14,724 | | 2.28 | % | | 1,190,412 | | 28,087 | | 3.15 | % |
| Total interest bearing-deposits | | 1,758,182 | | 6,444 | | 1.45 | % | | 1,991,440 | | 11,480 | | 2.29 | % | | 1,831,145 | | 22,131 | | 1.62 | % | | 1,933,055 | | 35,644 | | 2.47 | % |
| | | | | | | | | | | | | | | | | | | | | | | | | | | | | |
| Securities sold under repurchase and short-term borrowings | | 22,990 | | 6 | | 0.10 | % | | 25,454 | | 6 | | 0.09 | % | | 22,847 | | 17 | | 0.10 | % | | 28,872 | | 22 | | 0.10 | % |
| Notes payable | | 171,216 | | 1,726 | | 4.00 | % | | 220,591 | | 2,416 | | 4.35 | % | | 171,673 | | 5,132 | | 4.00 | % | | 226,314 | | 7,328 | | 4.33 | % |
| Subordinated debentures | | 88,662 | | 532 | | 2.38 | % | | 88,662 | | 556 | | 2.49 | % | | 88,662 | | 1,492 | | 2.25 | % | | 88,662 | | 2,091 | | 3.15 | % |
| Total interest-bearing liabilities | | 2,041,050 | | 8,708 | | 1.69 | % | | 2,326,147 | | 14,458 | | 2.47 | % | | 2,114,327 | | 28,772 | | 1.82 | % | | 2,276,903 | | 45,085 | | 2.65 | % |
| | | | | | | | | | | | | | | | | | | | | | | | | | | | | |
Non-interest bearing liabilities: | | | | | | | | | | | | | | | | | | | | | | | | | | | | |
| Demand Deposits | | 171,237 | | | | | | | 160,653 | | | | | | | 166,685 | | | | | | | 163,713 | | | | | |
| Other Liabilities | | 19,161 | | | | | | | 22,872 | | | | | | | 18,243 | | | | | | | 22,359 | | | | | |
| Total non-interest bearing liabilities | | 190,398 | | | | | | | 183,525 | | | | | | | 184,928 | | | | | | | 186,072 | | | | | |
| | | | | | | | | | | | | | | | | | | | | | | | | | | | | |
| Total liabilities | | 2,231,448 | | | | | | | 2,509,672 | | | | | | | 2,299,255 | | | | | | | 2,462,975 | | | | | |
| | | | | | | | | | | | | | | | | | | | | | | | | | | | | |
| Shareholders' equity | | 232,090 | | | | | | | 236,970 | | | | | | | 232,088 | | | | | | | 335,347 | | | | | |
| | | | | | | | | | | | | | | | | | | | | | | | | | | | | |
| Total liabilities & shareholders' equity | | 2,463,538 | | | | | | | 2,746,642 | | | | | | | 2,531,343 | | | | | | | 2,798,322 | | | | | |
| | | | | | | | | | | | | | | | | | | | | | | | | | | | | |
| Net interest income | | | | 20,926 | | | | | | | 20,526 | | | | | | | 64,427 | | | | | | | 60,497 | | | |
| | | | | | | | | | | | | | | | | | | | | | | | | | | | | |
| Interest rate spread | | | | | | 3.83 | % | | | | | | 3.22 | % | | | | | | 3.80 | % | | | | | | 3.16 | % |
| | | | | | | | | | | | | | | | | | | | | | | | | | | | | |
| Net yield on interest-earning assets (net interest margin) | | | | | | 3.90 | % | | | | | | 3.33 | % | | | | | | 3.89 | % | | | | | | 3.33 | % |
(1) Average loan balances exclude nonaccrual loans for the periods presented.
(2) Fully Taxable Equivalent (“FTE”) at the rate of 35%. The FTE basis adjusts for the tax benefits of income on certain tax-exempt loans and investments using the federal statutory rate of 35% for each period presented. The Company believes this measure to be the preferred industry measurement of net interest income and provides relevant comparison between taxable and non-taxable amounts.
Consolidated Financial Highlights
September 30, 2010
(UNAUDITED)
| | | | | | | | | | | | |
| | | | September 30, 2010 | | | June 30, 2010 | | | | | |
| | Loans | | Balance | | | % | | | Balance | | | % | | | % Change | | |
| | Commercial | | $ | 240,314 | | | | 12.99 | % | | $ | 255,223 | | | | 13.14 | % | | | -5.84 | % | |
| | Commercial real estate | | | 1,143,654 | | | | 61.81 | % | | | 1,222,460 | | | | 62.92 | % | | | -6.45 | % | |
| | Residential real estate | | | 385,950 | | | | 20.86 | % | | | 384,227 | | | | 19.78 | % | | | 0.45 | % | |
| | Consumer | | | 76,792 | | | | 4.15 | % | | | 78,421 | | | | 4.04 | % | | | -2.08 | % | |
| | Other | | | 3,440 | | | | 0.19 | % | | | 2,581 | | | | 0.13 | % | | | 33.28 | % | |
| | Total loans | | | 1,850,150 | | | | 100.00 | % | | | 1,942,912 | | | | 100.00 | % | | | -4.77 | % | |
| | | | | | | | | | | | | | | | | | | | | | | |
| | Less: Unearned income | | | (14,559 | ) | | | | | | | (14,738 | ) | | | | | | | | | |
| | Loans, net of unearned income | | $ | 1,835,591 | | | | | | | $ | 1,928,174 | | | | | | | | | | |
| | | | | | | | | | | | | | | | | | | | | | | |
| | Loan Balances by Geographical Region and Operating Subsidiaries | | | | | | | | | | | | | | | | | | | | | |
| | | | | | | | | | | | | | | | | | | | | | | |
| | | | September 30, 2010 | | | June 30, 2010 | | | | | | |
| | | | Loan | | | % to | | | Loan | | | % to | | | | | | |
| | | | Balance | | | Total Loans | | | Balance | | | Total Loans | | | % Change | | |
| | | | | | | | | | | | | | | | | | | | | | | |
| | Northeastern Tennessee Region(1) | | $ | 526,219 | | | | 28.67 | % | | $ | 557,874 | | | | 28.93 | % | | | -5.67 | % | |
| | East Tennessee Region | | | 563,997 | | | | 30.73 | % | | | 597,263 | | | | 30.98 | % | | | -5.57 | % | |
| | Middle Tennessee Region | | | 701,925 | | | | 38.24 | % | | | 729,438 | | | | 37.83 | % | | | -3.77 | % | |
| | | | | | | | | | | | | | | | | | | | | | | |
| | GCB Acceptance Corporation | | | 19,104 | | | | 1.04 | % | | | 19,184 | | | | 1.00 | % | | | -0.42 | % | |
| | Superior Financial Services, Inc. | | | 24,346 | | | | 1.33 | % | | | 24,415 | | | | 1.27 | % | | | -0.28 | % | |
| | | | | | | | | | | | | | | | | | | | | | | |
| | Loans, net of unearned income | | $ | 1,835,591 | | | | 100.01 | % | | $ | 1,928,174 | | | | 100.00 | % | | | -4.80 | % | |
| | (1) Includes one branch located in Southwestern Virginia and one branch located in Northwestern North Carolina | | | | | | |
| | | | | | | | | | | | | | | | | | | | | | | |
| | | | | | | | | | | | | | | | | | | | | | | |
| | | | | | | | | | | | | | | | | | | | | | | |
| | | | September 30, 2010 | | | June 30, 2010 | | | | | | |
| | Deposits | | Balance | | | % | | | Balance | | | % | | | % Change | | |
| | Non-interest bearing demand | | $ | 165,642 | | | | 8.64 | % | | $ | 170,396 | | | | 8.56 | % | | | -2.79 | % | |
| | Interest bearing demand | | | 673,904 | | | | 35.16 | % | | | 667,108 | | | | 33.49 | % | | | 1.02 | % | |
| | Money market and savings | | | 324,161 | | | | 16.92 | % | | | 306,600 | | | | 15.39 | % | | | 5.73 | % | |
| | Retail time | | | 463,800 | | | | 24.20 | % | | | 516,918 | | | | 25.95 | % | | | -10.28 | % | |
| | Jumbo time | | | 289,037 | | | | 15.08 | % | | | 330,818 | | | | 16.61 | % | | | -12.63 | % | |
| | Total | | $ | 1,916,544 | | | | 100.00 | % | | $ | 1,991,840 | | | | 100.00 | % | | | -3.78 | % | |
| | | | | | | | | | | | | | | | | | | | | | | |
| | Deposit Balances by Geographical Region | | | | | | | | | | | | | | | | | | | | | |
| | | | | | | | | | | | | | | | | | | | | | | |
| | | | September 30, 2010 | | | June 30, 2010 | | | | | | |
| | | | Balance | | | % | | | Balance | | | % | | | % Change | | |
| | Northeastern Tennessee Region(1) | | $ | 694,111 | | | | 36.22 | % | | $ | 724,809 | | | | 36.39 | % | | | -4.24 | % | |
| | East Tennessee Region | | | 314,773 | | | | 16.42 | % | | | 320,418 | | | | 16.09 | % | | | -1.76 | % | |
| | Middle Tennessee Region | | | 907,660 | | | | 47.36 | % | | | 946,613 | | | | 47.52 | % | | | -4.11 | % | |
| | | | | | | | | | | | | | | | | | | | | | | |
| | Total | | $ | 1,916,544 | | | | 100.00 | % | | $ | 1,991,840 | | | | 100.00 | % | | | -3.78 | % | |
| | (1) Includes one branch located in Southwestern Virginia and one branch located in Northwestern North Carolina | | | | | | |
| | | | | | | | |