GREEN BANKSHARES REPORTS RESULTS FOR THE FIRST QUARTER 2011
RECENTLY ANNOUNCED $217 MILLION CAPITAL RAISE EXPECTED TO STRENGTHEN THE COMPANY'S BALANCE SHEET
GREENEVILLE, Tenn. (May 10, 2011) – Green Bankshares, Inc. (NASDAQ:GRNB), the holding company for GreenBank, today reported results for the first quarter ended March 31, 2011. These results included a net loss available to common shareholders of $11.6 million or $0.88 per diluted share for the quarter ended March 31, 2011, compared with a net loss available to common shareholders of $52.8 million or $4.03 per diluted share for the quarter ended December 31, 2010, and net income available to common shareholders of $1.9 million or $0.15 per diluted share for the same quarter a year ago.
Importantly, the Company recently announced that it has entered into a definitive agreement to raise approximately $217 million in new capital through the sale of newly issued common shares to North American Financial Holdings, Inc. The transaction, which is subject to shareholder and regulatory approval, as well as the satisfaction of other customary closing conditions, is expected to be consummated in the third quarter of 2011. In connection with the investment, the Company expects that North American Financial Holdings will enter into a binding agreement with the U. S. Department of Treasury to purchase all of the outstanding shares of the Company's Fixed Rate Cumulative Perpetual Preferred Stock, Series A, and related warrants to purchase shares of the Company’s Common Stock. Commenting on the announcement, Stephen M. Rownd, Chairman and Chief Executive Officer, said, "The recapitalization strengthens our balance sheet and represents a strategically important step in returning the Company to profitability at a faster rate while ultimately enhancing shareholder value."
Regarding first quarter results, Rownd added, "Our first quarter performance reflected a continuation of elevated credit costs in the form of both our loan loss provision and costs related to other real estate owned (OREO). While the credit environment in which we operate remains challenging, our loss for the first quarter declined on a linked-quarter basis primarily as a result of lower credit costs incurred during the first quarter of 2011 compared with the fourth quarter of 2010.
"Our core earnings and the fundamentals of the Company remain solid, as evidenced in our linked-quarter stable net interest margin, improving non-interest income and lower recurring operating expenses," Rownd continued. "During the first quarter of 2011, we accrued approximately $570,000 of severance costs associated with "right-sizing" the Company, as we sought to align our staffing levels with the current economic environment and business activity levels. As we have previously discussed, ongoing pressure on real estate values in our markets will likely keep non-performing assets – and credit costs – at elevated levels throughout 2011."
-MORE-
Green Bankshares, Inc. ▪ 100 North Main Street ▪ Greeneville, TN 37743 ▪ (423) 639-5111
GRNB Reports First Quarter 2011 Results
Page 2
May 10, 2011
As a result of the first quarter 2011 loss, the Bank's capital ratios declined. Although these ratios remained above the statutory minimums necessary to be deemed a well-capitalized financial institution, they dropped below the Tier 1 leverage ratio of 10.0% and the Total Risk-based Capital Ratio of 14.0% that the Bank had informally committed to its regulators that it would maintain, as discussed further in the Company's Form 10-K for 2010.
Regarding the proposed investment by North American Financial Holdings, which will give it a 90.1% stake in the Company, the Company is expected to issue approximately 120 million new common shares at a price of $1.81 per share, raising approximately $217 million before transaction-related expenses. In connection with the investment by North American Financial Holdings, the Company’s shareholders as of a record date to be fixed near the closing of that transaction will receive a contingent value right, entitling them to cash proceeds of up to $0.75 per share based on the credit performance of the Bank’s legacy loan portfolio over the five-year period following closing.
Estimated capital levels: (see the non-GAAP measurement reconciliation on page 6 regarding tangible equity and book value per share)
| Consolidated: | | | 1Q11 | | | | 4Q10 | | | | 3Q10 | | | | 2Q10 | | | | 1Q10 | |
| Tangible common book value per share | | $ | 4.41 | | | $ | 5.23 | | | $ | 9.30 | | | $ | 11.95 | | | $ | 11.71 | |
| Tangible common equity to assets ratio | | | 2.44 | % | | | 2.88 | % | | | 5.09 | % | | | 6.25 | % | | | 6.03 | % |
| Bank Regulatory Ratios: | | | | | | | | | | | | | | | | | | | | |
| Tier 1 leverage ratio | | | 8.55 | % | | | 8.88 | % | | | 10.78 | % | | | 11.86 | % | | | 11.55 | % |
| Tier 1 risk-based capital ratio | | | 11.83 | % | | | 11.94 | % | | | 13.53 | % | | | 14.73 | % | | | 14.06 | % |
| Total risk-based capital ratio | | | 13.11 | % | | | 13.22 | % | | | 14.80 | % | | | 15.99 | % | | | 15.33 | % |
Net interest income:
| (dollars in thousands) | | | 1Q11 | | | | 4Q10 | | | | 3Q10 | | | | 2Q10 | | | | 1Q10 | |
| Net interest income | | $ | 19,267 | | | $ | 19,714 | | | $ | 20,747 | | | $ | 21,473 | | | $ | 21,659 | |
| Net interest margin | | | 3.77 | % | | | 3.77 | % | | | 3.90 | % | | | 3.86 | % | | | 3.90 | % |
| Average earning assets | | $ | 2,090,428 | | | $ | 2,094,399 | | | $ | 2,130,339 | | | $ | 2,248,240 | | | $ | 2,271,550 | |
| · | Both net interest income and the net interest margin for the first quarter of 2011 were adversely affected by loan interest reversals totaling approximately $947 thousand as $47.2 million of loans were moved to non-accrual status. Excluding interest reversals, net interest margin would have been 3.96% for the first quarter of 2011. |
Credit quality:
Summary:
| (dollars in thousands) | | | 1Q11 | | | | 4Q10 | | | | 3Q10 | | | | 2Q10 | | | | 1Q10 | |
| Net loan charge-offs | | $ | 15,617 | | | $ | 9,139 | | | $ | 36,549 | | | $ | 4,868 | | | $ | 3,882 | |
| New non-accrual loans added | | $ | 47,207 | | | $ | 61,867 | | | $ | 111,868 | | | $ | 22,415 | | | $ | 14,442 | |
| Reserves to total loans | | | 3.87 | % | | | 3.83 | % | | | 2.74 | % | | | 2.60 | % | | | 2.52 | % |
| Non-performing assets | | $ | 224,441 | | | $ | 205,914 | | | $ | 197,159 | | | $ | 141,915 | | | $ | 135,366 | |
GRNB Reports First Quarter 2011 Results
Page 3
May 10, 2011
Changes in non-performing assets:
| (dollars in thousands) | | | | | | | | | | | | |
| December 31, 2010 | | $ | 143,707 | | | $ | 60,095 | | | $ | 2,112 | | | $ | 205,914 | |
| Loan foreclosures | | | (7,379 | ) | | | 7,379 | | | | n/a | | | | n/a | |
| Gross loan charge-offs | | | (16,404 | ) | | | n/a | | | | n/a | | | | (16,404 | ) |
| New non-accrual loans | | | 47,207 | | | | n/a | | | | n/a | | | | 47,207 | |
| Reduction of non-accrual loans | | | (8,315 | ) | | | n/a | | | | n/a | | | | (8,315 | ) |
| Other real estate owned (OREO) sales proceeds | | | n/a | | | | (5,341 | ) | | | n/a | | | | (5,341 | ) |
| OREO write-downs, net | | | n/a | | | | (2,100 | ) | | | n/a | | | | (2,100 | ) |
| Change in past due > 90 days | | | n/a | | | | n/a | | | | 3,480 | | | | 3,480 | |
| March 31, 2011 | | $ | 158,816 | | | $ | 60,033 | | | $ | 5,592 | | | $ | 224,441 | |
(1) On average, all non-performing assets have been written down almost 35%.
Commercial real estate loan portfolio migration:
| | | | | | | | | | | | Mar. 31, 2011 from Mar. 31, 2010 | |
| (Dollars in thousands) | | | | | | | | | | | | | | | |
| Commercial real estate portfolio: | | | | | | | | | | | | | | | |
| Acquisition & development | | $ | 123,369 | | | $ | 133,947 | | | $ | 182,181 | | | $ | (58,812 | ) | | | (32.28 | )% |
| Lot warehouse | | | 39,989 | | | | 42,796 | | | | 55,499 | | | | (15,510 | ) | | | (27.95 | )% |
| Commercial 1-4 family construction | | | 27,260 | | | | 31,511 | | | | 69,328 | | | | (42,086 | ) | | | (60.68 | )% |
| Total speculative 1-4 family | | | 190,618 | | | | 208,254 | | | | 307,008 | | | | (116,390 | ) | | | (37.91 | )% |
| | | | | | | | | | | | | | | | | | | | | |
| Commercial vacant land | | | 74,506 | | | | 77,081 | | | | 101,218 | | | | (26,712 | ) | | | (26.39 | )% |
| Commercial construction non-owner occupied | | | 49,037 | | | | 76,568 | | | | 156,970 | | | | (107,933 | ) | | | (68.76 | )% |
| Commercial construction owner occupied | | | 5,229 | | | | 5,407 | | | | 27,614 | | | | (22,385 | ) | | | (81.06 | )% |
| Consumer residential construction | | | 11,445 | | | | 14,161 | | | | 14,701 | | | | (3,256 | ) | | | (22.15 | )% |
| Total construction and development | | | 140,217 | | | | 173,217 | | | | 300,503 | | | | (160,286 | ) | | | (53.34 | )% |
| | | | | | | | | | | | | | | | | | | | | |
| Non-owner occupied commercial real estate | | | 417,952 | | | | 427,291 | | | | 395,638 | | | | 22,314 | | | | 5.64 | % |
| | | | | | | | | | | | | | | | | | | | | |
| Total commercial real estate | | $ | 748,787 | | | $ | 808,762 | | | $ | 1,003,149 | | | $ | (254,362 | ) | | | (25.36 | )% |
GRNB Reports First Quarter 2011 Results
Page 4
May 10, 2011
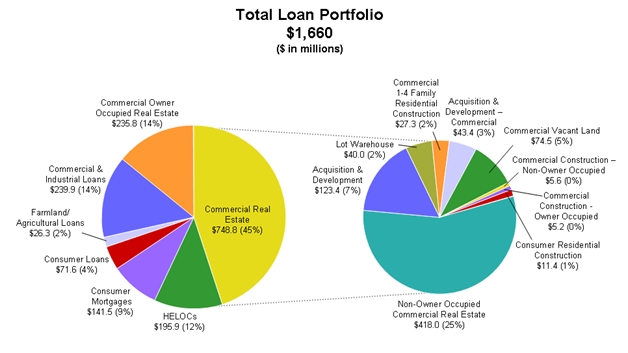
The following information graphically displays the consolidated loan portfolio by purpose code as of March 31, 2011:
Non-interest income totaled approximately $7.6 million for the first quarter of 2011, down from $7.7 million in the first quarter of 2010. This slight decline was reflected in lower levels of deposit service charges accompanied by lower mortgage banking income and Wealth Management revenues.
Non-interest expense totaled approximately $23.0 million for the first quarter of 2011, compared with $20.5 million for the first quarter of 2010. The increase primarily reflected increased OREO-related expenses, which were partially offset by lower collection and repossession expenses, as well as severance costs associated with a workforce reduction to "right-size" the Company that commenced in March 2011.
Greeneville, Tennessee-based Green Bankshares, Inc., with total assets of approximately $2.4 billion at March 31, 2011, is the holding company for GreenBank. GreenBank, which traces its origin to 1890, has 63 branches across East and Middle Tennessee, and one branch each in Bristol, Virginia, and Hot Springs, North Carolina. It also provides wealth management services through its GreenWealth Division and residential mortgage lending through its Mortgage Division. In addition, GreenBank conducts separate businesses through three wholly owned subsidiaries: Superior Financial Services, Inc., a consumer finance company; GCB Acceptance Corporation, a consumer finance company specializing in automobile lending and Fairway Title Co., a title insurance company.
GRNB Reports First Quarter 2011 Results
Page 5
May 10, 2011
Cautionary Statement
The investment discussed above involves the sale of securities in a private transaction that will not be registered under the Securities Act of 1933, as amended, and will be subject to the resale restrictions under that act. Such securities may not be offered or sold absent registration or an applicable exemption from registration requirements. This document does not constitute an offer to sell or a solicitation of an offer to buy any securities, nor shall there be any sale of securities in any state or jurisdiction in which such an offer, solicitation, or sale would be unlawful prior to registration or qualification under the securities laws of any such state or jurisdiction.
Forward-looking Statements
Certain matters discussed in this news release are not historical facts but are "forward-looking statements" within the meaning of and are furnished pursuant to the Private Securities Litigation Reform Act of 1995. All forward-looking statements involve risk and uncertainty and actual results could differ materially from the anticipated results or other expectations expressed in the forward-looking statements. Risks and uncertainties related to the Company's business are discussed in the Company's filings with the Securities and Exchange Commission (the “SEC”), including its Annual Report on Form 10-K for the year ended December 31, 2010. Risks and uncertainties related to the Company include, but are not limited to, (1) the occurrence of any event, change or other circumstances that could give rise to the termination of the Investment Agreement by and among the Company, the Bank and North American Financial Holdings, Inc., dated as of May 5, 2011 (the “Investment Agreement”); (2) the outcome of any legal proceedings that may be instituted against the Company and others following announcement of the Investment Agreement; (3) the inability to complete the transactions contemplated by the Investment Agreement due to the failure to obtain shareholder approval or the failure to satisfy other conditions to completion of the transaction, including the receipt of regulatory approval; (4) risks that the proposed transaction contemplated by the Investment Agreement disrupts current plans and operations and the potential difficulties in employee retention as a result of the proposed transaction; (5) the amount of the costs, fees, expenses and charges related to the proposed transaction contemplated by the Investment Agreement; (6) deterioration in the financial condition of borrowers resulting in significant increases in loan losses and provisions for those losses; (7) continuation of the historically low short-term interest rate environment; (8) changes in loan underwriting, credit review or loss reserve policies associated with economic conditions, examination conclusions, or regulatory developments; (9) increased levels of non-performing and repossessed assets and the ability to resolve these may result in future losses; (10) greater than anticipated deterioration or lack of sustained growth in the national or local economies; (11) rapid fluctuations or unanticipated changes in interest rates; (12) the impact of governmental restrictions on entities participating in the Capital Purchase Program (the "CPP") of the United States Department of the Treasury; (13) changes in state and federal legislation, regulations or policies applicable to banks or other financial service providers, including regulatory or legislative developments, like the Dodd-Frank Wall Street Reform and Consumer Protection Act, arising out of current unsettled conditions in the economy; (14) the results of regulatory examinations; (15) the remediation efforts related to the Company’s material weakness in its internal control over financial reporting; (16) increased competition with other financial institutions in the markets that the Bank serves; (17) the Company’s recording a further valuation allowance related to its deferred tax asset; (18) exploring alternatives available for the future repayment or conversion of the preferred stock issued in the CPP, including in the transaction contemplated by the Investment Agreement; (19) further deterioration in the valuation of other real estate owned; (20) inability to comply with regulatory capital requirements and to secure any required regulatory approvals for capital actions to raise capital if necessary to comply with any regulatory capital requirements; and (21) the loss of key personnel. The Company undertakes no obligation to update these forward-looking statements.
GRNB Reports First Quarter 2011 Results
Page 6
May 10, 2011
Additional Information and Where to Find It
This communication may be deemed to be solicitation material in respect of the proposed investment in the Company by North American Financial Holdings, Inc. The Company will file a proxy statement and other documents regarding the proposed investment transaction described in this news release with the SEC. SHAREHOLDERS OF THE COMPANY ARE URGED TO READ ALL RELEVANT DOCUMENTS FILED WITH THE SEC, INCLUDING THE COMPANY’S PROXY STATEMENT, BECAUSE THEY WILL CONTAIN IMPORTANT INFORMATION ABOUT THE PROPOSED TRANSACTION. Investors and security holders will be able to obtain the proxy statement and other relevant documents free of charge at the SEC’s website, http://www.sec.gov, and the Company’s shareholders will receive information at an appropriate time on how to obtain the proxy statement and other transaction-related documents for free from the Company. Such documents are not currently available.
Participants in the Solicitation
The Company and its directors, executive officers, certain members of management, and employees may have interests in the proposed investment transaction contemplated by the Investment Agreement or be deemed to be participants in the solicitation of proxies of the Company’s shareholders to approve the matters necessary to be approved to facilitate the proposed investment transaction. Certain information regarding the participants and their interest in the solicitation is set forth in the proxy statement for Green Bankshares’ 2011 Annual Meeting of Shareholders filed with the SEC on April 8, 2011. Shareholders may obtain additional information regarding the interests of such participants by reading the proxy statement relating to the proposed transaction when it becomes available.
GRNB Reports First Quarter 2011 Results
Page 7
May 10, 2011
GREEN BANKSHARES, INC.
Reconciliation of Non-GAAP Measures Presented in Earnings Release
(In thousands)
The following table provides a reconciliation of total stockholders' equity to tangible common equity in accordance with applicable regulatory requirements and GAAP. The Company provides the tangible common equity ratio, in addition to those defined by banking regulators, because of its widespread use by investors as a means to evaluate capital adequacy.
| | | | 1Q11 | | | | 4Q10 | | | | 3Q10 | | | | 2Q10 | | | | 1Q10 | |
| Total shareholders' equity | | $ | 132,830 | | | $ | 143,897 | | | $ | 197,824 | | | $ | 233,150 | | | $ | 230,189 | |
| Less: | | | | | | | | | | | | | | | | | | | | |
| Core deposit and other intangibles | | | (6,125 | ) | | | (6,751 | ) | | | (7,398 | ) | | | (8,044 | ) | | | (8,684 | ) |
| Preferred stock | | | (68,468 | ) | | | (68,121 | ) | | | (67,775 | ) | | | (67,428 | ) | | | (67,081 | ) |
| Tangible common equity | | $ | 58,237 | | | $ | 69,025 | | | $ | 122,651 | | | $ | 157,678 | | | $ | 154,424 | |
| | | | | | | | | | | | | | | | | | | | | |
| Tangible common book value per share | | $ | 4.41 | | | $ | 5.23 | | | $ | 9.30 | | | $ | 11.95 | | | $ | 11.71 | |
| | | | | | | | | | | | | | | | | | | | | |
| Total assets | | $ | 2,392,694 | | | $ | 2,406,040 | | | $ | 2,415,014 | | | $ | 2,529,332 | | | $ | 2,569,732 | |
| Less: | | | | | | | | | | | | | | | | | | | | |
| Core deposit and other intangibles | | | (6,125 | ) | | | (6,751 | ) | | | (7,398 | ) | | | (8,044 | ) | | | (8,684 | ) |
| Total tangible assets | | $ | 2,386,569 | | | $ | 2,399,289 | | | $ | 2,407,616 | | | $ | 2,521,288 | | | $ | 2,561,048 | |
| | | | | | | | | | | | | | | | | | | | | |
Tangible common equity to assets ratio | | | 2.44 | % | | | 2.88 | % | | | 5.09 | % | | | 6.25 | % | | | 6.03 | % |
GRNB Reports First Quarter 2011 Results
Page 8
May 10, 2011
GREEN BANKSHARES, INC.
Unaudited Financial Highlights
(In thousands, except per share amounts)
| | | | |
| | | | | | | | | | |
| Interest income | | $ | 26,625 | | | $ | 28,213 | | | $ | 31,892 | |
| Interest expense | | | 7,358 | | | | 8,499 | | | | 10,233 | |
| Net interest income | | | 19,267 | | | | 19,714 | | | | 21,659 | |
| Provision for loan losses | | | 13,897 | | | | 25,646 | | | | 3,889 | |
| Net interest income (loss) after provision for loan losses | | | 5,370 | | | | (5,932 | ) | | | 17,770 | |
| Non-interest income | | | 7,627 | | | | 7,058 | | | | 7,686 | |
| Non-interest expense | | | 23,027 | | | | 41,986 | | | | 20,546 | |
| Income (loss) before income taxes | | | (10,030 | ) | | | (40,860 | ) | | | 4,910 | |
| Income tax provision | | | 281 | | | | 10,688 | | | | 1,714 | |
| Income (loss) | | | (10,311 | ) | | | (51,548 | ) | | | 3,196 | |
| Preferred stock dividends and related cost | | | 1,250 | | | | 1,250 | | | | 1,250 | |
| Net income (loss) available to common shareholders | | $ | (11,561 | ) | | $ | (52,798 | ) | | $ | 1,946 | |
| Comprehensive income (loss) | | $ | (10,273 | ) | | $ | (53,173 | ) | | $ | 4,166 | |
| | | | | | | | | | | | | |
| Earnings (loss) per common share: | | | | | | | | | | | | |
Basic | | $ | (0.88 | ) | | $ | (4.03 | ) | | $ | 0.15 | |
Diluted 1 | | $ | (0.88 | ) | | $ | (4.03 | ) | | $ | 0.15 | |
| | | | | | | | | | | | | |
| Weighted average common shares: | | | | | | | | | | | | |
Basic | | | 13,109 | | | | 13,098 | | | | 13,082 | |
Diluted | | | 13,109 | | | | 13,098 | | | | 13,173 | |
| | | | | | | | | | | | | |
| | | | | | | | | | |
| Total assets | | $ | 2,392,694 | | | $ | 2,406,040 | | | $ | 2,569,732 | |
| Cash and cash equivalents | | | 331,416 | | | | 294,214 | | | | 177,541 | |
| Investment and other securities | | | 239,581 | | | | 215,201 | | | | 198,066 | |
| Loans, net of unearned interest | | | 1,680,249 | | | | 1,745,378 | | | | 1,994,039 | |
| Allowance for loan losses | | | (65,109 | ) | | | (66,830 | ) | | | (50,167 | ) |
| Deposits | | | 1,975,635 | | | | 1,976,854 | | | | 2,037,865 | |
| Shareholders' equity | | | 132,830 | | | | 143,897 | | | | 230,189 | |
Common shareholders' equity 2 | | | 64,362 | | | | 75,776 | | | | 163,108 | |
Tangible common shareholders' equity 3 | | | 58,237 | | | | 69,025 | | | | 154,424 | |
Common book value per share 2 | | | 4.88 | | | | 5.75 | | | | 12.36 | |
Tangible common book value per share 3 | | | 4.42 | | | | 5.23 | | | | 11.71 | |
| 1 | Diluted weighted average shares outstanding exclude 78,794, and 92,674 restricted average shares for the three-month periods ended March 31, 2011, and December 31, 2010, respectively, because their impact would be anti-dilutive. |
| 2 | Common shareholders' equity is shareholders' equity less preferred stock. |
| 3 | Tangible common shareholders' equity is shareholders' equity less intangible assets and preferred stock. |