UNITED STATES
SECURITIES AND EXCHANGE COMMISSION
Washington, D.C. 20549
FORM 10-K/A
(Mark One)
X Annual Report Pursuant to Section 13 or 15(d) of the
Securities Exchange Act of 1934
For the fiscal year ended December 31, 2001.
or
Transition Report Pursuant to Section 13 or 15(d) of the
Securities Exchange Act of 1934 [No Fee Required]
For the Transition Period From to .
Commission file number 2-96350
CNB CORPORATION
(Exact name of registrant as specified in its charter)
South Carolina 57-0792402
(State of incorporation) (I.R.S. Employer Identification No.)
1400 Third Avenue, P.O. Box 320, Conway, South Carolina 29528
(Address of Principal executive offices) (Zip Code)
Registrant's telephone number, including area code: (843) 248-5721
Securities registered pursuant to section 12(b) of the Act:
None
Securities registered pursuant to Section 12(g) of the Act:
Name of each exchange
Title of each class of which registered
Common Stock, par value $10.00 per share None
Indicate by check mark whether the registrant (1) has filed all reports required by Section 13 or 15(d) of the Securities Exchange Act of 1934 during the preceding 12 months and (2) has been subject to such filing requirements for the past 90 days. Yes X No
Indicate by check mark if disclosure of delinquent filers pursuant to Item 405 of Regulation S-K is not contained herein, and will not be contained, to the best of registrant's knowledge, in definitive proxy or information statements incorporated by reference in Part III of this Form 10-K or any amendment to this Form 10-K. [ ]
As of February 28, 2002, 716,912 shares of Common Stock of CNB Corporation were outstanding and the aggregate market value of such Common Stock held by nonaffiliates (based upon the price at which stock was sold during the 60 days prior to the date of filing) was approximately $76,709,584.
No Documents have been incorporated by reference.
TABLE OF CONTENTS
PART I
Page | ||
ITEM 1 | Description of Business and Supplementary Data | 1-23 |
PART II
ITEM 5 | Market for the Registrant's Common Stock and Related Security Holder Matters | 25 |
PART III
ITEM 10 | Directors and Executive Officers of the Registrant | 60-64 |
PART IV
ITEM 14 | Exhibits, Financial Statement Schedules, Notes to Financial Statements, and Reports on Form 8-K | 70 |
PART I
ITEM 1. Description of Business
DESCRIPTION OF CNB CORPORATION
CNB Corporation (the "Company") is a South Carolina business corporation organized for the purpose of becoming a bank holding company for The Conway National Bank (the "Bank") under the Bank Holding Company Act. The Company was organized with $500 of capital on March 8, 1985; received approval from the Board of Governors of the Federal Reserve System on May 15, 1985, to become a bank holding company; and on June 10, 1985, acquired, in exchange for its own shares of common stock, substantially all of the common stock of the Bank. The activities of the Company are subject to the supervision of the Federal Reserve, and the Company may engage directly or through subsidiary corporations in those activities closely related to banking which are specifically permitted under the Bank Holding Company Act and Gramm-Leach-Bliley Act of 1999. See "Supervision and Regulation." Although the Company, after obtaining the requisite approval of the Federal Reserve and any other appropriate regulatory agency, may seek to enter businesses closely related to banking or to acquire existing businesses already engaged in such activities, the Company has not conducted, and has no present intent to conduct, negotiations for the acquisition or formation of any entities to engage in other permissible activities other than the acquisition of the Bank. There can be no assurance that the Company will form or acquire any other entity.
The Company and the Bank compete with those banks and other financial institutions that compete with the Bank. See "Competition." In addition, if the Company attempts to form or acquire other entities and engage in activities closely related to banking, the Company will be competing with other bank holding companies, financial holding companies, and companies currently engaged in lines of business or permissible activities in which the Company might engage, many of which have far greater assets and financial resources than the Company and a greater capacity to raise additional debt and equity capital than the Company.
DESCRIPTION OF THE SUBSIDIARY
The Bank is an independent community bank engaged in the general commercial banking business in Horry and Georgetown Counties, South Carolina. The Bank was organized on June 5, 1903 as the Bank of Horry located on Main Street in Conway, South Carolina. The Bank became a national bank operating as The Conway National Bank in 1914. On June 10, 1985, the Bank was reorganized into a bank holding company structure when substantially all of the common stock of the Bank was acquired by CNB Corporation in exchange for its own shares of common stock. In 1960, the Bank opened its first additional office at 1400 Third Avenue in Conway. Since that time, the following offices have been opened: Coastal Centre in Conway, Horry County, (1969); Surfside in Surfside Beach, Horry County, (1971); Northside, north of Myrtle Beach, Horry County, (1977); Red Hill in Conway, Horry County, (1981); Socastee, in the southern portion of Myrtle Beach, Horry County, (1986); Aynor in the Town of Aynor, Horry County, (1991), Myrtle B each in the City of Myrtle Beach, Horry County, (1995), West Conway, in Conway, Horry County, (1998) and Murrells Inlet in Murrells Inlet, Georgetown County, (2000). The Surfside office was enlarged in 1977 and 1984, and the Coastal Centre office was expanded in 1980. The Third Avenue office, which houses the Bank's administrative offices and data processing facilities was expanded in 1982 from 11,150 square feet to 33,616 square feet. The Bank employs approximately 209 full-time-equivalent employees at its principal office and ten branch offices.
1
The Bank performs the full range of normal commercial banking functions. Some of the major services provided include checking accounts, NOW accounts, money market deposit accounts, IRA accounts, savings and time deposits of various types and loans to individuals for personal use, home mortgages, home improvement, automobiles, real estate, agricultural purposes and business needs. Commercial lending operations include various types of credit for business, industry, and agriculture. In addition, the Bank offers safe deposit boxes, wire transfer services, bank money orders, 24-hour teller machines on the STAR Network, internet banking, direct deposits and a MasterCard/Visa program. Through a correspondent relationship the Bank offers discount brokerage services. The Bank does not provide trust services; does not sell annuities; and does not sell mutual funds.
The majority of the Bank's customers are individuals and small to medium-sized businesses headquartered within the Bank's service area. The Bank has no material concentration of deposits from any single customer or group of customers. No significant portion of the Bank's loans is concentrated within a single industry or group of related industries. There are no material seasonal factors that would have any adverse effect on the Bank nor does the Bank rely on foreign sources of funds or income.
COMPETITION
The Bank actively competes with other institutions in Horry County in providing customers with deposit, credit and other financial services. The principal competitors of the Bank include local offices of six regional banks, two state-wide banks, five locally owned banks in Horry County and various other financial and thrift institutions. The regional banks with offices in Horry County are Bank of America, Centura Bank, First Union National Bank, First Citizens Bank and Trust Company, Branch Bank and Trust and Wachovia, N.A.. The statewide banks with offices in Horry County are National Bank of South Carolina and Carolina First Savings Bank. The locally owned banks having offices in Horry County are Anderson Brothers Bank, Coastal Federal Savings Bank, Horry County State Bank, Sandhills Bank, and Beach First National Bank. In addition, two thrift institutions have offices in Horry County. The Bank also competes with credit unions, money market funds, brokerage houses, insurance companies, mortgage companie s, leasing companies, consumer finance companies and other financial institutions. Significant competitive factors include interest rates on loans and deposits, prices and fees for services, office location, customer service, community reputation, and continuity of personnel.
SUPERVISION AND REGULATION
General
The Company and the Bank are subject to an extensive collection of state and federal banking laws and regulations which impose specific requirements and restrictions on, and provide for general regulatory oversight with respect to, virtually all aspects of the Company's and the Bank's operations. The Company and the Bank are also affected by government monetary policy and by regulatory measures affecting the banking industry in general. The actions of the Federal Reserve System affect the money supply and, in general, the Bank's lending abilities in increasing or decreasing the cost and availability of funds to the Bank. Additionally, the Federal Reserve System regulates the availability of bank credit in order to combat recession and curb inflationary pressures in the economy by open market operations in United States government securities, changes in the discount rate on member bank borrowings, and changes in the reserve requirements against bank deposits.
2
During 1989 and 1991, the United States Congress enacted two major pieces of banking legislation: The Financial Institutions Reform, Recovery and Enforcement Act of 1989 ("FIRREA") and the Federal Deposit Insurance Corporation Improvement Act of 1991 ("FDICIA"). The FIRREA and FDICIA have significantly changed the commercial banking industry through, among other things, revising and limiting the types and amounts of investment authority, significantly increasing minimum regulatory capital requirements, and broadening the scope and power of federal bank and thrift regulators over financial institutions and affiliated persons in order to protect the deposit insurance funds and depositors. These laws, and the resulting implementing regulations, have subjected the Bank and the Company to extensive regulation, supervision and examination by the Office of the Comptroller of the Currency (OCC). This has resulted in increased administrative, professional and compensation expenses in complying with a substantially increased number of new regulations and policies. The regulatory structure created by these laws gives the regulatory authorities extensive authority in connection with their supervisory and enforcement activities and examination policies.
The Omnibus Consolidated Appropriations Act was enacted on September 30, 1996. Among the law's many provisions is a resolution of the BIF-SAIF deposit insurance premium disparity, many regulatory burden relief provisions and other bank-related legislation. The BIF-SAIF provisions are contained in the Deposit Insurance Funds Act of 1996.
The Gramm-Leach-Bliley Financial Modernization Act of 1999, effective March 11, 2000, allows bank holding companies to elect to be treated as financial holding companies. Financial holding companies may engage in a broad range of securities, insurance, and other financial activities.
The following is a brief summary of certain statutes, rules and regulations affecting the Company and the Bank. This summary is qualified in its entirety by reference to the particular statutory and regulatory provisions referred to below and is not intended to be an exhaustive description of the statutes or regulations applicable to the business of the Company and the Bank. Any change in applicable laws or regulations may have a material adverse effect on the business and prospects of the Company and the Bank.
The Company
The Company is a bank holding company within the meaning of the Federal Bank Holding Company Act of 1956, as amended (the "BHCA") and is registered as such with the Federal Reserve. The Company is required to file annual reports and other information regarding its business operations and those of its subsidiaries. It is also subject to supervision and regular examinations.
The BHCA requires every bank holding company to obtain the prior approval of the Federal Reserve Board before (i) it or any of its subsidiaries (other than a bank) acquires substantially all of the assets of any bank, (ii) it acquires ownership or control of any voting shares of any bank if after such acquisition it would own or control, directly or indirectly, more than 5% of the voting shares of such bank, or (iii) it merges or consolidates with any other bank holding company.
3
The BHCA and the Federal Change in Bank Control Act, together with regulations promulgated by the Federal Reserve Board, require that, depending on the particular circumstances, either the Federal Reserve Board's approval must be obtained or notice must be furnished to the Federal Reserve Board and not disapproved prior to any person or company acquiring control of a bank holding company, such as the Company, subject to certain exemptions for certain transactions.
Under the BHCA, a bank holding company is generally prohibited from engaging in, or acquiring direct or indirect control of more than 5% of the voting shares of any company engaged in, nonbanking activities, unless the Federal Reserve Board, by order or regulation, has found those activities to be so closely related to banking or managing or controlling banks as to be a proper incident thereto. Some of the activities that the Federal Reserve Board has determined by regulation to be proper incidents to the business of a bank holding company include making or servicing loans and certain types of leases, engaging in certain insurance and discount brokerage activities, performing certain data processing services, acting in certain circumstances as a fiduciary or investment or financial adviser, owning savings associations and making investments in certain corporations or projects designed primarily to promote community welfare. The Company is also restricted in its activities by the provisions of the Glass-St egall Act of 1933, which prohibits the Company from owning subsidiaries that are engaged principally in the issue, flotation, underwriting, public sale or distribution of securities. The regulatory requirements to which the Company is subject also set forth various conditions regarding the eligibility and qualifications of its directors and officers.
Under the Gramm-Leach-Bliley Act, the Company may elect to be treated as a financial holding company which would allow the Company to engage in a broad range of securities, insurance, and other financial activities.
The Bank
The Bank is subject to regulation and supervision, of which regular bank examinations are a part, by the Comptroller of the Currency. The Bank is a member of the Federal Deposit Insurance Corporation (the "FDIC") which currently insures the deposits of each member bank to a maximum of $100,000 per depositor. For this protection, each bank pays a statutory assessment and is subject to the rules and regulations of the FDIC. The Company is an "affiliate" of the Bank within the meaning of the Federal Reserve Act and the Federal Deposit Insurance Act, which imposes restrictions on loans by any subsidiary bank to the Company, on investments by any subsidiary bank in the stock or securities of the Company and on the use of such stock or securities as collateral security for loans by any subsidiary bank to any borrower. The Company will also be subject to certain restrictions with respect to engaging in the business of issuing, underwriting and distributing securities.
4
DESCRIPTION OF BANK STOCK
The Bank is authorized to issue 199,536 shares and has outstanding 193,536 shares of Bank Stock. The holders of Bank Stock are entitled to one vote per share. Holders of shares of Bank Stock have preemptive rights to purchase additional shares of Bank Stock and have cumulative rights in the elections of directors of the Bank. The National Bank Act generally provides for a majority vote of the Bank Stock to approve an action by the Bank but a two-thirds vote of the outstanding shares of Bank Stock is required to approve certain fundamental changes.
The National Bank Act, 12 U.S.C. Section 55, provides for the pro rata assessment of holders of common stock of a national bank in the event that its capital becomes impaired, such assessment to be enforced by sale to the extent necessary of the stock of the stockholder failing to pay his assessment. However, the Company has been advised that the Comptroller of the Currency has not used this provision in recent years. Accordingly, the shares of Bank Stock are subject to such assessment. However, the Bank's management does not anticipate the Bank Stock being assessed in this manner in the foreseeable future.
The holders of Bank Stock are entitled to receive such dividends as may be declared by the Board of Directors of the Bank out of funds legally available therefor. National banking laws and regulations impose restrictions on the payment of dividends and other distributions to stockholders. The National Bank Act provides that a national bank cannot pay dividends or other distributions to stockholders out of any portion of its capital and surplus, and that no dividend shall be paid by a bank in an amount greater than its "net profits then on hand" (as defined in the National Bank Act), after deduction of statutory "bad debts." In addition, 12 U.S.C. Section 60 provides that the approval of the Comptroller of the Currency is required for the payment of dividends by a national bank if the total of all dividends declared by the bank in any calendar year shall exceed the total of its "net profits" of that year combined with its "retained net profits" of the preceding two years. The same section further provides that, until the surplus fund of a national bank shall equal its common capital, no dividends shall be declared unless there has been carried to the surp lus fund not less than one-tenth part of the bank's net profits of the preceding half year in the case of quarterly or semiannual dividends, or not less than one-tenth part of its net dividends. Also, under 12 U.S.C. Section 1818, the Comptroller of the Currency can restrict a national bank's dividend payments if they are deemed an unsafe or unsound banking practice.
In the event of the liquidation, dissolution or winding-up of the affairs of the Bank, the holders of outstanding shares of Bank Stock will be entitled to share pro rata according to their respective interests in the Bank's assets and funds remaining after payment or provision for payment of all debts and other liabilities of the Bank.
5
DESCRIPTION OF COMPANY STOCK
General
The Company is authorized to issue 1,500,000 shares of Company Stock and as of December 31, 2001, has 718,246 shares issued and 716,112 shares outstanding. The holders of Company Stock are entitled to one vote per share. Holders of shares of Company Stock do not have pre-emptive rights to purchase any additional shares of Company Stock and do not have cumulative voting rights in the election of directors. Without pre-emptive rights, stockholders could experience dilution of their voting power and of their equity interest in the Company.
The ability of the Company to pay dividends to the holders of the Company Stock depends upon the amount of dividends paid by the Bank to the Company. The holders of shares of Company Stock will be entitled to receive such dividends as may be declared by the Board of Directors of the Company out of the funds legally available therefor. The payment of dividends by the company are subject to the restrictions of South Carolina laws applicable to the declaration of dividends by a business corporation. Under such provisions, dividends may be paid in cash or in property of the Company, including the shares of other corporations, except when the Company is insolvent or would thereby be made insolvent or when the declaration of payment thereof would be contrary to any restrictions in the Company Articles. Dividends may be declared and paid only out of the unreserved and unrestricted earned surplus of the Company.
In the event of the liquidation, dissolution or winding-up of the affairs of the Company, the holders of outstanding shares of Company Stock will be entitled to share pro rata according to their respective interests in the Company's assets and funds remaining after payment or provision for payment of all debts and other liabilities of the Company.
All shares of Company Stock are fully paid and nonassessable.
The Bank is the transfer agent for shares of Company Stock.
DISCUSSION OF FORWARD-LOOKING STATEMENTS
Information in the enclosed report, other than historical information, may contain forward-looking statements that involve risks and uncertainties, including, but not limited to, timing of certain business initiatives of the Company, the Company's interest rate risk condition, and future regulatory actions of the Comptroller of the Currency and Federal Reserve System. It is important to note that the Company's actual results may differ materially and adversely from those discussed in forward-looking statements.
6
SUPPLEMENTARY DATA
QUARTERLY SHAREHOLDER INFORMATION
CNB CORPORATION
QUARTERLY SHAREHOLDER INFORMATION
(All Dollar Amounts, Except Per Share Data, in Thousands)
Summary of Operating Results by Quarter
First Quarter | Second Quarter | Third Quarter | Fourth Quarter | |||||
| 2001 | 2000 | 2001 | 2000 | 2001 | 2000 | 2001 | 2000 |
SUPPLEMENTARY INFLATION ADJUSTED FINANCIAL DATA
Inflation-adjusted accounting has not been applied to the Company's financial information as management does not believe this type of analysis provides useful information within the financial services industry. The Company currently does not meet the asset size criteria which would make detailed disclosure of inflation adjusted data mandatory.
GUIDE 3. STATISTICAL DISCLOSURE BY BANK
HOLDING COMPANIES
The following tables present additional statistical information about CNB Corporation and its operation and financial condition and should be read in conjunction with the consolidated financial statements and related notes thereto contained elsewhere in this report.
DISTRIBUTION OF ASSETS, LIABILITIES, AND STOCKHOLDERS' EQUITY:
INTEREST RATES AND INTEREST DIFFERENTIAL
The tables on the following 5 pages present selected financial data and an analysis of net interest income.
7
| |||
| Twelve Months Ended 12/31/01 | ||
|
|
| |
|
| ||
(2) The Company had no out-of-period adjustments or foreign activities.
Loan fees of $295 are included in the above interest income. Loans on a
non-accrual basis for the recognition of interest income totalling $633
as of December 31, 2001 are included in loans, net of unearned income,
for purpose of this analysis.
8
CNB Corporation and Subsidiary | |||
| Twelve Months Ended 12/31/00 | ||
|
|
| |
|
| ||
(2) The Company had no out-of-period adjustments or foreign activities.
Loan fees of $237 are included in the above interest income. Loans on a
non-accrual basis for the recognition of interest income totalling $305
as of December 31, 2000 are included in loans, net of unearned income,
for purpose of this analysis.
9
| |||
| Twelve Months Ended 12/31/99 | ||
|
|
| |
|
| ||
(2) The Company had no out-of-period adjustments or foreign activities.
Loan fees of $228 are included in the above interest income. Loans on a
non-accrual basis for the recognition of interest income totalling $527
as of December 31, 1999 are included in loans, net of unearned income,
for purpose of this analysis.
10
CNB Corporation and Subsidiary
Rate/Volume Variance Analysis
For the Twelve Months Ended December 31, 2001 and 2000
(Dollars in Thousands)
|
|
|
|
|
|
|
|
|
| Change |
(1) Tax-equivalent adjustment based on a 34% tax rate.
(2) Includes non-accruing loans which does not have a material effect on the
Net Yield on Earning Assets.
11
CNB Corporation and Subsidiary
Rate/Volume Variance Analysis
For the Twelve Months Ended December 31, 2000 and 1999
(Dollars in Thousands)
|
|
|
|
|
|
|
|
|
| Change |
(1) Tax-equivalent adjustment based on a 34% tax rate.
(2) Includes non-accruing loans which does not have a material effect on the
Net Yield on Earning Assets.
12
CNB Corporation and Subsidiary
Rate/Volume Variance Analysis
For the Twelve Months Ended December 31, 1999 and 1998
(Dollars in Thousands)
|
|
|
|
|
|
|
|
|
| Change |
(1) Tax-equivalent adjustment based on a 34% tax rate.
(2) Includes non-accruing loans which does not have a material effect on the
Net Yield on Earning Assets.
13
INVESTMENT SECURITIES
The purpose of the investment policy of the Bank is to ensure that the investment securities portfolio shall be managed to maximize portfolio yield over the long term in a manner that is consistent with liquidity needs, pledging requirements, asset/liability strategies, and safety/soundness concerns. Specific investment objectives include the desire to: ensure adequate liquidity for loan demand, deposit fluctuations, and other changes in balance sheet mix; manage interest rate risk; maximize the institution's overall return; ensure collateral is available for pledging; and manage asset-quality diversification of the bank's assets. Currently, investment securities comprise a higher percentage of total assets due to weakened loan demand within our market. At December 31, 2001, the Loans/Total Assets ratio had dropped to 58.6% as compared to 62.8% at December 31, 2000, and investment securities correspondingly rose as a percentage of total assets from 27.8% to 32.0%, respectively.
Investment securities with a par value of $76,640, $90,870, and $82,325 at December 31, 2001, 2000, and 1999, respectively, were pledged to secure public deposits and for other purposes required by law.
The following summaries reflect the book value, unrealized gains and losses, approximate market value, and tax-equivalent yields on investment securities at December 31, 2001, 2000, and 1999.
| December 31, 2001 | ||||
Federal agencies |
|
|
|
|
|
State, county and |
|
|
|
|
|
HELD TO MATURITY |
|
|
|
|
|
|
|
|
|
|
|
(1) Tax equivalent adjustment based on a 34% tax rate.
As of the quarter ended December 31, 2001, the Bank did not hold any securities of an issuer that exceeded 10% of stockholders' equity.
14
INVESTMENT SECURITIES, continued
| December 31, 2000 | ||||
|
|
|
|
| |
|
|
|
|
|
|
State, county and |
|
|
|
|
|
|
|
|
|
|
|
|
|
|
|
|
|
State, county and |
|
|
|
|
|
(1) Tax equivalent adjustment based on a 34% tax rate.
As of the quarter ended December 31, 2000, the Bank did not hold any securities of an issuer that exceeded 10% of stockholders' equity.
15
INVESTMENT SECURITIES, continued
| December 31, 1999 | ||||
|
|
|
|
| |
|
|
|
|
|
|
State, county and |
|
|
|
|
|
|
|
|
|
|
|
|
|
|
|
|
|
State, county and |
|
|
|
|
|
(1) Tax equivalent adjustment based on a 34% tax rate.
As of the quarter ended December 31, 1999, the Bank did not hold any securities of an issuer that exceeded 10% of stockholders' equity.
16
LOAN PORTFOLIO
LENDING ACTIVITIES
The Company engages, through the Bank, in a full compliment of lending activities, including commercial, consumer, installment and real estate loans.
Real Estate Loans
One of the primary components of the Bank's loan portfolio are loans secured by first or second mortgages on residential and commercial real estate. These loans will generally consist of commercial real estate loans, construction and development loans and residential real estate loans (including home equity and second mortgage loans). Interest rates may be fixed or adjustable. The bank seeks to manage credit risk in the commercial real estate portfolio by emphasizing loans on owner-occupied office and retail buildings where the loan-to-value ratio, established by independent appraisals, generally does not exceed 80%. In addition, the Bank typically requires personal guarantees of the principal owners of the property. The Bank may also facilitate mortgage loans for sale into the secondary market, earning a fee, but avoiding the interest rate risk of holding long-term, fixed-rate loans. The principal economic risk associated with all loans, including real estate loans, is the creditworthiness of the Bank's borrowers. The ability of a borrower to repay a real estate loan will depend upon a number of economic factors, including employment levels and fluctuations in the value of real estate. In the case of a real estate construction loan, there is generally no income from the underlying property during the construction period, and the developer's personal obligations under the loan may be limited. Each of these factors increases the risk of nonpayment by the borrower. In the case of a real estate purchase loan, the borrower may be unable to repay the loan at the end of the loan term and may thus be forced to refinance the loan at a higher interest rate, or, in certain cases, the borrower may default as a result of its inability to refinance the loan. In either case, the risk of nonpayment by the borrower is increased. The Bank will also face additional credit risks to the extent that it engages in making adjustable rate mortgage loans ("ARMs"). In the case of an ARM, as interest rates increase, the borrower's required payments increase periodically, thus increasing the potential for default. The marketability of all real estate loans, including ARMs, is also generally affected by the prevailing level of interest rates.
Commercial Loans
The Bank makes loans for commercial purposes in various lines of business. The commercial loans will include both secured an unsecured loans for working capital (including inventory and receivables), loans for business expansion (including acquisition of real estate and improvements), and loans for purchases of equipment and machinery. Equipment loans will typically be made for a term of five years of less at either fixed or variable rates, with the loan fully amortized over the term and secured by the financed equipment. Working capital loans will typically have terms not exceeding one year and will usually be secured by accounts receivable, inventory or personal guarantees of the principals of the business. Commercial loans will vary greatly depending upon the circumstances and loan terms will be structured on a case-by-case basis to better serve customer needs. The risks associated with commercial loans vary with many economic factors, including the economy in the Bank's market area. Many of the Bank's commercial loans are made to small- to medium - sized businesses, which are typically smaller, have shorter operating histories, and less sophisticated record keeping systems than larger entities. As a result, these smaller entities may be less able to withstand adverse competitive, economic and financial conditions than larger borrowers. In addition, because payments on loans secured by commercial property generally depend to a large degree on the results of operations and management of the properties, repayment of such loans may be subject, to a greater extent than other loans, to adverse conditions in the real estate market or the economy. The Bank seeks to spread commercial loans throughout a variety of industries and monitors loan diversification to avoid a significant concentration within the loan portfolio.
17
CLASSIFICATION OF LOANS
Consumer Loans
The Bank makes a variety of loans to individuals for personal and household purposes, including secured and unsecured installment and term loans, home equity loans and lines of credit and unsecured revolving lines of credit such as credit cards. The secured installment and term loans to consumers will generally consist of loans to purchase automobiles, boats, recreational vehicles, mobile homes and household furnishings, with the collateral for each loan being the purchased property. The underwriting criteria for home equity loans will generally be the same as applied by the Bank when making a first mortgage loan, as described above, but more restrictive for home equity lines of credit. Consumer loans generally involve more credit risks than other loans because of the type and nature of the underlying collateral or because of the absence of any collateral. Consumer loan repayments are dependent on the borrower's continuing financial stability and are likely to be adversely affected by job loss, divorce and illness. Furthermore, the application of various federal and state laws, including federal and state bankruptcy and insolvency laws, may limit the amount which can be recovered on such loans in the case of default. In most cases, any repossessed collateral will not provide an adequate source of repayment of the outstanding loan balance. Although the underwriting process for consumer loans includes a comparison of the value of the security, if any to the proposed loan amount, the Bank cannot predict the extent to which the borrower's ability to pay, and the value of the security, will be affected by prevailing economic and other conditions.
Loan Approval and Review
The Bank's loan approval policies provide for various levels of officer lending authority. When the amount of aggregate loans to a single borrower exceeds an individual officer's lending authority, the loan request will be considered and approved by an officer with a higher lending limit or by the Credit Committee as established by the Board of Directors. The Loan Committee of the Board of Directors determines the lending limits for the Bank's loan officers. The Bank has an in-house lending limit to a single borrower of 10% of capital. An unsecured limit (aggregate) for the Bank is set at 100% of total capital.
CLASSIFICATION OF LOANS
The following is a summary of loans, in thousands of dollars, at December 31, 2001, 2000, 1999, 1998, and 1997 by major classification:
2001 | 2000 | 1999 | 1998 | 1997 | |
Real Estate Loans - mortgage | $187,808 | $191,329 | $163,614 | $142,039 | $136,441 |
MATURITIES AND SENSITIVITY TO CHANGES IN INTEREST RATES
The Company's loan portfolio consisted of approximately $220,786 and $232,944 in fixed rate loans as of December 31, 2001 and 2000, respectively. At December 31, 2001, and 2000, fixed rate loans with maturities in excess of one year amounted to approximately $169,151 and $175,866, respectively. Variable rate loans are those on which the interest rate can be adjusted to changes in the Bank's prime rate. Fixed rate loans are those on which the interest rate generally cannot be changed for the term of the loan.
18
RISK ELEMENTS
The following information relates to certain assets which are defined as risk elements by the Securities and Exchange Commission. All loans which meet the criteria set forth by the Securities and Exchange Commission are detailed below, regardless of the likelihood of collection in full or in part. All loans classified for regulatory purposes as loss, doubtful, substandard, or especially mentioned that have not been disclosed do not represent or result from trends or uncertainties which management reasonably expects will materially impact future operating results, liquidity, or capital resources or represent material credits about which management is aware of any information which causes management to have serious doubts as to the ability of such borrower to comply with the loan repayment terms. As a matter of practice, loans which management has serious concerns about the borrower being able to pay are put into a non-accrual status and disclosed under Risk Elements. Management reviews these loans periodic ally and feels that the current reserve for possible loan losses adequately provides coverage for actual loss potential. Other interest-bearing assets considered a risk element, if any, are also detailed in this section.
NONACCRUAL, PAST DUE AND RESTRUCTURED LOANS
The following schedule summarizes the amount of nonaccrual, past due, and restructured loans, in thousands of dollars, for the periods ended December 2001, 2000, 1999, 1998, 1997:
2001 | 2000 | 1999 | 1998 | 1997 | |
Nonaccrual loans | $ 633 | $ 305 | $ 527 | $ 422 | $ 24 |
Information relating to interest income on nonaccrual and renegotiated loans outstanding for the year ended December 31, 2001, 2000, and 1999 is as follows:
2001 | 2000 | 1999 | |
Interest included in income during the year | $ 12 | $ 10 | $ 26 |
Loans are placed in a non-accrual status when, in the opinion of management, the collection of additional interest is questionable. Thereafter no interest is taken into income unless received in cash or until such time as the borrower demonstrates the ability to pay principal and interest.
19
POTENTIAL PROBLEM LOANS
In addition to those loans disclosed under "Risk Elements", there are certain loans in the portfolio which are presently current but about which management has concerns regarding the ability of the borrower to comply with present loan repayment terms. Management maintains a loan review of the total loan portfolio to identify loans where there is concern that the borrower will not be able to continue to satisfy present loan repayment terms. Such problem loan identification includes the review of individual loans, loss experience, and economic conditions. Problem loans include both current and past due loans.
As of December 31, 2001, loans which management had serious concerns about the borrower being able to repay were put into a non-accrual status which are disclosed under "Risk Elements".
FOREIGN OUTSTANDINGS
As of the year ended December 31, 2001, the Company had no foreign loans outstanding.
LOAN CONCENTRATIONS
As of the year ended December 31, 2001, the Company did not have any concentration of loans exceeding 10% of total loans which are not otherwise disclosed as a category of loans pursuant to Item III. A. of Guide 3.
OTHER INTEREST-BEARING ASSETS
As of December 31, 2001, the Company does not have any interest-bearing assets that would be required to be disclosed under Item III. C. 1. or 2. if such assets were loans.
20
SUMMARY OF LOAN LOSS EXPERIENCE
Loan loss experience for each reported period, in thousands of dollars, is summarized as follows:
| Year Ended December 31, | ||||
|
|
|
|
| |
|
|
|
|
|
|
The reserve for loan losses is maintained at the greater of 1.20% of net loans or an amount that bears the same ratio to eligible loans as net charge-offs to average eligible loans over the past six years. In addition, the Asset/ Liability Management Committee and the Loan Committee review the adequacy of the reserve quarterly and make recommendations as to the desired amount of the reserve. Determination of the adequacy of the reserve is based on the above ratios and, but not limited to, considerations of classified and internally-identified problem loans, the current trend in delinquencies, the volume of past-due loans, and current or expected economic conditions.
The Board of Directors maintains an independent Loan Review function which has established controls and procedures to monitor loan portfolio risk on an on-going basis. Credit reviews on all major relationships are conducted on a continuous basis as is the monitoring of past-due trends and classified assets. The function utilizes various methodologies in its assessment of the adequacy of the Reserve for Loan Losses. Three primary measurements are reported to the Board of Directors on a quarterly basis, the Graded Loan Method based on a bank-wide risk grading model, the Migration Analysis Method which tracks risk patterns on charged-off loans for the previous 10 years, and the Historical Experience Method based on net charge-offs. Additionally, the function annually conducts an independent economic assessment, addresses portfolio risk by industry concentration, reviews loan policy changes and marketing strategies for any effect on portfolio risk, and conducts tests addressing portfolio performance by type of portfolio, collateral type, and loan officer performance.
Based upon all relevant factors, Management anticipates net charge-offs to be approximately $750 during 2002.
21
DEPOSITS
AVERAGE DEPOSITS BY CLASSIFICATION
The following table sets forth the classification of average deposits for the indicated period, in the thousands of dollars:
Years Ended December 31, | |||
| 2001 | 2000 | 1999 |
AVERAGE RATES PAID ON DEPOSITS
The following table sets forth average rates paid on categories of interest-bearing deposits for the periods indicated:
Years Ended December 31, | |||
| 2001 | 2000 | 1999 |
MATURITIES OF TIME DEPOSITS OF $100,000 OR MORE
The following table sets forth the maturity of time deposits of $100,000 or more, in thousands of dollars, at December 31, 2001:
Maturity within 3 months or less | $28,479 |
22
RETURN ON EQUITY AND ASSETS
The following table presents certain ratios relating to the Company's equity and assets:
Years Ended December 31, | |||
| 2001 | 2000 | 1999 |
SHORT-TERM BORROWINGS
Federal funds purchased and securities sold under repurchase agreements are short-term borrowings which generally mature within 90 days from the dates of issuance. No other category of short-term borrowings had an average balance outstanding during the reported period which represented 30 percent or more of stockholders' equity at the end of the period.
The following is a summary of short-term borrowings at December 31 of each reported period, in thousands of dollars:
December 31, | |||
| 2001 | 2000 | 1999 |
The following information relates to short-term borrowings outstanding during 2001, 2000, and 1999:
Maximum Amount Weighted Average
Outstanding in Any Interest Rate
Month End at December 31,
2001 2000 1999 2001 2000 1999
Federal funds
purchased and
securities sold
under agreement
to repurchase $36,702 $34,263 $36,183 1.91% 5.00% 4.34%
Year ended December 31,
2001 2000 1999
Federal funds purchased and
securities sold under
agreement to repurchase-
average daily amount outstanding $30,882 $30,851 $32,555
Weighted average interest rate paid 3.46% 4.76% 4.15%
23
ITEM 2. PROPERTIES
The Company's subsidiary, The Conway National Bank, has ten permanent offices in Horry County and one permanent office in Georgetown County, for a total of eleven offices. The principal office, located at 1400 Third Avenue in Conway, houses the Bank's administrative offices and data processing facilities. This three-story structure, which was significantly expanded in 1982, contains approximately 33,616 square feet. In addition, the Bank has a 632 square foot building for express banking services adjacent to the principal office. The Bank has a two-story office on Main Street in Conway containing 8,424 square feet. Bank offices are housed in one-story facilities at the Coastal Centre in Conway (3,500 square feet with an adjacent 675 square foot building for express banking services), Red Hill in Conway (3,760 square feet) West Conway in Conway (3,286 square feet) Surfside in Surfside Beach (6,339 square feet), Northside, north of Myrtle Beach (2,432 square feet), Socastee in the southern portion of Myrtl e Beach (3,498 square feet), Aynor in The Town of Aynor (2,809 square feet), Myrtle Beach in the City of Myrtle Beach (12,000 square feet), and Murrells Inlet in Murrells Inlet, Georgetown County (3,600 square feet). Of the eleven offices, the bank owns the principal office, the office at Red Hill, West Conway, Surfside Beach, Northside, Main Street, Socastee, Aynor, Myrtle Beach, and Murrells Inlet. One facility, Coastal Centre in Conway, is leased by the Bank under a long-term lease with renewal options. In addition to the existing facilities, the Company has purchased three future office sites. The sites consist of 1.1 acres on Highway 701 north of Conway, 1.0 acres on Highway 17 in North Myrtle Beach, and 3.24 acres on Highway 9 west of North Myrtle Beach. Plans are being made to build an approximate 3,600 square foot office on the North Myrtle Beach site with a tentative opening date in October, 2002. The company anticipates building offices on the other sites within the next three to five years, depe nding on market conditions. Additionally, preliminary work is being done to build a new approximate 24,000 square foot retail office at the principal site and converting the existing 33,616 square foot building into an operations center. Anticipated completion of this project is in the latter half of 2003.
ITEM 3. LEGAL PROCEEDINGS
There were no material legal proceedings against the Company or its subsidiary, The Conway National Bank, as of December 31, 2001.
There were no administrative or judicial proceedings arising under Section 8 of the Federal Deposit Insurance Act.
There were no material proceedings to which any director, officer, or owner of record of more than 5% of the voting securities of the Company or any associate is a party adverse to the Company.
There are other legal proceedings pending against the Company or its subsidiary, The Conway National Bank, in the ordinary course of business. In the opinion of management, based upon the opinion of counsel, liabilities arising from these proceedings, if any, would not have a material adverse effect on the financial position of the Company.
24
ITEM 4. SUBMISSION OF MATTERS TO VOTE OF SECURITY HOLDERS
On May 8, 2001, at the Annual Meeting of CNB Corporation, the security holders:
1) Nominated and elected three directors to serve for a three-year
term; and
2) Ratified the appointment of Elliott Davis, LLP as independent
auditors for the Company and its subsidiary for the year ending December
31, 2001.
PART II
ITEM 5. MARKET PRICE OF REGISTRANT'S COMMON STOCK AND
RELATED SECURITY HOLDER MATTERS
As of December 31, 2001, there were approximately 723 holders of record of Company stock. There is no established market for shares of Company stock and only limited trading in such shares has occurred since the formation of the Company on June 10, 1985. Most of the limited trading transactions have been effected through the efforts of officers of the Company in matching interested purchasers with shareholders who have expressed an interest in selling their shares of Company stock. Some private trading of Company stock has occurred without any participation in the transaction by the officers of the Company other than to effect the transfer on the Company's shareholder records. Accordingly, management of the Company is not aware of the prices at which all shares of Company stock have traded. The following table sets forth the prices known to management of the Company at which shares of Company stock have traded in each quarter within the two most recent fiscal years adjusted for the effect of a 20% stock di vidend paid during 2000.
2001 2000
High Low High Low
First Quarter $100.00 $100.00 $ 91.25 $ 91.25
Second Quarter $104.00 $100.00 $ 95.00 $ 91.25
Third Quarter $104.00 $104.00 $ 95.00 $ 95.00
Fourth Quarter $107.00 $104.00 $100.00 $ 95.00
Holders of shares of Company stock are entitled to such dividends as may be declared from time to time by the Board of Directors of the Company. The Company paid an annual cash dividend of $3.50 per share in 2001, 2000, 1999 and 1998, $3.00 per share in 1997, 1996 and 1995, $2.00 per share in 1994, 1993 and 1992, $1.50 per share in 1991, and $1.00 per share in the years 1985 through 1990. In addition, the Company may from time to time pay a stock dividend. The Company paid a 20% stock dividend in September 2000, a 25% stock dividend in September 1997, a 20% stock dividend in September 1994, a 50% stock dividend in July 1989, a 20% stock dividend in August 1987 and a 15% stock dividend in November 1985. There can be no assurance, however, as to the payment of dividends by the Company in the future since payment will be dependent upon the earnings and financial condition of the Company and the Bank and other related factors.
25
ITEM 6. SELECTED FINANCIAL DATA
CNB Corporation
FINANCIAL SUMMARY
(All Dollar Amounts, Except Per Share Data, in Thousands)
The following table sets forth certain selected financial data relating to the Company and subsidiary and is qualified in its entirety by reference to the more detailed
financial statements of the Company and subsidiary and notes thereto included elsewhere
in this report.
Year Ended December 31, | |||||
| 2001 | 2000 | 1999 | 1998 | 1997 |
*Restated for a 20% stock dividend issued during 2000.
Selected Balance Sheet Data: |
|
|
|
|
|
26
ITEM 7. MANAGEMENT'S DISCUSSION AND ANALYSIS OF FINANCIAL
CONDITION AND RESULTS OF OPERATIONS
"Management's Discussion and Analysis" is provided to afford a clearer understanding of the major elements of the Company's financial condition, results of operations, liquidity, and capital resources. The following discussion should be read in conjunction with the Company's financial statements and notes thereto and other detailed information appearing elsewhere in this report.
Distribution of Assets and Liabilities
The Company maintains a conservative approach in determining the distribution of assets and liabilities. Loans, net of unearned income, increased 10.7% from $267,141 at December 31, 1999 to $295,648 at December 31, 2000; and .3% from December 31, 2000 to $296,607 at December 31, 2001. Loan growth is attributed to overall business development efforts to meet business and personal loan demand in our market area. Loan demand was strong in our market area in 2000 reflecting a strong local economy, but declined in 2001 due to recessionary pressures coupled with the effects of the September 11 terrorist attacks on consumer confidence. Loans, net of unearned income, increased as a percentage of total assets from 58.6% at year-end 1999 to 62.8% at year-end 2000 and decreased to 58.6% at year-end 2001. Correspondingly, investment securities and federal funds sold decreased as a percentage of total assets from 34.1% at year-end 1999 to 29.9% at year-end 2000 and increased to 32.8% at year-end 2001 as investments have been utilized to balance the growth in loan outstandings. Investments and federal funds sold provide for an adequate supply of secondary liquidity. Year-end other assets as a percentage of total assets increased from 7.3% in 1999 and 2000 to 8.6% in 2001 due to the purchase of the existing Surfside Beach office site in early 2001. Management has sought to build the deposit base with stable, relatively non-interest-rate sensitive deposits by offering the small to medium account holders a wide array of deposit instruments at competitive rates. Non-interest-bearing demand deposits have grown from 16.0% at December 31, 1999 to 16.2% at December 31, 2000 and 17.6% at December 31, 2001. Demand deposits are expected to decline over the long-term as more customers utilize interest-bearing deposit and repo accounts. Interest-bearing liabilities as a percentage of total assets have declined from 73.3% at December 31, 1999 to 72.3% at December 31, 2000 and 70.5% at December 31, 2001.
The following table sets forth the percentage relationship to total assets of significant components of the Company's balance sheet as of December 31, 2001, 2000 and 1999:
| December 31, | ||
|
|
| |
|
|
|
|
27
Results of Operation
CNB Corporation and subsidiary experienced earnings in 2001, 2000 and 1999 of $6,435, $6,311,and $6,105, respectively, resulting in a return of average assets of 1.28%, 1.36%, and 1.35% and a return on average stockholders' equity of 12.25%, 13.42% and 14.15%. The earnings were primarily attributable to favorable net interest margins in each period (see Net Income-Net Interest Income). Other factors include management's ongoing effort to maintain other income at adequate levels (see Net Income - Other Income) and to control other expenses (see Net Income - Other Expenses). These strong earnings, coupled with a conservative dividend policy, have supplied the necessary capital funds to support bank operations. Total assets were $505,725 at December 31, 2001 as compared to $471,076 at December 31, 2000 and $455,702 at December 31, 1999. The following table sets forth the financial highlights for fiscal years 2001, 2000, and 1999.
28
CNB Corporation and Subsidiary
FINANCIAL HIGHLIGHTS
(All Dollar Amounts, Except Per Share Data, in Thousands)
| 2000 |
| 1999 |
| |||||
| Net interest income after provision for loan losses Income before income taxes Net Income Per Share (weighted average of shares outstanding)* Cash dividends declared Per Share* Total assets Total deposits Loans, net of unearned income Investment securities Stockholders' equity Book value per share* (actual number of shares outstanding) *Restated for stock dividend Ratios (1): Return on average total assets Return on average stockholders' equity |
|
|
|
|
| ||||
(1) For the fiscal years ended December 31, 2001, 2000, and 1999, average total assets amounted to $504,396, $462,360, and $453,571 with average stockholders' equity totaling $52,543, $47,025, and $43,146, respectively.
29
NET INCOME
Net Interest Income - Earnings are dependent to a large degree on net interest income, defined as the difference between gross interest and fees earned on earning assets, primarily loans and investment securities, and interest paid on deposits and borrowed funds. Net interest income is affected by the interest rates earned or paid and by volume changes in loans, investment securities, deposits, and borrowed funds.
The Bank maintained net interest margins in 2000 and 1999 of 4.6% and 4.5%, respectively, which meet or exceed management's long-term target of 4.5%. However, the 2001 net interest margin fell to 4.2% due to an unusually rapid decline in market interest rates lowering returns available on loans and investments while interest costs on liabilities did not decline as quickly due to strong competitive pressure. We do expect a widening in the net interest margin in 2002. Fully-tax-equivalent net interest income grew from $19,069 in 1999 to $19,847 in 2000 and shrank to 19,621 in 2001. During the three-year period, total fully-tax-equivalent interest income increased by 8.0% from $32,113 in 1999 to $34,672 in 2000 and decreased .7% in 2001 to $34,443. Over the same period, total interest expense increased by 13.7% from $13,044 in 1999 to $14,825 in 2000 and showed little change to $14,822 in 2001. Fully-tax-equivalent net interest income as a percentage of average total earning assets was 4.5% in 1999, 4.6% in 2000 and decreased to 4.2% in 2001.
Interest rates paid on deposits and borrowed funds and earned on loans and investments have generally followed the fluctuations in market interest rates in 2001, 2000, and 1999. However, fluctuations in market interest rates do not necessarily have a significant impact on net interest income, depending on the Bank's rate sensitivity position. A rate sensitive asset (RSA) is any loan or investment that can be repriced up or down in interest rate within a certain time interval. A rate sensitive liability (RSL) is an interest paying deposit or other liability that can be repriced either up or down in interest rate within a certain time interval. When a proper balance between RSA and RSL exists, market interest rate fluctuations should not have a significant impact on earnings. The larger the imbalance, the greater the interest rate risk assumed by the Bank and the greater the positive or negative impact of interest rate fluctuations on earnings. The Bank seeks to manage its assets and liabilities in a manner that will limit interest rate risk and thus stabilize long-run earning power. The following table sets forth the Bank's static gap rate sensitivity position at each of the time intervals indicated. The table illustrates the Bank's rate sensitivity position on specific dates and may not be indicative of the position at other points in time. Management believes that a rise or fall in interest rates will not materially effect earnings.
Interest Rate Sensitivity Analysis
|
|
|
| Over 1 |
| |
Rate Sensitive Assets (RSA) |
|
|
|
|
|
|
30
NET INCOME (continued)
Provision for Possible Loan Losses - It is the policy of the bank to maintain the reserve for possible loan losses at the greater of 1.20% of net loans or the percentage based on the actual loan loss experience over the previous five years. In addition, management may increase the reserve to a level above these guidelines to cover potential losses identified during the ongoing in-house problem loan identification process. The Company includes the provisions of SFAS No. 114, "Accounting by Creditors for Impairment of a Loan",as amended by SFAS 118, in the allowance for loan losses (see NOTE 1 - SUMMARY OF SIGNIFICANT ACCOUNTING POLICIES). The provision for possible loan losses was $625 in 2001, $820 in 2000 and $795 in 1999. Net loan charge-offs totalled $644 in 2001, $489 in 2000, and $476 in 1999 with net charge-offs being centered in consumer purpose loans during each period. The reserve for possible loan losses as a percentage of net loans was 1.28% at December 31, 2 001, 1.30% at December 31, 2000, and 1.31% at December 31, 1999. The decreased provision during 2001 was due to a decrease in the rate of loan growth.
Securities Transactions - Net unrealized gains/(losses) in the investment securities portfolio were $2,999 at December 31, 2001, $455 at December 31, 2000, and $(2,121) at December 31, 1999. The market value of investment securities rose in 2000 and 2001 as overall market rates declined. No security gains/(losses) were taken in 1999 or 2000, but a gain of $169 was taken in 2001. Due to the increased steepness of the Treasury yield curve, it was felt appropriate to take the gains on the sale of $11,213 in available-for-sale short-term Treasuries with a .8 year average life and reinvest in U.S. Agencies with an average life of 5.3 years.
Other Income - Other income, net of any securities gains/(losses), increased by 5.9% from $4,307 in 1999 to $4,562 in 2000 and grew 13.3% from $4,562 in 2000 to $5,168 in 2001. Other income rose in 1999, 2000 and 2001 due to continued growth in deposit account activity, higher merchant discount income and increased refinancing volume in the mortgage loan department. Effective July 1, 2001, overall service charge rates were increased which will correspondingly increase future non-interest income levels.
Other Expenses - Other expenses increased by 7.1% from $13,030 in 1999 to $13,961 in 2000 and 4.6% from $13,961 in 2000 to $14,606 in 2001. The components of other expenses are salaries and employee benefits of $8,024, $8,620, and $9,282; occupancy and furniture and equipment expenses of $1,719, $1,821, and $1,876; and other operating expenses of $3,287, $3,520, and $3,448 for 1999, 2000, and 2001, respectively. The increase in salaries and employee benefits reflects compensation increments, the increased costs of providing employee benefits, and an increase from 202 to 209 full-time equivalent employees over the three-year period. The addition of the Murrells Inlet office in 2000 and the purchase of the Surfside Office which was previously a leasehold interest impacted occupancy and furniture and equipment expense. Looking ahead, non-interest expense should grow in 2002 due to the addition of the North Myrtle Beach office and corresponding operational areas, and in 2003 due to the construction of the new Main Office Retail Center. Other operating expenses have decreased due to lower credit card department related costs in the merchant discount income area.
Income Taxes - Provisions for income taxes decreased 5.1% from $3,076 in 1999 to $2,920 in 2000 and decreased 3.7% from $2,920 in 2000 to $2,812 in 2001. The decrease in income taxes in 2000 and 2001 was due to only a slight increase in income before income taxes each year coupled with a 7.1% increase in nontaxable income from $719 in 1999 to $770 in 2000 and a 20.9% increase from $770 in 2000 to $931 in 2001.
31
LIQUIDITY
The bank's liquidity position is primarily dependent on short-term demands for funds caused by customer credit needs and deposit withdrawals and upon the liquidity of bank assets to meet these needs. The bank's liquidity sources include cash and due from banks, federal funds sold and short-term investments. In addition, the bank has established federal funds lines of credit from correspondent banks; has the ability, on a short-term basis, to borrow funds from the Federal Reserve System; and has a line of credit from the Federal Home Loan Bank of Atlanta (see NOTE 8 - LINES OF CREDIT). The Company has cash balances on hand of $5,248, $4,776, and $4,241 at December 31, 2001, 2000, and 1999 with liabilities, consisting of cash dividends payable, totalling $2,507, $2,502, and $2,086, respectively. Management feels that liquidity sources are more than adequate to meet funding needs.
OFF-BALANCE SHEET RISK
The Company, through the operations of the Bank, makes contractual commitments to extend credit in the ordinary course of business. These commitments are legally binding agreements to lend money to customers of the Bank at predetermined interest rates for a specified period of time. In addition to commitments to extend credit, the Bank also issues standby letters of credit which are assurances to a third party that they will not suffer a loss if the Bank's customer fails to meet its contractual obligation to a third party. At December 31, 2001, the Bank had issued commitments to extend credit of $25.8 million and standby letters of credit of $3.5 million (see NOTE 10 - FINANCIAL INSTRUMENTS WITH OFF-BALANCE SHEET RISK). The majority of the commitments and standby letters of credit typically mature within one year and past experience indicates that many of the commitments and standby letters of credit will expire unused. However, through its various sources of liquidity, the Bank believes that it will have the necessary resources to meet these obligations should the need arise.
Neither the Company nor the Bank is involved in other off-balance sheet contractual relationships, unconsolidated related entities that have off-balance sheet arrangements, or transactions that could result in liquidity needs or other commitments or significantly impact earnings.
Obligations under noncancelable operating lease agreements totaled $41 thousand at December 31, 2001. These obligations are payable over several years as shown in NOTE 11 - COMMITMENTS AND CONTINGENCIES.
CAPITAL RESOURCES
Total stockholders' equity was $53,996, $48,606, and $43,712 at December 31, 2001, 2000, and 1999, representing 10.68%, 10.32%, and 9.59% of total assets, respectively. At December 31, 2001, the Bank exceeds quantitative measures established by regulation to ensure capital adequacy (see NOTE 15 - REGULATORY MATTERS). Capital is considered sufficient by management to meet current and prospective capital requirements and to support anticipated growth in bank operations.
EFFECTS OF INFLATION
Inflation normally has the effect of accelerating the growth of both a bank's assets and liabilities. One result of this inflationary effect is an increased need for equity capital. Income is also affected by inflation. While interest rates have traditionally moved with inflation, the effect on net income is diminished because both interest earned on assets and interest paid on liabilities vary directly with each other. In some cases, however, rate increases are delayed on fixed-rate instruments. Loan demand normally declines during periods of high inflation. Inflation has a direct impact on the Bank's non-interest expense. The Bank responds to inflation changes through readjusting non-interest income by repricing services.
32
EFFECTS OF REGULATORY ACTION
The Federal Deposit Insurance Corporation (FDIC) reduced FDIC insurance premium rates during 1995 which has had a positive effect on subsequent earnings and should favorably impact future year's income. Effective March 11, 2000, the Gramm-Leach-Bliley Act of 1999 allows bank holding companies to elect to be treated as financial holding companies which may engage in a broad range of securities, insurance, and other financial activities. At this time, neither the Company nor the Bank plan to enter these new lines of business. The management of the Company and the Bank is not aware of any other current recommendations by the regulatory authorities which, if they were to be implemented, would have a material effect on liquidity, capital resources, or operations.
ACCOUNTING ISSUES
Statement of Financial Accounting Standards No. 140,"Accounting for Transfers and Servicing of Financial Assets and Extinguishments of Liabilities -- a replacement of SFAS No. 125," was issued in September 2000. It revised the standards for accounting for securitizations and other transfers of financial assets and collateral and requires certain disclosures but 3will carry over most of SFAs No. 125's provisions without reconsideration. SFAS 140 is effective for transfers and servicing of financial assets and extinguishment of liabilities occurring after March 31, 2001. This statement is effective for recognition and reclassification of collateral and for disclosures related to securitization transactions and collateral for fiscal years ending after December 15, 2000. The adoption of the provisions of SFAS No. 140 in 2001 did not have a material effect on the Company.
In July 2001, the Financial Accounting Standards Board ("FASB") issued SFAS No. 141,"Business Combinations", and SFAS No. 142,"Goodwill and Other Intangible Assets." SFAS No. 141 requires that the purchase method of accounting be used for all business combinations initiated after June 30, 2001. SFAS 141 also specifies criteria intangible assets acquired in a purchase method business combination must meet to be recognized and reported apart from goodwill, noting that any purchase price allocable to an assembled workforce may not be accounted for separately. SFAS No. 142 will require that goodwill and intangible assets with indefinite useful lives no longer be amortized, but instead tested for impairment at least annually in accordance with the provisions of SFAS No. 142. The Company was required to adopt the provisions of SFAS No. 141 immediately and must adopt SFAS No. 142 effective January 1, 2002. The adoption of the provisions of SFAS No. 141 in 2001 did not have a material effect on t he Company. The adoption of SFAS No. 142 is not expected to have a material effect on the Company.
In August 2001, the FASB issued SFAS No. 144, "Accounting for the Impairment or Disposal of Long-Lived Assets." This SFAS supercedes prior pronouncements associated with impairment or disposal of long-lived assets. The SFAS establishes methodologies for assessing impairment of long-lived assets, including assets to be disposed of by sale or by other means. This statement is effective for all fiscal years beginning after December 15, 2001. This SFAS is not expected to have a material impact on the Company's financial position.
On July 2, 2001, The Securities and Exchange Commission ("SEC") issued Staff Accounting Bulletin ("SAB") No. 102,"Selected Loan Loss Allowance Methodology and Documentation Issues". SAB 102 expresses the SEC's views on the development, documentation and application of a systematic methodology for determining the allowance for loan and lease losses in accordance with Generally Accepted Accounting Principles. The Company believes that it is currently in compliance with the requirements of SAB 102.
Other accounting standards that have been issued or proposed by the Financial Accounting Standards Board that do not require adoption until a future date are not expected to have a material impact on the consolidated financial statements upon adoption.
33
RISKS AND UNCERTAINTIES
In the normal course of its business the Company encounters two significant types of risks: economic and regulatory. There are three main components of economic risk: interest rate risk, credit risk and market risk. The Company is subject to interest rate risk to the degree that its interest-bearing liabilities mature or reprice at different speeds, or on different basis, than its interest-earning assets. Credit risk is the risk of default on the Company's loan portfolio that results from borrower's inability or unwillingness to make contractually required payments. Market risk reflects changes in the value of collateral underlying loans receivable and the valuation of real estate held by the Company.
The Company is subject to the regulations of various governmental agencies. These regulations can and do change significantly from period to period. The Company also undergoes periodic examinations by the regulatory agencies, which may subject it to further changes with respect to asset valuations, amounts of required loss allowances and operating restrictions from the regulators' judgments based on information available to them at the time of their examination.
QUALITATIVE AND QUANTITATIVE DISCLOSURES ABOUT MARKET RISK
Market risk is the risk of loss from adverse changes in market prices and rates. The Company's market risk arises principally from interest rate risk inherent in its lending, deposit and borrowing activities. Management actively monitors and manages its interest rate risk exposure. In addition to other risks which the Company manages in the normal course of business, such as credit quality and liquidity risk, management considers interest rate risk to be a significant market risk that could potentially have a material effect on the Company's financial condition and results of operations (See Net Income - Net Interest Income). Other types of market risks, such as foreign currency risk and commodity price risk, do not arise in the normal course of the Company's business activities.
34
ITEM 8 - FINANCIAL STATEMENTS
CNB CORPORATION AND SUBSIDIARY
REPORT ON CONSOLIDATED FINANCIAL STATEMENTS
FOR THE YEARS ENDED DECEMBER 31, 2001, 2000 AND 1999
-35-
CNB CORPORATION AND SUBSIDIARY
CONWAY, SOUTH CAROLINA
CONTENTS
PAGE | |
REPORT OF INDEPENDENT CERTIFIED PUBLIC ACCOUNTANTS | 36 |
- -36-
ELLIOTT DAVIS, LLP
CERTIFIED PUBLIC ACCOUNTS
MEMBERS OF THE AMERICAN INSTITUTE OF CERTIFIED PUBLIC ACCOUNTS
GREENVILLE, S.C.
GREENWOOD, S.C.
ANDERSON, S.C.
AIKEN, S.C.
COLUMBIA, S.C.
AUGUSTA, GA
REPORT OF INDEPENDENT CERTIFIED PUBLIC ACCOUNTANTS
The Directors and Stockholders
CNB Corporation
Conway, South Carolina
We have audited the accompanying consolidated balance sheets ofCNB Corporation and Subsidiary as of December 31, 2001 and 2000, and the related consolidated statements of income, stockholders' equity, comprehensive income and cash flows for each of the years in the three year period ended December 31, 2001. These consolidated financial statements are the responsibility of the Company's management. Our responsibility is to express an opinion on these consolidated financial statements based on our audits.
We conducted our audits in accordance with auditing standards generally accepted in the United States of America. Those standards require that we plan and perform the audits to obtain reasonable assurance about whether the consolidated financial statements are free of material misstatement. An audit includes examining, on a test basis, evidence supporting the amounts and disclosures in the consolidated financial statements. An audit also includes assessing the accounting principles used and significant estimates made by management, as well as evaluating the overall financial statement presentation. We believe that our audits provide a reasonable basis for our opinion.
In our opinion, the consolidated financial statements referred to above present fairly, in all material respects, the financial position ofCNB Corporation and Subsidiary at December 31, 2001 and 2000 and the results of their operations and their cash flows for each of the years in the three year period ended December 31, 2001, in conformity with accounting principles generally accepted in the United States of America.
Elliott Davis, LLP
January 18, 2002
Greenville, South Carolina
Internationally - Moore Stephens Elliott Davis, LLC
Members of the American Institute of Certified Public Accounts
870 S. PleasantburG Drive Post Office Box 6286 Greenville, South Carolina 29606-6286
Telephone (864) 242-3370 Telefax (864) 232-7161
- -37-
CNB CORPORATION AND SUBSIDIARY
CONSOLIDATED BALANCE SHEETS
(amounts, except share data, in thousands)
December 31, | ||
| 2001 | 2000 |
The accompanying notes are an integral part of these consolidated financial statements.
-38-
CNB CORPORATION AND SUBSIDIARY
CONSOLIDATED STATEMENTS OF INCOME
(amounts, except per share data, in thousands)
For the years ended December 31, | |||
| 2001 | 2000 | 1999 |
The accompanying notes are an integral part of these consolidated financial statements.
- -39-
CNB CORPORATION AND SUBSIDIARY
CONSOLIDATED STATEMENTS OF STOCKHOLDERS' EQUITY
For the years ended December 31, 2001, 2000, and 1999
(amounts, except share data, in thousands)
|
|
| Accumu- |
|
| |||
|
|
|
|
|
|
|
| |
The accompanying notes are an integral part of these consolidated financial statements.
- -40-
CNB CORPORATION AND SUBSIDIARY
CONSOLIDATED STATEMENTS OF COMPREHENSIVE INCOME
(amounts in thousands)
For the years ended December 31, | |||
| 2001 | 2000 | 1999 |
The accompanying notes are an integral part of these consolidated financial statements.
- -41-
CNB CORPORATION AND SUBSIDIARY
CONSOLIDATED STATEMENTS OF CASH FLOWS
(amounts in thousands)
For the years ended December 31, | |||
| 2001 | 2000 | 1999 |
The accompanying notes are an integral part of these consolidated financial statements.
- -42-
CNB CORPORATION AND SUBSIDIARY
NOTES TO CONSOLIDATED FINANCIAL STATEMENTS
NOTE 1 - SUMMARY OF SIGNIFICANT ACCOUNTING POLICIES AND ACTIVITIES
Principles of consolidation and nature of operations
The consolidated financial statements include the accounts of CNB Corporation ("the Company") and its wholly-owned subsidiary, The Conway National Bank ("the Bank"). The Company operates as one business segment. All significant intercompany balances and transactions have been eliminated. The Bank operates under a national bank charter and provides full banking services to customers. The Bank is subject to regulation by the Office of the Comptroller of the Currency and the Federal Deposit Insurance Corporation. The Company is subject to regulation by the Federal Reserve Board.
Estimates
The preparation of financial statements in conformity with accounting principles generally accepted in the United States of America requires management to make estimates and assumptions that affect the reported amounts of assets and liabilities and disclosure of contingent assets and liabilities as of the dates of the consolidated balance sheets and the consolidated statements of income for the periods covered. Actual results could differ from those estimates.
Concentrations of credit risk
The Company, through its subsidiary, makes commercial and personal loans to individuals and small businesses located primarily in the South Carolina coastal region. The Company has a diversified loan portfolio and the borrowers' ability to repay their loans is not dependent upon any specific economic sector.
Cash and cash equivalents
For purposes of the statements of cash flows, cash and cash equivalents are defined as those amounts included in the balance sheet caption"Cash and Due from Banks". Cash and cash equivalents have an original maturity of three months or less.
Investment securities
The Company accounts for investment securities in accordance with Statement of Financial Accounting Standards ("SFAS") No. 115, "Accounting for Certain Investments in Debt and Equity Securities." This statement requires that the Company classify debt securities upon purchase as available for sale, held to maturity or trading. Such assets classified as available for sale are carried at fair value. Unrealized holding gains or losses are reported as a component of stockholders' equity (accumulated other comprehensive income (loss)) net of deferred income taxes. Securities classified as held to maturity are carried at cost, adjusted for the amortization of premiums and the accretion of discounts into interest income using a method which approximates a level yield. To qualify as held to maturity the Company must have the intent and ability to hold the securities to maturity. Trading securities are carried at market value. The Company has no trading securities. Gains or losses on disposition of securities are based on the difference between the net proceeds and the adjusted carrying amount of the securities sold, using the specific identification method.
(Continued)
- -43-
NOTE 1 - SUMMARY OF SIGNIFICANT ACCOUNTING POLICIES AND ACTIVITIES, Continued
Loans and interest income
Interest on loans is accrued and recognized based upon the interest method.
The Company accounts for impaired loans in accordance with SFAS No. 114, "Accounting by Creditors for Impairment of a Loan". This standard requires that all creditors value loans at the loan's fair value if it is probable that the creditor will be unable to collect all amounts due according to the terms of the loan agreement. Fair value may be determined based upon the present value of expected cash flows, market price of the loan, if available, or value of the underlying collateral. Expected cash flows are required to be discounted at the loan's effective interest rate. SFAS No. 114 was amended by SFAS No. 118 to allow a creditor to use existing methods for recognizing interest income on an impaired loan and by requiring additional disclosures about how a creditor recognizes interest income on an impaired loan.
Under SFAS No. 114, as amended by SFAS 118, when the ultimate collectibility of an impaired loan's principal is in doubt, wholly or partially, all cash receipts are applied to principal. When this doubt does not exist, cash receipts are applied under the contractual terms of the loan agreement. Once the reported principal balance has been reduced to zero, future cash receipts are applied to interest income, to the extent that any interest has been foregone. Further cash receipts are recorded as recoveries of any amounts previously charged off.
A loan is also considered impaired if its terms are modified in a troubled debt restructuring. For these accruing impaired loans, cash receipts are typically applied to principal and interest receivable in accordance with the terms of the restructured loan agreement. Interest income is recognized on these loans using the accrual method of accounting.
Allowance for loan losses
The allowance for loan losses is based on management's ongoing evaluation of the loan portfolio and reflects an amount that, in management's opinion, is adequate to absorb losses in the existing portfolio. In evaluating the portfolio, management takes into consideration numerous factors, including current economic conditions, prior loan loss experience, the composition of the loan portfolio, and management's estimate of anticipated credit losses. Loans are charged against the allowance at such time as they are determined to be losses. Subsequent recoveries are credited to the allowance. Management considers the year-end allowance appropriate and adequate to cover possible losses in the loan portfolio; however, management's judgment is based upon a number of assumptions about future events, which are believed to be reasonable, but which may or may not prove valid. Thus, there can be no assurance that charge-offs in future periods will not exceed the allowance for loan losses or that additional incr eases in the allowance for loan losses will not be required.
Non-performing assets
Non-performing assets include real estate acquired through foreclosure or deed taken in lieu of foreclosure, and loans on non-accrual status. Loans are placed on non-accrual status when, in the opinion of management, the collection of additional interest is questionable. Thereafter no interest is taken into income unless received in cash or until such time as the borrower demonstrates the ability to pay principal and interest.
Premises and equipment
Premises and equipment are stated at cost less accumulated depreciation and amortization. Depreciation and amortization are computed over the estimated useful lives of the assets using primarily the straight-line method. Additions to premises and equipment and major replacements or improvements are capitalized at cost. Maintenance, repairs and minor replacements are expensed when incurred. Gains and losses on routine dispositions are reflected in current operations.
(Continued)
-44-
NOTE 1 - SUMMARY OF SIGNIFICANT ACCOUNTING POLICIES AND ACTIVITIES, Continued
Advertising expense
Advertising, promotional and other business development costs are generally expensed as incurred. External costs incurred in producing media advertising are expensed the first time the advertising takes place. External costs relating to direct mailing costs are expensed in the period in which the direct mailings are sent. Advertising, promotional and other business development costs of $294,000, $357,000 and $285,000, were included in the Company's results of operations for 2001, 2000, and 1999, respectively.
Income taxes
Income taxes are accounted for in accordance with SFAS No. 109,"Accounting for Income Taxes".Under SFAS No. 109, deferred tax liabilities are recognized on all taxable temporary differences (reversing differences where tax deductions initially exceed financial statement expense, or income is reported for financial statement purposes prior to being reported for tax purposes). In addition, deferred tax assets are recognized on all deductible temporary differences (reversing differences where financial statements expense initially exceeds tax deductions, or income is reported for tax purposes prior to being reported for financial statement purposes). Valuation allowances are established to reduce deferred tax assets if it is determined to be"more likely than not" that all or some portion of the potential deferred tax assets will not be realized.
Reclassifications
Certain amounts in the financial statements for the year ended December 31, 2000 and 2001 have been reclassified, with no effect on net income to be consistent with the classifications adopted for the year ended December 31, 2001.
Net income per share
The Company computes net income per share in accordance with SFAS No. 128,"Earnings Per Share." Net income per share is computed on the basis of the weighted average number of common shares outstanding: 714,618 in 2001, 715,656 in 2000, and 716,209 in 1999. The Company does not have any dilutive instruments and therefore only basic net income per share is presented.
Fair values of financial instruments
SFAS No. 107,"Disclosures About Fair Value of Financial Instruments," as amended by SFAS No. 119, requires disclosure of fair value information for financial instruments, whether or not recognized in the balance sheet, when it is practicable to estimate the fair value. SFAS No. 107 defines a financial instrument as cash, evidence of an ownership interest in an entity or contractual obligations which require the exchange of cash or other financial instruments. Certain items are specifically excluded from the disclosure requirements, including the Company's common stock. In addition, other nonfinancial instruments such as premises and equipment and other assets and liabilities are not subject to the disclosure requirements.
The following methods and assumptions were used by the Company in estimating fair values of financial instruments as disclosed herein:
Cash and due from banks - The carrying amounts of cash and due from banks (cash on hand, due from banks and interest bearing deposits with other banks) approximate their fair value.
Federal funds sold - The carrying amounts of federal funds sold approximate their fair value.
Investment securities available for sale and held to maturity - Fair values for investment securities are based on quoted market prices.
Other investments -No ready market exists for Federal Reserve and Federal Home Loan Bank Stock and they have no quoted market value. However, redemption of this stock has historically been at par value.
(Continued)
- -45-
NOTE 1 - SUMMARY OF SIGNIFICANT ACCOUNTING POLICIES AND ACTIVITIES, Continued
Fair values of financial instruments, continued
Loans - For variable rate loans that reprice frequently and for loans that mature within one year, fair values are based on carrying values. Fair values for all other loans are estimated using discounted cash flow analyses, with interest rates currently being offered for loans with similar terms to borrowers of similar credit quality. Fair values for impaired loans are estimated using discounted cash flow analyses or underlying collateral values, where applicable.
Deposits - The fair values disclosed for demand deposits are, by definition, equal to their carrying amounts. The carrying amounts of variable rate, fixed-term money market accounts and short-term certificates of deposit approximate their fair values at the reporting date. Fair values for long-term fixed-rate certificates of deposit are estimated using a discounted cash flow calculation that applies interest rates currently being offered on certificates to a schedule of aggregated expected monthly maturities.
Short-term borrowings - The carrying amounts of borrowings under repurchase agreements, federal funds purchased, short-term Federal Home Loan Bank advances and U. S. Treasury demand notes approximate their fair values.
Federal Home Loan Bank advances - Fair values of Federal Home Loan Bank advances are based on a discounted cash flow analysis comparing existing rates on the Company's advances to current rates offered on advances of similar maturities.
Off balance sheet instruments - Fair values of off balance sheet lending commitments are based on fees currently charged to enter into similar agreements, taking into account the remaining terms of the agreements and the counterparties' credit standing.
Recently issued accounting standards
Statement of Financial Accounting Standards No. 140, "Accounting for Transfers and Servicing of Financial Assets and Extinguishments of Liabilities -- a replacement of SFAS No. 125, " was issued in September 2000. It revises the standards for accounting for securitizations and other transfers of financial assets and collateral and requires certain disclosures but will carry over most of SFAS No. 125's provisions without reconsideration. SFAS 140 is effective for transfers and servicing of financial assets and extinguishment of liabilities occurring after March 31, 2001. This statement is effective for recognition and reclassification of collateral and for disclosures related to securitization transactions and collateral for fiscal years ending after December 15, 2000. The adoption of the provisions of SFAS No. 140 in 2001 did not have a material effect on the Company.
In July 2001, the Financial Accounting Standards Board ("FASB") issued SFAS No. 141, "Business Combinations", and SFAS No. 142,"Goodwill and Other Intangible Assets." SFAS No. 141 requires that the purchase method of accounting be used for all business combinations initiated after June 30, 2001. SFAS 141 also specifies criteria intangible assets acquired in a purchase method business combination must meet to be recognized and reported apart from goodwill, noting that any purchase price allocable to an assembled workforce may not be accounted for separately. SFAS No. 142 will require that goodwill and intangible assets with indefinite useful lives no longer be amortized, but instead tested for impairment at least annually in accordance with the provisions of SFAS No. 142. The Company was required to adopt the provisions of SFAS No. 141 immediately and must adopt SFAS No. 142 effective January 1, 2002. The adoption of the provisions of SFAS No. 141 in 2001 did not have a material effect on the Company. The adoption of SFAS No. 142 is not expected to have a material effect on the Company.
(Continued)
-46-
NOTE 1 - SUMMARY OF SIGNIFICANT ACCOUNTING POLICIES AND ACTIVITIES, Continued
Recently issued accounting standards, continued
In August 2001, the FASB issued SFAS No. 144,"Accounting for the Impairment or Disposal of Long-Lived Assets." This SFAS supercedes prior pronouncements associated with impairment or disposal of long-lived assets. The SFAS establishes methodologies for assessing impairment of long-lived assets, including assets to be disposed of by sale or by other means. This statement is effective for all fiscal years beginning after December 15, 2001. This SFAS is not expected to have a material impact on the Company's financial position.
On July 2, 2001, The Securities and Exchange Commission ("SEC") issued Staff Accounting Bulletin (SAB") No. 102,"Selected Loan Loss Allowance Methodology and Documentation Issues". SAB 102 expresses the SEC's views on the development, documentation and application of a systematic methodology for determining the allowance for loan and lease losses in accordance with Generally Accepted Accounting Principles. The Company believes that it is currently in compliance with the requirements of SAB 102.
Other accounting standards that have been issued or proposed by the Financial Accounting Standards Board that do not require adoption until a future date are not expected to have a material impact on the consolidated financial statements upon adoption.
Risks and Uncertainties
In the normal course of its business the Company encounters two significant types of risks: economic and regulatory. There are three main components of economic risk: interest rate risk, credit risk and market risk. The Company is subject to interest rate risk to the degree that its interest-bearing liabilities mature or reprice at different speeds, or on different basis, than its interest-earning assets. Credit risk is the risk of default on the Company's loan portfolio that results from borrower's inability or unwillingness to make contractually required payments. Market risk reflects changes in the value of collateral underlying loans receivable and the valuation of real estate held by the Company.
The Company is subject to the regulations of various governmental agencies. These regulations can and do change significantly from period to period. The Company also undergoes periodic examinations by the regulatory agencies, which may subject it to further changes with respect to asset valuations, amounts of required loss allowances and operating restrictions from the regulators' judgments based on information available to them at the time of their examination.
NOTE 2 - RESTRICTIONS ON CASH AND DUE FROM BANKS
The Bank is required to maintain average reserve balances either at the Bank or on deposit with the Federal Reserve Bank. The average amounts of these reserve balances for the years ended December 31, 2001 and 2000 were approximately $9,103,000 and $8,852,000, respectively.
- -47-
NOTE 3 - INVESTMENT SECURITIES
The book value, approximate fair value and expected maturities of investment securities are summarized as follows (tabular amounts in thousands):
December 31, 2001 | ||||
AVAILABLE FOR SALE | Cost | Gains | Losses | Value |
(Continued)
-48-
NOTE 3 - INVESTMENT SECURITIES, Continued
December 31, 2000 | ||||
AVAILABLE FOR SALE | Cost | Gains | Losses | Value |
OTHER INVESTMENTS, AT COST
The Bank, as a member institution, is required to own certain stock investments in the Federal Home Loan Bank of Atlanta ("FHLB")and the Federal Reserve Bank. The stock is generally pledged against any borrowings from these institutions (see Note 8). No ready market exists for the stock and it has no quoted market value. However, redemption of these stocks has historically been at par value.
- -49-
NOTE 3 - INVESTMENT SECURITIES, Continued
OTHER INVESTMENTS, AT COST, Continued
The Company's investments in stock are summarized below (tabular amounts in thousands):
December 31, | ||
| 2001 | 2000 |
Investment securities with an aggregate par value of $76,640,000 at December 31, 2001 and $90,870,000 at December 31, 2000 were pledged to secure public deposits and for other purposes.
NOTE 4 - LOANS AND ALLOWANCE FOR LOAN LOSSES
Following is a summary of loans by major classification (tabular amounts in thousands):
December 31, | ||
| 2001 | 2000 |
The Bank's loan portfolio consisted of $220,786,000 and $232,944,000 in fixed rate loans as of December 31, 2001 and 2000, respectively. Fixed rate loans with maturities in excess of one year amounted to $169,151,000 and $175,866,000 at December 31, 2001 and 2000, respectively. The Bank has an available line of credit from the Federal Home Loan Bank of Atlanta. Securing the line is a blanket lien on qualifying 1-4 family mortgages.
Changes in the allowance for loan losses are summarized as follows (tabular amounts in thousands):
For the years ended December 31,
2001 | 2000 | 1999 | ||
Balance, beginning of year | $ 3,782 | $ 3,451 | $ 3,132 | |
At December 31, 2001 and 2000, non-accrual loans totaled $633,000 and $305,000, respectively. The total amount of interest earned on non-accrual loans was $12,000 in 2001, $10,000 in 2000, and $26,000 in 1999. The gross interest income which would have been recorded under the original terms of the non-accrual loans amounted to $66,000 in 2001, $38,000 in 2000, and $46,000 in 1999. As of December 31, 2001 and 2000, the Company had no impaired loans.
- -50-
NOTE 5 - PREMISES AND EQUIPMENT
Premises and equipment at December 31 is summarized as follows (tabular amounts in thousands):
2001 | 2000 | |
Land and buildings | $ 14,097 | $ 12,267 |
Depreciation and amortization of premises and equipment charged to operating expense totaled $650,000 in 2001, $586,000 in 2000, $576,000 in 1999.
NOTE 6 - DEPOSITS
A summary of deposits, by type, as of December 31 follows (tabular amounts in thousands):
2001 | 2000 | |
Transaction accounts | $ 139,395 | $ 126,536 |
Interest paid on certificates of deposit of $100,000 or more totaled $4,627,000 in 2001, $3,915,000 in 2000, and $3,513,000 in 1999.
At December 31, 2001 the scheduled maturities of time deposits are as follows (dollar amounts in thousands):
2002 | $ 174,075 |
NOTE 7 - FHLB ADVANCES AND SECURITIES SOLD UNDER REPURCHASE AGREEMENTS
Securities sold under repurchase agreements are summarized as follows (tabular amounts in thousands):
At and for the year ended | ||
| 2001 | 2000 |
(Continued)
-51-
NOTE 7 - SECURITIES SOLD UNDER REPURCHASE AGREEMENTS, Continued
The Bank enters into sales of securities under agreements to repurchase. These obligations to repurchase securities sold are reflected as liabilities in the consolidated balance sheets. The dollar amount of securities underlying the agreements are book entry securities maintained at the Federal Reserve Bank of Richmond. U. S. Government securities with a book value of $37,599,000 ($38,631,000 fair value) and $38,592,000 ($38,626,000 fair value) at December 31, 2001 and 2000, respectively, are used as collateral for the agreements.
The Bank has an outstanding advance with the FHLB totaling $1,485,000 and $1,650,000 at December 31, 2001 and 2000, respectively. At December 31, 2001, the advance bears interest at 7.01 percent and matures on October 18, 2010.
NOTE 8 - LINES OF CREDIT
At December 31, 2001, the Bank had unused short-term lines of credit totaling $23,000,000 to purchase Federal Funds from unrelated banks. These lines of credit are available on a one to seven day basis for general corporate purposes of the Bank. All of the lenders have reserved the right to withdraw these lines at their option.
The Bank has a demand note through the U.S. Treasury, Tax and Loan system with the Federal Reserve Bank of Richmond. The Bank may borrow up to $7,000,000 under the arrangement at an interest rate of 1.40 percent. The note is secured by U.S. Treasury Notes with a market value of $6,295,000 at December 31, 2001. The amount outstanding under the note totaled $653,000 and $1,834,000 at December 31, 2001 and 2000, respectively.
The Bank also has a line of credit from the FHLB for $76,306,000 secured by a lien on the Bank's qualifying 1-4 family mortgages and the Bank's investment in FHLB stock. Allowable terms range from overnight to 20 years at varying rates set daily by the FHLB. At December 31, 2001, $1,485,000 was outstanding under the agreement.
NOTE 9 - INCOME TAXES
The provision for income taxes is reconciled to the amount of income tax computed at the federal statutory rate on income before income taxes as follows (dollar amounts in thousands):
For the years ended December 31,
2001 | 2000 | 1999 | ||||
| Amount | % | Amount | % | Amount | % |
(Continued)
- -52-
NOTE 9 - INCOME TAXES, Continued
The sources and tax effects of temporary differences that give rise to significant portions of the deferred tax assets and deferred tax liabilities are as follows:
December 31, | ||
| 2001 | 2000 |
The net deferred tax asset (liability) is included in other assets and other liabilities at December 31, 2001 and 2000, respectively.
A portion of the change in net deferred taxes relates to the change in unrealized net gains and losses on securities available for sale. The related 2001 deferred tax expense of $891,000 and the 2000 deferred tax expense of $739,000 have been recorded directly to stockholders' equity. The balance of the change in net deferred taxes results from the current period deferred tax benefit.
The following summary of the provision for income taxes includes tax deferrals which arise from temporary differences in the recognition of certain items of revenue and expense for tax and financial reporting purposes (amounts in thousands):
For the years ended December 31,
| 2001 | 2000 | 1999 |
- -53-
NOTE 10 - FINANCIAL INSTRUMENTS WITH OFF BALANCE SHEET RISK
The Bank is a party to financial instruments with off balance sheet risk in the normal course of business to meet the financing needs of its customers. These financial instruments include commitments to extend credit and standby letters of credit. Those instruments involve, to varying degrees, elements of credit and interest rate risk in excess of the amount recognized in the accompanying consolidated balance sheets. The contract amounts of those instruments reflect the extent of involvement the Bank has in particular classes of financial instruments. The Bank uses the same credit policies in making commitments and conditional obligations as it does for on balance sheet instruments.
The contract value of the Bank's off balance sheet financial instruments is as follows as of December 31, 2001 (amounts in thousands):
| Contract |
Commitments to extend credit are agreements to lend as long as there is no violation of any condition established in the contract. Commitments generally have fixed expiration dates or other termination clauses and may require payment of a fee. Since many of the commitments are expected to expire without being drawn upon, the total commitment amounts do not necessarily represent future cash requirements. The Bank evaluates each customer's creditworthiness on a case-by-case basis. The amount of collateral obtained if deemed necessary by the Bank upon extension of credit is based on management's credit evaluation.
NOTE 11 - COMMITMENTS AND CONTINGENCIES
At December 31, 2001, the Bank was obligated under a number of non-cancelable operating leases on land used for branch offices and a computer maintenance contract that had initial or remaining terms of more than one year. Future minimum payments under these agreements at December 31, 2001 were (tabular amounts in thousands):
Payable in year ending | Amount |
Lease payments under all operating leases charged to expense totaled $25,000 in 2001, $60,000 in 2000 and $92,900 in 1999. The leases provide that the lessee pay property taxes, insurance and maintenance cost.
The Company is party to litigation and claims arising in the normal course of business. Management, after consultation with legal counsel, believes that the liabilities, if any, arising from such litigation and claims will not be material to the Company's financial position.
- -54-
NOTE 12 - RESTRICTION ON DIVIDENDS
The ability of the Company to pay cash dividends is dependent upon receiving cash in the form of dividends from the Bank. Federal banking regulations restrict the amount of dividends that can be paid and such dividends are payable only from the retained earnings of the Bank. At December 31, 2001 the Bank's retained earnings were $10,826,000.
NOTE 13 - TRANSACTIONS WITH DIRECTORS, EXECUTIVE OFFICERS AND ASSOCIATES
Directors and executive officers of the Company and the Bank and associates of such persons are customers of and had transactions with the Bank in the ordinary course of business. Additional transactions may be expected to take place in the future. Also, included in such transactions are outstanding loans and commitments, all of which were made on comparable terms, including interest rates and collateral, as those prevailing at the time for other customers of the Bank, and did not involve more than normal risk of collectibility or present other unfavorable features.
Total loans to all executive officers and directors, including immediate family and business interests, at December 31, were as follows (tabular amounts in thousands):
December 31, | ||
| 2001 | 2000 |
NOTE 14 - EMPLOYEE BENEFIT PLAN
The Bank has a defined contribution pension plan covering all employees who have attained age twenty-one and have a minimum of one year of service. Upon ongoing approval of the Board of Directors, the Bank matches one-hundred percent of employee contributions up to three percent of employee salary deferred and fifty percent of employee contributions in excess of three percent and up to five percent of salary deferred. The Board of Directors may also make discretionary contributions to the Plan. For the years ended December 31, 2001, 2000, and 1999, $426,000, $404,000 and $423,000, respectively, were charged to operations under the plan.
Supplemental benefits are provided to certain key officers under The Conway National Bank Executive Supplemental Income Plan (ESI) and the Long-Term Deferred Compensation Plan (LTDC). These plans are not qualified under the Internal Revenue Code. The plans are unfunded. However, certain benefits under the ESI Plan are informally and indirectly funded by insurance policies on the lives of the covered employees.
-55-
NOTE 15 - REGULATORY MATTERS
The Bank is subject to various regulatory capital requirements administered by the federal banking agencies. Failure to meet minimum capital requirements can initiate certain mandatory and possibly additional discretionary actions by regulators that, if undertaken, could have a direct material effect on the Bank's financial statements. Under capital adequacy guidelines and the regulatory framework for prompt corrective action, the Bank must meet specific capital guidelines that involve quantitative measures of the Bank's assets, liabilities, and certain off-balance-sheet items as calculated under regulatory accounting practices. The Bank's capital amounts and classification are also subject to qualitative judgments by the regulators about components, risk weightings, and other factors.
Quantitative measures established by regulation to ensure capital adequacy require the Bank to maintain minimum amounts and ratios (set forth in the table below) of total and Tier I capital to risk-weighted assets, and of Tier I capital to average assets. Management believes, as of December 31, 2001, that the Bank meets all capital adequacy requirements to which it is subject.
As of December 31, 2001, the most recent notification from the Office of the Comptroller of the Currency categorized the Bank as well capitalized under the regulatory framework for prompt corrective action. There are no conditions or events since that notification that management believes have changed the Bank's category. The Bank's actual capital amounts and ratios and minimum regulatory amounts and ratios are presented as follows (dollar amounts in thousands):
| | To be well capitalized | ||||
| Amount | Ratio | Amount | Ratio | Amount | Ratio |
-56-
NOTE 16 - ESTIMATED FAIR VALUE OF FINANCIAL INSTRUMENTS
The estimated fair values of the Company's financial instruments were as follows at December 31 (amounts in thousands):
2001 | 2000 | |||
| Amount | Value | Amount | Value |
NOTE 17 - PARENT COMPANY INFORMATION
Following is condensed financial information of CNB Corporation (parent company only) (amounts in thousands):
CONDENSED BALANCE SHEETS
December 31, | ||
| 2001 | 2000 |
- -57-
NOTE 17 - PARENT COMPANY INFORMATION, Continued
CONDENSED STATEMENTS OF INCOME
For the years ended December 31, | |||
| 2001 | 2000 | 1999 |
CONDENSED STATEMENTS OF CASH FLOWS
For the years ended December 31, | |||
| 2001 | 2000 | 1999 |
- -58-
NOTE 18 - QUARTERLY FINANCIAL DATA (UNAUDITED)
Unaudited condensed financial data by quarter for 2001 and 2000 is as follows (amounts, except per share data, in thousand):
Quarter ended | ||||||||||
March 31 | June 30 | September 30 | December 31 | |||||||
2001 |
|
|
|
| ||||||
Quarter ended | ||||||||||
March 31 | June 30 | September 30 | December 31 | |||||||
2000 |
| |
|
| ||||||
ITEM 9 - DISAGREEMENTS ON ACCOUNTING AND FINANCIAL DISCLOSURE
None.
-59-
PART III
ITEM 10. DIRECTORS AND EXECUTIVE OFFICERS OF THE REGISTRANT
MANAGEMENT OF THE COMPANY
Directors
The Directors and Nominees for election to the Board of Directors of the Company are as follows:
| Director | Proposed | Present | Company |
Willis J. Duncan (43) |
|
|
|
|
|
60
ITEM 10. DIRECTORS AND EXECUTIVE OFFICERS OF THE REGISTRANT
MANAGEMENT OF THE COMPANY (continued)
| Director | Proposed | Present | Company | |
Richard M. Lovelace, Jr. |
|
|
|
|
|
* Nominee for election to the Board of Directors.
61
Except as indicated below, each director or director nominee of the company has sole voting and investment power with respect to all shares of Company stock owned by such director or director nominee. Each director or director nominee resides in Conway, South Carolina with the exceptions of Harold G. Cushman, H. Buck Cutts, and Paul R. Dusenbury who reside in Myrtle Beach, Surfside Beach, and Aynor, respectively, which are within Horry County, South Carolina. The address of each director or director nominee is c/o The Conway National Bank, Post Office Drawer 320, 1400 Third Avenue, Conway, South Carolina 29528. All Directors and officers of the Company and its subsidiary, The Conway National Bank, as a group (42 persons), own 147,813 (20.6%) shares of Company stock.
(1) Includes 12,632 shares held by Harriette B. Duncan (wife).
(2) Includes 1,665 shares held by Robin F. Duncan (wife); 3,632 shares held by Ann Louise Duncan (daughter); 3,632 shares held by Mary Kathryn Duncan (daughter); 3,632 shares by Willis Jennings Duncan, V (son); and 3,632 shares by Margaret Brunson Duncan (daughter).
(3) Includes 4,826 shares held by Janet J. Barnette (wife).
(4) Includes 21,000 shares held by the Cushman Family Limited partnership; 488 shares held by Dianne C. Cushman (wife); 657 shares held by Frances Faison Cushman (daughter); 657 shares held by Harold G. Cushman, III (son); 639 shares held by Harold G. Cushman, IV (grandson); and 638 shares held by Kara Dawn Cushman (granddaughter).
(5) Includes 1,293 shares held by Brenda M. Cutts (wife); 1,172 shares held by Claire Cutts Abbot (daughter); and 1,172 shares held by Emeline E. Cutts (daughter).
(6) Includes 208 shares held by Jennifer S. Dusenbury (wife); 65 shares held by Elena Cox Dusenbury (daughter); and 65 shares held by Sarah Cherry Dusenbury (daughter).
(7) Includes 988 shares held by George Heyward Goldfinch (son); 350 shares held by Merilyn Goldfinch Cain (daughter); and 250 shares held by Cynthia Goldfinch Turner (daughter).
(8) Includes 400 shares held by Willie Ann Hucks (wife); 30 shares held by Mariah J. Hucks (daughter); 74 shares held by Norah Leigh Hucks (daughter); and 224 shares held by Robert P. Hucks, II (son).
(9) Includes 434 shares held by Rebecca S. Lovelace (wife); 518 shares held by Richard Blake Lovelace (son); and 423 shares held by Macon B. Lovelace (son).
(10) Includes 1,586 shares held by Bertha T. Massey (wife).
Each director or director nominee of the Company has been engaged in his principal occupation of employment as specified above for five (5) years or more unless otherwise indicated.
W. Jennings Duncan is Willis J. Duncan's son. No other family relationships exist among the above named directors or officers of the Company. No director owns 25% or more of a publicly traded company. None of the directors of the Company holds a directorship in any company with a class of securities registered under Section 12 of the Securities Exchange Act of 1934, as amended, or subject to the requirements of Section 15(d) of that act or in any company registered as an investment company under the Investment Company Act of 1940, as amended.
62
The Board of Directors of the Company, as originally constituted, was classified into three (3) classes with each class consisting of five (5) directors. Five (5) directors in Class II will be elected at the 2002 Annual Meeting to serve for a three (3) year term. Directors in Class III will be elected at the 2003 Annual Meeting to serve for a three (3) year term and Directors in Class I will be elected at the 2004 Annual Meeting to serve for a three (3) year term. Currently, there are ten (10) Directors, with four (4) directors in Class II. The Board of Directors has passed a resolution increasing the total number of Directors from ten (10) to eleven (11).
The Board of Directors of the Company serves as the Board of Directors of its subsidiary, The Conway National Bank. The Company's Board of Directors meets as is necessary and the Bank's Board of Directors meets on a monthly basis.
The Board of Directors of the Bank has an Executive Committee that meets when necessary between scheduled meetings of the Board of Directors. The Executive Committee recommends to the Board of Directors the appointment of officers; determines officer compensation subject to Board approval; reviews employee salaries; considers any director nominee submitted by the shareholders; and addresses any other business as is necessary which does not come under the authority of other committees on the Board of Directors. The Executive Committee will consider any nominee to the Board of Directors submitted by the shareholders, provided shareholders intending to nominate director candidates for election deliver written notice thereof to the Secretary of the Company not later than (i) with respect to at election to be held at an Annual Meeting of shareholders, ninety (90) days prior to the anniversary date of the immediately preceding Annual Meeting of shareholders, and (ii) with respect to an election to be held at a special meeting of shareholders, the close of business on the tenth (10th) day following the date on which notice of such meeting is first given to shareholders. The Bylaws further provide that the notice shall set forth certain information concerning such shareholder and his nominee(s), including their names and addresses, a representation that the shareholder is entitled to vote at such meeting and intends to appear in person or by proxy at the meeting to nominate the person or persons specified in the notice, a description of all arrangements or understandings between the shareholder and each nominee, such other information as would be required to be included in a proxy statement soliciting proxies for the election of the nominees of such shareholder and the consent of each nominee to serve as Director of the Company if so elected. The Chairman of the meeting may refuse to acknowledge the nomination of any person not made in compliance with the foregoing procedures . The members of the Executive Committee are Harold G. Cushman, Jr., Willis J. Duncan, and W. Jennings Duncan.
In addition, the Board of Directors of the Bank has Audit, Loan, Public Relations, and Building Committees. The members of the Audit Committee are James W. Barnette, Jr., John K. Massey, and Howard B. Smith, III. The members of the Loan Committee are Harold G. Cushman, Jr., Willis J. Duncan, W. Jennings Duncan, Paul R. Dusenbury, G. Heyward Goldfinch, Robert P. Hucks, and Richard M. Lovelace, Jr. The members of the Public Relations Committee are James W. Barnette, Jr., G. Heyward Goldfinch, and John K. Massey. The members of the Building Committee are James W. Barnette, Jr., Harold G. Cushman, Jr., Willis J. Duncan, W. Jennings Duncan, and Robert P. Hucks. Willis J. Duncan, Chairman of the Board, and W. Jennings Duncan, President, are ex officio members of each of these committees of the Board with the exception of the Audit Committee.
The Audit Committee acts pursuant to a written charter adopted by the Board of Directors. A copy of the charter is attached to the May 8, 2001 Proxy Statement as Appendix A. Each member of the Audit Committee is independent as defined in the National Association of Securities Dealers listing standards.
63
The function of the Loan Committee is to review and ratify new loans and monitor the performance and quality of existing loans, as well as to ensure that sound policies and procedures exist in the Bank's lending operations.
During 2001, the Company's Board of Directors met three (3) times; the Bank's Board of Directors met twelve (12) times; the Executive Committee met nine (9) times; the Audit Committee met nine (9) times; the Loan Committee met twelve (12) times; the Building Committee met two (2) times; and the Public Relations Committee did not meet. Each Director attended at least 75% of the aggregate of (a) the total number of meetings of the Board of Directors held during the period for which he served as Director and (b) the total number of meetings held by all committees of the Board of Directors of which he served.
Executive Officers:
The Executive Officers and other officers of the Company are as follows:
Position(s) Currently
Name Age With The Company
Willis J. Duncan 74 Chairman of the Board (1)
W. Jennings Duncan 46 President and Director (1)
Robert P. Hucks 56 Executive Vice President and
Director (1)
Paul R. Dusenbury 43 Treasurer and Director (1)
(Chief Financial Officer and
Chief Accounting Officer)
Virginia B. Hucks 52 Secretary
_________________
(1) Executive Officer
All executive officers and other officers serve at the pleasure of the Board of Directors of the Company. Each executive officer and other officer of the Company has been employed by the Company and/or the Bank for five (5) years.
64
ITEM 11. COMPENSATION OF DIRECTORS AND EXECUTIVE OFFICERS
The Company pays no remuneration to its Directors and Executive Officers. All remuneration for services rendered are paid by the Company's subsidiary, The Conway National Bank, Conway, South Carolina ("the Bank").
Compensation Committee Report
The Executive Committee of the Bank recommends to the Board of Directors the appointment of officers; determines officer compensation subject to Board approval; and reviews employee salaries. The compensation of the President (Chief Executive Officer) and the other executive officers is not tied directly to corporate performance or any measure thereof. However, it would be deemed unacceptable by the Executive Committee, Board, and management to establish compensation levels that are not consistent with the performance of the Bank or return to shareholders. During the compensation decision process, much emphasis is placed on the Job Evaluation Salary Administration Program (JESAP) Committee. The "JESAP" Committee is charged with the responsibility of establishing job position descriptions; applying values to each job position in the form of a salary range; and obtaining salary surveys of a local, regional, and national level to determine that salary ranges are cons istent with the industry and peers. The "JESAP" committee utilizes an independent management consulting firm to aid in this process. For each Bank employee, including the President (Chief Executive Officer) and all executive officers, a salary minimum, midpoint, and maximum is established. For fiscal 2001, all executive officer salary levels were below the midpoint as established by the JESAP process.
Summary Compensation Table
Annual Compensation Long-Term Compensation
Awards Payouts
|
|
|
| Other | Restricted | Stock | Long-Term | All Other (2) |
|
|
|
|
|
|
|
|
|
(1) Cash value of personal use of automobile furnished by the Bank or automobile travel allowance.
(2) Cash contributions made by the Bank to the Bank's contributory profit-sharing and savings defined contribution plan.
65
COMPENSATION OF DIRECTORS AND EXECUTIVE OFFICERS (continued)
PENSION PLAN DISCLOSURE
The Bank has a defined contribution pension plan covering all employees who have attained age twenty-one and have a minimum one year of service. Upon ongoing approval of the Board of Directors, the Bank matches one hundred percent of employee contributions up to three percent of employee contributions of salary deferred and fifty percent of employee contributions in excess of three percent and up to five percent of salary deferred. For the years ended December 31, 2001, 2000, and 1999, $426,000, $404,000, and $423,000, respectively, was charged to operations under the plan.
The Board of Directors of the Bank provides supplemental benefits to certain key officers, under The Conway National Bank Executive Supplemental Income (ESI) Plan and a Long-Term Deferred Compensation (LTDC) Plan. A copy of said plans was filed as Exhibit 10(a) and 10(b) with an amended Form 10-K Annual Report dated June 10, 2002.These plans are not qualified under the Internal Revenue Code. These plans are unfunded, however, certain benefits under the ESI Plan are informally and indirectly funded by insurance policies on the lives of the covered employees. Under the provisions of the ESI Plan, the Bank and the participating employees will execute agreements providing each employee (or his beneficiary, if applicable) with a pre-retirement death benefit and a post-retirement annuity benefit. The ESI Plan is designed to provide participating employees with a pre-retirement benefit based on a percentage of the employee's current compensation. The ESI agreement's post-retirement benefit is designed to supplement a participating employee's retirement benefits from Social Security in order to provide the employee with a certain percentage of his final average income at retirement age. Upon normal retirement age, Willis J. Duncan, W. Jennings Duncan, Robert P. Hucks, and Paul R. Dusenbury are eligible to receive fifteen annual payments of $9,650, $37,178, $30,827, and $28,379, respectively. While the employee is receiving benefits under the ESI Agreement, the agreement will prohibit the employee from competing with the Bank and will require the participating employee to be available for consulting work for the Bank. The ESI Agreement may be amended or revoked at any time prior to the participating employee's death or retirement, but only with the mutual written consent of the covered employee and the Bank. The ESI Agreements require that the participating employee be employed at the Bank at the earlier of death or retirement to be eligible to receive, or have his beneficiary receive, benefits under the agreement. Under the LTDC Plan, certain key employees and the Board of Directors may defer a portion of their compensation for their retirement and purchase units which are equivalent in value to one share of the Company's stock at market value. The number of units shall be equitably adjusted and restated to reflect changes in the number of common shares outstanding resulting from stock splits, stock dividends, stock issuances, and stock redemptions. The number of units also shall be equitably adjusted and restated to reflect cash dividends paid to Company common shareholders. The employee or Director receives appreciation, if any, in the market value of the unit as compared to the initial value per unit.
66
COMPENSATION OF DIRECTORS AND EXECUTIVE OFFICERS (continued)
Performance Graphs
COMPARISON OF FIVE-YEAR CUMULATIVE TOTAL RETURN
AMONG CNB CORPORATION, INDEPENDENT BANK INDEX, AND NASDAQ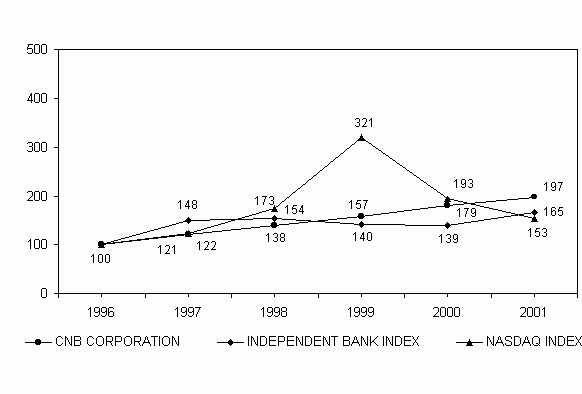
ASSUMES $100 INVESTED ON DECEMBER 31, 1996 IN EACH OF CNB CORPORATION STOCK,
INDEPENDENT BANK INDEX, AND NASDAQ INDEX WITH REINVESTMENT OF DIVIDENDS
COMPARISON OF RETURN ON AVERAGE ASSETS (ROA)
AMONG THE BANK, ALL SOUTH CAROLINA BANKS, AND SOUTH CAROLINA S&L's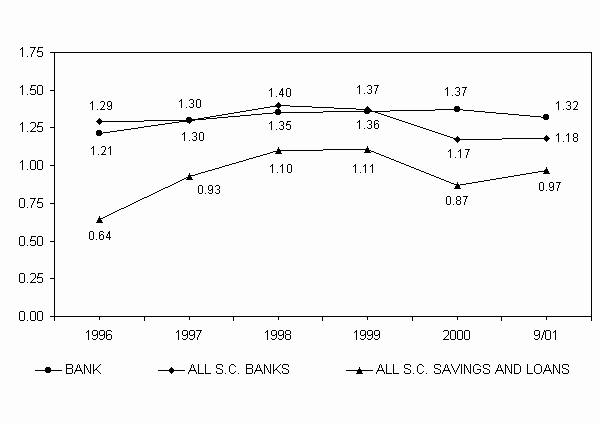
BASED ON DECEMBER 31 DATA WITH THE EXCEPTION OF THE SEPTEMBER 30,2001 DATA
DUE TO THE UNAVAILABILITY OF DECEMBER 31, 2001 DATA
67
COMPENSATION OF DIRECTORS AND EXECUTIVE OFFICERS (continued)
Compensation Committee Interlocks and Insider Participation in Compensation Decisions
No Compensation Committee interlocks exist. The members of the Executive Committee of the Board, which serves as the Compensation Committee, are Harold G. Cushman, Jr. (outside Director), Willis J. Duncan (Chairman of the Board and inside Director), and W. Jennings Duncan (President and inside Director). Membership of the "JESAP" Committee consists of seven Bank officers.
Director Compensation
Directors who are not Bank officers received $500 for each monthly meeting of the Board of Directors and an additional $150 for each committee meeting attended in 2001. Committee meeting compensation has been increased to $200 in 2002.
COMPLIANCE WITH SECTION 16(a) OF THE EXCHANGE ACT
Section 16(a) of the Securities Exchange Act of 1934 requires the Company's directors and executive officers and persons who own more than ten percent of a registered class of the Company's equity securities to file reports of ownership on Form 3 and changes in ownership on Form 4 or 5 with the Securities and Exchange Commission (the "SEC") and the National Association of Securities Dealers. Such officers, directors, and 10 percent shareholders are also required by SEC rules to furnish the Company with copies of all Section 16(a) forms that they file.
Based solely on its review of copies of such reports received or written representations from certain reporting persons, the Company believes that during the fiscal year ended December 31, 2001, all Section 16(a) filing requirements applicable to its officers, directors, and 10 percent shareholders were complied with.
68
ITEM 12. SECURITY OWNERSHIP OF MANAGEMENT
The following table sets forth as of December 31, 2001, certain information regarding the ownership of Company Stock of all officers and directors of the Company. No shareholder is known to the management of the Company to be the beneficial owner of more than five (5%) percent of the Company Stock. The Company Stock is the Company's only class of voting securities.
Name and Address Amount and Nature of Percent
of Beneficial Owner Beneficial Ownership(1) of Class
All Officers and Directors as a Group
(42 persons) (2) 147,813 20.6%
_________________
(1) For a description of the amount and nature of ownership of the directors of the Company, see "Management of the Company -Directors".
(2) Includes 31 officers of the subsidiary, The Conway National Bank, who are not officers of the Company.
ITEM 13. CERTAIN TRANSACTIONS
Directors, principal shareholders, and Executive Officers of the Company and the Bank are customers of and had transactions with the Bank in the ordinary course of business. Included in such transactions are outstanding loans and commitments, all of which were made on comparable terms, including interest rates and collateral as those prevailing at the time for other customers of the Bank, and did not involve more than normal risk of collectibility or present other unfavorable features.
69
PART IV
ITEM 14. EXHIBITS, FINANCIAL STATEMENT SCHEDULES AND
REPORTS ON FORM 8-K
(a) The following exhibits, financial statements and financial
statement schedules are filed as part of this report:
FINANCIAL STATEMENTS
Report of Independent Public Accountants
Consolidated Statements of Condition - December 31, 2001 and 2000
Consolidated Statements of Income - Years ended December 31, 2001,
2000, and 1999
Consolidated Statements of Changes in Stockholders' Equity - Years
ended December 31, 2001, 2000, and 1999
Consolidated Statements of Comprehensive Income - Years ended December 31,
2001, 2000, and 1999.
Consolidated Statements of Cash Flows - Years Ended December 31,
2001, 2000, and 1999
Notes to Consolidated Financial Statements
FINANCIAL STATEMENT SCHEDULES
All financial statement schedules have been omitted from this Annual Report because the required information is presented in the financial statements or in the notes thereto or the required subject matter is not applicable.
EXHIBITS
See Exhibit Index appearing below.
Reports on Form 8-K - No reports on Form 8-K were filed during the last quarter of the period covered by this report.
EXHIBIT INDEX
Exhibit
Number
3 Articles of Incorporation - A copy of the Articles of
Incorporation of the Company is incorporated herein
by reference to Exhibit 3(a) which was filed with a
Form 8-A dated June 24, 1998
By-laws of the Company - A copy of the By-laws of the
Company is incorporated herein by reference to Exhibit
3(b) which was filed with a Form 10-Q Quarterly
Report dated June 30, 1997.
10 Executive Supplemental Income Plan - A copy of the Executive
Supplemental Income Plan is filed herewith as Exhibit 10(a).
Long Term Deferred Compensation Plan entitled "Phantom Stock Plan" - A
copy of the Long Term Deferred Compensation Plan is filed herewith as
Exhibit 10(b).
22 Subsidiaries of the Registrant - A copy of the subsidiaries
of the registrant is incorporated herein by reference to Exhibit 22
which was filed with a Form 10-K Annual Report dated March 28, 1986.
All other exhibits, the filing of which are required with this Form,
are not applicable.
70
SIGNATURES
Pursuant to the requirements of Section 13 or 15(d) of the Securities Exchange Act of 1934, the registrant has duly caused this report to be signed on its behalf by the undersigned, thereunto duly authorized.
CNB Corporation
W. Jennings Duncan, President
Pursuant to the requirements of the Securities Exchange Act of 1934, this report has been signed below by the following persons on behalf of the registrant and in their capacities on March 13, 2002.
Signature Capacity
S/Willis J. Duncan
Willis J. Duncan Chairman of the Board
S/W. Jennings Duncan
W. Jennings Duncan President and Director
S/Robert P. Hucks
Robert P. Hucks Executive Vice President and
Director
S/Paul R. Dusenbury
Paul R. Dusenbury Treasurer and Director
(Chief Financial Officer
and Chief Accounting Officer)
S/Virginia B. Hucks
Virginia B. Hucks Secretary
S/James W. Barnette, Jr.
James W. Barnette, Jr. Director
S/Harold G. Cushman, Jr.
Harold G. Cushman, Jr. Director
S/G. Heyward Goldfinch
G. Heyward Goldfinch Director
S/Richard M. Lovelace, Jr.
Richard M. Lovelace, Jr. Director
S/John K. Massey
John K. Massey Director
S/Howard B. Smith, III
Howard B. Smith, III Director
71