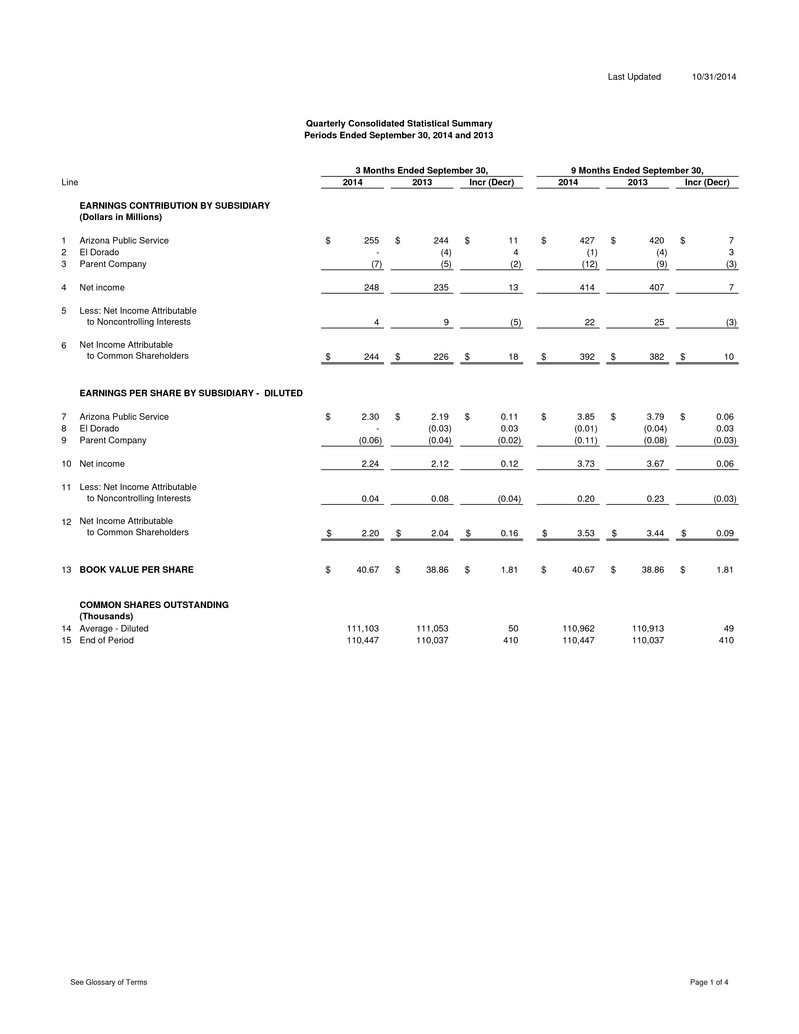
Last Updated 10/31/2014 Line 2014 2013 Incr (Decr) 2014 2013 Incr (Decr) EARNINGS CONTRIBUTION BY SUBSIDIARY (Dollars in Millions) 1 Arizona Public Service 255$ 244$ 11$ 427$ 420$ 7$ 2 El Dorado - (4) 4 (1) (4) 3 3 Parent Company (7) (5) (2) (12) (9) (3) 4 Net income 248 235 13 414 407 7 5 Less: Net Income Attributable to Noncontrolling Interests 4 9 (5) 22 25 (3) 6 Net Income Attributable to Common Shareholders 244$ 226$ 18$ 392$ 382$ 10$ EARNINGS PER SHARE BY SUBSIDIARY - DILUTED 7 Arizona Public Service 2.30$ 2.19$ 0.11$ 3.85$ 3.79$ 0.06$ 8 El Dorado - (0.03) 0.03 (0.01) (0.04) 0.03 9 Parent Company (0.06) (0.04) (0.02) (0.11) (0.08) (0.03) 10 Net income 2.24 2.12 0.12 3.73 3.67 0.06 11 Less: Net Income Attributable to Noncontrolling Interests 0.04 0.08 (0.04) 0.20 0.23 (0.03) 12 Net Income Attributable to Common Shareholders 2.20$ 2.04$ 0.16$ 3.53$ 3.44$ 0.09$ 13 BOOK VALUE PER SHARE 40.67$ 38.86$ 1.81$ 40.67$ 38.86$ 1.81$ COMMON SHARES OUTSTANDING (Thousands) 14 Average - Diluted 111,103 111,053 50 110,962 110,913 49 15 End of Period 110,447 110,037 410 110,447 110,037 410 Quarterly Consolidated Statistical Summary Periods Ended September 30, 2014 and 2013 3 Months Ended September 30, 9 Months Ended September 30, See Glossary of Terms Page 1 of 4

Last Updated 10/31/2014 Line 2014 2013 Incr (Decr) 2014 2013 Incr (Decr) ELECTRIC OPERATING REVENUES (Dollars in Millions) Retail 16 Residential 619$ 626$ (7)$ 1,329$ 1,377$ (48)$ 17 Business 460 457 3 1,205 1,205 - 18 Total retail 1,079 1,083 (4) 2,534 2,582 (48) Wholesale revenue on delivered electricity 19 Traditional contracts 16 18 (2) 40 44 (4) 20 Off-system sales 61 28 33 140 68 72 21 Native load hedge liquidation - 4 (4) - 8 (8) 22 Total wholesale 77 50 27 180 120 60 23 Transmission for others 7 10 (3) 23 25 (2) 24 Other miscellaneous services 9 9 - 26 25 1 25 Total electric operating revenues 1,172$ 1,152$ 20$ 2,763$ 2,752$ 11$ ELECTRIC SALES (GWH) Retail sales 26 Residential 4,665 4,752 (87) 10,252 10,826 (574) 27 Business 4,234 4,239 (5) 11,260 11,387 (127) 28 Total retail 8,899 8,991 (92) 21,512 22,213 (701) Wholesale electricity delivered 29 Traditional contracts 186 242 (56) 560 585 (25) 30 Off-system sales 1,552 927 625 2,844 2,281 563 31 Retail load hedge management - 85 (85) - 200 (200) 32 Total wholesale 1,738 1,254 484 3,404 3,066 338 33 Total electric sales 10,637 10,245 392 24,916 25,279 (363) Quarterly Consolidated Statistical Summary Periods Ended September 30, 2014 and 2013 3 Months Ended September 30, 9 Months Ended September 30, Pinnacle West Capital Corporation See Glossary of Terms Page 2 of 4

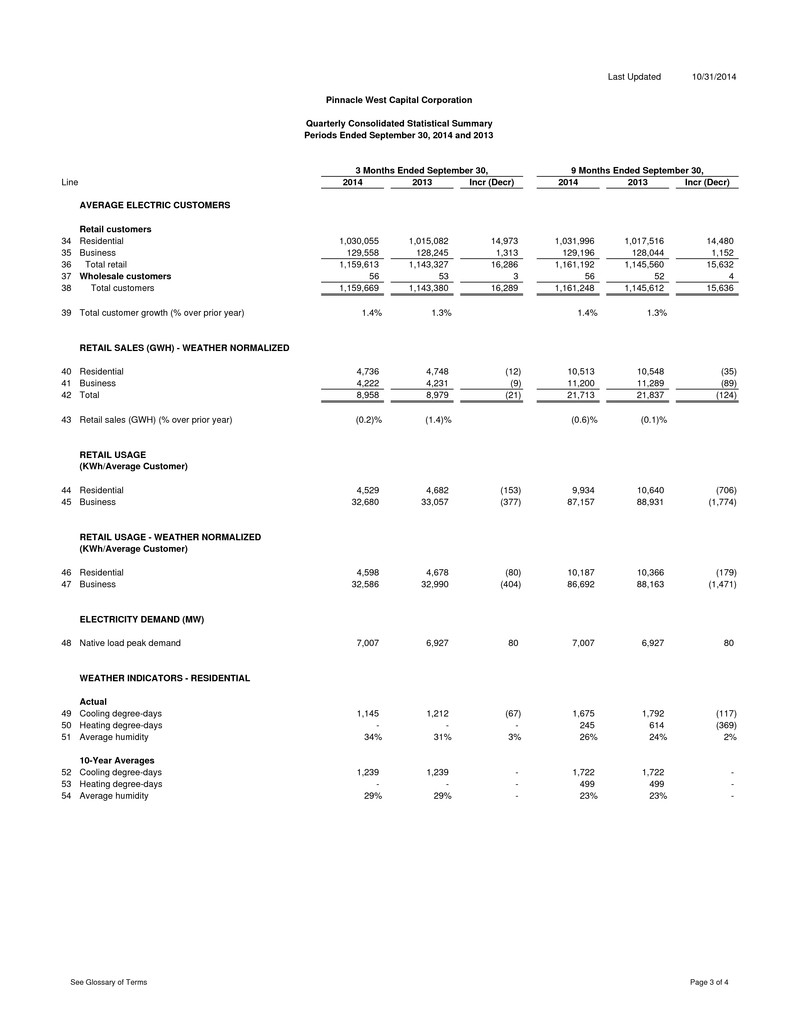
Last Updated 10/31/2014 Line 2014 2013 Incr (Decr) 2014 2013 Incr (Decr) AVERAGE ELECTRIC CUSTOMERS Retail customers 34 Residential 1,030,055 1,015,082 14,973 1,031,996 1,017,516 14,480 35 Business 129,558 128,245 1,313 129,196 128,044 1,152 36 Total retail 1,159,613 1,143,327 16,286 1,161,192 1,145,560 15,632 37 Wholesale customers 56 53 3 56 52 4 38 Total customers 1,159,669 1,143,380 16,289 1,161,248 1,145,612 15,636 39 Total customer growth (% over prior year) 1.4% 1.3% 1.4% 1.3% RETAIL SALES (GWH) - WEATHER NORMALIZED 40 Residential 4,736 4,748 (12) 10,513 10,548 (35) 41 Business 4,222 4,231 (9) 11,200 11,289 (89) 42 Total 8,958 8,979 (21) 21,713 21,837 (124) 43 Retail sales (GWH) (% over prior year) (0.2)% (1.4)% (0.6)% (0.1)% RETAIL USAGE (KWh/Average Customer) 44 Residential 4,529 4,682 (153) 9,934 10,640 (706) 45 Business 32,680 33,057 (377) 87,157 88,931 (1,774) RETAIL USAGE - WEATHER NORMALIZED (KWh/Average Customer) 46 Residential 4,598 4,678 (80) 10,187 10,366 (179) 47 Business 32,586 32,990 (404) 86,692 88,163 (1,471) ELECTRICITY DEMAND (MW) 48 Native load peak demand 7,007 6,927 80 7,007 6,927 80 WEATHER INDICATORS - RESIDENTIAL Actual 49 Cooling degree-days 1,145 1,212 (67) 1,675 1,792 (117) 50 Heating degree-days - - - 245 614 (369) 51 Average humidity 34% 31% 3% 26% 24% 2% 10-Year Averages 52 Cooling degree-days 1,239 1,239 - 1,722 1,722 - 53 Heating degree-days - - - 499 499 - 54 Average humidity 29% 29% - 23% 23% - Quarterly Consolidated Statistical Summary Pinnacle West Capital Corporation Periods Ended September 30, 2014 and 2013 3 Months Ended September 30, 9 Months Ended September 30, See Glossary of Terms Page 3 of 4

Last Updated 10/31/2014 Line 2014 2013 Incr (Decr) 2014 2013 Incr (Decr) ENERGY SOURCES (GWH) Generation production 55 Nuclear 2,523 2,522 1 7,232 7,223 9 56 Coal 3,450 2,759 691 8,985 8,416 569 57 Gas, oil and other 2,253 2,310 (57) 4,713 4,820 (107) 58 Total generation production 8,226 7,591 635 20,930 20,459 471 Purchased power 59 Firm load 2,717 2,969 (252) 5,601 5,564 37 60 Marketing and trading 140 180 (40) 351 408 (57) 61 Total purchased power 2,857 3,149 (292) 5,952 5,973 (21) 62 Total energy sources 11,083 10,740 343 26,882 26,432 450 POWER PLANT PERFORMANCE Capacity Factors 63 Nuclear 100% 100% 0% 96% 96% 0% 64 Coal 81% 71% 10% 71% 73% (2)% 65 Gas, oil and other 30% 32% (2)% 21% 22% (1)% 66 System average 58% 56% 2% 49% 49% 0% ECONOMIC INDICATORS Building Permits (a) 67 Metro Phoenix 3,962 3,460 502 14,387 11,446 2,941 Arizona Job Growth (b) 68 Payroll job growth (% over prior year) 2.2% 2.2% 0.0% 1.9% 2.2% (0.3)% 69 Unemployment rate (%, seasonally adjusted) 7.0% 8.1% (1.1)% 7.1% 8.0% (0.9)% Sources: (a) U.S. Census Bureau (b) Arizona Department of Economic Security 3 Months Ended September 30, 9 Months Ended September 30, Pinnacle West Capital Corporation Quarterly Consolidated Statistical Summary Periods Ended September 30, 2014 and 2013 See Glossary of Terms Page 4 of 4


