Exhibit 99.1
| DELIVERING SUPERIOR SHAREHOLDER VALUE Pinnacle West Analyst Day November 9, 2012 |
| FORWARD-LOOKING STATEMENTS This presentation contains forward-looking statements based on current expectations, including statements regarding our earnings guidance and financial outlook and goals. These forward-looking statements are often identified by words such as “estimate,” “predict,” “may,” “believe,” “plan,” “expect,” “require,” “intend,” “assume” and similar words. Because actual results may differ materially from expectations, we caution you not to place undue reliance on these statements. A number of factors could cause future results to differ materially from historical results, or from outcomes currently expected or sought by Pinnacle West or APS. These factors include, but are not limited to: our ability to manage capital expenditures and operations and maintenance costs while maintaining reliability and customer service levels; variations in demand for electricity, including those due to weather, the general economy, customer and sales growth (or decline), and the effects of energy conservation measures and distributed generation; power plant and transmission system performance and outages; volatile fuel and purchased power costs; fuel and water supply availability; our ability to achieve timely and adequate rate recovery of our costs, including returns on debt and equity capital; regulatory and judicial decisions, developments and proceedings; new legislation or regulation, including those relating to environmental requirements and nuclear plant operations; our ability to meet renewable energy and energy efficiency mandates and recover related costs; risks inherent in the operation of nuclear facilities, including spent fuel disposal uncertainty; competition in retail and wholesale power markets; the duration and severity of the economic decline in Arizona and current real estate market conditions; the cost of debt and equity capital and the ability to access capital markets when required; changes to our credit ratings; the investment performance of the assets of our nuclear decommissioning trust, pension, and other postretirement benefit plans and the resulting impact on future funding requirements; the liquidity of wholesale power markets and the use of derivative contracts in our business; potential shortfalls in insurance coverage; new accounting requirements or new interpretations of existing requirements; generation, transmission and distribution facility and system conditions and operating costs; the ability to meet the anticipated future need for additional baseload generation and associated transmission facilities in our region; the willingness or ability of our counterparties, power plant participants and power plant land owners to meet contractual or other obligations or extend the rights for continued power plant operations; technological developments affecting the electric industry; and restrictions on dividends or other provisions in our credit agreements and Arizona Corporation Commission orders. These and other factors are discussed in Risk Factors described in Part I, Item 1A of the Pinnacle West/APS Annual Report on Form 10-K for the fiscal year ended December 31, 2011, which you should review carefully before placing any reliance on our financial statements, disclosures or earnings outlook. Neither Pinnacle West nor APS assumes any obligation to update these statements, even if our internal estimates change, except as required by law. 2 |
| NON-GAAP FINANCIAL MEASURES In this presentation, we refer to “on-going earnings per share,” which is a “non-GAAP financial measure,” as defined in accordance with SEC rules. We believe on-going earnings per share provides investors with a useful indicator of our results that is comparable among periods because it excludes the effects of unusual items that may occur on an irregular basis. The appendix contains a reconciliation of on-going earnings per share to our earnings per share attributable to common shareholders based on diluted common shares as reported on our Consolidated Statements of Income, which is the most directly comparable financial measures calculated and presented in accordance with generally accepted accounting principles in the United States of America (GAAP). Investors should note that non-GAAP financial measures may involve judgments by management, including whether an item is classified as an unusual item. These measures are key components of our internal financial reporting and are used by our management in analyzing the operations of our business. We believe that investors benefit from having access to the same financial measures that management uses. 3 |

| DELIVERING SUPERIOR SHAREHOLDER VALUE STRATEGIC OVERVIEW Don Brandt |

| 2 NYSE Ticker PNW Market Cap $6 Billion Enterprise Value $9 Billion Yield 4% Principal Subsidiary • Arizona’s largest electric utility • $13 billion assets Service Territory • 1.1 million customer accounts • 34,646 square miles Customer Growth • 2.0% average annual growth expected 2012-2015 • 3-4% historical average — well above industry average 2012 Peak Demand – 7,212 MW CONTINENTAL UNITED STATES STATE OF ARIZONA PINNACLE WEST: WHO WE ARE We are a vertically integrated, regulated electric utility. |

| ARIZONA CORPORATION COMMISSIONERS *Term limited 3 Bob Stump (R)* Brenda Burns (R) Gary Pierce (R)* Chairman Terms Through 2015 Terms Through 2017 Susan Bitter-Smith (R) Bob Burns (R) Incumbents New Commissioners Three seats for four-year terms through January 2017 were addressed in the November 2012 election. |
| SUPERIOR SHAREHOLDER RETURNS Our total return to shareholders has outperformed our industry and the broad market over the past five years. Pinnacle West S&P 500 S&P 1500 Electric Utilities 1 Year 2 Years 3 Years 5 Years Periods Ended December 31, 2011 4 |
| DELIVERING SUPERIOR SHAREHOLDER VALUE OPERATIONS OVERVIEW Mark Schiavoni |

| OPERATIONS OVERVIEW AGENDA Safety Top decile in the industry Resource Planning Meeting growing energy needs through a balanced resource mix Energy Innovation Strategically piloting and implementing advanced technologies Energy Delivery Making transmission investments to maintain reliability and deliver diverse resources Top quartile reliability in industry over past several years Fossil Fleet Consistently strong summer reliability and performance Actively working to meet environmental regulations Internationally Recognized Environmental, Sustainability and Governance Leader Fossil Fleet – ISO 14001 environmental certification achieved Intelligent Utility Magazine’s #4 Most Intelligent Utility in 2011 Planning and operational execution position APS for success. 2 |

| SAFETY = #1 CRITICAL AREA OF FOCUS APS continues to build and maintain a safety-first culture that strives for “zero incidents.” 3 OSHA Recordable Incidents Historical 2012 Target 2013 Target Top Decile Accident Injury Rate 2007 – 3Q2012 |
| RESOURCE PLANNING FOR RELIABILITY AND SUSTAINABILITY Existing Owned Resources Includes retirement of Four Corners 1-3 Existing Contracts Four Corners 4-5 Resource Planning Requirement Load Requirement Including Reserves We will meet future load growth through a balanced resource mix including renewable resources and energy efficiency programs. Projected 3% Four Corners Transactions, Net 21% Future Energy Efficiency 24% Future Renewable Resources 52% Future Natural Gas Generation MW 4 2011 Generation Capacity Mix Gas & Oil Coal Nuclear Solar Additional Resources by 2027 |
| RESOURCE PLANNING FOR RELIABILITY AND SUSTAINABILITY APS has multiple resources options to serve future energy growth. 5 Plans to meet near-term needs include renewable energy and energy efficiency additions Options for future resource decisions Intermediate term: renewable energy and natural gas tradeoffs drive resource decisions Long term: natural gas is the most prevalent fuel source with renewable energy the most viable alternative to mitigate natural gas volatility and provide resource diversification New technology, both traditional and advanced (e.g. battery storage), will continue to be monitored to meet load growth |

| RENEWABLE ENERGY RISES WITH THE SUN We are helping Arizona become the “Solar Capital of the World.” Germany and Japan are among countries with highest installed solar capacity, yet have solar conditions far inferior to Arizona Arizona 6 |
| APS AZ SUN PROGRAM PROVIDES EARNINGS GROWTH POTENTIAL Up to 200 MW utility-scale photovoltaic solar plants owned by APS Up to $975 million capital investment In service 2011 through 2015 Constructive rate recovery through RES until included in base rates Commitments to date: 118 MW $504 million capital investment 50 MW in commercial operation to date Planning and procurement under way for additional projects Owning solar resources makes sense for our customers and the environment and provides returns to shareholders. 7 Projects to Date Capacity Actual or Target COD Paloma 17 MW Sept. 2011 Cotton Center 17 MW Oct. 2011 Hyder 16 MW Feb. 2012 Chino Valley 19 MW Dec. 2012 Foothills – Phase 1 17 MW 1Q 2013 Foothills – Phase 2 18 MW 4Q 2013 Hyder II 14 MW 4Q 2013 |
| SOLANA 8 250 MW 30-year PPA for all output (~900 GWh/year) Concentrating solar trough facility 70 miles southwest of Phoenix On target for 2013 commercial operation 90%+ on-peak capacity factor with use of thermal storage capability Expected to be first major U.S. solar trough plant with thermal energy storage Near existing transmission lines To be built, owned and operated by Abengoa Solar Solana will provide more than one-quarter of APS’s renewable energy target by 2015. |
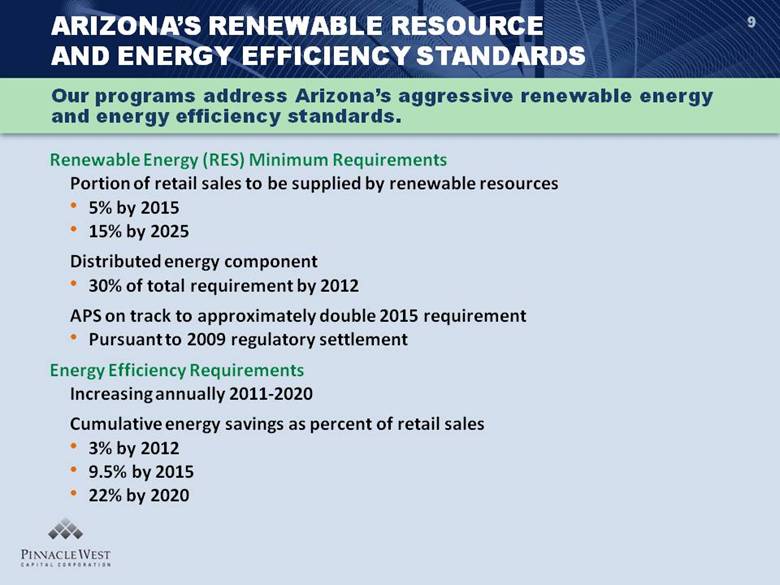
| Renewable Energy (RES) Minimum Requirements Portion of retail sales to be supplied by renewable resources 5% by 2015 15% by 2025 Distributed energy component 30% of total requirement by 2012 APS on track to approximately double 2015 requirement Pursuant to 2009 regulatory settlement Energy Efficiency Requirements Increasing annually 2011-2020 Cumulative energy savings as percent of retail sales 3% by 2012 9.5% by 2015 22% by 2020 Our programs address Arizona’s aggressive renewable energy and energy efficiency standards. 9 ARIZONA’S RENEWABLE RESOURCE AND ENERGY EFFICIENCY STANDARDS |
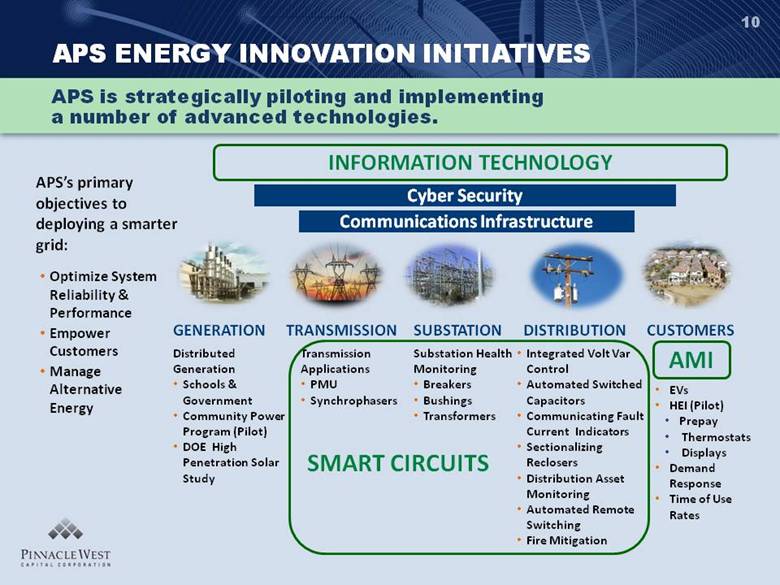
| APS ENERGY INNOVATION INITIATIVES 10 APS is strategically piloting and implementing a number of advanced technologies. AMI GENERATION TRANSMISSION SUBSTATION DISTRIBUTION CUSTOMERS Communications Infrastructure Cyber Security Substation Health Monitoring Breakers Bushings Transformers Integrated Volt Var Control Automated Switched Capacitors Communicating Fault Current Indicators Sectionalizing Reclosers Distribution Asset Monitoring Automated Remote Switching Fire Mitigation Distributed Generation Schools & Government Community Power Program (Pilot) DOE High Penetration Solar Study Transmission Applications PMU Synchrophasers EVs HEI (Pilot) Prepay Thermostats Displays Demand Response Time of Use Rates Optimize System Reliability & Performance Empower Customers Manage Alternative Energy APS’s primary objectives to deploying a smarter grid: SMART CIRCUITS INFORMATION TECHNOLOGY |
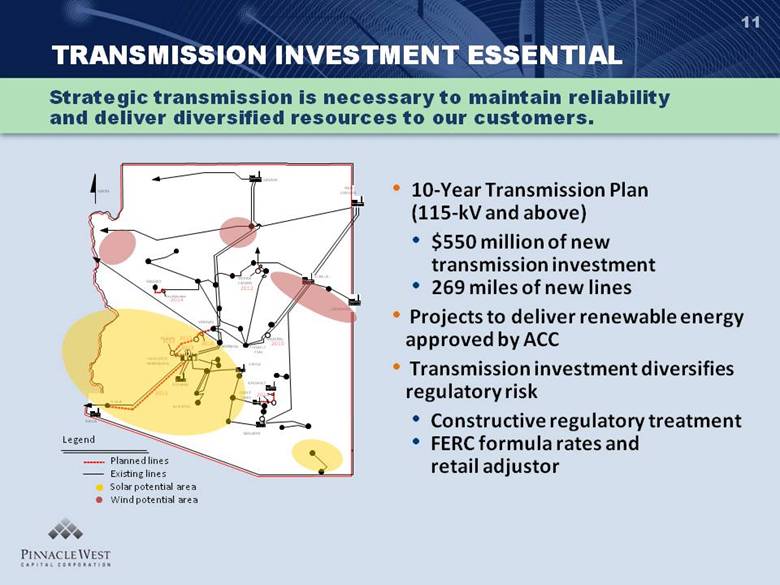
| TRANSMISSION INVESTMENT ESSENTIAL 10-Year Transmission Plan (115-kV and above) $550 million of new transmission investment 269 miles of new lines Projects to deliver renewable energy approved by ACC Transmission investment diversifies regulatory risk Constructive regulatory treatment FERC formula rates and retail adjustor Strategic transmission is necessary to maintain reliability and deliver diversified resources to our customers. Legend NORTH SAGUARO N.GILA PALO VERDE - HASSAYAMPA YUCCA GILA BEND REDHAWK KYRENE WESTWING BAGDAD 2016 PINNACLE PEAK CHOLLA NAVAJO 2015 CORONADO YOUNGS CANYON 2012 SUNDANCE 2014 FOUR CORNERS DESERT BASIN Line Relocation 2014 Planned lines Existing lines Solar potential area Wind potential area 2013 DELANEY 2013 MAZATZAL 2015 MORGAN 2015 11 |
| ENERGY DELIVERY PERFORMANCE Comprehensive maintenance and inspection program includes: EEI Edison Award winning TOAN, state-of-the-art, on-line transformer diagnostics system Extensive circuit breaker maintenance program Award-winning vegetation management program Direct buried cable replacement program Annual patrol of transmission and distribution lines Wide use of predictive, condition assessment technologies Top-quartile reliability is reducing the frequency of customer outages. 12 Average number of customer interruptions/year System Average Interruption Frequency Index (SAIFI) |
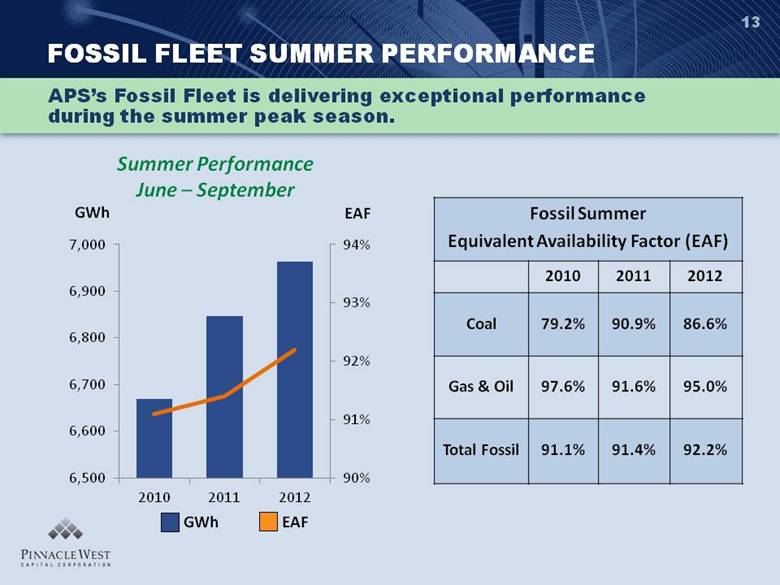
| FOSSIL FLEET SUMMER PERFORMANCE APS’s Fossil Fleet is delivering exceptional performance during the summer peak season. 13 Summer Performance June – September EAF Fossil Summer Equivalent Availability Factor (EAF) 2010 2011 2012 Coal 79.2% 90.9% 86.6% Gas & Oil 97.6% 91.6% 95.0% Total Fossil 91.1% 91.4% 92.2% GWh EAF |
| ENVIRONMENTAL UPDATE Mercury and Air Toxics Standards (MATS) EPA program to control mercury and other air pollutants Regional Haze EPA program to reduce visibility impact of SO2 and NOx Cooling Water Intake Structure (316b) EPA program to protect fish and other aquatic organisms Coal Combustion Residue (CCR) EPA program to regulate the management and disposal of coal ash APS is actively pursuing options to comply with environmental regulations. 14 |
| ENVIRONMENTAL, SUSTAINABILITY AND GOVERNANCE LEADERSHIP 15 We are recognized internationally for our achievements. Top 10 Utility Solar Ranking Highest Ranked Utility 15th Overall Best practices in utility arboriculture since 1997 U.S. DOE/EPA Sustained Excellence since 2008 Partner of the Year since 2005 Ranked on Dow Jones Sustainability Index since 2005 Rated 4th Highest Intelligent Utility in 2011 1st utility in world to endorse Ceres’ Code of Conduct in 1994 Ranked 6 of 196 energy and utility companies 2012 - Top 10 North American Utility in Smart Grid Deployment Environmental Certification Gas/Oil Fleet – 2011 Coal Fleet - 2012 |
| Operations Overview Appendix |
| 17 Fuel / Plant Location Units Dispatch Commercial Ops. Date Ownership Interest1 Net Capacity (MW) Nuclear Palo Verde Wintersburg, AZ 1-3 Base 1986 - 1989 29.1% 1,146 Total Nuclear 1,146 Coal Cholla Joseph City, AZ 1-3 Base 1962 - 1980 100 647 Four Corners Farmington, NM 1-3 Base 1963 - 1964 100 560 Four Corners Farmington, NM 4,5 Base 1969 - 1970 15 231 Navajo Page, AZ 1-3 Base 1974 - 1976 14 315 Total Coal 1,753 Gas/Oil - Combined Cycle Redhawk Arlington, AZ 1,2 Intermediate 2002 100 984 West Phoenix Phoenix, AZ 1-5 Intermediate 1976 - 2003 100 887 Total Gas/Oil - Combined Cycle 1,871 Gas/Oil - Steam Turbines Ocotillo Tempe, AZ 1,2 Peaking 1960 100 220 Saguaro Red Rock, AZ 1,2 Peaking 1954 - 1955 100 210 Total Gas/Oil - Steam Turbines 430 Gas/Oil – Combustion Turbines Sundance Casa Grande, AZ 10 Peaking 2002 100 420 Yucca Yuma, AZ 6 Peaking 1971 - 2008 100 243 Saguaro Red Rock, AZ 1-3 Peaking 1972 - 2002 100 189 West Phoenix Phoenix, AZ 1,2 Peaking 1972 - 1973 100 110 Ocotillo Tempe, AZ 1,2 Peaking 1972 - 1973 100 110 Douglas Douglas, AZ 1 Peaking 1972 100 16 Total Gas/Oil - Combustion Turbines 1,088 Solar Total Solar Total Generation Capacity 6,343 As of February 24, 2012 1Includes leased generating plants. 5 Paloma Cotton Center Hyder Various Gila Bend, AZ Gila Bend, AZ Hyder, AZ Multiple Arizona Facilities - - - - As Available As Available As Available As Available 2011 2011 2011 - 2012 1996 - 2006 100 100 100 100 16 17 17 55 A WELL-BALANCED GENERATION PORTFOLIO |
| 18 Fuel / Contract Location Owner/ Developer Status 1 PPA Signed Commercial Operation Date Term (years) Capacity Net (MW) Solar Solana Gila Bend, AZ Abengoa UC Feb-2008 2013 30 250 Ajo Ajo, AZ Duke Energy Gen Svcs IO Jan-2010 2011 25 5 Prescott Prescott, AZ SunEdison IO Feb-2010 2011 30 10 Solar 1 Tonopah, AZ Not Disclosed UC Jan-2011 2012 30 15 Total Solar 310 Wind Aragonne Mesa Santa Rosa, NM Infigen Asset Mgmt IO Dec-2005 2006 20 90 High Lonesome Mountainair, NM Foresight / EME IO Feb-2008 2009 30 100 Perrin Ranch Wind Williams, AZ NextEra Energy IO Jul-2010 2011 25 99 Total Wind 289 Geothermal CE Turbo Imperial County, CA Cal Energy IO Jan-2006 2006 23 10 Total Geothermal 10 Biomass Snowflake Snowflake, AZ Najafi IO Sep-2005 2008 15 14 Total Biomass 14 Biogas Glendale Energy Glendale, AZ Glendale Energy LLC IO Jul-2008 2010 20 3 Landfill 1 Surprise, AZ Waste Management IO Dec-2010 2012 20 3 Total Biogas 6 Total Renewable Contracted Capacity 629 Solar 2 Solar 3 Tonopah, AZ Not Disclosed Jan-2012 2013 30 15 Maricopa County, AZ Not Disclosed Jan-2012 2013 30 15 UD UD RENEWABLE PURCHASE POWER CONTRACTS As of August 31, 2012 1 IO = In Operation; UC = Under Construction; UD = Under Development |
| 19 FOUR CORNERS POWER PLANT FACTS & FIGURES Common Unit 1 Unit 2 Unit 3 Unit 4 Unit 5 Commercial Operation Date 1963 1963 1964 1969 1970 Original Cost ($M) $41 $382 $164 Net Book Value at 6/30/12 ($M) $27 $0 $130 Current Depreciation Ends 2038 Mid-2012 2038 2038 Current Expiration Dates Site Lease July 6, 2041 BHP Coal Agreement July 6, 2016 Certain Related Rights-of-Way July 6, 2041 Total Employees (549) 48 Common (75% Native Americans) + 75 Matrix 193 233 Capacity (MW) 170 170 220 770 770 Ownership Percentages Arizona Public Service 100% 100% 100% 15% 15% Southern California Edison - - - 48% 48% Public Service Company of New Mexico - - - 13% 13% Salt River Project - - - 10% 10% El Paso Electric - - - 7% 7% Tucson Electric Power - - - 7% 7% Heat Rate (Btu/kWh) 10,816 11,051 10,614 9,443 10,035 |
| PALO VERDE OVERVIEW Randy Edington DELIVERING SUPERIOR SHAREHOLDER VALUE |
| PALO VERDE OVERVIEW AGENDA Business plan/objectives Performance trends Major capital improvements Fukushima follow-up Operating license extensions 2 |
| PALO VERDE MISSION We SAFELY and efficiently generate electricity for the long term. 3 |
| PALO VERDE MISSION We SAFELY and efficiently generate electricity for the long term. 4 |
| PALO VERDE MISSION We SAFELY and efficiently generate electricity for the long term.5 |
| PALO VERDE BUSINESS PLAN Our business plan guides all of our operations and initiatives. 6 |
| PALO VERDE GOALS BY 2013/2014 We target top-quartile cost per megawatt-hour by 2014. Safety TISAR top quartile No NRC Reactor Oversight Process issues: No greater than GREEN findings No cross-cutting issues Industry metrics Cost Less than $20 per MWh (2 cents per kWh) Generation Greater than or equal to 92% capacity factor Refueling outages less than or equal to 30 days 7 |

| PALO VERDE BUSINESS AND STRATEGIC PLANS 8 |
| Headquarters Palo Verde (Arizona) Callaway (Missouri) Comanche Peak (Texas) Diablo Canyon (California) San Onofre (California) South Texas (Texas) Wolf Creek (Kansas) KS CA AZ TX MO STARS ALLIANCE We team with other nuclear plants to create efficiencies and purchasing power. 9 |
| PALO VERDE NET GENERATION 10 Palo Verde has exceeded 30 million megawatt-hours annual production seven times – the only U.S. plant to ever do so. Million Megawatt Hours Projected |
| TOTAL INDUSTRIAL ACCIDENT RATE Palo Verde’s safety metrics compare favorably with industry norms and are improving. 11 |
| U.S. NUCLEAR OPERATING COSTS Projected Palo Verde operating costs are below industry averages and improving. Dollars per Megawatt-Hour 12 |
| PALO VERDE MAJOR CAPITAL PROJECTS Major capital projects completed in past 10 years Steam generator replacements Reactor vessel head replacements New rapid refueling packages Main transformers Main generator rotors Circulating water system tie-in for future cooling towers Energy Education Center Cooling tower replacement update 13 Completed capital projects position Palo Verde well for safe, efficient operations for the long term. |
| PALO VERDE MAJOR CAPITAL PROJECTS Steam generators Installed 2003-2007 Reactor vessel heads Installed 2009-2010 14 |
| Rapid refueling packages Installed 2009-2010 Increased efficiency and safety Reduced future outage durations Before After PALO VERDE MAJOR CAPITAL PROJECTS 15 |
| Main transformers 2008 to 2018 Main generator rotors Most recent outage Circulating water system tie-in for potential future cooling towers 2009-2010 PALO VERDE MAJOR CAPITAL PROJECTS 16 |
| Energy Education Center Public education Response coordination in state-of-the-art Emergency Operations Facility Joint Information Center PALO VERDE MAJOR CAPITAL PROJECTS 17 |
| Fukushima Event Response Team Room 18 FUKUSHIMA FOLLOW-UP |
| Low risk of natural events at Palo Verde Seismic and flooding walk-downs conducted Changes in NRC regulations and industry standards FUKUSHIMA FOLLOW-UP 19 |
| FLEX / Beyond Design Bases Event Mitigation Enhanced Procedures and Emergency Plans Significant Investment in Safety 20 FUKUSHIMA FOLLOW-UP |

| PALO VERDE ECONOMIC IMPACT Largest single commercial taxpayer in Arizona Nearly $50 million in property taxes annually Local purchases of materials and services Palo Verde employees donate approximately $1 million annually to local charities Approximately 2,800 employees Amounts represent total Palo Verde project. Source: Applied Economics, Palo Verde Economic Study, May 2010 Palo Verde is estimated to favorably impact Arizona by $1.8 billion each year. 21 |
| 2045 2046 2047 2065 2066 2067 PALO VERDE LICENSE RENEWAL We SAFELY and efficiently generate electricity for the long term. 2025 2026 2027 22 |
| REGULATORY OVERVIEW Jeff Guldner DELIVERING SUPERIOR SHAREHOLDER VALUE |
| REGULATORY OVERVIEW AGENDA Regulatory Landscape Regulatory Strategic Framework Goals and Initiatives FERC Developments Conclusions 2 |
| OUR REGULATORY MIX 3 $6.9 Billion Total Approved Rate Base Most Recent Rate Decisions ACC FERC Rate Effective Dates 7/1/2012 6/1/2012 Test Year Ended 12/31/2010* 12/31/2011 Rate Base $5.7 B $1.2 B Equity Layer 54% 55% Allowed ROE 10.00% 10.75% The bulk of APS’s revenues comes from a regulated retail rate base and a meaningful transmission business. *Adjusted to include post test-year plant in service through March 31, 2012 Generation & Distribution (83%) Transmission (17%) |
| CONSTRUCTIVE REGULATORY ENVIRONMENT Enables creative solutions towards a common goal: healthy utility that will help Arizona’s sustainable energy future. 4 |
| IMPROVING OUR REGULATORY ENVIRONMENT: HISTORICAL PERSPECTIVE 5 We have reduced our rate case cycle length significantly while achieving increasingly constructive outcomes. 2008 2009 2011 2010 2012 2007 2006 2005 2004 2003-05 Case 18 Months 2005-07 Case 20 Months 2008-09 Case 22 Months 2011-12 Case 12 Months Prolonged Proceedings Financial Results |
| CURRENT REGULATORY FRAMEWORK 6 Progress Themes Traditional themes are trending towards sustained constructive outcomes. |
| BEYOND A HISTORICAL TEST YEAR Retail rate mechanisms mitigate strict historical test-year framework. Current Arizona Retail Rate Structure Traditional Historical Test Year Rates based on finances experienced during 12 months preceding rate application preparation, adjusted only for known and measurable changes Post-Test Year Plant in Rate Base Fifteen months or more past test year Adjustors that Recover Revenue Requirements AZ Sun Environmental costs Cost Deferrals Property taxes Four Corners acquisition costs Enhanced Fixed Cost Recovery Lost Fixed Cost Recovery Mechanism Rate design changes for commercial customers 7 |
| FERC OVERVIEW Ratemaking Formula rates updated annually Retail transmission cost adjuster Policy Development Transmission returns on equity FERC Order 1000 compliance Non-RTO performance metrics We have achieved constructive transmission rate treatment and actively engage in key policy matters. 8 |
| REGULATORY INITIATIVES Begin recovery of Four Corners acquisition by end of 2013 Target next retail rate decision by mid-2016 Continue active engagement of stakeholders in integrated resource planning process to meet long-term customer needs for reliable, cost effective power Continue active engagement with regional FERC Order 1000 compliance team to achieve structure that supports customer and shareholder needs We have a near-term business plan that supports the Company’s overall objectives 9 |
| CUSTOMER SATISFACTION: A KEY PRIORITY 10 Strong customer service supports constructive regulatory outcomes. 2012 J.D. Power Residential Customer Survey Outstanding Residential Customer Satisfaction Rating APS Industry Average Rating |
| 11 An intentional structure of on-going financial support buttresses a four-year stay-out. Rate Rider for Four Corners Acquisition Costs Lost Fixed Cost Recovery Mechanism Property Tax Deferrals Elimination of 90/10 Sharing in Fuel Adjustor Forward-Looking Improvements to Environmental Surcharge 4 Year Stay-Out Provision (2012-2016) 2012 REGULATORY SETTLEMENT POSITIONED APS WELL THROUGH 2016 |
| CONCLUSIONS Positive regulatory developments Constructive on-going relationships Address future of continuing change We remain focused on achieving supportive regulatory structures and productive cost recovery process and timing. 12 |
| Regulatory Overview Appendix |

| 2012 RETAIL RATE CASE SETTLEMENT KEY BENEFITS 14 Shareholder Benefits Regulatory certainty Base rate stay-out until at least mid-2016 Rate gradualism through adjustment mechanisms Financial support APS needs to achieve Arizona’s energy goals 10% allowed return on equity Customer Benefits Rate certainty No base rate change until at least mid-2016 Rate gradualism through adjustment mechanisms Support for renewable energy and energy efficiency Mutual Benefits Encourages progress toward sustainable energy future Continuation of constructive regulatory framework established in 2009 settlement Collaboration and cooperation among APS, ACC and numerous stakeholders The settlement contains a number of benefits for shareholders and customers. |
| 2012 RETAIL RATE CASE SETTLEMENT KEY FINANCIAL PROVISIONS – BASE RATES & TIMING 15 The provisions of the settlement became effective July 1, 2012, as originally requested by APS. Annual Revenue Change Annualized Base Rate Revenue Changes ($ millions) Non-fuel base rate increase $ 116.3 Fuel-related base rate decrease (153.1) Revenues related to AZ Sun and other solar projects to be transferred from Renewable Energy Surcharge to base rates 36.8 Net base rate change $ -0- |
| 2012 RETAIL RATE CASE SETTLEMENT KEY PROVISIONS – OTHER THAN BASE RATES 16 Post test-year plant additions – 15 months’ additions included in rate base Constructive new or modified adjustment mechanisms Lost Fixed Cost Recovery (LFCR) rate mechanism to address ratemaking effects of energy efficiency and distributed renewable energy Power Supply Adjustor (PSA) – 100% pass-through Transmission Cost Adjustor (TCA) – streamlined for future rate changes Environmental Improvement Surcharge (EIS) – recovery of certain carrying costs for government-mandated environmental capital expenditures Four Corners transaction – procedure to allow APS to request related rate adjustments, if transaction consummated Property tax expense deferrals for future tax rate changes Current PSA credit on customer bills to continue until February 1, 2013, rather than reset when base rates change effective July 1, 2012 Next general rate case may be filed on or after May 31, 2015 for rates to become effective on or after July 1, 2016 (4-year stay-out) Other key provisions continue constructive regulatory treatment and limit regulatory lag. |
| 2012 RETAIL RATE CASE SETTLEMENT KEY FINANCIAL ASSUMPTIONS 17 Rate base $5.7 billion Allowed return on equity 10% Capital structure Long-term debt 46.1% Common equity 53.9% Base fuel rate (¢/kWh) 3.21¢ Projected fuel-price year for base fuel rate 2012 Test year ended December 31, 2010 adjusted for post-test year plant additions Updated rate base, cost of capital and fuel prices underpin the settlement amounts. |
| DELIVERING SUPERIOR SHAREHOLDER VALUE FINANCIAL OVERVIEW Jim Hatfield |

| FINANCIAL OVERVIEW AGENDA 2 Third quarter earnings Financial objectives 2012 – 2015 outlook Capital expenditures O&M cost management initiatives Earnings guidance and dividend outlook Debt and liquidity profile Value proposition |
| 3 Per Share Net Income On-Going Earnings Per Share CONSOLIDATED EPS COMPARISONS 3rd Quarter 2012 versus 3rd Quarter 2011 See non-GAAP reconciliation in appendix $3.00 $2.50 $2.00 $1.50 $1.00 $0.50 $0.00 $3.00 $2.50 $2.00 $1.50 $1.00 $0.20 $0.00 $2.21 $2.32 2012 2011 $2.21 $2.24 2012 2011 |
| 4 * Excludes costs, and offsetting operating revenues, associated with renewable energy (net of AZ Sun), energy efficiency and similar regulatory program. See non-GAAP reconciliation for gross margin in appendix. Higher gross margin* $0.16 Lower infrastructure-related costs $0.04 Higher O&M* $(0.10) Net Decrease $(0.03) = Other, net $(0.04) Lower prior-year effective tax rate $(0.09) ON-GOING EPS VARIANCES 3rd Quarter 2012 versus 3rd Quarter 2011 |

| 5 Net Increase $0.16 = Lower retail kWh sales $(0.02) Retail transmission revenue increase $0.09 2012 regulatory settlement $0.21 Weather effects $(0.17) Other, net $0.05 GROSS MARGIN EPS DRIVERS 3rd Quarter 2012 versus 3rd Quarter 2011 See non-GAAP reconciliation in appendix |
| LONG-TERM FINANCIAL OBJECTIVES 6 Deliver strong consistent total return Capitalize on dynamic service territory growth Emphasize capital and O&M budgeting disciplines Maintain solid investment-grade credit ratings Improve financial strength and agility Our long-term goal is to provide continued superior returns to our shareholders. |
| POSITIVE LONG-TERM DEMOGRAPHICS 7 Superior Growth APS’s customer growth generally outpaces U.S. and Arizona population growth. Annual Growth 1990 1995 2000 2005 2010 2016 Projected APS Customer Growth Arizona Population Growth US Population Growth 2.6%* Millions APS Customer Growth *Compound Annual Growth Rate |
| POSITIVE NEAR-TERM TRENDS 8 Non-Farm Job Growth Year-Over- Year Change YTD Metro Phoenix Vacant Housing APS Service Territory YTD Arizona’s economy is reflecting more sustained growth and activity. |
| Metro Phoenix home foreclosure sales are the lowest since 2007. FORECLOSURE HEADWINDS WINDING DOWN Existing Single Family Home Sales 9 Key Trends Existing home sales activity remains robust Investor interest peaked in Q1 2012 20% of market Q1 < 15% in Q3 Lender-owned sales down 70% in Q3 2012 vs 2011 190,000 homes have been sold through foreclosure since 2007 Normal |
| Metro Phoenix new home construction beginning to see benefits from lower vacancies and higher prices in existing housing. NEW HOME MARKET BREATHING AGAIN New Home Sales & Single Family Permits 10 Key Trends After three very weak sales years, Metro Phoenix new home construction is turning up Q3 2012 new home sales at highest level in two years Single family permits up 40% over prior year Total housing permits up 20% Increasing demand reflects declining value gap with existing homes |
| POSITIVE NEAR-TERM TRENDS 11 Housing and non-residential sectors are showing steady improvement. Value Relative to Jan ‘05 Home Prices Nonresidential Building Vacancy Vacancy Rate Office Retail YTD YTD |
| Investment is required throughout the business to meet expected demand growth. LONG-TERM GROWTH DRIVES CAP EX APS Capital Expenditures by Function $ Millions Projected Other Distribution Transmission Renewables Environmental Traditional Generation 12 |
| SOLID CAPITAL RECOVERY AND STRONG RATE BASE GROWTH $ Billions Year-End Projected APS Rate Base Growth 6% Compound Annual Growth Rate ACC FERC 13 Other Capital Expenditures Recovered through Rate Adjustors Covered by Depreciation Cash Flow $ Millions APS Capital Expenditures by Recovery Mechanism Projected We expect our rate base will grow 6% per year on average, and we have constructive recovery of capital expenditures. |
| 14 RATE ADJUSTORS COMPLEMENT BASE RATE INCREASES Regulatory structure provides support for gross margin growth throughout base rate stay-out period. Base Rate Increase 2012 2013 2014 2015 55% 45% — — — 55% 45% — X X X X X X X X X X X X — — X X Transmission Cost Adjustor AZ Sun Lost Fixed Cost Recovery Environmental Improvement Surcharge Four Corners |
| Our goal is to keep O&M growth in line with retail sales growth. STRONG COST MANAGEMENT FOCUS Excludes RES and demand-side management costs. 2011 also excludes $28 million related to prior-period transmission rights-of-way settlement. APS O&M Expense Trends $ Millions 15 |
| Continued success requires a more rigorous, standardized approach to running the business. SUSTAINABLE COST MANAGEMENT INITIATIVE (“SCMI”) 16 Recognize combined challenges Costs Capital Sales growth Stayout Improve organizational efficiencies Strengthen governance and clarify accountability Refine understanding of cost structure to better identify opportunities Motivation Sustainable Changes Tiered Metrics Business Planning Corporate Resources Operating Model (“CROM”) Centralize Financial Planning and Analysis Centralize Information Technology Enterprise Process Improvement |
| Our strategies and financial performance are producing earnings growth. CONSOLIDATED FINANCIAL OUTLOOK On-Going EPS Guidance as of November 9, 2012 See key factors and assumptions in appendix $2.99 $3.35 – $3.50 17 $3.45 – $3.60 Outlook Through 2015 6% rate base growth,* but regulatory recovery not perfect Adjustment mechanisms provide substantial recovery during stay-out, but incomplete Limited sales growth EPS expected to grow somewhat below rate base growth * Compound annual growth rate |
| Our financial results facilitate growing cash returns to our shareholders. CONSOLIDATED FINANCIAL OUTLOOK Dividend Growth Goal 18 Indicated Annual Dividend Rate at Year-End * Increase effective 4th quarter 2012 Annual Dividend Growth Approx. 4%** Projected ** As of November 9, 2012 Future dividends subject to declaration at Board of Directors’ discretion |
| Our goal is to consistently earn a competitive return on average common equity. CONSOLIDATED FINANCIAL OUTLOOK Consolidated Earned ROE Goal* Projected 8.8% At Least 9.5% Per Year 19 * As of November 9, 2012 |
| SUPERIOR SHAREHOLDER RETURNS Our total return to shareholders has outperformed our industry and the broad market over the past five years. Pinnacle West S&P 500 S&P 1500 Electric Utilities 1 Year 2 Years 3 Years 5 Years Periods Ended December 31, 2011 20 |
| READY ACCESS TO CAPITAL Strong access to capital resources is supported by solid credit ratings, manageable debt maturities and ample liquidity. 2012 Major Financing Activities $375M APS senior notes refinancing* Remarketing of $32MM Maricopa 2009B tax-exempts – VRDN mode with L/C * Remarketing of $38.15MM Navajo 2009A tax-exempts – 2-year put mode* $90M redemption of Maricopa 2002A tax-exempts* APS potential new debt issuance *Completed 21 APS Long-Term Debt Maturities Projected $ Millions |
| SOLID CREDIT RATINGS We are disclosing these ratings to enhance understanding of our sources of liquidity and the effects of our ratings on our costs of funds. APS Parent Corporate Credit Ratings Moody’s Baa1 Baa2 S&P BBB BBB Fitch BBB BBB Senior Unsecured Moody’s Baa1 - S&P BBB - Fitch BBB+ - Outlook Moody’s Stable Stable S&P Positive Positive Fitch Stable Stable 22 Available liquidity remains substantial and our credit ratings have improved. Credit Facilities and Liquidity* Borrower Capacity ($ Millions) Maturities APS $ 500 Feb. ’15 APS 500 Nov. ’16 PNW 200 Nov. ‘16 Consolidated 1,200 Cash 79 Total Liquidity $1,279 *As of September 30, 2012 |
| PINNACLE WEST: OUR VALUE PROPOSITION Our commitment to investors... Delivering Superior Shareholder Returns 23 |
| Financial Overview Appendix |

| 2012 ON-GOING EPS GUIDANCE Electricity gross margin* (operating revenues, net of fuel and purchased power expenses) about $2.13 billion to $2.18 billion Retail customer growth about 1% Weather-normalized retail electricity sales volume slightly below prior year taking into account effects of customer conservation and energy efficiency and distributed renewable generation initiatives Actual weather for first 9 months of year and normal weather patterns for remainder of year Operating expenses* (operations and maintenance, depreciation and amortization and taxes other than income taxes) about $1.32 billion to $1.35 billion (which was previously $1.33 billion to $1.36 billion) Interest expense, net of allowances for borrowed and equity funds used during construction, about $180 million to $190 million Net income attributable to noncontrolling interests about $30 million to $35 million Effective tax rate about 35% Key Factors and Assumptions as of November 9, 2012 * Excludes O&M of $127 million, and offsetting operating revenues, associated with renewable energy and energy efficiency programs 25 |
| 2013 ON-GOING EPS GUIDANCE Electricity gross margin* (operating revenues, net of fuel and purchased power expenses) about $2.20 billion to $2.25 billion Retail customer growth about 1.5% Weather-normalized retail electricity sales volume about flat to prior year taking into account effects of customer conservation and energy efficiency and distributed renewable generation initiatives Normal weather patterns Operating expenses* (operations and maintenance, depreciation and amortization and taxes other than income taxes) about $1.36 billion to $1.39 billion Interest expense, net of allowances for borrowed and equity funds used during construction, about $190 million to $200 million Net income attributable to noncontrolling interests about $30 million to $35 million Effective tax rate about 35% Key Factors and Assumptions as of November 9, 2012 * Excludes O&M of $132 million, and offsetting operating revenues, associated with renewable energy and energy efficiency programs 26 |
| 2012 – 2015 FINANCIAL OUTLOOK 2012 retail rate settlement effective July 1, 2012 Revenue provisions Retail base rate changes effective July 1, 2012 Adjustment mechanisms Four Corners acquisition AZ Sun additions to flow through RES until next base rate case Lost Fixed Cost Recovery (LFCR) mechanism assumed to offset 30-40% of revenues lost due to ACC-mandated energy efficiency and distributed renewable generation initiatives Environmental Improvement Surcharge (EIS) assumed to recover up to $5 million annually of carrying costs for government-mandated environmental capital expenditures Cost mitigation provisions Power Supply Adjustor (PSA) – 100% pass-through Potential property tax deferrals – assume 60% of property tax increases relate to tax rates, therefore, will be eligible for deferrals Deferral rates: 25% in 2012; 50% in 2013; 75% in 2014 and thereafter (continued) Key Drivers and Assumptions as of November 9, 2012 27 |
| 2012 – 2015 FINANCIAL OUTLOOK Key Drivers and Assumptions as of November 9, 2012 (continued) Modestly improving Arizona and U.S. economic conditions; specifically, no major disruptions to the on-going national economic recovery [resulting from political action or inaction] Retail customer growth to average 2% annually Weather-normalized retail electricity sales volume growth: Relatively flat after customer conservation and energy efficiency and distributed renewable generation initiatives Average 2.5% annually before customer conservation and energy efficiency and distributed renewable generation initiatives Rate base growth to average 6% annually AZ Sun Program – additional 150 MW placed into service in 2012-2015 Transmission rate increases (FERC formula rates and retail adjustor) Four Corners cost deferrals between dates acquired and included in retail rates Company-wide operating and capital cost management Financing to maintain balanced capital structure and support credit ratings Interest rates Normal weather (except actual for first 9 months of 2012) 28 |
| NON-GAAP EPS RECONCILIATION Consolidated On-Going EPS Guidance *As of November 9, 2012 29 Year 2011 Actual Year 2012 Guidance* Year 2013 Guidance* Net income attributable to common shareholders $ 3.09 Less income (loss) from discontinued operations: Real estate Energy services business (0.01) 0.11 On-going EPS $ 2.99 $ 3.35 - $ 3.50 $ 3.45 - $ 3.60 |
| S&P CREDIT METRICS APS FFO / Debt FFO / Interest Debt / Capitalization Pinnacle West FFO / Debt FFO / Interest Debt / Capitalization Our key credit metrics have been improving. 2007 2008 2009 2010 2011 17.2% 22.1% 22.8% 22.3% 20.8% 4.1x 5.1x 4.8x 4.6x 4.6x 55.2% 57.4% 56.8% 53.0% 53.0% 15.7% 18.0% 18.4% 22.5% 20.3% 3.7x 4.3x 4.0x 4.6x 4.5x 57.0% 59.4% 59.8% 55.1% 54.5% 30 Source: S&P Credit Stats |
| NON-GAAP EPS RECONCILIATION 3rd Quarter 2012 vs. 3rd Quarter 2011 31 3rd Qtr 3rd Qtr 2012 2011 Change EPS as reported 2.21 $ 2.32 $ (0.11) $ Less income from discontinued operations - (0.08) 0.08 On-going EPS 2.21 $ 2.24 $ (0.03) $ |
| NON-GAAP MEASURE RECONCILIATION 3rd Quarter 2012 vs. 3rd Quarter 2011 Gross Margin 32 Three Months Ended September 30, EPS Change $ millions pretax, except per share amounts 2012 2011 Operating revenues* $1,110 $1,125 Fuel and purchased power expenses* (303) (338) Gross margin 807 787 $0.11 Less: Renewable energy (excluding AZ Sun), energy efficiency and similar regulatory programs (35) (44) 0.05 Gross margin - adjusted $772 $743 $0.16 * Line items from Consolidated Statements of Income. |