UNITED STATES
SECURITIES AND EXCHANGE COMMISSION
Washington, D.C. 20549
FORM N-CSR
CERTIFIED SHAREHOLDER REPORT OF REGISTERED
MANAGEMENT INVESTMENT COMPANIES
Investment Company Act file number 811-04254
Legg Mason Partners Income Trust
(Exact name of registrant as specified in charter)
620 Eighth Avenue, 47th Floor, New York, NY 10018
(Address of principal executive offices) (Zip code)
Marc A. De Oliveira
Franklin Templeton
100 First Stamford Place
Stamford, CT 06902
(Name and address of agent for service)
Registrant’s telephone number, including area code: 877-6LM-FUND/656-3863
Date of fiscal year end: July 31
Date of reporting period: January 31, 2024
| ITEM 1. | REPORT TO STOCKHOLDERS. |
The Semi-Annual Report to Stockholders is filed herewith.

| | |
| Semi-Annual Report | | January 31, 2024 |
WESTERN ASSET
MUNICIPAL HIGH INCOME FUND
The Securities and Exchange Commission has adopted new regulations that will result in changes to the design and delivery of annual and semi-annual shareholder reports beginning in July 2024.
If you have previously elected to receive shareholder reports electronically, you will continue to do so and need not take any action.
Otherwise, paper copies of the Fund’s shareholder reports will be mailed to you beginning in July 2024. If you would like to receive shareholder reports and other communications from the Fund electronically instead of by mail, you may make that request at any time by contacting your financial intermediary (such as a broker-dealer or bank) or, if you are a direct investor, enrolling at franklintempleton.com.
You may access franklintempleton.com by scanning the code below.


|
| INVESTMENT PRODUCTS: NOT FDIC INSURED • NO BANK GUARANTEE • MAY LOSE VALUE |
Fund objective
The Fund seeks to maximize current income exempt from regular federal income tax*.
| * | Certain investors may be subject to the federal alternative minimum tax (“AMT”), and state and local taxes will apply. Capital gains, if any, are fully taxable. Please consult your personal tax or legal adviser. |
| | |
II | | Western Asset Municipal High Income Fund |
Letter from the president

Dear Shareholder,
We are pleased to provide the semi-annual report of Western Asset Municipal High Income Fund for the six-month reporting period ended January 31, 2024. Please read on for Fund performance information during the Fund’s reporting period.
Special shareholder notice
Effective March 1, 2024, Michael C. Buchanan and Ryan K. Brist will join the Fund’s portfolio management team and S. Kenneth Leech will no longer serve as a member of the Fund’s portfolio management team. For more information, please see the Fund’s prospectus supplement dated March 1, 2024.
As always, we remain committed to providing you with excellent service and a full spectrum of investment choices. We also remain committed to supplementing the support you receive from your financial advisor. One way we accomplish this is through our website, www.franklintempleton.com. Here you can gain immediate access to market and investment information, including:
| • | | Fund prices and performance, |
| • | | Market insights and commentaries from our portfolio managers, and |
| • | | A host of educational resources. |
We look forward to helping you meet your financial goals.
Sincerely,

Jane Trust, CFA
President and Chief Executive Officer
February 29, 2024
| | |
| Western Asset Municipal High Income Fund | | III |
Performance review
For the six months ended January 31, 2024, Class A shares of Western Asset Municipal High Income Fund, excluding sales charges, returned 4.25%. The Fund’s unmanaged benchmark, the Bloomberg Municipal Bond Indexi, returned 2.70% for the same period.
Certain investors may be subject to the federal alternative minimum tax, and state and local taxes will apply. Capital gains, if any, are fully taxable. Please consult your personal tax or legal adviser.
| | | | |
Performance Snapshot as of January 31, 2024
(unaudited) | |
| (excluding sales charges) | | 6 months | |
| Western Asset Municipal High Income Fund: | | | | |
Class A | | | 4.25 | % |
Class C | | | 3.88 | % |
Class I | | | 4.27 | % |
| Bloomberg Municipal Bond Index | | | 2.70 | % |
The performance shown represents past performance. Past performance is no guarantee of future results and current performance may be higher or lower than the performance shown above. Principal value, investment returns and yields will fluctuate and investors’ shares, when redeemed, may be worth more or less than their original cost. To obtain performance data current to the most recent month-end, please visit our website at www.franklintempleton.com.
All share class returns assume the reinvestment of all distributions, including returns of capital, if any, at net asset value and the deduction of all Fund expenses. Returns have not been adjusted to include sales charges that may apply or the deduction of taxes that a shareholder would pay on Fund distributions. If sales charges were reflected, the performance quoted would be lower. Performance figures for periods shorter than one year represent cumulative figures and are not annualized.
Fund performance figures reflect fee waivers and/or expense reimbursements, without which the performance would have been lower.
The 30-Day SEC Yields for the period ended January 31, 2024 for Class A, Class C and Class I shares were 3.77%, 3.35% and 4.09%, respectively. Absent fee waivers and/or expense reimbursements, the 30-Day SEC Yield for Class I shares would have been 4.04%. The 30-Day SEC Yield, calculated pursuant to the standard SEC formula, is based on the Fund’s investments over an annualized trailing 30-day period, and not on the distributions paid by the Fund, which may differ.
| | |
| Total Annual Operating Expenses (unaudited) | | |
As of the Fund’s current prospectus dated December 1, 2023, the gross total annual fund operating expense ratios for Class A, Class C and Class I shares were 0.77%, 1.33% and 0.64%, respectively.
Actual expenses may be higher. For example, expenses may be higher than those shown if average net assets decrease. Net assets are more likely to decrease and Fund expense ratios are more likely to increase when markets are volatile.
As a result of an expense limitation arrangement, the ratio of total annual fund operating expenses, other than interest, brokerage, taxes, extraordinary expenses and acquired fund fees and expenses,
| | | | |
IV | | | | Western Asset Municipal High Income Fund |
Performance review (cont’d)
to average net assets will not exceed 0.55% for Class I shares. This expense limitation arrangement cannot be terminated prior to December 31, 2025 without the Board of Trustees’ consent.
The manager is permitted to recapture amounts waived and/or reimbursed to a class within two years after the fiscal year in which the manager earned the fee or incurred the expense if the class’ total annual fund operating expenses have fallen to a level below the expense limitation (“expense cap”) in effect at the time the fees were earned or the expenses incurred. In no case will the manager recapture any amount that would result, on any particular business day of the Fund, in the class’ total annual fund operating expenses exceeding the expense cap or any other lower limit then in effect.
As always, thank you for your confidence in our stewardship of your assets.
Sincerely,
Jane Trust, CFA
President and Chief Executive Officer
February 29, 2024
RISKS: The Fund’s investments are subject to interest rate and credit risks. As interest rates rise, bond prices fall, reducing the value of the Fund’s share price. Municipal securities purchased by the Fund may be adversely affected by changes in the financial condition of municipal issuers and insurers, regulatory and political developments, uncertainties and public perceptions, and other factors. A significant portion of portfolio holdings may be invested in lower quality securities, which present greater risk of loss of principal and interest than higher rated securities. The Fund may enter into tender option bond (“TOB”) transactions, which expose the Fund to leverage and credit risk, and generally involve greater risk than investments in fixed rate municipal bonds, including the risk of loss of principal. The interest payments that the Fund would typically receive on inverse floaters acquired in such transactions vary inversely with short-term interest rates and will be reduced (and potentially eliminated) when short-term interest rates increase. Inverse floaters will generally underperform the market for fixed rate municipal securities when interest rates rise. The value and market for inverse floaters can be volatile, and inverse floaters can have limited liquidity. Investments in inverse floaters issued in TOB transactions are derivative instruments and, therefore, are also subject to the risks generally applicable to investments in derivatives. Below investment grade securities (that is, securities rated below the Baa/BBB categories) or, if unrated, securities determined to be of comparable credit quality are commonly referred to as “junk bonds”. Investing in securities issued by investment companies, including exchange-traded funds (“ETFs”), involves risks similar to those of investing directly in the securities and other assets held by the investment company or ETF. The Fund will pay brokerage commissions in connection with the purchase and sale of shares of ETFs. In addition, the Fund will indirectly bear its pro rata share of the fees and
| | | | | | |
Western Asset Municipal High Income Fund | | | | | V | |
expenses incurred by a fund it invests in, including advisory fees. These expenses are in addition to the advisory and other expenses that the Fund bears directly in connection with its own operations. The Fund may use derivatives, such as options and futures, which can be illiquid, may disproportionately increase losses, and may have a potentially large impact on Fund performance. The market values of securities or other assets will fluctuate, sometimes sharply and unpredictably, due to changes in general market conditions, overall economic trends or events, governmental actions or intervention, actions taken by the U.S. Federal Reserve or foreign central banks, market disruptions caused by trade disputes or other factors, political developments, armed conflicts, economic sanctions and countermeasures in response to sanctions, major cybersecurity events, investor sentiment, the global and domestic effects of a pandemic, and other factors that may or may not be related to the issuer of the security or other asset. Please see the Fund’s prospectus for a more complete discussion of these and other risks and the Fund’s investment strategies.
All investments are subject to risk including the possible loss of principal. Past performance is no guarantee of future results. All index performance reflects no deduction for fees, expenses or taxes. Please note that an investor cannot invest directly in an index.
| i | The Bloomberg Municipal Bond Index is a market value weighted index of investment grade municipal bonds with maturities of one year or more. |
| | |
VI | | Western Asset Municipal High Income Fund |
Fund at a glance† (unaudited)
Investment breakdown (%) as a percent of total investments
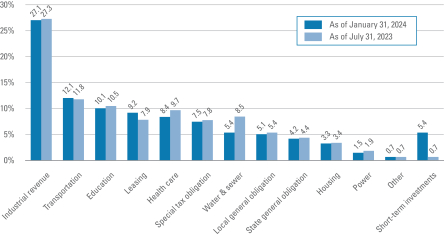
| † | The bar graph above represents the composition of the Fund’s investments as of January 31, 2024 and July 31, 2023, and does not include derivatives, such as futures contracts. The Fund is actively managed. As a result, the composition of the Fund’s investments is subject to change at any time. |
| | | | | | |
Western Asset Municipal High Income Fund 2024 Semi-Annual Report | | | | | 1 | |
Fund expenses (unaudited)
Example
As a shareholder of the Fund, you may incur two types of costs: (1) transaction costs, including front-end and back-end sales charges (loads) on purchase payments; and (2) ongoing costs, including management fees; service and/or distribution (12b-1) fees; and other Fund expenses. This example is intended to help you understand your ongoing costs (in dollars) of investing in the Fund and to compare these costs with the ongoing costs of investing in other mutual funds.
This example is based on an investment of $1,000 invested on August 1, 2023 and held for the six months ended January 31, 2024.
Actual expenses
The table below titled “Based on actual total return” provides information about actual account values and actual expenses. You may use the information provided in this table, together with the amount you invested, to estimate the expenses that you paid over the period. To estimate the expenses you paid on your account, divide your ending account value by $1,000 (for example, an $8,600 ending account value divided by $1,000 = 8.6), then multiply the result by the number under the heading entitled “Expenses Paid During the Period”.
Hypothetical example for comparison purposes
The table below titled “Based on hypothetical total return” provides information about hypothetical account values and hypothetical expenses based on the actual expense ratio and an assumed rate of return of 5.00% per year before expenses, which is not the Fund’s actual return. The hypothetical account values and expenses may not be used to estimate the actual ending account balance or expenses you paid for the period. You may use the information provided in this table to compare the ongoing costs of investing in the Fund and other funds. To do so, compare the 5.00% hypothetical example relating to the Fund with the 5.00% hypothetical examples that appear in the shareholder reports of the other funds.
Please note that the expenses shown in the table below are meant to highlight your ongoing costs only and do not reflect any transactional costs, such as front-end or back-end sales charges (loads). Therefore, the table is useful in comparing ongoing costs only, and will not help you determine the relative total costs of owning different funds. In addition, if these transaction costs were included, your costs would have been higher.
| | | | | | | | | | | | | | | | | | | | | | | | | | | | | | | | | | | | | | | | | | | | | | |
| | | |
| Based on actual total return1 | | | | | | | | | Based on hypothetical total return1 | |
| | | Actual
Total Return
Without
Sales
Charge2 | | | Beginning
Account
Value | | | Ending
Account
Value | | | Annualized
Expense
Ratio | | | Expenses
Paid
During
the
Period3 | | | | | | | | Hypothetical
Annualized
Total Return | | | Beginning Account
Value | | | Ending
Account
Value | | | Annualized
Expense
Ratio | | | Expenses
Paid
During
the
Period3 | |
| Class A | | | 4.25 | % | | $ | 1,000.00 | | | $ | 1,042.50 | | | | 0.81 | % | | $ | 4.16 | | | | | | | Class A | | | 5.00 | % | | $ | 1,000.00 | | | $ | 1,021.06 | | | | 0.81 | % | | $ | 4.12 | |
| Class C | | | 3.88 | | | | 1,000.00 | | | | 1,038.80 | | | | 1.38 | | | | 7.07 | | | | | | | Class C | | | 5.00 | | | | 1,000.00 | | | | 1,018.20 | | | | 1.38 | | | | 7.00 | |
| Class I | | | 4.27 | | | | 1,000.00 | | | | 1,042.70 | | | | 0.62 | | | | 3.18 | | | | | | | Class I | | | 5.00 | | | | 1,000.00 | | | | 1,022.02 | | | | 0.62 | | | | 3.15 | |
| | | | |
2 | | | | Western Asset Municipal High Income Fund 2024 Semi-Annual Report |
| 1 | For the six months ended January 31, 2024. |
| 2 | Assumes the reinvestment of all distributions, including returns of capital, if any, at net asset value and does not reflect the deduction of the applicable sales charge with respect to Class A shares or the applicable contingent deferred sales charge (“CDSC”) with respect to Class C shares. Total return is not annualized, as it may not be representative of the total return for the year. Performance figures may reflect compensating balance arrangements, fee waivers and/or expense reimbursements. In the absence of compensating balance arrangements, fee waivers and/or expense reimbursements, the total return would have been lower. Past performance is no guarantee of future results. |
| 3 | Expenses (net of compensating balance arrangements, fee waivers and/or expense reimbursements) are equal to each class’ respective annualized expense ratio multiplied by the average account value over the period, multiplied by the number of days in the most recent fiscal half-year (184), then divided by 366. |
| | | | | | |
Western Asset Municipal High Income Fund 2024 Semi-Annual Report | | | | | 3 | |
Schedule of investments (unaudited)
January 31, 2024
Western Asset Municipal High Income Fund
(Percentages shown based on Fund net assets)
| | | | | | | | | | | | | | | | |
| Security | | Rate | | | Maturity
Date | | | Face Amount | | | Value | |
| Municipal Bonds — 92.1% | | | | | | | | | | | | | | | | |
Alabama — 3.5% | | | | | | | | | | | | | | | | |
Black Belt Energy Gas District, AL, Gas Project Revenue Bonds, Series D-1, Refunding | | | 5.500 | % | | | 2/1/29 | | | $ | 400,000 | | | $ | 428,571 | (a)(b) |
Hoover, AL, IDA Revenue, United States Steel Corp. Project, Series 2019 | | | 5.750 | % | | | 10/1/49 | | | | 450,000 | | | | 464,197 | (c) |
Jefferson County, AL, Sewer Revenue: | | | | | | | | | | | | | | | | |
Warrants, Series 2024, Refunding | | | 5.250 | % | | | 10/1/44 | | | | 3,500,000 | | | | 3,868,056 | |
Warrants, Series 2024, Refunding | | | 5.250 | % | | | 10/1/49 | | | | 3,000,000 | | | | 3,257,858 | |
Warrants, Series 2024, Refunding | | | 5.500 | % | | | 10/1/53 | | | | 2,500,000 | | | | 2,773,105 | |
Southeast Alabama Gas Supply District, Gas Supply Revenue, Project No 1, Series A, Refunding | | | 5.000 | % | | | 4/1/32 | | | | 750,000 | | | | 798,093 | |
Total Alabama | | | | | | | | | | | | | | | 11,589,880 | |
Alaska — 0.2% | | | | | | | | | | | | | | | | |
Anchorage, AK, Port Revenue, Series A | | | 5.000 | % | | | 12/1/50 | | | | 600,000 | | | | 618,094 | (c) |
Arizona — 4.1% | | | | | | | | | | | | | | | | |
Chandler, AZ, IDA Revenue, Intel Corp. Project | | | 4.100 | % | | | 6/15/28 | | | | 500,000 | | | | 505,830 | (a)(b)(c) |
La Paz County, AZ, IDA Revenue: | | | | | | | | | | | | | | | | |
Charter School Solutions, Harmony Public School Project, Series A | | | 5.000 | % | | | 2/15/36 | | | | 750,000 | | | | 761,412 | (d) |
Charter School Solutions, Harmony Public School Project, Series A | | | 5.000 | % | | | 2/15/46 | | | | 3,175,000 | | | | 3,175,706 | (d) |
Maricopa County, AZ, IDA Revenue, Legacy Traditional Schools Project, Series 2019, Refunding | | | 5.000 | % | | | 7/1/49 | | | | 1,500,000 | | | | 1,425,451 | (d) |
Navajo Nation, AZ, Revenue, Series A, Refunding | | | 5.500 | % | | | 12/1/30 | | | | 850,000 | | | | 870,438 | (d) |
Phoenix, AZ, IDA Revenue, Basis School Inc., Refunding | | | 5.000 | % | | | 7/1/45 | | | | 7,000,000 | | | | 6,706,867 | (d) |
Total Arizona | | | | | | | | | | | | | | | 13,445,704 | |
Arkansas — 0.2% | | | | | | | | | | | | | | | | |
Arkansas State Development Finance Authority, Environmental Improvement Revenue, United States Steel Corporation Project, Green Bonds | | | 5.700 | % | | | 5/1/53 | | | | 750,000 | | | | 773,706 | (c) |
California — 12.6% | | | | | | | | | | | | | | | | |
California State Community Choice Financing Authority Revenue, Clean Energy Project, Green Bonds, Series B-1 | | | 5.000 | % | | | 8/1/29 | | | | 1,100,000 | | | | 1,165,768 | (a)(b) |
See Notes to Financial Statements.
| | | | |
4 | | | | Western Asset Municipal High Income Fund 2024 Semi-Annual Report |
Western Asset Municipal High Income Fund
(Percentages shown based on Fund net assets)
| | | | | | | | | | | | | | | | |
| Security | | Rate | | | Maturity
Date | | | Face Amount | | | Value | |
California — continued | | | | | | | | | | | | | | | | |
California State Community Housing Agency, Essential Housing Revenue, Stoneridge Apartments, Series A | | | 4.000 | % | | | 2/1/56 | | | $ | 1,500,000 | | | $ | 1,135,612 | (d) |
California State MFA Revenue, Senior Lien, LINXS APM Project, Series A | | | 5.000 | % | | | 12/31/43 | | | | 2,250,000 | | | | 2,284,253 | (c) |
California State PCFA Water Furnishing Revenue, Poseidon Resources Desalination Project | | | 5.000 | % | | | 11/21/45 | | | | 7,500,000 | | | | 7,503,623 | (c)(d) |
California State Public Finance Authority, | | | | | | | | | | | | | | | | |
Senior Living Revenue: | | | | | | | | | | | | | | | | |
Enso Village Project, Green Bond, Series A, Refunding | | | 5.000 | % | | | 11/15/51 | | | | 500,000 | | | | 400,294 | |
Enso Village Project, Green Bond, Series A, Refunding | | | 5.000 | % | | | 11/15/56 | | | | 750,000 | | | | 588,086 | |
Enso Village Project, Green Bond, Series B-3, Refunding | | | 2.125 | % | | | 11/15/27 | | | | 200,000 | | | | 199,998 | (d) |
California State School Finance Authority, School Facilities Revenue: | | | | | | | | | | | | | | | | |
KIPP LA Project, Series A | | | 5.000 | % | | | 7/1/34 | | | | 600,000 | | | | 602,571 | (d) |
KIPP LA Project, Series A | | | 5.125 | % | | | 7/1/44 | | | | 750,000 | | | | 751,552 | (d) |
California Statewide CDA Revenue: | | | | | | | | | | | | | | | | |
Provident Group-Pomona Properties LLC, Series A | | | 5.600 | % | | | 1/15/36 | | | | 2,850,000 | | | | 2,850,006 | (d) |
Provident Group-Pomona Properties LLC, Series A | | | 5.750 | % | | | 1/15/45 | | | | 2,230,000 | | | | 2,229,878 | (d) |
Mountain House Public Financing Authority, CA, Utility Systems Revenue, Green Bond, Series A, BAM | | | 4.000 | % | | | 12/1/45 | | | | 2,250,000 | | | | 2,275,397 | |
M-S-R Energy Authority, CA, Natural Gas Revenue, Series B | | | 7.000 | % | | | 11/1/34 | | | | 14,000,000 | | | | 17,886,700 | |
River Islands, CA, Public Financing Authority, Special Tax Revenue: | | | | | | | | | | | | | | | | |
Community Facilities District No 2003-1 | | | 5.500 | % | | | 9/1/37 | | | | 250,000 | | | | 262,061 | |
Community Facilities District No 2003-1 | | | 5.750 | % | | | 9/1/52 | | | | 500,000 | | | | 512,731 | |
Community Facilities District No 2023-1 | | | 5.625 | % | | | 9/1/53 | | | | 1,060,000 | | | | 1,088,166 | |
Total California | | | | | | | | | | | | | | | 41,736,696 | |
Colorado — 2.8% | | | | | | | | | | | | | | | | |
Colorado State High Performance Transportation Enterprise Revenue, C-470 Express Lanes | | | 5.000 | % | | | 12/31/51 | | | | 500,000 | | | | 501,261 | |
See Notes to Financial Statements.
| | | | | | |
| Western Asset Municipal High Income Fund 2024 Semi-Annual Report | | | | | 5 | |
Schedule of investments (unaudited) (cont’d)
January 31, 2024
Western Asset Municipal High Income Fund
(Percentages shown based on Fund net assets)
| | | | | | | | | | | | | | | | |
| Security | | Rate | | | Maturity
Date | | | Face
Amount | | | Value | |
Colorado — continued | | | | | | | | | | | | | | | | |
North Range, CO, Metropolitan District No 2, GO: | | | | | | | | | | | | | | | | |
Series A, Refunding | | | 5.625 | % | | | 12/1/37 | | | $ | 500,000 | | | $ | 505,751 | |
Subordinated, Series B | | | 7.750 | % | | | 12/15/47 | | | | 1,000,000 | | | | 1,004,275 | |
Public Authority for Colorado Energy, Natural Gas Purchase Revenue | | | 6.500 | % | | | 11/15/38 | | | | 4,450,000 | | | | 5,607,258 | |
Village Metropolitan District, CO: | | | | | | | | | | | | | | | | |
Limited & Special Revenue, Series 2020, Refunding and Improvements | | | 5.000 | % | | | 12/1/40 | | | | 500,000 | | | | 496,560 | |
Limited & Special Revenue, Series 2020, Refunding and Improvements | | | 5.000 | % | | | 12/1/49 | | | | 1,200,000 | | | | 1,166,280 | |
Total Colorado | | | | | | | | | | | | | | | 9,281,385 | |
Florida — 4.6% | | | | | | | | | | | | | | | | |
Broward County, FL, Port Facilities Revenue, Senior Bonds, Series B | | | 4.000 | % | | | 9/1/49 | | | | 4,500,000 | | | | 4,270,628 | (c) |
Florida State Development Finance Corp., Educational Facilities Revenue: | | | | | | | | | | | | | | | | |
Mater Academy Projects, Series A | | | 5.000 | % | | | 6/15/35 | | | | 1,000,000 | | | | 1,027,846 | |
Mater Academy Projects, Series A | | | 5.000 | % | | | 6/15/40 | | | | 1,000,000 | | | | 1,012,739 | |
Renaissance Charter School Inc. Projects, Series A | | | 6.000 | % | | | 6/15/35 | | | | 1,200,000 | | | | 1,215,292 | (d) |
Renaissance Charter School Inc. Projects, Series A | | | 6.125 | % | | | 6/15/46 | | | | 990,000 | | | | 996,810 | (d) |
Miami-Dade County, FL, Aviation Revenue, Series A, Refunding | | | 5.000 | % | | | 10/1/49 | | | | 2,000,000 | | | | 2,058,961 | (c) |
Miami-Dade County, FL, Seaport Revenue, Senior Bonds, Series A, Refunding | | | 5.250 | % | | | 10/1/52 | | | | 1,500,000 | | | | 1,596,490 | (c) |
Orange County, FL, Health Facilities Authority Revenue, Orlando Health Inc., Series A | | | 5.000 | % | | | 10/1/53 | | | | 500,000 | | | | 534,451 | |
Palm Beach County, FL, Health Facilities Authority Revenue: | | | | | | | | | | | | | | | | |
Acts Retirement-Life Communities | | | 5.000 | % | | | 11/15/45 | | | | 750,000 | | | | 766,907 | |
Toby & Leon Cooperman Sinai Residences of Boca Raton Expansion, Refunding | | | 4.000 | % | | | 6/1/41 | | | | 250,000 | | | | 210,412 | |
Toby & Leon Cooperman Sinai Residences of Boca Raton Expansion, Series A | | | 5.000 | % | | | 6/1/55 | | | | 1,000,000 | | | | 888,927 | |
See Notes to Financial Statements.
| | | | |
6 | | | | Western Asset Municipal High Income Fund 2024 Semi-Annual Report |
Western Asset Municipal High Income Fund
(Percentages shown based on Fund net assets)
| | | | | | | | | | | | | | | | |
| Security | | Rate | | | Maturity
Date | | | Face
Amount | | | Value | |
Florida — continued | | | | | | | | | | | | | | | | |
Reunion, FL, East Community Development District, Special Assessment Bond, Series A-2 | | | 7.375 | % | | | 5/1/33 | | | $ | 355,000 | | | $ | 4 | *(e) |
Wildwood, FL, Village Community Development District No 15, Special Assessment Revenue | | | 5.000 | % | | | 5/1/43 | | | | 650,000 | | | | 659,575 | (d) |
Total Florida | | | | | | | | | | | | | | | 15,239,042 | |
Georgia — 1.3% | | | | | | | | | | | | | | | | |
Georgia State Municipal Electric Authority, Power Revenue: | | | | | | | | | | | | | | | | |
Plant Vogtle Units 3&4, Project M, Series A | | | 5.250 | % | | | 7/1/64 | | | | 800,000 | | | | 851,095 | |
Plant Vogtle Units 3&4, Project P, Series A | | | 5.500 | % | | | 7/1/64 | | | | 500,000 | | | | 531,590 | |
Plant Vogtle Units 3&4, Project P, Series B | | | 5.000 | % | | | 1/1/59 | | | | 1,200,000 | | | | 1,217,666 | |
Main Street Natural Gas Inc., GA, Gas Project Revenue: | | | | | | | | | | | | | | | | |
Series A | | | 5.000 | % | | | 5/15/43 | | | | 1,250,000 | | | | 1,285,925 | |
Series C | | | 5.000 | % | | | 9/1/30 | | | | 500,000 | | | | 532,103 | (a)(b) |
Total Georgia | | | | | | | | | | | | | | | 4,418,379 | |
Illinois — 12.9% | | | | | | | | | | | | | | | | |
Chicago, IL, Board of Education, Dedicated Capital Improvement, Special Tax Revenue, Series 2018 | | | 5.000 | % | | | 4/1/42 | | | | 1,000,000 | | | | 1,025,220 | |
Chicago, IL, Board of Education, GO: | | | | | | | | | | | | | | | | |
Dedicated, Series A | | | 5.000 | % | | | 12/1/36 | | | | 500,000 | | | | 521,808 | |
Dedicated, Series A | | | 5.875 | % | | | 12/1/47 | | | | 1,000,000 | | | | 1,097,262 | |
Dedicated, Series G, Refunding | | | 5.000 | % | | | 12/1/34 | | | | 100,000 | | | | 101,974 | |
Dedicated, Series H | | | 5.000 | % | | | 12/1/46 | | | | 3,250,000 | | | | 3,255,778 | |
Series A | | | 5.000 | % | | | 12/1/35 | | | | 2,000,000 | | | | 2,098,469 | |
Series D | | | 5.000 | % | | | 12/1/46 | | | | 750,000 | | | | 751,862 | |
Chicago, IL, GO: | | | | | | | | | | | | | | | | |
Chicago Works, Series A | | | 5.500 | % | | | 1/1/39 | | | | 1,200,000 | | | | 1,311,633 | |
Series A, Refunding | | | 5.000 | % | | | 1/1/28 | | | | 1,500,000 | | | | 1,587,209 | |
Series A, Refunding | | | 6.000 | % | | | 1/1/38 | | | | 1,250,000 | | | | 1,309,629 | |
Series C, Refunding | | | 5.000 | % | | | 1/1/25 | | | | 1,000,000 | | | | 1,011,543 | |
Chicago, IL, O’Hare International Airport Revenue: | | | | | | | | | | | | | | | | |
Senior Lien, Series G | | | 5.000 | % | | | 1/1/47 | | | | 1,000,000 | | | | 1,013,000 | (c) |
Senior Lien, Series G | | | 5.000 | % | | | 1/1/52 | | | | 1,000,000 | | | | 1,008,448 | (c) |
Chicago, IL, Transit Authority, Sales Tax Receipts Revenue: | | | | | | | | | | | | | | | | |
Second Lien | | | 5.000 | % | | | 12/1/51 | | | | 4,000,000 | | | | 4,052,179 | |
See Notes to Financial Statements.
| | | | | | |
| Western Asset Municipal High Income Fund 2024 Semi-Annual Report | | | | | 7 | |
Schedule of investments (unaudited) (cont’d)
January 31, 2024
Western Asset Municipal High Income Fund
(Percentages shown based on Fund net assets)
| | | | | | | | | | | | | | | | |
| Security | | Rate | | | Maturity
Date | | | Face Amount | | | Value | |
Illinois — continued | | | | | | | | | | | | | | | | |
Second Lien, Series A, Refunding | | | 4.000 | % | | | 12/1/55 | | | $ | 300,000 | | | $ | 279,715 | |
Illinois State Development Finance Authority, Environmental Facilities Revenue, Citgo Petroleum Corp. Project | | | 8.000 | % | | | 6/1/32 | | | | 3,250,000 | | | | 3,253,485 | (c) |
Illinois State Sports Facilities Authority Revenue, Sport Facilities Project, Series 2019, Refunding, BAM | | | 5.000 | % | | | 6/15/29 | | | | 720,000 | | | | 769,031 | |
Illinois State, GO: | | | | | | | | | | | | | | | | |
Series 2016 | | | 5.000 | % | | | 1/1/41 | | | | 5,020,000 | | | | 5,094,361 | |
Series A | | | 5.000 | % | | | 3/1/46 | | | | 1,000,000 | | | | 1,059,070 | |
Series A, Refunding | | | 5.000 | % | | | 10/1/29 | | | | 2,900,000 | | | | 3,142,200 | |
Series A, Refunding | | | 5.000 | % | | | 10/1/30 | | | | 1,475,000 | | | | 1,597,884 | |
Metropolitan Pier & Exposition Authority, IL, Revenue: | | | | | | | | | | | | | | | | |
McCormick Place Expansion Project, Series A | | | 5.000 | % | | | 6/15/57 | | | | 1,150,000 | | | | 1,171,116 | |
McCormick Place Expansion Project, Series A, Refunding | | | 4.000 | % | | | 12/15/42 | | | | 2,000,000 | | | | 1,953,463 | |
McCormick Place Expansion Project, Series A, Refunding | | | 5.000 | % | | | 6/15/50 | | | | 750,000 | | | | 774,463 | |
McCormick Place Expansion Project, Series B, Refunding | | | 5.000 | % | | | 6/15/42 | | | | 3,250,000 | | | | 3,439,542 | |
Total Illinois | | | | | | | | | | | | | | | 42,680,344 | |
Indiana — 0.9% | | | | | | | | | | | | | | | | |
Indiana State Finance Authority Revenue: | | | | | | | | | | | | | | | | |
BHI Senior Living Inc., Series A, Refunding | | | 4.000 | % | | | 11/15/41 | | | | 1,250,000 | | | | 1,113,287 | |
Marion General Hospital, Series A | | | 4.000 | % | | | 7/1/45 | | | | 500,000 | | | | 470,328 | |
Midwestern Disaster Relief, Ohio Valley Electric Corp. Project, Series A | | | 4.250 | % | | | 11/1/30 | | | | 500,000 | | | | 503,878 | |
Valparaiso, IN, Exempt Facilities Revenue, Pratt Paper LLC Project | | | 7.000 | % | | | 1/1/44 | | | | 1,000,000 | | | | 1,002,335 | (c) |
Total Indiana | | | | | | | | | | | | | | | 3,089,828 | |
Iowa — 1.0% | | | | | | | | | | | | | | | | |
Iowa State Finance Authority Revenue: | | | | | | | | | | | | | | | | |
Midwestern Disaster Area, Iowa Fertilizer Co. Project, Refunding | | | 5.000 | % | | | 12/1/42 | | | | 1,800,000 | | | | 1,891,663 | (a)(b) |
Midwestern Disaster Area, Iowa Fertilizer Co. Project, Refunding | | | 5.000 | % | | | 12/1/50 | | | | 1,300,000 | | | | 1,361,334 | |
Total Iowa | | | | | | | | | | | | | | | 3,252,997 | |
See Notes to Financial Statements.
| | | | |
8 | | | | Western Asset Municipal High Income Fund 2024 Semi-Annual Report |
Western Asset Municipal High Income Fund
(Percentages shown based on Fund net assets)
| | | | | | | | | | | | | | | | |
| Security | | Rate | | | Maturity
Date | | | Face
Amount | | | Value | |
Kentucky — 0.6% | | | | | | | | | | | | | | | | |
Kentucky State PEA, Gas Supply Revenue, Series A | | | 4.000 | % | | | 6/1/26 | | | $ | 2,000,000 | | | $ | 2,003,308 | (a)(b) |
Louisiana — 1.3% | | | | | | | | | | | | | | | | |
Louisiana State PFA, Lease Revenue: | | | | | | | | | | | | | | | | |
Provident Group, Flagship Properties | | | 5.000 | % | | | 7/1/42 | | | | 1,000,000 | | | | 1,029,034 | |
Provident Group, Flagship Properties, Series A | | | 4.000 | % | | | 7/1/44 | | | | 1,000,000 | | | | 985,516 | |
Provident Group, Flagship Properties, Series A | | | 4.000 | % | | | 7/1/49 | | | | 500,000 | | | | 481,052 | |
St. John the Baptist Parish, LA, State Revenue: | | | | | | | | | | | | | | | | |
Marathon Oil Corp. Project, Series A-3, Refunding | | | 2.200 | % | | | 7/1/26 | | | | 1,000,000 | | | | 948,802 | (a)(b) |
Marathon Oil Corp. Project, Series B-2, Refunding | | | 2.375 | % | | | 7/1/26 | | | | 750,000 | | | | 714,572 | (a)(b) |
Total Louisiana | | | | | | | | | | | | | | | 4,158,976 | |
Maryland — 1.0% | | | | | | | | | | | | | | | | |
Maryland State EDC Revenue: | | | | | | | | | | | | | | | | |
Morgan State University Project | | | 4.250 | % | | | 7/1/50 | | | | 1,000,000 | | | | 914,888 | |
Seagirt Marine Terminal Project, Series A | | | 5.000 | % | | | 6/1/44 | | | | 300,000 | | | | 310,683 | (c) |
Seagirt Marine Terminal Project, Series A | | | 5.000 | % | | | 6/1/49 | | | | 1,000,000 | | | | 1,027,935 | (c) |
Maryland State Health & Higher EFA Revenue: | | | | | | | | | | | | | | | | |
Frederick Health System, Refunding | | | 4.000 | % | | | 7/1/45 | | | | 500,000 | | | | 481,614 | |
Frederick Health System, Refunding | | | 4.000 | % | | | 7/1/50 | | | | 725,000 | | | | 678,540 | |
Total Maryland | | | | | | | | | | | | | | | 3,413,660 | |
Massachusetts — 0.3% | | | | | | | | | | | | | | | | |
Massachusetts State DFA Revenue, Boston Medical Center, Sustainability Bonds, Series G, Refunding | | | 5.250 | % | | | 7/1/52 | | | | 1,000,000 | | | | 1,086,189 | |
Michigan — 0.9% | | | | | | | | | | | | | | | | |
Detroit, MI, Downtown Development Authority Revenue, Catalyst Development, Series A, Refunding, AGM | | | 5.000 | % | | | 7/1/48 | | | | 750,000 | | | | 745,546 | |
Michigan State Finance Authority Revenue: | | | | | | | | | | | | | | | | |
Henry Ford Health System, Series A | | | 4.000 | % | | | 11/15/50 | | | | 1,250,000 | | | | 1,153,101 | |
Tobacco Settlement Asset Backed Senior Bonds, Series B-1, Refunding | | | 5.000 | % | | | 6/1/49 | | | | 145,000 | | | | 149,935 | |
Michigan State Strategic Fund Limited Obligation Revenue, I-75 Improvement Project | | | 5.000 | % | | | 12/31/43 | | | | 850,000 | | | | 871,772 | (c) |
Total Michigan | | | | | | | | | | | | | | | 2,920,354 | |
See Notes to Financial Statements.
| | | | | | |
| Western Asset Municipal High Income Fund 2024 Semi-Annual Report | | | | | 9 | |
Schedule of investments (unaudited) (cont’d)
January 31, 2024
Western Asset Municipal High Income Fund
(Percentages shown based on Fund net assets)
| | | | | | | | | | | | | | | | |
| Security | | Rate | | | Maturity
Date | | | Face
Amount | | | Value | |
Minnesota — 1.1% | | | | | | | | | | | | | | | | |
Minneapolis & St. Paul, MN, Metropolitan Airports Commission Revenue, Subordinated, Series B, Refunding | | | 5.000 | % | | | 1/1/44 | | | $ | 3,500,000 | | | $ | 3,636,740 | (c) |
Missouri — 1.6% | | | | | | | | | | | | | | | | |
Missouri State HEFA Revenue, Senior Living Facilities, Lutheran Senior Services Projects, Refunding | | | 5.000 | % | | | 2/1/44 | | | | 2,450,000 | | | | 2,357,116 | |
St. Louis County, MO, IDA, Senior Living Facilities Revenue, Friendship Village of Sunset Hills, Series A | | | 5.875 | % | | | 9/1/43 | | | | 3,000,000 | | | | 3,001,389 | |
Total Missouri | | | | | | | | | | | | | | | 5,358,505 | |
Nebraska — 1.0% | | | | | | | | | | | | | | | | |
Central Plains Energy Project, NE, Gas Project Revenue, Project No 3, Series A, Refunding | | | 5.000 | % | | | 9/1/42 | | | | 3,160,000 | | | | 3,454,072 | |
Nevada — 1.0% | | | | | | | | | | | | | | | | |
State of Nevada Department of Business & Industry Revenue: | | | | | | | | | | | | | | | | |
Charter School Lease Revenue, Somerset Academy, Series A | | | 5.000 | % | | | 12/15/35 | | | | 1,295,000 | | | | 1,299,046 | (d) |
Charter School Lease Revenue, Somerset Academy, Series A | | | 5.125 | % | | | 12/15/45 | | | | 2,015,000 | | | | 1,934,264 | (d) |
Total Nevada | | | | | | | | | | | | | | | 3,233,310 | |
New Hampshire — 0.2% | | | | | | | | | | | | | | | | |
National Finance Authority, NH, Revenue, Presbyterian Senior Living Project, Series A | | | 5.250 | % | | | 7/1/48 | | | | 700,000 | | | | 721,564 | |
New Jersey — 4.8% | | | | | | | | | | | | | | | | |
New Jersey State EDA Revenue: | | | | | | | | | | | | | | | | |
Provident Group - Rowan Properties LLC, Rowan University Housing Project | | | 5.000 | % | | | 1/1/48 | | | | 2,000,000 | | | | 1,875,337 | |
Special Facility, Port Newark Container Terminal LLC Project, Refunding | | | 5.000 | % | | | 10/1/37 | | | | 1,150,000 | | | | 1,176,954 | (c) |
New Jersey State Higher Education, Student Assistance Authority Revenue, Subordinated, Series B-1 | | | 5.000 | % | | | 12/1/44 | | | | 2,780,000 | | | | 2,763,700 | (c) |
New Jersey State Transportation Trust Fund Authority Revenue: | | | | | | | | | | | | | | | | |
Transportation Program, Series AA | | | 5.250 | % | | | 6/15/43 | | | | 500,000 | | | | 531,620 | |
Transportation Program, Series BB | | | 5.000 | % | | | 6/15/44 | | | | 3,000,000 | | | | 3,146,935 | |
Transportation System, Series A, Refunding | | | 5.000 | % | | | 6/15/37 | | | | 1,000,000 | | | | 1,152,339 | |
See Notes to Financial Statements.
| | | | |
10 | | | | Western Asset Municipal High Income Fund 2024 Semi-Annual Report |
Western Asset Municipal High Income Fund
(Percentages shown based on Fund net assets)
| | | | | | | | | | | | | | | | |
| Security | | Rate | | | Maturity
Date | | | Face
Amount | | | Value | |
New Jersey — continued | | | | | | | | | | | | | | | | |
Transportation System, Series A, Refunding | | | 5.000 | % | | | 6/15/38 | | | $ | 4,000,000 | | | $ | 4,573,081 | |
Transportation System, Series A, Refunding | | | 4.250 | % | | | 6/15/40 | | | | 500,000 | | | | 518,142 | |
Total New Jersey | | | | | | | | | | | | | | | 15,738,108 | |
New Mexico — 0.2% | | | | | | | | | | | | | | | | |
Santa Fe, NM, Retirement Facilities Revenue, EL Castillo Retirement Residences Project, Series A | | | 5.000 | % | | | 5/15/49 | | | | 750,000 | | | | 634,083 | |
New York — 6.6% | | | | | | | | | | | | | | | | |
Build NYC Resource Corp., NY, Revenue, East Harlem Scholars Academy Charter School Project | | | 5.750 | % | | | 6/1/62 | | | | 750,000 | | | | 764,256 | (d) |
MTA, NY, Transportation Revenue: | | | | | | | | | | | | | | | | |
Green Bonds, Series E, Refunding | | | 5.000 | % | | | 11/15/30 | | | | 1,000,000 | | | | 1,123,674 | |
Green Bonds, Series E, Refunding | | | 4.000 | % | | | 11/15/45 | | | | 500,000 | | | | 485,097 | |
Series A-2 | | | 5.000 | % | | | 5/15/30 | | | | 1,000,000 | | | | 1,080,876 | (a)(b) |
Series B, Refunding | | | 5.000 | % | | | 11/15/37 | | | | 500,000 | | | | 514,170 | |
New York City, NY, Industrial Development Agency Revenue, Yankee Stadium Project, Refunding | | | 4.000 | % | | | 3/1/45 | | | | 750,000 | | | | 743,951 | |
New York State Liberty Development Corp., Liberty Revenue, 7 World Trade Center Project, Class 3, Refunding | | | 3.500 | % | | | 9/15/52 | | | | 1,800,000 | | | | 1,445,944 | |
New York State Transportation Development Corp., Special Facilities Revenue: | | | | | | | | | | | | | | | | |
Delta Air Lines Inc., LaGuardia Airport Terminals C and D Redevelopment Project, Series 2020 | | | 4.375 | % | | | 10/1/45 | | | | 2,000,000 | | | | 1,956,693 | (c) |
Delta Air Lines Inc., LaGuardia Airport Terminals C and D Redevelopment Project, Series 2023 | | | 6.000 | % | | | 4/1/35 | | | | 800,000 | | | | 899,226 | (c) |
Delta Air Lines Inc., LaGuardia Airport Terminals C and D Redevelopment Project, Series 2023 | | | 5.625 | % | | | 4/1/40 | | | | 700,000 | | | | 759,639 | (c) |
John F. Kennedy International Airport New Terminal One Project, Green Bonds | | | 5.375 | % | | | 6/30/60 | | | | 6,500,000 | | | | 6,806,237 | (c) |
LaGuardia Airport Terminal B Redevelopment Project, Series A | | | 5.000 | % | | | 7/1/41 | | | | 1,100,000 | | | | 1,100,606 | (c) |
LaGuardia Airport Terminal B Redevelopment Project, Series A | | | 5.000 | % | | | 7/1/46 | | | | 1,200,000 | | | | 1,200,153 | (c) |
See Notes to Financial Statements.
| | | | | | |
| Western Asset Municipal High Income Fund 2024 Semi-Annual Report | | | | | 11 | |
Schedule of investments (unaudited) (cont’d)
January 31, 2024
Western Asset Municipal High Income Fund
(Percentages shown based on Fund net assets)
| | | | | | | | | | | | | | | | |
| Security | | Rate | | | Maturity
Date | | | Face
Amount | | | Value | |
New York — continued | | | | | | | | | | | | | | | | |
Port Authority of New York & New Jersey Revenue: | | | | | | | | | | | | | | | | |
Consolidated Series 221 | | | 4.000 | % | | | 7/15/45 | | | $ | 1,500,000 | | | $ | 1,457,103 | (c) |
Consolidated Series 221 | | | 4.000 | % | | | 7/15/55 | | | | 500,000 | | | | 477,885 | (c) |
Troy Capital Resource Corp., NY, Revenue, Rensselaer Polytechnic Institute Project, Series A, Refunding | | | 4.000 | % | | | 9/1/40 | | | | 1,000,000 | | | | 1,001,961 | |
Total New York | | | | | | | | | | | | | | | 21,817,471 | |
North Carolina — 0.5% | | | | | | | | | | | | | | | | |
North Carolina State Turnpike Authority, Monroe Expressway Toll Revenue, Series A, Refunding | | | 5.000 | % | | | 7/1/51 | | | | 1,600,000 | | | | 1,624,803 | |
North Dakota — 0.2% | | | | | | | | | | | | | | | | |
Grand Forks, ND, Health Care System Revenue, Altru Health System, Refunding, AGM | | | 3.000 | % | | | 12/1/46 | | | | 800,000 | | | | 619,532 | |
Ohio — 1.7% | | | | | | | | | | | | | | | | |
Buckeye, OH, Tobacco Settlement Financing Authority Revenue, Senior Bonds, Series B-2, Refunding | | | 5.000 | % | | | 6/1/55 | | | | 1,300,000 | | | | 1,229,239 | |
Ohio State Air Quality Development Authority Revenue: | | | | | | | | | | | | | | | | |
American Electric Co. Project, Series B, Refunding | | | 2.500 | % | | | 10/1/29 | | | | 1,000,000 | | | | 886,743 | (a)(b)(c) |
AMG Vanadium Project, Series 2019 | | | 5.000 | % | | | 7/1/49 | | | | 2,000,000 | | | | 1,820,641 | (c) |
Ohio State Private Activity Revenue, Portsmouth Bypass Project | | | 5.000 | % | | | 6/30/53 | | | | 1,650,000 | | | | 1,651,853 | (c) |
Total Ohio | | | | | | | | | | | | | | | 5,588,476 | |
Oklahoma — 0.5% | | | | | | | | | | | | | | | | |
Tulsa County, OK, Industrial Authority, Senior Living Community Revenue: | | | | | | | | | | | | | | | | |
Montereau Inc. Project, Refunding | | | 5.250 | % | | | 11/15/37 | | | | 500,000 | | | | 503,367 | |
Montereau Inc. Project, Refunding | | | 5.250 | % | | | 11/15/45 | | | | 1,000,000 | | | | 987,141 | |
Total Oklahoma | | | | | | | | | | | | | | | 1,490,508 | |
Oregon — 0.4% | | | | | | | | | | | | | | | | |
Clackamas County, OR, Hospital Facility Authority Revenue, Senior Living, Willamette View Project, Refunding | | | 5.000 | % | | | 11/15/47 | | | | 1,250,000 | | | | 1,161,266 | |
See Notes to Financial Statements.
| | | | |
12 | | | | Western Asset Municipal High Income Fund 2024 Semi-Annual Report |
Western Asset Municipal High Income Fund
(Percentages shown based on Fund net assets)
| | | | | | | | | | | | | | | | |
| Security | | Rate | | | Maturity
Date | | | Face Amount | | | Value | |
Pennsylvania — 3.9% | | | | | | | | | | | | | | | | |
Allegheny County, PA, HDA Revenue, University Pittsburgh Medical Center, Series A, Refunding | | | 4.000 | % | | | 7/15/39 | | | $ | 1,000,000 | | | $ | 998,979 | |
Lancaster County, PA, IDA Revenue, Willow Valley Communities Project | | | 5.000 | % | | | 12/1/49 | | | | 1,750,000 | | | | 1,767,446 | |
Lancaster County, PA, Convention Center Authority Revenue, Hotel Room Rental Tax, Series B, Refunding, County GTD | | | 4.750 | % | | | 5/1/57 | | | | 1,000,000 | | | | 1,006,967 | |
Pennsylvania State Economic Development Financing Authority Revenue: | | | | | | | | | | | | | | | | |
Tax-Exempt Private Activity, The Penndot Major Bridges Package One Project | | | 5.000 | % | | | 12/31/32 | | | | 2,000,000 | | | | 2,265,854 | (c) |
Tax-Exempt Private Activity, The Penndot Major Bridges Package One Project | | | 5.250 | % | | | 6/30/53 | | | | 5,400,000 | | | | 5,739,320 | (c) |
Philadelphia, PA, Authority for IDR, Charter School Revenue, Philadelphia Performing Arts: A String Theory Charter School Project, Refunding | | | 5.000 | % | | | 6/15/50 | | | | 1,200,000 | | | | 1,164,018 | |
Total Pennsylvania | | | | | | | | | | | | | | | 12,942,584 | |
Puerto Rico — 4.8% | | | | | | | | | | | | | | | | |
Puerto Rico Commonwealth Aqueduct & Sewer Authority Revenue, Senior Lien, Series A, Refunding | | | 5.000 | % | | | 7/1/47 | | | | 2,600,000 | | | | 2,612,630 | (d) |
Puerto Rico Commonwealth, GO: | | | | | | | | | | | | | | | | |
CAB, Restructured, Series A-1 | | | 0.000 | % | | | 7/1/24 | | | | 7,624 | | | | 7,494 | |
CAB, Restructured, Series A-1 | | | 0.000 | % | | | 7/1/33 | | | | 60,471 | | | | 38,539 | |
Restructured, Series A-1 | | | 5.375 | % | | | 7/1/25 | | | | 52,334 | | | | 53,196 | |
Restructured, Series A-1 | | | 5.625 | % | | | 7/1/27 | | | | 51,860 | | | | 54,811 | |
Restructured, Series A-1 | | | 5.625 | % | | | 7/1/29 | | | | 51,018 | | | | 55,326 | |
Restructured, Series A-1 | | | 5.750 | % | | | 7/1/31 | | | | 49,554 | | | | 55,304 | |
Restructured, Series A-1 | | | 4.000 | % | | | 7/1/33 | | | | 46,990 | | | | 45,694 | |
Restructured, Series A-1 | | | 4.000 | % | | | 7/1/35 | | | | 442,237 | | | | 423,035 | |
Restructured, Series A-1 | | | 4.000 | % | | | 7/1/37 | | | | 2,160,000 | | | | 2,031,266 | |
Restructured, Series A-1 | | | 4.000 | % | | | 7/1/41 | | | | 299,287 | | | | 273,884 | |
Restructured, Series A-1 | | | 4.000 | % | | | 7/1/46 | | | | 51,258 | | | | 45,664 | |
Subseries CW | | | 0.000 | % | | | 11/1/43 | | | | 207,750 | | | | 115,301 | (b) |
Puerto Rico Electric Power Authority Revenue: | | | | | | | | | | | | | | | | |
Series A | | | 5.000 | % | | | 7/1/42 | | | | 1,420,000 | | | | 440,200 | *(e) |
Series A | | | 5.050 | % | | | 7/1/42 | | | | 215,000 | | | | 66,650 | *(e) |
Series XX | | | 5.250 | % | | | 7/1/40 | | | | 2,130,000 | | | | 660,300 | *(e) |
See Notes to Financial Statements.
| | | | | | |
| Western Asset Municipal High Income Fund 2024 Semi-Annual Report | | | | | 13 | |
Schedule of investments (unaudited) (cont’d)
January 31, 2024
Western Asset Municipal High Income Fund
(Percentages shown based on Fund net assets)
| | | | | | | | | | | | | | | | |
| Security | | Rate | | | Maturity
Date | | | Face Amount | | | Value | |
Puerto Rico — continued | | | | | | | | | | | | | | | | |
Series ZZ | | | — | | | | 7/1/18 | | | $ | 350,000 | | | $ | 107,625 | *(f) |
Puerto Rico Sales Tax Financing Corp., Sales Tax Revenue: | | | | | | | | | | | | | | | | |
CAB, Restructured, Series A-1 | | | 0.000 | % | | | 7/1/27 | | | | 760,000 | | | | 669,019 | |
CAB, Restructured, Series A-1 | | | 0.000 | % | | | 7/1/46 | | | | 3,460,000 | | | | 1,079,317 | |
Restructured, Series A-1 | | | 4.550 | % | | | 7/1/40 | | | | 130,000 | | | | 130,470 | |
Restructured, Series A-1 | | | 4.750 | % | | | 7/1/53 | | | | 5,275,000 | | | | 5,181,473 | |
Restructured, Series A-1 | | | 5.000 | % | | | 7/1/58 | | | | 1,145,000 | | | | 1,148,708 | |
Restructured, Series A-2 | | | 4.329 | % | | | 7/1/40 | | | | 720,000 | | | | 717,302 | |
Total Puerto Rico | | | | | | | | | | | | | | | 16,013,208 | |
Rhode Island — 0.1% | | | | | | | | | | | | | | | | |
Central Falls, RI, Detention Facility Corp., Detention Facilities Revenue, Refunding | | | 7.250 | % | | | 7/15/35 | | | | 980,000 | | | | 392,000 | *(e) |
South Carolina — 0.3% | | | | | | | | | | | | | | | | |
South Carolina State Jobs-EDA Hospital Facilities Revenue, Bon Secours Mercy Health Inc., Series A, Refunding | | | 4.000 | % | | | 12/1/44 | | | | 1,000,000 | | | | 999,194 | |
Tennessee — 0.5% | | | | | | | | | | | | | | | | |
Clarksville, TN, Water, Sewer & Gas Revenue, Series A | | | 4.000 | % | | | 2/1/51 | | | | 1,000,000 | | | | 990,990 | |
Metropolitan Government of Nashville & Davidson County, TN, Sports Authority Revenue, Series A, AGM | | | 5.250 | % | | | 7/1/53 | | | | 750,000 | | | | 828,824 | |
Total Tennessee | | | | | | | | | | | | | | | 1,819,814 | |
Texas — 11.3% | | | | | | | | | | | | | | | | |
Austin, TX, Airport System Revenue, Series 2022 | | | 5.000 | % | | | 11/15/52 | | | | 750,000 | | | | 782,732 | (c) |
Central Texas Regional Mobility Authority Revenue: | | | | | | | | | | | | | | | | |
CAB | | | 0.000 | % | | | 1/1/36 | | | | 2,800,000 | | | | 1,786,137 | |
CAB | | | 0.000 | % | | | 1/1/38 | | | | 2,000,000 | | | | 1,130,082 | |
CAB | | | 0.000 | % | | | 1/1/40 | | | | 2,200,000 | | | | 1,106,442 | |
Gulf Coast, TX, IDA, Solid Waste Disposal Revenue, Citgo Petroleum Corp. Project | | | 4.875 | % | | | 5/1/25 | | | | 2,000,000 | | | | 1,999,963 | (c) |
Houston, TX, Airport System Revenue: | | | | | | | | | | | | | | | | |
Special Facilities, Continental Airlines Terminal Improvement Projects, Refunding | | | 6.500 | % | | | 7/15/30 | | | | 6,500,000 | | | | 6,504,014 | (c) |
Special Facilities, Continental Airlines Terminal Improvement Projects, Refunding | | | 6.625 | % | | | 7/15/38 | | | | 5,000,000 | | | | 5,003,089 | (c) |
See Notes to Financial Statements.
| | | | |
14 | | | | Western Asset Municipal High Income Fund 2024 Semi-Annual Report |
Western Asset Municipal High Income Fund
(Percentages shown based on Fund net assets)
| | | | | | | | | | | | | | | | |
| Security | | Rate | | | Maturity
Date | | | Face Amount | | | Value | |
Texas — continued | | | | | | | | | | | | | | | | |
Special Facilities, United Airlines Inc., Terminal Improvement Project, Series B-1 | | | 4.000 | % | | | 7/15/41 | | | $ | 1,000,000 | | | $ | 906,145 | (c) |
Special Facilities, United Airlines Terminal Improvement Projects, Refunding | | | 5.000 | % | | | 7/15/35 | | | | 7,500,000 | | | | 7,510,202 | (c) |
Love Field, TX, Airport Modernization Corp., General Airport Revenue: | | | | | | | | | | | | | | | | |
Series 2017 | | | 5.000 | % | | | 11/1/33 | | | | 110,000 | | | | 113,636 | (c) |
Series 2017 | | | 5.000 | % | | | 11/1/36 | | | | 110,000 | | | | 113,006 | (c) |
New Hope Cultural Education Facilities Finance Corp., TX, Retirement Facility Revenue, Westminster Manor Project | | | 4.000 | % | | | 11/1/49 | | | | 1,200,000 | | | | 1,042,895 | |
New Hope Cultural Education Facilities Finance Corp., TX, Student Housing Revenue, Collegiate Housing College Station, AGM | | | 5.000 | % | | | 4/1/46 | | | | 500,000 | | | | 500,074 | |
Newark, TX, Higher Education Finance Corp., Education Revenue, TLC Academy, Series A | | | 4.000 | % | | | 8/15/56 | | | | 900,000 | | | | 675,748 | |
Port Beaumont, TX, Navigation District Dock and Wharf Facility Revenue, Jefferson Gulf Coast Energy Project, Series A | | | 3.000 | % | | | 1/1/50 | | | | 250,000 | | | | 151,314 | (c)(d) |
Tarrant County, TX, Cultural Education Facilities Finance Corp., Retirement Facility Revenue: | | | | | | | | | | | | | | | | |
Buckner Retirement Services Inc. Project, Refunding | | | 5.000 | % | | | 11/15/37 | | | | 1,000,000 | | | | 1,013,661 | |
Buckner Retirement Services Inc. Project, Refunding | | | 5.000 | % | | | 11/15/46 | | | | 1,200,000 | | | | 1,200,429 | |
Texas State, Municipal Gas Acquisition & Supply Corp. I, Gas Supply Revenue, Senior Lien, Series D | | | 6.250 | % | | | 12/15/26 | | | | 2,805,000 | | | | 2,921,388 | |
Texas State Private Activity Bond Surface Transportation Corp. Revenue: | | | | | | | | | | | | | | | | |
Senior Lien, Blueridge Transportation Group LLC | | | 5.000 | % | | | 12/31/50 | | | | 1,500,000 | | | | 1,502,019 | (c) |
Senior Lien, LBJ Infrastructure Group LLC, I-635 Managed Lanes Project, Series A, Refunding | | | 4.000 | % | | | 6/30/37 | | | | 515,000 | | | | 520,656 | |
Senior Lien, NTE Mobility Partners Segments 3 LLC, Refunding | | | 5.500 | % | | | 6/30/40 | | | | 600,000 | | | | 644,554 | (c) |
Willacy County, TX, Jail Public Facilities Corp. Project Revenue | | | 7.500 | % | | | 11/1/25 | | | | 195,000 | | | | 183,346 | |
See Notes to Financial Statements.
| | | | | | |
| Western Asset Municipal High Income Fund 2024 Semi-Annual Report | | | | | 15 | |
Schedule of investments (unaudited) (cont’d)
January 31, 2024
Western Asset Municipal High Income Fund
(Percentages shown based on Fund net assets)
| | | | | | | | | | | | | | | | |
| Security | | Rate | | | Maturity
Date | | | Face Amount | | | Value | |
Texas — continued | | | | | | | | | | | | | | | | |
Woodloch, TX, Health Facilities Development Corp., Senior Housing Revenue: | | | | | | | | | | | | | | | | |
Inspired Living at Lewisville Project, Series A-1 | | | 6.750 | % | | | 12/1/51 | | | $ | 292,758 | | | $ | 5,855 | *(d)(e) |
Subordinated, Inspired Living at Lewisville Project, Series B | | | 10.000 | % | | | 12/1/51 | | | | 150,000 | | | | 7,500 | *(e) |
Total Texas | | | | | | | | | | | | | | | 37,324,887 | |
Utah — 1.0% | | | | | | | | | | | | | | | | |
Utah State Charter School Finance Authority, Charter School Revenue: | | | | | | | | | | | | | | | | |
Summit Academy Inc., Series A, Refunding, UT CSCE | | | 5.000 | % | | | 4/15/39 | | | | 350,000 | | | | 371,188 | |
Summit Academy Inc., Series A, Refunding, UT CSCE | | | 5.000 | % | | | 4/15/44 | | | | 625,000 | | | | 653,304 | |
Syracuse Arts Academy Project, UT CSCE | | | 5.000 | % | | | 4/15/42 | | | | 750,000 | | | | 764,205 | |
Utah State Infrastructure Agency Telecommunication Revenue: | | | | | | | | | | | | | | | | |
Series 2021 | | | 4.000 | % | | | 10/15/41 | | | | 500,000 | | | | 449,677 | |
Series A | | | 5.375 | % | | | 10/15/40 | | | | 1,150,000 | | | | 1,180,893 | |
Total Utah | | | | | | | | | | | | | | | 3,419,267 | |
Virginia — 0.4% | | | | | | | | | | | | | | | | |
Virginia State Small Business Financing Authority Revenue: | | | | | | | | | | | | | | | | |
National Senior Campuses, Inc., Series A, Refunding | | | 5.000 | % | | | 1/1/34 | | | | 500,000 | | | | 531,495 | |
Senior Lien, I-495 HOT Lanes Project, Refunding | | | 5.000 | % | | | 12/31/47 | | | | 750,000 | | | | 783,568 | (c) |
Total Virginia | | | | | | | | | | | | | | | 1,315,063 | |
Washington — 0.4% | | | | | | | | | | | | | | | | |
Washington State Health Care Facilities Authority Revenue, Commonspirit Health, Series A-1, Refunding | | | 4.000 | % | | | 8/1/44 | | | | 1,250,000 | | | | 1,200,999 | |
Wisconsin — 1.4% | | | | | | | | | | | | | | | | |
Public Finance Authority, WI, Revenue Bonds, The Carmelite System Inc. Obligated Group, Refunding | | | 5.000 | % | | | 1/1/45 | | | | 300,000 | | | | 292,018 | |
Public Finance Authority, WI, Student Housing Revenue: | | | | | | | | | | | | | | | | |
Beyond Boone LLC, Appalachian State University Project, AGM | | | 4.000 | % | | | 7/1/50 | | | | 700,000 | | | | 670,959 | |
See Notes to Financial Statements.
| | | | |
16 | | | | Western Asset Municipal High Income Fund 2024 Semi-Annual Report |
Western Asset Municipal High Income Fund
(Percentages shown based on Fund net assets)
| | | | | | | | | | | | | | | | |
| Security | | Rate | | | Maturity
Date | | | Face Amount | | | Value | |
Wisconsin — continued | | | | | | | | | | | | | | | | |
CHF Wilmington LLC, University of North Carolina at Wilmington Project, AGM | | | 5.000 | % | | | 7/1/53 | | | $ | 2,470,000 | | | $ | 2,536,209 | |
University of Hawai’i Foundation Project, Green Bonds, Series A-1 | | | 4.000 | % | | | 7/1/51 | | | | 790,000 | | | | 649,297 | (d) |
Wisconsin State HEFA Revenue, Bellin Memorial Hospital Inc., Series A | | | 5.500 | % | | | 12/1/52 | | | | 500,000 | | | | 549,302 | |
Total Wisconsin | | | | | | | | | | | | | | | 4,697,785 | |
Total Municipal Bonds (Cost — $303,310,861) | | | | | | | | | | | | | | | 304,911,781 | |
| Municipal Bonds Deposited in Tender Option Bond Trusts (g) — 3.7% | | | | | | | | | | | | | | | | |
New York — 3.7% | | | | | | | | | | | | | | | | |
New York City, NY, Municipal Water Finance Authority, Water & Sewer System Revenue, Second General Resolution Fiscal 2023, Subseries AA-1 | | | 5.250 | % | | | 6/15/52 | | | | 3,055,000 | | | | 3,421,185 | |
New York State Dormitory Authority, State Personal Income Tax Revenue, Series A | | | 4.000 | % | | | 3/15/45 | | | | 4,755,000 | | | | 4,722,087 | |
New York State Urban Development Corp., Sales Tax Revenue, Series 2023 | | | 5.000 | % | | | 3/15/49 | | | | 3,700,000 | | | | 4,087,316 | |
Total Municipal Bonds Deposited in Tender Option Bond Trusts
(Cost — $11,720,705) | | | | | | | | | | | | | | | 12,230,588 | |
Total Investments before Short-Term Investments
(Cost — $315,031,566) | | | | | | | | | | | | | | | 317,142,369 | |
| Short-Term Investments — 5.5% | | | | | | | | | | | | | | | | |
| Municipal Bonds — 5.5% | | | | | | | | | | | | | | | | |
Alabama — 0.1% | | | | | | | | | | | | | | | | |
West Jefferson, AL, Industrial Development Board, Solid Waste Disposal Revenue, Alabama Power Co. Miller Plant Project | | | 3.500 | % | | | 12/1/38 | | | | 500,000 | | | | 500,000 | (c)(h)(i) |
Delaware — 0.4% | | | | | | | | | | | | | | | | |
University of Delaware Revenue, Series 2005, Refunding, SPA - TD Bank N.A. | | | 3.150 | % | | | 11/1/35 | | | | 1,400,000 | | | | 1,400,000 | (h)(i) |
Florida — 0.5% | | | | | | | | | | | | | | | | |
Highlands County, FL, Health Facilities Authority Revenue, Adventist Health System, Refunding | | | 4.550 | % | | | 11/15/32 | | | | 100,000 | | | | 100,000 | (h)(i) |
See Notes to Financial Statements.
| | | | | | |
| Western Asset Municipal High Income Fund 2024 Semi-Annual Report | | | | | 17 | |
Schedule of investments (unaudited) (cont’d)
January 31, 2024
Western Asset Municipal High Income Fund
(Percentages shown based on Fund net assets)
| | | | | | | | | | | | | | | | |
| Security | | Rate | | | Maturity
Date | | | Face Amount | | | Value | |
Florida — continued | | | | | | | | | | | | | | | | |
Hillsborough County, FL, IDA, Healthcare System Revenue, Baycare Health System, Series C, Refunding, LOC - TD Bank N.A. | | | 3.800 | % | | | 11/1/38 | | | $ | 1,000,000 | | | $ | 1,000,000 | (h)(i) |
Orange County, FL, Health Facilities Authority Revenue, Orlando Regional Healthcare System, Series E, Refunding, LOC - TD Bank N.A. | | | 3.800 | % | | | 10/1/26 | | | | 400,000 | | | | 400,000 | (h)(i) |
Total Florida | | | | | | | | | | | | | | | 1,500,000 | |
Georgia — 2.5% | | | | | | | | | | | | | | | | |
Bartow County, GA, Development Authority Revenue, Solid Waste Disposal Facility, Georgia Power Company Plant Bowen Project | | | 3.400 | % | | | 11/1/62 | | | | 8,250,000 | | | | 8,250,000 | (c)(h)(i) |
Mississippi — 0.1% | | | | | | | | | | | | | | | | |
Mississippi State Business Finance Corp., Gulf Opportunity Zone, IDR, Chevron USA Inc. Project, Series A | | | 3.200 | % | | | 11/1/35 | | | | 200,000 | | | | 200,000 | (h)(i) |
New York — 1.7% | | | | | | | | | | | | | | | | |
New York City, NY, GO: | | | | | | | | | | | | | | | | |
Subseries A-3, SPA - Bank of Montreal | | | 3.150 | % | | | 9/1/49 | | | | 2,200,000 | | | | 2,200,000 | (h)(i) |
Subseries F-6, SPA - JPMorgan Chase & Co. | | | 3.100 | % | | | 6/1/44 | | | | 1,500,000 | | | | 1,500,000 | (h)(i) |
New York City, NY, HDC, MFH Revenue, Boricua Village Apartment Site, Series A-2, LOC - Citibank N.A. | | | 3.500 | % | | | 9/1/42 | | | | 250,000 | | | | 250,000 | (c)(h)(i) |
New York City, NY, Municipal Water Finance Authority, Water & Sewer System Revenue, Second General Resolution, Series DD-1, Refunding, SPA - TD Bank N.A. | | | 3.150 | % | | | 6/15/43 | | | | 400,000 | | | | 400,000 | (h)(i) |
New York City, NY, TFA Revenue Future Tax Secured, Subordinated, Series A, SPA - JPMorgan Chase & Co. | | | 3.100 | % | | | 8/1/45 | | | | 1,200,000 | | | | 1,200,000 | (h)(i) |
Total New York | | | | | | | | | | | | | | | 5,550,000 | |
Oregon — 0.1% | | | | | | | | | | | | | | | | |
Oregon State Facilities Authority Revenue, Peacehealth, Series B, Refunding, LOC - TD Bank N.A. | | | 3.150 | % | | | 8/1/34 | | | | 200,000 | | | | 200,000 | (h)(i) |
See Notes to Financial Statements.
| | | | |
18 | | | | Western Asset Municipal High Income Fund 2024 Semi-Annual Report |
Western Asset Municipal High Income Fund
(Percentages shown based on Fund net assets)
| | | | | | | | | | | | | | | | |
| Security | | Rate | | | Maturity
Date | | | Face Amount | | | Value | |
Texas — 0.1% | | | | | | | | | | | | | | | | |
Harris County, TX, Health Facilities Development Corp. Revenue, Methodist Hospital System, Series A-1, Refunding | | | 3.100 | % | | | 12/1/41 | | | $ | 500,000 | | | $ | 500,000 | (h)(i) |
Total Short-Term Investments (Cost — $18,100,000) | | | | | | | | | | | | | | | 18,100,000 | |
Total Investments — 101.3% (Cost — $333,131,566) | | | | | | | | | | | | | | | 335,242,369 | |
TOB Floating Rate Notes — (1.9)% | | | | | | | | | | | | | | | (6,265,000 | ) |
Other Assets in Excess of Other Liabilities — 0.6% | | | | | | | | | | | | | | | 2,098,249 | |
Total Net Assets — 100.0% | | | | | | | | | | | | | | $ | 331,075,618 | |
| * | Non-income producing security. |
| (a) | Maturity date shown represents the mandatory tender date. |
| (b) | Variable rate security. Interest rate disclosed is as of the most recent information available. Certain variable rate securities are not based on a published reference rate and spread but are determined by the issuer or agent and are based on current market conditions. These securities do not indicate a reference rate and spread in their description above. |
| (c) | Income from this issue is considered a preference item for purposes of calculating the alternative minimum tax (“AMT”). |
| (d) | Security is exempt from registration under Rule 144A of the Securities Act of 1933. This security may be resold in transactions that are exempt from registration, normally to qualified institutional buyers. This security has been deemed liquid pursuant to guidelines approved by the Board of Trustees. |
| (e) | The coupon payment on this security is currently in default as of January 31, 2024. |
| (f) | The maturity principal is currently in default as of January 31, 2024. |
| (g) | Represents securities deposited into a special purpose entity, referred to as a Tender Option Bond (“TOB”) trust (Note 1). |
| (h) | Variable rate demand obligations (“VRDOs”) have a demand feature under which the Fund can tender them back to the issuer or liquidity provider on no more than 7 days notice. The interest rate generally resets on a daily or weekly basis and is determined on the specific interest rate reset date by the remarketing agent, pursuant to a formula specified in official documents for the VRDO, or set at the highest rate allowable as specified in official documents for the VRDO. VRDOs are benchmarked to the Securities Industry and Financial Markets Association (“SIFMA”) Municipal Swap Index. The SIFMA Municipal Swap Index is compiled from weekly interest rate resets of tax-exempt VRDOs reported to the Municipal Securities Rulemaking Board’s Short-term Obligation Rate Transparency System. |
| (i) | Maturity date shown is the final maturity date. The security may be sold back to the issuer before final maturity. |
See Notes to Financial Statements.
| | | | | | |
| Western Asset Municipal High Income Fund 2024 Semi-Annual Report | | | | | 19 | |
Schedule of investments (unaudited) (cont’d)
January 31, 2024
Western Asset Municipal High Income Fund
| | |
Abbreviation(s) used in this schedule: |
| |
| AGM | | — Assured Guaranty Municipal Corporation — Insured Bonds |
| |
| BAM | | — Build America Mutual — Insured Bonds |
| |
| CAB | | — Capital Appreciation Bonds |
| |
| CDA | | — Communities Development Authority |
| |
| CSCE | | — Charter School Credit Enhancement |
| |
| DFA | | — Development Finance Agency |
| |
| EDA | | — Economic Development Authority |
| |
| EDC | | — Economic Development Corporation |
| |
| EFA | | — Educational Facilities Authority |
| |
| GO | | — General Obligation |
| |
| GTD | | — Guaranteed |
| |
| HDA | | — Housing Development Authority |
| |
| HDC | | — Housing Development Corporation |
| |
| HEFA | | — Health & Educational Facilities Authority |
| |
| IDA | | — Industrial Development Authority |
| |
| IDR | | — Industrial Development Revenue |
| |
| LOC | | — Letter of Credit |
| |
| MFA | | — Municipal Finance Authority |
| |
| MFH | | — Multi-Family Housing |
| |
| MTA | | — Metropolitan Transportation Authority |
| |
| PCFA | | — Pollution Control Financing Authority |
| |
| PEA | | — Public Energy Authority |
| |
| PFA | | — Public Facilities Authority |
| |
| SPA | | — Standby Bond Purchase Agreement — Insured Bonds |
| |
| TFA | | — Transitional Finance Authority |
At January 31, 2024, the Fund had the following open futures contracts:
| | | | | | | | | | | | | | | | | | | | |
| | | Number of
Contracts | | | Expiration
Date | | | Notional
Amount | | | Market
Value | | | Unrealized
Appreciation | |
| Contracts to Buy: | | | | | | | | | | | | | | | | | | | | |
| U.S. Treasury Ultra Long-Term Bonds | | | 40 | | | | 3/24 | | | $ | 5,101,555 | | | $ | 5,168,750 | | | $ | 67,195 | |
See Notes to Financial Statements.
| | | | |
20 | | | | Western Asset Municipal High Income Fund 2024 Semi-Annual Report |
Statement of assets and liabilities (unaudited)
January 31, 2024
| | | | |
| |
| Assets: | | | | |
Investments, at value (Cost — $333,131,566) | | $ | 335,242,369 | |
Cash | | | 373,172 | |
Interest receivable | | | 2,752,756 | |
Receivable for Fund shares sold | | | 118,431 | |
Receivable from brokers — net variation margin on open futures contracts | | | 67,195 | |
Prepaid expenses | | | 22,894 | |
| |
| Total Assets | | | 338,576,817 | |
Liabilities: | | | | |
TOB Floating Rate Notes (Note 1) | | | 6,265,000 | |
Payable for Fund shares repurchased | | | 766,482 | |
Distributions payable | | | 146,072 | |
Investment management fee payable | | | 119,970 | |
Interest and commitment fee payable | | | 69,032 | |
Service and/or distribution fees payable | | | 32,010 | |
Trustees’ fees payable | | | 468 | |
Accrued expenses | | | 102,165 | |
Total Liabilities | | | 7,501,199 | |
| Total Net Assets | | $ | 331,075,618 | |
| |
| Net Assets: | | | | |
Par value (Note 7) | | $ | 256 | |
Paid-in capital in excess of par value | | | 355,460,711 | |
Total distributable earnings (loss) | | | (24,385,349) | |
| Total Net Assets | | $ | 331,075,618 | |
| |
| Net Assets: | | | | |
Class A | | | $216,774,396 | |
Class C | | | $7,949,395 | |
Class I | | | $106,351,827 | |
| |
| Shares Outstanding: | | | | |
Class A | | | 16,718,476 | |
Class C | | | 616,370 | |
Class I | | | 8,246,392 | |
| |
| Net Asset Value: | | | | |
Class A (and redemption price) | | | $12.97 | |
Class C* | | | $12.90 | |
Class I (and redemption price) | | | $12.90 | |
| Maximum Public Offering Price Per Share: | | | | |
Class A (based on maximum initial sales charge of 3.75%) | | | $13.48 | |
| * | Redemption price per share is NAV of Class C shares reduced by a 1.00% CDSC if shares are redeemed within one year from purchase payment (Note 2). |
See Notes to Financial Statements.
| | | | | | |
Western Asset Municipal High Income Fund 2024 Semi-Annual Report | | | | | 21 | |
Statement of operations (unaudited)
For the Six Months Ended January 31, 2024
| | | | |
| |
| Investment Income: | | | | |
Interest | | $ | 7,850,126 | |
| |
| Expenses: | | | | |
Investment management fee (Note 2) | | | 709,379 | |
Service and/or distribution fees (Notes 2 and 5) | | | 184,981 | |
Interest expense (Note 1) | | | 118,073 | |
Transfer agent fees (Notes 2 and 5) | | | 108,775 | |
Registration fees | | | 38,062 | |
Fund accounting fees | | | 34,584 | |
Audit and tax fees | | | 22,101 | |
Legal fees | | | 7,534 | |
Shareholder reports | | | 6,569 | |
Trustees’ fees | | | 3,799 | |
Commitment fees (Note 8) | | | 1,383 | |
Insurance | | | 1,150 | |
Custody fees | | | 341 | |
Miscellaneous expenses | | | 3,602 | |
Total Expenses | | | 1,240,333 | |
Less: Fee waivers and/or expense reimbursements (Notes 2 and 5) | | | (29,201) | |
Net Expenses | | | 1,211,132 | |
| Net Investment Income | | | 6,638,994 | |
| |
| Realized and Unrealized Gain (Loss) on Investments and Futures Contracts (Notes 1, 3 and 4): | | | | |
Net Realized Gain (Loss) From: | | | | |
Investment transactions | | | (995,224) | |
Futures contracts | | | 11,874 | |
Net Realized Loss | | | (983,350) | |
Change in Net Unrealized Appreciation (Depreciation) From: | | | | |
Investments | | | 7,326,817 | |
Futures contracts | | | 67,195 | |
Change in Net Unrealized Appreciation (Depreciation) | | | 7,394,012 | |
| Net Gain on Investments and Futures Contracts | | | 6,410,662 | |
| Increase in Net Assets From Operations | | $ | 13,049,656 | |
See Notes to Financial Statements.
| | | | |
22 | | | | Western Asset Municipal High Income Fund 2024 Semi-Annual Report |
Statements of changes in net assets
| | | | | | | | |
For the Six Months Ended January 31, 2024 (unaudited) and the Year Ended July 31, 2023 | | 2024 | | | 2023 | |
| | |
| Operations: | | | | | | | | |
Net investment income | | $ | 6,638,994 | | | $ | 13,152,688 | |
Net realized loss | | | (983,350) | | | | (5,576,652) | |
Change in net unrealized appreciation (depreciation) | | | 7,394,012 | | | | (8,056,277) | |
Increase (Decrease) in Net Assets From Operations | | | 13,049,656 | | | | (480,241) | |
| | |
| Distributions to Shareholders From (Notes 1 and 6): | | | | | | | | |
Total distributable earnings | | | (6,520,489) | | | | (13,080,954) | |
Decrease in Net Assets From Distributions to Shareholders | | | (6,520,489) | | | | (13,080,954) | |
| | |
| Fund Share Transactions (Note 7): | | | | | | | | |
Net proceeds from sale of shares | | | 50,257,007 | | | | 84,051,826 | |
Reinvestment of distributions | | | 5,637,105 | | | | 11,132,933 | |
Cost of shares repurchased | | | (53,998,556) | | | | (135,949,737) | |
Increase (Decrease) in Net Assets From Fund Share Transactions | | | 1,895,556 | | | | (40,764,978) | |
| | |
| Increase (Decrease) in Net Assets | | | 8,424,723 | | | | (54,326,173) | |
| | |
| Net Assets: | | | | | | | | |
Beginning of period | | | 322,650,895 | | | | 376,977,068 | |
End of period | | $ | 331,075,618 | | | $ | 322,650,895 | |
See Notes to Financial Statements.
| | | | | | |
| Western Asset Municipal High Income Fund 2024 Semi-Annual Report | | | | | 23 | |
Financial highlights
| | | | | | | | | | | | | | | | | | | | | | | | |
For a share of each class of beneficial interest outstanding throughout each year ended July 31, unless
otherwise noted: | |
| Class A Shares1 | | 20242 | | | 2023 | | | 2022 | | | 2021 | | | 2020 | | | 2019 | |
| | | | | | |
| Net asset value, beginning of period | | | $12.70 | | | | $13.15 | | | | $14.73 | | | | $14.07 | | | | $14.27 | | | | $14.05 | |
| | | | | | |
| Income (loss) from operations: | | | | | | | | | | | | | | | | | | | | | | | | |
Net investment income | | | 0.26 | | | | 0.49 | | | | 0.42 | | | | 0.46 | | | | 0.51 | | | | 0.61 | |
Net realized and unrealized gain (loss) | | | 0.27 | | | | (0.45) | | | | (1.58) | | | | 0.65 | | | | (0.20) | | | | 0.22 | |
Total income (loss) from operations | | | 0.53 | | | | 0.04 | | | | (1.16) | | | | 1.11 | | | | 0.31 | | | | 0.83 | |
| | | | | | |
| Less distributions from: | | | | | | | | | | | | | | | | | | | | | | | | |
Net investment income | | | (0.26) | | | | (0.49) | | | | (0.42) | | | | (0.45) | | | | (0.51) | | | | (0.61) | |
Total distributions | | | (0.26) | | | | (0.49) | | | | (0.42) | | | | (0.45) | | | | (0.51) | | | | (0.61) | |
| | | | | | |
| Net asset value, end of period | | | $12.97 | | | | $12.70 | | | | $13.15 | | | | $14.73 | | | | $14.07 | | | | $14.27 | |
Total return3 | | | 4.25 | % | | | 0.42 | % | | | (7.96) | % | | | 7.98 | % | | | 2.32 | % | | | 6.09 | % |
| | | | | | |
| Net assets, end of period (millions) | | | $217 | | | | $213 | | | | $236 | | | | $284 | | | | $274 | | | | $283 | |
| | | | | | |
| Ratios to average net assets: | | | | | | | | | | | | | | | | | | | | | | | | |
Gross expenses | | | 0.81 | %4 | | | 0.80 | % | | | 0.83 | % | | | 0.82 | % | | | 0.82 | % | | | 0.83 | % |
Net expenses | | | 0.81 | 4 | | | 0.80 | 5 | | | 0.83 | | | | 0.82 | 5 | | | 0.82 | 5 | | | 0.83 | |
Net investment income | | | 4.17 | 4 | | | 3.91 | | | | 3.03 | | | | 3.19 | | | | 3.66 | | | | 4.36 | |
| | | | | | |
| Portfolio turnover rate | | | 11 | % | | | 20 | % | | | 13 | % | | | 21 | % | | | 28 | % | | | 17 | % |
| 1 | Per share amounts have been calculated using the average shares method. |
| 2 | For the six months ended January 31, 2024 (unaudited). |
| 3 | Performance figures, exclusive of sales charges, may reflect compensating balance arrangements, fee waivers and/or expense reimbursements. In the absence of compensating balance arrangements, fee waivers and/or expense reimbursements, the total return would have been lower. Past performance is no guarantee of future results. Total returns for periods of less than one year are not annualized. |
| 5 | Reflects fee waivers and/or expense reimbursements. |
See Notes to Financial Statements.
| | | | |
24 | | | | Western Asset Municipal High Income Fund 2024 Semi-Annual Report |
| | | | | | | | | | | | | | | | | | | | | | | | |
For a share of each class of beneficial interest outstanding throughout each year ended July 31, unless
otherwise noted: | |
| Class C Shares1 | | 20242 | | | 2023 | | | 2022 | | | 2021 | | | 2020 | | | 2019 | |
| | | | | | |
| Net asset value, beginning of period | | | $12.64 | | | | $13.08 | | | | $14.64 | | | | $14.00 | | | | $14.19 | | | | $13.97 | |
| | | | | | |
| Income (loss) from operations: | | | | | | | | | | | | | | | | | | | | | | | | |
Net investment income | | | 0.22 | | | | 0.42 | | | | 0.34 | | | | 0.38 | | | | 0.44 | | | | 0.53 | |
Net realized and unrealized gain (loss) | | | 0.26 | | | | (0.44) | | | | (1.56) | | | | 0.63 | | | | (0.20) | | | | 0.22 | |
Total income (loss) from operations | | | 0.48 | | | | (0.02) | | | | (1.22) | | | | 1.01 | | | | 0.24 | | | | 0.75 | |
| | | | | | |
| Less distributions from: | | | | | | | | | | | | | | | | | | | | | | | | |
Net investment income | | | (0.22) | | | | (0.42) | | | | (0.34) | | | | (0.37) | | | | (0.43) | | | | (0.53) | |
Total distributions | | | (0.22) | | | | (0.42) | | | | (0.34) | | | | (0.37) | | | | (0.43) | | | | (0.53) | |
| | | | | | |
| Net asset value, end of period | | | $12.90 | | | | $12.64 | | | | $13.08 | | | | $14.64 | | | | $14.00 | | | | $14.19 | |
Total return3 | | | 3.88 | % | | | (0.08) | % | | | (8.40) | % | | | 7.34 | % | | | 1.74 | % | | | 5.50 | % |
| | | | | | |
| Net assets, end of period (000s) | | | $7,949 | | | | $9,148 | | | | $12,926 | | | | $23,250 | | | | $31,104 | | | | $50,857 | |
| | | | | | |
| Ratios to average net assets: | | | | | | | | | | | | | | | | | | | | | | | | |
Gross expenses | | | 1.38 | %4 | | | 1.36 | % | | | 1.39 | % | | | 1.38 | % | | | 1.39 | % | | | 1.40 | % |
Net expenses | | | 1.38 | 4 | | | 1.36 | 5 | | | 1.39 | | | | 1.38 | | | | 1.39 | 5 | | | 1.40 | |
Net investment income | | | 3.60 | 4 | | | 3.34 | | | | 2.46 | | | | 2.64 | | | | 3.10 | | | | 3.81 | |
| | | | | | |
| Portfolio turnover rate | | | 11 | % | | | 20 | % | | | 13 | % | | | 21 | % | | | 28 | % | | | 17 | % |
| 1 | Per share amounts have been calculated using the average shares method. |
| 2 | For the six months ended January 31, 2024 (unaudited). |
| 3 | Performance figures, exclusive of CDSC, may reflect compensating balance arrangements, fee waivers and/or expense reimbursements. In the absence of compensating balance arrangements, fee waivers and/or expense reimbursements, the total return would have been lower. Past performance is no guarantee of future results. Total returns for periods of less than one year are not annualized. |
| 5 | Reflects fee waivers and/or expense reimbursements. |
See Notes to Financial Statements.
| | | | | | |
Western Asset Municipal High Income Fund 2024 Semi-Annual Report | | | | | 25 | |
Financial highlights (cont’d)
| | | | | | | | | | | | | | | | | | | | | | | | |
For a share of each class of beneficial interest outstanding throughout each year ended July 31, unless
otherwise noted: | |
| Class I Shares1 | | 20242 | | | 2023 | | | 2022 | | | 2021 | | | 2020 | | | 2019 | |
| | | | | | |
| Net asset value, beginning of period | | | $12.64 | | | | $13.08 | | | | $14.65 | | | | $14.00 | | | | $14.19 | | | | $13.98 | |
| | | | | | |
| Income (loss) from operations: | | | | | | | | | | | | | | | | | | | | | | | | |
Net investment income | | | 0.27 | | | | 0.51 | | | | 0.44 | | | | 0.48 | | | | 0.54 | | | | 0.63 | |
Net realized and unrealized gain (loss) | | | 0.26 | | | | (0.44) | | | | (1.57) | | | | 0.65 | | | | (0.20) | | | | 0.21 | |
Total income (loss) from operations | | | 0.53 | | | | 0.07 | | | | (1.13) | | | | 1.13 | | | | 0.34 | | | | 0.84 | |
| | | | | | |
| Less distributions from: | | | | | | | | | | | | | | | | | | | | | | | | |
Net investment income | | | (0.27) | | | | (0.51) | | | | (0.44) | | | | (0.48) | | | | (0.53) | | | | (0.63) | |
Total distributions | | | (0.27) | | | | (0.51) | | | | (0.44) | | | | (0.48) | | | | (0.53) | | | | (0.63) | |
| | | | | | |
| Net asset value, end of period | | | $12.90 | | | | $12.64 | | | | $13.08 | | | | $14.65 | | | | $14.00 | | | | $14.19 | |
Total return3 | | | 4.27 | % | | | 0.67 | % | | | (7.79) | % | | | 8.18 | % | | | 2.49 | % | | | 6.21 | % |
| | | | | | |
| Net assets, end of period (millions) | | | $106 | | | | $101 | | | | $128 | | | | $183 | | | | $175 | | | | $196 | |
| | | | | | |
| Ratios to average net assets: | | | | | | | | | | | | | | | | | | | | | | | | |
Gross expenses | | | 0.68 | %4 | | | 0.67 | % | | | 0.70 | % | | | 0.69 | % | | | 0.69 | % | | | 0.70 | % |
Net expenses5,6 | | | 0.62 | 4 | | | 0.62 | | | | 0.66 | | | | 0.65 | | | | 0.65 | | | | 0.65 | |
Net investment income | | | 4.35 | 4 | | | 4.08 | | | | 3.19 | | | | 3.35 | | | | 3.83 | | | | 4.54 | |
| | | | | | |
| Portfolio turnover rate | | | 11 | % | | | 20 | % | | | 13 | % | | | 21 | % | | | 28 | % | | | 17 | % |
| 1 | Per share amounts have been calculated using the average shares method. |
| 2 | For the six months ended January 31, 2024 (unaudited). |
| 3 | Performance figures may reflect compensating balance arrangements, fee waivers and/or expense reimbursements. In the absence of compensating balance arrangements, fee waivers and/or expense reimbursements, the total return would have been lower. Past performance is no guarantee of future results. Total returns for periods of less than one year are not annualized. |
| 5 | As a result of an expense limitation arrangement, effective November 30, 2022, the ratio of total annual fund operating expenses, other than interest, brokerage, taxes, extraordinary expenses and acquired fund fees and expenses, to average net assets of Class I shares did not exceed 0.55%. Total annual fund operating expenses, after waiving and/or reimbursing expenses, exceeded the expense limitation as a result of interest expense. This expense limitation arrangement cannot be terminated prior to December 31, 2025 without the Board of Trustees’ consent. Prior to November 30, 2022, the expense limitation was 0.65%. |
| 6 | Reflects fee waivers and/or expense reimbursements. |
See Notes to Financial Statements.
| | | | |
26 | | | | Western Asset Municipal High Income Fund 2024 Semi-Annual Report |
Notes to financial statements (unaudited)
1. Organization and significant accounting policies
Western Asset Municipal High Income Fund (the “Fund”) is a separate diversified investment series of Legg Mason Partners Income Trust (the “Trust”). The Trust, a Maryland statutory trust, is registered under the Investment Company Act of 1940, as amended (the “1940 Act”), as an open-end management investment company.
The Fund follows the accounting and reporting guidance in Financial Accounting Standards Board (“FASB”) Accounting Standards Codification Topic 946, Financial Services – Investment Companies (“ASC 946”). The following are significant accounting policies consistently followed by the Fund and are in conformity with U.S. generally accepted accounting principles (“GAAP”), including, but not limited to, ASC 946. Estimates and assumptions are required to be made regarding assets, liabilities and changes in net assets resulting from operations when financial statements are prepared. Changes in the economic environment, financial markets and any other parameters used in determining these estimates could cause actual results to differ. Subsequent events have been evaluated through the date the financial statements were issued.
(a) Investment valuation. The valuations for fixed income securities (which may include, but are not limited to, corporate, government, municipal, mortgage-backed, collateralized mortgage obligations and asset-backed securities) and certain derivative instruments are typically the prices supplied by independent third party pricing services, which may use market prices or broker/dealer quotations or a variety of valuation techniques and methodologies. The independent third party pricing services typically use inputs that are observable such as issuer details, interest rates, yield curves, prepayment speeds, credit risks/spreads, default rates and quoted prices for similar securities. Investments in open-end funds are valued at the closing net asset value per share of each fund on the day of valuation. Futures contracts are valued daily at the settlement price established by the board of trade or exchange on which they are traded. If independent third party pricing services are unable to supply prices for a portfolio investment, or if the prices supplied are deemed by the manager to be unreliable, the market price may be determined by the manager using quotations from one or more broker/dealers or at the transaction price if the security has recently been purchased and no value has yet been obtained from a pricing service or pricing broker. When reliable prices are not readily available, such as when the value of a security has been significantly affected by events after the close of the exchange or market on which the security is principally traded, but before the Fund calculates its net asset value, the Fund values these securities as determined in accordance with procedures approved by the Fund’s Board of Trustees.
Pursuant to policies adopted by the Board of Trustees, the Fund’s manager has been designated as the valuation designee and is responsible for the oversight of the daily valuation process. The Fund’s manager is assisted by the Global Fund Valuation Committee (the “Valuation Committee”). The Valuation Committee is responsible for making fair value determinations, evaluating the effectiveness of the Fund’s pricing policies, and reporting to
| | | | | | |
| Western Asset Municipal High Income Fund 2024 Semi-Annual Report | | | | | 27 | |
Notes to financial statements (unaudited) (cont’d)
the Fund’s manager and the Board of Trustees. When determining the reliability of third party pricing information for investments owned by the Fund, the Valuation Committee, among other things, conducts due diligence reviews of pricing vendors, monitors the daily change in prices and reviews transactions among market participants.
The Valuation Committee will consider pricing methodologies it deems relevant and appropriate when making fair value determinations. Examples of possible methodologies include, but are not limited to, multiple of earnings; discount from market of a similar freely traded security; discounted cash-flow analysis; book value or a multiple thereof; risk premium/yield analysis; yield to maturity; and/or fundamental investment analysis. The Valuation Committee will also consider factors it deems relevant and appropriate in light of the facts and circumstances. Examples of possible factors include, but are not limited to, the type of security; the issuer’s financial statements; the purchase price of the security; the discount from market value of unrestricted securities of the same class at the time of purchase; analysts’ research and observations from financial institutions; information regarding any transactions or offers with respect to the security; the existence of merger proposals or tender offers affecting the security; the price and extent of public trading in similar securities of the issuer or comparable companies; and the existence of a shelf registration for restricted securities.
For each portfolio security that has been fair valued pursuant to the policies adopted by the Board of Trustees, the fair value price is compared against the last available and next available market quotations. The Valuation Committee reviews the results of such back testing monthly and fair valuation occurrences are reported to the Board of Trustees quarterly.
The Fund uses valuation techniques to measure fair value that are consistent with the market approach and/or income approach, depending on the type of security and the particular circumstance. The market approach uses prices and other relevant information generated by market transactions involving identical or comparable securities. The income approach uses valuation techniques to discount estimated future cash flows to present value.
GAAP establishes a disclosure hierarchy that categorizes the inputs to valuation techniques used to value assets and liabilities at measurement date. These inputs are summarized in the three broad levels listed below:
| • | | Level 1 — unadjusted quoted prices in active markets for identical investments |
| • | | Level 2 — other significant observable inputs (including quoted prices for similar investments, interest rates, prepayment speeds, credit risk, etc.) |
| • | | Level 3 — significant unobservable inputs (including the Fund’s own assumptions in determining the fair value of investments) |
| | | | |
28 | | | | Western Asset Municipal High Income Fund 2024 Semi-Annual Report |
The inputs or methodologies used to value securities are not necessarily an indication of the risk associated with investing in those securities.
The following is a summary of the inputs used in valuing the Fund’s assets carried at fair value:
| | | | | | | | | | | | | | | | |
| ASSETS | |
| Description | | Quoted Prices
(Level 1) | | | Other Significant
Observable Inputs
(Level 2) | | | Significant Unobservable Inputs
(Level 3) | | | Total | |
| Long-Term Investments†: | | | | | | | | | | | | | | | | |
Municipal Bonds | | | — | | | $ | 304,911,781 | | | | — | | | $ | 304,911,781 | |
Municipal Bonds Deposited in Tender Option Bond Trusts | | | — | | | | 12,230,588 | | | | — | | | | 12,230,588 | |
| Total Long-Term Investments | | | — | | | | 317,142,369 | | | | — | | | | 317,142,369 | |
| Short-Term Investments† | | | — | | | | 18,100,000 | | | | — | | | | 18,100,000 | |
| Total Investments | | | — | | | $ | 335,242,369 | | | | — | | | $ | 335,242,369 | |
| Other Financial Instruments: | | | | | | | | | | | | | | | | |
Futures Contracts†† | | $ | 67,195 | | | | — | | | | — | | | $ | 67,195 | |
| Total | | $ | 67,195 | | | $ | 335,242,369 | | | | — | | | $ | 335,309,564 | |
| † | See Schedule of Investments for additional detailed categorizations. |
| †† | Reflects the unrealized appreciation (depreciation) of the instruments. |
(b) Tender option bonds. The Fund may enter into tender option bond (“TOB”) transactions and may invest in inverse floating rate instruments (“Inverse Floaters”) issued in TOB transactions. The Fund may participate either in structuring an Inverse Floater or purchasing an Inverse Floater in the secondary market. When structuring an Inverse Floater, the Fund deposits securities (typically municipal bonds or other municipal securities) (the “Underlying Bonds”) into a special purpose entity, referred to as a TOB trust. The TOB trust generally issues floating rate notes (“Floaters”) to third parties and residual interest, Inverse Floaters, to the Fund. The Floaters issued by the TOB trust have interest rates which reset weekly and provide the holders of the Floaters the option to tender their notes back to the TOB trust for redemption at par at each reset date. The net proceeds of the sale of the Floaters, after expenses, are received by the Fund and may be invested in additional securities. The Inverse Floaters are inverse floating rate debt instruments, as the return on those bonds is inversely related to changes in a specified interest rate. Distributions on any Inverse Floaters paid to the Fund will be reduced or, in the extreme, eliminated as short-term interest rates rise and will increase when such interest rates fall. Floaters issued by a TOB trust may be senior to the Inverse Floaters held by the Fund. The value and market for Inverse Floaters can be volatile, and Inverse Floaters can have limited liquidity.
An investment in an Inverse Floater structured by the Fund is accounted for as a secured borrowing. The Underlying Bonds deposited into the TOB trust are included in the Fund’s Schedule of Investments and a liability for Floaters (TOB floating rate notes) issued by the
| | | | | | |
| Western Asset Municipal High Income Fund 2024 Semi-Annual Report | | | | | 29 | |
Notes to financial statements (unaudited) (cont’d)
TOB trust is recognized in the Fund’s Statement of Assets and Liabilities. The carrying amount of the TOB trust’s floating rate note obligations as reported on the Statement of Assets and Liabilities approximates its fair value. Interest income, including amortization, on the Underlying Bonds is recognized in the Fund’s Statements of Operations. Interest paid to holders of the Floaters, as well as other expenses related to administration, liquidity, remarketing and trustee services of the TOB trust, are recognized in Interest expense in the Fund’s Statement of Operations. For the six months ended January 31, 2024, the average daily amount of floating rate notes outstanding was $5,460,652 and weighted average interest rate was 4.09%.
(c) Futures contracts. The Fund uses futures contracts generally to gain exposure to, or hedge against, changes in interest rates or gain exposure to, or hedge against, changes in certain asset classes. A futures contract represents a commitment for the future purchase or sale of an asset at a specified price on a specified date.
Upon entering into a futures contract, the Fund is required to deposit cash or securities with a broker in an amount equal to a certain percentage of the contract amount. This is known as the ‘‘initial margin’’ and subsequent payments (‘‘variation margin’’) are made or received by the Fund each day, depending on the daily fluctuation in the value of the contract. For certain futures, including foreign denominated futures, variation margin is not settled daily, but is recorded as a net variation margin payable or receivable. The daily changes in contract value are recorded as unrealized appreciation or depreciation in the Statement of Operations and the Fund recognizes a realized gain or loss when the contract is closed.
Futures contracts involve, to varying degrees, risk of loss in excess of the amounts reflected in the financial statements. In addition, there is the risk that the Fund may not be able to enter into a closing transaction because of an illiquid secondary market.
(d) Credit and market risk. The Fund invests in high-yield instruments that are subject to certain credit and market risks. The yields of high-yield obligations reflect, among other things, perceived credit and market risks. The Fund’s investments in securities rated below investment grade typically involve risks not associated with higher rated securities including, among others, greater risk related to timely and ultimate payment of interest and principal, greater market price volatility and less liquid secondary market trading.
(e) Counterparty risk and credit-risk-related contingent features of derivative instruments. The Fund may invest in certain securities or engage in other transactions where the Fund is exposed to counterparty credit risk in addition to broader market risks. The Fund may invest in securities of issuers, which may also be considered counterparties as trading partners in other transactions. This may increase the risk of loss in the event of default or bankruptcy by the counterparty or if the counterparty otherwise fails to meet its contractual obligations. The Fund’s subadviser attempts to mitigate counterparty risk by (i) periodically assessing the creditworthiness of its trading partners, (ii) monitoring and/or
| | | | |
30 | | | | Western Asset Municipal High Income Fund 2024 Semi-Annual Report |
limiting the amount of its net exposure to each individual counterparty based on its assessment and (iii) requiring collateral from the counterparty for certain transactions. Market events and changes in overall economic conditions may impact the assessment of such counterparty risk by the subadviser. In addition, declines in the values of underlying collateral received may expose the Fund to increased risk of loss.
With exchange traded and centrally cleared derivatives, there is less counterparty risk to the Fund since the exchange or clearinghouse, as counterparty to such instruments, guarantees against a possible default. The clearinghouse stands between the buyer and the seller of the contract; therefore, the credit risk is limited to failure of the clearinghouse. While offset rights may exist under applicable law, the Fund does not have a contractual right of offset against a clearing broker or clearinghouse in the event of a default of the clearing broker or clearinghouse.
The Fund has entered into master agreements, such as an International Swaps and Derivatives Association, Inc. Master Agreement (“ISDA Master Agreement”) or similar agreement, with certain of its derivative counterparties that govern over-the-counter (“OTC”) derivatives and provide for general obligations, representations, agreements, collateral posting terms, netting provisions in the event of default or termination and credit related contingent features. The credit related contingent features include, but are not limited to, a percentage decrease in the Fund’s net assets or net asset value per share over a specified period of time. If these credit related contingent features were triggered, the derivatives counterparty could terminate the positions and demand payment or require additional collateral.
Under an ISDA Master Agreement, the Fund may, under certain circumstances, offset with the counterparty certain derivative financial instruments’ payables and/or receivables with collateral held and/or posted and create one single net payment. However, absent an event of default by the counterparty or a termination of the agreement, the terms of the ISDA Master Agreements do not result in an offset of reported amounts of financial assets and financial liabilities in the Statement of Assets and Liabilities across transactions between the Fund and the applicable counterparty. The enforceability of the right to offset may vary by jurisdiction.
Collateral requirements differ by type of derivative. Collateral or margin requirements are set by the broker or exchange clearinghouse for exchange traded derivatives while collateral terms are contract specific for OTC traded derivatives. Cash collateral that has been pledged to cover obligations of the Fund under derivative contracts, if any, will be reported separately in the Statement of Assets and Liabilities. Securities pledged as collateral, if any, for the same purpose are noted in the Schedule of Investments.
As of January 31, 2024, the Fund did not have any open OTC derivative transactions with credit related contingent features in a net liability position.
| | | | | | |
| Western Asset Municipal High Income Fund 2024 Semi-Annual Report | | | | | 31 | |
Notes to financial statements (unaudited) (cont’d)
(f) Security transactions and investment income. Security transactions are accounted for on a trade date basis. Interest income (including interest income from payment-in-kind securities) is recorded on the accrual basis. Amortization of premiums and accretion of discounts on debt securities are recorded to interest income over the lives of the respective securities, except for premiums on certain callable debt securities, which are amortized to the earliest call date. The cost of investments sold is determined by use of the specific identification method. To the extent any issuer defaults or a credit event occurs that impacts the issuer, the Fund may halt any additional interest income accruals and consider the realizability of interest accrued up to the date of default or credit event.
(g) Distributions to shareholders. Distributions from net investment income of the Fund are declared each business day to shareholders of record and are paid monthly. The Fund intends to satisfy conditions that will enable interest from municipal securities, which is exempt from federal and certain state income taxes, to retain such tax-exempt status when distributed to the shareholders of the Fund. Distributions of net realized gains, if any, are taxable and declared at least annually. Distributions to shareholders of the Fund are recorded on the ex-dividend date and are determined in accordance with income tax regulations, which may differ from GAAP.
(h) Share class accounting. Investment income, common expenses and realized/ unrealized gains (losses) on investments are allocated to the various classes of the Fund on the basis of daily net assets of each class. Fees relating to a specific class are charged directly to that share class.
(i) Compensating balance arrangements. The Fund has an arrangement with its custodian bank whereby a portion of the custodian’s fees is paid indirectly by credits earned on the Fund’s cash on deposit with the bank.
(j) Federal and other taxes. It is the Fund’s policy to comply with the federal income and excise tax requirements of the Internal Revenue Code of 1986 (the “Code”), as amended, applicable to regulated investment companies. Accordingly, the Fund intends to distribute its taxable income and net realized gains, if any, to shareholders in accordance with timing requirements imposed by the Code. Therefore, no federal or state income tax provision is required in the Fund’s financial statements.
Management has analyzed the Fund’s tax positions taken on income tax returns for all open tax years and has concluded that as of July 31, 2023, no provision for income tax is required in the Fund’s financial statements. The Fund’s federal and state income and federal excise tax returns for tax years for which the applicable statutes of limitations have not expired are subject to examination by the Internal Revenue Service and state departments of revenue.
| | | | |
32 | | | | Western Asset Municipal High Income Fund 2024 Semi-Annual Report |
(k) Reclassification. GAAP requires that certain components of net assets be reclassified to reflect permanent differences between financial and tax reporting. These reclassifications have no effect on net assets or net asset value per share.
2. Investment management agreement and other transactions with affiliates
Franklin Templeton Fund Adviser, LLC (“FTFA”) (formerly known as Legg Mason Partners Fund Advisor, LLC prior to November 30, 2023) is the Fund’s investment manager and Western Asset Management Company, LLC (“Western Asset”) is the Fund’s subadviser. FTFA and Western Asset are indirect, wholly-owned subsidiaries of Franklin Resources, Inc. (“Franklin Resources”).
Under the investment management agreement, the Fund pays an investment management fee, calculated daily and paid monthly, at an annual rate of 0.45% of the Fund’s daily net assets.
FTFA provides administrative and certain oversight services to the Fund. FTFA delegates to the subadviser the day-to-day portfolio management of the Fund. For its services, FTFA pays Western Asset a fee monthly, at an annual rate equal to 70% of the net management fee it receives from the Fund.
As a result of an expense limitation arrangement between the Fund and FTFA, the ratio of total annual fund operating expenses, other than interest, brokerage, taxes, extraordinary expenses and acquired fund fees and expenses, to average net assets of Class I shares did not exceed 0.55%. Total annual fund operating expenses, after waiving and/or reimbursing expenses, exceeded the expense limitation for Class I shares as a result of interest expense. This expense limitation arrangement cannot be terminated prior to December 31, 2025 without the Board of Trustees’ consent.
During the six months ended January 31, 2024, fees waived and/or expenses reimbursed amounted to $29,201.
FTFA is permitted to recapture amounts waived and/or reimbursed to a class within two years after the fiscal year in which FTFA earned the fee or incurred the expense if the class’ total annual fund operating expenses have fallen to a level below the expense limitation (“expense cap”) in effect at the time the fees were earned or the expenses incurred. In no case will FTFA recapture any amount that would result, on any particular business day of the Fund, in the class’ total annual fund operating expenses exceeding the expense cap or any other lower limit then in effect.
| | | | | | |
| Western Asset Municipal High Income Fund 2024 Semi-Annual Report | | | | | 33 | |
Notes to financial statements (unaudited) (cont’d)
Pursuant to these arrangements, at January 31, 2024, the Fund had remaining fee waivers and/or expense reimbursements subject to recapture by FTFA and respective dates of expiration as follows:
| | | | | | | | | | | | |
| | | Class A | | | Class C | | | Class I | |
| Expires July 31, 2024 | | | — | | | | — | | | $ | 67,436 | |
| Expires July 31, 2025 | | $ | 357 | | | $ | 16 | | | | 52,327 | |
| Expires July 31, 2026 | | | — | | | | — | | | | 29,201 | |
| Total fee waivers/expense reimbursements subject to recapture | | $ | 357 | | | $ | 16 | | | $ | 148,964 | |
For the six months ended January 31, 2024, FTFA did not recapture any fees.
Franklin Distributors, LLC (“Franklin Distributors”) serves as the Fund’s sole and exclusive distributor. Franklin Distributors is an indirect, wholly-owned broker-dealer subsidiary of Franklin Resources. Franklin Templeton Investor Services, LLC (“Investor Services”) serves as the Fund’s shareholder servicing agent and acts as the Fund’s transfer agent and dividend-paying agent. Investor Services is an indirect, wholly-owned subsidiary of Franklin Resources. Each class of shares of the Fund pays transfer agent fees to Investor Services for its performance of shareholder servicing obligations. Investor Services charges account-based fees based on the number of individual shareholder accounts, as well as a fixed percentage fee based on the total account-based fees charged. In addition, each class reimburses Investor Services for out of pocket expenses incurred. For the six months ended January 31, 2024, the Fund incurred transfer agent fees as reported on the Statement of Operations, of which $792 was earned by Investor Services.
There is a maximum initial sales charge of 3.75% for Class A shares. There is a contingent deferred sales charge (“CDSC”) of 1.00% on Class C shares, which applies if redemption occurs within 12 months from purchase payment. In certain cases, Class A shares have a 1.00% CDSC, which applies if redemption occurs within 18 months from purchase payment. This CDSC only applies to those purchases of Class A shares, which, when combined with current holdings of other shares of funds sold by Franklin Distributors, equal or exceed $250,000 in the aggregate. These purchases do not incur an initial sales charge.
For the six months ended January 31, 2024, sales charges retained by and CDSCs paid to Franklin Distributors and its affiliates, if any, were as follows:
| | | | |
| | | Class A | |
| Sales charges | | $ | 1,871 | |
| CDSCs | | | 886 | |
All officers and one Trustee of the Trust are employees of Franklin Resources or its affiliates and do not receive compensation from the Trust.
The Fund is permitted to purchase or sell short-term variable rate demand obligations from or to certain other affiliated funds or portfolios under specified conditions outlined in procedures adopted by the Board of Trustees. The procedures have been designed to
| | | | |
34 | | | | Western Asset Municipal High Income Fund 2024 Semi-Annual Report |
provide assurance that any purchase or sale of securities by the Fund from or to another fund or portfolio that is, or could be considered, an affiliate by virtue of having a common investment manager or subadviser (or affiliated investment manager or subadviser), common Trustees and/or common officers complies with Rule 17a-7 under the 1940 Act. Further, as defined under the procedures, each transaction is effected at the current market price. For the six months ended January 31, 2024, such purchase and sale transactions (excluding accrued interest) were $28,770,000 and $19,070,000, respectively.
3. Investments
During the six months ended January 31, 2024, the aggregate cost of purchases and proceeds from sales of investments (excluding short-term investments) were as follows:
| | | | |
| Purchases | | $ | 35,517,717 | |
| Sales | | | 50,338,424 | |
At January 31, 2024, the aggregate cost of investments and the aggregate gross unrealized appreciation and depreciation of investments for federal income tax purposes were substantially as follows:
| | | | | | | | | | | | | | | | |
| | | Cost* | | | Gross
Unrealized
Appreciation | | | Gross Unrealized
Depreciation | | | Net
Unrealized
Appreciation | |
| Securities | | $ | 326,866,566 | | | $ | 12,794,736 | | | $ | (10,683,933) | | | $ | 2,110,803 | |
| Futures contracts | | | — | | | | 67,195 | | | | — | | | | 67,195 | |
| * | Cost of investments for federal income tax purposes includes the value of Inverse Floaters issued in TOB transactions (Note 1). |
4. Derivative instruments and hedging activities
Below is a table, grouped by derivative type, that provides information about the fair value and the location of derivatives within the Statement of Assets and Liabilities at January 31, 2024.
| | | | |
| ASSET DERIVATIVES1 | |
| | | Interest Rate Risk | |
| Futures contracts2 | | $ | 67,195 | |
| 1 | Generally, the balance sheet location for asset derivatives is receivables/net unrealized appreciation and for liability derivatives is payables/net unrealized depreciation. |
| 2 | Includes cumulative unrealized appreciation (depreciation) of futures contracts as reported in the Schedule of Investments. Only net variation margin is reported within the receivables and/or payables on the Statement of Assets and Liabilities. |
| | | | | | |
| Western Asset Municipal High Income Fund 2024 Semi-Annual Report | | | | | 35 | |
Notes to financial statements (unaudited) (cont’d)
The following tables provide information about the effect of derivatives and hedging activities on the Fund’s Statement of Operations for the six months ended January 31, 2024. The first table provides additional detail about the amounts and sources of gains (losses) realized on derivatives during the period. The second table provides additional information about the change in net unrealized appreciation (depreciation) resulting from the Fund’s derivatives and hedging activities during the period.
| | | | |
| AMOUNT OF NET REALIZED GAIN (LOSS) ON DERIVATIVES RECOGNIZED | |
| | | Interest
Rate Risk | |
| Futures contracts | | $ | 11,874 | |
| | | | |
| CHANGE IN NET UNREALIZED APPRECIATION (DEPRECIATION) ON DERIVATIVES RECOGNIZED | |
| | | Interest
Rate Risk | |
| Futures contracts | | $ | 67,195 | |
During the six months ended January 31, 2024, the volume of derivative activity for the Fund was as follows:
| | | | |
| | | Average Market
Value | |
| Futures contracts (to buy) | | $ | 738,393 | |
5. Class specific expenses, waivers and/or expense reimbursements
The Fund has adopted a Rule 12b-1 shareholder services and distribution plan and under that plan the Fund pays service and/or distribution fees with respect to its Class A and Class C shares calculated at the annual rate of 0.15% and 0.70% of the average daily net assets of each class, respectively. Service and/or distribution fees are accrued daily and paid monthly.
For the six months ended January 31, 2024, class specific expenses were as follows:
| | | | | | | | |
| | | Service and/or
Distribution Fees | | | Transfer Agent
Fees | |
| Class A | | $ | 155,291 | | | $ | 64,002 | |
| Class C | | | 29,690 | | | | 3,374 | |
| Class I | | | — | | | | 41,399 | |
| Total | | $ | 184,981 | | | $ | 108,775 | |
| | | | |
36 | | | | Western Asset Municipal High Income Fund 2024 Semi-Annual Report |
For the six months ended January 31, 2024, waivers and/or expense reimbursements by class were as follows:
| | | | |
| | | Waivers/Expense
Reimbursements | |
| Class A | | | — | |
| Class C | | | — | |
| Class I | | $ | 29,201 | |
| Total | | $ | 29,201 | |
6. Distributions to shareholders by class
| | | | | | | | |
| | | Six Months Ended
January 31, 2024 | | | Year Ended July 31, 2023 | |
| Net Investment Income: | | | | | | | | |
| Class A | | $ | 4,237,098 | | | $ | 8,520,426 | |
| Class C | | | 149,245 | | | | 348,191 | |
| Class I | | | 2,134,146 | | | | 4,212,337 | |
| Total | | $ | 6,520,489 | | | $ | 13,080,954 | |
7. Shares of beneficial interest
At January 31, 2024, the Trust had an unlimited number of shares of beneficial interest authorized with a par value of $0.00001 per share. The Fund has the ability to issue multiple classes of shares. Each class of shares represents an identical interest and has the same rights, except that each class bears certain direct expenses, including those specifically related to the distribution of its shares.
Transactions in shares of each class were as follows:
| | | | | | | | | | | | | | | | |
| | | Six Months Ended
January 31, 2024 | | | Year Ended
July 31, 2023 | |
| | | Shares | | | Amount | | | Shares | | | Amount | |
| Class A | | | | | | | | | | | | | | | | |
| Shares sold | | | 1,849,086 | | | $ | 23,234,068 | | | | 2,896,607 | | | $ | 36,615,091 | |
| Shares issued on reinvestment | | | 312,664 | | | | 3,901,878 | | | | 620,330 | | | | 7,805,336 | |
| Shares repurchased | | | (2,190,031) | | | | (27,357,644) | | | | (4,706,357) | | | | (59,398,992) | |
| Net decrease | | | (28,281) | | | $ | (221,698) | | | | (1,189,420) | | | $ | (14,978,565) | |
| | | | |
| Class C | | | | | | | | | | | | | | | | |
| Shares sold | | | 68,869 | | | $ | 860,325 | | | | 124,383 | | | $ | 1,554,745 | |
| Shares issued on reinvestment | | | 11,358 | | | | 140,788 | | | | 26,253 | | | | 328,543 | |
| Shares repurchased | | | (187,794) | | | | (2,340,679) | | | | (414,798) | | | | (5,180,671) | |
| Net decrease | | | (107,567) | | | $ | (1,339,566) | | | | (264,162) | | | $ | (3,297,383) | |
| | | | | | |
| Western Asset Municipal High Income Fund 2024 Semi-Annual Report | | | | | 37 | |
Notes to financial statements (unaudited) (cont’d)
| | | | | | | | | | | | | | | | |
| | | Six Months Ended
January 31, 2024 | | | Year Ended
July 31, 2023 | |
| | | Shares | | | Amount | | | Shares | | | Amount | |
| Class I | | | | | | | | | | | | | | | | |
| Shares sold | | | 2,097,910 | | | $ | 26,162,614 | | | | 3,648,840 | | | $ | 45,881,990 | |
| Shares issued on reinvestment | | | 128,430 | | | | 1,594,439 | | | | 239,527 | | | | 2,999,054 | |
| Shares repurchased | | | (1,954,712) | | | | (24,300,233) | | | | (5,710,145) | | | | (71,370,074) | |
| Net increase (decrease) | | | 271,628 | | | $ | 3,456,820 | | | | (1,821,778) | | | $ | (22,489,030) | |
8. Redemption facility
The Fund, together with other U.S. registered and foreign investment funds (collectively, the “Borrowers”) managed by Franklin Resources or its affiliates, is a borrower in a joint syndicated senior unsecured credit facility totaling $2.675 billion (the “Global Credit Facility”). The Global Credit Facility provides a source of funds to the Borrowers for temporary and emergency purposes, including the ability to meet future unanticipated or unusually large redemption requests. Unless renewed, the Global Credit Facility will terminate on January 31, 2025.
Under the terms of the Global Credit Facility, the Fund shall, in addition to interest charged on any borrowings made by the Fund and other costs incurred by the Fund, pay its share of fees and expenses incurred in connection with the implementation and maintenance of the Global Credit Facility, based upon its relative share of the aggregate net assets of all the Borrowers, including an annual commitment fee of 0.15% based upon the unused portion of the Global Credit Facility. These fees are reflected in the Statement of Operations. The Fund did not utilize the Global Credit Facility during the six months ended January 31, 2024.
9. Deferred capital losses
As of July 31, 2023, the Fund had deferred capital losses of $27,147,340, which have no expiration date, that will be available to offset future taxable capital gains.
| | | | |
38 | | | | Western Asset Municipal High Income Fund 2024 Semi-Annual Report |
Western Asset
Municipal High Income Fund
Trustees
Robert Abeles, Jr.
Jane F. Dasher
Anita L. DeFrantz
Susan B. Kerley
Michael Larson
Ronald L. Olson
Avedick B. Poladian
William E.B. Siart
Chairman
Jaynie M. Studenmund
Peter J. Taylor
Jane Trust
Investment manager
Franklin Templeton Fund Adviser, LLC*
Subadviser
Western Asset Management Company, LLC
Distributor
Franklin Distributors, LLC
Custodian
The Bank of New York Mellon
| * | Formerly known as Legg Mason Partners Fund Advisor, LLC. |
Transfer agent
Franklin Templeton Investor Services, LLC
3344 Quality Drive
Rancho Cordova, CA 95670-7313
Independent registered public accounting firm
PricewaterhouseCoopers LLP Baltimore, MD
Western Asset Municipal High Income Fund
The Fund is a separate investment series of Legg Mason Partners Income Trust, a Maryland statutory trust.
Western Asset Municipal High Income Fund
Legg Mason Funds
620 Eighth Avenue, 47th Floor
New York, NY 10018
The Fund files its complete schedule of portfolio holdings with the Securities and Exchange Commission (“SEC”) for the first and third quarters of each fiscal year as an exhibit to its reports on Form N-PORT. The Fund’s Forms N-PORT are available on the SEC’s website at www.sec.gov. To obtain information on Form N-PORT, shareholders can call the Fund at 877-6LM-FUND/656-3863.
Information on how the Fund voted proxies relating to portfolio securities during the prior 12-month period ended June 30th of each year and a description of the policies and procedures that the Fund uses to determine how to vote proxies related to portfolio transactions are available (1) without charge, upon request, by calling the Fund at 877-6LM-FUND/656-3863, (2) at www.franklintempleton.com and (3) on the SEC’s website at www.sec.gov.
This report is submitted for the general information of the shareholders of Western Asset Municipal High Income Fund. This report is not authorized for distribution to prospective investors in the Fund unless preceded or accompanied by a current prospectus.
Investors should consider the Fund’s investment objectives, risks, charges and expenses carefully before investing. The prospectus contains this and other important information about the Fund. Please read the prospectus carefully before investing.
www.franklintempleton.com
© 2024 Franklin Distributors, LLC, Member FINRA/SIPC. All rights reserved.
Legg Mason Funds Privacy and Security Notice
Your Privacy Is Our Priority
Franklin Templeton* is committed to safeguarding your personal information. This notice is designed to provide you with a summary of the non-public personal information Franklin Templeton may collect and maintain about current or former individual investors; our policy regarding the use of that information; and the measures we take to safeguard the information. We do not sell individual investors’ non-public personal information to anyone and only share it as described in this notice.
Information We Collect
When you invest with us, you provide us with your non-public personal information. We collect and use this information to service your accounts and respond to your requests. The non-public personal information we may collect falls into the following categories:
| • | | Information we receive from you or your financial intermediary on applications or other forms, whether we receive the form in writing or electronically. For example, this information may include your name, address, tax identification number, birth date, investment selection, beneficiary information, and your personal bank account information and/or email address if you have provided that information. |
| • | | Information about your transactions and account history with us, or with other companies that are part of Franklin Templeton, including transactions you request on our website or in our app. This category also includes your communications to us concerning your investments. |
| • | | Information we receive from third parties (for example, to update your address if you move, obtain or verify your email address or obtain additional information to verify your identity). |
| • | | Information collected from you online, such as your IP address or device ID and data gathered from your browsing activity and location. (For example, we may use cookies to collect device and browser information so our website recognizes your online preferences and device information.) Our website contains more information about cookies and similar technologies and ways you may limit them. |
| • | | Other general information that we may obtain about you such as demographic information. |
Disclosure Policy
To better service your accounts and process transactions or services you requested, we may share non-public personal information with other Franklin Templeton companies. From time to time we may also send you information about products/services offered by other Franklin Templeton companies although we will not share your non-public personal information with these companies without first offering you the opportunity to prevent that sharing.
We will only share non-public personal information with outside parties in the limited circumstances permitted by law. For example, this includes situations where we need to share information with companies who work on our behalf to service or maintain your account or process transactions you requested, when the disclosure is to companies assisting us with our own marketing efforts, when the disclosure is to a party representing you, or when required by law (for example, in response to legal process). Additionally, we will ensure that any outside
|
| NOT PART OF THE SEMI-ANNUAL REPORT |
Legg Mason Funds Privacy and Security Notice (cont’d)
companies working on our behalf, or with whom we have joint marketing agreements, are under contractual obligations to protect the confidentiality of your information, and to use it only to provide the services we asked them to perform.
Confidentiality and Security
Our employees are required to follow procedures with respect to maintaining the confidentiality of our investors’ non-public personal information. Additionally, we maintain physical, electronic and procedural safeguards to protect the information. This includes performing ongoing evaluations of our systems containing investor information and making changes when appropriate.
At all times, you may view our current privacy notice on our website at franklintempleton.com or contact us for a copy at (800) 632-2301.
*For purposes of this privacy notice Franklin Templeton shall refer to the following entities:
Fiduciary Trust International of the South (FTIOS), as custodian for individual retirement plans Franklin Advisers, Inc.
Franklin Distributors, LLC, including as program manager of the Franklin Templeton 529 College Savings Plan and the NJBEST 529 College Savings Plan
Franklin Mutual Advisers, LLC
Franklin, Templeton and Mutual Series Funds
Franklin Templeton Institutional, LLC
Franklin Templeton Investments Corp., Canada
Franklin Templeton Investments Management, Limited UK
Franklin Templeton Portfolio Advisors, Inc.
Legg Mason Funds serviced by Franklin Templeton Investor Services, LLC
Templeton Asset Management, Limited
Templeton Global Advisors, Limited
Templeton Investment Counsel, LLC
If you are a customer of other Franklin Templeton affiliates and you receive notices from them, you will need to read those notices separately.
|
| NOT PART OF THE SEMI-ANNUAL REPORT |
www.franklintempleton.com
© 2024 Franklin Distributors, LLC, Member FINRA/SIPC. All rights reserved.
FD02173 3/24 SR24-4841
Not applicable.
| ITEM 3. | AUDIT COMMITTEE FINANCIAL EXPERT. |
Not applicable.
| ITEM 4. | PRINCIPAL ACCOUNTANT FEES AND SERVICES. |
Not applicable.
| ITEM 5. | AUDIT COMMITTEE OF LISTED REGISTRANTS. |
Not applicable.
| ITEM 6. | SCHEDULE OF INVESTMENTS. |
Included herein under Item 1.
| ITEM 7. | DISCLOSURE OF PROXY VOTING POLICIES AND PROCEDURES FOR CLOSED-END MANAGEMENT INVESTMENT COMPANIES. |
Not applicable.
| ITEM 8. | PORTFOLIO MANAGERS OF CLOSED-END MANAGEMENT INVESTMENT COMPANIES. |
Not applicable.
| ITEM 9. | PURCHASES OF SECURITIES BY CLOSED-END MANAGEMENT INVESTMENT COMPANY AND AFFILIATED PURCHASERS. |
Not applicable.
| ITEM 10. | SUBMISSION OF MATTERS TO A VOTE OF SECURITY HOLDERS. |
Not applicable.
| ITEM 11. | CONTROLS AND PROCEDURES. |
| | (a) | The registrant’s principal executive officer and principal financial officer have concluded that the registrant’s disclosure controls and procedures (as defined in Rule 30a- 3(c) under the Investment Company Act of 1940, as amended (the “1940 Act”)) are effective as of a date within 90 days of the filing date of this report that includes the disclosure required by this paragraph, based on their evaluation of the disclosure controls and procedures required by Rule 30a-3(b) under the 1940 Act and 15d-15(b) under the Securities Exchange Act of 1934. |
| | (b) | There were no changes in the registrant’s internal control over financial reporting (as defined in Rule 30a-3(d) under the 1940 Act) that occurred during the period covered by this report that have materially affected, or are likely to materially affect the registrant’s internal control over financial reporting. |
| ITEM 12. | DISCLOSURE OF SECURITIES LENDING ACTIVITIES FOR CLOSED-END MANAGEMENT INVESTMENT COMPANIES. |
Not applicable.
| ITEM 13. | RECOVERY OF ERRONEOUSLY AWARDED COMPENSATION. |
(a) Not applicable.
(b) Not applicable.
(a) (1) Not applicable.
Exhibit 99.CODE ETH
(a) (2) Certifications pursuant to section 302 of the Sarbanes-Oxley Act of 2002 attached hereto.
Exhibit 99.CERT
(b) Certifications pursuant to Section 906 of the Sarbanes-Oxley Act of 2002 attached hereto.
Exhibit 99.906CERT
SIGNATURES
Pursuant to the requirements of the Securities Exchange Act of 1934 and the Investment Company Act of 1940, the registrant has duly caused this Report to be signed on its behalf by the undersigned, there unto duly authorized.
| | |
| Legg Mason Partners Income Trust |
| |
| By: | | /s/ Jane Trust |
| | Jane Trust |
| | Chief Executive Officer |
| |
| Date: | | March 25, 2024 |
Pursuant to the requirements of the Securities Exchange Act of 1934 and the Investment Company Act of 1940, this report has been signed below by the following persons on behalf of the registrant and in the capacities and on the dates indicated.
| | |
| By: | | /s/ Jane Trust |
| | Jane Trust |
| | Chief Executive Officer |
| |
| Date: | | March 25, 2024 |
| | |
| By: | | /s/ Christopher Berarducci |
| | Christopher Berarducci |
| | Principal Financial Officer |
| |
| Date: | | March 25, 2024 |