|
| | | | | | |
UNITED STATES SECURITIES AND EXCHANGE COMMISSION Washington, D.C. 20549 |
|
FORM 10-K |
| (Mark One) | | |
| | [X] | | ANNUAL REPORT PURSUANT TO SECTION 13 OR 15(d) OF THE SECURITIES EXCHANGE ACT OF 1934 For the fiscal year ended December 31, 2017 |
| |
| |
OR |
| | [ ] | | TRANSITION REPORT PURSUANT TO SECTION 13 OR 15(d) OF THE SECURITIES EXCHANGE ACT OF 1934 For the transition period from __________ to __________. |
| Commission File No. 001-11241 |
CATERPILLAR FINANCIAL SERVICES CORPORATION (Exact name of Registrant as specified in its charter) |
Delaware (State or other jurisdiction of incorporation or organization) | 37-1105865 (I.R.S. Employer Identification No.) |
2120 West End Ave., Nashville, Tennessee (Address of principal executive offices) | 37203-0001 (Zip Code) |
Registrant's telephone number, including area code: (615) 341-1000 |
The Registrant is a wholly-owned subsidiary of Caterpillar Inc. and meets the conditions set forth in General Instruction (I)(1)(a) and (b) of Form 10-K, and is therefore filing this Form with the reduced disclosure format.
|
| | | |
Securities registered pursuant to Section 12(b) of the Act: |
| | Title of each class | | Name of each exchange on which registered |
| | Medium-Term Notes, Series H, 3.300% Notes Due 2024 | | New York Stock Exchange |
| Securities registered pursuant to Section 12(g) of the Act: None |
Indicate by check mark if the registrant is a well-known seasoned issuer, as defined in Rule 405 of the Securities Act.
Yes [ü] No [ ]
Indicate by check mark if the registrant is not required to file reports pursuant to Section 13 or Section 15(d) of the Act.
Yes [ ] No [ü]
Indicate by check mark whether the registrant (1) has filed all reports required to be filed by Section 13 or 15(d) of the Securities Exchange Act of 1934 during the preceding 12 months (or for such shorter period that the registrant was required to file such reports), and (2) has been subject to such filing requirements for the past 90 days. Yes [ü] No [ ]
Indicate by check mark whether the registrant has submitted electronically and posted on its corporate Web site, if any, every Interactive Data File required to be submitted and posted pursuant to Rule 405 of Regulation S-T (§232.405 of this chapter) during the preceding 12 months (or for such shorter period that the registrant was required to submit and post such files).
Yes [ü] No [ ]
Indicate by check mark if disclosure of delinquent filers pursuant to Item 405 of Regulation S-K (§229.405 of this chapter) is not contained herein, and will not be contained, to the best of the registrant’s knowledge, in definitive proxy or information statements incorporated by reference in Part III of this Form 10-K or any amendment to this Form 10-K. [ü]
Indicate by check mark whether the registrant is a large accelerated filer, an accelerated filer, a non-accelerated filer, a smaller reporting company, or an emerging growth company. See the definitions of "large accelerated filer," "accelerated filer," "smaller reporting company" and "emerging growth company" in Rule 12b-2 of the Exchange Act.
Large accelerated filer [ ] Accelerated filer [ ] Non-accelerated filer [ü] (Do not check if a smaller reporting company)
Smaller reporting company [ ] Emerging Growth Company [ ]
If an emerging growth company, indicate by check mark if the registrant has elected not to use the extended transition period for complying with any new or revised financial accounting standards provided pursuant to Section 13(a) of the Exchange Act. [ ]
Indicate by check mark whether the registrant is a shell company (as defined in Rule 12b-2 of the Act).
Yes [ ] No [ü]
As of February 15, 2018, one share of common stock of the registrant was outstanding, which is owned by Caterpillar Inc.
|
| | | |
| TABLE OF CONTENTS |
| | | | Page |
| | Business | 4 |
| | | Risk Factors | 6 |
| | | Unresolved Staff Comments | 11 |
| | | Properties | 11 |
| | | Legal Proceedings | 12 |
| | | Mine Safety Disclosures | 12 |
| | Market for Registrant's Common Equity, Related Stockholder Matters
and Issuer Purchases of Equity Securities | 12 |
| | | Management's Discussion and Analysis of Financial Condition and Results of Operations | 13 |
| | | Quantitative and Qualitative Disclosures About Market Risk | 28 |
| | | Financial Statements and Supplementary Data | 29 |
| | | Changes in and Disagreements With Accountants on Accounting and Financial Disclosure | 29 |
| | | Controls and Procedures | 29 |
| | | Other Information | 29 |
| | Principal Accounting Fees and Services | 30 |
| | Exhibits and Financial Statement Schedules | 30 |
| | Item 16. | Form 10-K Summary | 32 |
CAUTIONARY STATEMENT REGARDING FORWARD-LOOKING STATEMENTS
Certain statements contained in this Annual Report on Form 10-K may be considered "forward-looking statements" as that term is defined in the Private Securities Litigation Reform Act of 1995. These statements may relate to future events or our future financial performance, which may involve known and unknown risks and uncertainties and other factors that may cause our actual results, levels of activity, performance or achievement to be materially different from those expressed or implied by any forward-looking statements. From time to time, we may also provide forward-looking statements in oral presentations to the public or in other materials we issue to the public. Forward-looking statements give current expectations or forecasts of future events about the company. You may identify these statements by the fact that they do not relate to historical or current facts and may use words such as "believes," "expects," "estimates," "anticipates," "will," "should," "plan," "project," "intend," "could" and similar words or phrases. These statements are only predictions. Actual events or results may differ materially due to factors that affect international businesses, including changes in economic conditions, disruptions in the global financial and credit markets, and changes in laws, regulations and political stability, as well as factors specific to Cat Financial and the markets we serve, including the market’s acceptance of our products and services, the creditworthiness of our customers, interest rate and currency rate fluctuations and estimated residual values of leased equipment. These risk factors may not be exhaustive. We operate in a continually changing business environment, and new risk factors emerge from time to time. We cannot predict these new risk factors, nor can we assess the impact, if any, of these new risk factors on our businesses or the extent to which any factor, or combination of factors, may cause actual results to differ materially from those projected in any forward-looking statements. Accordingly, forward-looking statements should not be relied upon as a prediction of actual results. All of the forward-looking statements are qualified in their entirety by reference to the factors discussed under the captions "Risk Factors" and "Management’s Discussion and Analysis of Financial Condition and Results of Operations" in this Form 10-K and could cause results to differ materially from those projected in the forward-looking statements. Cat Financial undertakes no obligation to publicly update forward-looking statements, whether as a result of new information, future events or otherwise. You may, however, consult any related disclosures we may make in our subsequent Form 10-Q and Form 8-K reports filed with the Securities and Exchange Commission ("SEC").
General
Caterpillar Financial Services Corporation was organized in 1981 in the State of Delaware (together with its subsidiaries, "Cat Financial," "the Company," "we" or "our"). We are a wholly-owned finance subsidiary of Caterpillar Inc. (together with its other subsidiaries, "Caterpillar" or "Cat") and our corporate headquarters is located in Nashville, Tennessee.
Nature of Operations
Our primary business is to provide retail and wholesale financing alternatives for Caterpillar products to customers and dealers around the world. Retail financing is primarily comprised of financing of Caterpillar equipment, machinery and engines. We also provide financing for vehicles, power generation facilities and marine vessels that, in most cases, incorporate Caterpillar products. In addition to retail financing, we also provide wholesale financing to Caterpillar dealers and purchase short-term receivables from Caterpillar. The various financing plans offered by Cat Financial are primarily designed to increase the opportunity for sales of Caterpillar products and generate financing income for Cat Financial. A significant portion of our activity is conducted in North America with additional offices and subsidiaries in Latin America, Asia/Pacific, Europe, Africa and Middle East. We have more than 35 years of experience in providing financing for Caterpillar products, contributing to our knowledge of asset values, industry trends, product structuring and customer needs.
The Company’s retail leases and installment sale contracts (totaling 56 percent*) include:
| |
| • | Tax leases that are classified as either operating or finance leases for financial accounting purposes, depending on the characteristics of the lease. For tax purposes, we are considered the owner of the equipment (12 percent*). |
| |
| • | Finance (non-tax) leases, where the lessee for tax purposes is considered to be the owner of the equipment during the term of the lease, that either require or allow the customer to purchase the equipment for a fixed price at the end of the term (21 percent*). |
| |
| • | Installment sale contracts, which are equipment loans that enable customers to purchase equipment with a down payment or trade-in and structure payments over time (22 percent*). |
| |
| • | Governmental lease-purchase plans in the U.S. that offer low interest rates and flexible terms to qualified non-federal government agencies (1 percent*). |
The Company’s wholesale notes receivable, finance leases and installment sale contracts (totaling 14 percent*) include:
| |
| • | Inventory/rental programs, which provide assistance to dealers by financing their new Caterpillar inventory and rental fleets (3 percent*). |
| |
| • | Short-term receivables we purchase from Caterpillar at a discount (11 percent*). |
The Company’s retail notes receivable (30 percent*) include:
| |
| • | Loans that allow customers and dealers to use their Caterpillar equipment or other assets as collateral to obtain financing. |
*Indicates the percentage of total portfolio as of December 31, 2017. We define total portfolio as finance receivables, net plus equipment on operating leases, less accumulated depreciation.
Competitive Environment
We operate in a highly competitive environment, with financing for users of Caterpillar equipment available through a variety of sources, principally commercial banks and finance and leasing companies. Our competitors include Wells Fargo Equipment Finance Inc. and various other banks and finance companies. In addition, many of the manufacturers that compete with Caterpillar also own financial subsidiaries, such as Volvo Financial Services, Komatsu Financial L.P. and John Deere Capital Corporation, that utilize below-market interest rate programs (funded by the manufacturer) to assist machine sales.
We provide financing only when certain criteria are met. Credit decisions are based on a variety of credit quality factors, including prior payment experience, customer financial information, credit-rating agency ratings, loan-to-value ratios and other internal metrics. We typically maintain a security interest in retail financed equipment and require physical damage insurance coverage on financed equipment. We finance a significant portion of Caterpillar dealers' sales and inventory of Caterpillar equipment throughout the world (see Note 16 of Notes to Consolidated Financial Statements for more information regarding our segments and geographic areas). Our competitive position is improved by marketing programs offered in conjunction with Caterpillar and/or Caterpillar dealers that allow us to periodically offer financing to customers at interest rates that are below market rates. Under these programs, Caterpillar, or the dealer, funds an amount at the outset of the transaction, which we then recognize as revenue over the term of the financing. We believe that these marketing programs provide us with a significant competitive advantage in financing Caterpillar products.
In certain instances, our operations are subject to supervision and regulation by state, federal and various foreign governmental authorities and may be subject to various laws and judicial and administrative decisions imposing various requirements and restrictions which, among other things, (i) regulate credit granting activities and the administration of loans, (ii) establish maximum interest rates, finance charges and other charges, (iii) require disclosures to customers and investors, (iv) govern secured transactions, (v) set collection, foreclosure, repossession and other trade practices and (vi) regulate the use and reporting of information related to a borrower's credit experience. Our ability to comply with these and other governmental and legal requirements and restrictions affects our operations.
We also have agreements with Caterpillar that are significant to our operations. These agreements provide us with certain types of operational and administrative support from Caterpillar such as the administration of employee benefit plans, financial support, funding support and various forms of corporate services that are integral to the conduct of our business. For more information on these agreements, please refer to Note 14 of Notes to Consolidated Financial Statements.
Employment
As of December 31, 2017, the Company had 1,855 full-time employees, an increase of 2 percent from December 31, 2016.
Available Information
The Company files electronically with the SEC required reports on Form 8-K, Form 10-Q, Form 10-K and registration statements on Form S-3 and other forms or reports as required. The SEC maintains a website (www.sec.gov) that contains reports, proxy and information statements and other information regarding issuers that file electronically with the SEC. Copies of our annual report on Form 10-K, quarterly reports on Form 10-Q, current reports on Form 8-K and any amendments to these reports filed or furnished with the SEC are available free of charge through Caterpillar Inc.’s website (www.caterpillar.com/secfilings) as soon as reasonably practicable after filing with the SEC. Copies may also be obtained free of charge by writing to: Legal Dept., Caterpillar Financial Services Corporation, 2120 West End Ave., Nashville, Tennessee 37203-0001. In addition, the public may obtain more detailed information about our parent company, Caterpillar Inc., by visiting its website (www.caterpillar.com). None of the information contained at any time on our website, Caterpillar’s website or the SEC’s website is incorporated by reference into this document.
The statements in this section describe the most significant risks to our business and may contain "forward-looking statements" that are subject to the caption "CAUTIONARY STATEMENT REGARDING FORWARD-LOOKING STATEMENTS" presented prior to Item 1 of this report. The statements in this section should also be considered carefully in conjunction with "Management’s Discussion and Analysis of Financial Condition and Results of Operations" and the "Notes to Consolidated Financial Statements" to this Form 10-K. The risk factors described below are a cautionary discussion of risks, uncertainties and assumptions that we believe are significant to our business. These are factors that, individually or in the aggregate, we believe could make our actual results differ materially from expected or past results. Because it is impossible to predict or identify all such factors, the following factors should not be considered to be a complete discussion of risks, uncertainties and assumptions.
FINANCIAL RISKS
Disruptions or volatility in global financial markets could adversely impact the industries and markets in which we serve and operate
Continuing to meet our cash requirements over the long-term could require substantial liquidity and access to sources of funds, including capital and credit markets. Global economic conditions may cause volatility and disruptions in the capital and credit markets. We have continued to maintain access to key global medium-term note and commercial paper markets, but there can be no assurance that such markets will continue to represent a reliable source of financing. If global economic conditions were to deteriorate, we could face materially higher financing costs, become unable to access adequate funding to operate and grow our business and/or meet our debt service obligations as they mature, and we could be required to draw upon contractually committed lending agreements primarily provided by global banks and/or by seeking other funding sources. However, under extreme market conditions, there can be no assurance that such agreements and other funding sources would be available or sufficient. Any of these events could negatively impact our business, results of operations and financial condition.
The extent of any impact on our ability to meet our funding or liquidity needs would depend on several factors, including our operating cash flows, the duration of any market disruptions, changes in counterparty credit risk, the impact of government intervention in financial markets including the effects of any programs or legislation designed to increase or restrict liquidity for certain areas of the market, general credit conditions, the volatility of equity and debt markets, our credit ratings and credit capacity and the cost of financing and other general economic and business conditions. Market disruption and volatility may also lead to a number of other risks in connection with these events, including but not limited to:
| |
| • | Market developments that may affect the demand for Caterpillar products and/or customer confidence levels and may cause declines in the demand for financing and adverse changes in payment patterns, causing increases in delinquencies and default rates, which could impact our write-offs and provision for credit losses; |
| |
| • | The process we use to estimate losses inherent in our credit exposure requires a high degree of management’s judgment regarding numerous subjective, qualitative factors, including forecasts of economic conditions and how economic predictors might impair the ability of our borrowers to repay their loans. If financial market disruption and volatility is experienced, the accuracy of these judgments may be impacted; |
| |
| • | Our ability to engage in routine funding transactions or borrow from other financial institutions on acceptable terms or at all could be adversely affected by disruptions in the capital markets or other events, including actions by rating agencies and deteriorating investor expectations; and |
| |
| • | Because our lending agreements are primarily with financial institutions, their ability to perform in accordance with any of our underlying agreements could be adversely affected by market volatility and/or disruptions in the equity and credit markets. |
Failure to maintain our credit ratings would increase our cost of borrowing and could adversely affect our cost of funds, liquidity, competitive position and access to capital markets
Each of Caterpillar and Cat Financial's costs of borrowing and their respective ability to access the capital markets are affected not only by market conditions but also by the short-term and long-term credit ratings assigned to our respective debt by the major credit rating agencies. These ratings are based, in significant part, on each of Caterpillar's and Cat Financial's performance as measured by financial metrics such as net worth, interest coverage and leverage ratios, as well as transparency with rating agencies and timeliness of financial reporting. There can be no assurance that Caterpillar or Cat Financial will be able to maintain their credit ratings. On December 13, 2016, Moody’s Investors Service (Moody’s) downgraded the long- and short-term ratings of Caterpillar and Cat Financial to A3 from A2 and to Prime-2 from Prime-1. A further downgrade of Caterpillar or Cat Financial’s credit ratings by Moody’s or one of the other major credit rating agencies would result in increased borrowing costs and could adversely affect Caterpillar's and our liquidity, competitive position and access to the capital markets, including restricting, in whole or in part, access to the commercial paper market. There can be no assurance that the commercial paper market will continue to be a reliable source of short-term financing for Cat Financial or an available source of short-term financing for Caterpillar. An inability to access the capital markets could have a material adverse effect on our cash flows, results of operations and financial condition.
Changes in interest rates, foreign currency exchange rates or market liquidity conditions could adversely affect our earnings and/or cash flows
Changes in interest rates, foreign currency exchange rates and market liquidity conditions could have a material adverse effect on our earnings and cash flows. Because our financial results are reported in U.S. dollars, but our operations are conducted internationally, currency exchange rates can have a significant impact on our results. Additionally, because a significant number of our loans are made at fixed interest rates, our business is impacted by fluctuations in interest rates. Changes in market interest rates may influence our financing costs, returns on financial investments and the valuation of derivative contracts and could reduce our earnings and cash flows. In addition, because we make a significant number of loans in currencies other than the U.S. dollar, fluctuations in foreign currency exchange rates could also reduce our earnings and cash flows. There has been, and may continue to be, volatility in currency exchange rates as a result of the United Kingdom’s withdrawal from the European Union (commonly known as “Brexit”), especially between the U.S. dollar and the British pound. We also rely on a number of diversified global debt capital markets and funding programs to provide liquidity for our global operations, including commercial paper, medium-term notes, retail notes, variable denomination floating rate demand notes and bank loans. Significant changes in market liquidity conditions could impact our access to funding and the associated funding cost and reduce our earnings and cash flows.
Although we manage interest rate, foreign currency exchange rate and market liquidity risks with a variety of techniques, including a match-funding program that addresses interest rate risk by aligning the interest rate profile (fixed or floating rate and duration) of our debt portfolio with the interest rate profile of our receivables portfolio within predetermined ranges on an ongoing basis, the selective use of derivatives and a broadly diversified funding program, there can be no assurance that fluctuations in interest rates, currency exchange rates and market liquidity conditions will not have a material adverse effect on our earnings and cash flows. If any of the variety of instruments and strategies we use to hedge our exposure to these various types of risk is ineffective, we may incur losses.
Our business is significantly influenced by the credit risk associated with our customers and an increase in delinquencies, repossessions or net losses could adversely affect our results
Our business is significantly influenced by the credit risk associated with our customers. The creditworthiness of each customer and the rate of delinquencies, repossessions and net losses on customer obligations are directly impacted by several factors, including, but not limited to, relevant industry (particularly construction-related industries) and economic conditions, the availability of capital, the experience and expertise of the customer's management team, commodity prices, political events and the sustained value of the underlying collateral. Any increase in delinquencies, repossessions and net losses on customer obligations could have a material adverse effect on our earnings and cash flows.
In addition, although we evaluate and adjust our allowance for credit losses related to past due and non-performing receivables on a regular basis, adverse economic conditions or other factors that might cause deterioration of the financial health of our customers could change the timing and level of payments received and necessitate an increase in our estimated losses, which could also have a material adverse effect on our earnings and cash flows.
A decrease in the residual value of the equipment that we finance could adversely affect our results
Declines in the residual value of equipment financed by us may reduce our earnings. The residual value of leased equipment is determined based on its estimated end-of-term market value at the time of the expiration of the lease term. We estimate the residual value of leased equipment at the inception of the lease based on a number of factors, including historical wholesale market sales prices, past remarketing experience and any known significant market/product trends. If estimated end-of-term market values significantly decline due to economic factors, obsolescence or other adverse circumstances, we may not realize such residual value, which could reduce our earnings, either through an increase in depreciation expense or a decrease in finance revenue.
Restrictive covenants in our debt agreements could limit our financial and operating flexibility
Cat Financial and certain subsidiaries have credit agreements under which we borrow or have the ability to borrow funds for use in our respective businesses that are utilized primarily for general corporate purposes. Certain of these agreements include covenants relating to our financial performance and financial position. The two most significant financial covenants included in these agreements are: (1) a leverage ratio covenant that requires us to maintain a ratio of consolidated debt to consolidated net worth of not greater than 10 to 1, calculated (i) on a monthly basis as the average of the leverage ratios determined on the last day of each of the six preceding calendar months and (ii) at each December 31; and (2) an interest coverage ratio that requires us to maintain a ratio of (i) profit excluding income taxes, interest expense and net gain/(loss) from interest rate derivatives to (ii) interest expense of not less than 1.15 to 1, in each case, calculated at the end of each calendar quarter for the rolling four-quarter period then most recently ended for us and our subsidiaries on a consolidated basis in accordance with generally accepted accounting principles. In addition, we are restricted in a number of our agreements from terminating, amending or modifying our support agreement with Caterpillar. We are also restricted in our ability to incur secured indebtedness or consolidate, merge or sell assets. Similarly, we are also bound by covenants in various agreements that involve Caterpillar and its obligation to maintain a consolidated net worth of not less than $9 billion at all times during each fiscal year.
Although we do not believe any of these covenants presently materially restrict our operations, our ability to meet any one particular financial covenant may be affected by events that could be beyond our control and could result in material adverse consequences that negatively impact our business, results of operations and financial condition. These consequences may include the acceleration of repayment of amounts outstanding under certain of our credit agreements, the triggering of an obligation to redeem certain debt securities, the termination of existing unused credit commitments by our lenders, the refusal by our lenders to extend further credit under one or more of our credit agreements or the lowering or modification of our credit ratings, including those of any of our subsidiaries. We cannot provide assurance that we will continue to comply with each credit covenant, particularly if we were to encounter challenging and volatile market conditions.
MACROECONOMIC RISKS
Changes in government monetary or fiscal policies may negatively impact our results
Most countries where Caterpillar products and services are sold have established central banks to regulate monetary systems and influence economic activities, generally by adjusting interest rates. Interest rate changes affect overall economic growth, which in turn affects Caterpillar’s sales and our financing activities. Interest rate changes may also affect customers’ ability to finance machine purchases, can change the optimal time to keep machines in a fleet and can impact the ability of Caterpillar’s suppliers to finance the production of parts and components necessary to manufacture and support Caterpillar products. Increases in interest rates could negatively impact Caterpillar sales and create supply chain inefficiencies that could in turn adversely impact our business, results of operations and financial condition.
Central banks and other policy arms of many countries may take actions to vary the amount of liquidity and credit available in an economy. The impact from a change in liquidity and credit policies could negatively affect the customers and markets we serve or our suppliers, which could adversely impact our business, results of operations and financial condition.
Government policies on taxes and spending also affect our business. Throughout the world, government spending finances a significant portion of infrastructure development, such as highways, airports, sewer and water systems and dams. Tax regulations determine asset depreciation lives and impact the after-tax returns on business activity and investment, both of which influence investment decisions. Unfavorable developments, such as declines in government revenues, decisions to reduce public spending or increases in taxes, could negatively impact our results.
Our global operations are exposed to political and economic risks, commercial instability and events beyond our control in the countries in which we operate
Our global operations are dependent upon products manufactured, purchased, sold and financed in the U.S. and internationally, including in countries with political and economic instability or uncertainty. This includes, for example, the uncertainty related to Brexit. Some countries have greater political and economic volatility and greater vulnerability to infrastructure and labor disruptions than others. Operating in different regions and countries exposes us to a number of risks, including:
| |
| • | Multiple and potentially conflicting legal and regulatory requirements that are subject to change, including but not limited to, those legal and regulatory requirements described in Item 1 of this report under the heading Competitive Environment; |
| |
| • | Imposition of currency restrictions, restrictions on repatriation of earnings or other restraints; |
| |
| • | Difficulty of enforcing agreements and collecting receivables through foreign legal systems; |
| |
| • | Changes in trade agreements; |
| |
| • | Imposition of new or additional trade and economic sanctions laws imposed by the U.S. or foreign governments; |
| |
| • | War or terrorist acts; and |
| |
| • | Political and economic instability or civil unrest that may severely disrupt economic activity in affected countries. |
The occurrence of one or more of these events may negatively impact our business, results of operations and financial condition.
OPERATIONAL RISKS
The success of our business depends upon the demand for Caterpillar’s products
Our primary business is to provide retail and wholesale financing alternatives for Caterpillar products to customers and dealers and is therefore largely dependent upon the demand for Caterpillar’s products and customers’ willingness to enter into financing or leasing agreements, which may be negatively affected by challenging global economic conditions. As a result, a significant or prolonged decrease in demand could have a material adverse effect on our business, financial condition, results of operations and cash flows. The demand for Caterpillar’s products and our products and services is influenced by a number of factors, including:
| |
| • | General world economic conditions and the level of energy, mining, construction and manufacturing activity; |
| |
| • | Changes and uncertainties in the monetary and fiscal policies of various governmental and regulatory entities; |
| |
| • | Fluctuations in demand and prices for certain commodities; |
| |
| • | Fluctuations in currency exchange rates and interest rates; |
| |
| • | Political, economic and legislative changes; |
| |
| • | Caterpillar’s ability to produce products that meet customers' needs; |
| |
| • | Caterpillar’s ability to maintain key dealer relationships; |
| |
| • | The ability of Caterpillar dealers to sell Caterpillar products and their practices regarding inventory control; and |
| |
| • | Changes in pricing policies by Caterpillar or its competitors. |
Any significant adverse changes to these factors could negatively impact our results.
Changes in the marketing, operational or administrative support that we receive from Caterpillar could adversely affect our results
We participate in certain marketing programs offered in conjunction with Caterpillar and/or Caterpillar dealers that allow us to offer financing to customers at interest rates that are below market rates. These marketing programs provide us with a significant competitive advantage in financing Caterpillar products. Any change in these marketing programs or reduction in our ability to offer competitively priced financing to customers could reduce the percentage of Caterpillar products financed by us, which could have a material adverse effect on our business, financial condition, results of operations and cash flows. Caterpillar also provides us with other types of operational and administrative support, such as the administration of employee benefit plans, which is integral to the conduct of our business. Any changes in the levels of support from Caterpillar could also negatively impact our results.
The success of our business depends on our ability to develop, produce and market quality products and services that meet our customers’ needs
We operate in a highly competitive environment, with financing for users of Caterpillar equipment available through a variety of sources, principally commercial banks and finance and leasing companies. Increasing competition may adversely affect our business if we are unable to match the products and services of our competitors. Also, as noted above, any changes to the marketing programs offered in conjunction with Caterpillar and/or Caterpillar dealers, which allow us to offer financing to customers at interest rates that are below market rates, could have a materially adverse effect on our business.
Increased information technology security threats and more sophisticated computer crime pose a risk to our systems, networks, products and services
We rely upon information technology systems and networks, some of which are managed by third parties, in connection with a variety of business activities. Additionally, we collect and store data that is sensitive to us and our customers. The secure operation of these information technology systems and networks, and the processing and maintenance of this data, in a secure manner, is critical to our business operations and strategy. Information technology security threats -- from user error to attacks designed to gain unauthorized access to our systems, networks and data -- are increasing in frequency and sophistication. Attacks may range from random attempts to coordinated and targeted attacks, including sophisticated computer crime and advanced persistent threats. These threats pose a risk to the security of our systems and networks and the confidentiality, availability and integrity of our data. Cybersecurity attacks could also include attacks targeting customer data or the security, integrity and/or reliability of the hardware and software installed in our products. We have experienced cybersecurity attacks that have resulted in unauthorized parties gaining access to our information technology systems and networks, and we could in the future experience similar attacks. However, to date, no cybersecurity attack has had a material impact on our financial condition, results of operations or liquidity. If an attack against us were to succeed it could expose us, and our customers, dealers and suppliers to misuse of information or systems, the compromising of confidential information, manipulation and destruction of data and operations disruptions. The consequences associated with the occurrence of any of these events include reputational damage, litigation with third parties, disruption to systems, unauthorized release of confidential or otherwise protected information, corruption of data, and increased cybersecurity protection and remediation costs, which in turn could adversely affect our competitiveness, results of operations and financial condition. The amount of insurance coverage we maintain may be inadequate to cover claims or liabilities relating to a cybersecurity attack.
LEGAL & REGULATORY RISKS
Our global operations are subject to extensive trade and anti-corruption laws and regulations
Due to the international scope of our operations, we are subject to a complex system of laws and regulations, including U.S. regulations issued by the Office of Foreign Assets Control. Any alleged or actual violations may subject us to government scrutiny, investigation and civil and criminal penalties, and may limit our ability to provide financing outside the United States and/or potentially require us to divest portions of our existing portfolio under certain circumstances. Furthermore, embargoes and sanctions imposed by the U.S. and other governments prohibiting providing financing to specific persons or countries may expose us to potential criminal and civil sanctions. We cannot predict the nature, scope or effect of future regulatory requirements to which our operations might be subject or the manner in which existing laws might be administered or interpreted.
In addition, the U.S. Foreign Corrupt Practices Act and similar anti-corruption laws of other countries generally prohibit companies and their intermediaries from making improper payments or providing anything of value to improperly influence foreign government officials for the purpose of obtaining or retaining business, or obtaining an unfair advantage. Recent years have seen a substantial increase in the global enforcement of anti-corruption laws. Our continued operation and expansion outside the United States, including in developing countries, could increase the risk of such violations. Violations of anti-corruption laws by our employees or by intermediaries acting on our behalf, may result in severe criminal or civil sanctions, could disrupt our business, and result in an adverse effect on our reputation, business and results of operations or financial condition.
New regulations or changes in financial services regulation could adversely impact our results of operations and financial condition
Our operations are highly regulated by governmental authorities in the locations where we operate, which can impose significant additional costs and/or restrictions on our business. In the U.S. for example, certain of our activities are subject to the U.S. Dodd-Frank Wall Street Reform and Consumer Protection Act ("Dodd-Frank"), a comprehensive financial reform act that includes extensive provisions regulating the financial services industry. Certain aspects of Dodd-Frank remain to be implemented under the rulemaking and regulatory authority of the SEC, the Commodity Futures Trading Commission and federal banking regulators and certain or all aspects of Dodd-Frank could be substantially modified or repealed. As such, we have become and could continue to become subject to additional regulatory costs that could be significant and could have an adverse effect on our results of operations and financial condition. Additional regulations in the U.S. or internationally impacting the financial services industry could also add significant cost or operational constraints that might have an adverse effect on our results of operations and financial condition.
We may incur additional tax expense or become subject to additional tax exposure
We are subject to income taxes in the United States and numerous other jurisdictions. Our future results of operations could be adversely affected by changes in the effective tax rate as a result of a change in the mix of earnings in jurisdictions with differing statutory tax rates, changes in our overall profitability, changes in tax laws or treaties or in their application or interpretation, changes in tax rates, changes in generally accepted accounting principles, changes in the valuation of deferred tax assets and liabilities, changes in the amount of earnings indefinitely reinvested in certain non-U.S. jurisdictions, the results of audits and examinations of previously filed tax returns and continuing assessments of our tax exposures. We are also subject to the continuous examination of our income tax returns by the U.S. Internal Revenue Service and other tax authorities. We regularly assess the likelihood of an adverse outcome resulting from these examinations. If our effective tax rates were to increase, or if the ultimate determination of our taxes owed is for an amount in excess of amounts previously accrued, our operating results, cash flows and financial condition could be adversely affected.
Changes in accounting guidance could have an adverse effect on our results of operations
Our consolidated financial statements are subject to the application of generally accepted accounting principles in the United States, which is periodically revised and/or expanded. Accordingly, from time to time we are required to adopt new or revised accounting guidance and related interpretations issued by recognized authoritative bodies, including the Financial Accounting Standards Board and the SEC. Market conditions have prompted accounting standard setters to issue new guidance, which further interprets or seeks to revise accounting pronouncements related to various transactions, as well as to issue new guidance expanding disclosures. The impact of accounting pronouncements that have been issued but not yet implemented is disclosed in our annual and quarterly reports on Form 10-K and Form 10-Q. An assessment of proposed guidance is not provided, as such proposals are subject to change through the exposure process and, therefore, their effects on our financial statements cannot be meaningfully assessed. It is possible that future accounting guidance we are required to adopt, or future changes in accounting principles, could change the current accounting treatment that we apply to our consolidated financial statements and that such changes could have a material adverse effect on our business, results of operations and financial condition.
|
| |
| Item 1B. | Unresolved Staff Comments. |
None.
Our corporate headquarters are located in Nashville, Tennessee. We maintain forty-five offices in total, of which nine are located in North America (eight in the U.S. and one in Canada), twenty are located in Europe, one is located in Africa, one is located in the Middle East, eight are located in Asia/Pacific and six are located in Latin America (see Note 16 of Notes to Consolidated Financial Statements for more information regarding our segments and geographic areas). As of December 31, 2017, all of our offices were leased, though we had a commitment to purchase the corporate headquarters building for $91 million. The corporate headquarters building purchase closed on January 4, 2018.
|
| |
| Item 3. | Legal Proceedings. |
We are involved in unresolved legal actions that arise in the normal course of business. Although it is not possible to predict with certainty the outcome of our unresolved legal actions, we believe that these unresolved legal actions will neither individually nor in the aggregate have a material adverse effect on our consolidated results of operations, financial position or liquidity.
|
| |
| Item 4. | Mine Safety Disclosures. |
Not applicable.
|
| |
| Item 5. | Market for Registrant's Common Equity, Related Stockholder Matters and Issuer Purchases of Equity Securities. |
Our stock is not publicly traded. Caterpillar Inc. is the owner of our one outstanding share. Cash dividends of $725 million, $275 million and $600 million were paid to Caterpillar in 2017, 2016 and 2015, respectively.
|
| |
| Item 7. | Management's Discussion and Analysis of Financial Condition and Results of Operations. |
OVERVIEW
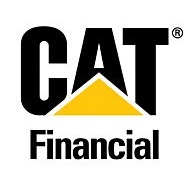
We reported revenues of $2.69 billion for 2017, an increase of $94 million, or 4 percent, compared with 2016. Profit was $586 million, a $202 million, or 53 percent, increase from 2016.
The increase in revenues was primarily due to a $61 million favorable impact from higher average financing rates and a $48 million favorable impact from lending activity with Caterpillar, partially offset by a $29 million unfavorable impact from lower average earning assets.
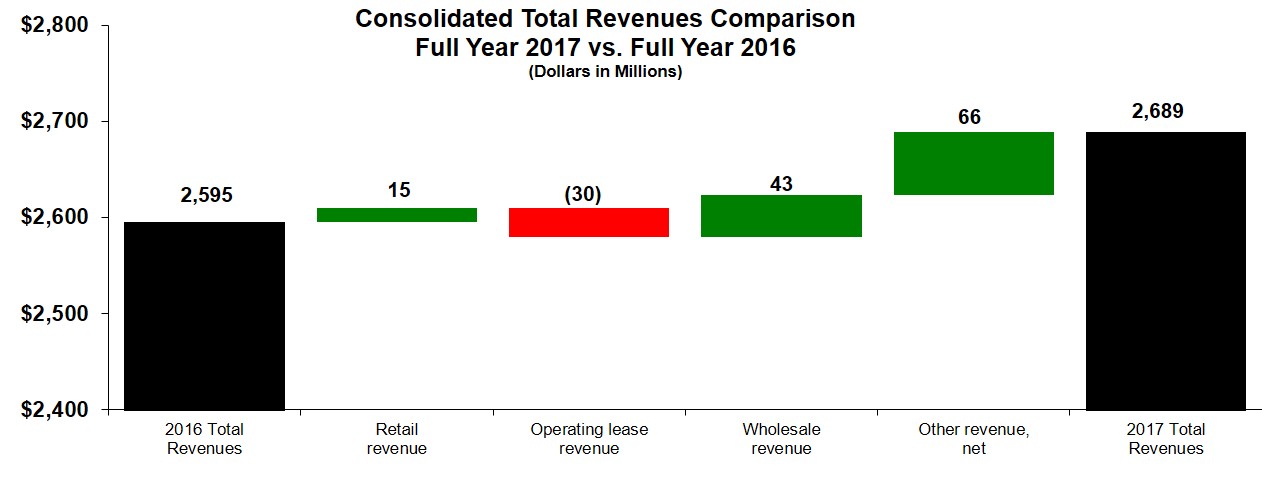
Profit before income taxes was $590 million for 2017, compared with $561 million for 2016. The increase was primarily due to a $33 million increase in net yield on average earning assets and a $30 million favorable impact from lending activity with Caterpillar, partially offset by a $38 million increase in general, operating and administrative expenses primarily due to higher incentive compensation.
The provision for income taxes reflects an annual tax rate of negative 1 percent for 2017, compared with 30 percent for 2016. The provision for income taxes for 2017 includes a provisionally estimated net benefit of $151 million due to the enactment of U.S. tax reform legislation on December 22, 2017. The provisionally estimated net benefit includes a $334 million write-down of net deferred tax liabilities to reflect the reduction in the U.S. corporate tax rate from 35 percent to 21 percent beginning January 1, 2018, partially offset by the cost of a mandatory deemed repatriation of non-U.S. earnings. We believe this net benefit is a reasonable estimate, as of January 18, 2018, that may change as additional required information is prepared and analyzed, interpretations and assumptions are refined, additional guidance is issued, and due to actions we may take as a result of the legislation. The decrease in the annual tax rate is primarily due to this net benefit, an increase in available foreign tax credits and changes in the geographic mix of profits.
Retail new business volume for 2017 was $11.22 billion, an increase of $316 million, or 3 percent, from 2016. The increase was primarily driven by higher volume in Asia/Pacific, partially offset by decreases in Latin America and North America.
At the end of 2017, past dues were 2.78 percent, compared with 2.38 percent at the end of 2016. Write-offs, net of recoveries, were $114 million for 2017, compared with $123 million for 2016. As of December 31, 2017, the allowance for credit losses totaled $365 million, or 1.33 percent of net finance receivables, compared with $343 million, or 1.29 percent of net finance receivables at year-end 2016.
2017 COMPARED WITH 2016
Consolidated Total Revenues
The chart above graphically illustrates reasons for the change in Consolidated Total Revenues between 2016 (at left) and 2017 (at right). Items favorably impacting total revenues appear as upward stair steps with corresponding dollar amounts above each bar, while items negatively impacting total revenues appear as downward stair steps with dollar amounts reflected in parentheses above each bar. Management utilizes these charts internally to visually communicate results.
Retail revenue for 2017 was $1.24 billion, an increase of $15 million from 2016. The increase was due to a $35 million favorable impact from higher interest rates on retail finance receivables, partially offset by a $20 million unfavorable impact from lower average earning assets. For the year ended December 31, 2017, retail average earning assets were $23.09 billion, a decrease of $374 million from 2016. The average yield was 5.35 percent for 2017, compared with 5.20 percent in 2016.
Operating lease revenue for 2017 was $985 million, a decrease of $30 million from 2016. The decrease was due to a $28 million unfavorable impact from lower average earning assets and a $2 million unfavorable impact from lower average rental rates on operating leases.
Wholesale revenue for 2017 was $307 million, an increase of $43 million from 2016. The increase was due to a $36 million favorable impact from higher interest rates on wholesale finance receivables and a $7 million favorable impact from higher average earning assets. For the year ended December 31, 2017, wholesale average earning assets were $3.82 billion, an increase of $93 million from 2016. The average yield was 8.04 percent for 2017, compared with 7.09 percent in 2016.
Other revenue, net, items were as follows:
|
| | | | | | | | | | | | |
| (Millions of dollars) | | | | | | |
| | | 2017 | | 2016 | | $ Change |
Finance receivable and operating lease fees (including late charges)(1) | | $ | 80 |
| | $ | 73 |
| | $ | 7 |
|
| Fees on committed credit facility extended to Caterpillar | | 40 |
| | 40 |
| | — |
|
Interest income on Notes Receivable from Caterpillar(2) | | 74 |
| | 30 |
| | 44 |
|
| Net loss on returned or repossessed equipment | | (48 | ) | | (61 | ) | | 13 |
|
| Miscellaneous other revenue, net | | 16 |
| | 14 |
| | 2 |
|
| Total Other revenue, net | | $ | 162 |
| | $ | 96 |
| | $ | 66 |
|
| | | | | | | |
(1) Portfolio-related revenues
(2) For the years ended December 31, 2017 and 2016, includes $26 million and $30 million, respectively, of portfolio-related revenues.
Consolidated Profit Before Income Taxes
The chart above graphically illustrates reasons for the change in Consolidated Profit Before Income Taxes between 2016 (at left) and 2017 (at right). Items favorably impacting profit before income taxes appear as upward stair steps with corresponding dollar amounts above each bar, while items negatively impacting profit before income taxes appear as downward stair steps with dollar amounts reflected in parentheses above each bar. Management utilizes these charts internally to visually communicate results.
Profit before income taxes was $590 million for 2017, compared with $561 million for 2016. The increase was primarily due to a $33 million increase in net yield on average earning assets and a $30 million favorable impact from lending activity with Caterpillar, partially offset by a $38 million increase in general, operating and administrative expenses primarily due to higher incentive compensation.
Provision for Income Taxes
The provision for income taxes reflects an annual tax rate of negative 1 percent for 2017, compared with 30 percent for 2016. The provision for income taxes for 2017 includes a provisionally estimated net benefit of $151 million due to the enactment of U.S. tax reform legislation on December 22, 2017. The provisionally estimated net benefit includes a $334 million write-down of net deferred tax liabilities to reflect the reduction in the U.S. corporate tax rate from 35 percent to 21 percent beginning January 1, 2018, partially offset by the cost of a mandatory deemed repatriation of non-U.S. earnings. We believe this net benefit is a reasonable estimate, as of January 18, 2018, that may change as additional required information is prepared and analyzed, interpretations and assumptions are refined, additional guidance is issued, and due to actions we may take as a result of the legislation. The decrease in the annual tax rate is primarily due to this net benefit, an increase in available foreign tax credits and changes in the geographic mix of profits.
Finance Receivables and Equipment on Operating Leases
New Business Volume
|
| | | | | | | | | | | | |
| (Millions of dollars) | | | | | | |
| | | 2017 | | 2016 | | $ Change |
| New retail financing | | $ | 9,844 |
| | $ | 9,260 |
| | $ | 584 |
|
| New operating lease activity | | 1,388 |
| | 1,670 |
| | (282 | ) |
| New wholesale financing | | 36,299 |
| | 30,642 |
| | 5,657 |
|
| Total | | $ | 47,531 |
| | $ | 41,572 |
| | $ | 5,959 |
|
| | | | | | | |
New retail financing increased primarily due to higher volume in Asia/Pacific, Europe and North America, partially offset by lower volume in Latin America. New operating lease activity (which is substantially related to retail) decreased primarily due to lower rentals of Cat equipment in North America, Europe and Asia/Pacific. New wholesale financing increased primarily due to higher purchases of trade receivables from Caterpillar.
Total Managed Portfolio
We define total portfolio as finance receivables, net plus equipment on operating leases, less accumulated depreciation. We also manage and service receivables and leases that have been sold by us to third parties with limited or no recourse in order to mitigate our concentration of credit risk with certain customers. These assets are not available to pay our creditors. Total managed portfolio as of December 31, was as follows:
|
| | | | | | | | | | | | |
| (Millions of dollars) | | | | | | |
| | | 2017 | | 2016 | | $ Change |
| Finance receivables, net | | $ | 27,126 |
| | $ | 26,212 |
| | $ | 914 |
|
| Equipment on operating leases, less accumulated depreciation | | 3,568 |
| | 3,708 |
| | (140 | ) |
| Total portfolio | | $ | 30,694 |
| | $ | 29,920 |
| | $ | 774 |
|
| | | | | | | |
| Retail finance leases | | $ | 103 |
| | $ | 41 |
| | $ | 62 |
|
| Retail installment sale contracts | | 74 |
| | 79 |
| | (5 | ) |
| Retail notes receivable | | 55 |
| | 87 |
| | (32 | ) |
| Operating leases | | 39 |
| | 79 |
| | (40 | ) |
| Total off-balance sheet managed assets | | $ | 271 |
| | $ | 286 |
| | $ | (15 | ) |
| | | | | | | |
| Total managed portfolio | | $ | 30,965 |
| | $ | 30,206 |
| | $ | 759 |
|
| | | | | | | |
At the end of 2017, past dues were 2.78 percent, compared with 2.38 percent at the end of 2016. Total non-performing finance receivables, which represent finance receivables currently on non-accrual status, were $684 million and $580 million at December 31, 2017 and 2016, respectively. Total non-performing finance receivables as a percentage of our recorded investment in finance receivables were 2.49 percent and 2.18 percent at December 31, 2017 and 2016, respectively.
Our allowance for credit losses as of December 31, 2017 was $365 million or 1.33 percent of net finance receivables compared with $343 million or 1.29 percent as of December 31, 2016. The allowance is subject to an ongoing evaluation based on many quantitative and qualitative factors, including past loss experience, known and inherent risks in the portfolio, adverse situations that may affect the borrower’s ability to repay, estimated value of underlying collateral and current economic conditions. We believe our allowance is sufficient to provide for losses inherent in our existing finance receivable portfolio as of December 31, 2017.
FOURTH QUARTER 2017 VS. FOURTH QUARTER 2016
CONSOLIDATED STATEMENTS OF PROFIT (UNAUDITED)
(Dollars in Millions)
|
| | | | | | | | |
| | | Three Months Ended December 31, |
| | | 2017 | | 2016 |
| Revenues: | | | | |
| Retail finance | | $ | 311 |
| | $ | 306 |
|
| Operating lease | | 248 |
| | 259 |
|
| Wholesale finance | | 85 |
| | 62 |
|
| Other, net | | 34 |
| | 15 |
|
| Total revenues | | 678 |
| | 642 |
|
| | | | | |
| Expenses: | | |
| | |
|
| Interest | | 168 |
| | 153 |
|
| Depreciation on equipment leased to others | | 202 |
| | 214 |
|
| General, operating and administrative | | 110 |
| | 99 |
|
| Provision for credit losses | | 50 |
| | 39 |
|
| Other | | 10 |
| | 10 |
|
| Total expenses | | 540 |
| | 515 |
|
| | | | | |
| Other income (expense) | | (5 | ) | | (5 | ) |
| | | | | |
| Profit before income taxes | | 133 |
| | 122 |
|
| | | | | |
| Provision (benefit) for income taxes | | (141 | ) | | 35 |
|
| | | | | |
| Profit of consolidated companies | | 274 |
| | 87 |
|
| | | | | |
| Less: Profit (loss) attributable to noncontrolling interests | | 3 |
| | 2 |
|
| | | | | |
Profit1 | | $ | 271 |
| | $ | 85 |
|
| | | | | |
| | | |
| | |
|
1 Profit attributable to Caterpillar Financial Services Corporation.
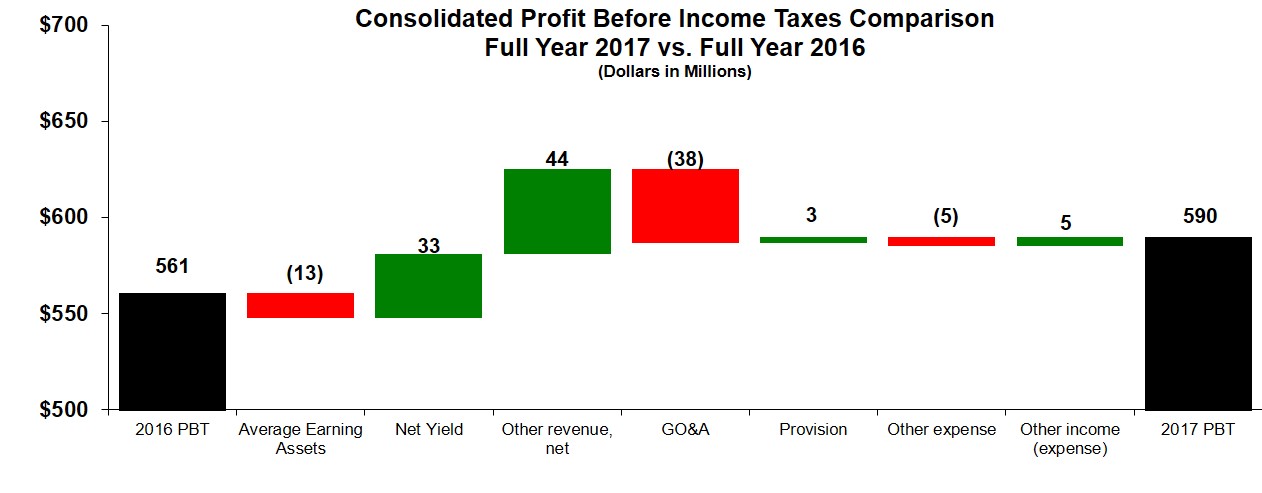
Consolidated Total Revenues
The chart above graphically illustrates reasons for the change in Consolidated Total Revenues between fourth quarter 2016 (at left) and fourth quarter 2017 (at right). Items favorably impacting total revenues appear as upward stair steps with corresponding dollar amounts above each bar, while items negatively impacting total revenues appear as downward stair steps with dollar amounts reflected in parentheses above each bar. Management utilizes these charts internally to visually communicate results.
Retail revenue for the fourth quarter of 2017 was $311 million, an increase of $5 million from the same period in 2016. The increase was due to a $6 million favorable impact from higher interest rates on retail finance receivables, partially offset by a $1 million unfavorable impact from lower average earning assets. For the quarter ended December 31, 2017, retail average earning assets were $23.08 billion, a decrease of $86 million from the same period in 2016. The annualized average yield was 5.39 percent for the fourth quarter of 2017, compared with 5.28 percent for the fourth quarter of 2016.
Operating lease revenue for the fourth quarter of 2017 was $248 million, a decrease of $11 million from the same period in 2016. The decrease was due to a $12 million unfavorable impact from lower average earning assets, partially offset by a $1 million favorable impact from higher average rental rates on operating leases.
Wholesale revenue for the fourth quarter of 2017 was $85 million, an increase of $23 million from the same period in 2016. The increase was due to a $14 million favorable impact from higher average earning assets and a $9 million favorable impact from higher interest rates on wholesale finance receivables. For the quarter ended December 31, 2017, wholesale average earning assets were $4.11 billion, an increase of $724 million from the same period in 2016. The annualized average yield was 8.22 percent for the fourth quarter of 2017, compared with 7.38 percent for the fourth quarter of 2016.
Other revenue, net, items were as follows:
|
| | | | | | | | | | | | |
(Millions of dollars) | | Three Months Ended
December 31, |
| | | 2017 | | 2016 | | $ Change |
Finance receivable and operating lease fees (including late charges)(1) | | $ | 23 |
| | $ | 18 |
| | $ | 5 |
|
| Fees on committed credit facility extended to Caterpillar | | 10 |
| | 10 |
| | — |
|
Interest income on Notes Receivable from Caterpillar(2) | | 15 |
| | 7 |
| | 8 |
|
| Net loss on returned or repossessed equipment | | (18 | ) | | (25 | ) | | 7 |
|
| Miscellaneous other revenue, net | | 4 |
| | 5 |
| | (1 | ) |
| Total Other revenue, net | | $ | 34 |
| | $ | 15 |
| | $ | 19 |
|
| | | | | | | |
(1) Portfolio-related revenues
(2) For the three months ended December 31, 2017 and 2016, includes $6 million and $7 million, respectively, of portfolio-related revenues.
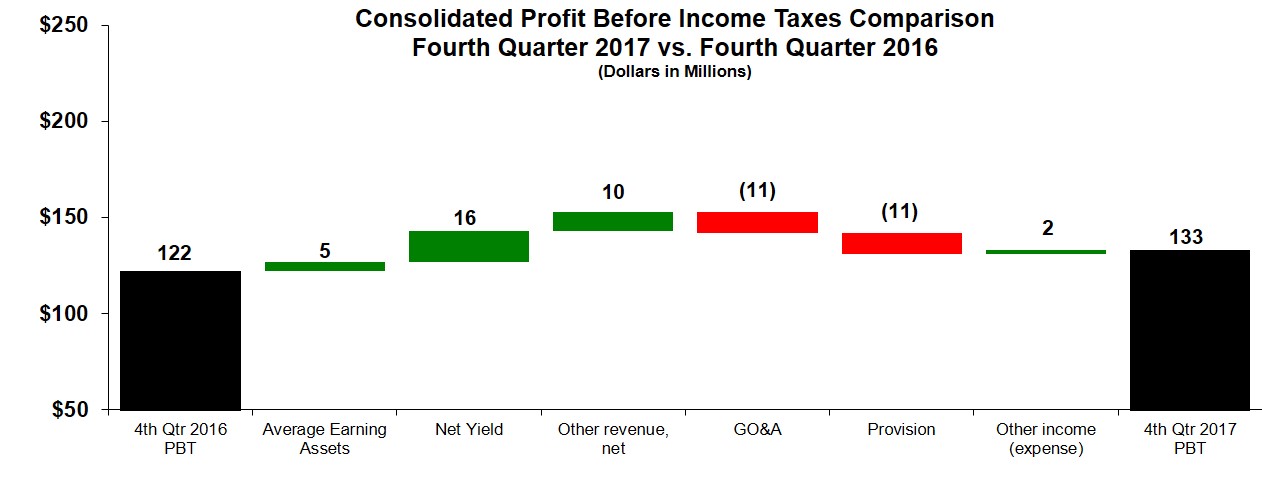
Consolidated Profit Before Income Taxes
The chart above graphically illustrates reasons for the change in Consolidated Profit Before Income Taxes between fourth quarter 2016 (at left) and fourth quarter 2017 (at right). Items favorably impacting profit before income taxes appear as upward stair steps with corresponding dollar amounts above each bar, while items negatively impacting profit before income taxes appear as downward stair steps with dollar amounts reflected in parentheses above each bar. Management utilizes these charts internally to visually communicate results.
Profit before income taxes was $133 million for the fourth quarter of 2017, compared with $122 million for the fourth quarter of 2016. The increase was primarily due to a $16 million increase in net yield on average earning assets, a $7 million favorable impact from returned or repossessed equipment, a $5 million favorable impact from higher average earning assets and a $4 million favorable impact from lending activity with Caterpillar. These favorable impacts were partially offset by an $11 million increase in provision for credit losses and an $11 million increase in general, operating and administrative expenses primarily due to higher incentive compensation.
Provision for Income Taxes
The provision for income taxes reflects an effective tax rate of negative 107 percent in the fourth quarter of 2017, compared with 29 percent in the fourth quarter of 2016. The provision for income taxes in the fourth quarter of 2017 includes a provisionally estimated net benefit of $151 million due to the enactment of U.S. tax reform legislation on December 22, 2017. The provisionally estimated net benefit includes a $334 million write-down of net deferred tax liabilities to reflect the reduction in the U.S. corporate tax rate from 35 percent to 21 percent beginning January 1, 2018, partially offset by the cost of a mandatory deemed repatriation of non-U.S. earnings. We believe this net benefit is a reasonable estimate, as of January 18, 2018, that may change as additional required information is prepared and analyzed, interpretations and assumptions are refined, additional guidance is issued, and due to actions we may take as a result of the legislation. The decrease in the effective tax rate is primarily due to this net benefit, an increase in available foreign tax credits and changes in the geographic mix of profits.
2016 COMPARED WITH 2015
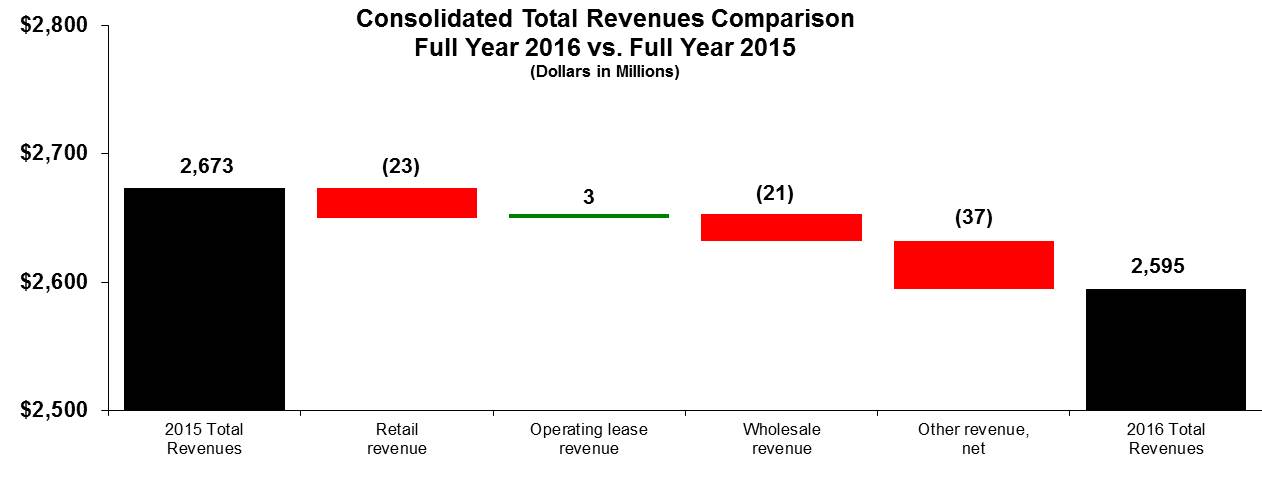
Consolidated Total Revenues
The chart above graphically illustrates reasons for the change in Consolidated Total Revenues between 2015 (at left) and 2016 (at right). Items favorably impacting total revenues appear as upward stair steps with corresponding dollar amounts above each bar, while items negatively impacting total revenues appear as downward stair steps with dollar amounts reflected in parentheses above each bar. Management utilizes these charts internally to visually communicate results.
Retail revenue for 2016 was $1.22 billion, a decrease of $23 million from 2015. The decrease was due to a $19 million unfavorable impact from lower average earning assets and a $4 million unfavorable impact from lower interest rates on retail finance receivables. For the year ended December 31, 2016, retail average earning assets were $23.46 billion, a decrease of $362 million from 2015. The average yield was 5.20 percent for 2016, compared with 5.22 percent in 2015.
Operating lease revenue for 2016 was $1.02 billion, an increase of $3 million from 2015. The increase was due to a $37 million favorable impact from higher average earning assets, partially offset by a $34 million unfavorable impact from lower average rental rates on operating leases.
Wholesale revenue for 2016 was $264 million, a decrease of $21 million from 2015. The decrease was due to a $43 million unfavorable impact from lower average earning assets, partially offset by a $22 million favorable impact from higher interest rates on wholesale finance receivables. For the year ended December 31, 2016, wholesale average earning assets were $3.72 billion, a decrease of $655 million from 2015. The average yield was 7.09 percent for 2016, compared with 6.50 percent in 2015.
Other revenue, net, items were as follows:
|
| | | | | | | | | | | | |
| (Millions of dollars) | | | | | | |
| | | 2016 | | 2015 | | $ Change |
Finance receivable and operating lease fees (including late charges)(1) | | $ | 73 |
| | $ | 68 |
| | $ | 5 |
|
| Fees on committed credit facility extended to Caterpillar | | 40 |
| | 40 |
| | — |
|
Interest income on Notes Receivable from Caterpillar(1) | | 30 |
| | 21 |
| | 9 |
|
| Net loss on returned or repossessed equipment | | (61 | ) | | (18 | ) | | (43 | ) |
| Miscellaneous other revenue, net | | 14 |
| | 22 |
| | (8 | ) |
| Total Other revenue, net | | $ | 96 |
| | $ | 133 |
| | $ | (37 | ) |
| | | | | | | |
(1) Portfolio-related revenues
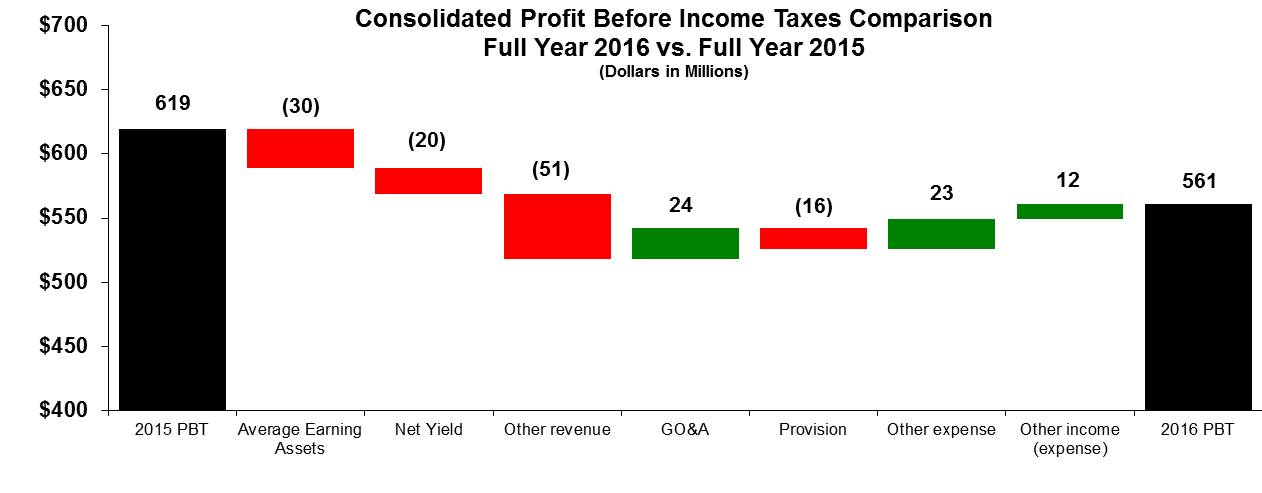
Consolidated Profit Before Income Taxes
The chart above graphically illustrates reasons for the change in Consolidated Profit Before Income Taxes between 2015 (at left) and 2016 (at right). Items favorably impacting profit before income taxes appear as upward stair steps with corresponding dollar amounts above each bar, while items negatively impacting profit before income taxes appear as downward stair steps with dollar amounts reflected in parentheses above each bar. Management utilizes these charts internally to visually communicate results.
Profit before income taxes was $561 million for 2016, compared with $619 million for 2015. The decrease was primarily due to a $43 million unfavorable impact from returned or repossessed equipment and a $30 million unfavorable impact from lower average earning assets. These unfavorable impacts were partially offset by a $24 million decrease in general, operating and administrative expenses primarily due to lower personnel costs.
Provision for Income Taxes
The provision for income taxes reflects an annual tax rate of 30 percent for 2016, compared with 26 percent for 2015. The increase in the annual tax rate is primarily due to a reduction in available foreign tax credits and changes in the geographic mix of profits.
Finance Receivables and Equipment on Operating Leases
New Business Volume
|
| | | | | | | | | | | | |
| (Millions of dollars) | | | | | | |
| | | 2016 | | 2015 | | $ Change |
| New retail financing | | $ | 9,260 |
| | $ | 9,988 |
| | $ | (728 | ) |
| New operating lease activity | | 1,670 |
| | 1,466 |
| | 204 |
|
| New wholesale financing | | 30,642 |
| | 35,540 |
| | (4,898 | ) |
| Total | | $ | 41,572 |
| | $ | 46,994 |
| | $ | (5,422 | ) |
| | | | | | | |
New retail financing decreased due to lower volume across North America, marine and mining, partially offset by an increase in Asia/Pacific and Europe. New operating lease activity (which is substantially related to retail) increased primarily due to higher rentals of Cat equipment in North America. New wholesale financing decreased primarily due to lower purchases of trade receivables from Caterpillar.
Total Managed Portfolio
We define total portfolio as finance receivables, net plus equipment on operating leases, less accumulated depreciation. We also manage and service receivables and leases that have been sold by us to third parties with limited or no recourse in order to mitigate our concentration of credit risk with certain customers. These assets are not available to pay our creditors. Total managed portfolio as of December 31, was as follows:
|
| | | | | | | | | | | | |
| (Millions of dollars) | | | | | | |
| | | 2016 | | 2015 | | $ Change |
| Finance receivables, net | | $ | 26,212 |
| | $ | 27,388 |
| | $ | (1,176 | ) |
| Equipment on operating leases, less accumulated depreciation | | 3,708 |
| | 3,564 |
| | 144 |
|
| Total portfolio | | $ | 29,920 |
| | $ | 30,952 |
| | $ | (1,032 | ) |
| | | | | | | |
| Retail notes receivable | | $ | 87 |
| | $ | 113 |
| | $ | (26 | ) |
| Operating leases | | 79 |
| | 81 |
| | (2 | ) |
| Retail installment sale contracts | | 79 |
| | 67 |
| | 12 |
|
| Retail finance leases | | 41 |
| | 49 |
| | (8 | ) |
| Total off-balance sheet managed assets | | $ | 286 |
| | $ | 310 |
| | $ | (24 | ) |
| | | | | | | |
| Total managed portfolio | | $ | 30,206 |
| | $ | 31,262 |
| | $ | (1,056 | ) |
| | | | | | | |
At the end of 2016, past dues were 2.38 percent, compared with 2.14 percent at the end of 2015. The increase in past dues was primarily driven by the European marine portfolio. Total non-performing finance receivables, which represent finance receivables currently on non-accrual status, were $580 million and $485 million at December 31, 2016 and 2015, respectively. Total non-performing finance receivables as a percentage of our recorded investment in finance receivables were 2.18 percent and 1.75 percent at December 31, 2016 and 2015, respectively.
Our allowance for credit losses as of December 31, 2016 was $343 million or 1.29 percent of net finance receivables compared with $338 million or 1.22 percent as of December 31, 2015. The allowance is subject to an ongoing evaluation based on many quantitative and qualitative factors, including past loss experience, known and inherent risks in the portfolio, adverse situations that may affect the borrower’s ability to repay, estimated value of underlying collateral and current economic conditions. We believe our allowance is sufficient to provide for losses inherent in our existing finance receivable portfolio as of December 31, 2016.
CAPITAL RESOURCES AND LIQUIDITY
Capital resources and liquidity provide us with the ability to meet our financial obligations on a timely basis. Maintaining and managing adequate capital and liquidity resources includes management of funding sources and their utilization based on current, future and contingent needs. Throughout 2017, we experienced favorable liquidity conditions. We ended 2017 with $708 million of cash, a decrease of $1.09 billion from year-end 2016. Our cash balances are held in numerous locations throughout the world with approximately $274 million held by our non-U.S. subsidiaries. U.S. tax reform legislation enacted on December 22, 2017 resulted in a one-time mandatory deemed repatriation of non-U.S. earnings. The resulting tax liability, net of available foreign tax credits, will be payable over eight years, and is not expected to significantly impact liquidity. Amounts held by non-U.S. subsidiaries are available for general corporate use and could be used in the U.S. without incurring significant additional U.S. taxes. We expect to meet our U.S. funding needs without repatriating undistributed profits that are indefinitely reinvested outside the U.S.
BORROWINGS
Borrowings consist primarily of medium-term notes and commercial paper, the combination of which is used to manage interest rate risk and funding requirements. (Please refer to Notes 6, 7 and 8 of Notes to Consolidated Financial Statements for additional discussion.)
We receive debt ratings from the major rating agencies. In December 2016, Moody's Investors Service downgraded our long-term ratings to A3 from A2, and short-term ratings to Prime-2 from Prime-1. The Moody’s downgrade did not have a material impact on our borrowing costs or our overall financial health. A further downgrade of our credit ratings by Moody's or one of the other major credit rating agencies would result in increased borrowing costs and could make access to certain credit markets more difficult. However, our long-term ratings with Fitch and S&P continue to be "mid-A". In the event economic conditions deteriorate such that access to debt markets becomes unavailable, we would rely on cash flows from our existing portfolio, existing cash balances, access to our revolving credit facilities and our other credit facilities and potential borrowings from Caterpillar. In addition, Caterpillar maintains a support agreement with us, which requires Caterpillar to remain as our sole owner and may, under certain circumstances, require Caterpillar to make payments to us should we fail to maintain certain financial ratios.
Total borrowings outstanding as of December 31, 2017, were $28.58 billion, a decrease of $688 million over December 31, 2016. Outstanding borrowings as of December 31 were as follows:
|
| | | | | | | | |
(Millions of dollars) | | 2017 | | 2016 |
| Medium-term notes, net of unamortized discount and debt issuance costs | | $ | 21,303 |
| | $ | 19,667 |
|
| Commercial paper, net of unamortized discount | | 3,680 |
| | 5,985 |
|
| Bank borrowings – long-term | | 803 |
| | 870 |
|
| Bank borrowings – short-term | | 675 |
| | 553 |
|
| Variable denomination floating rate demand notes | | 481 |
| | 556 |
|
| Notes payable to Caterpillar | | 1,638 |
| | 1,637 |
|
| Total outstanding borrowings | | $ | 28,580 |
| | $ | 29,268 |
|
| | | | | |
Medium-term notes
We issue medium-term unsecured notes through securities dealers or underwriters in the U.S., Canada, Europe, Australia, Japan, Hong Kong, China, Argentina and Mexico to both retail and institutional investors. These notes are offered in several currencies and with a variety of maturities. These notes are senior unsecured obligations of the Company. Medium-term notes issued totaled $7.29 billion and redeemed totaled $5.89 billion for the year ended December 31, 2017. Medium-term notes outstanding as of December 31, 2017, mature as follows:
|
| | | |
| (Millions of dollars) | |
| 2018 | $ | 5,888 |
|
| 2019 | 5,440 |
|
| 2020 | 4,195 |
|
| 2021 | 1,643 |
|
| 2022 | 1,986 |
|
| Thereafter | 2,151 |
|
| Total | $ | 21,303 |
|
| | |
|
Commercial paper
We issue unsecured commercial paper in the U.S., Europe and other international capital markets. These short-term promissory notes are issued on a discounted basis and are payable at maturity.
Revolving credit facilities
We have three global credit facilities with a syndicate of banks totaling $10.50 billion (Credit Facility) available in the aggregate to both Caterpillar and us for general liquidity purposes. Based on management's allocation decision, which can be revised from time to time, the portion of the Credit Facility available to us as of December 31, 2017 was $7.75 billion.
| |
| • | The 364-day facility of $3.15 billion (of which $2.33 billion is available to us) expires in September 2018. |
| |
| • | The three-year facility, as amended in September 2017, of $2.73 billion (of which $2.01 billion is available to us) expires in September 2020. |
| |
| • | The five-year facility, as amended in September 2017, of $4.62 billion (of which $3.41 billion is available to us) expires in September 2022. |
At December 31, 2017, Caterpillar’s consolidated net worth was $13.72 billion, which was above the $9.00 billion required under the Credit Facility. The consolidated net worth is defined in the Credit Facility as the consolidated shareholders' equity including preferred stock but excluding the pension and other postretirement benefits balance within Accumulated other comprehensive income/(loss).
At December 31, 2017, our covenant interest coverage ratio was 1.88 to 1. This is above the 1.15 to 1 minimum ratio, calculated as (1) profit excluding income taxes, interest expense and net gain/(loss) from interest rate derivatives to (2) interest expense, calculated at the end of each calendar quarter for the rolling four quarter period then most recently ended, required by the Credit Facility.
In addition, at December 31, 2017, our six-month covenant leverage ratio was 7.38 to 1 and our year-end covenant leverage ratio was 7.71 to 1. This is below the maximum ratio of debt to net worth of 10 to 1, calculated (1) on a monthly basis as the average of the leverage ratios determined on the last day of each of the six preceding calendar months and (2) at each December 31, required by the Credit Facility.
In the event that either Caterpillar or we do not meet one or more of our respective financial covenants under the Credit Facility in the future (and are unable to obtain a consent or waiver), the syndicate of banks may terminate the commitments allocated to the party that does not meet its covenants. Additionally, in such event, certain of our other lenders under other loan agreements where similar financial covenants or cross default provisions are applicable, may, at their election, choose to pursue remedies under those loan agreements, including accelerating the repayment of outstanding borrowings. At December 31, 2017, there were no borrowings under the Credit Facility.
Bank borrowings
Available credit lines with banks as of December 31, 2017 totaled $4.59 billion. These committed and uncommitted credit lines, which may be eligible for renewal at various future dates or have no specified expiration date, are used primarily by our non-U.S. subsidiaries for local funding requirements. As of December 31, 2017, we had $1.48 billion outstanding against these credit lines and were in compliance with all debt covenants under these credit lines. The remaining available credit commitments may be withdrawn any time at the lenders' discretion.
Variable denomination floating rate demand notes
We obtain funding from the sale of variable denomination floating rate demand notes, which may be redeemed at any time at the option of the holder without any material restriction. We do not hold reserves to fund the payment of the demand notes. The notes are offered on a continuous basis. As of December 31, 2017, there was $481 million of variable denomination floating rate demand notes outstanding. The maximum amount of variable denomination floating rate demand notes that we may have outstanding at any time may not exceed $1.25 billion.
Notes receivable from/payable to Caterpillar
Under our variable amount and term lending agreements and other notes receivable with Caterpillar, we may borrow up to $2.79 billion from Caterpillar and Caterpillar may borrow up to $2.14 billion from us. The variable amount lending agreements are in effect for indefinite periods of time and may be changed or terminated by either party with 30 days notice. The term lending agreements have remaining maturities ranging up to ten years. We had notes payable of $1.64 billion and notes receivable of $559 million outstanding under these agreements as of December 31, 2017.
Committed credit facility
We extended a $2 billion committed credit facility to Caterpillar, which expires in February 2019. We receive a fee from Caterpillar based on amounts drawn under the credit facility and a commitment fee for the undrawn amounts under the credit facility. At December 31, 2017, there were no borrowings under this credit facility.
OFF-BALANCE SHEET ARRANGEMENTS
We lease all of our facilities. In addition, we have potential payment exposure for guarantees issued to third parties totaling $91 million as of December 31, 2017. Please refer to Notes 11 and 15 of Notes to Consolidated Financial Statements for further information.
Managed assets
Certain finance receivables and equipment on operating leases are sold by us to third parties with limited or no recourse in order to mitigate our concentration of credit risk with certain customers. In 2017, we received $129 million of cash proceeds from the sale of such assets. We typically maintain servicing responsibilities for these assets.
CONTRACTUAL OBLIGATIONS
We have committed cash outflow related to long-term debt, operating lease agreements and purchase obligations. Minimum payments for these obligations are:
|
| | | | | | | | | | | | | | | | | | | | |
| (Millions of dollars) | | | | | | | | | | |
| | | 2018 | | 2019-2020 | | 2021-2022 | | After 2022 | | Total |
Long-term debt(1) | | $ | 6,191 |
| | $ | 9,989 |
| | $ | 3,826 |
| | $ | 2,147 |
| | $ | 22,153 |
|
| Interest payable on long-term debt | | 509 |
| | 566 |
| | 258 |
| | 107 |
| | 1,440 |
|
| Operating leases | | 8 |
| | 10 |
| | 6 |
| | 3 |
| | 27 |
|
Purchase obligations(2) | | 26 |
| | — |
| | — |
| | — |
| | 26 |
|
| Total contractual obligations | | $ | 6,734 |
| | $ | 10,565 |
| | $ | 4,090 |
| | $ | 2,257 |
| | $ | 23,646 |
|
| | | | | | | | | | | |
(1)Excludes debt issuance costs, unamortized discounts and fair value adjustments.
(2)Represents short-term contractual obligations made in the ordinary course of business for contracted services at December 31, 2017.
We had a commitment to purchase the corporate headquarters building for $91 million as of December 31, 2017. The building purchase was closed on January 4, 2018.
These contractual obligations do not include unused commitments and lines of credit for dealers and customers discussed in Note 11 of Notes to Consolidated Financial Statements.
CASH FLOWS
Operating cash flow for 2017 was $1.22 billion, compared with $1.41 billion for 2016. Net cash used for investing activities in 2017 was $527 million, compared with $87 million cash provided by investing activities in 2016. The change was primarily due to the impact of net intercompany purchased receivables, partially offset by lower capital expenditures for equipment on operating leases and higher proceeds from disposal of equipment. Net cash used for financing activities was $1.81 billion in 2017, compared with $717 million in 2016. The change was primarily due to the impact of borrowings with Caterpillar and an increase in dividends paid to Caterpillar.
CRITICAL ACCOUNTING POLICIES
The preparation of financial statements in conformity with generally accepted accounting principles requires management to make estimates and assumptions that affect reported amounts. The more significant estimates include: residual values for leased assets, allowance for credit losses and income taxes. We have incorporated many years of data into the determination of each of these estimates and we have not historically experienced significant adjustments. These assumptions are reviewed at least annually with the Audit Committee of the Caterpillar Inc. Board of Directors. Following are the methods and assumptions used in determining our estimates and an indication of the risks inherent in each.
Residual values for leased assets
Lease residual values are an estimate of the market value of leased equipment at the end of the lease term and are based on an analysis of historical wholesale market sales prices, projected forward on a level trend line without consideration for inflation or possible future pricing action. At the inception of the lease, residual values are estimated with consideration of the following critical factors: market size and demand, any known significant market/product trends, total expected hours of usage, machine configuration, application, location, model changes, quantities, past remarketing experience, third-party residual guarantees and contractual customer purchase options. Many of these factors are gathered in an application survey that is completed prior to quotation. The lease agreement also clearly defines applicable return conditions and remedies for non-compliance, to ensure that the leased equipment will be in good operating condition upon return. Model changes and updates, as well as market strength and product acceptance, are monitored and adjustments are made to residual values in accordance with the significance of any such changes. Remarketing sales staff works closely with customers and dealers to manage the sale of lease returns and the recovery of residual exposure.
During the term of the equipment on operating leases, we evaluate our depreciation on a regular basis taking into consideration expected residual values at lease termination. Adjustments to depreciation expense reflecting revised estimates of expected residual values at the end of the lease terms are recorded prospectively on a straight-line basis. For finance leases, residual value adjustments are recognized through a reduction of finance revenue.
We evaluate the carrying value of equipment on operating leases for potential impairment when we determine a triggering event has occurred. When a triggering event occurs, a test for recoverability is performed by comparing projected undiscounted future cash flows to the carrying value of the equipment on operating leases. If the test for recoverability identifies a possible impairment, the fair value of the equipment on operating leases is measured in accordance with the fair value measurement framework. An impairment charge is recognized for the amount by which the carrying value of the equipment on operating leases exceeds its estimated fair value.
At December 31, 2017, the aggregate residual value of equipment on operating leases was $2.20 billion. Without consideration of other factors such as third-party residual guarantees or contractual customer purchase options, a 10 percent non-temporary decrease in the market value of our equipment subject to operating leases would reduce residual value estimates and result in recognition of approximately $80 million of additional annual depreciation expense.
Allowance for credit losses
The allowance for credit losses is an estimate of the losses inherent in our finance receivable portfolio and includes consideration of accounts that have been individually identified as impaired, as well as pools of finance receivables where it is probable that certain receivables in the pool are impaired but the individual accounts cannot yet be identified. In identifying and measuring impairment, management takes into consideration past loss experience, known and inherent risks in the portfolio, adverse situations that may affect the borrower’s ability to repay, estimated value of underlying collateral and current economic conditions.
Accounts are identified for individual review based on past-due status and information available about the customer, such as financial statements, news reports and published credit ratings, as well as general information regarding industry trends and the economic environment in which our customers operate. The allowance for credit losses attributable to finance receivables that are individually evaluated and determined to be impaired is based on the present value of expected future cash flows discounted at the receivables' effective interest rate, the fair value of the collateral for collateral-dependent receivables or the observable market price of the receivable. In determining collateral value, we estimate the current fair market value of the collateral less selling costs. We also consider credit enhancements such as additional collateral and contractual third-party guarantees. The allowance for credit losses attributable to the remaining accounts not yet individually identified as impaired is estimated based on loss forecast models utilizing probabilities of default, our estimate of the loss emergence period and the estimated loss given default. In addition, qualitative factors not able to be fully captured in our loss forecast models including industry trends, macroeconomic factors and model imprecision are considered in the evaluation of the adequacy of the allowance for credit losses. These qualitative factors are subjective and require a degree of management judgment.
While management believes it has exercised prudent judgment and applied reasonable assumptions, there can be no assurance that in the future, changes in economic conditions or other factors would not cause changes in the financial health of our customers. If the financial health of our customers deteriorates, the timing and level of payments received could be impacted and therefore, could result in a change to our estimated losses.
Income taxes
We are subject to the income tax laws of the many jurisdictions in which we operate. These tax laws are complex, and the manner in which they apply to our facts is sometimes open to interpretation. In establishing the provision for income taxes, we must make judgments about the application of these inherently complex tax laws.
Despite our belief that our tax return positions are consistent with applicable tax laws, we believe that taxing authorities could challenge certain positions. Settlement of any challenge can result in no change, a complete disallowance, or some partial adjustment reached through negotiations or litigation. We record tax benefits for uncertain tax positions based upon management's evaluation of the information available at the reporting date. To be recognized in the financial statements, a tax benefit must be at least more likely than not of being sustained based on technical merits. The benefit for positions meeting the recognition threshold is measured as the largest benefit more likely than not of being realized upon ultimate settlement with a taxing authority that has full knowledge of all relevant information. Significant judgment is required in making these determinations and adjustments to unrecognized tax benefits may be necessary to reflect actual taxes payable upon settlement. Adjustments related to positions impacting the effective tax rate affect the provision for income taxes. Adjustments related to positions impacting the timing of deductions impact deferred tax assets and liabilities.
Income taxes are based on the statutory tax rate of the jurisdiction in which earnings are subject to taxation. That statutory rate may differ from the statutory tax rate of the jurisdiction in which that entity is incorporated. Taxes are paid in the jurisdictions where earnings are subject to taxation. The effective tax rate differs from the U.S. statutory rate in part due to profits of non-U.S. subsidiaries being subject to statutory tax rates which were generally lower than the U.S. rate of 35 percent effective prior to January 1, 2018.
Our income tax positions and analysis are based on currently enacted tax law. On December 22, 2017, U.S. tax legislation was enacted containing a broad range of tax reform provisions including a corporate tax rate reduction and changes in the U.S. taxation of non-U.S. earnings. We have not completed our accounting for the income tax effects of U.S. tax reform. However, we have made a reasonable estimate of the 2017 financial statement impact as of January 18, 2018, and recognized a provisional net benefit of $151 million. We will continue to update our calculations as additional required information is prepared and analyzed, interpretations and assumptions are refined, additional guidance is issued, and due to actions we may take as a result of the legislation. These updates could significantly impact the provision for income taxes, the amount of taxes payable, and the deferred tax asset and liability balances.
The provisionally estimated net benefit includes a $334 million write-down of net deferred tax liabilities to reflect the reduction in the U.S. corporate tax rate from 35 percent to 21 percent beginning January 1, 2018. We are still analyzing certain aspects of the law and refining our calculations of basis differences as of December 31, 2017, which could affect the measurement of these balances.
The provisionally estimated net benefit includes $183 million for the estimated cost of a mandatory deemed repatriation of non-U.S. earnings. The resulting tax liability, net of available foreign tax credits, is $131 million, payable over eight years and is included in Income taxes payable in the Consolidated Statements of Financial Position. The U.S. federal tax cost for the mandatory deemed repatriation is computed at 15.5 percent for non-U.S. earnings held in liquid assets and 8 percent for non-liquid assets, reduced by applicable foreign tax credits. These estimates are provisional due to additional information and analysis required to determine cumulative taxable earnings since 1986 for non-U.S. subsidiaries at two separate points in time and to determine the amount of earnings that are held in liquid versus non-liquid assets as defined in the new legislation at several different measurement periods. In addition, information is being gathered and analyzed to support available foreign tax credits including estimates of credit utilization and valuation allowance considerations for any remaining foreign tax credit carryforward. Due to uncertainty about aspects of the tax law, we have made various assumptions to determine our reasonable estimate that we expect to refine as additional guidance is issued.
As a result of U.S. tax reform legislation, distributions of profits from non-U.S. subsidiaries are expected to have minimal U.S. tax impact in the future. However, these distributions may be subject to non-U.S. withholding taxes if profits are distributed from certain jurisdictions. We have not recorded a deferred tax liability for withholding taxes in non-U.S. jurisdictions where earnings are considered indefinitely reinvested. If management intentions or U.S. tax law changes in the future, there could be an impact on the provision for income taxes to record an incremental tax liability in the period the change occurs.
Deferred tax assets generally represent tax benefits for tax deductions or credits available in future tax returns. Certain estimates and assumptions are required to determine whether it is more likely than not that all or some portion of the benefit of a deferred tax asset will not be realized. In making this assessment, management analyzes the trend of U.S. GAAP earnings and estimates the impact of future taxable income, reversing temporary differences and available prudent and feasible tax planning strategies. Should a change in facts or circumstances lead to a change in judgment about the ultimate realizability of a deferred tax asset, we record or adjust the related valuation allowance in the period that the change in facts and circumstances occurs, along with a corresponding increase or decrease in the provision for income taxes.
|
| |
| Item 7A. | Quantitative and Qualitative Disclosures About Market Risk. |
In the normal course of business, our earnings and cash flow are subject to fluctuations due to changes in foreign currency exchange rates and interest rates. We use derivative financial instruments to manage foreign currency exchange rate and interest rate exposures. Our Risk Management Policy prevents us from using these instruments for speculative purposes.
Interest rate risk
Interest rate movements create a degree of risk by affecting the amount of our interest payments and the value of our fixed-rate debt. Our practice is to use interest rate contracts to manage our exposure to interest rate changes.
We have a match-funding policy that addresses interest rate risk by aligning the interest rate profile (fixed or floating rate and duration) of our debt portfolio with the interest rate profile of our finance receivable portfolio within predetermined ranges on an ongoing basis. In connection with that policy, we use interest rate derivative instruments to modify the debt structure to match assets within the finance receivable portfolio. This matched funding reduces the volatility of margins between interest-bearing assets and interest-bearing liabilities, regardless of which direction interest rates move.
In order to properly manage our sensitivity to changes in interest rates, we measure the potential impact of different interest rate assumptions on pre-tax earnings. All on-balance sheet positions, including derivative financial instruments, are included in the analysis. The primary assumptions used in the analysis are that there are no new fixed rate assets or liabilities, the proportion of fixed rate debt to fixed rate assets remains unchanged and the level of floating rate assets and debt remains constant. An analysis of the December 31, 2017 balance sheet, using these assumptions, estimates the impact of a 100 basis point immediate and sustained adverse change in interest rates to have a potential $5 million adverse impact on pre-tax earnings. Last year, similar assumptions and calculations yielded a potential $6 million adverse impact on pre-tax earnings.
This analysis does not necessarily represent our current outlook of future market interest rate movement, nor does it consider any actions management could undertake in response to changes in interest rates. Accordingly, no assurance can be given that actual results would be consistent with the results of our analysis.
Foreign currency exchange rate risk
We have balance sheet positions and expected future transactions denominated in foreign currencies, thereby creating exposure to movements in exchange rates. In managing foreign currency risk, our objective is to minimize earnings volatility resulting from conversion and the remeasurement of net foreign currency balance sheet positions and future transactions denominated in foreign currencies. Our policy allows the use of foreign currency forward, option and cross currency contracts to offset the risk of currency mismatch between our assets and liabilities and exchange rate risk associated with future transactions denominated in foreign currencies. An analysis of the December 31, 2017 balance sheet estimates the net impact of a 10 percent adverse change in the value of the U.S. dollar relative to all other currencies, to have a net impact to pre-tax earnings of less than $2 million. A similar analysis performed on the December 31, 2016 balance sheet resulted in an estimated net impact to pre-tax earnings of less than $1 million.
This analysis does not necessarily represent our current outlook for the U.S. dollar relative to all other currencies, nor does it consider any actions management could undertake in response to changes in the foreign currency markets. Accordingly, no assurance can be given that actual results would be consistent with the results of our analysis.
|
| |
| Item 8. | Financial Statements and Supplementary Data. |
Information required by Item 8 is included following the Report of Independent Registered Public Accounting Firm.
|
| |
| Item 9. | Changes in and Disagreements With Accountants on Accounting and Financial Disclosure. |
None.
|
| |
| Item 9A. | Controls and Procedures. |
Evaluation of Disclosure Controls and Procedures
An evaluation was performed under the supervision and with the participation of our management, including our Chief Executive Officer (CEO) and our Chief Financial Officer (CFO), of the effectiveness of the design and operation of our disclosure controls and procedures, as such term is defined under Rule 13a-15(e) of the Securities Exchange Act of 1934, as amended, as of December 31, 2017. Based on that evaluation, our CEO and CFO concluded that our disclosure controls and procedures were effective as of December 31, 2017.
Management’s Report on Internal Control over Financial Reporting
The management of Cat Financial is responsible for establishing and maintaining adequate internal control over financial reporting, as such term is defined under Exchange Act Rule 13a-15(f). Our internal control over financial reporting is a process designed to provide reasonable assurance regarding the reliability of our financial reporting and the preparation of financial statements for external purposes in accordance with generally accepted accounting principles. Our internal control over financial reporting includes those policies and procedures that (i) pertain to the maintenance of records that, in reasonable detail, accurately and fairly reflect the transactions and dispositions of our assets; (ii) provide reasonable assurance that transactions are recorded as necessary to permit preparation of financial statements in accordance with generally accepted accounting principles, and that our receipts and expenditures are being made only in accordance with authorizations of our management and directors and (iii) provide reasonable assurance regarding prevention or timely detection of unauthorized acquisition, use or disposition of our assets that could have a material effect on the financial statements.
Because of its inherent limitations, internal control over financial reporting may not prevent or detect misstatements. Also, projections of any evaluation of effectiveness to future periods are subject to the risk that controls may become inadequate because of changes in conditions, or that the degree of compliance with the policies or procedures may deteriorate.
Management assessed the effectiveness of our internal control over financial reporting as of December 31, 2017. In making this assessment, we used the criteria set forth by the Committee of Sponsoring Organizations of the Treadway Commission (COSO) in Internal Control - Integrated Framework (2013). Based on our assessment, we concluded that, as of December 31, 2017, our internal control over financial reporting was effective based on those criteria.
The effectiveness of our internal control over financial reporting as of December 31, 2017 has been audited by PricewaterhouseCoopers LLP, an independent registered public accounting firm, as stated in their report which appears herein.
Changes in Internal Control over Financial Reporting
There have been no changes in the Company's internal control over financial reporting during the fourth quarter of 2017 covered by this Annual Report on Form 10-K that materially affected, or are reasonably likely to materially affect, the Company’s internal control over financial reporting.
|
| |
| Item 9B. | Other Information. |
None.
|
| |
| Item 14. | Principal Accounting Fees and Services. |
As a wholly-owned subsidiary of Caterpillar Inc., our principal accounting fees and services are subject to Caterpillar Inc.’s Audit Committee pre-approval policies and procedures described in its Proxy Statement. This Proxy Statement can be located at Caterpillar Inc.’s Internet site (www.caterpillar.com), under Investors, Financial Information, Proxy Statement. Other than these policies and procedures, the information contained at that Internet site is not incorporated by reference in this filing. During 2017, all services provided by the external auditor were pre-approved by Caterpillar’s Audit Committee in accordance with such policy.
Fees for professional services provided by our auditors include the following:
|
| | | | | | | | |
| (Millions of dollars) | | | | |
| | | 2017 | | 2016 |
Audit fees(1) | | $ | 5.9 |
| | $ | 5.7 |
|
Audit-related fees(2) | | .1 |
| | .1 |
|
Tax fees(3) | | .1 |
| | .1 |
|
| Total | | $ | 6.1 |
| | $ | 5.9 |
|
| | | | | |
(1) "Audit fees" principally includes audit and review of financial statements (including internal control over financial reporting), statutory and subsidiary audits, SEC registration statements, comfort letters and consents.
(2) "Audit-related fees" principally includes accounting consultations and pre- or post- implementation reviews of processes or systems.
(3) "Tax fees" include, among other things, statutory tax return preparation and review and advising on the impact of changes in local tax laws.
|
| |
| Item 15. | Exhibits and Financial Statement Schedules. |
|
| | | | | |
| The following documents are filed as part of this report. |
| 1 |
| | Financial Statements: |
| | | · | | Report of Independent Registered Public Accounting Firm |
| | | · | | Consolidated Statements of Profit |
| | | · | | Consolidated Statements of Comprehensive Income |
| | | · | | Consolidated Statements of Financial Position |
| | | · | | Consolidated Statements of Changes in Shareholder’s Equity |
| | | · | | Consolidated Statements of Cash Flows |
| | | · | | Notes to Consolidated Financial Statements |
| 2 |
| | Financial Statement Schedules: |
| | | · | | All schedules are omitted because the required information is shown in the financial statements or the notes thereto or considered to be immaterial. |
| 3 |
| | Exhibits |
|
| |
| 3.1 | Certificate of Incorporation of the Company, as amended (incorporated by reference from Exhibit 3.1 to the Company’s Form 10 for the year ended December 31, 1984). |
| 3.2 | |
| 4.1 | Indenture, dated as of April 15, 1985, between the Company and Morgan Guaranty Trust Company of New York, as Trustee (incorporated by reference from Exhibit 4.1 to the Company’s Registration Statement on Form S-3, Commission File No. 33-2246). |
| 4.2 | First Supplemental Indenture, dated as of May 22, 1986, amending the Indenture dated as of April 15, 1985, between the Company and Morgan Guaranty Trust Company of New York, as Trustee (incorporated by reference from Exhibit 4.1 to the Company’s Quarterly Report on Form 10-Q, for the quarter ended June 20, 1986). |
|
| |
| 4.3 | Second Supplemental Indenture, dated as of March 15, 1987, amending the Indenture dated as of April 15, 1985, between the Company and Morgan Guaranty Trust Company of New York, as Trustee (incorporated by reference from Exhibit 4.3 to the Company’s Current Report on Form 8-K, dated April 24, 1987). |
| 4.4 | Third Supplemental Indenture, dated as of October 2, 1989, amending the Indenture dated as of April 15, 1985, between the Company and Morgan Guaranty Trust Company of New York, as Trustee (incorporated by reference from Exhibit 4.3 to the Company’s Current Report on Form 8-K, dated October 16, 1989). |
| 4.5 | Fourth Supplemental Indenture, dated as of October 1, 1990, amending the Indenture dated April 15, 1985, between the Company and Morgan Guaranty Trust Company of New York, as Trustee (incorporated by reference from Exhibit 4.3 to the Company’s Current Report on Form 8-K, dated October 29, 1990). |
| 4.6 | Indenture, dated as of July 15, 1991, between the Company and Continental Bank, National Association, as Trustee (incorporated by reference from Exhibit 4.1 to the Company’s Current Report on Form 8-K, dated July 25, 1991). |
| 4.7 | |
| 4.8 | Support Agreement, dated as of December 21, 1984, between the Company and Caterpillar (incorporated by reference from Exhibit 10.2 to the Company’s amended Form 10, for the year ended December 31, 1984). |
| 4.9 | First Amendment to the Support Agreement dated June 14, 1995, between the Company and Caterpillar (incorporated by reference from Exhibit 4 to the Company’s Current Report on Form 8-K, dated June 14, 1995). |
| | The registrant hereby undertakes upon request to furnish the Commission with a copy of any instrument with respect to long-term debt where the total amount of securities authorized thereunder does not exceed 10% of the total assets of the registrant and its subsidiaries on a consolidated basis. |
| 10.1 | Tax Sharing Agreement, dated as of June 21, 1984, between the Company and Caterpillar (incorporated by reference from Exhibit 10.3 to the Company’s amended Form 10, for the year ended December 31, 1984). |
| 10.2 | 364-Day Credit Agreement (364-Day Facility), dated as of September 7, 2017, among the Company, Caterpillar Inc., Caterpillar International Finance Designated Activity Company and Caterpillar Finance Kabushiki Kaisha, certain financial institutions named therein, Citibank, N.A., as Agent, Citibank Europe PLC, UK Branch, as Local Currency Agent, and The Bank of Tokyo-Mitsubishi UFJ, Ltd., as Japan Local Currency Agent (incorporated by reference from Exhibit 99.1 to the Company’s Current Report on Form 8-K filed September 12, 2017). |
| 10.3 | |
| 10.4 | |
| 10.5 | Omnibus Amendment No. 2 to Amended and Restated Credit Agreement (3-Year Facility) and Amendment No. 2 to Japan Local Currency Addendum, dated as of September 8, 2017, among the Company, Caterpillar Inc., Caterpillar International Finance Designated Activity Company and Caterpillar Finance Kabushiki Kaisha, certain financial institutions named therein, Citibank, N.A., as Agent, Citibank Europe PLC, UK Branch, as Local Currency Agent, and The Bank of Tokyo-Mitsubishi UFJ, Ltd., as Japan Local Currency Agent (incorporated by reference from Exhibit 99.4 to the Company’s Current Report on Form 8-K filed September 12, 2017). |
| 10.6 | Omnibus Amendment No. 1 to Amended and Restated Credit Agreement (3-Year Facility), Amendment No. 1 to Local Currency Addendum and Amendment No. 1 to Japan Local Currency Addendum, dated as of September 8, 2016, among the Company, Caterpillar Inc., Caterpillar International Finance Limited and Caterpillar Finance Kabushiki Kaisha, certain financial institutions named therein, Citibank, N.A., as Agent, Citibank Europe PLC, UK Branch, as Local Currency Agent, and The Bank of Tokyo-Mitsubishi UFJ, Ltd., as Japan Local Currency Agent (incorporated by reference from Exhibit 99.4 to the Company’s Current Report on Form 8-K filed September 14, 2016). |
| 10.7 | Amended and Restated Credit Agreement (3-Year Facility), dated as of September 10, 2015, by and among the Company, Caterpillar Inc., Caterpillar International Finance Limited and Caterpillar Finance Corporation, the Banks named therein, Local Currency Banks and Japan Local Currency Banks party thereto, Citibank, N.A., as Agent, Citibank International Limited, as Local Currency Agent, and The Bank of Tokyo-Mitsubishi UFJ, Ltd., as Japan Local Currency Agent (incorporated by reference from Exhibit 99.4 to the Company’s Current Report on Form 8-K filed September 16, 2015). |
| 10.8 | |
| 10.9 | |
|
| |
| 10.10 | Omnibus Amendment No. 2 to Amended and Restated Credit Agreement (5-Year Facility) and Amendment No. 2 to Japan Local Currency Addendum, dated as of September 8, 2017, among the Company, Caterpillar Inc., Caterpillar International Finance Designated Activity Company and Caterpillar Finance Kabushiki Kaisha, certain financial institutions named therein, Citibank, N.A., as Agent, Citibank Europe PLC, UK Branch, as Local Currency Agent, and The Bank of Tokyo-Mitsubishi UFJ, Ltd., as Japan Local Currency Agent (incorporated by reference from Exhibit 99.5 to the Company’s Current Report on Form 8-K filed September 12, 2017). |
| 10.11 | Omnibus Amendment No. 1 to Amended and Restated Credit Agreement (5-Year Facility), Amendment No. 1 to Local Currency Addendum and Amendment No. 1 to Japan Local Currency Addendum, dated as of September 8, 2016, among the Company, Caterpillar Inc., Caterpillar International Finance Limited and Caterpillar Finance Kabushiki Kaisha, certain financial institutions named therein, Citibank, N.A., as Agent, Citibank Europe PLC, UK Branch, as Local Currency Agent, and The Bank of Tokyo-Mitsubishi UFJ, Ltd., as Japan Local Currency Agent (incorporated by reference from Exhibit 99.5 to the Company’s Current Report on Form 8-K filed September 14, 2016). |
| 10.12 | Amended and Restated Credit Agreement (5-Year Facility), dated as of September 10, 2015, by and among the Company, Caterpillar Inc., Caterpillar International Finance Limited and Caterpillar Finance Corporation, the Banks named therein, Local Currency Banks and Japan Local Currency Banks party thereto, Citibank, N.A., as Agent, Citibank International Limited, as Local Currency Agent, and The Bank of Tokyo-Mitsubishi UFJ, Ltd., as Japan Local Currency Agent (incorporated by reference from Exhibit 99.7 to the Company’s Current Report on Form 8-K filed September 16, 2015). |
| 10.13 | |
| 10.14 | Japan Local Currency Addendum to the 5-Year Facility, dated as of September 10, 2015, among the Company, Caterpillar Finance Corporation, the Japan Local Currency Banks named therein, Citibank, N.A. and The Bank of Tokyo-Mitsubishi UFJ, Ltd. (incorporated by reference from Exhibit 99.9 to the Company’s Current Report on Form 8-K, filed September 16, 2015). |
| 12 | |
| 23 | |
| 31.1 | |
| 31.2 | |
| 32 | |
| 101.INS | XBRL Instance Document |
| 101.SCH | XBRL Taxonomy Extension Schema Document |
| 101.CAL | XBRL Taxonomy Extension Calculation Linkbase Document |
| 101.DEF | XBRL Taxonomy Extension Definition Linkbase Document |
| 101.LAB | XBRL Taxonomy Extension Label Linkbase Document |
| 101.PRE | XBRL Taxonomy Extension Presentation Linkbase Document |
|
| |
| Item 16. | Form 10-K Summary |
Not applicable.
SIGNATURES
Pursuant to the requirements of Section 13 or 15(d) of the Securities Exchange Act of 1934, the registrant has duly caused this report to be signed on its behalf by the undersigned, thereunto duly authorized.
|
| | | |
| | | Caterpillar Financial Services Corporation |
| | | (Registrant) |
| | | | |
| Date: | February 15, 2018 | By: | /s/Leslie S. Zmugg |
| | | | Leslie S. Zmugg, Secretary |
| | | | |
Pursuant to the requirements of the Securities Exchange Act of 1934, this report has been signed below by the following persons on behalf of the registrant and in the capacities and on the dates indicated.
|
| | | | |
| Date | | Signature | | Title |
| | | | | |
| February 15, 2018 | | /s/David T. Walton | | President, Director and Chief Executive Officer |
| | | David T. Walton | | |
| | | | | |
| February 15, 2018 | | /s/Bradley M. Halverson | | Director |
| | | Bradley M. Halverson | | |
| | | | | |
| February 15, 2018 | | /s/James A. Duensing | | Executive Vice President and Chief Financial Officer (Principal Financial Officer) |
| | | James A. Duensing | | |
| | | | | |
| February 15, 2018 | | /s/Jeffry D. Everett | | Controller (Principal Accounting Officer) |
| | | Jeffry D. Everett | | |
| | | | | |
REPORT OF INDEPENDENT REGISTERED PUBLIC ACCOUNTING FIRM
To the Board of Directors and Shareholder of Caterpillar Financial Services Corporation:
Opinions on the Financial Statements and Internal Control over Financial Reporting
We have audited the accompanying consolidated statement of financial position of Caterpillar Financial Services Corporation and its subsidiaries as of December 31, 2017 and 2016, and the related consolidated statements of profit, comprehensive income, changes in shareholder’s equity and cash flows for each of the three years in the period ended December 31, 2017, including the related notes (collectively referred to as the “consolidated financial statements”). We also have audited the Company's internal control over financial reporting as of December 31, 2017, based on criteria established in Internal Control - Integrated Framework (2013) issued by the Committee of Sponsoring Organizations of the Treadway Commission (COSO).
In our opinion, the consolidated financial statements referred to above present fairly, in all material respects, the financial position of the Company as of December 31, 2017 and December 31, 2016, and the results of their operations and their cash flows for each of the three years in the period ended December 31, 2017 in conformity with accounting principles generally accepted in the United States of America. Also in our opinion, the Company maintained, in all material respects, effective internal control over financial reporting as of December 31, 2017, based on criteria established in Internal Control - Integrated Framework (2013) issued by the COSO.
Basis for Opinions
The Company's management is responsible for these consolidated financial statements, for maintaining effective internal control over financial reporting, and for its assessment of the effectiveness of internal control over financial reporting, included in the accompanying Management’s Report on Internal Control over Financial Reporting. Our responsibility is to express opinions on the Company’s consolidated financial statements and on the Company's internal control over financial reporting based on our audits. We are a public accounting firm registered with the Public Company Accounting Oversight Board (United States) ("PCAOB") and are required to be independent with respect to the Company in accordance with the U.S. federal securities laws and the applicable rules and regulations of the Securities and Exchange Commission and the PCAOB.
We conducted our audits in accordance with the standards of the PCAOB. Those standards require that we plan and perform the audits to obtain reasonable assurance about whether the consolidated financial statements are free of material misstatement, whether due to error or fraud, and whether effective internal control over financial reporting was maintained in all material respects.
Our audits of the consolidated financial statements included performing procedures to assess the risks of material misstatement of the consolidated financial statements, whether due to error or fraud, and performing procedures that respond to those risks. Such procedures included examining, on a test basis, evidence regarding the amounts and disclosures in the consolidated financial statements. Our audits also included evaluating the accounting principles used and significant estimates made by management, as well as evaluating the overall presentation of the consolidated financial statements. Our audit of internal control over financial reporting included obtaining an understanding of internal control over financial reporting, assessing the risk that a material weakness exists, and testing and evaluating the design and operating effectiveness of internal control based on the assessed risk. Our audits also included performing such other procedures as we considered necessary in the circumstances. We believe that our audits provide a reasonable basis for our opinions.
Definition and Limitations of Internal Control over Financial Reporting
A company’s internal control over financial reporting is a process designed to provide reasonable assurance regarding the reliability of financial reporting and the preparation of financial statements for external purposes in accordance with generally accepted accounting principles. A company’s internal control over financial reporting includes those policies and procedures that (i) pertain to the maintenance of records that, in reasonable detail, accurately and fairly reflect the transactions and dispositions of the assets of the company; (ii) provide reasonable assurance that transactions are recorded as necessary to permit preparation of financial statements in accordance with generally accepted accounting principles, and that receipts and expenditures of the company are being made only in accordance with authorizations of management and directors of the company; and (iii) provide reasonable assurance regarding prevention or timely detection of unauthorized acquisition, use, or disposition of the company’s assets that could have a material effect on the financial statements.
Because of its inherent limitations, internal control over financial reporting may not prevent or detect misstatements. Also, projections of any evaluation of effectiveness to future periods are subject to the risk that controls may become inadequate because of changes in conditions, or that the degree of compliance with the policies or procedures may deteriorate.
/s/ PricewaterhouseCoopers LLP
Nashville, Tennessee
February 15, 2018
We have served as the Company’s auditor since 1984.
Caterpillar Financial Services Corporation
CONSOLIDATED STATEMENTS OF PROFIT
For the Years Ended December 31,
(Dollars in Millions)
|
| | | | | | | | | | | | |
| | | 2017 | | 2016 | | 2015 |
| Revenues: | | | | | | |
| Retail finance | | $ | 1,235 |
| | $ | 1,220 |
| | $ | 1,243 |
|
| Operating lease | | 985 |
| | 1,015 |
| | 1,012 |
|
| Wholesale finance | | 307 |
| | 264 |
| | 285 |
|
| Other, net | | 162 |
| | 96 |
| | 133 |
|
| Total revenues | | 2,689 |
| | 2,595 |
| | 2,673 |
|
| | | | | | | |
| Expenses: | | |
| | |
| | |
|
| Interest | | 667 |
| | 611 |
| | 593 |
|
| Depreciation on equipment leased to others | | 810 |
| | 841 |
| | 836 |
|
| General, operating and administrative | | 429 |
| | 391 |
| | 415 |
|
| Provision for credit losses | | 132 |
| | 135 |
| | 119 |
|
| Other | | 46 |
| | 41 |
| | 64 |
|
| Total expenses | | 2,084 |
| | 2,019 |
| | 2,027 |
|
| | | | | | | |
| Other income (expense) | | (15 | ) | | (15 | ) | | (27 | ) |
| | | | | | | |
| Profit before income taxes | | 590 |
| | 561 |
| | 619 |
|
| | | | | | | |
| Provision (benefit) for income taxes | | (4 | ) | | 171 |
| | 158 |
|
| | | | | | | |
| Profit of consolidated companies | | 594 |
| | 390 |
| | 461 |
|
| | | | | | | |
| Less: Profit attributable to noncontrolling interests | | 8 |
| | 6 |
| | 1 |
|
| | | | | | | |
Profit1 | | $ | 586 |
| | $ | 384 |
| | $ | 460 |
|
| | | | | | | |
| | | | | | | |
1 Profit attributable to Caterpillar Financial Services Corporation.
See Notes to Consolidated Financial Statements.
Caterpillar Financial Services Corporation
CONSOLIDATED STATEMENTS OF COMPREHENSIVE INCOME
For the Years Ended December 31,
(Dollars in Millions)
|
| | | | | | | | | | | | |
| | | 2017 | | 2016 | | 2015 |
| | | | | | | |
| Profit of consolidated companies | | $ | 594 |
| | $ | 390 |
| | $ | 461 |
|
| | | | | | | |
| Other comprehensive income (loss), net of tax: | | | | | | |
Foreign currency translation, net of tax (expense)/benefit of: 2017-$106; 2016-$(25); 2015-$(91) | | 414 |
| | (104 | ) | | (545 | ) |
| Derivative financial instruments: | | | | | | |
Gains (losses) deferred, net of tax (expense)/benefit of: 2017-$28; 2016-$(8); 2015-$(1) | | (49 | ) | | 15 |
| | 2 |
|
(Gains) losses reclassified to earnings, net of tax expense/(benefit) of: 2017-$(27); 2016-$9; 2015-$(2) | | 45 |
| | (16 | ) | | 3 |
|
| Total Other comprehensive income (loss), net of tax | | 410 |
| | (105 | ) | | (540 | ) |
| | | | | | | |
| Comprehensive income (loss) | | 1,004 |
| | 285 |
| | (79 | ) |
| | | | | | | |
| Less: Comprehensive income (loss) attributable to the noncontrolling interests | | 15 |
| | (1 | ) | | (6 | ) |
| | | | | | | |
Comprehensive income (loss) attributable to Caterpillar Financial Services Corporation | | $ | 989 |
| | $ | 286 |
| | $ | (73 | ) |
| | | | | | | |
See Notes to Consolidated Financial Statements.
Caterpillar Financial Services Corporation
CONSOLIDATED STATEMENTS OF FINANCIAL POSITION
At December 31,
(Dollars in Millions, except share data)
|
| | | | | | | | |
| | | 2017 | | 2016 |
| Assets: | | | | |
| Cash and cash equivalents | | $ | 708 |
| | $ | 1,795 |
|
| Finance receivables, net (Note 2) | | 27,126 |
| | 26,212 |
|
| Notes receivable from Caterpillar (Note 14) | | 559 |
|
| 530 |
|
| Equipment on operating leases, | | |
| | |
|
| less accumulated depreciation (Note 3) | | 3,568 |
| | 3,708 |
|
| Deferred and refundable income taxes (Note 12) | | 174 |
| | 119 |
|
| Other assets (Note 4) | | 1,025 |
| | 1,251 |
|
| Total assets | | $ | 33,160 |
| | $ | 33,615 |
|
| | | | | |
| Liabilities and shareholder’s equity: | | |
| | |
|
| Payable to dealers and others | | $ | 190 |
| | $ | 140 |
|
| Payable to Caterpillar – other | | 85 |
| | 49 |
|
| Accrued expenses | | 274 |
| | 172 |
|
| Income taxes payable (Note 12) | | 158 |
| | 32 |
|
| Payable to Caterpillar – borrowings (Note 14) | | 1,638 |
|
| 1,637 |
|
| Short-term borrowings (Note 7) | | 4,836 |
| | 7,094 |
|
| Current maturities of long-term debt (Note 8) | | 6,188 |
| | 6,155 |
|
| Long-term debt (Note 8) | | 15,918 |
| | 14,382 |
|
| Deferred income taxes and other liabilities (Note 12) | | 609 |
| | 969 |
|
| Total liabilities | | 29,896 |
| | 30,630 |
|
| | | | | |
| Commitments and contingent liabilities (Note 11) | |
|
| |
|
|
| | | | | |
| Common stock - $1 par value | | |
| | |
|
| Authorized: 2,000 shares; Issued and | | |
| | |
|
| outstanding: one share (at paid-in amount) | | 745 |
| | 745 |
|
| Additional paid-in capital | | 2 |
| | 2 |
|
| Retained earnings | | 2,969 |
| | 3,108 |
|
| Accumulated other comprehensive income/(loss) | | (592 | ) | | (995 | ) |
| Noncontrolling interests | | 140 |
| | 125 |
|
| Total shareholder’s equity | | 3,264 |
| | 2,985 |
|
| | | | | |
| Total liabilities and shareholder’s equity | | $ | 33,160 |
| | $ | 33,615 |
|
| | | | | |
See Notes to Consolidated Financial Statements.
Caterpillar Financial Services Corporation
CONSOLIDATED STATEMENTS OF CHANGES IN SHAREHOLDER’S EQUITY
For the Years Ended December 31,
(Dollars in Millions)
|
| | | | | | | | | | | | | | | | | | | | | | | | |
| | | Common stock | | Additional paid-in capital | | Retained earnings | | Accumulated other comprehensive income/(loss) | | Noncontrolling interests | | Total |
| Balance at December 31, 2014 | | $ | 745 |
| | $ | 2 |
| | $ | 3,139 |
| | $ | (364 | ) | | $ | 132 |
| | $ | 3,654 |
|
| Profit of consolidated companies | | |
| | |
| | 460 |
| | |
| | 1 |
| | 461 |
|
| Dividend paid to Caterpillar | | |
| | |
| | (600 | ) | | |
| | |
| | (600 | ) |
| Foreign currency translation, net of tax | | |
| | |
| | |
| | (538 | ) | | (7 | ) | | (545 | ) |
| Derivative financial instruments, net of tax | | |
| | |
| | |
| | 5 |
| | | | 5 |
|
| Balance at December 31, 2015 | | $ | 745 |
| | $ | 2 |
| | $ | 2,999 |
| | $ | (897 | ) | | $ | 126 |
| | $ | 2,975 |
|
| Profit of consolidated companies | | |
| | |
| | 384 |
| | |
| | 6 |
| | 390 |
|
| Dividend paid to Caterpillar | | |
| | |
| | (275 | ) | | |
| | |
| | (275 | ) |
| Foreign currency translation, net of tax | | |
| | |
| | |
| | (97 | ) | | (7 | ) | | (104 | ) |
| Derivative financial instruments, net of tax | | |
| | |
| | |
| | (1 | ) | | |
| | (1 | ) |
| Balance at December 31, 2016 | | $ | 745 |
| | $ | 2 |
| | $ | 3,108 |
| | $ | (995 | ) | | $ | 125 |
| | $ | 2,985 |
|
| Profit of consolidated companies | | |
| | |
| | 586 |
| | | | 8 |
| | 594 |
|
| Dividend paid to Caterpillar | | |
| | |
| | (725 | ) | | | | | | (725 | ) |
| Foreign currency translation, net of tax | | |
| | |
| | | | 407 |
| | 7 |
| | 414 |
|
| Derivative financial instruments, net of tax | | |
| | |
| | |
| | (4 | ) | | | | (4 | ) |
| Balance at December 31, 2017 | | $ | 745 |
| | $ | 2 |
| | $ | 2,969 |
| | $ | (592 | ) | | $ | 140 |
| | $ | 3,264 |
|
| | | | | | | | | | | | | |
Caterpillar Financial Services Corporation
CONSOLIDATED STATEMENTS OF CASH FLOWS
For the Years Ended December 31,
(Dollars in Millions) |
| | | | | | | | | | | | |
| | | 2017 | | 2016 | | 2015 |
| Cash flows from operating activities: | | | | | | |
| Profit of consolidated companies | | $ | 594 |
| | $ | 390 |
| | $ | 461 |
|
| Adjustments for non-cash items: | | |
| | |
| | |
|
| Depreciation and amortization | | 820 |
| | 851 |
| | 848 |
|
| Amortization of receivables purchase discount | | (253 | ) | | (207 | ) | | (222 | ) |
| Provision for credit losses | | 132 |
| | 135 |
| | 119 |
|
| Other, net | | 57 |
| | 72 |
| | 29 |
|
| Changes in assets and liabilities: | | |
| | |
| | |
|
| Receivables from others | | 70 |
| | (69 | ) | | (43 | ) |
| Other receivables/payables with Caterpillar | | 26 |
| | 1 |
| | (17 | ) |
| Payable to dealers and others | | (66 | ) | | 36 |
| | 83 |
|
| Accrued interest payable | | 11 |
| | (21 | ) | | 7 |
|
| Accrued expenses and other liabilities, net | | (261 | ) | | 71 |
| | 76 |
|
| Income taxes payable | | 102 |
| | 138 |
| | (74 | ) |
| Settlements of designated derivatives | | (9 | ) | | 44 |
| | 4 |
|
| Debt exchange premium | | — |
| | (33 | ) | | — |
|
| Net cash provided by operating activities | | 1,223 |
| | 1,408 |
| | 1,271 |
|
| Cash flows from investing activities: | | |
| | |
| | |
|
| Capital expenditures for equipment on operating leases and other capital expenditures | | (1,373 | ) | | (1,636 | ) | | (1,461 | ) |
| Proceeds from disposals of equipment | | 1,003 |
| | 789 |
| | 583 |
|
| Additions to finance receivables | | (13,920 | ) | | (11,862 | ) | | (12,928 | ) |
| Collections of finance receivables | | 14,353 |
| | 12,341 |
| | 12,225 |
|
| Net changes in Caterpillar purchased receivables | | (732 | ) | | 399 |
| | 745 |
|
| Proceeds from sales of receivables | | 127 |
| | 127 |
| | 136 |
|
| Net change in variable lending to Caterpillar | | (51 | ) | | 30 |
| | — |
|
| Additions to other notes receivable with Caterpillar | | (53 | ) | | (146 | ) | | (134 | ) |
| Collections on other notes receivable with Caterpillar | | 75 |
| | 76 |
| | 58 |
|
| Restricted cash and cash equivalents activity, net | | 5 |
| | (11 | ) | | (7 | ) |
| Settlements of undesignated derivatives | | 45 |
| | (25 | ) | | (58 | ) |
| Other, net | | (6 | ) | | 5 |
| | — |
|
| Net cash provided by (used for) investing activities | | (527 | ) | | 87 |
| | (841 | ) |
| Cash flows from financing activities: | | |
| | |
| | |
|
| Net change in variable lending from Caterpillar | | 40 |
| | 1,492 |
| | — |
|
| Proceeds from borrowings with Caterpillar | | — |
| | 253 |
| | — |
|
| Payments on borrowings with Caterpillar | | (49 | ) | | (1,203 | ) | | — |
|
| Proceeds from debt issued (original maturities greater than three months) | | 8,702 |
| | 5,109 |
| | 5,129 |
|
| Payments on debt issued (original maturities greater than three months) | | (6,919 | ) | | (6,032 | ) | | (7,775 | ) |
| Short-term borrowings, net (original maturities three months or less) | | (2,854 | ) | | (61 | ) | | 3,018 |
|
| Dividend paid to Caterpillar | | (725 | ) | | (275 | ) | | (600 | ) |
| Net cash provided by (used for) financing activities | | (1,805 | ) | | (717 | ) | | (228 | ) |
| Effect of exchange rate changes on cash and cash equivalents | | 22 |
| | 1 |
| | (43 | ) |
| Increase/(decrease) in cash and cash equivalents | | (1,087 | ) | | 779 |
| | 159 |
|
| Cash and cash equivalents at beginning of period | | 1,795 |
| | 1,016 |
| | 857 |
|
| Cash and cash equivalents at end of period | | $ | 708 |
| | $ | 1,795 |
| | $ | 1,016 |
|
| | | | | | | |
| Cash paid for interest | | $ | 647 |
| | $ | 608 |
| | $ | 579 |
|
| Cash (received) paid for taxes | | $ | 159 |
| | $ | (61 | ) | | $ | 125 |
|
| All short-term investments, which consist primarily of highly liquid investments with original maturities of three months or less, are considered to be cash equivalents. |
| Non-cash activity: In September 2016, $381 million of medium-term notes with varying interest rates and maturity dates were exchanged for $366 million of 1.93% medium-term notes due in 2021 and $15 million of cash. In addition, a debt exchange premium of $33 million was paid and is included in the operating section of the Consolidated Statements of Cash Flows. |
See Notes to Consolidated Financial Statements.
NOTES TO CONSOLIDATED FINANCIAL STATEMENTS
NOTE 1 – SUMMARY OF SIGNIFICANT ACCOUNTING POLICIES
A. Nature of Operations
Caterpillar Financial Services Corporation, a Delaware corporation organized in 1981 (together with its subsidiaries, "Cat Financial," "the Company," "we" and "our"), is a wholly-owned finance subsidiary of Caterpillar Inc. (together with its other subsidiaries, "Caterpillar" or "Cat"). Our primary business is to provide retail and wholesale financing alternatives for Caterpillar products to customers and dealers around the world. Retail financing is primarily comprised of financing of Caterpillar equipment, machinery and engines. In addition, we also provide financing for vehicles, power generation facilities and marine vessels that, in most cases, incorporate Caterpillar products. We also provide wholesale financing to Caterpillar dealers and purchase short-term receivables from Caterpillar. The various financing plans offered by Cat Financial are primarily designed to increase the opportunity for sales of Caterpillar products and generate financing income for Cat Financial. A significant portion of our activities is conducted in North America. However, we have additional offices and subsidiaries in Latin America, Asia/Pacific, Europe, Africa and the Middle East.
B. Basis of Presentation
The accompanying consolidated financial statements include the accounts of Cat Financial and consolidated variable interest entities (VIEs) in which Cat Financial is the primary beneficiary.
We consolidate all VIEs where we are the primary beneficiary. For VIEs, we assess whether we are the primary beneficiary as prescribed by the accounting guidance on the consolidation of VIEs. The primary beneficiary of a VIE is the party that has both the power to direct the activities that most significantly impact the entity’s economic performance and the obligation to absorb losses or the right to receive benefits that could potentially be significant to the entity. Please refer to Note 11 for more information.
We have customers and dealers that are VIEs of which we are not the primary beneficiary. Although we have provided financial support to these entities and therefore have a variable interest, we do not have the power to direct the activities that most significantly impact their economic performance. Our maximum exposure to loss from our involvement with these VIEs is limited to the credit risk inherently present in the financial support that we have provided. These risks are evaluated and reflected in our financial statements as part of our overall portfolio of finance receivables and related allowance for credit losses.
Certain amounts for prior years have been reclassified to conform with current-year financial statement presentation.
C. Recognition of Earned Income
Finance revenue is recorded over the life of the related finance receivable using the interest method, including the accretion of certain direct origination costs that are deferred. Revenue from rental payments received on operating leases is recognized on a straight-line basis over the term of the lease.
Recognition of finance revenue and operating lease revenue is suspended and the account is placed on non-accrual status when management determines that collection of future income is not probable (generally after 120 days past due). Recognition is resumed, and previously suspended income is recognized, when the account becomes current and collection of remaining amounts is considered probable.
We participate in certain marketing programs offered in conjunction with Caterpillar and/or Caterpillar dealers that allow us to periodically offer financing to customers at interest rates that are below market rates. Under these marketing programs, Caterpillar and/or the dealer funds an amount at the outset of the transaction, which we then recognize as revenue over the term of the financing. The funds we receive from Caterpillar and/or the dealer equal an amount that when combined with the customer’s contractual interest provides us with a market interest rate.
D. Depreciation
Depreciation for equipment on operating leases is recognized using the straight-line method over the lease term, typically one to seven years. The depreciable basis is the original cost of the equipment less the estimated residual value of the equipment at the end of the lease term.
E. Residual Values
The residuals for leases classified as operating leases are included in Equipment on operating leases. The residuals for leases classified as finance leases, in accordance with lease accounting, are included in finance receivables.
During the term of the equipment on operating leases, we evaluate our depreciation on a regular basis taking into consideration expected residual values at lease termination. Adjustments to depreciation expense reflecting revised estimates of expected residual values at the end of the lease terms are recorded prospectively on a straight-line basis. For finance leases, residual value adjustments are recognized through a reduction of finance revenue.
We evaluate the carrying value of equipment on operating leases for potential impairment when we determine a triggering event has occurred. When a triggering event occurs, a test for recoverability is performed by comparing projected undiscounted future cash flows to the carrying value of the equipment on operating leases. If the test for recoverability identifies a possible impairment, the fair value of the equipment on operating leases is measured in accordance with the fair value measurement framework. An impairment charge is recognized for the amount by which the carrying value of the equipment on operating leases exceeds its estimated fair value.
F. Derivative Financial Instruments
Our earnings and cash flows are subject to fluctuations due to changes in foreign currency exchange rates and interest rates. Our Risk Management Policy (policy) allows for the use of derivative financial instruments to manage foreign currency exchange rate and interest rate exposures. Our policy specifies that derivatives are not to be used for speculative purposes. Derivatives that we use are primarily foreign currency forward, option, and cross currency contracts and interest rate contracts. All derivatives are recorded at fair value. See Note 9 for additional information.
G. Allowance for Credit Losses
The allowance for credit losses is an estimate of the losses inherent in our finance receivable portfolio and includes consideration of accounts that have been individually identified as impaired, as well as pools of finance receivables where it is probable that certain receivables in the pool are impaired but the individual accounts cannot yet be identified. In identifying and measuring impairment, management takes into consideration past loss experience, known and inherent risks in the portfolio, adverse situations that may affect the borrower’s ability to repay, estimated value of underlying collateral and current economic conditions.
Accounts are identified for individual review based on past-due status and information available about the customer, such as financial statements, news reports and published credit ratings, as well as general information regarding industry trends and the economic environment in which our customers operate. The allowance for credit losses attributable to finance receivables that are individually evaluated and determined to be impaired is based on the present value of expected future cash flows discounted at the receivables' effective interest rate, the fair value of the collateral for collateral-dependent receivables or the observable market price of the receivable. In determining collateral value, we estimate the current fair market value of the collateral less selling costs. We also consider credit enhancements such as additional collateral and contractual third-party guarantees. The allowance for credit losses attributable to the remaining accounts not yet individually identified as impaired is estimated based on loss forecast models utilizing probabilities of default, our estimate of the loss emergence period and the estimated loss given default. In addition, qualitative factors not able to be fully captured in our loss forecast models including industry trends, macroeconomic factors and model imprecision are considered in the evaluation of the adequacy of the allowance for credit losses. These qualitative factors are subjective and require a degree of management judgment.
Receivable balances, including accrued interest, are written off against the allowance for credit losses when, in the judgment of management, they are considered uncollectible (generally upon repossession of the collateral). The amount of the write-off is determined by comparing the fair value of the collateral, less cost to sell, to the recorded investment. Subsequent recoveries, if any, are credited to the allowance for credit losses when received.
H. Income Taxes
The provision for income taxes is determined using the asset and liability approach taking into account guidance related to uncertain tax positions. Tax laws require items to be included in tax filings at different times than the items are reflected in the financial statements. A current liability is recognized for the estimated taxes payable for the current year. Deferred taxes represent the future tax consequences expected to occur when the reported amounts of assets and liabilities are recovered or paid. Deferred taxes are adjusted for enacted changes in tax rates and tax laws. Valuation allowances are recorded to reduce deferred tax assets when it is more likely than not that a tax benefit will not be realized.
We join Caterpillar in the filing of a consolidated U.S. Federal income tax return and certain state income tax returns. In accordance with our tax sharing agreement with Caterpillar, we generally pay to or receive from Caterpillar our allocated share of income taxes or credits reflected in these consolidated filings. This amount is calculated on a separate return basis by taking taxable income times the applicable statutory tax rate and includes payment for certain tax attributes earned during the year.
I. Foreign Currency Translation
The functional currency for most of our subsidiaries is the respective local currency. Gains and losses resulting from the remeasurement of foreign currency amounts to the functional currency are included in Other income (expense) in the Consolidated Statements of Profit. Gains and losses resulting from translating assets and liabilities from the functional currency to U.S. dollars are included in Accumulated other comprehensive income/(loss) in the Consolidated Statements of Financial Position.
J. Use of Estimates in the Preparation of Financial Statements
The preparation of financial statements, in conformity with generally accepted accounting principles in the United States of America, requires management to make estimates and assumptions that affect the reported amounts. Significant estimates include residual values for leased assets, allowance for credit losses and income taxes. Actual results may differ from these estimates.
K. New Accounting Pronouncements
Revenue recognition – In May 2014, the Financial Accounting Standards Board (FASB) issued new revenue recognition guidance to provide a single, comprehensive revenue recognition model for all contracts with customers. Under the new guidance, an entity will recognize revenue to depict the transfer of promised goods or services to customers at an amount that the entity expects to be entitled to in exchange for those goods or services. A five step model has been introduced for an entity to apply when recognizing revenue. The new guidance also includes enhanced disclosure requirements and was effective January 1, 2018. Entities have the option to apply the new guidance under a retrospective approach to each prior reporting period presented, or a modified retrospective approach with the cumulative effect of initially applying the new guidance recognized at the date of initial application within the Consolidated Statement of Changes in Shareholder's Equity. We will adopt the new guidance effective January 1, 2018 under the modified retrospective approach. We do not expect the adoption to have a material impact on our financial statements.
Recognition and measurement of financial assets and financial liabilities – In January 2016, the FASB issued accounting guidance that affects the accounting for equity investments, financial liabilities accounted for under the fair value option and the presentation and disclosure requirements for financial instruments. Under the new guidance, all equity investments in unconsolidated entities (other than those accounted for using the equity method of accounting) will generally be measured at fair value through earnings. There will no longer be an available-for-sale classification for equity securities with readily determinable fair values. For financial liabilities when the fair value option has been elected, changes in fair value due to instrument-specific credit risk will be recognized separately in other comprehensive income. In addition, the FASB clarified guidance related to the valuation allowance assessment when recognizing deferred tax assets resulting from unrealized losses on available-for-sale debt securities. The guidance was effective January 1, 2018, and will be applied on a modified retrospective basis through a cumulative effect adjustment to retained earnings as of January 1, 2018. We do not expect the adoption to have a material impact on our financial statements.
Lease accounting – In February 2016, the FASB issued accounting guidance that revises the accounting for leases. Under the new guidance, lessees are required to recognize a right-of-use asset and a lease liability for all leases. The new guidance will continue to classify leases as either financing or operating, with classification affecting the pattern of expense recognition. The accounting applied by a lessor under the new guidance will be substantially equivalent to current lease accounting guidance. The new guidance is effective January 1, 2019, with early adoption permitted. The new standard is required to be applied with a modified retrospective approach to each prior reporting period presented and provides for certain practical expedients. An implementation team is in the process of evaluating the effect of the new guidance on our financial statements. We plan to adopt the new guidance effective January 1, 2019.
Measurement of credit losses on financial instruments – In June 2016, the FASB issued accounting guidance to introduce a new model for recognizing credit losses on financial instruments based on an estimate of current expected credit losses. The new guidance will apply to loans, accounts receivable, trade receivables, other financial assets measured at amortized cost, loan commitments and other off-balance sheet credit exposures. The new guidance will also apply to debt securities and other financial assets measured at fair value through other comprehensive income. The new guidance is effective January 1, 2020, with early adoption permitted beginning January 1, 2019. We are in the process of evaluating the effect of the new guidance on our financial statements.
Classification for certain cash receipts and cash payments – In August 2016, the FASB issued accounting guidance related to the presentation and classification of certain transactions in the statement of cash flows where diversity in practice exists. The guidance was effective January 1, 2018, and we do not expect the adoption to have a material impact on our financial statements.
Classification of restricted cash – In November 2016, the FASB issued accounting guidance related to the presentation and classification of changes in restricted cash on the statement of cash flows where diversity in practice exists. The new standard is required to be applied with a retrospective approach. The guidance was effective January 1, 2018, and we do not expect the adoption to have a material impact on our financial statements.
Derivatives and hedging – In August 2017, the FASB issued accounting guidance to better align hedge accounting with a company’s risk management activities, simplify the application of hedge accounting and improve the disclosures of hedging arrangements. The new guidance is required to be applied on a modified retrospective basis, resulting in a cumulative-effect adjustment to opening retained earnings in the period of adoption. The guidance is effective January 1, 2019, with early adoption permitted. We have completed the evaluation of the impact of the new standard and do not expect the adoption to have a material impact on our financial statements.
NOTE 2 – FINANCE RECEIVABLES
A summary of finance receivables included in the Consolidated Statements of Financial Position as of December 31, was as follows:
|
| | | | | | | | |
| (Millions of dollars) | | | | |
| | | 2017 | | 2016 |
Finance leases and installment sale contracts – Retail (1) | | $ | 14,647 |
| | $ | 13,565 |
|
| Retail notes receivable | | 9,417 |
| | 10,195 |
|
| Wholesale notes receivable | | 4,161 |
| | 3,457 |
|
| Finance leases and installment sale contracts – Wholesale | | 119 |
| | 103 |
|
| | | 28,344 |
| | 27,320 |
|
| Less: Unearned income | | (853 | ) | | (765 | ) |
| Recorded investment in finance receivables | | 27,491 |
| | 26,555 |
|
| Less: Allowance for credit losses | | (365 | ) | | (343 | ) |
| Total finance receivables, net | | $ | 27,126 |
| | $ | 26,212 |
|
| | | | | |
(1) Includes $4 million of finance receivables classified as held for sale as of December 31, 2016.
Maturities of our finance receivables, as of December 31, 2017, reflect contractual repayments due from borrowers and were as follows:
|
| | | | | | | | | | | | | | | | | | | | | | | | | | | | |
| (Millions of dollars) | | | | | | | | | | | | | | |
| Amounts due in | | Retail Installment Sale Contracts | | Wholesale Installment Sale Contracts | | Retail Finance Leases | | Wholesale Finance Leases | | Retail Notes | | Wholesale Notes | | Total |
| 2018 | | $ | 2,798 |
| | $ | 10 |
| | $ | 2,758 |
| | $ | 22 |
| | $ | 3,578 |
| | $ | 3,955 |
| | $ | 13,121 |
|
| 2019 | | 2,031 |
| | 8 |
| | 1,920 |
| | 16 |
| | 1,510 |
| | 121 |
| | 5,606 |
|
| 2020 | | 1,281 |
| | 6 |
| | 1,078 |
| | 9 |
| | 1,445 |
| | 77 |
| | 3,896 |
|
| 2021 | | 629 |
| | 2 |
| | 444 |
| | 5 |
| | 1,160 |
| | 6 |
| | 2,246 |
|
| 2022 | | 212 |
| | — |
| | 153 |
| | 2 |
| | 867 |
| | 2 |
| | 1,236 |
|
| Thereafter | | 26 |
| | — |
| | 57 |
| | 2 |
| | 857 |
| | — |
| | 942 |
|
| Total | | 6,977 |
| | 26 |
| | 6,410 |
| | 56 |
| | 9,417 |
| | 4,161 |
| | 27,047 |
|
| Guaranteed residual value | | — |
| | — |
| | 425 |
| | 31 |
| | — |
| | — |
| | 456 |
|
| Unguaranteed residual value | | — |
| | — |
| | 835 |
| | 6 |
| | — |
| | — |
| | 841 |
|
| Total | | $ | 6,977 |
| | $ | 26 |
| | $ | 7,670 |
| | $ | 93 |
| | $ | 9,417 |
| | $ | 4,161 |
| | $ | 28,344 |
|
| | | | | | | | | | | | | | | |
Our finance receivables generally may be repaid or refinanced without penalty prior to contractual maturity and we also sell finance receivables to third parties to mitigate the concentration of credit risk with certain customers. Accordingly, this presentation should not be regarded as a forecast of future cash collections.
Allowance for Credit Losses
The allowance for credit losses is an estimate of the losses inherent in our finance receivable portfolio and includes consideration of accounts that have been individually identified as impaired, as well as pools of finance receivables where it is probable that certain receivables in the pool are impaired but the individual accounts cannot yet be identified. In identifying and measuring impairment, management takes into consideration past loss experience, known and inherent risks in the portfolio, adverse situations that may affect the borrower’s ability to repay, estimated value of underlying collateral and current economic conditions.
Accounts are identified for individual review based on past-due status and information available about the customer, such as financial statements, news reports and published credit ratings, as well as general information regarding industry trends and the economic environment in which our customers operate. The allowance for credit losses attributable to finance receivables that are individually evaluated and determined to be impaired is based on the present value of expected future cash flows discounted at the receivables' effective interest rate, the fair value of the collateral for collateral-dependent receivables or the observable market price of the receivable. In determining collateral value, we estimate the current fair market value of the collateral less selling costs. We also consider credit enhancements such as additional collateral and contractual third-party guarantees. The allowance for credit losses attributable to the remaining accounts not yet individually identified as impaired is estimated based on loss forecast models utilizing probabilities of default, our estimate of the loss emergence period and the estimated loss given default. In addition, qualitative factors not able to be fully captured in our loss forecast models including industry trends, macroeconomic factors and model imprecision are considered in the evaluation of the adequacy of the allowance for credit losses. These qualitative factors are subjective and require a degree of management judgment.
Our allowance for credit losses is segregated into three portfolio segments:
| |
| • | Customer - Finance receivables with retail customers. |
| |
| • | Dealer - Finance receivables with Caterpillar dealers. |
| |
| • | Caterpillar Purchased Receivables - Trade receivables purchased from Caterpillar entities. |
A portfolio segment is the level at which the Company develops a systematic methodology for determining its allowance for credit losses.
We further evaluate our portfolio segments by the class of finance receivables, which is defined as a level of information (below a portfolio segment) in which the finance receivables have the same initial measurement attribute and a similar method for assessing and monitoring credit risk. Typically, our finance receivables within a geographic area have similar credit risk profiles and methods for assessing and monitoring credit risk. Our classes, which align with management reporting for credit losses, are as follows:
| |
| • | North America - Finance receivables originated in the United States and Canada. |
| |
| • | Europe - Finance receivables originated in Europe, Africa, Middle East and the Commonwealth of Independent States. |
| |
| • | Asia/Pacific - Finance receivables originated in Australia, New Zealand, China, Japan and Southeast Asia. |
| |
| • | Mining - Finance receivables related to large mining customers worldwide and project financing in various countries. |
| |
| • | Latin America - Finance receivables originated in Mexico, Central and South American countries. |
| |
| • | Caterpillar Power Finance - Finance receivables related to marine vessels with Caterpillar engines worldwide and Caterpillar electrical power generation, gas compression and co-generation systems and non-Caterpillar equipment that is powered by these systems worldwide. |
Our allowance for credit losses as of December 31, 2017 was $365 million or 1.33 percent of our recorded investment in finance receivables compared with $343 million or 1.29 percent as of December 31, 2016. An analysis of the allowance for credit losses was as follows:
|
| | | | | | | | | | | | | | | | |
| (Millions of dollars) | | | | | | | | |
| | | December 31, 2017 |
| Allowance for Credit Losses: | | Customer | | Dealer | | Caterpillar Purchased Receivables | | Total |
| Balance at beginning of year | | $ | 331 |
| | $ | 10 |
| | $ | 2 |
| | $ | 343 |
|
| Receivables written off | | (157 | ) | | — |
| | — |
| | (157 | ) |
| Recoveries on receivables previously written off | | 43 |
| | — |
| | — |
| | 43 |
|
| Provision for credit losses | | 129 |
| | (1 | ) | | 1 |
| | 129 |
|
| Adjustment due to sale of receivables | | (1 | ) | | — |
| | — |
| | (1 | ) |
| Foreign currency translation adjustment | | 8 |
| | — |
| | — |
| | 8 |
|
| Balance at end of year | | $ | 353 |
| | $ | 9 |
| | $ | 3 |
| | $ | 365 |
|
| | | | | | | | | |
| Individually evaluated for impairment | | $ | 149 |
| | $ | — |
| | $ | — |
| | $ | 149 |
|
| Collectively evaluated for impairment | | 204 |
| | 9 |
| | 3 |
| | 216 |
|
| Ending Balance | | $ | 353 |
| | $ | 9 |
| | $ | 3 |
| | $ | 365 |
|
| | | | | | | | | |
| Recorded Investment in Finance Receivables: | | |
| | |
| | |
| | |
|
| Individually evaluated for impairment | | $ | 942 |
| | $ | — |
| | $ | — |
| | $ | 942 |
|
| Collectively evaluated for impairment | | 18,847 |
| | 4,241 |
| | 3,461 |
| | 26,549 |
|
| Ending Balance | | $ | 19,789 |
| | $ | 4,241 |
| | $ | 3,461 |
| | $ | 27,491 |
|
| | | | | | | | | |
|
| | | | | | | | | | | | | | | | |
| (Millions of dollars) | | | | | | | | |
| | | December 31, 2016 |
| Allowance for Credit Losses: | | Customer | | Dealer | | Caterpillar Purchased Receivables | | Total |
| Balance at beginning of year | | $ | 327 |
| | $ | 9 |
| | $ | 2 |
| | $ | 338 |
|
| Receivables written off | | (158 | ) | | — |
| | — |
| | (158 | ) |
| Recoveries on receivables previously written off | | 35 |
| | — |
| | — |
| | 35 |
|
| Provision for credit losses | | 132 |
| | 1 |
| | — |
| | 133 |
|
| Adjustment due to sale of receivables | | (8 | ) | | — |
| | — |
| | (8 | ) |
| Foreign currency translation adjustment | | 3 |
| | — |
| | — |
| | 3 |
|
| Balance at end of year | | $ | 331 |
| | $ | 10 |
| | $ | 2 |
| | $ | 343 |
|
| | | | | | | | | |
| Individually evaluated for impairment | | $ | 85 |
| | $ | — |
| | $ | — |
| | $ | 85 |
|
| Collectively evaluated for impairment | | 246 |
| | 10 |
| | 2 |
| | 258 |
|
| Ending Balance | | $ | 331 |
| | $ | 10 |
| | $ | 2 |
| | $ | 343 |
|
| | | | | | | | | |
| Recorded Investment in Finance Receivables: | | |
| | |
| | |
| | |
|
| Individually evaluated for impairment | | $ | 786 |
| | $ | — |
| | $ | — |
| | $ | 786 |
|
| Collectively evaluated for impairment | | 18,859 |
| | 4,479 |
| | 2,431 |
| | 25,769 |
|
| Ending Balance | | $ | 19,645 |
| | $ | 4,479 |
| | $ | 2,431 |
| | $ | 26,555 |
|
| | | | | | | | | |
Credit quality of finance receivables
At origination, we evaluate credit risk based on a variety of credit quality factors including prior payment experience, customer financial information, credit-rating agency ratings, loan-to-value ratios and other internal metrics. On an ongoing basis, we monitor credit quality based on past-due status and collection experience as there is a meaningful correlation between the past-due status of customers and the risk of loss.
In determining past-due status, we consider the entire recorded investment in finance receivable past due when any installment is over 30 days past due. The tables below summarize our recorded investment of finance receivables by aging category.
|
| | | | | | | | | | | | | | | | | | | | | | | | | | | | |
| (Millions of dollars) | | | | | | | | | | | | | | |
| | | December 31, 2017 |
| | | 31-60 Days Past Due | | 61-90 Days Past Due | | 91+ Days Past Due | | Total Past Due | | Current | | Recorded Investment in Finance Receivables | | 91+ Still Accruing |
| Customer | | |
| | |
| | |
| | | | | | | | |
| North America | | $ | 71 |
| | $ | 15 |
| | $ | 42 |
| | $ | 128 |
| | $ | 8,040 |
| | $ | 8,168 |
| | $ | 8 |
|
| Europe | | 21 |
| | 10 |
| | 46 |
| | 77 |
| | 2,718 |
| | 2,795 |
| | 13 |
|
| Asia/Pacific | | 18 |
| | 7 |
| | 14 |
| | 39 |
| | 2,520 |
| | 2,559 |
| | 5 |
|
| Mining | | 3 |
| | 1 |
| | 60 |
| | 64 |
| | 1,751 |
| | 1,815 |
| | 9 |
|
| Latin America | | 37 |
| | 55 |
| | 142 |
| | 234 |
| | 1,546 |
| | 1,780 |
| | — |
|
| Caterpillar Power Finance | | 20 |
| | 32 |
| | 144 |
| | 196 |
| | 2,476 |
| | 2,672 |
| | 1 |
|
| Dealer | | | | | | | | | | | | | | |
| North America | | — |
| | — |
| | — |
| | — |
| | 2,394 |
| | 2,394 |
| | — |
|
| Europe | | — |
| | — |
| | — |
| | — |
| | 417 |
| | 417 |
| | — |
|
| Asia/Pacific | | — |
| | — |
| | — |
| | — |
| | 578 |
| | 578 |
| | — |
|
| Mining | | — |
| | — |
| | — |
| | — |
| | 5 |
| | 5 |
| | — |
|
| Latin America | | — |
| | 72 |
| | — |
| | 72 |
| | 773 |
| | 845 |
| | — |
|
| Caterpillar Power Finance | | — |
| | — |
| | — |
| | — |
| | 2 |
| | 2 |
| | — |
|
| Caterpillar Purchased Receivables | | | | | | | | | | | | | | |
| North America | | 24 |
| | 5 |
| | 2 |
| | 31 |
| | 2,010 |
| | 2,041 |
| | 2 |
|
| Europe | | 1 |
| | 2 |
| | 1 |
| | 4 |
| | 344 |
| | 348 |
| | — |
|
| Asia/Pacific | | — |
| | — |
| | — |
| | — |
| | 630 |
| | 630 |
| | — |
|
| Mining | | — |
| | — |
| | — |
| | — |
| | — |
| | — |
| | — |
|
| Latin America | | — |
| | — |
| | — |
| | — |
| | 437 |
| | 437 |
| | — |
|
| Caterpillar Power Finance | | — |
| | — |
| | — |
| | — |
| | 5 |
| | 5 |
| | — |
|
| Total | | $ | 195 |
| | $ | 199 |
| | $ | 451 |
| | $ | 845 |
| | $ | 26,646 |
| | $ | 27,491 |
| | $ | 38 |
|
| | | | | | | | | | | | | | | |
|
| | | | | | | | | | | | | | | | | | | | | | | | | | | | |
| (Millions of dollars) | | | | | | | | | | | | | | |
| | | December 31, 2016 |
| | | 31-60 Days Past Due | | 61-90 Days Past Due | | 91+ Days Past Due | | Total Past Due | | Current | | Recorded Investment in Finance Receivables | | 91+ Still Accruing |
| Customer | | |
| | |
| | |
| | | | | | | | |
| North America | | $ | 50 |
| | $ | 16 |
| | $ | 59 |
| | $ | 125 |
| | $ | 8,051 |
| | $ | 8,176 |
| | $ | 5 |
|
| Europe | | 16 |
| | 12 |
| | 39 |
| | 67 |
| | 2,388 |
| | 2,455 |
| | 6 |
|
| Asia/Pacific | | 18 |
| | 7 |
| | 15 |
| | 40 |
| | 1,944 |
| | 1,984 |
| | 4 |
|
| Mining | | 3 |
| | 2 |
| | 63 |
| | 68 |
| | 1,756 |
| | 1,824 |
| | 2 |
|
| Latin America | | 40 |
| | 33 |
| | 214 |
| | 287 |
| | 1,808 |
| | 2,095 |
| | — |
|
| Caterpillar Power Finance | | 11 |
| | 9 |
| | 73 |
| | 93 |
| | 3,018 |
| | 3,111 |
| | 1 |
|
| Dealer | | | | | | | | | | | | | | |
| North America | | — |
| | — |
| | — |
| | — |
| | 2,705 |
| | 2,705 |
| | — |
|
| Europe | | — |
| | — |
| | — |
| | — |
| | 336 |
| | 336 |
| | — |
|
| Asia/Pacific | | — |
| | — |
| | — |
| | — |
| | 582 |
| | 582 |
| | — |
|
| Mining | | — |
| | — |
| | — |
| | — |
| | 6 |
| | 6 |
| | — |
|
| Latin America | | — |
| | — |
| | — |
| | — |
| | 848 |
| | 848 |
| | — |
|
| Caterpillar Power Finance | | — |
| | — |
| | — |
| | — |
| | 2 |
| | 2 |
| | — |
|
| Caterpillar Purchased Receivables | | | | | | | | | | | | | | |
| North America | | 11 |
| | 3 |
| | 1 |
| | 15 |
| | 1,303 |
| | 1,318 |
| | 1 |
|
| Europe | | — |
| | — |
| | 1 |
| | 1 |
| | 268 |
| | 269 |
| | — |
|
| Asia/Pacific | | — |
| | — |
| | — |
| | — |
| | 475 |
| | 475 |
| | — |
|
| Mining | | — |
| | — |
| | — |
| | — |
| | — |
| | — |
| | — |
|
| Latin America | | — |
| | — |
| | — |
| | — |
| | 366 |
| | 366 |
| | — |
|
| Caterpillar Power Finance | | — |
| | — |
| | — |
| | — |
| | 3 |
| | 3 |
| | — |
|
| Total | | $ | 149 |
| | $ | 82 |
| | $ | 465 |
| | $ | 696 |
| | $ | 25,859 |
| | $ | 26,555 |
| | $ | 19 |
|
| | | | | | | | | | | | | | | |
Impaired finance receivables
For all classes, a finance receivable is considered impaired, based on current information and events, if it is probable that we will be unable to collect all amounts due according to the contractual terms. Impaired finance receivables include finance receivables that have been restructured and are considered to be troubled debt restructures.
There were no impaired finance receivables as of December 31, 2017, 2016 and 2015, for the Dealer and Caterpillar Purchased Receivables portfolio segments. Our recorded investment in impaired finance receivables and the related unpaid principal balances and allowance for the Customer portfolio segment were as follows:
|
| | | | | | | | | | | | | | | | | | | | | | | | |
| (Millions of dollars) | | | | | | | | | | | | |
| | | As of December 31, 2017 | | As of December 31, 2016 |
Impaired Finance Receivables With No Allowance Recorded | | Recorded Investment | | Unpaid Principal Balance | | Related Allowance | | Recorded Investment | | Unpaid Principal Balance | | Related Allowance |
| North America | | $ | 19 |
| | $ | 19 |
| | $ | — |
| | $ | 10 |
| | $ | 10 |
| | $ | — |
|
| Europe | | 45 |
| | 45 |
| | — |
| | 49 |
| | 48 |
| | — |
|
| Asia/Pacific | | 34 |
| | 33 |
| | — |
| | 3 |
| �� | 2 |
| | — |
|
| Mining | | 121 |
| | 121 |
| | — |
| | 129 |
| | 129 |
| | — |
|
| Latin America | | 45 |
| | 45 |
| | — |
| | 68 |
| | 68 |
| | — |
|
| Caterpillar Power Finance | | 160 |
| | 172 |
| | — |
| | 271 |
| | 271 |
| | — |
|
| Total | | $ | 424 |
| | $ | 435 |
| | $ | — |
| | $ | 530 |
| | $ | 528 |
| | $ | — |
|
Impaired Finance Receivables With An Allowance Recorded | | |
| | |
| | |
| | |
| | |
| | |
|
| North America | | $ | 44 |
| | $ | 43 |
| | $ | 17 |
| | $ | 61 |
| | $ | 60 |
| | $ | 22 |
|
| Europe | | 9 |
| | 8 |
| | 5 |
| | 7 |
| | 7 |
| | 3 |
|
| Asia/Pacific | | 8 |
| | 8 |
| | 2 |
| | 50 |
| | 50 |
| | 8 |
|
| Mining | | — |
| | — |
| | — |
| | — |
| | — |
| | — |
|
| Latin America | | 95 |
| | 106 |
| | 42 |
| | 93 |
| | 104 |
| | 34 |
|
| Caterpillar Power Finance | | 362 |
| | 365 |
| | 83 |
| | 45 |
| | 44 |
| | 18 |
|
| Total | | $ | 518 |
| | $ | 530 |
| | $ | 149 |
| | $ | 256 |
| | $ | 265 |
| | $ | 85 |
|
| Total Impaired Finance Receivables | | | | | | | | | | | | |
| North America | | $ | 63 |
| | $ | 62 |
| | $ | 17 |
| | $ | 71 |
| | $ | 70 |
| | $ | 22 |
|
| Europe | | 54 |
| | 53 |
| | 5 |
| | 56 |
| | 55 |
| | 3 |
|
| Asia/Pacific | | 42 |
| | 41 |
| | 2 |
| | 53 |
| | 52 |
| | 8 |
|
| Mining | | 121 |
| | 121 |
| | — |
| | 129 |
| | 129 |
| | — |
|
| Latin America | | 140 |
| | 151 |
| | 42 |
| | 161 |
| | 172 |
| | 34 |
|
| Caterpillar Power Finance | | 522 |
| | 537 |
| | 83 |
| | 316 |
| | 315 |
| | 18 |
|
| Total | | $ | 942 |
| | $ | 965 |
| | $ | 149 |
| | $ | 786 |
| | $ | 793 |
| | $ | 85 |
|
| | | | | | | | | | | | | |
|
| | | | | | | | | | | | | | | | | | | | | | | | |
| (Millions of dollars) | | | | | | | | | | | | |
| | | Year Ended
December 31, 2017 | | Year Ended
December 31, 2016 | | Year Ended
December 31, 2015 |
Impaired Finance Receivables With No Allowance Recorded | | Average Recorded Investment | | Interest Income Recognized | | Average Recorded Investment | | Interest Income Recognized | | Average Recorded Investment | | Interest Income Recognized |
| North America | | $ | 13 |
| | $ | 1 |
| | $ | 18 |
| | $ | 1 |
| | $ | 12 |
| | $ | 1 |
|
| Europe | | 48 |
| | 1 |
| | 46 |
| | 1 |
| | 42 |
| | 1 |
|
| Asia/Pacific | | 24 |
| | 2 |
| | 2 |
| | — |
| | 2 |
| | — |
|
| Mining | | 126 |
| | 7 |
| | 98 |
| | 4 |
| | 75 |
| | 3 |
|
| Latin America | | 64 |
| | 3 |
| | 47 |
| | 1 |
| | 31 |
| | — |
|
| Caterpillar Power Finance | | 221 |
| | 9 |
| | 270 |
| | 11 |
| | 170 |
| | 5 |
|
| Total | | $ | 496 |
| | $ | 23 |
| | $ | 481 |
| | $ | 18 |
| | $ | 332 |
| | $ | 10 |
|
Impaired Finance Receivables With An Allowance Recorded | | | | | | | | | | | | |
| North America | | $ | 49 |
| | $ | 1 |
| | $ | 34 |
| | $ | — |
| | $ | 9 |
| | $ | — |
|
| Europe | | 6 |
| | — |
| | 11 |
| | 1 |
| | 14 |
| | 1 |
|
| Asia/Pacific | | 31 |
| | 2 |
| | 37 |
| | 3 |
| | 44 |
| | 2 |
|
| Mining | | — |
| | — |
| | 13 |
| | — |
| | 39 |
| | 1 |
|
| Latin America | | 99 |
| | 4 |
| | 66 |
| | 2 |
| | 56 |
| | 3 |
|
| Caterpillar Power Finance | | 180 |
| | 6 |
| | 50 |
| | 1 |
| | 115 |
| | 3 |
|
| Total | | $ | 365 |
| | $ | 13 |
| | $ | 211 |
| | $ | 7 |
| | $ | 277 |
| | $ | 10 |
|
| Total Impaired Finance Receivables | | | | | | | | | | | | |
| North America | | $ | 62 |
| | $ | 2 |
| | $ | 52 |
| | $ | 1 |
| | $ | 21 |
| | $ | 1 |
|
| Europe | | 54 |
| | 1 |
| | 57 |
| | 2 |
| | 56 |
| | 2 |
|
| Asia/Pacific | | 55 |
| | 4 |
| | 39 |
| | 3 |
| | 46 |
| | 2 |
|
| Mining | | 126 |
| | 7 |
| | 111 |
| | 4 |
| | 114 |
| | 4 |
|
| Latin America | | 163 |
| | 7 |
| | 113 |
| | 3 |
| | 87 |
| | 3 |
|
| Caterpillar Power Finance | | 401 |
| | 15 |
| | 320 |
| | 12 |
| | 285 |
| | 8 |
|
| Total | | $ | 861 |
| | $ | 36 |
| | $ | 692 |
| | $ | 25 |
| | $ | 609 |
| | $ | 20 |
|
| | | | | | | | | | | | | |
Recognition of income is suspended and the finance receivable is placed on non-accrual status when management determines that collection of future income is not probable (generally after 120 days past due). Recognition is resumed and previously suspended income is recognized when the finance receivable becomes current and collection of remaining amounts is considered probable. Payments received while the finance receivable is on non-accrual status are applied to interest and principal in accordance with the contractual terms.
As of December 31, 2017 and 2016, there were no finance receivables on non-accrual status for the Dealer portfolio segment. As of December 31, 2017 and 2016, there was $1 million in finance receivables on non-accrual status for the Caterpillar Purchased Receivables portfolio segment, all of which was in the Europe finance receivable class. The recorded investment in Customer finance receivables on non-accrual status as of December 31, was as follows:
|
| | | | | | | | |
| (Millions of dollars) | | | | |
| | | 2017 | | 2016 |
| North America | | $ | 38 |
| | $ | 66 |
|
| Europe | | 37 |
| | 35 |
|
| Asia/Pacific | | 10 |
| | 12 |
|
| Mining | | 63 |
| | 69 |
|
| Latin America | | 192 |
| | 307 |
|
| Caterpillar Power Finance | | 343 |
| | 90 |
|
| Total | | $ | 683 |
| | $ | 579 |
|
| | | | | |
Troubled debt restructurings
A restructuring of a finance receivable constitutes a troubled debt restructuring (TDR) when the lender grants a concession it would not otherwise consider to a borrower experiencing financial difficulties. Concessions granted may include extended contract maturities, inclusion of interest only periods, below market interest rates, extended skip payment periods and reduction of principal and/or accrued interest.
As of December 31, 2017, there were no additional funds committed to lend to a borrower whose terms have been modified in a TDR. As of December 31, 2016, there were $11 million of additional funds committed to lend to a borrower whose terms have been modified in a TDR.
There were no finance receivables modified as TDRs during the years ended December 31, 2017, 2016 and 2015 for the Dealer or Caterpillar Purchased Receivables portfolio segments. Our recorded investment in finance receivables in the Customer portfolio segment modified as TDRs during the years ended December 31, 2017, 2016 and 2015, were as follows:
|
| | | | | | | | | | | |
| (Dollars in millions) | | Year Ended
December 31, 2017 |
| | | Number of Contracts | | Pre-TDR Recorded Investment | | Post-TDR Recorded Investment |
| North America | | 43 |
| | $ | 34 |
| | $ | 35 |
|
| Europe | | 4 |
| | 1 |
| | 1 |
|
| Asia/Pacific | | 10 |
| | 39 |
| | 31 |
|
| Mining | | 2 |
| | 57 |
| | 56 |
|
| Latin America | | 17 |
| | 26 |
| | 27 |
|
Caterpillar Power Finance(1) | | 68 |
| | 422 |
| | 407 |
|
| Total | | 144 |
| | $ | 579 |
| | $ | 557 |
|
| | | | | | | |
| | | Year Ended
December 31, 2016 |
| | | Number of Contracts | | Pre-TDR Recorded Investment | | Post-TDR Recorded Investment |
| North America | | 25 |
| | $ | 25 |
| | $ | 25 |
|
| Europe | | 43 |
| | 12 |
| | 9 |
|
| Asia/Pacific | | 31 |
| | 29 |
| | 28 |
|
| Mining | | 4 |
| | 74 |
| | 66 |
|
Latin America(2) | | 437 |
| | 118 |
| | 82 |
|
| Caterpillar Power Finance | | 34 |
| | 196 |
| | 177 |
|
| Total | | 574 |
| | $ | 454 |
| | $ | 387 |
|
| | | | | | | |
| | | Year Ended
December 31, 2015 |
| | | Number of Contracts | | Pre-TDR Recorded Investment | | Post-TDR Recorded Investment |
| North America | | 14 |
| | $ | 1 |
| | $ | 1 |
|
| Europe | | 23 |
| | 2 |
| | 2 |
|
| Asia/Pacific | | 21 |
| | 26 |
| | 26 |
|
| Mining | | 4 |
| | 65 |
| | 65 |
|
| Latin America | | 11 |
| | 1 |
| | 2 |
|
| Caterpillar Power Finance | | 21 |
| | 259 |
| | 242 |
|
| Total | | 94 |
| | $ | 354 |
| | $ | 338 |
|
| | | | | | | |
(1) In Caterpillar Power Finance, 48 contracts with a pre-TDR recorded investment of $265 million and a post-TDR recorded investment of $258 million are related to six customers.
(2) In Latin America, 321 contracts with a pre-TDR recorded investment of $94 million and a post-TDR recorded investment of $64 million are related to four customers.
TDRs in the Customer portfolio segment with a payment default (defined as 91+ days past due) during the years ended December 31, 2017, 2016 and 2015, which had been modified within twelve months prior to the default date, were as follows:
|
| | | | | | | | | | | | | | | | | | | | | |
| (Dollars in millions) | | Year Ended
December 31, 2017 | | Year Ended
December 31, 2016 | | Year Ended
December 31, 2015 |
| | | Number of Contracts | | Post-TDR Recorded Investment | | Number of Contracts | | Post-TDR Recorded Investment | | Number of Contracts | | Post-TDR Recorded Investment |
| North America | | 4 |
| | $ | 3 |
| | 5 |
| | $ | 2 |
| | 7 |
| | $ | 1 |
|
| Europe | | 1 |
| | — |
| | 5 |
| | 2 |
| | — |
| | — |
|
| Asia/Pacific | | 4 |
| | 1 |
| | 1 |
| | — |
| | — |
| | — |
|
Latin America(1) | | 243 |
| | 17 |
| | 4 |
| | 1 |
| | 12 |
| | 1 |
|
| Total | | 252 |
| | $ | 21 |
| | 15 |
| | $ | 5 |
| | 19 |
| | $ | 2 |
|
| | | | | | | | | | | | | |
(1) In Latin America, 238 contracts with a post-TDR recorded investment of $16 million are related to two customers for the year ended December 31, 2017.
NOTE 3 – EQUIPMENT ON OPERATING LEASES
Components of equipment on operating leases, less accumulated depreciation as of December 31, were as follows:
|
| | | | | | | | |
| (Millions of dollars) | | | | |
| | | 2017 | | 2016 |
| Equipment on operating leases, at cost | | $ | 5,204 |
| | $ | 5,395 |
|
| Less: Accumulated depreciation | | (1,636 | ) | | (1,687 | ) |
| Equipment on operating leases, net | | $ | 3,568 |
| | $ | 3,708 |
|
| | | | | |
At December 31, 2017, scheduled minimum rental payments for operating leases were as follows:
|
| | | | | | | | | | | | | | | | | | | | | | | | | | |
| 2018 | | 2019 | | 2020 | | 2021 | | 2022 | | Thereafter | | Total |
| $ | 799 |
| | $ | 517 |
| | $ | 264 |
| | $ | 113 |
| | $ | 43 |
| | $ | 11 |
| | $ | 1,747 |
|
NOTE 4 – OTHER ASSETS
The components of other assets as of December 31, were as follows:
|
| | | | | | | | |
| (Millions of dollars) | | | | |
| | | 2017 | | 2016 |
| Customer and other miscellaneous receivables | | $ | 457 |
| | $ | 417 |
|
| Collateral held for resale, at net realizable value | | 432 |
| | 654 |
|
Other (1) | | 136 |
| | 180 |
|
| Total other assets | | $ | 1,025 |
| | $ | 1,251 |
|
| | | | | |
(1) Includes $31 million and $21 million of other receivables from Caterpillar as of December 31, 2017 and 2016, respectively.
NOTE 5 – CONCENTRATION OF CREDIT RISK
Financial instruments with potential credit risk consist primarily of finance receivables. Additionally, to a lesser extent, we have potential credit risk associated with counterparties to derivative contracts.
As of December 31, 2017 and 2016, receivables from customers in construction-related industries made up approximately one-third of our total portfolio of which customers in North America were approximately 60 percent. No single customer or dealer represented a significant concentration of credit risk. We typically maintain a security interest in retail financed equipment and in some instances, wholesale financed equipment. We also require physical damage insurance coverage on all financed equipment. See Note 16 for further information concerning business segments.
For derivative contracts, collateral is generally not required of the counterparties or of us. We enter into International Swaps and Derivatives Association (ISDA) master netting agreements that permit the net settlement of amounts owed under their respective derivative contracts. Our exposure to credit loss in the event of nonperformance by the counterparties is limited to only those gains that we have recorded, but for which we have not yet received cash payment. The master netting agreements reduce the amount of loss the company would incur should the counterparties fail to meet their obligations. At December 31, 2017 and 2016, the maximum exposure to credit loss, was $22 million and $72 million, respectively, before the application of any master netting agreements. See Note 9 for further information concerning derivatives.
NOTE 6 – CREDIT COMMITMENTS
Revolving credit facilities
We have three global credit facilities with a syndicate of banks totaling $10.50 billion (Credit Facility) available in the aggregate to both Caterpillar and us for general liquidity purposes. Based on management's allocation decision, which can be revised from time to time, the portion of the Credit Facility available to us as of December 31, 2017 was $7.75 billion.
| |
| • | The 364-day facility of $3.15 billion (of which $2.33 billion is available to us) expires in September 2018. |
| |
| • | The three-year facility, as amended in September 2017, of $2.73 billion (of which $2.01 billion is available to us) expires in September 2020. |
| |
| • | The five-year facility, as amended in September 2017, of $4.62 billion (of which $3.41 billion is available to us) expires in September 2022. |
At December 31, 2017, Caterpillar’s consolidated net worth was $13.72 billion, which was above the $9.00 billion required under the Credit Facility. The consolidated net worth is defined in the Credit Facility as the consolidated shareholders' equity including preferred stock but excluding the pension and other postretirement benefits balance within Accumulated other comprehensive income/(loss).
At December 31, 2017, our covenant interest coverage ratio was 1.88 to 1. This is above the 1.15 to 1 minimum ratio, calculated as (1) profit excluding income taxes, interest expense and net gain/(loss) from interest rate derivatives to (2) interest expense, calculated at the end of each calendar quarter for the rolling four quarter period then most recently ended, required by the Credit Facility.
In addition, at December 31, 2017, our six-month covenant leverage ratio was 7.38 to 1 and our year-end covenant leverage ratio was 7.71 to 1. This is below the maximum ratio of debt to net worth of 10 to 1, calculated (1) on a monthly basis as the average of the leverage ratios determined on the last day of each of the six preceding calendar months and (2) at each December 31, required by the Credit Facility.
In the event that either Caterpillar or we do not meet one or more of our respective financial covenants under the Credit Facility in the future (and are unable to obtain a consent or waiver), the syndicate of banks may terminate the commitments allocated to the party that does not meet its covenants. Additionally, in such event, certain of our other lenders under other loan agreements where similar financial covenants or cross default provisions are applicable, may, at their election, choose to pursue remedies under those loan agreements, including accelerating the repayment of outstanding borrowings. At December 31, 2017, there were no borrowings under the Credit Facility.
Bank borrowings
Available credit lines with banks as of December 31, 2017 totaled $4.59 billion. These committed and uncommitted credit lines, which may be eligible for renewal at various future dates or have no specified expiration date, are used primarily by our non-U.S. subsidiaries for local funding requirements. As of December 31, 2017 and 2016, we had $1.48 billion and $1.42 billion, respectively, outstanding against these credit lines and were in compliance with all debt covenants under these credit lines. The remaining available credit commitments may be withdrawn any time at the lenders' discretion.
Variable denomination floating rate demand notes
We obtain funding from the sale of variable denomination floating rate demand notes, which may be redeemed at any time at the option of the holder without any material restriction. We do not hold reserves to fund the payment of the demand notes. The notes are offered on a continuous basis. As of December 31, 2017 and 2016, there was $481 million and $556 million of variable denomination floating rate demand notes outstanding. The maximum amount of variable denomination floating rate demand notes that we may have outstanding at any time may not exceed $1.25 billion.
Notes receivable from/payable to Caterpillar
Under our variable amount and term lending agreements and other notes receivable with Caterpillar, we may borrow up to $2.79 billion from Caterpillar and Caterpillar may borrow up to $2.14 billion from us. The variable amount lending agreements are in effect for indefinite periods of time and may be changed or terminated by either party with 30 days notice. The term lending agreements have remaining maturities ranging up to ten years. We had notes payable of $1.64 billion and notes receivable of $559 million outstanding under these agreements as of December 31, 2017, compared with notes payable of $1.64 billion and notes receivable of $530 million as of December 31, 2016.
Committed credit facility
We extended a $2 billion committed credit facility to Caterpillar, which expires in February 2019. We receive a fee from Caterpillar based on amounts drawn under the credit facility and a commitment fee for the undrawn amounts under the credit facility. At December 31, 2017, there were no borrowings under this credit facility.
NOTE 7 – SHORT-TERM BORROWINGS
Short-term borrowings outstanding as of December 31, were comprised of the following:
|
| | | | | | | | | | | | |
| (Millions of dollars) | | | | |
| | | 2017 | | 2016 |
| | | Balance | | Avg. Rate | | Balance | | Avg. Rate |
| Commercial paper, net | | $ | 3,680 |
| | 1.1% | | $ | 5,985 |
| | 0.9% |
| Bank borrowings | | 675 |
| | 5.2% | | 553 |
| | 7.5% |
| Variable denomination floating rate demand notes | | 481 |
| | 1.1% | | 556 |
| | 0.9% |
| Total | | $ | 4,836 |
| | | | $ | 7,094 |
| | |
| | | | | | | | | |
NOTE 8 – LONG-TERM DEBT
During 2017, we issued $7.29 billion of medium-term notes, of which $4.89 billion were at fixed interest rates and $2.40 billion were at floating interest rates, primarily indexed to LIBOR. At December 31, 2017, the outstanding medium-term notes had remaining maturities ranging up to 9 years. Debt issuance costs are capitalized and amortized to Interest expense using the straight-line method over the term of the debt issuance. The balance of our medium-term notes contains unamortized fair value adjustments for debt in a fair value hedge relationship.
Long-term debt outstanding as of December 31, was comprised of the following:
|
| | | | | | | | | | | | |
| (Millions of dollars) | | | | |
| | | 2017 | | 2016 |
| | | Balance | | Avg. Rate | | Balance | | Avg. Rate |
| Medium-term notes | | $ | 21,362 |
| | 2.5% | | $ | 19,731 |
| | 2.4% |
| Unamortized discount and debt issuance costs | | (59 | ) | | | | (64 | ) | | |
| Medium-term notes, net | | 21,303 |
| | | | 19,667 |
| | |
| Bank borrowings | | 803 |
| | 5.0% | | 870 |
| | 4.5% |
| Total | | $ | 22,106 |
| | | | $ | 20,537 |
| | |
| | | | | | | | | |
Long-term debt outstanding as of December 31, 2017, matures as follows:
|
| | | |
(Millions of dollars) | |
| 2018 | $ | 6,188 |
|
| 2019 | 5,681 |
|
| 2020 | 4,290 |
|
| 2021 | 1,740 |
|
| 2022 | 2,048 |
|
| Thereafter | 2,159 |
|
| Total | $ | 22,106 |
|
| | |
|
The above table includes $148 million of medium-term notes that could be called by us at some point in the future at par.
During September 2016, $381 million of medium-term notes with varying interest rates and maturity dates were exchanged for $366 million of 1.93 percent medium-term notes due in 2021 and $15 million in cash. In addition, a debt exchange premium of $33 million was paid.
NOTE 9 – DERIVATIVE FINANCIAL INSTRUMENTS AND RISK MANAGEMENT
Our earnings and cash flow are subject to fluctuations due to changes in foreign currency exchange rates and interest rates. Our Risk Management Policy (policy) allows for the use of derivative financial instruments to manage foreign currency exchange rate and interest rate exposures. Our policy specifies that derivatives are not to be used for speculative purposes. Derivatives that we use are primarily foreign currency forward, option and cross currency contracts and interest rate contracts. Our derivative activities are subject to the management, direction and control of our senior financial officers. Risk management practices, including the use of financial derivative instruments, are presented to our Board of Directors and the Audit Committee of the Caterpillar Inc. Board of Directors at least annually.
All derivatives are recognized on the Consolidated Statements of Financial Position at their fair value. On the date the derivative contract is entered into, the derivative instrument is (1) designated as a hedge of the fair value of a recognized asset or liability (fair value hedge), (2) designated as a hedge of a forecasted transaction or the variability of cash flows (cash flow hedge) or (3) undesignated. Changes in the fair value of a derivative that is qualified, designated and highly effective as a fair value hedge, along with the gain or loss on the hedged recognized asset or liability that is attributable to the hedged risk, are recorded in current earnings. Changes in the fair value of a derivative that is qualified, designated and highly effective as a cash flow hedge are recorded in Accumulated other comprehensive income/(loss) (AOCI), to the extent effective, on the Consolidated Statements of Financial Position until they are reclassified to earnings in the same period or periods during which the hedged transaction affects earnings. Changes in the fair value of undesignated derivative instruments and the ineffective portion of designated derivative instruments are reported in current earnings. Cash flows from designated derivative financial instruments are classified within the same category as the item being hedged on the Consolidated Statements of Cash Flows. Cash flows from undesignated derivative financial instruments are included in the investing category on the Consolidated Statements of Cash Flows.
We formally document all relationships between hedging instruments and hedged items, as well as the risk-management objective and strategy for undertaking various hedge transactions. This process includes linking all derivatives that are designated as fair value hedges to specific assets and liabilities on the Consolidated Statements of Financial Position and linking cash flow hedges to specific forecasted transactions or variability of cash flow.
We also formally assess, both at the hedge’s inception and on an ongoing basis, whether the designated derivatives that are used in hedging transactions are highly effective in offsetting changes in fair value or cash flow of hedged items. When a derivative is determined not to be highly effective as a hedge or the underlying hedged transaction is no longer probable, we discontinue hedge accounting prospectively in accordance with derecognition criteria for hedge accounting.
Foreign currency exchange rate risk
We have balance sheet positions and expected future transactions denominated in foreign currencies, thereby creating exposure to movements in exchange rates. In managing foreign currency risk, our objective is to minimize earnings volatility resulting from conversion and the remeasurement of net foreign currency balance sheet positions and future transactions denominated in foreign currencies. Our policy allows the use of foreign currency forward, option and cross currency contracts to offset the risk of currency mismatch between our assets and liabilities and exchange rate risk associated with future transactions denominated in foreign currencies. Our foreign currency forward, option and cross currency contracts are primarily undesignated. We designate fixed-to-fixed cross currency contracts as cash flow hedges to protect against movements in exchange rates on foreign currency fixed rate assets and liabilities.
Interest rate risk
Interest rate movements create a degree of risk by affecting the amount of our interest payments and the value of our fixed-rate debt. Our practice is to use interest rate contracts to manage our exposure to interest rate changes.
We have a match-funding policy that addresses interest rate risk by aligning the interest rate profile (fixed or floating rate and duration) of our debt portfolio with the interest rate profile of our finance receivable portfolio within predetermined ranges on an ongoing basis. In connection with that policy, we use interest rate derivative instruments to modify the debt structure to match assets within the finance receivable portfolio. This matched funding reduces the volatility of margins between interest-bearing assets and interest-bearing liabilities, regardless of which direction interest rates move.
Our policy allows us to use fixed-to-floating, floating-to-fixed and floating-to-floating interest rate contracts to meet the match-funding objective. We designate fixed-to-floating interest rate contracts as fair value hedges to protect debt against changes in fair value due to changes in the benchmark interest rate. We designate most floating-to-fixed interest rate contracts as cash flow hedges to protect against the variability of cash flows due to changes in the benchmark interest rate.
As of December 31, 2017, less than $2 million of deferred net gains, net of tax, included in equity (AOCI in the Consolidated Statements of Financial Position), related to our floating-to-fixed interest rate contracts, are expected to be reclassified to Interest expense over the next twelve months. The actual amount recorded in Interest expense will vary based on interest rates at the time the hedged transactions impact earnings.
We have, at certain times, liquidated fixed-to-floating interest rate contracts that resulted in deferred gains at the time of liquidation. The deferred gains associated with these interest rate contracts are included in Long-term debt in the Consolidated Statements of Financial Position and are being amortized to Interest expense over the remaining term of the previously designated hedged item.
The location and fair value of derivative instruments reported in the Consolidated Statements of Financial Position were as follows:
|
| | | | | | | | | | |
| (Millions of dollars) | | | | | | |
| | | | | Asset (Liability) Fair Value |
| | | | | December 31, |
| | | Consolidated Statements of Financial Position Location | | 2017 | | 2016 |
| Designated derivatives | | | | | | |
| Interest rate contracts | | Other assets | | $ | 3 |
| | $ | 4 |
|
| Interest rate contracts | | Accrued expenses | | (2 | ) | | (1 | ) |
| Cross currency contracts | | Other assets | | 7 |
| | 29 |
|
| Cross currency contracts | | Accrued expenses | | (57 | ) | | (3 | ) |
| | | | | $ | (49 | ) | | $ | 29 |
|
| Undesignated derivatives | | | | |
| | |
|
| Foreign exchange contracts | | Other assets | | $ | 12 |
| | $ | 12 |
|
| Foreign exchange contracts | | Accrued expenses | | (9 | ) | | (4 | ) |
| Cross currency contracts | | Other assets | | — |
| | 27 |
|
| | | | | $ | 3 |
| | $ | 35 |
|
| | | | | | | |
The total notional amount of our derivative instruments was $3.69 billion and $2.63 billion as of December 31, 2017 and 2016, respectively. The notional amounts of derivative financial instruments do not represent amounts exchanged by the parties. The amounts exchanged by the parties are calculated by reference to the notional amounts and by other terms of the derivatives, such as foreign currency exchange rates and interest rates.
The effect of derivatives designated as hedging instruments on the Consolidated Statements of Profit was as follows:
|
| | | | | | | | | | |
| Fair Value Hedges |
| (Millions of dollars) |
| | | | | Year Ended December 31, 2017 |
| | | Classification | | Gains (Losses) on Derivatives | | Gains (Losses) on Borrowings |
| Interest rate contracts | | Other income (expense) | | $ | (2 | ) | | $ | 2 |
|
| | | | | | | |
| | | | | Year Ended December 31, 2016 |
| | | Classification | | Gains (Losses) on Derivatives | | Gains (Losses) on Borrowings |
| Interest rate contracts | | Other income (expense) | | $ | (12 | ) | | $ | 11 |
|
| | | | | | | |
| | | | | Year Ended December 31, 2015 |
| | | Classification | | Gains (Losses) on Derivatives | | Gains (Losses) on Borrowings |
| Interest rate contracts | | Other income (expense) | | $ | (27 | ) | | $ | 26 |
|
| | | | | | | |
|
| | | | | | | | | | | | |
| Cash Flow Hedges |
| (Millions of dollars) |
| | Year Ended December 31, 2017 |
| | | Recognized in Earnings |
| | Amounts of Gains (Losses) Recognized in AOCI (Effective Portion) | Classification | | Reclassified from AOCI to Earnings (Effective Portion) | | Recognized in Earnings (Ineffective Portion) |
| Interest rate contracts | $ | — |
| Interest expense | | $ | 3 |
| | $ | — |
|
| Cross currency contracts | (77 | ) | Other income (expense) | | (81 | ) | | — |
|
| Cross currency contracts |
| Interest expense | | 6 |
| | — |
|
| | $ | (77 | ) | | | $ | (72 | ) | | $ | — |
|
| | | | | | | |
| | Year Ended December 31, 2016 |
| | | Recognized in Earnings |
| | Amounts of Gains (Losses) Recognized in AOCI (Effective Portion) | Classification | | Reclassified from AOCI to Earnings (Effective Portion) | | Recognized in Earnings (Ineffective Portion) |
| Interest rate contracts | $ | 8 |
| Interest expense | | $ | (3 | ) | | $ | — |
|
| Cross currency contracts | 15 |
| Other income (expense) | | 28 |
| | — |
|
| | $ | 23 |
| | | $ | 25 |
| | $ | — |
|
| | | | | | | |
| | Year Ended December 31, 2015 |
| | | Recognized in Earnings |
| | Amounts of Gains (Losses) Recognized in AOCI (Effective Portion) | Classification | | Reclassified from AOCI to Earnings (Effective Portion) | | Recognized in Earnings (Ineffective Portion) |
| Interest rate contracts | $ | 2 |
| Interest expense | | $ | (6 | ) | | $ | — |
|
| Cross currency contracts | 1 |
| Other income (expense) | | 1 |
| | — |
|
| | $ | 3 |
| | | $ | (5 | ) | | $ | — |
|
| | | | | | | |
The effect of derivatives not designated as hedging instruments on the Consolidated Statements of Profit was as follows for the years ended December 31:
|
| | | | | | | | | | | | | | |
| (Millions of dollars) | | | | | | | | |
| | | Classification | | 2017 | | 2016 | | 2015 |
| Foreign exchange contracts | | Other income (expense) | | $ | 14 |
| | $ | (10 | ) | | $ | (50 | ) |
| Cross currency contracts | | Other income (expense) | | (5 | ) | | (14 | ) | | 16 |
|
| | | | | $ | 9 |
| | $ | (24 | ) | | $ | (34 | ) |
| | | | | | | | | |
Balance sheet offsetting
We enter into International Swaps and Derivatives Association (ISDA) master netting agreements that permit the net settlement of amounts owed under their respective derivative contracts. Under these master netting agreements, net settlement generally permits us or the counterparty to determine the net amount payable for contracts due on the same date and in the same currency for similar types of derivative transactions. The master netting agreements generally also provide for net settlement of all outstanding contracts with a counterparty in the case of an event of default or a termination event.
Collateral is generally not required of the counterparties or us under the master netting agreements. As of December 31, 2017, 2016 and 2015, no cash collateral was received or pledged under the master netting agreements.
The effect of net settlement provisions of the master netting agreements on our derivative balances upon an event of default or a termination event as of December 31, was as follows:
|
| | | | | | | | | |
| Offsetting of Derivative Assets and Liabilities | | | | |
| (Millions of dollars) | | | | |
| | | 2017 | | 2016 |
| Derivative Assets | | | | |
| Gross Amount of Recognized Assets | | $ | 22 |
| | $ | 72 |
|
| Gross Amounts Offset | | — |
| | — |
|
Net Amount of Assets(1) | | 22 |
| | 72 |
|
| Gross Amounts Not Offset | | (10 | ) | | (7 | ) |
| Net Amount | | $ | 12 |
| | $ | 65 |
|
| | | | | |
| Derivative Liabilities | | | | |
| Gross Amount of Recognized Liabilities | | $ | (68 | ) | | $ | (8 | ) |
| Gross Amounts Offset | | — |
| | — |
|
Net Amount of Liabilities(1) | | (68 | ) | | (8 | ) |
| Gross Amounts Not Offset | | 10 |
| | 7 |
|
| Net Amount | | $ | (58 | ) | | $ | (1 | ) |
| | | | | |
(1) As presented in the Consolidated Statements of Financial Position.
NOTE 10 – ACCUMULATED OTHER COMPREHENSIVE INCOME/(LOSS)
Comprehensive income/(loss) and its components are presented in the Consolidated Statements of Comprehensive Income. Changes in Accumulated other comprehensive income/(loss), net of tax, included in the Consolidated Statements of Changes in Shareholder's Equity, consisted of the following:
|
| | | | | | | | | | | |
| (Millions of dollars) | Foreign currency translation | | Derivative financial instruments | | Total |
| | | | | | |
| Balance at December 31, 2014 | $ | (359 | ) | | $ | (5 | ) | | $ | (364 | ) |
Other comprehensive income/(loss) before reclassifications | (538 | ) | | 2 |
| | (536 | ) |
Amounts reclassified from accumulated other comprehensive (income)/loss | — |
| | 3 |
| | 3 |
|
| Other comprehensive income/(loss) | (538 | ) | | 5 |
| | (533 | ) |
| Balance at December 31, 2015 | $ | (897 | ) | | $ | — |
| | $ | (897 | ) |
Other comprehensive income/(loss) before reclassifications | (97 | ) | | 15 |
| | (82 | ) |
Amounts reclassified from accumulated other comprehensive (income)/loss | — |
| | (16 | ) | | (16 | ) |
| Other comprehensive income/(loss) | (97 | ) | | (1 | ) | | (98 | ) |
| Balance at December 31, 2016 | $ | (994 | ) | | $ | (1 | ) | | $ | (995 | ) |
Other comprehensive income/(loss) before reclassifications | 407 |
| | (49 | ) | | 358 |
|
Amounts reclassified from accumulated other comprehensive (income)/loss | — |
| | 45 |
| | 45 |
|
| Other comprehensive income/(loss) | 407 |
| | (4 | ) | | 403 |
|
| Balance at December 31, 2017 | $ | (587 | ) | | $ | (5 | ) | | $ | (592 | ) |
| | | | | | |
The effect of the reclassifications out of Accumulated other comprehensive income/(loss) on the Consolidated Statements of Profit during the years ended December 31, 2017, 2016 and 2015 was as follows:
|
| | | | | | | | | | | | | |
| (Millions of dollars) | | | | | | | |
| | Classification of income (expense) | | 2017 | | 2016 | | 2015 |
| Cross currency contracts | Other income (expense) | | $ | (81 | ) | | $ | 28 |
| | $ | 1 |
|
| Cross currency contracts | Interest expense | | 6 |
| | — |
| | — |
|
| Interest rate contracts | Interest expense | | 3 |
| | (3 | ) | | (6 | ) |
| Reclassifications before tax | | | (72 | ) | | 25 |
| | (5 | ) |
| Tax (provision) benefit | | | 27 |
| | (9 | ) | | 2 |
|
| Total reclassifications from Accumulated other comprehensive income/(loss) | | $ | (45 | ) | | $ | 16 |
| | $ | (3 | ) |
| | | | | | | | |
NOTE 11 – COMMITMENTS AND CONTINGENT LIABILITIES
We provide loan guarantees to third-party lenders for financing associated with machinery purchased by customers. These guarantees have varying terms and are secured by the machinery being financed. We also provide residual value guarantees to third-party lenders associated with machinery leased to customers. These guarantees have varying terms. In addition, we participate in standby letters of credit issued to third parties on behalf of our customers. These standby letters of credit have varying terms and beneficiaries and are secured by customer assets.
No significant loss has been experienced or is anticipated under any of these guarantees. At December 31, 2017 and 2016, the related recorded liability was less than $1 million and $1 million, respectively. The maximum potential amount of future payments (undiscounted and without reduction for any amounts that may possibly be recovered under recourse or collateralized provisions) we could be required to make under the guarantees was $91 million and $43 million, at December 31, 2017 and 2016, respectively.
We provide guarantees to repurchase certain loans of Caterpillar dealers from a special purpose corporation (SPC) that qualifies as a VIE (see Note 1 for additional information regarding the accounting guidance on the consolidation of VIEs). The purpose of the SPC is to provide short-term working capital loans to Caterpillar dealers. This SPC issues commercial paper and uses the proceeds to fund its loan program. We have a loan purchase agreement with the SPC that obligates us to purchase certain loans that are not paid at maturity. We receive a fee for providing this guarantee, which provides a source of liquidity for the SPC. We are the primary beneficiary of the SPC as our guarantees result in us having both the power to direct the activities that most significantly impact the SPC's economic performance and the obligation to absorb losses and therefore we have consolidated the financial statements of the SPC. As of December 31, 2017 and 2016, the SPC’s assets of $1.11 billion and $1.09 billion, respectively, were primarily comprised of loans to dealers, which are included in Finance receivables, net in the Consolidated Statements of Financial Position, and the SPC's liabilities of $1.11 billion and $1.09 billion, respectively, were primarily comprised of commercial paper, which is included in Short-term borrowings in the Consolidated Statements of Financial Position. The assets of the SPC are not available to pay our creditors. We may be obligated to perform under the guarantee if the SPC experiences losses. No loss has been experienced or is anticipated under this loan purchase agreement.
We are party to agreements in the normal course of business with selected customers and Caterpillar dealers in which we commit to provide a set dollar amount of financing on a pre-approved basis. We also provide lines of credit to certain customers and Caterpillar dealers, of which a portion remains unused as of the end of the period. Commitments and lines of credit generally have fixed expiration dates or other termination clauses. It has been our experience that not all commitments and lines of credit will be used. Management applies the same credit policies when making commitments and granting lines of credit as it does for any other financing. We do not require collateral for these commitments/lines, but if credit is extended, collateral may be required upon funding. As of December 31, 2017 and 2016, the amount of the unused commitments and lines of credit for dealers was $11.21 billion and $12.97 billion, respectively. As of December 31, 2017 and 2016, the amount of the unused commitments and lines of credit for customers was $3.09 billion and $3.34 billion, respectively.
We had a commitment to purchase the corporate headquarters building for $91 million as of December 31, 2017. The building purchase was closed on January 4, 2018.
We are involved in unresolved legal actions that arise in the normal course of business. Although it is not possible to predict with certainty the outcome of our unresolved legal actions, we believe that these unresolved legal actions will neither individually nor in the aggregate have a material adverse effect on our consolidated results of operations, financial position or liquidity.
NOTE 12 – INCOME TAXES
On December 22, 2017, U.S. tax legislation was enacted containing a broad range of tax reform provisions including a corporate tax rate reduction and changes in the U.S. taxation of non-U.S. earnings. We have not completed our accounting for the income tax effects of U.S. tax reform. However, we have made a reasonable estimate of the 2017 financial statement impact as of January 18, 2018, and recognized a provisional net benefit of $151 million. We will continue to update our calculations as additional required information is prepared and analyzed, interpretations and assumptions are refined, additional guidance is issued, and due to actions we may take as a result of the legislation. These updates could significantly impact the provision for income taxes, the amount of taxes payable, and the deferred tax asset and liability balances.
The provisionally estimated net benefit includes a $334 million write-down of net deferred tax liabilities to reflect the reduction in the U.S. corporate tax rate from 35 percent to 21 percent beginning January 1, 2018. We are still analyzing certain aspects of the law and refining our calculations of basis differences as of December 31, 2017, which could affect the measurement of these balances.
The provisionally estimated net benefit includes $183 million for the estimated cost of a mandatory deemed repatriation of non-U.S. earnings. The resulting tax liability, net of available foreign tax credits, is $131 million, payable over eight years and is included in Income taxes payable in the Consolidated Statements of Financial Position. The U.S. federal tax cost for the mandatory deemed repatriation is computed at 15.5 percent for non-U.S. earnings held in liquid assets and 8 percent for non-liquid assets, reduced by applicable foreign tax credits. These estimates are provisional due to additional information and analysis required to determine cumulative taxable earnings since 1986 for non-U.S. subsidiaries at two separate points in time and to determine the amount of earnings that are held in liquid versus non-liquid assets as defined in the new legislation at several different measurement periods. In addition, information is being gathered and analyzed to support available foreign tax credits including estimates of credit utilization and valuation allowance considerations for any remaining foreign tax credit carryforward. Due to uncertainty about aspects of the tax law, we have made various assumptions to determine our reasonable estimate that we expect to refine as additional guidance is issued.
As a result of U.S. tax reform legislation, distributions of profits from non-U.S. subsidiaries are expected to have minimal U.S. tax impact in the future. However, these distributions may be subject to non-U.S. withholding taxes if profits are distributed in certain jurisdictions. We have not recorded a deferred tax liability for withholding taxes in non-U.S. jurisdictions where earnings are considered indefinitely reinvested. If management intentions or U.S. tax law changes in the future, there could be an impact on the provision for income taxes to record an incremental tax liability in the period the change occurs.
A reconciliation of the U.S. federal statutory rate to the effective rate for the years ended December 31, was as follows:
|
| | | | | | | | | | | | | | | | | | | | | |
| (Millions of dollars) | | | | | | |
| | | 2017 | | 2016 | | 2015 |
| Taxes computed at U.S. statutory rates | | $ | 206 |
| | 35.0 | % | | $ | 196 |
| | 35.0 | % | | $ | 217 |
| | 35.0 | % |
| (Decreases) increases in taxes resulting from: | | | | | | |
| | |
| | |
| | |
|
| State Income Tax, net of Federal Tax | | 2 |
| | 0.3 | % | | 2 |
| | 0.4 | % | | 3 |
| | 0.5 | % |
Subsidiaries' results subject to tax rates other than U.S. statutory rates | | (31 | ) | | (5.3 | )% | | (36 | ) | | (6.5 | )% | | (25 | ) | | (4.0 | )% |
Income from non-U.S. subsidiaries taxed at U.S. statutory rates, net of foreign tax credits(1) | | (16 | ) | | (2.7 | )% | | 2 |
| | 0.3 | % | | (39 | ) | | (6.3 | )% |
| Foreign currency translation taxed at non-U.S. subsidiaries | | (12 | ) | | (2.0 | )% | | 13 |
| | 2.3 | % | | 6 |
| | 0.9 | % |
| U.S. deferred tax rate change | | (334 | ) | | (56.6 | )% | | — |
| | — | % | | — |
| | — | % |
| Mandatory deemed repatriation of non-U.S. earnings | | 183 |
| | 31.0 | % | | — |
| | — | % | | — |
| | — | % |
| Other, net | | (2 | ) | | (0.4 | )% | | (6 | ) | | (1.1 | )% | | (4 | ) | | (0.6 | )% |
| Provision (benefit) for income taxes | | $ | (4 | ) | | (0.7 | )% | | $ | 171 |
| | 30.4 | % | | $ | 158 |
| | 25.5 | % |
| | | | | | | | | | | | | |
(1) Excludes provisionally estimated net benefit from 2017 U.S. tax reform.
The components of Profit before income taxes for the years ended December 31, were as follows:
|
| | | | | | | | | | | | |
| (Millions of dollars) | | | | | | |
| | | 2017 | | 2016 | | 2015 |
| U.S. | | $ | 285 |
| | $ | 249 |
| | $ | 230 |
|
| Non-U.S. | | 305 |
| | 312 |
| | 389 |
|
| Total | | $ | 590 |
| | $ | 561 |
| | $ | 619 |
|
| | | | | | | |
Profit before income taxes, as shown above, is based on the location of the entity to which such earnings are attributable. Where an entity’s earnings are subject to taxation, however, may not correlate solely to where an entity is located. Thus, the income tax provision shown below as U.S. or non-U.S. may not correspond to the earnings shown above.
The components of the Provision (benefit) for income taxes were as follows for the years ended December 31:
|
| | | | | | | | | | | | |
| (Millions of dollars) | | | | | | |
| | | 2017 | | 2016 | | 2015 |
| Current income tax provision (benefit): | | | | | | |
| U.S. | | $ | 157 |
| | $ | (18 | ) | | $ | (21 | ) |
| Non-U.S. | | 102 |
| | 111 |
| | 109 |
|
| State (U.S.) | | 1 |
| | — |
| | 2 |
|
| | | 260 |
| | 93 |
| | 90 |
|
| | | | | | | |
| Deferred income tax provision (benefit): | | |
| | |
| | |
|
| U.S. | | (239 | ) | | 90 |
| | 45 |
|
| Non-U.S. | | (28 | ) | | (15 | ) | | 21 |
|
| State (U.S.) | | 3 |
| | 3 |
| | 2 |
|
| | | (264 | ) | | 78 |
| | 68 |
|
| | | | | | | |
| Total Provision (benefit) for income taxes | | $ | (4 | ) | | $ | 171 |
| | $ | 158 |
|
| | | | | | | |
Current income tax provision is the amount of income taxes reported or expected to be reported on our income tax returns. We join Caterpillar in the filing of a consolidated U.S. Federal income tax return and certain state income tax returns. In accordance with our tax sharing agreement with Caterpillar, we generally pay to or receive from Caterpillar our allocated share of income taxes or credits reflected in these consolidated filings. This amount is calculated on a separate return basis by taking taxable income times the applicable statutory tax rate and includes payment for certain tax attributes earned during the year.
Accounting for income taxes under generally accepted accounting principles in the United States of America requires individual tax-paying entities of the Company to offset deferred income tax assets and liabilities within each particular tax jurisdiction and present them as a single amount in the Consolidated Statements of Financial Position. Amounts in different tax jurisdictions cannot be offset against each other. The amounts of deferred income taxes at December 31, included in the following lines in our Consolidated Statements of Financial Position were:
|
| | | | | | | | |
| (Millions of dollars) | | | | |
| | | 2017 | | 2016 |
| Assets: | | | | |
| Deferred and refundable income taxes | | $ | 101 |
| | $ | 89 |
|
| Liabilities: | | |
| | |
|
| Deferred income taxes and other liabilities | | (579 | ) | | (939 | ) |
| Deferred income taxes, net | | $ | (478 | ) | | $ | (850 | ) |
| | | | | |
Our consolidated deferred income taxes consisted of the following components as of December 31:
|
| | | | | | | | |
| (Millions of dollars) | | | | |
| | | 2017 | | 2016 |
| Deferred income tax assets: | | | | |
| Allowance for credit losses | | $ | 96 |
| | $ | 148 |
|
| Tax carryforwards | | 43 |
| | 73 |
|
| | | 139 |
| | 221 |
|
| | | | | |
| Deferred income tax liabilities (primarily lease basis differences) | | (441 | ) | | (693 | ) |
| | | | | |
| Valuation allowance for deferred income tax assets | | (11 | ) | | (10 | ) |
| | | | | |
| Deferred income tax on translation adjustment | | (165 | ) | | (368 | ) |
| | | | | |
| Deferred income taxes, net | | $ | (478 | ) | | $ | (850 | ) |
| | | | | |
As of December 31, 2017, amounts and expiration dates of net operating loss (NOL) carryforwards in various U.S. state taxing jurisdictions were:
|
| | | | | | | | | | | | | | | | | | | | | | |
| (Millions of dollars) | | | | | | | | |
| 2018 | | 2019 | | 2020 | | 2021 | | 2022-2037 | | Total |
| $ | 6 |
| | $ | 4 |
| | $ | 1 |
| | $ | 5 |
| | $ | 137 |
| | $ | 153 |
|
The gross deferred income tax asset associated with these NOL carryforwards is $12 million as of December 31, 2017, partially offset by a valuation allowance of $1 million.
In some U.S. state income tax jurisdictions, we join with other Caterpillar entities in filing combined income tax returns. In other U.S. state income tax jurisdictions, we file on a separate, stand-alone basis.
As of December 31, 2017, amounts and expiration dates of NOL carryforwards in various non-U.S. taxing jurisdictions were:
|
| | | | | | | | | | | | | | | | | | | | | | | | | | |
| (Millions of dollars) | | | | | | | | | | |
| 2018 | | 2019 | | 2020 | | 2021 | | 2022-2037 | | Unlimited | | Total |
| $ | — |
| | $ | — |
| | $ | — |
| | $ | 26 |
| | $ | 45 |
| | $ | 53 |
| | $ | 124 |
|
Valuation allowances totaling $10 million have been recorded at certain non-U.S. subsidiaries that have not yet demonstrated consistent and/or sustainable profitability to support the recognition of net deferred income tax assets.
A reconciliation of the beginning and ending amounts of gross unrecognized income tax benefits for uncertain income tax positions, including positions impacting only the timing of income tax benefits was as follows:
|
| | | | | | | | |
| (Millions of dollars) | | | | |
| | | 2017 | | 2016 |
Reconciliation of unrecognized income tax benefits(1): | | | | |
| Balance at beginning of year | | $ | 4 |
| | $ | — |
|
| Additions for income tax positions related to current year | | — |
| | 1 |
|
| Additions for income tax positions related to prior year | | — |
| | 3 |
|
Reductions for income tax positions related to settlements(2) | | (4 | ) | | — |
|
| Balance at end of year | | $ | — |
| | $ | 4 |
|
| | | | | |
| Amount that, if recognized, would impact the effective tax rate | | $ | — |
| | $ | — |
|
| | | | | |
(1) Foreign currency translation amounts are included within each line as applicable.
(2) Includes cash payment or other reduction of assets to settle liability.
We classify interest and penalties on income taxes as a component of the provision for income taxes. During the years ended December 31, 2017, 2016 and 2015, we recognized an expense of $2 million, a benefit of less than $1 million and an expense of less than $1 million in interest and penalties, respectively. As of December 31, 2017 and 2016, the total amount of accrued interest and penalties was less than $1 million and $2 million, respectively.
On January 31, 2018, Caterpillar received a Revenue Agent's Report (RAR) from the IRS indicating the end of field examination of our U.S. tax returns for 2010 to 2012. Tax years prior to 2007 are generally no longer subject to U.S. tax assessment. In our major non-U.S. jurisdictions, tax years are typically subject to examination for three to seven years. Due to the uncertainty related to the timing and potential outcome of audits, we cannot estimate the range of reasonably possible change in unrecognized tax benefits in the next 12 months.
NOTE 13 – FAIR VALUE MEASUREMENTS
| |
| A. | Fair Value Measurements |
The guidance on fair value measurements defines fair value as the exchange price that would be received for an asset or paid to transfer a liability (an exit price) in the principal or most advantageous market for the asset or liability in an orderly transaction between market participants. This guidance also specifies a fair value hierarchy based upon the observability of inputs used in valuation techniques. Observable inputs (highest level) reflect market data obtained from independent sources, while unobservable inputs (lowest level) reflect internally developed market assumptions. In accordance with this guidance, fair value measurements are classified under the following hierarchy:
| |
| • | Level 1 – Quoted prices for identical instruments in active markets. |
| |
| • | Level 2 – Quoted prices for similar instruments in active markets; quoted prices for identical or similar instruments in markets that are not active; and model-derived valuations in which all significant inputs or significant value-drivers are observable in active markets. |
| |
| • | Level 3 – Model-derived valuations in which one or more significant inputs or significant value-drivers are unobservable. |
When available, we use quoted market prices to determine fair value and we classify such measurements within Level 1. In some cases where market prices are not available, we make use of observable market-based inputs to calculate fair value, in which case the measurements are classified within Level 2. If quoted or observable market prices are not available, fair value is based upon internally developed models that use, where possible, current market-based parameters such as interest rates, yield curves and currency rates. These measurements are classified within Level 3.
Fair value measurements are classified according to the lowest level input or value-driver that is significant to the valuation. A measurement may therefore be classified within Level 3 even though there may be significant inputs that are readily observable.
Fair value measurement includes the consideration of nonperformance risk. Nonperformance risk refers to the risk that an obligation (either by a counterparty or us) will not be fulfilled. For financial assets traded in an active market (Level 1), the nonperformance risk is included in the market price. For certain other financial assets and liabilities (Level 2 and 3), our fair value calculations have been adjusted accordingly.
Derivative financial instruments
The fair value of interest rate contracts is primarily based on standard industry accepted models that utilize the appropriate market-based forward swap curves and zero-coupon interest rates to determine discounted cash flows. The fair value of foreign currency forward and cross currency contracts is based on a standard industry accepted valuation model that discounts cash flows resulting from the differential between the contract price and the market-based forward rate.
Derivative financial instruments are measured on a recurring basis at fair value and are classified as Level 2 measurements. We had derivative financial instruments in a net liability position included in our Consolidated Statements of Financial Position of $46 million as of December 31, 2017, and in a net asset position of $64 million as of December 31, 2016.
Impaired loans
Our impaired loans are subject to measurement at fair value on a nonrecurring basis and are classified as Level 3 measurements. A loan is considered impaired when management determines that collection of contractual amounts due is not probable. In these cases, an allowance for credit losses may be established based either on the present value of expected future cash flows discounted at the receivables' effective interest rate, the fair value of the collateral for collateral-dependent receivables or the observable market price of the receivable. In determining collateral value, we estimate the current fair market value of the collateral less selling costs. We had impaired loans carried at the fair value of $341 million and $137 million as of December 31, 2017 and 2016, respectively.
| |
B. | Fair Values of Financial Instruments |
In addition to the methods and assumptions we use to record the fair value of financial instruments as discussed in the Fair Value Measurements section above, we used the following methods and assumptions to estimate the fair value of our financial instruments.
Cash and cash equivalents – carrying amount approximated fair value.
Finance receivables, net – fair value was estimated by discounting the future cash flows using current rates representative of receivables with similar remaining maturities.
Restricted cash and cash equivalents – carrying amount approximated fair value.
Short-term borrowings – carrying amount approximated fair value.
Long-term debt – fair value for fixed and floating-rate debt was estimated based on quoted market prices.
Guarantees – fair value of guarantees is based on our estimate of the premium a market participant would require to issue the same guarantee in a stand-alone, arms-length transaction with an unrelated party. If quoted or observable market prices are not available, fair value is based upon internally developed models that utilize current market-based assumptions.
Please refer to the table below for the fair values of our financial instruments.
|
| | | | | | | | | | | | | | | | | | |
| (Millions of dollars) | | 2017 | | 2016 | | |
| | | Carrying Amount | | Fair Value | | Carrying Amount | | Fair Value | Fair Value Levels | Reference |
| Cash and cash equivalents | | $ | 708 |
| | $ | 708 |
| | $ | 1,795 |
| | $ | 1,795 |
| 1 | |
Finance receivables, net (excluding finance leases(1)) | | $ | 20,063 |
| | $ | 20,019 |
| | $ | 20,101 |
| | $ | 19,949 |
| 3 | Note 2 |
| Interest rate contracts: | | |
| | |
| | |
| | |
| | |
| In a net receivable position | | $ | 3 |
| | $ | 3 |
| | $ | 4 |
| | $ | 4 |
| 2 | Note 9 |
| In a net payable position | | $ | (2 | ) | | $ | (2 | ) | | $ | (1 | ) | | $ | (1 | ) | 2 | Note 9 |
| Cross currency contracts | | | | | | | | | | |
| In a receivable position | | $ | 7 |
| | $ | 7 |
| | $ | 56 |
| | $ | 56 |
| 2 | Note 9 |
| In a payable position | | $ | (57 | ) | | $ | (57 | ) | | $ | (3 | ) | | $ | (3 | ) | 2 | Note 9 |
| Foreign currency contracts: | | |
| | |
| | |
| | |
| | |
| In a receivable position | | $ | 12 |
| | $ | 12 |
| | $ | 12 |
| | $ | 12 |
| 2 | Note 9 |
| In a payable position | | $ | (9 | ) | | $ | (9 | ) | | $ | (4 | ) | | $ | (4 | ) | 2 | Note 9 |
Restricted cash and cash equivalents(2) | | $ | 24 |
| | $ | 24 |
| | $ | 29 |
| | $ | 29 |
| 1 | |
| Short-term borrowings | | $ | (4,836 | ) | | $ | (4,836 | ) | | $ | (7,094 | ) | | $ | (7,094 | ) | 1 | Note 7 |
| Long-term debt | | $ | (22,106 | ) | | $ | (22,230 | ) | | $ | (20,537 | ) | | $ | (20,724 | ) | 2 | Note 8 |
| Guarantees | | $ | — |
| | $ | — |
| | $ | (1 | ) | | $ | (1 | ) | 3 | Note 11 |
| | | | | | | | | | | |
(1) As of December 31, 2017 and 2016, represents finance leases with a net carrying value of $7.06 billion and $6.11 billion, respectively.
(2) Included in Other assets in the Consolidated Statements of Financial Position.
NOTE 14 – TRANSACTIONS WITH RELATED PARTIES
We have a Support Agreement with Caterpillar, which provides that Caterpillar will (1) remain, directly or indirectly, our sole owner; (2) cause us to maintain a tangible net worth of at least $20 million and (3) ensure that we maintain a ratio of profit before income taxes and interest expense to interest expense (as defined by the Support Agreement) of not less than 1.15 to 1, calculated on an annual basis. Although this agreement can be modified or terminated by either party, any termination or any modification which would adversely affect holders of our debt requires the consent of holders of 66-2/3 percent in principal amount of outstanding debt of each series so affected. Any modification or termination which would adversely affect the lenders under the Credit Facility requires their consent. Caterpillar's obligation under this agreement is not directly enforceable by any of our creditors and does not constitute a guarantee of any of our obligations. Cash dividends of $725 million, $275 million and $600 million were paid to Caterpillar in 2017, 2016 and 2015, respectively.
We have variable amount and term lending agreements and other notes receivable with Caterpillar. Under these agreements, we may borrow up to $2.79 billion from Caterpillar, and Caterpillar may borrow up to $2.14 billion from us. The variable amount lending agreements are in effect for indefinite periods of time and may be changed or terminated by either party with 30 days notice. The term lending agreements have remaining maturities ranging up to ten years. We extended a $2 billion committed credit facility to Caterpillar, which expires in February 2019. Under this agreement, we receive a fee from Caterpillar based on amounts drawn under the credit facility and a commitment fee for the undrawn amounts under the credit facility. Information concerning these agreements was as follows:
|
| | | | | | | | | | | | |
| (Millions of dollars) | | | | | | |
| | | 2017 | | 2016 | | 2015 |
| Notes payable as of December 31, | | $ | 1,638 |
| | $ | 1,637 |
| | $ | 1,096 |
|
| Notes receivable as of December 31, | | $ | 559 |
| | $ | 530 |
| | $ | 490 |
|
| Interest expense | | $ | 21 |
| | $ | 15 |
| | $ | 6 |
|
Interest income on Notes Receivable with Caterpillar(1) | | $ | 74 |
| | $ | 30 |
| | $ | 21 |
|
Fees on committed credit facility extended to Caterpillar(1) | | $ | 40 |
| | $ | 40 |
| | $ | 40 |
|
| | | | | | | |
(1) Included in Other revenues, net in the Consolidated Statements of Profit.
We have agreements with Caterpillar to purchase certain trade receivables at a discount. Information pertaining to these purchases was as follows:
|
| | | | | | | | | | | | |
| (Millions of dollars) | | | | | | |
| | | 2017 | | 2016 | | 2015 |
| Purchases made | | $ | 34,667 |
| | $ | 28,631 |
| | $ | 33,154 |
|
| Discounts earned | | $ | 253 |
| | $ | 207 |
| | $ | 222 |
|
| Purchased Receivables as of December 31, | | $ | 3,461 |
| | $ | 2,431 |
| | $ | 2,601 |
|
| | | | | | | |
We participate in certain marketing programs offered in conjunction with Caterpillar that allow us to periodically offer financing to customers at interest rates that are below market rates. Under these marketing programs, Caterpillar funds an amount at the outset of the transaction, which we then recognize as revenue over the term of the financing. During 2017, 2016 and 2015, relative to such programs, we received $250 million, $233 million and $188 million, respectively. We have finance receivables and equipment on operating leases, net of depreciation, with Caterpillar of $17 million and $18 million as of December 31, 2017 and 2016, respectively. For the years ended December 31, 2017, 2016 and 2015, we recognized revenues of $4 million, $8 million and $9 million, respectively, related to these finance receivables and operating leases. For the years ended December 31, 2017, 2016 and 2015, we recognized depreciation related to these operating leases of $3 million, $7 million and $7 million, respectively. At December 31, 2017 and 2016, $481 million and $403 million, respectively, of our portfolio is subject to guarantees by Caterpillar and affiliates.
We participate in various benefit plans, which are administered by Caterpillar. These plans include employee medical plans and postretirement benefit plans. We reimburse Caterpillar for these charges. During 2017, 2016 and 2015, these charges amounted to $31 million, $29 million and $29 million, respectively. Included in these charges are contributions to defined benefit plans in the amount of $8 million in 2017 and $7 million for 2016 and 2015, respectively. These contributions are related to our participation in the following defined benefit plans that are administered by Caterpillar: the Caterpillar Inc. Retirement Income Plan, the Caterpillar Inc. Supplemental Retirement Plan and the Caterpillar Inc. Retiree Benefit Program. The total cost of the defined benefit plans is determined by actuarial valuation and we receive an allocation of the service and prior service cost based on headcount. We participate in the Caterpillar stock incentive plans. In 2017, 2016 and 2015, Caterpillar allocated to us $8 million, $9 million and $12 million, respectively, in expenses related to stock based compensation. Further information about these plans is available in Caterpillar’s 2017 Annual Report on Form 10-K filed separately with the Securities and Exchange Commission.
Caterpillar provides operational and administrative support, which is integral to the conduct of our business. In 2017, 2016 and 2015, these operational and support charges for which we reimburse Caterpillar amounted to $30 million, $28 million and $37 million, respectively. In addition, we provide administrative support services to certain Caterpillar subsidiaries. Caterpillar reimburses us for these charges. During 2017, 2016 and 2015, these charges amounted to $9 million, $9 million and $12 million, respectively.
We join Caterpillar in the filing of a consolidated U.S. Federal income tax return and certain state income tax returns. In accordance with our tax sharing agreement with Caterpillar, we generally pay to or receive from Caterpillar our allocated share of income taxes or credits reflected in these consolidated filings. This amount is calculated on a separate return basis by taking taxable income times the applicable statutory tax rate and includes payment for certain tax attributes earned during the year.
NOTE 15 – LEASES
We lease our offices and other property through operating leases. Rental expense is charged to operations as incurred. For 2017, 2016 and 2015, total rental expense for operating leases was $16 million, $17 million and $16 million, respectively. At December 31, 2017, minimum payments for operating leases having initial non-cancelable terms in excess of one year were as follows:
|
| | | |
| (Millions of dollars) | |
| 2018 | $ | 8 |
|
| 2019 | 6 |
|
| 2020 | 4 |
|
| 2021 | 3 |
|
| 2022 | 3 |
|
| Thereafter | 3 |
|
| Total | $ | 27 |
|
| | |
|
We had a commitment to purchase the corporate headquarters building for $91 million as of December 31, 2017. The building purchase was closed on January 4, 2018.
NOTE 16 – SEGMENT AND GEOGRAPHIC INFORMATION
A. Basis for Segment Information
We report information internally for operating segments based on management responsibility. Our operating segments offer financing to customers and dealers for the purchase and lease of Caterpillar and other equipment, as well as financing for Caterpillar sales to dealers. Financing plans include operating and finance leases, installment sale contracts, working capital loans and wholesale financing plans within each of the respective segments.
B. Description of Segments
We have five operating segments that offer financing services. Following is a brief description of our segments:
| |
| • | North America - Includes our operations in the United States and Canada. |
| |
| • | Europe - Includes our operations in Europe, Africa, Middle East and the Commonwealth of Independent States. |
| |
| • | Asia/Pacific - Includes our operations in Australia, New Zealand, China, Japan and Southeast Asia. |
| |
| • | Latin America and Caterpillar Power Finance - Includes our operations in Mexico, Central and South American countries. This segment also includes Caterpillar Power Finance (CPF), which finances marine vessels with Caterpillar engines worldwide and also provides financing for Caterpillar electrical power generation, gas compression and co-generation systems and non-Caterpillar equipment that is powered by these systems worldwide. |
| |
| • | Mining - Serves large mining customers worldwide and provides project financing in various countries. |
C. Segment Measurement and Reconciliations
Cash, debt and other expenses are allocated to our segments based on their respective portfolios. The related Interest expense is calculated based on the amount of allocated debt and the rates associated with that debt. The performance of each segment is assessed based on a consistent leverage ratio. The Provision for credit losses is based on each segment's respective finance receivable portfolio. Capital expenditures include expenditures for equipment on operating leases and other miscellaneous capital expenditures.
Reconciling items are created based on accounting differences between segment reporting and consolidated external reporting. For the reconciliation of profit before income taxes, we have grouped the reconciling items as follows:
| |
| • | Unallocated - This item is related to corporate requirements and strategies that are considered to be for the benefit of the entire organization. Also included are the consolidated results of the special purpose corporation (see Note 11 for additional information) and other miscellaneous items. |
| |
| • | Timing - Timing differences in the recognition of costs between segment reporting and consolidated external reporting. |
| |
| • | Methodology - Methodology differences between segment reporting and consolidated external reporting are as follows: |
| |
| ◦ | Segment assets include off-balance sheet managed assets for which we maintain servicing responsibilities. |
| |
| ◦ | The impact of differences between the actual leverage and the segment leverage ratios. |
| |
| ◦ | Interest expense includes realized forward points on foreign currency forward contracts. |
| |
| ◦ | The net gain or loss from interest rate derivatives. |
| |
| ◦ | The profit attributable to noncontrolling interests is considered a component of segment profit. |
Supplemental segment data and reconciliations to consolidated external reporting for the years ended December 31 was as follows: |
| | | | | | | | | | | | | | | | | | | | | | | | | | | |
(Millions of dollars)
2017 | External Revenues | | Profit before income taxes | | Interest Expense | | Depreciation on equipment leased to others | | Provision for credit losses | | Assets at December 31, 2017 | | Capital expenditures |
| North America | $ | 1,337 |
| | $ | 353 |
| | $ | 306 |
| | $ | 520 |
| | $ | 36 |
| | $ | 14,790 |
| | $ | 992 |
|
| Europe | 307 |
| | 116 |
| | 37 |
| | 80 |
| | 4 |
| | 4,332 |
| | 103 |
|
| Asia/Pacific | 267 |
| | 99 |
| | 87 |
| | 25 |
| | (5 | ) | | 4,214 |
| | 6 |
|
| Latin America and CPF | 447 |
| | 47 |
| | 165 |
| | 41 |
| | 94 |
| | 6,153 |
| | 54 |
|
| Mining | 272 |
| | 49 |
| | 50 |
| | 142 |
| | 8 |
| | 2,399 |
| | 210 |
|
| Total Segments | 2,630 |
| | 664 |
| | 645 |
| | 808 |
| | 137 |
| | 31,888 |
| | 1,365 |
|
| Unallocated | 90 |
| | (220 | ) | | 193 |
| | — |
| | — |
| | 1,719 |
| | 8 |
|
| Timing | (31 | ) | | (6 | ) | | — |
| | 2 |
| | (5 | ) | | 53 |
| | — |
|
| Methodology | — |
| | 152 |
| | (171 | ) | | — |
| | — |
| | (256 | ) | | — |
|
Inter-segment Eliminations (1) | — |
| | — |
| | — |
| | — |
| | — |
| | (244 | ) | | — |
|
| Total | $ | 2,689 |
| | $ | 590 |
| | $ | 667 |
| | $ | 810 |
| | $ | 132 |
| | $ | 33,160 |
| | $ | 1,373 |
|
| | | | | | | | | | | | | | |
2016 | External Revenues | | Profit before income taxes | | Interest Expense | | Depreciation on equipment leased to others | | Provision for credit losses | | Assets at December 31, 2016 | | Capital expenditures |
| North America | $ | 1,230 |
| | $ | 326 |
| | $ | 287 |
| | $ | 477 |
| | $ | 28 |
| | $ | 14,925 |
| | $ | 1,174 |
|
| Europe | 268 |
| | 86 |
| | 33 |
| | 83 |
| | — |
| | 3,834 |
| | 147 |
|
| Asia/Pacific | 254 |
| | 82 |
| | 81 |
| | 29 |
| | 3 |
| | 3,620 |
| | 74 |
|
| Latin America and CPF | 487 |
| | 77 |
| | 156 |
| | 61 |
| | 100 |
| | 7,270 |
| | 26 |
|
| Mining | 308 |
| | 49 |
| | 47 |
| | 188 |
| | 7 |
| | 2,734 |
| | 206 |
|
| Total Segments | 2,547 |
| | 620 |
| | 604 |
| | 838 |
| | 138 |
| | 32,383 |
| | 1,627 |
|
| Unallocated | 80 |
| | (138 | ) | | 116 |
| | — |
| | — |
| | 1,688 |
| | 6 |
|
| Timing | (32 | ) | | (12 | ) | | — |
| | 3 |
| | (3 | ) | | 27 |
| | 3 |
|
| Methodology | — |
| | 91 |
| | (109 | ) | | — |
| | — |
| | (220 | ) | | — |
|
Inter-segment Eliminations (1) | — |
| | — |
| | — |
| | — |
| | — |
| | (263 | ) | | — |
|
| Total | $ | 2,595 |
| | $ | 561 |
| | $ | 611 |
| | $ | 841 |
| | $ | 135 |
| | $ | 33,615 |
| | $ | 1,636 |
|
| | | | | | | | | | | | | | |
2015 | External Revenues | | Profit before income taxes | | Interest Expense | | Depreciation on equipment leased to others | | Provision for credit losses | | Assets at December 31, 2015 | | Capital expenditures |
| North America | $ | 1,156 |
| | $ | 370 |
| | $ | 261 |
| | $ | 409 |
| | $ | 7 |
| | $ | 14,419 |
| | $ | 1,118 |
|
| Europe | 284 |
| | 96 |
| | 31 |
| | 76 |
| | 3 |
| | 3,758 |
| | 136 |
|
| Asia/Pacific | 285 |
| | 65 |
| | 100 |
| | 21 |
| | 29 |
| | 3,923 |
| | 37 |
|
| Latin America and CPF | 533 |
| | 108 |
| | 152 |
| | 104 |
| | 64 |
| | 7,376 |
| | 89 |
|
| Mining | 380 |
| | 52 |
| | 56 |
| | 226 |
| | 14 |
| | 2,947 |
| | 69 |
|
| Total Segments | 2,638 |
| | 691 |
| | 600 |
| | 836 |
| | 117 |
| | 32,423 |
| | 1,449 |
|
| Unallocated | 65 |
| | (101 | ) | | 67 |
| | — |
| | — |
| | 1,743 |
| | 9 |
|
| Timing | (30 | ) | | (32 | ) | | — |
| | — |
| | 2 |
| | 164 |
| | 3 |
|
| Methodology | — |
| | 61 |
| | (74 | ) | | — |
| | — |
| | (216 | ) | | — |
|
Inter-segment Eliminations (1) | — |
| | — |
| | — |
| | — |
| | — |
| | (247 | ) | | — |
|
| Total | $ | 2,673 |
| | $ | 619 |
| | $ | 593 |
| | $ | 836 |
| | $ | 119 |
| | $ | 33,867 |
| | $ | 1,461 |
|
| | | | | | | | | | | | | | |
Geographic information:
|
| | | | | | | | | | | | |
| (Millions of dollars) | | | | | | |
| | | 2017 | | 2016 | | 2015 |
| Revenues | | | | | | |
| Inside U.S. | | $ | 1,551 |
| | $ | 1,397 |
| | $ | 1,330 |
|
| Inside Canada | | 157 |
| | 171 |
| | 198 |
|
| Inside Australia | | 139 |
| | 176 |
| | 200 |
|
| All other | | 842 |
| | 851 |
| | 945 |
|
| Total | | $ | 2,689 |
| | $ | 2,595 |
| | $ | 2,673 |
|
| | | | | | | |
Equipment on Operating Leases and Non-Leased Equipment (included in Other Assets), Net | | 2017 | | 2016 | | |
| Inside U.S. | | $ | 2,554 |
| | $ | 2,401 |
| | |
| Inside Canada | | 413 |
| | 535 |
| | |
| Inside Australia | | 113 |
| | 250 |
| | |
| All other | | 550 |
| | 584 |
| | |
| Total | | $ | 3,630 |
| | $ | 3,770 |
| | |
| | | | | | | |
NOTE 17 – SELECTED QUARTERLY FINANCIAL DATA (UNAUDITED)
|
| | | | | | | | | | | | | | | | |
| (Millions of dollars) | | | | | | |
| 2017 | | First quarter | | Second quarter | | Third quarter | | Fourth quarter |
| Total revenues | | $ | 662 |
| | $ | 676 |
| | $ | 673 |
| | $ | 678 |
|
| Profit before income taxes | | $ | 167 |
| | $ | 164 |
| | $ | 126 |
| | $ | 133 |
|
| Profit | | $ | 115 |
| | $ | 114 |
| | $ | 86 |
| | $ | 271 |
|
| | | | | | | | | |
| 2016 | | First quarter | | Second quarter | | Third quarter | | Fourth quarter |
| Total revenues | | $ | 643 |
| | $ | 659 |
| | $ | 651 |
| | $ | 642 |
|
| Profit before income taxes | | $ | 145 |
| | $ | 148 |
| | $ | 146 |
| | $ | 122 |
|
| Profit | | $ | 100 |
| | $ | 102 |
| | $ | 97 |
| | $ | 85 |
|
| | | | | | | | | |