AS FILED WITH THE SECURITIES AND EXCHANGE COMMISSION ON MARCH 12, 2009
SECURITIES ACT FILE NO. 333- 156991
SECURITIES AND EXCHANGE COMMISSION
Washington, D.C. 20549
FORM N-14
REGISTRATION STATEMENT
UNDER
| | | | |
| | THE SECURITIES ACT OF 1933 | | x |
| | |
| | Pre-Effective Amendment No. 1 | | x |
| | Post-Effective Amendment No. | | ¨ |
DWS VARIABLE SERIES I
(Exact Name of Registrant as Specified in Charter)
345 Park Avenue
New York, NY 10154
(Address of Principal Executive Offices) (Zip Code)
617-295-1000
(Registrant’s Area Code and Telephone Number)
John Millette, Secretary
One Beacon Street
Boston, Massachusetts 02108
(Name and Address of Agent for Service)
With copies to:
Thomas Hiller, Esq.
Ropes & Gray
One International Place
Boston, MA 02110
Approximate date of proposed public offering: As soon as practicable after the effective date of this Registration Statement.
TITLE OF SECURITIES BEING REGISTERED: Shares of Beneficial Interest (no par value) of the Registrant.
No filing fee is required because an indefinite number of shares have previously been registered pursuant to Rule 24f-2 under the Investment Company Act of 1940.
The Registrant hereby amends this Registration Statement on such date or dates as may be necessary to delay its effective date until the Registrant shall file a further amendment that specifically states that this Registration Statement shall thereafter become effective in accordance with Section 8(a) of the Securities Act of 1933 or until the Registration Statement shall become effective on such date as the Commission, acting pursuant to said Section 8(a), may determine.
Questions & Answers
DWS Janus Growth & Income VIP
DWS Variable Series II
Q&A
Q What is happening?
A DWS Investments is proposing to merge DWS Janus Growth & Income VIP into DWS Capital Growth VIP.
Q What issue am I being asked to vote on?
A You are being asked to vote on a proposal to merge DWS Janus Growth & Income VIP into DWS Capital Growth VIP.
After carefully reviewing the proposal, the Board of DWS Variable Series II, of which DWS Janus Growth & Income VIP is a series, has determined that this action is in the best interests of the fund. The Board unanimously recommends that you vote for this proposal.
Q I am the owner of a variable life insurance policy or variable annuity contract offered by my insurance company. I am not a shareholder of the fund. Why am I being asked to vote on a proposal for DWS Janus Growth & Income VIP shareholders?
A You have previously directed your insurance company to invest certain proceeds relating to your variable life insurance policy and/or variable annuity contract (each a “Contract”) in DWS Janus Growth & Income VIP. Although you receive the gains, losses and income from this investment, your insurance company holds on your behalf any shares corresponding to your investment in the fund. Thus, you are not the “shareholder” of DWS Janus Growth & Income VIP; rather, your insurance company is

Q&A continued
the shareholder. However, you have the right to instruct your insurance company on how to vote the fund shares corresponding to your investment.
The attached proxy statement is, therefore, used to solicit voting instructions from you and other owners of Contracts. All persons entitled to direct the voting shares of the fund, whether or not they are shareholders, are described as voting for purposes of the proxy statement.
Q Why has this proposal been made for the fund?
A DWS Investments believes that the proposed merger is in the best interests of DWS Janus Growth & Income VIP for several reasons. DWS Investments believes that the merger will result in lower management fees and lower operational expenses through economies of scale. In addition, DWS Investments believes that the merger will benefit Contract Owners (as defined on page 1 of the enclosed Prospectus/Proxy Statement) by transitioning their investment into DWS Capital Growth VIP, a fund with more favorable performance over recent years and that is open to broader distribution, both of which may subsequently lead to additional sales and additional economies of scale. Finally, the proposed merger is consistent with ongoing efforts by DWS Investments to consolidate overlapping fund products. Accordingly, DWS Investments proposed the merger of DWS Janus Growth & Income VIP into DWS Capital Growth VIP.
While DWS Investments believes that DWS Capital Growth VIP should provide a comparable investment opportunity for shareholders of DWS Janus Growth & Income VIP, there are a number of differences in the portfolios of the funds. If the merger is approved by shareholders of DWS Janus Growth & Income VIP, DWS Investments expects that all of DWS Janus Growth & Income VIP’s holdings will be liquidated after shareholder approval and prior to the merger. Proceeds from the liquidation will be used to acquire securities consistent with DWS Capital Growth VIP’s current implementation of its investment objective, policies, restrictions and strategies. The repositioning of DWS Janus Growth & Income VIP’s portfolio prior to the merger will involve transaction costs which will be borne by DWS Janus Growth & Income VIP subject to an expense cap agreed to by Deutsche Investment Management Americas Inc.
Q&A continued
(“DIMA”), DWS Janus Growth & Income VIP’s investment adviser. Pursuant to the expense cap, DIMA will pay any one-time merger costs, including the transaction costs associated with repositioning DWS Janus Growth & Income VIP’s portfolio, to the extent those costs exceed the estimated total one-year benefit expected to be realized by DWS Janus Growth & Income VIP through the proposed merger. See page 23 of the enclosed Prospectus/Proxy Statement for more information regarding the costs of the merger and DIMA’s agreement to cap expenses.
Contract Owners may continue to instruct their insurance company on how to invest proceeds relating to their Contract, including effecting sales into or out of DWS Janus Growth & Income VIP. Contract Owners should contact their insurance company for further information regarding their investment.
Q Will I have to pay taxes as a result of the merger?
A The merger is expected to be a tax-free reorganization for federal income tax purposes and will not take place unless special tax counsel provides an opinion to that effect. Before or after the merger, you may instruct your insurance company to direct proceeds relating to your Contract out of DWS Janus Growth & Income VIP and into other investments (such direction, a “Transfer”). A Contract Owner will not be subject to tax at the time of a Transfer. However, a Contract Owner’s insurance company may charge a fee for Transfers. If you choose to redeem or exchange your investment by surrendering your Contract or initiating a partial withdrawal before or after the merger, you may be subject to taxes and tax penalties; therefore, you may wish to consult a tax advisor before doing so.
Q Upon the merger, how will the value of my investment change?
A The aggregate value of your investment will not change as a result of the merger. However, the number of shares owned by your insurance company on your behalf will likely change as a result of the merger because your insurance company’s shares will be exchanged at the net asset value per share of DWS Janus Growth & Income VIP, which will probably be different from the net asset value per share of DWS Capital Growth VIP.
Q&A continued
Q When would the merger take place?
A If approved, the merger would occur on or about April 27, 2009, or as soon as reasonably practicable after shareholder approval is obtained. Shortly after completion of the merger, shareholders whose accounts are affected by the merger (i.e., your insurance company) will receive a confirmation statement reflecting their new account number and the number of shares of DWS Capital Growth VIP they are receiving. Subsequently, you will be notified of changes to your account information by your insurance company.
Q How can I vote?
A You can vote in any one of three ways:
| n | | Through the Internet, by going to the website listed on your voting instruction form; |
| n | | By telephone, with a toll-free call to the number listed on your voting instruction form; or |
| n | | By mail, by sending the enclosed voting instruction form, signed and dated, to us in the enclosed envelope. |
We encourage you to vote over the Internet or by telephone, following the instructions that appear on your voting instruction form. Whichever method you choose, please take the time to read the full text of the Prospectus/Proxy Statement before you vote.
Q Whom should I call for additional information about this Prospectus/Proxy Statement?
A Please call Computershare Fund Services, Inc., your fund’s information agent, at 1-866-963-6127, or your insurance company.
DWS JANUS GROWTH & INCOME VIP
A Message from the President of DWS Variable Series II
, 2009
Dear Investor:
I am writing to ask you to instruct your insurance company as to how to vote on an important matter that affects your investment in DWS Janus Growth & Income VIP (“Janus Growth & Income”). You may provide your instructions by filling out and signing the enclosed voting instruction form, or by recording your instructions by telephone or through the Internet.
We are asking for your voting instructions on the following matter:
| | |
| Proposal: | | Approving an Agreement and Plan of Reorganization and the transactions it contemplates, including the transfer of all of the assets of Janus Growth & Income to DWS Capital Growth VIP (“Capital Growth”), in exchange for shares of Capital Growth and the assumption by Capital Growth of all the liabilities of Janus Growth & Income, and the distribution of such shares, on a tax-free basis for federal income tax purposes, to the shareholders of Janus Growth & Income in complete liquidation and termination of Janus Growth & Income. |
DWS Investments has proposed the merger of Janus Growth & Income into Capital Growth because it believes the proposed merger is in the best interests of Janus Growth & Income for several reasons. DWS Investments believes that the merger will result in lower management fees and lower operational expenses through economies of scale. In addition, DWS Investments believes that the merger will benefit contract owners by transitioning their investment into DWS Capital Growth VIP, a fund with more favorable performance over recent years and that is open to broader distribution, both of which may subsequently lead to additional sales and additional economies of scale. Finally, the proposed merger is consistent with ongoing efforts by DWS Investments to consolidate overlapping fund products. The Board of Trustees of DWS Variable Series II has unanimously approved the proposed merger.
In determining to approve the merger, the Board conducted a thorough review of the potential implications of the merger, and concluded that Janus Growth & Income’s participation in the proposed merger would be in the best interests of Janus Growth & Income and would not dilute the interests of existing shareholders. A discussion of the factors the Board considered is included in the attached Prospectus/Proxy Statement. If the merger is approved, the Board expects that the proposed changes will take effect during the second calendar quarter of 2009.
Included in this booklet is information about the upcoming shareholders’ meeting:
| | • | | A Notice of a Special Meeting of Shareholders, which summarizes the issue for which you are being asked to provide voting instructions; and |
| | • | | A Prospectus/Proxy Statement, which provides detailed information on Capital Growth, the specific proposal that will be considered at the shareholders’ meeting, and why the proposal is being made. |
We need your voting instructions and urge you to review the enclosed materials thoroughly. Once you’ve determined how you would like your interests to be represented, please promptly complete, sign, date and return the enclosed voting instruction form, or record your voting instructions by telephone or on the Internet. A postage-paid envelope is enclosed for mailing, and telephone and Internet voting instructions are listed at the top of your voting instruction form. You may receive more than one voting instruction form. If so, please vote each one.
I’m sure that you, like most people, lead a busy life and are tempted to put this Prospectus/Proxy Statement aside for another day. Please don’t. Your prompt return of the enclosed voting instruction form (or your voting by telephone or through the Internet) may save the necessity and expense of further solicitations.
Your vote is important to us. We appreciate the time and consideration I am sure you will give to this important matter. If you have questions about the proposal, please call Computershare Fund Services, Inc., DWS Janus Growth & Income VIP’s information agent, at 1-866-963-6127 or contact your insurance company. Thank you for your continued support of DWS Investments.
Sincerely yours,

Michael Clark
President
DWS Variable Series II
DWS JANUS GROWTH & INCOME VIP
NOTICE OF A SPECIAL MEETING OF SHAREHOLDERS
This is the formal agenda for your Fund’s special meeting of shareholders. It tells you what matter will be voted on and the time and place of the meeting.
To the Shareholders of DWS Janus Growth & Income VIP (“Janus Growth & Income”):
A Special Meeting of Shareholders of Janus Growth & Income will be held April 13, 2009 at 2:15 p.m. Eastern time, at the offices of Deutsche Investment Management Americas Inc., 345 Park Avenue, 27th Floor, New York, New York 10154 (the “Meeting”), to consider the following (the “Proposal”):
| | |
| Proposal: | | Approving an Agreement and Plan of Reorganization and the transactions it contemplates, including the transfer of all of the assets of Janus Growth & Income to DWS Capital Growth VIP (“Capital Growth”), in exchange for shares of Capital Growth and the assumption by Capital Growth of all the liabilities of Janus Growth & Income, and the distribution of such shares, on a tax-free basis for federal income tax purposes, to the shareholders of Janus Growth & Income in complete liquidation and termination of Janus Growth & Income. |
The persons named as proxies will vote in their discretion on any other business that may properly come before the Meeting or any adjournments or postponements thereof.
Holders of record of shares of Janus Growth & Income at the close of business on February 10, 2009 are entitled to vote at the Meeting and at any adjournments or postponements thereof.
The chairman of the Meeting may adjourn the Meeting without further notice with respect to the proposal to a designated time and place, whether or not a quorum is present with respect to the proposal. Upon motion of the chairman of the Meeting, the question of adjournment may be submitted to a vote of the shareholders, and in that case, any adjournment must be approved by the vote of holders of a majority of the shares present and entitled to vote with respect to the proposal and without further notice. The Board may postpone the Meeting with notice to shareholders entitled to vote at the Meeting.
By order of the Board of Trustees

John Millette
Secretary
, 2009
WE URGE YOU TO MARK, SIGN, DATE AND MAIL THE ENCLOSED PROXY IN THE POSTAGE-PAID ENVELOPE PROVIDED OR RECORD YOUR VOTING INSTRUCTIONS BY TELEPHONE OR THROUGH THE INTERNET SO THAT YOU WILL BE REPRESENTED AT THE MEETING.
IF YOU SIMPLY SIGN THE VOTING INSTRUCTION FORM, IT WILL BE VOTED IN ACCORDANCE WITH THE BOARD’S RECOMMENDATION ON THE PROPOSAL. YOUR PROMPT RETURN OF THE ENCLOSED VOTING INSTRUCTION FORM (OR YOUR VOTING BY TELEPHONE OR VIA THE INTERNET) MAY SAVE THE NECESSITY AND EXPENSE OF FURTHER SOLICITATIONS.
INSTRUCTIONS FOR SIGNING VOTING INSTRUCTION FORMS
The following general rules for signing voting instruction forms may be of assistance to you and avoid the time and expense involved in validating your vote if you fail to sign your voting instruction form properly.
1. Individual Accounts: Sign your name exactly as it appears in the registration on the voting instruction form.
2. Joint Accounts: Either party may sign, but the name of the party signing should conform exactly to the name shown in the registration on the voting instruction form.
3. All Other Accounts: The capacity of the individual signing the voting instruction form should be indicated unless it is reflected in the form of registration. For example:
| | |
Registration | | Valid Signature |
Corporate Accounts: | | |
(1) ABC Corp. | | ABC Corp.
John Doe, Treasurer |
(2) ABC Corp. | | John Doe, Treasurer |
(3) ABC Corp. c/o John Doe, Treasurer | | John Doe |
(4) ABC Corp. Profit Sharing Plan | | John Doe, Trustee |
| |
Partnership Accounts | | |
(1) The XYZ Partnership | | Jane B. Smith, Partner |
(2) Smith and Jones, Limited Partnership | | Jane B. Smith, General Partner |
| |
Trust Accounts | | |
(1) ABC Trust Account | | Jane B. Doe, Trustee |
(2) Jane B. Doe, Trustee u/t/d 12/28/78 | | Jane B. Doe |
| |
Custodial or Estate Accounts | | |
(1) John B. Smith, Cust. f/b/o John B. Smith Jr.
UGMA/UTMA | | John B. Smith |
(2) Estate of John B. Smith | | John B. Smith, Jr., Executor |
IMPORTANT INFORMATION FOR OWNERS OF VARIABLE ANNUITY OR LIFE INSURANCE CONTRACTS INVESTED IN DWS JANUS GROWTH & INCOME VIP
This document contains a Prospectus/Proxy Statement and a voting instruction form. A voting instruction form is, in essence, a ballot. You can use your voting instruction form to tell your insurance company how to vote on your behalf on an important issue relating to your investment in DWS Janus Growth & Income VIP. If you complete and sign the voting instruction form (or tell your insurance company by telephone or through the Internet how you want it to vote), your insurance company will vote the shares corresponding to your insurance contract exactly as you indicate. If you simply sign the voting instruction form, your insurance company will vote the shares corresponding to your contract in accordance with the Board’s recommendation on page 22. If you do not return your voting instruction form or record your voting instructions by telephone or through the Internet, your insurance company will vote your shares in the same proportion as shares for which instructions have been received. As a result, a small number of Contract Owners may determine the outcome of the vote.
We urge you to review the Prospectus/Proxy Statement carefully, and either fill out your voting instruction form and return it by mail, or record your voting instructions by telephone or through the Internet. Your prompt return of the enclosed voting instruction form (or your providing voting instructions by telephone or through the Internet) may save the necessity and expense of further solicitations.
We want to know how you would like your interests to be represented and welcome your comments. Please take a few minutes to read these materials and return your voting instruction form. If you have any questions, please call Computershare Fund Services, Inc., DWS Janus Growth & Income VIP’s information agent, at the special toll-free number we have set up for you 1-866-963-6127 or contact your insurance company.
PROSPECTUS/PROXY STATEMENT
, 2009
| | |
Acquisition of the assets of: | | By and in exchange for shares of: |
| |
DWS Janus Growth & Income VIP, a series of DWS Variable Series II | | DWS Capital Growth VIP, a series of DWS Variable Series I |
345 Park Avenue New York, NY 10154 800-778-1482 | | 345 Park Avenue New York, NY 10154 800-778-1482 |
This Prospectus/Proxy Statement is being furnished in connection with the proposed merger of DWS Janus Growth & Income VIP (“Janus Growth & Income”) into DWS Capital Growth VIP (“Capital Growth”). Janus Growth & Income and Capital Growth are referred to herein collectively as the “Funds,” and each is referred to herein individually as a “Fund.” As a result of the proposed merger, each shareholder of Janus Growth & Income will receive a number of full and fractional shares of the corresponding class of Capital Growth equal in aggregate value as of the Valuation Time (as defined below on page 22) to the aggregate value of such shareholder’s Janus Growth & Income shares.
Shares of Janus Growth & Income are available exclusively as a funding vehicle for variable life insurance policies and variable annuity contracts (each a “Contract”) offered by the separate accounts, or sub-accounts thereof, of certain life insurance companies (“Participating Insurance Companies”). The Participating Insurance Companies own shares of Janus Growth & Income as depositors for the owners of their respective Contracts (each a “Contract Owner”). Thus, individual Contract Owners are not the “shareholders” of Janus Growth & Income. Rather, the Participating Insurance Companies and their separate accounts are the shareholders. To the extent required to be consistent with the interpretations of voting requirements by the staff of the Securities and Exchange Commission (“SEC”), each Participating Insurance Company will offer to Contract Owners the opportunity to instruct it as to how it should vote shares held by it and the separate accounts on the proposed merger. This Prospectus/Proxy Statement is, therefore, furnished to Contract Owners entitled to give voting instructions with regard to Janus Growth & Income. All persons entitled to direct the voting of shares of Janus Growth & Income, whether or not they are shareholders, are described as voting for purposes of this Prospectus/Proxy Statement.
This Prospectus/Proxy Statement is being mailed on or about , 2009. It explains concisely what you should know before voting on the matter described herein or investing in Capital Growth, a series of DWS Variable Series I, an open-end management investment company. Please read it carefully and keep it for future reference.
The securities offered by this Prospectus/Proxy Statement have not been approved or disapproved by the Securities and Exchange Commission (the “SEC”), nor has the SEC passed upon the accuracy or adequacy of this Prospectus/Proxy Statement. Any representation to the contrary is a criminal offense.
1
The following documents have been filed with the SEC and are incorporated into this Prospectus/Proxy Statement by reference:
| | (i) | | the prospectus of Capital Growth dated May 1, 2008, as supplemented from time to time, for Class A shares, a copy of which is included with this Prospectus/Proxy Statement (File No. 002-96461); |
| | (ii) | | the prospectus of Janus Growth & Income dated May 1, 2008, as supplemented from time to time, for Class A shares (File No. 033-11802); |
| | (iii) | | the statement of additional information of Janus Growth & Income dated May 1, 2008, as supplemented from time to time (File No. 033-11802); |
| | (iv) | | the statement of additional information relating to the proposed merger, dated �� 2009 (the “Merger SAI”) (File No. 333-156991); and |
| | (v) | | the audited financial statements and related independent registered public accounting firm’s report for Janus Growth & Income contained in the Annual Report for the fiscal year ended December 31, 2008. |
No other parts of Janus Growth & Income’s Annual Report are incorporated by reference herein.
The financial highlights for Capital Growth contained in the Annual Report to shareholders for the period ended December 31, 2008, are attached to this Prospectus/Proxy Statement as Exhibit B.
You may receive free copies of the Funds’ Annual Reports, Semi-annual Reports, prospectuses, statements of additional information (the “SAIs”) and/or the Merger SAI, request other information about a Fund, or make shareholder inquiries, by contacting your insurance company or by calling the corresponding Fund at 1-800-778-1482.
Like shares of Janus Growth & Income, shares of Capital Growth are not deposits or obligations of, or guaranteed or endorsed by, any financial institution, are not insured by the Federal Deposit Insurance Corporation, the Federal Reserve Board or any other agency, and involve risk, including the possible loss of the principal amount invested.
This document is designed to give you the information you need to vote on the proposal. Much of the information is required disclosure under rules of the SEC; some of it is technical. If there is anything you don’t understand, please contact Computershare Fund Services, Inc., Janus Growth & Income’s information agent, at 1-866-963-6127, or contact your insurance company.
Each Fund is subject to the informational requirements of the Securities Exchange Act of 1934, as amended, and in accordance therewith files reports and other information with the SEC. You may review and copy information about the Funds, including the SAIs, at the SEC’s public reference room at 100 F Street, N.E., Washington, D.C. You may call the SEC at 1-202-551-5850 for information about the operation of the public reference room. You may obtain copies of this information, with payment of a duplication fee, by electronic request at the following e-mail address: publicinfo@sec.gov, or by writing the Public Reference Branch, Office of Consumer
2
Affairs and Information Services, Securities and Exchange Commission, Washington, D.C. 20549. You may also access reports and other information about the Funds on the EDGAR database on the SEC’s Internet site at http://www.sec.gov.
I. SYNOPSIS
The responses to the questions that follow provide an overview of key points typically of concern to shareholders considering a proposed merger between mutual funds. These responses are qualified in their entirety by the remainder of this Prospectus/Proxy Statement, which you should read carefully because it contains additional information and further details regarding the proposed merger.
| 1. | | What is being proposed? |
The Board of DWS Variable Series II (the “Trust”), of which Janus Growth & Income is a series, is recommending that shareholders approve the transactions contemplated by the Agreement and Plan of Reorganization (as described below in Part IV and the form of which is attached hereto as Exhibit A), which are referred to herein as a merger of Janus Growth & Income into Capital Growth. If approved by shareholders, all of the assets of Janus Growth & Income will be transferred to Capital Growth solely in exchange for the issuance and delivery to Janus Growth & Income of Class A shares of Capital Growth (“Merger Shares”) with an aggregate value equal to the value of Janus Growth & Income’s assets net of liabilities and for the assumption by Capital Growth of all the liabilities of Janus Growth & Income. All Merger Shares delivered to Janus Growth & Income will be delivered at net asset value without a sales load, commission or other similar fee being imposed. Immediately following the transfer, the Merger Shares received by Janus Growth & Income will be distributed pro rata, on a tax-free basis for federal income tax purposes, to its shareholders of record.
| 2. | | What will happen to an investment in Janus Growth & Income as a result of the merger? |
An investment in Janus Growth & Income will, in effect, be exchanged on a federal income tax-free basis for an investment in the same class of Capital Growth with an equal aggregate net asset value as of the Valuation Time (as defined below on page 22).
| 3. | | Why has the Board of the Trust recommended that shareholders approve the merger? |
DWS Investments advised the Board that it believes the proposed merger is in the best interests of Janus Growth & Income for several reasons. DWS Investments believes that the merger will result in lower management fees and lower operational expenses through economies of scale. In addition, DWS Investments believes that the merger will benefit contract owners by transitioning their investment into Capital Growth, a fund with more favorable performance over recent years and that is open to broader distribution, both of which may subsequently lead to additional sales and additional economies of scale. In addition, the proposed merger is consistent with ongoing efforts by DWS Investments to consolidate overlapping fund products. In determining to
3
recommend that shareholders of Janus Growth & Income approve the merger, the Board considered, among others, the following factors:
| | • | | The compatibility of Janus Growth & Income’s and Capital Growth’s investment strategies. |
| | • | | The effective advisory fees paid by the combined fund will be lower at all asset levels as compared to the advisory fees currently paid by Janus Growth & Income. |
| | • | | The estimated total operating expense ratio of the relevant class of the combined fund is expected to be lower than the current operating expense ratio of Janus Growth & Income. |
The Board has concluded that: (1) the merger is in the best interests of Janus Growth & Income and (2) the interests of the existing shareholders of Janus Growth & Income will not be diluted as a result of the merger. Accordingly, the Board unanimously recommends that shareholders approve the Agreement (as defined on page 20) effecting the merger. For a complete discussion of the Board’s considerations please see “Information About the Proposed Merger—Background and Board’s Considerations Relating to the Proposed Merger” below.
| 4. | | What are the investment goals, policies and restrictions of the Funds? |
While not identical, the two Funds have similar investment objectives and techniques. Janus Growth & Income seeks long-term capital growth and current income. In contrast, Capital Growth seeks to provide long-term growth of capital.
Janus Growth & Income normally emphasizes investments in equity securities, which may include initial public offerings, and shifts assets between the growth and income components of its holdings based on portfolio management’s analysis of relevant market, financial and economic conditions. Janus Growth & Income may invest up to 75% of its total assets in equity securities selected primarily for their growth potential and at least 25% of its total assets in securities portfolio management believes have income potential. The Fund may invest substantially all of its assets in equity securities if portfolio management believes that equity securities have the potential to appreciate in value. The growth component of the Fund is expected to consist primarily of common stocks, but may also include warrants, preferred stocks or convertible securities selected primarily for their growth potential. The income component of the Fund will consist of securities that portfolio management believes have income potential. Such securities may include equity securities, convertible securities and all types of debt securities, including indexed/structured securities such as equity-linked structured notes.
Capital Growth normally invests at least 65% of total assets in equities, mainly common stocks of U.S. companies, and although the Fund can invest in companies of any size, it intends to invest primarily in companies whose market capitalizations are similar in size to those of the companies in the Standard & Poor’s 500 Composite Stock Price Index (the “S&P 500 Index”) or the Russell 1000 Growth Index (as of December 31, 2008, the S&P 500 Index and the Russell 1000 Growth Index had median market capitalizations of $6.4 billion and $3.3 billion, respectively). Although the portfolio may invest in companies of any size, it intends to invest primarily in
4
companies whose market capitalizations fall within the normal range of these indices. Capital Growth may also invest in other types of equity securities, such as preferred stocks or convertible securities.
In the case of Janus Growth & Income, portfolio management generally seeks to identify equity securities of companies with earnings growth potential that may not be recognized by the market at large. Portfolio management makes this assessment by looking at companies one at a time, regardless of size, country or organization, place of principal business activity, or other similar selection criteria. Similarly, in the case of Capital Growth, in choosing stocks, portfolio management begin by utilizing a proprietary quantitative model to rank stocks based on a number of factors including valuation and profitability. The portfolio managers also apply fundamental techniques to identify companies that display above-average earnings growth compared to other companies that have strong product lines, effective management and leadership positions within core markets. The factors considered and models used by Capital Growth’s portfolio managers may change over time. Portfolio management will normally sell a stock when they believe its potential risks have increased, its price is unlikely to go higher, its fundamental factors have changed, other investments offer better opportunities or in the course of adjusting the portfolio’s emphasis on a given industry.
Janus Growth & Income may invest without limit in foreign securities either indirectly (e.g., depositary receipts) or directly in foreign markets. Foreign securities are generally selected on a stock-by-stock basis without regard to any defined allocation among countries or geographic regions. However, certain factors such as expected levels of inflation, government policies influencing business conditions, currency exchange rates, and prospects for economic growth among countries or geographic regions may warrant greater consideration in selecting foreign securities.
Janus Growth & Income may also invest in debt securities, high-yield/high-risk bonds and securities purchased on a when-issued, delayed delivery or forward commitment basis. Compared to investment-grade bonds, high yield bonds may pay higher yields and have higher volatility and risk of default. Although it is not a principal investment strategy for the Fund, Janus Growth & Income is permitted, but not required, to use various types of derivatives (contracts whose value is based on, for example, indices, currencies or securities). Derivatives may be used for hedging and for risk management or for non-hedging purposes to seek to enhance potential gain. The Fund may use derivatives in circumstances where portfolio management believes they offer an economical means of gaining exposure to a particular asset class or to keep cash on hand to meet shareholder redemptions or other needs while maintaining exposure to the market. As a temporary defensive measure, the Fund could shift up to 100% of assets into investments such as money market securities. This measure could prevent losses, but, while engaged in a temporary defensive position, the Fund will not be pursuing its investment objective. However, the portfolio managers may choose not to use these strategies for various reasons, even in very volatile market conditions. In addition, the Fund may lend its investment securities in an amount up to 33 1/3% of its total assets to approved institutional borrowers.
Although it is not a principal investment strategy for the Fund, Capital Growth is permitted, but not required, to use various types of derivatives (contracts whose value is based on, for example, indices, currencies or securities). Derivatives may be used for hedging and for risk management or for non-hedging purposes to seek to enhance
5
potential gain. Capital Growth may use derivatives in circumstances where portfolio management believes they offer an economical means of gaining exposure to a particular asset class or to keep cash on hand to meet shareholder redemptions or other needs while maintaining exposure to the market. In addition, the Fund may lend its investment securities in an amount up to 33 1/3% of its total assets to approved institutional borrowers. Please also see Part II—Investment Strategies and Risk Factors—below for a more detailed comparison of the Fund’s investment policies and restrictions.
While DWS Investments believes that DWS Capital Growth VIP should provide a comparable investment opportunity for shareholders of DWS Janus Growth & Income VIP, there are a number of differences in the portfolios of the funds. If the merger is approved by shareholders of DWS Janus Growth & Income VIP, DWS Investments expects that all of DWS Janus Growth & Income VIP’s holdings will be liquidated after shareholder approval and prior to the merger. Proceeds from the liquidation will be used to acquire securities consistent with DWS Capital Growth VIP’s current implementation of its investment objective, policies, restrictions and strategies. The repositioning of DWS Janus Growth & Income VIP’s portfolio prior to the merger will involve transaction costs which will be borne by DWS Janus Growth & Income VIP subject to an expense cap agreed to by Deutsche Investment Management Americas Inc. (“DIMA” or “Advisor”), DWS Janus Growth & Income VIP’s investment adviser. Pursuant to the expense cap, DIMA will pay any one-time merger costs, including the transaction costs associated with repositioning DWS Janus Growth & Income VIP’s portfolio, to the extent those costs exceed the estimated total one-year benefit expected to be realized by DWS Janus Growth & Income VIP through the proposed merger. See page 23 of the enclosed Prospectus/Proxy Statement for more information regarding the costs of the merger and DIMA’s agreement to cap expenses.
The following table sets forth a summary of the composition of each Fund’s investment portfolio as of December 31, 2008, and DWS Investments’ estimation of the portfolio composition of Capital Growth assuming consummation of the proposed merger.
Portfolio Composition
(as a % of Fund)
| | | | | | | | | |
| | | Janus Growth &
Income | | | Capital Growth | | | Capital
Growth—Estimated
(assuming
consummation of
merger)(1) | |
Consumer Discretionary | | 10 | % | | 8 | % | | 8 | % |
Consumer Staples | | 22 | % | | 15 | % | | 15 | % |
Energy | | 13 | % | | 10 | % | | 10 | % |
Financials | | 5 | % | | 3 | % | | 3 | % |
Health Care | | 17 | % | | 22 | % | | 22 | % |
Industrials | | 5 | % | | 10 | % | | 10 | % |
Information Technology | | 24 | % | | 22 | % | | 22 | % |
Materials | | 4 | % | | 8 | % | | 8 | % |
Telecommunications Services | | — | | | 1 | % | | 1 | % |
Utilities | | — | | | 1 | % | | 1 | % |
| | | | | | | | | |
Total | | 100 | % | | 100 | % | | 100 | % |
6
(1) | | Reflects DWS Investments’ estimation of the portfolio composition of Capital Growth subsequent to the merger, taking into account its expectation that after shareholder approval and prior to the merger, all of the portfolio holdings of Janus Growth & Income will be liquidated and proceeds will be used to acquire other securities consistent with the current implementation of investment objective, policies, restrictions and strategies of Capital Growth. There can be no assurance as to actual portfolio composition of Capital Growth subsequent to the merger. |
| 5. | | How do the management fees and expense ratios of the two Funds compare, and what are they estimated to be following the merger? |
The following tables summarize the expenses that each of the Funds incurred during its most recent fiscal year and the pro forma estimated expense ratios of Capital Growth assuming consummation of the merger as of that date.
As shown below, the merger is expected to result in a lower total expense ratio for shareholders of Janus Growth & Income. However, there can be no assurance that the merger will result in expense savings. The information below does not reflect charges and fees associated with separate accounts that invest in the Funds and any Contract for which the Funds are investment options. These charges and fees will increase expenses.
Annual Fund Operating Expenses(1)
(expenses that are deducted from Fund assets)
| | | | | | | | | | | | | | | | | | |
| | | Management
Fees | | | Distribution/
Service
(12b-1) Fee | | | Other
Expenses | | | Total
Annual
Fund
Operating
Expenses | | | Less
Expense
Waiver/
Reimburse-
ments | | | Net
Annual
Fund
Operating
Expenses | |
Janus Growth & Income | | | | | | | | | | | | | | | | | | |
Class A | | 0.66 | % | | 0.00 | % | | 0.20 | %(2) | | 0.86 | % | | — | | | 0.86 | %(3) |
Capital Growth | | | | | | | | | | | | | | | | | | |
Class A | | 0.37 | % | | 0.00 | % | | 0.13 | %(2) | | 0.50 | % | | (0.01 | )%(4) | | 0.49 | % |
Capital Growth | | | | | | | | | | | | | | | | | | |
(Pro forma combined)(5) | | | | | | | | | | | | | | | | | | |
Class A | | 0.37 | % | | 0.00 | % | | 0.14 | %(2)(6) | | 0.51 | % | | (0.02 | )%(4) | | 0.49 | % |
(1) | | The Annual Fund Operating Expenses table is presented as of each Fund’s fiscal year end (December 31, 2008 for both Funds). The pro forma combined figures assume the consummation of the merger on December 31, 2008 and reflect average net asset levels for both Funds for the 12-month period ended December 31, 2008. It is important for you to understand that a decline in the Fund’s average net assets during the current fiscal year due to recent unprecedented market volatility or other factors could cause the Funds’ expense ratios for the current fiscal year to be higher than the expense information presented. |
(2) | | Includes 0.10% paid to DIMA, the investment manager for the Funds, for administrative and accounting services pursuant to an Administrative Services Agreement. |
7
(3) | | Through September 30, 2009, DIMA has contractually agreed to waive all or a portion of its management fee and reimburse or pay certain operating expenses of the Fund to the extent necessary to maintain the Fund’s total operating expenses at 0.86% for Class A shares, excluding certain expenses such as extraordinary expenses, taxes, brokerage and interest expenses. |
(4) | | Through April 30, 2010, DIMA has contractually agreed to waive all or a portion of its management fee and reimburse or pay certain operating expenses of the Fund to the extent necessary to maintain the Fund’s total operating expenses at 0.49% for Class A shares, excluding certain expenses such as extraordinary expenses, taxes, brokerage and interest expenses. |
(5) | | Pro forma expenses do not include the expenses expected to be borne by Janus Growth & Income in connection with the merger. See page 23 for additional information on these fees. |
(6) | | Other expenses are estimated, accounting for the effect of the merger. |
Examples
These examples translate the expenses shown in the preceding table (including one year of capped expenses in each period) into dollar amounts. By doing this, you can more easily compare the costs of investing in the Funds. The examples make certain assumptions. They assume that you invest $10,000 in a Fund for the time periods shown and reinvest all dividends and distributions. They also assume a 5% return on your investment each year and that a Fund’s operating expenses remain the same. The examples are hypothetical; your actual costs and returns may be higher or lower.
| | | | | | | | | | | | |
| | | 1 Year | | 3 Years | | 5 Years | | 10 Years |
Janus Growth & Income | | | | | | | | | | | | |
Assuming you sold your shares at the end of each period. | | | | | | | | | |
Class A | | $ | 88 | | $ | 274 | | $ | 477 | | $ | 1,061 |
Assuming you kept your shares. | | | | | | | | | | | | |
Class A | | $ | 88 | | $ | 274 | | $ | 477 | | $ | 1,061 |
Capital Growth | | | | | | | | | | | | |
Assuming you sold your shares at the end of each period. | | | | | | | | | |
Class A | | $ | 50 | | $ | 159 | | $ | 279 | | $ | 627 |
Assuming you kept your shares. | | | | | | | | | | | | |
Class A | | $ | 50 | | $ | 159 | | $ | 279 | | $ | 627 |
Capital Growth (Pro forma combined) | | | | | | | | | | | | |
Assuming you sold your shares at the end of each period. | | | | | | | | | |
Class A | | $ | 50 | | $ | 162 | | $ | 283 | | $ | 639 |
Assuming you kept your shares. | | | | | | | | | | | | |
Class A | | $ | 50 | | $ | 162 | | $ | 283 | | $ | 639 |
8
The tables below set forth the annual management fee schedules of the Funds, expressed as a percentage of net assets. As of December 31, 2008, Capital Growth and Janus Growth & Income had net assets of $604.4 million and $72.8 million, respectively.
The fee schedule for each Fund is as follows:
| | | | | | | | | | |
Capital Growth (Pre- and Post Merger) | | | | | Janus Growth & Income | |
First $250 million | | 0.390 | % | | | | First $250 million | | 0.665 | % |
Next $750 million | | 0.365 | % | | | | Next $750 million | | 0.640 | % |
Thereafter | | 0.340 | % | | | | Next $1.5 billion | | 0.615 | % |
| | | | | | | Thereafter | | 0.590 | % |
| 6. | | What are the federal income tax consequences of the proposed merger? |
For federal income tax purposes, no gain or loss is expected to be recognized by Janus Growth & Income or its shareholders as a direct result of the merger. As long as these Contracts qualify as annuity contracts or life insurance under Section 72 of the Internal Revenue Code of 1986, as amended (the “Code”), the merger, whether or not treated as a tax-free reorganization, will not create any tax liability for Contract Owners. For a more detailed discussion of the tax consequences of the merger, please see “Information about the Proposed Merger—Certain Federal Income Tax Consequences,” below.
| 7. | | Will the dividend policy be affected by the merger? |
The merger will not result in a change in dividend policy.
| 8. | | Do the procedures for purchasing, redeeming and exchanging shares of the two Funds differ? |
No. The procedures for purchasing and redeeming shares of each Fund are identical. Each Fund continuously sells shares to Participating Insurance Company separate accounts, without a sales charge, at the net asset value per share next determined after a proper purchase order is placed by a Participating Insurance Company. A Participating Insurance Company offers Contract Owners units in its separate accounts which correspond to shares in the Fund. A Participating Insurance Company submits purchase and redemption orders to the Fund based on allocation instructions for premium payments, transfer instructions and surrender or partial withdrawal requests for Contract Owners, as set forth in the accompanying prospectus for the Participating Insurance Company’s Contracts. These orders reflect the amount of premium payments to be invested, surrender and transfer requests and other matters. Redemption orders are effected at the next net asset value per share is determined after a proper redemption order is place by a Participating Insurance Company. Contract Owners should look at their Contract prospectuses for redemption procedures and fees.
| 9. | | How will I be notified of the outcome of the merger? |
If the proposed merger is approved by separate accounts as shareholders, separate accounts as shareholders whose accounts are affected by the merger will receive a
9
confirmation statement reflecting their new account number and the number of shares of Capital Growth they are receiving after the merger is completed. Subsequently, affected Contract Owners will be notified of changes to their account information by their respective Participating Insurance Companies. If the proposed merger is not approved, this result will be noted in the next shareholder report of Janus Growth & Income.
| 10. | | Will the value of an investment in Janus Growth & Income change? |
The number of shares owned by each Participating Insurance Company will most likely change. However, the total value of an investment in Capital Growth will equal the total value of your indirect investment in Janus Growth & Income as of the Valuation Time (as defined on page 22). Even though the net asset value per share of each Fund is likely to be different, the total value of your holdings will not change as a result of the merger.
| 11. | | What percentage of shareholders’ votes is required to approve the merger? |
Approval of the merger will require the affirmative vote of the shareholders of Janus Growth & Income entitled to vote more than fifty percent (50%) of the votes entitled to be cast on the matter at the special meeting.
The Trustees of the Trust believe that the proposed merger is in the best interests of Janus Growth & Income. Accordingly, the Trustees unanimously recommend that shareholders vote FOR approval of the proposed merger.
II. INVESTMENT STRATEGIES AND RISK FACTORS
What are the main investment strategies and related risks of Capital Growth, and how do they compare with those of Janus Growth & Income?
Objectives and Strategies. Capital Growth and Janus Growth & Income have similar investment objectives. Capital Growth seeks long term growth of capital, whereas Janus Growth & Income seeks long term growth and current income. Capital Growth normally invests at least 65% of total assets in equities, mostly common stocks of U.S. companies. Although Capital Growth can invest in companies of any size, it generally focuses on established companies that are similar in size to the companies in the Standard & Poor’s 500 Composite Stock price Index (the “S&P 500 Index”) or the Russell 1000 Growth Index (as of December 31, 2008, the S&P 500 Index and the Russell 1000 Growth Index had median market capitalizations of $6.4 billion and $3.3 billion, respectively). Although Capital Growth may invest in companies of any size, the Fund intends to invest primarily in companies whose market capitalizations fall within the normal range of these indices. The portfolio may also invest in other types of equity securities, such as preferred stocks or convertible securities.
Janus Growth & Income normally emphasizes investments in equity securities, which may include initial public offerings. It may invest up to 75% of its total assets in equity securities selected primarily for their growth potential and at least 25% of its total assets in securities portfolio management believes have income potential. Janus Growth & Income may invest substantially all of its assets in equity securities if portfolio
10
management believes that equity securities have the potential to appreciate in value. Portfolio management generally seeks to identify equity securities of companies with earnings growth potential that may not be recognized by the market at large. Portfolio management makes this assessment by looking at companies one at a time, regardless of size, country or organization, place of principal business activity, or other similar selection criteria.
Janus Growth & Income may invest without limit in foreign securities either indirectly (e.g., depositary receipts) or directly in foreign markets. Foreign securities are generally selected on a stock-by-stock basis without regard to any defined allocation among countries or geographic regions. However, certain factors such as expected levels of inflation, government policies influencing business conditions, currency exchange rates, and prospects for economic growth among countries or geographic regions may warrant greater consideration in selecting foreign securities. Janus Growth & Income shifts assets between the growth and income components of its holdings based on portfolio management’s analysis of relevant market, financial and economic conditions. If portfolio management believes that growth securities may provide better returns than the yields available or expected on income-producing securities, Janus Growth & Income will place a greater emphasis on the growth component of its holdings. The growth component of Janus Growth & Income is expected to consist primarily of common stocks, but may also include warrants, preferred stocks or convertible securities selected primarily for their growth potential. The income component of Janus Growth & Income is expected to consist of securities that portfolio management believes have income potential. Such securities may include equity securities, convertible securities and all types of debt securities, including indexed/structured securities such as equity-linked structured notes. Equity securities may be included in the income component of Janus Growth & Income if they currently pay dividends or if portfolio management believes they have the potential for either increasing their dividends or commencing dividends, if none are currently paid.
The Funds use different investment processes. For Capital Growth, in choosing stocks, the portfolio managers begin by utilizing a proprietary quantitative model to rank stocks based on a number of factors including valuation and profitability. The portfolio managers also apply fundamental techniques to identify companies that display above-average earnings growth compared to other companies and that have strong product lines, effective management and leadership positions within core markets. The factors considered and models used by the portfolio managers may change over time. The portfolio managers will normally sell a stock when they believe its potential risks have increased, its price is unlikely to higher, its fundamental factors have changed, other investments offer better opportunities or in the course of adjusting the Fund's emphasis on a given industry. For Janus Growth & Income, portfolio management applies a “bottom-up” approach in choosing investments. In other words, portfolio management looks mostly for equity and income-producing securities that meet its investment criteria one at a time. If Janus Growth & Income is unable to find such investments, much of the Fund’s assets may be in cash or similar investments.
Other Investments. Janus Growth & Income may invest in debt securities, high-yield/high-risk bonds and securities purchased on a when-issued, delayed delivery or forward commitment basis. Compared to investment-grade bonds, high yield bonds may pay higher yields and have higher volatility and risk of default. Each Fund is permitted, but is not required, to use various types of derivatives (contracts whose value is based
11
on, for example, indices, currencies or securities). Derivatives may be used for hedging and for risk management or for non-hedging purposes to seek to enhance potential gains. Each Fund may use derivatives in circumstances where portfolio management believes they offer economical means of gaining exposure to a particular asset class or to maintain a high level of liquidity to meet shareholder redemptions or other needs while maintaining exposure to the market. In particular, Capital Growth may use futures, options and covered call options.
Securities Lending. Each Fund may lend its investment securities in an amount up to 33 1/3% of its total assets to approved institutional borrowers who need to borrow securities in order to complete certain transactions.
Other Policies. Although major changes tend to be infrequent, each Fund’s Board could change the Fund’s investment objectives without seeking shareholder approval.
As a temporary defensive measure, Capital Growth could shift up to 100% of assets into cash and cash equivalents, U.S. government securities, money market instruments and high quality debt securities without equity features, while Janus Growth & Income could shift up to 100% of assets into investments such as money market securities. For each Fund, this measure could prevent losses, but, while engaged in a temporary defensive position, each Fund will not be pursuing its investment objective. However, the portfolio managers may choose not to use these strategies for various reasons, even in very volatile market conditions.
DWS Investments believes that Capital Growth should provide a comparable investment opportunity for shareholders of Janus Growth & Income.
Primary Risks. As with any investment, you may lose money by investing in Capital Growth. Certain risks associated with an investment in Capital Growth are summarized below. Subject to certain exceptions, the risks of an investment in Capital Growth are similar to the risks of an investment in Janus Growth & Income. More detailed descriptions of the risks associated with an investment in Capital Growth can be found in the Capital Growth prospectus and statement of additional information.
The value of your investment in Capital Growth will change with changes in the values of the investments held by Capital Growth. A wide array of factors can affect those values. In this summary we describe the principal risks that may affect Capital Growth’s investments as a whole.
Stock Market Risk. The Fund is affected by how the stock market performs. To the extent Capital Growth invests in a particular market sector, the Fund’s performance may be proportionally affected by that segment’s general performance. When stock prices fall, you should expect the value of your investment to fall as well. Because a stock represents ownership in its issuer, stock prices can be hurt by poor management, shrinking product demand and other business risks. These may affect single companies as well as groups of companies. In addition, movements in financial markets may adversely affect a stock’s price, regardless of how well the company performs. The market as a whole may not favor the types of investments Capital Growth makes and Capital Growth may not be able to get attractive prices for them. An investment in Janus Growth & Income is also subject to this risk.
12
Growth Investing Risk. Since growth stocks usually reinvest a large portion of earnings in their own businesses, they may lack the dividends associated with value stocks that might otherwise cushion their decline in a falling market. Earnings disappointments in growth stocks often result in sharp price declines because investors buy these stocks for their potential superior earnings growth. Growth stocks may also be out of favor for certain periods in relation to value stocks.
Industry Risk. While Capital Growth does not concentrate in any industry or sector, to the extent that the Fund has exposure to a given industry or sector, any factors affecting that industry or sector could affect the value of portfolio securities. For example, manufacturers of consumer goods could be hurt by a rise in unemployment, or technology companies could be hurt by such factors as market saturation, price competition and rapid obsolescence. An investment in Janus Growth & Income is also subject to this risk.
Security Selection Risk. A risk that pervades all investing is the risk that the securities in the Fund’s portfolio may decline in value. An investment in Janus Growth & Income is also subject to this risk.
IPO Risk. Securities purchased in initial public offerings (IPOs) may be very volatile, due to their stock prices rising and falling rapidly, often based, among other reasons, on investor perceptions rather than economic reasons. Additionally, investments in IPOs may magnify the Fund’s performance if it has a small asset base. The Fund is less likely to experience a similar impact on its performance as its assets grow because it is unlikely that the Fund will obtain proportionately larger IPO allocations. An investment in Janus Growth & Income is also subject to this risk.
Derivatives Risk. Risks associated with derivatives include: the risk that the derivative is not well correlated with the security, index or currency to which it relates; the risk that derivatives may result in losses or missed opportunities; the risk that Capital Growth will be unable to sell the derivative because of an illiquid secondary market; the risk that a counterparty is unwilling or unable to meet its obligation; and the risk that the derivatives transaction could expose the Fund to the effects of leverage, which could increase the Fund’s exposure to the market and magnify potential losses. There is no guarantee that these derivatives, to the extent employed, will have the intended effect, and their use could cause lower returns or even losses to Capital Growth. The use of derivatives by Capital Growth to hedge risk may reduce the opportunity for gain by offsetting the positive effect of favorable price movements. An investment in Janus Growth & Income is also subject to this risk.
Securities Lending Risk. Any loss in the market price of securities loaned by Capital Growth that occurs during the term of the loan would be borne by the Fund and would adversely affect the Fund’s performance. Also, there may be delays in recovery of securities loaned or even a loss of rights in the collateral should the borrower of the securities fail financially while the loan is outstanding. However, loans will be made only to borrowers selected by Capital Growth’s delegate after a review of relevant facts and circumstances, including the creditworthiness of the borrower. An investment in Janus Growth & Income is also subject to this risk.
Pricing Risk. At times, market conditions may make it difficult to value some investments, and the Fund may use certain valuation methodologies for some of its investments, such as fair value pricing. Given the subjective nature of such valuation
13
methodologies, it is possible that the value determined for an investment may be different than the value realized upon such investment’s sale. If the Fund has valued its securities too highly, you may pay too much for Fund shares when you buy into the Fund. If the Fund has underestimated the price of its securities, you may not receive the full market value when you sell your Fund shares. An investment in Janus Growth & Income is also subject to this risk.
Other factors that could affect the performance of Capital Growth include:
| | • | | portfolio management could be wrong in the analysis of industries, companies, economic trends, the relative attractiveness of different securities or other matters; and |
| | • | | foreign securities may be more volatile than their U.S. counterparts, for reasons such as currency fluctuations and political and economic uncertainty. |
Performance Information. The following information provides some indication of the risks of investing in each Fund. Of course, a Fund’s past performance is not an indication of future performance. The information shown below does not reflect charges and fees associated with the separate accounts that invest in the Funds or any Contract for which the Funds are investment options. If it did, performance would be less than that shown.
The bar charts show how the performance of each Fund’s Class A shares has varied from year to year, which may give some idea of risk. The tables following the charts show how each Fund’s performance compares with one or more broad-based market indices (which, unlike the Funds, do not have any fees or expenses). The performance of both the Fund and the broad-based market indices vary over time. All figures assume reinvestment of dividends and distributions.
Calendar Year Total Returns (%)
Capital Growth – Class A Shares
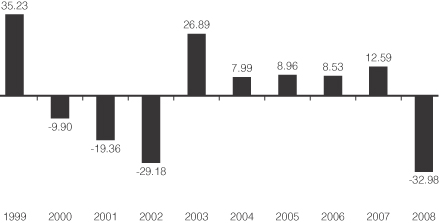
For the periods included in the bar chart:
| | |
| Best Quarter: 24.86%, Q4 1999 | | Worst Quarter: -21.49%, Q4 2008 |
14
Janus Growth & Income – Class A Shares
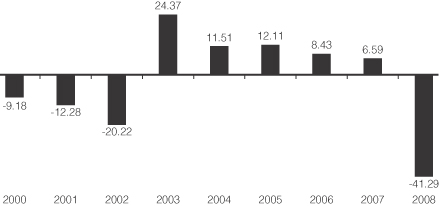
For the periods included in the bar chart:
| | |
| Best Quarter: 12.40%, Q4 2004 | | Worst Quarter: -20.68%, Q4 2008 |
Average Annual Total Returns (%) (for period ended December 31, 2008)
| | | | | | |
| | | Past
1 year | | Past
5 years | | Past
10 Years |
Capital Growth | | | | | | |
Class A | | -32.98 | | -0.74 | | -1.60 |
Russell 1000 Growth Index (reflects no deductions for fees or expenses) | | -38.44 | | -3.42 | | -4.27 |
Standard and Poor’s (S&P) 500 Index (reflects no deductions for fees or expenses) | | -37.00 | | -2.19 | | -1.38 |
| | | Total return would have been lower had certain expenses not been reduced. |
| | Russell 1000® Growth Index is an unmanaged index that consists of those stocks in the Russell 1000 Index with higher price-to-book ratios and higher forecasted growth values. Russell 1000 Index is an unmanaged price-only index of the 1,000 largest capitalized companies that are domiciled in the US and whose common stocks are traded. |
| | | Standard & Poor’s 500 Index (S&P 500) is an unmanaged, capitalization-weighted index of 500 stocks. The index is designed to measure performance of the broad domestic economy through changes in the aggregate market value of 500 stocks representing all major industries. |
15
| | | | | | |
| | | Past
1 year | | Past
5 years | | Since
Inception |
Janus Growth & Income | | | | | | |
Class A | | -41.29 | | -3.24 | | -2.80 |
Russell 1000 Growth Index (reflects no deductions for fees or expenses) | | -38.44 | | -3.42 | | -6.04 |
| | Russell 1000® Growth Index is an unmanaged index that consists of those stocks in the Russell 1000 Index with higher price-to-book ratios and higher forecasted growth values. Russell 1000 Index is an unmanaged price-only index of the 1,000 largest capitalized companies that are domiciled in the US and whose common stocks are traded. |
Current performance may be higher or lower than the performance data quoted above. For more recent performance information, call your insurance company or 1-800-778-1482.
III. OTHER INFORMATION ABOUT THE FUNDS
Advisor and Portfolio Manager. DIMA, with headquarters at 345 Park Avenue, New York, NY 10154, is the investment advisor for each Fund. Under the oversight of the Board of each Fund, DIMA, or a subadvisor, makes investment decisions, buys and sells securities for each Fund and conducts research that leads to these purchase and sale decisions. DIMA provides a full range of global investment advisory services to institutional and retail clients.
DWS Investments is part of Deutsche Bank’s Asset Management division (“DeAM”) and within the U.S. represents the retail asset management activities of Deutsche Bank AG, DIMA, Deutsche Bank Trust Company Americas and DWS Trust Company. Deutsche Asset Management is a global asset management organization that offers a wide range of investing expertise and resources, including hundreds of portfolio managers and analysts and an office network that reaches the world’s major investment centers. This well-resourced global investment platform brings together a wide variety of experience and investment insight across industries, regions, asset classes and investing styles. DIMA is an indirect, wholly owned subsidiary of Deutsche Bank AG. Deutsche Bank AG is a major global banking institution that is engaged in a wide range of financial services, including investment management, mutual funds, retail, private and commercial banking, investment banking and insurance.
Capital Growth. The following individuals implement the investment strategy of Capital Growth:
Owen Fitzpatrick, CFA, is the Co-Portfolio Manager for Capital Growth. Mr. Fitzpatrick is a Managing Director of Deutsche Asset Management. Mr. Fitzpatrick joined Deutsche Asset Management and began managing Capital Growth in 2009. Prior to joining Deutsche Asset Management, Mr. Fitzpatrick was Managing Director of Deutsche Bank Private Wealth Management and served as head of U.S. Equity Strategy and manager of the U.S. large cap, core, value and growth portfolios. Mr. Fitzpatrick joined Deutsche Bank in 1995 after over twenty one years of experience in trust and investment management.
16
Richard Shepley is the Co-Portfolio Manager for Capital Growth. Mr. Shepley is a Managing Director of Deutsche Asset Management. He joined Deutsche Asset Management in 1998 after eight years of investment industry experience at Newton Investment Management and PriceWaterhouse. Mr. Shepley began managing Capital Growth in 2007.
Brendan O’Neill is a Portfolio Manager for Capital Growth. Mr. O’Neill is a Director of Deutsche Asset Management. Mr. O’Neill joined Deutsche Asset Management and began managing Capital Growth in 2009. He previously served as an Equity Research Analyst covering the financial services sector and as a member of the Large Cap Core Equity team.
Capital Growth’s statement of additional information provides further information about the portfolio managers’ investments in the Fund, a description of the Fund’s compensation structure and information regarding other accounts the portfolio managers manage.
Janus Growth & Income. The subadvisor for Janus Growth & Income is Janus Capital Management LLC, 151 Detroit Street, Denver, Colorado 80206. Janus Capital Management is an investment advisor registered with the SEC. DIMA compensates Janus Capital Management out of the management fee it receives from the Fund. The following individual handles the day-to-day management of Janus Growth & Income:
Marc Pinto is the Portfolio Manager for Janus Growth & Income. Mr. Pinto is also a portfolio manager of other Janus accounts. He joined Janus in 1994 as an analyst and has acted as portfolio manager of other Janus-advised mutual funds since 2005. Mr. Pinto has managed Janus Growth & Income since November 2007.
Janus Growth & Income’s statement of additional information provides additional information about the portfolio manager’s investments in the Fund, a description of his compensation structure and information regarding other accounts he manages.
Distribution and Service Fees. Pursuant to separate Underwriting and Distribution Services Agreements, DWS Investments Distributors, Inc., 222 South Riverside Plaza, Chicago, Illinois 60606, an affiliate of DIMA, is the principal underwriter and distributor for the Class A shares of Capital Growth and Janus Growth & Income, and acts as the agent of each Fund in the continuous offering of its shares.
Trustees and Officers. The Trustees overseeing Capital Growth are the same as the Trustees who oversee Janus Growth & Income: Paul K. Freeman (Chair), John W. Ballantine, Henry P. Becton, Dawn-Marie Driscoll, Keith R. Fox, Kenneth C. Froewiss, Richard J. Herring, William McClayton, Rebecca W. Rimel, Axel Schwarzer, William N. Searcy, Jr., Jean Gleason Stromberg and Robert H. Wadsworth. The officers of Capital Growth are also the same as those of Janus Growth & Income.
Independent Registered Public Accounting Firm (“Auditor”). PricewaterhouseCoopers LLP, 125 High Street, Boston, MA 02110 serves as Capital Growth’s independent registered public accounting firm. Ernst & Young LLP, 200 Clarendon Street, Boston, MA 02116, serves as Janus Growth & Income’s independent registered public accounting firm, audits the financial statements of the Fund and provides other audit, tax and related services to the Fund.
17
Charter Documents.
Capital Growth is a series of DWS Variable Series I, a Massachusetts business trust organized under the laws of Massachusetts and is governed by an Amended and Restated Declaration of Trust dated June 2, 2008 (the “Variable Series I Declaration of Trust”). Janus Growth & Income is a series of DWS Variable Series II, a Massachusetts business trust organized under the laws of Massachusetts and is governed by an Amended and Restated Declaration of Trust dated June 2, 2008 (the “Variable Series II Declaration of Trust”). The Variable Series I Declaration of Trust and the Variable Series II Declaration of Trust are referred to herein collectively as the “Declarations of Trust,” and each is referred to herein individually as a “Declaration of Trust.” Additional information about the Declarations of Trust is provided below.
Shares. The Trustees have the authority to create additional funds and to designate the relative rights and preferences as between the different funds. The trustees of the Trust also may authorize the division of shares of the Funds into different classes, which may bear different expenses. All shares issued and outstanding are fully paid and non-assessable (except as set forth below), transferable, have no pre-emptive or conversion rights (except as may be determined by the Board of Trustees) and are redeemable as described in the SAIs and the Funds’ prospectuses. Each share has equal rights with each other share of the same class of the Funds as to voting, dividends, exchanges, conversion features and liquidation. Shareholders are entitled to one vote for each full share held and fractional votes for fractional shares held. Shares of the Funds have noncumulative voting rights with respect to the election of Trustees.
Shareholder Meetings. Neither Fund is generally required to hold meetings of its shareholders. Under the Declarations of Trust, however, shareholder meetings will be held in connection with the following matters to the extent and as provided in the Declarations of Trust and as required by applicable law: (a) the election or removal of Trustees if a meeting is called for such purpose; (b) the termination of the Trust; (c) an amendment of the Declaration of Trust; and (d) such additional matters as may be required by law or as the Trustees may determine to be necessary or desirable. Shareholders also vote upon changes in fundamental policies or restrictions. The shareholders shall generally take action by the affirmative vote of the holders of a majority of the shares present in person or by proxy and entitled to vote and voting or voted at a meeting of shareholders at which a quorum is present. The Declarations of Trust provide that shareholder meeting quorum requirements shall be established in the Funds’ By-laws. The By-laws of both Funds currently in effect provide that the presence in person or by proxy of the holders of thirty percent (30%) of the shares entitled to vote at a meeting (or of an individual series or class if required to vote separately) shall constitute a quorum for the transaction of business at meetings of shareholders of the Funds.
On any matter submitted to a vote of shareholders, all shares of the Funds entitled to vote shall, except as otherwise provided in the Funds’ By-Laws, be voted in the aggregate as a single class without regard to series or classes of shares, except (a) when required by applicable law or when the Trustees shall have determined that the matter affects one or more series or classes of shares materially differently, shares shall be voted by individual series or class; and (b) when the Trustees have determined that the matter affects only the interests of one or more series or classes, only shareholders of such series or classes shall be entitled to vote thereon.
18
Shareholder Liability. Under Massachusetts law, shareholders of a Massachusetts business trust could, under certain circumstances, be held personally liable for obligations of a Fund. The Declarations of Trust, however, disclaim shareholder liability for acts or obligations of the Funds and require that notice of such disclaimer be given in each agreement, obligation, or instrument entered into or executed by the Funds. Moreover, the Declarations of Trust provide for indemnification out of the property of the Funds for all losses and expenses of any shareholder held personally liable for the obligations of the Funds and the applicable Fund may be covered by insurance which the Trustees consider adequate to cover foreseeable claims. Thus, the risk of a shareholder incurring financial loss on account of shareholder liability is considered by the Advisor remote and not material, since it is limited to circumstances in which a disclaimer is inoperative and the Funds themselves are unable to meet their obligations.
Trustee Liability. The Declarations of Trust provide that obligations of the Funds are not binding upon the Trustees individually but only upon the property of the Funds and that the Funds will indemnify their Trustees and officers against liabilities and expenses incurred in connection with any claim, action, suit or proceeding in which they may be involved because of their offices with the Funds, except if it is determined in the manner provided in the Declarations of Trust that they have not acted in good faith in the reasonable belief that their actions were in the best interests of the Funds. However, nothing in the Declarations of Trust protects or indemnifies a Trustee or officer against any liability to which he or she would otherwise be subject by reason of willful misfeasance, bad faith, gross negligence, of reckless disregard of duties involved in the conduct of his or her office.
Election and Term of Trustees. Each Trustee serves until the next meeting of shareholders, if any, called for the purpose of electing Trustees and until the election and qualification of a successor or until such Trustee sooner dies, resigns, retires, is removed or incapacitated. Any Trustee who has become incapacitated by illness or injury as determined by a majority of the other Trustees may be retired by written instrument, signed by at least a majority of the other Trustees, specifying the date upon which such removal shall become effective. Any Trustee may be removed with or without cause (i) by the vote of the shareholders holding two-thirds of the outstanding shares of the applicable Trust, or (ii) by the action of two-thirds of the remaining Trustees. The Trustees shall promptly call a meeting of the shareholders for the purpose of voting upon the question of removal of any Trustee or Trustees when requested in writing so to do by the holders of not less than ten percent (10%) of the outstanding shares, and in that connection, the Trustees will assist shareholder communications to the extent provided for in Section 16(c) under the 1940 Act.
The foregoing is only a summary of the charter documents of Capital Growth and Janus Growth & Income and is not a complete description of provisions contained in those sources. Shareholders should refer to the provisions of those documents and state law directly for a more thorough description.
IV. INFORMATION ABOUT THE PROPOSED MERGER
General. The shareholders of Janus Growth & Income are being asked to approve the merger pursuant to an Agreement and Plan of Reorganization between Janus
19
Growth & Income and Capital Growth (the “Agreement”), the form of which is attached to this Prospectus/Proxy Statement as Exhibit A.
The merger is structured as a transfer of all of the assets of Janus Growth & Income to Capital Growth in exchange for the assumption by Capital Growth of all the liabilities of Janus Growth & Income and for the issuance and delivery of Merger Shares to Janus Growth & Income equal in aggregate value to the net value of the assets transferred to Capital Growth.
After receipt of the Merger Shares, Janus Growth & Income will distribute the Merger Shares to its shareholders, in proportion to their existing shareholdings, in complete liquidation of Janus Growth & Income, and the legal existence of Janus Growth & Income as a series of the Trust will be terminated. Each shareholder of Janus Growth & Income will receive a number of full and fractional Merger Shares equal in aggregate value as of the Valuation Time (as defined on page 22) to the aggregate value of the shareholder’s Janus Growth & Income shares. Each Participating Insurance Company will then allocate its Merger Shares on a pro-rata basis for the benefit of the Contract owners in its Janus Growth & Income separate account (or in sub-accounts thereof). Unless a Contract Owner instructs his or her Participating Insurance Company otherwise, amounts that would have been allocated to Janus Growth & Income under an existing Contract will, following the merger, be allocated to Capital Growth.
Prior to the date of the merger, Janus Growth & Income will sell all investments that are not consistent with the current implementation of the investment objective, policies, restrictions and investment strategies of Capital Growth, if any, and make such other changes to reposition the investment portfolio in preparation for the merger. In addition, prior to the merger, Janus Growth & Income will declare a distribution which, together with all previous distributions, will have the effect of distributing to shareholders all of its net investment income and net realized capital gains, if any, through the date of the merger. Contract Owners who invest in Janus Growth & Income through a Contract will not be affected by such distributions as long as the Contracts they hold qualify as annuity contracts or life insurance under Section 72 of the Code.
The Trustees of the Trust have voted unanimously to approve the Agreement and the proposed merger and to recommend that shareholders also approve the merger. The actions contemplated by the Agreement and the related matters described therein will be consummated only if approved by the affirmative vote of the shareholders of Janus Growth & Income entitled to vote more than fifty percent (50%) of the votes entitled to be cast on the matter at the special meeting. In the event that the merger does not receive the required shareholder approval, each Fund will continue to be managed as a separate Fund in accordance with its current investment objective and policies, and the Trustees of the Trusts may consider such alternatives as may be in the best interests of each Fund.
Background and Board’s Considerations Relating to the Proposed Merger.
DWS Investments proposed the merger to the Board in November 2008 as part of an ongoing effort to consolidate overlapping products and realize the ongoing benefits to shareholders of a consolidated product line up, such as greater support from product management, marketing and sales. DWS Investments advised the Board that a merger of
20
Janus Growth & Income into Capital Growth would provide shareholders with the opportunity to invest in a larger fund with better performance than Janus Growth & Income currently has, lower management fees, a lower total operating expense ratio and a similar investment approach to that employed by Janus Growth & Income.
The Trustees conducted a thorough review of the potential implications of the merger on Janus Growth & Income’s shareholders. They were assisted in this review by their independent legal counsel. The Trustees met on several occasions to review and discuss the merger, both among themselves and with representatives of DWS Investments.
On January 22, 2009, the Trustees of Janus Growth & Income, including all Trustees who are not “interested persons” (as defined in the 1940 Act) (“Independent Trustees”), approved the terms of the proposed merger of Janus Growth & Income into Capital Growth. The Trustees have also unanimously determined to recommend that the merger be approved by Janus Growth & Income’s shareholders.
In determining to recommend that the shareholders of Janus Growth & Income approve the merger, the Trustees considered, among other factors:
| | • | | The compatibility of Janus Growth & Income’s and Capital Growth’s investment objectives, policies, restrictions and portfolios, and that the merger would permit the shareholders of Janus Growth & Income to pursue similar investment goals, relative to other DWS VIP funds, in a significantly larger fund; |
| | • | | The investment advisory fee schedules for Janus Growth & Income and Capital Growth, and, in particular, that the effective advisory fees paid by the combined fund will be lower at all asset levels as compared to the advisory fees paid by Janus Growth & Income; |
| | • | | The operating expense ratios of Janus Growth & Income and Capital Growth, including a comparison between the expenses of Janus Growth & Income and the estimated total operating expense ratios of the combined fund, and, in particular, noted that the total operating expense ratio of the relevant class of the combined fund was expected to be lower than the current total operating expense ratio of Janus Growth & Income; |
| | • | | DIMA’s commitment to cap the expenses to be incurred by Janus Growth & Income in connection with the merger. More specifically, DIMA has agreed to bear expenses incurred by Janus Growth & Income in connection with the merger, including certain transaction costs, to the extent that such expenses exceed the expected cost savings to be realized by Janus Growth & Income during the one-year period following the merger (See the Agreement below for additional information regarding this cap); |
| | • | | The merger would provide a continuity of investment within the DWS fund family for shareholders of Janus Growth & Income; |
| | • | | The merger would not result in the dilution of the interests of Janus Growth & Income shareholders and that the terms and conditions of the Agreement were fair and reasonable; |
| | • | | Services available to shareholders of Janus Growth & Income and Capital Growth are substantially similar on a class-level basis; |
21
| | • | | The investment performance of Janus Growth & Income and Capital Growth; |
| | • | | Prospects for the combined fund to attract additional assets, including that Capital Growth is open to broader distribution, which may result in future economies of scale; and |
| | • | | The federal income tax consequences of the merger on Janus Growth & Income and its shareholders. |
Based on all of the foregoing, the Trustees concluded that Janus Growth & Income’s participation in the merger would be in the best interests of Janus Growth & Income and would not dilute the interests of Janus Growth & Income’s existing shareholders. The Board of Trustees of Janus Growth & Income, including all of the Independent Trustees, unanimously recommends that shareholders of the Fund approve the merger.
Agreement and Plan of Reorganization. The proposed merger will be governed by the Agreement, the form of which is attached as Exhibit A. The Agreement provides that Capital Growth will acquire all of the assets of Janus Growth & Income solely in exchange for the assumption by Capital Growth of all the liabilities of Janus Growth & Income and for the issuance of Merger Shares equal in value to the value of the transferred assets net of assumed liabilities. The shares will be issued on the next full business day (the “Exchange Date”) following the time as of which the Funds’ shares are valued for determining net asset value for the merger (4:00 p.m. Eastern time, on April 24, 2009, or such other date and time as may be agreed upon by the parties (the “Valuation Time”)). The following discussion of the Agreement is qualified in its entirety by the full text of the Agreement.
Janus Growth & Income will transfer all of its assets to Capital Growth, and in exchange, Capital Growth will assume all the liabilities of Janus Growth & Income and deliver to Janus Growth & Income a number of full and fractional Merger Shares having an aggregate net asset value equal to the value of the assets of Janus Growth & Income attributable to shares of Janus Growth & Income, less the value of the liabilities of Janus Growth & Income assumed by Capital Growth attributable to shares of Janus Growth & Income. Immediately following the transfer of assets on the Exchange Date, Janus Growth & Income will distribute pro rata to its shareholders of record as of the Valuation Time the full and fractional Merger Shares received by Janus Growth & Income, with Merger Shares being distributed to holders of shares of Janus Growth & Income. As a result of the proposed transaction, each shareholder of Janus Growth & Income will receive a number of Merger Shares of equal in aggregate value at the Valuation Time to the value of Janus Growth & Income shares surrendered by the shareholder. This distribution will be accomplished by the establishment of accounts on the share records of Capital Growth in the name of such Janus Growth & Income shareholders, each account representing the respective number of full and fractional Merger Shares due the respective shareholder. New certificates for Merger Shares will not be issued.
The Trustees of the Trust and of Capital Growth have determined that the interests of each Fund’s shareholders will not be diluted as a result of the transactions contemplated by the Agreement, and that the proposed merger is in the best interests of each Fund.
22
The consummation of the merger is subject to the conditions set forth in the Agreement. The Agreement may be terminated and the merger abandoned (i) by mutual consent of Capital Growth and Janus Growth & Income, (ii) by either party if the merger shall not be consummated by July 31, 2009 (iii) by either party if the other party shall have materially breached, or made a material and intentional misrepresentation in or in connection with the Agreement.
DWS Investments has represented that it expects that all of Janus Growth & Income’s portfolio holdings will be liquidated prior to the merger and the proceeds reinvested in other securities so that at the time of the merger, Janus Growth & Income’s portfolio will conform more closely to Capital Growth’s current implementation of its investment objective, policies, restrictions and strategies. DWS Investments has estimated that transaction costs in connection with the repositioning of Janus Growth & Income’s portfolio will be approximately $105,000 (“Pre-Merger Transaction Costs”). Janus Growth & Income will bear the Pre-Merger Transaction Costs, subject to the cap below.
Pursuant to the Agreement, Janus Growth & Income will bear all the expenses of the merger, including the Pre-Merger Transaction Costs, subject to the cap agreed to by DIMA. DIMA has agreed to bear all the expenses of the merger, including the Pre-Merger Transaction Costs, to the extent that the expenses of the merger exceed the estimated total one-year economic benefit expected to be realized by Janus Growth & Income through the merger (calculated immediately prior to the merger). The estimated one-year benefit to Janus Growth & Income shareholders is calculated by analyzing the difference between the estimated one-year total expenses of Janus Growth & Income and the estimated one-year total expenses of the combined fund, in each case based on current expense ratios. The difference between these total expense figures represents the estimated cost savings to Janus Growth & Income shareholders for one year as a result of the merger. As of December 31, 2008, the estimated one-year economic benefit to Janus Growth & Income was $271,000 and the total estimated expenses of the merger, including the Pre-Merger Transaction Costs, were $251,000. Therefore, based on estimates as of December 31, 2008, the cap agreed to by DIMA is not expected to be triggered and Janus Growth & Income is expected to bear the expenses of the merger. You should note that the above dollar amounts are only estimates and the actual merger costs borne by Janus Growth & Income may be higher or lower. The final estimates will be calculated immediately prior to the merger.
Description of the Merger Shares. Merger Shares will be issued to separate accounts as shareholders of Janus Growth & Income in accordance with the Agreement as described above. The Merger Shares are Class A shares of Capital Growth. The Merger Shares have the same characteristics as Class A shares of Janus Growth & Income. Merger Shares will be treated as having been purchased on the date a separate account as shareholder purchased its Janus Growth & Income shares and for the price it originally paid. For more information on the characteristics of the Merger Shares, please see the applicable Capital Growth prospectus, a copy of which is included with this Prospectus/Proxy Statement.
Certain Federal Income Tax Consequences. As a condition to each Fund’s obligation to consummate the reorganization, each Fund will receive a tax opinion from Willkie Farr & Gallagher LLP, special tax counsel (which opinion will be based on certain factual representations of the Funds and certain customary assumptions), to the
23
effect that, on the basis of the existing provisions of the US Internal Revenue Code of 1986, as amended (the “Code”), Treasury regulations issued thereunder, published rulings and procedures of the Internal Revenue Service and judicial decisions, all as in effect on the date of the opinion, for federal income tax purposes:
| | • | | The acquisition by Capital Growth of all of the assets of Janus Growth & Income solely in exchange for Merger Shares and the assumption by Capital Growth of all of the liabilities of Janus Growth & Income, followed by the distribution by Janus Growth & Income to separate accounts as shareholders of Merger Shares in complete liquidation of Janus Growth & Income, all pursuant to the Agreement, constitutes a reorganization within the meaning of Section 368(a) of the Code, and Janus Growth & Income and Capital Growth will each be a “party to a reorganization” within the meaning of Section 368(b) of the Code. |
| | • | | Under Sections 361 and 357(a) of the Code, Janus Growth & Income will not recognize gain or loss upon the transfer of its assets to Capital Growth in exchange for Merger Shares and the assumption of Janus Growth & Income’s liabilities by Capital Growth, and Janus Growth & Income will not recognize gain or loss upon the distribution to its shareholders of the Merger Shares in liquidation of Janus Growth & Income. |
| | • | | Under Section 354 of the Code, separate accounts as shareholders of Janus Growth & Income will not recognize gain or loss on the receipt of Merger Shares solely in exchange for Janus Growth & Income shares. |
| | • | | Under Section 358 of the Code, the aggregate basis of the Merger Shares received by each separate account as a shareholder of Janus Growth & Income will be the same as the aggregate basis of Janus Growth & Income shares exchanged therefor. |
| | • | | Under Section 1223(1) of the Code, the holding period of the Merger Shares received by each separate account as a shareholder of Janus Growth & Income will include the holding period of the Janus Growth & Income shares exchanged therefor, provided that such separate account as a shareholder of Janus Growth & Income held the Janus Growth & Income shares at the time of the reorganization as a capital asset. |
| | • | | Under Section 1032 of the Code, Capital Growth will not recognize gain or loss upon the receipt of assets of Janus Growth & Income in exchange for Merger Shares and the assumption by Capital Growth of all of the liabilities of Janus Growth & Income. |
| | • | | Under Section 362(b) of the Code, the basis of the assets of Janus Growth & Income transferred to Capital Growth in the reorganization will be the same in the hands of Capital Growth as the basis of such assets in the hands of Janus Growth & Income immediately prior to the transfer. |
| | • | | Under Section 1223(2) of the Code, the holding periods of the assets of Janus Growth & Income transferred to Capital Growth in the reorganization in the hands of Capital Growth will include the periods during which such assets were held by Janus Growth & Income. |
As long as the Contracts qualify as annuity contracts under Section 72 of the Code and Treasury regulations thereunder, the merger, whether or not treated as a tax-free
24
reorganization for federal income tax purposes, will not create any tax liability for Contract Owners. Contract Owners who choose to redeem or exchange their investments by surrendering their Contracts or initiating a partial withdrawal, however, may be subject to taxes and a 10% tax penalty. In addition, although it is not expected to affect Contract Owners, as a result of the merger each Fund may lose the benefit of certain tax losses that could have been used to offset or defer future gains of the combined fund.
This description of the federal income tax consequences of the merger is made without regard to the particular facts and circumstances of any shareholder or Contract Owner. Shareholders and Contract Owners are urged to consult their own tax advisors as to the specific consequences to them of the merger, including, without limitation, the applicability and effect of federal, state, local, non-US and other tax laws.
Capitalization. The following table sets forth the unaudited capitalization of each Fund as of December 31, 2008, and of Capital Growth on a pro forma combined basis, giving effect to the proposed acquisition of assets at net asset value as of that date.(1)(2)
| | | | | | | | | | | | |
| | | DWS Capital
Growth VIP | | DWS Janus
Growth &
Income VIP | | Pro Forma
Adjustments | | | Pro Forma
Combined |
Net Assets | | | | | | | | | | | | |
Class A | | $ | 593,927,716 | | $ | 72,747,912 | | (251,000 | ) | | $ | 666,424,628 |
Class B | | $ | 10,493,953 | | | — | | — | | | $ | 10,493,953 |
Total Net assets | | $ | 604,421,669 | | $ | 72,747,912 | | (251,000 | ) | | $ | 676,918,581 |
Shares outstanding | | | | | | | | | | | | |
Class A | | | 43,844,542 | | | 10,707,778 | | (5,357,452 | ) | | | 49,194,868 |
Class B | | | 777,803 | | | — | | — | | | | 777,803 |
Net Asset Value per share | | | | | | | | | | | | |
Class A | | | 13.55 | | | 6.79 | | — | | | | 13.55 |
Class B | | | 13.49 | | | — | | — | | | | 13.49 |
(1) | | Assumes the merger had been consummated on December 31, 2008 and is for information purposes only. No assurance can be given as to how many shares of Capital Growth will be received by the shareholders of Janus Growth & Income on the date the merger takes place, and the foregoing should not be relied upon to reflect the number of shares of Capital Growth that actually will be received on or after such date. |
(2) | | Pro Forma adjustments include estimated one-time merger costs of $251,000 expected to be borne by Janus Growth & Income. Pursuant to the Agreement, Janus Growth & Income will bear all the expenses of the merger, including the Pre-Merger Transaction Costs, subject to the cap agreed to by DIMA. DIMA has agreed to bear all the expenses of the merger, including the Pre-Merger Transaction Costs, to the extent that the expenses of the merger exceed the estimated total one-year economic benefit expected to be realized by Janus Growth & Income through the merger (please see page 23 for a description of how such estimated benefit is calculated). As of December 31, 2008, the estimated one-year economic benefit to Janus Growth & Income was $271,000 and the total estimated expenses of the merger, including the Pre-Merger Transaction Costs, were $251,000. Therefore, based on estimates as of December 31, 2008, the cap agreed to by |
25
| | DIMA is not expected to be triggered and Janus Growth & Income is expected to bear the expenses of the merger. You should note that the above dollar amounts are only estimates and the actual merger costs borne by Janus Growth & Income may be higher or lower. |
The Trustees of the Trust, a majority of whom are independent Trustees, unanimously recommend approval of the merger.
V. INFORMATION ABOUT VOTING AT THE SHAREHOLDER MEETING
General. This Prospectus/Proxy Statement is furnished in connection with the proposed merger of Janus Growth & Income into Capital Growth and the solicitation of proxies by and on behalf of the Trustees of the Trust for use at the special meeting of Janus Growth & Income shareholders (the “Meeting”). The Meeting is to be held on April 13, 2009 at 2:15 p.m. Eastern time at the offices of DIMA, 345 Park Avenue, 27th Floor, New York, New York 10154, or at such later time as is made necessary by adjournment or postponement. The Notice of the Special Meeting of Shareholders, the Prospectus/Proxy Statement and the enclosed voting instruction form are being mailed to shareholders on or about , 2009.
As of February 10, 2009, Janus Growth & Income had the following shares outstanding:
| | |
Share Class | | Number of
Shares |
Class A | | 10,153,145.90 |
Only shareholders of record on February 10, 2009 will be entitled to notice of and to vote at the Meeting. Each share is entitled to one vote, with fractional shares voting proportionally.
The Trustees of the Trust know of no matters other than those set forth herein to be brought before the Meeting. If, however, any other matters properly come before the Meeting, it is the Trustees’ intention that proxies will be voted on such matters in accordance with the judgment of the persons named in the enclosed form of proxy.
Required Vote. Proxies are being solicited from Janus Growth & Income’s shareholders by the Trustees of the Trust for the Meeting. Unless revoked, all valid proxies will be voted in accordance with the specification thereon or, in the absence of specification, FOR approval of the Agreement. The transactions contemplated by the Agreement will be consummated only if approved by the affirmative vote of the shareholders of Janus Growth & Income entitled to vote more than fifty percent (50%) of the votes entitled to be cast on the matter at the special meeting.
Record Date, Quorum and Method of Tabulation. Shareholders of record of Janus Growth & Income at the close of business on February 10, 2009 (the “Record Date”) will be entitled to vote at the Meeting or any adjournment thereof. The presence in person or by proxy of the holders of thirty percent (30%) of the shares entitled to vote at the Meeting shall constitute a quorum for the transaction of business at the Meeting.
26
Votes cast by proxy or in person at the Meeting will be counted by persons appointed by Janus Growth & Income as tellers for the Meeting. The tellers will count the total number of votes cast “FOR” approval of the proposal for purposes of determining whether sufficient affirmative votes have been cast. The tellers will count shares represented by proxies that reflect abstentions as shares that are present and entitled to vote on the matter for purposes of determining the presence of a quorum. Abstentions will therefore have the effect of a negative vote on the proposal. Shares attributable to amounts retained by each Participating Insurance Company will be voted in the same proportion as voting instructions received from Contract Owners. Accordingly, there are not expected to be any “broker non-votes.”
Share Ownership. As of February 10, 2009, the officers and Trustees of the Trust as a group beneficially owned less than 1% of the outstanding shares of Janus Growth & Income and of Capital Growth. To the best of the knowledge of Janus Growth & Income, the following shareholders owned of record or beneficially 5% or more of the outstanding shares of any class of Janus Growth & Income as of such date:
| | | | |
Class | | Shareholder Name and Address | | Percentage Owned |
| A | | Zurich Destinations Farmers SV c/o Kilico Attn. Investment Accounting LL- Greenville, SC 29602-9097 | | 69.54% |
| | |
| A | | Allmerica Life SVSII One Security Benefit Place Topeka, KS 66636-1000 | | 29.12% |
To the best of the knowledge of Capital Growth, the following shareholders owned of record or beneficially 5% or more of the outstanding shares of any class of Capital Growth as of February 10, 2009:
| | | | |
Class | | Shareholder Name and Address | | Percentage Owned |
| A | | Mutual of America Sep. Acct. 2 Saint Louis, MO 63119-2533 | | 28.92% |
| | |
| A | | Zurich Destinations/ Farmers F c/o Kilico Attn. Investment Accounting LL- Greenville, SC 29602-9097 | | 23.4% |
| | |
| A | | Mutual of America 320 Park Avenue New York, NY 10022-6815 | | 11.49% |
| | |
| A | | Allmerica Life SVSII One Security Benefit Place Topeka, KS 66636-1000 | | 11.01% |
| | |
| A | | Kemper Investors Life c/o Product Valuation One Security Benefit Place Topeka, KS 66636-1000 | | 10.32% |
27
| | | | |
Class | | Shareholder Name and Address | | Percentage Owned |
| A | | Charter Nat. Life Ins. Co.-Horizon Attn. Accounting Financial Control Vernon Hills, IL | | 6.98% |
| | |
| B | | MetLife Insurance Co. of CT Attn. Shareholder Accounting Dept. Hartford, CT 06199-0027 | | 91.88% |
Solicitation of Proxies. As discussed above, shares of Janus Growth & Income are offered only to Participating Insurance Companies to fund benefits under their Contracts. Therefore, shares of Janus Growth & Income are held by separate accounts, or sub-accounts thereof, of various Participating Insurance Companies. These shares are owned by the Participating Insurance Companies as depositors for their respective Contracts issued to individual Contract Owners or to a group (e.g., a defined benefit plan) in which Contract Owners participate. Contract Owners have the right to instruct the Participating Insurance Companies on how to vote the shares related to their interests through their Contracts (i.e., pass-through voting). A Participating Insurance Company must vote the shares of Janus Growth & Income held in its name as directed. In the absence of voting directions on any voting instruction form that is signed and returned, the Participating Insurance Company will vote the interest represented thereby in favor of the proposal. If a Participating Insurance Company does not receive voting instructions for all of the shares of Janus Growth & Income held under the Contracts, it will vote all of the shares in the relevant separate accounts with respect to the proposal, for, against, or abstaining, in the same proportion as the shares of Janus Growth & Income for which it has received instructions from Contract Owners (i.e., “echo voting”). As a result, a small number of contract owners may determine the outcome of the vote. This Prospectus/Proxy Statement is used to solicit voting instructions from Contract Owners, as well as to solicit proxies from Participating Insurance Companies and the actual shareholders of Janus Growth & Income. All persons entitled to direct the voting of shares, whether or not they are shareholders, are described as voting for purposes of this Prospectus/Proxy Statement.
In addition to soliciting proxies by mail, certain officers and representatives of Janus Growth & Income, officers and employees of the Advisor and certain financial services firms and their representatives, who will receive no extra compensation for their services, may solicit proxies by telephone, telegram or personally.
All properly executed proxies received in time for the Meeting will be voted as specified in the proxy or, if no specification is made, in favor of the proposal.
Computershare Fund Services, Inc. (“Computershare”) has been engaged as an information agent in connection with this Prospectus/Proxy Statement at an estimated cost of $1,750. No person has been engaged to assist in the solicitation of proxies.
Please see the instructions on your voting instruction form for telephone touch-tone voting and Internet voting. Investors will have an opportunity to review their voting instructions and make any necessary changes before submitting their voting instructions and terminating their telephone call or Internet link. Investors who vote via the Internet, in addition to confirming their voting instructions prior to submission, will also receive an e-mail confirming their instructions upon request.
28
If a shareholder wishes to participate in the Meeting, but does not wish to give a proxy by telephone or electronically, the shareholder may still submit the proxy card originally sent with the Prospectus/Proxy Statement or attend in person. Should shareholders require additional information regarding the proxy or replacement proxy card, they may contact Computershare toll-free at 1-866-963-6127. Any proxy given by a shareholder is revocable until voted at the Meeting.
Persons holding shares as nominees will, upon request, be reimbursed for their reasonable expenses in soliciting instructions from their principals. The cost of preparing, printing and mailing the enclosed voting instruction form and Prospectus/Proxy Statement, and all other costs incurred in connection with the solicitation of proxies for Janus Growth & Income, including any additional solicitation made by letter, telephone or telegraph, will be paid by Janus Growth & Income (subject to the cap described above).
Revocation of Proxies. Proxies, including proxies given by telephone or over the Internet, may be revoked at any time before they are voted either (i) by a written revocation received by the Secretary of the Fund at One Beacon Street, Boston, MA 02108, (ii) by properly submitting a later-dated proxy that is received by the Fund at or prior to the Meeting or (iii) by attending the Meeting and voting in person. Merely attending the Meeting without voting, however, will not revoke a previously submitted proxy. Only a shareholder may execute or revoke a proxy. Contract Owners should consult their Participating Insurance Company regarding their ability to revoke voting instructions after such instructions have been provided to the Participating Insurance Company.
Adjournment and Postponement. The Meeting may, by action of the chairman of the meeting, be adjourned without further notice with respect to any matter to be considered at the Meeting to a designated time and place, whether or not a quorum is present with respect to such matter. Upon motion of the chairman of the Meeting, the question of adjournment may be submitted to a vote of the shareholders, and in that case, any adjournment with respect to any matter must be approved by the vote of holders of a majority of the shares present and entitled to vote with respect to the matter or matters adjourned, and without further notice. The Board may postpone the Meeting of shareholders prior to the Meeting with notice to shareholders entitled to vote at or receive notice of the Meeting.
29
EXHIBIT A
FORM OF AGREEMENT AND PLAN OF REORGANIZATION
THIS AGREEMENT AND PLAN OF REORGANIZATION (the “Agreement”) is made as of this 13th day of February, 2009, by and among DWS Variable Series I (the “Acquiring Trust”), a Massachusetts business trust, on behalf of DWS Capital Growth VIP (the “Acquiring Fund”), a separate series of the Acquiring Trust, and DWS Variable Series II (the “Acquired Trust,” and, together with the Acquiring Trust, each a “Trust” and collectively the “Trusts”), a Massachusetts business trust, on behalf of DWS Janus Growth & Income VIP (the “Acquired Fund,” and, together with the Acquiring Fund, each a “Fund” and collectively the “Funds”), a separate series of the Acquired Trust, and Deutsche Investment Management Americas Inc. (“DIMA”), investment adviser for the Funds (for purposes of section 10.2 of the Agreement only). The principal place of business of the Acquiring Trust is 345 Park Avenue, New York, NY 10154. The principal place of business of the Acquired Trust is 345 Park Avenue, New York, NY 10154.
This Agreement is intended to be and is adopted as a plan of reorganization and liquidation within the meaning of Section 368(a) of the Internal Revenue Code of 1986, as amended (the “Code”). The reorganization (the “Reorganization”) will consist of the transfer of all of the assets of the Acquired Fund to the Acquiring Fund in exchange solely for Class A voting shares of beneficial interest (par value $0.01 per share) of the Acquiring Fund (the “Acquiring Fund Shares”), the assumption by the Acquiring Fund of all of the liabilities of the Acquired Fund and the distribution of the Acquiring Fund Shares to the Class A shareholders of the Acquired Fund in complete liquidation and termination of the Acquired Fund as provided herein, all upon the terms and conditions hereinafter set forth in this Agreement.
NOW, THEREFORE, in consideration of the premises and of the covenants and agreements hereinafter set forth, the parties hereto covenant and agree as follows:
1. Transfer of Assets of the Acquired Fund to the Acquiring Fund in Consideration For Acquiring Fund Shares, the Assumption of All Acquired Fund Liabilities and the Liquidation of the Acquired Fund
1.1 Subject to the terms and conditions herein set forth and on the basis of the representations and warranties contained herein, the Acquired Fund agrees to transfer to the Acquiring Fund all of the Acquired Fund’s assets as set forth in section 1.2, and the Acquiring Fund agrees in consideration therefor (i) to deliver to the Acquired Fund that number of full and fractional Class A Acquiring Fund Shares determined by dividing the value of the Acquired Fund’s assets net of any liabilities of the Acquired Fund with respect to Class A shares of the Acquired Fund, computed in the manner and as of the time and date set forth in section 2.1, by the net asset value of one Acquiring Fund Share of Class A, computed in the manner and as of the time and date set forth in section 2.2; and (ii) to assume all of the liabilities of the Acquired Fund, including, but not limited to, any deferred compensation to the Acquired Trust’s trustees. All Acquiring Fund Shares delivered to the Acquired Fund shall be delivered at net asset value without a sales load,
A-1
commission or other similar fee being imposed. Such transactions shall take place at the closing provided for in section 3.1 (the “Closing”).
1.2 The assets of the Acquired Fund to be acquired by the Acquiring Fund (the “Assets”) shall consist of all assets, including, without limitation, all cash, cash equivalents, securities, commodities and futures contracts and dividends or interest or other receivables that are owned by the Acquired Fund and any deferred or prepaid expenses shown on the unaudited statement of assets and liabilities of the Acquired Fund prepared as of the effective time of the Closing in accordance with accounting principles generally accepted in the United States of America (“GAAP”) applied consistently with those of the Acquired Fund’s most recent audited statement of assets and liabilities. The Assets shall constitute at least 90% of the fair market value of the net assets, and at least 70% of the fair market value of the gross assets, held by the Acquired Fund immediately before the Closing (excluding for these purposes assets used to pay the dividends and other distributions paid pursuant to section 1.4).
1.3 The Acquired Fund will endeavor, to the extent practicable, to discharge all of its liabilities and obligations that are accrued prior to the Closing Date.
1.4 On or as soon as practicable prior to the Closing Date, the Acquired Fund will declare and pay to its shareholders of record one or more dividends and/or other distributions so that it will have distributed substantially all of its investment company taxable income (computed without regard to any deduction for dividends paid) and realized net capital gain, if any, for the current taxable year through the Closing Date.
1.5 Immediately after the transfer of Assets provided for in section 1.1, the Acquired Fund will distribute to the Acquired Fund’s shareholders of record with respect to Class A shares (the “Acquired Fund Shareholders”), determined as of the Valuation Time (as defined in section 2.1), on a pro rata basis, Class A Acquiring Fund Shares received by the Acquired Fund pursuant to section 1.1 and will completely liquidate. Such distribution and liquidation will be accomplished with respect Class A shares of the Acquired Fund by the transfer of the Acquiring Fund Shares then credited to the account of the Acquired Fund on the books of the Acquiring Fund to open accounts on the share records of the Acquiring Fund in the names of the Acquired Fund Shareholders. The Acquiring Fund shall have no obligation to inquire as to the validity, propriety or correctness of such records, but shall assume that such transaction is valid, proper and correct. The aggregate net asset value of Class A Acquiring Fund Shares to be so credited to Class A Acquired Fund Shareholders shall, be equal to the aggregate net asset value of the Acquired Fund shares owned by such shareholders as of the Valuation Time. All issued and outstanding shares of the Acquired Fund will simultaneously be cancelled on the books of the Acquired Fund, although share certificates representing interests in Class A of the Acquired Fund will represent a number of Class A Acquiring Fund Shares after the Closing Date as determined in accordance with section 2.3. The Acquiring Fund will not issue certificates representing Acquiring Fund Shares.
1.6 Ownership of Acquiring Fund Shares will be shown on the books of the Acquiring Fund. Shares of the Acquiring Fund will be issued in the manner described in the Acquiring Fund’s then-current prospectus and statement of additional information for Class A shares.
A-2
1.7 Any reporting responsibility of the Acquired Fund including, without limitation, the responsibility for filing of regulatory reports, tax returns, or other documents with the Securities and Exchange Commission (the “Commission”), any state securities commission, and any federal, state or local tax authorities or any other relevant regulatory authority, is and shall remain the responsibility of the Acquired Fund.
1.8 All books and records of the Acquired Fund, including all books and records required to be maintained under the Investment Company Act of 1940, as amended (the “1940 Act”), and the rules and regulations thereunder, shall be available to the Acquiring Fund from and after the Closing Date and shall be turned over to the Acquiring Fund as soon as practicable following the Closing Date.
2. Valuation
2.1 The value of the Assets and the liabilities of the Acquired Fund shall be computed as of the close of regular trading on The New York Stock Exchange, Inc. (the “NYSE”) on the business day immediately preceding the Closing Date (the “Valuation Time”) after the declaration and payment of any dividends and/or other distributions on that date, using the valuation procedures set forth in the Acquiring Trust’s Amended and Restated Declaration of Trust, as amended, and the Acquiring Fund’s then-current prospectus or statement of additional information for Class A shares, copies of which have been delivered to the Acquired Fund.
2.2 The net asset value of a Class A Acquiring Fund Share shall be the net asset value per share computed with respect to that class as of the Valuation Time using the valuation procedures referred to in section 2.1.
2.3 The number of Class A Acquiring Fund Shares to be issued (including fractional shares, if any) in consideration for the Assets shall be determined by dividing the value of the Assets net of liabilities with respect to Class A shares of the Acquired Fund determined in accordance with section 2.1 by the net asset value of an Acquiring Fund Share of the same class determined in accordance with section 2.2.
2.4 All computations of value hereunder shall be made by or under the direction of each Fund’s respective accounting agent, if applicable, in accordance with its regular practice and the requirements of the 1940 Act and shall be subject to confirmation by each Fund’s respective Independent Registered Public Accounting Firm upon the reasonable request of the other Fund.
3. Closing and Closing Date
3.1 The Closing of the transactions contemplated by this Agreement shall be April 27, 2009, or such later date as the parties may agree in writing (the “Closing Date”). All acts taking place at the Closing shall be deemed to take place simultaneously as of 9:00 a.m., Eastern time, on the Closing Date, unless otherwise agreed to by the parties. The Closing shall be held at the offices of counsel to the Acquiring Fund, or at such other place and time as the parties may agree.
3.2 The Acquired Fund shall deliver to the Acquiring Fund on the Closing Date a schedule of Assets.
3.3 State Street Bank and Trust Company (“SSB”), custodian for the Acquired Fund, shall deliver at the Closing a certificate of an authorized officer stating that
A-3
(a) the Assets shall have been delivered in proper form to SSB, also the custodian for the Acquiring Fund, prior to or on the Closing Date and (b) all necessary taxes in connection with the delivery of the Assets, including all applicable federal and state stock transfer stamps, if any, have been paid or provision for payment has been made. The Acquired Fund’s portfolio securities represented by a certificate or other written instrument shall be presented by the custodian for the Acquired Fund to the custodian for the Acquiring Fund for examination no later than five business days preceding the Closing Date and transferred and delivered by the Acquired Fund as of the Closing Date by the Acquired Fund for the account of Acquiring Fund duly endorsed in proper form for transfer in such condition as to constitute good delivery thereof. The Acquired Fund’s portfolio securities and instruments deposited with a securities depository, as defined in Rule 17f-4 under the 1940 Act, shall be delivered as of the Closing Date by book entry in accordance with the customary practices of such depositories and the custodian for the Acquiring Fund. The cash to be transferred by the Acquired Fund shall be delivered by wire transfer of federal funds on the Closing Date.
3.4 DWS Investments Service Company (“DWS-ISC”), as transfer agent for the Acquired Trust, on behalf of the Acquired Fund, shall deliver at the Closing a certificate of an authorized officer stating that its records contain the names and addresses of the Acquired Fund Shareholders and the number and percentage ownership (to three decimal places) of outstanding Class A Acquired Fund shares owned by each such shareholder immediately prior to the Closing. The Acquiring Fund shall issue and deliver a confirmation evidencing the Acquiring Fund Shares to be credited on the Closing Date to the Acquired Fund or provide evidence satisfactory to the Acquired Fund that such Acquiring Fund Shares have been credited to the Acquired Fund’s account on the books of the Acquiring Fund. At the Closing, each party shall deliver to the other such bills of sale, checks, assignments, share certificates, if any, receipts or other documents as such other party or its counsel may reasonably request to effect the transactions contemplated by this Agreement.
3.5 In the event that immediately prior to the Valuation Time (a) the NYSE or another primary trading market for portfolio securities of the Acquiring Fund or the Acquired Fund shall be closed to trading or trading thereupon shall be restricted, or (b) trading or the reporting of trading on the NYSE or elsewhere shall be disrupted so that, in the judgment of the Board of Trustees of the Acquiring Trust or Board of Trustees of the Acquired Trust, as applicable (each a “Board”), accurate appraisal of the value of the net assets with respect to the Class A shares of the Acquiring Fund or the Acquired Fund is impracticable, the Closing Date shall be postponed until the first business day after the day when trading shall have been fully resumed and reporting shall have been restored.
3.6 The liabilities of the Acquired Fund shall include all of the Acquired Fund’s liabilities, debts, obligations, and duties of whatever kind or nature, whether absolute, accrued, contingent, or otherwise, whether or not arising in the ordinary course of business, whether or not determinable at the Closing Date, and whether or not specifically referred to in this Agreement including but not limited to any deferred compensation to the Acquired Fund’s trustees.
A-4
4. Representations and Warranties
4.1 The Acquired Trust, on behalf of the Acquired Fund, represents and warrants to the Acquiring Fund as follows:
(a) The Acquired Trust is a voluntary association with transferable shares commonly referred to as a Massachusetts business trust duly organized and validly existing under the laws of The Commonwealth of Massachusetts with power under the Acquired Trust’s Amended and Restated Declaration of Trust to own all of its properties and assets and to carry on its business as it is now being conducted and, subject to approval of Acquired Fund Shareholders, to carry out the Agreement. The Acquired Fund is a separate series of the Acquired Trust duly designated in accordance with the applicable provisions of the Acquired Trust’s Amended and Restated Declaration of Trust. The Acquired Trust and Acquired Fund are qualified to do business in all jurisdictions in which they are required to be so qualified, except jurisdictions in which the failure to so qualify would not have a material adverse effect on the Acquired Trust or Acquired Fund. The Acquired Fund has all material federal, state and local authorizations necessary to own all of the properties and assets and to carry on its business as now being conducted, except authorizations which the failure to so obtain would not have a material adverse effect on the Acquired Fund;
(b) The Acquired Trust is registered with the Commission as an open-end management investment company under the 1940 Act, and such registration is in full force and effect and the Acquired Fund is in compliance in all material respects with the 1940 Act and the rules and regulations thereunder;
(c) No consent, approval, authorization, or order of any court or governmental authority is required for the consummation by the Acquired Fund of the transactions contemplated herein, except such as have been obtained under the Securities Act of 1933, as amended (the “1933 Act”), the Securities Exchange Act of 1934, as amended (the “1934 Act”), and the 1940 Act and such as may be required by state securities laws;
(d) The Acquired Trust is not, and the execution, delivery and performance of this Agreement by the Acquired Trust, on behalf of the Acquired Fund, will not result (i) in violation of Massachusetts law or of the Acquired Trust’s Amended and Restated Declaration of Trust or By-Laws, (ii) in a violation or breach of, or constitute a default under, any material agreement, indenture, instrument, contract, lease or other undertaking to which the Acquired Fund is a party or by which it is bound, and the execution, delivery and performance of this Agreement by the Acquired Fund will not result in the acceleration of any obligation, or the imposition of any penalty, under any agreement, indenture, instrument, contract, lease, judgment or decree to which the Acquired Fund is a party or by which it is bound, or (iii) in the creation or imposition of any lien, charge or encumbrance on any property or assets of the Acquired Fund;
(e) No material litigation or administrative proceeding or investigation of or before any court or governmental body is presently pending or to the Acquired Fund’s knowledge threatened against the Acquired Fund or any properties or assets held by it. The Acquired Fund knows of no facts which might form the basis for the institution of such proceedings which would materially and adversely affect its business, other than as disclosed in the foregoing schedule, and is not a party to or subject to the provisions of any order, decree or judgment
A-5
of any court or governmental body which materially and adversely affects its business or its ability to consummate the transactions herein contemplated;
(f) The Statements of Assets and Liabilities, Operations, and Changes in Net Assets, the Financial Highlights, and the Investment Portfolio of the Acquired Fund at and for the fiscal year ended December 31, 2008, have been audited by Ernst & Young LLP, Independent Registered Public Accounting Firm, and are in accordance with GAAP consistently applied, and such statements (a copy of each of which has been furnished to the Acquiring Fund) present fairly, in all material respects, the financial position of the Acquired Fund as of such date in accordance with GAAP and there are no known contingent liabilities of the Acquired Fund required to be reflected on a statement of assets and liabilities (including the notes thereto) in accordance with GAAP as of such date not disclosed therein;
(g) Since December 31, 2008, there has not been any material adverse change in the Acquired Fund’s financial condition, assets, liabilities or business other than changes occurring in the ordinary course of business, or any incurrence by the Acquired Fund of indebtedness maturing more than one year from the date such indebtedness was incurred except as otherwise disclosed to and accepted in writing by the Acquiring Fund. For purposes of this subsection (g), a decline in net asset value per share of the Acquired Fund due to declines in market values of securities in the Acquired Fund’s portfolio, the discharge of Acquired Fund liabilities, or the redemption of Acquired Fund Shares by Acquired Fund Shareholders shall not constitute a material adverse change;
(h) At the date hereof and at the Closing Date, all federal and other tax returns and reports of the Acquired Fund required by law to have been filed by such dates (including any extensions) shall have been filed and are or will be correct in all material respects, and all federal and other taxes (shown as due or required to be shown as due on said returns and reports) shall have been paid or provision shall have been made for the payment thereof, and, to the best of the Acquired Fund’s knowledge, no such return is currently under audit and no assessment has been asserted with respect to such returns;
(i) For each taxable year of its operation (including the taxable year ending on the Closing Date), the Acquired Fund has met the requirements of Subchapter M of the Code for qualification as a regulated investment company and has elected to be treated as such, has been eligible to and has computed its federal income tax under Section 852 of the Code, and will have distributed all of its investment company taxable income (as determined without regard to any deduction for dividends paid by the Acquired Fund) and net capital gain (as such terms are defined in the Code) that has accrued through the Closing Date;
(j) For all taxable years and all applicable quarters of the Acquired Fund from the date of its inception, the assets of the Acquired Fund have been sufficiently diversified that each segregated asset account investing all its assets in the Acquired Fund was adequately diversified within the meaning of Section 817(h) of the Code.
(k) All issued and outstanding shares of the Acquired Fund (i) have been offered and sold in every state and the District of Columbia in compliance in all material respects with applicable registration requirements of the 1933 Act and state securities laws, (ii) are, and on the Closing Date will be, duly and validly
A-6
issued and outstanding, fully paid and non-assessable (recognizing that, under Massachusetts law, Acquired Fund Shareholders, under certain circumstances, could be held personally liable for the obligations of the Acquired Fund) and not subject to preemptive or dissenter’s rights, and (iii) will be held at the time of the Closing by the persons and in the amounts set forth in the records of DWS ISC, as provided in section 3.4. The Acquired Fund does not have outstanding any options, warrants or other rights to subscribe for or purchase any of the Acquired Fund Shares, nor is there outstanding any security convertible into any Acquired Fund Shares;
(l) At the Closing Date, the Acquired Fund will have good and marketable title to the Acquired Fund’s assets to be transferred to the Acquiring Fund pursuant to section 1.1 and full right, power, and authority to sell, assign, transfer and deliver such assets hereunder free of any liens or other encumbrances, except those liens or encumbrances as to which the Acquiring Fund has received notice at or prior to the Closing, and upon delivery and payment for such assets, the Acquiring Fund will acquire good and marketable title thereto, subject to no restrictions on the full transfer thereof, including such restrictions as might arise under the 1933 Act and the 1940 Act, except those restrictions as to which the Acquiring Fund has received notice and necessary documentation at or prior to the Closing;
(m) The execution, delivery and performance of this Agreement will have been duly authorized prior to the Closing Date by all necessary action on the part of the trustees of the Acquired Trust (including the determinations required by Rule 17a-8(a) under the 1940 Act), and, subject to the approval of the Acquired Fund Shareholders, this Agreement constitutes a valid and binding obligation of the Acquired Trust, on behalf of the Acquired Fund, enforceable in accordance with its terms, subject, as to enforcement, to bankruptcy, insolvency, fraudulent transfer, reorganization, moratorium and other laws relating to or affecting creditors’ rights and to general equity principles;
(n) The information to be furnished by the Acquired Fund for use in applications for orders, registration statements or proxy materials or for use in any other document filed or to be filed with any federal, state or local regulatory authority (including the Financial Industry Regulatory Authority (“FINRA”)), which may be necessary in connection with the transactions contemplated hereby, shall be accurate and complete in all material respects and shall comply in all material respects with federal securities and other laws and regulations applicable thereto;
(o) The current prospectuses and statement of additional information of the Acquired Fund conform in all material respects to the applicable requirements of the 1933 Act and the 1940 Act and the rules and regulations of the Commission thereunder and do not include any untrue statement of a material fact or omit to state any material fact required to be stated therein or necessary to make the statements therein, in light of the circumstances under which they were made, not materially misleading; and
(p) The Registration Statement referred to in section 5.7, insofar as it relates to the Acquired Fund, will, on the effective date of the Registration Statement and on the Closing Date, (i) comply in all material respects with the provisions and regulations of the 1933 Act, the 1934 Act and the 1940 Act, as applicable, and (ii) not contain any untrue statement of a material fact or omit to state a material
A-7
fact required to be stated therein or necessary to make the statements therein, in light of the circumstances under which such statements are made, not materially misleading; provided, however, that the representations and warranties in this section shall not apply to statements in or omissions from the Registration Statement made in reliance upon and in conformity with information that was furnished or should have been furnished by the Acquiring Fund for use therein.
4.2 The Acquiring Trust, on behalf of the Acquiring Fund, represents and warrants to the Acquired Fund as follows:
(a) The Acquiring Trust is a voluntary association with transferable shares commonly referred to as a Massachusetts business trust duly organized and validly existing under the laws of The Commonwealth of Massachusetts with power under the Acquiring Trust’s Amended and Restated Declaration of Trust, as amended, to own all of its properties and assets and to carry on its business as it is now being conducted and to carry out the Agreement. The Acquiring Fund is a separate series of the Acquiring Trust duly designated in accordance with the applicable provisions of the Acquiring Trust’s Amended and Restated Declaration of Trust. The Acquiring Trust and Acquiring Fund are qualified to do business in all jurisdictions in which they are required to be so qualified, except jurisdictions in which the failure to so qualify would not have a material adverse effect on the Acquiring Trust or Acquiring Fund. The Acquiring Fund has all material federal, state and local authorizations necessary to own all of the properties and assets and to carry on its business as now being conducted, except authorizations which the failure to so obtain would not have a material adverse effect on the Acquiring Fund;
(b) The Acquiring Trust is registered with the Commission as an open-end management investment company under the 1940 Act, and such registration is in full force and effect and the Acquiring Fund is in compliance in all material respects with the 1940 Act and the rules and regulations thereunder;
(c) No consent, approval, authorization, or order of any court or governmental authority is required for the consummation by the Acquiring Fund of the transactions contemplated herein, except such as have been obtained under the 1933 Act, the 1934 Act and the 1940 Act and such as may be required by state securities laws;
(d) The Acquiring Trust is not, and the execution, delivery and performance of this Agreement by the Acquiring Trust will not result (i) in violation of Massachusetts law or of the Acquiring Trust’s Amended and Restated Declaration of Trust, or By-Laws, (ii) in a violation or breach of, or constitute a default under, any material agreement, indenture, instrument, contract, lease or other undertaking to which the Acquiring Fund is a party or by which it is bound, and the execution, delivery and performance of this Agreement by the Acquiring Fund will not result in the acceleration of any obligation, or the imposition of any penalty, under any agreement, indenture, instrument, contract, lease, judgment or decree to which the Acquiring Fund is a party or by which it is bound, or (iii) in the creation or imposition of any lien, charge or encumbrance on any property or assets of the Acquiring Fund;
(e) No material litigation or administrative proceeding or investigation of or before any court or governmental body is presently pending or to its knowledge threatened against the Acquiring Fund or any properties or assets held by it. The
A-8
Acquiring Fund knows of no facts which might form the basis for the institution of such proceedings which would materially and adversely affect its business, and is not a party to or subject to the provisions of any order, decree or judgment of any court or governmental body which materially and adversely affects its business or its ability to consummate the transactions herein contemplated;
(f) The Statements of Assets and Liabilities, Operations, and Changes in Net Assets, the Financial Highlights, and the Investment Portfolio of the Acquiring Fund at and for the fiscal year ended December 31, 2008, have been audited by PricewaterhouseCoopers LLP, Independent Registered Public Accounting Firm, and are in accordance with GAAP consistently applied, and such statements (a copy of each of which has been furnished to the Acquired Fund) present fairly, in all material respects, the financial position of the Acquiring Fund as of such date in accordance with GAAP, and there are no known contingent liabilities of the Acquiring Fund required to be reflected on a statement of assets and liabilities (including the notes thereto) in accordance with GAAP as of such date not disclosed therein;
(g) Since December 31, 2008, there has not been any material adverse change in the Acquiring Fund’s financial condition, assets, liabilities or business other than changes occurring in the ordinary course of business, or any incurrence by the Acquiring Fund of indebtedness maturing more than one year from the date such indebtedness was incurred except as otherwise disclosed to and accepted in writing by the Acquired Fund. For purposes of this subsection (g), a decline in net asset value per share of the Acquiring Fund due to declines in market values of securities in the Acquiring Fund’s portfolio, the discharge of Acquiring Fund liabilities, or the redemption of Acquiring Fund shares by Acquiring Fund shareholders (the "Acquiring Fund Shareholders") shall not constitute a material adverse change;
(h) At the date hereof and at the Closing Date, all federal and other tax returns and reports of the Acquiring Fund required by law to have been filed by such dates (including any extensions) shall have been filed and are or will be correct in all material respects, and all federal and other taxes (shown as due or required to be shown as due on said returns and reports) shall have been paid or provision shall have been made for the payment thereof, and, to the best of the Acquiring Fund’s knowledge, no such return is currently under audit and no assessment has been asserted with respect to such returns;
(i) For each taxable year of its operation, the Acquiring Fund has met the requirements of Subchapter M of the Code for qualification as a regulated investment company and has elected to be treated as such, has been eligible to and has computed its federal income tax under Section 852 of the Code, and will do so for the taxable year including the Closing Date;
(j) For all taxable years and all applicable quarters of the Acquiring Fund from the date of its inception, the assets of the Acquiring Fund have been sufficiently diversified that each segregated asset account investing all its assets in the Acquiring Fund was adequately diversified within the meaning of Section 817(h) of the Code.
(k) All issued and outstanding shares of the Acquiring Fund (i) have been offered and sold in every state and the District of Columbia in compliance in all
A-9
material respects with applicable registration requirements of the 1933 Act and state securities laws and (ii) are, and on the Closing Date will be, duly and validly issued and outstanding, fully paid and non-assessable (recognizing that, under Massachusetts law, Acquiring Fund Shareholders, under certain circumstances, could be held personally liable for the obligations of the Acquiring Fund), and not subject to preemptive or dissenter’s rights. The Acquiring Fund does not have outstanding any options, warrants or other rights to subscribe for or purchase any of the Acquiring Fund Shares, nor is there outstanding any security convertible into any Acquiring Fund Shares;
(l) The Acquiring Fund Shares to be issued and delivered to the Acquired Fund, for the account of the Acquired Fund Shareholders, pursuant to the terms of this Agreement, will at the Closing Date have been duly authorized and, when so issued and delivered, will be duly and validly issued and outstanding Acquiring Fund Shares, and will be fully paid and non-assessable (recognizing that, under Massachusetts law, Acquiring Fund shareholders, under certain circumstances, could be held personally liable for the obligations of the Acquiring Fund);
(m) At the Closing Date, the Acquiring Fund will have good and marketable title to the Acquiring Fund’s assets, free of any liens or other encumbrances, except those liens or encumbrances as to which the Acquired Fund has received notice at or prior to the Closing;
(n) The execution, delivery and performance of this Agreement will have been duly authorized prior to the Closing Date by all necessary action on the part of the trustees of the Acquiring Trust (including the determinations required by Rule 17a-8(a) under the 1940 Act) and this Agreement will constitute a valid and binding obligation of the Acquiring Trust, on behalf of the Acquiring Fund, enforceable in accordance with its terms, subject, as to enforcement, to bankruptcy, insolvency, fraudulent transfer, reorganization, moratorium and other laws relating to or affecting creditors’ rights and to general equity principles;
(o) The information to be furnished by the Acquiring Fund for use in applications for orders, registration statements or proxy materials or for use in any other document filed or to be filed with any federal, state or local regulatory authority (including FINRA), which may be necessary in connection with the transactions contemplated hereby, shall be accurate and complete in all material respects and shall comply in all material respects with federal securities and other laws and regulations applicable thereto;
(p) The current prospectuses and statement of additional information with respect to Class A of the Acquiring Fund conform in all material respects to the applicable requirements of the 1933 Act and the 1940 Act and the rules and regulations of the Commission thereunder and do not include any untrue statement of a material fact or omit to state any material fact required to be stated therein or necessary to make the statements therein, in light of the circumstances under which they were made, not materially misleading;
(q) The Registration Statement, only insofar as it relates to the Acquiring Fund, will, on the effective date of the Registration Statement and on the Closing Date, (i) comply in all material respects with the provisions and regulations of the 1933 Act, the 1934 Act, and the 1940 Act and (ii) not contain any untrue
A-10
statement of a material fact or omit to state a material fact required to be stated therein or necessary to make the statements therein, in light of the circumstances under which such statements were made, not materially misleading; provided, however, that the representations and warranties in this section shall not apply to statements in or omissions from the Registration Statement made in reliance upon and in conformity with information that was furnished or should have been furnished by the Acquired Fund for use therein; and
(r) The Acquiring Fund agrees to use all reasonable efforts to obtain the approvals and authorizations required by the 1933 Act, the 1940 Act and such of the state securities laws as may be necessary in order to continue its operations after the Closing Date.
5. Covenants of the Acquiring Fund and the Acquired Fund
5.1 The Acquiring Fund and the Acquired Fund each covenants to operate its business in the ordinary course between the date hereof and the Closing Date, it being understood that such ordinary course of business will include the declaration and payment of customary dividends and other distributions and such changes as are contemplated by the Funds’ normal operations. No party shall take any action that would, or reasonably would be expected to, result in any of its representations and warranties set forth in this Agreement being or becoming untrue in any material respect. The Acquired Trust and Acquiring Trust covenant and agree to coordinate the respective portfolios of the Acquired Fund and Acquiring Fund from the date of the Agreement up to and including the Closing Date in order that at Closing, when the Assets are added to the Acquiring Fund’s portfolio, the resulting portfolio will meet the Acquiring Fund’s investment objective, policies, strategies and restrictions, as set forth in the Acquiring Fund’s prospectus for Class A, a copy of which has been delivered to the Acquired Fund.
5.2 Upon reasonable notice, the Acquiring Trust’s officers and agents shall have reasonable access to the Acquired Fund’s books and records necessary to maintain current knowledge of the Acquired Fund and to ensure that the representations and warranties made by the Acquired Fund are accurate.
5.3 The Acquired Fund covenants to call a meeting of the Acquired Fund Shareholders entitled to vote thereon to consider and act upon this Agreement and to take all other reasonable action necessary to obtain approval of the transactions contemplated herein. Such meeting shall be scheduled for no later than May 15, 2009.
5.4 The Acquired Fund covenants that the Acquiring Fund Shares to be issued hereunder are not being acquired for the purpose of making any distribution thereof other than in accordance with the terms of this Agreement.
5.5 The Acquired Fund covenants that it will assist the Acquiring Fund in obtaining such information as the Acquiring Fund reasonably requests concerning the beneficial ownership of the Acquired Fund shares.
5.6 Subject to the provisions of this Agreement, the Acquiring Fund and the Acquired Fund will each take, or cause to be taken, all actions, and do or cause to be done, all things reasonably necessary, proper, and/or advisable to consummate and make effective the transactions contemplated by this Agreement.
A-11
5.7 Each Fund covenants to prepare in compliance with the 1933 Act, the 1934 Act and the 1940 Act the Registration Statement on Form N-14 (the “Registration Statement”) in connection with the meeting of the Acquired Fund Shareholders to consider approval of this Agreement and the transactions contemplated herein. The Acquiring Trust will file the Registration Statement, including a proxy statement, with the Commission. The Acquired Fund will provide the Acquiring Fund with information reasonably necessary for the preparation of a prospectus, which will include a proxy statement, all to be included in the Registration Statement, in compliance in all material respects with the 1933 Act, the 1934 Act and the 1940 Act.
5.8 The Acquired Fund covenants that it will, from time to time, as and when reasonably requested by the Acquiring Fund, execute and deliver or cause to be executed and delivered all such assignments and other instruments, and will take or cause to be taken such further action as the Acquiring Fund may reasonably deem necessary or desirable in order to vest in and confirm the Acquiring Fund’s title to and possession of all the Assets and otherwise to carry out the intent and purpose of this Agreement.
5.9 The Acquiring Fund covenants to use all reasonable efforts to obtain the approvals and authorizations required by the 1933 Act and 1940 Act, and such of the state securities laws as it deems appropriate in order to continue its operations after the Closing Date and to consummate the transactions contemplated herein; provided, however, that the Acquiring Fund may take such actions it reasonably deems advisable after the Closing Date as circumstances change.
5.10 The Acquiring Fund covenants that it will, from time to time, as and when reasonably requested by the Acquired Fund, execute and deliver or cause to be executed and delivered all such assignments, assumption agreements, releases, and other instruments, and will take or cause to be taken such further action, as the Acquired Fund may reasonably deem necessary or desirable in order to (i) vest and confirm to the Acquired Fund title to and possession of all Acquiring Fund Shares to be transferred to the Acquired Fund pursuant to this Agreement and (ii) assume all of the liabilities of the Acquired Fund.
5.11 As soon as reasonably practicable after the Closing, the Acquired Fund shall make a liquidating distribution to its shareholders consisting of the Acquiring Fund Shares received at the Closing and will completely liquidate.
5.12 The Acquiring Fund and the Acquired Fund shall each use its reasonable best efforts to fulfill or obtain the fulfillment of the conditions precedent to effect the transactions contemplated by this Agreement as promptly as practicable.
5.13 The intention of the parties is that the transaction will qualify as a reorganization within the meaning of Section 368(a) of the Code. Neither the Trusts, the Acquiring Fund nor the Acquired Fund shall take any action, or cause any action to be taken (including, without limitation, the filing of any tax return) that is inconsistent with such treatment or results in the failure of the transaction to qualify as a reorganization within the meaning of Section 368(a) of the Code. At or prior to the Closing Date, the Trusts, the Acquiring Fund and the Acquired Fund will take such action, or cause such action to be taken, as is reasonably necessary to enable Willkie Farr & Gallagher LLP to render the tax opinion contemplated herein in section 8.5.
A-12
5.14 At or immediately prior to the Closing, the Acquired Fund will declare and pay to its shareholders a dividend or other distribution in an amount large enough so that it will have distributed its investment company taxable income (computed without regard to any deduction for dividends paid) and realized net capital gain, if any, for any taxable year of the Acquired Fund ending on or prior to the Closing Date, including the taxable year ending December 31, 2008.
5.15 The Acquiring Fund agrees to identify in writing prior to the Closing Date any assets of the Acquired Fund that it does not wish to acquire because they are not consistent with the current implementation of its investment objective, policies, restrictions or strategies of the Acquiring Fund, and the Acquired Fund agrees to dispose of such assets prior to the Closing Date. The Acquiring Fund agrees to identify in writing prior to the Closing Date any assets that it would like the Acquired Fund to purchase, consistent with the Acquiring Fund’s current implementation of its investment objective, policies, restrictions and strategies, and the Acquired Fund agrees to purchase such assets pursuant to the Acquiring Fund’s investment objective, policies, restrictions or strategies prior to the Closing Date. Notwithstanding the foregoing, nothing herein will require the Acquired Fund to dispose of or purchase any assets if, in the reasonable judgment of the Acquired Fund, such disposition or purchase would adversely affect the tax-free nature of the reorganization.
6. Conditions Precedent to Obligations of the Acquired Fund
The obligations of the Acquired Fund to consummate the transactions provided for herein shall be subject, at its election, to the performance by the Acquiring Fund of all the obligations to be performed by it hereunder on or before the Closing Date, and, in addition thereto, the following further conditions:
6.1 All representations and warranties of the Acquiring Trust, on behalf of the Acquiring Fund, contained in this Agreement shall be true and correct in all material respects as of the date hereof and, except as they may be affected by the transactions contemplated by this Agreement, as of the Closing Date, with the same force and effect as if made on and as of the Closing Date; and there shall be (i) no pending or threatened litigation brought by any person (other than the Acquired Fund, its adviser or any of their affiliates) against the Acquiring Fund or its investment adviser(s), Board members or officers arising out of this Agreement and (ii) no facts known to the Acquiring Fund which the Acquiring Fund reasonably believes might result in such litigation.
6.2 The Acquiring Fund shall have delivered to the Acquired Fund on the Closing Date a certificate executed in its name by the Acquiring Trust’s President, Treasurer or a Vice President, in a form reasonably satisfactory to the Acquired Trust, on behalf of the Acquired Fund, and dated as of the Closing Date, to the effect that the representations and warranties of the Acquiring Trust, on behalf of the Acquiring Fund made in this Agreement are true and correct on and as of the Closing Date, except as they may be affected by the transactions contemplated by this Agreement, and as to such other matters as the Acquired Fund shall reasonably request.
6.3 The Acquired Fund shall have received on the Closing Date an opinion of Ropes & Gray LLP, in a form reasonably satisfactory to the Acquired Fund, and dated as of the Closing Date, to the effect that:
A-13
(a) the Acquiring Trust is a validly existing voluntary association with transferable shares of beneficial interest under the laws of The Commonwealth of Massachusetts;
(b) the Acquiring Fund has the adequate power to carry on its business as presently conducted in accordance with the description thereof in the Acquiring Trust’s current registration statement under the 1940 Act;
(c) the Agreement has been duly authorized, executed and delivered by the Acquiring Trust, on behalf of the Acquiring Fund, and constitutes a valid and legally binding obligation of the Acquiring Trust, on behalf of the Acquiring Fund, enforceable in accordance with its terms, subject to bankruptcy, insolvency, fraudulent transfer, reorganization, moratorium and laws of general applicability relating to or affecting creditors’ rights and to general equity principles;
(d) the execution and delivery of the Agreement by the Acquiring Trust, on behalf of the Acquiring Fund, did not, and the issuance of Acquiring Fund Shares pursuant to the Agreement will not, violate the Acquiring Trust’s Amended and Restated Declaration of Trust, as amended, or By-laws, as amended; and
(e) to the knowledge of such counsel, and without any independent investigation, (i) the Acquiring Fund is not subject to any litigation or other proceedings that might have a materially adverse effect on the operations of the Acquiring Fund, (ii) the Acquiring Trust is registered as an investment company with the Commission and is not subject to any stop order, and (iii) all regulatory consents, authorizations, approvals or filings required to be obtained or made by the Acquiring Fund under the federal laws of the United States or the laws of The Commonwealth of Massachusetts for the issuance of Acquiring Fund Shares pursuant to the Agreement, have been obtained or made.
The delivery of such opinion is conditioned upon receipt by Ropes & Gray LLP of customary representations it shall reasonably request of each of the Trusts and will be subject to such firm’s customary opinion qualifications, assumptions and limitations.
6.4 The Acquiring Trust, on behalf of the Acquiring Fund, shall have performed all of the covenants and complied with all of the provisions required by this Agreement to be performed or complied with by the Acquiring Fund on or before the Closing Date.
7. Conditions Precedent to Obligations of the Acquiring Fund
The obligations of the Acquiring Fund to consummate the transactions provided for herein shall be subject, at its election, to the performance by the Acquired Trust, on behalf of the Acquired Fund of all of the obligations to be performed by it hereunder on or before the Closing Date and, in addition thereto, the following further conditions:
7.1 All representations and warranties of the Acquired Trust, on behalf of the Acquired Fund contained in this Agreement shall be true and correct in all material respects as of the date hereof and, except as they may be affected by the transactions contemplated by this Agreement, as of the Closing Date, with the same force and effect as if made on and as of the Closing Date; and there shall be (i) no pending or threatened litigation brought by any person (other than the Acquiring Fund, its adviser or any of their affiliates) against the Acquired Fund or its investment adviser, trustees or officers arising out of this Agreement and (ii) no facts known to the Acquired Fund which the Acquired Fund reasonably believes might result in such litigation.
A-14
7.2 The Acquired Trust, on behalf of the Acquired Fund, shall have delivered to the Acquiring Fund a statement of the Acquired Fund’s assets and liabilities as of the Closing Date, certified by the Treasurer of the Acquired Trust.
7.3 The Acquired Trust, on behalf of the Acquired Fund, shall have delivered to the Acquiring Fund on the Closing Date a certificate executed in its name by the Acquired Trust’s President, Treasurer or a Vice President, in a form reasonably satisfactory to the Acquiring Trust, on behalf of the Acquiring Fund, and dated as of the Closing Date, to the effect that the representations and warranties of the Acquired Trust with respect to the Acquired Fund made in this Agreement are true and correct on and as of the Closing Date, except as they may be affected by the transactions contemplated by this Agreement, and as to such other matters as the Acquiring Fund shall reasonably request.
7.4 The Acquiring Fund shall have received on the Closing Date an opinion of Vedder Price P.C., in a form reasonably satisfactory to the Acquiring Fund, and dated as of the Closing Date, to the effect that:
(a) the Acquired Trust is a validly existing voluntary association with transferable shares of beneficial interest under the laws of The Commonwealth of Massachusetts and is in good standing under the laws of that State;
(b) the Acquired Fund has the adequate power and authority to carry on its business as described in the Acquired Trust’s current registration statement under the 1940 Act;
(c) the Agreement has been duly authorized, executed and delivered by the Acquired Trust, on behalf of the Acquired Fund, and constitutes a valid and legally binding obligation of the Acquired Trust, on behalf of the Acquired Fund, enforceable in accordance with its terms;
(d) the execution and delivery of the Agreement by the Acquired Trust, on behalf of the Acquired Fund, did not, and the exchange of the Acquired Fund’s assets for Acquiring Fund Shares pursuant to the Agreement will not, violate the Acquired Trust’s Amended and Restated Declaration of Trust or By-laws; and
(e) to the knowledge of such counsel, and without any independent investigation, (i) the Acquired Fund is not subject to any litigation or other proceedings that might have a materially adverse effect on the operations of the Acquired Fund, (ii) the Acquired Trust is registered as an investment company under the 1940 Act and no stop order suspending the effectiveness of its registration statement has been issued under the 1933 Act and no order of suspension or revocation of registration pursuant to Section 8(e) of the 1940 Act has been issued, and (iii) all regulatory consents, authorizations, approvals or filings required to be obtained or made by the Acquired Fund under the federal laws of the United States or the laws of The Commonwealth of Massachusetts with respect to the exchange of the Acquired Fund’s assets for Acquiring Fund Shares pursuant to the Agreement have been obtained or made.
The delivery of such opinion is conditioned upon receipt by Vedder Price P.C. of customary representations it shall reasonably request of each of the Trusts and will be subject to such firm's customary opinion qualifications, assumptions and limitations.
A-15
7.5 The Acquired Trust, on behalf of the Acquired Fund, shall have performed all of the covenants and complied with all of the provisions required by this Agreement to be performed or complied with by the Acquired Fund on or before the Closing Date.
8. Further Conditions Precedent to Obligations of the Acquiring Fund and the Acquired Fund
If any of the conditions set forth below have not been met on or before the Closing Date with respect to the Acquired Fund or the Acquiring Fund, the other party to this Agreement shall, at its option, not be required to consummate the transactions contemplated by this Agreement:
8.1 This Agreement and the transactions contemplated herein shall have been approved by the requisite vote of the holders of the outstanding shares of the Acquired Fund in accordance with the provisions of the Acquired Trust’s Amended and Restated Declaration of Trust and By-Laws, applicable Massachusetts law and the 1940 Act, and certified copies of the resolutions evidencing such approval shall have been delivered to the Acquiring Fund. Notwithstanding anything herein to the contrary, neither the Acquiring Fund nor the Acquired Fund may waive the conditions set forth in this section 8.1.
8.2 On the Closing Date, no action, suit or other proceeding shall be pending or to its knowledge threatened before any court or governmental agency in which it is sought to restrain or prohibit, or obtain material damages or other relief in connection with, this Agreement or the transactions contemplated herein.
8.3 All consents of other parties and all other consents, orders and permits of federal, state and local regulatory authorities deemed necessary by the Acquiring Fund or the Acquired Fund to permit consummation, in all material respects, of the transactions contemplated hereby shall have been obtained, except where failure to obtain any such consent, order or permit would not involve a risk of a material adverse effect on the assets or properties of the Acquiring Fund or the Acquired Fund, provided that either party hereto may for itself waive any of such conditions.
8.4 The Registration Statement shall have become effective under the 1933 Act and no stop orders suspending the effectiveness thereof shall have been issued and, to the best knowledge of the parties hereto, no investigation or proceeding for that purpose shall have been instituted or be pending, threatened or contemplated under the 1933 Act.
8.5 The parties shall have received an opinion of Willkie Farr & Gallagher LLP addressed to each of the Acquiring Fund and the Acquired Fund, in a form reasonably satisfactory to each such party to this Agreement, substantially to the effect that, based upon certain facts, assumptions and representations of the parties, for federal income tax purposes: (i) the acquisition by the Acquiring Fund of all of the assets of the Acquired Fund solely in exchange for Acquiring Fund Shares and the assumption by the Acquiring Fund of all of the liabilities of the Acquired Fund, followed by the distribution by the Acquired Fund to its shareholders of Acquiring Fund Shares in complete liquidation of Acquired Fund, all pursuant to the Agreement, constitutes a reorganization within the meaning of Section 368(a) of the Code, and the Acquiring Fund and the Acquired Fund will each be a “party to a reorganization” within the meaning of Section 368(b) of the Code; (ii) under Sections 361 and 357(a) of the Code, the Acquired Fund will not recognize gain or
A-16
loss upon the transfer of its assets to the Acquiring Fund in exchange for Acquiring Fund Shares and the assumption of all of the Acquired Fund’s liabilities by the Acquiring Fund, and the Acquired Fund will not recognize gain or loss upon the distribution to its shareholders of the Acquiring Fund Shares in liquidation of the Acquired Fund; (iii) under Section 354 of the Code, Acquired Fund Shareholders will not recognize gain or loss on the receipt of Acquiring Fund Shares solely in exchange for their Acquired Fund shares; (iv) under Section 358 of the Code, the aggregate basis of the Acquiring Fund Shares received by each shareholder of Acquired Fund will be the same as the aggregate basis of the Acquired Fund shares exchanged therefor; (v) under Section 1223(1) of the Code, the holding period of the Acquiring Fund Shares received by each Acquired Fund Shareholder will include the holding period of Acquired Fund shares exchanged therefor, provided that the Acquired Fund shareholder held the Acquired Fund shares at the time of the reorganization as a capital asset; (vi) under Section 1032 of the Code, the Acquiring Fund will not recognize gain or loss upon the receipt of assets of the Acquired Fund in exchange for Acquiring Fund Shares and the assumption by the Acquiring Fund of all of the liabilities of the Acquired Fund; (vii) under Section 362(b) of the Code, the basis of the assets of the Acquired Fund transferred to the Acquiring Fund in the reorganization will be the same in the hands of Acquiring Fund as the basis of such assets in the hands of the Acquired Fund immediately prior to the transfer; and (viii) under Section 1223(2) of the Code, the holding periods of the assets of the Acquired Fund transferred to the Acquiring Fund in the reorganization in the hands of the Acquiring Fund will include the periods during which such assets were held by the Acquired Fund. The delivery of such opinion is conditioned upon receipt by Willkie Farr & Gallagher LLP of representations it shall reasonably request of each of the Trusts. Notwithstanding anything herein to the contrary, neither the Acquiring Fund nor the Acquired Fund may waive the condition set forth in this section 8.5.
9. Indemnification
9.1 The Acquiring Fund agrees to indemnify and hold harmless the Acquired Fund and each of the Acquired Trust’s trustees and officers from and against any and all losses, claims, damages, liabilities or expenses (including, without limitation, the payment of reasonable legal fees and reasonable costs of investigation) to which jointly and severally, the Acquired Trust or any of its trustees or officers may become subject, insofar as any such loss, claim, damage, liability or expense (or actions with respect thereto) arises out of or is based on any breach by the Acquiring Fund of any of its representations, warranties, covenants or agreements set forth in this Agreement.
9.2 The Acquired Fund agrees to indemnify and hold harmless the Acquiring Fund and each of the Acquiring Trust’s trustees and officers from and against any and all losses, claims, damages, liabilities or expenses (including, without limitation, the payment of reasonable legal fees and reasonable costs of investigation) to which jointly and severally, the Acquiring Trust or any of its trustees or officers may become subject, insofar as any such loss, claim, damage, liability or expense (or actions with respect thereto) arises out of or is based on any breach by the Acquired Fund of any of its representations, warranties, covenants or agreements set forth in this Agreement.
A-17
10. Fees and Expenses
10.1 The Acquiring Trust, on behalf of the Acquiring Fund, and the Acquired Trust, on behalf of the Acquired Fund, each represents and warrants to the other that it has no obligations to pay any brokers or finders fees in connection with the transactions provided for herein.
10.2 Except as provided herein, the Acquired Fund will bear all the expenses associated with the Reorganization, including, but not limited to, any transaction costs payable by the Acquired Fund in connection with the sale and purchase of assets as directed by the Acquiring Fund pursuant to Section 5.15 prior to the date of the Reorganization (“Pre-Reorganization Transaction Costs”). DIMA agrees to bear expenses incurred by the Acquired Fund in connection with the Reorganization, including Pre-Reorganization Transaction Costs, to the extent that such expenses exceed the estimated total one-year benefit of the Reorganization to the Acquired Fund, as calculated immediately prior to the Closing. Expenses will in any event be paid by the Fund directly incurring such expenses if and to the extent that the payment by the other Fund of such expenses would result in the disqualification of such Fund as a regulated investment company within the meaning of Section 851 of the Code.
11. Entire Agreement
The Acquiring Trust, on behalf of the Acquiring Fund, and the Acquired Trust, on behalf of the Acquired Fund, agree that neither party has made any representation, warranty or covenant not set forth herein and that this Agreement constitutes the entire agreement between the parties.
12. Termination
This Agreement may be terminated and the transactions contemplated hereby may be abandoned (i) by mutual agreement of the parties, or (ii) by either party if the Closing shall not have occurred on or before [ ], 2009, unless such date is extended by mutual agreement of the parties, or (iii) by either party if the other party shall have materially breached its obligations under this Agreement or made a material and intentional misrepresentation herein or in connection herewith. In the event of any such termination, this Agreement shall become void and there shall be no liability hereunder on the part of any party or their respective Board members or officers, except for any such material breach or intentional misrepresentation, as to each of which all remedies at law or in equity of the party adversely affected shall survive.
13. Amendments
This Agreement may be amended, modified or supplemented in such manner as may be mutually agreed upon in writing by any authorized officer of the Acquired Fund and any authorized officer of the Acquiring Fund; provided, however, that following the meeting of the Acquired Fund Shareholders called by the Acquired Fund pursuant to section 5.3 of this Agreement, no such amendment may have the effect of changing the provisions for determining the number of the Acquiring Fund Shares to be issued to the Acquired Fund Shareholders under this Agreement to the detriment of such shareholders without their further approval.
A-18
14. Notices
Any notice, report, statement or demand required or permitted by any provisions of this Agreement shall be in writing and shall be deemed duly given if delivered by hand (including by Federal Express or similar express courier) or transmitted by facsimile or three days after being mailed by prepaid registered or certified mail, return receipt requested, addressed to the Acquired Fund, 345 Park Avenue, New York, NY 10154, with a copy to Vedder Price P.C., 222 North LaSalle Street, Chicago, Illinois 60601, Attention: David A. Sturms, Esq., or to the Acquiring Fund, 345 Park Avenue, New York, NY 10154, with a copy to Ropes & Gray LLP, One International Place, Boston, Massachusetts, 02110-2624, Attention: John W. Gerstmayr, Esq. or to any other address that the Acquired Fund or the Acquiring Fund shall have last designated by notice to the other party.
15. Headings; Counterparts; Assignment; Limitation of Liability
15.1 The Article and section headings contained in this Agreement are for reference purposes only and shall not affect in any way the meaning or interpretation of this Agreement.
15.2 This Agreement may be executed in any number of counterparts, each of which shall be deemed an original.
15.3 This Agreement shall bind and inure to the benefit of the parties hereto and their respective successors and assigns, but no assignment or transfer hereof or of any rights or obligations hereunder shall be made by any party without the written consent of the other party. Nothing herein expressed or implied is intended or shall be construed to confer upon or give any person, firm or corporation, other than the parties hereto and the Acquiring Fund Shareholders and the Acquired Fund Shareholders and their respective successors and assigns, any rights or remedies under or by reason of this Agreement.
15.4 It is expressly agreed that the obligations of any Trust hereunder shall not be binding upon any of the trustees, shareholders, variable life insurance policy and variable annuity contract holders, nominees, officers, agents, or employees of such Trust or the Funds personally, but bind only the respective property of the Acquiring Fund or Acquired Fund, as applicable, as provided in such Trust’s Declaration of Trust. Moreover, no series of a Trust other than the Fund shall be responsible for the obligations of such Trust hereunder, and all persons shall look only to the assets of the applicable Fund to satisfy the obligations of any Trust hereunder. The execution and the delivery of this Agreement have been authorized by the Trusts’ trustees, on behalf of the Funds, and this Agreement has been signed by authorized officers of the Trusts acting as such, and neither such authorization by such trustees, nor such execution and delivery by such officers, shall be deemed to have been made by any of them individually or to impose any liability on any of them personally, but shall bind only the respective property of the applicable Fund, as provided in such Trust’s Declaration of Trust.
15.5 Notwithstanding anything to the contrary contained in this Agreement, the obligations, agreements, representations and warranties with respect to each Fund shall constitute the obligations, agreements, representations and warranties of that Fund only (the “Obligated Fund”), and in no event shall any other series of the Trusts or the assets of any such series be held liable with respect to the breach or other default by the Obligated Fund of its obligations, agreements, representations and warranties as set forth herein.
A-19
15.6 This Agreement shall be governed by, and construed and enforced in accordance with, the laws of The Commonwealth of Massachusetts, without regard to its principles of conflicts of laws.
IN WITNESS WHEREOF, each of the parties hereto has caused this Agreement to be executed by an authorized officer and its seal to be affixed thereto and attested by its Secretary or Assistant Secretary.
| | | | | | | | |
| Attest: | | | | DWS VARIABLE SERIES I, on behalf of DWS Capital Growth VIP |
| | | |
| | | | By: | | |
| Secretary | | | | Its: | | |
| | |
| Attest: | | | | DWS VARIABLE SERIES II, on behalf of DWS Janus Growth & Income VIP |
| | | |
| | | | By: | | |
| Secretary | | | | Its: | | |
| | | |
| AGREED TO AND ACKNOWLEDGED ONLY WITH RESPECT TO SECTION 10.2 HERETO | | | | | | |
| | | |
DEUTSCHE INVESTMENT MANAGEMENT AMERICAS INC. | | | | | | |
| | | | |
| By: | | | | | | | | |
| Its: | | | | | | | | |
| | | | |
| By: | | | | | | | | |
| Its: | | | | | | | | |
A-20
EXHIBIT B
FINANCIAL HIGHLIGHTS
DWS Capital Growth VIP Class A
| | | | | | | | | | | | | | | | | | | | |
| | | Years Ended December 31, | |
| | | 2008 | | | 2007 | | | 2006 | | | 2005 | | | 2004 | |
Selected Per Share Data | | | | | | | | | | | | | | | | | | | | |
Net asset value, beginning of period | | $ | 20.41 | | | $ | 18.24 | | | $ | 16.90 | | | $ | 15.67 | | | $ | 14.59 | |
Income (loss) from investment operations: | | | | | | | | | | | | | | | | | | | | |
Net investment income (loss)a | | | .16 | | | | .17 | d | | | .13 | c | | | .10 | | | | .14 | |
Net realized and unrealized gain (loss) | | | (6.83 | ) | | | 2.12 | | | | 1.31 | | | | 1.29 | | | | 1.02 | |
Total from investment operations | | | (6.67 | ) | | | 2.29 | | | | 1.44 | | | | 1.39 | | | | 1.16 | |
Less distributions from: | | | | | | | | | | | | | | | | | | | | |
Net investment income | | | (.19 | ) | | | (.12 | ) | | | (.10 | ) | | | (.16 | ) | | | (.08 | ) |
Net asset value, end of period | | $ | 13.55 | | | $ | 20.41 | | | $ | 18.24 | | | $ | 16.90 | | | $ | 15.67 | |
Total Return (%) | | | (32.98 | )b | | | 12.59 | b | | | 8.53 | b,c | | | 8.96 | b | | | 7.99 | |
| | | | | |
Ratios to Average Net Assets and Supplemental Data | | | | | | | | | | | | | | | | | | | | |
Net assets, end of period ($ millions) | | | 594 | | | | 1,058 | | | | 1,131 | | | | 1,031 | | | | 698 | |
Ratio of expenses before expense reductions (%) | | | .50 | | | | .53 | | | | .52 | | | | .50 | | | | .50 | |
Ratio of expenses after expense reductions (%) | | | .49 | | | | .52 | | | | .49 | | | | .49 | | | | .50 | |
Ratio of net investment income (loss) (%) | | | .89 | | | | .86 | d | | | .73 | c | | | .61 | | | | .98 | |
Portfolio turnover rate (%) | | | 21 | | | | 30 | | | | 16 | | | | 17 | | | | 15 | |
a | | Based on average shares outstanding during the period. |
b | | Total return would have been lower had certain expenses not been reduced. |
c | | Includes non-recurring income from the Advisor recorded as a result of an administrative proceeding regarding disclosure of brokerage allocation practices in connection with sales of DWS Funds. The non-recurring income resulted in an increase in net investment income of $0.007 per share and an increase in the ratio of net investment income of 0.04%. Excluding this non-recurring income, total return would have been 0.03% lower. |
d | | Net investment income per share and ratio of net investment income include non-recurring dividend income amounting to $0.03 per share and 0.17% of average daily net assets, respectively. |
B-1
JNS VIP-021009
| | |
| VOTING OPTIONS: |
| |
 | | VOTE ON THE INTERNET |
| | Log on to: |
| | www.proxy-direct.com |
| | Follow the on-screen instructions |
| | available 24 hours |
| |
 | | VOTE BY PHONE |
| | Call 1-866-241-6192 |
| | Follow the recorded instructions |
| | available 24 hours |
| |
 | | VOTE BY MAIL |
| | Vote, sign and date this Proxy Card and return in the postage-paid envelope |
| |
 | | VOTE IN PERSON |
| | Attend Shareholder Meeting |
| | 345 Park Avenue, 27th Floor |
| | New York, NY 10154 |
| | on April 13, 2009 |
Please detach at perforation before mailing.
| | | | |
 | | DWS JANUS GROWTH & INCOME VIP | | PROXY CARD |
| | DWS VARIABLE SERIES II | | |
| | PROXY FOR THE SPECIAL MEETING OF SHAREHOLDERS | | |
| | 345 Park Avenue, 27th Floor, New York, New York 10154 | | |
| 280 Oser Avenue | | 2:15 p.m., Eastern time, on April 13, 2009 | | |
| Hauppauge, NY 11788-3610 | | | | |
The undersigned hereby appoint(s) J. Christopher Jackson, John Millette and Rita Rubin, and each of them, with full power of substitution, as proxy or proxies of the undersigned to vote all shares of the Fund that the undersigned is entitled in any capacity to vote at the above-stated Special Meeting of Shareholders, and at any and all adjournments or postponements thereof (the “Special Meeting”), on the matter set forth in the Notice of a Special Meeting of Shareholders and on this Proxy Card, and, in their discretion, upon all matters incident to the conduct of the Special Meeting and upon such other matters as may properly be brought before the Special Meeting. This proxy revokes all prior proxies given by the undersigned.
All properly executed proxies will be voted as directed. If no instructions are indicated on a properly executed proxy, the proxy will be voted FOR approval of the Proposal. All ABSTAIN votes will be counted in determining the existence of a quorum at the Special Meeting. Receipt of the Notice of a Special Meeting of Shareholders and the related Proxy Statement is hereby acknowledged.
| | | | |
| VOTE VIA THE INTERNET: www.proxy-direct.com |
| VOTE VIA THE TELEPHONE: 1-866-241-6192 |
| | | | |
| | | | |
| Note: Joint owners should EACH sign. Please sign EXACTLY as your name(s) appears on this proxy card. When signing as attorney, trustee, executor, administrator, guardian or corporate officer, please give your FULL title as such. |
|
| Signature(s) (Title(s), if applicable) |
|
| Date JGI_19888_022409 |
Please detach at perforation before mailing.
THIS PROXY IS SOLICITED ON BEHALF OF THE BOARD OF TRUSTEES WITH RESPECT TO YOUR FUND. THE FOLLOWING MATTER IS PROPOSED BY YOUR FUND. THE BOARD OF TRUSTEES RECOMMENDS A VOTE FOR THE PROPOSAL.
| | |
| TO VOTE, MARK A BLOCK BELOW IN BLUE OR BLACK INK. Example: ¢ |
VOTE ON PROPOSAL:
| | | | | | |
| | | FOR | | AGAINST | | ABSTAIN |
1. Approving an Agreement and Plan of Reorganization and the transactions it contemplates, including the transfer of all the assets of DWS Janus Growth & Income VIP (“Janus Growth & Income”) to DWS Capital Growth VIP (“Capital Growth”), in exchange for shares of Capital Growth and the assumption by Capital Growth of all the liabilities of Janus Growth & Income, and the distribution of such shares, on a tax-free basis for federal income tax purposes, to the shareholders of Janus Growth & Income in complete liquidation and termination of Janus Growth & Income. | | ¨ | | ¨ | | ¨ |
UNLESS VOTING BY TELEPHONE OR INTERNET, PLEASE SIGN, DATE AND MAIL THIS PROXY CARD PROMPTLY USING THE ENCLOSED ENVELOPE.
NO POSTAGE REQUIRED.
JGI_19888_022409
DWS VARIABLE SERIES I
SUPPLEMENT TO THE CURRENTLY EFFECTIVE PROSPECTUSES OF THE LISTED PORTFOLIO:
----------
DWS Capital Growth VIP
The following information replaces information in "The Portfolio's Main
Investment Strategy" section of the portfolio's prospectuses:
The portfolio seeks to provide long-term growth of capital.
The portfolio normally invests at least 65% of total assets in equities, mainly
common stocks of US companies. Although the portfolio can invest in companies of
any size, it intends to invest primarily in companies whose market
capitalizations are similar in size to the companies in the Standard &
Poor's 500(R) Composite Stock Price Index (the "S&P 500 Index") or the
Russell 1000(R) Growth Index (as of December 31, 2008, the S&P 500 Index and
the Russell 1000(R) Growth Index had median market capitalizations of $6.4
billion and $3.3 billion, respectively). The portfolio may also invest in other
types of equity securities, such as preferred stocks or convertible securities.
In choosing stocks, the portfolio managers begin by utilizing a proprietary
quantitative model to rank stocks based on a number of factors including
valuation and profitability. The portfolio managers also apply fundamental
techniques to identify companies that display above-average earnings growth
compared to other companies and that have strong product lines, effective
management and leadership positions within core markets. The factors considered
and models used by the portfolio managers may change over time.
The portfolio managers will normally sell a stock when they believe its
potential risks have increased, its price is unlikely to go higher, its
fundamental factors have changed, other investments offer better opportunities
or in the course of adjusting the portfolio's emphasis on a given industry.
Please Retain This Supplement for Future Reference
[Logo]DWS
INVESTMENTS
Deutsche Bank Group
March 4, 2009
VS-3620
Page 1
<pre>
DWS VARIABLE SERIES I
SUPPLEMENT TO THE CURRENTLY EFFECTIVE PROSPECTUSES OF THE LISTED PORTFOLIO:
-----------------------
DWS Capital Growth VIP
The following information replaces information about the portfolio management
team in "The Portfolio Managers" section of the portfolio's prospectuses:
The following people handle the day-to-day management of the portfolio:
Owen Fitzpatrick, CFA
Managing Director of Deutsche Asset Management and Co-Lead Portfolio Manager
of the portfolio effective February 15, 2009.
o Joined Deutsche Asset Management and the portfolio in 2009.
o Prior to joining Deutsche Asset Management, he was Managing Director of
Deutsche Bank Private Wealth Management and served as head of U.S. Equity
Strategy and manager of the U.S. large cap core, value and growth
portfolios and member of the U.S. Investment Committee and head of the
Equity Strategy Group.
o Previous experience includes over 21 years of experience in trust and
investment management. Prior to joining Deutsche Bank in 1995, managed an
equity income fund, trust and advisory relationships for Princeton Bank &
Trust Company, where he was also responsible for research coverage of the
consumer cyclical sector. Previously served as a portfolio manager at
Manufacturer's Hanover Trust Company.
o BA and MBA, Fordham University.
Richard Shepley
Managing Director of Deutsche Asset Management and Co-Lead Portfolio Manager
of the portfolio.
o Joined Deutsche Asset Management in 1998 and the portfolio in 2007.
o Previous experience includes eight years of investment industry
experience as research analyst for global beverage and media sectors at
Newton Investment Management and assistant manager in corporate tax and
corporate insolvency department at PriceWaterhouse, London.
o MA, Oxford University.
Brendan O'Neill, CFA
Director of Deutsche Asset Management and Portfolio Manager of the portfolio.
o Joined Deutsche Asset Management in 2000 and the portfolio in 2009.
o Equity Research Analyst covering the financial services sector since
2001.
o Previously served as a member of the Large Cap Core Equity team.
o BA, Queens College, CUNY; MS, Zicklin School of Business, Baruch College.
Please Retain This Supplement for Future Reference
[DWS INVESTMENTS LOGO]
Deutsche Bank Group
January 9, 2009
VSDCGF-3600
SUPPLEMENT TO THE CURRENTLY EFFECTIVE PROSPECTUSES
OF EACH OF THE LISTED PORTFOLIOS:
================================================================================
DWS Investments VIT Funds
DWS Equity 500 Index VIP
DWS Small Cap Index VIP
================================================================================
DWS Variable Series I
DWS Bond VIP
DWS Capital Growth VIP
DWS Global Opportunities VIP
DWS Growth & Income VIP
DWS Health Care VIP
DWS International VIP
================================================================================
DWS Variable Series II
DWS Balanced VIP DWS International Select Equity VIP
DWS Blue Chip VIP DWS Janus Growth & Income VIP
DWS Conservative Allocation VIP DWS Large Cap Value VIP
DWS Core Fixed Income VIP DWS Mid Cap Growth VIP
DWS Davis Venture Value VIP DWS Moderate Allocation VIP
DWS Dreman High Return Equity VIP DWS Money Market VIP
DWS Dreman Small Mid Cap Value VIP DWS Small Cap Growth VIP
DWS Global Thematic VIP DWS Strategic Income VIP
DWS Government & Agency Securities VIP DWS Technology VIP
DWS Growth Allocation VIP DWS Turner Mid Cap Growth VIP
DWS High Income VIP
The following information replaces similar disclosure regarding the schedule for
posting portfolio holdings in the "Other Policies and Risks -- For more
information" section of each portfolio's prospectuses:
A complete list of each portfolio's portfolio holdings is posted as of the month
end on www.dws-investments.com on or about the 15th day of the following month.
More frequent postings of portfolio holdings may be made from time to time on
www.dws-investments.com.
Please Retain This Supplement for Future Reference
[Logo]DWS
INVESTMENTS
Deutsche Bank Group
October 27, 2008
VS-3614
MAY 1, 2008
PROSPECTUS
CLASS A
DWS VARIABLE SERIES I
DWS BOND VIP
DWS GROWTH & INCOME VIP
DWS CAPITAL GROWTH VIP
DWS GLOBAL OPPORTUNITIES VIP
DWS INTERNATIONAL VIP
DWS HEALTH CARE VIP
DWS INVESTMENTS VIT FUNDS
DWS EQUITY 500 INDEX VIP
DWS SMALL CAP INDEX VIP
This prospectus should be read in conjunction with the variable life insurance
or variable annuity contract prospectus and plan documents for tax-qualified
plans. These shares are available and are being marketed exclusively as a
pooled funding vehicle for life insurance companies writing all types of
variable life insurance policies and variable annuity contracts.
The Securities and Exchange Commission (SEC) does not approve or disapprove
these shares or determine whether the information in this prospectus is
truthful or complete. It is a criminal offense for anyone to inform you
otherwise.
ONE GLOBAL FORCE. ONE FOCUS. YOU. [DWS SCUDDER Logo]
Deutsche Bank Group
--------------------------------------------------------------------------------
TABLE OF CONTENTS
3 DWS Bond VIP
12 DWS Growth & Income VIP
19 DWS Capital Growth VIP
26 DWS Global Opportunities VIP
34 DWS International VIP
41 DWS Health Care VIP
48 DWS Equity 500 Index VIP
55 DWS Small Cap Index VIP
62 Other Policies and Risks
62 The Investment Advisor
63 Portfolio Subadvisors
YOUR INVESTMENT IN THE PORTFOLIOS
66 Buying and Selling Shares
69 How each Portfolio Calculates Share Price
69 Distributions
69 Taxes
HOW EACH PORTFOLIO WORKS
Each portfolio is designed to serve as an investment option for certain
variable annuity contracts, variable life insurance policies and tax-qualified
plans. Your investment in a portfolio is made in conjunction with one of these
contracts or policies. Each portfolio has its own investment objective and
strategy.
Remember that each portfolio is not a bank deposit. Each portfolio is not
insured or guaranteed by the Federal Deposit Insurance Corporation or any other
government agency. Share prices will go up and down and you could lose money by
investing.
Please read this prospectus in conjunction with the prospectus for your
variable life insurance policy or variable annuity contract or plan documents
for tax-qualified plans. HOW EACH PORTFOLIO WORKS
DWS BOND VIP
THE PORTFOLIO'S MAIN INVESTMENT STRATEGY
The portfolio seeks to maximize total return consistent with preservation of
capital and prudent investment management, by investing for both current income
and capital appreciation. Under normal circumstances, the portfolio invests at
least 80% of net assets, plus the amount of any borrowings for investment
purposes, in bonds of any maturity.
The portfolio primarily invests in US dollar-denominated investment grade fixed
income securities, including corporate bonds, US government and agency bonds
and mortgage- and asset-backed securities. A significant portion of the
portfolio's assets may also be allocated among foreign investment grade fixed
income securities, high yield bonds of US and foreign issuers (including high
yield bonds of issuers in countries with new or emerging securities markets),
or, to maintain liquidity, in cash or money market instruments.
The portfolio normally invests at least 65% of total assets in high grade US
bonds (those considered to be in the top three grades of credit quality). The
portfolio may invest up to 25% of its total assets in foreign investment grade
bonds (those considered to be in the top four grades of credit quality).
In addition, the portfolio may also invest up to 20% of total assets in
securities of US and foreign issuers that are below investment grade (rated as
low as the sixth credit grade, i.e., grade B, otherwise known as junk bonds),
including investment in US dollar or foreign currency denominated bonds of
issuers located in countries with new or emerging securities markets. The
portfolio considers an emerging securities market to be one where the sovereign
debt issued by the government in local currency terms is rated below investment
grade. Compared to investment grade bonds, junk bonds may pay higher yields,
have higher volatility and may have higher risk of default on payments of
interest or principal.
The portfolio may have exposure of up to 10% of total assets in foreign
currencies. Currency forward contracts are permitted for both non-hedging and
hedging purposes.
A team approach is employed to allocate the portfolio's assets among the
various asset classes. The asset allocation team meets formally on a monthly
basis to determine relative value across asset classes, drawing on input from
sector and market specialists. Once allocation targets for each broad
fixed-income sector are set, sector specialists consider the relative
attractiveness of potential investments in light of the distinct
characteristics of that particular asset class. Company research and
fundamental analysis are used to select securities within each asset class. The
techniques used by the sector specialists in evaluating each asset class
include those described below.
US INVESTMENT GRADE SECURITIES. In selecting these securities for investment,
the portfolio managers typically:
o assign a relative value to each bond, based on creditworthiness, cash flow
and price;
o determine the value of each issue by examining the issuer's credit quality,
debt structure, option value and liquidity risks. The portfolio managers
look to take advantage of any inefficiencies between this value and market
trading price;
o use credit analysis to determine the issuer's ability to fulfill its
contracts; and
o use a bottom-up approach which subordinates sector weightings to individual
bonds that the portfolio managers believe may add above-market value.
The portfolio managers generally sell these securities when they reach their
target price or when there is a negative change in their outlook relative to
the other securities held by the portfolio. Bonds may also be sold to
facilitate the purchase of an issue with more attractive risk/return
characteristics.
FOREIGN INVESTMENT GRADE SECURITIES AND EMERGING MARKETS HIGH YIELD SECURITIES.
In selecting these securities for investment, the portfolio managers follow a
bottom-up, relative value strategy. The portfolio managers look to purchase
foreign securities that they believe offer incremental value over US
Treasuries. The portfolio managers invest in a focused manner in those markets
that its relative value process has identified as being the most attractive.
The portfolio managers sell securities or exchanges currencies when they meet
their target price objectives or when the portfolio managers revise price
objectives downward. In selecting emerging market securities, the portfolio
managers also consider short-term factors such as market sentiment, capital
flows and new issue programs.
DWS VARIABLE SERIES I - DWS INVESTMENTS VIT FUNDS
CLASS A SHARES
DWS BOND VIP 3
HIGH YIELD SECURITIES (EXCLUDING EMERGING MARKET SOVEREIGN DEBT). In selecting
these securities for investment, the portfolio managers:
o analyze economic conditions for improving or undervalued sectors and
industries;
o use independent credit research and on-site management visits to evaluate
individual issuer's debt service, growth rate, and downgrade and upgrade
potential;
o assess new issues versus secondary market opportunities; and
o seek issues within industry sectors they believe has strong long-term
fundamentals and improving credits.
Factors that influence the portfolio managers' decision to sell a security
could include the realization of anticipated gains/target yield, deterioration
in a company's fundamentals (i.e., a repeated shortfall in revenues or cash
flow), or an unexpected development that, in the portfolio managers' opinion,
will diminish the company's competitive position or ability to generate
adequate cash flow.
SECURITIES LENDING. The portfolio may lend its investment securities in an
amount up to 33 1/3% of its total assets to approved institutional borrowers
who need to borrow securities in order to complete certain transactions.
Although major changes tend to be infrequent, the Board of Trustees could
change the portfolio's investment objective without seeking shareholder
approval. However, the Board will provide shareholders with at least 60 days'
notice prior to making any changes to the portfolio's 80% investment policy.
OTHER INVESTMENTS
Although not one of its principal investment strategies, the portfolio is
permitted, but not required, to use various types of derivatives (contracts
whose value is based on, for example, indexes, currencies or securities).
Derivatives may be used for hedging and for risk management or for non-hedging
purposes to seek to enhance potential gains. The portfolio may use derivatives
in circumstances where portfolio management believes they offer an economical
means of gaining exposure to a particular asset class or to keep cash on hand
to meet shareholder redemptions or other needs while maintaining exposure to
the market.
As a temporary defensive measure, the portfolio could shift up to 100% of
assets in cash and cash equivalents, US government securities, money market
instruments and high quality debt securities without equity features. This
measure could prevent losses, but, while engaged in a temporary defensive
position, the portfolio will not be pursuing its investment objective. However,
the portfolio managers may choose not to use these strategies for various
reasons, even in very volatile market conditions.
THE MAIN RISKS OF INVESTING IN THE PORTFOLIO
There are several risk factors that could hurt the portfolio's performance,
cause you to lose money or cause the portfolio's performance to trail that of
other investments.
INTEREST RATE RISK. Generally, fixed income securities will decrease in value
when interest rates rise. The longer the effective maturity of the portfolio's
securities, the more sensitive the portfolio will be to interest rate changes.
(As a general rule, a 1% rise in interest rates means a 1% fall in value for
every year of duration.) As interest rates decline, the issuers of securities
held by the portfolio may prepay principal earlier than scheduled, forcing the
portfolio to reinvest in lower-yielding securities. Prepayment may reduce the
portfolio's income. As interest rates increase, slower than expected principal
payments may extend the average life of fixed income securities. This will have
the effect of locking in a below-market interest rate, increasing the
portfolio's duration and reducing the value of such a security. Because the
portfolio may invest in mortgage-related securities, it is more vulnerable to
both of these risks.
CREDIT RISK. A portfolio purchasing bonds faces the risk that the
creditworthiness of an issuer may decline, causing the value of the bonds to
decline. In addition, an issuer may not be able to make timely payments on the
interest and/or principal on the bonds it has issued. Because the issuers of
high-yield bonds or junk bonds (bonds rated below the fourth highest category)
may be in uncertain financial health, the prices of these bonds may be more
vulnerable to bad economic news or even the expectation of bad news, than
investment-grade
DWS VARIABLE SERIES I - DWS INVESTMENTS VIT FUNDS
CLASS A SHARES
4 DWS BOND VIP
bonds. In some cases, bonds, particularly high-yield bonds, may decline in
credit quality or go into default. Because the portfolio may invest in
securities not paying current interest or in securities already in default,
these risks may be more pronounced.
MARKET RISK. Deteriorating market conditions might cause a general weakness in
the market that reduces the prices of securities in that market. Developments
in a particular class of bonds or the stock market could also adversely affect
the portfolio by reducing the relative attractiveness of bonds as an
investment. Also, to the extent that the portfolio emphasizes bonds from any
given industry, it could be hurt if that industry does not do well.
FOREIGN INVESTMENT RISK. Foreign investments involve certain special risks,
including:
o POLITICAL RISK. Some foreign governments have limited the outflow of profits
to investors abroad, imposed restrictions on the exchange or export of
foreign currency, extended diplomatic disputes to include trade and
financial relations, seized foreign investment and imposed higher taxes.
o INFORMATION RISK. Companies based in foreign markets are usually not subject
to accounting, auditing and financial reporting standards and practices as
stringent as those in the US. Therefore, their financial reports may present
an incomplete, untimely or misleading picture of a company, as compared to
the financial reports required in the US.
o LIQUIDITY RISK. Investments that trade less can be more difficult or more
costly to buy, or to sell, than more liquid or active investments. This
liquidity risk is a factor of the trading volume of a particular investment,
as well as the size and liquidity of the entire local market. On the whole,
foreign exchanges are smaller and less liquid than US exchanges. This can
make buying and selling certain investments more difficult and costly.
Relatively small transactions in some instances can have a
disproportionately large effect on the price and supply of securities. In
certain situations, it may become virtually impossible to sell an investment
in an orderly fashion at a price that approaches portfolio management's
estimate of its value. For the same reason, it may at times be difficult to
value the portfolio's foreign investments.
o REGULATORY RISK. There is generally less government regulation of foreign
markets, companies and securities dealers than in the US.
o CURRENCY RISK. The portfolio invests in securities denominated in foreign
currencies. Changes in exchange rates between foreign currencies and the US
dollar may affect the US dollar value of foreign securities or the income or
gain received on these securities.
o LIMITED LEGAL RECOURSE RISK. Legal remedies for investors may be more limited
than the legal remedies available in the US.
o TRADING PRACTICE RISK. Brokerage commissions and other fees are generally
higher for foreign investments than for US investments. The procedures and
rules governing foreign transactions and custody may also involve delays in
payment, delivery or recovery of money or investments.
o TAXES. Foreign withholding and certain other taxes may reduce the amount of
income available to distribute to shareholders of the portfolio. In
addition, special US tax considerations may apply to the portfolio's foreign
investments.
EMERGING MARKET RISK. All of the risks of investing in foreign securities are
increased in connection with investments in emerging markets securities. In
addition, profound social changes and business practices that depart from norms
in developed countries' economies have hindered the orderly growth of emerging
economies and their markets in the past and have caused instability. High
levels of debt tend to make emerging economies heavily reliant on foreign
capital and vulnerable to capital flight. Countries in emerging markets are
also more likely to experience high levels of inflation, deflation or currency
devaluation, which could also hurt their economies and securities markets. For
these and other reasons, investments in emerging markets are often considered
speculative.
DERIVATIVES RISK. Risks associated with derivatives include the risk that the
derivative is not well correlated with the security, index or currency to which
it relates; the risk that derivatives may result in losses or missed
opportunities; the risk that the portfolio will be unable to sell the
derivative because of an illiquid secondary market; the risk that a
counterparty is unwilling or unable to meet its obligation and the risk that
the derivative transaction could expose the portfolio to the effects of
leverage, which could increase the portfolio's exposure to the market and
magnify potential losses. There is no guarantee that derivatives, to the extent
employed, will
DWS VARIABLE SERIES I - DWS INVESTMENTS VIT FUNDS
CLASS A SHARES
DWS BOND VIP 5
have the intended effect, and their use could cause lower returns or even
losses to the portfolio. The use of derivatives by the portfolio to hedge risk
may reduce the opportunity for gain by offsetting the positive effect of
favorable price movements.
SECURITIES LENDING RISK. Any loss in the market price of securities loaned by
the portfolio that occurs during the term of the loan would be borne by the
portfolio and would adversely affect the portfolio's performance. Also, there
may be delays in recovery of securities loaned or even a loss of rights in the
collateral should the borrower of the securities fail financially while the
loan is outstanding. However, loans will be made only to borrowers selected by
the portfolio's delegate after a review of relevant facts and circumstances,
including the creditworthiness of the borrower.
PRICING RISK. At times, market conditions may make it difficult to value some
investments, and the portfolio may use certain valuation methodologies for some
of its investments, such as fair value pricing. Given the subjective nature of
such valuation methodologies, it is possible that the value determined for an
investment may be different than the value realized upon such investment's
sale. If the portfolio has valued its securities too highly, you may pay too
much for portfolio shares when you buy into the portfolio. If the portfolio has
underestimated the price of its securities, you may not receive the full market
value when you sell your portfolio shares.
Another factor that could affect performance is:
o portfolio management could be wrong in the analysis of industries, companies,
economic trends, the relative attractiveness of different securities or
other matters.
This portfolio is designed for investors who are looking for a relatively high
level of income and can accept a moderate level of risk to their investment.
PERFORMANCE - CLASS A
While a portfolio's past performance isn't necessarily a sign of how it will do
in the future, it can be valuable for an investor to know.
The bar chart shows how the returns for the portfolio's Class A shares have
varied from year to year, which may give some idea of risk. The table shows
average annual returns for the portfolio and comparable index information
(which, unlike the portfolio, does not have any fees or expenses). The
performance of both the portfolio and the comparable index information varies
over time. All figures assume reinvestment of dividends and distributions.
This information doesn't reflect charges and fees associated with the separate
account that invests in the portfolio or any variable life insurance policy or
variable annuity contract for which the portfolio is an investment option.
These charges and fees will reduce returns.
ANNUAL TOTAL RETURN (%) as of 12/31 each year - CLASS A
[BAR GRAPHIC APPEARS HERE]
6.57 -0.95 10.56 5.75 7.66 5.06 5.38 2.60 4.72 4.18
1998 1999 2000 2001 2002 2003 2004 2005 2006 2007
FOR THE PERIODS INCLUDED IN THE BAR CHART:
BEST QUARTER: 3.98%, Q4 2000 WORST QUARTER: -2.27%, Q2 2004
2008 TOTAL RETURN AS OF MARCH 31: -1.43%
DWS VARIABLE SERIES I - DWS INVESTMENTS VIT FUNDS
CLASS A SHARES
6 DWS BOND VIP
AVERAGE ANNUAL TOTAL RETURNS (%) as of 12/31/2007
1 YEAR 5 YEARS 10 YEARS
------ ------- --------
Portfolio - Class A 4.18 4.38 5.11
Lehman Brothers U.S. Aggregate Index 6.97 4.42 5.97
Total returns would have been lower if operating expenses hadn't been reduced.
LEHMAN BROTHERS U.S. AGGREGATE INDEX is an unmanaged market value-weighted
measure of Treasury issues, agency issues, corporate bond issues and mortgage
securities.
Current performance information may be higher or lower than the performance
data quoted above. For more recent performance information, contact your
participating insurance company.
HOW MUCH INVESTORS PAY
This table describes the fees and expenses that you may pay if you buy and hold
portfolio shares. The information in the table does not reflect charges and
fees associated with the separate account that invests in the portfolio or any
variable life insurance policy or variable annuity contract for which the
portfolio is an investment option. These charges and fees will increase
expenses.
FEE TABLE CLASS A
-------------------------------- -------
ANNUAL OPERATING EXPENSES,
deducted from portfolio assets
Management Fee 0.39%
Distribution/Service (12b-1) Fee None
Other Expenses1 0.18
TOTAL ANNUAL OPERATING EXPENSES2 0.57
1 "Other Expenses" are based on estimated amounts for the current fiscal
year. Actual expenses may be different. Includes a 0.10% administrative
services fee paid to the Advisor.
2 Through September 30, 2008, the Advisor has contractually agreed to waive
all or a portion of its management fee and reimburse or pay certain
operating expenses so that the total annual operating expenses of the
portfolio will not exceed 0.63% for Class A shares, excluding certain
expenses such as extraordinary expenses, taxes, brokerage and interest.
Although there can be no assurance that the current waiver/expense
reimbursement arrangement will be maintained beyond September 30, 2008,
the Advisor has committed to review the continuance of waiver/expense
reimbursement arrangements by September 30, 2008.
Based on the costs above, this example helps you compare the expenses of Class A
shares to those of other mutual funds. This example assumes the expenses above
remain the same. It also assumes that you invested $10,000, earned 5% annual
returns, reinvested all dividends and distributions and sold your shares at the
end of each period. This is only an example; actual expenses will be different.
EXAMPLE 1 YEAR 3 YEARS 5 YEARS 10 YEARS
-------------- ------ ------- ------- --------
Class A shares $58 $183 $318 $714
DWS VARIABLE SERIES I - DWS INVESTMENTS VIT FUNDS
CLASS A SHARES
DWS BOND VIP 7
THE PORTFOLIO MANAGERS
The portfolio's subadvisor is Aberdeen Asset Management, Inc. A team approach
is utilized with respect to the day-to-day management of the portfolio.
Portfolio decisions are made jointly by the senior members of the portfolio
management team. The following members of the portfolio management team handle
the day-to-day operations of the core bond, active fixed income and high yield
portions of the portfolio:
Gary W. Bartlett, CFA
Head of US Fixed Income and senior portfolio manager specializing in taxable
municipal, utility and government fixed income investments: Philadelphia.
o Joined Aberdeen Asset Management Inc. in 2005 and the portfolio in 2002.
o Formerly, Managing Director of Deutsche Asset Management; joined
Deutsche Asset Management in 1992 after nine years of experience as an
analyst and fixed income portfolio manager at PNC Financial and credit
analyst at First Pennsylvania Bank.
o BA from Bucknell University; MBA from Drexel University.
Warren S. Davis, III
Senior portfolio manager for mortgage- and asset-backed fixed income
investments: Philadelphia.
o Joined Aberdeen Asset Management Inc. in 2005 and the portfolio in 2002.
o Formerly, Managing Director of Deutsche Asset Management; joined
Deutsche Asset Management in 1995 after nine years of experience as a
trader, analyst and developer of analytical and risk management systems
for PaineWebber and Merrill Lynch.
o BS from Pennsylvania State University; MBA from Drexel University.
Thomas J. Flaherty
Senior portfolio manager for corporate and taxable municipal fixed income
investments: Philadelphia.
o Joined Aberdeen Asset Management Inc. in 2005 and the portfolio in 2002.
o Formerly, Managing Director of Deutsche Asset Management; joined
Deutsche Asset Management in 1995 after 10 years of fixed income
experience, including vice president for US taxable fixed income
securities at Prudential Securities.
o BA from SUNY Stony Brook.
J. Christopher Gagnier
Head of Core Plus Fixed Income product and senior portfolio manager for
corporate and commercial mortgages: Philadelphia.
o Joined Aberdeen Asset Management Inc. in 2005 and the portfolio in 2002.
o Formerly, Managing Director of Deutsche Asset Management; joined
Deutsche Asset Management in 1997 after 17 years of experience in fixed
income investments at PaineWebber and Continental Bank.
o BS from Wharton School of Business; MBA from University of Chicago.
Daniel R. Taylor, CFA
Senior portfolio manager for asset-backed and commercial mortgage fixed income
investments: Philadelphia.
o Joined Aberdeen Asset Management Inc. in 2005 and the portfolio in 2002.
o Formerly, Managing Director of Deutsche Asset Management; joined
Deutsche Asset Management in 1998 after six years of experience as fixed
income portfolio manager and senior credit analyst for CoreStates
Investment Advisors.
o BS from Villanova University.
Timothy C. Vile, CFA
Senior portfolio manager for Core Fixed Income and Global Aggregate Fixed
Income: Philadelphia.
o Joined Aberdeen Asset Management Inc. in 2005 and the portfolio in 2002.
o Formerly, Managing Director of Deutsche Asset Management; joined
Deutsche Asset Management in 1991 as member of Core Fixed Income; seconded
to the London office from January 1999 to June 2002 to design and develop
the firm's European Credit and Global Aggregate capabilities; before
joining Deutsche Asset Management, he had six years of experience that
included portfolio manager for fixed income portfolios at Equitable
Capital Management.
o BS from Susquehanna University.
William T. Lissenden
Portfolio manager for Core Fixed Income: Philadelphia.
o Joined Aberdeen Asset Management Inc. in 2005 and the portfolio in 2004.
o Formerly, Director of Deutsche Asset Management; joined Deutsche Asset
Management in 2002 after 31 years of experience, including fixed income
strategist and director of research at Conseco Capital Management,
director of fixed income research and product management at Prudential
Securities and national sales manager for fixed income securities at
Prudential Securities.
o BS from St. Peter's College; MBA from Baruch College.
DWS VARIABLE SERIES I - DWS INVESTMENTS VIT FUNDS
CLASS A SHARES
8 DWS BOND VIP
The portfolio's sub-subadvisor is Aberdeen Asset Management Investment Services
Limited. The following portfolio managers of the sub-subadvisor are responsible
for the day-to-day management of the foreign securities, foreign currencies and
related investments for the portfolio:
Brett Diment
Head of Emerging Markets and Co-Manager of the portfolio.
o Joined Aberdeen Asset Management in 2005 and the portfolio in 2002.
o Formerly, Managing Director of Deutsche Asset Management, joined Deutsche
Asset Management 1991. Head of Emerging Markets.
o BSc from London School of Economics.
Annette Fraser
Client Portfolio Manager and Co-Manager of the portfolio.
o Joined Aberdeen Asset Management and the portfolio in 2005.
o Formerly, Managing Director of Deutsche Asset Management; joined Deutsche
Asset Management in 1990.
o Portfolio Manager in the fixed income team for 10 years specializing in
the global fixed income product.
o MA from St. Andrews University.
Anthony Fletcher
Client Portfolio Manager and Co-Manager of the portfolio.
o Joined Aberdeen Asset Management and the portfolio in 2005.
o Formerly, Managing Director of Deutsche Asset Management; joined Deutsche
Asset Management in 1996 as a portfolio manager covering global and UK
fixed income products.
o Over 19 years investment industry experience, including serving as the
Head of global fixed income at the Saudi American Bank and as a fund
manager for the Industrial Bank of Japan.
o BSc Geology from University of London.
Nik Hart
Head of European Investment Grade and Co-Manager of the portfolio.
o Joined Aberdeen Asset Management and the portfolio in 2005.
o Formerly, Managing Director of Deutsche Asset Management; joined Deutsche
Asset Management in 1992.
o Head of European Investment Grade, analyst specializing in investing
credit and managing sterling portfolios.
o Joined the fund in 2002.
Stephen Ilott
Head of Fixed Income and Co-Manager of the portfolio.
o Joined Aberdeen Asset Management in 2005 as head of the fixed income
business globally.
o Joined the portfolio in 2004.
o Formerly, Managing Director of Deutsche Asset Management; joined Deutsche
Asset Management in 1998.
o Prior to 1998, managed global fixed income and currency portfolios on
behalf of central banks, corporations and pension funds at Robert Fleming
& Company from 1986 to 1997.
Ian Winship
Head of Global Interest Rates and Co-Manager of the portfolio.
o Joined Aberdeen Asset Management in 2005 and the portfolio in 2004.
o Formerly, Director of Deutsche Asset Management; joined Deutsche Asset
Management in 1999 as a member of the fixed income team.
o Previously had nine years of experience as a fixed income portfolio
manager at Scottish Amicable Investment Managers, Murray Johnstone, and
Hill Samuel Asset Managers.
o BA from University of Strathclyde.
Matthew Cobon
Head of Currency and Co-Manager of the portfolio.
o Joined Aberdeen Asset Management and the portfolio in 2005.
o Formerly, Director of Deutsche Asset Management; joined Deutsche Asset
Management in 2001 as a member of the fixed income currency desk.
o Previously had five years of experience at Citibank advising global fixed
income and currency fund managers on the active management of their
currency exposure.
o BA from Warwick University.
The portfolio's Statement of Additional Information provides additional
information about a portfolio manager's investments in the portfolio, a
description of the portfolio management compensation structure, and information
regarding other accounts managed.
DWS VARIABLE SERIES I - DWS INVESTMENTS VIT FUNDS
CLASS A SHARES
DWS BOND VIP 9
FINANCIAL HIGHLIGHTS
This table is designed to help you understand the portfolio's financial
performance. The figures in the first part of the table are for a single share.
The total return figures represent the percentage that an investor in the
portfolio would have earned (or lost), assuming all dividends and distributions
were reinvested. This information has been audited by PricewaterhouseCoopers
LLP, an independent registered public accounting firm, whose report, along with
the portfolio's financial statements, is included in the portfolio's annual
report (see "Shareholder reports" on the back cover).
The following table includes selected data for a share outstanding throughout
each period and other performance information derived from the financial
statements.
This information doesn't reflect charges and fees associated with the separate
account that invests in the portfolio or any variable life insurance policy or
variable annuity contract for which the portfolio is an investment option.
These charges and fees will reduce returns.
DWS BOND VIP - CLASS A
YEARS ENDED DECEMBER 31, 2007 2006 2005 2004 2003
------------------------------------------------ ------- ------- ------- ------- -------
SELECTED PER SHARE DATA
-------------------------------------------------------------------------------------------------------
NET ASSET VALUE, BEGINNING OF PERIOD $ 7.03 $ 6.99 $ 7.13 $ 7.04 $ 6.98
------------------------------------------------ ------- ------- ------- ------- -------
Income (loss) from investment operations:
Net investment income a .35 .33 .29 .29 .26
------------------------------------------------ ------- ------- ------- ------- -------
Net realized and unrealized gain (loss) (.06) (.01) (.10) .08 .09
------------------------------------------------ ------- ------- ------- ------- -------
TOTAL FROM INVESTMENT OPERATIONS .29 .32 .19 .37 .35
------------------------------------------------ ------- ------- ------- ------- -------
Less distributions from:
Net investment income (.34) (.27) (.26) (.28) (.29)
------------------------------------------------ ------- ------- ------- ------- -------
Net realized gains -- (.01) (.07) -- --
------------------------------------------------ ------- ------- ------- ------- -------
TOTAL DISTRIBUTIONS (.34) (.28) (.33) (.28) (.29)
------------------------------------------------ ------- ------- ------- ------- -------
NET ASSET VALUE, END OF PERIOD $ 6.98 $ 7.03 $ 6.99 $ 7.13 $ 7.04
------------------------------------------------ ------- ------- ------- ------- -------
Total Return (%) 4.18 4.72b 2.60 5.38 5.06
------------------------------------------------ ------- ------- ------- ------- -------
RATIOS TO AVERAGE NET ASSETS AND SUPPLEMENTAL DATA
-------------------------------------------------------------------------------------------------------
Net assets, end of period ($ millions) 229 218 209 177 176
------------------------------------------------ ------- ------- ------- ------- -------
Ratio of expenses before expense reductions(%) .61 .66 .68 .60 .58
------------------------------------------------ ------- ------- ------- ------- -------
Ratio of expenses after expense reductions(%) .61 .62 .68 .60 .58
------------------------------------------------ ------- ------- ------- ------- -------
Ratio of net investment income(%) 5.03 4.82 4.11 4.18 3.78
------------------------------------------------ ------- ------- ------- ------- -------
Portfolio turnover rate(%)c 176 179 187 223 242
------------------------------------------------ ------- ------- ------- ------- -------
a Based on average shares outstanding during the period.
b Total return would have been lower had certain expenses not been reduced.
c The portfolio turnover rate including mortgage dollar roll transactions was
185%, 186%, 197%, 245% and 286% for the years ended December 31, 2007,
December 31, 2006, December 31, 2005, December 31, 2004, and December 31,
2003, respectively.
DWS VARIABLE SERIES I - DWS INVESTMENTS VIT FUNDS
CLASS A SHARES
10 DWS BOND VIP
HYPOTHETICAL EXPENSE SUMMARY
Using the annual portfolio operating expense ratios presented in the fee tables
in the portfolio prospectus, the Hypothetical Expense Summary shows the
estimated fees and expenses, in actual dollars, that would be charged on a
hypothetical investment of $10,000 in the portfolio held for the next 10 years
and the impact of such fees and expenses on portfolio returns for each year and
cumulatively, assuming a 5% return for each year. The tables also assume that
all dividends and distributions are reinvested. The annual portfolio expense
ratios shown are net of any contractual fee waivers or expense reimbursements,
if any, for the period of the contractual commitment. Also, please note that if
you are investing through a third party provider, that provider may have fees
and expenses separate from those of the portfolio that are not reflected here.
Mutual fund fees and expenses fluctuate over time and actual expenses may be
higher or lower than those shown.
The Hypothetical Expense Summary should not be used or construed as an offer to
sell, a solicitation of an offer to buy or a recommendation or endorsement of
any specific mutual fund. You should carefully review the portfolio's
prospectus to consider the investment objectives, risks, expenses and charges
of the portfolio prior to investing.
DWS BOND VIP - CLASS A
INITIAL HYPOTHETICAL ASSUMED RATE
MAXIMUM INVESTMENT: OF RETURN:
SALES CHARGE: $10,000 5%
0.00% ------------------------------ ----------------------------
CUMULATIVE CUMULATIVE HYPOTHETICAL
RETURN BEFORE RETURN AFTER YEAR-END BALANCE ANNUAL
FEES AND ANNUAL FUND FEES AND AFTER FEES AND FEES AND
YEAR EXPENSES EXPENSE RATIOS EXPENSES EXPENSES EXPENSES
----- ------------- -------------- ------------ ---------------- --------
1 5.00% 0.57% 4.43% $10,443.00 $ 58.26
2 10.25% 0.57% 9.06% $10,905.62 $ 60.84
3 15.76% 0.57% 13.89% $11,388.74 $ 63.54
4 21.55% 0.57% 18.93% $11,893.27 $ 66.35
5 27.63% 0.57% 24.20% $12,420.14 $ 69.29
6 34.01% 0.57% 29.70% $12,970.35 $ 72.36
7 40.71% 0.57% 35.45% $13,544.94 $ 75.57
8 47.75% 0.57% 41.45% $14,144.98 $ 78.92
9 55.13% 0.57% 47.72% $14,771.60 $ 82.41
10 62.89% 0.57% 54.26% $15,425.98 $ 86.06
TOTAL $713.60
DWS VARIABLE SERIES I - DWS INVESTMENTS VIT FUNDS
CLASS A SHARES
DWS BOND VIP 11
DWS GROWTH & INCOME VIP
THE PORTFOLIO'S MAIN INVESTMENT STRATEGY
The portfolio seeks long-term growth of capital, current income and growth of
income. The portfolio invests at least 65% of total assets in equities, mainly
common stocks. Although the portfolio can invest in companies of any size and
from any country, it invests primarily in large US companies. The portfolio
managers may favor securities from different industries and companies at
different times.
The portfolio managers use quantitative stock techniques and fundamental equity
analysis to evaluate each company's stock price relative to the company's
earnings, operating trends, market outlook and other measures of performance
potential.
The portfolio managers will normally sell a stock when they believe its
fundamental factors have changed, other investments offer better opportunities
or in the course of adjusting the portfolio's emphasis on or within a given
industry.
SECURITIES LENDING. The portfolio may lend its investment securities in an
amount up to 33 1/3% of its total assets to approved institutional borrowers
who need to borrow securities in order to complete certain transactions.
Although major changes tend to be infrequent, the Board of Trustees could
change the portfolio's investment objective without seeking shareholder
approval.
OTHER INVESTMENTS
The portfolio is permitted, but not required, to use various types of
derivatives (contracts whose value is based on, for example, indexes,
currencies or securities). The portfolio may use derivatives in circumstances
where the portfolio managers believe they offer an economical means of gaining
exposure to a particular asset class or to keep cash on hand to meet
shareholder redemptions or other needs while maintaining exposure to the
market.
As a temporary defensive measure, the portfolio could shift up to 100% of
assets into investments such as money market securities. This measure could
prevent losses, but, while engaged in a temporary defensive position, the
portfolio will not be pursuing its investment objective. However, the portfolio
managers may choose not to use these strategies for various reasons, even in
very volatile market conditions.
THE MAIN RISKS OF INVESTING IN THE PORTFOLIO
There are several risk factors that could hurt the portfolio's performance,
cause you to lose money or cause the portfolio's performance to trail that of
other investments.
STOCK MARKET RISK. The portfolio is affected by how the stock market performs.
To the extent the portfolio invests in a particular capitalization or market
sector, the portfolio's performance may be proportionately affected by that
segment's general performance. When stock prices fall, you should expect the
value of your investment to fall as well. Because a stock represents ownership
in its issuer, stock prices can be hurt by poor management, shrinking product
demand and other business risks. These factors may affect single companies as
well as groups of companies. In addition, movements in financial markets may
adversely affect a stock's price, regardless of how well the company performs.
The market as a whole may not favor the types of investments the portfolio
makes, which could affect the portfolio's ability to sell them at an attractive
price.
GROWTH INVESTING RISK. Since growth stocks usually reinvest a large portion of
earnings in their own businesses, they may lack the dividends associated with
value stocks that might otherwise cushion their decline in a falling market.
Earnings disappointments in growth stocks often result in sharp price declines
because investors buy these stocks for their potential superior earnings
growth. Growth stocks may also be out of favor for certain periods in relation
to value stocks.
VALUE INVESTING RISK. At times, "value" investing may perform better than or
worse than other investment styles and the overall market. If portfolio
management overestimates the value or return potential of one or more common
stocks, the portfolio may underperform the general equity market. Value stocks
may also be out of favor for certain periods in relation to growth stocks.
DWS VARIABLE SERIES I - DWS INVESTMENTS VIT FUNDS
CLASS A SHARES
12 DWS GROWTH & INCOME VIP
INDUSTRY RISK. While the portfolio does not concentrate in any industry, to the
extent that the portfolio has exposure to a given industry or sector, any
factors affecting that industry or sector could affect the value of portfolio
securities. For example, manufacturers of consumer goods could be hurt by a
rise in unemployment or technology companies could be hurt by such factors as
market saturation, price competition and rapid obsolescence.
SECURITY SELECTION RISK. A risk that pervades all investing is the risk that
the securities in the portfolio's portfolio may decline in value.
DERIVATIVES RISK. Risks associated with derivatives include the risk that the
derivative is not well correlated with the security, index or currency to which
it relates; the risk that derivatives may result in losses or missed
opportunities; the risk that the portfolio will be unable to sell the
derivative because of an illiquid secondary market; the risk that a
counterparty is unwilling or unable to meet its obligation and the risk that
the derivative transaction could expose the portfolio to the effects of
leverage, which could increase the portfolio's exposure to the market and
magnify potential losses. There is no guarantee that derivatives, to the extent
employed, will have the intended effect, and their use could cause lower
returns or even losses to the portfolio. The use of derivatives by the
portfolio to hedge risk may reduce the opportunity for gain by offsetting the
positive effect of favorable price movements.
SECURITIES LENDING RISK. Any loss in the market price of securities loaned by
the portfolio that occurs during the term of the loan would be borne by the
portfolio and would adversely affect the portfolio's performance. Also, there
may be delays in recovery of securities loaned or even a loss of rights in the
collateral should the borrower of the securities fail financially while the
loan is outstanding. However, loans will be made only to borrowers selected by
the portfolio's delegate after a review of relevant facts and circumstances,
including the creditworthiness of the borrower.
PRICING RISK. At times, market conditions may make it difficult to value some
investments, and the portfolio may use certain valuation methodologies for some
of its investments, such as fair value pricing. Given the subjective nature of
such valuation methodologies, it is possible that the value determined for an
investment may be different than the value realized upon such investment's
sale. If the portfolio has valued its securities too highly, you may pay too
much for portfolio shares when you buy into the portfolio. If the portfolio has
underestimated the price of its securities, you may not receive the full market
value when you sell your portfolio shares.
Other factors that could affect performance include:
o portfolio management could be wrong in the analysis of industries, companies,
economic trends, the relative attractiveness of different securities or
other matters.
o foreign securities may be more volatile than their US counterparts, for
reasons such as currency fluctuations and political and economic
uncertainty.
This portfolio may make sense for investors interested in an equity fund with
an objective of providing long-term growth and some current income.
DWS VARIABLE SERIES I - DWS INVESTMENTS VIT FUNDS
CLASS A SHARES
DWS GROWTH & INCOME VIP 13
PERFORMANCE - CLASS A
While a portfolio's past performance isn't necessarily a sign of how it will do
in the future, it can be valuable for an investor to know.
The bar chart shows how the returns for the portfolio's Class A shares have
varied from year to year, which may give some idea of risk. The table shows
average annual returns for the portfolio and comparable index information
(which, unlike the portfolio, does not have any fees or expenses). The
performance of both the portfolio and the comparable index information varies
over time. All figures assume reinvestment of dividends and distributions.
This information doesn't reflect charges and fees associated with the separate
account that invests in the portfolio or any variable life insurance policy or
variable annuity contract for which the portfolio is an investment option.
These charges and fees will reduce returns.
ANNUAL TOTAL RETURN (%) as of 12/31 each year - CLASS A
[BAR GRAPHIC APPEARS HERE]
7.18 5.80 -2.10 -11.30 -23.13 26.74 10.16 6.07 13.63 1.36
1998 1999 2000 2001 2002 2003 2004 2005 2006 2007
FOR THE PERIODS INCLUDED IN THE BAR CHART:
BEST QUARTER: 12.85%, Q1 1998 WORST QUARTER: -16.73%, Q3 2002
2008 TOTAL RETURN AS OF MARCH 31: -10.64%
AVERAGE ANNUAL TOTAL RETURNS (%) as of 12/31/2007
1 YEAR 5 YEARS 10 YEARS
------ ------- --------
Portfolio - Class A 1.36 11.27 2.59
Russell 1000 (Reg. TM) Index 5.77 13.43 6.20
Standard & Poor's (S&P) 500 Index 5.49 12.83 5.91
Total returns would have been lower if operating expenses hadn't been reduced.
RUSSELL 1000 (Reg. TM) INDEX is an unmanaged price-only index of the 1,000
largest capitalized companies that are domiciled in the US and whose common
stocks are traded.
STANDARD & POOR'S 500 INDEX (S&P 500) is an unmanaged, capitalization-weighted
index of 500 stocks. The index is designed to measure performance of the broad
domestic economy through changes in the aggregate market value of 500 stocks
representing all major industries.
Current performance information may be higher or lower than the performance
data quoted above. For more recent performance information, contact your
participating insurance company.
DWS VARIABLE SERIES I - DWS INVESTMENTS VIT FUNDS
CLASS A SHARES
14 DWS GROWTH & INCOME VIP
HOW MUCH INVESTORS PAY
This table describes the fees and expenses that you may pay if you buy and hold
portfolio shares. The information in the table does not reflect charges and
fees associated with the separate account that invests in the portfolio or any
variable life insurance policy or variable annuity contract for which the
portfolio is an investment option. These charges and fees will increase
expenses.
FEE TABLE CLASS A
------------------------------------- -------
ANNUAL OPERATING EXPENSES,
deducted from portfolio assets
Management Fee 0.39%
Distribution/Service (12b-1) Fee None
Other Expenses1 0.15
TOTAL ANNUAL OPERATING EXPENSES 0.54
Less Fee Waiver/Expense Reimbursement 0.01
NET ANNUAL OPERATING EXPENSES2,3 0.53
1 "Other Expenses" are based on estimated amounts for the current fiscal
year. Actual expenses may be different. Includes a 0.10% administrative
services fee paid to the Advisor.
2 Through April 30, 2010, the Advisor has contractually agreed to waive all
or a portion of its management fee and reimburse or pay certain operating
expenses so that the total annual operating expenses of the portfolio will
not exceed 0.54% for Class A shares, excluding certain expenses such as
extraordinary expenses, taxes, brokerage and interest.
3 Additionally, the Advisor has contractually agreed to waive a portion of
its fees in the amount of 0.01% of average daily net assets until April
27, 2010.
Based on the costs above (including one year of capped expenses in the "1 Year"
period, and two years of capped expenses in the "3 Years," "5 Years" and "10
Years" periods), this example helps you compare the expenses of Class A shares
to those of other mutual funds. This example assumes the expenses above remain
the same. It also assumes that you invested $10,000, earned 5% annual returns,
reinvested all dividends and distributions and sold your shares at the end of
each period. This is only an example; actual expenses will be different.
EXAMPLE 1 YEAR 3 YEARS 5 YEARS 10 YEARS
-------------- ------ ------- ------- --------
Class A shares $54 $171 $300 $675
DWS VARIABLE SERIES I - DWS INVESTMENTS VIT FUNDS
CLASS A SHARES
DWS GROWTH & INCOME VIP 15
THE PORTFOLIO MANAGERS
The portfolio is managed by a team of investment professionals who collaborate
to implement the portfolio's investment strategy. Each portfolio manager on the
team has authority over all aspects of the portfolio's investment portfolio,
including but not limited to, purchases and sales of individual securities,
portfolio construction techniques, portfolio risk assessment and the management
of daily cash flows in accordance with portfolio holdings.
The following people handle the day-to-day management of the portfolio:
Robert Wang
Managing Director of Deutsche Asset Management and Portfolio Manager of the
portfolio.
o Joined Deutsche Asset Management in 1995 as portfolio manager for asset
allocation after 13 years of experience of trading fixed income, foreign
exchange and derivative products at J.P. Morgan.
o Global Head of Quantitative Strategies Portfolio Management: New York.
o Joined the portfolio in 2007.
o BS, The Wharton School, University of Pennsylvania.
Jin Chen, CFA
Director of Deutsche Asset Management and Portfolio Manager of the portfolio.
o Senior portfolio manager for Global Strategies: New York.
o Joined Deutsche Asset Management in 1999; prior to that, served as
portfolio manager for Absolute Return Strategies and as a fundamental
equity analyst and portfolio manager for Thomas White Asset Management.
o Joined the portfolio in 2007.
o BS, Nanjing University; MS, Michigan State University.
Julie Abbett
Director of Deutsche Asset Management and Portfolio Manager of the portfolio.
o Senior portfolio manager for Global Quantitative Equity: New York.
o Joined Deutsche Asset Management in 2000 after four years of combined
experience as a consultant with equity trading services for BARRA, Inc.
and a product developer for FactSet Research.
o Joined the portfolio in 2007.
o BA, University of Connecticut.
The portfolio's Statement of Additional Information provides additional
information about a portfolio manager's investments in the portfolio, a
description of the portfolio management compensation structure, and information
regarding other accounts managed.
DWS VARIABLE SERIES I - DWS INVESTMENTS VIT FUNDS
CLASS A SHARES
16 DWS GROWTH & INCOME VIP
FINANCIAL HIGHLIGHTS
This table is designed to help you understand the portfolio's financial
performance. The figures in the first part of the table are for a single share.
The total return figures represent the percentage that an investor in the
portfolio would have earned (or lost), assuming all dividends and distributions
were reinvested. This information has been audited by PricewaterhouseCoopers
LLP, an independent registered public accounting firm, whose report, along with
the portfolio's financial statements, is included in the portfolio's annual
report (see "Shareholder reports" on the back cover).
The following table includes selected data for a share outstanding throughout
each period and other performance information derived from the financial
statements.
This information doesn't reflect charges and fees associated with the separate
account that invests in the portfolio or any variable life insurance policy or
variable annuity contract for which the portfolio is an investment option.
These charges and fees will reduce returns.
DWS GROWTH & INCOME VIP - CLASS A
YEARS ENDED DECEMBER 31, 2007 2006 2005 2004 2003
---------------------------------------------- ------- ------- ------ ------ ------
SELECTED PER SHARE DATA
---------------------------------------------------------------------------------------------------
NET ASSET VALUE, BEGINNING OF PERIOD $ 10.94 $ 9.72 $ 9.29 $ 8.50 $ 6.77
---------------------------------------------- ------- ------- ------ ------ ------
Income (loss) from investment operations:
Net investment income (loss)a .13 .13c .10 .12 .07
---------------------------------------------- ------- ------- ------ ------ ------
Net realized and unrealized gain (loss) .02 1.19 .45 .74 1.74
---------------------------------------------- ------- ------- ------ ------ ------
TOTAL FROM INVESTMENT OPERATIONS .15 1.32 .55 .86 1.81
---------------------------------------------- ------- ------- ------ ------ ------
Less distributions from:
Net investment income ( .13) ( .10) ( .12) ( .07) ( .08)
---------------------------------------------- ------- ------- ------ ------ ------
Net realized gains ( .15) -- -- -- --
---------------------------------------------- ------- ------- ------ ------ ------
Total distributions ( .28) ( .10) ( .12) ( .07) ( .08)
---------------------------------------------- ------- ------- ------ ------ ------
NET ASSET VALUE, END OF PERIOD $ 10.81 $ 10.94 $ 9.72 $ 9.29 $ 8.50
---------------------------------------------- ------- ------- ------ ------ ------
Total Return (%) 1.36b 13.63b,c 6.07b 10.16 26.74
---------------------------------------------- ------- ------- ------ ------ ------
RATIOS TO AVERAGE NET ASSETS AND SUPPLEMENTAL DATA
---------------------------------------------------------------------------------------------------
Net assets, end of period ($ millions) 196 280 294 172 161
---------------------------------------------- ------- ------- ------ ------ ------
Ratio of expenses before expense reductions(%) .57 .56 .57 .56 .59
---------------------------------------------- ------- ------- ------ ------ ------
Ratio of expenses after expense reductions(%) .56 .54 .54 .56 .59
---------------------------------------------- ------- ------- ------ ------ ------
Ratio of net investment income(loss) (%) 1.18 1.24c 1.10 1.37 .91
---------------------------------------------- ------- ------- ------ ------ ------
Portfolio turnover rate(%) 310 105 115 33 37
---------------------------------------------- ------- ------- ------ ------ ------
a Based on average shares outstanding during the period.
b Total return would have been lower had certain expenses not been reduced.
c Includes non-recurring income from the Advisor recorded as a result of an
administrative proceeding regarding disclosure of brokerage allocation
practices in connection with sales of DWS Scudder Funds. The non-recurring
income resulted in an increase in net investment income of $0.007 per
share and an increase in the ratio of net investment income of 0.07%.
Excluding this non-recurring income, total return would have been 0.06%
lower.
DWS VARIABLE SERIES I - DWS INVESTMENTS VIT FUNDS
CLASS A SHARES
DWS GROWTH & INCOME VIP 17
HYPOTHETICAL EXPENSE SUMMARY
Using the annual portfolio operating expense ratios presented in the fee tables
in the portfolio prospectus, the Hypothetical Expense Summary shows the
estimated fees and expenses, in actual dollars, that would be charged on a
hypothetical investment of $10,000 in the portfolio held for the next 10 years
and the impact of such fees and expenses on portfolio returns for each year and
cumulatively, assuming a 5% return for each year. The tables also assume that
all dividends and distributions are reinvested. The annual portfolio expense
ratios shown are net of any contractual fee waivers or expense reimbursements,
if any, for the period of the contractual commitment. Also, please note that if
you are investing through a third party provider, that provider may have fees
and expenses separate from those of the portfolio that are not reflected here.
Mutual fund fees and expenses fluctuate over time and actual expenses may be
higher or lower than those shown.
The Hypothetical Expense Summary should not be used or construed as an offer to
sell, a solicitation of an offer to buy or a recommendation or endorsement of
any specific mutual fund. You should carefully review the portfolio's
prospectus to consider the investment objectives, risks, expenses and charges
of the portfolio prior to investing.
DWS GROWTH & INCOME VIP - CLASS A
INITIAL HYPOTHETICAL ASSUMED RATE
MAXIMUM INVESTMENT: OF RETURN:
SALES CHARGE: $10,000 5%
0.00% ----------------------------- ---------------------------
CUMULATIVE CUMULATIVE HYPOTHETICAL
RETURN BEFORE RETURN AFTER YEAR-END BALANCE ANNUAL
FEES AND ANNUAL FUND FEES AND AFTER FEES AND FEES AND
YEAR EXPENSES EXPENSE RATIOS EXPENSES EXPENSES EXPENSES
----- ------------- -------------- ------------ ---------------- --------
1 5.00% 0.53% 4.47% $10,447.00 $ 54.18
2 10.25% 0.53% 9.14% $10,913.98 $ 56.61
3 15.76% 0.54% 14.01% $11,400.74 $ 60.25
4 21.55% 0.54% 19.09% $11,909.22 $ 62.94
5 27.63% 0.54% 24.40% $12,995.21 $ 65.74
6 34.01% 0.54% 29.95% $12,995.21 $ 68.68
7 40.71% 0.54% 35.75% $13,574.80 $ 71.74
8 47.75% 0.54% 41.80% $14,180.23 $ 74.94
9 55.13% 0.54% 48.13% $14,812.67 $ 78.28
10 62.89% 0.54% 54.73% $15,473.31 $ 81.77
TOTAL $675.13
DWS VARIABLE SERIES I - DWS INVESTMENTS VIT FUNDS
CLASS A SHARES
18 DWS GROWTH & INCOME VIP
DWS CAPITAL GROWTH VIP
THE PORTFOLIO'S MAIN INVESTMENT STRATEGY
The portfolio seeks to provide long-term growth of capital.
The portfolio normally invests at least 65% of total assets in common stocks of
US companies. Although the portfolio can invest in companies of any size, it
intends to invest primarily in companies whose market capitalizations are
similar in size to those of the companies in the Standard & Poor's 500 (Reg.
TM) Composite Stock Price Index (the "S&P 500 Index") or the Russell 1000 (Reg.
TM) Growth Index (as of February 29, 2008, the S&P 500 Index and the Russell
1000 (Reg. TM) Growth Index had median market capitalizations of $10.81 billion
and $5.37 billion, respectively). The portfolio may also invest in other types
of equity securities, such as preferred stocks or convertible securities.
In choosing stocks, the portfolio managers look for individual companies that
have displayed above-average earnings growth compared to other growth companies
and that have strong product lines, effective management and leadership
positions within core markets. The portfolio managers also analyze each
company's valuation, stock price movements and other factors.
The portfolio managers will normally sell a stock when they believe its
potential risks have increased, its price is unlikely to go higher, its
fundamental factors have changed, other investments offer better opportunities
or in the course of adjusting the portfolio's emphasis on or within a given
industry.
SECURITIES LENDING. The portfolio may lend its investment securities in an
amount up to 33 1/3% of its total assets to approved institutional borrowers
who need to borrow securities in order to complete certain transactions.
Although major changes tend to be infrequent, the Board of Trustees could
change the portfolio's investment objective without seeking shareholder
approval.
OTHER INVESTMENTS
The portfolio is permitted, but not required, to use various types of
derivatives (contracts whose value is based on, for example, indices,
currencies or securities). Derivatives may be used for hedging and for risk
management or for non-hedging purposes to seek to enhance potential gains. The
portfolio may use derivatives in circumstances where portfolio management
believes they offer an economical means of gaining exposure to a particular
asset class or to keep cash on hand to meet shareholder redemptions or other
needs while maintaining exposure to the market. In particular, the portfolio
may use futures, options and covered call options.
As a temporary defensive measure, the portfolio could shift up to 100% of
assets in cash and cash equivalents, US government securities, money market
instruments and high quality debt securities without equity features. This
measure could prevent losses, but, while engaged in a temporary defensive
position, the portfolio will not be pursuing its investment objective. However,
the portfolio mangers may choose not to use these strategies for various
reasons, even in very volatile market conditions.
THE MAIN RISKS OF INVESTING IN THE PORTFOLIO
There are several risk factors that could hurt the portfolio's performance,
cause you to lose money or cause the portfolio's performance to trail that of
other investments.
STOCK MARKET RISK. The portfolio is affected by how the stock market performs.
To the extent the portfolio invests in a particular capitalization or market
sector, the portfolio's performance may be proportionately affected by that
segment's general performance. When stock prices fall, you should expect the
value of your investment to fall as well. Because a stock represents ownership
in its issuer, stock prices can be hurt by poor management, shrinking product
demand and other business risks. These factors may affect single companies as
well as groups of companies. In addition, movements in financial markets may
adversely affect a stock's price, regardless of how well the company performs.
The market as a whole may not favor the types of investments the portfolio
makes, which could affect the portfolio's ability to sell them at an attractive
price.
DWS VARIABLE SERIES I - DWS INVESTMENTS VIT FUNDS
CLASS A SHARES
DWS CAPITAL GROWTH VIP 19
GROWTH INVESTING RISK. Since growth stocks usually reinvest a large portion of
earnings in their own businesses, they may lack the dividends associated with
value stocks that might otherwise cushion their decline in a falling market.
Earnings disappointments in growth stocks often result in sharp price declines
because investors buy these stocks for their potential superior earnings
growth. Growth stocks may also be out of favor for certain periods in relation
to value stocks.
INDUSTRY RISK. While the portfolio does not concentrate in any industry, to the
extent that the portfolio has exposure to a given industry or sector, any
factors affecting that industry or sector could affect the value of portfolio
securities. For example, manufacturers of consumer goods could be hurt by a
rise in unemployment or technology companies could be hurt by such factors as
market saturation, price competition and rapid obsolescence.
SECURITY SELECTION RISK. A risk that pervades all investing is the risk that
the securities in the portfolio's portfolio may decline in value.
IPO RISK. Securities purchased in initial public offerings (IPOs) may be very
volatile, due to their stock prices rising and falling rapidly, often based,
among other reasons, on investor perceptions rather than economic reasons.
Additionally, investments in IPOs may magnify the portfolio's performance if it
has a small asset base. The portfolio is less likely to experience a similar
impact on its performance as its assets grow because it is unlikely that the
portfolio will obtain proportionately larger IPO allocations.
DERIVATIVES RISK. Risks associated with derivatives include the risk that the
derivative is not well correlated with the security, index or currency to which
it relates; the risk that derivatives may result in losses or missed
opportunities; the risk that the portfolio will be unable to sell the
derivative because of an illiquid secondary market; the risk that a
counterparty is unwilling or unable to meet its obligation and the risk that
the derivative transaction could expose the portfolio to the effects of
leverage, which could increase the portfolio's exposure to the market and
magnify potential losses. There is no guarantee that derivatives, to the extent
employed, will have the intended effect, and their use could cause lower
returns or even losses to the portfolio. The use of derivatives by the
portfolio to hedge risk may reduce the opportunity for gain by offsetting the
positive effect of favorable price movements.
SECURITIES LENDING RISK. Any loss in the market price of securities loaned by
the portfolio that occurs during the term of the loan would be borne by the
portfolio and would adversely affect the portfolio's performance. Also, there
may be delays in recovery of securities loaned or even a loss of rights in the
collateral should the borrower of the securities fail financially while the
loan is outstanding. However, loans will be made only to borrowers selected by
the portfolio's delegate after a review of relevant facts and circumstances,
including the creditworthiness of the borrower.
PRICING RISK. At times, market conditions may make it difficult to value some
investments, and the portfolio may use certain valuation methodologies for some
of its investments, such as fair value pricing. Given the subjective nature of
such valuation methodologies, it is possible that the value determined for an
investment may be different than the value realized upon such investment's
sale. If the portfolio has valued its securities too highly, you may pay too
much for portfolio shares when you buy into the portfolio. If the portfolio has
underestimated the price of its securities, you may not receive the full market
value when you sell your portfolio shares.
Other factors that could affect performance include:
o portfolio management could be wrong in the analysis of industries, companies,
economic trends, the relative attractiveness of different securities or
other matters.
o foreign securities may be more volatile than their US counterparts, for
reasons such as currency fluctuations and political and economic
uncertainty.
This portfolio may make sense for investors seeking long-term growth.
DWS VARIABLE SERIES I - DWS INVESTMENTS VIT FUNDS
CLASS A SHARES
20 DWS CAPITAL GROWTH VIP
PERFORMANCE - CLASS A
While a portfolio's past performance isn't necessarily a sign of how it will do
in the future, it can be valuable for an investor to know.
The bar chart shows how the returns for the portfolio's Class A shares have
varied from year to year, which may give some idea of risk. The table shows
average annual returns for the portfolio and comparable index information
(which, unlike the portfolio, does not have any fees or expenses). The
performance of both the portfolio and the comparable index information varies
over time. All figures assume reinvestment of dividends and distributions.
This information doesn't reflect charges and fees associated with the separate
account that invests in the portfolio or any variable life insurance policy or
variable annuity contract for which the portfolio is an investment option.
These charges and fees will reduce returns.
ANNUAL TOTAL RETURN (%) as of 12/31 each year - CLASS A
[BAR GRAPHIC APPEARS HERE]
23.23 35.23 -9.90 -19.36 -29.18 26.89 7.99 8.96 8.53 12.59
1998 1999 2000 2001 2002 2003 2004 2005 2006 2007
FOR THE PERIODS INCLUDED IN THE BAR CHART:
BEST QUARTER: 25.80%, Q4 1998 WORST QUARTER: -19.94%, Q3 2001
2008 TOTAL RETURN AS OF MARCH 31: -6.37%
AVERAGE ANNUAL TOTAL RETURNS (%) as of 12/31/2007
1 YEAR 5 YEARS 10 YEARS
------ ------- --------
Portfolio - Class A 12.59 12.78 4.58
Russell 1000 (Reg. TM) Growth Index 11.81 12.11 3.83
Standard & Poor's (S&P) 500 Index 5.49 12.83 5.91
Total returns would have been lower if operating expenses hadn't been reduced.
RUSSELL 1000 (Reg. TM) GROWTH INDEX is an unmanaged index that consists of
those stocks in the Russell 1000 (Reg. TM) Index that have higher price-to-book
ratios and higher forecasted growth values. Russell 1000 (Reg. TM) Index is an
unmanaged price-only index of the 1,000 largest capitalized companies that are
domiciled in the US and whose common stocks are traded.
STANDARD & POOR'S 500 INDEX (S&P 500) is an unmanaged, capitalization-weighted
index of 500 stocks. The index is designed to measure performance of the broad
domestic economy through changes in the aggregate market value of 500 stocks
representing all major industries.
Current performance information may be higher or lower than the performance
data quoted above. For more recent performance information, contact your
participating insurance company.
DWS VARIABLE SERIES I - DWS INVESTMENTS VIT FUNDS
CLASS A SHARES
DWS CAPITAL GROWTH VIP 21
HOW MUCH INVESTORS PAY
This table describes the fees and expenses that you may pay if you buy and hold
portfolio shares. The information in the table does not reflect charges and
fees associated with the separate account that invests in the portfolio or any
variable life insurance policy or variable annuity contract for which the
portfolio is an investment option. These charges and fees will increase
expenses.
FEE TABLE CLASS A
------------------------------------- -------
ANNUAL OPERATING EXPENSES,
deducted from portfolio assets
Management Fee 0.37%
Distribution/Service (12b-1) Fee None
Other Expenses1 0.13
TOTAL ANNUAL OPERATING EXPENSES 0.50
Less Fee Waiver/Expense Reimbursement 0.01
NET ANNUAL OPERATING EXPENSES2 0.49
1 "Other Expenses" are based on estimated amounts for the current fiscal
year. Actual expenses may be different. Includes a 0.10% administrative
services fee paid to the Advisor.
2 Through April 30, 2010, the Advisor has contractually agreed to waive all
or a portion of its management fee and reimburse or pay certain operating
expenses so that the total annual operating expenses of the portfolio will
not exceed 0.49% for Class A shares, excluding certain expenses such as
extraordinary expenses, taxes, brokerage and interest.
Based on the costs above (including one year of capped expenses in the "1 Year"
period and two years of capped expenses in the "3 Years," "5 Years" and "10
Years" periods), this example helps you compare the expenses of Class A shares
to those of other mutual funds. This example assumes the expenses above remain
the same. It also assumes that you invested $10,000, earned 5% annual returns,
reinvested all dividends and distributions and sold your shares at the end of
each period. This is only an example; actual expenses will be different.
EXAMPLE 1 YEAR 3 YEARS 5 YEARS 10 YEARS
-------------- ------ ------- ------- --------
Class A shares $50 $158 $278 $626
DWS VARIABLE SERIES I - DWS INVESTMENTS VIT FUNDS
CLASS A SHARES
22 DWS CAPITAL GROWTH VIP
THE PORTFOLIO MANAGERS
The portfolio is managed by a team of investment professionals who collaborate
to implement the portfolio's investment strategy. The team is led by a lead
portfolio manager who is responsible for developing the portfolio's investment
strategy. Each portfolio manager on the team has authority over all aspects of
the portfolio's investment portfolio, including but not limited to, purchases
and sales of individual securities, portfolio construction techniques,
portfolio risk assessment and the management of daily cash flows in accordance
with portfolio holdings.
The following people handle the day-to-day management of the portfolio:
Julie M. Van Cleave, CFA
Managing Director of Deutsche Asset Management and Lead Portfolio Manager of
the portfolio.
o Joined Deutsche Asset Management and the portfolio in 2002.
o Head of Large Cap Growth Portfolio Selection Team.
o Previous experience includes 18 years of investment industry experience
at Mason Street Advisors, most recently serving as Managing Director and
team leader for the large cap investment team.
o BBA, MBA, University of Wisconsin - Madison.
Jack A. Zehner
Director of Deutsche Asset Management and Portfolio Manager of the portfolio.
o Joined Deutsche Asset Management and the portfolio in 2002.
o Previous experience includes nine years of investment industry experience
at Mason Street Advisors where he served most recently as Director -
Common Stock.
o BBA, University of Wisconsin - Madison; MBA, Marquette University.
Richard Shepley
Managing Director of Deutsche Asset Management and Portfolio Manager of the
portfolio.
o Joined Deutsche Asset Management in 1998 and the portfolio in 2007.
o Previous experience includes eight years of investment industry
experience as a research analyst for global beverage and media sectors at
Newton Investment Management and assistant manager in the corporate tax
and corporate insolvency department at Price Waterhouse, London.
o MA, Oxford University.
The portfolio's Statement of Additional Information provides additional
information about a portfolio manager's investments in the portfolio, a
description of the portfolio management compensation structure, and information
regarding other accounts managed.
DWS VARIABLE SERIES I - DWS INVESTMENTS VIT FUNDS
CLASS A SHARES
DWS CAPITAL GROWTH VIP 23
FINANCIAL HIGHLIGHTS
This table is designed to help you understand the portfolio's financial
performance. The figures in the first part of the table are for a single share.
The total return figures represent the percentage that an investor in the
portfolio would have earned (or lost), assuming all dividends and distributions
were reinvested. This information has been audited by PricewaterhouseCoopers
LLP, an independent registered public accounting firm, whose report, along with
the portfolio's financial statements, is included in the portfolio's annual
report (see "Shareholder reports" on the back cover).
The following table includes selected data for a share outstanding throughout
each period and other performance information derived from the financial
statements.
This information doesn't reflect charges and fees associated with the separate
account that invests in the portfolio or any variable life insurance policy or
variable annuity contract for which the portfolio is an investment option.
These charges and fees will reduce returns.
DWS CAPITAL GROWTH VIP - CLASS A
YEARS ENDED DECEMBER 31, 2007 2006 2005 2004 2003
---------------------------------------------- ------- ------- ------- ------- -------
SELECTED PER SHARE DATA
--------------------------------------------------------------------------------------------------------
NET ASSET VALUE, BEGINNING OF PERIOD $ 18.24 $ 16.90 $ 15.67 $ 14.59 $ 11.54
---------------------------------------------- ------- ------- ------- ------- -------
Income (loss) from investment operations:
Net investment income (loss)a .17d .13c .10 .14 .08
---------------------------------------------- ------- ------- ------- ------- -------
Net realized and unrealized gain (loss) 2.12 1.31 1.29 1.02 3.03
---------------------------------------------- ------- ------- ------- ------- -------
TOTAL FROM INVESTMENT OPERATIONS 2.29 1.44 1.39 1.16 3.11
---------------------------------------------- ------- ------- ------- ------- -------
Less distributions from:
Net investment income ( .12) ( .10) ( .16) ( .08) ( .06)
---------------------------------------------- ------- ------- ------- ------- -------
NET ASSET VALUE, END OF PERIOD $ 20.41 $ 18.24 $ 16.90 $ 15.67 $ 14.59
---------------------------------------------- ------- ------- ------- ------- -------
Total Return (%) 12.59b 8.53b,c 8.96b 7.99 26.89
---------------------------------------------- ------- ------- ------- ------- -------
RATIOS TO AVERAGE NET ASSETS AND SUPPLEMENTAL DATA
--------------------------------------------------------------------------------------------------------
Net assets, end of period ($ millions) 1,058 1,131 1,031 698 705
---------------------------------------------- ------- ------- ------- ------- -------
Ratio of expenses before expense reductions(%) .53 .52 .50 .50 .51
---------------------------------------------- ------- ------- ------- ------- -------
Ratio of expenses after expense reductions(%) .52 .49 .49 .50 .51
---------------------------------------------- ------- ------- ------- ------- -------
Ratio of net investment income (loss)(%) .86d .73c .61 .98 .61
---------------------------------------------- ------- ------- ------- ------- -------
Portfolio turnover rate(%) 30 16 17 15 13
---------------------------------------------- ------- ------- ------- ------- -------
a Based on average shares outstanding during the period.
b Total return would have been lower had certain expenses not been reduced.
c Includes non-recurring income from the Advisor recorded as a result of an
administrative proceeding regarding disclosure of brokerage allocation
practices in connection with sales of DWS Scudder Funds. The non-recurring
income resulted in an increase in net investment income of $0.007 per
share and an increase in the ratio of net investment income of 0.04%.
Excluding this non-recurring income, total return would have been 0.03%
lower.
d Net investment income per share and ratio of net investment income include
non-recurring dividend income amounting to $0.03 per share and 0.17% of
average daily assets, respectively.
DWS VARIABLE SERIES I - DWS INVESTMENTS VIT FUNDS
CLASS A SHARES
24 DWS CAPITAL GROWTH VIP
HYPOTHETICAL EXPENSE SUMMARY
Using the annual portfolio operating expense ratios presented in the fee tables
in the portfolio prospectus, the Hypothetical Expense Summary shows the
estimated fees and expenses, in actual dollars, that would be charged on a
hypothetical investment of $10,000 in the portfolio held for the next 10 years
and the impact of such fees and expenses on portfolio returns for each year and
cumulatively, assuming a 5% return for each year. The tables also assume that
all dividends and distributions are reinvested. The annual portfolio expense
ratios shown are net of any contractual fee waivers or expense reimbursements,
if any, for the period of the contractual commitment. Also, please note that if
you are investing through a third party provider, that provider may have fees
and expenses separate from those of the portfolio that are not reflected here.
Mutual fund fees and expenses fluctuate over time and actual expenses may be
higher or lower than those shown.
The Hypothetical Expense Summary should not be used or construed as an offer to
sell, a solicitation of an offer to buy or a recommendation or endorsement of
any specific mutual fund. You should carefully review the portfolio's
prospectus to consider the investment objectives, risks, expenses and charges
of the portfolio prior to investing.
DWS CAPITAL GROWTH VIP - CLASS A
INITIAL HYPOTHETICAL ASSUMED RATE
MAXIMUM INVESTMENT: OF RETURN:
SALES CHARGE: $10,000 5%
0.00% ------------------------------ ----------------------------
CUMULATIVE CUMULATIVE HYPOTHETICAL
RETURN BEFORE RETURN AFTER YEAR-END BALANCE ANNUAL
FEES AND ANNUAL FUND FEES AND AFTER FEES AND FEES AND
YEAR EXPENSES EXPENSE RATIOS EXPENSES EXPENSES EXPENSES
----- ------------- -------------- ------------ ---------------- --------
1 5.00% 0.49% 4.51% $10,451.00 $ 50.10
2 10.25% 0.49% 9.22% $10,922.34 $ 52.36
3 15.76% 0.50% 14.14% $11,413.85 $ 55.84
4 21.55% 0.50% 19.27% $11,927.47 $ 58.35
5 27.63% 0.50% 24.64% $12,464.20 $ 60.98
6 34.01% 0.50% 30.25% $13,025.09 $ 63.72
7 40.71% 0.50% 36.11% $13,611.22 $ 66.59
8 47.75% 0.50% 42.24% $14,223.73 $ 69.59
9 55.13% 0.50% 48.64% $14,863.80 $ 72.72
10 62.89% 0.50% 55.33% $15,532.67 $ 75.99
TOTAL $626.24
DWS VARIABLE SERIES I - DWS INVESTMENTS VIT FUNDS
CLASS A SHARES
DWS CAPITAL GROWTH VIP 25
DWS GLOBAL OPPORTUNITIES VIP
THE PORTFOLIO'S MAIN INVESTMENT STRATEGY
The portfolio seeks above-average capital appreciation over the long term.
The portfolio invests at least 65% of total assets in common stocks and other
equities of small companies throughout the world (companies with market values
similar to the smallest 20% of the S&P/Citigroup Extended Market Index -
World). While the portfolio may invest in securities in any country, it
generally focuses on countries with developed economies (including the US). As
of March 31, 2008, companies in which the portfolio invests typically have a
market capitalization of between $500 million and $5 billion at the time of
purchase. As part of the investment process (and low turnover strategy) the
portfolio may own stocks even though they exceed the market capitalization
upper range.
The portfolio may invest up to 35% of total assets in common stocks and other
equities of large companies or in debt securities (of which 5% of net assets
may be junk bonds, i.e., grade BB/Ba and below). Compared to investment-grade
bonds, junk bonds may pay higher yields, have higher volatility and a higher
risk of default. The portfolio's equity investments are mainly common stocks,
but may also include other types of equities such as preferred or convertible
stocks. In particular, the portfolio may use futures, options and yield curve
options. To the extent the portfolio invests in foreign securities, the
portfolio may enter into forward currency exchange contracts and buy and sell
currency options to hedge against currency exchange rate fluctuations.
In choosing securities, the portfolio managers use a combination of three
analytical disciplines:
BOTTOM-UP RESEARCH. The portfolio managers look for individual companies with a
history of above-average growth, strong competitive positioning, attractive
prices relative to potential growth, sound financial strength and effective
management, among other factors.
GROWTH ORIENTATION. The portfolio managers generally look for companies that
they believe have above-average potential for sustainable growth of revenue or
earnings and whose market value appears reasonable in light of their business
prospects.
ANALYSIS OF GLOBAL THEMES. The portfolio managers consider global economic
outlooks, seeking to identify industries and companies that are likely to
benefit from social, political and economic changes.
The portfolio managers will normally sell a stock when they believe its price
is unlikely to go much higher, its fundamentals have deteriorated, other
investments offer better opportunities or in the course of adjusting the
portfolio's exposure to a given country.
SECURITIES LENDING. The portfolio may lend its investment securities in an
amount up to 33 1/3% of its total assets to approved institutional borrowers
who need to borrow securities in order to complete certain transactions.
Although major changes tend to be infrequent, the Board of Trustees could
change the portfolio's investment objective without seeking shareholder
approval.
OTHER INVESTMENTS
The portfolio is permitted, but not required, to use various types of
derivatives (contracts whose value is based on, for example, indicies,
currencies or securities). Derivatives may be used for hedging and for risk
management or for non-hedging purposes to seek to enhance potential gains. The
portfolio may use derivatives in circumstances where portfolio management
believes they offer an economical means of gaining exposure to a particular
asset class or to keep cash on hand to meet shareholder redemptions or other
needs while maintaining exposure to the market.
As a temporary defensive measure, the portfolio could shift up to 100% of
assets into investments such as money market securities. This measure could
prevent losses, but, while engaged in a temporary defensive position, the
portfolio will not be pursuing its investment objective. However, the portfolio
managers may choose not to use these strategies for various reasons, even in
very volatile market conditions.
DWS VARIABLE SERIES I - DWS INVESTMENTS VIT FUNDS
CLASS A SHARES
26 DWS GLOBAL OPPORTUNITIES VIP
THE MAIN RISKS OF INVESTING IN THE PORTFOLIO
There are several risk factors that could hurt the portfolio's performance,
cause you to lose money or cause the portfolio's performance to trail that of
other investments.
STOCK MARKET RISK. An important factor with the portfolio is how the stock
markets perform - in this case US and foreign stock markets. When US and
foreign stock prices fall, you should expect the value of your investment to
fall as well. Compared to large company stocks, small company stocks tend to be
more volatile, in part because these companies tend to be less established and
the valuation of their stocks often depends on future expectations. Because a
stock represents ownership in its issuer, stock prices can be hurt by poor
management, shrinking product demand and other business risks. These risk
factors may affect single companies as well as groups of companies. In
addition, movements in financial markets may adversely affect a stock's price,
regardless of how well the company performs. The market as a whole may not
favor the types of investments the portfolio makes and the portfolio may not be
able to get attractive prices for them.
FOREIGN INVESTMENT RISK. Foreign investments involve certain special risks,
including:
o POLITICAL RISK. Some foreign governments have limited the outflow of profits
to investors abroad, imposed restrictions on the exchange or export of
foreign currency, extended diplomatic disputes to include trade and
financial relations, seized foreign investment and imposed higher taxes.
o INFORMATION RISK. Companies based in foreign markets are usually not subject
to accounting, auditing and financial reporting standards and practices as
stringent as those in the US. Therefore, their financial reports may present
an incomplete, untimely or misleading picture of a company, as compared to
the financial reports required in the US.
o LIQUIDITY RISK. Investments that trade less can be more difficult or more
costly to buy, or to sell, than more liquid or active investments. This
liquidity risk is a factor of the trading volume of a particular investment,
as well as the size and liquidity of the entire local market. On the whole,
foreign exchanges are smaller and less liquid than US exchanges. This can
make buying and selling certain investments more difficult and costly.
Relatively small transactions in some instances can have a
disproportionately large effect on the price and supply of securities. In
certain situations, it may become virtually impossible to sell an investment
in an orderly fashion at a price that approaches portfolio management's
estimate of its value. For the same reason, it may at times be difficult to
value the portfolio's foreign investments.
o REGULATORY RISK. There is generally less government regulation of foreign
markets, companies and securities dealers than in the US.
o CURRENCY RISK. The portfolio invests in securities denominated in foreign
currencies. Changes in exchange rates between foreign currencies and the US
dollar may affect the US dollar value of foreign securities or the income or
gain received on these securities.
o LIMITED LEGAL RECOURSE RISK. Legal remedies for investors may be more limited
than the legal remedies available in the US.
o TRADING PRACTICE RISK. Brokerage commissions and other fees are generally
higher for foreign investments than for US investments. The procedures and
rules governing foreign transactions and custody may also involve delays in
payment, delivery or recovery of money or investments.
o TAXES. Foreign withholding and certain other taxes may reduce the amount of
income available to distribute to shareholders of the portfolio. In
addition, special US tax considerations may apply to the portfolio's foreign
investments.
EMERGING MARKET RISK. All of the risks of investing in foreign securities are
increased in connection with investments in emerging markets securities. In
addition, profound social changes and business practices that depart from norms
in developed countries' economies have hindered the orderly growth of emerging
economies and their markets in the past and have caused instability. High
levels of debt tend to make emerging economies heavily reliant on foreign
capital and vulnerable to capital flight. Countries in emerging markets are
also more likely to experience high levels of inflation, deflation or currency
devaluation, which could also hurt their economies and securities markets. For
these and other reasons, investments in emerging markets are often considered
speculative.
DWS VARIABLE SERIES I - DWS INVESTMENTS VIT FUNDS
CLASS A SHARES
DWS GLOBAL OPPORTUNITIES VIP 27
SMALL COMPANY CAPITALIZATION RISK. Small company stocks tend to experience
steeper price fluctuations than the stocks of larger companies. A shortage of
reliable information can also pose added risk to small company stocks.
Industry-wide reversals may have a greater impact on small companies, since
they lack the financial resources of large companies. Small company stocks are
typically less liquid than large company stocks. Accordingly, it may be harder
to find buyers for small company shares.
PRICING RISK. At times, market conditions may make it difficult to value some
investments, and the portfolio may use certain valuation methodologies for some
of its investments, such as fair value pricing. Given the subjective nature of
such valuation methodologies, it is possible that the value determined for an
investment may be different than the value realized upon such investment's
sale. If the portfolio has valued its securities too highly, you may pay too
much for portfolio shares when you buy into the portfolio. If the portfolio has
underestimated the price of its securities, you may not receive the full market
value when you sell your portfolio shares.
SECURITY SELECTION RISK. A risk that pervades all investing is the risk that
the securities in the portfolio's portfolio may decline in value.
IPO RISK. Securities purchased in initial public offerings (IPOs) may be very
volatile, due to their stock prices rising and falling rapidly, often based,
among other reasons, on investor perceptions rather than economic reasons.
Additionally, investments in IPOs may magnify the portfolio's performance if it
has a small asset base. The portfolio is less likely to experience a similar
impact on its performance as its assets grow because it is unlikely that the
portfolio will obtain proportionately larger IPO allocations.
DERIVATIVES RISK. Risks associated with derivatives include the risk that the
derivative is not well correlated with the security, index or currency to which
it relates; the risk that derivatives may result in losses or missed
opportunities; the risk that the portfolio will be unable to sell the
derivative because of an illiquid secondary market; the risk that a
counterparty is unwilling or unable to meet its obligation and the risk that
the derivative transaction could expose the portfolio to the effects of
leverage, which could increase the portfolio's exposure to the market and
magnify potential losses. There is no guarantee that derivatives, to the extent
employed, will have the intended effect, and their use could cause lower
returns or even losses to the portfolio. The use of derivatives by the
portfolio to hedge risk may reduce the opportunity for gain by offsetting the
positive effect of favorable price movements.
SECURITIES LENDING RISK. Any loss in the market price of securities loaned by
the portfolio that occurs during the term of the loan would be borne by the
portfolio and would adversely affect the portfolio's performance. Also, there
may be delays in recovery of securities loaned or even a loss of rights in the
collateral should the borrower of the securities fail financially while the
loan is outstanding. However, loans will be made only to borrowers selected by
the portfolio's delegate after a review of relevant facts and circumstances,
including the creditworthiness of the borrower.
Other factors that could affect performance include:
o portfolio management could be wrong in the analysis of industries, companies,
economic trends, the relative attractiveness of different securities or
other matters.
o growth stocks may be out of favor for certain periods.
o a bond could fall in credit quality, go into default, or decrease in value
for various reasons, including a change in prevailing interest rates; this
risk is greater with junk bonds and foreign bonds.
This portfolio may interest long-term investors interested in diversifying a
large-cap or domestic portfolio of investments.
DWS VARIABLE SERIES I - DWS INVESTMENTS VIT FUNDS
CLASS A SHARES
28 DWS GLOBAL OPPORTUNITIES VIP
PERFORMANCE - CLASS A
While a portfolio's past performance isn't necessarily a sign of how it will do
in the future, it can be valuable for an investor to know.
The bar chart shows how the returns for the portfolio's Class A shares have
varied from year to year, which may give some idea of risk. The table shows
average annual returns for the portfolio and comparable index information
(which, unlike the portfolio, does not have any fees or expenses). The
performance of both the portfolio and the comparable index information varies
over time. All figures assume reinvestment of dividends and distributions.
This information doesn't reflect charges and fees associated with the separate
account that invests in the portfolio or any variable life insurance policy or
variable annuity contract for which the portfolio is an investment option.
These charges and fees will reduce returns.
ANNUAL TOTAL RETURN (%) as of 12/31 each year - CLASS A
[BAR GRAPHIC APPEARS HERE]
16.44 65.88 -5.29 -24.59 -19.89 49.09 23.35 18.19 22.08 9.33
1998 1999 2000 2001 2002 2003 2004 2005 2006 2007
FOR THE PERIODS INCLUDED IN THE BAR CHART:
BEST QUARTER: 40.96%, Q4 1999 WORST QUARTER: -21.29%, Q3 2001
2008 TOTAL RETURN AS OF MARCH 31: -11.27%
AVERAGE ANNUAL TOTAL RETURNS (%) as of 12/31/2007
1 YEAR 5 YEARS 10 YEARS
------ ------- --------
Portfolio - Class A 9.33 23.74 12.36
S&P/Citigroup Extended Market Index - World 6.05 22.23 10.92
Total returns would have been lower if operating expenses hadn't been reduced.
S&P/CITIGROUP EXTENDED MARKET INDEX - WORLD is an unmanaged index of
small-capitalization stocks within 26 countries around the globe.
Current performance information may be higher or lower than the performance
data quoted above. For more recent performance information, contact your
participating insurance company.
DWS VARIABLE SERIES I - DWS INVESTMENTS VIT FUNDS
CLASS A SHARES
DWS GLOBAL OPPORTUNITIES VIP 29
HOW MUCH INVESTORS PAY
This table describes the fees and expenses that you may pay if you buy and hold
portfolio shares. The information in the table does not reflect charges and
fees associated with the separate account that invests in the portfolio or any
variable life insurance policy or variable annuity contract for which the
portfolio is an investment option. These charges and fees will increase
expenses.
FEE TABLE CLASS A
--------- -------
ANNUAL OPERATING EXPENSES, deducted from portfolio assets
Management Fee 0.89%
Distribution/Service (12b-1) Fee None
Other Expenses1 0.21
TOTAL ANNUAL OPERATING EXPENSES 1.10
Less Fee Waiver/Expense Reimbursement 0.11
NET ANNUAL OPERATING EXPENSES2 0.99
1 "Other Expenses" are based on estimated amounts for the current fiscal
year. Actual expenses may be different. Includes a 0.10% administrative
services fee paid to the Advisor.
2 Through April 30, 2009, the Advisor has contractually agreed to waive all
or a portion of its management fee and reimburse or pay certain operating
expenses so that the total annual operating expenses of the portfolio will
not exceed 0.99% for Class A shares, excluding certain expenses such as
extraordinary expenses, taxes, brokerage and interest.
Based on the costs above (including one year of capped expenses in each
period), this example helps you compare the expenses of Class A shares to those
of other mutual funds. This example assumes the expenses above remain the same.
It also assumes that you invested $10,000, earned 5% annual returns, reinvested
all dividends and distributions and sold your shares at the end of each period.
This is only an example; actual expenses will be different.
EXAMPLE 1 YEAR 3 YEARS 5 YEARS 10 YEARS
------- ------ ------- ------- --------
Class A shares $101 $339 $596 $1,330
DWS VARIABLE SERIES I - DWS INVESTMENTS VIT FUNDS
CLASS A SHARES
30 DWS GLOBAL OPPORTUNITIES VIP
THE PORTFOLIO MANAGERS
The portfolio is managed by a team of investment professionals who collaborate
to implement the portfolio's investment strategy. The team is led by a lead
portfolio manager who is responsible for developing the portfolio's investment
strategy. Each portfolio manager on the team has authority over all aspects of
the portfolio's investment portfolio, including but not limited to, purchases
and sales of individual securities, portfolio construction techniques,
portfolio risk assessment and the management of daily cash flows in accordance
with portfolio holdings.
The following people handle the day-to-day management of the portfolio:
Joseph Axtell, CFA
Managing Director of Deutsche Asset Management and Lead Portfolio Manager of
the portfolio.
o Joined Deutsche Asset Management in 2001 and the portfolio in 2002.
o Senior analyst at Merrill Lynch Investment Managers for the international
equity portion of a global balanced portfolio (1996-2001).
o Director, International Research at PCM International (1989-1996).
o Associate manager, structured debt and equity group at Prudential Capital
Corporation (1988-1989).
o Analyst at Prudential-Bache Capital Funding in London (1987-1988).
o Equity analyst in the healthcare sector at Prudential Equity Management
Associates (1985-1987).
o BS, University of Minnesota - Carlson School of Management.
Terrence S. Gray, CFA
Managing Director of Deutsche Asset Management and Portfolio Manager of the
portfolio.
o Joined Deutsche Asset Management in 1993 and the portfolio in 2003.
o Over 14 years of investment industry experience.
o Head of global portfolio selection team for Pacific Basin Equity: New
York.
o BS, Boston College.
The portfolio's Statement of Additional Information provides additional
information about a portfolio manager's investments in the portfolio, a
description of the portfolio management compensation structure, and information
regarding other accounts managed.
DWS VARIABLE SERIES I - DWS INVESTMENTS VIT FUNDS
CLASS A SHARES
DWS GLOBAL OPPORTUNITIES VIP 31
FINANCIAL HIGHLIGHTS
This table is designed to help you understand the portfolio's financial
performance. The figures in the first part of the table are for a single share.
The total return figures represent the percentage that an investor in the
portfolio would have earned (or lost), assuming all dividends and distributions
were reinvested. This information has been audited by PricewaterhouseCoopers
LLP, an independent registered public accounting firm, whose report, along with
the portfolio's financial statements, is included in the portfolio's annual
report (see "Shareholder reports" on the back cover).
The following table includes selected data for a share outstanding throughout
each period and other performance information derived from the financial
statements.
This information doesn't reflect charges and fees associated with the separate
account that invests in the portfolio or any variable life insurance policy or
variable annuity contract for which the portfolio is an investment option.
These charges and fees will reduce returns.
DWS GLOBAL OPPORTUNITIES VIP - CLASS A
YEARS ENDED DECEMBER 31, 2007 2006 2005 2004 2003
----------------------------------------------- ------- ------- ------- ------- -------
SELECTED PER SHARE DATA
----------------------------------------------------------------------------------------------------------
NET ASSET VALUE, BEGINNING OF PERIOD $ 18.15 $ 15.00 $ 12.77 $ 10.38 $ 6.97
----------------------------------------------- ------- ------- ------- ------- -------
Income (loss) from investment operations:
Net investment income (loss)a .08d .03c .04 .01 .02
----------------------------------------------- ------- ------- ------- ------- -------
Net realized and unrealized gain (loss) 1.61 3.28 2.27 2.41 3.40
----------------------------------------------- ------- ------- ------- ------- -------
TOTAL FROM INVESTMENT OPERATIONS 1.69 3.31 2.31 2.42 3.42
----------------------------------------------- ------- ------- ------- ------- -------
Less distributions from:
Net investment income ( .23) ( .16) ( .08) ( .03) ( .01)
----------------------------------------------- ------- ------- ------- ------- -------
NET REALIZED GAINS ( 1.33) -- -- -- --
----------------------------------------------- ------- ------- ------- ------- -------
Total distributions ( 1.56) ( .16) ( .08) ( .03) ( .01)
----------------------------------------------- ------- ------- ------- ------- -------
NET ASSET VALUE, END OF PERIOD $ 18.28 $ 18.15 $ 15.00 $ 12.77 $ 10.38
----------------------------------------------- ------- ------- ------- ------- -------
Total Return (%) 9.33b 22.08c 18.19 23.35 49.09
----------------------------------------------- ------- ------- ------- ------- -------
RATIOS TO AVERAGE NET ASSETS AND SUPPLEMENTAL DATA
----------------------------------------------------------------------------------------------------------
Net assets, end of period ($ millions) 310 331 285 232 183
----------------------------------------------- ------- ------- ------- ------- -------
Ratio of expenses before expense reductions (%) 1.14 1.12 1.17 1.18 1.18
----------------------------------------------- ------- ------- ------- ------- -------
Ratio of expenses after expense reductions (%) 1.12 1.12 1.17 1.18 1.18
----------------------------------------------- ------- ------- ------- ------- -------
Ratio of net investment income (loss) (%) .45d .16c .32 .09 .28
----------------------------------------------- ------- ------- ------- ------- -------
Portfolio turnover rate (%) 19 28 30 24 41
----------------------------------------------- ------- ------- ------- ------- -------
a Based on average shares outstanding during the period.
b Total return would have been lower had certain expenses not been reduced.
c Includes non-recurring income from the Advisor recorded as a result of an
administrative proceeding regarding disclosure of brokerage allocation
practices in connection with sales of DWS Scudder Funds. The non-recurring
income resulted in an increase in net investment income of $0.002 per
share and an increase in the ratio of net investment income of 0.01%.
Excluding this non-recurring income, total return would have been 0.01%
lower.
d Net investment income per share and ratio of net investment income include
non-recurring dividend income amounting to $0.02 per share and 0.09% of
average daily net assets, respectively.
DWS VARIABLE SERIES I - DWS INVESTMENTS VIT FUNDS
CLASS A SHARES
32 DWS GLOBAL OPPORTUNITIES VIP
HYPOTHETICAL EXPENSE SUMMARY
Using the annual portfolio operating expense ratios presented in the fee tables
in the portfolio prospectus, the Hypothetical Expense Summary shows the
estimated fees and expenses, in actual dollars, that would be charged on a
hypothetical investment of $10,000 in the portfolio held for the next 10 years
and the impact of such fees and expenses on portfolio returns for each year and
cumulatively, assuming a 5% return for each year. The tables also assume that
all dividends and distributions are reinvested. The annual portfolio expense
ratios shown are net of any contractual fee waivers or expense reimbursements,
if any, for the period of the contractual commitment. Also, please note that if
you are investing through a third party provider, that provider may have fees
and expenses separate from those of the portfolio that are not reflected here.
Mutual fund fees and expenses fluctuate over time and actual expenses may be
higher or lower than those shown.
The Hypothetical Expense Summary should not be used or construed as an offer to
sell, a solicitation of an offer to buy or a recommendation or endorsement of
any specific mutual fund. You should carefully review the portfolio's
prospectus to consider the investment objectives, risks, expenses and charges
of the portfolio prior to investing.
DWS GLOBAL OPPORTUNITIES VIP - CLASS A
INITIAL HYPOTHETICAL ASSUMED RATE
MAXIMUM INVESTMENT: OF RETURN:
SALES CHARGE: $10,000 5%
0.00% ---------------------------------- ---------------------------------
CUMULATIVE CUMULATIVE HYPOTHETICAL
RETURN BEFORE RETURN AFTER YEAR-END BALANCE ANNUAL
FEES AND ANNUAL FUND FEES AND AFTER FEES AND FEES AND
YEAR EXPENSES EXPENSE RATIOS EXPENSES EXPENSES EXPENSES
----- ------------- -------------- ------------ ---------------- ---------
1 5.00% 0.99% 4.01% $ 10,401.00 $ 100.98
2 10.25% 1.10% 8.07% $ 10,806.64 $ 116.64
3 15.76% 1.10% 12.28% $ 11,228.10 $ 121.19
4 21.55% 1.10% 16.66% $ 11,665.99 $ 125.92
5 27.63% 1.10% 21.21% $ 12,120.97 $ 130.83
6 34.01% 1.10% 25.94% $ 12,593.69 $ 135.93
7 40.71% 1.10% 30.85% $ 13,084.84 $ 141.23
8 47.75% 1.10% 35.95% $ 13,595.15 $ 146.74
9 55.13% 1.10% 41.25% $ 14,125.36 $ 152.46
10 62.89% 1.10% 46.76% $ 14,676.25 $ 158.41
TOTAL $1,330.33
DWS VARIABLE SERIES I - DWS INVESTMENTS VIT FUNDS
CLASS A SHARES
DWS GLOBAL OPPORTUNITIES VIP 33
DWS INTERNATIONAL VIP
THE PORTFOLIO'S MAIN INVESTMENT STRATEGY
The portfolio seeks long-term growth of capital primarily through diversified
holdings of marketable foreign equity investments (equities issued by
foreign-based companies and listed on foreign exchanges.) Although the
portfolio can invest in companies of any size and from any country (other than
the United States), it invests mainly in common stocks of established companies
in countries with developed economies.
The portfolio managers use a bottom-up approach, emphasizing individual stock
selection, with any active allocation among countries, regions or industries as
a residual of the strategy. The portfolio managers' process begins with a broad
universe of equity securities of issuers primarily, but not exclusively,
located in the countries that make up the MSCI EAFE (Reg. TM) Index. The MSCI
EAFE (Reg. TM) Index tracks stocks in Australia, Austria, Belgium, Denmark,
Finland, France, Germany, Hong Kong, Ireland, Italy, Japan, Malaysia, the
Netherlands, New Zealand, Norway, Portugal, Singapore, Spain, Sweden,
Switzerland and the United Kingdom. The universe includes all securities in the
Index and a large number of securities not included in the Index but whose
issuers are located in the countries that make up the Index.
The portfolio managers screen for companies seeking to identify those with high
or improving, and sustainable, returns on capital and long-term prospects for
growth. The portfolio managers focus on companies with real cash flow on
investment rather than published earnings. The portfolio managers utilize
information gleaned from a variety of sources and perspectives, including broad
trends such as lifestyle, demographic and technological changes, industry
cycles and regulatory changes, quantitative screening and individual company
analysis.
Based on this fundamental research, the portfolio managers set a target price
objective (the portfolio manager's opinion of the intrinsic value of the
security) for each security and ranks the securities based on these target
price objectives. The portfolio managers apply a disciplined approach to risk
management and portfolio construction. Stocks are sold when they meet their
target price objectives, a better investment opportunity has been identified or
there has been a negative change in the outlook for the company, country or
industry. In implementing this strategy, the portfolio may experience a high
portfolio turnover rate.
SECURITIES LENDING. The portfolio may lend its investment securities in an
amount up to 33 1/3% of its total assets to approved institutional borrowers
who need to borrow securities in order to complete certain transactions.
Although major changes tend to be infrequent, the Board of Trustees could
change the portfolio's investment objective without seeking shareholder
approval.
OTHER INVESTMENTS
While most of the portfolio's foreign equities are common stocks, some may be
other types of equities, such as convertible securities, preferred stocks and
depositary receipts. The portfolio is permitted, but not required, to use
various types of derivatives (contracts whose value is based on, for example,
indexes, currencies or securities). The portfolio may use derivatives in
circumstances where the portfolio managers believe they offer an economical
means of gaining exposure to a particular asset class or to keep cash on hand
to meet shareholder redemptions or other needs while maintaining exposure to
the market. In particular, the portfolio may use futures, currency options and
forward currency transactions.
For temporary defensive purposes, the portfolio may invest up to 100% of its
assets in Canadian and US Government obligations or currencies, securities of
companies incorporated in and having their principal place of business in
Canada or the US or in relatively stable investments, such as money market
securities. In such a case, the portfolio would not be pursuing its investment
objective. However, the portfolio managers may choose not to use these
strategies for various reasons, even in very volatile market conditions.
DWS VARIABLE SERIES I - DWS INVESTMENTS VIT FUNDS
CLASS A SHARES
34 DWS INTERNATIONAL VIP
THE MAIN RISKS OF INVESTING IN THE PORTFOLIO
There are several risk factors that could hurt the portfolio's performance,
cause you to lose money or cause the portfolio's performance to trail that of
other investments.
STOCK MARKET RISK. As with most stock funds, an important factor with this
portfolio is how stock markets perform - in this case, foreign markets. When
foreign stock prices fall, you should expect the value of your investment to
fall as well. Because a stock represents ownership in its issuer, stock prices
can be hurt by poor management, shrinking product demand and other business
risks. These may affect single companies as well as groups of companies. In
addition, movements in financial markets may adversely affect a stock's price,
regardless of how well the company performs. The market as a whole may not
favor the types of investments the portfolio makes and the portfolio may not be
able to get attractive prices for them.
FOREIGN INVESTMENT RISK. Foreign investments involve certain special risks,
including:
o POLITICAL RISK. Some foreign governments have limited the outflow of profits
to investors abroad, imposed restrictions on the exchange or export of
foreign currency, extended diplomatic disputes to include trade and
financial relations, seized foreign investment and imposed higher taxes.
o INFORMATION RISK. Companies based in foreign markets are usually not subject
to accounting, auditing and financial reporting standards and practices as
stringent as those in the US. Therefore, their financial reports may present
an incomplete, untimely or misleading picture of a company, as compared to
the financial reports required in the US.
o LIQUIDITY RISK. Investments that trade less can be more difficult or more
costly to buy, or to sell, than more liquid or active investments. This
liquidity risk is a factor of the trading volume of a particular investment,
as well as the size and liquidity of the entire local market. On the whole,
foreign exchanges are smaller and less liquid than US exchanges. This can
make buying and selling certain investments more difficult and costly.
Relatively small transactions in some instances can have a
disproportionately large effect on the price and supply of securities. In
certain situations, it may become virtually impossible to sell an investment
in an orderly fashion at a price that approaches portfolio management's
estimate of its value. For the same reason, it may at times be difficult to
value the portfolio's foreign investments.
o REGULATORY RISK. There is generally less government regulation of foreign
markets, companies and securities dealers than in the US.
o CURRENCY RISK. The portfolio invests in securities denominated in foreign
currencies. Changes in exchange rates between foreign currencies and the US
dollar may affect the US dollar value of foreign securities or the income or
gain received on these securities.
o LIMITED LEGAL RECOURSE RISK. Legal remedies for investors may be more limited
than the legal remedies available in the US.
o TRADING PRACTICE RISK. Brokerage commissions and other fees are generally
higher for foreign investments than for US investments. The procedures and
rules governing foreign transactions and custody may also involve delays in
payment, delivery or recovery of money or investments.
o TAXES. Foreign withholding and certain other taxes may reduce the amount of
income available to distribute to shareholders of the portfolio. In
addition, special US tax considerations may apply to the portfolio's foreign
investments.
EMERGING MARKET RISK. All of the risks of investing in foreign securities are
increased in connection with investments in emerging markets securities. In
addition, profound social changes and business practices that depart from norms
in developed countries' economies have hindered the orderly growth of emerging
economies and their markets in the past and have caused instability. High
levels of debt tend to make emerging economies heavily reliant on foreign
capital and vulnerable to capital flight. Countries in emerging markets are
also more likely to experience high levels of inflation, deflation or currency
devaluation, which could also hurt their economies and securities markets. For
these and other reasons, investments in emerging markets are often considered
speculative.
DWS VARIABLE SERIES I - DWS INVESTMENTS VIT FUNDS
CLASS A SHARES
DWS INTERNATIONAL VIP 35
PRICING RISK. At times, market conditions may make it difficult to value some
investments, and the portfolio may use certain valuation methodologies for some
of its investments, such as fair value pricing. Given the subjective nature of
such valuation methodologies, it is possible that the value determined for an
investment may be different than the value realized upon such investment's
sale. If the portfolio has valued its securities too highly, you may pay too
much for portfolio shares when you buy into the portfolio. If the portfolio has
underestimated the price of its securities, you may not receive the full market
value when you sell your portfolio shares.
SECURITY SELECTION RISK. A risk that pervades all investing is the risk that
the securities in the portfolio's portfolio may decline in value.
IPO RISK. Securities purchased in initial public offerings (IPOs) may be very
volatile, due to their stock prices rising and falling rapidly, often based,
among other reasons, on investor perceptions rather than economic reasons.
Additionally, investments in IPOs may magnify the portfolio's performance if it
has a small asset base. The portfolio is less likely to experience a similar
impact on its performance as its assets grow because it is unlikely that the
portfolio will obtain proportionately larger IPO allocations.
DERIVATIVES RISK. Risks associated with derivatives include the risk that the
derivative is not well correlated with the security, index or currency to which
it relates; the risk that derivatives may result in losses or missed
opportunities; the risk that the portfolio will be unable to sell the
derivative because of an illiquid secondary market; the risk that a
counterparty is unwilling or unable to meet its obligation and the risk that
the derivative transaction could expose the portfolio to the effects of
leverage, which could increase the portfolio's exposure to the market and
magnify potential losses. There is no guarantee that derivatives, to the extent
employed, will have the intended effect, and their use could cause lower
returns or even losses to the portfolio. The use of derivatives by the
portfolio to hedge risk may reduce the opportunity for gain by offsetting the
positive effect of favorable price movements.
SECURITIES LENDING RISK. Any loss in the market price of securities loaned by
the portfolio that occurs during the term of the loan would be borne by the
portfolio and would adversely affect the portfolio's performance. Also, there
may be delays in recovery of securities loaned or even a loss of rights in the
collateral should the borrower of the securities fail financially while the
loan is outstanding. However, loans will be made only to borrowers selected by
the portfolio's delegate after a review of relevant facts and circumstances,
including the creditworthiness of the borrower.
Other factors that could affect performance include:
o portfolio management could be wrong in the analysis of foreign governments,
industries, companies, economic trends, the relative attractiveness of
different sizes of stocks, geographical trends or other matters.
This portfolio is designed for investors who are interested in a broadly
diversified international investment with the emphasis on long-term growth of
capital.
DWS VARIABLE SERIES I - DWS INVESTMENTS VIT FUNDS
CLASS A SHARES
36 DWS INTERNATIONAL VIP
PERFORMANCE - CLASS A
While a portfolio's past performance isn't necessarily a sign of how it will do
in the future, it can be valuable for an investor to know.
The bar chart shows how the returns for the portfolio's Class A shares have
varied from year to year, which may give some idea of risk. The table shows
average annual returns for the portfolio and comparable index information
(which, unlike the portfolio, does not have any fees or expenses). The
performance of both the portfolio and the comparable index information varies
over time. All figures assume reinvestment of dividends and distributions.
This information doesn't reflect charges and fees associated with the separate
account that invests in the portfolio or any variable life insurance policy or
variable annuity contract for which the portfolio is an investment option.
These charges and fees will reduce returns.
ANNUAL TOTAL RETURN (%) as of 12/31 each year - CLASS A
[BAR GRAPHIC APPEARS HERE]
18.49 54.51 -21.70 -30.86 -18.37 27.75 16.53 16.17 25.91 14.59
1998 1999 2000 2001 2002 2003 2004 2005 2006 2007
FOR THE PERIODS INCLUDED IN THE BAR CHART:
BEST QUARTER: 29.06%, Q4 1999 WORST QUARTER: -18.80%, Q3 2002
2008 TOTAL RETURN AS OF MARCH 31: -9.26%
AVERAGE ANNUAL TOTAL RETURNS (%) as of 12/31/2007
1 YEAR 5 YEARS 10 YEARS
------ ------- --------
Portfolio - Class A 14.59 20.07 7.28
MSCI EAFE (Reg. TM) Index 11.17 21.59 8.66
MORGAN STANLEY CAPITAL INTERNATIONAL EUROPE, AUSTRALASIA AND THE FAR EAST (MSCI
EAFE (Reg. TM)) INDEX is an unmanaged index that tracks international stock
performance in the 21 developed markets of Europe, Australasia and the Far
East.
Current performance information may be higher or lower than the performance
data quoted above. For more recent performance information, contact your
participating insurance company.
DWS VARIABLE SERIES I - DWS INVESTMENTS VIT FUNDS
CLASS A SHARES
DWS INTERNATIONAL VIP 37
HOW MUCH INVESTORS PAY
This table describes the fees and expenses that you may pay if you buy and hold
portfolio shares. The information in the table does not reflect charges and
fees associated with the separate account that invests in the portfolio or any
variable life insurance policy or variable annuity contract for which the
portfolio is an investment option. These charges and fees will increase
expenses.
FEE TABLE CLASS A
--------- -------
ANNUAL OPERATING EXPENSES, deducted from portfolio assets
Management Fee 0.74
Distribution/Service (12b-1) Fee None
Other Expenses1 0.20
TOTAL ANNUAL OPERATING EXPENSES2 0.94
1 "Other Expenses" are based on estimated amounts for the current fiscal
year. Actual expenses may be different. Includes a 0.10% administrative
services fee paid to the Advisor.
2 Through April 30, 2010, the Advisor has contractually agreed to waive all
or a portion of its management fee and reimburse or pay certain operating
expenses so that the total annual operating expenses of the portfolio will
not exceed 0.96% for Class A shares, excluding certain expenses such as
extraordinary expenses, taxes, brokerage and interest.
Based on the costs above, this example helps you compare the expenses of Class
A shares to those of other mutual funds. This example assumes the expenses
above remain the same. It also assumes that you invested $10,000, earned 5%
annual returns, reinvested all dividends and distributions and sold your shares
at the end of each period. This is only an example; actual expenses will be
different.
EXAMPLE 1 YEAR 3 YEARS 5 YEARS 10 YEARS
------- ------ ------- ------- --------
Class A shares $96 $300 $520 $1,155
THE PORTFOLIO MANAGERS
The portfolio is managed by a team of investment professionals who collaborate
to implement the portfolio's investment strategy. Each portfolio manager on the
team has authority over all aspects of the portfolio's investment portfolio,
including but not limited to, purchases and sales of individual securities,
portfolio construction techniques, portfolio risk assessment and the management
of daily cash flows in accordance with portfolio holdings.
The following people handle the day-to-day management of the portfolio:
Matthias Knerr, CFA
Director, Deutsche Asset Management and Portfolio Manager of the portfolio.
o Joined Deutsche Asset Management in 1995 and the portfolio in 2004.
o Portfolio manager for International Equities.
o BS, Pennsylvania State University.
Chris LaJaunie, CFA
Director, Deutsche Asset Management and Portfolio Manager of the portfolio.
o Joined Deutsche Asset Management in 2006 as an analyst for International
Equity and International Select Equity strategies: New York.
o Prior to that, nine years of experience as portfolio manager for Morgan
Stanley Capital Strategy, and as equity analyst for Oaktree Capital
Management, JP Morgan Securities and Scudder Kemper Investments.
o Joined the portfolio in 2008.
o BA, MA, Louisiana State University.
The portfolio's Statement of Additional Information provides additional
information about a portfolio manager's investments in the portfolio, a
description of the portfolio management compensation structure, and information
regarding other accounts managed.
DWS VARIABLE SERIES I - DWS INVESTMENTS VIT FUNDS
CLASS A SHARES
38 DWS INTERNATIONAL VIP
FINANCIAL HIGHLIGHTS
This table is designed to help you understand the portfolio's financial
performance. The figures in the first part of the table are for a single share.
The total return figures represent the percentage that an investor in the
portfolio would have earned (or lost), assuming all dividends and distributions
were reinvested. This information has been audited by PricewaterhouseCoopers
LLP, an independent registered public accounting firm, whose report, along with
the portfolio's financial statements, is included in the portfolio's annual
report (see "Shareholder reports" on the back cover).
The following table includes selected data for a share outstanding throughout
each period and other performance information derived from the financial
statements.
This information doesn't reflect charges and fees associated with the separate
account that invests in the portfolio or any variable life insurance policy or
variable annuity contract for which the portfolio is an investment option.
These charges and fees will reduce returns.
DWS INTERNATIONAL VIP - CLASS A
YEARS ENDED DECEMBER 31, 2007 2006 2005 2004 2003
----------------------------------------- ------- ------- ------- ------- -------
SELECTED PER SHARE DATA
----------------------------------------------------------------------------------------------------
NET ASSET VALUE, BEGINNING OF PERIOD $ 13.42 $ 10.85 $ 9.50 $ 8.26 $ 6.52
----------------------------------------- ------- ------- ------- ------- -------
Income (loss) from investment operations:
Net investment income (loss)a .21c .28b .15 .09 .09
----------------------------------------- ------- ------- ------- ------- -------
Net realized and unrealized gain (loss) 1.73 2.51 1.36 1.26 1.70
----------------------------------------- ------- ------- ------- ------- -------
TOTAL FROM INVESTMENT OPERATIONS 1.94 2.79 1.51 1.35 1.79
----------------------------------------- ------- ------- ------- ------- -------
Less distributions from:
Net investment income ( .35) ( .22) ( .16) ( .11) ( .05)
----------------------------------------- ------- ------- ------- ------- -------
NET ASSET VALUE, END OF PERIOD $ 15.01 $ 13.42 $ 10.85 $ 9.50 $ 8.26
----------------------------------------- ------- ------- ------- ------- -------
Total Return (%) 14.59 25.91 16.17 16.53 27.75
----------------------------------------- ------- ------- ------- ------- -------
RATIOS TO AVERAGE NET ASSETS AND SUPPLEMENTAL DATA
----------------------------------------------------------------------------------------------------
Net assets, end of period ($ millions) 702 702 558 533 485
----------------------------------------- ------- ------- ------- ------- -------
Ratio of expenses (%) .98 .98 1.02 1.04 1.05
----------------------------------------- ------- ------- ------- ------- -------
Ratio of net investment income (loss) (%) 1.48c 2.32b 1.59 1.05 1.32
----------------------------------------- ------- ------- ------- ------- -------
Portfolio turnover rate (%) 108 105 59 73 119
----------------------------------------- ------- ------- ------- ------- -------
a Based on average shares outstanding during the period.
b Net investment income per share and the ratio of net investment income
include non-recurring dividend income amounting to $0.11 per share and
0.92% of average daily net assets, respectively.
c Net investment income per share and the ratio of net investment income
include non-recurring dividend income amounting to $0.05 per share and
0.33% of average daily net assets, respectively.
DWS VARIABLE SERIES I - DWS INVESTMENTS VIT FUNDS
CLASS A SHARES
DWS INTERNATIONAL VIP 39
HYPOTHETICAL EXPENSE SUMMARY
Using the annual portfolio operating expense ratios presented in the fee tables
in the portfolio prospectus, the Hypothetical Expense Summary shows the
estimated fees and expenses, in actual dollars, that would be charged on a
hypothetical investment of $10,000 in the portfolio held for the next 10 years
and the impact of such fees and expenses on portfolio returns for each year and
cumulatively, assuming a 5% return for each year. The tables also assume that
all dividends and distributions are reinvested. The annual portfolio expense
ratios shown are net of any contractual fee waivers or expense reimbursements,
if any, for the period of the contractual commitment. Also, please note that if
you are investing through a third party provider, that provider may have fees
and expenses separate from those of the portfolio that are not reflected here.
Mutual fund fees and expenses fluctuate over time and actual expenses may be
higher or lower than those shown.
The Hypothetical Expense Summary should not be used or construed as an offer to
sell, a solicitation of an offer to buy or a recommendation or endorsement of
any specific mutual fund. You should carefully review the portfolio's
prospectus to consider the investment objectives, risks, expenses and charges
of the portfolio prior to investing.
DWS INTERNATIONAL VIP - CLASS A
INITIAL HYPOTHETICAL ASSUMED RATE
MAXIMUM INVESTMENT: OF RETURN:
SALES CHARGE: $10,000 5%
0.00% ---------------------------------- ----------------------------------
CUMULATIVE CUMULATIVE HYPOTHETICAL
RETURN BEFORE RETURN AFTER YEAR-END BALANCE ANNUAL
FEES AND ANNUAL FUND FEES AND AFTER FEES AND FEES AND
YEAR EXPENSES EXPENSE RATIOS EXPENSES EXPENSES EXPENSES
---- ------------- -------------- ------------ ---------------- ---------
1 5.00% 0.94% 4.06% $ 10,406.00 $ 95.91
2 10.25% 0.94% 8.28% $ 10,828.48 $ 99.80
3 15.76% 0.94% 12.68% $ 11,268.12 $ 103.85
4 21.55% 0.94% 17.26% $ 11,725.61 $ 108.07
5 27.63% 0.94% 22.02% $ 12,201.67 $ 112.46
6 34.01% 0.94% 26.97% $ 12,697.05 $ 117.02
7 40.71% 0.94% 32.13% $ 13,212.55 $ 121.78
8 47.75% 0.94% 37.49% $ 13,748.98 $ 126.72
9 55.13% 0.94% 43.07% $ 14,307.19 $ 131.86
10 62.89% 0.94% 48.88% $ 14,888.06 $ 137.22
TOTAL $1,154.69
DWS VARIABLE SERIES I - DWS INVESTMENTS VIT FUNDS
CLASS A SHARES
40 DWS INTERNATIONAL VIP
DWS HEALTH CARE VIP
THE PORTFOLIO'S MAIN INVESTMENT STRATEGY
The portfolio seeks long-term growth of capital by investing, under normal
circumstances, at least 80% of total assets, plus the amount of any borrowings
for investment purposes, in common stocks of companies in the health care
sector. For purposes of the portfolio's 80% investment policy, to be considered
part of the health care sector, companies must commit at least half of their
assets to, or derive at least half of their revenues or net income from, that
sector. The industries in the health care sector include pharmaceuticals,
biotechnology, medical products and supplies, and health care services. The
companies may be of any size. The portfolio will invest primarily in securities
of US companies, but may invest in foreign companies as well. While the
portfolio invests mainly in common stocks, it may also invest up to 20% of
total assets in US Treasury and agency debt obligations.
In choosing stocks, the portfolio managers use a combination of three
analytical disciplines:
BOTTOM-UP RESEARCH. The portfolio managers look for individual companies with a
history of above-average growth, strong competitive positioning, new tests or
treatments, the ability to take advantage of demographic trends, attractive
prices relative to potential growth, sound financial strength and effective
management, among other factors.
GROWTH ORIENTATION. The portfolio managers generally look for companies that
they believe have above-average potential for sustainable growth of revenue or
earnings and whose market value appears reasonable in light of their business
prospects.
TOP-DOWN ANALYSIS. The portfolio managers consider the economic outlooks for
various industries within the health care sector while looking for those that
may benefit from changes in the overall business environment.
The portfolio managers may favor securities from different industries and
companies within the health care sector at different times. The portfolio
managers will normally sell a stock when they believe its price is unlikely to
go higher, its fundamental factors have changed, other investments offer better
opportunities, or in the course of adjusting their emphasis on a given health
care industry.
SECURITIES LENDING. The portfolio may lend its investment securities in an
amount up to 33 1/3% of its total assets to approved institutional borrowers
who need to borrow securities in order to complete certain transactions.
Although major changes tend to be infrequent, the Board of Trustees could
change the portfolio's investment objective without seeking shareholder
approval. However, the Board will provide shareholders with at least 60 days'
notice prior to making any changes to the portfolio's 80% investment policy.
OTHER INVESTMENTS
Although not one of its principal investment strategies, the portfolio is
permitted, but not required, to use various types of derivatives (contracts
whose value is based on, for example, indicies, currencies or securities).
Derivatives may be used for hedging and for risk management or for non-hedging
purposes to seek to enhance potential gains. The portfolio may use derivatives
in circumstances where portfolio management believes they offer an economical
means of gaining exposure to a particular asset class or to keep cash on hand
to meet shareholder redemptions or other needs while maintaining exposure to
the market.
As a temporary defensive measure, the portfolio could shift up to 100% of
assets into investments such as money market securities. This measure could
prevent losses, but, while engaged in a temporary defensive position, the
portfolio will not be pursuing its investment objective. However, the portfolio
managers may choose not to use these strategies for various reasons, even in
very volatile market conditions.
DWS VARIABLE SERIES I - DWS INVESTMENTS VIT FUNDS
CLASS A SHARES
DWS HEALTH CARE VIP 41
THE MAIN RISKS OF INVESTING IN THE PORTFOLIO
There are several risk factors that could hurt the portfolio's performance,
cause you to lose money or cause the portfolio's performance to trail that of
other investments.
STOCK MARKET RISK. The portfolio is affected by how the stock market performs.
To the extent the portfolio invests in a particular capitalization or market
sector, the portfolio's performance may be proportionately affected by that
segment's general performance. When stock prices fall, you should expect the
value of your investment to fall as well. Because a stock represents ownership
in its issuer, stock prices can be hurt by poor management, shrinking product
demand and other business risks. These factors may affect single companies as
well as groups of companies. In addition, movements in financial markets may
adversely affect a stock's price, regardless of how well the company performs.
The market as a whole may not favor the types of investments the portfolio
makes, which could affect the portfolio's ability to sell them at an attractive
price.
FOREIGN INVESTMENT RISK. To the extent the portfolio has exposure to companies
based outside the US, it faces the risks inherent in foreign investing. Adverse
political, economic or social developments could undermine the value of the
portfolio's investments or prevent the portfolio from realizing their full
value. Financial reporting standards for companies based in foreign markets
differ from those in the US. Additionally, foreign securities markets generally
are smaller and less liquid than the US markets. These risks tend to be greater
in emerging markets so, to the extent the portfolio invests in emerging
markets, it takes on greater risks. The currency of a country in which the
portfolio has invested could decline relative to the value of the US dollar,
which decreases the value of the investment to US investors. The investments of
the portfolio may be subject to foreign withholding taxes.
GROWTH INVESTING RISK. Since growth stocks usually reinvest a large portion of
earnings in their own businesses, they may lack the dividends associated with
value stocks that might otherwise cushion their decline in a falling market.
Earnings disappointments in growth stocks often result in sharp price declines
because investors buy these stocks for their potential superior earnings
growth. Growth stocks may also be out of favor for certain periods in relation
to value stocks.
CONCENTRATION RISK. The portfolio concentrates its investments in the
industries of the health care sector. As a result, factors affecting that
sector, such as rapid product obsolescence and the unpredictability of winning
government approvals, will have a significant impact on the portfolio's
performance.
SECURITY SELECTION RISK. A risk that pervades all investing is the risk that
the securities in the portfolio's portfolio may decline in value.
IPO RISK. Securities purchased in initial public offerings (IPOs) may be very
volatile, due to their stock prices rising and falling rapidly, often based,
among other reasons, on investor perceptions rather than economic reasons.
Additionally, investments in IPOs may magnify the portfolio's performance if it
has a small asset base. The portfolio is less likely to experience a similar
impact on its performance as its assets grow because it is unlikely that the
portfolio will obtain proportionately larger IPO allocations.
DERIVATIVES RISK. Risks associated with derivatives include the risk that the
derivative is not well correlated with the security, index or currency to which
it relates; the risk that derivatives may result in losses or missed
opportunities; the risk that the portfolio will be unable to sell the
derivative because of an illiquid secondary market; the risk that a
counterparty is unwilling or unable to meet its obligation and the risk that
the derivative transaction could expose the portfolio to the effects of
leverage, which could increase the portfolio's exposure to the market and
magnify potential losses. There is no guarantee that derivatives, to the extent
employed, will have the intended effect, and their use could cause lower
returns or even losses to the portfolio. The use of derivatives by the
portfolio to hedge risk may reduce the opportunity for gain by offsetting the
positive effect of favorable price movements.
SECURITIES LENDING RISK. Any loss in the market price of securities loaned by
the portfolio that occurs during the term of the loan would be borne by the
portfolio and would adversely affect the portfolio's performance. Also, there
may be delays in recovery of securities loaned or even a loss of rights in the
collateral should the borrower of the securities fail financially while the
loan is outstanding. However, loans will be made only to borrowers selected by
the portfolio's delegate after a review of relevant facts and circumstances,
including the creditworthiness of the borrower.
DWS VARIABLE SERIES I - DWS INVESTMENTS VIT FUNDS
CLASS A SHARES
42 DWS HEALTH CARE VIP
PRICING RISK. At times, market conditions may make it difficult to value some
investments, and the portfolio may use certain valuation methodologies for some
of its investments, such as fair value pricing. Given the subjective nature of
such valuation methodologies, it is possible that the value determined for an
investment may be different than the value realized upon such investment's
sale. If the portfolio has valued its securities too highly, you may pay too
much for portfolio shares when you buy into the portfolio. If the portfolio has
underestimated the price of its securities, you may not receive the full market
value when you sell your portfolio shares.
MEDIUM-SIZED COMPANY RISK. Medium-sized company stocks tend to experience
steeper price fluctuations than stocks of larger companies. A shortage of
reliable information can also pose added risk to medium sized companies stocks.
Industry-wide reversals may have a greater impact on medium-sized companies,
since they usually lack the financial resources of large companies.
Medium-sized company stocks are typically less liquid than large company
stocks. Accordingly, it may be harder to find buyers for medium-sized company
shares.
SMALL COMPANY CAPITALIZATION RISK. Small company stocks tend to experience
steeper price fluctuations than the stocks of larger companies. A shortage of
reliable information can also pose added risk to small company stocks.
Industry-wide reversals may have a greater impact on small companies, since
they lack the financial resources of large companies. Small company stocks are
typically less liquid than large company stocks. Accordingly, it may be harder
to find buyers for small company shares.
Another factor that could affect performance is:
o portfolio management could be wrong in the analysis of industries, companies,
economic trends, the relative attractiveness of different securities or
other matters.
The portfolio may make sense for investors who are comfortable with higher
risks of a portfolio that focuses on an often volatile sector and are
interested in gaining exposure to the health care sector.
PERFORMANCE - CLASS A
While a portfolio's past performance isn't necessarily a sign of how it will do
in the future, it can be valuable for an investor to know.
The bar chart shows how the returns for the portfolio's Class A shares have
varied from year to year, which may give some idea of risk. The table shows
average annual returns for the portfolio and comparable index information
(which, unlike the portfolio, does not have any fees or expenses). The
performance of both the portfolio and the comparable index information varies
over time. All figures assume reinvestment of dividends and distributions.
This information doesn't reflect charges and fees associated with the separate
account that invests in the portfolio or any variable life insurance policy or
variable annuity contract for which the portfolio is an investment option.
These charges and fees will reduce returns.
ANNUAL TOTAL RETURN (%) as of 12/31 each year - CLASS A
[BAR GRAPHIC APPEARS HERE]
-23.10 33.70 9.59 8.50 6.17 13.20
2002 2003 2004 2005 2006 2007
FOR THE PERIODS INCLUDED IN THE BAR CHART:
BEST QUARTER: 15.08%, Q2 2003 WORST QUARTER: -15.62%, Q2 2002
2008 TOTAL RETURN AS OF MARCH 31: -7.70%
DWS VARIABLE SERIES I - DWS INVESTMENTS VIT FUNDS
CLASS A SHARES
DWS HEALTH CARE VIP 43
AVERAGE ANNUAL TOTAL RETURNS (%) as of 12/31/2007
1 YEAR 5 YEARS SINCE INCEPTION*
------ ------- ----------------
Portfolio - Class A 13.20 13.82 6.93
Standard & Poor's (S&P) 500 Index 5.49 12.83 4.27
Goldman Sachs Healthcare Index 8.26 10.87 4.66
* Inception: May 1, 2001. Index comparisons begin April 30, 2001.
STANDARD & POOR'S 500 INDEX (S&P 500) is an unmanaged, capitalization-weighted
index of 500 stocks. The index is designed to measure performance of the broad
domestic economy through changes in the aggregate market value of 500 stocks
representing all major industries.
GOLDMAN SACHS HEALTHCARE INDEX is an unmanaged, market-capitalization-weighted
index of 114 stocks designed to measure the performance of companies in the
health care sector.
Current performance information may be higher or lower than the performance
data quoted above. For more recent performance information, contact your
participating insurance company.
HOW MUCH INVESTORS PAY
This table describes the fees and expenses that you may pay if you buy and hold
portfolio shares. The information in the table does not reflect charges and
fees associated with the separate account that invests in the portfolio or any
variable life insurance policy or variable annuity contract for which the
portfolio is an investment option. These charges and fees will increase
expenses.
FEE TABLE CLASS A
--------- -------
ANNUAL OPERATING EXPENSES, deducted from portfolio assets
Management Fee 0.67%
Distribution/Service (12b-1) Fee None
Other Expenses1 0.23
TOTAL ANNUAL OPERATING EXPENSES 0.90
1 "Other Expenses" are based on estimated amounts for the current fiscal
year. Actual expenses may be different. Includes a 0.10% administrative
services fee paid to the Advisor.
Based on the costs above, this example helps you compare the expenses of Class
A shares to those of other mutual funds. This example assumes the expenses
above remain the same. It also assumes that you invested $10,000, earned
5% annual returns, reinvested all dividends and distributions and sold
your shares at the end of each period. This is only an example; actual
expenses will be different.
EXAMPLE 1 YEAR 3 YEARS 5 YEARS 10 YEARS
------- ------ ------- ------- --------
Class A shares $92 $287 $498 $1,108
DWS VARIABLE SERIES I - DWS INVESTMENTS VIT FUNDS
CLASS A SHARES
44 DWS HEALTH CARE VIP
THE PORTFOLIO MANAGERS
The portfolio is managed by a team of investment professionals who collaborate
to implement the portfolio's investment strategy. The team is led by a lead
portfolio manager who is responsible for developing the portfolio's investment
strategy. Each portfolio manager on the team has authority over all aspects of
the portfolio's investment portfolio, including but not limited to, purchases
and sales of individual securities, portfolio construction techniques,
portfolio risk assessment and the management of daily cash flows in accordance
with portfolio holdings.
The following people handle the day-to-day management of the portfolio:
Leefin Lai, CFA
Managing Director of Deutsche Asset Management and Lead Portfolio Manager of
the portfolio.
o Joined Deutsche Asset Management in 2001 and the portfolio in 2001,
previously serving as an analyst for Salomon Smith Barney and Paine Webber
and as Vice President/analyst for Citigroup Global Asset Management and
Scudder Kemper Investments.
o Over 15 years of investment industry experience.
o BS, MBA, University of Illinois.
Thomas E. Bucher, CFA
Managing Director of Deutsche Asset Management and Consultant to the portfolio.
o Joined Deutsche Asset Management in 1995 and the portfolio in 2002,
previously serving as analyst for European Chemical, Oil, Steel and
Engineering sectors and analyst/
portfolio manager for Eastern European equity.
o Head of global equity research team for health care sector and portfolio
manager for European Equity: Frankfurt.
o MA, University of Tuegingen, Germany.
The portfolio's Statement of Additional Information provides additional
information about a portfolio manager's investments in the portfolio, a
description of the portfolio management compensation structure, and information
regarding other accounts managed.
DWS VARIABLE SERIES I - DWS INVESTMENTS VIT FUNDS
CLASS A SHARES
DWS HEALTH CARE VIP 45
FINANCIAL HIGHLIGHTS
This table is designed to help you understand the portfolio's financial
performance. The figures in the first part of the table are for a single share.
The total return figures represent the percentage that an investor in the
portfolio would have earned (or lost), assuming all dividends and distributions
were reinvested. This information has been audited by PricewaterhouseCoopers
LLP, an independent registered public accounting firm, whose report, along with
the portfolio's financial statements, is included in the portfolio's annual
report (see "Shareholder reports" on the back cover).
The following table includes selected data for a share outstanding throughout
each period and other performance information derived from the financial
statements.
This information doesn't reflect charges and fees associated with the separate
account that invests in the portfolio or any variable life insurance policy or
variable annuity contract for which the portfolio is an investment option.
These charges and fees will reduce returns.
DWS HEALTH CARE VIP - CLASS A
YEARS ENDED DECEMBER 31, 2007 2006 2005 2004 2003
----------------------------------------- -------- ------- -------- -------- -------
SELECTED PER SHARE DATA
-------------------------------------------------------------------------------------------------------
NET ASSET VALUE, BEGINNING OF PERIOD $ 13.77 $ 13.02 $ 12.00 $ 10.95 $ 8.19
----------------------------------------- -------- ------- -------- -------- -------
Income (loss) from investment operations:
Net investment income (loss)a .03c ( .01)b ( .02) ( .03) ( .02)
----------------------------------------- -------- ------- -------- -------- -------
Net realized and unrealized gain (loss) 1.75 .81 1.04 1.08 2.78
----------------------------------------- -------- ------- -------- -------- -------
TOTAL FROM INVESTMENT OPERATIONS 1.78 .80 1.02 1.05 2.76
----------------------------------------- -------- ------- -------- -------- -------
Less distributions from:
Net realized gains ( .87) ( .05) - - -
----------------------------------------- -------- ------- -------- -------- -------
NET ASSET VALUE, END OF PERIOD $ 14.68 $ 13.77 $ 13.02 $ 12.00 $ 10.95
----------------------------------------- -------- ------- -------- -------- -------
Total Return (%) 13.20 6.17b 8.50 9.59 33.70
----------------------------------------- -------- ------- -------- -------- -------
RATIOS TO AVERAGE NET ASSETS AND SUPPLEMENTAL DATA
-------------------------------------------------------------------------------------------------------
Net assets, end of period ($ millions) 98 101 109 109 101
----------------------------------------- -------- ------- -------- -------- -------
Ratio of expenses (%) .93 .89 .88 .88 .87
----------------------------------------- -------- ------- -------- -------- -------
Ratio of net investment income (loss) (%) .19c ( .03)b ( .18) ( .29) ( .24)
----------------------------------------- -------- ------- -------- -------- -------
Portfolio turnover rate (%) 37 47 43 77 64
----------------------------------------- -------- ------- -------- -------- -------
a Based on average shares outstanding during the period.
b Includes non-recurring income from the Advisor recorded as a result of an
administrative proceeding regarding disclosure of brokerage allocation
practices in connection with sales of DWS Scudder Funds. The non-recurring
income resulted in an increase in net investment income of $0.003 per
share and an increase in the ratio of net investment income of 0.02%.
Excluding this non-recurring income, total return would have been 0.02%
lower.
c Net investment income per share and ratio of net investment income include
non-recurring dividend income amounting to $0.02 per share and 0.13% of
average daily net assets, respectively.
DWS VARIABLE SERIES I - DWS INVESTMENTS VIT FUNDS
CLASS A SHARES
46 DWS HEALTH CARE VIP
HYPOTHETICAL EXPENSE SUMMARY
Using the annual portfolio operating expense ratios presented in the fee tables
in the portfolio prospectus, the Hypothetical Expense Summary shows the
estimated fees and expenses, in actual dollars, that would be charged on a
hypothetical investment of $10,000 in the portfolio held for the next 10 years
and the impact of such fees and expenses on portfolio returns for each year and
cumulatively, assuming a 5% return for each year. The tables also assume that
all dividends and distributions are reinvested. The annual portfolio expense
ratios shown are net of any contractual fee waivers or expense reimbursements,
if any, for the period of the contractual commitment. Also, please note that if
you are investing through a third party provider, that provider may have fees
and expenses separate from those of the portfolio that are not reflected here.
Mutual fund fees and expenses fluctuate over time and actual expenses may be
higher or lower than those shown.
The Hypothetical Expense Summary should not be used or construed as an offer to
sell, a solicitation of an offer to buy or a recommendation or endorsement of
any specific mutual fund. You should carefully review the portfolio's
prospectus to consider the investment objectives, risks, expenses and charges
of the portfolio prior to investing.
DWS HEALTH CARE VIP - CLASS A
INITIAL HYPOTHETICAL ASSUMED RATE
MAXIMUM INVESTMENT: OF RETURN:
SALES CHARGE: $10,000 5%
0.00% ---------------------------------- ---------------------------------
CUMULATIVE CUMULATIVE HYPOTHETICAL
RETURN BEFORE RETURN AFTER YEAR-END BALANCE ANNUAL
FEES AND ANNUAL FUND FEES AND AFTER FEES AND FEES AND
YEAR EXPENSES EXPENSE RATIOS EXPENSES EXPENSES EXPENSES
---- ------------- -------------- ------------ ---------------- ---------
1 5.00% 0.90% 4.10% $ 10,410.00 $ 91.85
2 10.25% 0.90% 8.37% $ 10,836.81 $ 95.61
3 15.76% 0.90% 12.81% $ 11,281.12 $ 99.53
4 21.55% 0.90% 17.44% $ 11,743.65 $ 103.61
5 27.63% 0.90% 22.25% $ 12,225.13 $ 107.86
6 34.01% 0.90% 27.26% $ 12,726.37 $ 112.28
7 40.71% 0.90% 32.48% $ 13,248.15 $ 116.89
8 47.75% 0.90% 37.91% $ 13,791.32 $ 121.68
9 55.13% 0.90% 43.57% $ 14,356.76 $ 126.67
10 62.89% 0.90% 49.45% $ 14,945.39 $ 131.86
TOTAL $1,107.84
DWS VARIABLE SERIES I - DWS INVESTMENTS VIT FUNDS
CLASS A SHARES
DWS HEALTH CARE VIP 47
DWS EQUITY 500 INDEX VIP
THE PORTFOLIO'S MAIN INVESTMENT STRATEGY
The portfolio seeks to replicate, as closely as possible, before the deduction
of expenses, the performance of the Standard & Poor's 500 Composite Stock Price
Index (the "S&P 500 Index"), which emphasizes stocks of large US companies. The
S&P 500 Index is a well-known stock market index that includes common stocks of
500 companies from several industrial sectors representing a significant
portion of the market value of all stocks publicly traded in the United States.
Stocks in the S&P 500 Index are weighted according to their market
capitalization (the number of shares outstanding multiplied by the stock's
current price).
The portfolio invests for capital appreciation, not income; any dividend and
interest income is incidental to the pursuit of its objective. While the
portfolio manager gives priority to replicating the S&P 500 Index's
performance, there is no assurance of achieving this objective.
INDEX INVESTING VERSUS ACTIVE MANAGEMENT
Active management involves the portfolio management team buying and selling
securities based on research and analysis. Unlike a portfolio that is actively
managed, an index portfolio tries to replicate, as closely as possible, the
performance of a target index by holding either all, or a representative
sample, of the securities in the index. Indexing appeals to many investors for
the following reasons:
o indexing provides simplicity because it is a straightforward
market-replicating strategy;
o index portfolios generally provide diversification by investing in a wide
variety of companies and industries;
o an index portfolio's performance is generally predictable in that the
portfolio's value is expected to move in the same direction, up or down, as
the target index;
o index portfolios tend to have lower costs because they do not have many of
the expenses of actively managed funds, such as research. Also, index
portfolios usually have relatively low trading activity and therefore
brokerage commissions tend to be lower; and
o index portfolios generally realize low capital gains as compared to actively
managed portfolios.
STRATEGY
The portfolio will pursue its objective by investing primarily in the
securities of the companies included in the benchmark and derivative
instruments, such as futures contracts and options, relating to the benchmark.
Futures contracts and options are used as a low-cost method of gaining exposure
to a particular securities market without investing directly in those
securities. The portfolio management team uses quantitative analysis techniques
to structure the portfolio to obtain a high correlation to the S&P 500 Index,
while keeping the portfolio as fully invested as possible in all market
environments. To attempt to replicate the risk and return characteristics of
the S&P 500 Index as closely as possible, the portfolio invests in a
statistically selected sample of the securities found in the S&P 500 Index,
using a process known as "optimization." This process selects stocks for the
portfolio so that industry weightings, market capitalizations and fundamental
characteristics (price-to-book ratios, price-to-earnings ratios, debt-to-asset
ratios and dividend yields), closely replicate those of the securities in the
S&P 500 Index. Over the long term, the portfolio seeks a correlation between
the performance of the portfolio, before expenses, and the S&P 500 Index of 98%
or better. A figure of 100% would indicate perfect correlation.
PRINCIPAL INVESTMENTS
Under normal circumstances, the portfolio intends to invest at least 80% of its
assets, determined at the time of purchase, in stocks of companies included in
the S&P 500 Index and in derivative instruments, such as futures contracts and
options, that provide exposure to the stocks of companies in the S&P 500 Index.
The portfolio's securities are weighted to attempt to make the portfolio's
total investment characteristics similar to those of the S&P 500 Index as a
whole. We may exclude or remove any S&P 500 Index stock from the portfolio if
we believe that the stock is illiquid or that the merit of the investment has
been impaired by financial conditions or other extraordinary events. At times,
the portfolio management team may purchase a stock not
DWS VARIABLE SERIES I - DWS INVESTMENTS VIT FUNDS
CLASS A SHARES
48 DWS EQUITY 500 INDEX VIP
included in the S&P 500 Index when it is believed to be a cost-efficient way of
approximating the S&P 500 Index's performance, for example, in anticipation of
a stock being added to the S&P 500 Index. The portfolio may hold assets in
short-term debt securities or money market instruments for liquidity purposes.
SECURITIES LENDING. The portfolio may lend its investment securities up to 30%
of its total assets to approved institutional borrowers who need to borrow
securities in order to complete certain transactions.
Although major changes tend to be infrequent, the Board could change the
portfolio's investment goal without seeking shareholder approval. In addition,
the portfolio's Board will provide shareholders with at least 60 days' notice
prior to making any changes to the portfolio's 80% investment policy, as
described herein.
INVESTMENT PROCESS
In an effort to run an efficient and effective strategy, the portfolio uses the
process of "optimization," a statistical sampling technique. First, the
portfolio buys the stocks that make up the larger portions of the S&P 500
Index's value in roughly the same proportion as the S&P 500 Index. Second,
smaller stocks are analyzed and selected based on liquidity. In selecting
smaller stocks, the portfolio management team tries to replicate the industry
and risk characteristics of all of the smaller companies in the S&P 500 Index
without buying all of those stocks. This approach attempts to maximize the
portfolio's liquidity and returns while minimizing its costs. Historically,
this portfolio has had a low portfolio turnover rate. Portfolio turnover
measures the frequency that the portfolio sells and replaces the value of its
securities within a given period.
INFORMATION REGARDING THE INDEX
The portfolio is not sponsored, endorsed, sold or promoted by the Standard &
Poor's Division of The McGraw-Hill Companies, Inc. ("S&P"). S&P makes no
representation or warranty, express or implied, to the owners of the portfolio
or any member of the public regarding the advisability of investing in
securities generally or in the portfolio particularly or the ability of the S&P
500 Index to track general stock market performance. S&P's only relationship to
the portfolio is the licensing of certain trademarks and trade names of S&P and
of the S&P 500 Index, which is determined, composed and calculated by S&P
without regard to the portfolio.
S&P has no obligation to take the needs of the portfolio or the owners of the
portfolio into consideration in determining, composing or calculating the S&P
500 Index. S&P is not responsible for and has not participated in the
determination of the timing of, prices at, or quantities of the portfolio to be
issued or in the determination or calculation of the equation by which shares
of the portfolio are redeemable for cash. S&P has no obligation or liability in
connection with the administration, marketing or trading of the portfolio.
S&P does not guarantee the accuracy and/or the completeness of the S&P 500
Index or any data included therein and S&P shall have no liability for any
errors, omissions or interruptions therein. S&P makes no warranty, express or
implied, as to results to be obtained by the portfolio, owners of the
portfolio, or any other person or entity from the use of the S&P 500 Index or
any data included therein. S&P makes no express or implied warranties, and
expressly disclaims all warranties of merchantability or fitness for a
particular purpose or use with respect to the S&P 500 Index or any data
included therein. Without limiting any of the foregoing, in no event shall S&P
have any liability for any special, punitive, indirect or consequential damages
(including lost profits), even if notified of the possibility of such damages.
DWS VARIABLE SERIES I - DWS INVESTMENTS VIT FUNDS
CLASS A SHARES
DWS EQUITY 500 INDEX VIP 49
THE MAIN RISKS OF INVESTING IN THE PORTFOLIO
There are several risk factors that could hurt the portfolio's performance,
cause you to lose money or cause the portfolio's performance to trail that of
other investments.
STOCK MARKET RISK. The portfolio is affected by how the stock market performs.
To the extent the portfolio invests in a particular capitalization or market
sector, the portfolio's performance may be proportionately affected by that
segment's general performance. When stock prices fall, you should expect the
value of your investment to fall as well. Because a stock represents ownership
in its issuer, stock prices can be hurt by poor management, shrinking product
demand and other business risks. These factors may affect single companies as
well as groups of companies. In addition, movements in financial markets may
adversely affect a stock's price, regardless of how well the company performs.
The market as a whole may not favor the types of investments the portfolio
makes, which could affect the portfolio's ability to sell them at an attractive
price.
TRACKING ERROR RISK. There are several reasons that the portfolio's performance
may not replicate the S&P 500 Index exactly:
o Unlike the S&P 500 Index, the portfolio incurs fees and administrative
expenses and transaction costs in trading stocks.
o The composition of the S&P 500 Index and the stocks held by the portfolio may
occasionally diverge.
o The timing and magnitude of cash inflows from investors buying shares could
create balances of uninvested cash. Conversely, the timing and magnitude of
cash outflows to investors selling shares could require ready reserves of
uninvested cash. Either situation would likely cause the portfolio's
performance to deviate from that of the "fully invested" S&P 500 Index which
does not include a cash component.
INDEX FUND RISK. Because the portfolio invests at least 80% of its assets in
the stocks of companies included in the S&P 500 Index and in derivative
instruments that provide exposure to the stocks of companies in the S&P 500
Index, it cannot alter its investment strategy in response to fluctuations in
the market segment represented by the Index.
FUTURES AND OPTIONS RISK. The portfolio may invest, to a limited extent, in
securities index futures or options, which are types of derivatives. The
portfolio will not use these derivatives for speculative purposes. Rather, the
portfolio invests in derivatives to keep cash on hand to meet shareholder
redemptions or other needs while maintaining exposure to the stock market.
Risks associated with derivatives include: the risk that the derivative is not
well correlated with the security, index or currency to which it relates; the
risk that derivatives used for risk management may not have the intended
effects and may result in losses or missed opportunities; the risk that the
portfolio will be unable to sell the derivative because of an illiquid
secondary market; the risk that a counterparty is unwilling or unable to meet
its obligation; the risk of interest rate movements; and the risk that the
derivatives transaction could expose the portfolio to the effects of leverage,
which could increase the portfolio's exposure to the market and magnify
potential losses.
PRICING RISK. At times, market conditions may make it difficult to value some
investments, and the portfolio may use certain valuation methodologies for some
of its investments, such as fair value pricing. Given the subjective nature of
such valuation methodologies, it is possible that the value determined for an
investment may be different than the value realized upon such investment's
sale. If the portfolio has valued its securities too highly, you may pay too
much for portfolio shares when you buy into the portfolio. If the portfolio has
underestimated the price of its securities, you may not receive the full market
value when you sell your portfolio shares.
SECURITIES LENDING RISK. Any loss in the market price of securities loaned by
the portfolio that occurs during the term of the loan would be borne by the
portfolio and would adversely affect the portfolio's performance. Also, there
may be delays in recovery of securities loaned or even a loss of rights in the
collateral should the borrower of the securities fail financially while the
loan is outstanding. However, loans will be made only to borrowers selected by
the portfolio's delegate after a review of relevant facts and circumstances,
including the creditworthiness of the borrower.
This portfolio is designed for investors interested in capital appreciation
over the long term; exposure to the US equity markets as represented by larger
companies; and investment returns that track the performance of the S&P 500
Index.
DWS VARIABLE SERIES I - DWS INVESTMENTS VIT FUNDS
CLASS A SHARES
50 DWS EQUITY 500 INDEX VIP
PERFORMANCE - CLASS A
While a portfolio's past performance isn't necessarily a sign of how it will do
in the future, it can be valuable for an investor to know.
The bar chart shows how the returns for the portfolio's Class A shares have
varied from year to year, which may give some idea of risk. The table shows
average annual returns for the portfolio and comparable index information
(which, unlike the portfolio, does not have any fees or expenses). The
performance of both the portfolio and the comparable index information varies
over time. All figures assume reinvestment of dividends and distributions.
This information doesn't reflect charges and fees associated with the separate
account that invests in the portfolio or any variable life insurance policy or
variable annuity contract for which the portfolio is an investment option.
These charges and fees will reduce returns.
ANNUAL TOTAL RETURN (%) as of 12/31 each year - CLASS A
[BAR GRAPHIC APPEARS HERE]
28.71 20.39 -9.24 -12.18 -22.31 28.16 10.59 4.68 15.52 5.30
1998 1999 2000 2001 2002 2003 2004 2005 2006 2007
FOR THE PERIODS INCLUDED IN THE BAR CHART:
BEST QUARTER: 21.22%, Q4 1998 WORST QUARTER: -17.24%, Q3 2002
2008 TOTAL RETURN AS OF MARCH 31: -9.53%
AVERAGE ANNUAL TOTAL RETURNS (%) as of 12/31/2007
1 YEAR 5 YEARS 10 YEARS
------ ------- --------
Portfolio - Class A Shares 5.30 12.53 5.64
Standard & Poor's (S&P) 500 Index 5.49 12.83 5.91
Total returns would have been lower if operating expenses hadn't been reduced.
STANDARD & POOR'S 500 INDEX (S&P 500) is an unmanaged, capitalization-weighted
index of 500 stocks. The index is designed to measure performance of the broad
domestic economy through changes in the aggregate market value of 500 stocks
representing all major industries.
Current performance information may be higher or lower than the performance
data quoted above. For more recent performance information, contact your
participating insurance company.
DWS VARIABLE SERIES I - DWS INVESTMENTS VIT FUNDS
CLASS A SHARES
DWS EQUITY 500 INDEX VIP 51
HOW MUCH INVESTORS PAY
This table describes the fees and expenses that you may pay if you buy and hold
portfolio shares. The information in the table does not reflect charges and
fees associated with the separate account that invests in the fund or any
variable life insurance policy, variable annuity contract or tax-qualified plan
for which the portfolio is an investment option. These charges and fees will
increase expenses.
FEE TABLE CLASS A
--------- -------
ANNUAL OPERATING EXPENSES, deducted from portfolio assets
Management Fee 0.19%
Distribution/Service (12b-1) Fee None
Other Expenses1 0.12
TOTAL ANNUAL OPERATING EXPENSES 0.31
Less Fee Waiver/Expense Reimbursement 0.03
NET ANNUAL OPERATING EXPENSES2 0.28
1 "Other Expenses" are based on estimated amounts for the current fiscal
year. Actual expenses may be different. Includes a 0.10% administrative
services fee paid to the Advisor.
2 Through April 30, 2009, the Advisor has contractually agreed to waive all
or a portion of its management fee and reimburse or pay certain operating
expenses so that the total annual operating expenses of the portfolio will
not exceed 0.28% for Class A shares, excluding certain expenses such as
extraordinary expenses, taxes, brokerage and interest.
Based on the costs above (including one year of capped expenses in each
period), this example helps you compare the expenses of Class A shares to those
of other mutual funds. This example assumes the expenses above remain the same.
It also assumes that you invested $10,000, earned 5% annual returns, and
reinvested all dividends and distributions. This is only an example; actual
expenses will be different.
EXAMPLE 1 YEAR 3 YEARS 5 YEARS 10 YEARS
------- ------ ------- ------- --------
Class A shares $29 $97 $171 $390
THE PORTFOLIO MANAGER
Brent Reeder is a Senior Vice President at Northern Trust Investments, NA
("NTI"). Mr. Reeder has had responsibility for the portfolio since May 2007.
Mr. Reeder joined NTI in 1993. For the past six years, he has managed
quantitative equity portfolios.
The portfolio's Statement of Additional Information provides additional
information about a portfolio manager's investments in the portfolio, a
description of the portfolio management compensation structure, and information
regarding other accounts managed.
DWS VARIABLE SERIES I - DWS INVESTMENTS VIT FUNDS
CLASS A SHARES
52 DWS EQUITY 500 INDEX VIP
FINANCIAL HIGHLIGHTS
This table is designed to help you understand the portfolio's financial
performance. The figures in the first part of the table are for a single share.
The total return figures represent the percentage that an investor in the
portfolio would have earned (or lost), assuming all dividends and distributions
were reinvested. This information has been audited by PricewaterhouseCoopers
LLP, an independent registered public accounting firm, whose report, along with
the portfolio's financial statements, is included in the portfolio's annual
report (see "Shareholder reports" on the back cover).
The following table includes selected data for a share outstanding throughout
each period and other performance information derived from the financial
statements.
This information doesn't reflect charges and fees associated with the separate
account that invests in the portfolio or any variable life insurance policy or
variable annuity contract for which the portfolio is an investment option.
These charges and fees will reduce returns.
Information for the periods ended prior to December 31, 2005 was audited by
Ernst & Young LLP, an independent registered public accounting firm.
DWS EQUITY 500 INDEX VIP - CLASS A
YEARS ENDED DECEMBER 31, 2007 2006 2005 2004 2003
-------------------------------------------------- ------- ------- ------- ------- -------
SELECTED PER SHARE DATA
--------------------------------------------------------------------------------------------------------------
NET ASSET VALUE, BEGINNING OF PERIOD $ 14.97 $ 13.11 $ 12.73 $ 11.64 $ 9.20
-------------------------------------------------- ------- ------- ------- ------- -------
Income (loss) from investment operations:
Net investment income (loss)a .27 .24 .21 .21 .15
-------------------------------------------------- ------- ------- ------- ------- -------
Net realized and unrealized gain (loss) .52 1.78 .37 1.01 2.41
--------------------------------------------------- ------- ------- ------- ------- -------
TOTAL FROM INVESTMENT OPERATIONS .79 2.02 .58 1.22 2.56
--------------------------------------------------- ------- ------- ------- ------- -------
Less distributions from:
Net investment income ( .23) ( .16) ( .20) ( .13) ( .12)
-------------------------------------------------- ------- ------- ------- ------- -------
NET ASSET VALUE, END OF PERIOD $ 15.53 $ 14.97 $ 13.11 $ 12.73 $ 11.64
--------------------------------------------------- ------- ------- ------- ------- -------
Total Return (%) 5.30b 15.52b 4.68 10.59b 28.16b
-------------------------------------------------- ------- ------- ------- ------- -------
RATIOS TO AVERAGE NET ASSETS AND SUPPLEMENTAL DATA
--------------------------------------------------------------------------------------------------------------
Net assets, end of period ($ millions) 1,046 1,412 1,102 790 627
-------------------------------------------------- ------- ------- ------- ------- -------
Ratio of expenses before expense reductions and/or
recoupments (%) .33 .28 .27 .28 .30
-------------------------------------------------- ------- ------- ------- ------- -------
Ratio of expenses after expense reductions and/or
recoupments (%) .30 .27 .27 .29 .30
-------------------------------------------------- ------- ------- ------- ------- -------
Ratio of net investment income (loss) (%) 1.71 1.73 1.62 1.76 1.50
-------------------------------------------------- ------- ------- ------- ------- -------
Portfolio turnover rate (%) 7c 9 15 1 1
--------------------------------------------------- ------- ------- ------- ------- -------
a Based on average shares outstanding during the period.
b Total return would have been lower had certain expenses not been reduced.
c Excludes portfolio securities delivered as a result of processing
redemption in-kind transactions.
DWS VARIABLE SERIES I - DWS INVESTMENTS VIT FUNDS
CLASS A SHARES
DWS EQUITY 500 INDEX VIP 53
HYPOTHETICAL EXPENSE SUMMARY
Using the annual portfolio operating expense ratios presented in the fee tables
in the portfolio prospectus, the Hypothetical Expense Summary shows the
estimated fees and expenses, in actual dollars, that would be charged on a
hypothetical investment of $10,000 in the portfolio held for the next 10 years
and the impact of such fees and expenses on portfolio returns for each year and
cumulatively, assuming a 5% return for each year. The tables also assume that
all dividends and distributions are reinvested. The annual portfolio expense
ratios shown are net of any contractual fee waivers or expense reimbursements,
if any, for the period of the contractual commitment. Also, please note that if
you are investing through a third party provider, that provider may have fees
and expenses separate from those of the portfolio that are not reflected here.
Mutual fund fees and expenses fluctuate over time and actual expenses may be
higher or lower than those shown.
The Hypothetical Expense Summary should not be used or construed as an offer to
sell, a solicitation of an offer to buy or a recommendation or endorsement of
any specific mutual fund. You should carefully review the portfolio's
prospectus to consider the investment objectives, risks, expenses and charges
of the portfolio prior to investing.
DWS EQUITY 500 INDEX VIP - CLASS A
INITIAL HYPOTHETICAL ASSUMED RATE
MAXIMUM INVESTMENT: OF RETURN:
SALES CHARGE: $10,000 5%
0.00% ---------------------------------- --------------------------------
CUMULATIVE CUMULATIVE HYPOTHETICAL
RETURN BEFORE RETURN AFTER YEAR-END BALANCE ANNUAL
FEES AND ANNUAL FUND FEES AND AFTER FEES AND FEES AND
YEAR EXPENSES EXPENSE RATIOS EXPENSES EXPENSES EXPENSES
----- ------------- -------------- ------------ ---------------- --------
1 5.00% 0.28% 4.72% $ 10,472.00 $ 28.66
2 10.25% 0.31% 9.63% $ 10,963.14 $ 33.22
3 15.76% 0.31% 14.77% $ 11,477.31 $ 34.78
4 21.55% 0.31% 20.16% $ 12,015.59 $ 36.41
5 27.63% 0.31% 25.79% $ 12,579.12 $ 38.12
6 34.01% 0.31% 31.69% $ 13,169.09 $ 39.91
7 40.71% 0.31% 37.87% $ 13,786.72 $ 41.78
8 47.75% 0.31% 44.33% $ 14,443.31 $ 43.74
9 55.13% 0.31% 51.10% $ 15,110.24 $ 45.79
10 62.89% 0.31% 58.19% $ 15,818.91 $ 47.94
TOTAL $390.35
DWS VARIABLE SERIES I - DWS INVESTMENTS VIT FUNDS
CLASS A SHARES
54 DWS EQUITY 500 INDEX VIP
DWS SMALL CAP INDEX VIP
THE PORTFOLIO'S MAIN INVESTMENT STRATEGY
The portfolio seeks to replicate, as closely as possible, before the deduction
of expenses, the performance of the Russell 2000 (Reg. TM) Index, which
emphasizes stocks of small US companies. The Russell 2000 (Reg. TM) Index is a
widely accepted benchmark of small company stock performance. The Russell 2000
(Reg. TM) Index measures the performance of the 2,000 smallest companies in the
Russell 3000 (Reg. TM) Index which represents approximately 8% of the market
capitalization of the Russell 3000 (Reg. TM) Index. Stocks in the Russell 2000
(Reg. TM) Index are weighted according to their market capitalization (the
number of shares outstanding multiplied by the stock's current price).
The portfolio invests for capital appreciation, not income; any dividend and
interest income is incidental to the pursuit of its objective. While the
portfolio manager gives priority to replicating the Russell 2000 (Reg. TM)
Index's performance, there is no assurance of achieving this objective.
INDEX INVESTING VERSUS ACTIVE MANAGEMENT
Active management involves the portfolio management team buying and selling
securities based on research and analysis. Unlike a portfolio that is actively
managed, an index fund tries to replicate, as closely as possible, the
performance of a target index by holding either all, or a representative
sample, of the securities in the index. Indexing appeals to many investors for
the following reasons:
o indexing provides simplicity because it is a straightforward
market-replicating strategy;
o index portfolios generally provide diversification by investing in a wide
variety of companies and industries;
o an index portfolio's performance is generally predictable in that the
portfolio's value is expected to move in the same direction, up or down, as
the target index;
o index portfolios tend to have lower costs because they do not have many of
the expenses of actively managed funds, such as research. Also, index
portfolios usually have relatively low trading activity and therefore
brokerage commissions tend to be lower; and
o index portfolios generally realize low capital gains as compared to actively
managed portfolios.
STRATEGY
The portfolio will pursue its objective by investing primarily in the
securities of the companies included in the benchmark and derivative
instruments, such as futures contracts and options, relating to the benchmark.
Futures contracts and options are used as a low-cost method of gaining exposure
to a particular securities market without investing directly in those
securities. The portfolio management team uses quantitative analysis techniques
to structure the portfolio to obtain a high correlation to the Russell 2000
(Reg. TM) Index while keeping the portfolio as fully invested as possible in
all market environments. To attempt to replicate the risk and return
characteristics of the Russell 2000 (Reg. TM) Index as closely as possible, the
portfolio invests in a statistically selected sample of the securities found in
the Russell 2000 (Reg. TM) Index, using a process known as "optimization." This
process selects stocks for the portfolio so that industry weightings, market
capitalizations and fundamental characteristics (price-to-book ratios,
price-to-earnings ratios, debt-to-asset ratios and dividend yields) closely
replicate those of the securities in the Russell 2000 (Reg. TM) Index. Over the
long term, the portfolio seeks a correlation between the performance of the
portfolio, before expenses, and the Russell 2000 (Reg. TM) Index of 95% or
better. A figure of 100% would indicate perfect correlation.
PRINCIPAL INVESTMENTS
Under normal circumstances, the portfolio intends to invest at least 80% of its
assets, determined at the time of purchase, in stocks of companies included in
the Russell 2000 (Reg. TM) Index and in derivative instruments, such as stock
index futures contracts and options, that provide exposure to the stocks of
companies in the Russell 2000 (Reg. TM) Index. The portfolio's securities are
weighted to attempt to make the portfolio's total investment characteristics
similar to those of the Russell 2000 (Reg. TM) Index as a whole. We may exclude
or remove any Russell 2000 (Reg. TM) Index stock from the portfolio if we
believe that the stock is illiquid or has impaired financial conditions brought
on by extraordinary events. At times, the portfolio management team may
purchase a stock not
DWS VARIABLE SERIES I - DWS INVESTMENTS VIT FUNDS
CLASS A SHARES
DWS SMALL CAP INDEX VIP 55
included in the Russell 2000 (Reg. TM) Index when it is believed to be a
cost-efficient way of approximating the Russell 2000 (Reg. TM) Index's
performance, for example, in anticipation of a stock being added to the Russell
2000 (Reg. TM) Index. The portfolio may hold assets in short-term debt
securities or money market instruments for liquidity purposes.
SECURITIES LENDING. The portfolio may lend its investment securities up to 30%
of its total assets to approved institutional borrowers who need to borrow
securities in order to complete certain transactions.
Although major changes tend to be infrequent, the Board could change the
portfolio's investment objective without seeking shareholder approval. In
addition, the portfolio's Board will provide shareholders with at least 60
days' notice prior to making any changes to the portfolio's 80% investment
policy, as described herein.
INVESTMENT PROCESS
In an effort to run an efficient and effective strategy, the portfolio uses the
process of "optimization," a statistical sampling technique. First, the
portfolio buys the stocks that make up the larger portions of the Russell 2000
(Reg. TM) Index's value in roughly the same proportion as the Russell 2000
(Reg. TM) Index. Second, smaller stocks are analyzed and selected based on
liquidity. In selecting smaller stocks, the portfolio management team tries to
replicate the industry and risk characteristics of all of the smaller companies
in the Russell 2000 (Reg. TM) Index without buying all of those stocks. This
approach attempts to maximize the portfolio's liquidity and returns while
minimizing its costs. Historically, this portfolio has had a low portfolio
turnover rate. Portfolio turnover measures the frequency that the fund sells
and replaces the value of its securities within a given period. High turnover
can increase a portfolio's transaction costs, thereby lowering its returns.
THE MAIN RISKS OF INVESTING IN THE PORTFOLIO
There are several risk factors that could hurt the portfolio's performance,
cause you to lose money or cause the portfolio's performance to trail that of
other investments.
STOCK MARKET RISK. The portfolio is affected by how the stock market performs.
To the extent the portfolio invests in a particular capitalization or market
sector, the portfolio's performance may be proportionately affected by that
segment's general performance. When stock prices fall, you should expect the
value of your investment to fall as well. Because a stock represents ownership
in its issuer, stock prices can be hurt by poor management, shrinking product
demand and other business risks. These factors may affect single companies as
well as groups of companies. In addition, movements in financial markets may
adversely affect a stock's price, regardless of how well the company performs.
The market as a whole may not favor the types of investments the portfolio
makes, which could affect the portfolio's ability to sell them at an attractive
price.
TRACKING ERROR RISK. There are several reasons that the portfolio's performance
may not replicate the Russell 2000 (Reg. TM) Index exactly:
o Unlike the Russell 2000 (Reg. TM) Index, the portfolio incurs fees and
administrative expenses and transaction costs in trading stocks.
o The composition of the Russell 2000 (Reg. TM) Index and the stocks held by
the portfolio may occasionally diverge.
o The timing and magnitude of cash inflows from investors buying shares could
create balances of uninvested cash. Conversely, the timing and magnitude of
cash outflows to investors selling shares could require ready reserves of
uninvested cash. Either situation would likely cause the portfolio's
performance to deviate from the "fully invested" Russell 2000 (Reg. TM)
Index, which does not include a cash component.
INDEX FUND RISK. Because the portfolio invests at least 80% of its assets in
the stocks of companies included in the Russell 2000 (Reg. TM) Index and in
derivative instruments that provide exposure to the stocks of companies in the
Russell 2000 (Reg. TM) Index, it cannot alter its investment strategy in
response to fluctuations in the market segment represented by the Index.
SMALL COMPANY CAPITALIZATION RISK. Small company stocks tend to experience
steeper price fluctuations than the stocks of larger companies. A shortage of
reliable information can also pose added risk to small company stocks.
Industry-wide reversals may have a greater impact on small companies, since
they lack the financial resources of large companies. Small company stocks are
typically less liquid than large company stocks. Accordingly, it may be harder
to find buyers for small company shares.
DWS VARIABLE SERIES I - DWS INVESTMENTS VIT FUNDS
CLASS A SHARES
56 DWS SMALL CAP INDEX VIP
FUTURES AND OPTIONS RISK. The portfolio may invest, to a limited extent, in
securities index futures or options, which are types of derivatives. The
portfolio will not use these derivatives for speculative purposes. Rather, the
portfolio invests in derivatives to keep cash on hand to meet shareholder
redemptions or other needs while maintaining exposure to the stock market.
Risks associated with derivatives include: the risk that the derivative is not
well correlated with the security, index or currency to which it relates; the
risk that derivatives used for risk management may not have the intended
effects and may result in losses or missed opportunities; the risk that the
portfolio will be unable to sell the derivative because of an illiquid
secondary market; the risk that a counterparty is unwilling or unable to meet
its obligation; the risk of interest rate movements; and the risk that the
derivatives transaction could expose the portfolio to the effects of leverage,
which could increase the portfolio's exposure to the market and magnify
potential losses.
PRICING RISK. At times, market conditions may make it difficult to value some
investments, and the portfolio may use certain valuation methodologies for some
of its investments, such as fair value pricing. Given the subjective nature of
such valuation methodologies, it is possible that the value determined for an
investment may be different than the value realized upon such investment's
sale. If the portfolio has valued its securities too highly, you may pay too
much for portfolio shares when you buy into the portfolio. If the portfolio has
underestimated the price of its securities, you may not receive the full market
value when you sell your portfolio shares.
SECURITIES LENDING RISK. Any loss in the market price of securities loaned by
the portfolio that occurs during the term of the loan would be borne by the
portfolio and would adversely affect the portfolio's performance. Also, there
may be delays in recovery of securities loaned or even a loss of rights in the
collateral should the borrower of the securities fail financially while the
loan is outstanding. However, loans will be made only to borrowers selected by
the portfolio's delegate after a review of relevant facts and circumstances,
including the creditworthiness of the borrower.
This portfolio is designed for investors interested in capital appreciation
over the long term; exposure to the US equity markets as represented by smaller
companies; and investment returns that track the performance of the Russell
2000 (Reg. TM) Index.
DWS VARIABLE SERIES I - DWS INVESTMENTS VIT FUNDS
CLASS A SHARES
DWS SMALL CAP INDEX VIP 57
PERFORMANCE - CLASS A
While a portfolio's past performance isn't necessarily a sign of how it will do
in the future, it can be valuable for an investor to know.
The bar chart shows how the returns for the portfolio's Class A shares have
varied from year to year, which may give some idea of risk. The table shows
average annual returns for the portfolio and comparable index information
(which, unlike the portfolio, does not have any fees or expenses). The
performance of both the portfolio and the comparable index information varies
over time. All figures assume reinvestment of dividends and distributions.
This information doesn't reflect charges and fees associated with the separate
account that invests in the portfolio or any variable life insurance policy or
variable annuity contract for which the portfolio is an investment option.
These charges and fees will reduce returns.
ANNUAL TOTAL RETURN (%) as of 12/31 each year - CLASS A
[BAR GRAPHIC APPEARS HERE]
-2.18 20.16 -3.87 2.07 -20.58 46.42 17.76 4.26 17.49 -1.90
1998 1999 2000 2001 2002 2003 2004 2005 2006 2007
FOR THE PERIODS INCLUDED IN THE BAR CHART:
BEST QUARTER: 23.16%, Q2 2003 WORST QUARTER: -21.37%, Q3 2002
2008 TOTAL RETURN AS OF MARCH 31: -10.13%
AVERAGE ANNUAL TOTAL RETURNS (%) as of 12/31/2007
1 YEAR 5 YEARS 10 YEARS
------ ------- --------
Portfolio - Class A shares -1.90 15.69 6.62
Russell 2000 (Reg. TM) Index -1.57 16.25 7.08
Total returns would have been lower if operating expenses hadn't been reduced.
RUSSELL 2000 (Reg. TM) INDEX is an unmanaged capitalization-weighted measure of
approximately 2,000 small US stocks.
Current performance information may be higher or lower than the performance
data quoted above. For more recent performance information, contact your
participating insurance company.
DWS VARIABLE SERIES I - DWS INVESTMENTS VIT FUNDS
CLASS A SHARES
58 DWS SMALL CAP INDEX VIP
HOW MUCH INVESTORS PAY
This table describes the fees and expenses that you may pay if you buy and hold
portfolio shares. The information in the table does not reflect charges and
fees associated with the separate account that invests in the portfolio or any
variable life insurance policy, variable annuity contract or tax-qualified plan
for which the portfolio is an investment option. These charges and fees will
increase expenses.
FEE TABLE CLASS A
--------- -------
ANNUAL OPERATING EXPENSES, deducted from portfolio assets
Management Fee 0.35%
Distribution/Service (12b-1) Fee None
Other Expenses1 0.15
TOTAL ANNUAL OPERATING EXPENSES 0.50
Less Fee Waiver/Expense Reimbursement 0.03
NET ANNUAL OPERATING EXPENSES2 0.47
1 "Other Expenses" are based on estimated amounts for the current fiscal
year. Actual expenses may be different. Includes a 0.10% administrative
services fee paid to the Advisor.
2 Through April 30, 2009, the Advisor has contractually agreed to waive all
or a portion of its management fee and reimburse or pay operating expenses
of the portfolio to the extent necessary to maintain the portfolio's total
annual operating expenses at 0.47% for Class A shares, excluding certain
expenses such as extraordinary expenses, taxes, brokerage and interest.
Based on the costs above (including one year of capped expenses in each
period), this example helps you compare the expenses of Class A shares to those
of other mutual funds. This example assumes the expenses above remain the same.
It also assumes that you invested $10,000, earned 5% annual returns, and
reinvested all dividends and distributions. This is only an example; actual
expenses will be different.
EXAMPLE 1 YEAR 3 YEARS 5 YEARS 10 YEARS
------- ------ ------- ------- --------
Class A shares $48 $157 $277 $625
THE PORTFOLIO MANAGER
Brent Reeder is a Senior Vice President at Northern Trust Investments, NA
("NTI"). Mr. Reeder has had responsibility for the portfolio since May 2007.
Mr. Reeder joined NTI in 1993. For the past six years, he has managed
quantitative equity portfolios.
The portfolio's Statement of Additional Information provides additional
information about a portfolio manager's investments in the portfolio, a
description of the portfolio management compensation structure, and information
regarding other accounts managed.
DWS VARIABLE SERIES I - DWS INVESTMENTS VIT FUNDS
CLASS A SHARES
DWS SMALL CAP INDEX VIP 59
FINANCIAL HIGHLIGHTS
This table is designed to help you understand the portfolio's financial
performance. The figures in the first part of the table are for a single share.
The total return figures represent the percentage that an investor in the
portfolio would have earned (or lost), assuming all dividends and distributions
were reinvested. This information has been audited by PricewaterhouseCoopers
LLP, an independent registered public accounting firm, whose report, along with
the portfolio's financial statements, is included in the portfolio's annual
report (see "Shareholder reports" on the back cover).
The following table includes selected data for a share outstanding throughout
each period and other performance information derived from the financial
statements.
This information doesn't reflect charges and fees associated with the separate
account that invests in the portfolio or any variable life insurance policy or
variable annuity contract for which the portfolio is an investment option.
These charges and fees will reduce returns.
Information for the periods ended prior to December 31, 2005 was audited by
Ernst & Young LLP, an independent registered public accounting firm.
DWS SMALL CAP INDEX VIP - CLASS A
YEARS ENDED DECEMBER 31, 2007 2006 2005 2004 2003
----------------------------------------------- ------- ------- ------- ------- -------
SELECTED PER SHARE DATA
-------------------------------------------------------------------------------------------------------
NET ASSET VALUE, BEGINNING OF PERIOD $ 16.12 $ 14.40 $ 14.35 $ 12.24 $ 8.45
----------------------------------------------- ------- ------- ------- ------- -------
Income (loss) from investment operations:
Net investment income (loss)a .17 .14 .11 .11 .09
----------------------------------------------- ------- ------- ------- ------- -------
Net realized and unrealized gain (loss) ( .40) 2.34 .42 2.06 3.79
----------------------------------------------- ------- ------- ------- ------- -------
TOTAL FROM INVESTMENT OPERATIONS ( .23) 2.48 .53 2.17 3.88
----------------------------------------------- ------- ------- ------- ------- -------
Less distributions from:
Net investment income ( .14) ( .10) ( .09) ( .06) ( .09)
----------------------------------------------- ------- ------- ------- ------- -------
Net realized gains ( 1.04) ( .66) ( .39) - -
----------------------------------------------- ------- ------- ------- ------- -------
TOTAL DISTRIBUTIONS ( 1.18) ( .76) ( .48) ( .06) ( .09)
----------------------------------------------- ------- ------- ------- ------- -------
NET ASSET VALUE, END OF PERIOD $ 14.71 $ 16.12 $ 14.40 $ 14.35 $ 12.24
----------------------------------------------- ------- ------- ------- ------- -------
Total Return (%)b ( 1.90) 17.49 4.26 17.76 46.42
----------------------------------------------- ------- ------- ------- ------- -------
RATIOS TO AVERAGE NET ASSETS AND SUPPLEMENTAL DATA
-------------------------------------------------------------------------------------------------------
Net assets, end of period ($ millions) 305 536 449 450 316
----------------------------------------------- ------- ------- ------- ------- -------
Ratio of expenses before expense reductions (%) .53 .47 .46 .48 .61
----------------------------------------------- ------- ------- ------- ------- -------
Ratio of expenses after expense reductions (%) .51 .45 .45 .45 .45
----------------------------------------------- ------- ------- ------- ------- -------
Ratio of net investment income (loss) (%) 1.09 .93 .78 .87 .91
----------------------------------------------- ------- ------- ------- ------- -------
Portfolio turnover rate (%) 24c 42 26 22 28
----------------------------------------------- ------- ------- ------- ------- -------
a Based on average shares outstanding during the period.
b Total return would have been lower had certain expenses not been reduced.
c Excludes portfolio securities delivered as a result of processing
redemption in-kind transactions.
DWS VARIABLE SERIES I - DWS INVESTMENTS VIT FUNDS
CLASS A SHARES
60 DWS SMALL CAP INDEX VIP
HYPOTHETICAL EXPENSE SUMMARY
Using the annual portfolio operating expense ratios presented in the fee tables
in the portfolio prospectus, the Hypothetical Expense Summary shows the
estimated fees and expenses, in actual dollars, that would be charged on a
hypothetical investment of $10,000 in the portfolio held for the next 10 years
and the impact of such fees and expenses on portfolio returns for each year and
cumulatively, assuming a 5% return for each year. The tables also assume that
all dividends and distributions are reinvested. The annual portfolio expense
ratios shown are net of any contractual fee waivers or expense reimbursements,
if any, for the period of the contractual commitment. Also, please note that if
you are investing through a third party provider, that provider may have fees
and expenses separate from those of the portfolio that are not reflected here.
Mutual fund fees and expenses fluctuate over time and actual expenses may be
higher or lower than those shown.
The Hypothetical Expense Summary should not be used or construed as an offer to
sell, a solicitation of an offer to buy or a recommendation or endorsement of
any specific mutual fund. You should carefully review the portfolio's
prospectus to consider the investment objectives, risks, expenses and charges
of the portfolio prior to investing.
DWS SMALL CAP INDEX VIP - CLASS A
INITIAL HYPOTHETICAL ASSUMED RATE
MAXIMUM INVESTMENT: OF RETURN:
SALES CHARGE: $10,000 5%
0.00% ---------------------------------- ---------------------------------
CUMULATIVE CUMULATIVE HYPOTHETICAL
RETURN BEFORE RETURN AFTER YEAR-END BALANCE ANNUAL
FEES AND ANNUAL FUND FEES AND AFTER FEES AND FEES AND
YEAR EXPENSES EXPENSE RATIOS EXPENSES EXPENSES EXPENSES
----- ------------- -------------- ------------ ---------------- --------
1 5.00% 0.47% 4.53% $ 10,453.00 $ 48.06
2 10.25% 0.50% 9.23% $ 10,923.39 $ 53.44
3 15.76% 0.50% 14.15% $ 11,414.94 $ 55.85
4 21.55% 0.50% 19.29% $ 11,928.61 $ 58.36
5 27.63% 0.50% 24.65% $ 12,465.40 $ 60.99
6 34.01% 0.50% 30.26% $ 13,026.34 $ 63.73
7 40.71% 0.50% 36.13% $ 13,612.53 $ 66.60
8 47.75% 0.50% 42.25% $ 14,225.09 $ 69.59
9 55.13% 0.50% 48.65% $ 14,865.22 $ 72.73
10 62.89% 0.50% 55.34% $ 15,534.15 $ 76.00
TOTAL $625.35
DWS VARIABLE SERIES I - DWS INVESTMENTS VIT FUNDS
CLASS A SHARES
DWS SMALL CAP INDEX VIP 61
OTHER POLICIES AND RISKS
While the previous pages describe the main points of each portfolio's strategy
and risks, there are a few other issues to know about:
o Each portfolio may trade securities actively. This could raise transaction
costs and, accordingly, lower performance.
o The Advisor, or a subadvisor, will establish a debt security's credit quality
when it buys a security, using independent ratings, or for unrated
securities, its own credit determination. When ratings don't agree, a
portfolio will use the higher rating. If a security's credit quality falls,
the Advisor or subadvisor will determine whether selling it would be in a
portfolio's best interest.
FOR MORE INFORMATION
This prospectus doesn't tell you about every policy or risk of investing in
each portfolio.
If you want more information on each portfolio's allowable securities and
investment practices and the characteristics and risks of each one, you may
want to request a copy of the Statement of Additional Information (the back
cover tells you how to do this).
Keep in mind that there is no assurance that a portfolio will achieve its
objective.
A complete list of each portfolio's portfolio holdings as of the month-end is
posted on www.dws-scudder.com (the Web site does not form a part of this
prospectus) on or after the last day of the following month. This posted
information generally remains accessible at least until the date on which a
portfolio files its Form N-CSR or N-Q with the Securities and Exchange
Commission for the period that includes the date as of which the posted
information is current. In addition, each portfolio's (except DWS Bond VIP) top
ten equity holdings and other information about each portfolio is posted on
www.dws-scudder.com as of the calendar quarter-end on or after the 15th day
following quarter end. Each portfolio's Statement of Additional Information
includes a description of a portfolio's policies and procedures with respect to
the disclosure of a portfolio's portfolio holdings.
THE INVESTMENT ADVISOR
Deutsche Investment Management Americas Inc. ("DIMA" or the "Advisor"), is the
investment advisor for each portfolio. Under the supervision of the Board
Members, the Advisor, with headquarters at 345 Park Avenue, New York, NY 10154,
or a subadvisor, makes portfolio investment decisions, buys and sells
securities for each portfolio and conducts research that leads to these
purchase and sale decisions. The Advisor provides a full range of global
investment advisory services to institutional and retail clients.
DWS Scudder is part of Deutsche Asset Management, which is the marketing name
in the US for the asset management activities of Deutsche Bank AG, DIMA,
Deutsche Bank Trust Company Americas and DWS Trust Company.
Deutsche Asset Management is a global asset management organization that offers
a wide range of investing expertise and resources, including hundreds of
portfolio managers and analysts and an office network that reaches the world's
major investment centers. This well-resourced global investment platform brings
together a wide variety of experience and investment insight across industries,
regions, asset classes and investing styles.
The Advisor is an indirect, wholly owned subsidiary of Deutsche Bank AG.
Deutsche Bank AG is a major global banking institution that is engaged in a
wide range of financial services, including investment management, mutual
funds, retail, private and commercial banking, investment banking and
insurance.
DWS VARIABLE SERIES I - DWS INVESTMENTS VIT FUNDS
CLASS A SHARES
62 OTHER POLICIES AND RISKS
The Advisor receives a management fee from each portfolio. Below is the
management rate paid by each portfolio for the most recent fiscal year, as a
percentage of each portfolio's average daily net assets:
PORTFOLIO NAME FEE PAID
-------------- --------
DWS Bond VIP 0.39%
DWS Growth & Income VIP 0.38%*
DWS Capital Growth VIP 0.36%*
DWS Global Opportunities VIP 0.87%*
DWS International VIP 0.74%
DWS Health Care VIP 0.67%
DWS Equity 500 Index VIP 0.16%*
DWS Small Cap Index VIP 0.33%*
* Reflecting the effect of expense limitations and/or fee waivers then in
effect.
A discussion regarding the basis for the Board renewal of each portfolio's
investment management agreement and, as applicable, subadvisory agreement, and
sub-subadvisory agreement is contained in the shareholder reports for the
annual period ended December 31, 2007 (see "Shareholder reports" on the back
cover).
In addition, under a separate administrative services agreement between each
portfolio and Deutsche Investment Management Americas Inc., each portfolio pays
the Advisor for providing most of each portfolio's administrative services.
PORTFOLIO SUBADVISORS
SUBADVISOR FOR DWS BOND VIP
Pursuant to an investment subadvisory agreement between the Advisor and
Aberdeen Asset Management Inc. ("AAMI"), an investment adviser registered under
the Investment Advisers Act of 1940, as amended, AAMI acts as subadvisor. As
the subadvisor, AAMI, under the supervision of the Board and the Advisor, makes
investment decisions, buys and sells securities and conducts the research that
leads to these purchase and sale decisions. AAMI provides a full range of
international investment advisory services to institutional and retail clients.
AAMI is a direct, wholly owned subsidiary of Aberdeen Asset Management PLC, the
parent company of an asset management group formed in 1983. AAMI is located at
1735 Market Street, Philadelphia, PA 19103.
SUB-SUBADVISOR FOR DWS BOND VIP
Pursuant to an investment sub-subadvisory agreement between AAMI and Aberdeen
Asset Management Investment Services Limited ("AAMISL"), an investment adviser
registered under the Investment Advisers Act of 1940, as amended, AAMISL acts
as the sub-subadvisor for the portfolio. As the sub-subadvisor, AAMISL, under
the supervision of the Board of Trustees, DIMA and AAMI, manages the
portfolio's investments in foreign securities, foreign currencies and related
investments and conducts the research that leads to these investments. AAMISL
provides a full range of international investment advisory services to
institutional and retail clients. AAMI continues to manage the core bond and
active fixed income strategies of the portfolio.
AAMISL will be paid for its sub-subadvisory services by AAMI, the portfolio's
subadvisor, from AAMI's subadvisory fee paid by DIMA to AAMI.
SUBADVISOR FOR DWS EQUITY 500 INDEX VIP AND DWS SMALL CAP INDEX VIP
Northern Trust Investments, N.A. ("NTI"), the subadvisor for DWS Equity 500
Index VIP and DWS Small Cap Index VIP, is located at 50 South LaSalle Street,
Chicago, IL 60603. NTI is an investment adviser registered under the Investment
Advisers Act of 1940, as amended. It primarily manages assets for defined
contribution and benefit plans, investment companies and other institutional
investors. NTI is a subsidiary of The Northern Trust Company ("TNTC"). TNTC is
an Illinois state chartered banking organization and a member of the Federal
DWS VARIABLE SERIES I - DWS INVESTMENTS VIT FUNDS
CLASS A SHARES
THE INVESTMENT ADVISOR 63
Reserve System. Formed in 1889, TNTC administers and manages assets for
individuals, personal trusts, defined contribution and benefit plans and other
institutional and corporate clients. TNTC is the principal subsidiary of
Northern Trust Corporation, a company that is regulated by the Board of
Governors of the Federal Reserve System as a financial holding company under
the U.S. Bank Holding Company Act of 1956, as amended. Northern Trust
Corporation, through its subsidiaries, has for more than 100 years managed the
assets of individuals, charitable organizations, foundations and large
corporate investors. As of December 31, 2007, NTI and its affiliates had assets
under custody of $4.1 trillion, and assets under investment management of
$757.2 billion.
DWS VARIABLE SERIES I - DWS INVESTMENTS VIT FUNDS
CLASS A SHARES
64 PORTFOLIO SUBADVISORS
--------------------------------------------------------------------------------
YOUR INVESTMENT IN THE PORTFOLIOS
The information in this section may affect anyone who selects one or more
portfolios as an investment option in a variable annuity contract or variable
life insurance policy that offers one or more portfolios. These contracts and
policies are described in separate prospectuses issued by participating
insurance companies. Each portfolio assumes no responsibility for such
prospectuses.
POLICIES ABOUT TRANSACTIONS
The information in this prospectus applies to Class A shares of each portfolio.
Each portfolio offers two classes of shares (except DWS Equity 500 Index VIP,
which offers three classes of shares). Class A shares are offered at net asset
value and are not subject to 12b-1 fees.
Technically, the shareholders of DWS Variable Series I and DWS Investments VIT
Funds (which include each portfolio just described) are the participating
insurance companies (the "insurance companies") that offer each portfolio as
choices for holders of certain variable annuity contracts or variable life
insurance policies (the "contract(s)") issued or sponsored by the insurance
companies. The insurance companies effectively pass through the ownership of
portfolio shares to their contract owners and some may pass through voting
rights as well. Each portfolio does not sell shares directly to the public.
Each portfolio sells shares only to separate accounts of insurance companies.
As a contract owner, your premium payments are allocated to a portfolio by the
insurance companies in accordance with your contract. Please see the contract
prospectus that accompanies this prospectus for a detailed explanation of your
contract.
Please bear in mind that there are important differences between funds
available to any investor (a "Retail Fund") and those that are only available
through certain financial institutions, such as insurance companies. For
example, Retail Funds, unlike a portfolio, are not sold to insurance company
separate accounts to fund investments in variable insurance contracts. In
addition, the investment objectives, policies and strategies of a portfolio,
while similar to those of a Retail Fund, are not identical. Retail Funds may be
smaller or larger than a portfolio and have different expense ratios than the
portfolios. As a result, the performance of a portfolio and a Retail Fund will
differ.
Should any conflict between contract owners arise that would require that a
substantial amount of net assets be withdrawn from a portfolio, orderly
portfolio management could be disrupted to the potential detriment of contract
owners of that portfolio.
Each portfolio has a verification process for new insurance company accounts to
help the government fight the funding of terrorism and money laundering
activities. Federal law requires all financial institutions to obtain, verify
and record information that identifies each insurance company that opens an
account. This means that when an insurance company opens an account, a
portfolio will ask for its name, address and other information that will allow
a portfolio to identify the company. This information will be verified to
ensure the identity of all insurance companies opening an account.
For certain insurance companies, a portfolio might request additional
information (for instance, a portfolio would ask for documents such as the
insurance company's articles of incorporation) to help a portfolio verify the
insurance company's identity.
Each portfolio will not complete the purchase of any shares for an account
until all information has been provided and the application has been submitted
in "good order." Once the application is determined to be in good order, the
purchase(s) will be effected at the net asset value per share next calculated.
Each portfolio may reject a new account application if the insurance company
doesn't provide any required or requested identifying information, or for other
reasons.
DWS VARIABLE SERIES I - DWS INVESTMENTS VIT FUNDS
CLASS A SHARES
YOUR INVESTMENT IN THE PORTFOLIOS 65
BUYING AND SELLING SHARES
Each PORTFOLIO IS OPEN FOR BUSINESS each day the New York Stock Exchange is
open. Each portfolio calculates its share price every business day, as of the
close of regular trading on the New York Stock Exchange (typically 4 p.m.
Eastern time, but sometimes earlier, as in the case of scheduled half-day
trading or unscheduled suspensions of trading).
Each portfolio continuously sells shares to each insurance company separate
account, without a sales charge, at the net asset value per share next
determined after a proper purchase order is placed by the insurance company.
The insurance company offers contract owners units in its separate accounts
which correspond to shares in a portfolio. Each insurance company submits
purchase and redemption orders to a portfolio based on allocation instructions
for premium payments, transfer instructions and surrender or partial withdrawal
requests for contract owners, as set forth in the accompanying prospectus for
the contracts. These orders reflect the amount of premium payments to be
invested, surrender and transfer requests, and other matters. Redemption orders
are effected at the next net asset value per share determined after a proper
redemption order is placed by the insurance company. Contract owners should
look at their contract prospectuses for redemption procedures and fees.
IMPORTANT INFORMATION ABOUT BUYING AND SELLING SHARES
o After receiving a contract owner's order, the insurance company buys or sells
shares at the net asset value next calculated on any day a portfolio is open
for business.
o Unless otherwise instructed, a portfolio normally makes payment of the
proceeds from the sale of shares the next business day but always within
seven calendar days.
o Each portfolio does not issue share certificates.
o Each portfolio reserves the right to reject purchases of shares for any
reason.
o Each portfolio reserves the right to withdraw or suspend the offering of
shares at any time.
o Each portfolio reserves the right to reject purchases of shares or to suspend
or postpone redemptions at times when the New York Stock Exchange is closed
(other than customary closings), trading is restricted or when an emergency
exists that prevents a portfolio from disposing of its portfolio securities
or pricing its shares.
o Each portfolio may refuse, cancel or rescind any purchase order; freeze any
account (meaning the insurance company will not be able to purchase shares
in its account); suspend account services; and/or involuntarily redeem the
account if we think that the account is being used for fraudulent or illegal
purposes by the insurance company; one or more of these actions will be
taken when, at the sole discretion of a portfolio, they are deemed to be in
a portfolio's best interest or when a portfolio is requested or compelled to
do so by governmental authority or by applicable law.
o Each portfolio may close and liquidate an account if a portfolio is unable to
verify provided information, or for other reasons; if a portfolio decides to
close the account, the shares will be redeemed at the net asset value per
share next calculated after we determine to close the account; the insurance
company may be subject to gain or loss on the redemption of the portfolio
shares and may incur tax liability.
o Each portfolio may pay you for shares you sell by "redeeming in kind," that
is, by giving you marketable securities (which typically will involve
brokerage costs for you to liquidate) rather than cash, but which will be
taxable to the same extent as a redemption for cash; a portfolio generally
won't make a redemption in kind unless your requests over a 90-day period
total more than $250,000 or 1% of the value of a portfolio's net assets,
whichever is less.
o A purchase order from an insurance company separate account may not be
accepted if the sale of portfolio shares has been suspended or if it is
determined that the purchase would be detrimental to the interests of a
portfolio's shareholders.
MARKET TIMING POLICIES AND PROCEDURES. Short-term and excessive trading of
portfolio shares may present risks to each portfolio's long-term shareholders
(as used herein, the term "shareholders" may refer to the contract owners),
including potential dilution in the value of portfolio shares, interference
with the efficient management of a portfolio (including losses on the sale of
investments), taxable gains to remaining
DWS VARIABLE SERIES I - DWS INVESTMENTS VIT FUNDS
CLASS A SHARES
66 YOUR INVESTMENT IN THE PORTFOLIOS
shareholders and increased brokerage and administrative costs. These risks may
be more pronounced if a portfolio invests in certain securities such as those
that trade in foreign markets, are illiquid or do not otherwise have "readily
available market quotations." Certain investors may seek to employ short-term
trading strategies aimed at exploiting variations in portfolio valuation that
arise from the nature of the securities held by a portfolio (e.g., "time zone
arbitrage"). Each portfolio has adopted policies and procedures that are
intended to detect and deter short-term and excessive trading.
Pursuant to these policies, each portfolio reserves the right to reject or
cancel a purchase or exchange order for any reason without prior notice. For
example, a portfolio may in its discretion reject or cancel a purchase or an
exchange order even if the transaction is not subject to the specific roundtrip
transaction limitation described below if the Advisor believes that there
appears to be a pattern of short-term or excessive trading activity by a
shareholder or deems any other trading activity harmful or disruptive to a
portfolio. Each portfolio, through its Advisor and transfer agent, will measure
short-term and excessive trading by the number of roundtrip transactions within
a shareholder's account during a rolling 12-month period. A "roundtrip"
transaction is defined as any combination of purchase and redemption activity
(including exchanges) of the same portfolio's shares. Each portfolio may take
other trading activity into account if a portfolio believes such activity is of
an amount or frequency that may be harmful to long-term shareholders or
disruptive to portfolio management.
Shareholders are limited to four roundtrip transactions in the same portfolio
over a rolling 12-month period. Shareholders with four or more roundtrip
transactions in the same portfolio within a rolling 12-month period generally
will be blocked from making additional purchases of, or exchanges into, that
portfolio. Each portfolio has sole discretion whether to remove a block from a
shareholder's account. The rights of a shareholder to redeem shares of each
portfolio are not affected by the four roundtrip transaction limitation.
The Advisor may make exceptions to the roundtrip transaction policy for certain
types of transactions if in its opinion the transactions do not represent
short-term or excessive trading or are not abusive or harmful to each
portfolio, such as, but not limited to, systematic transactions, required
minimum retirement distributions, transactions initiated by each portfolio or
administrator and transactions by certain qualified fund-of-fund(s).
In certain circumstances, each portfolio may rely upon the policy of the
insurance company or other financial intermediary to deter short-term or
excessive trading if the Advisor believes that the policy of such insurance
company or other financial intermediary is reasonably designed to detect and
deter transactions that are not in the best interest of each portfolio. An
insurance company's or other financial intermediary's policy relating to
short-term or excessive trading may be more or less restrictive than each
portfolio's policies, may permit certain transactions not permitted by each
portfolio's policies, or prohibit transactions not subject to each portfolio's
policies.
The Advisor may also accept undertakings from an insurance company or other
financial intermediary to enforce short-term or excessive trading policies on
behalf of each portfolio that provide a substantially similar level of
protection for each portfolio against such transactions. For example, certain
insurance companies may have contractual or legal restrictions, or operational
constraints, that prevent them from blocking an account. In such instances, the
Advisor may permit the insurance company to use alternate techniques that the
Advisor considers to be a reasonable substitute for such a block.
In addition, each portfolio that invests some portion of its assets in foreign
securities has adopted certain fair valuation practices intended to protect
each portfolio from "time zone arbitrage" with respect to its foreign
securities holdings and other trading practices that seek to exploit variations
in portfolio valuation that arise from the nature of the securities held by
each portfolio. (See "How each Portfolio Calculates Share Price.")
There is no assurance that these policies and procedures will be effective in
limiting short-term and excessive trading in all cases. For example, the
Advisor may not be able to effectively monitor, detect or limit short-term or
excessive trading by underlying contract holders that occurs through separate
accounts maintained by insurance companies or other financial intermediaries.
The Advisor reviews trading activity at the separate account level to detect
short-term or excessive trading. If the Advisor has reason to suspect that
short-term or excessive trading is occurring at the separate account level, the
Advisor will contact the insurance company or other financial intermediary to
request underlying shareholder level activity. Depending on the amount of
portfolio shares held in such separate account (which may represent most of
each portfolio's shares), short-term and/or excessive trading of portfolio
shares could adversely affect long-term shareholders in each portfolio. If
short-term or excessive trading is identified, the Advisor will take
appropriate action.
Each portfolio's market timing policies and procedures may be modified or
terminated at any time.
DWS VARIABLE SERIES I - DWS INVESTMENTS VIT FUNDS
CLASS A SHARES
YOUR INVESTMENT IN THE PORTFOLIOS 67
HOW TO RECEIVE ACCOUNT INFORMATION
If you are a contract owner, you should contact your insurance company or the
organization that provides record keeping services for information about your
account.
Please see the contract prospectus that accompanies this prospectus for the
customer service phone number.
HOW TO SELECT SHARES
Shares in a portfolio are available in connection with certain variable annuity
and life insurance arrangements. Each insurance company has different
provisions about how and when their contract owners may select portfolio
shares. Each insurance company is responsible for communicating its contract
owners' instructions to a portfolio. Contract owners should contact their
insurance company to effect transactions in connection with a portfolio.
FINANCIAL INTERMEDIARY SUPPORT PAYMENTS
The Advisor, DWS Scudder Distributors, Inc. (the "Distributor") and/or their
affiliates may pay additional compensation, out of their own assets and not as
an additional charge to each portfolio, to selected financial advisors in
connection with the sale and/or distribution of portfolio shares or the
retention and/or servicing of fund investors and fund shares ("revenue
sharing"). Such revenue sharing payments are in addition to any distribution or
service fees payable under any Rule 12b-1 or service plan of each portfolio, any
record keeping/sub-transfer agency/networking fees payable by each portfolio
(generally through the Distributor or an affiliate) and/or the Distributor to
certain financial advisors for performing such services and any sales charge,
commissions, non-cash compensation arrangements expressly permitted under
applicable rules of the Financial Industry Regulatory Authority or other
concessions described in the fee table or elsewhere in this prospectus or the
Statement of Additional Information as payable to all financial advisors. For
example, the Advisor, the Distributor and/or their affiliates may compensate
financial advisors for providing a portfolio with "shelf space" or access to a
third party platform or portfolio offering list or other marketing programs,
including, without limitation, inclusion of the portfolio on preferred or
recommended sales lists, mutual fund "supermarket" platforms and other formal
sales programs; granting the Distributor access to the financial advisor's sales
force; granting the Distributor access to the financial advisor's conferences
and meetings; assistance in training and educating the financial advisor's
personnel; and obtaining other forms of marketing support.
The level of revenue sharing payments made to financial advisors may be a fixed
fee or based upon one or more of the following factors: gross sales, current
assets and/or number of accounts of each portfolio attributable to the
financial advisor, the particular portfolio or portfolio type or other measures
as agreed to by the Advisor, the Distributor and/or their affiliates and the
financial advisors or any combination thereof. The amount of these revenue
sharing payments is determined at the discretion of the Advisor, the
Distributor and/or their affiliates from time to time, may be substantial, and
may be different for different financial advisors based on, for example, the
nature of the services provided by the financial advisor.
The Advisor, the Distributor and/or their affiliates currently make revenue
sharing payments from their own assets in connection with the sale and/or
distribution of DWS Fund shares or the retention and/or servicing of investors
and DWS Fund shares to financial advisors in amounts that generally range from
..01% up to .50% of assets of each portfolio serviced and maintained by the
financial advisor, .10% to .25% of sales of each portfolio attributable to the
financial advisor, a flat fee of $13,350 up to $500,000, or any combination
thereof. These amounts are subject to change at the discretion of the Advisor,
the Distributor and/or their affiliates. Receipt of, or the prospect of
receiving, this additional compensation may influence your financial advisor's
recommendation of each portfolio or of any particular share class of each
portfolio. You should review your financial advisor's compensation disclosure
and/or talk to your financial advisor to obtain more information on how this
compensation may have influenced your financial advisor's recommendation of
each portfolio. Additional information regarding these revenue sharing payments
is included in each portfolio's Statement of Additional Information, which is
available to you on request at no charge (see the back cover of this prospectus
for more information on how to request a copy of the Statement of Additional
Information).
The Advisor, the Distributor and/or their affiliates may also make such revenue
sharing payments to financial advisors under the terms discussed above in
connection with the distribution of both DWS funds and non-DWS funds by
financial advisors to retirement plans that obtain record keeping services from
ADP, Inc. on the DWS
DWS VARIABLE SERIES I - DWS INVESTMENTS VIT FUNDS
CLASS A SHARES
68 YOUR INVESTMENT IN THE PORTFOLIOS
Scudder branded retirement plan platform (the "Platform") with the level of
revenue sharing payments being based upon sales of both the DWS funds and the
non-DWS funds by the financial advisor on the Platform or current assets of
both the DWS funds and the non-DWS funds serviced and maintained by the
financial advisor on the Platform.
It is likely that broker-dealers that execute portfolio transactions for each
portfolio will include firms that also sell shares of the DWS funds to their
customers. However, the Advisor will not consider sales of DWS fund shares as a
factor in the selection of broker-dealers to execute portfolio transactions for
the DWS funds. Accordingly, the Advisor has implemented policies and procedures
reasonably designed to prevent its traders from considering sales of DWS fund
shares as a factor in the selection of broker-dealers to execute portfolio
transactions for each portfolio. In addition, the Advisor, the Distributor
and/or their affiliates will not use fund brokerage to pay for their obligation
to provide additional compensation to financial advisors as described above.
HOW EACH PORTFOLIO CALCULATES SHARE PRICE
To calculate net asset value per share, or NAV, each portfolio uses the
following equation:
TOTAL ASSETS - TOTAL LIABILITIES
---------------------------------- = NAV
TOTAL NUMBER OF SHARES OUTSTANDING
The price at which you buy and sell shares for each portfolio is the NAV.
We typically value securities using information furnished by an independent
pricing service or market quotations, where appropriate. However, we may use
methods approved by the Board, such as a fair valuation model, which are
intended to reflect fair value when pricing service information or market
quotations are not readily available or when a security's value or a meaningful
portion of the value of a portfolio is believed to have been materially
affected by a significant event, such as a natural disaster, an economic event
like a bankruptcy filing, or a substantial fluctuation in domestic or foreign
markets, that has occurred between the close of the exchange or market on which
the security is principally traded (for example, a foreign exchange or market)
and the close of the New York Stock Exchange. In such a case, a portfolio's
value for a security is likely to be different from the last quoted market
price or pricing service information. In addition, due to the subjective and
variable nature of fair value pricing, it is possible that the value determined
for a particular asset may be materially different from the value realized upon
such asset's sale. It is expected that the greater the percentage of portfolio
assets that is invested in non-US securities, the more extensive will be a
portfolio's use of fair value pricing. This is intended to reduce a portfolio's
exposure to "time zone arbitrage" and other harmful trading practices. (See
"Market Timing Policies and Procedures.")
To the extent that a portfolio invests in securities that are traded primarily
in foreign markets, the value of its holdings could change at a time when you
aren't able to buy or sell portfolio shares through the contract. This is
because some foreign markets are open on days and at times when each portfolio
doesn't price the shares.
DISTRIBUTIONS
Each portfolio intends to declare and distribute dividends from their net
investment income and capital gains, if any, annually. Each portfolio may make
additional distributions if necessary.
All distributions will be reinvested in shares of a portfolio unless we are
informed by an insurance company that they should be paid out in cash. The
insurance companies will be informed about the amount and character of
distributions from the relevant portfolio for federal income tax purposes.
TAXES
Each portfolio intends to qualify each year as a regulated investment company
under Subchapter M of the Internal Revenue Code of 1986, as amended, (the
"Code") and to meet all requirements necessary to avoid paying any federal
income or excise taxes.
DWS VARIABLE SERIES I - DWS INVESTMENTS VIT FUNDS
CLASS A SHARES
YOUR INVESTMENT IN THE PORTFOLIOS 69
Generally, owners of variable annuity and variable life contracts are not taxed
currently on income or gains realized with respect to such contracts. However,
some distributions from such contracts, whether made prior to or during the
annuity payment period, may be taxable at ordinary income tax rates. In
addition, distributions made to an owner who is younger than 59 1|M/2 may be
subject to a 10% penalty tax. For further information concerning federal income
tax consequences for the holders of variable annuity contracts and variable
life insurance policies, such holders should consult the prospectus used in
connection with the issuance of their particular contracts or policies.
In order for investors to receive the favorable tax treatment available to
holders of variable annuity and variable life contracts, the separate accounts
underlying such contracts, as well as the funds in which such accounts invest,
must meet certain diversification requirements. Each portfolio intends to
comply with these requirements. If a portfolio or separate account does not
meet such requirements or otherwise fails to qualify as a regulated investment
company for any taxable year, income allocable to the contracts associated with
the separate account will be taxable currently to the holders of such contracts
and income from prior periods with respect to such contracts also could be
taxable, most likely in the year of the failure.
Under Treasury regulations, insurance companies holding the separate accounts
may have to report to the Internal Revenue Service losses above a certain
amount resulting from a sale or disposition of a portfolio's shares.
The discussion above is generally based on the assumption that shares of a
portfolio will be respected as owned by insurance company separate accounts. If
this is not the case (for example, because the Internal Revenue Service finds
an impermissible level of "investor control" over the investment options
underlying variable contracts), the advantageous tax treatment provided in
respect of insurance company separate accounts under the Code will no longer be
available, and the person or persons determined to own the portfolio shares
will be currently taxed on portfolio distributions, and on the proceeds of any
redemption of portfolio shares, under the Code rules.
Portfolio investments in securities of foreign issuers may be subject to
withholding and other taxes at the source, including on dividend or interest
payments. Participating insurance companies should consult their own tax
advisors as to whether such distributions are subject to federal income tax if
they are retained as part of policy reserves.
A portfolio's investments in certain debt obligations may cause the portfolio
to recognize taxable income in excess of the cash generated by such obligation.
Thus, a portfolio could be required at times to liquidate other investments in
order to satisfy its distribution requirements.
The preceding is a brief summary of certain of the relevant tax considerations.
Because each shareholder and contract holder's tax situation is unique, ask
your tax professional about the tax consequences of your investments, including
possible foreign, state or local taxes.
DWS VARIABLE SERIES I - DWS INVESTMENTS VIT FUNDS
CLASS A SHARES
70 DISTRIBUTIONS
--------------------------------------------------------------------------------
TO GET MORE INFORMATION
SHAREHOLDER REPORTS - These include commentary from each portfolio's management
team about recent market conditions and the effects of each portfolio's
strategies on its performance. They also have detailed performance figures, a
list of everything each portfolio owns, and its financial statements.
Shareholders get these reports automatically.
STATEMENT OF ADDITIONAL INFORMATION (SAI) - This tells you more about each
portfolio's features and policies, including additional risk information. The
SAI is incorporated by reference into this document (meaning that it's legally
part of this prospectus).
For a free copy of any of these documents or to request other information about
a portfolio, call (800) 778 -1482, or contact DWS Scudder at the address listed
below. Each portfolio's SAI and shareholder reports are also available through
the DWS Scudder Web site at www.dws-scudder.com. These documents and other
information about the portfolio are available from the EDGAR Database on the
SEC's Internet site at www.sec.gov. If you like, you may obtain copies of this
information, after paying a copying fee, by e-mailing a request to
publicinfo@sec.gov or by writing the SEC at the address listed below. You can
also review and copy these documents and other information about the portfolio,
including the portfolio's SAI, at the SEC's Public Reference Room in
Washington, D.C. Information on the operation of the SEC's Public Reference
Room may be obtained by calling (800) SEC-0330.
DWS SCUDDER DISTRIBUTORS, INC. SEC
222 South Riverside Plaza 100 F Street, N.E.
Chicago, IL 60606-5808 Washington, D.C. 20549-0102
(800) 621-1148 WWW.SEC.GOV
(800) SEC-0330
SEC FILE NUMBER:
-------------------------------------
DWS Variable Series I 811-04257
DWS Investments VIT Funds 811-07507
(05/01/08) 1a-A
DWS VARIABLE SERIES II
SUPPLEMENT TO THE CURRENTLY EFFECTIVE PROSPECTUSES OF EACH OF
THE LISTED PORTFOLIOS:
-----------------
DWS Janus Growth & Income VIP
DWS Davis Venture Value VIP
The Board of each portfolio noted above has given preliminary approval to a
proposal by Deutsche Investment Management Americas Inc. ("DIMA"), the advisor
of each portfolio, to effect the following portfolio mergers:
--------------------------------------------------------------------------------
Acquired Portfolios Acquiring Portfolios
--------------------------------------------------------------------------------
DWS Janus Growth & Income VIP DWS Variable Series I: DWS Capital Growth VIP
--------------------------------------------------------------------------------
DWS Davis Venture Value VIP DWS Variable Series II: DWS Large Cap Value VIP
--------------------------------------------------------------------------------
Completion of each merger is subject to a number of conditions, including final
approval by a portfolio's Board and approval by shareholders of the Acquired
Portfolios at a shareholder meeting expected to be held on or about the first
quarter of 2009. Prior to the shareholder meeting, you and your insurance
company will receive: (i) a proxy statement/prospectus describing in detail the
proposed merger and the Board's considerations in recommending that shareholders
approve the merger; and (ii) a prospectus for the applicable Acquiring
Portfolio. You will also receive a voting instruction form and instructions on
how to submit your voting instructions to your insurance company. Your insurance
company, as shareholder, will actually vote the shares corresponding to your
investment (likely by executing a proxy card) once it receives your voting
instructions.
Please Retain This Supplement for Future Reference
December 1, 2008
st-VS_merger
SUPPLEMENT TO THE CURRENTLY EFFECTIVE PROSPECTUSES
OF EACH OF THE LISTED PORTFOLIOS:
================================================================================
DWS Investments VIT Funds
DWS Equity 500 Index VIP
DWS Small Cap Index VIP
================================================================================
DWS Variable Series I
DWS Bond VIP
DWS Capital Growth VIP
DWS Global Opportunities VIP
DWS Growth & Income VIP
DWS Health Care VIP
DWS International VIP
================================================================================
DWS Variable Series II
DWS Balanced VIP DWS International Select Equity VIP
DWS Blue Chip VIP DWS Janus Growth & Income VIP
DWS Conservative Allocation VIP DWS Large Cap Value VIP
DWS Core Fixed Income VIP DWS Mid Cap Growth VIP
DWS Davis Venture Value VIP DWS Moderate Allocation VIP
DWS Dreman High Return Equity VIP DWS Money Market VIP
DWS Dreman Small Mid Cap Value VIP DWS Small Cap Growth VIP
DWS Global Thematic VIP DWS Strategic Income VIP
DWS Government & Agency Securities VIP DWS Technology VIP
DWS Growth Allocation VIP DWS Turner Mid Cap Growth VIP
DWS High Income VIP
The following information replaces similar disclosure regarding the schedule for
posting portfolio holdings in the "Other Policies and Risks -- For more
information" section of each portfolio's prospectuses:
A complete list of each portfolio's portfolio holdings is posted as of the month
end on www.dws-investments.com on or about the 15th day of the following month.
More frequent postings of portfolio holdings may be made from time to time on
www.dws-investments.com.
Please Retain This Supplement for Future Reference
[Logo]DWS
INVESTMENTS
Deutsche Bank Group
October 27, 2008
VS-3614
MAY 1, 2008
PROSPECTUS
DWS VARIABLE SERIES II
CLASS A
DWS BALANCED VIP
DWS BLUE CHIP VIP
DWS CORE FIXED INCOME VIP
DWS DAVIS VENTURE VALUE VIP
DWS DREMAN HIGH RETURN EQUITY VIP
DWS DREMAN SMALL MID CAP VALUE VIP
DWS GLOBAL THEMATIC VIP
DWS GOVERNMENT & AGENCY SECURITIES VIP
DWS HIGH INCOME VIP
DWS INTERNATIONAL SELECT EQUITY VIP
DWS JANUS GROWTH & INCOME VIP
DWS LARGE CAP VALUE VIP
DWS MID CAP GROWTH VIP
DWS MONEY MARKET VIP
DWS SMALL CAP GROWTH VIP
DWS STRATEGIC INCOME VIP
DWS TECHNOLOGY VIP
DWS TURNER MID CAP GROWTH VIP
This prospectus should be read in conjunction with the variable life insurance
or variable annuity contract prospectus and plan documents for tax-qualified
plans. These shares are available and are being marketed exclusively as a
pooled funding vehicle for life insurance companies writing all types of
variable life insurance policies and variable annuity contracts.
The Securities and Exchange Commission (SEC) does not approve or disapprove
these shares or determine whether the information in this prospectus is
truthful or complete. It is a criminal offense for anyone to inform you
otherwise.
ONE GLOBAL FORCE. ONE FOCUS. YOU. [DWS SCUDDER LOGO]
Deutsche Bank Group
--------------------------------------------------------------------------------
TABLE OF CONTENTS
HOW EACH PORTFOLIO WORKS
3 DWS Balanced VIP
12 DWS Blue Chip VIP
18 DWS Core Fixed Income VIP
25 DWS Davis Venture Value VIP
31 DWS Dreman High Return
Equity VIP
38 DWS Dreman Small Mid Cap
Value VIP
45 DWS Global Thematic VIP
53 DWS Government & Agency
Securities VIP
60 DWS High Income VIP
67 DWS International Select Equity
VIP
74 DWS Janus Growth & Income
VIP
80 DWS Large Cap Value VIP
86 DWS Mid Cap Growth VIP
93 DWS Money Market VIP
99 DWS Small Cap Growth VIP
106 DWS Strategic Income VIP
114 DWS Technology VIP
121 DWS Turner Mid Cap Growth
VIP
127 Other Policies and Risks
127 The Investment Advisor
130 Portfolio Subadvisors
YOUR INVESTMENT IN THE PORTFOLIOS
134 Buying and Selling Shares
137 How each Portfolio Calculates
Share Price
138 Distributions
138 Taxes
HOW EACH PORTFOLIO WORKS
Each portfolio is designed to serve as an investment option for certain
variable annuity contracts, variable life insurance policies and tax-qualified
plans. Your investment in a portfolio is made in conjunction with one of these
contracts or policies. Each portfolio has its own investment objective and
strategy.
Remember that each portfolio is not a bank deposit. Each portfolio is not
insured or guaranteed by the Federal Deposit Insurance Corporation or any other
government agency. Share prices will go up and down and you could lose money by
investing.
Please read this prospectus in conjunction with the prospectus for your
variable life insurance policy or variable annuity contract or plan documents
for tax-qualified plans.
DWS BALANCED VIP
THE PORTFOLIO'S MAIN INVESTMENT STRATEGY
The portfolio seeks high total return, a combination of income and capital
appreciation.
The portfolio can buy many types of securities, among them common stocks,
convertible securities, corporate bonds, US government bonds, mortgage- and
asset-backed securities and certain derivatives. The portfolio normally invests
approximately 60% of its net assets in common stocks and other equity
securities and approximately 40% of its net assets in fixed-income securities,
including lower-quality high-yield debt securities. These percentages may
fluctuate in response to changing market conditions, but the portfolio will at
all times invest at least 25% of net assets in fixed-income senior securities.
Generally, most securities are from US issuers, but the portfolio may invest up
to 25% of total assets in foreign securities.
The Advisor allocates the portfolio's assets among various asset categories
including growth and value stocks of large capitalization companies, small
capitalization companies and investment-grade and high-yield debt securities.
The Advisor reviews the portfolio's allocation among the various asset
categories periodically and may adjust the portfolio's allocation among various
asset categories based on current or expected market conditions or to manage
risk as is consistent with the portfolio's overall investment strategy.
The Advisor uses one or more strategies within each asset category for
selecting equity and debt securities for the portfolio. Each strategy is
managed by a team of portfolio managers that specialize in a respective asset
category. The strategies that the Advisor may implement utilize a variety of
quantitative and qualitative techniques.
iGAP STRATEGY. In addition to the portfolio's main investment strategy, the
Advisor seeks to enhance returns by employing a global tactical asset
allocation overlay strategy. This strategy, which the Advisor calls iGAP
(integrated Global Alpha Platform), attempts to take advantage of short-term
and medium-term mispricings within global bond, equity and currency markets.
The iGAP strategy is implemented through the use of derivatives, which are
contracts or other instruments whose value is based on, for example, indices,
currencies or securities. The iGAP strategy primarily uses exchange-traded
futures contracts on global bonds and equity indices and over-the-counter
forward currency contracts, and is expected to have a low correlation to the
portfolio's other securities holdings. Because the iGAP strategy relies
primarily on futures, forward currency contracts and other derivative
instruments, the aggregate notional market exposure obtained from such
investments within the iGAP strategy may range up to 100% of the net assets of
the portfolio (assuming the maximum allocation to the iGAP strategy).
SECURITIES LENDING. The portfolio may lend its investment securities, in an
amount up to 33 1/3% of its total assets, to approved institutional borrowers
who need to borrow securities in order to complete certain transactions.
DERIVATIVES. In addition to derivatives utilized within the iGAP strategy, the
portfolio managers may, but are not required to, also use various types of
derivatives. Derivatives may be used for hedging and for risk management or
non-hedging purposes to enhance potential gains. The portfolio may use
derivatives in circumstances where the portfolio managers believe they offer a
more efficient or economical means of gaining exposure to a particular asset
class or market or to maintain a high level of liquidity to meet shareholder
redemptions or other needs while maintaining exposure to the market. In
particular, the portfolio managers may use futures, options, forward currency
transactions and swaps.
Although major changes tend to be infrequent, the Board of Trustees could
change the portfolio's investment objective without seeking shareholder
approval.
OTHER INVESTMENTS
As a temporary defensive measure, the portfolio could shift up to 100% of its
assets into investments such as money market securities. This measure could
prevent losses, but, while engaged in a temporary defensive position, the
portfolio will not be pursuing its investment objective. However, the Advisor
may choose not to use these strategies for various reasons, even in very
volatile market conditions.
DWS VARIABLE SERIES II - CLASS A SHARES DWS BALANCED
VIP 3
THE MAIN RISKS OF INVESTING IN THE PORTFOLIO
There are several risk factors that could hurt the portfolio's performance,
cause you to lose money or cause the portfolio's performance to trail that of
other investments.
ASSET ALLOCATION RISK. Although asset allocation among different asset
categories generally reduces risk and exposure to any one category, the risk
remains that the Advisor may favor an asset category that performs poorly
relative to the other asset categories. Because the portfolio may employ more
than one team of portfolio managers to manage each strategy within the asset
categories in which the portfolio's assets are allocated, it is possible that
different portfolio management teams could be purchasing or selling the same
security at the same time which could affect the price at which the portfolio
pays, or receives, for a particular security. In addition, it is possible that
as one team of portfolio managers is purchasing a security another team of
portfolio managers could be selling the same security resulting in no
significant change in the overall assets of the portfolio but incurring
additional costs for the portfolio. Further, because the Advisor may
periodically adjust the portfolio's allocation among various asset categories,
the portfolio may incur additional costs associated with portfolio turnover.
STOCK MARKET RISK. The portfolio is affected by how the stock market performs.
To the extent the portfolio invests in a particular capitalization or market
sector, the portfolio's performance may be proportionately affected by that
segment's general performance. When stock prices fall, you should expect the
value of your investment to fall as well. Because a stock represents ownership
in its issuer, stock prices can be hurt by poor management, shrinking product
demand and other business risks. These factors may affect single companies as
well as groups of companies. In addition, movements in financial markets may
adversely affect a stock's price, regardless of how well the company performs.
The market as a whole may not favor the types of investments the portfolio
makes, which could affect the portfolio's ability to sell them at an attractive
price.
INDUSTRY RISK. While the portfolio does not concentrate in any industry, to the
extent that the portfolio has exposure to a given industry or sector, any
factors affecting that industry or sector could affect the value of portfolio
securities. For example, manufacturers of consumer goods could be hurt by a
rise in unemployment or technology companies could be hurt by such factors as
market saturation, price competition and rapid obsolescence.
CREDIT RISK. A portfolio purchasing bonds faces the risk that the
creditworthiness of an issuer may decline, causing the value of the bonds to
decline. In addition, an issuer may not be able to make timely payments on the
interest and/or principal on the bonds it has issued. Because the issuers of
high-yield bonds or junk bonds (bonds rated below the fourth highest category)
may be in uncertain financial health, the prices of these bonds may be more
vulnerable to bad economic news or even the expectation of bad news, than
investment-grade bonds. In some cases, bonds, particularly high-yield bonds,
may decline in credit quality or go into default. Because the portfolio may
invest in securities not paying current interest or in securities already in
default, these risks may be more pronounced.
INTEREST RATE RISK. Generally, fixed income securities will decrease in value
when interest rates rise. The longer the effective maturity of the portfolio's
securities, the more sensitive the portfolio will be to interest rate changes.
(As a general rule, a 1% rise in interest rates means a 1% fall in value for
every year of duration.) As interest rates decline, the issuers of securities
held by the portfolio may prepay principal earlier than scheduled, forcing the
portfolio to reinvest in lower-yielding securities. Prepayment may reduce the
portfolio's income. As interest rates increase, slower than expected principal
payments may extend the average life of fixed income securities. This will have
the effect of locking in a below-market interest rate, increasing the
portfolio's duration and reducing the value of such a security. Because the
portfolio may invest in mortgage-related securities, it is more vulnerable to
both of these risks.
SMALL COMPANY CAPITALIZATION RISK. Small company stocks tend to experience
steeper price fluctuations than the stocks of larger companies. A shortage of
reliable information can also pose added risk to small company stocks.
Industry-wide reversals may have a greater impact on small companies, since
they lack the financial resources of large companies. Small company stocks are
typically less liquid than large company stocks. Accordingly, it may be harder
to find buyers for small company shares.
FOREIGN INVESTMENT RISK. To the extent the portfolio has exposure to companies
based outside the US, it faces the risks inherent in foreign investing. Adverse
political, economic or social developments could undermine the value of the
portfolio's investments or prevent the portfolio from realizing their full
value. Financial reporting
4 DWS BALANCED VIP DWS VARIABLE SERIES II -
CLASS A SHARES
standards for companies based in foreign markets differ from those in the US.
Additionally, foreign securities markets generally are smaller and less liquid
than the US markets. These risks tend to be greater in emerging markets so, to
the extent the portfolio invests in emerging markets, it takes on greater
risks. The currency of a country in which the portfolio has invested could
decline relative to the value of the US dollar, which decreases the value of
the investment to US investors. The investments of the portfolio may be subject
to foreign withholding taxes.
PRICING RISK. At times, market conditions may make it difficult to value some
investments, and the portfolio may use certain valuation methodologies for some
of its investments, such as fair value pricing. Given the subjective nature of
such valuation methodologies, it is possible that the value determined for an
investment may be different than the value realized upon such investment's
sale. If the portfolio has valued its securities too highly, you may pay too
much for portfolio shares when you buy into the portfolio. If the portfolio has
underestimated the price of its securities, you may not receive the full market
value when you sell your portfolio shares.
DERIVATIVES RISK. Risks associated with derivatives include the risk that the
derivative is not well correlated with the security, index or currency to which
it relates; the risk that derivatives may result in losses or missed
opportunities; the risk that the portfolio will be unable to sell the
derivative because of an illiquid secondary market; the risk that a
counterparty is unwilling or unable to meet its obligation and the risk that
the derivative transaction could expose the portfolio to the effects of
leverage, which could increase the portfolio's exposure to the market and
magnify potential losses. There is no guarantee that derivatives, to the extent
employed, will have the intended effect, and their use could cause lower
returns or even losses to the portfolio. The use of derivatives by the
portfolio to hedge risk may reduce the opportunity for gain by offsetting the
positive effect of favorable price movements.
iGAP RISK. The success of the iGAP strategy depends, in part, on the Advisor's
ability to analyze the correlation between various global markets and asset
classes. If the Advisor's correlation analysis proves to be incorrect, losses
to the fund may be significant and may exceed the intended level of market
exposure for the iGAP strategy.
SECURITIES LENDING RISK. Any loss in the market price of securities loaned by
the portfolio that occurs during the term of the loan would be borne by the
portfolio and would adversely affect the portfolio's performance. Also, there
may be delays in recovery of securities loaned or even a loss of rights in the
collateral should the borrower of the securities fail financially while the
loan is outstanding. However, loans will be made only to borrowers selected by
the portfolio's delegate after a review of relevant facts and circumstances,
including the creditworthiness of the borrower.
SECURITY SELECTION RISK. A risk that pervades all investing is the risk that
the securities in the portfolio's portfolio may decline in value.
Other factors that could affect performance include:
o portfolio management could be wrong in the analysis of industries, companies,
economic trends, the relative attractiveness of different securities or
other matters.
o the Advisor measures credit quality at the time it buys securities, using
independent rating agencies or, for unrated securities, the Advisor's own
credit quality standards. If a security's credit quality declines, the
Advisor will decide what to do with the security, based on the circumstances
and its assessment of what would benefit shareholders most.
This portfolio is designed for investors interested in asset class
diversification in a single portfolio that invests in a mix of stocks and
bonds.
PERFORMANCE - CLASS A
While a portfolio's past performance isn't necessarily a sign of how it will do
in the future, it can be valuable for an investor to know.
The bar chart shows how the returns for the portfolio's Class A shares have
varied from year to year, which may give some idea of risk. The table shows
average annual returns for the portfolio and comparable index information
(which, unlike the portfolio, does not have any fees or expenses). The
performance of both the portfolio and the comparable index information varies
over time. All figures assume reinvestment of dividends and distributions.
DWS VARIABLE SERIES II - CLASS A SHARES DWS BALANCED
VIP 5
This information doesn't reflect charges and fees associated with the separate
account that invests in the portfolio or any variable life insurance policy or
variable annuity contract for which the portfolio is an investment option.
These charges and fees will reduce returns.
ANNUAL TOTAL RETURN (%) as of 12/31 each year - CLASS A
[BARGRAPHIC APPEARS HERE]
15.14 14.81 -2.63 -6.09 -15.17 18.10 6.64 4.30 10.24 4.84
1998 1999 2000 2001 2002 2003 2004 2005 2006 2007
FOR THE PERIODS INCLUDED IN THE BAR CHART:
BEST QUARTER: 12.82%, Q4 1998 WORST QUARTER: -9.91%, Q2 2002
2008 TOTAL RETURN AS OF MARCH 31: -5.52%
AVERAGE ANNUAL TOTAL RETURNS (%) as of 12/31/2007
1 YEAR 5 YEARS 10 YEARS
------ ------- --------
Portfolio - Class A 4.84 8.71 4.53
Russell 1000 Index 5.77 13.43 6.20
Russell 2000 Index -1.57 16.25 7.08
Standard & Poor's (S&P) 500 Index 5.49 12.83 5.91
Lehman Brothers U.S. Aggregate Index 6.97 4.42 5.97
MSCI EAFE Index 11.17 21.59 8.66
Credit Suisse High Yield Index 2.65 10.97 6.10
Merrill Lynch 3-Month US Treasury Bill Index 5.03 3.07 3.77
Total returns would have been lower if operating expenses hadn't been reduced.
RUSSELL 1000 (Reg. TM) INDEX is an unmanaged price-only index of the 1,000
largest capitalized companies that are domiciled in the US and whose common
stocks are traded.
RUSSELL 2000 (Reg. TM) INDEX is an unmanaged capitalization-weighted measure of
approximately 2,000 small US stocks.
STANDARD & POOR'S 500 INDEX (S&P 500) is an unmanaged, capitalization-weighted
index of 500 stocks. The index is designed to measure performance of the broad
domestic economy through changes in the aggregate market value of 500 stocks
representing all major industries.
LEHMAN BROTHERS U.S. AGGREGATE INDEX is an unmanaged market value-weighted
measure of Treasury issues, agency issues, corporate bond issues and mortgage
securities.
MORGAN STANLEY CAPITAL INTERNATIONAL EUROPE, AUSTRALASIA AND THE FAR EAST (MSCI
EAFE (Reg. TM)) INDEX is an unmanaged index that tracks international stock
performance in the 21 developed markets of Europe, Australasia and the Far
East.
CREDIT SUISSE HIGH YIELD INDEX is an unmanaged trader-priced portfolio,
constructed to mirror the global high-yield debt market.
MERRILL LYNCH 3-MONTH US TREASURY BILL INDEX is an unmanaged index capturing
the performance of a single issue maturing closest to, but not exceeding, three
months from the re-balancing date.
Current performance information may be higher or lower than the performance
data quoted above. For more recent performance information, contact your
participating insurance company.
6 DWS BALANCED VIP DWS VARIABLE SERIES II -
CLASS A SHARES
HOW MUCH INVESTORS PAY
This table describes the fees and expenses that you may pay if you buy and hold
portfolio shares. The information in the table does not reflect charges and
fees associated with the separate account that invests in the portfolio or any
variable life insurance policy or variable annuity contract for which the
portfolio is an investment option. These charges and fees will increase
expenses.
FEE TABLE CLASS A
--------- --------
ANNUAL OPERATING EXPENSES, deducted from portfolio assets
Management Fee1 0.36%
Distribution/Service (12b-1) Fee None
Other Expenses2 0.16
TOTAL ANNUAL OPERATING EXPENSES 0.52
1 Restated on an annualized basis to reflect approved fee changes taking
effect on May 1, 2008.
2 Restated on an annualized basis to reflect approved fee changes taking
effect on May 1, 2008. Includes a 0.10% administrative services fee paid
to the Advisor.
Based on the costs above, this example helps you compare the expenses of Class
A shares to those of other mutual funds. This example assumes the expenses
above remain the same. It also assumes that you invested $10,000, earned 5%
annual returns, reinvested all dividends and distributions and sold your shares
at the end of each period. This is only an example; actual expenses will be
different.
EXAMPLE 1 YEAR 3 YEARS 5 YEARS 10 YEARS
------- ------ ------- ------- --------
Class A shares $53 $167 $291 $653
DWS VARIABLE SERIES II - CLASS A SHARES DWS BALANCED
VIP 7
THE PORTFOLIO MANAGERS
The portfolio is managed by separate teams of investment professionals who
develop and implement each strategy within a particular asset category which
together make up the portfolio's overall investment strategy. Each portfolio
management team has authority over all aspects of the portion of the portfolio
allocated to it, including, but not limited to, purchases and sales of
individual securities, portfolio construction techniques, portfolio risk
assessment and the management of daily cash flows in accordance with portfolio
holdings.
The following people handle the day-to-day management of the portfolio:
William Chepolis, CFA
Managing Director of Deutsche Asset Management and Portfolio Manager of the
portfolio.
o Joined Deutsche Asset Management in 1998 after 13 years of experience as
vice president and portfolio manager for Norwest Bank, where he managed
the bank's fixed income and foreign exchange portfolios.
o Portfolio Manager for Retail Mortgage Backed Securities: New York.
o Joined the portfolio in 2005.
o BIS, University of Minnesota.
Matthew F. MacDonald
Director of Deutsche Asset Management and Portfolio Manager of the portfolio.
o Joined Deutsche Asset Management and the portfolio in 2006 after 14
years of fixed income experience at Bank of America Global Structured
Products and PPM America, Inc., where he was portfolio manager for public
fixed income, including MBS, ABS, CDOs and corporate bonds; earlier, as an
analyst for MBS, ABS and money markets; and originally, at Duff & Phelps
Credit Rating Company.
o Portfolio Manager for Retail Mortgage Backed Securities: New York.
o BA, Harvard University; MBA, University of Chicago Graduate School of
Business.
Inna Okounkova
Director of Deutsche Asset Management and Portfolio Manager of the portfolio.
o Lead portfolio manager for Asset Allocation strategies: New York.
o Joined Deutsche Asset Management in 1999 as quantitative analyst,
becoming associate portfolio manager in 2001.
o Joined the portfolio in 2005.
o BS, MS, Moscow State University; MBA, University of Chicago Graduate
School of Business.
Gary Sullivan, CFA
Managing Director of Deutsche Asset Management and Portfolio Manager of the
portfolio.
o Joined Deutsche Asset Management in 1996 and the portfolio in 2006.
Served as head of the High Yield group in Europe and as an Emerging
Markets portfolio manager.
o Prior to that, four years at Citicorp as a research analyst and
structurer of collateralized mortgage obligations. Prior to Citicorp,
served as an officer in the US Army from 1988 to 1991.
o BS, United States Military Academy (West Point); MBA, New York
University, Stern School of Business.
Julie M. Van Cleave, CFA
Managing Director of Deutsche Asset Management and Portfolio Manager of the
portfolio.
o Joined Deutsche Asset Management and the portfolio in 2002.
o Head of Large Cap Growth Portfolio Selection Team.
o Previous experience includes 18 years of investment industry experience
at Mason Street Advisors, as Managing Director and team leader for the
large cap investment team.
o BBA, MBA, University of Wisconsin -
Madison.
Robert Wang
Managing Director of Deutsche Asset Management and Portfolio Manager of the
portfolio.
o Joined Deutsche Asset Management in 1995 as portfolio manager for asset
allocation after 13 years of experience of trading fixed income, foreign
exchange and derivative products at J.P. Morgan.
o Global Head of Quantitative Strategies Portfolio Management: New York.
o Joined the portfolio in 2005.
o BS, The Wharton School, University of Pennsylvania.
Jin Chen, CFA
Director of Deutsche Asset Management and Portfolio Manager of the portfolio.
o Senior portfolio manager for Global Strategies: New York.
o Joined Deutsche Asset Management in 1999; prior to that, served as
portfolio manager for Absolute Return Strategies and as a fundamental
equity analyst and portfolio manager for Thomas White Asset Management.
o Joined the portfolio in 2007.
o BS, Nanjing University; MS, Michigan State University.
Julie Abbett
Director of Deutsche Asset Management and Portfolio Manager of the portfolio.
o Senior portfolio manager for Global Quantitative Equity: New York.
o Joined Deutsche Asset Management in 2000 after four years of combined
experience as a consultant with equity trading services for BARRA, Inc.
and a product developer for FactSet Research.
o Joined the portfolio in 2007.
o BA, University of Connecticut.
Thomas Picciochi
Director of Deutsche Asset Management and Portfolio Manager of the portfolio.
o Senior portfolio manager for Quantitative Strategies: New York.
o Joined Deutsche Asset Management in 1999, formerly serving as portfolio
manager for Absolute Return Strategies, after 13 years of experience in
various research and analysis positions at State Street Global Advisors,
FPL Energy, Barnett Bank, Trade Finance Corporation and Reserve Financial
Management.
o Joined the portfolio in 2007.
o BA and MBA, University of Miami.
8 DWS BALANCED VIP DWS VARIABLE SERIES II -
CLASS A SHARES
Matthias Knerr, CFA
Managing Director Deutsche Asset Management and Portfolio Manager of the
portfolio.
o Joined Deutsche Asset Management in 1995 as a member of the International
Equity team, serving as portfolio manager and investment analyst, and
joined the portfolio in 2007.
o Senior portfolio manager for International Select Equity and
International Equity Strategies: New York.
o Previously served as portfolio manager for the Deutsche European Equity
Fund and the Deutsche Global Select Equity Fund, and as head of global
equity research team for Capital Goods sector: London.
o BS, Pennsylvania State University.
Thomas Schuessler, PhD
Managing Director of Deutsche Asset Management and Portfolio Manager of the
portfolio.
o Joined Deutsche Asset Management in 2001 after 5 years at Deutsche Bank
where he managed various projects and worked in the office of the Chairman
of the Management Board.
o US and Global Fund Management: Frankfurt.
o PhD, University of Heidelberg, studies in physics and economics at
University of Heidelberg and University of Utah.
John Brennan
Director of Deutsche Asset Management and Portfolio Manager of the portfolio.
o Portfolio and Sector Manager for Institutional Fixed Income: Louisville.
o Joined Deutsche Asset Management and the portfolio in 2007 after 14 years
of experience at INVESCO and Freddie Mac. Previously, was head of
Structured Securities sector team at INVESCO and before that was senior
fixed income portfolio manager at Freddie Mac specializing in MBS, CMBS,
collateralized mortgage obligations, ARMS, mortgage derivatives, US
Treasuries and agency debt.
o BS, University of Maryland; MBA William & Mary.
J. Richard Robben, CFA
Vice President of Deutsche Asset Management and Portfolio Manager of the
portfolio.
o Joined Deutsche Asset Management and the portfolio in 2007 after 11 years
of experience at INVESCO Institutional, most recently as senior portfolio
manager for LIBOR-related strategies and head of portfolio construction
group for North American Fixed Income.
o BA, Bellarmine University.
The portfolio's Statement of Additional Information provides additional
information about a portfolio manager's investments in the portfolio, a
description of the portfolio management compensation structure, and information
regarding other accounts managed.
DWS VARIABLE SERIES II - CLASS A SHARES DWS BALANCED
VIP 9
FINANCIAL HIGHLIGHTS
This table is designed to help you understand the portfolio's financial
performance. The figures in the first part of the table are for a single share.
The total return figures represent the percentage that an investor in the
portfolio would have earned (or lost), assuming all dividends and distributions
were reinvested. This information has been audited by Ernst & Young LLP, an
independent registered public accounting firm, whose report, along with the
portfolio's financial statements, is included in the portfolio's annual report
(see "Shareholder reports" on the back cover). The following table includes
selected data for a share outstanding throughout each period and other
performance information derived from the financial statements.
This information doesn't reflect charges and fees associated with the separate
account that invests in the portfolio or any variable life insurance policy or
variable annuity contract for which the portfolio is an investment option.
These charges and fees will reduce returns.
DWS BALANCED VIP - CLASS A
YEARS ENDED DECEMBER 31, 2007 2006 2005 2004 2003
----------------------------------------------- ------- ------- ------- ------- -------
SELECTED PER SHARE DATA
-----------------------------------------------------------------------------------------------------------
NET ASSET VALUE, BEGINNING OF PERIOD $ 24.46 $ 22.75 $ 22.37 $ 21.32 $ 18.66
----------------------------------------------- ------- ------- ------- ------- -------
Income (loss) from investment operations:
Net investment income a .74 .69d .59 .47 .37
----------------------------------------------- ------- ------- ------- ------- -------
Net realized and unrealized gain (loss) .42 1.60 .34 .93 2.90
----------------------------------------------- ------- ------- ------- ------- -------
TOTAL FROM INVESTMENT OPERATIONS 1.16 2.29 .93 1.40 3.27
----------------------------------------------- ------- ------- ------- ------- -------
Less distributions from:
Net investment income ( .81) ( .58) ( .55) ( .35) ( .61)
----------------------------------------------- ------- ------- ------- ------- -------
NET ASSET VALUE, END OF PERIOD $ 24.81 $ 24.46 $ 22.75 $ 22.37 $ 21.32
----------------------------------------------- ------- ------- ------- ------- -------
Total Return (%) 4.84b 10.24b,d 4.30b 6.64 18.10
----------------------------------------------- ------- ------- ------- ------- -------
RATIOS TO AVERAGE NET ASSETS AND SUPPLEMENTAL DATA
-----------------------------------------------------------------------------------------------------------
Net assets, end of period ($ millions) 528 600 653 622 667
----------------------------------------------- ------- ------- ------- ------- -------
Ratio of expenses before expense reductions (%) .52 .55 .55 .59 .59
----------------------------------------------- ------- ------- ------- ------- -------
Ratio of expenses after expense reductions (%) .51 .51 .53 .59 .59
----------------------------------------------- ------- ------- ------- ------- -------
Ratio of net investment income (%) 3.00 2.99d 2.66 2.18 1.88
----------------------------------------------- ------- ------- ------- ------- -------
Portfolio turnover rate (%) 190c 108 121c 131c 102c
----------------------------------------------- ------- ------- ------- ------- -------
a Based on average shares outstanding during the period.
b Total return would have been lower had certain expenses not been reduced.
c The portfolio turnover rate including mortgage dollar roll transactions was
199%, 122%, 140% and 108% for the years ended December 31, 2007, December
31, 2005, December 31, 2004 and December 31, 2003, respectively.
d Includes non-recurring income from the Advisor recorded as a result of an
administrative proceeding regarding disclosure of brokerage allocation
practices in connection with sales of DWS Scudder Funds. The non-recurring
income resulted in an increase in net investment income of $0.024 per share
and an increase in the ratio of net investment income of 0.10%. Excluding
this non-recurring income, total return would have been 0.10% lower.
10 DWS BALANCED VIP DWS VARIABLE SERIES II -
CLASS A SHARES
HYPOTHETICAL EXPENSE SUMMARY
Using the annual portfolio operating expense ratios presented in the fee tables
in the portfolio prospectus, the Hypothetical Expense Summary shows the
estimated fees and expenses, in actual dollars, that would be charged on a
hypothetical investment of $10,000 in the portfolio held for the next 10 years
and the impact of such fees and expenses on portfolio returns for each year and
cumulatively, assuming a 5% return for each year. The tables also assume that
all dividends and distributions are reinvested. The annual portfolio expense
ratios shown are net of any contractual fee waivers or expense reimbursements,
if any, for the period of the contractual commitment. Also, please note that if
you are investing through a third party provider, that provider may have fees
and expenses separate from those of the portfolio that are not reflected here.
Mutual fund fees and expenses fluctuate over time and actual expenses may be
higher or lower than those shown.
The Hypothetical Expense Summary should not be used or construed as an offer to
sell, a solicitation of an offer to buy or a recommendation or endorsement of
any specific mutual fund. You should carefully review the portfolio's
prospectus to consider the investment objectives, risks, expenses and charges
of the portfolio prior to investing.
DWS BALANCED VIP - CLASS A
INITIAL HYPOTHETICAL ASSUMED RATE
MAXIMUM INVESTMENT: OF RETURN:
SALES CHARGE: $10,000 5%
0.00% ---------------------------------- --------------------------------
CUMULATIVE CUMULATIVE HYPOTHETICAL
RETURN BEFORE RETURN AFTER YEAR-END BALANCE ANNUAL
FEES AND ANNUAL FUND FEES AND AFTER FEES AND FEES AND
YEAR EXPENSES EXPENSE RATIOS EXPENSES EXPENSES EXPENSES
----- ------------- -------------- ------------ ---------------- --------
1 5.00% 0.52% 4.48% $ 10,448.00 $ 53.16
2 10.25% 0.52% 9.16% $ 10,916.07 $ 55.55
3 15.76% 0.52% 14.05% $ 11,405.11 $ 58.04
4 21.55% 0.52% 19.16% $ 11,916.06 $ 60.64
5 27.63% 0.52% 24.50% $ 12,449.90 $ 63.35
6 34.01% 0.52% 30.08% $ 13,007.65 $ 66.19
7 40.71% 0.52% 35.90% $ 13,590.40 $ 69.15
8 47.75% 0.52% 41.99% $ 14,199.25 $ 72.25
9 55.13% 0.52% 48.35% $ 14,835.37 $ 75.49
10 62.89% 0.52% 55.00% $ 15,500.00 $ 78.87
TOTAL $652.69
DWS VARIABLE SERIES II - CLASS A SHARES DWS BALANCED
VIP 11
DWS BLUE CHIP VIP
THE PORTFOLIO'S MAIN INVESTMENT STRATEGY
The portfolio seeks growth of capital and income.
Under normal circumstances, the portfolio invests at least 80% of its net
assets, plus the amount of any borrowings for investment purposes, in common
stocks of large US companies that are similar in size to the companies in the
S&P 500 Index (as of February 29, 2008, the S&P 500 Index had a median market
capitalization of $10.8 billion) and that the portfolio managers consider to be
"blue chip" companies. Blue chip companies are large, well-known companies that
typically have an established earnings and dividends history, easy access to
credit, solid positions in their industry and strong management.
The portfolio managers look for "blue chip" companies whose stock price is
attractive relative to potential growth. The managers use quantitative stock
techniques and fundamental equity analysis to evaluate each company's stock
price relative to the company's earnings, operating trends, market outlook and
other measures of performance potential.
The portfolio managers will normally sell a stock when the managers believe its
fundamental factors have changed, other investments offer better opportunities
or in the case of adjusting the portfolio's emphasis on or within a given
industry.
SECURITIES LENDING. The portfolio may lend its investment securities in an
amount up to 33 1/3% of its total assets to approved institutional borrowers
who need to borrow securities in order to complete certain transactions.
Although major changes tend to be infrequent, the Board of Trustees could
change the portfolio's investment objective without seeking shareholder
approval. However, the Board will provide shareholders with at least 60 days'
notice prior to making any changes to the portfolio's 80% investment policy.
OTHER INVESTMENTS
While the portfolio invests mainly in US common stocks, it could invest up to
20% of its net assets in foreign securities. The portfolio may also invest in
other types of equity securities such as preferred stocks or convertible
securities.
The portfolio is permitted, but not required, to use various types of
derivatives (contracts whose value is based on, for example, indices,
currencies or securities). Derivatives may be used for hedging and for risk
management or for non-hedging purposes to seek to enhance potential gain. The
portfolio may use derivatives in circumstances where portfolio management
believes they offer an economical means of gaining exposure to a particular
asset class or to keep cash on hand to meet shareholder redemptions or other
needs while maintaining exposure to the market.
As a temporary defensive measure, the portfolio could shift up to 100% of its
assets into investments such as money market securities. This measure could
prevent losses, but, while engaged in a temporary defensive position, the
portfolio will not be pursuing its investment objective. However, the portfolio
managers may choose not to use these strategies for various reasons, even in
very volatile market conditions.
THE MAIN RISKS OF INVESTING IN THE PORTFOLIO
There are several risk factors that could hurt the portfolio's performance,
cause you to lose money or cause the portfolio's performance to trail that of
other investments.
STOCK MARKET RISK. The portfolio is affected by how the stock market performs.
To the extent the portfolio invests in a particular capitalization or market
sector, the portfolio's performance may be proportionately affected by that
segment's general performance. When stock prices fall, you should expect the
value of your investment to fall as well. Because a stock represents ownership
in its issuer, stock prices can be hurt by poor management, shrinking product
demand and other business risks. These factors may affect single companies as
12 DWS BLUE CHIP VIP DWS VARIABLE SERIES II -
CLASS A SHARES
well as groups of companies. In addition, movements in financial markets may
adversely affect a stock's price, regardless of how well the company performs.
The market as a whole may not favor the types of investments the portfolio
makes, which could affect the portfolio's ability to sell them at an attractive
price.
GROWTH INVESTING RISK. Since growth stocks usually reinvest a large portion of
earnings in their own businesses, they may lack the dividends associated with
value stocks that might otherwise cushion their decline in a falling market.
Earnings disappointments in growth stocks often result in sharp price declines
because investors buy these stocks for their potential superior earnings
growth. Growth stocks may also be out of favor for certain periods in relation
to value stocks.
VALUE INVESTING RISK. At times, "value" investing may perform better than or
worse than other investment styles and the overall market. If portfolio
management overestimates the value or return potential of one or more common
stocks, the portfolio may underperform the general equity market. Value stocks
may also be out of favor for certain periods in relation to growth stocks.
INDUSTRY RISK. While the portfolio does not concentrate in any industry, to the
extent that the portfolio has exposure to a given industry or sector, any
factors affecting that industry or sector could affect the value of portfolio
securities. For example, manufacturers of consumer goods could be hurt by a
rise in unemployment or technology companies could be hurt by such factors as
market saturation, price competition and rapid obsolescence.
DERIVATIVES RISK. Risks associated with derivatives include the risk that the
derivative is not well correlated with the security, index or currency to which
it relates; the risk that derivatives may result in losses or missed
opportunities; the risk that the portfolio will be unable to sell the
derivative because of an illiquid secondary market; the risk that a
counterparty is unwilling or unable to meet its obligation and the risk that
the derivative transaction could expose the portfolio to the effects of
leverage, which could increase the portfolio's exposure to the market and
magnify potential losses. There is no guarantee that derivatives, to the extent
employed, will have the intended effect, and their use could cause lower
returns or even losses to the portfolio. The use of derivatives by the
portfolio to hedge risk may reduce the opportunity for gain by offsetting the
positive effect of favorable price movements.
SECURITIES LENDING RISK. Any loss in the market price of securities loaned by
the portfolio that occurs during the term of the loan would be borne by the
portfolio and would adversely affect the portfolio's performance. Also, there
may be delays in recovery of securities loaned or even a loss of rights in the
collateral should the borrower of the securities fail financially while the
loan is outstanding. However, loans will be made only to borrowers selected by
the portfolio's delegate after a review of relevant facts and circumstances,
including the creditworthiness of the borrower.
PRICING RISK. At times, market conditions may make it difficult to value some
investments, and the portfolio may use certain valuation methodologies for some
of its investments, such as fair value pricing. Given the subjective nature of
such valuation methodologies, it is possible that the value determined for an
investment may be different than the value realized upon such investment's
sale. If the portfolio has valued its securities too highly, you may pay too
much for portfolio shares when you buy into the portfolio. If the portfolio has
underestimated the price of its securities, you may not receive the full market
value when you sell your portfolio shares.
SECURITY SELECTION RISK. A risk that pervades all investing is the risk that
the securities in the portfolio's portfolio may decline in value.
Other factors that could affect performance include:
o portfolio management could be wrong in the analysis of industries, companies,
economic trends, the relative attractiveness of different securities or
other matters.
o foreign securities may be more volatile than their US counterparts, for
reasons such as currency fluctuations and political and economic
uncertainty.
Investors with long-term goals who are interested in a core stock investment
may be interested in this portfolio.
DWS VARIABLE SERIES II - CLASS A SHARES DWS BLUE CHIP
VIP 13
PERFORMANCE - CLASS A
While a portfolio's past performance isn't necessarily a sign of how it will do
in the future, it can be valuable for an investor to know.
The bar chart shows how the returns for the portfolio's Class A shares have
varied from year to year, which may give some idea of risk. The table shows
average annual returns for the portfolio and comparable index information
(which, unlike the portfolio, does not have any fees or expenses). The
performance of both the portfolio and the comparable index information varies
over time. All figures assume reinvestment of dividends and distributions.
This information doesn't reflect charges and fees associated with the separate
account that invests in the portfolio or any variable life insurance policy or
variable annuity contract for which the portfolio is an investment option.
These charges and fees will reduce returns.
ANNUAL TOTAL RETURN (%) as of 12/31 each year - CLASS A
[BARGRAPHIC APPEARS HERE]
13.84 25.24 -7.84 -15.81 -22.11 27.25 16.04 10.06 15.65 3.50
1998 1999 2000 2001 2002 2003 2004 2005 2006 2007
FOR THE PERIODS INCLUDED IN THE BAR CHART:
BEST QUARTER: 18.26%, Q4 1998 WORST QUARTER: -17.43%, Q3 2001
2008 TOTAL RETURN AS OF MARCH 31: -10.84%
AVERAGE ANNUAL TOTAL RETURNS (%) as of 12/31/2007
1 YEAR 5 YEARS 10 YEARS
------ ------- --------
Portfolio - Class A 3.50 14.23 5.30
Russell 1000 Index 5.77 13.43 6.20
RUSSELL 1000 (Reg. TM) INDEX is an unmanaged price-only index of the 1,000
largest capitalized companies that are domiciled in the US and whose common
stocks are traded.
Current performance information may be higher or lower than the performance
data quoted above. For more recent performance information, contact your
participating insurance company.
14 DWS BLUE CHIP VIP DWS VARIABLE SERIES II -
CLASS A SHARES
HOW MUCH INVESTORS PAY
This table describes the fees and expenses that you may pay if you buy and hold
portfolio shares. The information in the table does not reflect charges and
fees associated with the separate account that invests in the portfolio or any
variable life insurance policy or variable annuity contract for which the
portfolio is an investment option. These charges and fees will increase
expenses.
FEE TABLE CLASS A
--------- -------
ANNUAL OPERATING EXPENSES, deducted from portfolio assets
Management Fee1 0.54%
Distribution/Service (12b-1) Fee None
Other Expenses2 0.17
TOTAL ANNUAL OPERATING EXPENSES 0.71
1 Restated on an annualized basis to reflect approved fee changes taking
effect on May 1, 2008.
2 Restated on an annualized basis to reflect approved fee changes taking
effect on May 1, 2008. Includes a 0.10% administrative services fee paid
to the Advisor.
Based on the costs above, this example helps you compare the expenses of Class
A shares to those of other mutual funds. This example assumes the expenses
above remain the same. It also assumes that you invested $10,000, earned 5%
annual returns, reinvested all dividends and distributions and sold your shares
at the end of each period. This is only an example; actual expenses will be
different.
EXAMPLE 1 YEAR 3 YEARS 5 YEARS 10 YEARS
------- ------ ------- ------- --------
Class A shares $73 $227 $395 $883
THE PORTFOLIO MANAGERS
The portfolio is managed by a team of investment professionals who collaborate
to develop and implement the portfolio's investment strategy. Each portfolio
manager on the team has authority over all aspects of the portfolio's
investment portfolio, including but not limited to, purchases and sales of
individual securities, portfolio construction techniques, portfolio risk
assessment and the management of daily cash flows in accordance with portfolio
holdings.
The following people handle the day-to-day management of the portfolio:
Robert Wang
Managing Director of Deutsche Asset Management and Portfolio Manager of the
portfolio.
o Joined Deutsche Asset Management in 1995 as portfolio manager for asset
allocation after 13 years of experience of trading fixed income and
derivative securities at J.P. Morgan.
o Global Head of Quantitative Strategies Portfolio Management: New York.
o Joined the portfolio in 2003.
o BS, The Wharton School, University of Pennsylvania.
Jin Chen, CFA
Director of Deutsche Asset Management and Portfolio Manager of the portfolio.
o Senior portfolio manager for Global Strategies: New York.
o Joined Deutsche Asset Management in 1999; prior to that, served as
portfolio manager for Absolute Return Strategies and as a fundamental
equity analyst and portfolio manager for Thomas White Asset Management.
o Joined the portfolio in 2006.
o BS, Nanjing University; MS, Michigan State University.
Julie Abbett
Director of Deutsche Asset Management and Portfolio Manager of the portfolio.
o Senior portfolio manager for Global Quantitative Equity: New York.
o Joined Deutsche Asset Management in 2000 after four years of combined
experience as a consultant with equity trading services for BARRA, Inc.
and a product developer for FactSet Research.
o Joined the portfolio in 2006.
o BA, University of Connecticut.
The portfolio's Statement of Additional Information provides additional
information about a portfolio manager's investments in the portfolio, a
description of the portfolio management compensation structure, and information
regarding other accounts managed.
DWS VARIABLE SERIES II - CLASS A SHARES DWS BLUE CHIP
VIP 15
FINANCIAL HIGHLIGHTS
This table is designed to help you understand the portfolio's financial
performance. The figures in the first part of the table are for a single share.
The total return figures represent the percentage that an investor in the
portfolio would have earned (or lost), assuming all dividends and distributions
were reinvested. This information has been audited by Ernst & Young LLP, an
independent registered public accounting firm, whose report, along with the
portfolio's financial statements, is included in the portfolio's annual report
(see "Shareholder reports" on the back cover). The following table includes
selected data for a share outstanding throughout each period and other
performance information derived from the financial statements.
This information doesn't reflect charges and fees associated with the separate
account that invests in the portfolio or any variable life insurance policy or
variable annuity contract for which the portfolio is an investment option.
These charges and fees will reduce returns.
DWS BLUE CHIP VIP - CLASS A
YEARS ENDED DECEMBER 31, 2007 2006 2005 2004 2003
----------------------------------------- ------- -------- ------- ------- -------
SELECTED PER SHARE DATA
----------------------------------------------------------------------------------------------------
NET ASSET VALUE, BEGINNING OF PERIOD $ 16.17 $ 14.88 $ 13.65 $ 11.84 $ 9.37
----------------------------------------- ------- -------- ------- ------- -------
Income (loss) from investment operations:
Net investment income a .17 .17b .14 .13 .08
----------------------------------------- ------- -------- ------- ------- -------
Net realized and unrealized gain (loss) .36 2.07 1.22 1.76 2.45
----------------------------------------- ------- -------- ------- ------- -------
TOTAL FROM INVESTMENT OPERATIONS .53 2.24 1.36 1.89 2.53
----------------------------------------- ------- -------- ------- ------- -------
Less distributions from:
Net investment income ( .18) ( .14) ( .13) ( .08) ( .06)
----------------------------------------- ------- -------- ------- ------- -------
Net realized gains ( 1.87) ( .81) - - -
----------------------------------------- ------- -------- ------- ------- -------
TOTAL DISTRIBUTIONS ( 2.05) ( .95) ( .13) ( .08) ( .06)
----------------------------------------- ------- -------- ------- ------- -------
NET ASSET VALUE, END OF PERIOD $ 14.65 $ 16.17 $ 14.88 $ 13.65 $ 11.84
----------------------------------------- ------- -------- ------- ------- -------
Total Return (%) 3.50 15.65b 10.06 16.04 27.25
----------------------------------------- ------- -------- ------- ------- -------
RATIOS TO AVERAGE NET ASSETS AND SUPPLEMENTAL DATA
----------------------------------------------------------------------------------------------------
Net assets, end of period ($ millions) 242 314 294 283 242
----------------------------------------- ------- -------- ------- ------- -------
Ratio of expenses (%) .71 .71 .70 .70 .71
----------------------------------------- ------- -------- ------- ------- -------
Ratio of net investment income (%) 1.13 1.12b 1.00 1.08 .82
----------------------------------------- ------- -------- ------- ------- -------
Portfolio turnover rate (%) 275 226 288 249 182
----------------------------------------- ------- -------- ------- ------- -------
a Based on average shares outstanding during the period.
b Includes non-recurring income from the Advisor recorded as a result of an
administrative proceeding regarding disclosure of brokerage allocation
practices in connection with sales of DWS Scudder Funds. The non-recurring
income resulted in an increase in net investment income of $0.003 per
share and an increase in the ratio of net investment income of 0.02%.
Excluding this non-recurring income, total return would have been 0.02%
lower.
16 DWS BLUE CHIP VIP DWS VARIABLE SERIES II -
CLASS A SHARES
HYPOTHETICAL EXPENSE SUMMARY
Using the annual portfolio operating expense ratios presented in the fee tables
in the portfolio prospectus, the Hypothetical Expense Summary shows the
estimated fees and expenses, in actual dollars, that would be charged on a
hypothetical investment of $10,000 in the portfolio held for the next 10 years
and the impact of such fees and expenses on portfolio returns for each year and
cumulatively, assuming a 5% return for each year. The tables also assume that
all dividends and distributions are reinvested. The annual portfolio expense
ratios shown are net of any contractual fee waivers or expense reimbursements,
if any, for the period of the contractual commitment. Also, please note that if
you are investing through a third party provider, that provider may have fees
and expenses separate from those of the portfolio that are not reflected here.
Mutual fund fees and expenses fluctuate over time and actual expenses may be
higher or lower than those shown.
The Hypothetical Expense Summary should not be used or construed as an offer to
sell, a solicitation of an offer to buy or a recommendation or endorsement of
any specific mutual fund. You should carefully review the portfolio's
prospectus to consider the investment objectives, risks, expenses and charges
of the portfolio prior to investing.
DWS BLUE CHIP VIP - CLASS A
INITIAL HYPOTHETICAL ASSUMED RATE
MAXIMUM INVESTMENT: OF RETURN:
SALES CHARGE: $10,000 5%
0.00% ---------------------------------- --------------------------------
CUMULATIVE CUMULATIVE HYPOTHETICAL
RETURN BEFORE RETURN AFTER YEAR-END BALANCE ANNUAL
FEES AND ANNUAL FUND FEES AND AFTER FEES AND FEES AND
YEAR EXPENSES EXPENSE RATIOS EXPENSES EXPENSES EXPENSES
----- ------------- -------------- ------------ ---------------- -------
1 5.00% 0.71% 4.29% $ 10,429.00 $ 72.52
2 10.25% 0.71% 8.76% $ 10,876.40 $ 75.63
3 15.76% 0.71% 13.43% $ 11,343.00 $ 78.88
4 21.55% 0.71% 18.30% $ 11,829.62 $ 82.26
5 27.63% 0.71% 23.37% $ 12,337.11 $ 85.79
6 34.01% 0.71% 28.66% $ 12,866.37 $ 89.47
7 40.71% 0.71% 34.18% $ 13,418.34 $ 93.31
8 47.75% 0.71% 39.94% $ 13,993.98 $ 97.31
9 55.13% 0.71% 45.94% $ 14,594.32 $101.49
10 62.89% 0.71% 52.20% $ 15,220.42 $105.84
TOTAL $882.50
DWS VARIABLE SERIES II - CLASS A SHARES DWS BLUE CHIP
VIP 17
DWS CORE FIXED INCOME VIP
THE PORTFOLIO'S MAIN INVESTMENT STRATEGY
The portfolio seeks high current income.
The portfolio invests for current income, not capital appreciation. Under
normal circumstances, the portfolio invests at least 80% of its assets, plus
the amount of any borrowings for investment purposes, determined at the time of
purchase, in fixed income securities. Fixed income securities include those of
the US Treasury, as well as US government agencies and instrumentalities,
corporate, mortgage-backed and asset-backed securities, taxable municipal and
tax-exempt municipal bonds and liquid Rule 144A securities.
The portfolio invests primarily in investment-grade fixed income securities
rated within the top three credit rating categories. The portfolio may invest
up to 20% of its total assets in investment-grade fixed income securities rated
within the fourth highest credit rating category. The portfolio may invest up
to 25% of its total assets in US dollar-denominated securities of foreign
issuers and governments. The portfolio may hold up to 20% of its total assets
in cash or money market instruments in order to maintain liquidity, or in the
event the portfolio managers determine that securities meeting the portfolio's
investment objective are not readily available for purchase. The portfolio's
investments in foreign issuers are limited to US dollar-denominated securities
to avoid currency risk.
The portfolio managers utilize a core US fixed income strategy that seeks to
add incremental returns to the Lehman Brothers U.S. Aggregate Index. In
managing the portfolio, the managers generally use a "bottom-up" approach. The
managers focus on the securities and sectors they believe are undervalued
relative to the market, rather than relying on interest rate forecasts. The
managers seek to identify pricing inefficiencies of individual securities in
the fixed-income market. Normally, the average duration of the portfolio will
be kept within 0.25 years of the duration of the Lehman Brothers U.S. Aggregate
Index.
Company research lies at the heart of the portfolio's investment process. In
selecting individual securities for investment, the portfolio managers:
o assign a relative value, based on creditworthiness, cash flow and price, to
each bond;
o determine the intrinsic value of each issue by examining credit, structure,
option value and liquidity risks. The managers look to exploit any
inefficiencies between intrinsic value and market trading price;
o use credit analysis to determine the issuer's ability to pay interest and
repay principal on its bonds; and
o subordinate sector weightings to individual bonds that may add above-market
value.
PORTFOLIO MATURITY. The portfolio managers intend to maintain a dollar weighted
effective average portfolio maturity of five to ten years. Subject to its
portfolio maturity policy, the portfolio may purchase individual securities
with any stated maturity. The dollar weighted average portfolio maturity may be
shorter than the stated maturity due to several factors, including but not
limited to prepayment patterns, call dates and put features. In implementing
this strategy, the portfolio may experience a high portfolio turnover rate.
SECURITIES LENDING. The portfolio may lend its investment securities, in an
amount up to 33 1/3% of its total assets, to approved institutional borrowers
who need to borrow securities in order to complete certain transactions.
Although major changes tend to be infrequent, the Board of Trustees could
change the portfolio's investment objective without seeking shareholder
approval. However, the Board will provide shareholders with at least 60 days'
notice prior to making any changes to the portfolio's 80% investment policy.
OTHER INVESTMENTS
Although not one of its principal strategies, the portfolio is permitted, but
not required, to use various types of derivatives (contracts whose value is
based on, for example, indices, currencies or securities). Derivatives may be
used for hedging and for risk management or for non-hedging purposes to seek to
enhance potential gains. The portfolio may use derivatives in circumstances
where portfolio management believes they offer an economical means of gaining
exposure to a particular asset class or to keep cash on hand to meet
shareholder redemptions or other needs while maintaining exposure to the
market. In particular, the portfolio may use futures, swaps and options.
18 DWS CORE FIXED INCOME VIP DWS VARIABLE SERIES II -
CLASS A SHARES
As a temporary defensive measure, the portfolio could shift up to 100% of
assets into investments such as money market securities. This measure could
prevent losses, but, while engaged in a temporary defensive position, the
portfolio will not be pursuing its investment objective. However, the portfolio
managers may choose not to use these strategies for various reasons, even in
very volatile market conditions.
THE MAIN RISKS OF INVESTING IN THE PORTFOLIO
There are several risk factors that could hurt the portfolio's performance,
cause you to lose money or cause the portfolio's performance to trail that of
other investments.
INTEREST RATE RISK. Generally, fixed income securities will decrease in value
when interest rates rise. The longer the effective maturity of the portfolio's
securities, the more sensitive the portfolio will be to interest rate changes.
(As a general rule, a 1% rise in interest rates means a 1% fall in value for
every year of duration.) As interest rates decline, the issuers of securities
held by the portfolio may prepay principal earlier than scheduled, forcing the
portfolio to reinvest in lower-yielding securities. Prepayment may reduce the
portfolio's income. As interest rates increase, slower than expected principal
payments may extend the average life of fixed income securities. This will have
the effect of locking in a below-market interest rate, increasing the
portfolio's duration and reducing the value of such a security. Because the
portfolio may invest in mortgage-related securities, it is more vulnerable to
both of these risks.
CREDIT RISK. A portfolio purchasing bonds faces the risk that the
creditworthiness of the issuer may decline, causing the value of its bonds to
decline. In addition, an issuer may be unable or unwilling to make timely
payments on the interest and principal on the bonds it has issued. Because the
issuers of bonds rated below the top three rating categories may be in
uncertain financial health, the prices of their bonds can be more vulnerable to
bad economic news or even the expectation of bad news, than investment-grade
bonds. In some cases, bonds may decline in credit quality or go into default.
Because this portfolio may invest in securities not paying current interest or
in securities already in default, these risks may be more pronounced.
MARKET RISK. Deteriorating market conditions might cause a general weakness in
the market that reduces the prices of securities in that market. Developments
in a particular class of bonds or the stock market could also adversely affect
the portfolio by reducing the relative attractiveness of bonds as an
investment. Also, to the extent that the portfolio emphasizes bonds from any
given industry, it could be hurt if that industry does not do well.
FOREIGN INVESTMENT RISK. To the extent the portfolio has exposure to companies
based outside the US, it faces the risks inherent in foreign investing. Adverse
political, economic or social developments could undermine the value of the
portfolio's investments or prevent the portfolio from realizing their full
value. Financial reporting standards for companies based in foreign markets
differ from those in the US. Additionally, foreign securities markets generally
are smaller and less liquid than the US markets. These risks tend to be greater
in emerging markets so, to the extent the portfolio invests in emerging
markets, it takes on greater risks. The currency of a country in which the
portfolio has invested could decline relative to the value of the US dollar,
which decreases the value of the investment to US investors. The investments of
the portfolio may be subject to foreign withholding taxes.
DERIVATIVES RISK. Risks associated with derivatives include the risk that the
derivative is not well correlated with the security, index or currency to which
it relates; the risk that derivatives may result in losses or missed
opportunities; the risk that the portfolio will be unable to sell the
derivative because of an illiquid secondary market; the risk that a
counterparty is unwilling or unable to meet its obligation and the risk that
the derivative transaction could expose the portfolio to the effects of
leverage, which could increase the portfolio's exposure to the market and
magnify potential losses. There is no guarantee that derivatives, to the extent
employed, will have the intended effect, and their use could cause lower
returns or even losses to the portfolio. The use of derivatives by the
portfolio to hedge risk may reduce the opportunity for gain by offsetting the
positive effect of favorable price movements.
SECURITIES LENDING RISK. Any loss in the market price of securities loaned by
the portfolio that occurs during the term of the loan would be borne by the
portfolio and would adversely affect the portfolio's performance. Also, there
may be delays in recovery of securities loaned or even a loss of rights in the
collateral should the
DWS VARIABLE SERIES II - CLASS A SHARES DWS CORE FIXED INCOME
VIP 19
borrower of the securities fail financially while the loan is outstanding.
However, loans will be made only to borrowers selected by the portfolio's
delegate after a review of relevant facts and circumstances, including the
creditworthiness of the borrower.
PRICING RISK. At times, market conditions may make it difficult to value some
investments, and the portfolio may use certain valuation methodologies for some
of its investments, such as fair value pricing. Given the subjective nature of
such valuation methodologies, it is possible that the value determined for an
investment may be different than the value realized upon such investment's
sale. If the portfolio has valued its securities too highly, you may pay too
much for portfolio shares when you buy into the portfolio. If the portfolio has
underestimated the price of its securities, you may not receive the full market
value when you sell your portfolio shares.
SECURITY SELECTION RISK. A risk that pervades all investing is the risk that
the securities in the portfolio's portfolio may decline in value.
Another factor that could affect performance is:
o portfolio management could be wrong in the analysis of industries, companies,
economic trends, the relative attractiveness of different securities or
other matters.
This portfolio is designed for individuals who are seeking to earn higher
current income than an investment in money market funds may provide.
PERFORMANCE - CLASS A
While a portfolio's past performance isn't necessarily a sign of how it will do
in the future, it can be valuable for an investor to know.
The bar chart shows how the returns for the portfolio's Class A shares have
varied from year to year, which may give some idea of risk. The table shows
average annual returns for the portfolio and comparable index information
(which, unlike the portfolio, does not have any fees or expenses). The
performance of both the portfolio and the comparable index information varies
over time. All figures assume reinvestment of dividends and distributions.
This information doesn't reflect charges and fees associated with the separate
account that invests in the portfolio or any variable life insurance policy or
variable annuity contract for which the portfolio is an investment option.
These charges and fees will reduce returns.
ANNUAL TOTAL RETURN (%) as of 12/31 each year - CLASS A
[BARGRAPHIC APPEARS HERE]
7.93 -2.06 9.90 5.71 8.01 5.13 4.53 2.25 4.26 4.17
1998 1999 2000 2001 2002 2003 2004 2005 2006 2007
FOR THE PERIODS INCLUDED IN THE BAR CHART:
BEST QUARTER: 4.14%, Q3 2002 WORST QUARTER: -2.36%, Q2 2004
2008 TOTAL RETURN AS OF MARCH 31: -2.01%
20 DWS CORE FIXED INCOME VIP DWS VARIABLE SERIES II -
CLASS A SHARES
AVERAGE ANNUAL TOTAL RETURNS (%) as of 12/31/2007
1 YEAR 5 YEARS 10 YEARS
------ ------- --------
Portfolio - Class A 4.17 4.06 4.93
Lehman Brothers U.S. Aggregate
Index 6.97 4.42 5.97
LEHMAN BROTHERS U.S. AGGREGATE INDEX is an unmanaged market value-weighted
measure of Treasury issues, agency issues, corporate bond issues and mortgage
securities.
Current performance information may be higher or lower than the performance
data quoted above. For more recent performance information, contact your
participating insurance company.
HOW MUCH INVESTORS PAY
This table describes the fees and expenses that you may pay if you buy and hold
portfolio shares. The information in the table does not reflect charges and
fees associated with the separate account that invests in the portfolio or any
variable life insurance policy or variable annuity contract for which the
portfolio is an investment option. These charges and fees will increase
expenses.
FEE TABLE CLASS A
--------- -------
ANNUAL OPERATING EXPENSES, deducted from portfolio assets
Management Fee1 0.49%
Distribution/Service (12b-1) Fee None
Other Expenses2 0.17
TOTAL ANNUAL OPERATING EXPENSES 3 0.66
1 Restated on an annualized basis to reflect approved fee changes taking
effect on May 1, 2008.
2 Restated on an annualized basis to reflect approved fee changes taking
effect on May 1, 2008. Includes a 0.10% administrative services fee paid
to the Advisor.
3 Through September 30, 2008, the Advisor has contractually agreed to waive
all or a portion of its management fee and reimburse or pay certain
operating expenses so that the total annual operating expenses of the
portfolio will not exceed 0.70% for Class A shares, excluding certain
expenses such as extraordinary expenses, taxes, brokerage and interest
expenses. Although there can be no assurance that the current
waiver/expense reimbursement arrangement will be maintained beyond
September 30, 2008, the Advisor has committed to review the continuance of
waiver/expense reimbursement arrangements by September 30, 2008.
Based on the costs above, this example helps you compare the expenses of Class
A shares to those of other mutual funds. This example assumes the expenses
above remain the same. It also assumes that you invested $10,000, earned 5%
annual returns, and reinvested all dividends and distributions and sold your
shares at the end of each period. This is only an example; actual expenses will
be different.
EXAMPLE 1 YEAR 3 YEARS 5 YEARS 10 YEARS
------- ------ ------- ------- --------
Class A shares $67 $211 $368 $822
DWS VARIABLE SERIES II - CLASS A SHARES DWS CORE FIXED INCOME
VIP 21
THE PORTFOLIO MANAGERS
The portfolio's subadvisor is Aberdeen Asset Management, Inc. A team approach
is utilized with respect to the day-to-day management of the portfolio.
Portfolio decisions are made jointly by the senior members of the management
team. The following members of the management team handle the day-to-day
operations of the portfolio:
Gary W. Bartlett, CFA
Head of US Fixed Income and senior portfolio manager specializing in taxable
municipal, utility and government fixed income investments: Philadelphia.
o Joined Aberdeen Asset Management Inc. in 2005 and the portfolio in 2002.
o Formerly, Managing Director of Deutsche Asset Management; joined Deutsche
Asset Management in 1992 after nine years of experience as an analyst and
fixed income portfolio manager at PNC Financial and credit analyst at
First Pennsylvania Bank.
o BA, Bucknell University; MBA, Drexel University.
Warren S. Davis, III
Senior portfolio manager for mortgage- and asset-backed fixed income
investments: Philadelphia.
o Joined Aberdeen Asset Management Inc. in 2005 and the portfolio in 2002.
o Formerly, Managing Director of Deutsche Asset Management; joined Deutsche
Asset Management in 1995 after nine years of experience as a trader,
analyst and developer of analytical and risk management systems for Paine
Webber and Merrill Lynch.
o BS, Pennsylvania State University; MBA, Drexel University.
Thomas J. Flaherty
Senior portfolio manager for corporate and taxable municipal fixed income
investments: Philadelphia.
o Joined Aberdeen Asset Management Inc. in 2005 and the portfolio in 2002.
o Formerly, Managing Director of Deutsche Asset Management; joined Deutsche
Asset Management in 1995 after 10 years of fixed income experience,
including vice president for US taxable fixed income securities at
Prudential Securities.
o BA, SUNY Stony Brook.
J. Christopher Gagnier
Head of Core Plus Fixed Income product and senior portfolio manager for
corporate and commercial mortgages: Philadelphia.
o Joined Aberdeen Asset Management Inc. in 2005 and the portfolio in 2002.
o Formerly, Managing Director of Deutsche Asset Management; joined Deutsche
Asset Management in 1997 after 17 years of experience in fixed income
investments at PaineWebber and Continental Bank.
o BS, The Wharton School, University of Pennsylvania; MBA, University of
Chicago.
Daniel R. Taylor, CFA
Senior portfolio manager for asset-backed and commercial mortgage fixed income
investments: Philadelphia.
o Joined Aberdeen Asset Management Inc. in 2005 and the portfolio in 2002.
o Formerly, Managing Director of Deutsche Asset Management; joined Deutsche
Asset Management in 1998 after six years of experience as fixed income
portfolio manager and senior credit analyst for CoreStates Investment
Advisors.
o BS, Villanova University.
Timothy C. Vile, CFA
Senior portfolio manager for Core Fixed Income and Global Aggregate Fixed
Income: Philadelphia.
o Joined Aberdeen Asset Management Inc. in 2005 and the portfolio in 2004.
o Formerly, Managing Director of Deutsche Asset Management; joined Deutsche
Asset Management in 1991 as member of Core Fixed Income; seconded to the
London office from January 1999 to June 2002 to design and develop the
firm's European Credit and Global Aggregate capabilities; before joining
the firm, he had six years of experience that included portfolio manager
for fixed income portfolios at Equitable Capital Management.
o BS, Susquehanna University.
William T. Lissenden
Portfolio manager for Core Fixed Income: Philadelphia.
o Joined Aberdeen Asset Management Inc. in 2005 and the portfolio in 2003.
o Formerly, Director of Deutsche Asset Management; joined Deutsche Asset
Management in 2002 after 31 years of experience, including fixed income
strategist and director of research at Conseco Capital Management,
director of fixed income research and product management at Prudential
Securities and national sales manager for fixed income securities at
Prudential Securities.
o BS, St. Peter's College; MBA, Baruch College.
The portfolio's Statement of Additional Information provides additional
information about a portfolio manager's investments in the portfolio, a
description of the portfolio management compensation structure, and information
regarding other accounts managed.
22 DWS CORE FIXED INCOME VIP DWS VARIABLE SERIES II -
CLASS A SHARES
FINANCIAL HIGHLIGHTS
This table is designed to help you understand the portfolio's financial
performance. The figures in the first part of the table are for a single share.
The total return figures represent the percentage that an investor in the
portfolio would have earned (or lost), assuming all dividends and distributions
were reinvested. This information has been audited by Ernst & Young LLP, an
independent registered public accounting firm, whose report, along with the
portfolio's financial statements, is included in the portfolio's annual report
(see "Shareholder reports" on the back cover). The following table includes
selected data for a share outstanding throughout each period and other
performance information derived from the financial statements.
This information doesn't reflect charges and fees associated with the separate
account that invests in the portfolio or any variable life insurance policy or
variable annuity contract for which the portfolio is an investment option.
These charges and fees will reduce returns.
DWS CORE FIXED INCOME VIP - CLASS A
YEARS ENDED DECEMBER 31, 2007 2006 2005 2004 2003
----------------------------------------- ------- ------- ------- ------- -------
SELECTED PER SHARE DATE
------------------------------------------------------------------------------------------------
NET ASSET VALUE, BEGINNING OF PERIOD $ 11.86 $ 11.81 $ 12.07 $ 12.16 $ 11.98
----------------------------------------- ------- ------- ------- ------- -------
Income (loss) from investment operations:
Net investment income a .56 .53 .47 .50 .45
----------------------------------------- ------- ------- ------- ------- -------
Net realized and unrealized gain (loss) ( .08) ( .05) ( .21) .05 .14
----------------------------------------- ------- ------- ------- ------- -------
TOTAL FROM INVESTMENT OPERATIONS .48 .48 .26 .55 .59
----------------------------------------- ------- ------- ------- ------- -------
Less distributions from:
Net investment income ( .52) ( .43) ( .41) ( .43) ( .41)
----------------------------------------- ------- ------- ------- ------- -------
Net realized gains - ( .00)* ( .11) ( .21) -
----------------------------------------- ------- ------- ------- ------- -------
TOTAL DISTRIBUTIONS ( .52) ( .43) ( .52) ( .64) ( .41)
----------------------------------------- ------- ------- ------- ------- -------
NET ASSET VALUE, END OF PERIOD $ 11.82 $ 11.86 $ 11.81 $ 12.07 $ 12.16
----------------------------------------- ------- ------- ------- ------- -------
Total Return (%) 4.17 4.26 2.25 4.53 5.13
----------------------------------------- ------- ------- ------- ------- -------
RATIOS TO AVERAGE NET ASSETS AND SUPPLEMENTAL DATA
------------------------------------------------------------------------------------------------
Net assets, end of period ($ millions) 186 277 252 210 201
----------------------------------------- ------- ------- ------- ------- -------
Ratio of expenses (%) .66 .68 .67 .66 .66
----------------------------------------- ------- ------- ------- ------- -------
Ratio of net investment income (%) 4.78 4.56 3.96 4.18 3.75
----------------------------------------- ------- ------- ------- ------- -------
Portfolio turnover rate (%)b 197 183 164 185 229
----------------------------------------- ------- ------- ------- ------- -------
a Based on average shares outstanding during the period.
b The portfolio turnover rate including mortgage dollar roll transactions was
209%, 198%, 241%, 176% and 204% for the years ended December 31, 2007,
December 31, 2006, December 31, 2005, December 31, 2004 and December 31,
2003, respectively.
* Amount is less than $.005
DWS VARIABLE SERIES II - CLASS A SHARES DWS CORE FIXED INCOME
VIP 23
HYPOTHETICAL EXPENSE SUMMARY
Using the annual portfolio operating expense ratios presented in the fee tables
in the portfolio prospectus, the Hypothetical Expense Summary shows the
estimated fees and expenses, in actual dollars, that would be charged on a
hypothetical investment of $10,000 in the portfolio held for the next 10 years
and the impact of such fees and expenses on portfolio returns for each year and
cumulatively, assuming a 5% return for each year. The tables also assume that
all dividends and distributions are reinvested. The annual portfolio expense
ratios shown are net of any contractual fee waivers or expense reimbursements,
if any, for the period of the contractual commitment. Also, please note that if
you are investing through a third party provider, that provider may have fees
and expenses separate from those of the portfolio that are not reflected here.
Mutual fund fees and expenses fluctuate over time and actual expenses may be
higher or lower than those shown.
The Hypothetical Expense Summary should not be used or construed as an offer to
sell, a solicitation of an offer to buy or a recommendation or endorsement of
any specific mutual fund. You should carefully review the portfolio's
prospectus to consider the investment objectives, risks, expenses and charges
of the portfolio prior to investing.
DWS CORE FIXED INCOME VIP - CLASS A
INITIAL HYPOTHETICAL ASSUMED RATE
MAXIMUM INVESTMENT: OF RETURN:
SALES CHARGE: $10,000 5%
0.00% ---------------------------------- ----------------------------------
CUMULATIVE CUMULATIVE HYPOTHETICAL
RETURN BEFORE RETURN AFTER YEAR-END BALANCE ANNUAL
FEES AND ANNUAL FUND FEES AND AFTER FEES AND FEES AND
YEAR EXPENSES EXPENSE RATIOS EXPENSES EXPENSES EXPENSES
----- ------------- -------------- ------------ ---------------- ---------
1 5.00% 0.66% 4.34% $ 10,434.00 $ 67.43
2 10.25% 0.66% 8.87% $ 10,886.84 $ 70.36
3 15.76% 0.66% 13.59% $ 11,359.32 $ 73.41
4 21.55% 0.66% 18.52% $ 11,852.32 $ 76.60
5 27.63% 0.66% 23.67% $ 12,366.71 $ 79.92
6 34.01% 0.66% 29.03% $ 12,903.42 $ 83.39
7 40.71% 0.66% 34.63% $ 13,463.43 $ 87.01
8 47.75% 0.66% 40.48% $ 14,047.75 $ 90.79
9 55.13% 0.66% 46.57% $ 14,657.42 $ 94.73
10 62.89% 0.66% 52.94% $ 15,293.55 $ 98.84
TOTAL $ 822.48
24 DWS CORE FIXED INCOME VIP DWS VARIABLE SERIES II -
CLASS A SHARES
DWS DAVIS VENTURE VALUE VIP
THE PORTFOLIO'S MAIN INVESTMENT STRATEGY
The portfolio seeks growth of capital.
The portfolio invests primarily in common stock of US companies with market
capitalizations of at least $5 billion.
The portfolio managers select common stocks of well-managed companies with
durable business models that can be purchased at attractive valuations relative
to their intrinsic value. The portfolio managers look for companies with
sustainable growth rates selling at modest price-earnings multiples that the
portfolio managers hope will expand as other investors recognize the company's
true worth. The portfolio managers believe that by combining a sustainable
growth rate with a gradually expanding multiple, these rates may compound and
can generate returns that could exceed average returns earned by investing in
large capitalization domestic stocks.
The portfolio managers consider selling a company if they believe the stock's
market price exceeds their estimates of intrinsic value, or if the ratio of the
risks and rewards of continuing to own the company is no longer attractive.
SECURITIES LENDING. The portfolio may lend its investment securities in an
amount up to 33 1/3% of its total assets to approved institutional borrowers
who need to borrow securities in order to complete certain transactions.
Although major changes tend to be infrequent, the Board of Trustees could
change the portfolio's investment objective without seeking shareholder
approval.
OTHER INVESTMENTS
The portfolio may also invest in foreign companies and US companies with
smaller market capitalizations.
The portfolio is permitted, but not required, to use various types of
derivatives (contracts whose value is based on, for example, indices,
currencies or securities). Derivatives may be used for hedging and for risk
management or for non-hedging purposes to seek to enhance potential gain. The
portfolio may use derivatives in circumstances where portfolio management
believes they offer an economical means of gaining exposure to a particular
asset class or to keep cash on hand to meet shareholder redemptions or other
needs while maintaining exposure to the market.
As a temporary defensive measure, the portfolio could shift up to 100% of
assets into investments such as money market securities. This measure could
prevent losses, but, while engaged in a temporary defensive position, the
portfolio will not be pursuing its investment objective. However, the portfolio
managers may choose not to use these strategies for various reasons, even in
very volatile market conditions.
THE MAIN RISKS OF INVESTING IN THE PORTFOLIO
There are several risk factors that could hurt the portfolio's performance,
cause you to lose money or cause the portfolio's performance to trail that of
other investments.
STOCK MARKET RISK. The portfolio is affected by how the stock market performs.
To the extent the portfolio invests in a particular capitalization or market
sector, the portfolio's performance may be proportionately affected by that
segment's general performance. When stock prices fall, you should expect the
value of your investment to fall as well. Because a stock represents ownership
in its issuer, stock prices can be hurt by poor management, shrinking product
demand and other business risks. These factors may affect single companies as
well as groups of companies. In addition, movements in financial markets may
adversely affect a stock's price, regardless of how well the company performs.
The market as a whole may not favor the types of investments the portfolio
makes, which could affect the portfolio's ability to sell them at an attractive
price.
VALUE INVESTING RISK. At times, "value" investing may perform better than or
worse than other investment styles and the overall market. If portfolio
management overestimates the value or return potential of one or more common
stocks, the portfolio may underperform the general equity market. Value stocks
may also be out of favor for certain periods in relation to growth stocks.
DWS VARIABLE SERIES II - CLASS A SHARES DWS DAVIS VENTURE VALUE
VIP 25
INDUSTRY RISK. While the portfolio does not concentrate in any industry, to the
extent that the portfolio has exposure to a given industry or sector, any
factors affecting that industry or sector could affect the value of portfolio
securities. For example, manufacturers of consumer goods could be hurt by a
rise in unemployment or technology companies could be hurt by such factors as
market saturation, price competition and rapid obsolescence.
DERIVATIVES RISK. Risks associated with derivatives include the risk that the
derivative is not well correlated with the security, index or currency to which
it relates; the risk that derivatives may result in losses or missed
opportunities; the risk that the portfolio will be unable to sell the
derivative because of an illiquid secondary market; the risk that a
counterparty is unwilling or unable to meet its obligation and the risk that
the derivative transaction could expose the portfolio to the effects of
leverage, which could increase the portfolio's exposure to the market and
magnify potential losses. There is no guarantee that derivatives, to the extent
employed, will have the intended effect, and their use could cause lower
returns or even losses to the portfolio. The use of derivatives by the
portfolio to hedge risk may reduce the opportunity for gain by offsetting the
positive effect of favorable price movements.
FOREIGN INVESTMENT RISK. Foreign investments involve certain special risks,
including:
o POLITICAL RISK. Some foreign governments have limited the outflow of profits
to investors abroad, imposed restrictions on the exchange or export of
foreign currency, extended diplomatic disputes to include trade and
financial relations, seized foreign investment and imposed higher taxes.
o INFORMATION RISK. Companies based in foreign markets are usually not subject
to accounting, auditing and financial reporting standards and practices as
stringent as those in the US. Therefore, their financial reports may present
an incomplete, untimely or misleading picture of a company, as compared to
the financial reports required in the US.
o LIQUIDITY RISK. Investments that trade less can be more difficult or more
costly to buy, or to sell, than more liquid or active investments. This
liquidity risk is a factor of the trading volume of a particular investment,
as well as the size and liquidity of the entire local market. On the whole,
foreign exchanges are smaller and less liquid than US exchanges. This can
make buying and selling certain investments more difficult and costly.
Relatively small transactions in some instances can have a
disproportionately large effect on the price and supply of securities. In
certain situations, it may become virtually impossible to sell an investment
in an orderly fashion at a price that approaches portfolio management's
estimate of its value. For the same reason, it may at times be difficult to
value the portfolio's foreign investments.
o REGULATORY RISK. There is generally less government regulation of foreign
markets, companies and securities dealers than in the US.
o CURRENCY RISK. The portfolio invests in securities denominated in foreign
currencies. Changes in exchange rates between foreign currencies and the US
dollar may affect the US dollar value of foreign securities or the income or
gain received on these securities.
o LIMITED LEGAL RECOURSE RISK. Legal remedies for investors may be more limited
than the legal remedies available in the US.
o TRADING PRACTICE RISK. Brokerage commissions and other fees are generally
higher for foreign investments than for US investments. The procedures and
rules governing foreign transactions and custody may also involve delays in
payment, delivery or recovery of money or investments.
o TAXES. Foreign withholding and certain other taxes may reduce the amount of
income available to distribute to shareholders of the portfolio. In
addition, special US tax considerations may apply to the portfolio's foreign
investments.
SECURITIES LENDING RISK. Any loss in the market price of securities loaned by
the portfolio that occurs during the term of the loan would be borne by the
portfolio and would adversely affect the portfolio's performance. Also, there
may be delays in recovery of securities loaned or even a loss of rights in the
collateral should the borrower of the securities fail financially while the
loan is outstanding. However, loans will be made only to borrowers selected by
the portfolio's delegate after a review of relevant facts and circumstances,
including the creditworthiness of the borrower.
SECURITY SELECTION RISK. A risk that pervades all investing is the risk that
the securities in the portfolio's portfolio may decline in value.
26 DWS DAVIS VENTURE VALUE VIP DWS VARIABLE SERIES II -
CLASS A SHARES
Other factors that could affect performance include:
o portfolio management could be wrong in the analysis of industries, companies,
economic trends, the relative attractiveness of different securities or
other matters.
Investors with long-term goals who want a core stock investment may be
interested in this portfolio.
PERFORMANCE - CLASS A
While a portfolio's past performance isn't necessarily a sign of how it will do
in the future, it can be valuable for an investor to know.
The bar chart shows how the returns for the portfolio's Class A shares have
varied from year to year, which may give some idea of risk. The table shows
average annual returns for the portfolio and comparable index information
(which, unlike the portfolio, does not have any fees or expenses). The
performance of both the portfolio and the comparable index information varies
over time. All figures assume reinvestment of dividends and distributions.
This information doesn't reflect charges and fees associated with the separate
account that invests in the portfolio or any variable life insurance policy or
variable annuity contract for which the portfolio is an investment option.
These charges and fees will reduce returns.
ANNUAL TOTAL RETURN (%) as of 12/31 each year - CLASS A
[BARGRAPHIC APPEARS HERE]
-15.79 29.84 11.83 9.64 14.84 4.46
2002 2003 2004 2005 2006 2007
FOR THE PERIODS INCLUDED IN THE BAR CHART:
BEST QUARTER: 17.04%, Q2 2003 WORST QUARTER: -12.70%, Q3 2002
2008 TOTAL RETURN AS OF MARCH 31: -8.95%
AVERAGE ANNUAL TOTAL RETURNS (%) as of 12/31/2007
1 YEAR 5 YEARS SINCE INCEPTION1
------ ------- ----------------
Portfolio - Class A 4.46 13.81 6.56
Russell 1000 Value Index -0.17 14.63 7.29
1 Since 5/1/01. Index comparison begins 4/30/01.
Total returns would have been lower if operating expenses hadn't been reduced.
RUSSELL 1000 (Reg. TM) VALUE INDEX is an unmanaged index that consists of those
stocks in the Russell 1000 Index with less-than-average growth orientation.
Russell 1000 (Reg. TM) Index is an unmanaged price-only index of the 1,000
largest capitalized companies that are domiciled in the US and whose common
stocks are traded.
Current performance information may be higher or lower than the performance
data quoted above. For more recent performance information, contact your
participating insurance company.
DWS VARIABLE SERIES II - CLASS A SHARES DWS DAVIS VENTURE VALUE
VIP 27
HOW MUCH INVESTORS PAY
This table describes the fees and expenses that you may pay if you buy and hold
portfolio shares. The information in the table does not reflect charges and
fees associated with the separate account that invests in the portfolio or any
variable life insurance policy or variable annuity contract for which the
portfolio is an investment option. These charges and fees will increase
expenses.
FEE TABLE CLASS A
--------- -------
ANNUAL OPERATING EXPENSES, deducted from portfolio assets
Management Fee1 0.86%
Distribution/Service (12b-1) Fee None
Other Expenses2 0.16
TOTAL ANNUAL OPERATING EXPENSES 1.02
Less Expense Waiver/Reimbursement 0.13
NET ANNUAL OPERATING EXPENSES3 0.89
1 Restated on an annualized basis to reflect approved fee changes taking
effect on May 1, 2008.
2 Restated on an annualized basis to reflect approved fee changes taking
effect on May 1, 2008. Includes a 0.10% administrative services fee paid
to the Advisor.
3 Through April 30, 2009, the Advisor has contractually agreed to waive all
or a portion of its management fee and reimburse or pay certain operating
expenses so that the total annual operating expenses of the portfolio will
not exceed 0.89% for Class A shares, excluding certain expenses such as
extraordinary expenses, taxes, brokerage and interest.
Based on the costs above (including one year of capped expenses in each
period), this example helps you compare the expenses of Class A shares to those
of other mutual funds. This example assumes the expenses above remain the same.
It also assumes that you invested $10,000, earned 5% annual returns, reinvested
all dividends and distributions and sold your shares at the end of each period.
This is only an example; actual expenses will be different.
EXAMPLE 1 YEAR 3 YEARS 5 YEARS 10 YEARS
------- ------ ------- ------- ---------
Class A shares $91 $312 $551 $1,236
THE PORTFOLIO MANAGERS
The portfolio's subadvisor is Davis Selected Advisers, L.P. The portfolio is
managed by a team of investment professionals who collaborate to develop and
implement the portfolio's investment strategy. Each portfolio manager on the
team has authority over all aspects of the portfolio's investment portfolio,
including but not limited to, purchases and sales of individual securities,
portfolio construction techniques, portfolio risk assessment and the management
of daily cash flows in accordance with portfolio holdings.
The portfolio managers are Christopher C. Davis and Kenneth Charles Feinberg,
who have each managed the portfolio since inception. Mr. Davis is Chairman of
Davis Selected Advisers, L.P. and manages several funds advised by the firm.
Mr. Davis began his investment career and joined the subadvisor in 1988. Mr.
Feinberg also manages several funds advised by Davis Selected Advisers, L.P. He
began his investment career in 1987 and joined the subadvisor in 1994 as a
research analyst.
The portfolio's Statement of Additional Information provides additional
information about a portfolio manager's investments in the portfolio, a
description of the portfolio management compensation structure, and information
regarding other accounts managed.
28 DWS DAVIS VENTURE VALUE VIP DWS VARIABLE SERIES II -
CLASS A SHARES
FINANCIAL HIGHLIGHTS
This table is designed to help you understand the portfolio's financial
performance. The figures in the first part of the table are for a single share.
The total return figures represent the percentage that an investor in the
portfolio would have earned (or lost), assuming all dividends and distributions
were reinvested. This information has been audited by Ernst & Young LLP, an
independent registered public accounting firm, whose report, along with the
portfolio's financial statements, is included in the portfolio's annual report
(see "Shareholder reports" on the back cover). The following table includes
selected data for a share outstanding throughout each period and other
performance information derived from the financial statements.
This information doesn't reflect charges and fees associated with the separate
account that invests in the portfolio or any variable life insurance policy or
variable annuity contract for which the portfolio is an investment option.
These charges and fees will reduce returns.
DWS DAVIS VENTURE VALUE VIP - CLASS A
YEARS ENDED DECEMBER 31, 2007 2006 2005 2004 2003
------------------------------------------------- -------- -------- -------- -------- -------
SELECTED PER SHARE DATA
--------------------------------------------------------------------------------------------------------------
NET ASSET VALUE, BEGINNING OF PERIOD $ 14.25 $ 12.49 $ 11.48 $ 10.31 $ 7.99
------------------------------------------------- -------- -------- -------- -------- -------
Income (loss) from investment operations:
Net investment income (loss)a .15 .10 .09 .08 .06
------------------------------------------------- -------- -------- -------- -------- -------
Net realized and unrealized gain (loss) .47 1.74 1.01 1.14 2.31
------------------------------------------------- -------- -------- -------- -------- -------
TOTAL FROM INVESTMENT OPERATIONS .62 1.84 1.10 1.22 2.37
------------------------------------------------- -------- -------- -------- -------- -------
Less distributions from:
Net investment income ( .10) ( .08) ( .09) ( .05) ( .05)
------------------------------------------------- -------- -------- -------- -------- -------
Net realized gains ( .18) - - - -
------------------------------------------------- -------- -------- -------- -------- -------
TOTAL DISTRIBUTIONS ( .28) ( .08) ( .09) ( .05) ( .05)
------------------------------------------------- -------- -------- -------- -------- -------
NET ASSET VALUE, END OF PERIOD $ 14.59 $ 14.25 $ 12.49 $ 11.48 $ 10.31
------------------------------------------------- -------- -------- -------- -------- -------
Total Return (%) 4.46b 14.84b 9.64b 11.83 29.84
------------------------------------------------- -------- -------- -------- -------- -------
RATIOS TO AVERAGE NET ASSETS AND SUPPLEMENTAL DATA
--------------------------------------------------------------------------------------------------------------
Net assets, end of period ($ millions) 307 346 309 268 220
------------------------------------------------- -------- -------- -------- -------- -------
Ratio of expenses before expense reductions (%) 1.02 1.02 1.02 1.05 1.01
------------------------------------------------- -------- -------- -------- -------- -------
Ratio of expenses after expense reductions (%) .88 .85 .96 1.05 1.01
------------------------------------------------- -------- -------- -------- -------- -------
Ratio of net investment income (%) 1.01 .77 .78 .74 .62
------------------------------------------------- -------- -------- -------- -------- -------
Portfolio turnover rate (%) 9 16 8 3 7
------------------------------------------------- -------- -------- -------- -------- -------
a Based on average shares outstanding during the period.
b Total return would have been lower had certain expenses not been reduced.
DWS VARIABLE SERIES II - CLASS A SHARES DWS DAVIS VENTURE VALUE
VIP 29
HYPOTHETICAL EXPENSE SUMMARY
Using the annual portfolio operating expense ratios presented in the fee tables
in the portfolio prospectus, the Hypothetical Expense Summary shows the
estimated fees and expenses, in actual dollars, that would be charged on a
hypothetical investment of $10,000 in the portfolio held for the next 10 years
and the impact of such fees and expenses on portfolio returns for each year and
cumulatively, assuming a 5% return for each year. The tables also assume that
all dividends and distributions are reinvested. The annual portfolio expense
ratios shown are net of any contractual fee waivers or expense reimbursements,
if any, for the period of the contractual commitment. Also, please note that if
you are investing through a third party provider, that provider may have fees
and expenses separate from those of the portfolio that are not reflected here.
Mutual fund fees and expenses fluctuate over time and actual expenses may be
higher or lower than those shown.
The Hypothetical Expense Summary should not be used or construed as an offer to
sell, a solicitation of an offer to buy or a recommendation or endorsement of
any specific mutual fund. You should carefully review the portfolio's
prospectus to consider the investment objectives, risks, expenses and charges
of the portfolio prior to investing.
DWS DAVIS VENTURE VALUE VIP - CLASS A
INITIAL HYPOTHETICAL ASSUMED RATE
MAXIMUM INVESTMENT: OF RETURN:
SALES CHARGE: $10,000 5%
0.00% ---------------------------------- ----------------------------------
CUMULATIVE CUMULATIVE HYPOTHETICAL
RETURN BEFORE RETURN AFTER YEAR-END BALANCE ANNUAL
FEES AND ANNUAL FUND FEES AND AFTER FEES AND FEES AND
YEAR EXPENSES EXPENSE RATIOS EXPENSES EXPENSES EXPENSES
----- ------------- -------------- ------------ ---------------- ----------
1 5.00% 0.89% 4.11% $ 10,411.00 $ 90.83
2 10.25% 1.02% 8.25% $ 10,825.36 $ 108.31
3 15.76% 1.02% 12.56% $ 11,256.21 $ 112.62
4 21.55% 1.02% 17.04% $ 11,704.20 $ 117.10
5 27.63% 1.02% 21.70% $ 12,170.03 $ 121.76
6 34.01% 1.02% 26.54% $ 12,654.40 $ 126.60
7 40.71% 1.02% 31.58% $ 13,158.04 $ 131.64
8 47.75% 1.02% 36.82% $ 13,681.73 $ 136.88
9 55.13% 1.02% 42.26% $ 14,226.27 $ 142.33
10 62.89% 1.02% 47.92% $ 14,792.47 $ 148.00
TOTAL $ 1,236.07
30 DWS DAVIS VENTURE VALUE VIP DWS VARIABLE SERIES II -
CLASS A SHARES
DWS DREMAN HIGH RETURN EQUITY VIP
THE PORTFOLIO'S MAIN INVESTMENT STRATEGY
The portfolio seeks to achieve a high rate of total return.
Under normal circumstances, the portfolio invests at least 80% of net assets,
plus the amount of any borrowings for investment purposes, in common stocks and
other equity securities. The portfolio focuses on stocks of large US companies
that are similar in size to the companies in the S&P 500 Index (as of February
29, 2008, the S&P 500 Index had a median market capitalization of $10.8
billion) and that the portfolio managers believe are undervalued. The portfolio
intends to invest primarily in companies whose market capitalizations fall
within the normal range of the Index. Although the portfolio can invest in
stocks of any economic sector, at times it may emphasize the financial services
sector or other sectors. In fact, it may invest more than 25% of total assets
in a single sector.
The portfolio's equity investments are mainly common stocks, but may also
include other types of equities such as preferred or convertible stocks. In
addition, the portfolio may invest in initial public offerings.
The portfolio managers begin by screening for stocks whose price-to-earnings
ratios are below the average for the S&P 500 Index. The managers then compare a
company's stock price to its book value, cash flow and yield, and analyze
individual companies to identify those that are financially sound and appear to
have strong potential for long-term growth and income.
The managers assemble the portfolio from among the most attractive stocks,
drawing on analysis of economic outlooks for various sectors and industries.
The managers normally will sell a stock when it reaches a target price, its
fundamental factors have changed or when other investments offer better
opportunities.
SECURITIES LENDING. The portfolio may lend its investment securities in an
amount up to 33 1/3% of its total assets to approved institutional borrowers
who need to borrow securities in order to complete certain transactions.
Although major changes tend to be infrequent, the Board of Trustees could
change the portfolio's investment objective without seeking shareholder
approval. However, the Board will provide shareholders with at least 60 days'
notice prior to making any changes to the portfolio's 80% investment policy.
OTHER INVESTMENTS
The portfolio may invest up to 20% of net assets in US dollar-denominated
American Depository Receipts and in securities of foreign companies traded
principally in securities markets outside the US.
Although not one of its principal investment strategies, the portfolio is
permitted, but not required, to use various types of derivatives (contracts
whose value is based on, for example, indices, currencies or securities).
Derivatives may be used for hedging and for risk management or for non-hedging
purposes to seek to enhance potential gains. The portfolio may also use
derivatives in circumstances where the portfolio believes they offer an
economical means of gaining exposure to a particular asset class or to keep
cash on hand to meet shareholder redemptions or other needs while maintaining
exposure to the market. In particular, the portfolio may use futures, currency
options and forward currency transactions.
As a temporary defensive measure, the portfolio could shift up to 100% of
assets into investments such as money market securities. This measure could
prevent losses, but, while engaged in a temporary defensive position, the
portfolio will not be pursuing its investment objective. However, the portfolio
managers may choose not to use these strategies for various reasons, even in
very volatile market conditions.
THE MAIN RISKS OF INVESTING IN THE PORTFOLIO
There are several risk factors that could hurt the portfolio's performance,
cause you to lose money or cause the portfolio's performance to trail that of
other investments.
DWS VARIABLE SERIES II - CLASS A SHARES DWS DREMAN HIGH RETURN EQUITY
VIP 31
STOCK MARKET RISK. The portfolio is affected by how the stock market performs.
To the extent the portfolio invests in a particular capitalization or market
sector, the portfolio's performance may be proportionately affected by that
segment's general performance. When stock prices fall, you should expect the
value of your investment to fall as well. Because a stock represents ownership
in its issuer, stock prices can be hurt by poor management, shrinking product
demand and other business risks. These factors may affect single companies as
well as groups of companies. In addition, movements in financial markets may
adversely affect a stock's price, regardless of how well the company performs.
The market as a whole may not favor the types of investments the portfolio
makes, which could affect the portfolio's ability to sell them at an attractive
price.
VALUE INVESTING RISK. At times, "value" investing may perform better than or
worse than other investment styles and the overall market. If portfolio
management overestimates the value or return potential of one or more common
stocks, the portfolio may underperform the general equity market. Value stocks
may also be out of favor for certain periods in relation to growth stocks.
INDUSTRY RISK. While the portfolio does not concentrate in any industry, to the
extent that the portfolio has exposure to a given industry or sector, any
factors affecting that industry or sector could affect the value of portfolio
securities. For example, manufacturers of consumer goods could be hurt by a
rise in unemployment or technology companies could be hurt by such factors as
market saturation, price competition and rapid obsolescence.
IPO RISK. Securities purchased in initial public offerings (IPOs) may be very
volatile, due to their stock prices rising and falling rapidly, often based,
among other reasons, on investor perceptions rather than economic reasons.
Additionally, investments in IPOs may magnify the portfolio's performance if it
has a small asset base. The portfolio is less likely to experience a similar
impact on its performance as its assets grow because it is unlikely that the
portfolio will obtain proportionately larger IPO allocations.
DERIVATIVES RISK. Risks associated with derivatives include the risk that the
derivative is not well correlated with the security, index or currency to which
it relates; the risk that derivatives may result in losses or missed
opportunities; the risk that the portfolio will be unable to sell the
derivative because of an illiquid secondary market; the risk that a
counterparty is unwilling or unable to meet its obligation and the risk that
the derivative transaction could expose the portfolio to the effects of
leverage, which could increase the portfolio's exposure to the market and
magnify potential losses. There is no guarantee that derivatives, to the extent
employed, will have the intended effect, and their use could cause lower
returns or even losses to the portfolio. The use of derivatives by the
portfolio to hedge risk may reduce the opportunity for gain by offsetting the
positive effect of favorable price movements.
SECURITIES LENDING RISK. Any loss in the market price of securities loaned by
the portfolio that occurs during the term of the loan would be borne by the
portfolio and would adversely affect the portfolio's performance. Also, there
may be delays in recovery of securities loaned or even a loss of rights in the
collateral should the borrower of the securities fail financially while the
loan is outstanding. However, loans will be made only to borrowers selected by
the portfolio's delegate after a review of relevant facts and circumstances,
including the creditworthiness of the borrower.
PRICING RISK. At times, market conditions may make it difficult to value some
investments, and the portfolio may use certain valuation methodologies for some
of its investments, such as fair value pricing. Given the subjective nature of
such valuation methodologies, it is possible that the value determined for an
investment may be different than the value realized upon such investment's
sale. If the portfolio has valued its securities too highly, you may pay too
much for portfolio shares when you buy into the portfolio. If the portfolio has
underestimated the price of its securities, you may not receive the full market
value when you sell your portfolio shares.
SECURITY SELECTION RISK. A risk that pervades all investing is the risk that
the securities in the portfolio's portfolio may decline in value.
Other factors that could affect performance include:
o portfolio management could be wrong in the analysis of industries, companies,
economic trends, the relative attractiveness of different securities or
other matters.
o foreign securities may be more volatile than their US counterparts, for
reasons such as currency fluctuations and political and economic
uncertainty.
32 DWS DREMAN HIGH RETURN EQUITY VIP DWS VARIABLE SERIES II -
CLASS A SHARES
This portfolio may serve investors with long-term goals who are interested in a
large-cap value portfolio that may focus on certain sectors of the economy.
PERFORMANCE - CLASS A
While a portfolio's past performance isn't necessarily a sign of how it will do
in the future, it can be valuable for an investor to know.
The bar chart shows how the returns for the portfolio's Class A shares have
varied from year to year, which may give some idea of risk. The table shows
average annual returns for the portfolio and comparable index information
(which, unlike the portfolio, does not have any fees or expenses). The
performance of both the portfolio and the comparable index information varies
over time. All figures assume reinvestment of dividends and distributions.
This information doesn't reflect charges and fees associated with the separate
account that invests in the portfolio or any variable life insurance policy or
variable annuity contract for which the portfolio is an investment option.
These charges and fees will reduce returns.
ANNUAL TOTAL RETURN (%) as of 12/31 each year - CLASS A
[BARGRAPHIC APPEARS HERE]
-11.16 30.52 1.69 -18.03 32.04 13.95 7.92 18.74 -1.86
1999 2000 2001 2002 2003 2004 2005 2006 2007
FOR THE PERIODS INCLUDED IN THE BAR CHART:
BEST QUARTER: 20.80%, Q2 2003 WORST QUARTER: -17.32%, Q3 2002
2008 TOTAL RETURN AS OF MARCH 31: -10.31%
AVERAGE ANNUAL TOTAL RETURNS (%) as of 12/31/2007
1 YEAR 5 YEARS SINCE INCEPTION*
------ ------- ----------------
Portfolio - Class A -1.86 13.60 6.76
Standard & Poor's (S&P) 500 Index 5.49 12.83 4.59
* Since 5/4/98. Index comparison begins 4/30/98.
STANDARD & POOR'S 500 INDEX (S&P 500) is an unmanaged, capitalization-weighted
index of 500 stocks. The index is designed to measure performance of the broad
domestic economy through changes in the aggregate market value of 500 stocks
representing all major industries.
Current performance information may be higher or lower than the performance
data quoted above. For more recent performance information, contact your
participating insurance company.
DWS VARIABLE SERIES II - CLASS A SHARES DWS DREMAN HIGH RETURN EQUITY
VIP 33
HOW MUCH INVESTORS PAY
This table describes the fees and expenses that you may pay if you buy and hold
portfolio shares. The information in the table does not reflect charges and
fees associated with the separate account that invests in the portfolio or any
variable life insurance policy or variable annuity contract for which the
portfolio is an investment option. These charges and fees will increase
expenses.
FEE TABLE CLASS A
--------- -------
ANNUAL OPERATING EXPENSES, deducted from portfolio assets
Management Fee1 0.64%
Distribution/Service (12b-1) Fee None
Other Expenses2 0.14
TOTAL ANNUAL OPERATING EXPENSES3 0.78
1 Restated on an annualized basis to reflect approved fee changes taking
effect on May 1, 2008.
2 Restated on an annualized basis to reflect approved fee changes taking
effect on May 1, 2008. Includes a 0.10% administrative services fee paid
to the Advisor.
3 Through April 30, 2010, the Advisor has agreed to waive all or a portion of
its management fee and reimburse or pay certain operating expenses so that
the total annual operating expenses of the portfolio will not exceed 0.78%
for Class A shares, excluding certain expenses such as extraordinary
expenses, taxes, brokerage and interest.
Based on the costs above, this example helps you compare the expenses of Class
A shares to those of other mutual funds. This example assumes the expenses
above remain the same. It also assumes that you invested $10,000, earned 5%
annual returns, reinvested all dividends and distributions and sold your shares
at the end of each period. This is only an example; actual expenses will be
different.
EXAMPLE 1 YEAR 3 YEARS 5 YEARS 10 YEARS
------- ------ ------- ------- --------
Class A shares $80 $249 $433 $966
34 DWS DREMAN HIGH RETURN EQUITY VIP DWS VARIABLE SERIES II -
CLASS A SHARES
THE PORTFOLIO MANAGERS
The portfolio's subadvisor is Dreman Value Management L.L.C. The portfolio is
managed by a team of investment professionals who collaborate to develop and
implement the portfolio's investment strategy. Each portfolio manager on the
team has authority over all aspects of the portfolio's investment portfolio,
including but not limited to, purchases and sales of individual securities,
portfolio construction techniques, portfolio risk assessment and the management
of daily cash flows in accordance with portfolio holdings.
The following people handle the day-to-day management of the portfolio:
David N. Dreman
Chairman and Chief Investment Officer of Dreman Value Management, L.L.C. and
Lead Portfolio Manager.
o Began investment career in 1957.
o Joined the portfolio team in 1998.
o Founder, Dreman Value Management, L.L.C.
F. James Hutchinson
President and Portfolio Manager.
o Managing Director of Dreman Value Management, L.L.C.
o Joined Dreman Value Management, L.L.C. in 2000.
o Began investment career in 1986.
o Joined the portfolio team in 2002.
o Prior to joining Dreman Value Management, L.L.C., 30 years of experience
in finance and trust/investment management with The Bank of New York.
E. Clifton Hoover, Jr.
Co-Chief Investment Officer and Portfolio Manager.
o Joined Dreman Value Management, L.L.C. in 2006 as a Managing Director and
Co-Chief Investment Officer of Large Cap Value Strategy.
o Prior to joining Dreman Value Management, L.L.C., Managing Director and a
Portfolio Manager at NFJ Investment Group since 1997; Vice President -
Corporate Finance at Credit Lyonnais, 1992-1997; Financial Analyst at
Citibank, 1990-1992; and Credit Analyst/Corporate Loan Officer for
RepublicBank (now Bank of America), 1985-1990.
o Over 20 years of investment industry experience.
o Joined the portfolio team in 2006.
o MS, Texas Tech University.
The portfolio's Statement of Additional Information provides additional
information about a portfolio manager's investments in the portfolio, a
description of the portfolio management compensation structure, and information
regarding other accounts managed.
DWS VARIABLE SERIES II - CLASS A SHARES DWS DREMAN HIGH RETURN EQUITY
VIP 35
FINANCIAL HIGHLIGHTS
This table is designed to help you understand the portfolio's financial
performance. The figures in the first part of the table are for a single share.
The total return figures represent the percentage that an investor in the
portfolio would have earned (or lost), assuming all dividends and distributions
were reinvested. This information has been audited by Ernst & Young LLP, an
independent registered public accounting firm, whose report, along with the
portfolio's financial statements, is included in the portfolio's annual report
(see "Shareholder reports" on the back cover). The following table includes
selected data for a share outstanding throughout each period and other
performance information derived from the financial statements.
This information doesn't reflect charges and fees associated with the separate
account that invests in the portfolio or any variable life insurance policy or
variable annuity contract for which the portfolio is an investment option.
These charges and fees will reduce returns.
DWS DREMAN HIGH RETURN EQUITY VIP - CLASS A
YEARS ENDED DECEMBER 31, 2007 2006 2005 2004 2003
------------------------------------------- ------- ------- ------- ------- -------
SELECTED PER SHARE DATA
------------------------------------------------------------------------------------------------
NET ASSET VALUE, BEGINNING OF PERIOD $ 15.02 $ 13.41 $ 12.65 $ 11.29 $ 8.76
------------------------------------------- ------- ------- ------- ------- -------
Income (loss) from investment operations:
Net investment income (loss)a .29 .27 .24 .23 .20
------------------------------------------- ------- ------- ------- ------- -------
Net realized and unrealized gain (loss) ( .56) 2.21 .75 1.32 2.53
------------------------------------------- ------- ------- ------- ------- -------
TOTAL FROM INVESTMENT OPERATIONS ( .27) 2.48 .99 1.55 2.73
------------------------------------------- ------- ------- ------- ------- -------
Less distributions from:
Net investment income ( .22) ( .28) ( .23) ( .19) ( .20)
------------------------------------------- ------- ------- ------- ------- -------
Net realized gains ( .13) ( .59) - - -
------------------------------------------- ------- ------- ------- ------- -------
TOTAL DISTRIBUTIONS ( .35) ( .87) ( .23) ( .19) ( .20)
------------------------------------------- ------- ------- ------- ------- -------
NET ASSET VALUE, END OF PERIOD $ 14.40 $ 15.02 $ 13.41 $ 12.65 $ 11.29
------------------------------------------- ------- ------- ------- ------- -------
Total Return (%) ( 1.86) 18.74 7.92 13.95 32.04
------------------------------------------- ------- ------- ------- ------- -------
RATIOS TO AVERAGE NET ASSETS AND SUPPLEMENTAL DATA
------------------------------------------------------------------------------------------------
Net assets, end of period ($ millions) 792 992 785 747 672
------------------------------------------- ------- ------- ------- ------- -------
Ratio of expenses (%) .78 .77 .78 .78 .79
------------------------------------------- ------- ------- ------- ------- -------
Ratio of net investment income (%) 1.94 1.87 1.84 1.96 2.14
------------------------------------------- ------- ------- ------- ------- -------
Portfolio turnover rate (%) 27 20 10 9 18
------------------------------------------- ------- ------- ------- ------- -------
a Based on average shares outstanding during the period.
36 DWS DREMAN HIGH RETURN EQUITY VIP DWS VARIABLE SERIES II -
CLASS A SHARES
HYPOTHETICAL EXPENSE SUMMARY
Using the annual portfolio operating expense ratios presented in the fee tables
in the portfolio prospectus, the Hypothetical Expense Summary shows the
estimated fees and expenses, in actual dollars, that would be charged on a
hypothetical investment of $10,000 in the portfolio held for the next 10 years
and the impact of such fees and expenses on portfolio returns for each year and
cumulatively, assuming a 5% return for each year. The tables also assume that
all dividends and distributions are reinvested. The annual portfolio expense
ratios shown are net of any contractual fee waivers or expense reimbursements,
if any, for the period of the contractual commitment. Also, please note that if
you are investing through a third party provider, that provider may have fees
and expenses separate from those of the portfolio that are not reflected here.
Mutual fund fees and expenses fluctuate over time and actual expenses may be
higher or lower than those shown.
The Hypothetical Expense Summary should not be used or construed as an offer to
sell, a solicitation of an offer to buy or a recommendation or endorsement of
any specific mutual fund. You should carefully review the portfolio's
prospectus to consider the investment objectives, risks, expenses and charges
of the portfolio prior to investing.
DWS DREMAN HIGH RETURN EQUITY VIP - CLASS A
INITIAL HYPOTHETICAL ASSUMED RATE
MAXIMUM INVESTMENT: OF RETURN:
SALES CHARGE: $10,000 5%
0.00% ---------------------------------- ---------------------------------
CUMULATIVE CUMULATIVE HYPOTHETICAL
RETURN BEFORE RETURN AFTER YEAR-END BALANCE ANNUAL
FEES AND ANNUAL FUND FEES AND AFTER FEES AND FEES AND
YEAR EXPENSES EXPENSE RATIOS EXPENSES EXPENSES EXPENSES
----- ------------- -------------- ------------ ---------------- ---------
1 5.00% 0.78% 4.22% $ 10,422.00 $ 79.65
2 10.25% 0.78% 8.62% $ 10,861.81 $ 83.01
3 15.76% 0.78% 13.20% $ 11,320.18 $ 86.51
4 21.55% 0.78% 17.98% $ 11,797.89 $ 90.16
5 27.63% 0.78% 22.96% $ 12,295.76 $ 93.97
6 34.01% 0.78% 28.15% $ 12,814.64 $ 97.93
7 40.71% 0.78% 33.55% $ 13,355.42 $ 102.06
8 47.75% 0.78% 39.19% $ 13,919.02 $ 106.37
9 55.13% 0.78% 45.06% $ 14,506.40 $ 110.86
10 62.89% 0.78% 51.19% $ 15,118.57 $ 115.54
TOTAL $ 966.06
DWS VARIABLE SERIES II - CLASS A SHARES DWS DREMAN HIGH RETURN EQUITY
VIP 37
DWS DREMAN SMALL MID CAP VALUE VIP
THE PORTFOLIO'S MAIN INVESTMENT STRATEGY
The portfolio seeks long-term capital appreciation.
Under normal circumstances, the portfolio invests at least 80% of net assets,
plus the amount of any borrowings for investment purposes, in undervalued
common stocks of small and mid-size US companies. The portfolio defines small
companies as those that are similar in market value to those in the Russell
2000 (Reg. TM) Value Index (as of February 29, 2008, the Russell 2000 (Reg. TM)
Value Index had a median market capitalization of $493 million). The portfolio
defines mid-size companies as those that are similar in market value to those
in the Russell Midcap (Reg. TM) Value Index (as of February 29, 2008, the
Russell Midcap (Reg. TM) Value Index had a median market capitalization of $3.7
billion). The portfolio intends to invest primarily in companies whose market
capitalizations fall within the normal range of each Index.
The portfolio's equity investments are mainly common stocks, but may also
include other types of equities such as preferred or convertible stocks. The
portfolio may also invest in initial public offerings.
The portfolio managers begin their stock selection process by screening stocks
of small and mid-size companies with below market price-to-earnings (P/E)
ratios. The managers then seek companies with a low price compared to the book
value, cash flow and yield and analyze individual companies to identify those
that are fundamentally sound and appear to have strong potential for earnings
and dividend growth over the Index.
From the remaining group, the managers then complete their fundamental analysis
and make their buy decisions from a group of the most attractive stocks,
drawing on analysis of economic outlooks for various industries.
SECURITIES LENDING. The portfolio may lend its investment securities in an
amount up to 33 1/3% of its total assets to approved institutional borrowers
who need to borrow securities in order to complete certain transactions.
The managers will normally sell a stock when it no longer qualifies as a small
or mid-size company, when its P/E rises above that of the Index, its
fundamentals change or other investments offer better opportunities.
Although major changes tend to be infrequent, the Board of Trustees could
change the portfolio's investment objective without seeking shareholder
approval. However, the Board will provide shareholders with at least 60 days'
notice prior to making any changes to the portfolio's 80% investment policy.
OTHER INVESTMENTS
While the portfolio invests mainly in US stocks, it could invest up to 20% of
net assets in foreign securities.
Although not one of its principal investment strategies, the portfolio is
permitted, but not required, to use various types of derivatives (contracts
whose value is based on, for example, indices, currencies or securities).
Derivatives may be used for hedging and for risk management or for non-hedging
purposes to seek to enhance potential gains. The portfolio may use derivatives
in circumstances where portfolio management believes they offer an economical
means of gaining exposure to a particular asset class or to keep cash on hand
to meet shareholder redemptions or other needs while maintaining exposure to
the market. In particular, the portfolio may use futures, currency options and
forward currency transactions.
As a temporary defensive measure, the portfolio could shift up to 100% of
assets into investments such as money market securities. This measure could
prevent losses, but, while engaged in a temporary defensive position, the
portfolio will not be pursuing its investment objective. However, the portfolio
managers may choose not to use these strategies for various reasons, even in
very volatile market conditions.
THE MAIN RISKS OF INVESTING IN THE PORTFOLIO
There are several risk factors that could hurt the portfolio's performance,
cause you to lose money or cause the portfolio's performance to trail that of
other investments.
38 DWS DREMAN SMALL MID CAP VALUE VIP DWS VARIABLE SERIES II -
CLASS A SHARES
STOCK MARKET RISK. The portfolio is affected by how the stock market performs.
To the extent the portfolio invests in a particular capitalization or market
sector, the portfolio's performance may be proportionately affected by that
segment's general performance. When stock prices fall, you should expect the
value of your investment to fall as well. Because a stock represents ownership
in its issuer, stock prices can be hurt by poor management, shrinking product
demand and other business risks. These factors may affect single companies as
well as groups of companies. In addition, movements in financial markets may
adversely affect a stock's price, regardless of how well the company performs.
The market as a whole may not favor the types of investments the portfolio
makes, which could affect the portfolio's ability to sell them at an attractive
price.
VALUE INVESTING RISK. At times, "value" investing may perform better than or
worse than other investment styles and the overall market. If portfolio
management overestimates the value or return potential of one or more common
stocks, the portfolio may underperform the general equity market. Value stocks
may also be out of favor for certain periods in relation to growth stocks.
SMALL COMPANY CAPITALIZATION RISK. Small company stocks tend to experience
steeper price fluctuations than the stocks of larger companies. A shortage of
reliable information can also pose added risk to small company stocks.
Industry-wide reversals may have a greater impact on small companies, since
they lack the financial resources of large companies. Small company stocks are
typically less liquid than large company stocks. Accordingly, it may be harder
to find buyers for small company shares.
MEDIUM-SIZED COMPANY RISK. Medium-sized company stocks tend to experience
steeper price fluctuations than stocks of larger companies. A shortage of
reliable information can also pose added risk to medium sized companies stocks.
Industry-wide reversals may have a greater impact on medium-sized companies,
since they usually lack the financial resources of large companies.
Medium-sized company stocks are typically less liquid than large company
stocks. Accordingly, it may be harder to find buyers for medium-sized company
shares.
INDUSTRY RISK. While the portfolio does not concentrate in any industry, to the
extent that the portfolio has exposure to a given industry or sector, any
factors affecting that industry or sector could affect the value of portfolio
securities. For example, manufacturers of consumer goods could be hurt by a
rise in unemployment or technology companies could be hurt by such factors as
market saturation, price competition and rapid obsolescence.
IPO RISK. Securities purchased in initial public offerings (IPOs) may be very
volatile, due to their stock prices rising and falling rapidly, often based,
among other reasons, on investor perceptions rather than economic reasons.
Additionally, investments in IPOs may magnify the portfolio's performance if it
has a small asset base. The portfolio is less likely to experience a similar
impact on its performance as its assets grow because it is unlikely that the
portfolio will obtain proportionately larger IPO allocations.
DERIVATIVES RISK. Risks associated with derivatives include the risk that the
derivative is not well correlated with the security, index or currency to which
it relates; the risk that derivatives may result in losses or missed
opportunities; the risk that the portfolio will be unable to sell the
derivative because of an illiquid secondary market; the risk that a
counterparty is unwilling or unable to meet its obligation and the risk that
the derivative transaction could expose the portfolio to the effects of
leverage, which could increase the portfolio's exposure to the market and
magnify potential losses. There is no guarantee that derivatives, to the extent
employed, will have the intended effect, and their use could cause lower
returns or even losses to the portfolio. The use of derivatives by the
portfolio to hedge risk may reduce the opportunity for gain by offsetting the
positive effect of favorable price movements.
SECURITIES LENDING RISK. Any loss in the market price of securities loaned by
the portfolio that occurs during the term of the loan would be borne by the
portfolio and would adversely affect the portfolio's performance. Also, there
may be delays in recovery of securities loaned or even a loss of rights in the
collateral should the borrower of the securities fail financially while the
loan is outstanding. However, loans will be made only to borrowers selected by
the portfolio's delegate after a review of relevant facts and circumstances,
including the creditworthiness of the borrower.
PRICING RISK. At times, market conditions may make it difficult to value some
investments, and the portfolio may use certain valuation methodologies for some
of its investments, such as fair value pricing. Given the subjective nature of
such valuation methodologies, it is possible that the value determined for an
investment may be different than the value realized upon such investment's
sale. If the portfolio has valued its securities too highly, you may pay too
much for portfolio shares when you buy into the portfolio. If the portfolio has
underestimated the price of its securities, you may not receive the full market
value when you sell your portfolio shares.
DWS VARIABLE SERIES II - CLASS A SHARES DWS DREMAN SMALL MID CAP VALUE
VIP 39
SECURITY SELECTION RISK. A risk that pervades all investing is the risk that
the securities in the portfolio's portfolio may decline in value.
Other factors that could affect performance include:
o portfolio management could be wrong in the analysis of industries, companies,
economic trends, the relative attractiveness of different securities or
other matters.
o foreign securities may be more volatile than their US counterparts, for
reasons such as currency fluctuations and political and economic
uncertainty.
This portfolio is designed for value-oriented investors who are interested in
small-cap and mid-cap market exposure.
PERFORMANCE - CLASS A
While a portfolio's past performance isn't necessarily a sign of how it will do
in the future, it can be valuable for an investor to know.
The bar chart shows how the returns for the portfolio's Class A shares have
varied from year to year, which may give some idea of risk. The table shows
average annual returns for the portfolio and comparable index information
(which, unlike the portfolio, does not have any fees or expenses). The
performance of both the portfolio and the comparable index information varies
over time. All figures assume reinvestment of dividends and distributions.
This information doesn't reflect charges and fees associated with the separate
account that invests in the portfolio or any variable life insurance policy or
variable annuity contract for which the portfolio is an investment option.
These charges and fees will reduce returns.
Prior to November 3, 2006, the portfolio was named DWS Dreman Small Cap Value
VIP and operated with a different investment strategy. Performance would have
been different if the portfolio's current policies had been in effect.
ANNUAL TOTAL RETURN (%) as of 12/31 each year - CLASS A
[BARGRAPHIC APPEARS HERE]
-11.25 2.80 4.05 17.63 -11.43 42.15 26.03 10.25 25.06 3.06
1998 1999 2000 2001 2002 2003 2004 2005 2006 2007
FOR THE PERIODS INCLUDED IN THE BAR CHART:
BEST QUARTER: 21.84%, Q2 2003 WORST QUARTER: -22.47%, Q3 1998
2008 TOTAL RETURN AS OF MARCH 31: -9.91%
AVERAGE ANNUAL TOTAL RETURNS (%) as of 12/31/2007
1 YEAR 5 YEARS 10 YEARS
------ ------- --------
Portfolio - Class A 3.06 20.55 9.68
Russell 2500 Value Index -7.27 16.17 9.66
Russell 2000 Value Index -1.57 16.25 7.08
RUSSELL 2500(TM) VALUE INDEX is an unmanaged index measuring the small- to
mid-cap US equity value market.
40 DWS DREMAN SMALL MID CAP VALUE VIP DWS VARIABLE SERIES II -
CLASS A SHARES
RUSSELL 2000 (Reg. TM) VALUE INDEX is an unmanaged index measuring the
performance of those Russell 2000 companies with lower price-to-book ratios and
lower forecasted growth values.
Current performance information may be higher or lower than the performance
data quoted above. For more recent performance information, contact your
participating insurance company.
HOW MUCH INVESTORS PAY
This table describes the fees and expenses that you may pay if you buy and hold
portfolio shares. The information in the table does not reflect charges and
fees associated with the separate account that invests in the portfolio or any
variable life insurance policy or variable annuity contract for which the
portfolio is an investment option. These charges and fees will increase
expenses.
FEE TABLE CLASS A
--------- -------
ANNUAL OPERATING EXPENSES, deducted from portfolio assets
Management Fee1 0.64%
Distribution/Service (12b-1) Fee None
Other Expenses2 0.14
TOTAL ANNUAL OPERATING EXPENSES 0.78
1 Restated on an annualized basis to reflect approved fee changes taking
effect on May 1, 2008.
2 Restated on an annualized basis to reflect approved fee changes taking
effect on May 1, 2008. Includes a 0.10% administrative services fee paid
to the Advisor.
Based on the costs above, this example helps you compare the expenses of Class
A shares to those of other mutual funds. This example assumes the expenses
above remain the same. It also assumes that you invested $10,000, earned 5%
annual returns, reinvested all dividends and distributions and sold your shares
at the end of each period. This is only an example; actual expenses will be
different.
EXAMPLE 1 YEAR 3 YEARS 5 YEARS 10 YEARS
------- ------ ------- ------- --------
Class A shares $80 $249 $433 $966
DWS VARIABLE SERIES II - CLASS A SHARES DWS DREMAN SMALL MID CAP VALUE
VIP 41
THE PORTFOLIO MANAGERS
The portfolio's subadvisor is Dreman Value Management, L.L.C. The portfolio is
managed by a team of investment professionals who collaborate to develop and
implement the portfolio's investment strategy. Each portfolio manager on the
team has authority over all aspects of the portfolio's investment portfolio,
including but not limited to, purchases and sales of individual securities,
portfolio construction techniques, portfolio risk assessment and the management
of daily cash flows in accordance with portfolio holdings.
The following people handle the day-to-day management of the portfolio:
David N. Dreman
Chairman and Chief Investment Officer of Dreman Value Management, L.L.C. and
Lead Portfolio Manager.
o Began investment career in 1957.
o Joined the portfolio in 2002.
o Founder, Dreman Value Management, L.L.C.
E. Clifton Hoover, Jr.
Co-Chief Investment Officer and Portfolio Manager.
o Joined Dreman Value Management L.L.C. in 2006 as a Managing Director and
Co-Chief Investment Officer of Large Cap Value Strategy.
o Prior to joining Dreman Value Management, L.L.C., Managing Director and a
Portfolio Manager at NFJ Investment Group since 1997; Vice President -
Corporate Finance at Credit Lyonnais, 1992-1997; Financial Analyst at
Citibank, 1990-1992; and Credit Analyst/Corporate Loan Officer for
RepublicBank (now Bank of America), 1985-1990.
o Over 20 years of investment industry experience.
o Joined the portfolio in 2006.
o MS, Texas Tech University.
Mark Roach
Managing Director and Portfolio Manager.
o Joined Dreman Value Management, L.L.C. in 2006 as a Managing Director and
Portfolio Manager of Small and Mid Cap products, and joined the portfolio
in 2006.
o Prior to that, Portfolio Manager at Vaughan Nelson Investment Management,
managing a small cap product from 2002 through 2006; security analyst from
1997 to 2001 for various institutions including Fifth and Third Bank,
Lynch, Jones & Ryan and USAA.
o BS, Baldwin Wallace College; MBA, University of Chicago.
The portfolio's Statement of Additional Information provides additional
information about a portfolio manager's investments in the portfolio, a
description of the portfolio management compensation structure, and information
regarding other accounts managed.
42 DWS DREMAN SMALL MID CAP VALUE VIP DWS VARIABLE SERIES II -
CLASS A SHARES
FINANCIAL HIGHLIGHTS
This table is designed to help you understand the portfolio's financial
performance. The figures in the first part of the table are for a single share.
The total return figures represent the percentage that an investor in the
portfolio would have earned (or lost), assuming all dividends and distributions
were reinvested. This information has been audited by Ernst & Young LLP, an
independent registered public accounting firm, whose report, along with the
portfolio's financial statements, is included in the portfolio's annual report
(see "Shareholder reports" on the back cover). The following table includes
selected data for a share outstanding throughout each period and other
performance information derived from the financial statements.
This information doesn't reflect charges and fees associated with the separate
account that invests in the portfolio or any variable life insurance policy or
variable annuity contract for which the portfolio is an investment option.
These charges and fees will reduce returns.
Prior to November 3, 2006, the portfolio was named DWS Dreman Small Cap Value
VIP and operated with a different investment strategy. Performance would have
been different if the portfolio's current policies had been in effect.
DWS DREMAN SMALL MID CAP VALUE VIP - CLASS A
YEARS ENDED DECEMBER 31, 2007 2006 2005 2004 2003
----------------------------------------- -------- -------- -------- ------- --------
SELECTED PER SHARE DATA
----------------------------------------------------------------------------------------------------
NET ASSET VALUE, BEGINNING OF PERIOD $ 22.93 $ 19.98 $ 20.05 $ 16.06 $ 11.66
----------------------------------------- -------- -------- -------- ------- --------
Income (loss) from investment operations:
Net investment income (loss)a .18 .15 .19 .17 .19
----------------------------------------- -------- -------- -------- ------- --------
Net realized and unrealized gain (loss) .54 4.69 1.67 3.98 4.55
------------------------------------------- -------- -------- -------- ------- --------
TOTAL FROM INVESTMENT OPERATIONS .72 4.84 1.86 4.15 4.74
------------------------------------------- -------- -------- -------- ------- --------
Less distributions from:
Net investment income ( .23) ( .18) ( .15) ( .16) ( .15)
----------------------------------------- -------- -------- -------- ------- --------
Net realized gains ( 3.30) ( 1.71) ( 1.78) - ( .19)
------------------------------------------- -------- -------- -------- ------- --------
TOTAL DISTRIBUTIONS ( 3.53) ( 1.89) ( 1.93) ( .16) ( .34)
------------------------------------------- -------- -------- -------- ------- --------
NET ASSET VALUE, END OF PERIOD $ 20.12 $ 22.93 $ 19.98 $ 20.05 $ 16.06
------------------------------------------- -------- -------- -------- ------- --------
Total Return (%) 3.06 25.06 10.25 26.03 42.15
----------------------------------------- -------- -------- -------- ------- --------
RATIOS TO AVERAGE NET ASSETS AND SUPPLEMENTAL DATA
----------------------------------------------------------------------------------------------------
Net assets, end of period ($ millions) 468 562 493 467 354
----------------------------------------- -------- -------- -------- ------- --------
Ratio of expenses (%) .78 .79 .79 .79 .80
----------------------------------------- -------- -------- -------- ------- --------
Ratio of net investment income (%) .85 .71 .96 .96 1.46
----------------------------------------- -------- -------- -------- ------- --------
Portfolio turnover rate (%) 110 52 61 73 71
------------------------------------------- -------- -------- -------- ------- --------
a Based on average shares outstanding during the period.
DWS VARIABLE SERIES II - CLASS A SHARES DWS DREMAN SMALL MID CAP VALUE
VIP 43
HYPOTHETICAL EXPENSE SUMMARY
Using the annual portfolio operating expense ratios presented in the fee tables
in the portfolio prospectus, the Hypothetical Expense Summary shows the
estimated fees and expenses, in actual dollars, that would be charged on a
hypothetical investment of $10,000 in the portfolio held for the next 10 years
and the impact of such fees and expenses on portfolio returns for each year and
cumulatively, assuming a 5% return for each year. The tables also assume that
all dividends and distributions are reinvested. The annual portfolio expense
ratios shown are net of any contractual fee waivers or expense reimbursements,
if any, for the period of the contractual commitment. Also, please note that if
you are investing through a third party provider, that provider may have fees
and expenses separate from those of the portfolio that are not reflected here.
Mutual fund fees and expenses fluctuate over time and actual expenses may be
higher or lower than those shown.
The Hypothetical Expense Summary should not be used or construed as an offer to
sell, a solicitation of an offer to buy or a recommendation or endorsement of
any specific mutual fund. You should carefully review the portfolio's
prospectus to consider the investment objectives, risks, expenses and charges
of the portfolio prior to investing.
DWS DREMAN SMALL MID CAP VALUE VIP - CLASS A
INITIAL HYPOTHETICAL ASSUMED RATE
MAXIMUM INVESTMENT: OF RETURN:
SALES CHARGE: $10,000 5%
0.00% ---------------------------------- ---------------------------------
CUMULATIVE CUMULATIVE HYPOTHETICAL
RETURN BEFORE RETURN AFTER YEAR-END BALANCE ANNUAL
FEES AND ANNUAL FUND FEES AND AFTER FEES AND FEES AND
YEAR EXPENSES EXPENSE RATIOS EXPENSES EXPENSES EXPENSES
----- ------------- -------------- ------------ ---------------- ---------
1 5.00% 0.78% 4.22% $ 10,422.00 $ 79.65
2 10.25% 0.78% 8.62% $ 10,861.81 $ 83.01
3 15.76% 0.78% 13.20% $ 11,320.18 $ 86.51
4 21.55% 0.78% 17.98% $ 11,797.89 $ 90.16
5 27.63% 0.78% 22.96% $ 12,295.76 $ 93.97
6 34.01% 0.78% 28.15% $ 12,814.64 $ 97.93
7 40.71% 0.78% 33.55% $ 13,355.42 $ 102.06
8 47.75% 0.78% 39.19% $ 13,919.02 $ 106.37
9 55.13% 0.78% 45.06% $ 14,506.40 $ 110.86
10 62.89% 0.78% 51.19% $ 15,118.57 $ 115.54
TOTAL $ 966.06
44 DWS DREMAN SMALL MID CAP VALUE VIP DWS VARIABLE SERIES II -
CLASS A SHARES
DWS GLOBAL THEMATIC VIP
THE PORTFOLIO'S MAIN INVESTMENT STRATEGY
The portfolio seeks long-term capital growth.
Under normal circumstances, the portfolio invests at least 80% of net assets,
plus the amount of any borrowings for investment purposes, in common stocks and
other equities of companies throughout the world that the portfolio manager
considers to be "blue chip" companies. Blue chip companies are large, well
known companies that typically have an established earnings and dividends
history, easy access to credit, solid positions in their industries and strong
management.
In choosing stocks, the portfolio manager uses a combination of three
analytical disciplines:
BOTTOM-UP RESEARCH. The manager looks for individual companies with a history
of above-average growth, strong competitive positioning, attractive prices
relative to potential growth, sound financial strength and effective
management, among other factors.
GROWTH ORIENTATION. The manager generally looks for companies that the manager
believes have above-average potential for sustainable growth of revenue or
earnings and whose market value appears reasonable in light of their business
prospects.
ANALYSIS OF GLOBAL THEMES. The manager considers global economic outlooks,
seeking to identify industries and companies that are likely to benefit from
social, political and economic changes.
The manager may favor different types of securities from different industries
and companies at different times, while still maintaining variety in terms of
the types of securities, issuers and countries represented.
The manager will normally sell a stock when the manager believes its price is
unlikely to go much higher, its fundamentals have deteriorated, other
investments offer better opportunities or in the course of adjusting the fund's
exposure to a given country.
SECURITIES LENDING. The portfolio may lend its investment securities in an
amount up to 33 1/3% of its total assets to approved institutional borrowers
who need to borrow securities in order to complete certain transactions.
Although major changes tend to be infrequent, the Board of Trustees could
change the portfolio's investment objective without seeking shareholder
approval. However, the Board will provide shareholders with at least 60 days'
notice prior to making any changes to the portfolio's 80% policy.
OTHER INVESTMENTS
While most of the portfolio's equities are common stocks, some may be other
types of equities, such as convertible stocks or preferred stocks. The
portfolio may also invest up to 5% of total assets in junk bonds, (i.e., grade
BB/Ba and below). Compared to investment grade bonds, junk bonds may pay higher
yields and have higher volatility and risk of default.
Although not one of its principal investment strategies, the portfolio is
permitted, but not required, to use various types of derivatives (contracts
whose value is based on, for example, indices, currencies or securities). The
portfolio may use derivatives in circumstances where the managers believe they
offer an economical means of gaining exposure to a particular asset class or to
keep cash on hand to meet shareholder redemptions or other needs while
maintaining exposure to the market. In particular, the portfolio may use
futures, currency options and forward currency transactions.
As a temporary defensive measure, the portfolio could shift up to 100% of
assets into investments such as money market securities. This measure could
prevent losses, but, while engaged in a temporary defensive position, the
portfolio will not be pursuing its investment objective. However, the portfolio
managers may choose not to use these strategies for various reasons, even in
very volatile market conditions.
DWS VARIABLE SERIES II - CLASS A SHARES DWS GLOBAL THEMATIC
VIP 45
THE MAIN RISKS OF INVESTING IN THE PORTFOLIO
There are several risk factors that could hurt the portfolio's performance,
cause you to lose money or cause the portfolio's performance to trail that of
other investments.
STOCK MARKET RISK. An important factor with the portfolio is how the stock
markets perform - in this case US and foreign stock markets. When US and
foreign stock prices fall, you should expect the value of your investment to
fall as well. Compared to large company stocks, small company stocks tend to be
more volatile, in part because these companies tend to be less established and
the valuation of their stocks often depends on future expectations. Because a
stock represents ownership in its issuer, stock prices can be hurt by poor
management, shrinking product demand and other business risks. These risk
factors may affect single companies as well as groups of companies. In
addition, movements in financial markets may adversely affect a stock's price,
regardless of how well the company performs. The market as a whole may not
favor the types of investments the portfolio makes and the portfolio may not be
able to get attractive prices for them.
FOREIGN INVESTMENT RISK. Foreign investments involve certain special risks,
including:
o POLITICAL RISK. Some foreign governments have limited the outflow of profits
to investors abroad, imposed restrictions on the exchange or export of
foreign currency, extended diplomatic disputes to include trade and
financial relations, seized foreign investment and imposed higher taxes.
o INFORMATION RISK. Companies based in foreign markets are usually not subject
to accounting, auditing and financial reporting standards and practices as
stringent as those in the US. Therefore, their financial reports may present
an incomplete, untimely or misleading picture of a company, as compared to
the financial reports required in the US.
o LIQUIDITY RISK. Investments that trade less can be more difficult or more
costly to buy, or to sell, than more liquid or active investments. This
liquidity risk is a factor of the trading volume of a particular investment,
as well as the size and liquidity of the entire local market. On the whole,
foreign exchanges are smaller and less liquid than US exchanges. This can
make buying and selling certain investments more difficult and costly.
Relatively small transactions in some instances can have a
disproportionately large effect on the price and supply of securities. In
certain situations, it may become virtually impossible to sell an investment
in an orderly fashion at a price that approaches portfolio management's
estimate of its value. For the same reason, it may at times be difficult to
value the portfolio's foreign investments.
o REGULATORY RISK. There is generally less government regulation of foreign
markets, companies and securities dealers than in the US.
o CURRENCY RISK. The portfolio invests in securities denominated in foreign
currencies. Changes in exchange rates between foreign currencies and the US
dollar may affect the US dollar value of foreign securities or the income or
gain received on these securities.
o LIMITED LEGAL RECOURSE RISK. Legal remedies for investors may be more limited
than the legal remedies available in the US.
o TRADING PRACTICE RISK. Brokerage commissions and other fees are generally
higher for foreign investments than for US investments. The procedures and
rules governing foreign transactions and custody may also involve delays in
payment, delivery or recovery of money or investments.
o TAXES. Foreign withholding and certain other taxes may reduce the amount of
income available to distribute to shareholders of the portfolio. In
addition, special US tax considerations may apply to the portfolio's foreign
investments.
EMERGING MARKET RISK. All of the risks of investing in foreign securities are
increased in connection with investments in emerging markets securities. In
addition, profound social changes and business practices that depart from norms
in developed countries' economies have hindered the orderly growth of emerging
economies and their markets in the past and have caused instability. High
levels of debt tend to make emerging economies heavily reliant on foreign
capital and vulnerable to capital flight. Countries in emerging markets are
also more likely to experience high levels of inflation, deflation or currency
devaluation, which could also hurt their economies and securities markets. For
these and other reasons, investments in emerging markets are often considered
speculative.
46 DWS GLOBAL THEMATIC VIP DWS VARIABLE SERIES II -
CLASS A SHARES
PRICING RISK. At times, market conditions may make it difficult to value some
investments, and the portfolio may use certain valuation methodologies for some
of its investments, such as fair value pricing. Given the subjective nature of
such valuation methodologies, it is possible that the value determined for an
investment may be different than the value realized upon such investment's
sale. If the portfolio has valued its securities too highly, you may pay too
much for portfolio shares when you buy into the portfolio. If the portfolio has
underestimated the price of its securities, you may not receive the full market
value when you sell your portfolio shares.
DERIVATIVES RISK. Risks associated with derivatives include the risk that the
derivative is not well correlated with the security, index or currency to which
it relates; the risk that derivatives may result in losses or missed
opportunities; the risk that the portfolio will be unable to sell the
derivative because of an illiquid secondary market; the risk that a
counterparty is unwilling or unable to meet its obligation and the risk that
the derivative transaction could expose the portfolio to the effects of
leverage, which could increase the portfolio's exposure to the market and
magnify potential losses. There is no guarantee that derivatives, to the extent
employed, will have the intended effect, and their use could cause lower
returns or even losses to the portfolio. The use of derivatives by the
portfolio to hedge risk may reduce the opportunity for gain by offsetting the
positive effect of favorable price movements.
SECURITIES LENDING RISK. Any loss in the market price of securities loaned by
the portfolio that occurs during the term of the loan would be borne by the
portfolio and would adversely affect the portfolio's performance. Also, there
may be delays in recovery of securities loaned or even a loss of rights in the
collateral should the borrower of the securities fail financially while the
loan is outstanding. However, loans will be made only to borrowers selected by
the portfolio's delegate after a review of relevant facts and circumstances,
including the creditworthiness of the borrower.
SECURITY SELECTION RISK. A risk that pervades all investing is the risk that
the securities in the portfolio's portfolio may decline in value.
Another factor that could affect performance is:
o portfolio management could be wrong in the analysis of industries, companies,
economic trends, the relative attractiveness of different securities or
other matters.
If you are interested in large-cap stocks and want to look beyond US markets,
this portfolio may be appropriate for you.
DWS VARIABLE SERIES II - CLASS A SHARES DWS GLOBAL THEMATIC
VIP 47
PERFORMANCE - CLASS A
While a portfolio's past performance isn't necessarily a sign of how it will do
in the future, it can be valuable for an investor to know.
The bar chart shows how the returns for the portfolio's Class A shares have
varied from year to year, which may give some idea of risk. The table shows
average annual returns for the portfolio and comparable index information
(which, unlike the portfolio, does not have any fees or expenses). The
performance of both the portfolio and the comparable index information varies
over time. All figures assume reinvestment of dividends and distributions.
This information doesn't reflect charges and fees associated with the separate
account that invests in the portfolio or any variable life insurance policy or
variable annuity contract for which the portfolio is an investment option.
These charges and fees will reduce returns.
ANNUAL TOTAL RETURN (%) as of 12/31 each year - CLASS A
[BARGRAPHIC APPEARS HERE]
26.70 -3.36 -15.48 -15.77 29.13 14.76 22.94 30.14 6.29
1999 2000 2001 2002 2003 2004 2005 2006 2007
FOR THE PERIODS INCLUDED IN THE BAR CHART:
BEST QUARTER: 18.36%, Q4 1999 WORST QUARTER: -16.04%, Q3 2002
2008 TOTAL RETURN AS OF MARCH 31: -8.74%
AVERAGE ANNUAL TOTAL RETURNS (%) as of 12/31/2007
1 YEAR 5 YEARS SINCE INCEPTION*
------ ------- ----------------
Portfolio - Class A 6.29 20.31 8.25
MSCI World Index 9.04 16.96 5.67
* Since 5/5/98. Index comparison begins 4/30/98.
Total returns would have been lower if operating expenses hadn't been reduced.
MSCI WORLD INDEX is an unmanaged capitalization-weighted measure of stock
markets around the world, including North America, Europe, Australia and Asia.
Current performance information may be higher or lower than the performance
data quoted above. For more recent performance information, contact your
participating insurance company.
48 DWS GLOBAL THEMATIC VIP DWS VARIABLE SERIES II -
CLASS A SHARES
HOW MUCH INVESTORS PAY
This table describes the fees and expenses that you may pay if you buy and hold
portfolio shares. The information in the table does not reflect charges and
fees associated with the separate account that invests in the portfolio or any
variable life insurance policy or variable annuity contract for which the
portfolio is an investment option. These charges and fees will increase
expenses.
FEE TABLE CLASS A
--------- -------
ANNUAL OPERATING EXPENSES, deducted from portfolio assets
Management Fee1 0.92%
Distribution/Service (12b-1) Fee None
Other Expenses2 0.40
Underlying Portfolio Expenses3 0.01
TOTAL ANNUAL OPERATING EXPENSES 1.33
Less Expense Waiver/Reimbursement 0.27
NET ANNUAL OPERATING EXPENSES4 1.06
1 Restated on an annualized basis to reflect approved fee changes taking
effect on May 1, 2008.
2 Restated on an annualized basis to reflect approved fee changes taking
effect on May 1, 2008. Includes a 0.10% administrative services fee paid
to the Advisor.
3 In addition to the expenses that the portfolio bears directly, the
portfolio's shareholders indirectly bear the expenses of the underlying
portfolios in which the portfolio invests. The portfolio's estimated
indirect expense from investing in the underlying portfolios, based on its
expected allocations to the underlying portfolios, is as shown in the
table.
4 Through April 30, 2009, the Advisor has agreed to waive all or a portion of
its management fee and reimburse or pay certain operating expenses so that
the total annual operating expenses of the portfolio will not exceed 1.05%
for Class A shares, excluding certain expenses such as extraordinary
expenses, taxes, brokerage, interest, and indirect expenses of underlying
DWS portfolios.
Based on the costs above (including one year of capped expenses in each
period), this example helps you compare the expenses of Class A shares to those
of other mutual funds. This example assumes the expenses above remain the same.
It also assumes that you invested $10,000, earned 5% annual returns, reinvested
all dividends and distributions and sold your shares at the end of each period.
This is only an example; actual expenses will be different.
EXAMPLE 1 YEAR 3 YEARS 5 YEARS 10 YEARS
------- ------ ------- ------- --------
Class A shares $108 $395 $703 $1,578
DWS VARIABLE SERIES II - CLASS A SHARES DWS GLOBAL THEMATIC
VIP 49
THE PORTFOLIO MANAGER
The following person handles the day-to-day management of the portfolio:
Oliver Kratz
Managing Director of Deutsche Asset Management and Portfolio Manager of the
portfolio.
o Joined Deutsche Asset Management in 1996 and the portfolio in 2003.
o Head of global portfolio selection team for Alpha Emerging Markets
Equity: New York.
o Prior to that, two years of experience at Merrill Lynch, Brown Brothers
Harriman and McKinsey & Co.; authored Frontier Emerging Markets Securities
Price Behavior and Valuation; Kluwers Academic Publishers, 1999.
o BA, Tufts University and Karlova University; MALD and Ph.D, The Fletcher
School, administered jointly by Harvard University and Tufts University.
The portfolio's Statement of Additional Information provides additional
information about a portfolio manager's investments in the portfolio, a
description of the portfolio management compensation structure, and information
regarding other accounts managed.
50 DWS GLOBAL THEMATIC VIP DWS VARIABLE SERIES II -
CLASS A SHARES
FINANCIAL HIGHLIGHTS
This table is designed to help you understand the portfolio's financial
performance. The figures in the first part of the table are for a single share.
The total return figures represent the percentage that an investor in the
portfolio would have earned (or lost), assuming all dividends and distributions
were reinvested. This information has been audited by Ernst & Young LLP, an
independent registered public accounting firm, whose report, along with the
portfolio's financial statements, is included in the portfolio's annual report
(see "Shareholder reports" on the back cover). The following table includes
selected data for a share outstanding throughout each period and other
performance information derived from the financial statements.
This information doesn't reflect charges and fees associated with the separate
account that invests in the portfolio or any variable life insurance policy or
variable annuity contract for which the portfolio is an investment option.
These charges and fees will reduce returns.
DWS GLOBAL THEMATIC VIP - CLASS A
YEARS ENDED DECEMBER 31, 2007 2006 2005 2004 2003
----------------------------------------------- -------- -------- ------- ------- -------
SELECTED PER SHARE DATA
-----------------------------------------------------------------------------------------------------------
NET ASSET VALUE, BEGINNING OF PERIOD $ 17.39 $ 14.44 $ 11.78 $ 10.39 $ 8.08
----------------------------------------------- -------- -------- ------- ------- -------
Income (loss) from investment operations:
Net investment income (loss)a .14 .15c .12 .04 .09
----------------------------------------------- -------- -------- ------- ------- -------
Net realized and unrealized gain (loss) .88 4.02 2.58 1.48 2.25
----------------------------------------------- -------- -------- ------- ------- -------
TOTAL FROM INVESTMENT OPERATIONS 1.02 4.17 2.70 1.52 2.34
----------------------------------------------- -------- -------- ------- ------- -------
Less distributions from:
Net investment income ( .11) ( .09) ( .04) ( .13) ( .03)
----------------------------------------------- -------- -------- ------- ------- -------
Net realized gains ( 2.64) ( 1.13) - - -
----------------------------------------------- -------- -------- ------- ------- -------
TOTAL DISTRIBUTIONS ( 2.75) ( 1.22) ( .04) ( .13) ( .03)
----------------------------------------------- -------- -------- ------- ------- -------
NET ASSET VALUE, END OF PERIOD $ 15.66 $ 17.39 $ 14.44 $ 11.78 $ 10.39
----------------------------------------------- -------- -------- ------- ------- -------
Total Return (%)b 6.29 30.14c 22.94 14.76 29.13
----------------------------------------------- -------- -------- ------- ------- -------
RATIOS TO AVERAGE NET ASSETS AND SUPPLEMENTAL DATA
-----------------------------------------------------------------------------------------------------------
Net assets, end of period ($ millions) 151 143 85 63 55
----------------------------------------------- -------- -------- ------- ------- -------
Ratio of expenses before expense reductions (%) 1.44 1.38 1.41 1.44 1.48
----------------------------------------------- -------- -------- ------- ------- -------
Ratio of expenses after expense reductions (%) 1.11 1.04 1.28 1.43 1.17
----------------------------------------------- -------- -------- ------- ------- -------
Ratio of net investment income (%) .82 .92c .98 .38 1.02
----------------------------------------------- -------- -------- ------- ------- -------
Portfolio turnover rate (%) 191 136 95 81 65
----------------------------------------------- -------- -------- ------- ------- -------
a Based on average shares outstanding during the period.
b Total return would have been lower had certain expenses not been reduced.
c Includes non-recurring income from the Advisor recorded as a result of an
administrative proceeding regarding disclosure of brokerage allocation
practices in connection with sales of DWS Scudder Funds. The non-recurring
income resulted in an increase in net investment income of $0.004 per
share and an increase in the ratio of net investment income of 0.03%.
Excluding this non-recurring income, total return would have been 0.02%
lower.
DWS VARIABLE SERIES II - CLASS A SHARES DWS GLOBAL THEMATIC
VIP 51
HYPOTHETICAL EXPENSE SUMMARY
Using the annual portfolio operating expense ratios presented in the fee tables
in the portfolio prospectus, the Hypothetical Expense Summary shows the
estimated fees and expenses, in actual dollars, that would be charged on a
hypothetical investment of $10,000 in the portfolio held for the next 10 years
and the impact of such fees and expenses on portfolio returns for each year and
cumulatively, assuming a 5% return for each year. The tables also assume that
all dividends and distributions are reinvested. The annual portfolio expense
ratios shown are net of any contractual fee waivers or expense reimbursements,
if any, for the period of the contractual commitment. Also, please note that if
you are investing through a third party provider, that provider may have fees
and expenses separate from those of the portfolio that are not reflected here.
Mutual fund fees and expenses fluctuate over time and actual expenses may be
higher or lower than those shown.
The Hypothetical Expense Summary should not be used or construed as an offer to
sell, a solicitation of an offer to buy or a recommendation or endorsement of
any specific mutual fund. You should carefully review the portfolio's
prospectus to consider the investment objectives, risks, expenses and charges
of the portfolio prior to investing.
DWS GLOBAL THEMATIC VIP - CLASS A
MAXIMUM INITIAL HYPOTHETICAL ASSUMED RATE
SALES CHARGE: INVESTMENT: OF RETURN:
0.00% $10,000 5%
------------- ---------------------------------- ---------------------------------
CUMULATIVE CUMULATIVE HYPOTHETICAL
RETURN BEFORE RETURN AFTER YEAR-END BALANCE ANNUAL
FEES AND ANNUAL FUND FEES AND AFTER FEES AND FEES AND
YEAR EXPENSES EXPENSE RATIOS EXPENSES EXPENSES EXPENSES
----- ------------- -------------- ------------ ---------------- ----------
1 5.00% 1.06% 3.94% $ 10,394.00 $ 108.09
2 10.25% 1.33% 7.75% $ 10,775.46 $ 140.78
3 15.76% 1.33% 11.71% $ 11,170.92 $ 145.94
4 21.55% 1.33% 15.81% $ 11,580.89 $ 151.30
5 27.63% 1.33% 20.06% $ 12,005.91 $ 156.85
6 34.01% 1.33% 24.47% $ 12,446.53 $ 162.61
7 40.71% 1.33% 29.03% $ 12,903.32 $ 168.58
8 47.75% 1.33% 33.77% $ 13,376.87 $ 174.76
9 55.13% 1.33% 38.68% $ 13,867.80 $ 181.18
10 62.89% 1.33% 43.77% $ 14,376.75 $ 187.83
TOTAL $ 1,577.92
52 DWS GLOBAL THEMATIC VIP DWS VARIABLE SERIES II -
CLASS A SHARES
DWS GOVERNMENT & AGENCY SECURITIES VIP
THE PORTFOLIO'S MAIN INVESTMENT STRATEGY
The portfolio seeks high current income consistent with preservation of
capital.
Under normal circumstances, the portfolio invests at least 80% of net assets,
plus the amount of any borrowings for investment purposes, in US government
securities and repurchase agreements of US government securities. US
government-related debt instruments in which the portfolio may invest include:
o direct obligations of the US Treasury;
o securities such as Ginnie Maes which are mortgage-backed securities issued
and guaranteed by the Government National Mortgage Association (GNMA) and
supported by the full faith and credit of the United States; and
o securities issued or guaranteed, as to their payment of principal and
interest, by US government agencies or government sponsored entities, some
of which may be supported only by the credit of the issuer.
The portfolio normally invests all of its assets in securities issued or
guaranteed by the US government, its agencies or instrumentalities, except the
portfolio may invest up to 10% of its net assets in cash equivalents, such as
money market funds, and short-term bond funds. These securities may not be
issued or guaranteed by the US government, its agencies or instrumentalities.
The portfolio may use derivative instruments as described in "Other
Investments."
In deciding which types of government bonds to buy and sell, the portfolio
managers first consider the relative attractiveness of Treasuries compared to
other US government and agency securities and determines allocations for each.
The portfolio managers' decisions are generally based on a number of factors,
including interest rate outlooks and changes in supply and demand within the
bond market.
In choosing individual bonds, the portfolio managers review each bond's
fundamentals, compare the yields of shorter maturity bonds to those of longer
maturity bonds and use specialized analysis to project prepayment rates and
other factors that could affect a bond's attractiveness.
The portfolio managers may adjust the duration (a measure of sensitivity to
interest rate movements) of the portfolio, depending on their outlook for
interest rates.
SECURITIES LENDING. The portfolio may lend its investment securities in an
amount up to 33 1/3% of its total assets to approved institutional borrowers
who need to borrow securities in order to complete certain transactions.
Although major changes tend to be infrequent, the Board of Trustees could
change the portfolio's investment objective without seeking shareholder
approval. However, the Board will provide shareholders with at least 60 days'
notice prior to making any changes to the portfolio's 80% investment policy.
CREDIT QUALITY POLICIES
This portfolio normally invests substantially all of its assets in securities
issued or guaranteed by the US government, its agencies or instrumentalities.
These securities are generally considered to be among the very highest quality
securities.
OTHER INVESTMENTS
The portfolio is permitted, but not required, to use various types of
derivatives (contracts whose value is based on, for example, indices,
currencies or securities). Derivatives may be used for hedging and for risk
management or for non-hedging purposes to seek to enhance potential gain. The
portfolio may use derivatives in circumstances where portfolio management
believes they offer an economical means of gaining exposure to a particular
asset class or to keep cash on hand to meet shareholder redemptions or other
needs while maintaining exposure to the market.
DWS VARIABLE SERIES II - CLASS A SHARES DWS GOVERNMENT & AGENCY
SECURITIES VIP 53
As a temporary defensive measure, the portfolio could shift up to 100% of
assets into investments such as money market securities. This measure could
prevent losses, but, while engaged in a temporary defensive position, the
portfolio will not be pursuing its investment objective. However, the portfolio
managers may choose not to use these strategies for various reasons, even in
very volatile market conditions.
THE MAIN RISKS OF INVESTING IN THE PORTFOLIO
There are several risk factors that could hurt the portfolio's performance,
cause you to lose money or cause the portfolio's performance to trail that of
other investments.
INTEREST RATE RISK. Generally, fixed income securities will decrease in value
when interest rates rise. The longer the effective maturity of the portfolio's
securities, the more sensitive the portfolio will be to interest rate changes.
(As a general rule, a 1% rise in interest rates means a 1% fall in value for
every year of duration.) As interest rates decline, the issuers of securities
held by the portfolio may prepay principal earlier than scheduled, forcing the
portfolio to reinvest in lower-yielding securities. Prepayment may reduce the
portfolio's income. As interest rates increase, slower than expected principal
payments may extend the average life of fixed income securities. This will have
the effect of locking in a below-market interest rate, increasing the
portfolio's duration and reducing the value of such a security. Because the
portfolio may invest in mortgage-related securities, it is more vulnerable to
both of these risks.
AGENCY RISK. Some securities issued by US government agencies or
instrumentalities are supported only by the credit of that agency or
instrumentality while other government securities have an additional line of
credit with the US Treasury. There is no guarantee that the US government will
provide support to such agencies or instrumentalities and such securities may
involve risk of loss of principal and interest. The full faith and credit
guarantee of the US government for certain securities doesn't protect the
portfolio against market-driven declines in the prices or yields of these
securities, nor does it apply to shares of the portfolio itself.
DERIVATIVES RISK. Risks associated with derivatives include the risk that the
derivative is not well correlated with the security, index or currency to which
it relates; the risk that derivatives may result in losses or missed
opportunities; the risk that the portfolio will be unable to sell the
derivative because of an illiquid secondary market; the risk that a
counterparty is unwilling or unable to meet its obligation and the risk that
the derivative transaction could expose the portfolio to the effects of
leverage, which could increase the portfolio's exposure to the market and
magnify potential losses. There is no guarantee that derivatives, to the extent
employed, will have the intended effect, and their use could cause lower
returns or even losses to the portfolio. The use of derivatives by the
portfolio to hedge risk may reduce the opportunity for gain by offsetting the
positive effect of favorable price movements.
SECURITIES LENDING RISK. Any loss in the market price of securities loaned by
the portfolio that occurs during the term of the loan would be borne by the
portfolio and would adversely affect the portfolio's performance. Also, there
may be delays in recovery of securities loaned or even a loss of rights in the
collateral should the borrower of the securities fail financially while the
loan is outstanding. However, loans will be made only to borrowers selected by
the portfolio's delegate after a review of relevant facts and circumstances,
including the creditworthiness of the borrower.
SECURITY SELECTION RISK. A risk that pervades all investing is the risk that
the securities in the portfolio's portfolio may decline in value.
Another factor that could affect performance is:
o portfolio management could be wrong in the analysis of industries, companies,
economic trends, the relative attractiveness of different securities or
other matters.
This portfolio may appeal to investors who want a portfolio that searches for
attractive yields generated by US government securities.
54 DWS GOVERNMENT & AGENCY SECURITIES VIP DWS VARIABLE SERIES II -
CLASS A SHARES
PERFORMANCE - CLASS A
While a portfolio's past performance isn't necessarily a sign of how it will do
in the future, it can be valuable for an investor to know.
The bar chart shows how the returns for the portfolio's Class A shares have
varied from year to year, which may give some idea of risk. The table shows
average annual returns for the portfolio and comparable index information
(which, unlike the portfolio, does not have any fees or expenses). The
performance of both the portfolio and the comparable index information varies
over time. All figures assume reinvestment of dividends and distributions.
This information doesn't reflect charges and fees associated with the separate
account that invests in the portfolio or any variable life insurance policy or
variable annuity contract for which the portfolio is an investment option.
These charges and fees will reduce returns.
ANNUAL TOTAL RETURN (%) as of 12/31 each year - CLASS A
[BARGRAPHIC APPEARS HERE]
7.03 0.68 10.93 7.48 8.05 2.26 3.75 2.57 4.16 5.95
1998 1999 2000 2001 2002 2003 2004 2005 2006 2007
FOR THE PERIODS INCLUDED IN THE BAR CHART:
BEST QUARTER: 4.13%, Q3 2001 WORST QUARTER: -0.98%, Q2 2004
2008 TOTAL RETURN AS OF MARCH 31: 2.23%
AVERAGE ANNUAL TOTAL RETURNS (%) as of 12/31/2007
1 YEAR 5 YEARS 10 YEARS
------ ------- --------
Portfolio - Class A 5.95 3.73 5.25
Lehman Brothers GNMA Index 6.98 4.39 5.85
Total returns would have been lower if operating expenses hadn't been reduced.
LEHMAN BROTHERS GNMA INDEX is an unmanaged market value-weighted measure of all
fixed-rate securities backed by mortgage pools of the Government National
Mortgage Association.
Current performance information may be higher or lower than the performance
data quoted above. For more recent performance information, contact your
participating insurance company.
DWS VARIABLE SERIES II - CLASS A SHARES DWS GOVERNMENT & AGENCY
SECURITIES VIP 55
HOW MUCH INVESTORS PAY
This table describes the fees and expenses that you may pay if you buy and hold
portfolio shares. The information in the table does not reflect charges and
fees associated with the separate account that invests in the portfolio or any
variable life insurance policy or variable annuity contract for which the
portfolio is an investment option. These charges and fees will increase
expenses.
FEE TABLE CLASS A
--------- -------
ANNUAL OPERATING EXPENSES, deducted from portfolio assets
Management Fee1 0.45%
Distribution/Service (12b-1) Fee None
Other Expenses2 0.21
TOTAL ANNUAL OPERATING EXPENSES3 0.66
1 Restated on an annualized basis to reflect approved fee changes taking
effect on May 1, 2008.
2 Restated on an annualized basis to reflect approved fee changes taking
effect on May 1, 2008. Includes a 0.10% administrative services fee paid
to the Advisor.
3 Through September 30, 2008, the Advisor has agreed to waive all or a
portion of its management fee and reimburse or pay certain operating
expenses so that the total annual operating expenses of the portfolio will
not exceed 0.64% for Class A shares, excluding certain expenses such as
extraordinary expenses, taxes, brokerage and interest. Although there can
be no assurance that the current waiver/expense reimbursment arrangement
will be maintained beyond September 30, 2008, the Advisor has committed to
review the continuance of waiver/expense reimbursement arrangements by
September 30, 2008.
Based on the costs above, this example helps you compare the expenses of Class
A shares to those of other mutual funds. This example assumes the expenses
above remain the same. It also assumes that you invested $10,000, earned 5%
annual returns, reinvested all dividends and distributions and sold your shares
at the end of each period. This is only an example; actual expenses will be
different.
EXAMPLE 1 YEAR 3 YEARS 5 YEARS 10 YEARS
------- ------ ------- ------- --------
Class A shares $67 $211 $368 $822
56 DWS GOVERNMENT & AGENCY SECURITIES VIP DWS VARIABLE SERIES II -
CLASS A SHARES
THE PORTFOLIO MANAGERS
The portfolio is managed by a team of investment professionals who collaborate
to develop and implement the portfolio's investment strategy. Each portfolio
manager on the team has authority over all aspects of the portfolio's
investment portfolio, including but not limited to, purchases and sales of
individual securities, portfolio construction techniques, portfolio risk
assessment and the management of daily cash flows in accordance with portfolio
holdings.
The following people handle the day-to-day management of the portfolio:
William Chepolis, CFA
Managing Director of Deutsche Asset Management and Co-Manager of the portfolio.
o Joined Deutsche Asset Management in 1998 after 13 years of experience as
vice president and portfolio manager for Norwest Bank, where he managed
the bank's fixed income and foreign exchange portfolios.
o Portfolio Manager for Retail Mortgage Backed Securities: New York.
o Joined the portfolio in 2002.
o BIS, University of Minnesota.
Matthew F. MacDonald
Director of Deutsche Asset Management and Co-Manager of the portfolio.
o Joined Deutsche Asset Management and the portfolio in 2006 after 14 years
of fixed income experience at Bank of America Global Structured Products
and PPM America, Inc., where he was portfolio manager for public fixed
income, including MBS, ABS, CDOs and corporate bonds; earlier, as an
analyst for MBS, ABS and money markets; and originally, at Duff & Phelps
Credit Rating Company.
o Portfolio Manager for Retail Mortgage Backed Securities: New York.
o BA, Harvard University; MBA, University of Chicago Graduate School of
Business.
The portfolio's Statement of Additional Information provides additional
information about a portfolio manager's investments in the portfolio, a
description of the portfolio management compensation structure, and information
regarding other accounts managed.
DWS VARIABLE SERIES II - CLASS A SHARES DWS GOVERNMENT & AGENCY
SECURITIES VIP 57
FINANCIAL HIGHLIGHTS
This table is designed to help you understand the portfolio's financial
performance. The figures in the first part of the table are for a single share.
The total return figures represent the percentage that an investor in the
portfolio would have earned (or lost), assuming all dividends and distributions
were reinvested. This information has been audited by Ernst & Young LLP, an
independent registered public accounting firm, whose report, along with the
portfolio's financial statements, is included in the portfolio's annual report
(see "Shareholder reports" on the back cover). The following table includes
selected data for a share outstanding throughout each period and other
performance information derived from the financial statements.
This information doesn't reflect charges and fees associated with the separate
account that invests in the portfolio or any variable life insurance policy or
variable annuity contract for which the portfolio is an investment option.
These charges and fees will reduce returns.
DWS GOVERNMENT & AGENCY SECURITIES VIP - CLASS A
YEARS ENDED DECEMBER 31, 2007 2006 2005 2004 2003
----------------------------------------------- -------- ------- -------- -------- --------
SELECTED PER SHARE DATA
-----------------------------------------------------------------------------------------------------------
NET ASSET VALUE, BEGINNING OF PERIOD $ 12.28 $ 12.26 $ 12.55 $ 12.54 $ 12.84
----------------------------------------------- -------- ------- -------- -------- --------
Income (loss) from investment operations:
Net investment income a .58 .55 .51 .44 .31
----------------------------------------------- -------- ------- -------- -------- --------
Net realized and unrealized gain (loss) .12 ( .06) ( .20) .03 ( .04)
----------------------------------------------- -------- ------- -------- -------- --------
TOTAL FROM INVESTMENT OPERATIONS .70 .49 .31 .47 .27
----------------------------------------------- -------- ------- -------- -------- --------
Less distributions from:
Net investment income ( .60) ( .47) ( .50) ( .35) ( .35)
----------------------------------------------- -------- ------- -------- -------- --------
Net realized gains - - ( .10) ( .11) ( .22)
----------------------------------------------- -------- ------- -------- -------- --------
TOTAL DISTRIBUTIONS ( .60) ( .47) ( .60) ( .46) ( .57)
----------------------------------------------- -------- ------- -------- -------- --------
NET ASSET VALUE, END OF PERIOD $ 12.38 $ 12.28 $ 12.26 $ 12.55 $ 12.54
----------------------------------------------- -------- ------- -------- -------- --------
Total Return (%) 5.95b 4.16 2.57 3.75 2.26
----------------------------------------------- -------- ------- -------- -------- --------
RATIOS TO AVERAGE NET ASSETS AND SUPPLEMENTAL DATA
-----------------------------------------------------------------------------------------------------------
Net assets, end of period ($ millions) 199 211 243 280 347
----------------------------------------------- -------- ------- -------- -------- --------
Ratio of expenses before expense reductions (%) .66 .67 .63 .61 .61
----------------------------------------------- -------- ------- -------- -------- --------
Ratio of expenses after expense reductions (%) .63 .67 .63 .61 .61
----------------------------------------------- -------- ------- -------- -------- --------
Ratio of net investment income (loss) (%) 4.77 4.56 4.17 3.59 2.50
----------------------------------------------- -------- ------- -------- -------- --------
Portfolio turnover rate (%)c 465 241 191 226 511
----------------------------------------------- -------- ------- -------- -------- --------
a Based on average shares outstanding during the period.
b Total return would have been lower had certain expenses not been reduced.
c The portfolio turnover rate including mortgage dollar roll transactions was
629%, 403%, 325%, 391% and 536% for the periods ended December 31, 2007,
December 31, 2006, December 31, 2005, December 31, 2004 and December 31,
2003, respectively.
58 DWS GOVERNMENT & AGENCY SECURITIES VIP DWS VARIABLE SERIES II -
CLASS A SHARES
HYPOTHETICAL EXPENSE SUMMARY
Using the annual portfolio operating expense ratios presented in the fee tables
in the portfolio prospectus, the Hypothetical Expense Summary shows the
estimated fees and expenses, in actual dollars, that would be charged on a
hypothetical investment of $10,000 in the portfolio held for the next 10 years
and the impact of such fees and expenses on portfolio returns for each year and
cumulatively, assuming a 5% return for each year. The tables also assume that
all dividends and distributions are reinvested. The annual portfolio expense
ratios shown are net of any contractual fee waivers or expense reimbursements,
if any, for the period of the contractual commitment. Also, please note that if
you are investing through a third party provider, that provider may have fees
and expenses separate from those of the portfolio that are not reflected here.
Mutual fund fees and expenses fluctuate over time and actual expenses may be
higher or lower than those shown.
The Hypothetical Expense Summary should not be used or construed as an offer to
sell, a solicitation of an offer to buy or a recommendation or endorsement of
any specific mutual fund. You should carefully review the portfolio's
prospectus to consider the investment objectives, risks, expenses and charges
of the portfolio prior to investing.
DWS GOVERNMENT & AGENCY SECURITIES VIP - CLASS A
INITIAL HYPOTHETICAL ASSUMED RATE
MAXIMUM INVESTMENT: OF RETURN:
SALES CHARGE: $10,000 5%
0.00% ---------------------------------- ---------------------------------
CUMULATIVE CUMULATIVE HYPOTHETICAL
RETURN BEFORE RETURN AFTER YEAR-END BALANCE ANNUAL
FEES AND ANNUAL FUND FEES AND AFTER FEES AND FEES AND
YEAR EXPENSES EXPENSE RATIOS EXPENSES EXPENSES EXPENSES
----- ------------- -------------- ------------ ---------------- ---------
1 5.00% 0.66% 4.34% $ 10,434.00 $ 67.43
2 10.25% 0.66% 8.87% $ 10,886.84 $ 70.36
3 15.76% 0.66% 13.59% $ 11,359.32 $ 73.41
4 21.55% 0.66% 18.52% $ 11,852.32 $ 76.60
5 27.63% 0.66% 23.67% $ 12,366.71 $ 79.92
6 34.01% 0.66% 29.03% $ 12,903.42 $ 83.39
7 40.71% 0.66% 34.63% $ 13,463.43 $ 87.01
8 47.75% 0.66% 40.48% $ 14,047.75 $ 90.79
9 55.13% 0.66% 46.57% $ 14,657.42 $ 94.73
10 62.89% 0.66% 52.94% $ 15,293.55 $ 98.84
TOTAL $ 822.48
DWS VARIABLE SERIES II - CLASS A SHARES DWS GOVERNMENT & AGENCY
SECURITIES VIP 59
DWS HIGH INCOME VIP
THE PORTFOLIO'S MAIN INVESTMENT STRATEGY
The portfolio seeks to provide a high level of current income.
Under normal circumstances, this portfolio generally invests at least 65% of
net assets, plus the amount of any borrowings for investment purposes, in junk
bonds, which are those rated below the fourth highest credit rating category
(i.e., grade BB/Ba and below). Compared to investment-grade bonds, junk bonds
may pay higher yields, have higher volatility and higher risk of default on
payments of interest or principal. The portfolio may invest up to 50% of total
assets in bonds denominated in US dollars or foreign currencies from foreign
issuers.
The portfolio manager focuses on cash flow and total return analysis, and broad
diversification among countries, sectors, industries and individual issuers and
maturities. The manager uses an active process which emphasizes relative value
in a global environment, managing on a total return basis, and using intensive
research to identify stable to improving credit situations that may provide
yield compensation for the risk of investing in below investment grade fixed
income securities (junk bonds).
The investment process involves using primarily a "bottom-up" approach by using
relative value and fundamental analysis to select the best securities within
each industry, and a top-down approach to assess the overall risk and return in
the market and which considers macro trends in the economy. To select
securities or investments, the portfolio manager:
o analyzes economic conditions for improving or undervalued sectors and
industries;
o uses independent credit research and on-site management visits to evaluate
individual issuers' debt service, growth rate, and both downgrade and
upgrade potential;
o assesses new offerings versus secondary market opportunities; and
o seeks issuers within attractive industry sectors and with strong long-term
fundamentals and improving credits.
PORTFOLIO MATURITY. The portfolio manager intends to maintain a dollar-weighted
effective average portfolio maturity of seven to ten years. The portfolio's
average portfolio maturity may vary and may be shortened by certain of the
portfolio's securities which have floating or variable interest rates or
include put features that provide the portfolio the right to sell the security
at face value prior to maturity. Subject to its portfolio maturity policy, the
portfolio may purchase individual securities with any stated maturity.
The dollar-weighted effective average portfolio maturity may be shorter than
the stated maturity due to several factors, including but not limited to,
prepayment patterns, call dates and put features.
In implementing this strategy, the portfolio may experience a high portfolio
turnover rate.
SECURITIES LENDING. The portfolio may lend its investment securities in an
amount up to 33 1/3% of its total assets to approved institutional borrowers
who need to borrow securities in order to complete certain transactions.
Although major changes tend to be infrequent, the Board of Trustees could
change the portfolio's investment objective without seeking shareholder
approval.
OTHER INVESTMENTS
The portfolio is permitted, but not required, to use various types of
derivatives (contracts whose value is based on, for example, indices,
currencies or securities). Derivatives may be used for hedging and for risk
management or for non-hedging purposes to seek to enhance potential gains. The
portfolio may use derivatives in circumstances where portfolio management
believes they offer an economical means of gaining exposure to a particular
asset class or to keep cash on hand to meet shareholder redemptions or other
needs while maintaining exposure to the market. In particular, the portfolio
may use futures, currency options, forward currency transactions and credit
default swaps.
60 DWS HIGH INCOME VIP DWS VARIABLE SERIES II -
CLASS A SHARES
As a temporary defensive measure, the portfolio could shift up to 100% of
assets into investments such as money market securities. This measure could
prevent losses, but, while engaged in a temporary defensive position, the
portfolio will not be pursuing its investment objective. However, the portfolio
manager may choose not to use these strategies for various reasons, even in
very volatile market conditions.
THE MAIN RISKS OF INVESTING IN THE PORTFOLIO
There are several risk factors that could hurt the portfolio's performance,
cause you to lose money or cause the portfolio's performance to trail that of
other investments.
CREDIT RISK. A portfolio purchasing bonds faces the risk that the
creditworthiness of an issuer may decline, causing the value of the bonds to
decline. In addition, an issuer may not be able to make timely payments on the
interest and/or principal on the bonds it has issued. Because the issuers of
high-yield bonds or junk bonds (bonds rated below the fourth highest category)
may be in uncertain financial health, the prices of these bonds may be more
vulnerable to bad economic news or even the expectation of bad news, than
investment-grade bonds. In some cases, bonds, particularly high-yield bonds,
may decline in credit quality or go into default. Because the portfolio may
invest in securities not paying current interest or in securities already in
default, these risks may be more pronounced.
INTEREST RATE RISK. Generally, fixed income securities will decrease in value
when interest rates rise. The longer the effective maturity of the portfolio's
securities, the more sensitive the portfolio will be to interest rate changes.
(As a general rule, a 1% rise in interest rates means a 1% fall in value for
every year of duration.) As interest rates decline, the issuers of securities
held by the portfolio may prepay principal earlier than scheduled, forcing the
portfolio to reinvest in lower-yielding securities. Prepayment may reduce the
portfolio's income. As interest rates increase, slower than expected principal
payments may extend the average life of fixed income securities. This will have
the effect of locking in a below-market interest rate, increasing the
portfolio's duration and reducing the value of such a security. Because the
portfolio may invest in mortgage-related securities, it is more vulnerable to
both of these risks.
MARKET RISK. Deteriorating market conditions might cause a general weakness in
the market that reduces the prices of securities in that market. Developments
in a particular class of bonds or the stock market could also adversely affect
the portfolio by reducing the relative attractiveness of bonds as an
investment. Also, to the extent that the portfolio emphasizes bonds from any
given industry, it could be hurt if that industry does not do well.
FOREIGN INVESTMENT RISK. Foreign investments involve certain special risks,
including:
o POLITICAL RISK. Some foreign governments have limited the outflow of profits
to investors abroad, imposed restrictions on the exchange or export of
foreign currency, extended diplomatic disputes to include trade and
financial relations, seized foreign investment and imposed higher taxes.
o INFORMATION RISK. Companies based in foreign markets are usually not subject
to accounting, auditing and financial reporting standards and practices as
stringent as those in the US. Therefore, their financial reports may present
an incomplete, untimely or misleading picture of a company, as compared to
the financial reports required in the US.
o LIQUIDITY RISK. Investments that trade less can be more difficult or more
costly to buy, or to sell, than more liquid or active investments. This
liquidity risk is a factor of the trading volume of a particular investment,
as well as the size and liquidity of the entire local market. On the whole,
foreign exchanges are smaller and less liquid than US exchanges. This can
make buying and selling certain investments more difficult and costly.
Relatively small transactions in some instances can have a
disproportionately large effect on the price and supply of securities. In
certain situations, it may become virtually impossible to sell an investment
in an orderly fashion at a price that approaches portfolio management's
estimate of its value. For the same reason, it may at times be difficult to
value the portfolio's foreign investments.
o REGULATORY RISK. There is generally less government regulation of foreign
markets, companies and securities dealers than in the US.
o CURRENCY RISK. The portfolio invests in securities denominated in foreign
currencies. Changes in exchange rates between foreign currencies and the US
dollar may affect the US dollar value of foreign securities or the income or
gain received on these securities.
DWS VARIABLE SERIES II - CLASS A SHARES DWS HIGH INCOME
VIP 61
o LIMITED LEGAL RECOURSE RISK. Legal remedies for investors may be more limited
than the legal remedies available in the US.
o TRADING PRACTICE RISK. Brokerage commissions and other fees are generally
higher for foreign investments than for US investments. The procedures and
rules governing foreign transactions and custody may also involve delays in
payment, delivery or recovery of money or investments.
o TAXES. Foreign withholding and certain other taxes may reduce the amount of
income available to distribute to shareholders of the portfolio. In
addition, special US tax considerations may apply to the portfolio's foreign
investments.
EMERGING MARKET RISK. All of the risks of investing in foreign securities are
increased in connection with investments in emerging markets securities. In
addition, profound social changes and business practices that depart from norms
in developed countries' economies have hindered the orderly growth of emerging
economies and their markets in the past and have caused instability. High
levels of debt tend to make emerging economies heavily reliant on foreign
capital and vulnerable to capital flight. Countries in emerging markets are
also more likely to experience high levels of inflation, deflation or currency
devaluation, which could also hurt their economies and securities markets. For
these and other reasons, investments in emerging markets are often considered
speculative.
DERIVATIVES RISK. Risks associated with derivatives include the risk that the
derivative is not well correlated with the security, index or currency to which
it relates; the risk that derivatives may result in losses or missed
opportunities; the risk that the portfolio will be unable to sell the
derivative because of an illiquid secondary market; the risk that a
counterparty is unwilling or unable to meet its obligation and the risk that
the derivative transaction could expose the portfolio to the effects of
leverage, which could increase the portfolio's exposure to the market and
magnify potential losses. There is no guarantee that derivatives, to the extent
employed, will have the intended effect, and their use could cause lower
returns or even losses to the portfolio. The use of derivatives by the
portfolio to hedge risk may reduce the opportunity for gain by offsetting the
positive effect of favorable price movements.
PRICING RISK. At times, market conditions may make it difficult to value some
investments, and the portfolio may use certain valuation methodologies for some
of its investments, such as fair value pricing. Given the subjective nature of
such valuation methodologies, it is possible that the value determined for an
investment may be different than the value realized upon such investment's
sale. If the portfolio has valued its securities too highly, you may pay too
much for portfolio shares when you buy into the portfolio. If the portfolio has
underestimated the price of its securities, you may not receive the full market
value when you sell your portfolio shares.
SECURITIES LENDING RISK. Any loss in the market price of securities loaned by
the portfolio that occurs during the term of the loan would be borne by the
portfolio and would adversely affect the portfolio's performance. Also, there
may be delays in recovery of securities loaned or even a loss of rights in the
collateral should the borrower of the securities fail financially while the
loan is outstanding. However, loans will be made only to borrowers selected by
the portfolio's delegate after a review of relevant facts and circumstances,
including the creditworthiness of the borrower.
SECURITY SELECTION RISK. A risk that pervades all investing is the risk that
the securities in the portfolio's portfolio may decline in value.
Another factor that could affect performance is:
o portfolio management could be wrong in the analysis of industries, companies,
economic trends, the relative attractiveness of different securities or
other matters.
Investors who seek high current income and can accept risk of loss of principal
may be interested in this portfolio.
62 DWS HIGH INCOME VIP DWS VARIABLE SERIES II -
CLASS A SHARES
PERFORMANCE - CLASS A
While a portfolio's past performance isn't necessarily a sign of how it will do
in the future, it can be valuable for an investor to know.
The bar chart shows how the returns for the portfolio's Class A shares have
varied from year to year, which may give some idea of risk. The table shows
average annual returns for the portfolio and comparable index information
(which, unlike the portfolio, does not have any fees or expenses). The
performance of both the portfolio and the comparable index information varies
over time. All figures assume reinvestment of dividends and distributions.
This information doesn't reflect charges and fees associated with the separate
account that invests in the portfolio or any variable life insurance policy or
variable annuity contract for which the portfolio is an investment option.
These charges and fees will reduce returns.
ANNUAL TOTAL RETURN (%) as of 12/31 each year - CLASS A
[BARGRAPHIC APPEARS HERE]
1.45 2.15 -8.68 2.63 -0.30 24.62 12.42 3.89 10.47 0.96
1998 1999 2000 2001 2002 2003 2004 2005 2006 2007
FOR THE PERIODS INCLUDED IN THE BAR CHART:
BEST QUARTER: 8.59%, Q2 2003 WORST QUARTER: -6.66%, Q3 1998
2008 TOTAL RETURN AS OF MARCH 31: -3.49%
AVERAGE ANNUAL TOTAL RETURNS (%) as of 12/31/2007
1 YEAR 5 YEARS 10 YEARS
------ ------- --------
Portfolio - Class A 0.96 10.17 4.63
Credit Suisse High Yield Index 2.65 10.97 6.10
CREDIT SUISSE HIGH YIELD INDEX is an unmanaged trader-priced portfolio,
constructed to mirror the global high-yield debt market.
Current performance information may be higher or lower than the performance
data quoted above. For more recent performance information, contact your
participating insurance company.
DWS VARIABLE SERIES II - CLASS A SHARES DWS HIGH INCOME
VIP 63
HOW MUCH INVESTORS PAY
This table describes the fees and expenses that you may pay if you buy and hold
portfolio shares. The information in the table does not reflect charges and
fees associated with the separate account that invests in the portfolio or any
variable life insurance policy or variable annuity contract for which the
portfolio is an investment option. These charges and fees will increase
expenses.
FEE TABLE CLASS A
--------- -------
ANNUAL OPERATING EXPENSES, deducted from portfolio assets
Management Fee1 0.49%
Distribution/Service (12b-1) Fee None
Other Expenses2 0.20
TOTAL ANNUAL OPERATING EXPENSES 0.69
1 Restated on an annualized basis to reflect approved fee changes taking
effect on May 1, 2008.
2 Restated on an annualized basis to reflect approved fee changes taking
effect on May 1, 2008. Includes a 0.10% administrative services fee paid
to the Advisor.
Based on the costs above, this example helps you compare the expenses of Class
A shares to those of other mutual funds. This example assumes the expenses
above remain the same. It also assumes that you invested $10,000, earned 5%
annual returns, reinvested all dividends and distributions and sold your shares
at the end of each period. This is only an example; actual expenses will be
different.
EXAMPLE 1 YEAR 3 YEARS 5 YEARS 10 YEARS
------- ------ ------- ------- --------
Class A shares $70 $221 $384 $859
THE PORTFOLIO MANAGER
The following person handles the day-to-day management of the portfolio:
Gary Sullivan, CFA
Managing Director of Deutsche Asset Management and Portfolio Manager of the
portfolio.
o Joined Deutsche Asset Management in 1996 and the portfolio in 2006.
Served as the head of the High Yield group in Europe and as an Emerging
Markets portfolio manager.
o Prior to that, four years at Citicorp as a research analyst and
structurer of collateralized mortgage obligations. Prior to Citicorp,
served as an officer in the US Army from 1988 to 1991.
o BS, United States Military Academy (West Point); MBA, New York
University, Stern School of Business
The portfolio's Statement of Additional Information provides additional
information about a portfolio manager's investments in the portfolio, a
description of the portfolio management compensation structure, and information
regarding other accounts managed.
64 DWS HIGH INCOME VIP DWS VARIABLE SERIES II -
CLASS A SHARES
FINANCIAL HIGHLIGHTS
This table is designed to help you understand the portfolio's financial
performance. The figures in the first part of the table are for a single share.
The total return figures represent the percentage that an investor in the
portfolio would have earned (or lost), assuming all dividends and distributions
were reinvested. This information has been audited by Ernst & Young LLP, an
independent registered public accounting firm, whose report, along with the
portfolio's financial statements, is included in the portfolio's annual report
(see "Shareholder reports" on the back cover). The following table includes
selected data for a share outstanding throughout each period and other
performance information derived from the financial statements.
This information doesn't reflect charges and fees associated with the separate
account that invests in the portfolio or any variable life insurance policy or
variable annuity contract for which the portfolio is an investment option.
These charges and fees will reduce returns.
DWS HIGH INCOME VIP - CLASS A
YEARS ENDED DECEMBER 31, 2007 2006 2005 2004 2003
----------------------------------------- ------- ------- ------- ------- -------
SELECTED PER SHARE DATA
-------------------------------------------------------------------------------------------------------------
NET ASSET VALUE, BEGINNING OF PERIOD $ 8.38 $ 8.23 $ 8.78 $ 8.43 $ 7.40
----------------------------------------- ------- ------- ------- ------- -------
Income (loss) from investment operations:
Net investment income a .63 .62 .68 .67 .67
----------------------------------------- ------- ------- ------- ------- -------
Net realized and unrealized gain (loss) ( .54) .19 ( .38) .31 1.03
----------------------------------------- ------- ------- ------- ------- -------
TOTAL FROM INVESTMENT OPERATIONS .09 .81 .30 .98 1.70
----------------------------------------- ------- ------- ------- ------- -------
Less distributions from:
Net investment income ( .66) ( .66) ( .85) ( .63) ( .67)
----------------------------------------- ------- ------- ------- ------- -------
NET ASSET VALUE, END OF PERIOD $ 7.81 $ 8.38 $ 8.23 $ 8.78 $ 8.43
----------------------------------------- ------- ------- ------- ------- -------
Total Return (%) .96 10.47 3.89 12.42 24.62
----------------------------------------- ------- ------- ------- ------- -------
RATIOS TO AVERAGE NET ASSETS AND SUPPLEMENTAL DATA
-------------------------------------------------------------------------------------------------------------
Net assets, end of period ($ millions) 248 322 344 393 413
----------------------------------------- ------- ------- ------- ------- -------
Ratio of expenses (%) .69 .71 .70 .66 .67
----------------------------------------- ------- ------- ------- ------- -------
Ratio of net investment income (%) 7.84 7.73 8.27 8.11 8.62
----------------------------------------- ------- ------- ------- ------- -------
Portfolio turnover rate (%) 61 93 100 162 165
----------------------------------------- ------- ------- ------- ------- -------
a Based on average shares outstanding during the period.
DWS VARIABLE SERIES II - CLASS A SHARES DWS HIGH INCOME
VIP 65
HYPOTHETICAL EXPENSE SUMMARY
Using the annual portfolio operating expense ratios presented in the fee tables
in the portfolio prospectus, the Hypothetical Expense Summary shows the
estimated fees and expenses, in actual dollars, that would be charged on a
hypothetical investment of $10,000 in the portfolio held for the next 10 years
and the impact of such fees and expenses on portfolio returns for each year and
cumulatively, assuming a 5% return for each year. The tables also assume that
all dividends and distributions are reinvested. The annual portfolio expense
ratios shown are net of any contractual fee waivers or expense reimbursements,
if any, for the period of the contractual commitment. Also, please note that if
you are investing through a third party provider, that provider may have fees
and expenses separate from those of the portfolio that are not reflected here.
Mutual fund fees and expenses fluctuate over time and actual expenses may be
higher or lower than those shown.
The Hypothetical Expense Summary should not be used or construed as an offer to
sell, a solicitation of an offer to buy or a recommendation or endorsement of
any specific mutual fund. You should carefully review the portfolio's
prospectus to consider the investment objectives, risks, expenses and charges
of the portfolio prior to investing.
DWS HIGH INCOME VIP - CLASS A
INITIAL HYPOTHETICAL ASSUMED RATE
MAXIMUM INVESTMENT: OF RETURN:
SALES CHARGE: $10,000 5%
0.00% ---------------------------------- ---------------------------------
CUMULATIVE CUMULATIVE HYPOTHETICAL
RETURN BEFORE RETURN AFTER YEAR-END BALANCE ANNUAL
FEES AND ANNUAL FUND FEES AND AFTER FEES AND FEES AND
YEAR EXPENSES EXPENSE RATIOS EXPENSES EXPENSES EXPENSES
----- ------------- -------------- ------------ ---------------- ---------
1 5.00% 0.69% 4.31% $ 10,431.00 $ 70.49
2 10.25% 0.69% 8.81% $ 10,880.58 $ 73.52
3 15.76% 0.69% 13.50% $ 11,349.53 $ 76.69
4 21.55% 0.69% 18.39% $ 11,838.69 $ 80.00
5 27.63% 0.69% 23.49% $ 12,348.94 $ 83.45
6 34.01% 0.69% 28.81% $ 12,881.18 $ 87.04
7 40.71% 0.69% 34.36% $ 13,436.36 $ 90.80
8 47.75% 0.69% 40.15% $ 14,015.47 $ 94.71
9 55.13% 0.69% 46.20% $ 14,619.53 $ 98.79
10 62.89% 0.69% 52.50% $ 15,249.64 $ 103.05
TOTAL $ 858.54
66 DWS HIGH INCOME VIP DWS VARIABLE SERIES II -
CLASS A SHARES
DWS INTERNATIONAL SELECT EQUITY VIP
THE PORTFOLIO'S MAIN INVESTMENT STRATEGY
The portfolio seeks capital appreciation.
Under normal circumstances, the portfolio invests at least 80% of its net
assets, plus the amount of any borrowings for investment purposes, in equity
securities and other securities with equity characteristics.
Although the portfolio can invest in companies of any size and from any
country, it invests mainly in common stocks of established companies located in
countries with, or tied economically to, developed economies (other than the
United States).
At least 50% of the portfolio's assets will be invested in securities that are
represented in the MSCI EAFE (Reg. TM) Index. The MSCI EAFE (Reg. TM) Index
tracks stocks in Australia, Austria, Belgium, Denmark, Finland, France,
Germany, Hong Kong, Ireland, Italy, Japan, Malaysia, the Netherlands, New
Zealand, Norway, Portugal, Singapore, Spain, Sweden, Switzerland and the United
Kingdom.
The portfolio's equity investments are mainly common stocks, but may also
include preferred stocks and other securities with equity characteristics, such
as convertible securities and warrants.
The portfolio may also invest up to 20% of its assets in cash equivalents, US
investment-grade fixed-income securities and US stocks and other equities.
The portfolio may invest a portion of its assets in companies located in
countries with emerging markets. These countries are generally located in Latin
America, the Middle East, Eastern Europe, Asia and Africa. Typically, the
portfolio will not hold more than 35% of its net assets in securities of
emerging markets issuers.
The portfolio managers seek to identify a focused list of approximately 35 to
50 companies that offer, in the manager's opinion, the greatest upside
potential based typically on a 12-18 month investment horizon. The portfolio
managers use a bottom-up approach, emphasizing individual stock selection, with
any active allocation among countries, regions or industries as a residual of
this strategy.
The portfolio managers' process begins with a broad universe of equity
securities of issuers primarily, but not exclusively, located in the countries
that make up the MSCI EAFE (Reg. TM) Index.
As of February 29, 2008, the MSCI EAFE (Reg. TM) Index had a median market
capitalization of approximately $5.8 billion. Under normal market conditions,
the portfolio invests in securities of issuers with a minimum market
capitalization of $500 million.
The portfolio managers screen for companies seeking to identify those with high
or improving, and sustainable, returns on capital and long-term prospects for
growth. The portfolio managers focus on companies with real cash flow on
investment rather than published earnings. The team utilizes information
gleaned from a variety of sources and perspectives, including broad trends such
as lifestyle, demographic and technological changes, industry cycles and
regulatory changes, quantitative screening and individual company analysis.
Based on this fundamental research, the portfolio managers set a target price
objective (the portfolio managers' opinion of the intrinsic value of the
security) for each security and ranks the securities based on these target
price objectives. The portfolio managers apply a disciplined approach to risk
management and portfolio construction. Stocks are sold when they meet their
target price objectives, a better investment opportunity has been identified or
there has been a negative change in the outlook for the company, country or
industry. In implementing this strategy, the portfolio may experience a high
portfolio turnover rate.
SECURITIES LENDING. The portfolio may lend its investment securities in an
amount up to 33 1/3% of its total assets to approved institutional borrowers
who need to borrow securities in order to complete certain transactions.
Although major changes tend to be infrequent, the Board of Trustees could
change the portfolio's investment objective without seeking shareholder
approval. However, the Board will provide shareholders with at least 60 days'
notice prior to making any changes to the portfolio's 80% investment policy.
DWS VARIABLE SERIES II - CLASS A SHARES DWS INTERNATIONAL SELECT
EQUITY VIP 67
OTHER INVESTMENTS
The portfolio is permitted, but not required, to use various types of
derivatives (contracts whose value is based on, for example, indices,
currencies or securities). Derivatives may be used for hedging and for risk
management or for non-hedging purposes to seek to enhance potential gains. The
portfolio managers may use derivatives in circumstances where the portfolio
management believes they offer an economical means of gaining exposure to a
particular asset class or to keep cash on hand to meet shareholder redemptions
or other needs while maintaining exposure to the market. In particular, the
portfolio may use futures, currency options and forward currency transactions.
As a temporary defensive measure, the portfolio could shift up to 100% of its
assets into investments such as money market securities. This measure could
prevent losses, but, while engaged in a temporary defensive position, the
portfolio will not be pursuing its investment objective. However, the portfolio
managers may choose not to use these strategies for various reasons, even in
very volatile market conditions.
THE MAIN RISKS OF INVESTING IN THE PORTFOLIO
There are several risk factors that could hurt the portfolio's performance,
cause you to lose money or cause the portfolio's performance to trail that of
other investments.
STOCK MARKET RISK. As with most stock funds, an important factor with this
portfolio is how stock markets perform - in this case, foreign markets. When
foreign stock prices fall, you should expect the value of your investment to
fall as well. Because a stock represents ownership in its issuer, stock prices
can be hurt by poor management, shrinking product demand and other business
risks. These may affect single companies as well as groups of companies. In
addition, movements in financial markets may adversely affect a stock's price,
regardless of how well the company performs. The market as a whole may not
favor the types of investments the portfolio makes and the portfolio may not be
able to get attractive prices for them.
SECURITY SELECTION RISK. A risk that pervades all investing is the risk that
the securities in the portfolio's portfolio may decline in value.
FOREIGN INVESTMENT RISK. Foreign investments involve certain special risks,
including:
o POLITICAL RISK. Some foreign governments have limited the outflow of profits
to investors abroad, imposed restrictions on the exchange or export of
foreign currency, extended diplomatic disputes to include trade and
financial relations, seized foreign investment and imposed higher taxes.
o INFORMATION RISK. Companies based in foreign markets are usually not subject
to accounting, auditing and financial reporting standards and practices as
stringent as those in the US. Therefore, their financial reports may present
an incomplete, untimely or misleading picture of a company, as compared to
the financial reports required in the US.
o LIQUIDITY RISK. Investments that trade less can be more difficult or more
costly to buy, or to sell, than more liquid or active investments. This
liquidity risk is a factor of the trading volume of a particular investment,
as well as the size and liquidity of the entire local market. On the whole,
foreign exchanges are smaller and less liquid than US exchanges. This can
make buying and selling certain investments more difficult and costly.
Relatively small transactions in some instances can have a
disproportionately large effect on the price and supply of securities. In
certain situations, it may become virtually impossible to sell an investment
in an orderly fashion at a price that approaches portfolio management's
estimate of its value. For the same reason, it may at times be difficult to
value the portfolio's foreign investments.
o REGULATORY RISK. There is generally less government regulation of foreign
markets, companies and securities dealers than in the US.
o CURRENCY RISK. The portfolio invests in securities denominated in foreign
currencies. Changes in exchange rates between foreign currencies and the US
dollar may affect the US dollar value of foreign securities or the income or
gain received on these securities.
o LIMITED LEGAL RECOURSE RISK. Legal remedies for investors may be more limited
than the legal remedies available in the US.
68 DWS INTERNATIONAL SELECT EQUITY VIP DWS VARIABLE SERIES II -
CLASS A SHARES
o TRADING PRACTICE RISK. Brokerage commissions and other fees are generally
higher for foreign investments than for US investments. The procedures and
rules governing foreign transactions and custody may also involve delays in
payment, delivery or recovery of money or investments.
o TAXES. Foreign withholding and certain other taxes may reduce the amount of
income available to distribute to shareholders of the portfolio. In
addition, special US tax considerations may apply to the portfolio's foreign
investments.
EMERGING MARKET RISK. All of the risks of investing in foreign securities are
increased in connection with investments in emerging markets securities. In
addition, profound social changes and business practices that depart from norms
in developed countries' economies have hindered the orderly growth of emerging
economies and their markets in the past and have caused instability. High
levels of debt tend to make emerging economies heavily reliant on foreign
capital and vulnerable to capital flight. Countries in emerging markets are
also more likely to experience high levels of inflation, deflation or currency
devaluation, which could also hurt their economies and securities markets. For
these and other reasons, investments in emerging markets are often considered
speculative.
DERIVATIVES RISK. Risks associated with derivatives include the risk that the
derivative is not well correlated with the security, index or currency to which
it relates; the risk that derivatives may result in losses or missed
opportunities; the risk that the portfolio will be unable to sell the
derivative because of an illiquid secondary market; the risk that a
counterparty is unwilling or unable to meet its obligation and the risk that
the derivative transaction could expose the portfolio to the effects of
leverage, which could increase the portfolio's exposure to the market and
magnify potential losses. There is no guarantee that derivatives, to the extent
employed, will have the intended effect, and their use could cause lower
returns or even losses to the portfolio. The use of derivatives by the
portfolio to hedge risk may reduce the opportunity for gain by offsetting the
positive effect of favorable price movements.
PRICING RISK. At times, market conditions may make it difficult to value some
investments, and the portfolio may use certain valuation methodologies for some
of its investments, such as fair value pricing. Given the subjective nature of
such valuation methodologies, it is possible that the value determined for an
investment may be different than the value realized upon such investment's
sale. If the portfolio has valued its securities too highly, you may pay too
much for portfolio shares when you buy into the portfolio. If the portfolio has
underestimated the price of its securities, you may not receive the full market
value when you sell your portfolio shares.
SECURITIES LENDING RISK. Any loss in the market price of securities loaned by
the portfolio that occurs during the term of the loan would be borne by the
portfolio and would adversely affect the portfolio's performance. Also, there
may be delays in recovery of securities loaned or even a loss of rights in the
collateral should the borrower of the securities fail financially while the
loan is outstanding. However, loans will be made only to borrowers selected by
the portfolio's delegate after a review of relevant facts and circumstances,
including the creditworthiness of the borrower.
Another factor that could affect performance is:
o portfolio management could be wrong in the analysis of industries, companies,
economic trends, the relative attractiveness of different securities or
other matters.
This portfolio may appeal to investors who are seeking high capital
appreciation and are willing to accept the risks of investing in the stocks of
foreign companies.
DWS VARIABLE SERIES II - CLASS A SHARES DWS INTERNATIONAL SELECT
EQUITY VIP 69
PERFORMANCE - CLASS A
While a portfolio's past performance isn't necessarily a sign of how it will do
in the future, it can be valuable for an investor to know.
The bar chart shows how the returns for the portfolio's Class A shares have
varied from year to year, which may give some idea of risk. The table shows
average annual returns for the portfolio and comparable index information
(which, unlike the portfolio, does not have any fees or expenses). The
performance of both the portfolio and the comparable index information varies
over time. All figures assume reinvestment of dividends and distributions.
This information doesn't reflect charges and fees associated with the separate
account that invests in the portfolio or any variable life insurance policy or
variable annuity contract for which the portfolio is an investment option.
These charges and fees will reduce returns.
Prior to May 1, 2002, the portfolio was named Scudder International Research
Portfolio and operated with a different goal and investment strategy.
Performance would have been different if the portfolio's current policies had
been in effect.
ANNUAL TOTAL RETURN (%) as of 12/31 each year - CLASS A
[BARGRAPHIC APPEARS HERE]
10.02 45.71 -20.49 -24.43 -13.48 29.83 18.25 14.51 25.56 16.71
1998 1999 2000 2001 2002 2003 2004 2005 2006 2007
FOR THE PERIODS INCLUDED IN THE BAR CHART:
BEST QUARTER: 31.03%, Q4 1999 WORST QUARTER: -17.32%, Q3 1998
2008 TOTAL RETURN AS OF MARCH 31: -8.90%
AVERAGE ANNUAL TOTAL RETURNS (%) as of 12/31/2007
1 YEAR 5 YEARS 10 YEARS
------ ------- --------
Portfolio - Class A 16.71 20.84 7.94
MSCI EAFE + EMF Index 16.31 24.17 9.86
MSCI EAFE Index 11.17 21.59 8.66
MORGAN STANLEY CAPITAL INTERNATIONAL (MSCI) EUROPE, AUSTRALASIA, FAR EAST
(EAFE) AND EMERGING MARKETS FREE INDEX is an unmanaged index generally accepted
as a benchmark for performance of major overseas markets, plus emerging
markets.
MORGAN STANLEY CAPITAL INTERNATIONAL EUROPE, AUSTRALASIA AND THE FAR EAST (MSCI
EAFE (Reg. TM)) INDEX is an unmanaged index that tracks international stock
performance in the 21 developed markets of Europe, Australasia and the Far
East.
Current performance information may be higher or lower than the performance
data quoted above. For more recent performance information, contact your
participating insurance company.
70 DWS INTERNATIONAL SELECT EQUITY VIP DWS VARIABLE SERIES II -
CLASS A SHARES
HOW MUCH INVESTORS PAY
This table describes the fees and expenses that you may pay if you buy and hold
portfolio shares. The information in the table does not reflect charges and
fees associated with the separate account that invests in the portfolio or any
variable life insurance policy or variable annuity contract for which the
portfolio is an investment option. These charges and fees will increase
expenses.
FEE TABLE CLASS A
--------- -------
ANNUAL OPERATING EXPENSES, deducted from portfolio assets
Management Fee1 0.65%
Distribution/Service (12b-1) Fee None
Other Expenses2 0.28
TOTAL ANNUAL OPERATING EXPENSES 0.93
1 Restated on an annualized basis to reflect approved fee changes taking
effect on May 1, 2008.
2 Restated on an annualized basis to reflect approved fee changes taking
effect on May 1, 2008. Includes a 0.10% administrative services fee paid
to the Advisor.
Based on the costs above, this example helps you compare the expenses of Class
A shares to those of other mutual portfolios. This example assumes the expenses
above remain the same. It also assumes that you invested $10,000, earned 5%
annual returns, reinvested all dividends and distributions and sold your shares
at the end of each period. This is only an example; actual expenses will be
different.
EXAMPLE 1 YEAR 3 YEARS 5 YEARS 10 YEARS
------- ------ ------- ------- --------
Class A shares $95 $296 $515 $1,143
THE PORTFOLIO MANAGER
The following people handle the day-to-day management of the portfolio:
Matthias Knerr, CFA
Director, Deutsche Asset Management and Portfolio Manager of the portfolio.
o Joined Deutsche Asset Management in 1995 and the portfolio in 2004.
o Portfolio manager for EAFE Equities and Global Equities.
o BS, Pennsylvania State University.
Chris LaJaunie, CFA
Director, Deutsche Asset Management and Portfolio Manager of the portfolio.
o Joined Deutsche Asset Management in 2006 as an analyst for International
Equity and International Select Equity strategies: New York.
o Prior to that, nine years of experience as portfolio manager for Morgan
Stanley Capital Management, JP Morgan Securities and Scudder Kemper
Investments.
o Joined the portfolio in 2008.
o BA, MA from Louisiana State University.
The portfolio's Statement of Additional Information provides additional
information about a portfolio manager's investments in the portfolio, a
description of the portfolio management compensation structure, and information
regarding other accounts managed.
DWS VARIABLE SERIES II - CLASS A SHARES DWS INTERNATIONAL SELECT
EQUITY VIP 71
FINANCIAL HIGHLIGHTS
This table is designed to help you understand the portfolio's financial
performance. The figures in the first part of the table are for a single share.
The total return figures represent the percentage that an investor in the
portfolio would have earned (or lost), assuming all dividends and distributions
were reinvested. This information has been audited by Ernst & Young LLP, an
independent registered public accounting firm, whose report, along with the
portfolio's financial statements, is included in the portfolio's annual report
(see "Shareholder reports" on the back cover). The following table includes
selected data for a share outstanding throughout each period and other
performance information derived from the financial statements.
This information doesn't reflect charges and fees associated with the separate
account that invests in the portfolio or any variable life insurance policy or
variable annuity contract for which the portfolio is an investment option.
These charges and fees will reduce returns.
DWS INTERNATIONAL SELECT EQUITY VIP - CLASS A
YEARS ENDED DECEMBER 31, 2007 2006 2005 2004 2003
----------------------------------------- -------- -------- -------- -------- -------
SELECTED PER SHARE DATA
------------------------------------------------------------------------------------------------------
NET ASSET VALUE, BEGINNING OF PERIOD $ 16.31 $ 13.25 $ 11.91 $ 10.18 $ 7.96
----------------------------------------- -------- -------- -------- -------- -------
Income (loss) from investment operations:
Net investment income a .25 .24b .20 .17 .10
----------------------------------------- -------- -------- -------- -------- -------
Net realized and unrealized gain (loss) 2.24 3.11 1.48 1.67 2.23
----------------------------------------- -------- -------- -------- -------- -------
TOTAL FROM INVESTMENT OPERATIONS 2.49 3.35 1.68 1.84 2.33
----------------------------------------- -------- -------- -------- -------- -------
Less distributions from:
Net investment income ( .46) ( .29) ( .34) ( .11) ( .11)
----------------------------------------- -------- -------- -------- -------- -------
Net realized gains ( 1.58) - - - -
----------------------------------------- -------- -------- -------- -------- -------
TOTAL DISTRIBUTIONS ( 2.04) ( .29) ( .34) ( .11) ( .11)
----------------------------------------- -------- -------- -------- -------- -------
NET ASSET VALUE, END OF PERIOD $ 16.76 $ 16.31 $ 13.25 $ 11.91 $ 10.18
----------------------------------------- -------- -------- -------- -------- -------
Total Return (%) 16.71 25.56 14.51 18.25 29.83
----------------------------------------- -------- -------- -------- -------- -------
RATIOS TO AVERAGE NET ASSETS AND SUPPLEMENTAL DATA
------------------------------------------------------------------------------------------------------
Net assets, end of period ($ millions) 236 223 196 184 147
----------------------------------------- -------- -------- -------- -------- -------
Ratio of expenses (%) .93 .88 .87 .89 .94
----------------------------------------- -------- -------- -------- -------- -------
Ratio of net investment income (%) 1.53 1.65b 1.59 1.58 1.17
----------------------------------------- -------- -------- -------- -------- -------
Portfolio turnover rate (%) 117 122 93 88 139
----------------------------------------- -------- -------- -------- -------- -------
a Based on average shares outstanding during the period.
b Net investment income per share and the ratio of net investment income
without non-recurring dividend income amounting to $0.20 per share and
1.39% of average daily net assets, respectively.
72 DWS INTERNATIONAL SELECT EQUITY VIP DWS VARIABLE SERIES II -
CLASS A SHARES
HYPOTHETICAL EXPENSE SUMMARY
Using the annual portfolio operating expense ratios presented in the fee tables
in the portfolio prospectus, the Hypothetical Expense Summary shows the
estimated fees and expenses, in actual dollars, that would be charged on a
hypothetical investment of $10,000 in the portfolio held for the next 10 years
and the impact of such fees and expenses on portfolio returns for each year and
cumulatively, assuming a 5% return for each year. The tables also assume that
all dividends and distributions are reinvested. The annual portfolio expense
ratios shown are net of any contractual fee waivers or expense reimbursements,
if any, for the period of the contractual commitment. Also, please note that if
you are investing through a third party provider, that provider may have fees
and expenses separate from those of the portfolio that are not reflected here.
Mutual fund fees and expenses fluctuate over time and actual expenses may be
higher or lower than those shown.
The Hypothetical Expense Summary should not be used or construed as an offer to
sell, a solicitation of an offer to buy or a recommendation or endorsement of
any specific mutual fund. You should carefully review the portfolio's
prospectus to consider the investment objectives, risks, expenses and charges
of the portfolio prior to investing.
DWS INTERNATIONAL SELECT EQUITY VIP - CLASS A
INITIAL HYPOTHETICAL ASSUMED RATE
MAXIMUM INVESTMENT: OF RETURN:
SALES CHARGE: $10,000 5%
0.00% ---------------------------------- ----------------------------------
CUMULATIVE CUMULATIVE HYPOTHETICAL
RETURN BEFORE RETURN AFTER YEAR-END BALANCE ANNUAL
FEES AND ANNUAL FUND FEES AND AFTER FEES AND FEES AND
YEAR EXPENSES EXPENSE RATIOS EXPENSES EXPENSES EXPENSES
----- ------------- -------------- ------------ ---------------- ----------
1 5.00% 0.93% 4.07% $ 10,407.00 $ 94.89
2 10.25% 0.93% 8.31% $ 10,830.56 $ 98.75
3 15.76% 0.93% 12.71% $ 11,271.37 $ 102.77
4 21.55% 0.93% 17.30% $ 11,730.11 $ 106.96
5 27.63% 0.93% 22.08% $ 12,207.53 $ 111.31
6 34.01% 0.93% 27.04% $ 12,704.38 $ 115.84
7 40.71% 0.93% 32.21% $ 13,221.44 $ 120.56
8 47.75% 0.93% 37.60% $ 13,759.56 $ 125.46
9 55.13% 0.93% 43.20% $ 14,319.57 $ 130.57
10 62.89% 0.93% 49.02% $ 14,902.38 $ 135.88
TOTAL $ 1,142.99
DWS VARIABLE SERIES II - CLASS A SHARES DWS INTERNATIONAL SELECT
EQUITY VIP 73
DWS JANUS GROWTH & INCOME VIP
THE PORTFOLIO'S MAIN INVESTMENT STRATEGY
The portfolio seeks long-term capital growth and current income.
The portfolio applies a "bottom-up" approach in choosing investments. In other
words, it looks mostly for equity and income-producing securities that meet its
investment criteria one at a time. If the portfolio is unable to find such
investments, much of the portfolio's assets may be in cash or similar
investments.
The portfolio normally emphasizes investments in equity securities, which may
include initial public offerings. It may invest up to 75% of its total assets
in equity securities selected primarily for their growth potential and at least
25% of its total assets in securities the portfolio manager believes have
income potential.
The portfolio may invest substantially all of its assets in equity securities
if the portfolio manager believes that equity securities have the potential to
appreciate in value. The portfolio manager generally seeks to identify equity
securities of companies with earnings growth potential that may not be
recognized by the market at large. The portfolio manager makes this assessment
by looking at companies one at a time, regardless of size, country of
organization, place of principal business activity, or other similar selection
criteria.
The portfolio may invest without limit in foreign securities either indirectly
(e.g., depositary receipts) or directly in foreign markets. Foreign securities
are generally selected on a stock-by-stock basis without regard to any defined
allocation among countries or geographic regions. However, certain factors such
as expected levels of inflation, government policies influencing business
conditions, currency exchange rates, and prospects for economic growth among
countries or geographic regions may warrant greater consideration in selecting
foreign securities.
The portfolio shifts assets between the growth and income components of its
holdings based on the portfolio manager's analysis of relevant market,
financial and economic conditions. If the portfolio manager believes that
growth securities may provide better returns than the yields then available or
expected on income-producing securities, the portfolio will place a greater
emphasis on the growth component of its holdings.
The growth component of the portfolio is expected to consist primarily of
common stocks, but may also include warrants, preferred stocks or convertible
securities selected primarily for their growth potential.
The income component of the portfolio will consist of securities that the
portfolio manager believes have income potential. Such securities may include
equity securities, convertible securities and all types of debt securities,
including indexed/structured securities such as equity-linked structured notes.
Equity securities may be included in the income component of the portfolio if
they currently pay dividends or if the portfolio manager believes they have the
potential for either increasing their dividends or commencing dividends, if
none are currently paid.
SECURITIES LENDING. The portfolio may lend its investment securities in an
amount up to 33 1/3% of its total assets to approved institutional borrowers
who need to borrow securities in order to complete certain transactions.
Although major changes tend to be infrequent, the Board of Trustees could
change the portfolio's investment objective without seeking shareholder
approval.
OTHER INVESTMENTS
The portfolio may invest in debt securities, high-yield/high-risk bonds (less
than 35% of the portfolio's total assets) and securities purchased on a
when-issued, delayed delivery or forward commitment basis. Compared to
investment-grade bonds, high yield bonds may pay higher yields and have higher
volatility and risk of default.
The portfolio is permitted, but not required, to use various types of
derivatives (contracts whose value is based on, for example, indices,
currencies or securities). Derivatives may be used for hedging and for risk
management or for non-hedging purposes to seek to enhance potential gain. The
portfolio may use derivatives in circumstances where portfolio management
believes they offer an economical means of gaining exposure to a particular
asset class or to keep cash on hand to meet shareholder redemptions or other
needs while maintaining exposure to the market.
74 DWS JANUS GROWTH & INCOME VIP DWS VARIABLE SERIES II -
CLASS A SHARES
As a temporary defensive measure, the portfolio could shift up to 100% of
assets into investments such as money market securities. This measure could
prevent losses, but, while engaged in a temporary defensive position, the
portfolio will not be pursuing its investment objective. However, the portfolio
manager may choose not to use these strategies for various reasons, even in
very volatile market conditions.
THE MAIN RISKS OF INVESTING IN THE PORTFOLIO
There are several risk factors that could hurt the portfolio's performance,
cause you to lose money or cause the portfolio's performance to trail that of
other investments.
STOCK MARKET RISK. The portfolio is affected by how the stock market performs.
To the extent the portfolio invests in a particular capitalization or market
sector, the portfolio's performance may be proportionately affected by that
segment's general performance. When stock prices fall, you should expect the
value of your investment to fall as well. Because a stock represents ownership
in its issuer, stock prices can be hurt by poor management, shrinking product
demand and other business risks. These factors may affect single companies as
well as groups of companies. In addition, movements in financial markets may
adversely affect a stock's price, regardless of how well the company performs.
The market as a whole may not favor the types of investments the portfolio
makes, which could affect the portfolio's ability to sell them at an attractive
price.
EQUITY-LINKED STRUCTURED NOTES. Equity-linked structured notes may be more
volatile or less liquid than other types of debt securities, may have no
guaranteed return of capital and may exhibit price behavior that does not
correlate with other debt securities.
INDUSTRY RISK. While the portfolio does not concentrate in any industry, to the
extent that the portfolio has exposure to a given industry or sector, any
factors affecting that industry or sector could affect the value of portfolio
securities. For example, manufacturers of consumer goods could be hurt by a
rise in unemployment or technology companies could be hurt by such factors as
market saturation, price competition and rapid obsolescence.
IPO RISK. Securities purchased in initial public offerings (IPOs) may be very
volatile, due to their stock prices rising and falling rapidly, often based,
among other reasons, on investor perceptions rather than economic reasons.
Additionally, investments in IPOs may magnify the portfolio's performance if it
has a small asset base. The portfolio is less likely to experience a similar
impact on its performance as its assets grow because it is unlikely that the
portfolio will obtain proportionately larger IPO allocations.
DERIVATIVES RISK. Risks associated with derivatives include the risk that the
derivative is not well correlated with the security, index or currency to which
it relates; the risk that derivatives may result in losses or missed
opportunities; the risk that the portfolio will be unable to sell the
derivative because of an illiquid secondary market; the risk that a
counterparty is unwilling or unable to meet its obligation and the risk that
the derivative transaction could expose the portfolio to the effects of
leverage, which could increase the portfolio's exposure to the market and
magnify potential losses. There is no guarantee that derivatives, to the extent
employed, will have the intended effect, and their use could cause lower
returns or even losses to the portfolio. The use of derivatives by the
portfolio to hedge risk may reduce the opportunity for gain by offsetting the
positive effect of favorable price movements.
SECURITIES LENDING RISK. Any loss in the market price of securities loaned by
the portfolio that occurs during the term of the loan would be borne by the
portfolio and would adversely affect the portfolio's performance. Also, there
may be delays in recovery of securities loaned or even a loss of rights in the
collateral should the borrower of the securities fail financially while the
loan is outstanding. However, loans will be made only to borrowers selected by
the portfolio's delegate after a review of relevant facts and circumstances,
including the creditworthiness of the borrower.
PRICING RISK. At times, market conditions may make it difficult to value some
investments, and the portfolio may use certain valuation methodologies for some
of its investments, such as fair value pricing. Given the subjective nature of
such valuation methodologies, it is possible that the value determined for an
investment may be different than the value realized upon such investment's
sale. If the portfolio has valued its securities too highly, you may pay too
much for portfolio shares when you buy into the portfolio. If the portfolio has
underestimated the price of its securities, you may not receive the full market
value when you sell your portfolio shares.
DWS VARIABLE SERIES II - CLASS A SHARES DWS JANUS GROWTH & INCOME
VIP 75
SECURITY SELECTION RISK. A risk that pervades all investing is the risk that
the securities in the portfolio's portfolio may decline in value.
Other factors that could affect performance include:
o portfolio management could be wrong in the analysis of industries, companies,
economic trends, the relative attractiveness of different securities or
other matters.
o debt securities may be subject to interest rate risk and credit risk.
o growth stocks may be out of favor for certain periods.
o foreign securities may be more volatile than their US counterparts, for
reasons such as currency fluctuations and political and economic
uncertainty.
PERFORMANCE - CLASS A
While a portfolio's past performance isn't necessarily a sign of how it will do
in the future, it can be valuable for an investor to know.
The bar chart shows how the returns for the portfolio's Class A shares have
varied from year to year, which may give some idea of risk. The table shows
average annual returns for the portfolio and comparable index information
(which, unlike the portfolio, does not have any fees or expenses). The
performance of both the portfolio and the comparable index information varies
over time. All figures assume reinvestment of dividends and distributions.
This information doesn't reflect charges and fees associated with the separate
account that invests in the portfolio or any variable life insurance policy or
variable annuity contract for which the portfolio is an investment option.
These charges and fees will reduce returns.
ANNUAL TOTAL RETURN (%) as of 12/31 each year - CLASS A
[BARGRAPHIC APPEARS HERE]
-9.18 -12.28 -20.22 24.37 11.51 12.11 8.43 6.59
2000 2001 2002 2003 2004 2005 2006 2007
FOR THE PERIODS INCLUDED IN THE BAR CHART:
BEST QUARTER: 12.40%, Q4 2004 WORST QUARTER: -15.87%, Q3 2002
2008 TOTAL RETURN AS OF MARCH 31: -9.56%
AVERAGE ANNUAL TOTAL RETURNS (%) as of 12/31/2007
1 YEAR 5 YEARS SINCE INCEPTION*
------ ------- ----------------
Portfolio - Class A 6.59 12.44 3.39
Russell 1000 Growth Index 11.81 12.11 -1.05
* Since 10/29/99. Index comparison begins 10/31/99.
RUSSELL 1000 (Reg. TM) GROWTH INDEX is an unmanaged index that consists of
those stocks in the Russell 1000 (Reg. TM) Index that have higher price-to-book
ratios and higher forecasted growth values. Russell 1000 (Reg. TM) Index is an
unmanaged price-only index of the 1,000 largest capitalized companies that are
domiciled in the US and whose common stocks are traded.
Current performance information may be higher or lower than the performance
data quoted above. For more recent performance information, contact your
participating insurance company.
76 DWS JANUS GROWTH & INCOME VIP DWS VARIABLE SERIES II -
CLASS A SHARES
HOW MUCH INVESTORS PAY
This table describes the fees and expenses that you may pay if you buy and hold
portfolio shares. The information in the table does not reflect charges and
fees associated with the separate account that invests in the portfolio or any
variable life insurance policy or variable annuity contract for which the
portfolio is an investment option. These charges and fees will increase
expenses.
FEE TABLE CLASS A
--------- -------
ANNUAL OPERATING EXPENSES, deducted from portfolio assets
Management Fee1 0.67%
Distribution/Service (12b-1) Fee None
Other Expenses2 0.23
TOTAL ANNUAL OPERATING EXPENSES 0.90
1 Restated on an annualized basis to reflect approved fee changes taking
effect on May 1, 2008.
2 Restated on an annualized basis to reflect approved fee changes taking
effect on May 1, 2008. Includes a 0.10% administrative services fee paid
to the Advisor.
Based on the costs above, this example helps you compare the expenses of Class
A shares to those of other mutual funds. This example assumes the expenses
above remain the same. It also assumes that you invested $10,000, earned 5%
annual returns, reinvested all dividends and distributions and sold your shares
at the end of each period. This is only an example; actual expenses will be
different.
EXAMPLE 1 YEAR 3 YEARS 5 YEARS 10 YEARS
------- ------ ------- ------- --------
Class A shares $92 $287 $498 $1,108
THE PORTFOLIO MANAGER
The portfolio's subadvisor is Janus Capital Management LLC ("Janus"). The
portfolio manager is Marc Pinto. He has managed the portfolio since November
2007. Mr. Pinto is also a portfolio manager of other Janus accounts. Mr. Pinto
joined Janus in 1994 as an analyst and has acted as portfolio manager of other
Janus-advised mutual funds since 2005. Mr. Pinto holds a Bachelor's degree in
History from Yale University and a Master's degree in Business Administration
from Harvard University. He holds the Chartered Financial Analyst designation.
The portfolio's Statement of Additional Information provides additional
information about a portfolio manager's investments in the portfolio, a
description of the portfolio management compensation structure, and information
regarding other accounts managed.
DWS VARIABLE SERIES II - CLASS A SHARES DWS JANUS GROWTH & INCOME
VIP 77
FINANCIAL HIGHLIGHTS
This table is designed to help you understand the portfolio's financial
performance. The figures in the first part of the table are for a single share.
The total return figures represent the percentage that an investor in the
portfolio would have earned (or lost), assuming all dividends and distributions
were reinvested. This information has been audited by Ernst & Young LLP, an
independent registered public accounting firm, whose report, along with the
portfolio's financial statements, is included in the portfolio's annual report
(see "Shareholder reports" on the back cover). The following table includes
selected data for a share outstanding throughout each period and other
performance information derived from the financial statements.
This information doesn't reflect charges and fees associated with the separate
account that invests in the portfolio or any variable life insurance policy or
variable annuity contract for which the portfolio is an investment option.
These charges and fees will reduce returns.
DWS JANUS GROWTH & INCOME VIP - CLASS A
YEARS ENDED DECEMBER 31, 2007 2006 2005 2004 2003
----------------------------------------- -------- -------- ------- ------ -------
SELECTED PER SHARE DATA
-------------------------------------------------------------------------------------------------
NET ASSET VALUE, BEGINNING OF PERIOD $ 11.91 $ 11.05 $ 9.88 $ 8.86 $ 7.18
----------------------------------------- -------- -------- ------- ------ -------
Income (loss) from investment operations:
Net investment income a .12 .07 .05 .03 .03
----------------------------------------- -------- -------- ------- ------ -------
Net realized and unrealized gain (loss) .66 .86 1.14 .99 1.71
----------------------------------------- -------- -------- ------- ------ -------
TOTAL FROM INVESTMENT OPERATIONS .78 .93 1.19 1.02 1.74
----------------------------------------- -------- -------- ------- ------ -------
Less distributions from:
Net investment income ( .07) ( .07) ( .02) - ( .06)
----------------------------------------- -------- -------- ------- ------ -------
NET ASSET VALUE, END OF PERIOD $ 12.62 $ 11.91 $ 11.05 $ 9.88 $ 8.86
----------------------------------------- -------- -------- ------- ------ -------
Total Return (%) 6.59 8.43 12.11 11.51 24.37
----------------------------------------- -------- -------- ------- ------ -------
RATIOS TO AVERAGE NET ASSETS AND SUPPLEMENTAL DATA
-------------------------------------------------------------------------------------------------
Net assets, end of period ($ millions) 169 193 195 187 189
----------------------------------------- -------- -------- ------- ------ -------
Ratio of expenses (%) .90 .85 .92 1.06 1.07
----------------------------------------- -------- -------- ------- ------ -------
Ratio of net investment income (loss) (%) .93 .68 .45 .34 .40
----------------------------------------- -------- -------- ------- ------ -------
Portfolio turnover rate (%) 73 44 32 52 46
----------------------------------------- -------- -------- ------- ------ -------
a Based on average shares outstanding during the period.
78 DWS JANUS GROWTH & INCOME VIP DWS VARIABLE SERIES II -
CLASS A SHARES
HYPOTHETICAL EXPENSE SUMMARY
Using the annual portfolio operating expense ratios presented in the fee tables
in the portfolio prospectus, the Hypothetical Expense Summary shows the
estimated fees and expenses, in actual dollars, that would be charged on a
hypothetical investment of $10,000 in the portfolio held for the next 10 years
and the impact of such fees and expenses on portfolio returns for each year and
cumulatively, assuming a 5% return for each year. The tables also assume that
all dividends and distributions are reinvested. The annual portfolio expense
ratios shown are net of any contractual fee waivers or expense reimbursements,
if any, for the period of the contractual commitment. Also, please note that if
you are investing through a third party provider, that provider may have fees
and expenses separate from those of the portfolio that are not reflected here.
Mutual fund fees and expenses fluctuate over time and actual expenses may be
higher or lower than those shown.
The Hypothetical Expense Summary should not be used or construed as an offer to
sell, a solicitation of an offer to buy or a recommendation or endorsement of
any specific mutual fund. You should carefully review the portfolio's
prospectus to consider the investment objectives, risks, expenses and charges
of the portfolio prior to investing.
DWS JANUS GROWTH & INCOME VIP - CLASS A
INITIAL HYPOTHETICAL ASSUMED RATE
MAXIMUM INVESTMENT: OF RETURN:
SALES CHARGE: $10,000 5%
0.00% ---------------------------------- ----------------------------------
CUMULATIVE CUMULATIVE HYPOTHETICAL
RETURN BEFORE RETURN AFTER YEAR-END BALANCE ANNUAL
FEES AND ANNUAL FUND FEES AND AFTER FEES AND FEES AND
YEAR EXPENSES EXPENSE RATIOS EXPENSES EXPENSES EXPENSES
----- ------------- -------------- ------------ ---------------- ----------
1 5.00% 0.90% 4.10% $ 10,410.00 $ 91.85
2 10.25% 0.90% 8.37% $ 10,836.81 $ 95.61
3 15.76% 0.90% 12.81% $ 11,281.12 $ 99.53
4 21.55% 0.90% 17.44% $ 11,743.65 $ 103.61
5 27.63% 0.90% 22.25% $ 12,225.13 $ 107.86
6 34.01% 0.90% 27.26% $ 12,726.37 $ 112.28
7 40.71% 0.90% 32.48% $ 13,248.15 $ 116.89
8 47.75% 0.90% 37.91% $ 13,791.32 $ 121.68
9 55.13% 0.90% 43.57% $ 14,356.76 $ 126.67
10 62.89% 0.90% 49.45% $ 14,945.39 $ 131.86
TOTAL $ 1,107.84
DWS VARIABLE SERIES II - CLASS A SHARES DWS JANUS GROWTH & INCOME
VIP 79
DWS LARGE CAP VALUE VIP
THE PORTFOLIO'S MAIN INVESTMENT STRATEGY
The portfolio seeks to achieve a high rate of total return.
Under normal circumstances, the portfolio invests at least 80% of net assets,
plus the amount of any borrowings for investment purposes, in common stocks and
other equity securities of large US companies that are similar in size to the
companies in the Russell 1000 (Reg. TM) Value Index (as of February 29, 2008,
the Russell 1000 (Reg. TM) Value Index had a median market capitalization of
$4.8 billion) and that the portfolio managers believe are undervalued. These
are typically companies that have been sound historically but are temporarily
out of favor. The portfolio intends to invest primarily in companies whose
market capitalizations fall within the normal range of the Index. Although the
portfolio can invest in stocks of any economic sector (which is comprised of
two or more industries), at times it may emphasize the financial services
sector or other sectors. In fact, it may invest more than 25% of total assets
in a single sector.
The portfolio's equity investments are mainly common stocks, but may also
include other types of equities such as preferred or convertible stocks.
The portfolio manager begins by screening for stocks whose price-to-earnings
ratios are below the average for the S&P 500 Index. The portfolio manager then
compares a company's stock price to its book value, cash flow and yield, and
analyze individual companies to identify those that are financially sound and
appear to have strong potential for long-term growth.
The portfolio manager assembles the portfolio from among the most attractive
stocks, drawing on analysis of economic outlooks for various sectors and
industries.
Portfolio management will normally sell a stock when it believes the stock's
price is unlikely to go higher, its fundamental factors have changed, other
investments offer better opportunities or in the course of adjusting the
portfolio's emphasis on a given industry.
SECURITIES LENDING. The portfolio may lend its investment securities in an
amount up to 33 1/3% of its total assets to approved institutional borrowers
who need to borrow securities in order to complete certain transactions.
Although major changes tend to be infrequent, the Board of Trustees could
change the portfolio's investment objective without seeking shareholder
approval. However, the Board will provide shareholders with at least 60 days'
notice prior to making any changes to the portfolio's 80% investment policy.
OTHER INVESTMENTS
The portfolio may invest up to 20% of total assets in foreign securities. The
portfolio is permitted, but not required, to use various types of derivatives
(contracts whose value is based on, for example, indices, currencies or
securities). Derivatives may be used for hedging and for risk management or for
non-hedging purposes to seek to enhance potential gains. The portfolio may use
derivatives in circumstances where portfolio management believes they offer an
economical means of gaining exposure to a particular asset class or to keep
cash on hand to meet shareholder redemptions or other needs while maintaining
exposure to the market. In particular, the portfolio may use futures, currency
options and forward currency transactions.
As a temporary defensive measure, the portfolio could shift up to 100% of
assets into investments such as money market securities. This measure could
prevent losses, but, while engaged in a temporary defensive position, the
portfolio will not be pursuing its investment objective. However, the portfolio
manager may choose not to use these strategies for various reasons, even in
very volatile market conditions.
THE MAIN RISKS OF INVESTING IN THE PORTFOLIO
There are several risk factors that could hurt the portfolio's performance,
cause you to lose money or cause the portfolio's performance to trail that of
other investments.
80 DWS LARGE CAP VALUE VIP DWS VARIABLE SERIES II -
CLASS A SHARES
STOCK MARKET RISK. The portfolio is affected by how the stock market performs.
To the extent the portfolio invests in a particular market sector, the
portfolio's performance may be proportionately affected by that segment's
general performance. When stock prices fall, you should expect the value of
your investment to fall as well. Because a stock represents ownership in its
issuer, stock prices can be hurt by poor management, shrinking product demand
and other business risks. These may affect single companies as well as groups
of companies. In addition, movements in financial markets may adversely affect
a stock's price, regardless of how well the company performs. The market as a
whole may not favor the types of investments the portfolio makes and the
portfolio may not be able to get an attractive price for them.
VALUE INVESTING RISK. At times, "value" investing may perform better than or
worse than other investment styles and the overall market. If portfolio
management overestimates the value or return potential of one or more common
stocks, the portfolio may underperform the general equity market. Value stocks
may also be out of favor for certain periods in relation to growth stocks.
INDUSTRY RISK. While the portfolio does not concentrate in any industry, to the
extent that the portfolio has exposure to a given industry or sector, any
factors affecting that industry or sector could affect the value of portfolio
securities. For example, manufacturers of consumer goods could be hurt by a
rise in unemployment or technology companies could be hurt by such factors as
market saturation, price competition and rapid obsolescence.
DERIVATIVES RISK. Risks associated with derivatives include the risk that the
derivative is not well correlated with the security, index or currency to which
it relates; the risk that derivatives may result in losses or missed
opportunities; the risk that the portfolio will be unable to sell the
derivative because of an illiquid secondary market; the risk that a
counterparty is unwilling or unable to meet its obligation and the risk that
the derivative transaction could expose the portfolio to the effects of
leverage, which could increase the portfolio's exposure to the market and
magnify potential losses. There is no guarantee that derivatives, to the extent
employed, will have the intended effect, and their use could cause lower
returns or even losses to the portfolio. The use of derivatives by the
portfolio to hedge risk may reduce the opportunity for gain by offsetting the
positive effect of favorable price movements.
SECURITIES LENDING RISK. Any loss in the market price of securities loaned by
the portfolio that occurs during the term of the loan would be borne by the
portfolio and would adversely affect the portfolio's performance. Also, there
may be delays in recovery of securities loaned or even a loss of rights in the
collateral should the borrower of the securities fail financially while the
loan is outstanding. However, loans will be made only to borrowers selected by
the portfolio's delegate after a review of relevant facts and circumstances,
including the creditworthiness of the borrower.
PRICING RISK. At times, market conditions may make it difficult to value some
investments, and the portfolio may use certain valuation methodologies for some
of its investments, such as fair value pricing. Given the subjective nature of
such valuation methodologies, it is possible that the value determined for an
investment may be different than the value realized upon such investment's
sale. If the portfolio has valued its securities too highly, you may pay too
much for portfolio shares when you buy into the portfolio. If the portfolio has
underestimated the price of its securities, you may not receive the full market
value when you sell your portfolio shares.
SECURITY SELECTION RISK. A risk that pervades all investing is the risk that
the securities in the portfolio's portfolio may decline in value.
Other factors that could affect performance include:
o portfolio management could be wrong in the analysis of industries, companies,
economic trends, the relative attractiveness of different securities or
other matters.
o foreign securities may be more volatile than their US counterparts, for
reasons such as currency fluctuations and political and economic
uncertainty.
Investors seeking to diversify a growth-oriented portfolio or add a core
holding to a value-oriented portfolio may want to consider this portfolio.
DWS VARIABLE SERIES II - CLASS A SHARES DWS LARGE CAP VALUE
VIP 81
PERFORMANCE - CLASS A
While a portfolio's past performance isn't necessarily a sign of how it will do
in the future, it can be valuable for an investor to know.
The bar chart shows how the returns for the portfolio's Class A shares have
varied from year to year, which may give some idea of risk. The table shows
average annual returns for the portfolio and comparable index information
(which, unlike the portfolio, does not have any fees or expenses). The
performance of both the portfolio and the comparable index information varies
over time. All figures assume reinvestment of dividends and distributions.
This information doesn't reflect charges and fees associated with the separate
account that invests in the portfolio or any variable life insurance policy or
variable annuity contract for which the portfolio is an investment option.
These charges and fees will reduce returns.
ANNUAL TOTAL RETURN (%) as of 12/31 each year - CLASS A
[BARGRAPHIC APPEARS HERE]
19.26 -10.21 16.13 1.87 -14.98 32.60 10.07 1.97 15.41 13.15
1998 1999 2000 2001 2002 2003 2004 2005 2006 2007
FOR THE PERIODS INCLUDED IN THE BAR CHART:
BEST QUARTER: 18.86%, Q2 2003 WORST QUARTER: -19.06%, Q3 2002
2008 TOTAL RETURN AS OF MARCH 31: -7.02%
AVERAGE ANNUAL TOTAL RETURNS (%) as of 12/31/2007
1 YEAR 5 YEARS 10 YEARS
------ ------- --------
Portfolio - Class A 13.15 14.21 7.66
Russell 1000 Value Index -0.17 14.63 7.68
Total returns would have been lower if operating expenses hadn't been reduced.
RUSSELL 1000 (Reg. TM) VALUE INDEX is an unmanaged index that consists of those
stocks in the Russell 1000 Index with less-than-average growth orientation.
Russell 1000 (Reg. TM) Index is an unmanaged price-only index of the 1,000
largest capitalized companies that are domiciled in the US and whose common
stocks are traded.
Current performance information may be higher or lower than the performance
data quoted above. For more recent performance information, contact your
participating insurance company.
82 DWS LARGE CAP VALUE VIP DWS VARIABLE SERIES II -
CLASS A SHARES
HOW MUCH INVESTORS PAY
This table describes the fees and expenses that you may pay if you buy and hold
portfolio shares. The information in the table does not reflect charges and
fees associated with the separate account that invests in the portfolio or any
variable life insurance policy or variable annuity contract for which the
portfolio is an investment option. These charges and fees will increase
expenses.
FEE TABLE CLASS A
--------- -------
ANNUAL OPERATING EXPENSES, deducted from portfolio assets
Management Fee1 0.65%
Distribution/Service (12b-1) Fee None
Other Expenses2 0.18
TOTAL ANNUAL OPERATING EXPENSES 0.83
1 Restated on an annualized basis to reflect fee changes which took effect on
April 11, 2007.
2 Restated on an annualized basis to reflect fee changes which took effect on
April 11, 2007. Includes a 0.10% administrative services fee paid to the
Advisor.
Based on the costs above, this example helps you compare the expenses of Class
A shares to those of other mutual funds. This example assumes the expenses
above remain the same. It also assumes that you invested $10,000, earned 5%
annual returns, reinvested all dividends and distributions and sold your shares
at the end of each period. This is only an example; actual expenses will be
different.
EXAMPLE 1 YEAR 3 YEARS 5 YEARS 10 YEARS
------- ------ ------- ------- --------
Class A shares $85 $265 $460 $1,025
THE PORTFOLIO MANAGER
Deutsche Asset Management International GmbH, Mainzer Landstrasse 178-190,
Frankfurt am Main, Germany, is the subadvisor for the portfolio.
The following person handles the day-to-day management of the portfolio:
Thomas Schuessler, PhD
Managing Director of Deutsche Asset Management and Portfolio Manager of the
portfolio.
o Joined Deutsche Asset Management in 2001 after 5 years at Deutsche Bank
where he managed various projects and served as executive assistant to
board member.
o US and Global Fund Management: Frankfurt.
o Joined the portfolio in 2007.
o PhD, University of Heidelberg, studies in physics and economics at
University of Heidelberg and University of Utah.
The portfolio's Statement of Additional Information provides additional
information about a portfolio manager's investments in the portfolio, a
description of the portfolio management compensation structure, and information
regarding other accounts managed.
DWS VARIABLE SERIES II - CLASS A SHARES DWS LARGE CAP VALUE
VIP 83
FINANCIAL HIGHLIGHTS
This table is designed to help you understand the portfolio's financial
performance. The figures in the first part of the table are for a single share.
The total return figures represent the percentage that an investor in the
portfolio would have earned (or lost), assuming all dividends and distributions
were reinvested. This information has been audited by Ernst & Young LLP, an
independent registered public accounting firm, whose report, along with the
portfolio's financial statements, is included in the portfolio's annual report
(see "Shareholder reports" on the back cover). The following table includes
selected data for a share outstanding throughout each period and other
performance information derived from the financial statements.
This information doesn't reflect charges and fees associated with the separate
account that invests in the portfolio or any variable life insurance policy or
variable annuity contract for which the portfolio is an investment option.
These charges and fees will reduce returns.
DWS LARGE CAP VALUE VIP - CLASS A
YEARS ENDED DECEMBER 31, 2007 2006 2005 2004 2003
------------------------------------------------- --------- -------- -------- -------- --------
SELECTED PER SHARE DATA
-----------------------------------------------------------------------------------------------------------------
NET ASSET VALUE, BEGINNING OF PERIOD $ 17.96 $ 15.81 $ 15.79 $ 14.57 $ 11.24
------------------------------------------------- --------- -------- -------- -------- --------
Income (loss) from investment operations:
Net investment income (loss)a .26 .29c .26 .27 .24
------------------------------------------------- --------- -------- -------- -------- --------
Net realized and unrealized gain (loss) 1.98 2.12 .04 1.18 3.33
------------------------------------------------- --------- -------- -------- -------- --------
TOTAL FROM INVESTMENT OPERATIONS 2.24 2.41 .30 1.45 3.57
------------------------------------------------- --------- -------- -------- -------- --------
Less distributions from:
Net investment income ( .32) ( .26) ( .28) ( .23) ( .24)
------------------------------------------------- --------- -------- -------- -------- --------
Net realized gains ( .67) - - - -
------------------------------------------------- --------- -------- -------- -------- --------
TOTAL DISTRIBUTIONS ( .99) ( .26) ( .28) ( .23) ( .24)
------------------------------------------------- --------- -------- -------- -------- --------
NET ASSET VALUE, END OF PERIOD $ 19.21 $ 17.96 $ 15.81 $ 15.79 $ 14.57
------------------------------------------------- --------- -------- -------- -------- --------
Total Return (%) 13.15b,d 15.41c 1.97b 10.07 32.60
------------------------------------------------- --------- -------- -------- -------- --------
RATIOS TO AVERAGE NET ASSETS AND SUPPLEMENTAL DATA
-----------------------------------------------------------------------------------------------------------------
Net assets, end of period ($ millions) 229 275 268 274 263
------------------------------------------------- --------- -------- -------- -------- --------
Ratio of expenses before expense reductions (%) .83 .83 .80 .80 .80
------------------------------------------------- --------- -------- -------- -------- --------
Ratio of expenses after expense reductions (%) .82 .83 .80 .80 .80
------------------------------------------------- --------- -------- -------- -------- --------
Ratio of net investment income (loss) (%) 1.43 1.73c 1.64 1.84 1.94
------------------------------------------------- --------- -------- -------- -------- --------
Portfolio turnover rate (%) 103 76 64 40 58
------------------------------------------------- --------- -------- -------- -------- --------
a Based on average shares outstanding during the period.
b Total return would have been lower had certain expenses not been reduced.
c Includes non-recurring income from the Advisor recorded as a result of an
administrative proceeding regarding disclosure of brokerage allocation
practices in connection with sales of DWS Scudder Funds. The non-recurring
income resulted in an increase in net investment income of $0.008 per
share and an increase in the ratio of net investment income of 0.04%.
Excluding this non-recurring income, total return would have been 0.04%
lower.
d Includes a reimbursement from the Advisor for $92,456 for losses on certain
operation errors during the period. Excluding this reimbursement, total
return would have been 0.04%lower.
84 DWS LARGE CAP VALUE VIP DWS VARIABLE SERIES II -
CLASS A SHARES
HYPOTHETICAL EXPENSE SUMMARY
Using the annual portfolio operating expense ratios presented in the fee tables
in the portfolio prospectus, the Hypothetical Expense Summary shows the
estimated fees and expenses, in actual dollars, that would be charged on a
hypothetical investment of $10,000 in the portfolio held for the next 10 years
and the impact of such fees and expenses on portfolio returns for each year and
cumulatively, assuming a 5% return for each year. The tables also assume that
all dividends and distributions are reinvested. The annual portfolio expense
ratios shown are net of any contractual fee waivers or expense reimbursements,
if any, for the period of the contractual commitment. Also, please note that if
you are investing through a third party provider, that provider may have fees
and expenses separate from those of the portfolio that are not reflected here.
Mutual fund fees and expenses fluctuate over time and actual expenses may be
higher or lower than those shown.
The Hypothetical Expense Summary should not be used or construed as an offer to
sell, a solicitation of an offer to buy or a recommendation or endorsement of
any specific mutual fund. You should carefully review the portfolio's
prospectus to consider the investment objectives, risks, expenses and charges
of the portfolio prior to investing.
DWS LARGE CAP VALUE VIP - CLASS A
INITIAL HYPOTHETICAL ASSUMED RATE
MAXIMUM INVESTMENT: OF RETURN:
SALES CHARGE: $10,000 5%
0.00% ----------------------------------- ----------------------------------
CUMULATIVE CUMULATIVE HYPOTHETICAL
RETURN BEFORE RETURN AFTER YEAR-END BALANCE ANNUAL
FEES AND ANNUAL FUND FEES AND AFTER FEES AND FEES AND
YEAR EXPENSES EXPENSE RATIOS EXPENSES EXPENSES EXPENSES
----- ------------- -------------- ------------ ---------------- ----------
1 5.00% 0.83% 4.17% $ 10,417.00 $ 84.73
2 10.25% 0.83% 8.51% $ 10,851.39 $ 88.26
3 15.76% 0.83% 13.04% $ 11,303.89 $ 91.94
4 21.55% 0.83% 17.75% $ 11,775.26 $ 95.78
5 27.63% 0.83% 22.66% $ 12,266.29 $ 99.77
6 34.01% 0.83% 27.78% $ 12,777.80 $ 103.93
7 40.71% 0.83% 33.11% $ 13,310.63 $ 108.27
8 47.75% 0.83% 38.66% $ 13,865.68 $ 112.78
9 55.13% 0.83% 44.44% $ 14,443.88 $ 117.48
10 62.89% 0.83% 50.46% $ 15,046.19 $ 122.38
TOTAL $ 1,025.32
DWS VARIABLE SERIES II - CLASS A SHARES DWS LARGE CAP VALUE
VIP 85
DWS MID CAP GROWTH VIP
THE PORTFOLIO'S MAIN INVESTMENT STRATEGY
The portfolio seeks long-term capital growth.
Under normal circumstances, the portfolio invests at least 80% of its net
assets, plus the amount of any borrowings for investment purposes, determined
at the time of purchase, in companies with market capitalizations within the
market capitalization range of the Russell Midcap(TM) Growth Index (as of
February 29, 2008, the Russell Midcap (Reg. TM) Growth Index had a median
market capitalization of $4.05 billion) or securities with equity
characteristics that provide exposure to those companies. The portfolio's
equity investments are mainly common stocks, but may also include other types
of equity securities such as preferred stocks or convertible securities.
The portfolio invests primarily in equity securities of medium-sized
growth-oriented US companies. Portfolio management focuses on individual
security selection rather than industry selection. Portfolio management uses an
active process which combines financial analysis with company visits to
evaluate management and strategies.
Company research lies at the heart of the investment process. Portfolio
management uses a "bottom-up" approach to picking securities.
o Portfolio management focuses on undervalued stocks with fast growing earnings
and superior near-to-intermediate term performance potential.
o Portfolio management emphasizes individual selection of medium sized stocks
across all economic sectors, early in their growth cycles and with the
potential to be the blue chips of the future.
o Portfolio management generally seeks companies with a leading or dominant
position in their niche markets, a high rate of return on invested capital
and the ability to finance a major part of future growth from internal
sources.
The portfolio follows a disciplined selling process in order to lessen risk. A
security may be sold if one or more of the following conditions are met:
o the stock price reaches portfolio management's expectations;
o there is a material change in the company's fundamentals;
o portfolio management believes other investments offer better opportunities;
or
o the market capitalization of a stock distorts the weighted average market
capitalization of the portfolio.
The portfolio may also invest up to 20% of its assets in stocks and other
securities of companies based outside the US.
SECURITIES LENDING. The portfolio may lend its investment securities in an
amount up to 33 1/3% of its total assets to approved institutional borrowers
who need to borrow securities in order to complete certain transactions.
Although major changes tend to be infrequent, the Board could change the
portfolio's investment objective without seeking shareholder approval. However,
the Board will provide shareholders with at least 60 days' notice prior to
making any changes to the portfolio's 80% investment policy.
OTHER INVESTMENTS
The portfolio is permitted, but not required, to use various types of
derivatives (contracts whose value is based on, for example, indices,
currencies or securities). Derivatives may be used for hedging and for risk
management or for non-hedging purposes to seek to enhance potential gains. The
portfolio may use derivatives in circumstances where portfolio management
believes they offer an economical means of gaining exposure to a particular
asset class or to keep cash on hand to meet shareholder redemptions or other
needs while maintaining exposure to the market.
86 DWS MID CAP GROWTH VIP DWS VARIABLE SERIES II -
CLASS A SHARES
As a temporary defensive measure, the portfolio could shift up to 100% of
assets into investments such as money market investments or other short-term
bonds that offer comparable safety. In addition, as a temporary defensive
position, the portfolio may invest up to 100% of assets in the common stock of
larger companies or in fixed-income securities. This could prevent losses, but,
while engaged in a temporary defensive position, the portfolio may not achieve
its investment objective. However, the portfolio manager may choose not to use
these strategies for various reasons, even in very volatile market conditions.
THE MAIN RISKS OF INVESTING IN THE PORTFOLIO
There are several risk factors that could hurt the portfolio's performance,
cause you to lose money or cause the portfolio's performance to trail that of
other investments.
STOCK MARKET RISK. The portfolio is affected by how the stock market performs.
To the extent the portfolio invests in a particular market sector, the
portfolio's performance may be proportionately affected by that segment's
general performance. When stock prices fall, you should expect the value of
your investment to fall as well. Because a stock represents ownership in its
issuer, stock prices can be hurt by poor management, shrinking product demand
and other business risks. These may affect single companies as well as groups
of companies. In addition, movements in financial markets may adversely affect
a stock's price, regardless of how well the company performs. The market as a
whole may not favor the types of investments the portfolio makes and the
portfolio may not be able to get an attractive price for them.
MEDIUM-SIZED COMPANY RISK. Medium-sized company stocks tend to experience
steeper price fluctuations than stocks of larger companies. A shortage of
reliable information can also pose added risk to medium sized companies stocks.
Industry-wide reversals may have a greater impact on medium-sized companies,
since they usually lack the financial resources of large companies.
Medium-sized company stocks are typically less liquid than large company
stocks. Accordingly, it may be harder to find buyers for medium-sized company
shares.
INDUSTRY RISK. While the portfolio does not concentrate in any industry, to the
extent that the portfolio has exposure to a given industry or sector, any
factors affecting that industry or sector could affect the value of portfolio
securities. For example, manufacturers of consumer goods could be hurt by a
rise in unemployment or technology companies could be hurt by such factors as
market saturation, price competition and rapid obsolescence.
IPO RISK. Securities purchased in initial public offerings (IPOs) may be very
volatile, due to their stock prices rising and falling rapidly, often based,
among other reasons, on investor perceptions rather than economic reasons.
Additionally, investments in IPOs may magnify the portfolio's performance if it
has a small asset base. The portfolio is less likely to experience a similar
impact on its performance as its assets grow because it is unlikely that the
portfolio will obtain proportionately larger IPO allocations.
PRICING RISK. At times, market conditions may make it difficult to value some
investments, and the portfolio may use certain valuation methodologies for some
of its investments, such as fair value pricing. Given the subjective nature of
such valuation methodologies, it is possible that the value determined for an
investment may be different than the value realized upon such investment's
sale. If the portfolio has valued its securities too highly, you may pay too
much for portfolio shares when you buy into the portfolio. If the portfolio has
underestimated the price of its securities, you may not receive the full market
value when you sell your portfolio shares.
DERIVATIVES RISK. Risks associated with derivatives include the risk that the
derivative is not well correlated with the security, index or currency to which
it relates; the risk that derivatives may result in losses or missed
opportunities; the risk that the portfolio will be unable to sell the
derivative because of an illiquid secondary market; the risk that a
counterparty is unwilling or unable to meet its obligation and the risk that
the derivative transaction could expose the portfolio to the effects of
leverage, which could increase the portfolio's exposure to the market and
magnify potential losses. There is no guarantee that derivatives, to the extent
employed, will have the intended effect, and their use could cause lower
returns or even losses to the portfolio. The use of derivatives by the
portfolio to hedge risk may reduce the opportunity for gain by offsetting the
positive effect of favorable price movements.
SECURITIES LENDING RISK. Any loss in the market price of securities loaned by
the portfolio that occurs during the term of the loan would be borne by the
portfolio and would adversely affect the portfolio's performance. Also, there
may be delays in recovery of securities loaned or even a loss of rights in the
collateral should the
DWS VARIABLE SERIES II - CLASS A SHARES DWS MID CAP GROWTH
VIP 87
borrower of the securities fail financially while the loan is outstanding.
However, loans will be made only to borrowers selected by the portfolio's
delegate after a review of relevant facts and circumstances, including the
creditworthiness of the borrower.
SECURITY SELECTION RISK. A risk that pervades all investing is the risk that
the securities in the portfolio's portfolio may decline in value.
Other factors that could affect performance include:
o portfolio management could be wrong in the analysis of industries, companies,
economic trends, the relative attractiveness of different securities or
other matters.
o foreign securities may be more volatile than their US counterparts, for
reasons such as currency fluctuations and political and economic
uncertainty.
This portfolio is designed for investors with long-term goals who can tolerate
capital fluctuation in pursuit of long-term capital growth.
PERFORMANCE - CLASS A
While a portfolio's past performance isn't necessarily a sign of how it will do
in the future, it can be valuable for an investor to know.
The bar chart shows how the returns for the portfolio's Class A shares have
varied from year to year, which may give some idea of risk. The table shows
average annual returns for the portfolio and comparable index information
(which, unlike the portfolio, does not have any fees or expenses). The
performance of both the portfolio and the comparable index information varies
over time. All figures assume reinvestment of dividends and distributions.
This information doesn't reflect charges and fees associated with the separate
account that invests in the portfolio or any variable life insurance policy or
variable annuity contract for which the portfolio is an investment option.
These charges and fees will reduce returns.
Prior to October 28, 2005, the portfolio was named Scudder Aggressive Growth
Portfolio and operated with a different goal and investment strategy.
Performance would have been different if the portfolio's current policies had
been in effect.
ANNUAL TOTAL RETURN (%) as of 12/31 each year - CLASS A
[BARGRAPHIC APPEARS HERE]
-4.96 -21.76 -30.66 33.99 4.02 15.04 10.95 8.36
2000 2001 2002 2003 2004 2005 2006 2007
FOR THE PERIODS INCLUDED IN THE BAR CHART:
BEST QUARTER: 23.43%, Q4 2001 WORST QUARTER: -25.94%, Q3 2001
2008 TOTAL RETURN AS OF MARCH 31: -12.42%
88 DWS MID CAP GROWTH VIP DWS VARIABLE SERIES II -
CLASS A SHARES
AVERAGE ANNUAL TOTAL RETURNS (%) as of 12/31/2007
1 YEAR 5 YEARS SINCE INCEPTION*
------ ------- ----------------
Portfolio - Class A 8.36 14.03 3.88
Russell Midcap Growth Index 11.43 17.90 5.80
Russell 3000 Growth Index 11.40 12.42 0.14
Standard & Poor's (S&P) 500 Index 5.49 12.83 2.76
* Since 5/1/99. Index comparisons begin 4/30/99.
Total returns would have been lower if operating expenses hadn't been reduced.
RUSSELL MIDCAP (Reg. TM) GROWTH INDEX is an unmanaged capitalization-weighted
index of medium and medium/small companies in the Russell 1000 (Reg. TM) Index
chosen for their growth orientation. Russell 1000 (Reg. TM) Index is an
unmanaged price-only index of the 1,000 largest capitalized companies that are
domiciled in the US and whose common stocks are traded.
RUSSELL 3000 (Reg. TM) GROWTH INDEX is an unmanaged capitalization-weighted
index containing the growth stocks in the Russell 3000 (Reg. TM) Index.
STANDARD & POOR'S 500 INDEX (S&P 500) is an unmanaged, capitalization-weighted
index of 500 stocks. The index is designed to measure performance of the broad
domestic economy through changes in the aggregate market value of 500 stocks
representing all major industries.
Current performance information may be higher or lower than the performance
data quoted above. For more recent performance information, contact your
participating insurance company.
HOW MUCH INVESTORS PAY
This table describes the fees and expenses that you may pay if you buy and hold
portfolio shares. The information in the table does not reflect charges and
fees associated with the separate account that invests in the portfolio or any
variable life insurance policy or variable annuity contract for which the
portfolio is an investment option. These charges and fees will increase
expenses.
FEE TABLE CLASS A
--------- -------
ANNUAL OPERATING EXPENSES, deducted from portfolio assets
Management Fee1 0.67%
Distribution/Service (12b-1) Fee None
Other Expenses2 0.28
TOTAL ANNUAL OPERATING EXPENSES 0.95
Less Expense Waiver/Reimbursement 0.01
NET ANNUAL OPERATING EXPENSES3 0.94
1 Restated on an annualized basis to reflect approved fee changes taking
effect on May 1, 2008.
2 Restated on an annualized basis to reflect approved fee changes taking
effect on May 1, 2008. Includes a 0.10% administrative services fee paid
to the Advisor.
3 Through April 30, 2009, the Advisor has agreed to waive all or a portion of
its management fee and reimburse or pay certain operating expenses so that
the total annual operating expenses of the portfolio will not exceed 0.94%
for Class A shares, excluding certain expenses such as extraordinary
expenses, taxes, brokerage and interest.
Based on the costs above (including one year of capped expenses in each
period), this example helps you compare the expenses of Class A shares to those
of other mutual funds. This example assumes the expenses above remain the same.
It also assumes that you invested $10,000, earned 5% annual returns, reinvested
all dividends and distributions and sold your shares at the end of each period.
This is only an example; actual expenses will be different.
EXAMPLE 1 YEAR 3 YEARS 5 YEARS 10 YEARS
------- ------ ------- ------- --------
Class A shares $96 $302 $525 $1,165
DWS VARIABLE SERIES II - CLASS A SHARES DWS MID CAP GROWTH
VIP 89
THE PORTFOLIO MANAGERS
The portfolio is managed by a team of investment professionals who collaborate
to implement the portfolio's investment strategy. The team is led by a lead
portfolio manager who is responsible for developing the portfolio's investment
strategy. Each portfolio manager on the team has authority over all aspects of
the portfolio's investment portfolio, including but not limited to, purchases
and sales of individual securities, portfolio construction techniques,
portfolio risk assessment and the management of daily cash flows in accordance
with portfolio holdings.
The following people handle the day-to-day management of the portfolio:
Robert S. Janis
Managing Director of Deutsche Asset Management and Lead Portfolio Manager of
the portfolio.
o Joined Deutsche Asset Management and the portfolio in 2004.
o Previously served as portfolio manager for 10 years at Credit Suisse
Asset Management (or at its predecessor, Warburg Pincus Asset Management).
o Over 20 years of investment industry experience.
o BA, University of Pennsylvania; MBA, University of Pennsylvania, Wharton
School.
Joseph Axtell, CFA
Managing Director of Deutsche Asset Management and Portfolio Manager of the
portfolio.
o Joined Deutsche Asset Management in 2001 and the portfolio in 2006.
o Senior analyst at Merrill Lynch Investment Managers for the international
equity portion of a global balanced portfolio (1996-2001).
o Director, International Research at PCM International (1989-1996).
o Associate manager, structured debt and equity group at Prudential Capital
Corporation (1988-1989).
o Analyst at Prudential-Bache Capital Funding in London (1987-1988).
o Equity analyst in the health care sector at Prudential Equity Management
Associates (1985-1987).
o BS, Carlson School of Management, University of Minnesota.
The portfolio's Statement of Additional Information provides additional
information about a portfolio manager's investments in the portfolio, a
description of the portfolio management compensation structure, and information
regarding other accounts managed.
90 DWS MID CAP GROWTH VIP DWS VARIABLE SERIES II -
CLASS A SHARES
FINANCIAL HIGHLIGHTS
This table is designed to help you understand the portfolio's financial
performance. The figures in the first part of the table are for a single share.
The total return figures represent the percentage that an investor in the
portfolio would have earned (or lost), assuming all dividends and distributions
were reinvested. This information has been audited by Ernst & Young LLP, an
independent registered public accounting firm, whose report, along with the
portfolio's financial statements, is included in the portfolio's annual report
(see "Shareholder reports" on the back cover). The following table includes
selected data for a share outstanding throughout each period and other
performance information derived from the financial statements.
This information doesn't reflect charges and fees associated with the separate
account that invests in the portfolio or any variable life insurance policy or
variable annuity contract for which the portfolio is an investment option.
These charges and fees will reduce returns.
Prior to October 28, 2005, the portfolio was named Scudder Aggressive Growth
Portfolio and operated with a different goal and investment strategy.
Performance would have been different if the portfolio's current policies had
been in effect.
DWS MID CAP GROWTH VIP - CLASS A
YEARS ENDED DECEMBER 31, 2007 2006 2005 2004 2003
------------------------------------------------- -------- ------- ------- ------- -------
SELECTED PER SHARE DATA
----------------------------------------------------------------------------------------------------------
NET ASSET VALUE, BEGINNING OF PERIOD $ 12.56 $ 11.32 $ 9.84 $ 9.46 $ 7.06
------------------------------------------------- -------- ------- ------- ------- -------
Income (loss) from investment operations:
Net investment income (loss)a ( .05) ( .06)c ( .05) ( .01) ( .05)
------------------------------------------------- -------- ------- ------- ------- -------
Net realized and unrealized gain (loss) 1.10 1.30 1.53 .39 2.45
------------------------------------------------- -------- ------- ------- ------- -------
TOTAL FROM INVESTMENT OPERATIONS 1.05 1.24 1.48 .38 2.40
------------------------------------------------- -------- ------- ------- ------- -------
NET ASSET VALUE, END OF PERIOD $ 13.61 $ 12.56 $ 11.32 $ 9.84 $ 9.46
------------------------------------------------- -------- ------- ------- ------- -------
Total Return (%)b 8.36 10.95c 15.04 4.02 33.99
------------------------------------------------- -------- ------- ------- ------- -------
RATIOS TO AVERAGE NET ASSETS AND SUPPLEMENTAL DATA
----------------------------------------------------------------------------------------------------------
Net assets, end of period ($ millions) 51 53 57 53 56
------------------------------------------------- -------- ------- ------- ------- -------
Ratio of expenses before expense reductions (%) 1.05 1.03 1.01 1.02 .98
------------------------------------------------- -------- ------- ------- ------- -------
Ratio of expenses after expense reductions (%) .90 .93 .95 .95 .95
------------------------------------------------- -------- ------- ------- ------- -------
Ratio of net investment income (loss) (%) ( .38) ( .51)c ( .45) ( .11) ( .57)
------------------------------------------------- -------- ------- ------- ------- -------
Portfolio turnover rate (%) 68 46 104 103 91
------------------------------------------------- -------- ------- ------- ------- -------
a Based on average shares outstanding during the period.
b Total return would have been lower had certain expenses not been reduced.
c Includes non-recurring income from the Advisor recorded as a result of an
administrative proceeding regarding disclosure of brokerage allocation
practices in connection with sales of DWS Scudder Funds. The non-recurring
income resulted in an increase in net investment income of $0.003 per
share and an increase in the ratio of net investment income of 0.03%.
Excluding this non-recurring income, total return would have been 0.03%
lower.
DWS VARIABLE SERIES II - CLASS A SHARES DWS MID CAP GROWTH
VIP 91
HYPOTHETICAL EXPENSE SUMMARY
Using the annual portfolio operating expense ratios presented in the fee tables
in the portfolio prospectus, the Hypothetical Expense Summary shows the
estimated fees and expenses, in actual dollars, that would be charged on a
hypothetical investment of $10,000 in the portfolio held for the next 10 years
and the impact of such fees and expenses on portfolio returns for each year and
cumulatively, assuming a 5% return for each year. The tables also assume that
all dividends and distributions are reinvested. The annual portfolio expense
ratios shown are net of any contractual fee waivers or expense reimbursements,
if any, for the period of the contractual commitment. Also, please note that if
you are investing through a third party provider, that provider may have fees
and expenses separate from those of the portfolio that are not reflected here.
Mutual fund fees and expenses fluctuate over time and actual expenses may be
higher or lower than those shown.
The Hypothetical Expense Summary should not be used or construed as an offer to
sell, a solicitation of an offer to buy or a recommendation or endorsement of
any specific mutual fund. You should carefully review the portfolio's
prospectus to consider the investment objectives, risks, expenses and charges
of the portfolio prior to investing.
DWS MID CAP GROWTH VIP - CLASS A
INITIAL HYPOTHETICAL ASSUMED RATE
MAXIMUM INVESTMENT: OF RETURN:
SALES CHARGE: $10,000 5%
0.00% ---------------------------------- ----------------------------------
CUMULATIVE CUMULATIVE HYPOTHETICAL
RETURN BEFORE RETURN AFTER YEAR-END BALANCE ANNUAL
FEES AND ANNUAL FUND FEES AND AFTER FEES AND FEES AND
YEAR EXPENSES EXPENSE RATIOS EXPENSES EXPENSES EXPENSES
----- ------------- -------------- ------------ ---------------- ----------
1 5.00% 0.94% 4.06% $ 10,406.00 $ 95.91
2 10.25% 0.95% 8.27% $ 10,827.44 $ 100.86
3 15.76% 0.95% 12.66% $ 11,265.95 $ 104.94
4 21.55% 0.95% 17.22% $ 11,722.23 $ 109.19
5 27.63% 0.95% 21.97% $ 12,196.98 $ 113.62
6 34.01% 0.95% 26.91% $ 12,690.95 $ 118.22
7 40.71% 0.95% 32.05% $ 13,204.94 $ 123.01
8 47.75% 0.95% 37.40% $ 13,739.74 $ 127.99
9 55.13% 0.95% 42.96% $ 14,296.20 $ 133.17
10 62.89% 0.95% 48.75% $ 14,875.19 $ 138.56
TOTAL $ 1,165.47
92 DWS MID CAP GROWTH VIP DWS VARIABLE SERIES II -
CLASS A SHARES
DWS MONEY MARKET VIP
THE PORTFOLIO'S MAIN INVESTMENT STRATEGY
The portfolio seeks maximum current income to the extent consistent with
stability of principal.
The portfolio pursues its goal by investing exclusively in high quality
short-term securities, as well as certain repurchase agreements that are backed
by high-quality securities.
While the portfolio's Advisor gives priority to earning income and maintaining
the value of the portfolio's principal at $1.00 per share, all money market
instruments, including US Government obligations, can change in value when
interest rates change or an issuer's creditworthiness changes.
The portfolio seeks to achieve its goal of current income by investing in high
quality money market securities and maintaining a dollar-weighted average
maturity of 90 days or less. The portfolio follows two policies designed to
maintain a stable share price:
o Portfolio securities are denominated in US dollars and generally have
remaining maturities of 397 days (about 13 months) or less at the time of
purchase. The portfolio may also invest in securities that have features
that reduce their maturities to 397 days or less at the time of purchase.
o The portfolio may not concentrate its investments in any particular industry
(excluding US Government Obligations), as that term is used in the
Investment Company Act of 1940, as amended, and as interpreted or modified
by the regulatory authority having jurisdiction from time to time, except
that the portfolio will invest more than 25% of its total assets in the
obligations of banks and other financial institutions.
o The portfolio buys US Government debt obligations, money market instruments
and other debt obligations that at the time of purchase:
- have received one of the two highest short-term ratings from two nationally
recognized statistical rating organizations (NRSROs);
- have received one of the two highest short-term ratings from one NRSRO (if
only one organization rates the security);
- are unrated, but are determined to be of similar quality by the Advisor; or
- have no short-term rating, but are rated in one of the top three highest
long-term rating categories, or are determined to be of similar quality by
the Advisor.
Although major changes tend to be infrequent, the Board of Trustees could
change the portfolio's investment objective without seeking shareholder
approval.
PRINCIPAL INVESTMENTS
The portfolio primarily invests in the following types of investments:
The portfolio may invest in high quality, short-term, US dollar denominated
money market instruments paying a fixed, variable or floating interest rate.
These include:
o Debt obligations issued by US and foreign banks, financial institutions,
corporations or other entities, including certificates of deposit, euro-time
deposits, commercial paper (including asset-backed commercial paper) and
notes. Securities that do not satisfy the maturity restrictions for a money
market portfolio may be specifically structured so that they are eligible
investments for money market portfolios. For example, some securities have
features which have the effect of shortening the security's maturity.
o US Government securities that are issued or guaranteed by the US Treasury, or
by agencies or instrumentalities of the US Government.
o Repurchase agreements, which are agreements to buy securities at one price,
with a simultaneous agreement to sell back the securities at a future date
at an agreed-upon price.
DWS VARIABLE SERIES II - CLASS A SHARES DWS MONEY MARKET
VIP 93
o Asset-backed securities, which are generally participations in a pool of
assets whose payment is derived from the payments generated by the
underlying assets. Payments on the asset-backed security generally consist
of interest and/or principal.
The portfolio may buy securities from many types of issuers, including the US
government, corporations and municipalities. The portfolio will invest at least
25% of its total assets in obligations of banks and other financial
institutions.
The portfolio may invest up to 10% of its total assets in other money market
portfolios in accordance with applicable regulations.
Working in conjunction with a credit team, the portfolio managers screen
potential securities and develop a list of those that the portfolio may buy.
The managers, looking for attractive yield and weighing considerations such as
credit quality, economic outlooks and possible interest rate movements, then
decide which securities on this list to buy. The managers may adjust the
portfolio's exposure to interest rate risk, typically seeking to take advantage
of possible rises in interest rates and to preserve yield when interest rates
appear likely to fall.
THE MAIN RISKS OF INVESTING IN THE PORTFOLIO
There are several risk factors that could hurt the portfolio's performance,
cause you to lose money or cause the portfolio's performance to trail that of
other investments.
INTEREST RATE RISK. Money market instruments, like all debt securities, face
the risk that the securities will decline in value because of changes in
interest rates. Generally, investments subject to interest rate risk will
decrease in value when interest rates rise and increase in value when interest
rates decline. To minimize such price fluctuations, the portfolio limits the
dollar-weighted average maturity of the securities held by the portfolio to 90
days or less. Generally, the price of short-term investments fluctuates less
than longer-term investments. Income earned on floating or variable rate
securities may vary as interest rates decrease or increase.
CREDIT RISK. A money market instrument's credit quality depends on the issuer's
ability to pay interest on the security and repay the debt; the lower the
credit rating, the greater the risk that the security's issuer will default, or
fail to meet its payment obligations. The credit risk of a security may also
depend on the credit quality of any bank or financial institution that provides
credit enhancement for it. To minimize credit risk, the portfolio only buys
high quality securities. Also, the portfolio only buys securities with
remaining maturities of 397 days (approximately 13 months) or less. This
reduces the risk that the issuer's creditworthiness will change, or that the
issuer will default on the principal and interest payments of the obligation.
Additionally, some securities issued by US government agencies or
instrumentalities are supported only by the credit of that agency or
instrumentality. There is no guarantee that the US government will provide
support to such agencies or instrumentalities and such securities may involve
risk of loss of principal and interest. Securities that rely on third party
guarantors to raise their credit quality could fall in price or go into default
if the financial condition of the guarantor deteriorates.
MARKET RISK. Although individual securities may outperform the market, the
entire market may decline as a result of rising interest rates, regulatory
developments or deteriorating economic conditions.
SECURITY SELECTION RISK. While the portfolio invests in short-term securities,
which by their nature are relatively stable investments, the risk remains that
the securities in which the portfolio invests will not perform as expected.
This could cause the portfolio's returns to lag behind those of similar money
market mutual funds.
REPURCHASE AGREEMENT RISK. A repurchase agreement exposes the portfolio to the
risk that the party that sells the securities may default on its obligation to
repurchase them. In this circumstance, the portfolio can lose money because:
o it cannot sell the securities at the agreed-upon time and price; or
o the securities lose value before they can be sold.
The portfolio seeks to reduce this risk by monitoring the creditworthiness of
the sellers with whom it enters into repurchase agreements. The portfolio also
monitors the value of the securities to ensure that they are at least equal to
the total amount of the repurchase obligations, including interest and accrued
interest.
94 DWS MONEY MARKET VIP DWS VARIABLE SERIES II -
CLASS A SHARES
CONCENTRATION RISK. Because the portfolio will invest more than 25% of its
total assets in the obligations of banks and other financial institutions, it
may be vulnerable to setbacks in that industry. Banks and other financial
institutions are highly dependent on short-term interest rates and can be
adversely affected by downturns in the US and foreign economies or changes in
banking regulations.
PREPAYMENT RISK. A bond issuer, such as an issuer of asset-backed securities,
may retain the right to pay off a high yielding bond before it comes due. In
that event, the portfolio may have to reinvest the proceeds at lower interest
rates. Thus, prepayment may reduce the portfolio's income. It may also create a
capital gains tax liability, because bond issuers usually pay a premium for the
right to pay off bonds early.
An investment in the portfolio is not insured or guaranteed by the FDIC or any
other government agency. Although the portfolio seeks to preserve the value of
your investment at $1.00 per share, this share price isn't guaranteed and you
could lose money by investing in the portfolio.
This portfolio may be of interest to investors who want a broadly diversified
money market fund.
PERFORMANCE - CLASS A
While a portfolio's past performance isn't necessarily a sign of how it will do
in the future, it can be valuable for an investor to know.
The bar chart shows how the returns for the portfolio's Class A shares have
varied from year to year, which may give some idea of risk. The table shows
average annual returns for the portfolio and comparable index information
(which, unlike the portfolio, does not have any fees or expenses). The
performance of both the portfolio and the comparable index information varies
over time. All figures assume reinvestment of dividends and distributions.
This information doesn't reflect charges and fees associated with the separate
account that invests in the portfolio or any variable life insurance policy or
variable annuity contract for which the portfolio is an investment option.
These charges and fees will reduce returns.
ANNUAL TOTAL RETURN (%) as of 12/31 each year - CLASS A
[BARGRAPHIC APPEARS HERE]
5.15 4.84 6.10 3.75 1.35 0.72 0.91 2.80 4.65 5.00
1998 1999 2000 2001 2002 2003 2004 2005 2006 2007
FOR THE PERIODS INCLUDED IN THE BAR CHART:
BEST QUARTER: 1.56%, Q3 2000 WORST QUARTER: 0.14%, Q3 2003
2008 TOTAL RETURN AS OF MARCH 31: 0.88%
AVERAGE ANNUAL TOTAL RETURNS (%) as of 12/31/2007
1 YEAR 5 YEARS 10 YEARS
------ ------- --------
Portfolio - Class A 5.00 2.80 3.51
7-day yield as of December 31, 2007: 4.58%
Total returns would have been lower if operating expenses hadn't been reduced.
Current performance information may be higher or lower than the performance
data quoted above. For more recent performance information, contact your
participating insurance company.
DWS VARIABLE SERIES II - CLASS A SHARES DWS MONEY MARKET
VIP 95
HOW MUCH INVESTORS PAY
This table describes the fees and expenses that you may pay if you buy and hold
portfolio shares. The information in the table does not reflect charges and
fees associated with the separate account that invests in the portfolio or any
variable life insurance policy or variable annuity contract for which the
portfolio is an investment option. These charges and fees will increase
expenses.
FEE TABLE CLASS A
--------- -------
ANNUAL OPERATING EXPENSES, deducted from portfolio assets
Management Fee1 0.29%
Distribution/Service (12b-1) Fee None
Other Expenses2 0.17
TOTAL ANNUAL OPERATING EXPENSES 0.46
Less Expense Waiver/Reimbursements 0.02
NET ANNUAL OPERATING EXPENSES3 0.44
1 Restated on an annualized basis to reflect approved fee changes taking
effect on May 1, 2008.
2 Restated on an annualized basis to reflect approved fee changes taking
effect on May 1, 2008. Includes a 0.10% administrative services fee paid
to the Advisor.
3 Through April 30, 2010, the Advisor has agreed to waive all or a portion of
its management fee and reimburse or pay certain operating expenses so that
the total annual operating expenses of the portfolio will not exceed 0.44%
for Class A shares, excluding certain expenses such as extraordinary
expenses, taxes, brokerage and interest.
Based on the costs above (including two years of capped expenses in each
period), this example helps you compare the expenses of Class A shares to those
of other mutual funds. This example assumes the expenses above remain the same.
It also assumes that you invested $10,000, earned 5% annual returns, reinvested
all dividends and distributions and sold your shares at the end of each period.
This is only an example; actual expenses will be different.
EXAMPLE 1 YEAR 3 YEARS 5 YEARS 10 YEARS
------- ------ ------- ------- --------
Class A shares $45 $143 $253 $575
THE PORTFOLIO MANAGERS
A group of investment professionals is responsible for the day-to-day
management of the portfolio. These investment professionals have a broad range
of experience managing money market portfolios.
96 DWS MONEY MARKET VIP DWS VARIABLE SERIES II -
CLASS A SHARES
FINANCIAL HIGHLIGHTS
This table is designed to help you understand the portfolio's financial
performance. The figures in the first part of the table are for a single share.
The total return figures represent the percentage that an investor in the
portfolio would have earned (or lost), assuming all dividends and distributions
were reinvested. This information has been audited by Ernst & Young LLP, an
independent registered public accounting firm, whose report, along with the
portfolio's financial statements, is included in the portfolio's annual report
(see "Shareholder reports" on the back cover). The following table includes
selected data for a share outstanding throughout each period and other
performance information derived from the financial statements.
This information doesn't reflect charges and fees associated with the separate
account that invests in the portfolio or any variable life insurance policy or
variable annuity contract for which the portfolio is an investment option.
These charges and fees will reduce returns.
DWS MONEY MARKET VIP - CLASS A
YEARS ENDED DECEMBER 31, 2007 2006 2005 2004 2003
------------------------------------------------- -------- -------- -------- -------- --------
SELECTED PER SHARE DATA
-------------------------------------------------------------------------------------------------------------
NET ASSET VALUE, BEGINNING OF PERIOD $ 1.000 $ 1.000 $ 1.000 $ 1.000 $ 1.000
------------------------------------------------- -------- -------- -------- -------- --------
Income from investment operations:
Net investment income .049 .046 .028 .009 .007
------------------------------------------------- -------- -------- -------- -------- --------
TOTAL FROM INVESTMENT OPERATIONS .049 .046 .028 .009 .007
------------------------------------------------- -------- -------- -------- -------- --------
Less distributions from:
Net investment income ( .049) ( .046) ( .028) ( .009) ( .007)
------------------------------------------------- -------- -------- -------- -------- --------
NET ASSET VALUE, END OF PERIOD $ 1.000 $ 1.000 $ 1.000 $ 1.000 $ 1.000
------------------------------------------------- -------- -------- -------- -------- --------
Total Return (%) 5.00a 4.65a 2.80 .91 .72
------------------------------------------------- -------- -------- -------- -------- --------
RATIOS TO AVERAGE NET ASSETS AND SUPPLEMENTAL DATA
-------------------------------------------------------------------------------------------------------------
Net assets, end of period ($ millions) 355 294 235 241 326
------------------------------------------------- -------- -------- -------- -------- --------
Ratio of expenses before expense reductions (%) .46 .52 .52 .53 .54
------------------------------------------------- -------- -------- -------- -------- --------
Ratio of expenses after expense reductions (%) .45 .51 .52 .53 .54
------------------------------------------------- -------- -------- -------- -------- --------
Ratio of net investment income (%) 4.88 4.58 2.77 .88 .73
------------------------------------------------- -------- -------- -------- -------- --------
a Total return would have been lower had certain expenses not been reduced.
DWS VARIABLE SERIES II - CLASS A SHARES DWS MONEY MARKET
VIP 97
HYPOTHETICAL EXPENSE SUMMARY
Using the annual portfolio operating expense ratios presented in the fee tables
in the portfolio prospectus, the Hypothetical Expense Summary shows the
estimated fees and expenses, in actual dollars, that would be charged on a
hypothetical investment of $10,000 in the portfolio held for the next 10 years
and the impact of such fees and expenses on portfolio returns for each year and
cumulatively, assuming a 5% return for each year. The tables also assume that
all dividends and distributions are reinvested. The annual portfolio expense
ratios shown are net of any contractual fee waivers or expense reimbursements,
if any, for the period of the contractual commitment. Also, please note that if
you are investing through a third party provider, that provider may have fees
and expenses separate from those of the portfolio that are not reflected here.
Mutual fund fees and expenses fluctuate over time and actual expenses may be
higher or lower than those shown.
The Hypothetical Expense Summary should not be used or construed as an offer to
sell, a solicitation of an offer to buy or a recommendation or endorsement of
any specific mutual fund. You should carefully review the portfolio's
prospectus to consider the investment objectives, risks, expenses and charges
of the portfolio prior to investing.
DWS MONEY MARKET VIP - CLASS A
INITIAL HYPOTHETICAL ASSUMED RATE
MAXIMUM INVESTMENT: OF RETURN:
SALES CHARGE: $10,000 5%
0.00% ----------------------------------- ---------------------------------
CUMULATIVE CUMULATIVE HYPOTHETICAL
RETURN BEFORE RETURN AFTER YEAR-END BALANCE ANNUAL
FEES AND ANNUAL FUND FEES AND AFTER FEES AND FEES AND
YEAR EXPENSES EXPENSE RATIOS EXPENSES EXPENSES EXPENSES
---- ------------- -------------- ------------ ---------------- ----------
1 5.00% 0.44% 4.56% $ 10,456.00 $ 45.00
2 10.25% 0.44% 9.33% $ 10,932.79 $ 47.06
3 15.76% 0.46% 14.29% $ 11,429.14 $ 51.43
4 21.55% 0.46% 19.48% $ 11,948.03 $ 53.77
5 27.63% 0.46% 24.90% $ 12,490.47 $ 56.21
6 34.01% 0.46% 30.58% $ 13,057.53 $ 58.76
7 40.71% 0.46% 36.50% $ 13,650.35 $ 61.43
8 47.75% 0.46% 42.70% $ 14,270.07 $ 64.22
9 55.13% 0.46% 49.18% $ 14,917.93 $ 67.13
10 62.89% 0.46% 55.95% $ 15,595.21 $ 70.18
TOTAL $ 575.19
98 DWS MONEY MARKET VIP DWS VARIABLE SERIES II -
CLASS A SHARES
DWS SMALL CAP GROWTH VIP
THE PORTFOLIO'S MAIN INVESTMENT STRATEGY
The portfolio seeks maximum appreciation of investors' capital.
Under normal circumstances, the portfolio invests at least 80% of net assets,
plus the amount of any borrowings for investment purposes, in small
capitalization stocks similar in size to those comprising the Russell 2000
(Reg. TM) Growth Index (as of February 29, 2008, the Russell 2000 (Reg. TM)
Growth Index had a median market capitalization of $538 million). The portfolio
intends to invest primarily in companies whose market capitalizations fall
within the normal range of the Index. The portfolio may invest in initial
public offerings.
The portfolio invests primarily in equity securities of US smaller
capitalization companies. Portfolio management focuses on individual security
selection rather than industry selection. Portfolio management uses an active
process which combines financial analysis with company visits to evaluate
management and strategies.
Company research lies at the heart of our investment process. Portfolio
management uses a "bottom-up" approach to picking securities.
o Portfolio management focuses on stocks with superior growth prospects and
above average near-to-intermediate term performance potential.
o Portfolio management emphasizes individual selection of small company stocks
across all economic sectors, early in their growth cycles and with the
potential to be the blue chips of the future.
o Portfolio management generally seeks companies with a leading or dominant
position in their niche markets, a high rate of return on invested capital
and the ability to finance a major part of future growth from internal
sources.
Portfolio management looks primarily for financial attributes that set these
companies apart:
o estimated above-average growth in revenues and earnings; and
o a balance sheet that can support this growth potential with sufficient
working capital and manageable levels of debt.
The portfolio follows a disciplined selling process in order to lessen risk. A
security may be sold if one or more of the following conditions are met:
o the stock price reaches portfolio management's expectations;
o there is a material change in the company's fundamentals;
o portfolio management believes other investments offer better opportunities;
or
o the market capitalization of a stock distorts the weighted average market
capitalization of the portfolio.
SECURITIES LENDING. The portfolio may lend its investment securities in an
amount up to 33 1/3% of its total assets to approved institutional borrowers
who need to borrow securities in order to complete certain transactions.
Although major changes tend to be infrequent, the Board of Trustees could
change the portfolio's investment objective without seeking shareholder
approval. However, the Board will provide shareholders with at least 60 days'
notice prior to making any changes to the portfolio's 80% investment policy.
OTHER INVESTMENTS
While the portfolio invests mainly in US stocks, it could invest up to 25% of
total assets in foreign securities.
The portfolio is permitted, but not required, to use various types of
derivatives (contracts whose value is based on, for example, indices,
currencies or securities). Derivatives may be used for hedging and for risk
management or for non-hedging purposes to seek to enhance potential gains. The
portfolio may use derivatives in circumstances where portfolio management
believes they offer an economical means of gaining exposure to a particular
asset class or to keep cash on hand to meet shareholder redemptions or other
needs while maintaining exposure to the market.
DWS VARIABLE SERIES II - CLASS A SHARES DWS SMALL CAP GROWTH
VIP 99
In particular, the portfolio may use futures, options and covered call options.
As a temporary defensive measure, the portfolio could shift up to 100% of
assets into investments such as money market securities. This measure could
prevent losses, but, while engaged in a temporary defensive position, the
portfolio will not be pursuing its investment objective. However, the portfolio
manager may choose not to use these strategies for various reasons, even in
very volatile market conditions.
THE MAIN RISKS OF INVESTING IN THE PORTFOLIO
There are several risk factors that could hurt the portfolio's performance,
cause you to lose money or cause the portfolio's performance to trail that of
other investments.
STOCK MARKET RISK. The portfolio is affected by how the stock market performs.
To the extent the portfolio invests in a particular market sector, the
portfolio's performance may be proportionately affected by that segment's
general performance. When stock prices fall, you should expect the value of
your investment to fall as well. Because a stock represents ownership in its
issuer, stock prices can be hurt by poor management, shrinking product demand
and other business risks. These may affect single companies as well as groups
of companies. In addition, movements in financial markets may adversely affect
a stock's price, regardless of how well the company performs. The market as a
whole may not favor the types of investments the portfolio makes and the
portfolio may not be able to get an attractive price for them.
GROWTH INVESTING RISK. Since growth stocks usually reinvest a large portion of
earnings in their own businesses, they may lack the dividends associated with
value stocks that might otherwise cushion their decline in a falling market.
Earnings disappointments in growth stocks often result in sharp price declines
because investors buy these stocks for their potential superior earnings
growth. Growth stocks may also be out of favor for certain periods in relation
to value stocks.
SMALL COMPANY CAPITALIZATION RISK. Small company stocks tend to experience
steeper price fluctuations than the stocks of larger companies. A shortage of
reliable information can also pose added risk to small company stocks.
Industry-wide reversals may have a greater impact on small companies, since
they lack the financial resources of large companies. Small company stocks are
typically less liquid than large company stocks. Accordingly, it may be harder
to find buyers for small company shares.
INDUSTRY RISK. While the portfolio does not concentrate in any industry, to the
extent that the portfolio has exposure to a given industry or sector, any
factors affecting that industry or sector could affect the value of portfolio
securities. For example, manufacturers of consumer goods could be hurt by a
rise in unemployment or technology companies could be hurt by such factors as
market saturation, price competition and rapid obsolescence.
IPO RISK. Securities purchased in initial public offerings (IPOs) may be very
volatile, due to their stock prices rising and falling rapidly, often based,
among other reasons, on investor perceptions rather than economic reasons.
Additionally, investments in IPOs may magnify the portfolio's performance if it
has a small asset base. The portfolio is less likely to experience a similar
impact on its performance as its assets grow because it is unlikely that the
portfolio will obtain proportionately larger IPO allocations.
DERIVATIVES RISK. Risks associated with derivatives include the risk that the
derivative is not well correlated with the security, index or currency to which
it relates; the risk that derivatives may result in losses or missed
opportunities; the risk that the portfolio will be unable to sell the
derivative because of an illiquid secondary market; the risk that a
counterparty is unwilling or unable to meet its obligation and the risk that
the derivative transaction could expose the portfolio to the effects of
leverage, which could increase the portfolio's exposure to the market and
magnify potential losses. There is no guarantee that derivatives, to the extent
employed, will have the intended effect, and their use could cause lower
returns or even losses to the portfolio. The use of derivatives by the
portfolio to hedge risk may reduce the opportunity for gain by offsetting the
positive effect of favorable price movements.
SECURITIES LENDING RISK. Any loss in the market price of securities loaned by
the portfolio that occurs during the term of the loan would be borne by the
portfolio and would adversely affect the portfolio's performance. Also, there
may be delays in recovery of securities loaned or even a loss of rights in the
collateral should the
100 DWS SMALL CAP GROWTH VIP DWS VARIABLE SERIES II -
CLASS A SHARES
borrower of the securities fail financially while the loan is outstanding.
However, loans will be made only to borrowers selected by the portfolio's
delegate after a review of relevant facts and circumstances, including the
creditworthiness of the borrower.
PRICING RISK. At times, market conditions may make it difficult to value some
investments, and the portfolio may use certain valuation methodologies for some
of its investments, such as fair value pricing. Given the subjective nature of
such valuation methodologies, it is possible that the value determined for an
investment may be different than the value realized upon such investment's
sale. If the portfolio has valued its securities too highly, you may pay too
much for portfolio shares when you buy into the portfolio. If the portfolio has
underestimated the price of its securities, you may not receive the full market
value when you sell your portfolio shares.
SECURITY SELECTION RISK. A risk that pervades all investing is the risk that
the securities in the portfolio's portfolio may decline in value.
Other factors that could affect performance include:
o portfolio management could be wrong in the analysis of industries, companies,
economic trends, the relative attractiveness of different securities or
other matters.
o foreign securities may be more volatile than their US counterparts, for
reasons such as currency fluctuations and political and economic
uncertainty.
Investors who are looking to add the growth potential of small and mid-size
companies or to diversify a large-cap growth portfolio may want to consider
this portfolio.
PERFORMANCE - CLASS A
While a portfolio's past performance isn't necessarily a sign of how it will do
in the future, it can be valuable for an investor to know.
The bar chart shows how the returns for the portfolio's Class A shares have
varied from year to year, which may give some idea of risk. The table shows
average annual returns for the portfolio and comparable index information
(which, unlike the portfolio, does not have any fees or expenses). The
performance of both the portfolio and the comparable index information varies
over time. All figures assume reinvestment of dividends and distributions.
This information doesn't reflect charges and fees associated with the separate
account that invests in the portfolio or any variable life insurance policy or
variable annuity contract for which the portfolio is an investment option.
These charges and fees will reduce returns.
ANNUAL TOTAL RETURN (%) as of 12/31 each year - CLASS A
[BARGRAPHIC APPEARS HERE]
18.37 34.56 -10.71 -28.91 -33.36 32.94 11.02 7.07 5.27 6.20
1998 1999 2000 2001 2002 2003 2004 2005 2006 2007
FOR THE PERIODS INCLUDED IN THE BAR CHART:
BEST QUARTER: 30.96%, Q4 1999 WORST QUARTER: -31.72%, Q3 2001
2008 TOTAL RETURN AS OF MARCH 31: -17.12%
DWS VARIABLE SERIES II - CLASS A SHARES DWS SMALL CAP GROWTH
VIP 101
AVERAGE ANNUAL TOTAL RETURNS (%) as of 12/31/2007
1 YEAR 5 YEARS 10 YEARS
------ ------- --------
Portfolio - Class A 6.20 12.06 1.76
Russell 2000 Growth Index 7.05 16.50 4.32
Total returns would have been lower if operating expenses hadn't been reduced.
RUSSELL 2000 (Reg. TM) GROWTH INDEX is an unmanaged capitalization-weighted
measure of 2,000 of the smallest capitalized US companies with a
greater-than-average growth orientation and whose common stocks trade on the
NYSE, AMEX and Nasdaq.
Current performance information may be higher or lower than the performance
data quoted above. For more recent performance information, contact your
participating insurance company.
HOW MUCH INVESTORS PAY
This table describes the fees and expenses that you may pay if you buy and hold
portfolio shares. The information in the table does not reflect charges and
fees associated with the separate account that invests in the portfolio or any
variable life insurance policy or variable annuity contract for which the
portfolio is an investment option. These charges and fees will increase
expenses.
FEE TABLE CLASS A
--------- -------
ANNUAL OPERATING EXPENSES, deducted from portfolio assets
Management Fee1 0.55%
Distribution/Service (12b-1) Fee None
Other Expenses2 0.20
TOTAL ANNUAL OPERATING EXPENSES 0.75
1 Restated on an annualized basis to reflect approved fee changes taking
effect on May 1, 2008.
2 Restated on an annualized basis to reflect approved fee changes taking
effect on May 1, 2008. Includes a 0.10% administrative services fee paid
to the Advisor.
Based on the costs above, this example helps you compare the expenses of Class
A shares to those of other mutual funds. This example assumes the expenses
above remain the same. It also assumes that you invested $10,000, earned 5%
annual returns, reinvested all dividends and distributions and sold your shares
at the end of each period. This is only an example; actual expenses will be
different.
EXAMPLE 1 YEAR 3 YEARS 5 YEARS 10 YEARS
------- ------ ------- ------- --------
Class A shares $77 $240 $417 $930
102 DWS SMALL CAP GROWTH VIP DWS VARIABLE SERIES II -
CLASS A SHARES
THE PORTFOLIO MANAGERS
The portfolio is managed by a team of investment professionals who collaborate
to implement the portfolio's investment strategy. The team is led by a lead
portfolio manager who is responsible for developing the portfolio's investment
strategy. Each portfolio manager on the team has authority over all aspects of
the portfolio's investment portfolio, including but not limited to, purchases
and sales of individual securities, portfolio construction techniques,
portfolio risk assessment and the management of daily cash flows in accordance
with portfolio holdings.
The following people handle the day-to-day management of the portfolio:
Robert S. Janis
Managing Director of Deutsche Asset Management and Lead Portfolio Manager of
the portfolio.
o Joined Deutsche Asset Management and the portfolio in 2004.
o Previously served as portfolio manager for 10 years at Credit Suisse
Asset Management (or at its predecessor, Warburg Pincus Asset Management).
o Over 20 years of investment industry experience.
o BA, University of Pennsylvania; MBA, University of Pennsylvania, Wharton
School.
Joseph Axtell, CFA
Managing Director of Deutsche Asset Management and Portfolio Manager of the
portfolio.
o Joined Deutsche Asset Management in 2001 and the portfolio in 2006.
o Senior analyst at Merrill Lynch Investment Managers for the international
equity portion of a global balanced portfolio (1996-2001).
o Director, International Research at PCM International (1989-1996).
o Associate manager, structured debt and equity group at Prudential Capital
Corporation (1988-1989).
o Analyst at Prudential-Bache Capital Funding in London (1987-1988).
o Equity analyst in the health care sector at Prudential Equity Management
Associates (1985-1987).
o BS, Carlson School of Management, University of Minnesota.
The portfolio's Statement of Additional Information provides additional
information about a portfolio manager's investments in the portfolio, a
description of the portfolio management compensation structure, and information
regarding other accounts managed.
DWS VARIABLE SERIES II - CLASS A SHARES DWS SMALL CAP GROWTH
VIP 103
FINANCIAL HIGHLIGHTS
This table is designed to help you understand the portfolio's financial
performance. The figures in the first part of the table are for a single share.
The total return figures represent the percentage that an investor in the
portfolio would have earned (or lost), assuming all dividends and distributions
were reinvested. This information has been audited by Ernst & Young LLP, an
independent registered public accounting firm, whose report, along with the
portfolio's financial statements, is included in the portfolio's annual report
(see "Shareholder reports" on the back cover). The following table includes
selected data for a share outstanding throughout each period and other
performance information derived from the financial statements.
This information doesn't reflect charges and fees associated with the separate
account that invests in the portfolio or any variable life insurance policy or
variable annuity contract for which the portfolio is an investment option.
These charges and fees will reduce returns.
DWS SMALL CAP GROWTH VIP - CLASS A
YEARS ENDED DECEMBER 31, 2007 2006 2005 2004 2003
------------------------------------------------- -------- ------- -------- -------- -------
SELECTED PER SHARE DATA
--------------------------------------------------------------------------------------------------------------
NET ASSET VALUE, BEGINNING OF PERIOD $ 14.19 $ 13.48 $ 12.59 $ 11.34 $ 8.53
------------------------------------------------- -------- ------- -------- -------- -------
Income (loss) from investment operations:
Net investment income (loss)a ( .01) ( .04)d ( .06) ( .05) ( .04)
------------------------------------------------- -------- ------- -------- -------- -------
Net realized and unrealized gain (loss) .89 .75 .95 1.30 2.85
------------------------------------------------- -------- ------- -------- -------- -------
TOTAL FROM INVESTMENT OPERATIONS .88 .71 .89 1.25 2.81
------------------------------------------------- -------- ------- -------- -------- -------
NET ASSET VALUE, END OF PERIOD $ 15.07 $ 14.19 $ 13.48 $ 12.59 $ 11.34
------------------------------------------------- -------- ------- -------- -------- -------
Total Return (%) 6.20b 5.27b,d 7.07c 11.02 32.94
------------------------------------------------- -------- ------- -------- -------- -------
RATIOS TO AVERAGE NET ASSETS AND SUPPLEMENTAL DATA
--------------------------------------------------------------------------------------------------------------
Net assets, end of period ($ millions) 174 208 243 210 210
------------------------------------------------- -------- ------- -------- -------- -------
Ratio of expenses before expense reductions (%) .75 .73 .72 .71 .69
------------------------------------------------- -------- ------- -------- -------- -------
Ratio of expenses after expense reductions (%) .72 .72 .72 .71 .69
------------------------------------------------- -------- ------- -------- -------- -------
Ratio of net investment income (loss) (%) ( .09) ( .32)d ( .47) ( .47) ( .41)
------------------------------------------------- -------- ------- -------- -------- -------
Portfolio turnover rate (%) 67 73 94 117 123
------------------------------------------------- -------- -------- -------- -------- -------
a Based on average shares outstanding during the period.
b Total return would have been lower had certain expenses been reduced.
c In 2005, the Portfolio realized a gain of $49,496 on the disposal of an
investment not meeting the Portfolio's investment restrictions. This had
no negative impact on the total return.
d Includes non-recurring income from the Advisor recorded as a result of an
administrative proceeding regarding disclosure of brokerage allocation
practices in connection with sales of DWS Scudder Funds. The non-recurring
income resulted in an increase in net investment income of $0.008 per
share and an increase in the ratio of net investment income of 0.06%.
Excluding this non-recurring income, total return would have been 0.06%
lower.
104 DWS SMALL CAP GROWTH VIP DWS VARIABLE SERIES II -
CLASS A SHARES
HYPOTHETICAL EXPENSE SUMMARY
Using the annual portfolio operating expense ratios presented in the fee tables
in the portfolio prospectus, the Hypothetical Expense Summary shows the
estimated fees and expenses, in actual dollars, that would be charged on a
hypothetical investment of $10,000 in the portfolio held for the next 10 years
and the impact of such fees and expenses on portfolio returns for each year and
cumulatively, assuming a 5% return for each year. The tables also assume that
all dividends and distributions are reinvested. The annual portfolio expense
ratios shown are net of any contractual fee waivers or expense reimbursements,
if any, for the period of the contractual commitment. Also, please note that if
you are investing through a third party provider, that provider may have fees
and expenses separate from those of the portfolio that are not reflected here.
Mutual fund fees and expenses fluctuate over time and actual expenses may be
higher or lower than those shown.
The Hypothetical Expense Summary should not be used or construed as an offer to
sell, a solicitation of an offer to buy or a recommendation or endorsement of
any specific mutual fund. You should carefully review the portfolio's
prospectus to consider the investment objectives, risks, expenses and charges
of the portfolio prior to investing.
DWS SMALL CAP GROWTH VIP - CLASS A
INITIAL HYPOTHETICAL ASSUMED RATE
MAXIMUM INVESTMENT: OF RETURN:
SALES CHARGE: $10,000 5%
0.00% ---------------------------------- ---------------------------------
CUMULATIVE CUMULATIVE HYPOTHETICAL
RETURN BEFORE RETURN AFTER YEAR-END BALANCE ANNUAL
FEES AND ANNUAL FUND FEES AND AFTER FEES AND FEES AND
YEAR EXPENSES EXPENSE RATIOS EXPENSES EXPENSES EXPENSES
---- ------------- -------------- ------------ ----------------- ---------
1 5.00% 0.75% 4.25% $ 10,425.00 $ 76.59
2 10.25% 0.75% 8.68% $ 10,868.06 $ 79.85
3 15.76% 0.75% 13.30% $ 11,329.96 $ 83.24
4 21.55% 0.75% 18.11% $ 11,811.48 $ 86.78
5 27.63% 0.75% 23.13% $ 12,313.47 $ 90.47
6 34.01% 0.75% 28.37% $ 12,836.79 $ 94.31
7 40.71% 0.75% 33.82% $ 13,382.35 $ 98.32
8 47.75% 0.75% 39.51% $ 13,951.10 $ 102.50
9 55.13% 0.75% 45.44% $ 14,544.02 $ 106.86
10 62.89% 0.75% 51.62% $ 15,162.14 $ 111.40
TOTAL $ 930.32
DWS VARIABLE SERIES II - CLASS A SHARES DWS SMALL CAP GROWTH
VIP 105
DWS STRATEGIC INCOME VIP
THE PORTFOLIO'S MAIN INVESTMENT STRATEGY
The portfolio seeks a high current return.
The portfolio invests mainly in bonds issued by US and foreign corporations and
governments. The credit quality of the portfolio's investments may vary; the
portfolio may invest up to 100% of total assets in either investment-grade
bonds (i.e., grade BBB/Baa or above) or in junk bonds, which are those below
the fourth highest credit rating category (i.e., below grade BBB/Baa). Compared
to investment-grade bonds, junk bonds may pay higher yields and have higher
volatility and higher risk of default on payments of interest or principal. The
portfolio may invest up to 50% of total assets in foreign bonds. The portfolio
may also invest in emerging markets securities and dividend-paying common
stocks.
In deciding which types of securities to buy and sell, the portfolio managers
typically weigh a number of factors against each other, from economic outlooks
and possible interest rate movements to changes in supply and demand within the
bond market. In choosing individual bonds, the managers consider how they are
structured and use independent analysis of issuers' creditworthiness.
The managers may adjust the duration (a measure of sensitivity to interest
rates) of the portfolio, depending on their outlook for interest rates.
iGAP STRATEGY. In addition to the portfolio's main investment strategy, the
Advisor seeks to enhance returns by employing a global tactical asset
allocation overlay strategy. This strategy, which the Advisor calls iGAP
(integrated Global Alpha Platform), attempts to take advantage of short-term
and medium-term mispricings within global bond and currency markets. The iGAP
strategy is implemented through the use of derivatives, which are contracts or
other instruments whose value is based on, for example, indices, currencies or
securities. The iGAP strategy primarily uses exchange-traded futures contracts
on global bonds and currencies indexes and over-the-counter forward currency
contracts, and is expected to have a low correlation to the portfolio's other
securities holdings. Because the iGAP strategy relies primarily on futures,
forward currency contracts and other derivative instruments, the aggregate
notional market exposure obtained from such investments within the iGAP
strategy may range up to 100% of the net assets of the portfolio (assuming the
maximum allocation to the iGAP strategy).
SECURITIES LENDING. The portfolio may lend its investment securities in an
amount up to 33 1/3% of its total assets to approved institutional borrowers
who need to borrow securities in order to complete certain transactions.
Although major changes tend to be infrequent, the Board of Trustees could
change the portfolio's investment objective without seeking shareholder
approval.
OTHER INVESTMENTS. The portfolio may invest in affiliated mutual funds. The
portfolio may invest up to 5% of net assets in shares of DWS Floating Rate Plus
Fund, which invests primarily in adjustable rate loans that have a senior right
to payment ("Senior Loans"). By investing in DWS Floating Rate Plus Fund, the
portfolio may achieve greater diversification within the Senior Loan asset
class (through indirect exposure to more Senior Loan securities of varying
sizes and risks) than it could gain buying Senior Loan securities directly.
In addition to derivatives utilized within the iGAP strategy, the portfolio
managers may, but are not required to, also use various types of derivatives.
Derivatives may be used for hedging and for risk management or for non-hedging
purposes to enhance potential gains. The portfolio may use derivatives in
circumstances where portfolio managers believe they offer a more efficient or
economical means of gaining exposure to a particular asset class or market or
to maintain a high level of liquidity to meet shareholder redemptions or other
needs while maintaining exposure to the market. In particular, the portfolio
managers may use futures, options, forward currency transactions and swaps.
As a temporary defensive measure, the portfolio could shift up to 100% of
assets into investments such as money market securities. This measure could
prevent losses, but, while engaged in a temporary defensive position, the
portfolio will not be pursuing its investment objective. However, the portfolio
managers may choose not to use these strategies for various reasons, even in
very volatile market conditions.
106 DWS STRATEGIC INCOME VIP DWS VARIABLE SERIES II -
CLASS A SHARES
THE MAIN RISKS OF INVESTING IN THE PORTFOLIO
There are several risk factors that could hurt the portfolio's performance,
cause you to lose money or cause the portfolio's performance to trail that of
other investments.
INTEREST RATE RISK. Generally, fixed-income securities will decrease in value
when nominal interest rates rise and increase in value when nominal interest
rates decline. A nominal interest rate can be described as the sum of a real
interest rate and an expected inflation rate. Inflation-indexed bonds decline
in value when real interest rates rise. In certain interest rate environments,
such as when real interest rates are rising faster than nominal interest rates,
inflation-indexed bonds may experience greater losses than other fixed-income
securities with similar durations. The longer the effective maturity of the
portfolio's securities, the more sensitive the portfolio will be to interest
rate changes. (As a general rule, a 1% rise in interest rates means a 1% fall
in value for every year of duration.)
CREDIT RISK. A portfolio purchasing bonds faces the risk that the
creditworthiness of an issuer may decline, causing the value of the bonds to
decline. In addition, an issuer may not be able to make timely payments on the
interest and/or principal on the bonds it has issued. Because the issuers of
high-yield bonds or junk bonds (bonds rated below the fourth highest category)
may be in uncertain financial health, the prices of these bonds may be more
vulnerable to bad economic news or even the expectation of bad news, than
investment-grade bonds. In some cases, bonds, particularly high-yield bonds,
may decline in credit quality or go into default. Because the portfolio may
invest in securities not paying current interest or in securities already in
default, these risks may be more pronounced.
MARKET RISK. Deteriorating market conditions might cause a general weakness in
the market that reduces the prices of securities in that market. Developments
in a particular class of bonds or the stock market could also adversely affect
the portfolio by reducing the relative attractiveness of bonds as an
investment. Also, to the extent that the portfolio emphasizes bonds from any
given industry, it could be hurt if that industry does not do well.
FOREIGN INVESTMENT RISK. Foreign investments involve certain special risks,
including:
o POLITICAL RISK. Some foreign governments have limited the outflow of profits
to investors abroad, imposed restrictions on the exchange or export of
foreign currency, extended diplomatic disputes to include trade and
financial relations, seized foreign investment and imposed higher taxes.
o INFORMATION RISK. Companies based in foreign markets are usually not subject
to accounting, auditing and financial reporting standards and practices as
stringent as those in the US. Therefore, their financial reports may present
an incomplete, untimely or misleading picture of a company, as compared to
the financial reports required in the US.
o LIQUIDITY RISK. Investments that trade less can be more difficult or more
costly to buy, or to sell, than more liquid or active investments. This
liquidity risk is a factor of the trading volume of a particular investment,
as well as the size and liquidity of the entire local market. On the whole,
foreign exchanges are smaller and less liquid than US exchanges. This can
make buying and selling certain investments more difficult and costly.
Relatively small transactions in some instances can have a
disproportionately large effect on the price and supply of securities. In
certain situations, it may become virtually impossible to sell an investment
in an orderly fashion at a price that approaches portfolio management's
estimate of its value. For the same reason, it may at times be difficult to
value the portfolio's foreign investments.
o REGULATORY RISK. There is generally less government regulation of foreign
markets, companies and securities dealers than in the US.
o CURRENCY RISK. The portfolio invests in securities denominated in foreign
currencies. Changes in exchange rates between foreign currencies and the US
dollar may affect the US dollar value of foreign securities or the income or
gain received on these securities.
o LIMITED LEGAL RECOURSE RISK. Legal remedies for investors may be more limited
than the legal remedies available in the US.
o TRADING PRACTICE RISK. Brokerage commissions and other fees are generally
higher for foreign investments than for US investments. The procedures and
rules governing foreign transactions and custody may also involve delays in
payment, delivery or recovery of money or investments.
DWS VARIABLE SERIES II - CLASS A SHARES DWS STRATEGIC INCOME
VIP 107
o TAXES. Foreign withholding and certain other taxes may reduce the amount of
income available to distribute to shareholders of the portfolio. In
addition, special US tax considerations may apply to the portfolio's foreign
investments.
EMERGING MARKET RISK. All of the risks of investing in foreign securities are
increased in connection with investments in emerging markets securities. In
addition, profound social changes and business practices that depart from norms
in developed countries' economies have hindered the orderly growth of emerging
economies and their markets in the past and have caused instability. High
levels of debt tend to make emerging economies heavily reliant on foreign
capital and vulnerable to capital flight. Countries in emerging markets are
also more likely to experience high levels of inflation, deflation or currency
devaluation, which could also hurt their economies and securities markets. For
these and other reasons, investments in emerging markets are often considered
speculative.
PRICING RISK. At times, market conditions may make it difficult to value some
investments, and the portfolio may use certain valuation methodologies for some
of its investments, such as fair value pricing. Given the subjective nature of
such valuation methodologies, it is possible that the value determined for an
investment may be different than the value realized upon such investment's
sale. If the portfolio has valued its securities too highly, you may pay too
much for portfolio shares when you buy into the portfolio. If the portfolio has
underestimated the price of its securities, you may not receive the full market
value when you sell your portfolio shares.
DERIVATIVES RISK. Risks associated with derivatives include the risk that the
derivative is not well correlated with the security, index or currency to which
it relates; the risk that derivatives may result in losses or missed
opportunities; the risk that the portfolio will be unable to sell the
derivative because of an illiquid secondary market; the risk that a
counterparty is unwilling or unable to meet its obligation and the risk that
the derivative transaction could expose the portfolio to the effects of
leverage, which could increase the portfolio's exposure to the market and
magnify potential losses. There is no guarantee that derivatives, to the extent
employed, will have the intended effect, and their use could cause lower
returns or even losses to the portfolio. The use of derivatives by the
portfolio to hedge risk may reduce the opportunity for gain by offsetting the
positive effect of favorable price movements.
iGAP RISK. The success of the iGAP strategy depends, in part, on the Advisor's
ability to analyze the correlation between various global markets and asset
classes. If the Advisor's correlation analysis proves to be incorrect, losses
to the fund may be significant and may exceed the intended level of market
exposure for the iGAP strategy.
SECURITIES LENDING RISK. Any loss in the market price of securities loaned by
the portfolio that occurs during the term of the loan would be borne by the
portfolio and would adversely affect the portfolio's performance. Also, there
may be delays in recovery of securities loaned or even a loss of rights in the
collateral should the borrower of the securities fail financially while the
loan is outstanding. However, loans will be made only to borrowers selected by
the portfolio's delegate after a review of relevant facts and circumstances,
including the creditworthiness of the borrower.
SECURITY SELECTION RISK. A risk that pervades all investing is the risk that
the securities in the portfolio's portfolio may decline in value.
Another factor that could affect performance is:
o portfolio management could be wrong in the analysis of industries, companies,
economic trends, the relative attractiveness of different securities or
other matters.
This portfolio is designed for investors who are interested in a bond portfolio
that emphasizes different types of bonds depending on market and economic
outlooks.
PERFORMANCE - CLASS A
While a portfolio's past performance isn't necessarily a sign of how it will do
in the future, it can be valuable for an investor to know.
108 DWS STRATEGIC INCOME VIP DWS VARIABLE SERIES II -
CLASS A SHARES
The bar chart shows how the returns for the portfolio's Class A shares have
varied from year to year, which may give some idea of risk. The table shows
average annual returns for the portfolio and comparable index information
(which, unlike the portfolio, does not have any fees or expenses). The
performance of both the portfolio and the comparable index information varies
over time. All figures assume reinvestment of dividends and distributions.
This information doesn't reflect charges and fees associated with the separate
account that invests in the portfolio or any variable life insurance policy or
variable annuity contract for which the portfolio is an investment option.
These charges and fees will reduce returns.
Prior to May 1, 2000, the portfolio was named Kemper Global Income Portfolio
and operated with a different goal and investment strategy. Performance would
have been different if the portfolio's current policies were in effect.
ANNUAL TOTAL RETURN (%) as of 12/31 each year - CLASS A
[BARGRAPHIC APPEARS HERE]
10.98 -5.85 2.57 5.23 11.30 7.85 8.60 2.38 8.98 5.43
1998 1999 2000 2001 2002 2003 2004 2005 2006 2007
FOR THE PERIODS INCLUDED IN THE BAR CHART:
BEST QUARTER: 6.35%, Q3 1998 WORST QUARTER: -3.33%, Q2 1999
2008 TOTAL RETURN AS OF MARCH 31: 0.64%
AVERAGE ANNUAL TOTAL RETURNS (%) as of 12/31/2007
1 YEAR 5 YEARS 10 YEARS
------ ------- --------
Portfolio - Class A 5.43 6.62 5.63
Citigroup World Government Bond
Index 10.95 6.81 6.31
JP Morgan Emerging Markets Bond
Index Plus 6.45 13.63 10.36
Merrill Lynch High Yield Master
Cash Pay Only Index 2.17 10.57 5.80
Lehman Brothers US Treasury Index 9.01 4.10 5.91
Total returns would have been lower if operating expenses hadn't been reduced.
CITIGROUP WORLD GOVERNMENT BOND INDEX is an unmanaged index that consists of
worldwide fixed-rate government bonds with remaining maturities greater than
one year.
J.P. MORGAN EMERGING MARKETS BOND INDEX PLUS (EMBI+) is an unmanaged index that
tracks total returns for emerging market debt instruments that trade outside
the country of issue.
MERRILL LYNCH HIGH YIELD MASTER CASH PAY ONLY INDEX is an unmanaged index which
tracks the performance of below investment grade US dollar-denominated
corporate bonds publicly issued in the US domestic market.
LEHMAN BROTHERS US TREASURY INDEX is an unmanaged index reflecting the
performance of all public obligations and does not focus on one particular
segment of the Treasury market.
Current performance information may be higher or lower than the performance
data quoted above. For more recent performance information, contact your
participating insurance company.
DWS VARIABLE SERIES II - CLASS A SHARES DWS STRATEGIC INCOME
VIP 109
HOW MUCH INVESTORS PAY
This table describes the fees and expenses that you may pay if you buy and hold
portfolio shares. The information in the table does not reflect charges and
fees associated with the separate account that invests in the portfolio or any
variable life insurance policy or variable annuity contract for which the
portfolio is an investment option. These charges and fees will increase
expenses.
FEE TABLE CLASS A
--------- -------
ANNUAL OPERATING EXPENSES, deducted from portfolio assets
Management Fee1, 2 0.55%
Distribution/Service (12b-1) Fee None
Other Expenses3 0.29
Acquired Funds (Underlying Funds) Fees and Expenses4 0.05
TOTAL ANNUAL OPERATING EXPENSES5 0.89
1 To the extent the portfolio invests in other mutual funds advised by the
Advisor and its affiliates ("affiliated mutual funds"), the Advisor has
agreed to waive its management fee by an amount equal to the amount of
management fees borne by the portfolio as a shareholder of such other
affiliated mutual funds. In the case of an investment in DWS Floating Rate
Plus Fund, the Advisor has also agreed to apply a management fee credit to
the portfolio equal to the difference between DWS Floating Rate Plus
Fund's management fee and the portfolio's management fee, if positive, as
applied to the amount of assets invested by the portfolio in DWS Floating
Rate Plus Fund.
2 Restated on an annualized basis to reflect approved fee changes taking
effect on May 1, 2008.
3 Restated on an annualized basis to reflect approved fee changes taking
effect on May 1, 2008. Includes a 0.10% administrative services fee paid
to the Advisor.
4 In addition to the Total Annual Operating Expenses which the portfolio
bears directly, the portfolio's shareholders indirectly bear the expenses
of the underlying funds in which the portfolio invests. The portfolio's
estimated indirect expenses from investing in the underlying funds, based
on its expected allocations and underlying funds, is as shown in the
table. An underlying fund's expense ratio reflects contractual expense
limitations and/or reimbursements where applicable.
5 Through September 30, 2008, the Advisor has contractually agreed to waive
all or a portion of its management fee and reimburse or pay certain
operating expenses so that the total annual operating expenses of the
portfolio will not exceed 0.83% for Class A shares, excluding certain
expenses such as extraordinary expenses, taxes, brokerage, interest, and
indirect expenses of underlying DWS funds. Although there can be no
assurance that the current waiver/expense reimbursement arrangement will
be maintained beyond September 30, 2008, the Advisor has committed to
review the continuance of waiver/expense reimbursement arrangements by
September 30, 2008.
Based on the costs above, this example helps you compare the expenses of Class
A shares to those of other mutual funds. This example assumes the expenses
above remain the same. It also assumes that you invested $10,000, earned 5%
annual returns, reinvested all dividends and distributions and sold your shares
at the end of each period. This is only an example; actual expenses will be
different.
EXAMPLE 1 YEAR 3 YEARS 5 YEARS 10 YEARS
------- ------ ------- ------- --------
Class A shares $91 $284 $493 $1,096
110 DWS STRATEGIC INCOME VIP DWS VARIABLE SERIES II -
CLASS A SHARES
THE PORTFOLIO MANAGERS
The portfolio is managed by a team of investment professionals who collaborate
to implement the portfolio's investment strategy. Each portfolio manager on the
team has authority over all aspects of the portfolio's investment portfolio for
their investment strategy, including but not limited to, purchases and sales of
individual securities, portfolio construction techniques, portfolio risk
assessment and the management of daily cash flows in accordance with portfolio
holdings.
The following people handle the day-to-day management of the portfolio:
Gary Sullivan, CFA
Managing Director of Deutsche Asset Management and Portfolio Manager of the
portfolio.
o Joined Deutsche Asset Management in 1996 and the portfolio in 2006.
Served as head of the High Yield group in Europe and as an Emerging
Markets portfolio manager.
o Prior to that, four years at Citicorp as a research analyst and
structurer of collateralized mortgage obligations. Prior to Citicorp,
served as an officer in the US Army from 1988 to 1991.
o BS, United States Military Academy (West Point); MBA, New York
University, Stern School of Business.
William Chepolis, CFA
Managing Director of Deutsche Asset Management and Portfolio Manager of the
portfolio.
o Joined Deutsche Asset Management in 1998 after 13 years of experience as
vice president and portfolio manager for Norwest Bank, where he managed
the bank's fixed income and foreign exchange portfolios.
o Portfolio Manager for Retail Mortgage Backed Securities: New York.
o Joined the portfolio in 2002.
o BIS, University of Minnesota.
Robert Wang
Managing Director of Deutsche Asset Management and Portfolio Manager of the
portfolio.
o Joined Deutsche Asset Management in 1995 as portfolio manager for asset
allocation after 13 years of experience of trading fixed income, foreign
exchange and derivative products at J.P. Morgan.
o Global Head of Quantitative Strategies Portfolio Management: New York.
o Joined the portfolio in 2007.
o BS, The Wharton School, University of Pennsylvania.
Matthew F. MacDonald
Director of Deutsche Asset Management and Portfolio Manager of the portfolio.
o Joined Deutsche Asset Management and the portfolio in 2006 after 14 years
of fixed income experience at Bank of America Global Structured Products
and PPM America, Inc., where he was portfolio manager for public fixed
income, including MBS, ABS, CDOs and corporate bonds; earlier, as an
analyst for MBS, ABS and money markets; and originally, at Duff & Phelps
Credit Rating Company.
o Portfolio Manager for Retail Mortgage Backed Securities: New York.
o BA, Harvard University; MBA, University of Chicago Graduate School of
Business.
Thomas Picciochi
Director of Deutsche Asset Management and Portfolio Manager of the portfolio.
o Senior portfolio manager for Quantitative Strategies: New York.
o Joined Deutsche Asset Management in 1999, formerly serving as portfolio
manager for Absolute Return Strategies, after 13 years of experience in
various research and analysis positions at State Street Global Advisors,
FPL Energy, Barnett Bank, Trade Finance Corporation and Reserve Financial
Management.
o Joined the portfolio in 2007.
o BA and MBA, University of Miami.
The portfolio's Statement of Additional Information provides additional
information about a portfolio manager's investments in the portfolio, a
description of the portfolio management compensation structure, and information
regarding other accounts managed.
DWS VARIABLE SERIES II - CLASS A SHARES DWS STRATEGIC INCOME
VIP 111
FINANCIAL HIGHLIGHTS
This table is designed to help you understand the portfolio's financial
performance. The figures in the first part of the table are for a single share.
The total return figures represent the percentage that an investor in the
portfolio would have earned (or lost), assuming all dividends and distributions
were reinvested. This information has been audited by Ernst & Young LLP, an
independent registered public accounting firm, whose report, along with the
portfolio's financial statements, is included in the portfolio's annual report
(see "Shareholder reports" on the back cover). The following table includes
selected data for a share outstanding throughout each period and other
performance information derived from the financial statements.
This information doesn't reflect charges and fees associated with the separate
account that invests in the portfolio or any variable life insurance policy or
variable annuity contract for which the portfolio is an investment option.
These charges and fees will reduce returns.
DWS STRATEGIC INCOME VIP - CLASS A
YEARS ENDED DECEMBER 31, 2007 2006 2005 2004 2003
------------------------------------------------- -------- -------- -------- -------- --------
SELECTED PER SHARE DATA
------------------------------------------------------------------------------------------------------------
NET ASSET VALUE, BEGINNING OF PERIOD $ 11.80 $ 11.50 $ 12.25 $ 11.82 $ 11.10
------------------------------------------------- -------- -------- -------- -------- --------
Income (loss) from investment operations:
Net investment income a .63 .62 .65 .58 .41
------------------------------------------------- -------- -------- -------- -------- --------
Net realized and unrealized gain (loss) ( .01) .36 ( .39) .39 .47
------------------------------------------------- -------- -------- -------- -------- --------
TOTAL FROM INVESTMENT OPERATIONS .62 .98 .26 .97 .88
------------------------------------------------- -------- -------- -------- -------- --------
Less distributions from:
Net investment income ( .72) ( .57) ( .98) - ( .15)
------------------------------------------------- -------- -------- -------- -------- --------
Net realized gains - ( .11) ( .03) ( .54) ( .01)
------------------------------------------------- -------- -------- -------- -------- --------
TOTAL DISTRIBUTIONS ( .72) ( .68) ( 1.01) ( .54) ( .16)
------------------------------------------------- -------- -------- -------- -------- --------
NET ASSET VALUE, END OF PERIOD $ 11.70 $ 11.80 $ 11.50 $ 12.25 $ 11.82
------------------------------------------------- -------- -------- -------- -------- --------
Total Return (%) 5.43b 8.98 2.38 8.60 7.85
------------------------------------------------- -------- -------- -------- -------- --------
RATIOS TO AVERAGE NET ASSETS AND SUPPLEMENTAL DATA
------------------------------------------------------------------------------------------------------------
Net assets, end of period ($ millions) 100 86 71 62 62
------------------------------------------------- -------- -------- -------- -------- --------
Ratio of expenses before expense reductions (%) .84 .85 .88 .84 .83
------------------------------------------------- -------- -------- -------- -------- --------
Ratio of expenses after expense reductions (%) .83 .85 .88 .84 .83
------------------------------------------------- -------- -------- -------- -------- --------
Ratio of net investment income (%) 5.50 5.47 5.61 4.99 3.60
------------------------------------------------- -------- -------- -------- -------- --------
Portfolio turnover rate (%) 147 143 120 210 160
------------------------------------------------- -------- -------- -------- -------- --------
a Based on average shares outstanding during the period.
b Total return would have been lower had certain expenses not been reduced.
112 DWS STRATEGIC INCOME VIP DWS VARIABLE SERIES II -
CLASS A SHARES
HYPOTHETICAL EXPENSE SUMMARY
Using the annual portfolio operating expense ratios presented in the fee tables
in the portfolio prospectus, the Hypothetical Expense Summary shows the
estimated fees and expenses, in actual dollars, that would be charged on a
hypothetical investment of $10,000 in the portfolio held for the next 10 years
and the impact of such fees and expenses on portfolio returns for each year and
cumulatively, assuming a 5% return for each year. The tables also assume that
all dividends and distributions are reinvested. The annual portfolio expense
ratios shown are net of any contractual fee waivers or expense reimbursements,
if any, for the period of the contractual commitment. Also, please note that if
you are investing through a third party provider, that provider may have fees
and expenses separate from those of the portfolio that are not reflected here.
Mutual fund fees and expenses fluctuate over time and actual expenses may be
higher or lower than those shown.
The Hypothetical Expense Summary should not be used or construed as an offer to
sell, a solicitation of an offer to buy or a recommendation or endorsement of
any specific mutual fund. You should carefully review the portfolio's
prospectus to consider the investment objectives, risks, expenses and charges
of the portfolio prior to investing.
DWS STRATEGIC INCOME VIP - CLASS A
INITIAL HYPOTHETICAL ASSUMED RATE
MAXIMUM INVESTMENT: OF RETURN:
SALES CHARGE: $10,000 5%
` 0.00% ---------------------------------- -----------------------------------
CUMULATIVE CUMULATIVE HYPOTHETICAL
RETURN BEFORE RETURN AFTER YEAR-END BALANCE ANNUAL
FEES AND ANNUAL FUND FEES AND AFTER FEES AND FEES AND
YEAR EXPENSES EXPENSE RATIOS EXPENSES EXPENSES EXPENSES
---- -------- -------------- ------------ ---------------- ----------
1 5.00% 0.89% 4.11% $ 10,411.00 $ 90.83
2 10.25% 0.89% 8.39% $ 10,838.89 $ 94.56
3 15.76% 0.89% 12.84% $ 11,284.37 $ 98.45
4 21.55% 0.89% 17.48% $ 11,748.16 $ 102.49
5 27.63% 0.89% 22.31% $ 12,231.01 $ 106.71
6 34.01% 0.89% 27.34% $ 12,733.70 $ 111.09
7 40.71% 0.89% 32.57% $ 13,257.06 $ 115.66
8 47.75% 0.89% 38.02% $ 13,801.92 $ 120.41
9 55.13% 0.89% 43.69% $ 14,369.18 $ 125.36
10 62.89% 0.89% 49.60% $ 14,959.75 $ 130.51
TOTAL $ 1,096.08
DWS VARIABLE SERIES II - CLASS A SHARES DWS STRATEGIC INCOME
VIP 113
DWS TECHNOLOGY VIP
THE PORTFOLIO'S MAIN INVESTMENT STRATEGY
The portfolio seeks growth of capital.
Under normal circumstances, the portfolio invests at least 80% of net assets,
plus the amount of any borrowings for investment purposes, in common stocks of
companies in the technology sector. For purposes of the portfolio's 80%
investment policy, companies in the technology sector must commit at least half
of their assets to the technology sector or derive at least half of their
revenues or net income from that sector. Examples of industries within the
technology sector are semiconductors, software, telecom equipment,
computer/hardware, IT services, the Internet and health technology. The
portfolio may invest in companies of any size. In addition, the portfolio may
invest in initial public offerings. While the portfolio invests mainly in US
stocks, it could invest up to 35% of net assets in foreign securities.
The portfolio's equity investments are mainly common stocks, but may also
include other types of equities such as preferred or convertible stocks.
In choosing stocks, the portfolio manager uses a combination of three
analytical disciplines:
BOTTOM-UP RESEARCH. The portfolio manager looks for individual companies with a
history of above-average growth, strong competitive positioning, attractive
prices relative to potential growth, innovative products and services, sound
financial strength and effective management, among other factors.
GROWTH ORIENTATION. The portfolio manager generally looks for companies that
the portfolio manager believes has above-average potential for sustainable
growth of revenue or earnings and whose market value appears reasonable in
light of their business prospects.
TOP-DOWN ANALYSIS. The portfolio manager considers the economic outlooks for
various industries within the technology sector and looks for those industries
that may benefit from changes in the overall business environment.
In addition, the portfolio manager uses the support of a quantitative analytic
group and its tools to attempt to actively manage the forecasted volatility
risk of the portfolio as a whole as compared to funds with a similar investment
objective, as well as appropriate benchmarks and peer groups. The portfolio
manager may favor securities from various industries and companies within the
technology sector at different times.
The portfolio manager will normally sell a stock when the portfolio manager
believes its price is unlikely to go higher, its fundamental factors have
changed, other investments offer better opportunities or in adjusting emphasis
on a given technology industry.
SECURITIES LENDING. The portfolio may lend its investment securities in an
amount up to 33 1/3% of its total assets to approved institutional borrowers
who need to borrow securities in order to complete certain transactions.
Although major changes tend to be infrequent, the Board of Trustees could
change the portfolio's investment objective without seeking shareholder
approval. However, the Board will provide shareholders with at least 60 days'
notice prior to making any changes to the portfolio's 80% investment policy.
OTHER INVESTMENTS
The portfolio is permitted, but not required, to use various types of
derivatives (contracts whose value is based on, for example, indices,
currencies or securities). Derivatives may be used for hedging and for risk
management or for non-hedging purposes to seek to enhance potential gains. The
portfolio may use derivatives in circumstances where portfolio management
believes they offer an economical means of gaining exposure to a particular
asset class or to keep cash on hand to meet shareholder redemptions or other
needs while maintaining exposure to the market. In particular, the portfolio
may use futures and options, including sales of covered put and call options.
114 DWS TECHNOLOGY VIP DWS VARIABLE SERIES II -
CLASS A SHARES
As a temporary defensive measure, the portfolio could shift up to 100% of
assets into investments such as money market securities. This measure could
prevent losses, but, while engaged in a temporary defensive position, the
portfolio will not be pursuing its investment objective. However, the portfolio
managers may choose not to use these strategies for various reasons, even in
very volatile market conditions.
THE MAIN RISKS OF INVESTING IN THE PORTFOLIO
There are several risk factors that could hurt the portfolio's performance,
cause you to lose money or cause the portfolio's performance to trail that of
other investments.
STOCK MARKET RISK. The portfolio is affected by how the stock market performs.
To the extent the portfolio invests in a particular capitalization, the
portfolio's performance may be proportionately affected by that segment's
general performance. When stock prices fall, you should expect the value of
your investment to fall as well. Because a stock represents ownership in its
issuer, stock prices can be hurt by poor management, shrinking product demand
and other business risks. These factors may affect single companies as well as
groups of companies. In addition, movements in financial markets may adversely
affect a stock's price, regardless of how well the company performs. The market
as a whole may not favor the types of investments the portfolio makes, which
could affect the portfolio's ability to sell them at an attractive price.
CONCENTRATION RISK. The portfolio concentrates its investments in the group of
industries constituting the technology sector. As a result, factors affecting
this sector, such as market price movements, market saturation and rapid
product obsolescence will have a significant impact on the portfolio's
performance. Additionally, many technology companies are smaller companies that
may have limited business lines and limited financial resources, making them
highly vulnerable to business and economic risks.
NON-DIVERSIFICATION RISK. The portfolio is classified as non-diversified under
the Investment Company Act of 1940, as amended. This means that the portfolio
may invest in securities of relatively few issuers. Thus, the performance of
one or a small number of portfolio holdings can affect overall performance more
than if the portfolio invested in a larger number of issuers.
FOREIGN INVESTMENT RISK. Foreign investments involve certain special risks,
including:
o POLITICAL RISK. Some foreign governments have limited the outflow of profits
to investors abroad, imposed restrictions on the exchange or export of
foreign currency, extended diplomatic disputes to include trade and
financial relations, seized foreign investment and imposed higher taxes.
o INFORMATION RISK. Companies based in foreign markets are usually not subject
to accounting, auditing and financial reporting standards and practices as
stringent as those in the US. Therefore, their financial reports may present
an incomplete, untimely or misleading picture of a company, as compared to
the financial reports required in the US.
o LIQUIDITY RISK. Investments that trade less can be more difficult or more
costly to buy, or to sell, than more liquid or active investments. This
liquidity risk is a factor of the trading volume of a particular investment,
as well as the size and liquidity of the entire local market. On the whole,
foreign exchanges are smaller and less liquid than US exchanges. This can
make buying and selling certain investments more difficult and costly.
Relatively small transactions in some instances can have a
disproportionately large effect on the price and supply of securities. In
certain situations, it may become virtually impossible to sell an investment
in an orderly fashion at a price that approaches portfolio management's
estimate of its value. For the same reason, it may at times be difficult to
value the portfolio's foreign investments.
o REGULATORY RISK. There is generally less government regulation of foreign
markets, companies and securities dealers than in the US.
o CURRENCY RISK. The portfolio invests in securities denominated in foreign
currencies. Changes in exchange rates between foreign currencies and the US
dollar may affect the US dollar value of foreign securities or the income or
gain received on these securities.
o LIMITED LEGAL RECOURSE RISK. Legal remedies for investors may be more limited
than the legal remedies available in the US.
DWS VARIABLE SERIES II - CLASS A SHARES DWS TECHNOLOGY
VIP 115
o TRADING PRACTICE RISK. Brokerage commissions and other fees are generally
higher for foreign investments than for US investments. The procedures and
rules governing foreign transactions and custody may also involve delays in
payment, delivery or recovery of money or investments.
o TAXES. Foreign withholding and certain other taxes may reduce the amount of
income available to distribute to shareholders of the portfolio. In
addition, special US tax considerations may apply to the portfolio's foreign
investments.
EMERGING MARKET RISK. All of the risks of investing in foreign securities are
increased in connection with investments in emerging markets securities. In
addition, profound social changes and business practices that depart from norms
in developed countries' economies have hindered the orderly growth of emerging
economies and their markets in the past and have caused instability. High
levels of debt tend to make emerging economies heavily reliant on foreign
capital and vulnerable to capital flight. Countries in emerging markets are
also more likely to experience high levels of inflation, deflation or currency
devaluation, which could also hurt their economies and securities markets. For
these and other reasons, investments in emerging markets are often considered
speculative.
IPO RISK. Securities purchased in initial public offerings (IPOs) may be very
volatile, due to their stock prices rising and falling rapidly, often based,
among other reasons, on investor perceptions rather than economic reasons.
Additionally, investments in IPOs may magnify the portfolio's performance if it
has a small asset base. The portfolio is less likely to experience a similar
impact on its performance as its assets grow because it is unlikely that the
portfolio will obtain proportionately larger IPO allocations.
DERIVATIVES RISK. Risks associated with derivatives include the risk that the
derivative is not well correlated with the security, index or currency to which
it relates; the risk that derivatives may result in losses or missed
opportunities; the risk that the portfolio will be unable to sell the
derivative because of an illiquid secondary market; the risk that a
counterparty is unwilling or unable to meet its obligation and the risk that
the derivative transaction could expose the portfolio to the effects of
leverage, which could increase the portfolio's exposure to the market and
magnify potential losses. There is no guarantee that derivatives, to the extent
employed, will have the intended effect, and their use could cause lower
returns or even losses to the portfolio. The use of derivatives by the
portfolio to hedge risk may reduce the opportunity for gain by offsetting the
positive effect of favorable price movements.
SECURITIES LENDING RISK. Any loss in the market price of securities loaned by
the portfolio that occurs during the term of the loan would be borne by the
portfolio and would adversely affect the portfolio's performance. Also, there
may be delays in recovery of securities loaned or even a loss of rights in the
collateral should the borrower of the securities fail financially while the
loan is outstanding. However, loans will be made only to borrowers selected by
the portfolio's delegate after a review of relevant facts and circumstances,
including the creditworthiness of the borrower.
PRICING RISK. At times, market conditions may make it difficult to value some
investments, and the portfolio may use certain valuation methodologies for some
of its investments, such as fair value pricing. Given the subjective nature of
such valuation methodologies, it is possible that the value determined for an
investment may be different than the value realized upon such investment's
sale. If the portfolio has valued its securities too highly, you may pay too
much for portfolio shares when you buy into the portfolio. If the portfolio has
underestimated the price of its securities, you may not receive the full market
value when you sell your portfolio shares.
SECURITY SELECTION RISK. A risk that pervades all investing is the risk that
the securities in the portfolio's portfolio may decline in value.
Other factors that could affect performance include:
o portfolio management could be wrong in the analysis of industries, companies,
economic trends, the relative attractiveness of different securities or
other matters.
o growth stocks may be out of favor for certain periods.
This portfolio is designed for investors who can accept above-average risks and
are interested in exposure to a sector that offers attractive long-term growth
potential.
116 DWS TECHNOLOGY VIP DWS VARIABLE SERIES II -
CLASS A SHARES
PERFORMANCE - CLASS A
While a portfolio's past performance isn't necessarily a sign of how it will do
in the future, it can be valuable for an investor to know.
The bar chart shows how the returns for the portfolio's Class A shares have
varied from year to year, which may give some idea of risk. The table shows
average annual returns for the portfolio and comparable index information
(which, unlike the portfolio, does not have any fees or expenses). The
performance of both the portfolio and the comparable index information varies
over time. All figures assume reinvestment of dividends and distributions.
This information doesn't reflect charges and fees associated with the separate
account that invests in the portfolio or any variable life insurance policy or
variable annuity contract for which the portfolio is an investment option.
These charges and fees will reduce returns.
ANNUAL TOTAL RETURN (%) as of 12/31 each year - CLASS A
[BARGRAPHIC APPEARS HERE]
-21.57 -32.39 -35.52 46.84 1.92 3.74 0.75 14.30
2000 2001 2002 2003 2004 2005 2006 2007
FOR THE PERIODS INCLUDED IN THE BAR CHART:
BEST QUARTER: 28.57%, Q4 2001 WORST QUARTER: -33.64%, Q3 2001
2008 TOTAL RETURN AS OF MARCH 31: -16.99%
AVERAGE ANNUAL TOTAL RETURNS (%) as of 12/31/2007
1 YEAR 5 YEARS SINCE INCEPTION*
------ ------- ----------------
Portfolio - Class A 14.30 12.29 0.94
Russell 1000 Growth Index 11.81 12.11 -0.17
S&P Goldman Sachs Technology
Index 16.94 15.58 -1.16
* Since 5/1/99. Index comparisons begin 4/30/99.
RUSSELL 1000 (Reg. TM) GROWTH INDEX is an unmanaged index that consists of
those stocks in the Russell 1000 (Reg. TM) Index that have higher price-to-book
ratios and higher forecasted growth values. Russell 1000 (Reg. TM) Index is an
unmanaged price-only index of the 1,000 largest capitalized companies that are
domiciled in the US and whose common stocks are traded.
S&P GOLDMAN SACHS TECHNOLOGY INDEX is an unmanaged capitalization-weighted
index based on a universe of technology-related stocks.
Current performance information may be higher or lower than the performance
data quoted above. For more recent performance information, contact your
participating insurance company.
DWS VARIABLE SERIES II - CLASS A SHARES DWS TECHNOLOGY
VIP 117
HOW MUCH INVESTORS PAY
This table describes the fees and expenses that you may pay if you buy and hold
portfolio shares. The information in the table does not reflect charges and
fees associated with the separate account that invests in the portfolio or any
variable life insurance policy or variable annuity contract for which the
portfolio is an investment option. These charges and fees will increase
expenses.
FEE TABLE CLASS A
--------- -------
ANNUAL OPERATING EXPENSES, deducted from portfolio assets
Management Fee1 0.67%
Distribution/Service (12b-1) Fee None
Other Expenses2 0.24
TOTAL ANNUAL OPERATING EXPENSES 0.91
1 Restated on an annualized basis to reflect approved fee changes taking
effect on May 1, 2008.
2 Restated on an annualized basis to reflect approved fee changes taking
effect on May 1, 2008. Includes a 0.10% administrative services fee paid
to the Advisor.
Based on the costs above, this example helps you compare the expenses of Class
A shares to those of other mutual funds. This example assumes the expenses
above remain the same. It also assumes that you invested $10,000, earned 5%
annual returns, reinvested all dividends and distributions and sold your shares
at the end of each period. This is only an example; actual expenses will be
different.
EXAMPLE 1 YEAR 3 YEARS 5 YEARS 10 YEARS
------- ------ ------- ------- --------
Class A shares $93 $290 $504 $1,120
THE PORTFOLIO MANAGER
The following person handles the day-to-day management of the portfolio:
Kelly P. Davis
Director of Deutsche Asset Management and Portfolio Manager of the portfolio.
o Joined Deutsche Asset Management in 2003 after eight years of experience
with semiconductors as an associate analyst in Equities Research with
Credit Suisse First Boston, team leader in applications engineering at
Advanced Micro Devices, and in technical roles at Interactive Silicon,
Motorola, Inc. and Tellabs Operations, Inc.
o Joined the portfolio in 2005.
o BS, Purdue University; MBA, University of California, Berkeley.
The portfolio's Statement of Additional Information provides additional
information about a portfolio manager's investments in the portfolio, a
description of the portfolio management compensation structure, and information
regarding other accounts managed.
118 DWS TECHNOLOGY VIP DWS VARIABLE SERIES II -
CLASS A SHARES
FINANCIAL HIGHLIGHTS
This table is designed to help you understand the portfolio's financial
performance. The figures in the first part of the table are for a single share.
The total return figures represent the percentage that an investor in the
portfolio would have earned (or lost), assuming all dividends and distributions
were reinvested. This information has been audited by Ernst & Young LLP, an
independent registered public accounting firm, whose report, along with the
portfolio's financial statements, is included in the portfolio's annual report
(see "Shareholder reports" on the back cover). The following table includes
selected data for a share outstanding throughout each period and other
performance information derived from the financial statements.
This information doesn't reflect charges and fees associated with the separate
account that invests in the portfolio or any variable life insurance policy or
variable annuity contract for which the portfolio is an investment option.
These charges and fees will reduce returns.
DWS TECHNOLOGY VIP - CLASS A
YEARS ENDED DECEMBER 31, 2007 2006 2005 2004 2003
------------------------------------------- ------- ------ ------- ------- ------
SELECTED PER SHARE DATA
-------------------------------------------------------------------------------------------------------------------------
NET ASSET VALUE, BEGINNING OF PERIOD $ 9.37 $ 9.30 $ 9.01 $ 8.84 $ 6.02
------------------------------------------- ------- ------ ------- ------- ------
Income (loss) from investment operations:
Net investment income (loss)a ( .02) ( .01)b ( .03) .04 ( .04)
------------------------------------------- ------- ------ ------- ------- ------
Net realized and unrealized gain (loss) 1.36 .08 .36 .13 2.86
------------------------------------------- ------- ------ ------- ------- ------
TOTAL FROM INVESTMENT OPERATIONS 1.34 .07 .33 .17 2.82
------------------------------------------- ------- ------ ------- ------- ------
Less distributions from:
Net investment income - - ( .04) - -
------------------------------------------- ------- ------ ------- ------- ------
NET ASSET VALUE, END OF PERIOD $ 10.71 $ 9.37 $ 9.30 $ 9.01 $ 8.84
------------------------------------------- ------- ------ ------- ------- ------
Total Return (%) 14.30 .75b 3.74 1.92 46.84
------------------------------------------- ------- ------ ------- ------- ------
RATIOS TO AVERAGE NET ASSETS AND SUPPLEMENTAL DATA
-------------------------------------------------------------------------------------------------------------------------
Net assets, end of period ($ millions) 153 165 199 230 257
------------------------------------------- ------- ------ ------- ------- ------
Ratio of expenses (%) .91 .89 .86 .83 .86
------------------------------------------- ------- ------ ------- ------- ------
Ratio of net investment income (loss) (%) ( .15) ( .12)b ( .36) .43 ( .50)
------------------------------------------- ------- ------ ------- ------- ------
Portfolio turnover rate (%) 91 49 135 112 66
------------------------------------------- ------- ------ ------- ------- ------
a Based on average shares outstanding during the period.
b Includes non-recurring income from the Advisor recorded as a result of an
administrative proceeding regarding disclosure of brokerage allocation
practices in connection with sales of DWS Scudder Funds. The non-recurring
income resulted in an increase in net investment income of $0.017 per
share and an increase in the ratio of net investment income of 0.18%.
Excluding this non-recurring income, total return would have been 0.19%
lower.
DWS VARIABLE SERIES II - CLASS A SHARES DWS TECHNOLOGY
VIP 119
HYPOTHETICAL EXPENSE SUMMARY
Using the annual portfolio operating expense ratios presented in the fee tables
in the portfolio prospectus, the Hypothetical Expense Summary shows the
estimated fees and expenses, in actual dollars, that would be charged on a
hypothetical investment of $10,000 in the portfolio held for the next 10 years
and the impact of such fees and expenses on portfolio returns for each year and
cumulatively, assuming a 5% return for each year. The tables also assume that
all dividends and distributions are reinvested. The annual portfolio expense
ratios shown are net of any contractual fee waivers or expense reimbursements,
if any, for the period of the contractual commitment. Also, please note that if
you are investing through a third party provider, that provider may have fees
and expenses separate from those of the portfolio that are not reflected here.
Mutual fund fees and expenses fluctuate over time and actual expenses may be
higher or lower than those shown.
The Hypothetical Expense Summary should not be used or construed as an offer to
sell, a solicitation of an offer to buy or a recommendation or endorsement of
any specific mutual fund. You should carefully review the portfolio's
prospectus to consider the investment objectives, risks, expenses and charges
of the portfolio prior to investing.
DWS TECHNOLOGY VIP - CLASS A
INITIAL HYPOTHETICAL ASSUMED RATE
MAXIMUM INVESTMENT: OF RETURN:
SALES CHARGE: $10,000 5%
0.00% ---------------------------------- ----------------------------------
CUMULATIVE CUMULATIVE HYPOTHETICAL
RETURN BEFORE RETURN AFTER YEAR-END BALANCE ANNUAL
FEES AND ANNUAL FUND FEES AND AFTER FEES AND FEES AND
YEAR EXPENSES EXPENSE RATIOS EXPENSES EXPENSES EXPENSES
---- ------------- -------------- ------------ ----------------- ----------
1 5.00% 0.91% 4.09% $ 10,409.00 $ 92.86
2 10.25% 0.91% 8.35% $ 10,834.73 $ 96.66
3 15.76% 0.91% 12.78% $ 11,277.87 $ 100.61
4 21.55% 0.91% 17.39% $ 11,739.13 $ 104.73
5 27.63% 0.91% 22.19% $ 12,219.26 $ 109.01
6 34.01% 0.91% 27.19% $ 12,719.03 $ 113.47
7 40.71% 0.91% 32.39% $ 13,239.24 $ 118.11
8 47.75% 0.91% 37.81% $ 13,780.73 $ 122.94
9 55.13% 0.91% 43.44% $ 14,344.36 $ 127.97
10 62.89% 0.91% 49.31% $ 14,931.04 $ 133.20
TOTAL $ 1,119.56
120 DWS TECHNOLOGY VIP DWS VARIABLE SERIES II -
CLASS A SHARES
DWS TURNER MID CAP GROWTH VIP
THE PORTFOLIO'S MAIN INVESTMENT STRATEGY
The portfolio seeks capital appreciation.
The portfolio pursues its objective by investing in common stocks and other
equity securities of US companies with medium market capitalizations that the
portfolio managers believe have strong earnings growth potential. The portfolio
will invest in securities of companies that are diversified across economic
sectors, and will attempt to maintain sector concentrations that approximate
those of the Russell Midcap (Reg. TM) Growth Index (as of February 29, 2008,
the Russell Midcap (Reg. TM) Growth Index had a median market capitalization of
$4.05 billion). The portfolio intends to invest primarily in companies whose
market capitalizations fall within the normal range of the Index. Portfolio
exposure is generally limited to 5% in any single issuer, subject to exceptions
for the most heavily weighted securities in the Index.
Under normal circumstances, at least 80% of the portfolio's net assets, plus
the amount of any borrowings for investment purposes, will be invested in
stocks of mid-cap companies, which are defined for this purpose as companies
with market capitalizations at the time of purchase in the range of market
capitalizations of those companies included in the Index. The portfolio
managers generally look for medium market capitalization companies with strong
histories of earnings growth that are likely to continue to grow their
earnings. The portfolio's investments in common stocks may include initial
public offerings. A stock becomes a sell candidate if there is deterioration in
the company's earnings growth potential. Moreover, positions will be trimmed to
adhere to capitalization or capacity constraints, to maintain sector neutrality
or to adjust stock position size relative to the Index.
In focusing on companies with strong earnings growth potential, the portfolio
managers engage in a relatively high level of trading activity so as to respond
to changes in earnings forecasts and economic developments.
SECURITIES LENDING. The portfolio may lend its investment securities in an
amount up to 33 1/3% of its total assets to approved institutional borrowers
who need to borrow securities in order to complete certain transactions.
Although major changes tend to be infrequent, the Board of Trustees could
change the portfolio's investment objective without seeking shareholder
approval. However, the Board will provide shareholders with at least 60 days'
notice prior to making any changes to the portfolio's 80% investment policy.
OTHER INVESTMENTS
The portfolio is permitted, but not required, to use various types of
derivatives (contracts whose value is based on, for example, indices,
currencies or securities). Derivatives may be used for hedging and for risk
management or for non-hedging purposes to seek to enhance potential gain. The
portfolio may use derivatives in circumstances where portfolio management
believes they offer an economical means of gaining exposure to a particular
asset class or to keep cash on hand to meet shareholder redemptions or other
needs while maintaining exposure to the market.
As a temporary defensive measure, the portfolio could shift up to 100% of
assets into investments such as money market securities. This measure could
prevent losses, but, while engaged in a temporary defensive position, the
portfolio will not be pursuing its investment objective. However, the portfolio
managers may choose not to use these strategies for various reasons, even in
very volatile market conditions.
THE MAIN RISKS OF INVESTING IN THE PORTFOLIO
There are several risk factors that could hurt the portfolio's performance,
cause you to lose money or cause the portfolio's performance to trail that of
other investments.
STOCK MARKET RISK. The portfolio is affected by how the stock market performs.
To the extent the portfolio invests in a particular market sector, the
portfolio's performance may be proportionately affected by that segment's
general performance. When stock prices fall, you should expect the value of
your investment to fall as well. Because a stock represents ownership in its
issuer, stock prices can be hurt by poor management, shrinking product demand
and other business risks. These may affect single companies as well as groups
of
DWS VARIABLE SERIES II - CLASS A SHARES DWS TURNER MID CAP GROWTH
VIP 121
companies. In addition, movements in financial markets may adversely affect a
stock's price, regardless of how well the company performs. The market as a
whole may not favor the types of investments the portfolio makes and the
portfolio may not be able to get an attractive price for them.
MEDIUM-SIZED COMPANY RISK. Medium-sized company stocks tend to experience
steeper price fluctuations than stocks of larger companies. A shortage of
reliable information can also pose added risk to medium sized companies stocks.
Industry-wide reversals may have a greater impact on medium-sized companies,
since they usually lack the financial resources of large companies.
Medium-sized company stocks are typically less liquid than large company
stocks. Accordingly, it may be harder to find buyers for medium-sized company
shares.
GROWTH INVESTING RISK. Since growth stocks usually reinvest a large portion of
earnings in their own businesses, they may lack the dividends associated with
value stocks that might otherwise cushion their decline in a falling market.
Earnings disappointments in growth stocks often result in sharp price declines
because investors buy these stocks for their potential superior earnings
growth. Growth stocks may also be out of favor for certain periods in relation
to value stocks.
INDUSTRY RISK. While the portfolio does not concentrate in any industry, to the
extent that the portfolio has exposure to a given industry or sector, any
factors affecting that industry or sector could affect the value of portfolio
securities. For example, manufacturers of consumer goods could be hurt by a
rise in unemployment or technology companies could be hurt by such factors as
market saturation, price competition and rapid obsolescence.
IPO RISK. Securities purchased in initial public offerings (IPOs) may be very
volatile, due to their stock prices rising and falling rapidly, often based,
among other reasons, on investor perceptions rather than economic reasons.
Additionally, investments in IPOs may magnify the portfolio's performance if it
has a small asset base. The portfolio is less likely to experience a similar
impact on its performance as its assets grow because it is unlikely that the
portfolio will obtain proportionately larger IPO allocations.
DERIVATIVES RISK. Risks associated with derivatives include the risk that the
derivative is not well correlated with the security, index or currency to which
it relates; the risk that derivatives may result in losses or missed
opportunities; the risk that the portfolio will be unable to sell the
derivative because of an illiquid secondary market; the risk that a
counterparty is unwilling or unable to meet its obligation and the risk that
the derivative transaction could expose the portfolio to the effects of
leverage, which could increase the portfolio's exposure to the market and
magnify potential losses. There is no guarantee that derivatives, to the extent
employed, will have the intended effect, and their use could cause lower
returns or even losses to the portfolio. The use of derivatives by the
portfolio to hedge risk may reduce the opportunity for gain by offsetting the
positive effect of favorable price movements.
SECURITIES LENDING RISK. Any loss in the market price of securities loaned by
the portfolio that occurs during the term of the loan would be borne by the
portfolio and would adversely affect the portfolio's performance. Also, there
may be delays in recovery of securities loaned or even a loss of rights in the
collateral should the borrower of the securities fail financially while the
loan is outstanding. However, loans will be made only to borrowers selected by
the portfolio's delegate after a review of relevant facts and circumstances,
including the creditworthiness of the borrower.
PRICING RISK. At times, market conditions may make it difficult to value some
investments, and the portfolio may use certain valuation methodologies for some
of its investments, such as fair value pricing. Given the subjective nature of
such valuation methodologies, it is possible that the value determined for an
investment may be different than the value realized upon such investment's
sale. If the portfolio has valued its securities too highly, you may pay too
much for portfolio shares when you buy into the portfolio. If the portfolio has
underestimated the price of its securities, you may not receive the full market
value when you sell your portfolio shares.
SECURITY SELECTION RISK. A risk that pervades all investing is the risk that
the securities in the portfolio's portfolio may decline in value.
Another factor that could affect performance is:
o portfolio management could be wrong in the analysis of industries, companies,
economic trends, the relative attractiveness of different securities or
other matters.
122 DWS TURNER MID CAP GROWTH VIP DWS VARIABLE SERIES II -
CLASS A SHARES
PERFORMANCE - CLASS A
While a portfolio's past performance isn't necessarily a sign of how it will do
in the future, it can be valuable for an investor to know.
The bar chart shows how the returns for the portfolio's Class A shares have
varied from year to year, which may give some idea of risk. The table shows
average annual returns for the portfolio and comparable index information
(which, unlike the portfolio, does not have any fees or expenses). The
performance of both the portfolio and the comparable index information varies
over time. All figures assume reinvestment of dividends and distributions.
This information doesn't reflect charges and fees associated with the separate
account that invests in the portfolio or any variable life insurance policy or
variable annuity contract for which the portfolio is an investment option.
These charges and fees will reduce returns.
ANNUAL TOTAL RETURN (%) as of 12/31 each year - CLASS A
[BARGRAPHIC APPEARS HERE]
-32.20 48.49 11.04 11.76 6.52 25.75
2002 2003 2004 2005 2006 2007
FOR THE PERIODS INCLUDED IN THE BAR CHART:
BEST QUARTER: 19.37%, Q2 2003 WORST QUARTER: -19.06%, Q2 2002
2008 TOTAL RETURN AS OF MARCH 31: -13.25%
AVERAGE ANNUAL TOTAL RETURNS (%) as of 12/31/2007
1 YEAR 5 YEARS SINCE INCEPTION*
------ ------- ----------------
Portfolio - Class A 25.75 19.81 6.01
Russell Midcap Growth Index 11.43 17.90 6.38
* Since 5/1/01. Index comparison begins 4/30/01.
RUSSELL MIDCAP (Reg. TM) GROWTH INDEX is an unmanaged capitalization-weighted
index of medium and medium/small companies in the Russell 1000 (Reg. TM) Index
chosen for their growth orientation. Russell 1000 (Reg. TM) Index is an
unmanaged price-only index of the 1,000 largest capitalized companies that are
domiciled in the US and whose common stocks are traded.
Current performance information may be higher or lower than the performance
data quoted above. For more recent performance information, contact your
participating insurance company.
DWS VARIABLE SERIES II - CLASS A SHARES DWS TURNER MID CAP GROWTH
VIP 123
HOW MUCH INVESTORS PAY
This table describes the fees and expenses that you may pay if you buy and hold
portfolio shares. The information in the table does not reflect charges and
fees associated with the separate account that invests in the portfolio or any
variable life insurance policy or variable annuity contract for which the
portfolio is an investment option. These charges and fees will increase
expenses.
FEE TABLE CLASS A
--------- -------
ANNUAL OPERATING EXPENSES, deducted from portfolio assets
Management Fee1 0.72%
Distribution/Service (12b-1) Fee None
Other Expenses2 0.19
TOTAL ANNUAL OPERATING EXPENSES3 0.91
1 Restated on an annualized basis to reflect approved fee changes taking
effect on May 1, 2008.
2 Restated on an annualized basis to reflect approved fee changes taking
effect on May 1, 2008. Includes a 0.10% administrative services fee paid
to the Advisor.
3 Through September 30, 2008, the Advisor has contractually agreed to waive
all or a portion of its management fee and reimburse or pay certain
operating expenses so that the total annual operating expenses of the
portfolio will not exceed 0.94% for Class A shares, excluding certain
expenses such as extraordinary expenses, taxes, brokerage and interest.
Although there can be no assurance that the current waiver/expense
reimbursement arrangement will be maintained beyond September 30, 2008,
the Advisor has committed to review the continuance of waiver/expense
reimbursement arrangements by September 30, 2008.
Based on the costs above, this example helps you compare the expenses of Class
A shares to those of other mutual funds. This example assumes the expenses
above remain the same. It also assumes that you invested $10,000, earned 5%
annual returns, reinvested all dividends and distributions and sold your shares
at the end of each period. This is only an example; actual expenses will be
different.
EXAMPLE 1 YEAR 3 YEARS 5 YEARS 10 YEARS
------- ------ ------- ------- --------
Class A shares $93 $290 $504 $1,120
THE PORTFOLIO MANAGERS
The portfolio's subadvisor is Turner Investment Partners, Inc. ("Turner"). The
portfolio is managed by a team of investment professionals who collaborate to
develop and implement the portfolio's investment strategy. The lead manager on
the team has authority over all aspects of the portfolio's investment
portfolio, including but not limited to, purchases and sales of individual
securities, portfolio construction techniques, portfolio risk assessment and
the management of daily cash flows in accordance with portfolio holdings.
The portfolio managers are Christopher K. McHugh (Lead Manager), Tara Hedlund
and Jason Schrotberger. Mr. McHugh has managed the portfolio since its
inception; Ms. Hedlund and Mr. Schrotberger joined the portfolio in 2006. Mr.
McHugh began his investment career in 1986 and joined the subadvisor when it
was founded in 1990. Mr. McHugh is a principal at Turner. Ms. Hedlund joined
Turner in 2000, has 13 years of investment industry experience and also serves
as a security analyst covering the technology and telecommunications sectors.
Ms. Hedlund is a principal at Turner. Mr. Schrotberger joined Turner in 2001,
has 14 years of investment industry experience and also serves as a security
analyst covering the consumer sector. Mr. Schrotberger is a principal at
Turner.
The portfolio's Statement of Additional Information provides additional
information about a portfolio manager's investments in the portfolio, a
description of the portfolio management compensation structure, and information
regarding other accounts managed.
124 DWS TURNER MID CAP GROWTH VIP DWS VARIABLE SERIES II -
CLASS A SHARES
FINANCIAL HIGHLIGHTS
This table is designed to help you understand the portfolio's financial
performance. The figures in the first part of the table are for a single share.
The total return figures represent the percentage that an investor in the
portfolio would have earned (or lost), assuming all dividends and distributions
were reinvested. This information has been audited by Ernst & Young LLP, an
independent registered public accounting firm, whose report, along with the
portfolio's financial statements, is included in the portfolio's annual report
(see "Shareholder reports" on the back cover). The following table includes
selected data for a share outstanding throughout each period and other
performance information derived from the financial statements.
This information doesn't reflect charges and fees associated with the separate
account that invests in the portfolio or any variable life insurance policy or
variable annuity contract for which the portfolio is an investment option.
These charges and fees will reduce returns.
DWS TURNER MID CAP GROWTH VIP - CLASS A
YEARS ENDED DECEMBER 31, 2007 2006 2005 2004 2003
------------------------------------------- -------- -------- ------- ------ ------
SELECTED PER SHARE DATA
-------------------------------------------------------------------------------------------------------------------------
NET ASSET VALUE, BEGINNING OF PERIOD $ 10.92 $ 11.02 $ 9.86 $ 8.88 $ 5.98
------------------------------------------- -------- -------- ------- ------ ------
Income (loss) from investment operations:
Net investment income (loss)a ( .04) ( .01) ( .05) ( .07) ( .06)
------------------------------------------- -------- -------- ------- ------ ------
Net realized and unrealized gain (loss) 2.64 .77 1.21 1.05 2.96
------------------------------------------- -------- -------- ------- ------ ------
TOTAL FROM INVESTMENT OPERATIONS 2.60 .76 1.16 .98 2.90
------------------------------------------- -------- -------- ------- ------ ------
Less distributions from:
Net realized gains ( .97) ( .86) - - -
------------------------------------------- -------- -------- ------- ------ ------
NET ASSET VALUE, END OF PERIOD $ 12.55 $ 10.92 $ 11.02 $ 9.86 $ 8.88
------------------------------------------- -------- -------- ------- ------ ------
Total Return (%) 25.75 6.52 11.76 11.04 48.49
------------------------------------------- -------- -------- ------- ------ ------
RATIOS TO AVERAGE NET ASSETS AND SUPPLEMENTAL DATA
-------------------------------------------------------------------------------------------------------------------------
Net assets, end of period ($ millions) 129 117 122 118 110
------------------------------------------- -------- -------- ------- ------ ------
Ratio of expenses (%) .95 .97 1.11 1.19 1.18
------------------------------------------- -------- -------- ------- ------ ------
Ratio of net investment income (loss) (%) ( .36) ( .06) ( .56) ( .82) ( .90)
------------------------------------------- -------- -------- ------- ------ ------
Portfolio turnover rate (%) 133 148 151 174 155
------------------------------------------- -------- -------- ------- ------ ------
a Based on average shares outstanding during the period.
DWS VARIABLE SERIES II - CLASS A SHARES DWS TURNER MID CAP GROWTH
VIP 125
HYPOTHETICAL EXPENSE SUMMARY
Using the annual portfolio operating expense ratios presented in the fee tables
in the portfolio prospectus, the Hypothetical Expense Summary shows the
estimated fees and expenses, in actual dollars, that would be charged on a
hypothetical investment of $10,000 in the portfolio held for the next 10 years
and the impact of such fees and expenses on portfolio returns for each year and
cumulatively, assuming a 5% return for each year. The tables also assume that
all dividends and distributions are reinvested. The annual portfolio expense
ratios shown are net of any contractual fee waivers or expense reimbursements,
if any, for the period of the contractual commitment. Also, please note that if
you are investing through a third party provider, that provider may have fees
and expenses separate from those of the portfolio that are not reflected here.
Mutual fund fees and expenses fluctuate over time and actual expenses may be
higher or lower than those shown.
The Hypothetical Expense Summary should not be used or construed as an offer to
sell, a solicitation of an offer to buy or a recommendation or endorsement of
any specific mutual fund. You should carefully review the portfolio's
prospectus to consider the investment objectives, risks, expenses and charges
of the portfolio prior to investing.
DWS TURNER MID CAP GROWTH VIP - CLASS A
INITIAL HYPOTHETICAL ASSUMED RATE
MAXIMUM INVESTMENT: OF RETURN:
SALES CHARGE: $10,000 5%
0.00% ----------------------------------- -----------------------------------
CUMULATIVE CUMULATIVE HYPOTHETICAL
RETURN BEFORE RETURN AFTER YEAR-END BALANCE ANNUAL
FEES AND ANNUAL FUND FEES AND AFTER FEES AND FEES AND
YEAR EXPENSES EXPENSE RATIOS EXPENSES EXPENSES EXPENSES
---- ------------- -------------- ------------ ---------------- -----------
1 5.00% 0.91% 4.09% $ 10,409.00 $ 92.86
2 10.25% 0.91% 8.35% $ 10,834.73 $ 96.66
3 15.76% 0.91% 12.78% $ 11,277.87 $ 100.61
4 21.55% 0.91% 17.39% $ 11,739.13 $ 104.73
5 27.63% 0.91% 22.19% $ 12,219.26 $ 109.01
6 34.01% 0.91% 27.19% $ 12,719.03 $ 113.47
7 40.71% 0.91% 32.39% $ 13,239.24 $ 118.11
8 47.75% 0.91% 37.81% $ 13,780.73 $ 122.94
9 55.13% 0.91% 43.44% $ 14,344.36 $ 127.97
10 62.89% 0.91% 49.31% $ 14,931.04 $ 133.20
TOTAL $ 1,119.56
126 DWS TURNER MID CAP GROWTH VIP DWS VARIABLE SERIES II -
CLASS A SHARES
OTHER POLICIES AND RISKS
While the previous pages describe the main points of each portfolio's strategy
and risks, there are a few other issues to know about:
o Each portfolio may trade securities actively. This could raise transaction
costs and, accordingly, lower performance.
o The Advisor, or a subadvisor, will establish a debt security's credit quality
when it buys a security, using independent ratings, or for unrated
securities, its own credit determination. When ratings don't agree, a
portfolio will use the higher rating. If a security's credit quality falls,
the Advisor or subadvisor will determine whether selling it would be in a
portfolio's best interest. For DWS Money Market VIP, such determination will
be made pursuant to procedures adopted by the Board.
FOR MORE INFORMATION
This prospectus doesn't tell you about every policy or risk of investing in
each portfolio.
If you want more information on each portfolio's allowable securities and
investment practices and the characteristics and risks of each one, you may
want to request a copy of the Statement of Additional Information (the back
cover tells you how to do this).
Keep in mind that there is no assurance that a portfolio will achieve its
objective.
A complete list of each portfolio's portfolio holdings as of each calendar
quarter end for DWS High Income VIP, on or after the 14th day of the following
month for DWS Money Market VIP, and for all other portfolios as of month end,
is posted on www.dws-scudder.com (the Web site does not form a part of this
prospectus) on or after the last day of the following month. This posted
information generally remains accessible at least until the date on which a
portfolio files its Form N-CSR or N-Q with the Securities and Exchange
Commission for the period that includes the date as of which the posted
information is current. In addition, each portfolio's (except DWS Core Fixed
Income VIP, DWS Government & Agency Securities VIP, DWS Strategic Income VIP
and DWS Money Market VIP) top ten equity holdings and other information about
each portfolio is posted on www.dws-scudder.com as of the calendar quarter-end
on or after the 15th day following quarter end. Each portfolio's Statement of
Additional Information includes a description of a portfolio's policies and
procedures with respect to the disclosure of a portfolio's portfolio holdings.
THE INVESTMENT ADVISOR
Deutsche Investment Management Americas Inc. ("DIMA" or the "Advisor"), is the
investment advisor for each portfolio. Under the supervision of the Board
Members, the Advisor, with headquarters at 345 Park Avenue, New York, NY 10154,
or a subadvisor, makes portfolio investment decisions, buys and sells
securities for each portfolio and conducts research that leads to these
purchase and sale decisions. The Advisor provides a full range of global
investment advisory services to institutional and retail clients.
DWS Scudder is part of Deutsche Asset Management, which is the marketing name
in the US for the asset management activities of Deutsche Bank AG, DIMA,
Deutsche Bank Trust Company Americas and DWS Trust Company.
Deutsche Asset Management is a global asset management organization that offers
a wide range of investing expertise and resources, including hundreds of
portfolio managers and analysts and an office network that reaches the world's
major investment centers. This well-resourced global investment platform brings
together a wide variety of experience and investment insight across industries,
regions, asset classes and investing styles.
The Advisor is an indirect, wholly owned subsidiary of Deutsche Bank AG.
Deutsche Bank AG is a major global banking institution that is engaged in a
wide range of financial services, including investment management, mutual
funds, retail, private and commercial banking, investment banking and
insurance.
DWS VARIABLE SERIES II - CLASS A SHARES OTHER POLICIES AND
RISKS 127
The Advisor receives a management fee from each portfolio. Below are the
management rates paid by each portfolio for the most recent fiscal year, as a
percentage of each portfolio's average daily net assets:
PORTFOLIO NAME FEE PAID
-------------- --------
DWS Balanced VIP 0.45%*
DWS Blue Chip VIP 0.64%
DWS Core Fixed Income VIP 0.59%
DWS Davis Venture Value VIP 0.79%*
DWS Dreman High Return Equity VIP 0.73%
DWS Dreman Small Mid Cap Value VIP 0.74%
DWS Global Thematic VIP 0.67%*
DWS Government & Agency Securities VIP 0.53%*
DWS High Income VIP 0.59%
DWS International Select Equity VIP 0.75%
DWS Janus Growth & Income VIP 0.75%
DWS Large Cap Value VIP 0.68%
DWS Mid Cap Growth VIP 0.61%
DWS Money Market VIP 0.38%*
DWS Small Cap Growth VIP 0.62%*
DWS Strategic Income VIP 0.65%
DWS Technology VIP 0.75%
DWS Turner Mid Cap Growth VIP 0.80%
* Reflecting the effect of expense limitations and/or fee waivers then in
effect.
Effective May 1, 2008, DWS Balanced VIP pays the Advisor a fee, under the
Investment Management Agreement, calculated daily and paid monthly, at the
annual rate of 0.370% of the portfolio's average daily net assets up to $250
million, 0.345% of the next $750 million and 0.310% over $1 billion.
Effective May 1, 2008, DWS Blue Chip VIP pays the Advisor a fee, under the
Investment Management Agreement, calculated daily and paid monthly, at the
annual rate of 0.550% of the portfolio's average daily net assets up to $250
million, 0.520% of the next $750 million, 0.500% of the next $1.5 billion,
0.480% of the next $2.5 billion, 0.450% of the next $2.5 billion, 0.430% of the
next $2.5 billion, 0.410% of the next $2.5 billion and 0.390% over $12.5
billion.
Effective May 1, 2008, DWS Core Fixed Income VIP pays the Advisor a fee, under
the Investment Management Agreement, calculated daily and paid monthly, at the
annual rate of 0.500% of the portfolio's average daily net assets up to $250
million, 0.470% of the next $750 million, 0.450% of the next $1.5 billion,
0.430% of the next $2.5 billion, 0.400% of the next $2.5 billion, 0.380% of the
next $2.5 billion, 0.360% of the next $2.5 billion and 0.340% over $12.5
billion.
Effective May 1, 2008, DWS Davis Venture Value VIP pays the Advisor a fee,
under the Investment Management Agreement, calculated daily and paid monthly,
at the annual rate of 0.865% of the portfolio's average daily net assets up to
$250 million, 0.840% of the next $250 million, 0.815% of the next $500 million,
0.790% of the next $1.5 billion and 0.765% over $2.5 billion.
Effective May 1, 2008, DWS Dreman High Return Equity VIP pays the Advisor a
fee, under the Investment Management Agreement, calculated daily and paid
monthly, at the annual rate of 0.665% of the portfolio's average daily net
assets up to $250 million, 0.635% of the next $750 million, 0.615% of the next
$1.5 billion, 0.595% of the next $2.5 billion, 0.565% of the next $2.5 billion,
0.555% of the next $2.5 billion, 0.545% of the next $2.5 billion and 0.535%
over $12.5 billion.
Effective May 1, 2008, DWS Dreman Small Mid Cap Value VIP pays the Advisor a
fee, under the Investment Management Agreement, calculated daily and paid
monthly, at the annual rate of 0.650% of the portfolio's average daily net
assets up to $250 million, 0.620% of the next $750 million, 0.600% of the next
$1.5 billion, 0.580% of the next $2.5 billion, 0.550% of the next $2.5 billion,
0.540% of the next $2.5 billion, 0.530% of the next $2.5 billion and 0.520%
over $12.5 billion.
128 THE INVESTMENT ADVISOR DWS VARIABLE SERIES II -
CLASS A SHARES
Effective May 1, 2008, DWS Global Thematic VIP pays the Advisor a fee, under
the Investment Management Agreement, calculated daily and paid monthly, at the
annual rate of 0.915% of the portfolio's average daily net assets up to $250
million, 0.865% of the next $500 million, 0.815% of the next $750 million,
0.765% of the next $1.5 billion and 0.715% over $3 billion.
Effective May 1, 2008, DWS Government & Agency Securities VIP pays the Advisor
a fee, under the Investment Management Agreement, calculated daily and paid
monthly, at the annual rate of 0.450% of the portfolio's average daily net
assets up to $250 million, 0.430% of the next $750 million, 0.410% of the next
$1.5 billion, 0.400% of the next $2.5 billion, 0.380% of the next $2.5 billion,
0.360% of the next $2.5 billion, 0.340% of the next $2.5 billion and 0.320%
over $12.5 billion.
Effective May 1, 2008, DWS High Income VIP pays the Advisor a fee, under the
Investment Management Agreement, calculated daily and paid monthly, at the
annual rate of 0.500% of the portfolio's average daily net assets up to $250
million, 0.470% of the next $750 million, 0.450% of the next $1.5 billion,
0.430% of the next $2.5 billion, 0.400% of the next $2.5 billion, 0.380% of the
next $2.5 billion, 0.360% of the next $2.5 billion and 0.340% over $12.5
billion.
Effective May 1, 2008, DWS International Select Equity VIP pays the Advisor a
fee, under the Investment Management Agreement, calculated daily and paid
monthly, at the annual rate of 0.650% of the portfolio's average daily net
assets up to $1.5 billion, 0.635% of the next $1.75 billion, 0.620% of the next
$1.75 billion and 0.605% over $5 billion.
Effective May 1, 2008, DWS Janus Growth & Income VIP pays the Advisor a fee,
under the Investment Management Agreement, calculated daily and paid monthly,
at the annual rate of 0.665% of the portfolio's average daily net assets up to
$250 million, 0.640% of the next $750 million, 0.615% of the next $1.5 billion
and 0.590% over $2.5 billion.
Effective May 1, 2008, DWS Mid Cap Growth VIP pays the Advisor a fee, under the
Investment Management Agreement, calculated daily and paid monthly, at the
annual rate of 0.665% of the portfolio's average daily net assets up to $250
million, 0.635% of the next $750 million, 0.615% of the next $1.5 billion,
0.595% of the next $2.5 billion, 0.565% of the next $2.5 billion, 0.555% of the
next $2.5 billion, 0.545% of the next $2.5 billion and 0.535% over $12.5
billion.
Effective May 1, 2008, DWS Money Market VIP pays the Advisor a fee, under the
Investment Management Agreement, calculated daily and paid monthly, at the
annual rate of 0.285% of the portfolio's average daily net assets up to $500
million, 0.270% of the next $500 million, 0.255% of the next $1.0 billion and
0.240% over $2 billion.
Effective May 1, 2008, DWS Small Cap Growth VIP pays the Advisor a fee, under
the Investment Management Agreement, calculated daily and paid monthly, at the
annual rate of 0.550% of the portfolio's average daily net assets up to $250
million, 0.525% of the next $750 million and 0.500% over $1 billion.
Effective May 1, 2008, DWS Strategic Income VIP pays the Advisor a fee, under
the Investment Management Agreement, calculated daily and paid monthly, at the
annual rate of 0.550% of the portfolio's average daily net assets up to $250
million, 0.520% of the next $750 million, 0.500% of the next $1.5 billion,
0.480% of the next $2.5 billion, 0.450% of the next $2.5 billion, 0.430% of the
next $2.5 billion, 0.410% of the next $2.5 billion and 0.390% over $12.5
billion.
Effective May 1, 2008, DWS Technology VIP pays the Advisor a fee, under the
Investment Management Agreement, calculated daily and paid monthly, at the
annual rate of 0.665% of the portfolio's average daily net assets up to $250
million, 0.635% of the next $750 million, 0.615% of the next $1.5 billion,
0.595% of the next $2.5 billion, 0.565% of the next $2.5 billion, 0.555% of the
next $2.5 billion, 0.545% of the next $2.5 billion and 0.535% over $12.5
billion.
Effective May 1, 2008, DWS Turner Mid Cap Growth VIP pays the Advisor a fee,
under the Investment Management Agreement, calculated daily and paid monthly,
at the annual rate of 0.715% of the portfolio's average daily net assets up to
$250 million, 0.700% of the next $250 million, 0.685% of the next $500 million
and 0.670% over $1 billion.
DWS VARIABLE SERIES II - CLASS A SHARES THE INVESTMENT
ADVISOR 129
A discussion regarding the basis for the Board renewal of each portfolio's
investment management agreement and, as applicable, subadvisory agreement, is
contained in the shareholder reports for the annual period ended December 31. A
discussion regarding the Board's approval of the new sub-advisory agreement for
DWS Balanced VIP is contained in the portfolio's shareholder report for the
annual period ended December 31, 2007 (see "Shareholder reports" on the back
cover).
In addition, under a separate administrative services agreement between each
portfolio and Deutsche Investment Management Americas Inc., each portfolio pays
the Advisor for providing most of each portfolio's administrative services.
PORTFOLIO SUBADVISORS
SUBADVISOR FOR DWS BALANCED VIP AND DWS LARGE CAP VALUE VIP
The subadvisor for DWS Balanced VIP and DWS Large Cap Value VIP is Deutsche
Asset Management International GmbH ("DeAMi"), Mainzer Landstrasse 178-190,
Frankfurt am Main, Germany. DeAMi renders investment advisory and management
services to the portfolio. DeAMi is an investment advisor registered with the
Securities and Exchange Commission and currently manages over $60 billion in
assets, which is primarily comprised of institutional accounts and investment
companies. DeAMi is a subsidiary of Deutsche Bank AG. DIMA compensates DeAMi
out of the management fee it receives from the portfolio.
SUBADVISOR FOR DWS CORE FIXED INCOME VIP
Pursuant to an investment subadvisory agreement between the Advisor and
Aberdeen Asset Management Inc. ("AAMI"), an investment adviser registered under
the Investment Advisers Act of 1940, as amended, AAMI acts as subadvisor. As
the subadvisor, AAMI, under the supervision of the Board and the Advisor, makes
investment decisions, buys and sells securities and conducts the research that
leads to these purchase and sale decisions. AAMI provides a full range of
international investment advisory services to institutional and retail clients.
AAMI is a direct, wholly owned subsidiary of Aberdeen Asset Management PLC, the
parent company of an asset management group formed in 1983. AAMI is located at
1735 Market Street, Philadelphia, PA 19103.
SUBADVISOR FOR DWS DAVIS VENTURE VALUE VIP
Davis Selected Advisers, L.P., 2949 E. Elvira Road, Suite 101, Tucson, Arizona
85706, is the subadvisor to DWS Davis Venture Value VIP. Davis Selected
Advisers, L.P. began serving as investment advisor to Davis New York Venture
Fund in 1969 and currently serves as investment advisor to all of the Davis
Funds, and acts as advisor or subadvisor for a number of other institutional
accounts including mutual funds and private accounts. DIMA pays a fee to Davis
Selected Advisers, L.P. for acting as subadvisor.
SUBADVISOR FOR DWS DREMAN HIGH RETURN EQUITY VIP AND DWS DREMAN SMALL MID CAP
VALUE VIP
The subadvisor for DWS Dreman High Return Equity VIP and DWS Dreman Small Mid
Cap Value VIP is Dreman Value Management, L.L.C. ("DVM"), 520 East Cooper
Avenue, Suite 230-4, Aspen, CO 81611. DVM was founded in 1977 and currently
manages over $18.9 billion in assets, which is primarily comprised of
institutional accounts and investment companies managed by the advisor.
Pursuant to a subadvisory agreement with DIMA, DVM performs some of the
functions of the Advisor, including making each portfolio's investment
decisions and buying and selling securities for each portfolio.
SUBADVISOR FOR DWS JANUS GROWTH & INCOME VIP
Janus Capital Management LLC ("Janus Capital"), 151 Detroit Street, Denver,
Colorado, is the subadvisor to DWS Janus Growth & Income VIP. Janus Capital
(together with its predecessors) has served as an investment adviser to since
1969 and currently serves as investment adviser or sub-adviser, to Seperately
Managed Accounts, Mutual Funds, as well as Comingled Pools or Private funds and
Wrap Fee Accounts. Janus Capital is a
130 THE INVESTMENT ADVISOR DWS VARIABLE SERIES II -
CLASS A SHARES
direct subsidiary of Janus Capital Group, Inc. ("JCGI"), a publicly traded
company with principal operations in financial asset management businesses.
JCGI owns approximately 95% of Janus Capital, with the remaining 5% held by
Janus Management Holdings Corporation. DIMA pays a fee to Janus Capital for
acting as subadvisor.
Although none of the legal proceedings described below currently involve your
portfolio, these matters affect Janus Capital, your portfolio's subadvisor. The
information that follows has been provided to the portfolio by Janus Capital as
of January 2008.
In the fall of 2003, the Securities and Exchange Commission ("SEC"), the Office
of the New York State Attorney General ("NYAG"), the Colorado Attorney General
("COAG"), and the Colorado Division of Securities ("CDS") announced that they
were investigating alleged frequent trading practices in the mutual fund
industry. On August 18, 2004, Janus Capital announced that it had reached final
settlements with the SEC, the NYAG, the COAG, and the CDS related to such
regulators' investigations into Janus Capital's frequent trading arrangements.
A number of civil lawsuits were brought against Janus Capital and certain of
its affiliates, the Janus funds, and related entities and individuals based on
allegations similar to those announced by the above regulators and were filed
in several state and federal jurisdictions. Such lawsuits alleged a variety of
theories for recovery including, but not limited to, the federal securities
laws, other federal statutes (including ERISA), and various common law
doctrines. The Judicial Panel on Multidistrict Litigation transferred these
actions to the U.S. District Court for the District of Maryland (the "Court")
for coordinated proceedings. On September 29, 2004, five consolidated amended
complaints were filed with the Court that generally include: (i) claims by a
putative class of investors in certain Janus funds asserting claims on behalf
of the investor class (Marini, et al. v. Janus Investment Fund, et al., U.S.
District Court, District of Maryland, Case No. 04-CV-00497); (ii) derivative
claims by investors in certain Janus funds ostensibly on behalf of such funds
(Steinberg et al. v. Janus Capital Management, LLC et al., U.S. District Court,
District of Maryland, Case No. 04-CV-00518); (iii) claims on behalf of
participants in the Janus 401(k) plan (Wangberger v. Janus Capital Group Inc.,
401(k) Advisory Committee, et al., U.S. District Court, District of Maryland,
Case No. JFM-05-2711); (iv) claims brought on behalf of shareholders of Janus
Capital Group Inc. ("JCGI") on a derivative basis against the Board of
Directors of JCGI (Chasen v. Whiston, et al., U.S. District Court, District of
Maryland, Case No. 04-MD-00855); and (v) claims by a putative class of
shareholders of JCGI asserting claims on behalf of the shareholders (Wiggins,
et al. v. Janus Capital Group, Inc., et al., U.S. District Court, District of
Maryland, Case No. 04-CV-00818). Each of the five complaints initially named
JCGI and/or Janus Capital as a defendant. In addition, the following were also
named as defendants in one or more of the actions: Janus Investment Fund
("JIF"), Janus Aspen Series ("JAS"), Janus Adviser Series ("JAD"), Janus
Distributors LLC, Enhanced Investment Technologies, LLC ("INTECH"), Bay Isle
Financial LLC ("Bay Isle"), Perkins, Wolf, McDonnell and Company, LLC
("Perkins"), the Advisory Committee of the Janus 401(k) plan, and the current
or former directors of JCGI.
On August 25, 2005, the Court entered orders dismissing most of the claims
asserted against Janus Capital and its affiliates by fund investors in the
Marini and Steinberg cases (actions (i) and (ii) above) except certain claims
under Section 10(b) of the Securities Exchange Act of 1934 and under Section
36(b) of the Investment Company Act of 1940, as amended (the "1940 Act"). On
August 15, 2006, the Wangberger complaint in the 401(k) plan class action
(action (iii) above) was dismissed by the district court with prejudice. The
plaintiff appealed that dismissal decision to the United States Court of
Appeals for the Fourth Circuit. The appeal is still pending and argument in the
matter was held in December 2007. The Court also dismissed the Chasen lawsuit
(action (iv) above) against JCGI's Board of Directors without leave to amend.
Finally, a Motion to Dismiss the Wiggins suit (action (v) above) was granted
and the matter was dismissed in May 2007. However, in June 2007, Plaintiffs
appealed that dismissal to the United States Court of Appeals for the Fourth
Circuit. That appeal is currently pending.
In addition to the lawsuits described above, the Auditor of the State of West
Virginia ("Auditor"), in his capacity as securities commissioner, has initiated
administrative proceedings against many of the defendants in the market timing
cases (including JCGI and Janus Capital) and, as a part of its relief, is
seeking disgorgement and other monetary relief based on similar market timing
allegations (In the Matter of Janus Capital Group Inc. et al., Before the
Securities Commissioner, State of West Virginia, Summary Order No. 05-1320).
The respondents in these proceedings collectively sought a Writ of Prohibition
in state court, which was denied. Their subsequent Petition for Appeal was also
denied. Consequently, in September 2006, JCGI and Janus Capital filed their
answer to the Auditor's summary order instituting proceedings and requested a
hearing. A status conference
DWS VARIABLE SERIES II - CLASS A SHARES PORTFOLIO
SUBADVISORS 131
was held on June 28, 2007, during which the parties were ordered to submit
their proposed scheduling order. To date, no scheduling order has been entered
in the case. In addition to the pending Motion to Discharge Order to Show
Cause, JCGI and Janus Capital, as well as other similarly situated defendants,
continue to challenge the statutory authority of the Auditor to bring such an
action.
Additional lawsuits may be filed against certain of the Janus funds, Janus
Capital, and related parties in the future. Janus Capital does not currently
believe that these pending actions will materially affect its ability to
continue providing services it has agreed to provide to the Janus funds.
SUBADVISOR FOR DWS TURNER MID CAP GROWTH VIP
Turner Investment Partners, Inc., 1205 Westlakes Drive Suite 100, Berwyn,
Pennsylvania, 19312 is the subadvisor to DWS Turner Mid Cap Growth VIP. As of
December 31, 2007, Turner Investment Partners, Inc. had approximately $29
billion in assets under management. DIMA pays a fee to Turner Investment
Partners, Inc. for acting as subadvisor.
132 PORTFOLIO SUBADVISORS DWS VARIABLE SERIES II -
CLASS A SHARES
--------------------------------------------------------------------------------
YOUR INVESTMENT IN THE PORTFOLIOS
The information in this section may affect anyone who selects one or more
portfolios as an investment option in a variable annuity contract or variable
life insurance policy that offers one or more portfolios. These contracts and
policies are described in separate prospectuses issued by participating
insurance companies. Each portfolio assumes no responsibility for such
prospectuses.
POLICIES ABOUT TRANSACTIONS
The information in this prospectus applies to Class A shares of each portfolio.
Each portfolio offers two classes of shares. Class A shares are offered at net
asset value and are not subject to 12b-1 fees.
Technically, the shareholders of DWS Variable Series II (which include each
portfolio just described) are the participating insurance companies (the
"insurance companies") that offer each portfolio as choices for holders of
certain variable annuity contracts or variable life insurance policies (the
"contract(s)") issued or sponsored by the insurance companies. The insurance
companies effectively pass through the ownership of portfolio shares to their
contract owners and some may pass through voting rights as well. Each portfolio
does not sell shares directly to the public. Each portfolio sells shares only
to separate accounts of insurance companies. As a contract owner, your premium
payments are allocated to a portfolio by the insurance companies in accordance
with your contract. Please see the contract prospectus that accompanies this
prospectus for a detailed explanation of your contract.
Please bear in mind that there are important differences between funds
available to any investor (a "Retail Fund") and those that are only available
through certain financial institutions, such as insurance companies. For
example, Retail Funds, unlike a portfolio, are not sold to insurance company
separate accounts to fund investments in variable insurance contracts. In
addition, the investment objectives, policies and strategies of a portfolio,
while similar to those of a Retail Fund, are not identical. Retail Funds may be
smaller or larger than a portfolio and have different expense ratios than the
portfolios. As a result, the performance of a portfolio and a Retail Fund will
differ.
Should any conflict between contract owners arise that would require that a
substantial amount of net assets be withdrawn from a portfolio, orderly
portfolio management could be disrupted to the potential detriment of contract
owners of that portfolio.
Each portfolio has a verification process for new insurance company accounts to
help the government fight the funding of terrorism and money laundering
activities. Federal law requires all financial institutions to obtain, verify
and record information that identifies each insurance company that opens an
account. This means that when an insurance company opens an account, a
portfolio will ask for its name, address and other information that will allow
a portfolio to identify the company. This information will be verified to
ensure the identity of all insurance companies opening an account.
For certain insurance companies, a portfolio might request additional
information (for instance, a portfolio would ask for documents such as the
insurance company's articles of incorporation) to help a portfolio verify the
insurance company's identity.
Each portfolio will not complete the purchase of any shares for an account
until all information has been provided and the application has been submitted
in "good order." Once the application is determined to be in good order, the
purchase(s) will be effected at the net asset value per share next calculated.
Since DWS Money Market VIP will be investing in instruments that normally
require immediate payment in Federal funds (monies credited to a bank's account
with its regional Federal Reserve Bank), that portfolio has adopted certain
procedures for the convenience of its shareholders and to ensure that DWS Money
Market VIP receives investable funds.
DWS VARIABLE SERIES II - CLASS A SHARES YOUR INVESTMENT IN THE
PORTFOLIOS 133
Each portfolio may reject a new account application if the insurance company
doesn't provide any required or requested identifying information, or for other
reasons.
BUYING AND SELLING SHARES
Each PORTFOLIO IS OPEN FOR BUSINESS each day the New York Stock Exchange is
open. Each portfolio calculates its share price every business day, as of the
close of regular trading on the New York Stock Exchange (typically 4 p.m.
Eastern time, but sometimes earlier, as in the case of scheduled half-day
trading or unscheduled suspensions of trading).
Each portfolio continuously sells shares to each insurance company separate
account, without a sales charge, at the net asset value per share next
determined after a proper purchase order is placed by the insurance company.
The insurance company offers contract owners units in its separate accounts
which correspond to shares in a portfolio. Each insurance company submits
purchase and redemption orders to a portfolio based on allocation instructions
for premium payments, transfer instructions and surrender or partial withdrawal
requests for contract owners, as set forth in the accompanying prospectus for
the contracts. These orders reflect the amount of premium payments to be
invested, surrender and transfer requests, and other matters. Redemption orders
are effected at the next net asset value per share determined after a proper
redemption order is placed by the insurance company. Contract owners should
look at their contract prospectuses for redemption procedures and fees.
IMPORTANT INFORMATION ABOUT BUYING AND SELLING SHARES
o After receiving a contract owner's order, the insurance company buys or sells
shares at the net asset value next calculated on any day each portfolio is
open for business.
o Unless otherwise instructed, each portfolio normally makes payment of the
proceeds from the sale of shares the next business day but always within
seven calendar days.
o Each portfolio does not issue share certificates.
o Each portfolio reserves the right to reject purchases of shares for any
reason.
o Each portfolio reserves the right to withdraw or suspend the offering of
shares at any time.
o Each portfolio reserves the right to reject purchases of shares or to suspend
or postpone redemptions at times when the New York Stock Exchange is closed
(other than customary closings), trading is restricted or when an emergency
exists that prevents a portfolio from disposing of its portfolio securities
or pricing its shares.
o Each portfolio may refuse, cancel or rescind any purchase order; freeze any
account (meaning the insurance company will not be able to purchase shares
in its account); suspend account services; and/or involuntarily redeem the
account if we think that the account is being used for fraudulent or illegal
purposes by the insurance company; one or more of these actions will be
taken when, at the sole discretion of each portfolio, they are deemed to be
in each portfolio's best interest or when each portfolio is requested or
compelled to do so by governmental authority or by applicable law.
o Each portfolio may close and liquidate an account if a portfolio is unable to
verify provided information, or for other reasons; if a portfolio decides to
close the account, the shares will be redeemed at the net asset value per
share next calculated after we determine to close the account; the insurance
company may be subject to gain or loss on the redemption of the portfolio
shares and may incur tax liability.
o Each portfolio may pay you for shares you sell by "redeeming in kind," that
is, by giving you marketable securities (which typically will involve
brokerage costs for you to liquidate) rather than cash, but which will be
taxable to the same extent as a redemption for cash; each portfolio
generally won't make a redemption in kind unless your requests over a 90-day
period total more than $250,000 or 1% of the value of each portfolio's net
assets, whichever is less.
o A purchase order from an insurance company separate account may not be
accepted if the sale of portfolio shares has been suspended or if it is
determined that the purchase would be detrimental to the interests of a
portfolio's shareholders.
134 YOUR INVESTMENT IN THE PORTFOLIOS DWS VARIABLE SERIES II -
CLASS A SHARES
MARKET TIMING POLICIES AND PROCEDURES. Short-term and excessive trading of
portfolio shares may present risks to each portfolio's long-term shareholders
(as used herein, the term "shareholders" may refer to the contract owners),
including potential dilution in the value of portfolio shares, interference
with the efficient management of a portfolio (including losses on the sale of
investments), taxable gains to remaining shareholders and increased brokerage
and administrative costs. These risks may be more pronounced if a portfolio
invests in certain securities such as those that trade in foreign markets, are
illiquid or do not otherwise have "readily available market quotations."
Certain investors may seek to employ short-term trading strategies aimed at
exploiting variations in portfolio valuation that arise from the nature of the
securities held by a portfolio (e.g., "time zone arbitrage"). Each portfolio
has adopted policies and procedures that are intended to detect and deter
short-term and excessive trading.
Pursuant to these policies, each portfolio reserves the right to reject or
cancel a purchase or exchange order for any reason without prior notice. For
example, a portfolio may in its discretion reject or cancel a purchase or an
exchange order even if the transaction is not subject to the specific roundtrip
transaction limitation described below if the Advisor believes that there
appears to be a pattern of short-term or excessive trading activity by a
shareholder or deems any other trading activity harmful or disruptive to a
portfolio. Each portfolio, through its Advisor and transfer agent, will measure
short-term and excessive trading by the number of roundtrip transactions within
a shareholder's account during a rolling 12-month period. A "roundtrip"
transaction is defined as any combination of purchase and redemption activity
(including exchanges) of the same portfolio's shares. Each portfolio may take
other trading activity into account if a portfolio believes such activity is of
an amount or frequency that may be harmful to long-term shareholders or
disruptive to portfolio management.
Shareholders are limited to four roundtrip transactions in the same portfolio
over a rolling 12-month period. Shareholders with four or more roundtrip
transactions in the same portfolio within a rolling 12-month period generally
will be blocked from making additional purchases of, or exchanges into, that
portfolio. Each portfolio has sole discretion whether to remove a block from a
shareholder's account. The rights of a shareholder to redeem shares of each
portfolio are not affected by the four roundtrip transaction limitation.
The Advisor may make exceptions to the roundtrip transaction policy for certain
types of transactions if in its opinion the transactions do not represent
short-term or excessive trading or are not abusive or harmful to each
portfolio, such as, but not limited to, systematic transactions, required
minimum retirement distributions, transactions initiated by each portfolio or
administrator and transactions by certain qualified fund-of-fund(s).
In certain circumstances, each portfolio may rely upon the policy of the
insurance company or other financial intermediary to deter short-term or
excessive trading if the Advisor believes that the policy of such insurance
company or other financial intermediary is reasonably designed to detect and
deter transactions that are not in the best interest of each portfolio. An
insurance company's or other financial intermediary's policy relating to
short-term or excessive trading may be more or less restrictive than each
portfolio's policies, may permit certain transactions not permitted by each
portfolio's policies, or prohibit transactions not subject to each portfolio's
policies.
The Advisor may also accept undertakings from an insurance company or other
financial intermediary to enforce short-term or excessive trading policies on
behalf of each portfolio that provide a substantially similar level of
protection for each portfolio against such transactions. For example, certain
insurance companies may have contractual or legal restrictions, or operational
constraints, that prevent them from blocking an account. In such instances, the
Advisor may permit the insurance company to use alternate techniques that the
Advisor considers to be a reasonable substitute for such a block.
In addition, to the extent that each portfolio invests some portion of its
assets in foreign securities, each portfolio has adopted certain fair valuation
practices intended to protect each portfolio from "time zone arbitrage" with
respect to its foreign securities holdings and other trading practices that
seek to exploit variations in portfolio valuation that arise from the nature of
the securities held by each portfolio. (See "How each Portfolio Calculates
Share Price.")
There is no assurance that these policies and procedures will be effective in
limiting short-term and excessive trading in all cases. For example, the
Advisor may not be able to effectively monitor, detect or limit short-term or
excessive trading by underlying contract holders that occurs through separate
accounts maintained by insurance companies or other financial intermediaries.
The Advisor reviews trading activity at the separate account level to detect
short-term or excessive trading. If the Advisor has reason to suspect that
short-term or excessive trading is occurring at the separate account level, the
Advisor will contact the insurance company or other financial
DWS VARIABLE SERIES II - CLASS A SHARES YOUR INVESTMENT IN THE
PORTFOLIOS 135
intermediary to request underlying shareholder level activity. Depending on the
amount of portfolio shares held in such separate account (which may represent
most of each portfolio's shares), short-term and/or excessive trading of
portfolio shares could adversely affect long-term shareholders in each
portfolio. If short-term or excessive trading is identified, the Advisor will
take appropriate action.
Each portfolio's market timing policies and procedures may be modified or
terminated at any time.
Since DWS Money Market VIP holds short-term instruments and is intended to
provide liquidity to shareholders, the Advisor does not monitor or limit
short-term and excessive trading activity in DWS Money Market VIP and,
accordingly, the Board has not approved any policies and procedures designed to
limit this activity. However, the portfolio reserves the right to and may
reject or cancel a purchase or exchange order into a money market fund for any
reason, including if, in the opinion of the Advisor, there appears to be a
pattern of short-term and excessive trading by an investor in other DWS funds.
HOW TO RECEIVE ACCOUNT INFORMATION
If you are a contract owner, you should contact your insurance company or the
organization that provides record keeping services for information about your
account.
Please see the contract prospectus that accompanies this prospectus for the
customer service phone number.
HOW TO SELECT SHARES
Shares in a portfolio are available in connection with certain variable annuity
and life insurance arrangements. Each insurance company has different
provisions about how and when their contract owners may select portfolio
shares. Each insurance company is responsible for communicating its contract
owners' instructions to a portfolio. Contract owners should contact their
insurance company to effect transactions in connection with a portfolio.
FINANCIAL INTERMEDIARY SUPPORT PAYMENTS
The Advisor, DWS Scudder Distributors, Inc. (the "Distributor") and/or their
affiliates may pay additional compensation, out of their own assets and not as
an additional charge to each portfolio, to selected financial advisors in
connection with the sale and/or distribution of portfolio shares or the
retention and/or servicing of fund investors and fund shares ("revenue
sharing"). Such revenue sharing payments are in addition to any distribution or
service fees payable under any Rule 12b-1 or service plan of each portfolio, any
record keeping/ sub-transfer agency/networking fees payable by each portfolio
(generally through the Distributor or an affiliate) and/or the Distributor to
certain financial advisors for performing such services and any sales charge,
commissions, non-cash compensation arrangements expressly permitted under
applicable rules of the Financial Industry Regulatory Authority or other
concessions described in the fee table or elsewhere in this prospectus or the
Statement of Additional Information as payable to all financial advisors. For
example, the Advisor, the Distributor and/or their affiliates may compensate
financial advisors for providing a portfolio with "shelf space" or access to a
third party platform or portfolio offering list or other marketing programs,
including, without limitation, inclusion of the portfolio on preferred or
recommended sales lists, mutual fund "supermarket" platforms and other formal
sales programs; granting the Distributor access to the financial advisor's sales
force; granting the Distributor access to the financial advisor's conferences
and meetings; assistance in training and educating the financial advisor's
personnel; and obtaining other forms of marketing support.
The level of revenue sharing payments made to financial advisors may be a fixed
fee or based upon one or more of the following factors: gross sales, current
assets and/or number of accounts of each portfolio attributable to the
financial advisor, the particular portfolio or portfolio type or other measures
as agreed to by the Advisor, the Distributor and/or their affiliates and the
financial advisors or any combination thereof. The amount of these revenue
sharing payments is determined at the discretion of the Advisor, the
Distributor and/or their affiliates from time to time, may be substantial, and
may be different for different financial advisors based on, for example, the
nature of the services provided by the financial advisor.
The Advisor, the Distributor and/or their affiliates currently make revenue
sharing payments from their own assets in connection with the sale and/or
distribution of DWS Fund shares or the retention and/or servicing of investors
and DWS Fund shares to financial advisors in amounts that generally range from
..01% up to .50% of assets of each portfolio serviced and maintained by the
financial advisor, .10% to .25% of sales of each portfolio
136 YOUR INVESTMENT IN THE PORTFOLIOS DWS VARIABLE SERIES II -
CLASS A SHARES
attributable to the financial advisor, a flat fee of $13,350 up to $500,000, or
any combination thereof. These amounts are subject to change at the discretion
of the Advisor, the Distributor and/or their affiliates. Receipt of, or the
prospect of receiving, this additional compensation may influence your
financial advisor's recommendation of each portfolio or of any particular share
class of each portfolio. You should review your financial advisor's
compensation disclosure and/or talk to your financial advisor to obtain more
information on how this compensation may have influenced your financial
advisor's recommendation of each portfolio. Additional information regarding
these revenue sharing payments is included in each portfolio's Statement of
Additional Information, which is available to you on request at no charge (see
the back cover of this prospectus for more information on how to request a copy
of the Statement of Additional Information).
The Advisor, the Distributor and/or their affiliates may also make such revenue
sharing payments to financial advisors under the terms discussed above in
connection with the distribution of both DWS funds and non-DWS funds by
financial advisors to retirement plans that obtain record keeping services from
ADP, Inc. on the DWS Scudder branded retirement plan platform (the "Platform")
with the level of revenue sharing payments being based upon sales of both the
DWS funds and the non-DWS funds by the financial advisor on the Platform or
current assets of both the DWS funds and the non-DWS funds serviced and
maintained by the financial advisor on the Platform.
It is likely that broker-dealers that execute portfolio transactions for each
portfolio will include firms that also sell shares of the DWS funds to their
customers. However, the Advisor will not consider sales of DWS fund shares as a
factor in the selection of broker-dealers to execute portfolio transactions for
the DWS funds. Accordingly, the Advisor has implemented policies and procedures
reasonably designed to prevent its traders from considering sales of DWS fund
shares as a factor in the selection of broker-dealers to execute portfolio
transactions for each portfolio. In addition, the Advisor, the Distributor
and/or their affiliates will not use fund brokerage to pay for their obligation
to provide additional compensation to financial advisors as described above.
HOW EACH PORTFOLIO CALCULATES SHARE PRICE
To calculate net asset value per share, or NAV, each portfolio uses the
following equation:
TOTAL ASSETS - TOTAL LIABILITIES
--------------------------- = NAV
TOTAL NUMBER OF SHARES OUTSTANDING
The price at which you buy and sell shares for each portfolio is the NAV.
For DWS Money Market VIP, the share price, or NAV, is normally $1.00 calculated
using amortized cost value (the method used by most money market funds).
We typically value securities using information furnished by an independent
pricing service or market quotations, where appropriate. However, we may use
methods approved by the Board, such as a fair valuation model, which are
intended to reflect fair value when pricing service information or market
quotations are not readily available or when a security's value or a meaningful
portion of the value of a portfolio is believed to have been materially
affected by a significant event, such as a natural disaster, an economic event
like a bankruptcy filing, or a substantial fluctuation in domestic or foreign
markets, that has occurred between the close of the exchange or market on which
the security is principally traded (for example, a foreign exchange or market)
and the close of the New York Stock Exchange. In such a case, a portfolio's
value for a security is likely to be different from the last quoted market
price or pricing service information. In addition, due to the subjective and
variable nature of fair value pricing, it is possible that the value determined
for a particular asset may be materially different from the value realized upon
such asset's sale. It is expected that the greater the percentage of portfolio
assets that is invested in non-US securities, the more extensive will be a
portfolio's use of fair value pricing. This is intended to reduce a portfolio's
exposure to "time zone arbitrage" and other harmful trading practices. (See
"Market Timing Policies and Procedures.")
DWS VARIABLE SERIES II - CLASS A SHARES YOUR INVESTMENT IN THE
PORTFOLIOS 137
DISTRIBUTIONS
DWS Money Market VIP intends to declare its net investment income as a dividend
daily and distribute dividends monthly. All other portfolios intend to declare
and distribute dividends from their net investment income and capital gains, if
any, annually. Each portfolio may make additional distributions if necessary.
All distributions will be reinvested in shares of a portfolio unless we are
informed by an insurance company that they should be paid out in cash. The
insurance companies will be informed about the amount and character of
distributions from the relevant portfolio for federal income tax purposes.
TAXES
Each portfolio intends to qualify each year as a regulated investment company
under Subchapter M of the Internal Revenue Code of 1986, as amended, (the
"Code") and to meet all requirements necessary to avoid paying any federal
income or excise taxes.
Generally, owners of variable annuity and variable life contracts are not taxed
currently on income or gains realized with respect to such contracts. However,
some distributions from such contracts, whether made prior to or during the
annuity payment period, may be taxable at ordinary income tax rates. In
addition, distributions made to an owner who is younger than 59 1/2 may be
subject to a 10% penalty tax. For further information concerning federal income
tax consequences for the holders of variable annuity contracts and variable
life insurance policies, such holders should consult the prospectus used in
connection with the issuance of their particular contracts or policies.
In order for investors to receive the favorable tax treatment available to
holders of variable annuity and variable life contracts, the separate accounts
underlying such contracts, as well as the funds in which such accounts invest,
must meet certain diversification requirements. Each portfolio intends to
comply with these requirements. If a portfolio or separate account does not
meet such requirements or otherwise fails to qualify as a regulated investment
company for any taxable year, income allocable to the contracts associated with
the separate account will be taxable currently to the holders of such contracts
and income from prior periods with respect to such contracts also could be
taxable, most likely in the year of the failure.
Under Treasury regulations, insurance companies holding the separate accounts
may have to report to the Internal Revenue Service losses above a certain
amount resulting from a sale or disposition of a portfolio's shares.
The discussion above is generally based on the assumption that shares of a
portfolio will be respected as owned by insurance company separate accounts. If
this is not the case (for example, because the Internal Revenue Service finds
an impermissible level of "investor control" over the investment options
underlying variable contracts), the advantageous tax treatment provided in
respect of insurance company separate accounts under the Code will no longer be
available, and the person or persons determined to own the portfolio shares
will be currently taxed on portfolio distributions, and on the proceeds of any
redemption of portfolio shares, under the Code rules.
Portfolio investments in securities of foreign issuers may be subject to
withholding and other taxes at the source, including on dividend or interest
payments. Participating insurance companies should consult their own tax
advisors as to whether such distributions are subject to federal income tax if
they are retained as part of policy reserves.
Each portfolio's investments in certain debt obligations may cause each
portfolio to recognize taxable income in excess of the cash generated by such
obligation. Thus, each portfolio could be required at times to liquidate other
investments in order to satisfy its distribution requirements.
The preceding is a brief summary of certain of the relevant tax considerations.
Because each shareholder and contract holder's tax situation is unique, ask
your tax professional about the tax consequences of your investments, including
possible foreign, state or local taxes.
138 DISTRIBUTIONS DWS VARIABLE SERIES II -
CLASS A SHARES
--------------------------------------------------------------------------------
TO GET MORE INFORMATION
SHAREHOLDER REPORTS - These include commentary from each portfolio's management
team about recent market conditions and the effects of each portfolio's
strategies on its performance. They also have detailed performance figures, a
list of everything each portfolio owns, and its financial statements.
Shareholders get these reports automatically.
STATEMENT OF ADDITIONAL INFORMATION (SAI) - This tells you more about each
portfolio's features and policies, including additional risk information. The
SAI is incorporated by reference into this document (meaning that it's legally
part of this prospectus).
For a free copy of any of these documents or to request other information about
a portfolio, call (800) 778-482, or contact DWS Scudder at the address listed
below. Each portfolio's SAI and shareholder reports are also available through
the DWS Scudder Web site at www.dws-scudder.com. These documents and other
information about the portfolio are available from the EDGAR Database on the
SEC's Internet site at www.sec.gov. If you like, you may obtain copies of this
information, after paying a copying fee, by e-mailing a request to
publicinfo@sec.gov or by writing the SEC at the address listed below. You can
also review and copy these documents and other information about the portfolio,
including the portfolio's SAI, at the SEC's Public Reference Room in
Washington, D.C. Information on the operation of the SEC's Public Reference
Room may be obtained by calling (800) SEC-0330.
DWS SCUDDER DISTRIBUTORS, INC. SEC
222 South Riverside Plaza 100 F Street, N.E.
Chicago, IL 60606-5808 Washington, D.C. 20549-0102
(800) 621-1148 WWW.SEC.GOV
(800) SEC-0330
SEC FILE NUMBER:
---------------------------------
DWS Variable Series II 811-5002
(05/01/08) 2a-A
</pre>
STATEMENT OF ADDITIONAL INFORMATION
DWS VARIABLE SERIES I
DWS CAPITAL GROWTH VIP
345 Park Avenue
New York, NY 10154
This statement of additional information is not a prospectus, but should be read in conjunction with the prospectus/proxy Statement dated [ ], 2009 for the special meeting of shareholders of DWS Janus Growth & Income VIP (“Janus Growth & Income VIP”), a series of DWS Variable Series II, to be held on April 13, 2009, into which this statement of additional information is hereby incorporated by reference. Copies of the prospectus/proxy statement may be obtained at no charge by contacting your insurance company or by calling the corresponding Fund at 1-800-621-1048, or from the firm from which this statement of additional information was obtained and are available along with other materials on the Securities and Exchange Commission’s Internet website (http://www.sec.gov). Unless otherwise indicated, capitalized terms used herein and not otherwise defined have the same meanings as are given to them in the Prospectus/Proxy Statement.
Further information about DWS Capital Growth VIP (“Capital Growth VIP”), a series of DWS Variable Series I, is contained in Capital Growth VIP’s statement of additional information dated May 1, 2008, as supplemented from time to time, which is attached to this statement of additional information as Exhibit A. The audited financial statements and related independent registered public accounting firm’s report for Capital Growth VIP contained in the annual report to shareholders for the fiscal year ended December 31, 2008 are incorporated herein by reference. No other parts of the annual report to shareholders are incorporated by reference herein.
The unaudited pro forma financial statements, attached hereto, are intended to present the financial condition and related results of operations of Capital Growth VIP as if the merger had been consummated on December 31, 2008.
Further information about Janus Growth & Income VIP is contained in the statement of additional information dated May 1, 2008, as supplemented from time to time.
The date of this statement of additional information is , 2009.
Pro Forma (DWS Capital Growth VIP & DWS Janus Growth & Income VIP)
Portfolio of Investments (Unaudited)
as of December 31, 2008
| | | | | | | | | | | | |
| | | DWS Capital
Growth VIP
Shares | | DWS Janus Growth
& Income VIP
Shares | | Combined
Pro Forma
Shares | | DWS Capital
Growth VIP
Value ($) | | DWS Janus Growth
& Income VIP
Value ($) ** | | Combined
Pro Forma
Value ($) |
Common Stocks 96.6% | | | | | | | | | | | | |
Consumer Discretionary 8.0% | | | | | | | | | | | | |
Hotels Restaurants & Leisure 2.8% | | | | | | | | | | | | |
Crown Ltd. | | — | | 37,830 | | 37,830 | | — | | 158,361 | | 158,361 |
McDonald’s Corp. | | 265,700 | | — | | 265,700 | | 16,523,883 | | — | | 16,523,883 |
MGM MIRAGE* | | — | | 57,340 | | 57,340 | | — | | 788,998 | | 788,998 |
Starwood Hotels & Resorts Worldwide, Inc. | | — | | 27,005 | | 27,005 | | — | | 483,390 | | 483,390 |
Wynn Resorts Ltd.* | | — | | 18,875 | | 18,875 | | — | | 797,658 | | 797,658 |
| | | | | | | | | | | | |
| | | | | | | | 16,523,883 | | 2,228,407 | | 18,752,290 |
| | | | | | | | | | | | |
| | | | | | |
Internet & Catalog Retail 0.0% | | | | | | | | | | | | |
Liberty Media Corp. - Interactive “A”* | | — | | 11,640 | | 11,640 | | — | | 36,317 | | 36,317 |
| | | | | | |
Media 0.6% | | | | | | | | | | | | |
The DIRECTV Group, Inc.* | | — | | 33,515 | | 33,515 | | — | | 767,829 | | 767,829 |
Walt Disney Co. | | 133,200 | | — | | 133,200 | | 3,022,308 | | — | | 3,022,308 |
| | | | | | | | | | | | |
| | | | | | | | 3,022,308 | | 767,829 | | 3,790,137 |
| | | | | | | | | | | | |
| | | | | | |
Multiline Retail 1.3% | | | | | | | | | | | | |
Kohl’s Corp.* | | 238,200 | | — | | 238,200 | | 8,622,840 | | — | | 8,622,840 |
| | | | | | |
Specialty Retail 2.5% | | | | | | | | | | | | |
Esprit Holdings Ltd. | | — | | 264,025 | | 264,025 | | — | | 1,504,951 | | 1,504,951 |
GameStop Corp. “A”* | | 210,100 | | — | | 210,100 | | 4,550,766 | | — | | 4,550,766 |
Staples, Inc. | | 413,565 | | — | | 413,565 | | 7,411,085 | | — | | 7,411,085 |
Tiffany & Co. | | 136,700 | | 22,250 | | 158,950 | | 3,230,221 | | 525,767 | | 3,755,988 |
| | | | | | | | | | | | |
| | | | | | | | 15,192,072 | | 2,030,718 | | 17,222,790 |
| | | | | | | | | | | | |
| | | | | | |
Textiles, Apparel & Luxury Goods 0.8% | | | | | | | | | | | | |
NIKE, Inc. “B” | | 88,400 | | 20,425 | | 108,825 | | 4,508,400 | | 1,041,675 | | 5,550,075 |
| | | | | | |
Consumer Staples 14.9% | | | | | | | | | | | | |
Beverages 4.4% | | | | | | | | | | | | |
Anheuser-Busch InBev NV | | — | | 155,601 | | 155,601 | | — | | 3,607,505 | | 3,607,505 |
Anheuser-Busch InBev NV (VVRP Strip)* | | — | | 88,376 | | 88,376 | | — | | 492 | | 492 |
Diageo PLC | | 506,526 | | — | | 506,526 | | 6,998,559 | | — | | 6,998,559 |
PepsiCo, Inc. | | 349,325 | | — | | 349,325 | | 19,132,530 | | — | | 19,132,530 |
| | | | | | | | | | | | |
| | | | | | | | 26,131,089 | | 3,607,997 | | 29,739,086 |
| | | | | | | | | | | | |
| | | | | | |
Food & Staples Retailing 4.3% | | | | | | | | | | | | |
CVS Caremark Corp. | | — | | 101,200 | | 101,200 | | — | | 2,908,488 | | 2,908,488 |
Shoppers Drug Mart Corp. | | 105,100 | | — | | 105,100 | | 4,090,770 | | — | | 4,090,770 |
Wal-Mart Stores, Inc. | | 294,400 | | — | | 294,400 | | 16,504,064 | | — | | 16,504,064 |
Walgreen Co. | | 216,800 | | — | | 216,800 | | 5,348,456 | | — | | 5,348,456 |
| | | | | | | | | | | | |
| | | | | | | | 25,943,290 | | 2,908,488 | | 28,851,778 |
| | | | | | | | | | | | |
Pro Forma (DWS Capital Growth VIP & DWS Janus Growth & Income VIP)
Portfolio of Investments (Unaudited)
as of December 31, 2008
| | | | | | | | | | | | |
| | | DWS Capital
Growth VIP
Shares | | DWS Janus Growth
& Income VIP
Shares | | Combined
Pro Forma
Shares | | DWS Capital
Growth VIP
Value ($) | | DWS Janus Growth
& Income VIP
Value ($) ** | | Combined
Pro Forma
Value ($) |
Food Products 3.6% | | | | | | | | | | | | |
Dean Foods Co.* | | 181,618 | | — | | 181,618 | | 3,263,676 | | — | | 3,263,676 |
General Mills, Inc. | | 49,400 | | — | | 49,400 | | 3,001,050 | | — | | 3,001,050 |
Groupe DANONE | | 110,035 | | — | | 110,035 | | 6,604,556 | | — | | 6,604,556 |
Kellogg Co. | | 162,200 | | — | | 162,200 | | 7,112,470 | | — | | 7,112,470 |
Nestle SA (ADR) (Registered) | | — | | 44,982 | | 44,982 | | — | | 1,785,785 | | 1,785,785 |
Nestle SA (Registered) | | — | | 68,430 | | 68,430 | | — | | 2,697,003 | | 2,697,003 |
| | | | | | | | | | | | |
| | | | | | | | 19,981,752 | | 4,482,788 | | 24,464,540 |
| | | | | | | | | | | | |
Household Products 2.2% | | | | | | | | | | | | |
Colgate-Palmolive Co. | | 139,240 | | — | | 139,240 | | 9,543,510 | | — | | 9,543,510 |
Procter & Gamble Co. | | 72,770 | | — | | 72,770 | | 4,498,641 | | — | | 4,498,641 |
Reckitt Benckiser Group PLC | | — | | 33,918 | | 33,918 | | — | | 1,263,596 | | 1,263,596 |
| | | | | | | | | | | | |
| | | | | | | | 14,042,151 | | 1,263,596 | | 15,305,747 |
| | | | | | | | | | | | |
Tobacco 0.4% | | | | | | | | | | | | |
Altria Group, Inc. | | — | | 41,620 | | 41,620 | | — | | 626,797 | | 626,797 |
Philip Morris International, Inc. | | — | | 41,620 | | 41,620 | | — | | 1,810,886 | | 1,810,886 |
| | | | | | | | | | | | |
| | | | | | | | — | | 2,437,683 | | 2,437,683 |
| | | | | | | | | | | | |
Energy 10.3% | | | | | | | | | | | | |
Energy Equipment & Services 2.3% | | | | | | | | | | | | |
Halliburton Co. | | 242,200 | | — | | 242,200 | | 4,403,196 | | — | | 4,403,196 |
Noble Corp. | | 152,700 | | — | | 152,700 | | 3,373,143 | | — | | 3,373,143 |
Schlumberger Ltd. | | 126,400 | | — | | 126,400 | | 5,350,512 | | — | | 5,350,512 |
Transocean Ltd.* | | 56,927 | | — | | 56,927 | | 2,689,801 | | — | | 2,689,801 |
| | | | | | | | | | | | |
| | | | | | | | 15,816,652 | | — | | 15,816,652 |
| | | | | | | | | | | | |
Oil, Gas & Consumable Fuels 8.0% | | | | | | | | | | | | |
ConocoPhillips | | 104,660 | | 45,000 | | 149,660 | | 5,421,388 | | 2,331,000 | | 7,752,388 |
Devon Energy Corp. | | 165,700 | | — | | 165,700 | | 10,888,147 | | — | | 10,888,147 |
EnCana Corp. | | — | | 45,668 | | 45,668 | | — | | 2,122,648 | | 2,122,648 |
EOG Resources, Inc. | | 119,725 | | 17,195 | | 136,920 | | 7,971,290 | | 1,144,843 | | 9,116,133 |
ExxonMobil Corp. | | 143,000 | | — | | 143,000 | | 11,415,690 | | — | | 11,415,690 |
Hess Corp. | | — | | 53,259 | | 53,259 | | — | | 2,856,813 | | 2,856,813 |
XTO Energy, Inc. | | 281,982 | | — | | 281,982 | | 9,945,505 | | — | | 9,945,505 |
| | | | | | | | | | | | |
| | | | | | | | 45,642,020 | | 8,455,304 | | 54,097,324 |
| | | | | | | | | | | | |
Financials 3.4% | | | | | | | | | | | | |
Capital Markets 1.5% | | | | | | | | | | | | |
Charles Schwab Corp. | | 239,000 | | — | | 239,000 | | 3,864,630 | | — | | 3,864,630 |
Credit Suisse Group AG (ADR) | | — | | 27,295 | | 27,295 | | — | | 771,356 | | 771,356 |
Morgan Stanley | | — | | 70,720 | | 70,720 | | — | | 1,134,349 | | 1,134,349 |
State Street Corp. | | 84,470 | | — | | 84,470 | | 3,322,205 | | — | | 3,322,205 |
The Goldman Sachs Group, Inc. | | — | | 9,315 | | 9,315 | | — | | 786,093 | | 786,093 |
| | | | | | | | | | | | |
| | | | | | | | 7,186,835 | | 2,691,798 | | 9,878,633 |
| | | | | | | | | | | | |
Real Estate Management & Development 0.0% | | | | | | | | | | | | |
Hang Lung Properties Ltd. | | — | | 140,725 | | 140,725 | | — | | 308,694 | | 308,694 |
Pro Forma (DWS Capital Growth VIP & DWS Janus Growth & Income VIP)
Portfolio of Investments (Unaudited)
as of December 31, 2008
| | | | | | | | | | | | |
| | | DWS Capital
Growth VIP
Shares | | DWS Janus Growth
& Income VIP
Shares | | Combined
Pro Forma
Shares | | DWS Capital
Growth VIP
Value ($) | | DWS Janus Growth
& Income VIP
Value ($) ** | | Combined
Pro Forma
Value ($) |
Diversified Financial Services 0.6% | | | | | | | | | | | | |
CME Group, Inc. | | 19,937 | | — | | 19,937 | | 4,149,089 | | — | | 4,149,089 |
| | | | | | |
Insurance 1.3% | | | | | | | | | | | | |
Aflac, Inc. | | 187,724 | | — | | 187,724 | | 8,605,268 | | — | | 8,605,268 |
| | | | | | |
Health Care 21.2% | | | | | | | | | | | | |
Biotechnology 6.0% | | | | | | | | | | | | |
Celgene Corp.* | | 146,900 | | 11,295 | | 158,195 | | 8,120,632 | | 624,388 | | 8,745,020 |
Genentech, Inc.* | | 110,350 | | 12,210 | | 122,560 | | 9,149,118 | | 1,012,331 | | 10,161,449 |
Gilead Sciences, Inc.* | | 429,620 | | — | | 429,620 | | 21,970,767 | | — | | 21,970,767 |
| | | | | | | | | | | | |
| | | | | | | | 39,240,517 | | 1,636,719 | | 40,877,236 |
| | | | | | | | | | | | |
Health Care Equipment & Supplies 5.9% | | | | | | | | | | | | |
Alcon, Inc. | | — | | 13,505 | | 13,505 | | — | | 1,204,511 | | 1,204,511 |
Baxter International, Inc. | | 287,800 | | 13,245 | | 301,045 | | 15,423,202 | | 709,799 | | 16,133,001 |
C.R. Bard, Inc. | | 96,500 | | — | | 96,500 | | 8,131,090 | | — | | 8,131,090 |
Covidien Ltd. | | — | | 16,345 | | 16,345 | | — | | 592,343 | | 592,343 |
Hologic, Inc.* | | 181,500 | | — | | 181,500 | | 2,372,205 | | — | | 2,372,205 |
Medtronic, Inc. | | 194,300 | | — | | 194,300 | | 6,104,906 | | — | | 6,104,906 |
Zimmer Holdings, Inc.* | | 135,840 | | — | | 135,840 | | 5,490,653 | | — | | 5,490,653 |
| | | | | | | | | | | | |
| | | | | | | | 37,522,056 | | 2,506,653 | | 40,028,709 |
| | | | | | | | | | | | |
Health Care Providers & Services 1.4% | | | | | | | | | | | | |
Laboratory Corp. of America Holdings* | | 105,300 | | — | | 105,300 | | 6,782,373 | | — | | 6,782,373 |
UnitedHealth Group, Inc. | | 34,685 | | 75,070 | | 109,755 | | 922,621 | | 1,996,862 | | 2,919,483 |
| | | | | | | | | | | | |
| | | | | | | | 7,704,994 | | 1,996,862 | | 9,701,856 |
| | | | | | | | | | | | |
Life Sciences Tools & Services 1.0% | | | | | | | | | | | | |
Thermo Fisher Scientific, Inc.* | | 193,400 | | — | | 193,400 | | 6,589,138 | | — | | 6,589,138 |
| | | | | | |
Pharmaceuticals 6.9% | | | | | | | | | | | | |
Abbott Laboratories | | 292,200 | | — | | 292,200 | | 15,594,714 | | — | | 15,594,714 |
Allergan, Inc. | | — | | 24,635 | | 24,635 | | — | | 993,283 | | 993,283 |
Bristol-Myers Squibb Co. | | — | | 27,660 | | 27,660 | | — | | 643,095 | | 643,095 |
Eli Lilly & Co. | | 92,400 | | — | | 92,400 | | 3,720,948 | | — | | 3,720,948 |
Johnson & Johnson | | 365,466 | | — | | 365,466 | | 21,865,831 | | — | | 21,865,831 |
Merck & Co., Inc. | | — | | 45,490 | | 45,490 | | — | | 1,382,896 | | 1,382,896 |
Roche Holding AG (Genusschein) | | — | | 8,737 | | 8,737 | | — | | 1,344,919 | | 1,344,919 |
Wyeth | | — | | 24,865 | | 24,865 | | — | | 932,686 | | 932,686 |
| | | | | | | | | | | | |
| | | | | | | | 41,181,493 | | 5,296,879 | | 46,478,372 |
| | | | | | | | | | | | |
Industrials 9.3% | | | | | | | | | | | | |
Aerospace & Defense 4.3% | | | | | | | | | | | | |
BAE Systems PLC (ADR) | | — | | 17,805 | | 17,805 | | — | | 397,230 | | 397,230 |
Boeing Co. | | — | | 28,590 | | 28,590 | | — | | 1,219,935 | | 1,219,935 |
Empresa Brasiliera de Aeronautica SA (ADR) | | — | | 50,013 | | 50,013 | | — | | 810,711 | | 810,711 |
Goodrich Corp. | | 208,300 | | — | | 208,300 | | 7,711,266 | | — | | 7,711,266 |
Honeywell International, Inc. | | 244,700 | | — | | 244,700 | | 8,033,501 | | — | | 8,033,501 |
Pro Forma (DWS Capital Growth VIP & DWS Janus Growth & Income VIP)
Portfolio of Investments (Unaudited)
as of December 31, 2008
| | | | | | | | | | | | |
| | | DWS Capital
Growth VIP
Shares | | DWS Janus Growth
& Income VIP
Shares | | Combined
Pro Forma
Shares | | DWS Capital
Growth VIP
Value ($) | | DWS Janus Growth
& Income VIP
Value ($) ** | | Combined
Pro Forma
Value ($) |
United Technologies Corp. | | 200,200 | | — | | 200,200 | | 10,730,720 | | — | | 10,730,720 |
| | | | | | | | | | | | |
| | | | | | | | 26,475,487 | | 2,427,876 | | 28,903,363 |
| | | | | | | | | | | | |
Electrical Equipment 1.7% | | | | | | | | | | | | |
Emerson Electric Co. | | 301,900 | | — | | 301,900 | | 11,052,559 | | — | | 11,052,559 |
JA Solar Holdings Co., Ltd. (ADR)* | | — | | 52,345 | | 52,345 | | — | | 228,748 | | 228,748 |
Suntech Power Holdings Co., Ltd. (ADR)* | | — | | 24,612 | | 24,612 | | — | | 287,960 | | 287,960 |
| | | | | | | | | | | | |
| | | | | | | | 11,052,559 | | 516,708 | | 11,569,267 |
| | | | | | | | | | | | |
Machinery 1.2% | | | | | | | | | | | | |
Caterpillar, Inc. | | 32,200 | | — | | 32,200 | | 1,438,374 | | — | | 1,438,374 |
Danaher Corp. | | — | | 13,820 | | 13,820 | | — | | 782,350 | | 782,350 |
Parker Hannifin Corp. | | 149,200 | | — | | 149,200 | | 6,346,968 | | — | | 6,346,968 |
| | | | | | | | | | | | |
| | | | | | | | 7,785,342 | | 782,350 | | 8,567,692 |
| | | | | | | | | | | | |
Road & Rail 2.1% | | | | | | | | | | | | |
Canadian National Railway Co. | | 254,900 | | — | | 254,900 | | 9,370,124 | | — | | 9,370,124 |
Norfolk Southern Corp. | | 102,800 | | — | | 102,800 | | 4,836,740 | | — | | 4,836,740 |
| | | | | | | | | | | | |
| | | | | | — | | 14,206,864 | | — | | 14,206,864 |
| | | | | | | | | | | | |
Information Technology 21.2% | | | | | | | | | | | | |
Communications Equipment 3.6% | | | | | | | | | | | | |
Cisco Systems, Inc.* | | 558,720 | | 35,285 | | 594,005 | | 9,107,136 | | 575,146 | | 9,682,282 |
Corning, Inc. | | — | | 149,242 | | 149,242 | | — | | 1,422,276 | | 1,422,276 |
Nokia Oyj (ADR) | | — | | 43,038 | | 43,038 | | — | | 671,393 | | 671,393 |
QUALCOMM, Inc. | | 275,700 | | 36,645 | | 312,345 | | 9,878,331 | | 1,312,990 | | 11,191,321 |
Research In Motion Ltd.* | | — | | 26,135 | | 26,135 | | — | | 1,060,558 | | 1,060,558 |
| | | | | | | | | | | | |
| | | | | | | | 18,985,467 | | 5,042,363 | | 24,027,830 |
| | | | | | | | | | | | |
Computers & Peripherals 6.4% | | | | | | | | | | | | |
Apple, Inc.* | | 142,835 | | 23,694 | | 166,529 | | 12,190,967 | | 2,022,283 | | 14,213,250 |
EMC Corp.* | | 378,615 | | 80,680 | | 459,295 | | 3,964,099 | | 844,720 | | 4,808,819 |
Hewlett-Packard Co. | | 365,000 | | — | | 365,000 | | 13,245,850 | | — | | 13,245,850 |
International Business Machines Corp. | | 134,700 | | — | | 134,700 | | 11,336,352 | | — | | 11,336,352 |
| | | | | | | | | | | | |
| | | | | | | | 40,737,268 | | 2,867,003 | | 43,604,271 |
| | | | | | | | | | | | |
Electronic Equipment, Instruments & Components 1.0% | | | | | | | | | | | | |
Amphenol Corp. “A” | | — | | 11,845 | | 11,845 | | — | | 284,043 | | 284,043 |
Mettler-Toledo International, Inc.* | | 97,300 | | — | | 97,300 | | 6,558,020 | | — | | 6,558,020 |
| | | | | | | | | | | | |
| | | | | | | | 6,558,020 | | 284,043 | | 6,842,063 |
| | | | | | | | | | | | |
Internet Software & Services 0.9% | | | | | | | | | | | | |
eBay, Inc.* | | — | | 39,690 | | 39,690 | | — | | 554,072 | | 554,072 |
Google, Inc. “A”* | | 17,825 | | — | | 17,825 | | 5,483,861 | | — | | 5,483,861 |
| | | | | | | | | | | | |
| | | | | | | | 5,483,861 | | 554,072 | | 6,037,933 |
| | | | | | | | | | | | |
IT Services 3.5% | | | | | | | | | | | | |
Accenture Ltd. “A” | | 324,300 | | — | | 324,300 | | 10,633,797 | | — | | 10,633,797 |
Fiserv, Inc.* | | 137,400 | | — | | 137,400 | | 4,997,238 | | — | | 4,997,238 |
Visa, Inc. “A” | | 129,000 | | 9,960 | | 138,960 | | 6,766,050 | | 522,402 | | 7,288,452 |
Western Union Co. | | — | | 61,260 | | 61,260 | | — | | 878,469 | | 878,469 |
| | | | | | | | | | | | |
| | | | | | | | 22,397,085 | | 1,400,871 | | 23,797,956 |
| | | | | | | | | | | | |
Pro Forma (DWS Capital Growth VIP & DWS Janus Growth & Income VIP)
Portfolio of Investments (Unaudited)
as of December 31, 2008
| | | | | | | | | | | | |
| | | DWS Capital
Growth VIP
Shares | | DWS Janus Growth
& Income VIP
Shares | | Combined
Pro Forma
Shares | | DWS Capital
Growth VIP
Value ($) | | DWS Janus Growth
& Income VIP
Value ($) ** | | Combined
Pro Forma
Value ($) |
Semiconductors & Semiconductor Equipment 2.1% | | | | | | | | | | | | |
Broadcom Corp. “A”* | | 156,200 | | — | | 156,200 | | 2,650,714 | | — | | 2,650,714 |
Intel Corp. | | 763,090 | | — | | 763,090 | | 11,186,900 | | — | | 11,186,900 |
| | | | | | | | | | | | |
| | | | | | | | 13,837,614 | | — | | 13,837,614 |
| | | | | | | | | | | | |
Software 3.7% | | | | | | | | | | | | |
Adobe Systems, Inc.* | | 268,475 | | — | | 268,475 | | 5,715,833 | | — | | 5,715,833 |
Citrix Systems, Inc.* | | — | | 11,845 | | 11,845 | | — | | 279,187 | | 279,187 |
Electronic Arts, Inc.* | | 147,700 | | — | | 147,700 | | 2,369,108 | | — | | 2,369,108 |
Microsoft Corp. | | 585,380 | | 53,575 | | 638,955 | | 11,379,787 | | 1,041,498 | | 12,421,285 |
Nintendo Co., Ltd. (ADR) | | — | | 21,100 | | 21,100 | | — | | 1,007,525 | | 1,007,525 |
Oracle Corp.* | | — | | 192,650 | | 192,650 | | — | | 3,415,684 | | 3,415,684 |
| | | | | | | | | | | | |
| | | | | | | | 19,464,728 | | 5,743,894 | | 25,208,622 |
| | | | | | | | | | | | |
Materials 7.0% | | | | | | | | | | | | |
Chemicals 5.0% | | | | | | | | | | | | |
Ecolab, Inc. | | 294,100 | | — | | 294,100 | | 10,337,615 | | — | | 10,337,615 |
Monsanto Co. | | 154,700 | | 5,455 | | 160,155 | | 10,883,145 | | 383,759 | | 11,266,904 |
Praxair, Inc. | | 161,300 | | 8,530 | | 169,830 | | 9,574,768 | | 506,341 | | 10,081,109 |
Syngenta AG (ADR) | | — | | 48,250 | | 48,250 | | — | | 1,888,505 | | 1,888,505 |
| | | | | | | | | | | | |
| | | | | | | | 30,795,528 | | 2,778,605 | | 33,574,133 |
| | | | | | | | | | | | |
Metals & Mining 2.0% | | | | | | | | | | | | |
Barrick Gold Corp. | | 316,500 | | — | | 316,500 | | 11,637,705 | | — | | 11,637,705 |
Freeport-McMoRan Copper & Gold, Inc. | | 85,800 | | — | | 85,800 | | 2,096,952 | | — | | 2,096,952 |
| | | | | | | | | | | | |
| | | | | | | | 13,734,657 | | — | | 13,734,657 |
| | | | | | | | | | | | |
Telecommunication Services 0.9% | | | | | | | | | | | | |
Diversified Telecommunication Services | | | | | | | | | | | | |
AT&T, Inc. | | 219,000 | | — | | 219,000 | | 6,241,500 | | — | | 6,241,500 |
| | | | | | |
Utilities 0.4% | | | | | | | | | | | | |
Electric Utilities | | | | | | | | | | | | |
Allegheny Energy, Inc. | | 80,100 | | — | | 80,100 | | 2,712,186 | | — | | 2,712,186 |
| | | | | | | | | | | | |
Total Common Stocks (Cost $574,082,567, $81,633,867 and $655,716,434 respectively) | | | | | | | | 588,074,013 | | 66,096,192 | | 654,170,205 |
| | | | | | | | | | | | |
| | | | | | |
Preferred Stock 0.0% | | | | | | | | | | | | |
Financials | | | | | | | | | | | | |
Citigroup, Inc., Series AA, 8.125% (Cost $413,997) | | — | | 18,325 | | 18,325 | | — | | 292,284 | | 292,284 |
| | | | | | |
Corporate Bonds 0.1% | | | | | | | | | | | | |
Consumer Discretionary 0.1% | | | | | | | | | | | | |
MGM MIRAGE, 8.5%, 9/15/2010 | | — | | 346,000 | | 346,000 | | — | | 290,640 | | 290,640 |
| | | | | | |
Energy 0.0% | | | | | | | | | | | | |
Suntech Power Holdings Co., Ltd., 144A, 3.0%, 3/15/2013 | | — | | 623,000 | | 623,000 | | — | | 249,979 | | 249,979 |
| | | | | | | | | | | | |
Total Corporate Bonds (Cost $850,506) | | | | | | | | — | | 540,619 | | 540,619 |
| | | | | | | | | | | | |
Pro Forma (DWS Capital Growth VIP & DWS Janus Growth & Income VIP)
Portfolio of Investments (Unaudited)
as of December 31, 2008
| | | | | | | | | | | | | | | |
| | | DWS Capital
Growth VIP
Shares | | DWS Janus Growth
& Income VIP
Shares | | Combined
Pro Forma
Shares | | DWS Capital
Growth VIP
Value ($) | | | DWS Janus Growth
& Income VIP
Value ($) ** | | | Combined
Pro Forma
Value ($) | |
Government & Agency Obligations 0.8% | | | | | | | | | | | | | | | |
US Treasury Obligations | | | | | | | | | | | | | | | |
US Treasury Notes: | | | | | | | | | | | | | | | |
1.5%, 10/31/2010 | | — | | 844,000 | | 844,000 | | — | | | 856,594 | | | 856,594 | |
2.125%, 1/31/2010 | | — | | 2,326,000 | | 2,326,000 | | — | | | 2,368,612 | | | 2,368,612 | |
2.75%, 7/31/2010 | | — | | 646,000 | | 646,000 | | — | | | 669,216 | | | 669,216 | |
3.375%, 7/31/2013 | | — | | 646,000 | | 646,000 | | — | | | 705,604 | | | 705,604 | |
4.875%, 7/31/2011 | | — | | 646,000 | | 646,000 | | — | | | 712,972 | | | 712,972 | |
| | | | | | | | | | | | | | | |
| | | | | | |
Total Government & Agency Obligations (Cost $5,164,642) | | | | | | | | — | | | 5,312,998 | | | 5,312,998 | |
| | | | | | | | | | | | | | | |
| | | | | | |
Securities Lending Collateral 21.9% | | | | | | | | | | | | | | | |
Daily Assets Fund Institutional, 1.69% (a) (b) | | 137,751,495 | | 10,735,723 | | 148,487,218 | | 137,751,495 | | | 10,735,723 | | | 148,487,218 | |
(Cost $137,751,495, $10,735,723, $148,487,218 respectively) | | | | | | | | | | | | | | | |
| | | | | | |
Cash Equivalents 2.6% | | | | | | | | | | | | | | | |
Cash Management QP Trust, 1.42% (a) | | 16,636,327 | | 646,439 | | 17,282,766 | | 16,636,327 | | | 646,439 | | | 17,282,766 | |
(Cost $16,636,327, $646,439 and $17,282,766 respectively) | | | | | | | | | | | | | | | |
| | | | | | |
Total Investment Portfolio (Cost $728,470,389, $99,445,174, and $827,915,563 respectively) 122.0% | | | | | | | | 742,461,835 | | | 83,624,255 | | | 826,086,090 | |
Other Assets and Liabilities, Net (22.0)% | | | | | | | | (138,040,166 | ) | | (10,876,343 | ) | | (149,167,509 | )(1) |
| | | | | | | | | | | | | | | |
Net Assets 100.0% | | | | | | | | 604,421,669 | | | 72,747,912 | | | 676,918,581 | (1) |
| | | | | | | | | | | | | | | |
| * | Non-income producing security. |
| ** | DWS Investments has represented that it expects that all of DWS Janus Growth & Income VIP’s portfolio holdings will be liquidated prior to the merger and the proceeds reinvested in other securities so that at the time of the merger, DWS Janus Growth & Income VIP’s portfolio will conform more closely to DWS Capital Growth VIP’s current implementation of its investment object, policies, restrictions and strategies. |
| (1) | Includes estimated pre-merger transaction costs and one time merger costs of $251,000, which are to be borne by DWS Janus Growth & Income, subject to the limitation described on page [23]. |
| (a) | Affiliated fund managed by Deutsche Investment Management Americas Inc. The rate shown is the annualized seven-day yield at period end. |
| (b) | Represents collateral held in connection with securities lending. Income earned is net of borrowers rebates. |
ADR: American Depositary Receipt
PRO FORMA CAPITALIZATION (UNAUDITED)
The following table sets forth the unaudited capitalization of DWS Capital Growth VIP and DWS Janus Growth & Income VIP as of December 31, 2008 giving effect to the proposed acquisition of assets at net asset value as of that date.(1) (2)
| | | | | | | | | | | | | |
| | | Acquiring | | Acquired | | | | | | | |
| | | DWS Capital Growth VIP | | DWS Janus Growth &
Income VIP | | Pro Forma
Adjustments | | | Pro Forma
Combined | | Check |
Net Assets | | | | | | | | | | | | | |
Class A | | $ | 593,927,716 | | $ | 72,747,912 | | (251,000 | ) | | 666,424,628 | | — |
Class B | | $ | 10,493,953 | | $ | — | | — | | | 10,493,953 | | — |
Total Net assets | | $ | 604,421,669 | | $ | 72,747,912 | | (251,000 | ) | | 676,918,581 | | — |
| | | | | |
Shares outstanding | | | | | | | | | | | | | |
Class A | | | 43,844,542 | | | 10,707,778 | | (5,357,452 | ) | | 49,194,868 | | — |
Class B | | | 777,803 | | | — | | | | | 777,803 | | — |
| | | | | |
Net Asset Value per share | | | | | | | | | | | | | |
Class A | | | 13.55 | | | 6.79 | | — | | | 13.55 | | — |
Class B | | | 13.49 | | | | | — | | | 13.49 | | — |
| 1) | Assumes the Reorganization had been consummated on December 31, 2008 and is for information purposes only. No assurance can be given as to how many shares of the DWS Capital Growth VIP will be received by the shareholders of the DWS Janus Growth & Income VIP on the date the Reorganization takes place, and the foregoing should not be relied upon to reflect the number of shares of the DWS Capital Growth VIP will be received by the shareholders of the DWS Janus Growth & Income VIP that actually will be received on or after such date. |
| 2) | Pro Forma adjustments include estimated one-time merger costs of $251,000 expected to be borne by Janus Growth & Income. Pursuant to the Agreement, Janus Growth & Income will bear all the expenses of the merger, including the Pre-Merger Transaction Costs, subject to the cap agreed to by DIMA. DIMA has agreed to bear all the expenses of the merger, including the Pre-Merger Transaction Costs, to the extent that the expenses of the merger exceed the estimated total one-year economic benefit expected to be realized by Janus Growth & Income through the merger (please see page 23 for a description of how such estimated benefit is calculated). As of December 31, 2008, the estimated one-year economic benefit to Janus Growth & Income was $271,000 and the total estimated expenses of the merger, including the Pre-Merger Transaction Costs, were $251,000. Therefore, based on estimates as of December 31, 2008, the cap agreed to by DIMA is not expected to be triggered and Janus Growth & Income is expected to bear the expected to bear the expenses of the merger. You should note that the above dollar amounts are only estimates and the actual merger costs borne by Janus Growth & Income may be higher or lower. |
PRO FORMA FINANCIAL STATEMENTS (UNAUDITED)
PRO FORMA COMBINING CONDENSED STATEMENT OF ASSETS AND LIABILITIES
As Of December 31, 2008 (Unaudited)
| | | | | | | | | | | | | | | | |
| | | Acquiring | | | Acquiring | | | Pro Forma
Adjustments | | | Pro Forma
Combined | |
| | | DWS Capital Growth VIP | | | DWS Janus Growth &
Income VIP | | | |
Investments, at value | | $ | 742,461,835 | | | $ | 83,624,255 | | | $ | — | | | $ | 826,086,090 | |
Cash overdraft | | $ | (78,290 | ) | | $ | — | | | $ | — | | | $ | (78,290 | ) |
Other assets less liabilities | | $ | (137,961,876 | ) | | $ | (10,876,343 | ) | | $ | (251,000 | ) | | $ | (149,089,219 | ) |
| | | | | | | | | | | | | | | | |
Total Net assets | | $ | 604,421,669 | | | $ | 72,747,912 | | | $ | (251,000 | ) | | $ | 676,918,581 | |
| | | | | | | | | | | | | | | | |
| | | | |
Net Assets | | | | | | | | | | | | | | | | |
Class A | | $ | 593,927,716 | | | $ | 72,747,912 | | | $ | (251,000 | ) | | $ | 666,424,628 | |
Class B | | $ | 10,493,953 | | | $ | — | | | $ | — | | | $ | 10,493,953 | |
| | | | | | | | | | | | | | | | |
Total Net assets | | $ | 604,421,669 | | | $ | 72,747,912 | | | $ | (251,000 | ) | | $ | 676,918,581 | |
Share Outstanding | | | | | | | | | | | | | | | | |
Class A | | | 43,844,542 | | | | 10,707,778 | | | | (5,357,452 | ) | | | 49,194,868 | |
Class B | | | 777,803 | | | | — | | | | — | | | | 777,803 | |
| | | | |
Net Asset Value per Share | | | | | | | | | | | | | | | | |
Class A | | | 13.55 | | | | 6.79 | | | | — | | | | 13.55 | |
Class B | | | 13.49 | | | | — | | | | — | | | | 13.49 | |
PRO FORMA COMBINING CONDENSED STATEMENT OF OPERATIONS
FOR THE TWELVE MONTH PERIOD ENDED December 31, 2008 (Unaudited)
| | | | | | | | | | | | | | | | |
| | | DWS Capital
Growth VIP | | | DWS Janus
Growth & Income
VIP | | | Pro Forma
Adjustments | | | Pro Forma
Combined | |
Investment Income: | | | | | | | | | | | | | | | | |
Interest and dividend income | | $ | 12,186,519 | | | $ | 2,571,390 | | | | — | | | $ | 14,757,909 | |
| | | | | | | | | | | | | | | | |
Total Investment Income | | | 12,186,519 | | | | 2,571,390 | | | | | | | | 14,757,909 | |
Expenses | | | | | | | | | | | | | | | | |
Management Fees | | | 3,273,016 | | | | 897,800 | | | | (430,123 | )(1) | | | 3,740,693 | |
Services to Shareholders | | | 15,046 | | | | 1,438 | | | | | | | | 16,484 | |
Administration Fee | | | 879,862 | | | | 76,972 | | | | 51,458 | (1) | | | 1,008,292 | |
Custodian Fees | | | 66,128 | | | | 32,869 | | | | | | | | 98,997 | |
Fund Accounting | | | | | | | 25,585 | | | | (25,585 | )(1) | | | — | |
Distribution Service Fees | | | 37,000 | | | | 3,511 | | | | | | | | 40,511 | |
Professional Fees | | | 95,226 | | | | 69,314 | | | | (13,543 | )(1) | | | 150,997 | |
Trustees Fees | | | 45,567 | | | | 19,156 | | | | | | | | 64,723 | |
Reports to Shareholders | | | 49,388 | | | | 26,734 | | | | | | | | 76,122 | |
Other Expenses | | | 30,997 | | | | 17,765 | | | | — | | | | 48,762 | |
| | | | | | | | | | | | | | | | |
Total expenses before reductions | | | 4,492,230 | | | | 1,171,144 | | | | (417,793 | ) | | | 5,245,581 | |
Expense reductions | | | (119,918 | ) | | | (7,973 | ) | | | (123,779 | ) | | | (251,670 | ) |
| | | | | | | | | | | | | | | | |
Expenses, net | | | 4,372,312 | | | | 1,163,171 | | | | (541,572 | ) | | | 4,993,911 | |
| | | | | | | | | | | | | | | | |
Net investment income (loss) | | | 7,814,207 | | | | 1,408,219 | | | | 541,572 | | | | 9,763,998 | |
| | | | | | | | | | | | | | | | |
| | | | |
Net Realized and Unrealized Gain (Loss) | | | | | | | | | | | | | | | | |
| | | | |
Net realized gain (loss) on: | | | | | | | | | | | | | | | | |
Investments | | | 23,279,165 | | | | (15,768,982 | ) | | | — | | | | 7,510,183 | |
Foreign currency related transactions | | | (106,168 | ) | | | 72,581 | | | | — | | | | (33,587 | ) |
| | | | |
Net unrealized appreciation (depreciation) on: | | | | | | | | | | | | | | | | |
Investments | | | (355,391,930 | ) | | | (48,908,666 | ) | | | — | | | | (404,300,596 | ) |
Foreign currency related transactions | | | 2,427 | | | | (170,089 | ) | | | — | | | | (167,662 | ) |
| | | | | | | | | | | | | | | | |
Net increase in net assets from operations | | $ | (324,402,299 | ) | | $ | (63,366,937 | ) | | $ | 541,572 | | | $ | (387,227,664 | ) |
| | | | | | | | | | | | | | | | |
| (1) | Pro forma operation expense are based on the actual expenses of DWS Capital Growth VIP and DWS Janus Growth & Income VIP. With certain expenses adjusted to reflect the estimated expenses of the combined entity. The management fee and administrative fee has been calculated for the combined Funds based on the fee schedule in effect for DWS Capital Growth VIP at the combined level of average net assets for the period ended December 31, 2008. |
The accompanying notes are an integral part of the financial statements.
Notes to Pro Forma Combining Financial Statements
December 31, 2008
These financial statements set forth the unaudited pro forma combined condensed Statement of Assets and Liabilities as of December 31, 2008, and the unaudited pro forma combined condensed Statement of Operations for the year ended December 31, 2008 for DWS Capital Growth VIP and DWS Janus Growth & Income VIP, as adjusted, giving effect to the merger as if it had occurred as of the beginning of the period. These statements have been derived from the books and records utilized in calculating daily net asset value for each fund and have been prepared in accordance with accounting principles generally accepted in the United States of America which require the use of management estimates. Actual results could differ from those estimates.
Basis of Combination
Under the terms of the Plan of Reorganization, the combination will be accounted for by the method of accounting for tax-free mergers of investment companies. The acquisitions would be accomplished by an acquisition of the net assets of DWS Janus Growth & Income VIP in exchange for shares of DWS Capital Growth VIP at net asset value. Following the acquisition, DWS Capital Growth VIP will be the accounting survivor. In accordance with accounting principles generally accepted in the United States of America, the historical cost of investment securities will be carried forward to the surviving fund and the results of operations for pre-combination periods will not be restated.
Portfolio Valuation
Investments are stated at value determined as of the close of regular trading on the New York Stock Exchange on each day the exchange is open for trading. Equity securities are valued at the most recent sale price or official closing price reported on the exchange (U.S. or foreign) or over-the-counter market on which the security is traded most extensively. Securities for which no sales are reported are valued at the calculated mean between the most recent bid and asked quotations on the relevant market or, if a mean cannot be determined, at the most recent bid quotation. Money market instruments purchased with an original or remaining maturity of sixty days or less, maturing at par, are valued at amortized cost. Investments in open-end investment companies and Cash Management QP Trust are valued at their net asset value each day.
Securities and other assets for which market quotations are not readily available or for which the above valuation procedures are deemed not to reflect fair value are valued in a manner that is intended to reflect their fair value as determined in accordance with procedures approved by the Directors/Trustees.
Federal Income Taxes
At December 31, 2008, the DWS Capital Growth VIP had a net tax basis capital loss carry-forward of approximately $227,747,000, which may be applied against any realized net taxable capital gains of each succeeding year until fully utilized or until the expiration date which range from December 31, 2009 to December 31, 2012, whichever occurs first, subject to certain limitations under Sections 382-384 of the Internal Revenue Code. During the year ended December, 2008, the DWS Capital Growth Fund utilized $29,828,000 and lost through expiration $19,244,000 of prior year capital loss carry-forwards.
At December 31, 2008, the DWS Janus Growth & Income VIP had a net tax basis capital loss carry-forward of approximately $8,636,000, which may be applied against any realized net taxable capital gains of each succeeding year until fully utilized or until the expiration date of December 31, 2016, whichever occurs first.
It is each Fund’s policy to comply with the requirements of the Internal Revenue Code, as amended, which are applicable to regulated investment companies, and to distribute all of their taxable income to shareholders. After the acquisition, DWS Capital Growth VIP intends to continue to qualify as a regulated investment company.
<pre>
SUPPLEMENT TO THE CURRENTLY EFFECTIVE STATEMENTS OF ADDITIONAL INFORMATION
OF EACH OF THE LISTED PORTFOLIOS:
---------------------
DWS Investments VIT Funds
DWS Equity 500 Index VIP
DWS Small Cap Index VIP
DWS Variable Series I
DWS Bond VIP DWS Growth & Income VIP
DWS Capital Growth VIP DWS Health Care VIP
DWS Global Opportunities VIP DWS International VIP
DWS Variable Series II
DWS Balanced VIP DWS International Select Equity VIP
DWS Blue Chip VIP DWS Janus Growth & Income VIP
DWS Conservative Allocation VIP DWS Large Cap Value VIP
DWS Core Fixed Income VIP DWS Mid Cap Growth VIP
DWS Davis Venture Value VIP DWS Moderate Allocation VIP
DWS Dreman High Return Equity VIP DWS Money Market VIP
DWS Dreman Small Mid Cap Value VIP DWS Small Cap Growth VIP
DWS Global Thematic VIP DWS Strategic Income VIP
DWS Government & Agency Securities VIP DWS Technology VIP
DWS Growth Allocation VIP DWS Turner Mid Cap Growth VIP
DWS High Income VIP
--------------------------------------------------------------------------------
The following information replaces similar disclosure under "Revenue Sharing" in
the "Purchase and Redemptions" or "Net Asset Value, Purchase and Redemption of
Shares" section of each Portfolio's Statement of Additional Information:
Revenue Sharing
In light of recent regulatory developments, the Advisor, the Distributor and
their affiliates have undertaken to furnish certain additional information below
regarding the level of payments made by them to selected affiliated and
unaffiliated brokers, dealers, participating insurance companies or other
financial intermediaries ("financial advisors") in connection with the sale
and/or distribution of Portfolio shares or the retention and/or servicing of
investors and Portfolio shares ("revenue sharing").
The Advisor, the Distributor and/or their affiliates may pay additional
compensation, out of their own assets and not as an additional charge to each
Portfolio, to financial advisors in connection with the sale and/or distribution
of Portfolio shares or the retention and/or servicing of Portfolio investors and
Portfolio shares. Such revenue sharing payments are in addition to any
distribution or service fees payable under any Rule 12b-1 or service plan of any
portfolio, any record keeping/sub-transfer agency/networking fees payable by
each Portfolio (generally through the Distributor or an affiliate) and/or the
Distributor to certain financial advisors for performing such services and any
sales charges, commissions, non-cash compensation arrangements expressly
permitted under applicable rules of FINRA or other concessions described in the
fee table or elsewhere in the Prospectuses or the SAI as payable to all
financial advisors. For example, the Advisor, the Distributor and/or their
affiliates may compensate financial advisors for providing each Portfolio with
"shelf space" or access to a third party platform or portfolio offering list, or
other marketing programs including, without limitation, inclusion of each
Portfolio on preferred or recommended sales lists, mutual fund "supermarket"
platforms and other formal sales programs; granting the Distributor access to
the financial advisor's sales force; granting the Distributor access to the
financial advisor's conferences and meetings; assistance in training and
educating the financial advisor's personnel; and, obtaining other forms of
marketing support. The level of revenue sharing payments made to financial
advisors may be a fixed fee or based upon one or more of the following factors:
gross sales, current assets and/or number of accounts of each Portfolio
attributable to the financial advisor, the particular portfolio or portfolio
type or other measures as agreed to by the Advisor, the Distributor and/or their
affiliates and the financial advisors or any combination thereof. The amount of
these payments is determined at the discretion of the Advisor, the Distributor
and/or their affiliates from time to time, may be substantial, and may be
different for different financial advisors based on, for example, the nature of
the services provided by the financial advisor.
The Advisor, the Distributor and/or their affiliates currently make revenue
sharing payments from their own assets in connection with the sale and/or
distribution of DWS Fund shares, or the retention and/or servicing of investors,
to financial advisors in amounts that
generally range from .01% up to .50% of assets of the Portfolio serviced and
maintained by the financial advisor, .05% to .25% of sales of the Portfolio
attributable to the financial advisor, a flat fee of $13,350 up to $500,000, or
any combination thereof. These amounts are annual figures typically paid on a
quarterly basis and are subject to change at the discretion of the Advisor, the
Distributor and/or their affiliates. Receipt of, or the prospect of receiving,
this additional compensation, may influence your financial advisor's
recommendation of this Portfolio or of any particular share class of the
Portfolio. You should review your financial advisor's compensation disclosure
and/or talk to your financial advisor to obtain more information on how this
compensation may have influenced your financial advisor's recommendation of this
Portfolio.
The Advisor, the Distributor and/or their affiliates may also make such revenue
sharing payments to financial advisors under the terms discussed above in
connection with the distribution of both DWS funds and non-DWS funds by
financial advisors to retirement plans that obtain record keeping services from
ADP, Inc. on the DWS Scudder branded retirement plan platform (the "Platform")
with the level of revenue sharing payments being based upon sales of both the
DWS funds and the non-DWS funds by the financial advisor on the Platform or
current assets of both the DWS funds and the non-DWS funds serviced and
maintained by the financial advisor on the Platform.
As of the date hereof, each Portfolio has been advised that the Advisor, the
Distributor and their affiliates expect that the following firms will receive
revenue sharing payments at different points during the coming year as described
above:
Channel: Broker-Dealers and Financial Advisors
AIG Advisors Group
Ameriprise
Cadaret, Grant & Co. Inc.
Capital Analyst, Incorporated
Citigroup Global Markets, Inc. (dba Smith Barney)
Commonwealth Equity Services, LLP (dba Commonwealth Financial Network)
Deutsche Bank Group
Ensemble Financial Services
First Allied Securities
First Clearing/Wachovia Securities
HD Vest Investment Securities, Inc.
ING Advisors Network
John Hancock Distributors LLC
LPL Financial
M.L. Stern & Co.
Meridien Financial Group
Merrill Lynch, Pierce, Fenner & Smith Inc.
Morgan Stanley
Oppenheimer & Co., Inc.
PlanMember Services
Raymond James & Associates
Raymond James Financial Services
RBC Dain Rauscher, Inc
Securities America, Inc.
UBS Financial Services
Wells Fargo Investments, LLC
Channel: Cash Product Platform
Allegheny Investments LTD
Bank of New York (Hare & Co.)
Brown Brothers Harriman
Brown Investment Advisory & Trust Company
Cadaret Grant & Co.
Chicago Mercantile Exchange
D.A. Davidson & Company
Deutsche Bank Group
Emmett A. Larkin Company
Fiduciary Trust Co. - International
2
First Southwest Company
J.P. Morgan Clearing Corp.
Legent Clearing LLC
Lincoln Investment Planning
LPL Financial
Mellon Financial Markets LLC
Mesirow Financial, Inc.
Penson Financial Services
Pershing Choice Platform
ProFunds Distributors, Inc.
Ridge Clearing & Outsourcing Solutions
Robert W. Baird & Co.
Romano Brothers and Company
SAMCO Capital Markets
Smith Moore & Company
Sungard Institutional Brokerage Inc.
Treasury Curve LLC
US Bancorp
UBS Financial Services
William Blair & Company
Channel: Third Party Insurance Platforms
Allstate Life Insurance Company of New York
Ameritas Life Insurance Group
Annuity Investors Life Insurance Company
Columbus Life Insurance Company
Commonwealth Annuity and Life Insurance Company
Companion Life Insurance Company
Connecticut General Life Insurance Company
Farmers New World Life Insurance Company
Fidelity Security Life Insurance Company
First Allmerica Financial Life Insurance Company
First Great West Life and Annuity Company
Genworth Life Insurance Company of New York
Genworth Life and Annuity Insurance Company
Great West Life and Annuity Insurance Company
Hartford Life Insurance Company
Integrity Life Insurance Company
John Hancock Life Insurance companies
Kemper Investors Life Insurance Company
Lincoln Benefit Life Insurance Company
Lincoln Life & Annuity Company of New York
Lincoln National Life Insurance Company
Massachusetts Mutual Life Insurance Group
MetLife Group
Minnesota Life Insurance Company
National Life Insurance Company
National Integrity Life Insurance Company
Nationwide Group
New York Life Insurance and Annuity Corporation
Phoenix Life Insurance Company
Protective Life Insurance
Provident Mutual Life Insurance
Prudential Insurance Company of America
Sun Life Group
Symetra Life Insurance Company
Transamerica Life Insurance Company
3
Union Central Life Insurance Company
United of Omaha Life Insurance Company
United Investors Life Insurance Company
Western Southern Life Assurance Company
Any additions, modifications or deletions to the financial advisors identified
above that have occurred since the date hereof are not reflected.
The Advisor, the Distributor or their affiliates may enter into additional
revenue sharing arrangements or change or discontinue existing arrangements with
financial advisors at any time without notice.
The prospect of receiving, or the receipt of additional compensation or
promotional incentives described above by financial advisors may provide such
financial advisors and/or their salespersons with an incentive to favor sales of
shares of the DWS funds or a particular DWS fund over sales of shares of mutual
funds (or non-mutual fund investments) with respect to which the financial
advisor does not receive additional compensation or promotional incentives, or
receives lower levels of additional compensation or promotional incentives.
Similarly, financial advisors may receive different compensation or incentives
that may influence their recommendation of any particular share class of the
Portfolio or of other portfolios. These payment arrangements, however, will not
change the price that an investor pays for Portfolio shares or the amount that
the Portfolio receives to invest on behalf of an investor and will not increase
Portfolio expenses. You may wish to take such payment arrangements into account
when considering and evaluating any recommendations relating to Portfolio shares
and you should discuss this matter with your financial advisor and review your
financial advisor's disclosures.
It is likely that broker-dealers that execute portfolio transactions for the
Portfolio will include firms that also sell shares of the DWS funds to their
customers. However, the Advisor will not consider sales of DWS fund shares as a
factor in the selection of broker-dealers to execute portfolio transactions for
the DWS funds. Accordingly, the Advisor has implemented policies and procedures
reasonably designed to prevent its traders from considering sales of DWS fund
shares as a factor in the selection of broker-dealers to execute portfolio
transactions for the Portfolio. In addition, the Advisor, the Distributor and/or
their affiliates will not use fund brokerage to pay for their obligation to
provide additional compensation to financial advisors as described above.
Please Retain This Supplement for Future Reference
December 31, 2008
4
Supplement to the currently effective Statements of Additional Information for
the listed Portfolios:
--------------------------------------------------------------------------------
DWS Variable Series I:
DWS Bond VIP
DWS Capital Growth VIP
DWS Global Opportunities VIP
DWS Growth & Income VIP
DWS Health Care VIP
DWS International VIP
DWS Variable Series II:
DWS Balanced VIP
DWS Blue Chip VIP
DWS Conservative Allocation VIP
DWS Core Fixed Income VIP
DWS Davis Venture Value VIP
DWS Dreman High Return Equity VIP
DWS Dreman Small Mid Cap Value VIP
DWS Global Thematic VIP
DWS Government & Agency Securities VIP
DWS Growth Allocation VIP
DWS High Income VIP
DWS International Select Equity VIP
DWS Janus Growth & Income VIP
DWS Large Cap Value VIP
DWS Mid Cap Growth VIP
DWS Moderate Allocation VIP
DWS Small Cap Growth VIP
DWS Strategic Income VIP
DWS Technology VIP
DWS Turner Mid Cap Growth VIP
--------------------------------------------------------------------------------
The following replaces similar language in the "Investment Policies and
Techniques -- General Characteristics of Options" section of the Portfolios'
Statements of Additional Information:
General Characteristics of Options. Put options and call options typically have
similar structural characteristics and operational mechanics regardless of the
underlying instrument on which they are purchased or sold. Thus, the following
general discussion relates to each of the particular types of options discussed
in greater detail below. In addition, many Strategic Transactions involving
options require segregation of a Portfolio's assets in special accounts, as
described in the section entitled "Asset Segregation."
A put option gives the purchaser of the option, upon payment of a premium, the
right to sell, and the writer the obligation to buy, the underlying security,
commodity, index, currency or other instrument at the exercise price. For
instance, each Portfolio's purchase of a put option on a security might be
designed to protect its holdings in the underlying instrument (or, in some
cases, a similar instrument) against a substantial decline in the market value
by giving each Portfolio the right to sell such instrument at the option
exercise price. A call option, upon payment of a premium, gives the purchaser of
the option the right to buy, and the seller the obligation to sell, the
underlying instrument at the exercise price. Each Portfolio's purchase of a call
option on a security, financial future, index, currency or other instrument
might be intended to protect each Portfolio against an increase in the price of
the underlying instrument that it intends to purchase in the future by fixing
the price at which it may purchase such instrument. An American style put or
call option may be exercised at any time during the option period while a
European
style put or call option may be exercised only upon expiration or during a fixed
period prior thereto. Each Portfolio is authorized to purchase and sell exchange
listed options and over-the-counter options ("OTC options"). Exchange listed
options are issued by a regulated intermediary such as the Options Clearing
Corporation ("OCC"), which guarantees the performance of the obligations of the
parties to such options. The discussion below uses the OCC as an example, but is
also applicable to other financial intermediaries.
With certain exceptions, OCC issued and exchange listed options generally settle
by physical delivery of the underlying security or currency, although in the
future cash settlement may become available. Index options and Eurodollar
instruments are cash settled for the net amount, if any, by which the option is
"in-the-money" (i.e., where the value of the underlying instrument exceeds, in
the case of a call option, or is less than, in the case of a put option, the
exercise price of the option) at the time the option is exercised. Frequently,
rather than taking or making delivery of the underlying instrument through the
process of exercising the option, listed options are closed by entering into
offsetting purchase or sale transactions that do not result in ownership of the
new option.
Each Portfolio's ability to close out its position as a purchaser or seller of
an OCC or exchange listed put or call option is dependent, in part, upon the
liquidity of the option market. Among the possible reasons for the absence of a
liquid option market on an exchange are: (i) insufficient trading interest in
certain options; (ii) restrictions on transactions imposed by an exchange; (iii)
trading halts, suspensions or other restrictions imposed with respect to
particular classes or series of options or underlying securities including
reaching daily price limits; (iv) interruption of the normal operations of the
OCC or an exchange; (v) inadequacy of the facilities of an exchange or OCC to
handle current trading volume; or (vi) a decision by one or more exchanges to
discontinue the trading of options (or a particular class or series of options),
in which event the relevant market for that option on that exchange would cease
to exist, although outstanding options on that exchange would generally continue
to be exercisable in accordance with their terms.
The hours of trading for listed options may not coincide with the hours during
which the underlying financial instruments are traded. To the extent that the
option markets close before the markets for the underlying financial
instruments, significant price and rate movements can take place in the
underlying markets that may not be reflected in the option markets.
OTC options are purchased from or sold to securities dealers, financial
institutions or other parties ("Counterparties") through direct bilateral
agreement with the Counterparty. In contrast to exchange listed options, which
generally have standardized terms and performance mechanics, all the terms of an
OTC option, including such terms as method of settlement, term, exercise price,
premium, guarantees and security, are set by negotiation of the parties. Each
Portfolio expects generally to enter into OTC options that have cash settlement
provisions, although it is not required to do so.
Unless the parties provide for it, there is no central clearing or guaranty
function in an OTC option. As a result, if the Counterparty fails to make or
take delivery of the security, currency or other instrument underlying an OTC
option it has entered into with each Portfolio or fails to make a cash
settlement payment due in accordance with the terms of that option, each
Portfolio will lose any premium it paid for the option as well as any
anticipated benefit of the transaction. Accordingly, the Advisor must assess the
creditworthiness of each such Counterparty or any guarantor or credit
enhancement of the Counterparty's credit to determine the likelihood that the
terms of the OTC option will be satisfied. Each Portfolio will engage in OTC
option transactions only with US government securities dealers recognized by the
Federal Reserve Bank of New York as "primary dealers" or broker/dealers,
domestic or foreign banks or other financial institutions which have received
(or the guarantors of the obligation of which have received) a short-term credit
rating of A-1 from S&P or P-1 from Moody's or an equivalent rating from any
other nationally recognized statistical rating organization ("NRSRO") or, in the
case of OTC currency transactions, are determined to be of equivalent credit
quality by the Advisor. The staff of the SEC currently takes the position that
OTC options purchased by each Portfolio, and portfolio securities "covering" the
amount of each Portfolio's obligation pursuant to an OTC option sold by it (the
cost of any sell-back plus the in-the-money amount, if any) are illiquid, and
are subject to each Portfolio's limitation on investing no more than 15% of its
net assets in illiquid securities.
If each Portfolio sells a call option, the premium that it receives may serve as
a partial hedge, to the extent of the option premium, against a decrease in the
value of the underlying securities or instruments in its portfolio or will
increase each Portfolio's income. The sale of put options can also provide
income.
Each Portfolio may purchase and sell call options on securities including, but
not limited to, US Treasury and agency securities, mortgage-backed securities,
foreign sovereign debt, corporate debt securities, equity securities (including
convertible securities) and Eurodollar instruments that are traded on US and
foreign securities exchanges and in the over-the-counter markets, and on
securities indices, currencies and futures contracts. All calls sold by each
Portfolio must be "covered" (i.e., each Portfolio must own the securities or
futures contract subject to the call) or must meet the asset segregation
requirements described below as long as the call is outstanding. Even though
each Portfolio will receive the option premium to help protect it against loss,
a call sold by each Portfolio exposes each Portfolio during the term of the
option to possible loss of opportunity to realize appreciation in the market
price of the underlying security or instrument and may require each Portfolio to
hold a security or instrument which it might otherwise have sold.
Each Portfolio may purchase and sell put options on securities including, but
not limited to, US Treasury and agency securities, mortgage-backed securities,
foreign sovereign debt, corporate debt securities, equity securities (including
convertible securities), Eurodollar instruments (whether or not it holds the
above securities in its portfolio), and on securities indices, currencies and
futures contracts other than futures on individual corporate debt and individual
equity securities. Each Portfolio will not sell put options if, as a result,
more than 50% of each Portfolio's total assets would be required to be
segregated to cover its potential obligations under such put options other than
those with respect to futures and options thereon. In selling put options, there
is a risk that each Portfolio may be required to buy the underlying security at
a disadvantageous price above the market price.
DWS Capital Growth VIP and DWS International VIP may write covered call and put
options on no more than 5% of each Portfolio's net assets; the value of the
aggregate premiums paid for all put and call options held by each of these
Portfolios will not exceed 20% of its total assets.
Please Retain This Supplement for Future Reference
October 22, 2008
SUPPLEMENT TO THE CURRENTLY EFFECTIVE STATEMENTS OF ADDITIONAL INFORMATION
OF EACH OF THE LISTED PORTFOLIOS:
--------------------------------------------------------------------------------
DWS Investments VIT Funds
DWS Equity 500 Index VIP
DWS Small Cap Index VIP
--------------------------------------------------------------------------------
DWS Variable Series I
DWS Bond VIP DWS Growth & Income VIP
DWS Capital Growth VIP DWS Health Care VIP
DWS Global Opportunities VIP DWS International VIP
--------------------------------------------------------------------------------
DWS Variable Series II
DWS Balanced VIP DWS International Select Equity VIP
DWS Blue Chip VIP DWS Janus Growth & Income VIP
DWS Conservative Allocation VIP DWS Large Cap Value VIP
DWS Core Fixed Income VIP DWS Mid Cap Growth VIP
DWS Davis Venture Value VIP DWS Moderate Allocation VIP
DWS Dreman High Return Equity VIP DWS Small Cap Growth VIP
DWS Dreman Small Mid Cap Value VIP DWS Strategic Income VIP
DWS Global Thematic VIP DWS Technology VIP
DWS Government & Agency Securities VIP DWS Turner Mid Cap Growth VIP
DWS Growth Allocation VIP
DWS High Income VIP
Effective on or about September 2, 2008, disclosure in the Portfolio's Statement
of Additional Information that describes the methods of segregating assets or
otherwise "covering" transaction, shall no longer apply, and the following
disclosure replaces similar disclosure, or for certain funds is added as new
disclosure, in each Portfolio's Statement of Additional Information:
Asset Segregation
Certain investment transactions expose the Portfolio to an obligation to make
future payments to third parties. Examples of these types of transactions,
include, but are not limited to, reverse repurchase agreements, short sales,
dollar rolls, when-issued, delayed-delivery or forward commitment transactions
and certain derivatives such as swaps, futures, forwards, and options. To the
extent that the Portfolio engages in such transactions, the Portfolio will (to
the extent required by applicable law) either (1) segregate cash or liquid
assets in the prescribed amount or (2) otherwise "cover" its future obligations
under the transaction, such as by holding an offsetting investment. If the
Portfolio segregates sufficient cash or other liquid assets or otherwise
"covers" its obligations under such transactions, the Portfolio will not
consider the transactions to be borrowings for purposes of its investment
restrictions or "senior securities" under the Investment Company Act of 1940, as
amended (the "1940 Act"), and therefore, such transactions will not be subject
to the 300% asset coverage requirement under the 1940 Act otherwise applicable
to borrowings by the Portfolio.
In some cases (e.g., with respect to futures and forwards that are contractually
required to "cash-settle"), the Portfolio will segregate cash or other liquid
assets with respect to the amount of the daily net (marked-to-market) obligation
arising from the transaction, rather than the notional amount of the underlying
contract. By segregating assets in an amount equal to the net obligation rather
than the notional amount, the Portfolio will have the ability to employ leverage
to a greater extent than if it set aside cash or other liquid assets equal to
the notional amount of the contract, which may increase the risk associated with
such transactions.
The Portfolio may utilize methods of segregating assets or otherwise "covering"
transactions that are currently or in the future permitted under the 1940 Act,
the rules and regulation thereunder, or orders issued by the Securities and
Exchange Commission ("SEC") thereunder. For these purposes, interpretations and
guidance provided by the SEC staff may be taken into account when deemed
appropriate by the Portfolio.
Assets used as segregation or cover cannot be sold while the position in the
corresponding transaction is open, unless they are replaced with other
appropriate assets. As a result, the commitment of a large portion of a
Portfolio's assets for segregation and cover purposes could impede portfolio
management or the Portfolio's ability to meet redemption requests or other
current obligations. Segregating assets or otherwise "covering" for these
purposes does not necessarily limit the percentage of the assets of the
Portfolio that may be at risk with respect to certain derivative transactions.
Please Retain This Supplement for Future Reference
Supplement to the currently effective Statements of Additional Information of
each of the funds/portfolios listed below:
Cash Account Trust DWS Equity Partners Fund DWS Small Cap Core Fund
Government and Agency Securities DWS Europe Equity Fund DWS Small Cap Growth Fund
Portfolio DWS Floating Rate Plus Fund DWS Small Cap Value Fund
Davidson Cash Equivalent Shares DWS Global Bond Fund DWS Strategic Government Securities Fund
Davidson Cash Equivalent Plus Shares DWS Global Opportunities Fund DWS Strategic High Yield Tax-Free Fund
DWS Government & Agency Money Fund DWS Global Thematic Fund DWS Strategic Income Fund
Capital Assets Funds Shares DWS GNMA Fund DWS Target 2010 Fund
Premier Money Market Shares DWS Gold & Precious Metals Fund DWS Target 2011 Fund
Service Shares DWS Growth & Income Fund DWS Target 2012 Fund
Money Market Portfolio DWS Health Care Fund DWS Target 2013 Fund
Capital Assets Funds Shares DWS High Income Fund DWS Target 2014 Fund
Capital Assets Funds Preferred Shares DWS High Income Plus Fund DWS Technology Fund
Davidson Cash Equivalent Shares DWS Inflation Protected Plus Fund DWS U.S. Bond Index Fund
Davidson Cash Equivalent Plus Shares DWS Intermediate Tax/AMT Free Fund DWS Value Builder Fund
Premier Money Market Shares DWS International Fund DWS Variable Series I
Premium Reserve Money Market Shares DWS International Select Equity Fund DWS Bond VIP
Service Shares DWS International Value Opportunities DWS Capital Growth VIP
Tax-Exempt Portfolio Fund DWS Global Opportunities VIP
Capital Assets Funds Shares DWS Investments VIT Funds DWS Growth & Income VIP
Davidson Cash Equivalent Shares DWS Equity 500 Index VIP DWS Health Care VIP
DWS Tax-Free Money Fund Class S DWS Small Cap Index VIP DWS International VIP
DWS Tax-Exempt Money Fund DWS Japan Equity Fund DWS Variable Series II
Premier Money Market Shares DWS Large Cap Value Fund DWS Balanced VIP
Service Shares DWS Large Company Growth Fund DWS Blue Chip VIP
Tax Free Investment Class DWS Latin America Equity Fund DWS Conservative Allocation VIP
Cash Reserve Fund, Inc. DWS LifeCompass 2015 Fund DWS Core Fixed Income VIP
Prime Series DWS LifeCompass 2020 Fund DWS Davis Venture Value VIP
Prime Shares DWS LifeCompass 2030 Fund DWS Dreman High Return Equity VIP
DWS Alternative Asset Allocation Plus Fund DWS LifeCompass 2040 Fund DWS Dreman Small Mid Cap Value VIP
DWS Balanced Fund DWS LifeCompass Income Fund DWS Global Thematic VIP
DWS Blue Chip Fund DWS LifeCompass Protect Fund DWS Government & Agency Securities VIP
DWS California Tax-Free Income Fund DWS LifeCompass Retirement Fund DWS Growth Allocation VIP
DWS Capital Growth Fund DWS Lifecycle Long Range Fund DWS High Income VIP
DWS Climate Change Fund DWS Managed Municipal Bond Fund DWS International Select Equity VIP
DWS Commodity Securities Fund DWS Massachusetts Tax-Free Fund DWS Janus Growth & Income VIP
DWS Communications Fund DWS Micro Cap Fund DWS Large Cap Value VIP
DWS Core Fixed Income Fund DWS Mid Cap Growth Fund DWS Mid Cap Growth VIP
DWS Core Plus Allocation Fund DWS Money Market Prime Series DWS Moderate Allocation VIP
DWS Core Plus Income Fund DWS Money Market Fund DWS Money Market VIP
DWS Disciplined Long/Short Growth Fund DWS Cash Investment Trust Class A DWS Small Cap Growth VIP
DWS Disciplined Long/Short Value Fund DWS Cash Investment Trust Class B DWS Strategic Income VIP
DWS Disciplined Market Neutral Fund DWS Cash Investment Trust Class C DWS Technology VIP
DWS Dreman Concentrated Value Fund DWS Cash Investment Trust Class S DWS Turner Mid Cap Growth VIP
DWS Dreman High Return Equity Fund DWS Money Market Series Investors Cash Trust
DWS Dreman Mid Cap Value Fund Premium Class S Treasury Portfolio
DWS Dreman Small Cap Value Fund Prime Reserve Class S Premier Money Market Shares
DWS EAFE(R) Equity Index Fund DWS New York Tax-Free Income Fund DWS U.S. Treasury Money Fund Class S
DWS Emerging Markets Equity Fund DWS RREEF Global Infrastructure Fund Investment Class Shares
DWS Emerging Markets Fixed Income Fund DWS RREEF Global Real Estate Securities NY Tax Free Money Fund
DWS Enhanced S&P 500 Index Fund Fund Tax Free Money Fund Investment
DWS Equity 500 Index Fund DWS RREEF Real Estate Securities Fund Tax-Exempt California Money Market Fund
DWS Equity Income Fund DWS S&P 500 Index Fund
DWS Short Duration Fund
DWS Short Duration Plus Fund
DWS Short-Term Municipal Bond Fund
Effective July 16, 2008, DWS Scudder Investments will change its name to DWS
Investments. In addition, the Web site for DWS funds will change to
www.dws-investments.com.
Also, effective July 16, 2008, several service providers to the funds and
retirement plans will change their names. The new names will be as follows:
Current Name New Name, effective July 16, 2008
------------ ---------------------------------
DWS Scudder Distributors, Inc. DWS Investments Distributors, Inc. ("DIDI")
DWS Scudder Fund Accounting Corporation DWS Investments Fund Accounting Corporation ("DIFA")
DWS Scudder Investments Service Company DWS Investments Service Company ("DISC")
DWS Scudder Wholesalers DWS Investments Wholesalers
DWS Scudder Flex Plan DWS Investments Flex Plan
DWS Scudder Individual Retirement Account (IRA) DWS Investments Individual Retirement Account (IRA)
DWS Scudder Horizon Plan DWS Investments Horizon Plan
DWS Scudder Profit Sharing and Money Purchase Pension DWS Simplified Profit Sharing and Money Purchase Pension
Plans Plans
DWS Scudder 401(k) Plan DWS Investments 401(k) Plan
DWS Scudder 403(b) Plan DWS Investments 403(b) Plan
DWS Scudder IRA DWS Investments IRA
References to the designation "DWS Scudder" contained in the "Management"
section of each of the funds' Statements of Additional Information are hereby
changed to "DWS Investments." DWS Investments is part of Deutsche Bank's Asset
Management division and, within the United States, represents the retail asset
management activities of Deutsche Bank AG, Deutsche Bank Trust Company Americas,
Deutsche Investment Management Americas Inc. and DWS Trust Company.
Please Retain this Supplement for Future Reference
July 16, 2008
STATEMENT OF ADDITIONAL INFORMATION
May 1, 2008
CLASS A AND B SHARES
DWS VARIABLE SERIES I
Two International Place, Boston, Massachusetts 02110
This combined Statement of Additional Information is not a prospectus. It should
be read in conjunction with the applicable prospectuses of DWS Variable Series I
(the "Fund") dated May 1, 2008, as amended from time to time. The prospectuses
may be obtained without charge from the Fund by calling (800) 778-1482, and is
also available along with other related materials on the Securities and Exchange
Commission Internet Web site (http://www.sec.gov). The prospectus is also
available from insurance companies that offer one or more of the Fund's
portfolios as an investment option (the "Participating Insurance Companies").
DWS Variable Series I offers a choice of six portfolios (each a "Portfolio,"
collectively, the "Portfolios"), in connection with certain variable life
insurance and variable annuity contracts ("Contract(s)") offered by
Participating Insurance Companies. Each Portfolio is a series of the Fund.
Portions of the Annual Report for each Portfolio for the fiscal year ended
December 31, 2007 are incorporated herein by reference, as specified herein. A
copy of each Portfolio's Annual Report may be obtained without charge from the
Fund by calling (800) 778-1482. This Statement of Additional Information is
incorporated by reference into the corresponding prospectuses for each class of
share of each Portfolio noted below.
The six portfolios are:
DWS BOND VIP
DWS GROWTH & INCOME VIP
DWS CAPITAL GROWTH VIP
DWS GLOBAL OPPORTUNITIES VIP
DWS INTERNATIONAL VIP
DWS HEALTH CARE VIP
TABLE OF CONTENTS
Page
----
INVESTMENT RESTRICTIONS........................................................1
INVESTMENT POLICIES AND TECHNIQUES.............................................3
General Investment Policies...........................................3
Portfolio Holdings Information.......................................34
MANAGEMENT OF THE FUND........................................................36
Investment Advisor...................................................36
Subadvisor and Sub-subadvisor -- DWS Bond VIP........................46
Compensation of Portfolio Managers...................................48
FUND SERVICE PROVIDERS........................................................66
Administrator........................................................66
Principal Underwriter................................................67
Transfer Agent.......................................................69
Custodian............................................................70
Independent Registered Public Accounting Firm........................71
Legal Counsel........................................................71
PORTFOLIO TRANSACTIONS........................................................74
PURCHASES AND REDEMPTIONS.....................................................81
DIVIDENDS, CAPITAL GAINS AND TAXES............................................90
NET ASSET VALUE...............................................................96
TRUSTEES AND OFFICERS.........................................................97
PROXY VOTING GUIDELINES......................................................125
ADDITIONAL INFORMATION.......................................................127
FINANCIAL STATEMENTS.........................................................128
APPENDIX A...................................................................129
INVESTMENT RESTRICTIONS
The following fundamental policies may not be changed with respect to any
Portfolio without the approval of the majority of outstanding voting securities
of that Portfolio which, under the Investment Company Act of 1940, as amended
(the "1940 Act"), and the rules thereunder and as used in this Statement of
Additional Information, means the lesser of (1) 67% of the shares of that
Portfolio present at a meeting if the holders of more than 50% of the
outstanding shares of that Portfolio are present in person or by proxy, or (2)
more than 50% of the outstanding shares of that Portfolio. Any investment
restrictions which involve a maximum percentage of securities or assets shall
not be considered to be violated unless an excess over the percentage occurs
immediately after, and is caused by, an acquisition or encumbrance of securities
or assets of, or borrowings by or on behalf of, a Portfolio.
As a matter of fundamental policy, the Fund may not on behalf of any Portfolio:
1. borrow money, except as permitted under the 1940 Act, and as
interpreted or modified by regulatory authority having jurisdiction,
from time to time;
2. issue senior securities, except as permitted under the 1940 Act, and as
interpreted or modified by regulatory authority having jurisdiction,
from time to time;
3. For all Portfolios (except DWS Health Care VIP): concentrate its
investments in a particular industry, as that term is used in the 1940
Act, and as interpreted or modified by regulatory authority having
jurisdiction, from time to time.
4. purchase or sell commodities, except as permitted by the 1940 Act, as
amended, and as interpreted or modified by the regulatory authority
having jurisdiction from time to time.
5. engage in the business of underwriting securities issued by others,
except to the extent that the Portfolio may be deemed to be an
underwriter in connection with the disposition of portfolio securities;
6. purchase or sell real estate, which term does not include securities of
companies which deal in real estate or mortgages or investments secured
by real estate or interests therein, except that the Portfolio reserves
freedom of action to hold and to sell real estate acquired as a result
of the Portfolio's ownership of securities; or
7. make loans except as permitted under the 1940 Act, and as interpreted
or modified by regulatory authority having jurisdiction, from time to
time.
Other Investment Policies. The Board of Trustees of the Fund has voluntarily
adopted policies and restrictions which are observed in the conduct of the
Fund's affairs. These represent intentions of the Board based upon current
circumstances. They differ from fundamental investment policies in that they may
be changed or amended by action of the Board without prior notice to or approval
of shareholders.
As a matter of nonfundamental policy, the Fund currently does not intend on
behalf of the indicated Portfolio(s):
1. to borrow money in an amount greater than 5% of its total assets,
except (i) for temporary or emergency purposes and (ii) by engaging in
reverse repurchase agreements, dollar rolls, or other investments or
transactions described in the Portfolio's registration statement which
may be deemed to be borrowings;
2. For all Portfolios (except DWS Bond VIP): to enter into either of
reverse repurchase agreements or dollar rolls in an amount greater than
5% of its total assets;
3. to purchase securities on margin or make short sales, except (i) short
sales against the box, (ii) in connection with arbitrage transactions,
(iii) for margin deposits in connection with futures contracts, options
or other permitted investments, (iv) that transactions in futures
contracts and options shall not be deemed to constitute selling
securities short, and (v) that the Portfolio may obtain such short-term
credits as may be necessary for the clearance of securities
transactions;
4. to purchase options, unless the aggregate premiums paid on all such
options held by the Portfolio at any time do not exceed 20% of its
total assets; or sell put options, if as a result, the aggregate value
of the obligations underlying such put options would exceed 50% of its
total assets;
5. For all Portfolios (except DWS Bond VIP): to enter into futures
contracts or purchase options thereon, unless immediately after the
purchase, the value of the aggregate initial margin with respect to
such futures contracts entered into on behalf of the Portfolio and the
premiums paid for such options on futures contracts does not exceed 5%
of the fair market value of the Portfolio's total assets; provided that
in the case of an option that is in-the-money at the time of purchase,
and in-the-money amount may be excluded in computing the 5% limit;
6. For Bond VIP: to invest more than 15% of its total assets in futures
contracts and interest rate swaps contracts based on the notional
amount of the contracts;
7. to purchase warrants if as a result, such securities, taken at the
lower of cost or market value, would represent more than 5% of the
value of the Portfolio's total assets (for this purpose, warrants
acquired in units or attached to securities will be deemed to have no
value);
8. to lend portfolio securities in an amount greater than 33 1/3% of its
total assets;
9. to acquire securities of registered, open-end investment companies or
registered unit investment trusts in reliance on Sections 12(d)(1)(F)
or 12(d)(1)(G) of the Investment Company Act of 1940, as amended.
"Value" for the purposes of all investment restrictions shall mean the value
used in determining a Portfolio's net asset value. (See "NET ASSET VALUE.")
Master/feeder Fund Structure
The Fund's Board of Trustees has the discretion with respect to each Portfolio
to retain the current distribution arrangement for the Portfolio while investing
in a master fund in a master/feeder fund structure as described below.
A master/feeder fund structure is one in which a fund (a "feeder fund"), instead
of investing directly in a portfolio of securities, invests most or all of its
investment assets in a separate registered investment company (the "master
fund") with substantially the same investment objective and policies as the
feeder fund. Such a structure permits the pooling of assets of two or more
feeder funds, preserving separate identities or distribution channels at the
feeder fund level. Based on the premise that certain of the expenses of
operating an investment portfolio are relatively fixed, a larger investment
portfolio may eventually achieve a lower ratio of operating expenses to average
net assets. An existing investment company is able to convert to a feeder fund
by selling all of its investments, which involves brokerage and other
transaction costs and realization of a taxable gain or loss, or by contributing
its assets to the master fund and avoiding transaction costs and, if proper
procedures are followed, the realization of taxable gain or loss.
Temporary Defensive Policy. For temporary defensive purposes, each Portfolio may
invest, without limit, in cash and cash equivalents, US government securities,
money market instruments and high quality debt securities without equity
features. In such a case, a Portfolio would not be pursuing, and may not
achieve, its investment objective.
INVESTMENT POLICIES AND TECHNIQUES
General Investment Policies
DWS Variable Series I is an open-end, registered management investment company
established as a Massachusetts business trust. The Fund is a series fund
consisting of six diversified portfolios: DWS Bond VIP, DWS Growth & Income VIP,
DWS Capital Growth VIP, DWS Global Opportunities VIP, DWS Health Care VIP and
DWS International VIP: (individually or collectively hereinafter referred to as
a "Portfolio" or the "Portfolios"). Additional portfolios may be created from
time to time. The Fund is intended to be the funding vehicle for variable
annuity contracts ("VA contracts") and variable life insurance policies ("VLI
policies") to be offered to the separate accounts of certain life insurance
companies ("Participating Insurance Companies").
Two classes of shares of each Portfolio of the Fund are currently offered
through Participating Insurance Companies. Class A shares are offered at net
asset value and are not subject to a Rule 12b-1 Distribution Plan. Class B
shares are offered at net asset value and are subject to a Rule 12b-1
Distribution Plan.
Each Portfolio has a different investment objective which it pursues through
separate investment policies, as described below. The differences in objectives
and policies among the Portfolios can be expected to affect the degree of market
and financial risk to which each Portfolio is subject and the return of each
Portfolio. The investment objectives and policies of each Portfolio may, unless
otherwise specifically stated, be changed by the Trustees of the Fund without a
vote of shareholders. There is no assurance that the objectives of any Portfolio
will be achieved.
Descriptions in this Statement of Additional Information of a particular
investment practice or technique in which a Portfolio may engage are meant to
describe the spectrum of investments that the Advisor in its discretion might,
but is not required to, use in managing each Portfolio's assets. The Advisor may
in its discretion at any time employ such practice, technique or instrument for
one or more Portfolios but not for all funds advised by it. Furthermore, it is
possible that certain types of financial instruments or investment techniques
described herein may not be available, permissible, economically feasible or
effective for their intended purposes in all markets. Certain practices,
techniques or instruments may not be principal activities of the Portfolios,
but, to the extent employed, could from time to time have a material impact on a
Portfolio's performance.
It is possible that certain investment practices and techniques described below
may not be permissible for a Portfolio based on its investment restrictions, as
described herein, and in the Portfolio's applicable prospectus.
Borrowing. As a matter of fundamental policy, each Portfolio will not borrow
money, except as permitted under the 1940 Act, and as interpreted by regulatory
authority having jurisdiction, from time to time. While the Trustees do not
currently intend to borrow for investment leveraging purposes, if such a
strategy were implemented in the future it would increase a Portfolio's
volatility and the risk of loss in a declining market. Borrowing by a Portfolio
will involve special risk considerations. Although the principal of a
Portfolio's borrowings will be fixed, the Portfolio's assets may change in value
during the time that a borrowing is outstanding, thus increasing exposure to
capital risk.
Asset-Backed Securities. Asset backed securities may include pools of mortgages
("mortgage-backed securities"), loans, receivables or other assets. Payment of
principal and interest may be largely dependent upon the cash flows generated by
the assets backing the securities. For purposes of determining the percentage of
a Portfolio's total assets invested in securities of issuers having their
principal business activities in a particular industry, asset backed securities
will be classified separately. Asset-backed securities present certain risks
that are not presented by mortgage-backed securities. Primarily, these
securities may not have the benefit of any security interest in the related
assets. Credit card receivables are generally unsecured and the debtors are
entitled to the protection of a number of state and federal consumer credit
laws, many of which give such debtors the right to set off certain amounts owed
on the credit cards, thereby reducing the balance due. There is the possibility
that recoveries on repossessed collateral may not, in some cases, be available
to support payments on these securities. Asset-backed securities are often
backed by a pool of assets representing the obligations of a number of different
parties. To lessen the effect of failures by obligors on underlying assets to
make payments, the securities may contain elements of credit support which fall
into two categories: (i) liquidity protection, and (ii) protection against
losses resulting from ultimate default by an obligor on the underlying assets.
Liquidity protection refers to the provision of advances, generally by the
entity administering the pool of assets, to ensure that the receipt of payments
on the underlying pool occurs in a timely fashion. Protection against losses
results from payment of the insurance obligations on at least a portion of the
assets in the pool. This protection may be provided through guarantees, policies
or letters of credit obtained by the issuer or sponsor from third parties,
through various means of structuring the transaction or through a combination of
such approaches. The Portfolios will not pay any additional or separate fees for
credit support. The degree of credit support provided for each issue is
generally based on historical information respecting the level of credit risk
associated with the underlying assets. Delinquency or loss in excess of that
anticipated or failure of the credit support could adversely affect the return
on an investment in such a security. The availability of asset-backed securities
may be affected by legislative or regulatory developments. It is possible that
such developments may require the funds to dispose of any then existing holdings
of such securities.
Asset-Indexed Securities. DWS Health Care VIP may purchase asset-indexed
securities which are debt securities usually issued by companies in precious
metals related businesses such as mining, the principal amount, redemption
terms, or interest rates of which are related to the market price of a specified
precious metal. The Portfolio will only enter into transactions in publicly
traded asset-indexed securities. Market prices of asset-indexed securities will
relate primarily to changes in the market prices of the precious metals to which
the securities are indexed rather than to changes in market rates of interest.
However, there may not be a perfect correlation between the price movements of
the asset-indexed securities and the underlying precious metals. Asset-indexed
securities typically bear interest or pay dividends at below market rates (and
in certain cases at nominal rates). The Portfolio may purchase asset-indexed
securities to the extent permitted by law.
Bank and Savings and Loan Obligations. These obligations include negotiable
certificates of deposit, bankers' acceptances, deposit notes, fixed time
deposits or other short-term bank obligations. Certificates of deposit are
negotiable certificates evidencing the obligations of a bank to repay funds
deposited with it for a specified period of time. The Portfolios may invest in
certificates of deposit of large domestic banks and their foreign branches,
large US regulated subsidiaries of large foreign banks (i.e., banks which at the
time of their most recent annual financial statements show total assets in
excess of $1 billion) and smaller banks as described below. Although the
Portfolios recognize that the size of a bank is important, this fact alone is
not necessarily indicative of its creditworthiness. Investment in certificates
of deposit issued by foreign branches of domestic banks involves investment
risks that are different in some respects from those associated with investment
in certificates of deposit issued by domestic branches of domestic banks,
including the possible imposition of withholding taxes on interest income, the
possible adoption of foreign governmental restrictions which might adversely
affect the payment of principal and interest on such certificates of deposit, or
other adverse political or economic developments. In addition, it might be more
difficult to obtain and enforce a judgment against a foreign branch of a
domestic bank. Further, foreign branches of foreign banks are not regulated by
US banking authorities, and generally are not bound by accounting, auditing and
financial reporting standards comparable to US banks.
Certificates of Deposit and Bankers' Acceptances. Certificates of deposit are
receipts issued by a depository institution in exchange for the deposit of
funds. The issuer agrees to pay the amount deposited plus interest to the bearer
of the receipt on the date specified on the certificate. The certificate usually
can be traded in the secondary market prior to maturity. Bankers' acceptances
typically arise from short-term credit arrangements designed to enable
businesses to obtain funds to finance commercial transactions. Generally, an
acceptance is a time draft drawn on a bank by an exporter or an importer to
obtain a stated amount of funds to pay for specific merchandise. The draft is
then "accepted" by a bank that, in effect, unconditionally guarantees to pay the
face value of the instrument on its maturity date. The acceptance may then be
held by the accepting bank as an earning asset or it may be sold in the
secondary market at the going rate of discount for a specific maturity. Although
maturities for acceptances can be as long as 270 days, most acceptances have
maturities of six months or less.
Banker's acceptances are credit instruments evidencing the obligations of a bank
to pay a draft drawn on it by a customer. These instruments reflect the
obligation both of the bank and of the drawer to pay the face amount of the
instrument upon maturity.
Time deposits are non-negotiable deposits maintained in a banking institution
for a specified period of time at a stated interest rate. Time deposits which
may be held by a Portfolio will not benefit from insurance from the Bank
Insurance Fund or the Savings Association Insurance Fund administered by the
Federal Deposit Insurance Corporation. Fixed time deposits may be withdrawn on
demand by the investor, but may be subject to early withdrawal penalties that
vary with market conditions and the remaining maturity of the obligation. Fixed
time deposits subject to withdrawal penalties maturing in more than seven
calendar days are subject to a fund's limitation on investments in illiquid
securities.
Collateralized Mortgage Obligations ("CMOs"). CMOs are hybrids between a
mortgage-backed bond and mortgage pass-through securities. Similar to a bond,
interest and prepaid principal are paid, in most cases, semiannually. CMOs may
be collateralized by whole mortgage loans but are more typically collateralized
by portfolios of mortgage pass-through securities guaranteed by GNMA, FHLMC, or
Fannie Mae, and their income streams.
CMOs are structured into multiple classes, each bearing a different stated
maturity. Actual maturity and average life will depend upon the prepayment
experience of the collateral. CMOs provide for a modified form of call
protection through a de facto breakdown of the underlying pool of mortgages
according to how quickly the loans are repaid. Monthly payment of principal
received from the pool of underlying mortgages, including prepayments, is first
returned to investors holding the shortest maturity class. Investors holding the
longer maturity classes receive principal only after the first class has been
retired. An investor is partially guarded against a sooner than desired return
of principal because of the sequential payments. The prices of certain CMOs,
depending on their structure and the rate of prepayments, can be volatile. Some
CMOs may also not be as liquid as other securities.
In a typical CMO transaction, a corporation issues multiple series, (e.g., A, B,
C, Z) of CMO bonds ("Bonds"). Proceeds of the Bond offering are used to purchase
mortgages or mortgage pass-through certificates ("Collateral"). The Collateral
is pledged to a third party trustee as security for the Bonds. Principal and
interest payments from the Collateral are used to pay principal on the Bonds in
the order A, B, C, Z. The Series A, B, and C bonds all bear current interest.
Interest on the Series Z Bond is accrued and added to principal and a like
amount is paid as principal on the Series A, B, or C Bond currently being paid
off. When the Series A, B, and C Bonds are paid in full, interest and principal
on the Series Z Bond begins to be paid currently. With some CMOs, the issuer
serves as a conduit to allow loan originators (primarily builders or savings and
loan associations) to borrow against their loan portfolios.
Commercial Paper. Commercial paper consists of short-term, unsecured promissory
notes issued to finance short-term credit needs. The commercial paper purchased
by a fund will consist only of direct obligations issued by domestic and foreign
entities.
Common Stock. DWS Growth & Income VIP, DWS Capital Growth VIP, DWS Global
Opportunities VIP, DWS International VIP and DWS Health Care VIP invest in
common stock. Common stock is issued by companies to raise cash for business
purposes and represents a proportionate interest in the issuing companies.
Therefore, the Portfolios may participate in the success or failure of any
company in which it holds stock. The market values of common stock can fluctuate
significantly, reflecting the business performance of the issuing company,
investor perception and general economic or financial market movements. Despite
the risk of price volatility, however, common stocks have historically offered a
greater potential for long-term gain on investment, compared to other classes of
financial assets such as bonds or cash equivalents, although there can be no
assurance that this will be true in the future.
Convertible Securities. Each Portfolio may invest in convertible securities;
that is, bonds, notes, debentures, preferred stocks and other securities which
are convertible into common stock. Investments in convertible securities can
provide an opportunity for capital appreciation and/or income through interest
and dividend payments by virtue of their conversion or exchange features.
The convertible securities in which a Portfolio may invest include fixed-income
or zero coupon debt securities which may be converted or exchanged at a stated
or determinable exchange ratio into underlying shares of common stock. The
exchange ratio for any particular convertible security may be adjusted from time
to time due to stock splits, dividends, spin-offs, other corporate distributions
or scheduled changes in the exchange ratio. Convertible securities and
convertible preferred stocks, until converted, have general characteristics
similar to both debt and equity securities. Although to a lesser extent than
with debt securities generally, the market values of convertible securities
tends to decline as interest rates increase and, conversely, tend to increase as
interest rates decline. In addition, because of the conversion or exchange
feature, the market values of convertible securities typically changes as the
market value of the underlying common stocks changes, and, therefore, also tend
to follow movements in the general market for equity securities. A unique
feature of convertible securities is that as the market price of the underlying
common stock declines, convertible securities tend to trade increasingly on a
yield basis, and so may not experience market value declines to the same extent
as the underlying common stock. When the market price of the underlying common
stock increases, the prices of the convertible securities tend to rise as a
reflection of the value of the underlying common stock, although typically not
as much as the underlying common stock. While no securities investments are
without risk, investments in convertible securities generally entail less risk
than investments in common stock of the same issuer.
As debt securities, convertible securities are investments which provide for a
stream of income (or in the case of zero coupon securities, accretion of income)
with generally higher yields than common stocks. Convertible securities
generally offer lower yields than non-convertible securities of similar quality
because of their conversion or exchange features.
Of course, like all debt securities, there can be no assurance of income or
principal payments because the issuers of the convertible securities may default
on their obligations.
Convertible securities are generally subordinated to other similar but
non-convertible securities of the same issuer, although convertible bonds, as
corporate debt obligations, enjoy seniority in right of payment to all equity
securities, and convertible preferred stock is senior to common stock, of the
same issuer. However, because of the subordination feature, convertible bonds
and convertible preferred stock typically have lower ratings than similar
non-convertible securities. Convertible securities may be issued as fixed income
obligations that pay current income or as zero coupon notes and bonds, including
Liquid Yield Option Notes ("LYONs").
Corporate Obligations. Investment in corporate debt obligations involves credit
and interest rate risk. The value of fixed-income investments will fluctuate
with changes in interest rates and bond market conditions, tending to rise as
interest rates decline and to decline as interest rates rise. Corporate debt
obligations generally offer less current yield than securities of lower quality,
but lower-quality securities generally have less liquidity, greater credit and
market risk, and as a result, more price volatility. Longer-term bonds are,
however, generally more volatile than bonds with shorter maturities.
Depositary Receipts. DWS Global Opportunities VIP, DWS International VIP and DWS
Health Care VIP may each invest in sponsored or unsponsored American Depositary
Receipts ("ADRs"), European Depositary Receipts ("EDRs"), Global Depositary
Receipts ("GDRs"), International Depositary Receipts ("IDRs") and other types of
Depositary Receipts (which, together with ADRs, EDRs, GDRs and IDRs are
hereinafter referred to as "Depositary Receipts"). Depositary receipts provide
indirect investment in securities of foreign issuers. Prices of unsponsored
Depositary Receipts may be more volatile than if they were sponsored by the
issuer of the underlying securities. Depositary Receipts may not necessarily be
denominated in the same currency as the underlying securities into which they
may be converted. In addition, the issuers of the stock of unsponsored
Depositary Receipts are not obligated to disclose material information in the
United States and, therefore, there may not be a correlation between such
information and the market value of the Depositary Receipts. ADRs are Depositary
Receipts which are bought and sold in the United States and are typically issued
by a bank or trust company which evidence ownership of underlying securities
issued by a foreign corporation. GDRs and IDRs and other types of Depositary
Receipts are typically issued by foreign banks or trust companies, although they
also may be issued by United States banks or trust companies, and evidence
ownership of underlying securities issued by either a foreign or a United States
corporation. Generally, Depositary Receipts in registered form are designed for
use in the United States securities markets and Depositary Receipts in bearer
form are designed for use in securities markets outside the United States. For
purposes of the DWS Growth & Income VIP, DWS Capital Growth VIP and DWS
International VIP investment policies, the Portfolios' investments in ADRs, GDRs
and other types of Depositary Receipts will be deemed to be investments in the
underlying securities. Depositary Receipts including those denominated in US
dollars will be subject to foreign currency exchange rate risk. However, by
investing in US dollar-denominated ADRs rather than directly in foreign issuers'
stock, a Portfolio avoids currency risks during the settlement period. In
general, there is a large, liquid market in the United States for most ADRs.
However, certain Depositary Receipts may not be listed on an exchange and
therefore may be illiquid securities.
Direct Debt Instruments. Direct debt instruments are interests in amounts owed
by a corporate, governmental or other borrower to lenders (direct loans), to
suppliers of goods or services (trade claims or other receivables) or to other
parties. DWS Bond VIP may invest in all types of direct debt investments, but
among these investments the Portfolio currently intends to invest primarily in
direct loans and trade claims.
When the Portfolio participates in a direct loan it will be lending money
directly to an issuer. Direct loans generally do not have an underwriter or
agent bank, but instead, are negotiated between a company's management team and
a lender or group of lenders. Direct loans typically offer better security and
structural terms than other types of high yield securities. Direct debt
obligations are often the most senior-obligations in an issuer's capital
structure or are well-collateralized so that overall risk is lessened.
Trade claims are unsecured rights of payment arising from obligations other than
borrowed funds. Trade claims include vendor claims and other receivables that
are adequately documented and available for purchase from high yield
broker-dealers. Trade claims typically may sell at a discount. In addition to
the risks otherwise associated with low-quality obligations, trade claims have
other risks, including the possibility that the amount of the claim may be
disputed by the obligor. Trade claims normally would be considered illiquid and
pricing can be volatile.
Direct debt instruments involve a risk of loss in case of default or insolvency
of the borrower. The Portfolio will rely primarily upon the creditworthiness of
the borrower and/or the collateral for payment of interest and repayment of
principal. The value of the Portfolio's investments may be adversely affected if
scheduled interest or principal payments are not made. Because most direct loans
will be secured, there will be a smaller risk of loss with direct loans than
with an investment in unsecured high yield bonds or trade claims. Indebtedness
of borrowers whose creditworthiness is poor involves substantially greater risks
and may be highly speculative. Borrowers that are in bankruptcy or restructuring
may never pay off their indebtedness or may pay only a small fraction of the
amount owed. Investments in direct debt instruments also involve interest rate
risk and liquidity risk. However, interest rate risk is lessened by the
generally short-term nature of direct debt instruments and their interest rate
structure, which typically floats. To the extent the direct debt instruments in
which the Portfolio invests are considered illiquid, the lack of a liquid
secondary market (1) will have an adverse impact on the value of such
instruments, (2) will have an adverse impact on the Portfolio's ability to
dispose of them when necessary to meet the Portfolio's liquidity needs or in
response to a specific economic event, such as a decline in creditworthiness of
the issuer, and (3) may make it more difficult for the Portfolio to assign a
value of these instruments for purposes of valuing the Portfolio's portfolio and
calculating its net asset value. In order to lessen liquidity risk, the
Portfolio anticipates investing primarily in direct debt instruments that are
quoted and traded in the high yield market and will not invest in these
instruments if it would cause more than 15% of the Portfolio's net assets to be
illiquid. Trade claims may also present a tax risk to the Portfolio. The
Portfolio will not invest in trade claims if it effects the Portfolio's
qualification as a regulated investment company under Subchapter M of the
Internal Revenue Code.
Dollar Roll Transactions. Dollar roll transactions consist of the sale by a
Portfolio to a bank or broker/dealer (the "counterparty") of GNMA certificates
or other mortgage-backed securities together with a commitment to purchase from
the counterparty similar, but not identical, securities at a future date, at the
same price. The counterparty receives all principal and interest payments,
including prepayments, made on the security while it is the holder. A Portfolio
receives a fee from the counterparty as consideration for entering into the
commitment to purchase. Dollar rolls may be renewed over a period of several
months with a different purchase and repurchase price fixed and a cash
settlement made at each renewal without physical delivery of securities.
Moreover, the transaction may be preceded by a firm commitment agreement
pursuant to which a Portfolio agrees to buy a security on a future date.
Each Portfolio will segregate cash, US Government securities or other liquid
assets in an amount sufficient to meet their purchase obligations under the
transactions.
Dollar rolls may be treated for purposes of the 1940 Act, as amended, as
borrowings of each Portfolio because they involve the sale of a security coupled
with an agreement to repurchase. A dollar roll involves costs to the Portfolio.
For example, while a Portfolio receives a fee as consideration for agreeing to
repurchase the security, the Fund forgoes the right to receive all principal and
interest payments while the counterparty holds the security. These payments to
the counterparty may exceed the fee received by the Portfolio, thereby
effectively charging the Portfolio interest on its borrowing. Further, although
a Portfolio can estimate the amount of expected principal prepayment over the
term of the dollar roll, a variation in the actual amount of prepayment could
increase or decrease the cost of the Portfolio's borrowing.
The entry into dollar rolls involves potential risks of loss that are different
from those related to the securities underlying the transactions. For example,
if the counterparty becomes insolvent, a Portfolio's right to purchase from the
counterparty might be restricted. Additionally, the value of such securities may
change adversely before a Fund is able to purchase them. Similarly, a Portfolio
may be required to purchase securities in connection with a dollar roll at a
higher price than may otherwise be available on the open market. Since, as noted
above, the counterparty is required to deliver a similar, but not identical
security to a Portfolio, the security that the Portfolio is required to buy
under the dollar roll may be worth less than an identical security. Finally,
there can be no assurance that each Portfolio's use of the cash that it receives
from a dollar roll will provide a return that exceeds borrowing costs.
Eurodollar Instruments. The Fund may make investments in Eurodollar instruments
for hedging purposes or to enhance potential gain. Eurodollar instruments are US
dollar-denominated futures contracts or options thereon which are linked to the
London Interbank Offered Rate ("LIBOR"), although foreign currency-denominated
instruments are available from time to time. Eurodollar futures contracts enable
purchasers to obtain a fixed rate for the lending of funds and sellers to obtain
a fixed rate for borrowings. The Fund might use Eurodollar futures contracts and
options thereon to hedge against changes in LIBOR, to which many interest rate
swaps and fixed income instruments are linked.
Eurodollar Obligations. Eurodollar bank obligations are US dollar-denominated
certificates of deposit and time deposits issued outside the US capital markets
by foreign branches of US banks and US branches of foreign banks. Eurodollar
obligations are subject to the same risks that pertain to domestic issues,
notably credit risk, market risk and liquidity risk. Additionally, Eurodollar
obligations are subject to certain sovereign risks.
FHLMC Collateralized Mortgage Obligations. Federal Home Loan Mortgage
Corporation ("FHLMC") CMOs are debt obligations of FHLMC issued in multiple
classes having different maturity dates which are secured by the pledge of a
pool of conventional mortgage loans purchased by FHLMC. Unlike FHLMC
Participation Certificates ("PCs"), payments of principal and interest on the
CMOs are made semiannually, as opposed to monthly. The amount of principal
payable on each semiannual payment date is determined in accordance with FHLMC's
mandatory sinking fund schedule, which, in turn, is equal to approximately 100%
of FHA prepayment experience applied to the mortgage collateral pool. All
sinking fund payments in the CMOs are allocated to the retirement of the
individual classes of bonds in the order of their stated maturities. Payment of
principal on the mortgage loans in the collateral pool in excess of the amount
of FHLMC's minimum sinking fund obligation for any payment date are paid to the
holders of the CMOs as additional sinking fund payments. Because of the
"pass-through" nature of all principal payments received on the collateral pool
in excess of FHLMC's minimum sinking fund requirement, the rate at which
principal of the CMOs is actually repaid is likely to be such that each class of
bonds will be retired in advance of its scheduled maturity date.
If collection of principal (including prepayments) on the mortgage loans during
any semiannual payment period is not sufficient to meet FHLMC's minimum sinking
fund obligation on the next sinking fund payment date, FHLMC agrees to make up
the deficiency from its general funds.
Criteria for the mortgage loans in the pool backing the CMOs are identical to
those of FHLMC PCs. FHLMC has the right to substitute collateral in the event of
delinquencies and/or defaults.
Foreign Currencies. Because investments in foreign securities usually will
involve currencies of foreign countries, and because a Portfolio may hold
foreign currencies and forward contracts, futures contracts and options on
foreign currencies and foreign currency futures contracts, the value of the
assets of a Portfolio as measured in U.S. dollars may be affected favorably or
unfavorably by changes in foreign currency exchange rates and exchange control
regulations, and a Portfolio may incur costs and experience conversion
difficulties and uncertainties in connection with conversions between various
currencies. Fluctuations in exchange rates may also affect the earning power and
asset value of the foreign entity issuing the security.
The strength or weakness of the U.S. dollar against these currencies is
responsible for part of a Portfolio's investment performance. If the dollar
falls in value relative to the Japanese yen, for example, the dollar value of a
Japanese stock held in the portfolio will rise even though the price of the
stock remains unchanged. Conversely, if the dollar rises in value relative to
the yen, the dollar value of the Japanese stock will fall. Many foreign
currencies have experienced significant devaluation relative to the dollar.
Although each Portfolio values its assets daily in terms of U.S. dollars, it
does not intend to convert its holdings of foreign currencies into U.S. dollars
on a daily basis. It will do so from time to time, and investors should be aware
of the costs of currency conversion. Although foreign exchange dealers do not
charge a fee for conversion, they do realize a profit based on the difference
(the "spread") between the prices at which they are buying and selling various
currencies. Thus, a dealer may offer to sell a foreign currency to a Portfolio
at one rate, while offering a lesser rate of exchange should a Portfolio desire
to resell that currency to the dealer. A Portfolio will conduct its foreign
currency exchange transactions either on a spot (i.e., cash) basis at the spot
rate prevailing in the foreign currency exchange market, or through entering
into options or forward or futures contracts to purchase or sell foreign
currencies.
Foreign Fixed Income Securities. Since most foreign fixed income securities are
not rated, a Portfolio will invest in foreign fixed income securities based on
the Advisor's analysis without relying on published ratings. Since such
investments will be based upon the Advisor's analysis rather than upon published
ratings, achievement of a Portfolio's goals may depend more upon the abilities
of the Advisor than would otherwise be the case.
The value of the foreign fixed income securities held by a Portfolio, and thus
the net asset value of a Portfolio's shares, generally will fluctuate with (a)
changes in the perceived creditworthiness of the issuers of those securities,
(b) movements in interest rates, and (c) changes in the relative values of the
currencies in which a Portfolio's investments in fixed income securities are
denominated with respect to the US dollar. The extent of the fluctuation will
depend on various factors, such as the average maturity of a Portfolio's
investments in foreign fixed income securities, and the extent to which a
Portfolio hedges its interest rate, credit and currency exchange rate risks. A
longer average maturity generally is associated with a higher level of
volatility in the market value of such securities in response to changes in
market conditions.
Investments in sovereign debt, including Brady Bonds (Brady Bonds are debt
securities issued under a plan implemented to allow debtor nations to
restructure their outstanding commercial bank indebtedness), involve special
risks. Foreign governmental issuers of debt or the governmental authorities that
control the repayment of the debt may be unable or unwilling to repay principal
or pay interest when due. In the event of default, there may be limited or no
legal recourse in that, generally, remedies for defaults must be pursued in the
courts of the defaulting party. Political conditions, especially a sovereign
entity's willingness to meet the terms of its fixed income securities, are of
considerable significance. Also, there can be no assurance that the holders of
commercial bank loans to the same sovereign entity may not contest payments to
the holders of sovereign debt in the event of default under commercial bank loan
agreements. In addition, there is no bankruptcy proceeding with respect to
sovereign debt on which a sovereign has defaulted, and a Portfolio may be unable
to collect all or any part of its investment in a particular issue. Foreign
investment in certain sovereign debt is restricted or controlled to varying
degrees, including requiring governmental approval for the repatriation of
income, capital or proceeds of sales by foreign investors. These restrictions or
controls may at times limit or preclude foreign investment in certain sovereign
debt or increase the costs and expenses of a Portfolio.
Sovereign debt of emerging market governmental issuers is to be considered
speculative. Emerging market governmental issuers are among the largest debtors
to commercial banks, foreign governments, international financial organizations
and other financial institutions. Certain emerging market governmental issuers
have not been able to make payments of interest on or principal of debt
obligations as those payments have come due. There is a history of defaults with
respect to commercial bank loans by public and private entities issuing
sovereign debt. All or a portion of the interest payments and/or principal
repayment with respect to sovereign debt may be uncollateralized. Obligations
arising from past restructuring agreements may affect the economic performance
and political and social stability of those issuers.
The ability of emerging market country governmental issuers to make timely
payments on their obligations is likely to be influenced strongly by the
issuer's balance of payments, including export performance, and its access to
international credits and investments. An emerging market whose exports are
concentrated in a few commodities could be vulnerable to a decline in the
international prices of one or more of those commodities. Increased
protectionism on the part of an emerging market's trading partners could also
adversely affect the country's exports and diminish its trade account surplus,
if any. To the extent that emerging markets receive payment for its exports in
currencies other than dollars or non-emerging market currencies, its ability to
make debt payments denominated in dollars or non-emerging market currencies
could be affected.
Another factor bearing on the ability of emerging market countries to repay debt
obligations is the level of international reserves of the country. Fluctuations
in the level of these reserves affect the amount of foreign exchange readily
available for external debt payments and thus could have a bearing on the
capacity of emerging market countries to make payments on these debt
obligations.
To the extent that an emerging market country cannot generate a trade surplus,
it must depend on continuing loans from foreign governments, multilateral
organizations or private commercial banks, aid payments from foreign governments
and inflows of foreign investment. The access of emerging markets to these forms
of external funding may not be certain, and a withdrawal of external funding
could adversely affect the capacity of emerging market country governmental
issuers to make payments on their obligations. In addition, the cost of
servicing emerging market debt obligations can be affected by a change in
international interest rates since the majority of these obligations carry
interest rates that are adjusted periodically based upon international rates.
Foreign Investment. DWS Bond VIP, DWS Growth & Income VIP, DWS Capital Growth
VIP, DWS Global Opportunities VIP and DWS International VIP may each invest,
except as applicable to debt securities generally, in US dollar-denominated
foreign debt securities (including those issued by the Dominion of Canada and
its provinces and other debt securities which meet the criteria applicable to
the Portfolio's domestic investments), and in certificates of deposit issued by
foreign banks and foreign branches of United States banks, to any extent deemed
appropriate by the Advisor. DWS Bond VIP may invest up to 25% of its assets in
non-US dollar-denominated foreign debt securities. DWS Growth & Income VIP may
invest up to 25% of its assets in non-US dollar denominated equity securities of
foreign issuers. DWS Capital Growth VIP may invest up to 25% of its assets, and
DWS Global Opportunities VIP and DWS International VIP may invest without limit,
in non-US dollar-denominated equity securities of foreign issuers.
Foreign Securities. Foreign securities are normally denominated and traded in
foreign currencies. As a result, the value of the fund's foreign investments and
the value of its shares may be affected favorably or unfavorably by changes in
currency exchange rates relative to the US dollar. There may be less information
publicly available about a foreign issuer than about a US issuer, and foreign
issuers may not be subject to accounting, auditing and financial reporting
standards and practices comparable to those in the US. The securities of some
foreign issuers are less liquid and at times more volatile than securities of
comparable US issuers. Foreign brokerage commissions and other fees are also
generally higher than in the US. Foreign settlement procedures and trade
regulations may involve certain risks (such as delay in payment or delivery of
securities or in the recovery of the fund's assets held abroad) and expenses not
present in the settlement of investments in US markets. Payment for securities
without delivery may be required in certain foreign markets.
In addition, foreign securities may be subject to the risk of nationalization or
expropriation of assets, imposition of currency exchange controls or
restrictions on the repatriation of foreign currency, confiscatory taxation,
political or financial instability and diplomatic developments which could
affect the value of the fund's investments in certain foreign countries.
Governments of many countries have exercised and continue to exercise
substantial influence over many aspects of the private sector through the
ownership or control of many companies, including some of the largest in these
countries. As a result, government actions in the future could have a
significant effect on economic conditions which may adversely affect prices of
certain portfolio securities. There is also generally less government
supervision and regulation of stock exchanges, brokers, and listed companies
than in the US. Dividends or interest on, or proceeds from the sale of, foreign
securities may be subject to foreign withholding taxes, and special US tax
considerations may apply. Moreover, foreign economies may differ favorably or
unfavorably from the US economy in such respects as growth of gross national
product, rate of inflation, capital reinvestment, resource self-sufficiency and
balance of payments position.
Legal remedies available to investors in certain foreign countries may be more
limited than those available with respect to investments in the US or in other
foreign countries. The laws of some foreign countries may limit the fund's
ability to invest in securities of certain issuers organized under the laws of
those foreign countries.
Of particular importance, many foreign countries are heavily dependent upon
exports, particularly to developed countries, and, accordingly, have been and
may continue to be adversely affected by trade barriers, managed adjustments in
relative currency values, and other protectionist measures imposed or negotiated
by the US and other countries with which they trade. These economies also have
been and may continue to be negatively impacted by economic conditions in the US
and other trading partners, which can lower the demand for goods produced in
those countries.
The risks described above, including the risks of nationalization or
expropriation of assets, typically are increased in connection with investments
in "emerging markets." For example, political and economic structures in these
countries may be in their infancy and developing rapidly, and such countries may
lack the social, political and economic stability characteristic of more
developed countries (including amplified risk of war and terrorism). Certain of
these countries have in the past failed to recognize private property rights and
have at times nationalized and expropriated the assets of private companies.
Investments in emerging markets may be considered speculative.
The currencies of certain emerging market countries have experienced
devaluations relative to the US dollar, and future devaluations may adversely
affect the value of assets denominated in such currencies. In addition, currency
hedging techniques may be unavailable in certain emerging market countries. Many
emerging market countries have experienced substantial, and in some periods
extremely high, rates of inflation or deflation for many years, and future
inflation may adversely affect the economies and securities markets of such
countries.
In addition, unanticipated political or social developments may affect the value
of investments in emerging markets and the availability of additional
investments in these markets. Any change in the leadership or politics of
emerging market countries, or the countries that exercise a significant
influence over those countries, may halt the expansion of or reverse the
liberalization of foreign investment policies now occurring and adversely affect
existing investment opportunities. The small size, limited trading volume and
relative inexperience of the securities markets in these countries may make
investments in securities traded in emerging markets illiquid and more volatile
than investments in securities traded in more developed countries. For example,
limited market size may cause prices to be unduly influenced by traders who
control large positions. In addition, the fund may be required to establish
special custodial or other arrangements before making investments in securities
traded in emerging markets. There may be little financial or accounting
information available with respect to issuers of emerging market securities, and
it may be difficult as a result to assess the value of prospects of an
investment in such securities.
The risk also exists that an emergency situation may arise in one or more
emerging markets as a result of which trading of securities may cease or may be
substantially curtailed and prices for a fund's securities in such markets may
not be readily available. A fund may suspend redemption of its shares for any
period during which an emergency exists, as determined by the SEC. Accordingly
if a fund believes that appropriate circumstances exist, it will promptly apply
to the SEC for a determination that an emergency is present. During the period
commencing from a fund's identification of such condition until the date of the
SEC action, a fund's securities in the affected markets will be valued at fair
value determined in good faith by or under the direction of a fund's Board.
Certain of the foregoing risks may also apply to some extent to securities of US
issuers that are denominated in foreign currencies or that are traded in foreign
markets, or securities of US issuers having significant foreign operations.
High Yield/High Risk Bonds. DWS Bond VIP, DWS Capital Growth VIP and DWS Global
Opportunities VIP may also purchase debt securities which are rated below
investment-grade (commonly referred to as "junk bonds"), that is, rated below Ba
by Moody's or below BB by S&P and unrated securities judged to be of equivalent
quality as determined by the Advisor. These securities usually entail greater
risk (including the possibility of default or bankruptcy of the issuers of such
securities), generally involve greater volatility of price and risk to principal
and income, and may be less liquid, than securities in the higher rating
categories. The lower the ratings of such debt securities, the more their risks
render them like equity securities. Securities rated D may be in default with
respect to payment of principal or interest. See the Appendix to this Statement
of Additional Information for a more complete description of the ratings
assigned by ratings organizations and their respective characteristics.
Issuers of such high yielding securities often are highly leveraged and may not
have available to them more traditional methods of financing. Therefore, the
risk associated with acquiring the securities of such issuers generally is
greater than is the case with higher rated securities. For example, during an
economic downturn or a sustained period of rising interest rates, highly
leveraged issuers of high yield securities may experience financial stress.
During such periods, such issuers may not have sufficient revenues to meet their
interest payment obligations. The issuer's ability to service its debt
obligations may also be adversely affected by specific corporate developments,
or the issuer's inability to meet specific projected business forecasts, or the
unavailability of additional financing. The risk of loss from default by the
issuer is significantly greater for the holders of high yield securities because
such securities are generally unsecured and are often subordinated to other
creditors of the issuer. Prices and yields of high yield securities will
fluctuate over time and, during periods of economic uncertainty, volatility of
high yield securities may adversely affect a Portfolio's net asset value. In
addition, investments in high yield zero coupon or pay-in-kind bonds, rather
than income-bearing high yield securities, may be more speculative and may be
subject to greater fluctuations in value due to changes in interest rates.
A Portfolio may have difficulty disposing of certain high yield (high risk)
securities because they may have a thin trading market. Because not all dealers
maintain markets in all high yield securities, a Portfolio anticipates that such
securities could be sold only to a limited number of dealers or institutional
investors. The lack of a liquid secondary market may have an adverse effect on
the market price and a Portfolio's ability to dispose of particular issues and
may also make it more difficult for a Portfolio to obtain accurate market
quotations for purposes of valuing a Portfolio's assets. Market quotations
generally are available on many high yield issues only from a limited number of
dealers and may not necessarily represent firm bids of such dealers or prices
for actual sales. Adverse publicity and investor perceptions may decrease the
values and liquidity of high yield securities. These securities may also involve
special registration responsibilities, liabilities and costs, and liquidity and
valuation difficulties.
Credit quality in the high-yield securities market can change suddenly and
unexpectedly, and even recently issued credit ratings may not fully reflect the
actual risks posed by a particular high-yield security. For these reasons, it is
generally the policy of the Advisor not to rely exclusively on ratings issued by
established credit rating agencies, but to supplement such ratings with its own
independent and on-going review of credit quality. The achievement of a
Portfolio's investment objective by investment in such securities may be more
dependent on the Advisor's credit analysis than is the case for higher quality
bonds. Should the rating of a portfolio security be downgraded, the Advisor will
determine whether it is in the best interests of the Fund to retain or dispose
of such security.
Prices for below investment-grade securities may be affected by legislative and
regulatory developments. Also, Congress has from time to time considered
legislation which would restrict or eliminate the corporate tax deduction for
interest payments in these securities and regulate corporate restructurings.
Such legislation may significantly depress the prices of outstanding securities
of this type.
Illiquid Securities and Restricted Securities. A Portfolio may purchase
securities that are subject to legal or contractual restrictions on resale
("restricted securities"). Generally speaking, restricted securities may be sold
(i) only to qualified institutional buyers; (ii) in a privately negotiated
transaction to a limited number of purchasers; (iii) in limited quantities after
they have been held for a specified period of time and other conditions are met
pursuant to an exemption from registration; or (iv) in a public offering for
which a registration statement is in effect under the Securities Act of 1933, as
amended. Issuers of restricted securities may not be subject to the disclosure
and other investor protection requirements that would be applicable if their
securities were publicly traded.
Restricted securities are often illiquid, but they may also be liquid. For
example, restricted securities that are eligible for resale under Rule 144A are
often deemed to be liquid.
A Portfolio's Board has approved guidelines for use by the Advisor in
determining whether a security is liquid or illiquid. Among the factors the
Advisor may consider in reaching liquidity decisions relating to Rule 144A
securities are: (1) the frequency of trades and quotes for the security; (2) the
number of dealers wishing to purchase or sell the security and the number of
other potential purchasers; (3) dealer undertakings to make a market in the
security; and (4) the nature of the security and the nature of the market for
the security (i.e., the time needed to dispose of the security, the method of
soliciting offers, and the mechanics of the transfer). Issuers of restricted
securities may not be subject to the disclosure and other investor protection
requirement that would be applicable if their securities were publicly traded.
Where a registration statement is required for the resale of restricted
securities, a Portfolio may be required to bear all or part of the registration
expenses. A Portfolio may be deemed to be an "underwriter" for purposes of the
Securities Act of 1933, as amended when selling restricted securities to the
public and, in such event, a Portfolio may be liable to purchasers of such
securities if the registration statement prepared by the issuer is materially
inaccurate or misleading.
A Portfolio may also purchase securities that are not subject to legal or
contractual restrictions on resale, but that are deemed illiquid. Such
securities may be illiquid, for example, because there is a limited trading
market for them.
A Portfolio may be unable to sell a restricted or illiquid security. In
addition, it may be more difficult to determine a market value for restricted or
illiquid securities. Moreover, if adverse market conditions were to develop
during the period between a Portfolio's decision to sell a restricted or
illiquid security and the point at which a Portfolio is permitted or able to
sell such security, a Portfolio might obtain a price less favorable than the
price that prevailed when it decided to sell. This investment practice,
therefore, could have the effect of increasing the level of illiquidity of a
Portfolio.
Impact of Large Redemptions and Purchases of Portfolio Shares. From time to
time, shareholders of a Portfolio (which may include affiliated and/or
non-affiliated registered investment companies that invest in a Portfolio) may
make relatively large redemptions or purchases of Portfolio shares. These
transactions may cause a Portfolio to have to sell securities or invest
additional cash, as the case may be. While it is impossible to predict the
overall impact of these transactions over time, there could be adverse effects
on a Portfolio's performance to the extent that a Portfolio may be required to
sell securities or invest cash at times when it would not otherwise do so. These
transactions could also accelerate the realization of taxable income if sales of
securities resulted in capital gains or other income and could also increase
transaction costs, which may impact a Portfolio's expense ratio.
Impact of Sub-Prime Mortgage Market. A Portfolio may invest in companies that
may be affected by the downturn in the sub-prime mortgage lending market in the
US. Sub-prime loans, which tend to have higher interest rates, are made to
borrowers who do not qualify for prime rate loans because of their low credit
ratings or other factors that suggest that they have a higher probability of
defaulting. The downturn in the sub-prime mortgage-lending market has had, and
may continue to have, a far-reaching impact on the broader securities market,
especially in the sub-prime, asset-backed and other debt related securities
markets. In addition to performance issues, the reduced investor demand for
sub-prime, asset-backed and other debt related securities as a result of the
downturn has created liquidity and valuation issues for these securities. A
Portfolio's investments related to or impacted by the downturn in the sub-prime
mortgage lending market may cause the overall value of a Portfolio to decrease.
Indexed Securities. DWS Bond VIP may invest in indexed securities, the value of
which is linked to currencies, interest rates, commodities, indices or other
financial indicators ("reference instruments"). Most indexed securities have
maturities of three years or less.
Indexed securities differ from other types of debt securities in which a
Portfolio may invest in several respects. First, the interest rate or, unlike
other debt securities, the principal amount payable at maturity of an indexed
security may vary based on changes in one or more specified reference
instruments, such as an interest rate compared with a fixed interest rate or the
currency exchange rates between two currencies (neither of which need be the
currency in which the instrument is denominated). The reference instrument need
not be related to the terms of the indexed security. For example, the principal
amount of a US dollar denominated indexed security may vary based on the
exchange rate of two foreign currencies. An indexed security may be positively
or negatively indexed; that is, its value may increase or decrease if the value
of the reference instrument increases. Further, the change in the principal
amount payable or the interest rate of an indexed security may be a multiple of
the percentage change (positive or negative) in the value of the underlying
reference instrument(s).
Investment in indexed securities involves certain risks. In addition to the
credit risk of the security's issuer and the normal risks of price changes in
response to changes in interest rates, the principal amount of indexed
securities may decrease as a result of changes in the value of reference
instruments. Further, in the case of certain indexed securities in which the
interest rate is linked to a reference instrument, the interest rate may be
reduced to zero, and any further declines in the value of the security may then
reduce the principal amount payable on maturity. Finally, indexed securities may
be more volatile than the reference instruments underlying indexed securities.
Interfund Borrowing and Lending Program. The Fund, on behalf of each Portfolio,
has received exemptive relief from the Securities and Exchange Commission
("SEC") which permits the Portfolios to participate in an interfund lending
program among certain investment companies advised by the Advisor. The interfund
lending program allows the participating funds to borrow money from and loan
money to each other for temporary or emergency purposes. The program is subject
to a number of conditions designed to ensure fair and equitable treatment of all
participating funds, including the following: (1) no fund may borrow money
through the program unless it receives a more favorable interest rate than a
rate approximating the lowest interest rate at which bank loans would be
available to any of the participating funds under a loan agreement; and (2) no
fund may lend money through the program unless it receives a more favorable
return than that available from an investment in repurchase agreements and, to
the extent applicable, money market cash sweep arrangements. In addition, a fund
may participate in the program only if and to the extent that such participation
is consistent with the fund's investment objectives and policies (for instance,
money market funds would normally participate only as lenders and tax exempt
funds only as borrowers). Interfund loans and borrowings may extend overnight,
but could have a maximum duration of seven days. Loans may be called on one
day's notice. A fund may have to borrow from a bank at a higher interest rate if
an interfund loan is called or not renewed. Any delay in repayment to a lending
fund could result in a lost investment opportunity or additional costs. The
program is subject to the oversight and periodic review of the Boards of the
participating funds. To the extent a Portfolio is actually engaged in borrowing
through the interfund lending program, the Portfolio, as a matter of
nonfundamental policy, may not borrow for other than temporary or emergency
purposes (and not for leveraging), except that a Portfolio may engage in reverse
repurchase agreements and dollar rolls for any purpose.
Investment Company Securities. Each Portfolio may acquire securities of other
investment companies to the extent consistent with its investment objective and
subject to the limitations of the 1940 Act. Each Portfolio will indirectly bear
its proportionate share of any management fees and other expenses paid by such
other investment companies.
For example, a Portfolio may invest in a variety of investment companies which
seek to track the composition and performance of specific indexes or a specific
portion of an index. These index-based investments hold substantially all of
their assets in securities representing their specific index. Accordingly, the
main risk of investing in index-based investments is the same as investing in a
portfolio of equity securities comprising the index. The market prices of
index-based investments will fluctuate in accordance with both changes in the
market value of their underlying portfolio securities and due to supply and
demand for the instruments on the exchanges on which they are traded (which may
result in their trading at a discount or premium to their Net Asset Value
("NAVs"). Index-based investments may not replicate exactly the performance of
their specified index because of transaction costs and because of the temporary
unavailability of certain component securities of the index.
Examples of index-based investments include:
SPDRs(R): SPDRs, an acronym for "Standard & Poor's Depositary Receipts," are
based on the S&P 500. They are issued by the SPDR Trust, a unit investment trust
that holds shares of substantially all the companies in the S&P 500 in
substantially the same weighting and seeks to closely track the price
performance and dividend yield of the Index.
MidCap SPDRs(R): MidCap SPDRs are based on the S&P MidCap 400 Index. They are
issued by the MidCap SPDR Trust, a unit investment trust that holds a portfolio
of securities consisting of substantially all of the common stocks in the S&P
MidCap 400 Index in substantially the same weighting and seeks to closely track
the price performance and dividend yield of the Index.
Select Sector SPDRs(R): Select Sector SPDRs are based on a particular sector or
group of industries that are represented by a specified Select Sector Index
within the S&P 500. They are issued by The Select Sector SPDR Trust, an open-end
management investment company with nine portfolios that each seeks to closely
track the price performance and dividend yield of a particular Select Sector
Index.
DIAMONDS(SM): DIAMONDS are based on the Dow Jones Industrial Average(SM). They
are issued by the DIAMONDS Trust, a unit investment trust that holds a portfolio
of all the component common stocks of the Dow Jones Industrial Average and seeks
to closely track the price performance and dividend yield of the Dow.
Nasdaq-100 Shares: Nasdaq-100 Shares are based on the Nasdaq 100 Index. They are
issued by the Nasdaq-100 Trust, a unit investment trust that holds a portfolio
consisting of substantially all of the securities, in substantially the same
weighting, as the component stocks of the Nasdaq-100 Index and seeks to closely
track the price performance and dividend yield of the Index.
Investment-Grade Bonds. Each Portfolio may purchase "investment-grade" bonds,
which are those rated Aaa, Aa, A or Baa by Moody's or AAA, AA, A or BBB by S&P
or, if unrated, judged to be of equivalent quality as determined by the Advisor.
Moody's considers bonds it rates Baa to have speculative elements as well as
investment-grade characteristics. To the extent that a Portfolio invests in
higher-grade securities, a Portfolio will not be able to avail itself of
opportunities for higher income which may be available at lower grades.
Investment of Uninvested Cash Balances. Each Portfolio may have cash balances
that have not been invested in portfolio securities ("Uninvested Cash").
Uninvested Cash may result from a variety of sources, including dividends or
interest received from portfolio securities, unsettled securities transactions,
reserves held for investment strategy purposes, scheduled maturity of
investments, liquidation of investment securities to meet anticipated
redemptions and dividend payments, and new cash received from investors.
Uninvested Cash may be invested directly in money market instruments or other
short-term debt obligations. Pursuant to an Exemptive Order issued by the SEC,
each Portfolio may use Uninvested Cash to purchase shares of affiliated funds
including money market funds, short-term bond funds and Cash Management QP Trust
and DWS Trust Company, or one or more future entities for which Deutsche Asset
Management acts as trustee or investment advisor that operate as cash management
investment vehicles and that are excluded from the definition of investment
company pursuant to section 3(c)(1) or 3(c)(7) of the 1940 Act (collectively,
the "Central Funds") in excess of the limitations of Section 12(d)(1) of the
1940 Act. Investment by a Portfolio in shares of the Central Funds will be in
accordance with the Portfolio's investment policies and restrictions as set
forth in its registration statement.
Certain of the Central Funds comply with rule 2a-7 under the Act. The other
Central Funds are or will be short-term bond funds that invest in fixed-income
securities and maintain a dollar weighted average maturity of three years or
less. Each of the Central Funds will be managed specifically to maintain a
highly liquid portfolio, and access to them will enhance a Portfolio's ability
to manage Uninvested Cash.
Each Portfolio will invest Uninvested Cash in Central Funds only to the extent
that the Portfolio's aggregate investment in the Central Funds does not exceed
25% of its total assets in shares of the Central Funds. Purchase and sales of
shares of Central Funds are made at net asset value.
IPO Risk. Securities issued through an initial public offering (IPO) can
experience an immediate drop in value if the demand for the securities does not
continue to support the offering price. Information about the issuers of IPO
securities is also difficult to acquire since they are new to the market and may
not have lengthy operating histories. The DWS Health Care VIP may engage in
short-term trading in connection with its IPO investments, which could produce
higher trading costs and adverse tax consequences. The number of securities
issued in an IPO is limited, so it is likely that IPO securities will represent
a smaller component of the Portfolio's portfolio as its assets increase (and
thus have a more limited effect on the Portfolio's performance).
Lending of Portfolio Securities. Each Portfolio may lend its investment
securities to approved institutional borrowers who need to borrow securities in
order to complete certain transactions, such as covering short sales, avoiding
failures to deliver securities or completing arbitrage operations. By lending
its investment securities, a portfolio attempts to increase its net investment
income through the receipt of interest on the loan. Any gain or loss in the
market price of the securities loaned that might occur during the term of the
loan would belong to a portfolio. A portfolio may lend its investment securities
so long as the terms, structure and the aggregate amount of such loans are not
inconsistent with the 1940 Act or the rules and regulations or interpretations
of the SEC thereunder, which currently require that (a) the borrower pledge and
maintain with the portfolio collateral consisting of liquid, unencumbered assets
having a value at all times not less than 100% of the value of the securities
loaned, (b) the borrower add to such collateral whenever the price of the
securities loaned rises (i.e., the borrower "marks to the market" on a daily
basis), (c) the loan be made subject to termination by a portfolio at any time,
and (d) a portfolio receives reasonable interest on the loan (which may include
the portfolio investing any cash collateral in interest bearing short-term
investments), and distributions on the loaned securities and any increase in
their market value. There may be risks of delay in recovery of the securities or
even loss of rights in the collateral should the borrower of the securities fail
financially. However, loans will be made only to borrowers selected by a
portfolio's delegate after a commercially reasonable review of relevant facts
and circumstances, including the creditworthiness of the borrower.
At the present time, the staff of the SEC does not object if an investment
company pays reasonable negotiated fees in connection with loaned securities, so
long as such fees are set forth in a written contract and approved by the
investment company's Board of Trustees. In addition, voting rights may pass with
the loaned securities, but if a material event occurs affecting an investment on
loan, the loan must be called and the securities voted. Pursuant to an exemptive
order granted by the SEC, cash collateral received by a portfolio may be
invested in a money market fund managed by the Advisor (or one of its
affiliates).
Letters of Credit. Municipal obligations, including certificates of
participation, commercial paper and other short-term obligations, may be backed
by an irrevocable letter of credit of a bank which assumes the obligation for
payment of principal and interest in the event of default by the issuer. Only
banks which, in the opinion of the Advisor, are of investment quality comparable
to other permitted investments of the Fund may be used for letter of credit
backed investments.
Micro-Cap Company Risk. While, historically, micro-capitalization company stocks
have outperformed the stocks of large companies, the former have customarily
involved more investment risk as well. There can be no assurance that this will
continue to be true in the future. Micro-capitalization companies may have
limited product lines, markets or financial resources; may lack management depth
or experience; and may be more vulnerable to adverse general market or economic
developments than large companies. The prices of micro-capitalization company
securities are often more volatile than prices associated with large company
issues, and can display abrupt or erratic movements at times, due to limited
trading volumes and less publicly available information.
Also, because micro-capitalization companies normally have fewer shares
outstanding and these shares trade less frequently than large companies, it may
be more difficult for a fund to buy and sell significant amounts of such shares
without an unfavorable impact on prevailing market prices.
Some of the companies in which a fund may invest may distribute, sell or produce
products which have recently been brought to market and may be dependent on key
personnel. The securities of micro-capitalization companies are often traded
over-the-counter and may not be traded in the volumes typical on a national
securities exchange. Consequently, in order to sell this type of holding, a fund
may need to discount the securities from recent prices or dispose of the
securities over a long period of time.
Mortgage-Backed Securities and Mortgage Pass-Through Securities. DWS Bond VIP,
DWS Global Opportunities VIP and DWS Growth & Income VIP may also invest in
mortgage-backed securities, which are interests in pools of mortgage loans,
including mortgage loans made by savings and loan institutions, mortgage
bankers, commercial banks, and others. Pools of mortgage loans are assembled as
securities for sale to investors by various governmental, government-related,
and private organizations as further described below. Underlying mortgages may
be of a variety of types, including adjustable rate, conventional 30-year,
graduated payment and 15-year.
A decline in interest rates will often lead to a faster rate of repayment of the
underlying mortgages, and expose the Portfolios to a lower rate of return upon
reinvestment. To the extent that such mortgage-backed securities are held by the
Portfolios, the prepayment right will tend to limit to some degree the increase
in net asset value of the Portfolios because the value of the mortgage-backed
securities held by the Portfolios may not appreciate as rapidly as the price of
non-callable debt securities. Mortgage-backed securities are subject to the risk
of prepayment and the risk that the underlying loans will not be repaid. Because
principal may be prepaid at any time, mortgage-backed securities may involve
significantly greater price and yield volatility than traditional debt
securities.
When interest rates rise, mortgage prepayment rates tend to decline, thus
lengthening the life of mortgage-related securities and increasing their
volatility, affecting the price volatility of the Fund's shares.
Interests in pools of mortgage-backed securities differ from other forms of debt
securities, which normally provide for periodic payment of interest in fixed
amounts with principal payments at maturity or specified call dates. Instead,
these securities provide a monthly payment which consists of both interest and
principal payments. In effect, these payments are a "pass-through" of the
monthly payments made by the individual borrowers on their mortgage loans, net
of any fees paid to the issuer or guarantor of such securities. Additional
payments are caused by repayments of principal resulting from the sale of the
underlying property, refinancing or foreclosure, net of fees or costs which may
be incurred. Some mortgage-related securities such as securities issued by the
"GNMA" are described as "modified pass-through." These securities entitle the
holder to receive all interest and principal payments owed on the mortgage pool,
net of certain fees, at the scheduled payment dates regardless of whether or not
the mortgagor actually makes the payment.
The principal governmental guarantor of mortgage-related securities is GNMA.
GNMA is a wholly owned US Government corporation within the Department of
Housing and Urban Development. GNMA is authorized to guarantee, with the full
faith and credit of the US Government, the timely payment of principal and
interest on securities issued by institutions approved by GNMA (such as savings
and loan institutions, commercial banks, and mortgage bankers) and backed by
pools of FHA-insured or VA-guaranteed mortgages. These guarantees, however, do
not apply to the market value or yield of mortgage-backed securities or to the
value of Portfolio shares. Also, GNMA securities often are purchased at a
premium over the maturity value of the underlying mortgages. This premium is not
guaranteed and will be lost if prepayment occurs.
Government-related guarantors (i.e., not backed by the full faith and credit of
the US Government) include Fannie Mae and the "FHLMC." Fannie Mae is a
government-sponsored corporation owned entirely by private stockholders. It is
subject to general regulation by the Secretary of Housing and Urban Development.
Fannie Mae purchases conventional (i.e., not insured or guaranteed by any
governmental agency) mortgages from a list of approved seller/servicers which
include state and federally chartered savings and loan associations, mutual
savings banks, commercial banks, credit unions, and mortgage bankers.
Pass-through securities issued by Fannie Mae are guaranteed as to timely payment
of principal and interest by Fannie Mae but are not backed by the full faith and
credit of the US Government.
FHLMC is a corporate instrumentality of the US Government and was created by
Congress in 1970 for the purpose of increasing the availability of mortgage
credit for residential housing. Its stock is owned by the twelve Federal Home
Loan Banks. FHLMC issues PCs which represent interests in conventional mortgages
from FHLMC's national portfolio. FHLMC guarantees the timely payment of interest
and ultimate collection of principal, but PCs are not backed by the full faith
and credit of the US Government.
Commercial banks, savings and loan institutions, private mortgage insurance
companies, mortgage bankers, and other secondary market issuers also create
pass-through pools of conventional mortgage loans. Such issuers may, in
addition, be the originators and/or servicers of the underlying mortgage loans
as well as the guarantors of the mortgage-related securities. Pools created by
such non-governmental issuers generally offer a higher rate of interest than
governmental and government-related pools because there are no direct or
indirect government or agency guarantees of payments. However, timely payment of
interest and principal of these pools may be supported by various forms of
insurance or guarantees, including individual loan, title, pool and hazard
insurance, and letters of credit. The insurance and guarantees are issued by
governmental entities, private insurers, and the mortgage poolers. Such
insurance and guarantees and the creditworthiness of the issuers thereof will be
considered in determining whether a mortgage-related security meets the
Portfolios' investment quality standards. There can be no assurance that the
private insurers or guarantors can meet their obligations under the insurance
policies or guarantee arrangements. The Portfolios may buy mortgage-related
securities without insurance or guarantees, if through an examination of the
loan experience and practices of the originators/servicers and poolers, the
Advisor determines that the securities meet the Portfolios' quality standards.
Although the market for such securities is becoming increasingly liquid,
securities issued by certain private organizations may not be readily
marketable.
Other Mortgage-Backed Securities. The Advisor expects that governmental,
government-related, or private entities may create mortgage loan pools and other
mortgage-related securities offering mortgage pass-through and
mortgage-collateralized investments in addition to those described above. The
mortgages underlying these securities may include alternative mortgage
instruments, that is, mortgage instruments whose principal or interest payments
may vary or whose terms to maturity may differ from customary long-term fixed
rate mortgages. DWS Bond VIP will not purchase mortgage-backed securities or any
other assets which, in the opinion of the Advisor, are illiquid if, as a result,
more than 15% of the value of the Portfolio's net assets will be illiquid. As
new types of mortgage-related securities are developed and offered to investors,
the Advisor will, consistent with the Portfolio's investment objectives,
policies, and quality standards, consider making investments in such new types
of mortgage-related securities.
Mortgage Dollar Rolls. DWS Bond VIP may enter into mortgage dollar rolls in
which the Portfolio sells mortgage-backed securities for delivery in the current
month and simultaneously contracts to repurchase similar, but not identical,
securities on a fixed date. The Portfolio receives compensation as consideration
for entering into the commitment to repurchase. The compensation is paid in the
form of a fee which is recorded as deferred income and amortized to income over
the roll period, or alternatively, a lower price for the security upon its
repurchase. Mortgage dollar rolls may be renewed with a new sale and repurchase
price and a cash settlement made at each renewal without physical delivery of
the securities subject to the contract.
Municipal Obligations. DWS Bond VIP may invest in municipal obligations.
Municipal obligations are issued by or on behalf of states, territories and
possessions of the United States and their political subdivisions, agencies and
instrumentalities and the District of Columbia to obtain funds for various
public purposes. The interest on these obligations is generally exempt from
federal income tax in the hands of most investors. The two principal
classifications of municipal obligations are "notes" and "bonds." Municipal
notes are generally used to provide for short-term capital needs and generally
have maturities of one year or less. Municipal notes include: Tax Anticipation
Notes; Revenue Anticipation Notes; Bond Anticipation Notes; and Construction
Loan Notes.
Tax Anticipation Notes are sold to finance working capital needs of
municipalities. They are generally payable from specific tax revenues expected
to be received at a future date. Revenue Anticipation Notes are issued in
expectation of receipt of other types of revenue. Tax Anticipation Notes and
Revenue Anticipation Notes are generally issued in anticipation of various
seasonal revenue such as income, sales, use and business taxes. Bond
Anticipation Notes are sold to provide interim financing and Construction Loan
Notes are sold to provide construction financing. These notes are generally
issued in anticipation of long-term financing in the market. In most cases,
these monies provide for the repayment of the notes. After the projects are
successfully completed and accepted, many projects receive permanent financing
through the FHA under Fannie Mae or GNMA. There are, of course, a number of
other types of notes issued for different purposes and secured differently than
those described above.
Municipal bonds, which meet longer-term capital needs and generally have
maturities of more than one year when issued, have two principal
classifications: "general obligation" bonds and "revenue" bonds.
Issuers of general obligation bonds include states, counties, cities, towns and
regional districts. The proceeds of these obligations are used to fund a wide
range of public projects including the construction or improvement of schools,
highways and roads, water and sewer systems and a variety of other public
purposes. The basic security behind general obligation bonds is the issuer's
pledge of its full faith, credit, and taxing power for the payment of principal
and interest. The taxes that can be levied for the payment of debt service may
be limited or unlimited as to rate or amount or special assessments.
The principal security for a revenue bond is generally the net revenues derived
from a particular facility or group of facilities or, in some cases, from the
proceeds of a special excise or other specific revenue source. Revenue bonds
have been issued to fund a wide variety of capital projects including: electric,
gas, water and sewer systems; highways, bridges and tunnels; port and airport
facilities; colleges and universities; and hospitals. Although the principal
security behind these bonds varies widely, many provide additional security in
the form of a debt service reserve fund whose monies may also be used to make
principal and interest payments on the issuer's obligations. Housing finance
authorities have a wide range of security including partially or fully-insured,
rent-subsidized and/or collateralized mortgages, and/or the net revenues from
housing or other public projects. In addition to a debt service reserve fund,
some authorities provide further security in the form of a state's ability
(without obligation) to make up deficiencies in the debt reserve fund. Lease
rental bonds issued by a state or local authority for capital projects are
secured by annual lease rental payments from the state or locality to the
authority sufficient to cover debt service on the authority's obligations.
Some issues of municipal bonds are payable from United States Treasury bonds and
notes held in escrow by a trustee, frequently a commercial bank. The interest
and principal on these US Government securities are sufficient to pay all
interest and principal requirements of the municipal securities when due. Some
escrowed Treasury securities are used to retire municipal bonds at their
earliest call date, while others are used to retire municipal bonds at their
maturity.
Securities purchased for a Portfolio may include variable/floating rate
instruments, variable mode instruments, put bonds, and other obligations which
have a specified maturity date but also are payable before maturity after notice
by the holder ("demand obligations"). Demand obligations are considered for a
Portfolio's purposes to mature at the demand date.
There are, in addition, a variety of hybrid and special types of municipal
obligations as well as numerous differences in the security of municipal
obligations both within and between the two principal classifications (i.e.,
notes and bonds) discussed above.
An entire issue of municipal securities may be purchased by one or a small
number of institutional investors such as a Portfolio. Thus, such an issue may
not be said to be publicly offered. Unlike the equity securities of operating
companies or mutual funds which must be registered under the Securities Act of
1933 prior to offer and sale unless an exemption from such registration is
available, municipal securities, whether publicly or privately offered, may
nevertheless be readily marketable. A secondary market exists for municipal
securities which have been publicly offered as well as securities which have not
been publicly offered initially but which may nevertheless be readily
marketable. Municipal securities purchased for a Portfolio are subject to the
limitations on holdings of securities which are not readily marketable based on
whether it may be sold in a reasonable time consistent with the customs of the
municipal markets (usually seven days) at a price (or interest rate) which
accurately reflects its recorded value. A Portfolio believes that the quality
standards applicable to their investments enhance marketability. In addition,
stand-by commitments, participation interests and demand obligations also
enhance marketability.
Provisions of the federal bankruptcy statutes relating to the adjustment of
debts of political subdivisions and authorities of states of the United States
provide that, in certain circumstances, such subdivisions or authorities may be
authorized to initiate bankruptcy proceedings without prior notice to or consent
of creditors, which proceedings could result in material and adverse
modification or alteration of the rights of holders of obligations issued by
such subdivisions or authorities.
Litigation challenging the validity under state constitutions of present systems
of financing public education has been initiated or adjudicated in a number of
states, and legislation has been introduced to effect changes in public school
finances in some states. In other instances there has been litigation
challenging the issuance of pollution control revenue bonds or the validity of
their issuance under state or federal law which litigation could ultimately
affect the validity of those Municipal Securities or the tax-free nature of the
interest thereon.
For the purpose of a Portfolio's investment restrictions, the identification of
the "issuer" of municipal obligations which are not general obligation bonds is
made by the Advisor on the basis of the characteristics of the obligation as
described above, the most significant of which is the source of funds for the
payment of principal and interest on such obligations.
DWS Bond VIP may acquire municipal obligations when, due to disparities in the
debt securities markets, the anticipated total return on such obligations is
higher than that on taxable obligations. DWS Bond VIP has no current intention
of purchasing tax-exempt municipal obligations that would amount to greater than
5% of the Portfolio's total assets.
Participation Interests. A Portfolio may purchase from financial institutions
participation interests in securities in which a Portfolio may invest. A
participation interest gives a Portfolio an undivided interest in the security
in the proportion that a Portfolio's participation interest bears to the
principal amount of the security. These instruments may have fixed, floating or
variable interest rates, with remaining maturities of 397 days or less. If the
participation interest is unrated, or has been given a rating below that which
is permissible for purchase by a Portfolio, the participation interest will be
backed by an irrevocable letter of credit or guarantee of a bank, or the payment
obligation otherwise will be collateralized by US Government securities, or, in
the case of unrated participation interest, determined by the Advisor to be of
comparable quality to those instruments in which a Portfolio may invest. For
certain participation interests, a Portfolio will have the right to demand
payment, on not more than seven days' notice, for all or any part of a
Portfolio's participation interests in the security, plus accrued interest. As
to these instruments, a Portfolio generally intends to exercise its right to
demand payment only upon a default under the terms of the security.
Privatized Enterprises. Investments in foreign securities may include securities
issued by enterprises that have undergone or are currently undergoing
privatization. The governments of certain foreign countries have, to varying
degrees, embarked on privatization programs contemplating the sale of all or
part of their interests in state enterprises. A Portfolio's investments in the
securities of privatized enterprises may include privately negotiated
investments in a government or state-owned or controlled company or enterprise
that has not yet conducted an initial equity offering, investments in the
initial offering of equity securities of a state enterprise or former state
enterprise and investments in the securities of a state enterprise following its
initial equity offering.
In certain jurisdictions, the ability of foreign entities, such as a Portfolio,
to participate in privatizations may be limited by local law, or the price or
terms on which a Portfolio may be able to participate may be less advantageous
than for local investors. Moreover, there can be no assurance that governments
that have embarked on privatization programs will continue to divest their
ownership of state enterprises, that proposed privatizations will be successful
or that governments will not re-nationalize enterprises that have been
privatized.
In the case of the enterprises in which a Portfolio may invest, large blocks of
the stock of those enterprises may be held by a small group of stockholders,
even after the initial equity offerings by those enterprises. The sale of some
portion or all of those blocks could have an adverse effect on the price of the
stock of any such enterprise.
Prior to making an initial equity offering, most state enterprises or former
state enterprises go through an internal reorganization of management. Such
reorganizations are made in an attempt to better enable these enterprises to
compete in the private sector. However, certain reorganizations could result in
a management team that does not function as well as an enterprise's prior
management and may have a negative effect on such enterprise. In addition, the
privatization of an enterprise by its government may occur over a number of
years, with the government continuing to hold a controlling position in the
enterprise even after the initial equity offering for the enterprise.
Prior to privatization, most of the state enterprises in which a Portfolio may
invest enjoy the protection of and receive preferential treatment from the
respective sovereigns that own or control them. After making an initial equity
offering, these enterprises may no longer have such protection or receive such
preferential treatment and may become subject to market competition from which
they were previously protected. Some of these enterprises may not be able to
operate effectively in a competitive market and may suffer losses or experience
bankruptcy due to such competition.
Other Asset-Backed Securities. The securitization techniques used to develop
mortgaged-backed securities are now being applied to a broad range of assets.
Through the use of trusts and special purpose corporations, various types of
assets, including automobile loans, computer leases and credit card receivables,
are being securitized in pass-through structures similar to the mortgage
pass-through structures or in a structure similar to the CMO structure. In
general, the collateral supporting these securities is of shorter maturity than
mortgage loans and is less likely to experience substantial prepayments with
interest rate fluctuations.
Several types of asset-backed securities have already been offered to investors,
including Certificates for Automobile Receivables(SM) ("CARS(SM)"). CARS(SM)
represent undivided fractional interests in a trust whose assets consist of a
pool of motor vehicle retail installment sales contracts and security interests
in the vehicles securing the contracts. Payments of principal and interest on
CARS(SM) are passed through monthly to certificate holders, and are guaranteed
up to certain amounts and for a certain time period by a letter of credit issued
by a financial institution unaffiliated with the trustee or originator of the
trust. An investor's return on CARS(SM) may be affected by early prepayment of
principal on the underlying vehicle sales contracts. If the letter of credit is
exhausted, the trust may be prevented from realizing the full amount due on a
sales contract because of state law requirements and restrictions relating to
foreclosure sales of vehicles and the obtaining of deficiency judgments
following such sales or because of depreciation, damage or loss of a vehicle,
the application of federal and state bankruptcy and insolvency laws, or other
factors. As a result, certificate holders may experience delays in payments or
losses if the letter of credit is exhausted.
Asset-backed securities present certain risks that are not presented by
mortgage-backed securities. Primarily, these securities may not have the benefit
of any security interest in the related assets. Credit card receivables are
generally unsecured and the debtors are entitled to the protection of a number
of state and federal consumer credit laws, many of which give such debtors the
right to set off certain amounts owed on the credit cards, thereby reducing the
balance due. There is the possibility that recoveries on repossessed collateral
may not, in some cases, be available to support payments on these securities.
Asset-backed securities are often backed by a pool of assets representing the
obligations of a number of different parties. To lessen the effect of failures
by obligors on underlying assets to make payments, the securities may contain
elements of credit support which fall into two categories: (i) liquidity
protection, and (ii) protection against losses resulting from ultimate default
by an obligor on the underlying assets. Liquidity protection refers to the
provision of advances, generally by the entity administering the pool of assets,
to ensure that the receipt of payments on the underlying pool occurs in a timely
fashion. Protection against losses results from payment of the insurance
obligations on at least a portion of the assets in the pool. This protection may
be provided through guarantees, policies or letters of credit obtained by the
issuer or sponsor from third parties, through various means of structuring the
transaction or through a combination of such approaches. DWS Bond VIP will not
pay any additional or separate fees for credit support. The degree of credit
support provided for each issue is generally based on historical information
respecting the level of credit risk associated with the underlying assets.
Delinquency or loss in excess of that anticipated, or failure of the credit
support could adversely affect the return on an investment in such a security.
DWS Bond VIP may also invest in residual interests in asset-backed securities.
In the case of asset-backed securities issued in a pass-through structure, the
cash flow generated by the underlying assets is applied to make required
payments on the securities and to pay related administrative expenses. The
residual interest in an asset-backed security pass-through structure represents
the interest in any excess cash flow remaining after making the foregoing
payments. The amount of residual cash flow resulting from a particular issue of
asset-backed securities will depend on, among other things, the characteristics
of the underlying assets, the coupon rates on the securities, prevailing
interest rates, the amount of administrative expenses and the actual prepayment
experience on the underlying assets. Asset-backed security residuals not
registered under the Securities Act of 1933 may be subject to certain
restrictions on transferability. In addition, there may be no liquid market for
such securities.
The availability of asset-backed securities may be affected by legislative or
regulatory developments. It is possible that such developments may require DWS
Bond VIP to dispose of any then existing holdings of such securities.
Real Estate Investment Trusts ("REITs"). DWS Bond VIP, DWS Growth & Income VIP,
DWS Global Opportunities VIP and DWS Health Care VIP may each invest in REITs.
REITs are sometimes informally categorized as equity REITs, mortgage REITs and
hybrid REITs. Investment in REITs may subject a Portfolio to risks associated
with the direct ownership of real estate, such as decreases in real estate
values, overbuilding, increased competition and other risks related to local or
general economic conditions, increases in operating costs and property taxes,
changes in zoning laws, casualty or condemnation losses, possible environmental
liabilities, regulatory limitations on rent and fluctuations in rental income.
Equity REITs generally experience these risks directly through fee or leasehold
interests, whereas mortgage REITs generally experience these risks indirectly
through mortgage interests, unless the mortgage REIT forecloses on the
underlying real estate. Equity REITs may also realize capital gains by selling
properties that have appreciated in value. Changes in interest rates may also
affect the value of a Portfolio's investment in REITs. For instance, during
periods of declining interest rates, certain mortgage REITs may hold mortgages
that the mortgagors elect to prepay, which prepayment may diminish the yield on
securities issued by those REITs.
Certain REITs have relatively small market capitalizations, which may tend to
increase the volatility of the market prices of their securities. Furthermore,
REITs are dependent upon specialized management skills, have limited
diversification and are, therefore, subject to risks inherent in operating and
financing a limited number of projects. REITs are also subject to heavy cash
flow dependency, defaults by borrowers and the possibility of failing to qualify
for tax-free pass-through of income under the Internal Revenue Code of 1986, as
amended, and to maintain exemption from the registration requirements of the
Investment Company Act of 1940, as amended. By investing in REITs indirectly
through a Portfolio, a shareholder will bear not only his or her proportionate
share of the expenses of a Portfolio, but also, indirectly, similar expenses of
the REITs. In addition, REITs depend generally on their ability to generate cash
flow to make distributions to shareholders.
Repurchase Agreements. On behalf of a Portfolio, the Fund may invest in
repurchase agreements pursuant to its investment guidelines. In a repurchase
agreement, the Fund acquires ownership of a security and simultaneously commits
to resell that security to the seller, typically a bank or broker/dealer.
A repurchase agreement provides a means for a Portfolio to earn income on funds
for periods as short as overnight. It is an arrangement under which the
purchaser (i.e., the Portfolio) acquires a security ("Obligation") and the
seller agrees, at the time of sale, to repurchase the Obligation at a specified
time and price. Securities subject to a repurchase agreement are held in a
segregated account and, as described in more detail below, the value of such
securities is kept at least equal to the repurchase price on a daily basis. The
repurchase price may be higher than the purchase price, the difference being
income to a Portfolio, or the purchase and repurchase prices may be the same,
with interest at a stated rate due to a Portfolio together with the repurchase
price upon repurchase. In either case, the income to a Portfolio is unrelated to
the interest rate on the Obligation itself. Obligations will be held by the
custodian or in the Federal Reserve Book Entry system.
It is not clear whether a court would consider the Obligation purchased by a
Portfolio subject to a repurchase agreement as being owned by a Portfolio or as
being collateral for a loan by a Portfolio to the seller. In the event of the
commencement of bankruptcy or insolvency proceedings with respect to the seller
of the Obligation before repurchase of the Obligation under a repurchase
agreement, a Portfolio may encounter delay and incur costs before being able to
sell the security. Delays may involve loss of interest or decline in price of
the Obligation. If the court characterizes the transaction as a loan and a
Portfolio has not perfected a security interest in the Obligation, a Portfolio
may be required to return the Obligation to the seller's estate and be treated
as an unsecured creditor of the seller. As an unsecured creditor, a Portfolio
would be at risk of losing some or all of the principal and income involved in
the transaction. As with any unsecured debt Obligation purchased for the
Portfolio, the Fund seeks to reduce the risk of loss through repurchase
agreements by analyzing the creditworthiness of the obligor, in this case the
seller of the Obligation. Apart from the risk of bankruptcy or insolvency
proceedings, there is also the risk that the seller may fail to repurchase the
Obligation, in which case a Portfolio may incur a loss if the proceeds to a
Portfolio of the sale to a third party are less than the repurchase price.
However, if the market value (including interest) of the Obligation subject to
the repurchase agreement becomes less than the repurchase price (including
interest), a Portfolio will direct the seller of the Obligation to deliver
additional securities so that the market value (including interest) of all
securities subject to the repurchase agreement will equal or exceed the
repurchase price.
Restructuring Instruments. DWS Bond VIP hold distressed securities, which are
securities that are in default or in risk of being in default. In connection
with an exchange or workout of such securities, the Portfolio may accept various
instruments if the investment adviser determines it is in the best interests of
the Portfolio and consistent with the portfolio's investment objective and
policies. Such instruments may include, but not limited to, warrants, rights,
participation interests in assets sales and contingent-interest obligations.
Reverse Repurchase Agreements. Each Portfolio may enter into "reverse repurchase
agreements," which are repurchase agreements in which a Portfolio, as the seller
of the securities, agrees to repurchase such securities at an agreed upon time
and price. The Portfolio maintains a segregated account in connection with
outstanding reverse repurchase agreements. Each Portfolio will enter into
reverse repurchase agreements only when the Advisor believes that the interest
income to be earned from the investment of the proceeds of the transaction will
be greater than the interest expense of the transaction. Such transactions may
increase fluctuations in the market value of Portfolio assets and its yield.
Short Sales Against the Box. DWS Health Care VIP may make short sales of common
stocks if, at all times when a short position is open, a Portfolio owns the
stock or owns preferred stocks or debt securities convertible or exchangeable,
without payment of further consideration, into the shares of common stock sold
short. Short sales of this kind are referred to as short sales "against the
box." The portfolio will incur a loss as a result of the short sale if the price
of the security increases between the dates of the short sale and the date on
which the Portfolio replaces the borrowed security. The broker/dealer that
executes a short sale generally invests cash proceeds of the sale until they are
paid to the Portfolio. Arrangements may be made with the broker/dealer to obtain
a portion of the interest earned by the broker on the investment of short sale
proceeds. The Portfolio will segregate the common stock or convertible or
exchangeable preferred stock or debt securities in a special account with the
custodian. The Portfolio will incur transaction costs, including interest
expenses in connection with opening, maintaining, and closing short sales
against the box. Uncertainty regarding the tax effects of short sales of
appreciated investments may limit the extent to which a Portfolio may enter into
short sales against the box.
Small Company Risk. The Advisor believes that many small companies often have
sales and earnings growth rates which exceed those of larger companies, and that
such growth rates may in turn be reflected in more rapid share price
appreciation over time. However, investing in smaller company stocks involves
greater risk than is customarily associated with investing in larger, more
established companies. For example, smaller companies can have limited product
lines, markets, or financial and managerial resources. Smaller companies may
also be dependent on one or a few key persons, and may be more susceptible to
losses and risks of bankruptcy. Also, the securities of smaller companies may be
thinly traded (and therefore have to be sold at a discount from current market
prices or sold in small lots over an extended period of time). Transaction costs
in smaller company stocks may be higher than those of larger companies.
Sovereign Debt. Investment in sovereign debt can involve a high degree of risk.
The governmental entity that controls the repayment of sovereign debt may not be
able or willing to repay the principal and/or interest when due in accordance
with the terms of such debt. A governmental entity's willingness or ability to
repay principal and interest due in a timely manner may be affected by, among
other factors, its cash flow situation, the extent of its foreign reserves, the
availability of sufficient foreign exchange on the date a payment is due, the
relative size of the debt service burden to the economy as a whole, the
governmental entity's policy toward the International Monetary Fund, and the
political constraints to which a governmental entity may be subject.
Governmental entities may also be dependent on expected disbursements from
foreign governments, multilateral agencies and others abroad to reduce principal
and interest arrearages on their debt. The commitment on the part of these
governments, agencies and others to make such disbursements may be conditioned
on a governmental entity's implementation of economic reforms and/or economic
performance and the timely service of such debtor's obligations. Failure to
implement such reforms, achieve such levels of economic performance or repay
principal or interest when due may result in the cancellation of such third
parties commitments to lend funds to the governmental entity, which may further
impair such debtor's ability or willingness to service its debts in a timely
manner. Consequently, governmental entities may default on their sovereign debt.
Holders of sovereign debt may be requested to participate in the rescheduling of
such debt and to extend further loans to governmental entities. There is no
bankruptcy proceeding by which sovereign debt on which governmental entities
have defaulted may be collected in whole or in part.
Stripped Zero Coupon Securities. Zero coupon securities include securities
issued directly by the US Treasury, and US Treasury bonds or notes and their
unmatured interest coupons and receipts for their underlying principal
("coupons") which have been separated by their holder, typically a custodian
bank or investment brokerage firm. A holder will separate the interest coupons
from the underlying principal (the "corpus") of the US Treasury security. A
number of securities firms and banks have stripped the interest coupons and
receipts and then resold them in custodial receipt programs with a number of
different names, including "Treasury Income Growth Receipts" ("TIGRS(TM)") and
Certificate of Accrual on Treasuries ("CATS(TM)"). The underlying US Treasury
bonds and notes themselves are held in book-entry form at the Federal Reserve
Bank or, in the case of bearer securities (i.e., unregistered securities which
are owned ostensibly by the bearer or holder thereof), in trust on behalf of the
owners thereof. The Treasury has facilitated transfers of ownership of zero
coupon securities by accounting separately for the beneficial ownership of
particular interest coupons and corpus payments on Treasury securities through
the Federal Reserve book-entry record-keeping system. The Federal Reserve
program as established by the Treasury Department is known as "STRIPS" or
"Separate Trading of Registered Interest and Principal of Securities." Under the
STRIPS program, the Portfolio will be able to have its beneficial ownership of
zero coupon securities recorded directly in the book-entry record-keeping system
in lieu of having to hold certificates or other evidences of ownership of the
underlying US Treasury securities.
When US Treasury obligations have been stripped of their unmatured interest
coupons by the holder, the principal or corpus is sold at a deep discount
because the buyer receives only the right to receive a future fixed payment on
the security and does not receive any rights to periodic interest (i.e. cash)
payments. Once stripped or separated, the corpus and coupons may be sold
separately. Typically, the coupons are sold separately or grouped with other
coupons with like maturity dates and sold in such bundled form. Purchasers of
stripped obligations acquire, in effect, discount obligations that are
economically identical to the zero coupon securities that the Treasury sells
itself.
Supranational Entities. Supranational entities are international organizations
designated or supported by governmental entities to promote economic
reconstruction or development and international banking institutions and related
government agencies. Examples include the International Bank for Reconstruction
and Development (the World Bank), the European Coal and Steel Community, The
Asian Development Bank and the InterAmerican Development Bank. Obligations of
supranational entities are backed by the guarantee of one or more foreign
governmental parties which sponsor the entity.
Trust Preferred Securities. DWS Bond VIP may invest in Trust Preferred
Securities, which are hybrid instruments issued by a special purpose trust (the
"Special Trust"), the entire equity interest of which is owned by a single
issuer. The proceeds of the issuance to the Portfolios of Trust Preferred
Securities are typically used to purchase a junior subordinated debenture, and
distributions from the Special Trust are funded by the payments of principal and
interest on the subordinated debenture.
If payments on the underlying junior subordinated debentures held by the Special
Trust are deferred by the debenture issuer, the debentures would be treated as
original issue discount ("OID") obligations for the remainder of their term. As
a result, holders of Trust Preferred Securities, such as the Portfolios, would
be required to accrue daily for Federal income tax purposes, their share of the
stated interest and the de minimis OID on the debentures (regardless of whether
a Portfolio receives any cash distributions from the Special Trust), and the
value of Trust Preferred Securities would likely be negatively affected.
Interest payments on the underlying junior subordinated debentures typically may
only be deferred if dividends are suspended on both common and preferred stock
of the issuer. The underlying junior subordinated debentures generally rank
slightly higher in terms of payment priority than both common and preferred
securities of the issuer, but rank below other subordinated debentures and debt
securities. Trust Preferred Securities may be subject to mandatory prepayment
under certain circumstances. The market values of Trust Preferred Securities may
be more volatile than those of conventional debt securities. Trust Preferred
Securities may be issued in reliance on Rule 144A under the Securities Act of
1933, as amended, and, unless and until registered, are restricted securities;
there can be no assurance as to the liquidity of Trust Preferred Securities and
the ability of holders of Trust Preferred Securities, such as the Portfolios, to
sell their holdings.
US Government Securities. There are two broad categories of US
Government-related debt instruments: (a) direct obligations of the US Treasury,
and (b) securities issued or guaranteed by US Government agencies.
Examples of direct obligations of the US Treasury are Treasury Bills, Notes,
Bonds and other debt securities issued by the US Treasury. These instruments are
backed by the "full faith and credit" of the United States. They differ
primarily in interest rates, the length of maturities and the dates of issuance.
Treasury bills have original maturities of one year or less. Treasury notes have
original maturities of one to ten years and Treasury bonds generally have
original maturities of greater than ten years.
Some agency securities are backed by the full faith and credit of the United
States (such as Maritime Administration Title XI Ship Financing Bonds and Agency
for International Development Housing Guarantee Program Bonds) and others are
backed only by the rights of the issuer to borrow from the US Treasury (such as
Federal Home Loan Bank Bonds and Federal National Mortgage Association Bonds),
while still others, such as the securities of the Federal Farm Credit Bank, are
supported only by the credit of the issuer. With respect to securities supported
only by the credit of the issuing agency or by an additional line of credit with
the US Treasury, there is no guarantee that the US Government will provide
support to such agencies and such securities may involve risk of loss of
principal and interest.
US Government Securities may include "zero coupon" securities that have been
stripped by the US Government of their unmatured interest coupons and
collateralized obligations issued or guaranteed by a US Government agency or
instrumentality.
Interest rates on US Government obligations may be fixed or variable. Interest
rates on variable rate obligations are adjusted at regular intervals, at least
annually, according to a formula reflecting then current specified standard
rates, such as 91-day US Treasury bill rates. These adjustments generally tend
to reduce fluctuations in the market value of the securities.
The government guarantee of the US Government Securities in a Portfolio's
portfolio does not guarantee the net asset value of the shares of a fund. There
are market risks inherent in all investments in securities and the value of an
investment in a fund will fluctuate over time. Normally, the value of
investments in US Government Securities varies inversely with changes in
interest rates. For example, as interest rates rise the value of investments in
US Government Securities will tend to decline, and as interest rates fall the
value of a fund's investments will tend to increase. In addition, the potential
for appreciation in the event of a decline in interest rates may be limited or
negated by increased principal prepayments with respect to certain
Mortgage-Backed Securities, such as GNMA Certificates. Prepayments of high
interest rate Mortgage-Backed Securities during times of declining interest
rates will tend to lower the return of a fund and may even result in losses to a
fund if some securities were acquired at a premium. Moreover, during periods of
rising interest rates, prepayments of Mortgage-Backed Securities may decline,
resulting in the extension of a Portfolio's average portfolio maturity. As a
result, a Portfolio's portfolio may experience greater volatility during periods
of rising interest rates than under normal market conditions.
Warrants. Each Portfolio may invest in warrants up to 5% of the value of its
total assets. The holder of a warrant has the right, until the warrant expires,
to purchase a given number of shares of a particular issuer at a specified
price. Such investments can provide a greater potential for profit or loss than
an equivalent investment in the underlying security. Prices of warrants do not
necessarily move, however, in tandem with the prices of the underlying
securities and are, therefore, considered speculative investments. Warrants pay
no dividends and confer no rights other than a purchase option. Thus, if a
warrant held by a Portfolio were not exercised by the date of its expiration,
the Portfolio would lose the entire purchase price of the warrant.
When-Issued Securities. A Portfolio may from time to time purchase securities on
a "when-issued" or "forward delivery" basis. Debt securities are often issued on
this basis. The price of such securities, which may be expressed in yield terms,
is generally fixed at the time a commitment to purchase is made, but delivery
and payment for the when-issued or forward delivery securities take place at a
later date. During the period between purchase and settlement, no payment is
made by the Portfolio and no interest accrues to the Portfolio. When a Portfolio
purchases such securities, it immediately assumes the risks of ownership,
including the risk of price fluctuation. Failure to deliver a security purchased
on this basis may result in a loss or missed opportunity to make an alternative
investment.
To the extent that assets of a Portfolio are held in cash pending the settlement
of a purchase of securities, that Portfolio would earn no income. While such
securities may be sold prior to the settlement date, a Portfolio intends to
purchase them with the purpose of actually acquiring them unless a sale appears
desirable for investment reasons. At the time a Portfolio makes the commitment
to purchase a security on this basis, it will record the transaction and reflect
the value of the security in determining its net asset value. The market value
of the securities may be more or less than the purchase price. A Portfolio will
establish a segregated account in which it will maintain cash and liquid
securities equal in value to commitments for such securities.
Zero Coupon Securities. DWS Bond VIP, DWS Growth & Income VIP, DWS Capital
Growth VIP and DWS Global Opportunities VIP may each invest in zero coupon
securities which pay no cash income and are sold at substantial discounts from
their value at maturity. When held to maturity, their entire income, which
consists of accretion of discount, comes from the difference between the issue
price and their value at maturity. The effect of owning instruments which do not
make current interest payments is that a fixed yield is earned not only on the
original investment but also, in effect, on all discount accretion during the
life of the obligation. This implicit reinvestment of earnings at the same rate
eliminates the risk of being unable to reinvest distributions at a rate as high
as the implicit yield on the zero coupon bond, but at the same time eliminates
any opportunity to reinvest earnings at higher rates. For this reason, zero
coupon bonds are subject to substantially greater price fluctuations during
periods of changing market interest rates than those of comparable securities
that pay interest currently, which fluctuation is greater as the period to
maturity is longer. Zero coupon securities which are convertible into common
stock offer the opportunity for capital appreciation (or depreciation) as
increases (or decreases) in market value of such securities closely follow the
movements in the market value of the underlying common stock. Zero coupon
convertible securities generally are expected to be less volatile than the
underlying common stocks, as they usually are issued with maturities of 15 years
or less and are issued with options and/or redemption features exercisable by
the holder of the obligation entitling the holder to redeem the obligation and
receive a defined cash payment.
Strategic Transactions and Derivatives. A Portfolio may, but is not required to,
utilize various other investment strategies as described below for a variety of
purposes, such as hedging various market risks, managing the effective maturity
or duration of fixed-income securities in its portfolio, or enhancing potential
gain. These strategies may be executed through the use of derivative contracts.
In the course of pursuing these investment strategies, a Portfolio may purchase
and sell exchange-listed and over-the-counter put and call options on
securities, equity and fixed-income indices and other instruments, purchase and
sell futures contracts and options thereon, enter into various transactions such
as swaps, caps, floors, collars, currency forward contracts, currency futures
contracts, currency swaps or options on currencies, or currency futures and
various other currency transactions (collectively, all the above are called
"Strategic Transactions"). In addition, strategic transactions may also include
new techniques, instruments or strategies that are permitted as regulatory
changes occur. Strategic Transactions may be used without limit (subject to
certain limitations imposed by the 1940 Act) to attempt to protect against
possible changes in the market value of securities held in or to be purchased
for a Portfolio's portfolio resulting from securities markets or currency
exchange rate fluctuations, to protect a Portfolio's unrealized gains in the
value of its portfolio securities, to facilitate the sale of such securities for
investment purposes, to manage the effective maturity or duration of
fixed-income securities in a Portfolio's portfolio, or to establish a position
in the derivatives markets as a substitute for purchasing or selling particular
securities. Some Strategic Transactions may also be used to enhance potential
gain although no more than 5% of the Portfolio's assets (10% for DWS Bond VIP
with respect to currency exposure and 15% for DWS Bond VIP with respect to
credit default swaps) will be committed to Strategic Transactions entered into
for non-hedging purposes.
Any or all of these investment techniques may be used at any time and in any
combination, and there is no particular strategy that dictates the use of one
technique rather than another, as use of any Strategic Transaction is a function
of numerous variables including market conditions. The ability of a Portfolio to
utilize these Strategic Transactions successfully will depend on the Advisor's
ability to predict pertinent market movements, which cannot be assured. Each
Portfolio will comply with applicable regulatory requirements when implementing
these strategies, techniques and instruments. Strategic Transactions will not be
used to alter fundamental investment purposes and characteristics of a
Portfolio, and a Portfolio will segregate assets (or as provided by applicable
regulations, enter into certain offsetting positions) as required by law.
Strategic Transactions, including derivative contracts, have risks associated
with them including possible default by the other party to the transaction,
illiquidity and, to the extent the Advisor's view as to certain market movements
is incorrect, the risk that the use of such Strategic Transactions could result
in losses greater than if they had not been used. Use of put and call options
may result in losses to a Portfolio, force the sale or purchase of portfolio
securities at inopportune times or for prices higher than (in the case of put
options) or lower than (in the case of call options) current market values,
limit the amount of appreciation a Portfolio can realize on its investments or
cause a Portfolio to hold a security it might otherwise sell. The use of
currency transactions can result in a Portfolio incurring losses as a result of
a number of factors including the imposition of exchange controls, suspension of
settlements, or the inability to deliver or receive a specified currency. The
use of options and futures transactions entails certain other risks. In
particular, the variable degree of correlation between price movements of
futures contracts and price movements in the related portfolio position of a
Portfolio creates the possibility that losses on the hedging instrument may be
greater than gains in the value of a Portfolio's position. In addition, futures
and options markets may not be liquid in all circumstances and certain
over-the-counter options may have no markets. As a result, in certain markets, a
Portfolio might not be able to close out a transaction without incurring
substantial losses, if at all. Although the use of futures and options
transactions for hedging should tend to minimize the risk of loss due to a
decline in the value of the hedged position, at the same time they tend to limit
any potential gain which might result from an increase in value of such
position. Finally, the daily variation margin requirements for futures contracts
would create a greater ongoing potential financial risk than would purchases of
options, where the exposure is limited to the cost of the initial premium.
Losses resulting from the use of Strategic Transactions would reduce net asset
value, and possibly income, and such losses can be greater than if the Strategic
Transactions had not been utilized.
General Characteristics of Options. Put options and call options typically have
similar structural characteristics and operational mechanics regardless of the
underlying instrument on which they are purchased or sold. Thus, the following
general discussion relates to each of the particular types of options discussed
in greater detail below. In addition, many Strategic Transactions involving
options require segregation of a Portfolio's assets in special accounts, as
described below under "Use of Segregated and Other Special Accounts."
A put option gives the purchaser of the option, upon payment of a premium, the
right to sell, and the writer the obligation to buy, the underlying security,
commodity, index, currency or other instrument at the exercise price. For
instance, a Portfolio's purchase of a put option on a security might be designed
to protect its holdings in the underlying instrument (or, in some cases, a
similar instrument) against a substantial decline in the market value by giving
a Portfolio the right to sell such instrument at the option exercise price. A
call option, upon payment of a premium, gives the purchaser of the option the
right to buy, and the seller the obligation to sell, the underlying instrument
at the exercise price. Each Portfolio's purchase of a call option on a security,
financial future, index, currency or other instrument might be intended to
protect a Portfolio against an increase in the price of the underlying
instrument that it intends to purchase in the future by fixing the price at
which it may purchase such instrument. An American style put or call option may
be exercised at any time during the option period while a European style put or
call option may be exercised only upon expiration or during a fixed period prior
thereto. Each Portfolio is authorized to purchase and sell exchange listed
options and over-the-counter options ("OTC options"). Exchange listed options
are issued by a regulated intermediary such as the Options Clearing Corporation
("OCC"), which guarantees the performance of the obligations of the parties to
such options. The discussion below uses the OCC as an example, but is also
applicable to other financial intermediaries.
With certain exceptions, OCC issued and exchange listed options generally settle
by physical delivery of the underlying security or currency, although in the
future cash settlement may become available. Index options and Eurodollar
instruments are cash settled for the net amount, if any, by which the option is
"in-the-money" (i.e., where the value of the underlying instrument exceeds, in
the case of a call option, or is less than, in the case of a put option, the
exercise price of the option) at the time the option is exercised. Frequently,
rather than taking or making delivery of the underlying instrument through the
process of exercising the option, listed options are closed by entering into
offsetting purchase or sale transactions that do not result in ownership of the
new option.
Each Portfolio's ability to close out its position as a purchaser or seller of
an OCC or exchange listed put or call option is dependent, in part, upon the
liquidity of the option market. Among the possible reasons for the absence of a
liquid option market on an exchange are: (i) insufficient trading interest in
certain options; (ii) restrictions on transactions imposed by an exchange; (iii)
trading halts, suspensions or other restrictions imposed with respect to
particular classes or series of options or underlying securities including
reaching daily price limits; (iv) interruption of the normal operations of the
OCC or an exchange; (v) inadequacy of the facilities of an exchange or OCC to
handle current trading volume; or (vi) a decision by one or more exchanges to
discontinue the trading of options (or a particular class or series of options),
in which event the relevant market for that option on that exchange would cease
to exist, although outstanding options on that exchange would generally continue
to be exercisable in accordance with their terms.
The hours of trading for listed options may not coincide with the hours during
which the underlying financial instruments are traded. To the extent that the
option markets close before the markets for the underlying financial
instruments, significant price and rate movements can take place in the
underlying markets that may not be reflected in the option markets.
OTC options are purchased from or sold to securities dealers, financial
institutions or other parties ("Counterparties") through direct bilateral
agreement with the Counterparty. In contrast to exchange listed options, which
generally have standardized terms and performance mechanics, all the terms of an
OTC option, including such terms as method of settlement, term, exercise price,
premium, guarantees and security, are set by negotiation of the parties. Each
Portfolio will only sell OTC options (other than OTC currency options) that are
subject to a buy-back provision permitting a Portfolio to require the
Counterparty to sell the option back to a Portfolio at a formula price within
seven days. Each Portfolio expects generally to enter into OTC options that have
cash settlement provisions, although it is not required to do so.
Unless the parties provide for it, there is no central clearing or guaranty
function in an OTC option. As a result, if the Counterparty fails to make or
take delivery of the security, currency or other instrument underlying an OTC
option it has entered into with a Portfolio or fails to make a cash settlement
payment due in accordance with the terms of that option, a Portfolio will lose
any premium it paid for the option as well as any anticipated benefit of the
transaction. Accordingly, the Advisor must assess the creditworthiness of each
such Counterparty or any guarantor or credit enhancement of the Counterparty's
credit to determine the likelihood that the terms of the OTC option will be
satisfied. Each Portfolio will engage in OTC option transactions only with US
government securities dealers recognized by the Federal Reserve Bank of New York
as "primary dealers" or broker/dealers, domestic or foreign banks or other
financial institutions which have received (or the guarantors of the obligation
of which have received) a short-term credit rating of A-1 from S&P or P-1 from
Moody's or an equivalent rating from any nationally recognized statistical
rating organization ("NRSRO") or, in the case of OTC currency transactions, are
determined to be of equivalent credit quality by the Advisor. The staff of the
SEC currently takes the position that OTC options purchased by a Portfolio, and
portfolio securities "covering" the amount of a Portfolio's obligation pursuant
to an OTC option sold by it (the cost of the sell-back plus the in-the-money
amount, if any) are illiquid, and are subject to a Portfolio's limitation on
investing no more than 15% of its net assets in illiquid securities.
If a Portfolio sells a call option, the premium that it receives may serve as a
partial hedge, to the extent of the option premium, against a decrease in the
value of the underlying securities or instruments in its portfolio or will
increase a Portfolio's income. The sale of put options can also provide income.
Each Portfolio may purchase and sell call options on securities including US
Treasury and agency securities, mortgage-backed securities, foreign sovereign
debt, corporate debt securities, equity securities (including convertible
securities) and Eurodollar instruments that are traded on US and foreign
securities exchanges and in the over-the-counter markets, and on securities
indices, currencies and futures contracts. All calls sold by a Portfolio must be
"covered" (i.e., a Portfolio must own the securities or futures contract subject
to the call) or must meet the asset segregation requirements described below as
long as the call is outstanding. Even though a Portfolio will receive the option
premium to help protect it against loss, a call sold by a Portfolio exposes a
Portfolio during the term of the option to possible loss of opportunity to
realize appreciation in the market price of the underlying security or
instrument and may require a Portfolio to hold a security or instrument which it
might otherwise have sold.
Each Portfolio may purchase and sell put options on securities including US
Treasury and agency securities, mortgage-backed securities, foreign sovereign
debt, corporate debt securities, equity securities (including convertible
securities) and Eurodollar instruments (whether or not it holds the above
securities in its portfolio), and on securities indices, currencies and futures
contracts other than futures on individual corporate debt and individual equity
securities. Each Portfolio will not sell put options if, as a result, more than
50% of a Portfolio's total assets would be required to be segregated to cover
its potential obligations under such put options other than those with respect
to futures and options thereon. In selling put options, there is a risk that a
Portfolio may be required to buy the underlying security at a disadvantageous
price above the market price. DWS Capital Growth VIP and DWS International VIP
may write covered call and put options on no more than 5% of each Portfolio's
net assets; the value of the aggregate premiums paid for all put and call
options held by each of these Portfolios will not exceed 20% of its total
assets.
General Characteristics of Futures. Each Portfolio may enter into futures
contracts or purchase or sell put and call options on such futures as a hedge
against anticipated interest rate, currency or equity market changes, and for
duration management, risk management and return enhancement purposes. Futures
are generally bought and sold on the commodities exchanges where they are listed
with payment of initial and variation margin as described below. The sale of a
futures contract creates a firm obligation by a Portfolio, as seller, to deliver
to the buyer the specific type of financial instrument called for in the
contract at a specific future time for a specified price (or, with respect to
index futures and Eurodollar instruments, the net cash amount). Options on
futures contracts are similar to options on securities except that an option on
a futures contract gives the purchaser the right in return for the premium paid
to assume a position in a futures contract and obligates the seller to deliver
such position. In particular cases, however, when it is economically
advantageous to the Portfolio, a long futures position may be terminated (or any
option may expire) without the corresponding purchase of securities.
The Portfolios have claimed exclusion from the definition of the term "commodity
pool operator" adopted by the CFTC and the National Futures Association, which
regulate trading in the futures markets. Therefore, the Portfolios are not
subject to commodity pool operator registration and regulation under the
Commodity Exchange Act. Futures and options on futures may be entered into for
bona fide hedging, risk management (including duration management) or other
portfolio and return enhancement management purposes to the extent consistent
with the exclusion from commodity pool operator registration. Typically,
maintaining a futures contract or selling an option thereon requires a Portfolio
to deposit with a financial intermediary as security for its obligations an
amount of cash or other specified assets (initial margin) which initially is
typically 1% to 10% of the face amount of the contract (but may be higher in
some circumstances). Additional cash or assets (variation margin) may be
required to be deposited thereafter on a daily basis as the marked to market
value of the contract fluctuates. The purchase of an option on financial futures
involves payment of a premium for the option without any further obligation on
the part of a Portfolio. If a Portfolio exercises an option on a futures
contract it will be obligated to post initial margin (and potential subsequent
variation margin) for the resulting futures position just as it would for any
position. Futures contracts and options thereon are generally settled by
entering into an offsetting transaction but there can be no assurance that the
position can be offset prior to settlement at an advantageous price, nor that
delivery will occur.
Options on Securities Indices and Other Financial Indices. Each Portfolio also
may purchase and sell call and put options on securities indices and other
financial indices and in so doing can achieve many of the same objectives it
would achieve through the sale or purchase of options on individual securities
or other instruments. Options on securities indices and other financial indices
are similar to options on a security or other instrument except that, rather
than settling by physical delivery of the underlying instrument, they settle by
cash settlement, i.e., an option on an index gives the holder the right to
receive, upon exercise of the option, an amount of cash if the closing level of
the index upon which the option is based exceeds, in the case of a call, or is
less than, in the case of a put, the exercise price of the option (except if, in
the case of an OTC option, physical delivery is specified). This amount of cash
is equal to the excess of the closing price of the index over the exercise price
of the option, which also may be multiplied by a formula value. The seller of
the option is obligated, in return for the premium received, to make delivery of
this amount. The gain or loss on an option on an index depends on price
movements in the instruments making up the market, market segment, industry or
other composite on which the underlying index is based, rather than price
movements in individual securities, as is the case with respect to options on
securities.
Currency Transactions. Each Portfolio (subject to the limitations pertaining to
certain Portfolios described below) may engage in currency transactions with
Counterparties primarily in order to hedge, or manage the risk of the value of
portfolio holdings denominated in particular currencies against fluctuations in
relative value. Currency transactions include forward currency contracts,
exchange listed currency futures, exchange listed and OTC options on currencies,
and currency swaps. A forward currency contract involves a privately negotiated
obligation to purchase or sell (with delivery generally required) a specific
currency at a future date, which may be any fixed number of days from the date
of the contract agreed upon by the parties, at a price set at the time of the
contract. A currency swap is an agreement to exchange cash flows based on the
notional difference among two or more currencies and operates similarly to an
interest rate swap, which is described below. Each Portfolio may enter into
currency transactions with Counterparties which have received (or the guarantors
of the obligations which have received) a credit rating of A-1 or P-1 by S&P or
Moody's, respectively, or that have an equivalent rating from a NRSRO or (except
for OTC currency options) are determined to be of equivalent credit quality by
the Advisor.
Each Portfolio's dealings in forward currency contracts and other currency
transactions such as futures, options, options on futures and swaps generally
will be limited to hedging involving either specific transactions or portfolio
positions except as described below. Transaction hedging is entering into a
currency transaction with respect to specific assets or liabilities of a
Portfolio, which will generally arise in connection with the purchase or sale of
its portfolio securities or the receipt of income therefrom. Position hedging is
entering into a currency transaction with respect to portfolio security
positions denominated or generally quoted in that currency.
Each Portfolio generally will not enter into a transaction to hedge currency
exposure to an extent greater, after netting all transactions intended wholly or
partially to offset other transactions, than the aggregate market value (at the
time of entering into the transaction) of the securities held in its portfolio
that are denominated or generally quoted in or currently convertible into such
currency, other than with respect to proxy hedging or cross hedging as described
below.
Each Portfolio may also cross-hedge currencies by entering into transactions to
purchase or sell one or more currencies that are expected to decline in value
relative to other currencies to which a Portfolio has or in which a Portfolio
expects to have portfolio exposure.
DWS Bond VIP will limit its currency exposure to 10% of its total assets
measured by the market value of non-U.S. dollar holdings netted with the market
value of currency forward contracts.
To reduce the effect of currency fluctuations on the value of existing or
anticipated holdings of portfolio securities, each Portfolio may also engage in
proxy hedging. Proxy hedging is often used when the currency to which a
Portfolio's portfolio is exposed is difficult to hedge against the dollar. Proxy
hedging entails entering into a commitment or option to sell a currency whose
changes in value are generally considered to be correlated to a currency or
currencies in which some or all of a Portfolio's portfolio securities are or are
expected to be denominated, in exchange for US dollars. Currency hedging
involves some of the same risks and considerations as other transactions with
similar instruments. Currency transactions can result in losses to a Portfolio
if the currency being hedged fluctuates in value to a degree or in a direction
that is not anticipated. Further, there is the risk that the perceived
correlation between various currencies may not be present or may not be present
during the particular time that a Portfolio is engaging in proxy hedging. If a
Portfolio enters into a currency transaction, a Portfolio will comply with the
asset segregation requirements described below.
Risks of Currency Transactions. Currency transactions are subject to risks
different from those of other portfolio transactions. Because currency control
is of great importance to the issuing governments and influences economic
planning and policy, purchases and sales of currency and related instruments can
be negatively affected by government exchange controls, blockages, and
manipulations or exchange restrictions imposed by governments. These can result
in losses to a Portfolio if it is unable to deliver or receive currency or funds
in settlement of obligations and could also cause hedges it has entered into to
be rendered useless, resulting in full currency exposure as well as incurring
transaction costs. Buyers and sellers of currency futures are subject to the
same risks that apply to the use of futures generally. Further, settlement of a
currency futures contract for the purchase of most currencies must occur at a
bank based in the issuing nation. Trading options on currency futures is
relatively new, and the ability to establish and close out positions on such
options is subject to the maintenance of a liquid market which may not always be
available. Currency exchange rates may fluctuate based on factors extrinsic to
that country's economy.
Swaps, Caps, Floors and Collars. Among the Strategic Transactions into which the
Portfolios may enter are, currency, and other types of swaps and the purchase or
sale of related caps, floors and collars. The Portfolios expect to enter into
these transactions primarily to preserve a return or spread on a particular
investment or portion of its portfolio, to protect against currency
fluctuations, as a duration management technique or to protect against any
increase in the price of securities the Portfolio anticipates purchasing at a
later date. A Portfolio will not sell interest rate caps or floors where it does
not own securities or other instruments providing the income stream a Portfolio
may be obligated to pay. Interest rate swaps involve the exchange by a Portfolio
with another party of their respective commitments to pay or receive interest,
e.g., an exchange of floating rate payments for fixed rate payments with respect
to a notional amount of principal. A currency swap is an agreement to exchange
cash flows on a notional amount of two or more currencies based on the relative
value differential among them and an index swap is an agreement to swap cash
flows on a notional amount based on changes in the values of the reference
indices. The purchase of a cap entitles the purchaser to receive payments on a
notional principal amount from the party selling such cap to the extent that a
specified index exceeds a predetermined interest rate or amount. The purchase of
a floor entitles the purchaser to receive payments on a notional principal
amount from the party selling such floor to the extent that a specified index
falls below a predetermined interest rate or amount. A collar is a combination
of a cap and a floor that preserves a certain return within a predetermined
range of interest rates or values.
A Portfolio will usually enter into swaps on a net basis, i.e., the two payment
streams are netted out in a cash settlement on the payment date or dates
specified in the instrument, with a Portfolio receiving or paying, as the case
may be, only the net amount of the two payments. Inasmuch as a Portfolio will
segregate assets (or enter into offsetting positions) to cover its obligations
under swaps, the Advisor and a Portfolio believe such obligations do not
constitute senior securities under the 1940 Act and, accordingly, will not treat
them as being subject to its borrowing restrictions. A Portfolio will not enter
into any swap, cap, floor or collar transaction unless, at the time of entering
into such transaction, the unsecured long-term debt of the Counterparty,
combined with any credit enhancements, is rated at least A by S&P or Moody's or
has an equivalent rating from a NRSRO or is determined to be of equivalent
credit quality by the Advisor. If there is a default by the Counterparty, a Fund
may have contractual remedies pursuant to the agreements related to the
transaction. The swap market has grown substantially in recent years with a
large number of banks and investment banking firms acting both as principals and
as agents utilizing standardized swap documentation. As a result, the swap
market has become relatively liquid. Caps, floors and collars are more recent
innovations for which standardized documentation has not yet been fully
developed and, accordingly, they are less liquid than swaps. DWS Bond VIP will
not invest more than 15% of its total assets in futures contracts and interest
rate swaps contracts based on the notional amount of the contracts and will
invest in these instruments only for hedging purposes.
DWS Bond VIP may invest up to 15% of its total assets in credit default swaps
for both hedging and non-hedging purposes (measured by the notional amount of
the contract).
A credit default swap is a contract between a buyer and a seller of protection
against a pre-defined credit event. The buyer of protection pays the seller a
fixed regular fee provided that no event of default on an underlying reference
obligation has occurred. If an event of default occurs, the seller must pay the
buyer the full notional value, or "par value", of the reference obligation in
exchange for the reference obligation. Credit default swaps are used as a means
of "buying" credit protection, i.e., attempting to mitigate the risk of default
or credit quality deterioration in some portion of the Portfolio's holdings, or
"selling" credit protection, i.e., attempting to gain exposure to an underlying
issuer's credit quality characteristics without directly investing in that
issuer. No more than 5% of the Portfolio's assets may be invested in credit
default swaps for purposes of buying credit protection on individual securities
if the Portfolio does not own the individual security or securities at the time
of the investment. Where the Portfolio is a seller of credit protection, it
effectively adds leverage to its portfolio because, in addition to its total net
assets, the Portfolio would be subject to investment exposure on the notional
amount of the swap. The Portfolio will only sell credit protection with respect
to securities in which it would be authorized to invest directly. The Portfolio
currently considers credit default swaps to be illiquid and treats the market
value of the contract as illiquid for purposes of determining compliance with
the Portfolio's restrictions on investing in illiquid securities.
If the Portfolio is a buyer of a credit default swap and no event of default
occurs, the Portfolio will lose its investment and recover nothing. However, if
the Portfolio is a buyer and an event of default occurs, the Portfolio will
receive the full notional value of the reference obligation that may have little
or no value. As a seller, the Portfolio receives a fixed rate of income through
the term of the contract (typically between six months and three years),
provided that there is no default event. If an event of default occurs, the
seller must pay the buyer the full notional value of the reference obligation.
Credit default swaps involve greater risks than if the Portfolio had invested in
the reference obligation directly.
The Portfolio may use credit default swaps to gain exposure to particular
issuers or particular markets through investments in portfolios of credit
default swaps, such as Dow Jones CDX.NA.HY certificates. By investing in
certificates representing interests in a basket of credit default swaps, the
Fund is taking credit risk with respect to an entity or group of entities and
providing credit protection to the swap counterparties. For example, the CDX EM
is a tradable basket of 19 credit default swaps on country credits which seeks
to replicate the returns on the indices of a broad group of emerging markets
countries. The credits are a subset of the countries represented by the JPMorgan
Emerging Markets Bond Index Global Diversified. By purchasing interests in CDX
EM, the Portfolio is gaining emerging markets exposure through a single
investment. Unlike other types of credit default swaps which are generally
considered illiquid, credit default swap certificates generally can be sold
within seven days and are not subject to the Portfolio's restrictions on
investing in illiquid securities.
Risks of Strategic Transactions Outside the US. When conducted outside the US,
Strategic Transactions may not be regulated as rigorously as in the US, may not
involve a clearing mechanism and related guarantees, and are subject to the risk
of governmental actions affecting trading in, or the prices of, foreign
securities, currencies and other instruments. The value of such positions also
could be adversely affected by: (i) other complex foreign political, legal and
economic factors, (ii) lesser availability than in the US of data on which to
make trading decisions, (iii) delays in a Portfolio's ability to act upon
economic events occurring in foreign markets during non-business hours in the
US, (iv) the imposition of different exercise and settlement terms and
procedures and margin requirements than in the US, and (v) lower trading volume
and liquidity.
Use of Segregated and Other Special Accounts. Many Strategic Transactions, in
addition to other requirements, require that a Portfolio segregate cash or
liquid assets with its custodian to the extent a Portfolio's obligations are not
otherwise "covered" through ownership of the underlying security, financial
instrument or currency. In general, either the full amount of any obligation by
a Portfolio to pay or deliver securities or assets must be covered at all times
by the securities, instruments or currency required to be delivered, or, subject
to any regulatory restrictions, an amount of cash or liquid assets at least
equal to the current amount of the obligation must be segregated with the
custodian. The segregated assets cannot be sold or transferred unless equivalent
assets are substituted in their place or it is no longer necessary to segregate
them. For example, a call option written by a Portfolio will require the
Portfolio to hold the securities subject to the call (or securities convertible
into the needed securities without additional consideration) or to segregate
cash or liquid assets sufficient to purchase and deliver the securities if the
call is exercised. A call option sold by a Portfolio on an index will require
the Portfolio to own portfolio securities which correlate with the index or to
segregate cash or liquid assets equal to the excess of the index value over the
exercise price on a current basis. A put option written by a Portfolio requires
the Portfolio to segregate cash or liquid assets equal to the exercise price.
Except when a Portfolio enters into a forward contract for the purchase or sale
of a security denominated in a particular currency, which requires no
segregation, a currency contract which obligates a Portfolio to buy or sell
currency will generally require a Portfolio to hold an amount of that currency
or liquid assets denominated in that currency equal to the Portfolio's
obligations or to segregate cash or liquid assets equal to the amount of a
Portfolio's obligation.
OTC options entered into by a Portfolio, including those on securities,
currency, financial instruments or indices and OCC issued and exchange listed
index options, will generally provide for cash settlement. As a result, when a
Portfolio sells these instruments it will only segregate an amount of cash or
liquid assets equal to its accrued net obligations, as there is no requirement
for payment or delivery of amounts in excess of the net amount. These amounts
will equal 100% of the exercise price in the case of a non cash-settled put, the
same as an OCC guaranteed listed option sold by a Portfolio, or the in-the-money
amount plus any sell-back formula amount in the case of a cash-settled put or
call. In addition, when a Portfolio sells a call option on an index at a time
when the in-the-money amount exceeds the exercise price, the Portfolio will
segregate, until the option expires or is closed out, cash or cash equivalents
equal in value to such excess. OCC issued and exchange listed options sold by a
Portfolio other than those above generally settle with physical delivery, or
with an election of either physical delivery or cash settlement and a Portfolio
will segregate an amount of cash or liquid assets equal to the full value of the
option. OTC options settling with physical delivery, or with an election of
either physical delivery or cash settlement will be treated the same as other
options settling with physical delivery.
In the case of a futures contract or an option thereon, a Portfolio must deposit
initial margin and possible daily variation margin in addition to segregating
cash or liquid assets sufficient to meet its obligation to purchase or provide
securities or currencies, or to pay the amount owed at the expiration of an
index-based futures contract. Such liquid assets may consist of cash, cash
equivalents, liquid debt or equity securities or other acceptable assets.
With respect to swaps, a Portfolio will accrue the net amount of the excess, if
any, of its obligations over its entitlements with respect to each swap on a
daily basis and will segregate an amount of cash or liquid assets having a value
equal to the accrued excess. Caps, floors and collars require segregation of
assets with a value equal to a Portfolio's net obligation, if any.
Strategic Transactions may be covered by other means when consistent with
applicable regulatory policies. Each Portfolio may also enter into offsetting
transactions so that its combined position, coupled with any segregated assets,
equals its net outstanding obligation in related options and Strategic
Transactions. For example, a Portfolio could purchase a put option if the strike
price of that option is the same or higher than the strike price of a put option
sold by the Portfolio. Moreover, instead of segregating cash or liquid assets if
a Portfolio held a futures or forward contract, it could purchase a put option
on the same futures or forward contract with a strike price as high or higher
than the price of the contract held. Other Strategic Transactions may also be
offset in combinations. If the offsetting transaction terminates at the time of
or after the primary transaction no segregation is required, but if it
terminates prior to such time, cash or liquid assets equal to any remaining
obligation would need to be segregated.
Combined Transactions. Each Portfolio may enter into multiple transactions,
including multiple options transactions, multiple futures transactions, multiple
currency transactions (including forward currency contracts) and multiple
interest rate transactions and any combination of futures, options, currency and
interest rate transactions ("component" transactions), instead of a single
Strategic Transaction, as part of a single or combined strategy when, in the
opinion of the Advisor, it is in the best interests of a Portfolio to do so. A
combined transaction will usually contain elements of risk that are present in
each of its component transactions. Although combined transactions are normally
entered into based on the Advisor's judgment that the combined strategies will
reduce risk or otherwise more effectively achieve the desired portfolio
management goal, it is possible that the combination will instead increase such
risks or hinder achievement of the portfolio management objective.
Portfolio Holdings Information
In addition to the public disclosure of portfolio holdings through required
Securities and Exchange Commission ("SEC") quarterly filings, a Portfolio may
make its portfolio holdings information publicly available on the DWS Funds' Web
site as described in each Portfolio's prospectus. Each Portfolio does not
disseminate non-public information about portfolio holdings except in accordance
with policies and procedures adopted by each Portfolio.
Each Portfolio's procedures permit non-public portfolio holdings information to
be shared with Deutsche Asset Management and its affiliates (collectively
"DeAM"), subadvisors, if any, custodians, independent registered public
accounting firms, attorneys, officers and trustees/directors and each of their
respective affiliates and advisers who require access to this information to
fulfill their duties to each Portfolio and are subject to the duties of
confidentiality, including the duty not to trade on non-public information,
imposed by law or contract, or by each Portfolio's procedures. This non-public
information may also be disclosed, subject to the requirements described below,
to securities lending agents, financial printers, proxy voting firms, mutual
fund analysts and rating and tracking agencies, or to shareholders in connection
with in-kind redemptions (collectively, "Authorized Third Parties").
Prior to any disclosure of each Portfolio's non-public portfolio holdings
information to Authorized Third Parties, a person authorized by each Portfolio's
Trustees/Directors must make a good faith determination in light of the facts
then known that a Portfolio has a legitimate business purpose for providing the
information, that the disclosure is in the best interest of each Portfolio, and
that the recipient assents or otherwise has a duty to keep the information
confidential and to not trade based on the information received while the
information remains non-public. No compensation is received by each Portfolio or
DeAM for disclosing non-public holdings information. Periodic reports regarding
these procedures will be provided to each Portfolio's Trustees/Directors.
Portfolio holdings information distributed by the trading desks of DeAM or a
subadvisor for the purpose of facilitating efficient trading of such securities
and receipt of relevant research is not subject to the foregoing requirements.
Non-public portfolio holding information does not include portfolio
characteristics (other than holdings or subsets of holdings) about each
Portfolio and information derived therefrom, including, but not limited to, how
each Portfolio's investments are divided among various sectors, industries,
countries, value and growth stocks, bonds, currencies and cash, types of bonds,
bond maturities, duration, bond coupons and bond credit quality ratings so long
as each Portfolio's holdings could not be derived from such information.
Registered investment companies that are subadvised by DeAM may be subject to
different portfolio holdings disclosure policies, and neither DeAM nor the
portfolios' Trustees exercise control over such policies. In addition, separate
account clients of DeAM have access to their portfolio holdings and are not
subject to a portfolio's portfolio holdings disclosure policy. The portfolio
holdings of some of the funds subadvised by DeAM and some of the separate
accounts managed by DeAM may substantially overlap with the portfolio holdings
of a portfolio.
DeAM also manages certain unregistered commingled trusts and creates model
portfolios, the portfolio holdings of which may substantially overlap with the
portfolio holdings of a portfolio. To the extent that investors in these
commingled trusts or recipients of model portfolio holdings information may
receive portfolio holdings information of their trust or of a model portfolio on
a different basis from that on which portfolio holdings information is made
public, DeAM has implemented procedures reasonably designed to encourage such
investors and recipients to keep such information confidential, and to prevent
those investors from trading on the basis of non-public holdings information.
There is no assurance that a portfolio's policies and procedures with respect to
the disclosure of portfolio holdings information will protect a portfolio from
the potential misuse of portfolio holdings information by those in possession of
that information.
MANAGEMENT OF THE FUND
Investment Advisor
Deutsche Investment Management Americas Inc. ("DIMA" or the "Advisor"), with
headquarters at 345 Park Avenue, New York, New York 10154, is part of Deutsche
Asset Management ("DeAM"), and serves as the investment advisor for each
Portfolio. Under the supervision of the Board of Trustees, DIMA or a subadvisor
makes the Portfolios' investment decisions, buys and sells securities for each
Portfolio and conducts research that leads to these purchase and sale decisions.
The Advisor manages each Portfolio's daily investment and business affairs
subject to the policies established by the Board of Trustees. DIMA and its
predecessors have more than 80 years of experience managing mutual funds and
provides a full range of investment advisory services to institutional and
retail clients. The Advisor or subadvisor is also responsible for selecting
brokers and dealers and for negotiating brokerage commissions and dealer
charges.
Deutsche Asset Management ("DeAM") is the marketing name in the US for the asset
management activities of Deutsche Bank AG, DIMA, Deutsche Bank Trust Company
Americas and DWS Trust Company. DeAM is a global asset management organization
that offers a wide range of investing expertise and resources, including
hundreds of portfolio managers and analysts and an office network that reaches
the world's major investment centers. This well-resourced global investment
platform brings together a wide variety of experience and investment insight,
across industries, regions, asset classes and investing styles. DIMA is an
indirect, wholly owned subsidiary of Deutsche Bank AG. Deutsche Bank AG is a
major global banking institution that is engaged in a wide range of financial
services, including investment management, mutual fund, retail, private and
commercial banking, investment banking and insurance. The term "DWS Scudder" is
the designation given to the products and services provided by DIMA and its
affiliates to the DWS Mutual Funds.
The Advisor provides investment counsel for many individuals and institutions,
including insurance companies, industrial corporations, and financial and
banking organizations, as well as providing investment advice to open- and
closed-end SEC registered funds.
In certain cases, the investments for a Portfolio are managed by the same
individuals who manage one or more other mutual funds advised by the Advisor
that have similar names, objectives and investment styles. You should be aware
that the Portfolios are likely to differ from these other mutual funds in size,
cash flow pattern and tax matters. Accordingly, the holdings and performance of
the Portfolios can be expected to vary from those of these other mutual funds.
Certain investments may be appropriate for a Portfolio and also for other
clients advised by the Advisor. Investment decisions for a Portfolio and other
clients are made with a view to achieving their respective investment objectives
and after consideration of such factors as their current holdings, availability
of cash for investment and the size of their investments generally. Frequently,
a particular security may be bought or sold for only one client or in different
amounts and at different times for more than one but less than all clients.
Likewise, a particular security may be bought for one or more clients when one
or more other clients are selling the security. In addition, purchases or sales
of the same security may be made for two or more clients on the same day. In
such event, such transactions will be allocated among the clients in a manner
believed by the Advisor to be equitable to each. In some cases, this procedure
could have an adverse effect on the price or amount of the securities purchased
or sold by a Portfolio. Purchase and sale orders for a Portfolio may be combined
with those of other clients of the Advisor in the interest of achieving the most
favorable net results to a Portfolio.
Each Portfolio is managed by a team of investment professionals who each play an
important role in the Portfolio's management process. Team members work together
to develop investment strategies and select securities for a Portfolio's
portfolio. This team works for the Advisor or its affiliates and is supported by
a large staff of economists, research analysts, traders and other investment
specialists. The Advisor or its affiliates believe(s) its team approach benefits
Portfolio investors by bringing together many disciplines and leveraging its
extensive resources. Team members with primary responsibility for management of
the Portfolios, as well as team members who have other ongoing management
responsibilities for each Portfolio, are identified in each Portfolio's
prospectus, as of the date of the Portfolio's prospectus. Composition of the
team may change over time, and Portfolio shareholders and investors will be
notified of changes affecting individuals with primary management
responsibilities.
Pursuant to an Investment Management Agreement between DIMA and each Portfolio
(the "Investment Management Agreements"), the Advisor provides continuing
investment management of the assets of the Portfolios. In addition to the
investment management of the assets of the Portfolios, the Advisor determines
the investments to be made for the Portfolios, including what portion of its
assets remain uninvested in cash or cash equivalents, and with whom the orders
for investments are placed, consistent with the Portfolio's policies as stated
in its Prospectus and SAI, or as adopted by the Portfolios' Board. The Advisor
will also monitor, to the extent not monitored by the Portfolios' administrator
or other agent, the Portfolios' compliance with its investment and tax
guidelines and other compliance policies.
The Advisor provides assistance to the Portfolio's Board in valuing the
securities and other instruments held by the Portfolio, to the extent reasonably
required by valuation policies and procedures that may be adopted by the Fund.
Pursuant to the Investment Management Agreement, (unless otherwise provided in
the agreement or as determined by the Portfolio's Board and to the extent
permitted by applicable law), the Advisor pays the compensation and expenses of
all the Board members, officers, and executive employees of the Portfolio,
including the Portfolio's share of payroll taxes, who are affiliated persons of
the Advisor.
The Investment Management Agreements provide that the Portfolios are generally
responsible for expenses that include: fees payable to the Advisor; outside
legal, accounting or auditing expenses, including with respect to expenses
related to negotiation, acquisition or distribution of portfolio investments;
maintenance of books and records that are maintained by the Portfolios, the
Portfolios' custodian, or other agents of the Portfolios; taxes and governmental
fees; fees and expenses of the Portfolios' accounting agent, custodian,
sub-custodians, depositories, transfer agents, dividend reimbursing agents and
registrars; payment for portfolio pricing or valuation services to pricing
agents, accountants, bankers and other specialists, if any; brokerage
commissions or other costs of acquiring or disposing of any portfolio securities
or other instruments of the Portfolio; and litigation expenses and other
extraordinary expenses not incurred in the ordinary course of the Portfolios'
business.
The Investment Management Agreements allow the Advisor to delegate any of its
duties under the Agreement to a subadvisor, subject to a majority vote of the
Board, including a majority of the Board who are not interested persons of the
Portfolios, and, if required by applicable law, subject to a majority vote of
the Portfolios' shareholders.
The Investment Management Agreements provide that the Advisor shall not be
liable for any error of judgment or mistake of law or for any loss suffered by
the Portfolios in connection with matters to which the agreement relates, except
a loss resulting from willful malfeasance, bad faith or gross negligence on the
part of the Advisor in the performance of its duties or from reckless disregard
by the Advisor of its obligations and duties under the agreement. The Investment
Management Agreements may be terminated at any time, without payment of penalty,
by either party or by vote of a majority of the outstanding voting securities of
the Portfolios on 60 days' written notice.
For all services provided under the Investment Management Agreements, each
Portfolio pays the Advisor a fee, computed daily and paid monthly, at the annual
rate as a percentage of net assets shown below:
Fund Management Fee Rate
---- -------------------
DWS Bond VIP 0.390% to $250 million
0.365% next $750 million
0.340% thereafter
DWS Capital Growth VIP 0.390% to $250 million
0.365% next $750 million
0.340% thereafter
DWS Global Opportunities VIP 0.890% first $500 million
0.875% next $500 million
0.860% next $1.0 billion
0.845% thereafter
DWS Growth & Income VIP 0.390% to $250 million
0.365% next $750 million
0.340% thereafter
DWS Health Care VIP 0.665% to $250 million
0.640% next $750 million
0.615% next $1.5 billion
0.595% next $2.5 billion
0.565% next $2.5 billion
0.555% next $2.5 billion
0.545% next $2.5 billion
0.535% thereafter
DWS International VIP 0.790% to $500 million
0.640% thereafter
The Advisor may enter into arrangements with affiliates and third party service
providers to perform various administrative, back-office and other services
relating to client accounts. Such service providers may be located in the US or
in non-US jurisdictions.
The Investment Management Agreements for the Portfolios, each dated June 1,
2006, were last renewed by the Trustees on September 18, 2007. Each Agreement
continues in effect until September 30, 2008 and from year to year thereafter
only if their continuance is approved annually by the vote of a majority of
those Trustees who are not parties to such Agreements or interested persons of
the Advisor or the Fund, cast in person at a meeting called for the purpose of
voting on such approval, and either by a vote of the Fund's Trustees or of a
majority of the outstanding voting securities of the respective Portfolio. The
Agreements may be terminated at any time without payment of penalty by either
party on sixty days' written notice and automatically terminate in the event of
their assignment.
For its investment management services, the Advisor received the amounts for the
years as indicated, from each Portfolio:
% of the average daily
net asset values of
each Portfolio as of
Portfolio fiscal year end 2007 2006(1) 2005(1)
--------- --------------- ---- ------- -------
DWS Bond VIP(3) 0.39% $873,517 $910,424 $865,302
DWS Growth & Income VIP(4) 0.38% $1,103,548(2) $1,359,770 $1,335,546
DWS Capital Growth VIP(5) 0.36% $4,224,782(2) $4,272,143 $4,421,003
DWS Global Opportunities VIP(6) 0.87% $3,148,776(2) $3,165,067 $2,754,030
DWS International VIP(7) 0.74% $5,588,748 $5,225,483 $4,841,891
DWS Health Care VIP 0.67% $745,355 $879,239 $959,087
(1) Prior to June 1, 2006, these fees included an administrative service
fee.
(2) $28,536 was waived for DWS Growth & Income VIP, $118,582 was waived for
DWS Capital Growth VIP, and $85,694 was waived for DWS Global
Opportunities VIP.
(3) Through September 30, 2008, the Advisor has contractually agreed to
waive all or a portion of its management fee and reimburse or pay
certain operating expenses so that the total annual operating expenses
of Bond VIP will not exceed 0.63% for Class A shares, excluding certain
expenses such as extraordinary expenses, taxes, brokerage and interest.
Although there can be no assurance that the current waiver/expense
reimbursement arrangement will be maintained beyond September 30, 2008,
the Advisor has committed to review the continuance of waiver/expense
reimbursement arrangements by September 30, 2008. Prior to June 1,
2006, the investment management fee for DWS Bond VIP was calculated
according to the following schedule: 0.475% of average daily net
assets. Pursuant to their respective agreements with DWS Variable
Series I, the advisor, the underwriter and the accounting agent had
contractually agreed, for the period January 1, 2005 to May 31, 2006,
to limit their respective fees and to reimburse other expenses to the
extent necessary to limit total operating expenses of Class A shares
and Class B shares (DWS Bond VIP Class B commenced operations on May 2,
2005) of DWS Bond VIP to 0.71% and 1.11%, excluding certain expenses
such as extraordinary expenses, taxes, brokerage and interest. Pursuant
to their respective agreements with DWS Variable Series I, the advisor,
the underwriter and the accounting agent had agreed, for the period
June 1, 2006 through September 30, 2006, to limit their respective fees
and to reimburse other expenses to the extent necessary to limit total
operating expenses of Class A Shares and Class B Shares of DWS Bond VIP
to 0.58% and 0.95%, respectively, excluding certain expenses such as
extraordinary expenses, taxes, brokerage and interest. Through
September 30, 2007, the Advisor had contractually agreed to waive all
or a portion of its management fee and reimburse or pay certain
operating expenses of the portfolio to the extent necessary to maintain
the portfolio's total operating expenses at 0.60% for Class A shares
and 1.00% for Class B shares, excluding certain expenses such as
extraordinary expenses, taxes, brokerage, interest, proxy and
organizational and offering expenses. Through April 30, 2008, the
Advisor had contractually agreed to waive all or a portion of its
management fee and reimburse or pay certain operating expenses of the
portfolio to the extent necessary so that the portfolio's total
operating expenses will not exceed 0.63% for Class A shares and 1.03%
for Class B shares, excluding certain expenses such as extraordinary
expenses, taxes, brokerage, interest and organizational and offering
expenses.
(4) Through April 30, 2010, the Advisor has contractually agreed to waive
all or a portion of its management fee and reimburse or pay certain
operating expenses so that the total annual operating expenses of
Growth & Income VIP will not exceed 0.54% and 0.87% for Class A and
Class B shares, respectively, excluding certain expenses such as
extraordinary expenses, taxes, brokerage and interest. Additionally,
the Advisor has contractually agreed to waive a portion of its fees in
the amount of 0.01% of average daily net assets until April 27, 2010.
Through April 29, 2005 the investment management fee for DWS Growth &
Income VIP was 0.475% of average daily net assets. Effective April 30,
2005 through May 31, 2006 the investment management fee for the DWS
Growth & Income VIP was calculated according to the following schedule:
0.475% of average daily net assets on the first $250 million, 0.450% of
average daily net assets on the next $750 million and 0.425% of average
daily net assets in excess of $1 billion. For the period from January
1, 2005 through April 30, 2005, the Advisor had contractually agreed to
waive a portion of its fee to the extent necessary to maintain the
operating expenses of Class A shares and Class B shares of DWS Growth &
Income VIP to 1.08%. Also, pursuant to its agreement with DWS Variable
Series I, the Advisor had contractually agreed, for the three year
period commencing May 1, 2005 through April 30, 2008, to waive a
portion of its fee and to reimburse expenses to the extent necessary to
maintain total operating expenses of Class A shares and Class B shares
of DWS Growth & Income VIP to 0.54% and 0.89%, respectively, excluding
certain expenses such as extraordinary expenses, taxes, brokerage and
interest. Under these arrangements, the Advisor reimbursed DWS Growth &
Income VIP $12,854 for expenses. For the year ended December 31, 2006,
the DWS Growth & Income VIP waived a portion of its management fees
pursuant to the Management Agreement aggregating $72,977 and the amount
charged aggregated $1,359,770, which was equivalent to an annual
effective rate of 0.40% of the Portfolio's average daily net assets.
(5) Through April 30, 2010, the Advisor has contractually agreed to waive
all or a portion of its management fee and reimburse or pay certain
operating expenses so that the total annual operating expenses of
Capital Growth VIP will not exceed 0.49% and 0.82% for Class A and
Class B shares, respectively, excluding certain expenses such as
extraordinary expenses, taxes, brokerage and interest. Through April
29, 2005 the investment management fee for DWS Capital Growth VIP was
calculated according to the following schedule: 0.475% of average daily
net assets on the first $500 million, 0.450% of average daily net
assets on the next $500 million and 0.425% of average daily net assets
in excess of $1 billion. Effective April 30, 2005 through May 31, 2006
the investment management fee for the DWS Capital Growth VIP was
calculated according to the following schedule: 0.475% of average daily
net assets on the first $250 million, 0.450% of average daily net
assets on the next $750 million and 0.425% of average daily net assets
in excess of $1 billion. As a result, the Advisor received compensation
at an annual rate of 0.468% and 0.454% for the fiscal years ended
December 31, 2004 and 2005, respectively. For the period from January
1, 2005 through April 30, 2005, the Advisor had contractually agreed to
waive a portion of its fee to the extent necessary to maintain the
operating expenses of Class A shares and Class B shares of DWS Capital
Growth VIP to 1.09%. Also, pursuant to its agreement with DWS Variable
Series I, the Advisor had contractually agreed, for the three-year
period commencing May 1, 2005 through April 30, 2008, to waive a
portion of its fee and to reimburse expenses to the extent necessary to
maintain total operating expenses of Class A shares and Class B shares
of DWS Capital Growth VIP to 0.49% and 0.86%, respectively, excluding
certain expenses such as extraordinary expenses, taxes, brokerage and
interest. Under these arrangements, the Advisor reimbursed DWS Capital
Growth VIP $11,870 for expenses. For the year ended December 31, 2006,
the DWS Capital Growth VIP waived a portion of its management fees
pursuant to the Management Agreement aggregating $325,012 and the
amount charged aggregated $4,272,143 which was equivalent to an annual
effective rate of 0.38% of the Portfolio's average daily net assets.
(6) Through April 30, 2009, the Advisor has contractually agreed to waive
all or a portion of its management fee and reimburse or pay certain
operating expenses so that the total annual operating expenses of
Global Opportunities VIP will not exceed 0.99% and 1.39% for Class A
and Class B shares, respectively, excluding certain expenses such as
extraordinary expenses, taxes, brokerage and interest. Prior to June 1,
2006, the investment management fee for DWS Global Opportunities VIP
was calculated according to the following schedule: 0.975% of average
daily net assets. The Advisor, the underwriter or the accounting agent
had contractually agreed, for the period January 1, 2005 through May
31, 2006, to limit their respective fees and to reimburse other
expenses to the extent necessary to limit their total operating
expenses at 1.24% of average daily net assets for Class A and Class B,
excluding certain expenses such as extraordinary expenses, taxes,
brokerage and interest. Under this arrangement, for the fiscal year
ended 2004, the Advisor reimbursed the portfolio $22,685. Under these
arrangements, the Advisor reimbursed DWS Global Opportunities VIP
$81,355 for expenses. Pursuant to their respective agreements with DWS
Variable Series I, the Advisor, the underwriter and the accounting
agent had agreed, for the period June 1, 2006 through September 30,
2006, to limit their respective fees and to reimburse other expenses to
the extent necessary to limit total operating expenses of Class A
Shares and Class B Shares of DWS Global Opportunities VIP to 1.097% and
1.24%, respectively, excluding certain expenses such as extraordinary
expenses, taxes, brokerage and interest. Through September 30, 2007,
the Advisor had contractually agreed to waive all or a portion of its
management fee and reimburse or pay certain operating expenses of the
portfolio to the extent necessary to maintain the portfolio's total
operating expenses at 1.52% for Class B shares, excluding certain
expenses such as extraordinary expenses, taxes, brokerage, interest,
proxy and organizational and offering expenses.
(7) Through April 30, 2010, the Advisor has contractually agreed to waive
all or a portion of its management fee and reimburse or pay certain
operating expenses so that the total annual operating expenses of
International VIP will not exceed 0.96% and 1.29% for Class A and Class
B shares, respectively, excluding certain expenses such as
extraordinary expenses, taxes, brokerage and interest. Prior to June 1,
2006, the investment management fee for DWS International VIP was
calculated according to the following schedule: 0.875% of average daily
net assets on the first $500 million and 0.725% of average daily net
assets in excess of $500 million. As a result, the Advisor received
compensation at an annual rate of 0.87% and 0.858% for the fiscal years
ended December 31, 2004 and 2005, respectively. The Advisor, the
underwriter or the accounting agent had contractually agreed, for the
period January 1, 2005 through May 31, 2006, to limit their respective
fees and to reimburse other expenses to the extent necessary to limit
their total operating expenses at 1.37% for Classes A and B, excluding
certain expenses such as extraordinary expenses, taxes, brokerage and
interest. Under this arrangement, for the fiscal year ended 2004, the
Advisor reimbursed the portfolio $9,159. Under these arrangements, the
Advisor reimbursed DWS International VIP $16,354 for expenses. Pursuant
to their respective agreements with DWS Variable Series I, the Advisor,
the underwriter and the accounting agent had agreed, for the period
June 1, 2006 through September 30, 2006, to limit their respective fees
and to reimburse other expenses to the extent necessary to limit total
operating expenses of Class A Shares and Class B Shares of DWS
International VIP to 1.15% and 1.55%, respectively, excluding certain
expenses such as extraordinary expenses, taxes, brokerage and interest.
(8) Prior to June 1, 2006, the investment management fee for the DWS Health
Care VIP was calculated according to the following schedule: 0.750% of
average daily net assets on the first $250 million, 0.725% of average
daily net assets on the next $750 million, 0.700% of average daily net
assets on the next $1.5 billion, 0.680% of average daily net assets on
the next $2.5 billion, 0.650% of average daily net assets on the next
$2.5 billion, 0.640% of average daily net assets on the next $2.5
billion, 0.630% of average daily net assets on the next $2.5 billion
and 0.620% of average daily net assets over $12.5 billion. The Advisor
received compensation at an annual rate of 0.750% for each of the
fiscal years ended December 31, 2004 and 2005. The Advisor, the
underwriter or the accounting agent have contractually agreed, for the
period January 1, 2005 through May 31, 2006, to limit their respective
fees and to reimburse other expenses to the extent necessary to limit
their total operating expenses at 0.95% of average daily net assets for
Class A and 1.35% of average daily net assets for Class B, excluding
certain expenses such as extraordinary expenses, taxes, brokerage and
interest. Pursuant to their respective agreements with DWS Variable
Series I, the Advisor, the underwriter and the accounting agent had
agreed, for the period June 1, 2006 through September 30, 2006, to
limit their respective fees and to reimburse other expenses to the
extent necessary to limit total operating expenses of Class A Shares
and Class B Shares of DWS Health Care VIP to 1.135% and 1.535%,
respectively, excluding certain expenses such as extraordinary
expenses, taxes, brokerage and interest.
Under the Investment Management Agreements, each Portfolio is responsible for
all of its other expenses, including clerical salaries; fees and expenses
incurred in connection with membership in investment company organizations;
brokers' commissions; legal, auditing and accounting expenses; taxes and
governmental fees; the charges of custodians, transfer agents and other agents;
any other expenses, including clerical expenses, of issue, sale, underwriting,
distribution, redemption or repurchase of shares; the expenses of and fees for
registering or qualifying securities for sale; the fees and expenses of the
Trustees of the Fund who are not affiliated with the Advisor; and the cost of
preparing and distributing reports and notices to shareholders. The Fund may
arrange to have third parties assume all or part of the expense of sale,
underwriting and distribution of a Portfolio's shares. Each Portfolio is also
responsible for its expenses incurred in connection with litigation, proceedings
and claims and the legal obligation it may have to indemnify its officers and
Trustees with respect thereto.
In reviewing the terms of the Investment Management Agreements and in
discussions with the Advisor concerning the Agreements, Independent Trustees (as
defined in the 1940 Act) of the Fund are represented by independent counsel at
the Fund's expense.
The Investment Management Agreements provide that the Advisor shall not be
liable for any error of judgment or mistake of law or for any loss suffered by
the Fund in connection with matters to which the Investment Management
Agreements relate, except a loss resulting from willful misfeasance, bad faith
or gross negligence on the part of the Advisor in the performance of its duties
or from reckless disregard by the Advisor of its obligations and duties under
the Investment Management Agreements.
Each Participating Insurance Company has agreed with the Advisor to reimburse
the Advisor for a period of five years to the extent that the aggregate annual
advisory fee paid on behalf of all Portfolios with respect to the average daily
net asset value of the shares of all Portfolios held in that Participating
Insurance Company's general or separate account (or those of affiliates) is less
than $25,000 in any year. It is expected that insurance companies which become
Participating Insurance Companies in the future will be required to enter into
similar arrangements.
Officers and employees of the Advisor from time to time may have transactions
with various banks, including the Fund's custodian bank. It is the Advisor's
opinion that the terms and conditions of those transactions were not influenced
by existing or potential custodial or other Fund relationships.
The Advisor may serve as Advisor to other funds with investment objectives and
policies similar to those of the Portfolios that may have different distribution
arrangements or expenses, which may affect performance.
Pursuant to DeAM procedures approved by the Boards on behalf of the DWS funds,
proof of claim forms are routinely filed on behalf of the DWS funds by a third
party service provider, with certain limited exceptions. The Boards of the DWS
funds receive periodic reports regarding the implementation of these procedures.
None of the Officers and Trustees of the Fund may have dealings with the Fund as
principals in the purchase or sale of securities, except as individual
subscribers to or holders of shares of the Fund.
In addition, the Board and shareholders approved a subadvisor approval policy
for the Portfolio (the "Subadvisor Approval Policy"). The Subadvisor Approval
Policy permits the Advisor, subject to the approval of the Board, including a
majority of its independent board members, to appoint and replace subadvisors
and to amend sub-advisory contracts without obtaining shareholder approval.
Under the Subadvisor Approval Policy, the Board, including its independent board
members, will continue to evaluate and approve all new sub-advisory contracts
between the Advisor and any subadvisor, as well as all changes to any existing
sub-advisory contract. The Portfolio cannot implement the Subadvisor Approval
Policy without the SEC either adopting revisions to current rules (as it
proposed to do in October 2003) or granting the Portfolio exemptive relief from
existing rules. The Portfolio and the Advisor would be subject to certain
conditions imposed by the SEC (and certain conditions that may be imposed in the
future within either exemptive relief or a rule) to ensure that the interests of
the Portfolio and its shareholders are adequately protected whenever the Advisor
acts under the Subadvisor Approval Policy, including any shareholder notice
requirements.
Subadvisor and Sub-subadvisor -- DWS Bond VIP
Prior to December 2, 2005, Deutsche Asset Management Investment Services Limited
("DeAMIS"), an affiliate of DIMA, the investment advisor of the Portfolio, was
the subadvisor for the Portfolio. DeAMIS rendered investment advisory and
management services including services related to foreign securities, foreign
currency transactions and related investments. The Advisor managed all other
assets of the Portfolio. DeAMIS provided a full range of international
investment advisory services to institutional and retail clients.
Effective December 2, 2005, Aberdeen Asset Management PLC ("Aberdeen PLC")
acquired from Deutsche Bank AG, the parent company of the Advisor, parts of its
asset management business and related assets based in London and Philadelphia.
Effective December 1, 2005, DeAMIS became a direct wholly-owned subsidiary of
Aberdeen PLC and was renamed Aberdeen Asset Management Investment Services
Limited ("AAMISL"), and the individuals at the Advisor's Philadelphia-based
Fixed Income team who managed all or a portion of the assets of the Portfolio
became employees of Aberdeen Asset Management Inc. ("AAMI"). AAMI and AAMISL are
each a direct wholly-owned subsidiary of Aberdeen PLC and each a registered
investment advisor under the Investment Advisers Act of 1940, as amended.
Effective December 2, 2005 and pursuant to a written contract with the Advisor,
AAMI became the subadvisor to the Portfolio (the "Aberdeen Subadvisory
Agreement"). As subadvisor and pursuant to the Aberdeen Subadvisory Agreement,
AAMI may delegate certain of its duties and responsibilities with respect to the
services it is contracted to provide to the Portfolio. Pursuant to such
authority, AAMI has entered into an investment sub-subadvisory agreement with
AAMISL to provide investment services to the Portfolio ("Sub-Subadvisory
Agreement").
Under the terms of the Aberdeen Subadvisory Agreement and the Sub-Subadvisory
Agreement, AAMI and AAMISL, respectively, each agree, subject to the supervision
and control of the Advisor and the Board (and, in the case of the
Sub-Subadvisory Agreement, also subject to the supervision and control of AAMI),
to manage the securities and assets of the Portfolio entrusted to it by the
Advisor (and, in the case of the Sub-Subadvisory Agreement, entrusted to AAMISL
by AAMI), in accordance with the Portfolio's investment objectives, policies and
restrictions.
AAMI is paid for its services by the Advisor, and not the Portfolio, from its
fee as investment advisor to the Portfolio. AAMISL is paid for its services by
AAMI, and not the Portfolio, from its fee as investment subadvisor to the
Portfolio. As compensation for their services under the Aberdeen Subadvisory
Agreement and the Sub-Subadvisory Agreement, the Advisor pays AAMI a fee at the
annual rate of 0.29% of the average daily net assets of the Portfolio, computed
daily and paid monthly. The subadvisory fee paid by DIMA to AAMI for the fiscal
year ended December 31, 2007 was $649,446. AAMI pays AAMISL a fee for its
services at the annual rate of 0.04% of the average daily net assets of the
Portfolio, computed daily and paid monthly.
The Aberdeen Subadvisory Agreement and the Sub-Subadvisory Agreement will each
have an initial term of two years (unless sooner terminated) and will each
remain in effect from year to year thereafter if approved annually (i) by the
Board or by the vote of a "majority of the outstanding voting securities" of the
Portfolio, and (ii) by a majority of the Independent Board Members who are not
parties to the Agreement, cast in person at a meeting called for such purpose.
AAMISL and AAMI are each obligated to pay all expenses (excluding brokerage
costs, custodian fees, fees of independent registered public accounting firms or
other expenses of the Portfolio to be borne by the Portfolio or the Trust in
connection with the performance of its services). The Portfolio bears certain
other expenses incurred in its operation. The services of AAMISL and AAMI are
not deemed to be exclusive and nothing in the Aberdeen Subadvisory Agreement or
Sub-Subadvisory Agreement prevents AAMISL and AAMI or their affiliates from
providing similar services to other investment companies and other clients
(whether or not their investment objective and policies are similar to those of
the Portfolio) or from engaging in other activities.
Under the Aberdeen Subadvisory Agreement and the Sub-Subadvisory Agreement,
AAMISL and AAMI will each be liable (i) if it causes the Portfolio to be in
violation of any applicable federal or state law, rule or regulation or any
investment policy or restriction set forth in the Prospectus or any written
guidelines, policies or instructions provided in writing by the Board or the
Advisor, and (ii) for its willful misfeasance, bad faith or gross negligence in
the performance of its duties or its reckless disregard of its obligations and
duties under the Aberdeen Subadvisory Agreement or the Sub-Subadvisory
Agreement.
Compensation of Portfolio Managers
Portfolio managers are eligible for total compensation comprised of base salary
and discretionary incentive compensation.
Base Salary - Base salary generally represents a smaller percentage of portfolio
managers' total compensation than discretionary incentive compensation. Base
salary is linked to job function, responsibilities and financial services
industry peer comparison through the use of extensive market data surveys.
Discretionary Incentive Compensation - Generally, discretionary incentive
compensation comprises a greater proportion of total compensation as a portfolio
manager's seniority and compensation levels increase. Discretionary incentive
compensation is determined based on an analysis of a number of factors,
including among other things, the performance of Deutsche Bank, the performance
of the Asset Management division, and the employee's individual contribution. In
evaluating individual contribution, management will consider a combination of
quantitative and qualitative factors. A portion of the portfolio manager's
discretionary incentive compensation may be delivered in long-term equity
programs (usually in the form of Deutsche Bank equity) (the "Equity Plan"). Top
performing portfolio managers may earn discretionary incentive compensation that
is a multiple of their base salary.
o The quantitative analysis of a portfolio manager's individual
performance is based on, among other factors, performance of all of the
accounts managed by the portfolio manager (which includes the fund and
any other accounts managed by the portfolio manager) over a one-,
three-, and five-year period relative to the appropriate Morningstar
and Lipper peer group universes and/or benchmark index(es) with respect
to each account. Additionally, the portfolio manager's
retail/institutional asset mix is weighted, as appropriate for
evaluation purposes. Generally the benchmark index used is a benchmark
index set forth in the fund's prospectus to which the fund's
performance is compared. Additional or different appropriate peer group
or benchmark indices may also be used. Primary weight is given to
pre-tax portfolio performance over three-year and five-year time
periods (adjusted as appropriate if the portfolio manager has served
for less than five years) with lesser consideration given to portfolio
performance over a one-year period. The increase or decrease in a
fund's assets due to the purchase or sale of fund shares is not
considered a material factor.
o The qualitative analysis of a portfolio manager's individual
performance is based on, among other things, the results of an annual
management and internal peer review process, and management's
assessment of overall portfolio manager contributions to investor
relations, the investment process and overall performance (distinct
from fund and other account performance). Other factors, including
contributions made to the investment team, as well as adherence to
Compliance Policies and Procedures, Risk Management procedures, the
firm's Code of Ethics and "living the values" of the Advisor are also
factors.
The quantitative analysis of a portfolio manager's performance is given more
weight in determining discretionary incentive compensation than the qualitative
portion.
Certain portfolio managers may also participate in the Equity Plan. The amount
of equity awarded under the long-term equity programs is generally based on the
individual's total compensation package and may comprise from 0% to 30% of the
total compensation award. As discretionary incentive compensation increases, the
percentage of compensation awarded in Deutsche Bank equity also increases.
Portfolio managers may receive a portion of their equity compensation in the
form of shares in the proprietary mutual funds that they manage or support.
Compensation of Portfolio Managers of Sub-Advised Portfolios
Remuneration of Personnel for DWS Bond VIP:
Aberdeen's remuneration policy ("Policy") is designed to reflect the importance
of recruiting, retaining and motivating senior executives and portfolio managers
of the caliber necessary to maintain and improve Aberdeen's position in the
asset management industry. The Policy seeks to reward performance in a manner
which aligns the interests of clients, shareholders and executives. The elements
of the Policy as it relates to the Fund's portfolio managers are as follows:
Basic salary. The salaries of all employees are reviewed annually and are
determined by reference to external market research. Aberdeen's Policy is to pay
salaries which, when taken together with other benefits, will provide a
remuneration package that is reasonable and competitive in the asset management
industry. Aberdeen participates in compensation surveys which provide salary
comparisons for a range of employees across Aberdeen. Aberdeen also considers
information included in other publicly available research and survey results.
Staff performance is reviewed formally once a year with mid-term reviews.
The review process looks at all of the ways in which an individual has
contributed to the organization, and specifically, in the case of portfolio
managers, to the investment team.
Annual bonus. The Policy is to recognize corporate and individual achievements
each year through an appropriate annual bonus plan. The aggregate amount of a
cash bonus available in any year is dependent on Aberdeen's overall performance
and profitability. Consideration will also be given to the levels of bonuses
paid in the marketplace. Individual awards, payable to all members of staff, are
determined by a rigorous assessment of achievement against defined objectives,
and are reviewed and approved by Aberdeen's Remuneration Committee.
Portfolio managers' bonuses are based on a combination of the investment team's
overall performance, the individual's performance and the overall performance of
Aberdeen. In calculating a portfolio manager's bonus, Aberdeen takes into
consideration the performance of funds managed by the team as well as more
subjective issues that benefit Aberdeen. Portfolio manager performance on
investment matters is judged over all funds to which the fund manager
contributes. Performance is measured against appropriate market indices as well
as peer universes over various time periods.
Deferred bonus. A deferred bonus plan exists and is designed to encourage the
retention of certain key employees identified as critical to Aberdeen's
achievement of its long-term goals. Deferred bonuses may be in the form of
deferred equity in Aberdeen PLC.
Retention and incentives for former Deutsche Asset Management employees. In
addition to the Policy, appropriate retention and incentive arrangements have
been put into place for certain employees of the former Deutsche Asset
Management businesses, including in some cases participation in the Long Term
Incentive Plan. The costs of these arrangements are being borne by both Deutsche
Asset Management and Aberdeen.
Conflicts of Interest for DWS Bond VIP:
In addition to the accounts above, an investment professional may manage
accounts in a personal capacity that may include holdings that are similar to,
or the same as, those of the funds. AAMI and AAMISL have in place a Code of
Ethics that is designed to address conflicts of interest and that, among other
things, imposes restrictions on the ability of portfolio managers and other
"access persons" to invest in securities that may be recommended or traded in
the funds and other client accounts.
Real, potential or apparent conflicts of interest may arise when a portfolio
manager has day-to-day portfolio management responsibilities with respect to
more than one fund or account, including the following:
o Certain investments may be appropriate for the Fund and also for other
clients advised by AAMI and AAMISL, including other client accounts
managed by the Fund's portfolio management team. Investment decisions
for the Fund and other clients are made with a view to achieving their
respective investment objectives and after consideration of such
factors as their current holdings, availability of cash for investment
and the size of their investments generally. A particular security may
be bought or sold for only one client or in different amounts and at
different times for more than one but less than all clients. Likewise,
because clients of AAMI and AAMISL may have differing investment
strategies, a particular security may be bought for one or more clients
when one or more other clients are selling the security. The investment
results achieved for the Fund may differ from the results achieved for
other clients of AAMI and AAMISL. In addition, purchases or sales of
the same security may be made for two or more clients on the same day.
In such event, such transactions will be allocated among the clients in
a manner believed by AAMI and AAMISL to be most equitable to each
client, generally utilizing a pro rata allocation methodology. In some
cases, the allocation procedure could potentially have an adverse
effect or positive effect on the price or amount of the securities
purchased or sold by the Fund. Purchase and sale orders for the Fund
may be combined with those of other clients of AAMI and AAMISL in the
interest of achieving the most favorable net results to the Fund and
the other clients.
o To the extent that a portfolio manager has responsibilities for
managing multiple client accounts, a portfolio manager will need to
divide time and attention among relevant accounts. The Advisor attempts
to minimize these conflicts by aligning its portfolio management teams
by investment strategy and by employing similar investment models
across multiple client accounts.
In some cases, an apparent conflict may arise where AAMI and AAMISL have an
incentive, such as a performance-based fee, in managing one account and not with
respect to other accounts it manages. The Advisor will not determine allocations
based on whether it receives a performance-based fee from the client.
Additionally, AAMI and AAMISL have in place supervisory oversight processes to
periodically monitor performance deviations for accounts with like strategies.
Fund Ownership of Portfolio Managers
The following table shows the dollar range of shares owned beneficially and of
record by each member of the Portfolios' management team in the applicable
Portfolio as well as in all DWS Funds as a group (i.e. those funds advised by
Deutsche Asset Management or its affiliates), including investments by their
immediate family members sharing the same household and amounts invested through
retirement and deferred compensation plans. This information is provided as of
the Portfolio's most recent fiscal year end.
Dollar Range of Dollar Range of All
Name of Portfolio Shares DWS Fund
Name of Portfolio Portfolio Manager Owned Shares Owned
----------------- ----------------- ----- ------------
DWS Bond VIP Gary W. Bartlett $0 N/A
Warren S. Davis, III $0 N/A
Thomas J. Flaherty $0 N/A
J. Christopher Gagnier $0 N/A
Daniel R. Taylor $0 N/A
Timothy C. Vile $0 N/A
William T. Lissenden $0 N/A
Brett Diment $0 N/A
Annette Fraser $0 N/A
Anthony Fletcher $0 N/A
Nick Hart $0 N/A
Stephen Ilott $0 N/A
Ian Winship $0 N/A
Matthew Cobon $0 N/A
DWS Growth & Income VIP Robert Wang $0(1) $100,001 - $500,000
Jin Chen $0(2) $100,001 - $500,000
Julie Abbett $0(3) $50,001 - $100,000
DWS Capital Growth VIP Julie M. Van Cleave $0(4) Over $1,000,000
Jack A. Zehner $0(5) $100,001 - $500,000
Richard Shepley $0(6) $100,001 - $500,000
DWS Global Opportunities VIP Joseph Axtell $0(7) $100,001 - $500,000
Terrence S. Gray $0(8) $500,001 - $1,000,000
DWS International VIP Matthias Knerr $0(9) $500,001 - $1,000,000
Chris LaJaunie $0(10) $50,001 - $100,000
DWS Health Care VIP Leefin Lai $0(11) $100,001 - $500,000
(1) Although the Portfolio Manager does not have an investment in this
variable annuity portfolio, the Portfolio Manager does hold
$10,001-$50,000 in DWS Growth & Income Fund, the retail mutual fund
that has the same investment strategy. This investment is included in
the "Dollar Range of All DWS Fund Shares Owned."
(2) Although the Portfolio Manager does not have an investment in this
variable annuity portfolio, the Portfolio Manager does hold
$10,001-$50,000 in DWS Growth & Income Fund, the retail mutual fund
that has the same investment strategy. This investment is included in
the "Dollar Range of All DWS Fund Shares Owned."
(3) Although the Portfolio Manager does not have an investment in this
variable annuity portfolio, the Portfolio Manager does hold $1-$10,000
in DWS Growth & Income Fund, the retail mutual fund that has the same
investment strategy. This investment is included in the "Dollar Range
of All DWS Fund Shares Owned."
(4) Although the Portfolio Manager does not have an investment in this
variable annuity portfolio, the Portfolio Manager does hold over
$1,000,000 in DWS Capital Growth Fund, the retail mutual fund that has
the same investment strategy. This investment is included in the
"Dollar Range of All DWS Fund Shares Owned."
(5) Although the Portfolio Manager does not have an investment in this
variable annuity portfolio, the Portfolio Manager does hold
$10,001-$50,000 in DWS Capital Growth Fund, the retail mutual fund that
has the same investment strategy. This investment is included in the
"Dollar Range of All DWS Fund Shares Owned."
(6) Although the Portfolio Manager does not have an investment in this
variable annuity portfolio, the Portfolio Manager does hold
$100,001-$500,000 in DWS Capital Growth Fund, the retail mutual fund
that has the same investment strategy. This investment is included in
the "Dollar Range of All DWS Fund Shares Owned."
(7) Although the Portfolio Manager does not have an investment in this
variable annuity portfolio, the Portfolio Manager does hold
$100,001-$500,000 in DWS Global Opportunities Fund, the retail mutual
fund that has the same investment strategy. This investment is included
in the "Dollar Range of All DWS Fund Shares Owned."
(8) Although the Portfolio Manager does not have an investment in this
variable annuity portfolio, the Portfolio Manager does hold
$10,001-$50,000 in DWS Global Opportunities Fund, the retail mutual
fund that has the same investment strategy. This investment is included
in the "Dollar Range of All DWS Fund Shares Owned."
(9) Although the Portfolio Manager does not have an investment in this
variable annuity portfolio, the Portfolio Manager does hold
$100,001-$500,000 in DWS International Fund, the retail mutual fund
that has the same investment strategy. This investment is included in
the "Dollar Range of All DWS Fund Shares Owned."
(10) Although the Portfolio Manager does not have an investment in this
variable annuity portfolio, the Portfolio Manager does hold
$50,001-$100,000 in DWS International Fund, the retail mutual fund that
has the same investment strategy. This investment is included in the
"Dollar Range of All DWS Fund Shares Owned."
(11) Although the Portfolio Manager does not have an investment in this
variable annuity portfolio, the Portfolio Manager does hold
$10,001-$50,000 in DWS Health Care Fund, the retail mutual fund that
has the same investment strategy. This investment is included in the
"Dollar Range of All DWS Fund Shares Owned."
Conflicts of Interest
In addition to managing the assets of the Portfolios, the portfolio managers may
have responsibility for managing other client accounts of the Advisor or its
affiliates. The tables below show, for each portfolio manager, the number and
asset size of (1) SEC registered investment companies (or series thereof) other
than the Fund, (2) pooled investment vehicles that are not registered investment
companies and (3) other accounts (e.g., accounts managed for individuals or
organizations) managed by each portfolio manager. Total assets attributed to
each portfolio manager in the tables below include total assets of each account
managed by them, although the manager may only manage a portion of such
account's assets. The tables also show the number of performance based fee
accounts, as well as the total assets of the accounts for which the advisory fee
is based on the performance of the account. This information is provided as of
the Portfolios' most resent fiscal year end.
Other SEC Registered Investment Companies Managed:
Number of
Number of Total Assets of Investment Total Assets of
Registered Registered Company Accounts Performance-Based
Name of Name of Portfolio Investment Investment with Performance- Fee
Portfolio Manager Companies Companies Based Fee Accounts
--------- ------- --------- --------- --------- --------
DWS Bond VIP Gary W. Bartlett 8 $3,336,496,808 0 $0
Warren S. Davis, III 8 $3,336,496,808 0 $0
Thomas J. Flaherty 8 $3,336,496,808 0 $0
J. Christopher Gagnier 8 $3,336,496,808 0 $0
Daniel R. Taylor 8 $3,336,496,808 0 $0
Timothy C. Vile 8 $3,336,496,808 0 $0
William T. Lissenden 8 $3,336,496,808 0 $0
Brett Dimet 7 $543,707,173 0 $0
Annette Fraser 3 $138,583,539 0 $0
Anthony Fletcher 3 $138,583,539 0 $0
Nick Hart 3 $138,583,539 0 $0
Stephen Ilott 3 $138,583,539 0 $0
Ian Winship 3 $138,583,539 0 $0
Mathew Cobon 3 $138,583,539 0 $0
DWS Growth & Income VIP Robert Wang 42 $14,180,412,183 0 $0
Jin Chen 23 $10,805,018,546 0 $0
Julie Abbett 23 $10,805,018,546 0 $0
DWS Capital Growth VIP Julie M. Van Cleave 4 $4,434,213,399 0 $0
Jack A. Zehner 2 $2,204,176,020 0 $0
Richard Shepley 2 $2,204,176,020 0 $0
DWS Global Joseph Axtell 7 $3,032,049,639 0 $0
Opportunities VIP Terrence S. Gray 3 $2,519,928,417 0 $0
DWS International VIP Matthias Knerr 6 $5,904,476,224 0 $0
Chris LaJaunie 0 $0 0 $0
DWS Health Care VIP Leefin Lai 1 $225,883,210 0 $0
Other Pooled Investment Vehicles Managed:
Number of Pooled
Number of Investment Vehicle Total Assets of
Pooled Total Assets of Accounts with Performance-Based
Name of Name of Portfolio Investment Pooled Investment Performance- Fee
Portfolio Manager Vehicles Vehicles Based Fee Accounts
--------- ------- -------- -------- --------- --------
DWS Bond VIP Gary W. Bartlett 9 $4,251,787,278 0 $0
Warren S. Davis, III 9 $4,251,787,278 0 $0
Thomas J. Flaherty 9 $4,251,787,278 0 $0
J. Christopher Gagnier 9 $4,251,787,278 0 $0
Daniel R. Taylor 9 $4,251,787,278 0 $0
Timothy C. Vile 9 $4,251,787,278 0 $0
William T. Lissenden 9 $4,251,787,278 0 $0
Brett Diment 90 $9,248,989,689 0 $0
Annette Fraser 83 $8,100,110,990 0 $0
Anthony Fletcher 83 $8,100,110,990 0 $0
Nick Hart 83 $8,100,110,990 0 $0
Stephen Ilott 83 $8,100,110,990 0 $0
Ian Winship 83 $8,100,110,990 0 $0
Mathew Cobon 83 $8,100,110,990 0 $0
DWS Growth & Income VIP Robert Wang 27 $974,093,507 4 $539,680,217
Jin Chen 15 $267,818,576 0 $0
Julie Abbett 15 $267,818,576 0 $0
DWS Capital Growth VIP Julie M. Van Cleave 0 $0 0 $0
Jack A. Zehner 0 $0 0 $0
Richard Shepley 0 $0 0 $0
DWS Global Joseph Axtell 0 $0 0 $0
Opportunities VIP
Terrence S. Gray 3 $432,135,698 0 $0
DWS International VIP Matthias Knerr 4 $86,797,515 0 $0
Chris LaJaunie 4 $86,797,515 0 $0
DWS Health Care VIP Leefin Lai 0 $0 0 $0
Other Accounts Managed:
Number of Other Total Assets of
Number of Accounts with Performance-Based
Name of Name of Portfolio Other Total Assets of Performance- Fee
Portfolio Manager Accounts Other Accounts Based Fee Accounts
--------- ------- -------- -------------- --------- --------
DWS Bond VIP Gary W. Bartlett 178 $28,378,917,155 4 $430,038,000
Warren S. Davis, III 178 $28,378,917,155 4 $430,038,000
Thomas J. Flaherty 178 $28,378,917,155 4 $430,038,000
J. Christopher Gagnier 178 $28,378,917,155 4 $430,038,000
Daniel R. Taylor 178 $28,378,917,155 4 $430,038,000
Timothy C. Vile 178 $28,378,917,155 4 $430,038,000
William T. Lissenden 178 $28,378,917,155 4 $430,038,000
Brett Diment 375 $58,057,040,962 0 $0
Annette Fraser 363 $55,504,289,839 0 $0
Anthony Fletcher 363 $55,504,289,839 0 $0
Nick Hart 363 $55,504,289,839 0 $0
Stephen Ilott 363 $55,504,289,839 0 $0
Ian Winship 363 $55,504,289,839 0 $0
Mathew Cobon 363 $55,504,289,839 0 $0
DWS Growth & Income VIP Robert Wang 46 $8,973,891,924 8 $232,996,736
Jin Chen 8 $821,247,762 0 $0
Julie Abbett 8 $821,247,762 0 $0
DWS Capital Growth VIP Julie M. Van Cleave 10 $700,135,085 0 $0
Jack A. Zehner 10 $700,135,085 0 $0
Richard Shepley 10 $700,135,085 0 $0
DWS Global Joseph Axtell 3 $295,790,509 0 $0
Opportunities VIP Terrence S. Gray 6 $970,318,130 0 $0
DWS International VIP Matthias Knerr 2 $114,160,972 0 $0
Chris LaJaunie 2 $114,160,972 0 $0
DWS Health Care VIP Leefin Lai 0 $0 0 $0
In addition to the accounts above, an investment professional may manage
accounts in a personal capacity that may include holdings that are similar to,
or the same as, those of the Portfolios. The Advisor has in place a Code of
Ethics that is designed to address conflicts of interest and that, among other
things, imposes restrictions on the ability of portfolio managers and other
"access persons" to invest in securities that may be recommended or traded in
the Portfolios and other client accounts.
Real, potential or apparent conflicts of interest may arise when a portfolio
manager has day-to-day portfolio management responsibilities with respect to
more than one fund or account, including the following:
o Certain investments may be appropriate for each Portfolio and also for
other clients advised by the Advisor, including other client accounts
managed by each Portfolio's management team. Investment decisions for
each Portfolio and other clients are made with a view to achieving
their respective investment objectives and after consideration of such
factors as their current holdings, availability of cash for investment
and the size of their investments generally. A particular security may
be bought or sold for only one client or in different amounts and at
different times for more than one but less than all clients. Likewise,
because clients of the Advisor may have differing investment
strategies, a particular security may be bought for one or more clients
when one or more other clients are selling the security. The investment
results achieved for each Portfolio may differ from the results
achieved for other clients of the Advisor. In addition, purchases or
sales of the same security may be made for two or more clients on the
same day. In such event, such transactions will be allocated among the
clients in a manner believed by the Advisor to be most equitable to
each client, generally utilizing a pro rata allocation methodology. In
some cases, the allocation procedure could potentially have an adverse
effect or positive effect on the price or amount of the securities
purchased or sold by each Portfolio. Purchase and sale orders for each
Portfolio may be combined with those of other clients of the Advisor in
the interest of achieving the most favorable net results to each
Portfolio and the other clients.
o To the extent that a portfolio manager has responsibilities for
managing multiple client accounts, a portfolio manager will need to
divide time and attention among relevant accounts. The Advisor attempts
to minimize these conflicts by aligning its portfolio management teams
by investment strategy and by employing similar investment models
across multiple client accounts.
o In some cases, an apparent conflict may arise where the Advisor has an
incentive, such as a performance-based fee, in managing one account and
not with respect to other accounts it manages. The Advisor will not
determine allocations based on whether it receives a performance-based
fee from the client. Additionally, the Advisor has in place supervisory
oversight processes to periodically monitor performance deviations for
accounts with like strategies.
o The Advisor and its affiliates and the investment team of the
Portfolios may manage other mutual funds and separate accounts on a
long-short basis. The simultaneous management of long and short
portfolios creates potential conflicts of interest including the risk
that short sale activity could adversely affect the market value of the
long positions(and vice versa), the risk arising from sequential orders
in long and short positions, and the risks associated with receiving
opposing orders at the same time. The Advisor has adopted procedures
that it believes are reasonably designed to mitigate these potential
conflicts of interest. Included in these procedures are specific
guidelines developed to ensure fair and equitable treatment for all
clients whose accounts are managed by each Portfolio's management team.
The Advisor and the portfolio management team have established
monitoring procedures, a protocol for supervisory reviews, as well as
compliance oversight to ensure that potential conflicts of interest
relating to this type of activity are properly addressed.
The Advisor is owned by Deutsche Bank AG, a multi-national financial services
company. Therefore, the Advisor is affiliated with a variety of entities that
provide, and/or engage in commercial banking, insurance, brokerage, investment
banking, financial advisory, broker-dealer activities (including sales and
trading), hedge funds, real estate and private equity investing, in addition to
the provision of investment management services to institutional and individual
investors. Since Deutsche Bank AG, its affiliates, directors, officers and
employees (the "Firm") are engaged in businesses and have interests other than
managing asset management accounts, such other activities involve real,
potential or apparent conflicts of interest. These interests and activities
include potential advisory, transactional and financial activities and other
interests in securities and companies that may be directly or indirectly
purchased or sold by the Firm for its clients' advisory accounts. These are
considerations of which advisory clients should be aware and which may cause
conflicts that could be to the disadvantage of the Advisor's advisory clients.
The Advisor has instituted business and compliance policies, procedures and
disclosures that are designed to identify, monitor and mitigate conflicts of
interest and, as appropriate, to report them to the Portfolio's Board.
Codes of Ethics
The Fund, Advisor and Subadvisor, as applicable, and the Fund's principal
underwriter have each adopted codes of ethics under Rule 17j-1 under the 1940
Act. Board members, officers of the Fund and employees of the Advisor and
principal underwriter are permitted to make personal securities transactions,
including transactions in securities that may be purchased or held by the Fund,
subject to requirements and restrictions set forth in the applicable Code of
Ethics. The Advisor's Code of Ethics contains provisions and requirements
designed to identify and address certain conflicts of interest between personal
investment activities and the interests of the Fund. Among other things, the
Advisor's Code of Ethics prohibits certain types of transactions absent prior
approval, imposes time periods during which personal transactions may not be
made in certain securities, and requires the submission of duplicate broker
confirmations and quarterly reporting of securities transactions. Additional
restrictions apply to portfolio managers, traders, research analysts and others
involved in the investment advisory process. Exceptions to these and other
provisions of the Advisor's Code of Ethics may be granted in particular
circumstances after review by appropriate personnel.
FUND SERVICE PROVIDERS
Administrator
The Portfolios have an administrative services agreements with the Advisor (the
"Administrative Services Agreement"), pursuant to which the Advisor provides
administrative services to the Portfolios including, among others, providing the
Portfolios with personnel, preparing and making required filings on behalf of
the Portfolios, maintaining books and records for the Portfolios, and monitoring
the valuation of Portfolio securities. For all services provided under the
Administrative Services Agreement, each Portfolio pays the Advisor a fee,
computed daily and paid monthly, of 0.10% of a Portfolio's average daily net
assets.
Under the Administrative Services Agreement, the Advisor is obligated on a
continuous basis to provide such administrative services as the Board reasonably
deems necessary for the proper administration of the Portfolios. The Advisor
provides each Portfolio with personnel; arranges for the preparation and filing
of the Portfolios' tax returns; prepares and submits reports and meeting
materials to the Board and the shareholders; prepares and files updates to the
Portfolios' prospectus and statement of additional information as well as other
reports required to be filed by the SEC; maintains the Portfolios' records;
provides the Portfolios with office space, equipment and services; supervises,
negotiates the contracts of and monitors the performance of third parties
contractors; oversees the tabulation of proxies; monitors the valuation of
portfolio securities and monitors compliance with Board-approved valuation
procedures; assists in establishing the accounting and tax policies of the
Portfolios; assists in the resolution of accounting issues that may arise with
respect to the Portfolios; establishes and monitors the Portfolios' operating
expense budgets; reviews and processes the Portfolios' bills; assists in
determining the amount of dividends and distributions available to be paid by
the Portfolios, prepares and arranges dividend notifications and provides
information to agents to effect payments thereof; provides to the Board periodic
and special reports; provides assistance with investor and public relations
matters; and monitors the registration of shares under applicable federal and
state law. The Advisor also performs certain Portfolio accounting services under
the Administrative Services Agreement. The Administrative Services Agreement
provides that the Advisor will not be liable under the Administrative Services
Agreement except for willful misfeasance, bad faith or negligence in the
performance of its duties or from the reckless disregard by it of its duties and
obligations thereunder.
The following administrative services fees were paid to DIMA by the Portfolios
for the last two fiscal periods:
Portfolio 2007 2006*
--------- ---- -----
DWS Bond VIP $223,979 $126,522
DWS Growth & Income VIP $285,358 $186,676
DWS Capital Growth VIP $1,150,671 $596,449
DWS Global Opportunities VIP $353,795 $197,914
DWS International VIP $756,054 $393,235
DWS Health Care VIP $112,083 $71,620
* For the period from June 1, 2006 through December 31, 2006.
Pursuant to an agreement between the Advisor and State Street Bank and Trust
Company ("SSB"), the Advisor has delegated certain administrative functions to
SSB. The costs and expenses of such delegation are borne by the Advisor, not by
the Portfolios.
Principal Underwriter
Pursuant to an underwriting agreement dated September 30, 2002, DWS Scudder
Distributors, Inc., 222 South Riverside Plaza, Chicago, Illinois 60606 (the
"Distributor"), an affiliate of the Advisor, is the principal underwriter for
the Class A and Class B shares of each Portfolio.
Under the principal underwriting agreement between the Fund and the Distributor,
the Fund is responsible for the payment of all fees and expenses in connection
with the preparation and filing of any registration statement and prospectus
covering the issue and sale of shares, and the registration and qualification of
shares for sale with the SEC in the various states, including registering the
Distributor as a broker or dealer. The Fund will also pay the fees and expenses
of preparing, printing and mailing prospectuses annually to existing
shareholders and any notice, proxy statement, report, prospectus or other
communication to shareholders of the Fund, printing and mailing confirmations of
purchases of shares, any issue taxes or any initial transfer taxes, a portion of
toll-free telephone service for shareholders, wiring funds for share purchases
and redemptions (unless paid by the shareholder who initiates the transaction),
printing and postage of business reply envelopes and a portion of the computer
terminals used by both the Fund and the Distributor.
The Distributor will pay for printing and distributing prospectuses or reports
prepared for its use in connection with the offering of the shares to the public
and preparing, printing and mailing any other literature or advertising in
connection with the offering of the shares to the public. The Distributor will
pay all fees and expenses in connection with its qualification and registration
as a broker or dealer under Federal and state laws, a portion of the toll-free
telephone service and of computer terminals, and of any activity which is
primarily intended to result in the sale of shares issued by the Fund, except
with respect to Class B shares, for which a 12b-l Plan is in effect which
provides that the Fund shall bear some or all of the distribution related
expenses attributable to such shares. The Distributor has entered into
agreements with broker-dealers authorized to offer and sell VA contracts and VLI
policies on behalf of the Participating Insurance Companies under which
agreements the broker-dealers have agreed to be responsible for the fees and
expenses of any prospectus, statement of additional information and printed
information supplemental thereto of the Fund distributed in connection with
their offer of VA contracts and VLI policies.
The Distributor currently offers shares of each Portfolio on a continuous basis
to the separate accounts of Participating Insurance Companies in all states in
which a Portfolio or the Fund may from time to time be registered or where
permitted by applicable law. The underwriting agreement provides that the
Distributor accepts orders for shares at net asset value without sales
commission or load being charged. The Distributor has made no commitment to
acquire shares of any Portfolio.
Each Portfolio has adopted a distribution plan under Rule 12b-1 (the "Plan")
that provides for fees payable as an expense of the Class B shares. Under the
plan, DWS Variable Series I may make quarterly payments to the distributor as
reimbursement for distribution and shareholder servicing related expenses
incurred or paid by the distributor or a participating insurance company. No
such payment shall be made with respect to any quarterly period in excess of an
amount determined for such period at the annual rate of .25% of the average
daily net assets of Class B shares during that quarterly period. The fee is
payable by the Fund, on behalf of each Portfolio, of up to 0.25% of the average
daily net assets attributable to the Class B shares of a Portfolio. Because
12b-1 fees are paid out of Portfolio assets on an ongoing basis, they will, over
time, increase the cost of investment and may cost more than other types of
sales charges. In connection with its consideration of the Plan, the Board of
Trustees was furnished with drafts of the Plan and related materials, including
information related to the advantages and disadvantages of Rule 12b-1 plans
currently being used in the mutual fund industry. Legal counsel for the Fund
provided additional information, summarized the provisions of the proposed Plan
and discussed the legal and regulatory considerations in adopting such Plan.
Expenses of the Portfolios and of the Distributor in connection with the Rule
12b-1 plan for the Class B shares are set forth below:
Class B Shares Fiscal Year 2006 Fiscal Year 2007
-------------- ---------------- ----------------
DWS Bond VIP $2,561 $2,631
DWS Growth & Income VIP $117,433 $69,685
DWS Capital Growth VIP $185,189 $121,808
DWS Global Opportunities VIP $87,390 $53,186
DWS International VIP $108,917 $64,471
DWS Health Care VIP $54,613 $27,047
The Board considered various factors in connection with its decision as to
whether to approve the Plan, including (a) the nature and causes of the
circumstances which make implementation of the Plan necessary and appropriate;
(b) the way in which the Plan would address those circumstances, including the
nature and potential amount of expenditures; (c) the nature of the anticipated
benefits; (d) the possible benefits of the Plan to any other person relative to
those of the Fund; (e) the effect of the Plan on existing owners of VA contracts
and VLI policies; (f) the merits of possible alternative plans or pricing
structures; (g) competitive conditions in the variable products industry and (h)
the relationship of the Plan to other distribution efforts of the Fund.
Based upon its review of the foregoing factors and the materials presented to
it, and in light of its fiduciary duties under relevant state law and the 1940
Act, the Board determined, in the exercise of its business judgment, that the
Fund's Plan is reasonably likely to benefit the Fund and the VA contract and VLI
policy owners in at least one of several ways. Specifically, the Board concluded
that the Participating Insurance Companies would have less incentive to educate
VA contract and VLI policy owners and sales people concerning the Fund if
expenses associated with such services were not paid for by the Fund. In
addition, the Board determined that the payment of distribution fees to insurers
should motivate them to maintain and enhance the level of services relating to
the Fund provided to VA contract and VLI policy owners, which would, of course,
benefit such VA contract and VLI policy owners. Further, the adoption of the
Plan would likely help to maintain and may lead to an increase in net assets
under management given the distribution financing alternatives available through
the multi-class structure. The Board also took into account expense structures
of other competing products and administrative compensation arrangements between
other funds, their advisors and insurance companies that currently are in use in
the variable products industry. Further, it is anticipated that Plan fees may be
used to educate potential and existing owners of VA contracts and VLI policies
concerning the Fund, the securities markets and related risks.
The Board realizes that there is no assurance that the expenditure of Fund
assets to finance distribution of Fund shares will have the anticipated results.
However, the Board believes there is a reasonable likelihood that one or more of
such benefits will result, and since the Board will be in a position to monitor
the distribution expenses of the Fund, it will be able to evaluate the benefit
of such expenditures in deciding whether to continue the Plan.
The Plan and any Rule 12b-1-related agreement that is entered into by the Fund
or the Distributor in connection with the Plan will continue in effect for a
period of more than one year only so long as continuance is specifically
approved at least annually by a vote of a majority of the Fund's Board of
Trustees, and of a majority of the Trustees who are not interested persons (as
defined in the 1940 Act) of the Fund or a Portfolio and who have no financial
interest in the operation of the Plan ("Independent Trustees"), cast in person
at a meeting called for the purpose of voting on the Plan, or the Rule 12b-1
related agreement, as applicable. In addition, the Plan and any Rule 12b-1
related agreement, may be terminated as to Class B shares of a Portfolio at any
time, without penalty, by vote of a majority of the outstanding Class B shares
of that Portfolio or by vote of a majority of the Independent Trustees. The Plan
also provides that it may not be amended to increase materially the amount that
may be spent for distribution of Class B shares of a Portfolio without the
approval of Class B shareholders of that Portfolio.
Transfer Agent
DWS Scudder Investments Service Company ("DWS-SISC" or the "Transfer Agent"),
811 Main Street, Kansas City, Missouri 64105-2005, is the transfer and dividend
paying agent for the Fund. The Transfer Agent receives an annual service fee for
each account of the Fund, based on the type of account. For open retail
accounts, the fee is a flat fee ranging from $20.00 to $27.50 per account, for
open wholesale money funds the fee is $32.50 per account, while for certain
retirement accounts serviced on the recordkeeping system of ADP, Inc., the fee
is a flat fee up to $3.60 per account (as of 2007, indexed to inflation) plus an
asset based fee of up to 0.25% of average net assets. 1/12th of the annual
service charge for each account is charged and payable to the Transfer Agent
each month. A fee is charged for any account which at any time during the month
had a share balance in the Fund. Smaller fees are also charged for closed
accounts for which information must be retained on the Transfer Agent's system
for up to 18 months after closing for tax reporting purposes.
Expenses of the Portfolios paid to DWS-SISC for the period ended December 31,
2007 are set forth below:
Portfolio Fiscal Year 2007 Waived
--------- ---------------- ------
DWS Bond VIP $898 $0
DWS Growth & Income VIP $940 $208
DWS Capital Growth VIP $951 $951
DWS Global Opportunities VIP $901 $667
DWS International VIP $1,493 $320
DWS Health Care VIP $503 $0
Certain out-of-pocket expenses incurred by the Transfer Agent, including
expenses of printing and mailing routine fund disclosure documents, costs of
record retention and transaction processing costs are reimbursed by the Fund or
are paid directly by the Fund. Certain additional out-of-pocket expenses,
including costs of computer hardware and software, third party record-keeping
and processing of proxy statements, may only be reimbursed by the Fund with the
prior approval of the Fund's Board.
Pursuant to a sub-transfer agency agreement between DWS-SISC and DST Systems,
Inc. ("DST"), DWS-SISC has delegated certain transfer agent, dividend paying
agent and shareholder servicing agent functions to DST. The costs and expenses
of such delegation are borne by DWS-SISC, not by the Funds.
Recordkeeping
The shareholders of the Portfolios of the Fund are the Participating Insurance
Companies that offer the Portfolios as investment options for holders of certain
variable annuity contracts and variable life insurance policies. The holders of
the shares of the Portfolios on the records of the Fund are the Participating
Insurance Companies and no information concerning the Portfolio holdings of
specific contract and policy holders is maintained by the Fund. The insurance
companies place orders for the purchase and redemption of Portfolio shares with
the Fund reflecting the investment premiums paid, surrender and transfer
requests and other matters on a net basis; they maintain all records of the
transactions and holdings of Portfolio shares and distributions thereon for
individual contract and policy holders; and they prepare and mail to contract
and policy holders confirmations and periodic account statements reflecting such
transactions and holdings.
The Portfolios of the Fund may compensate certain insurance companies for record
keeping and other administrative services performed with regard to holdings of
Class B Portfolio shares as an expense of the Class B shares up to 0.15%. These
fees are included within the "Other Expenses" category in the fee table for each
portfolio in the Class B Shares Prospectus (see "How Much Investors Pay" in a
Portfolio's prospectus). In addition, the Advisor may, from time to time, pay
its own resources certain insurance companies for record keeping and other
administrative services related to Class A and Class B shares of the Portfolios
held by such insurance companies on behalf of their contract and policy holders.
Custodian
Portfolio securities of the DWS Bond VIP, DWS Growth & Income VIP, DWS Capital
Growth VIP and DWS Health Care VIP are held separately, pursuant to a custodian
agreement, by State Street Bank and Trust Company, 225 Franklin Street, Boston,
Massachusetts 02110, as custodian.
DWS Bond VIP and DWS Health Care VIP only: SSB has entered into agreements with
foreign subcustodians approved by the Trustees pursuant to Rule 17f-5 under the
1940 Act. SSB uses Deutsche Bank AG, an affiliate of the Investment Advisor, as
subcustodian ("DB Subcustodian") in certain countries. To the extent a Portfolio
holds any securities in the countries in which SSB uses DB Subcustodian as a
subcustodian, those securities will be held by DB Subcustodian as part of a
larger omnibus account in the name of SSB (the "Omnibus Account"). For its
services, DB Subcustodian receives (1) an annual fee based on a percentage of
the average daily net assets of the Omnibus Account and (2) transaction charges
with respect to transactions that occur within the Omnibus Account.
Portfolio securities of DWS Global Opportunities VIP and DWS International VIP
are held separately, pursuant to a custodian agreement, by Brown Brothers
Harriman & Co., 40 Water Street, Boston, Massachusetts 02109, as custodian.
Independent Registered Public Accounting Firm
The Financial Highlights of the Portfolios included in the Fund's prospectuses
and the Financial Statements incorporated by reference into this Statement of
Additional Information have been so included or incorporated by reference in
reliance on the report of PricewaterhouseCoopers LLP, 125 High Street, Boston,
Massachusetts 02110, independent registered public accounting firm, and given on
the authority of that firm as experts in accounting and auditing.
PricewaterhouseCoopers LLP audits the financial statements of the Fund and
provides other audit, tax, and related services. Shareholders will receive
annual audited financial statements and semiannual unaudited financial
statements.
Legal Counsel
The law firm of Ropes & Gray LLP, One International Place, Boston, Massachusetts
02110, is counsel for the Fund and its Independent Trustees.
Regulatory Matters and Legal Proceedings
On December 21, 2006, Deutsche Asset Management ("DeAM") settled proceedings
with the Securities and Exchange Commission ("SEC") and the New York Attorney
General on behalf of Deutsche Asset Management, Inc. ("DAMI") and DIMA, the
investment advisors to many of the DWS Scudder funds, regarding allegations of
improper trading of fund shares at DeAM and at the legacy Scudder and Kemper
organizations prior to their acquisition by DeAM in April 2002. These regulators
alleged that although the prospectuses for certain funds in the regulators' view
indicated that the funds did not permit market timing, DAMI and DIMA breached
their fiduciary duty to those funds in that their efforts to limit trading
activity in the funds were not effective at certain times. The regulators also
alleged that DAMI and DIMA breached their fiduciary duty to certain funds by
entering into certain market timing arrangements with investors. These trading
arrangements originated in businesses that existed prior to the currently
constituted DeAM organization, which came together as a result of various
mergers of the legacy Scudder, Kemper and Deutsche fund groups, and all of the
arrangements were terminated prior to the start of the regulatory investigations
that began in the summer of 2003. No current DeAM employee approved these
trading arrangements. Under the terms of the settlements, DAMI and DIMA neither
admitted nor denied any wrongdoing.
The terms of the SEC settlement, which identified improper trading in the legacy
Deutsche and Kemper mutual funds only, provide for payment of disgorgement in
the amount of $17.2 million. The terms of the settlement with the New York
Attorney General provide for payment of disgorgement in the amount of $102.3
million, which is inclusive of the amount payable under the SEC settlement, plus
a civil penalty in the amount of $20 million. The total amount payable by DeAM,
approximately $122.3 million, will be distributed to shareholders of the
affected funds in accordance with a distribution plan to be developed by a
distribution consultant. The funds' investment advisors do not believe these
amounts will have a material adverse financial impact on them or materially
affect their ability to perform under their investment management agreements
with the DWS funds. The above-described amounts are not material to Deutsche
Bank, and have already been reserved.
Among the terms of the settled orders, DeAM is subject to certain undertakings
regarding the conduct of its business in the future, including formation of a
Code of Ethics Oversight Committee to oversee all matters relating to issues
arising under the advisors' Code of Ethics; establishment of an Internal
Compliance Controls Committee having overall compliance oversight responsibility
of the advisors; engagement of an Independent Compliance Consultant to conduct a
comprehensive review of the advisors' supervisory compliance and other policies
and procedures designed to prevent and detect breaches of fiduciary duty,
breaches of the Code of Ethics and federal securities law violations by the
advisors and their employees; and commencing in 2008, the advisors shall undergo
a compliance review by an independent third party.
In addition, DeAM is subject to certain further undertakings relating to the
governance of the mutual funds, including that at least 75% of the members of
the Boards of Trustees/Directors overseeing the DWS Funds continue to be
independent of DeAM; the Chairmen of the DWS Funds' Boards of Trustees/Directors
continue to be independent of DeAM; DeAM maintain existing management fee
reductions for certain funds for a period of five years and not increase
management fees for these certain funds during this period; the funds retain a
senior officer (or independent consultants, as applicable) responsible for
assisting in the review of fee arrangements and monitoring compliance by the
funds and the investment advisors with securities laws, fiduciary duties, codes
of ethics and other compliance policies, the expense of which shall be borne by
DeAM; and periodic account statements, fund prospectuses and the mutual funds'
web site contain additional disclosure and/or tools that assist investors in
understanding the fees and costs associated with an investment in the funds and
the impact of fees and expenses on fund returns.
DeAM has also settled proceedings with the Illinois Secretary of State regarding
market timing matters. The terms of the Illinois settlement provide for investor
education contributions totaling approximately $4 million and a payment in the
amount of $2 million to the Securities Audit and Enforcement Fund.
On September 28, 2006, the SEC and the National Association of Securities
Dealers ("NASD") (now known as FINRA) announced final agreements in which
Deutsche Investment Management Americas Inc. ("DIMA"), Deutsche Asset
Management, Inc. ("DAMI") and Scudder Distributors, Inc. ("DWS-SDI") (now known
as DWS Scudder Distributors, Inc.) settled administrative proceedings regarding
disclosure of brokerage allocation practices in connection with sales of the
Scudder Funds' (now known as the DWS Scudder Funds) shares during 2001-2003. The
agreements with the SEC and NASD are reflected in orders which state, among
other things, that DIMA and DAMI failed to disclose potential conflicts of
interest to the funds' Boards and to shareholders relating to DWS-SDI's use of
certain funds' brokerage commissions to reduce revenue sharing costs to
broker-dealer firms with whom it had arrangements to market and distribute
Scudder Fund shares. These directed brokerage practices were discontinued in
October 2003.
Under the terms of the settlements, in which DIMA, DAMI and DWS-SDI neither
admitted nor denied any of the regulators' findings, DIMA, DAMI and DWS-SDI
agreed to pay disgorgement, prejudgment interest and civil penalties in the
total amount of $19.3 million. The portion of the settlements distributed to the
funds was approximately $17.8 million and was paid to the funds as prescribed by
the settlement orders based upon the amount of brokerage commissions from each
fund used to satisfy revenue sharing agreements with broker-dealers who sold
fund shares.
As part of the settlements, DIMA, DAMI and DWS-SDI also agreed to implement
certain measures and undertakings relating to revenue sharing payments including
making additional disclosures in the funds' Prospectuses or Statements of
Additional Information, adopting or modifying relevant policies and procedures
and providing regular reporting to the fund Boards.
Additional information announced by DeAM regarding the terms of the settlements
is available at www.dws-scudder.com/regulatory_settlements.
The matters alleged in the regulatory settlements described above also serve as
the general basis of a number of private class action lawsuits involving the DWS
funds. These lawsuits name as defendants various persons, including certain DWS
funds, the funds' investment advisors and their affiliates, and certain
individuals, including in some cases fund Trustees/Directors, officers, and
other parties. Each DWS fund's investment advisor has agreed to indemnify the
applicable DWS funds in connection with these lawsuits, or other lawsuits or
regulatory actions that may be filed making similar allegations.
Based on currently available information, the funds' investment advisors believe
the likelihood that the pending lawsuits will have a material adverse financial
impact on a DWS fund is remote and such actions are not likely to materially
affect their ability to perform under their investment management agreements
with the DWS funds.
PORTFOLIO TRANSACTIONS
The Advisor is generally responsible for placing the orders for the purchase and
sale of portfolio securities, including the allocation of brokerage. With
respect to those funds for which a sub-investment advisor manages the fund's
investments, references in this section to the "Advisor" should be read to mean
the Sub-Advisor, except as noted below.
The policy of the Advisor in placing orders for the purchase and sale of
securities for the Funds is to seek best execution, taking into account such
factors, among others, as price; commission (where applicable); the
broker-dealer's ability to ensure that securities will be delivered on
settlement date; the willingness of the broker-dealer to commit its capital and
purchase a thinly traded security for its own inventory; whether the
broker-dealer specializes in block orders or large program trades; the
broker-dealer's knowledge of the market and the security; the broker-dealer's
ability to maintain confidentiality; the broker-dealer's ability to provide
access to new issues; the broker-dealer's ability to provide support when
placing a difficult trade; the financial condition of the broker-dealer; and
whether the broker-dealer has the infrastructure and operational capabilities to
execute and settle the trade. The Advisor seeks to evaluate the overall
reasonableness of brokerage commissions with commissions charged on comparable
transactions and compares the brokerage commissions (if any) paid by the Funds
to reported commissions paid by others. The Advisor routinely reviews commission
rates, execution and settlement services performed and makes internal and
external comparisons.
Commission rates on transactions in equity securities on US securities exchanges
are subject to negotiation. Commission rates on transactions in equity
securities on foreign securities exchanges are generally fixed. Purchases and
sales of fixed-income securities and certain over-the-counter securities are
effected on a net basis, without the payment of brokerage commissions.
Transactions in fixed income and certain over-the-counter securities are
generally placed by the Advisor with the principal market makers for these
securities unless the Advisor reasonably believes more favorable results are
available elsewhere. Transactions with dealers serving as market makers reflect
the spread between the bid and asked prices. Purchases of underwritten issues
will include an underwriting fee paid to the underwriter. Money market
instruments are normally purchased in principal transactions directly from the
issuer or from an underwriter or market maker.
It is likely that the broker-dealers selected based on the considerations
described in this section will include firms that also sell shares of the Funds
to their customers. However, the Advisor does not consider sales of shares of
the Funds as a factor in the selection of broker-dealers to execute portfolio
transactions for the Funds and, accordingly, has implemented policies and
procedures reasonably designed to prevent its traders from considering sales of
shares of the Funds as a factor in the selection of broker-dealers to execute
portfolio transactions for the Funds.
The Advisor is permitted by Section 28(e) of the Securities Exchange Act of
1934, as amended ("1934 Act"), when placing portfolio transactions for a Fund,
to cause the Fund to pay brokerage commissions in excess of that which another
broker-dealer might charge for executing the same transaction in order to obtain
research and brokerage services if the Advisor determines that such commissions
are reasonable in relation to the overall services provided. The Advisor may
from time to time, in reliance on Section 28(e) of the 1934 Act, execute
portfolio transactions with broker-dealers that provide research and brokerage
services to the Advisor. Consistent with the Advisor's policy regarding best
execution, where more than one broker is believed to be capable of providing
best execution for a particular trade, the Advisor may take into consideration
the receipt of research and brokerage services in selecting the broker-dealer to
execute the trade. Although certain research and brokerage services from
broker-dealers may be useful to a Fund and to the Advisor, it is the opinion of
the Advisor that such information only supplements its own research effort since
the information must still be analyzed, weighed and reviewed by the Advisor's
staff. To the extent that research and brokerage services of value are received
by the Advisor, the Advisor may avoid expenses that it might otherwise incur.
Research and brokerage services received from a broker-dealer may be useful to
the Advisor and its affiliates in providing investment management services to
all or some of its clients, which includes a Fund. Services received from
broker-dealers that executed securities transactions for a Portfolio will not
necessarily be used by the Advisor specifically to service such Fund.
Research and brokerage services provided by broker-dealers may include, but are
not limited to, information on the economy, industries, groups of securities,
individual companies, statistical information, accounting and tax law
interpretations, political developments, legal developments affecting portfolio
securities, technical market action, pricing and appraisal services, credit
analysis, risk measurement analysis, performance analysis and measurement and
analysis of corporate responsibility issues. Research and brokerage services are
typically received in the form of written or electronic reports, access to
specialized financial publications, telephone contacts and personal meetings
with security analysts, but may also be provided in the form of access to
various computer software and meetings arranged with corporate and industry
representatives.
The Advisor may also select broker-dealers and obtain from them research and
brokerage services that are used in connection with executing trades provided
that such services are consistent with interpretations under Section 28(e) of
the 1934 Act. Typically, these services take the form of computer software
and/or electronic communication services used by the Advisor to facilitate
trading activity with those broker-dealers.
Research and brokerage services may include products obtained from third parties
if the Advisor determines that such product or service constitutes brokerage and
research as defined in Section 28(e) and interpretations thereunder. Currently,
it is the Advisor's policy that Sub-Advisors may not execute portfolio
transactions on behalf of the Funds to obtain third party research and brokerage
services. The Advisor may, in the future, change this policy. Regardless,
certain Sub-Advisors may, as matter of internal policy, limit or preclude third
party research and brokerage services.
The Advisor may use brokerage commissions to obtain certain brokerage products
or services that have a mixed use (i.e., it also serves a function that does not
relate to the investment decision-making process). In those circumstances, the
Advisor will make a good faith judgment to evaluate the various benefits and
uses to which it intends to put the mixed use product or service and will pay
for that portion of the mixed use product or service that it reasonably believes
does not constitute research and brokerage services with its own resources.
DIMA will monitor regulatory developments and market practice in the use of
client commissions to obtain research and brokerage services and may adjust its
portfolio transactions policies in response thereto.
Investment decisions for each Fund and for other investment accounts managed by
the Advisor are made independently of each other in light of differing
conditions. However, the same investment decision may be made for two or more of
such accounts. In such cases, simultaneous transactions are inevitable. To the
extent permitted by law, the Advisor may aggregate the securities to be sold or
purchased for a Fund with those to be sold or purchased for other accounts in
executing transactions. Purchases or sales are then averaged as to price and
commission and allocated as to amount in a manner deemed equitable to each
account. While in some cases this practice could have a detrimental effect on
the price paid or received by, or on the size of the position obtained or
disposed of for, the Fund, in other cases it is believed that the ability to
engage in volume transactions will be beneficial to the Fund.
DIMA and its affiliates and the Funds' management team manage other mutual funds
and separate accounts, some of which use short sales of securities as a part of
its investment strategy. The simultaneous management of long and short
portfolios creates potential conflicts of interest including the risk that short
sale activity could adversely affect the market value of the long positions (and
vice versa), the risk arising from sequential orders in long and short
positions, and the risks associated with receiving opposing orders at the same
time.
DIMA has adopted procedures that it believes are reasonably designed to mitigate
these potential conflicts of interest. Incorporated in the procedures are
specific guidelines developed to ensure fair and equitable treatment for all
clients. DIMA and the investment team have established monitoring procedures and
a protocol for supervisory reviews, as well as compliance oversight to ensure
that potential conflicts of interest relating to this type of activity are
properly addressed.
Deutsche Bank AG or one of its affiliates (or in the case of a Sub-Advisor, the
Sub-Advisor or one of its affiliates) may act as a broker for the Funds and
receive brokerage commissions or other transaction-related compensation from the
Funds in the purchase and sale of securities, options or futures contracts when,
in the judgment of the Advisor, and in accordance with procedures approved by
the Funds' Boards, the affiliated broker will be able to obtain a price and
execution at least as favorable as those obtained from other qualified brokers
and if, in the transaction, the affiliated broker charges the Funds a rate
consistent with that charged to comparable unaffiliated customers in similar
transactions.
DWS Bond VIP: The Portfolio is required to identify any securities of its
"regular brokers or dealers" (as such term is defined in the 1940 Act) that the
Portfolio has acquired during the most recent fiscal year. As of December 31,
2007, the Portfolio held the following securities of its regular brokers or
dealers:
Value of Securities Owned as of
December 31, 2007
Name of Regular Broker or Dealer or Parent (Issuer) (in thousands)
--------------------------------------------------- --------------
Wachovia Capital Trust $6,856
Merrill Lynch & Co., Inc. $2,007
ICICI Bank Ltd. $534
AES El Salvador Trust $471
Arch Western Finance $125
DWS Growth & Income VIP: The Portfolio is required to identify any securities of
its "regular brokers or dealers" (as such term is defined in the 1940 Act) that
the Portfolio has acquired during the most recent fiscal year. As of December
31, 2006, the Portfolio held the following securities of its regular brokers or
dealers:
Value of Securities Owned as of
December 31, 2007
Name of Regular Broker or Dealer or Parent (Issuer) (in thousands)
--------------------------------------------------- --------------
The Goldman Sachs Group, Inc. $4,702
Morgan Stanley $4,038
JPMorgan Chase & Co. $2,667
Citigroup $2,182
PNC Financial Services Group $978
Jones Lang LaSalle Inc. $334
US Bancorp $282
Dun & Bradstreet $222
Lazard Ltd. $65
DWS Capital Growth VIP: The Portfolio is required to identify any securities of
its "regular brokers or dealers" (as such term is defined in the 1940 Act) that
the Portfolio has acquired during the most recent fiscal year. As of December
31, 2007, the Portfolio held the following securities of its regular brokers or
dealers:
Value of Securities Owned as of
December 31, 2007
Name of Regular Broker or Dealer or Parent (Issuer) (in thousands)
--------------------------------------------------- --------------
State Street Corp. $13,850
Lehman Brothers Holdings, Inc. $13,271
DWS Global Opportunities VIP: The Portfolio is required to identify any
securities of its "regular brokers or dealers" (as such term is defined in the
1940 Act) that the Portfolio has acquired during the most recent fiscal year. As
of December 31, 2007, the Portfolio held the following securities of its regular
brokers or dealers:
Value of Securities Owned as of
December 31, 2007
Name of Regular Broker or Dealer or Parent (Issuer) (in thousands)
--------------------------------------------------- --------------
Piraeus Bank S.A. $8,113
Wing Hang Bank Ltd. $5,531
Babcock & Brown, Ltd. $4,669
Anglo Irish Bank Corp., Plc $4,460
Hellenic Exchanges Holding SA $3,543
Ashmore Group PLC $3,222
Hypo Real Estate Hldgs $2,660
Partners Group AG $2,465
Yuanta Core Pacific Securities Co. $1,819
Matsui Securities Co., Ltd. $1,284
Jafco Co. Ltd. $717
DWS International VIP: The Portfolio is required to identify any securities of
its "regular brokers or dealers" (as such term is defined in the 1940 Act) that
the Portfolio has acquired during the most recent fiscal year. As of December
31, 2007, the Portfolio held the following securities of its regular brokers or
dealers:
Value of Securities Owned as of
December 31, 2007
Name of Regular Broker or Dealer or Parent (Issuer) (in thousands)
--------------------------------------------------- --------------
Unicredito Italiano SpA $13,723
3I Group PLC $11,514
National Bank of Greece $9,403
Prudential PLC $8,497
Erste Bank Der Oesterreichischen Sparkassen $7,303
KBC Groupe $6,522
Bancolombia SA $5,498
Mitsubishi UFJ Financial Group $4,608
Julius Baer Holdings AG-B $3,843
DWS Health Care VIP: The Portfolio is required to identify any securities of its
"regular brokers or dealers" (as such term is defined in the 1940 Act) that the
Portfolio has acquired during the most recent fiscal year. As of December 31,
2007, the Portfolio did not hold any securities of its regular brokers or
dealers.
The table below shows total brokerage commissions paid by each Portfolio for the
fiscal year ended December 31, 2007, as applicable.
Portfolio Fiscal 2007
--------- -----------
DWS Bond VIP $0
DWS Growth & Income VIP $466,993
DWS Capital Growth VIP $653,613
DWS Global Opportunities VIP $241,604
DWS International VIP $2,492,858
DWS Health Care VIP $92,122
In addition, for the fiscal year ended December 31, 2007:
Percentage of
Percentage of Transactions Dollar Amount of
Commissions Involving Commissions Paid
Paid to Affiliated Commissions Paid to to Brokers for
Portfolio Brokers Affiliated Brokers Research Services
--------- ------- ------------------ -----------------
DWS Bond VIP 0% 0% $0
DWS Growth & Income VIP 0% 0% $0
DWS Capital Growth VIP 0% 0% $0
DWS Global Opportunities VIP 0% 0% $0
DWS International VIP 0% 0% $0
DWS Health Care VIP 0% 0% $0
Portfolio Turnover
Portfolio turnover rate is defined by the SEC as the ratio of the lesser of
sales or purchases to the monthly average value of securities owned during the
year, excluding all securities whose remaining maturities at the time of
acquisition were one year or less. Higher levels of activity by a Portfolio
result in higher transaction costs and may also result in taxes on realized
capital gains to be borne by a Portfolio's shareholders. Purchases and sales are
made whenever necessary, in the Advisor's discretion, to meet a Portfolio's
objective.
Portfolio turnover rates for the two most recent fiscal periods are as follows:
12/31/06 12/31/07
-------- --------
DWS Bond VIP 179% 176%
DWS Growth & Income VIP 105% 310%
DWS Capital Growth VIP 16% 30%
DWS Global Opportunities VIP 28% 19%
DWS International VIP 105% 108%
DWS Health Care VIP 47% 37%
PURCHASES AND REDEMPTIONS
The separate accounts of the Participating Insurance Companies purchase and
redeem shares of each Portfolio based on, among other things, the amount of
premium payments to be invested and surrender and transfer requests to be
effected on that day pursuant to variable annuity contracts and variable life
insurance policies, but only on days on which the Exchange is open for trading.
Such purchases and redemptions of the shares of each Portfolio are effected at
their respective net asset values per share, determined as of the close of
regular trading on the Exchange (normally 4 p.m. Eastern time) on that same day
.. (See "NET ASSET VALUE.") Payment for redemptions will be made by State Street
Bank and Trust Company or Brown Brothers Harriman & Co., as applicable, on
behalf of the Fund and the applicable Portfolios within seven days thereafter.
No fee is charged the separate accounts of the Participating Insurance Companies
when they redeem Fund shares.
The Fund may, on behalf of a Portfolio, may suspend or postpone redemptions as
permitted pursuant to Section 22(e) of the Investment Company Act of 1940.
Generally, those circumstances are when: 1) the New York Stock Exchange is
closed other than customary weekend or holiday closings; 2) trading on the New
York Stock Exchange is restricted; 3) an emergency exists which makes the
disposal of securities owned by a fund or the fair determination of the value of
a fund's net assets not reasonably practicable; or 4) the SEC, by order, permits
the suspension of the right of redemption. Redemption payments by wire may also
be delayed in the event of a non-routine closure of the Federal Reserve wire
payment system.
Revenue Sharing
In light of recent regulatory developments, the Advisor, the Distributor and
their affiliates have undertaken to furnish certain additional information below
regarding the level of payments made by them to selected affiliated and
unaffiliated brokers, dealers, participating insurance companies or other
financial intermediaries ("financial advisors") in connection with the sale
and/or distribution of Portfolio shares or the retention and/or servicing of
investors and Portfolio shares ("revenue sharing").
The Advisor, the Distributor and/or their affiliates may pay additional
compensation, out of their own assets and not as an additional charge to each
Portfolio, to financial advisors in connection with the sale and/or distribution
of Portfolio shares or the retention and/or servicing of Portfolio investors and
Portfolio shares. Such revenue sharing payments are in addition to any
distribution or service fees payable under any Rule 12b-1 or service plan of any
portfolio, any record keeping/sub-transfer agency/networking fees payable by
each Portfolio (generally through the Distributor or an affiliate) and/or the
Distributor to certain financial advisors for performing such services and any
sales charges, commissions, non-cash compensation arrangements expressly
permitted under applicable rules of FINRA or other concessions described in the
fee table or elsewhere in the Prospectuses or the SAI as payable to all
financial advisors. For example, the Advisor, the Distributor and/or their
affiliates may compensate financial advisors for providing each Portfolio with
"shelf space" or access to a third party platform or portfolio offering list, or
other marketing programs including, without limitation, inclusion of each
Portfolio on preferred or recommended sales lists, mutual fund "supermarket"
platforms and other formal sales programs; granting the Distributor access to
the financial advisor's sales force; granting the Distributor access to the
financial advisor's conferences and meetings; assistance in training and
educating the financial advisor's personnel; and, obtaining other forms of
marketing support. The level of revenue sharing payments made to financial
advisors may be a fixed fee or based upon one or more of the following factors:
gross sales, current assets and/or number of accounts of each Portfolio
attributable to the financial advisor, the particular portfolio or portfolio
type or other measures as agreed to by the Advisor, the Distributor and/or their
affiliates and the financial advisors or any combination thereof. The amount of
these payments is determined at the discretion of the Advisor, the Distributor
and/or their affiliates from time to time, may be substantial, and may be
different for different financial advisors based on, for example, the nature of
the services provided by the financial advisor.
The Advisor, the Distributor and/or their affiliates currently make revenue
sharing payments from their own assets in connection with the sale and/or
distribution of DWS Fund shares, or the retention and/or servicing of investors,
to financial advisors in amounts that generally range from .01% up to .50% of
assets of the Portfolio serviced and maintained by the financial advisor, .10%
to .25% of sales of the Portfolio attributable to the financial advisor, a flat
fee of $13,350 up to $500,000, or any combination thereof. These amounts are
annual figures typically paid on a quarterly basis and are subject to change at
the discretion of the Advisor, the Distributor and/or their affiliates. Receipt
of, or the prospect of receiving, this additional compensation, may influence
your financial advisor's recommendation of this Portfolio or of any particular
share class of the Portfolio. You should review your financial advisor's
compensation disclosure and/or talk to your financial advisor to obtain more
information on how this compensation may have influenced your financial
advisor's recommendation of this Portfolio.
The Advisor, the Distributor and/or their affiliates may also make such revenue
sharing payments to financial advisors under the terms discussed above in
connection with the distribution of both DWS funds and non-DWS funds by
financial advisors to retirement plans that obtain record keeping services from
ADP, Inc. on the DWS Scudder branded retirement plan platform (the "Platform")
with the level of revenue sharing payments being based upon sales of both the
DWS funds and the non-DWS funds by the financial advisor on the Platform or
current assets of both the DWS funds and the non-DWS funds serviced and
maintained by the financial advisor on the Platform.
As of the date hereof, each Portfolio has been advised that the Advisor, the
Distributor and their affiliates expect that the following firms will receive
revenue sharing payments at different points during the coming year as described
above:
Channel: Broker-Dealers and Financial Advisors
AIG Advisors Group
Ameriprise
Cadaret, Grant & Co. Inc.
Capital Analyst, Incorporated
Citigroup Global Markets, Inc. (dba Smith Barney)
Commonwealth Equity Services, LLP (dba Commonwealth Financial Network)
Deutsche Bank Group
First Clearing/Wachovia Securities
Fiserv Trust Company
HD Vest Investment Securities, Inc.
ING Group
John Hancock Distributors LLC
LPL Financial
M.L. Stern & Co.
Marsh Insurance and Investment Company
Meridien Financial Group
Merrill Lynch, Pierce, Fenner & Smith Inc.
Morgan Stanley
Oppenheimer & Co., Inc.
Raymond James & Associates
Raymond James Financial Services
RBC Dain Rauscher, Inc
Securities America, Inc.
UBS Financial Services
Wachovia Securities
Wells Fargo Investments, LLC
Channel: Cash Product Platform
Allegheny Investments LTD
Bank of New York (Hare & Co.)
Bear, Stearns Securities Corp.
Brown Brothers Harriman
Brown Investment Advisory & Trust Company
Cadaret Grant & Co.
Chicago Mercantile Exchange
D.A. Davidson & Company
Deutsche Bank Group
Emmett A. Larkin Company
Fiduciary Trust Co. - International
First Southwest Company
Huntleigh Securities
Lincoln Investment Planning
LPL Financial
Mellon Financial Markets LLC
Penson Financial Services
Pershing Choice Platform
ProFunds Distributors, Inc.
Ridge Clearing & Outsourcing Solutions
Romano Brothers and Company
SAMCO Capital Markets
Smith Moore & Company
Sungard Institutional Brokerage Inc.
US Bancorp
UBS
William Blair & Company
Channel: Third Party Insurance Platforms
Allstate Life Insurance Company of New York
Ameritas Life Insurance Group
Annuity Investors Life Insurance Company
Columbus Life Insurance Company
Commonwealth Annuity and Life Insurance Company
Companion Life Insurance Company
Connecticut General Life Insurance Company
Farmers New World Life Insurance Company
Fidelity Security Life Insurance Company
First Allmerica Financial Life Insurance Company
First Great West Life and Annuity Company
Genworth Life Insurance Company of New York
Genworth Life and Annuity Insurance Company
Great West Life and Annuity Insurance Company
Hartford Life Insurance Company
Integrity Life Insurance Company
John Hancock Life Insurance companies
Kemper Investors Life Insurance Company
Lincoln Benefit Life Insurance Company
Lincoln Life & Annuity Company of New York
Lincoln National Life Insurance Company
Massachusetts Mutual Life Insurance Group
MetLife Group
Minnesota Life Insurance Company
National Life Insurance Company
National Integrity Life Insurance Company
Nationwide Group
New York Life Insurance and Annuity Corporation
Phoenix Life Insurance Company
Protective Life Insurance
Provident Mutual Life Insurance
Prudential Insurance Company of America
Sun Life Group
Symetra Life Insurance Company
Transamerica Life Insurance Company
Union Central Life Insurance Company
United of Omaha Life Insurance Company
United Investors Life Insurance Company
Western Southern Life Assurance Company
Any additions, modifications or deletions to the financial advisors identified
above that have occurred since the date hereof are not reflected.
The Advisor, the Distributor or their affiliates may enter into additional
revenue sharing arrangements or change or discontinue existing arrangements with
financial advisors at any time without notice.
The prospect of receiving, or the receipt of additional compensation or
promotional incentives described above by financial advisors may provide such
financial advisors and/or their salespersons with an incentive to favor sales of
shares of the DWS funds or a particular DWS fund over sales of shares of mutual
funds (or non-mutual fund investments) with respect to which the financial
advisor does not receive additional compensation or promotional incentives, or
receives lower levels of additional compensation or promotional incentives.
Similarly, financial advisors may receive different compensation or incentives
that may influence their recommendation of any particular share class of the
Portfolio or of other portfolios. These payment arrangements, however, will not
change the price that an investor pays for Portfolio shares or the amount that
the Portfolio receives to invest on behalf of an investor and will not increase
Portfolio expenses. You may wish to take such payment arrangements into account
when considering and evaluating any recommendations relating to Portfolio shares
and you should discuss this matter with your financial advisor and review your
financial advisor's disclosures.
It is likely that broker-dealers that execute portfolio transactions for the
Portfolio will include firms that also sell shares of the DWS funds to their
customers. However, the Advisor will not consider sales of DWS fund shares as a
factor in the selection of broker-dealers to execute portfolio transactions for
the DWS funds. Accordingly, the Advisor has implemented policies and procedures
reasonably designed to prevent its traders from considering sales of DWS fund
shares as a factor in the selection of broker-dealers to execute portfolio
transactions for the Portfolio. In addition, the Advisor, the Distributor and/or
their affiliates will not use fund brokerage to pay for their obligation to
provide additional compensation to financial advisors as described above.
DIVIDENDS, CAPITAL GAINS AND TAXES
Set forth below is a discussion of certain US federal income tax consequences
relating to the ownership of shares in the Portfolios by life insurance
companies for the purpose of funding variable life insurance policies. This
discussion does not purport to be complete or to deal with all aspects of
federal income taxation. It deals only with the status of the Portfolios as
regulated investment companies ("RICs") under subchapter M of the Internal
Revenue Code of 1986, as amended (the "Code") and the application of the
diversification rules of Section 817(h) of the Code. This discussion is based
upon the present provisions of the Code, the regulations promulgated thereunder,
and judicial and administrative ruling authorities, all of which are subject to
change, which change may be retroactive.
The discussion below is generally based on the assumption that the shares of
each Portfolio will be respected as owned by insurance company separate
accounts. If this is not the case, the person or persons determined to own the
Portfolios' shares will be currently taxed on the Portfolios' distributions, and
on the proceeds of any redemption of the Portfolios' shares, under the Code
rules. For information concerning the federal tax consequences to a holder of a
variable contract, refer to the prospectus for the particular contract. Because
insurance companies (and certain other investors) will be the only shareholders
of a Portfolio, no attempt is made here to particularly describe the tax aspects
of an investment in such a Portfolio.
Taxation of the Portfolios
Each Portfolio of the Fund has elected to be treated as a RIC under subchapter M
of the Code. In order to qualify for the special tax treatment accorded RICs and
their shareholders, each Portfolio must, among other things,
(a) derive at least 90% of its gross income for each taxable year from (i)
dividends, interest, payments with respect to certain securities loans, and
gains from the sale or other disposition of stock, securities or foreign
currencies, or other income (including but not limited to gains from options,
futures, or forward contracts) derived with respect to its business of investing
in such stock, securities, or currencies; and (ii) net income derived from
interests in "qualified publicly traded partnerships" (as defined below);
(b) diversify its holdings so that, at the end of each quarter of its taxable
year, (i) at least 50% of the market value of the Portfolio's total assets
consists of cash and cash items, US government securities, securities of other
RICs, and other securities limited in respect of any one issuer to a value not
greater than 5% of the value of the Portfolio's total assets and not more than
10% of the outstanding voting securities of such issuer, and (ii) not more than
25% of the value of its total assets is invested (x) in the securities (other
than those of the US Government or other RICs) of any one issuer or of two or
more issuers which the Portfolio controls and which are engaged in the same,
similar, or related trades or businesses; or (y) in the securities of one or
more qualified publicly traded partnerships (as defined below); and
(c) distribute with respect to each taxable year at least 90% of the sum of its
investment company taxable income (as the term is defined in the Code without
regard to the deduction for dividends paid -- generally taxable ordinary income
and the excess, if any, of net short-term capital gains over net long-term
capital losses) and net tax-exempt interest income, for such year.
In general, for purposes of the 90% gross income requirement described in
paragraph (a) above, income derived from a partnership will be treated as
qualifying income only to the extent such income is attributable to items of
income of the partnership which would be qualifying income if realized by the
RIC. However, 100% of the net income derived from an interest in a "qualified
publicly traded partnership" (defined as a partnership (x) interests in which
are traded on established securities market or readily tradable on a secondary
market or the substantial equivalent thereof, (y) that derives at least 90% of
its income from the passive income sources defined in Code section 7704(d), and
(z) that derives less than 90% of its income from the qualifying income
described in paragraph (a)(i) above) will be treated as qualifying income. In
addition, although in general the passive loss rules of the Code do not apply to
RICs, such rules do apply to a regulated investment company with respect to
items attributable to an interest in a qualified publicly traded partnership.
For purposes of meeting the diversification requirement described in (b) above,
in the case of a Portfolio's investment in loan participations, the Portfolio
shall treat both the financial intermediary and the issuer of the underlying
loan as an issuer. Also, for purposes of (b) above, the term "outstanding voting
securities of such issuer" will include the equity securities of a qualified
publicly traded partnership.
If a Portfolio qualifies as a regulated investment company that is accorded
special tax treatment, the Portfolio will not be subject to federal income tax
on income distributed in a timely manner to its shareholders in the form of
dividends (including net capital gains from the sale of investments that the
Fund owned for more than one year and that are properly designated by the Fund
as capital gain dividends).
If a Portfolio were to fail to qualify for treatment as a RIC for any taxable
year, (1) it would be taxed as an ordinary corporation on its taxable income for
that year without being able to deduct the distributions it makes to its
shareholders, and (2) each insurance company separate account invested in the
Portfolio would fail to satisfy the diversification requirements described
above, with the result that the contracts supported by that account would no
longer be eligible for tax deferral. All distributions from earnings and
profits, including any distributions of net tax-exempt income and net long-term
capital gains, would be taxable to shareholders as ordinary income. In addition,
the Portfolio could be required to recognize unrealized gains, pay substantial
taxes and interest and make substantial distributions before requalifying for
treatment as a RIC.
Tax Effects of Certain Transactions
A Portfolio's investment in securities issued at a discount and certain other
obligations will (and investments in securities purchased at a discount may)
require the Portfolio to accrue and distribute income not yet received. In order
to generate sufficient cash to make the requisite distributions, the Portfolio
may be required to sell securities in its portfolio that it otherwise would have
continued to hold.
Some of the Portfolios may invest directly or indirectly in residual interests
in real estate mortgage conduits ("REMICs") or taxable mortgage pools ("TMPs").
Under a notice recently issued by the IRS and Treasury regulations that have yet
to be issued but may apply retroactively, a portion of a Portfolio's income
(including income allocated to a Portfolio from a REIT or other pass-through
entity) that is attributable to a residual interest in a REMIC or a TMP
(referred to in the Code as an "excess inclusion") will be subject to federal
income tax in all events. This notice also provides, and the regulations are
expected to provide, that excess inclusion income of a RIC will be allocated to
shareholders of the RIC in proportion to the dividends received by such
shareholders, with the same consequences as if the shareholders held the related
residual interest directly. As a result, a life insurance company separate
account funding a variable contract may be taxed currently to the extent of its
share of a Portfolio's excess inclusion income, as described below.
In general, excess inclusion income allocated to shareholders (i) cannot be
offset by net operating losses (subject to a limited exception for certain
thrift institutions), (ii) will constitute unrelated business taxable income
("UBTI") to entities (including a qualified pension plan, an individual
retirement account, a 401(k) plan, a Keogh plan or other tax-exempt entity)
subject to tax on UBTI, thereby potentially requiring such an entity that is
allocated excess inclusion income, and otherwise might not be required to file a
tax return, to file a tax return and pay tax on such income, (iii) in the case
of a non-U.S. shareholder, will not qualify for any reduction in U.S. federal
withholding tax, and (iv) in the case of a life insurance company separate
account funding a variable contract, cannot be offset by an adjustment to the
reserves and thus is not eligible for tax deferral.
Variable Contracts
Each Portfolio also intends to comply with the separate diversification
requirements imposed by Section 817(h) of the Code and the regulations
thereunder on certain insurance company separate accounts. These requirements,
which are in addition to the diversification requirements imposed on the
Portfolios by the 1940 Act and Subchapter M of the Code, place certain
limitations on assets of each insurance company separate account used to fund
variable contracts. Because Section 817(h) and those regulations treat the
assets of a Portfolio as assets of the related separate account, these
regulations are imposed on the assets of a Portfolio. Specifically, the
regulations provide that, after a one year start-up period or, except as
permitted by the "safe harbor" described below, as of the end of each calendar
quarter or within 30 days thereafter no more than 55% of the total assets of the
Portfolio may be represented by any one investment, no more than 70% by any two
investments, no more than 80% by any three investments, and no more than 90% by
any four investments. For this purpose, all securities of the same issuer are
considered a single investment, and each US Government agency and
instrumentality is considered a separate issuer. Section 817(h) provides, as a
safe harbor, that a separate account will be treated as being adequately
diversified if the diversification requirements under Subchapter M are satisfied
and no more than 55% of the value of the account's total assets is attributable
to cash and cash items (including receivables), US Government securities and
securities of other regulated investment companies. Failure by a Portfolio to
satisfy the Section 817(h) requirements would generally cause the variable
contracts to lose their favorable tax status and require a contract holder to
include in ordinary income any income accrued under the contracts for the
current and all prior taxable years. Under certain circumstances described in
the applicable Treasury regulations, inadvertent failure to satisfy the
applicable diversification requirements may be corrected, but such a correction
would require a payment to the Internal Revenue Service ("IRS") based on the tax
contract holders would have incurred if they were treated as receiving the
income on the contract for the period during which the diversification
requirements were not satisfied. Any such failure may also result in adverse tax
consequences for the insurance company issuing the contracts.
The IRS has indicated that a degree of investor control over the investment
options underlying variable contracts may interfere with the tax-deferred
treatment described above. The Treasury Department has issued rulings addressing
the circumstances in which a variable contract owner's control of the
investments of the separate account may cause the contract owner, rather than
the insurance company, to be treated as the owner of the assets held by the
separate account, and is likely to issue additional rulings in the future. If
the contract owner is considered the owner of the securities underlying the
separate account, income and gains produced by those securities would be
included currently in the contract owner's gross income. A contract holder's
control of the investments of the separate accounts in this case is similar to,
but different in certain respects from, those described by the IRS in rulings.
The Portfolios have objectives and strategies that are not materially narrower
in focus than the investment strategies described in more recent IRS rulings in
which strategies, such as large company stocks, international stocks, small
company stocks, mortgage-based securities, telecommunications stocks and
financial services stocks, were held not to constitute sufficient control over
individual investment decisions so as to cause ownership of such investments to
be attributable to contract owners. The Regulations proposed by the Treasury
Department in the summer of 2004 relating to Section 817(h) and current
published IRS guidance do not directly speak to the strategies such as those
reflected in the Portfolios, described above. However, the IRS and the Treasury
Department may in the future provide further guidance as to what it deems to
constitute an impermissible level of "investor control" over a separate
account's investments in funds such as the Portfolios, and such guidance could
affect the treatment of the Portfolios described herein, including
retroactively.
In the event that additional rules or regulations are adopted, there can be no
assurance that a Portfolio will be able to operate as currently described, or
that such Portfolio will not have to change its investment objective or
investment policies. A Portfolio's investment objective and investment policies
may be modified as necessary to prevent any such prospective rules and
regulations from causing variable contract owners to be considered the owners of
the shares of the Portfolio.
Other Taxation
Under Treasury Regulations, if a shareholder recognizes a loss on a disposition
of a Fund's shares of $2 million or more for an individual shareholder or $10
million or more for a corporate shareholder (including, for example, an
insurance company holding separate account), the shareholder must file with the
IRS a disclosure statement on Form 8886. Direct shareholders of portfolio
securities are in many cases excepted from this reporting, requirement, but
under current guidance, shareholders of a regulated investment company are not
excepted. This filing requirement applies even though, as a practical matter,
any such loss would not, for example, reduce the taxable income of an insurance
company. Future guidance may extend the current exception from this reporting
requirement to shareholders of most or all regulated investment companies.
Investment by a Portfolio in "passive foreign investment companies" ("PFICs")
could subject the Portfolio to US federal income tax (including interest
charges) on distributions received from the company or on proceeds received from
the disposition of shares in the company, which tax cannot be eliminated by
making distributions to Portfolio shareholders. However, a Portfolio also may
make an election to mark the gains (and to a limited extent the losses) in such
holdings "to the market" as though it had sold and repurchased its holdings in
those PFICs on the last day of the Portfolio's taxable year. Such gains and
losses are treated as ordinary income and loss. A Portfolio may also elect to
treat a PFIC as a "qualified electing fund" ("QEF election"), in which case the
Portfolio will be required to include its share of the company's income and net
capital gains annually, regardless of whether it receives any distribution from
the company. The QEF and mark-to-market elections may accelerate the recognition
of income (without the receipt of cash) and increase the amount required to be
distributed for the Portfolio to avoid taxation. Making either of these
elections therefore may require a Portfolio to liquidate other investments
(including when it is not advantageous to do so) to meet its distribution
requirement, which also may accelerate the recognition of gain and affect a
Portfolio's total return.
Distributions from the Portfolios
Each Portfolio intends to follow the practice of distributing at least annually
substantially all of its investment company taxable income which includes any
excess of net realized short-term capital gains over net realized long-term
capital losses. A Portfolio may follow the practice of distributing the entire
excess of net realized long-term capital gains over net realized short-term
capital losses. However, a Portfolio may retain all or part of such net capital
gain for reinvestment, after paying the related federal taxes. Amounts not
distributed on a timely basis by RICs in accordance with a calendar year
distribution requirement are subject to a nondeductible 4% excise tax at the
Portfolio level. The excise tax is generally inapplicable to any RIC whose sole
shareholders are either tax-exempt pension trusts or separate accounts of life
insurance companies funding variable contracts.
Each Portfolio intends to distribute investment company taxable income and any
net realized capital gains in April each year. Additional distributions may be
made if necessary.
All distributions will be made in shares of a Portfolio. Both dividends and
capital gain distributions will be reinvested in additional shares of such a
Portfolio unless an election is made on behalf of a separate account to receive
dividends and capital gain distributions in cash.
Shareholders of the Portfolios may be subject to state and local taxes on
distributions received from such Portfolios and on redemptions of their shares.
Each distribution is accompanied by a brief explanation of the form and
character of the distribution.
The Fund is organized as a Massachusetts business trust, and neither the Fund
nor the Portfolios are liable for any income or franchise tax in the
Commonwealth of Massachusetts providing each Portfolio continues to qualify as a
regulated investment company under Subchapter M of the Code.
The federal income tax discussion set forth above is for general information
only. Prospective holders of a variable contracts should consult their tax
advisers regarding the specific federal tax consequences of purchasing, holding,
and disposing of shares of a Portfolio, as well as the effects of state, local
and foreign tax law and any proposed tax law changes.
NET ASSET VALUE
The net asset value of each Portfolio is computed as of the close of regular
trading on the New York Stock Exchange (the "Exchange") on each day the Exchange
is open for regular trading (the "Value Time"). The Exchange is scheduled to be
closed on the following holidays: New Year's Day, Dr. Martin Luther King, Jr.
Day, Presidents' Day, Good Friday, Memorial Day, Independence Day, Labor Day,
Thanksgiving and Christmas, and on the preceding Friday or subsequent Monday
when one of these holidays falls on a Saturday or Sunday, respectively. Net
asset value per share is determined separately for each class of shares by
dividing the net asset value of such class, which is the value of the total
assets of each Portfolio attributable to the shares of that class, less all
liabilities attributable to that class, by the total number of shares of that
class outstanding. The per share net asset value may be lower for certain
classes of each Portfolio because of higher expenses borne by these classes.
An equity security is valued at its most recent sale price on the security's
primary exchange or OTC market as of the Value Time. Lacking any sales, the
security is valued at the calculated mean between the most recent bid quotation
and the most recent asked quotation (the "Calculated Mean") on such exchange or
OTC market as of the Value Time. If it is not possible to determine the
Calculated Mean, the security is valued at the most recent bid quotation on such
exchange or OTC market as of the Value Time. In the case of certain foreign
exchanges or OTC markets, the closing price reported by the exchange or OTC
market (which may sometimes be referred to as the "official close" or the
"official closing price" or other similar term) will be considered the most
recent sale price.
Debt securities are valued as follows. Money market instruments purchased with
an original or remaining maturity of 60 days or less, maturing at par, are
valued at amortized cost. Other money market instruments are valued based on
information obtained from an approved pricing agent or, if such information is
not readily available, by using matrix pricing techniques (formula driven
calculations based primarily on current market yields). Bank loans are valued at
prices supplied by an approved pricing agent (which are intended to reflect the
mean between the bid and asked prices), if available, and otherwise at the mean
of the most recent bid and asked quotations or evaluated prices, as applicable,
based on quotations or evaluated prices obtained from one or more
broker-dealers. Privately placed debt securities, other than Rule 144A debt
securities, initially are valued at cost and thereafter based on all relevant
factors including type of security, size of holding and restrictions on
disposition. Municipal debt securities are valued at prices supplied by an
approved pricing agent (which are intended to reflect the mean between the bid
and asked prices), if available, and otherwise at the mean of the most recent
bid and asked quotations or evaluated prices obtained from a broker-dealer.
Other debt securities are valued at prices supplied by an approved pricing
agent, if available, and otherwise at the most recent bid quotation or evaluated
price, as applicable, obtained from one or more broker-dealers. If it is not
possible to value a particular debt security pursuant to the above methods, the
security is valued on the basis of factors including (but not limited to)
maturity, coupon, creditworthiness, currency denomination, and the movement of
the market in which the security is normally traded.
An exchange-traded option contract on securities, currencies and other financial
instruments is valued at its most recent sale price on such exchange. Lacking
any sales, the option contract is valued at the Calculated Mean. If it is not
possible to determine the Calculated Mean, the option contract is valued at the
most recent bid quotation in the case of a purchased option contract or the most
recent asked quotation in the case of a written option contract, in each case as
of the Value Time. An option contract on securities, currencies and other
financial instruments traded in the OTC market is valued at the evaluated price
provided by the broker-dealer with which it was traded. Futures contracts (and
options thereon) are valued at the most recent settlement price, if available,
on the exchange on which they are traded most extensively. With the exception of
stock index futures contracts which trade on the Chicago Mercantile Exchange,
closing settlement times are prior to the close of trading on the New York Stock
Exchange. For stock index futures contracts which trade on the Chicago
Mercantile Exchange, closing settlement prices are normally available at
approximately 4:20 Eastern time. If no settlement price is available, the last
trade price on such exchange will be used.
If market quotations for a portfolio asset are not readily available or the
value of a portfolio asset as determined in accordance with Board approved
procedures does not represent the fair market value of the portfolio asset, the
value of the portfolio asset is taken to be an amount which, in the opinion of
the Fund's Pricing Committee (or, in some cases, the Board's Valuation
Committee), represents fair market value. The value of other portfolio holdings
owned by the Fund is determined in a manner which is intended to fairly reflect
the fair market value of the asset on the valuation date, based on valuation
procedures adopted by the Fund's Board and overseen primarily by the Fund's
Pricing Committee.
TRUSTEES AND OFFICERS
The following table presents certain information regarding the Board Members of
the Trust. Each Board Member's year of birth is set forth in parentheses after
his or her name. Unless otherwise noted, (i) each Board Member has engaged in
the principal occupation(s) noted in the table for at least the most recent five
years, although not necessarily in the same capacity, and (ii) the address of
each Board Member that is not an "interested person" (as defined in the 1940
Act) of the Trust or the Advisor (each, an "Independent Board Member") is c/o
Dawn-Marie Driscoll, PO Box 100176, Cape Coral, FL 33904. The term of office for
each Board Member is until the election and qualification of a successor, or
until such Board Member sooner dies, resigns, is removed or as otherwise
provided in the governing documents of the Trust. Because the Portfolios do not
hold an annual meeting of shareholders, each Board Member will hold office for
an indeterminate period. The Board Members may also serve in similar capacities
with other funds in the DWS fund complex.
Independent Board Members
--------------------------------------------------------------------------------------------------------------------
Name, Year of Birth, Position Number of Funds
with the Trust and Length of Business Experience and in DWS Fund
Time Served(1) Directorships During the Past 5 Years Complex Overseen
--------------------------------------------------------------------------------------------------------------------
Dawn-Marie Driscoll (1946) President, Driscoll Associates (consulting firm); Executive 128
Chairperson since 2004,(2) and Fellow, Center for Business Ethics, Bentley College;
Board Member since 1987 formerly: Partner, Palmer & Dodge (1988-1990); Vice President
of Corporate Affairs and General Counsel, Filene's
(1978-1988); Directorships: Trustee of 8 open-end mutual
funds managed by Sun Capital Advisers, Inc. (since 2007);
Director of ICI Mutual Insurance Company (since 2007);
Advisory Board, Center for Business Ethics, Bentley College;
Trustee, Southwest Florida Community Foundation (charitable
organization); former Directorships: Investment Company
Institute (audit, executive, nominating committees) and
Independent Directors Council (governance, executive
committees)
--------------------------------------------------------------------------------------------------------------------
Paul K. Freeman Consultant, World Bank/Inter-American Development Bank; 132
(1950) formerly: Project Leader, International Institute for Applied
Vice Chairperson since 2008, and Systems Analysis (1998-2001); Chief Executive Officer, The
Board Member since 1993 Eric Group, Inc. (environmental insurance) (1986-1998)
--------------------------------------------------------------------------------------------------------------------
John W. Ballantine (1946) Retired; formerly: Executive Vice President and Chief Risk 134
Board Member since 1999 Management Officer, First Chicago NBD Corporation/The First
National Bank of Chicago (1996-1998); Executive Vice
President and Head of International Banking (1995-1996);
Directorships: Healthways Inc. (provider of disease and care
management services); Portland General Electric (utility
company); Stockwell Capital Investments PLC (private equity);
former Directorships: First Oak Brook Bancshares, Inc. and
Oak Brook Bank
--------------------------------------------------------------------------------------------------------------------
Henry P. Becton, Jr. (1943) Vice Chair, WGBH Educational Foundation; Directorships: 128
Board Member since Association of Public Television Stations; Becton Dickinson
1990 and Company(3) (medical technology company); Belo
Corporation(3) (media company); Boston Museum of Science;
Public Radio International; former Directorships: American
Public Television; Concord Academy; New England Aquarium;
Mass. Corporation for Educational Telecommunications;
Committee for Economic Development; Public Broadcasting
Service
--------------------------------------------------------------------------------------------------------------------
Keith R. Fox (1954) Managing General Partner, Exeter Capital Partners (a series 128
Board Member since of private equity funds); Directorships: Progressive Holding
1996 Corporation (kitchen goods importer and distributor); Natural
History, Inc. (magazine publisher); Box Top Media Inc.
(advertising); The Kennel Shop (retailer)
--------------------------------------------------------------------------------------------------------------------
Kenneth C. Froewiss Clinical Professor of Finance, NYU Stern School of Business 128
(1945) (1997-present); Member, Finance Committee, Association for
Board Member since Asian Studies (2002-present); Director, Mitsui Sumitomo
2001 Insurance Group (US) (2004-present); prior thereto, Managing
Director, J.P. Morgan (investment banking firm) (until 1996)
--------------------------------------------------------------------------------------------------------------------
Richard J. Herring Jacob Safra Professor of International Banking and Professor, 128
(1946) Finance Department, The Wharton School, University of
Board Member since Pennsylvania (since July 1972); Co-Director, Wharton
1990 Financial Institutions Center (since July 2000); Director,
Japan Equity Fund, Inc. (since September 2007), Thai Capital
Fund, Inc. (since September 2007), Singapore Fund, Inc.
(since September 2007); formerly: Vice Dean and Director,
Wharton Undergraduate Division (July 1995-June 2000);
Director, Lauder Institute of International Management
Studies (July 2000-June 2006)
--------------------------------------------------------------------------------------------------------------------
William McClayton (1944) Chief Administrative Officer, Diamond Management & Technology 134
Board Member since 2004 Consultants, Inc. (global management consulting firm)
(2001-present); Directorship: Board of Managers, YMCA of
Metropolitan Chicago; formerly: Senior Partner, Arthur
Andersen LLP (accounting) (1966-2001); Trustee, Ravinia
Festival
--------------------------------------------------------------------------------------------------------------------
Rebecca W. Rimel President and Chief Executive Officer, The Pew Charitable 128
(1951) Trusts (charitable organization) (1994 to present); Trustee,
Board Member since Thomas Jefferson Foundation (charitable organization) (1994
1995 to present); Trustee, Executive Committee, Philadelphia
Chamber of Commerce (2001 to 2007); Trustee, Pro Publica
(2007-present) (charitable organization); formerly: Executive
Vice President, The Glenmede Trust Company (investment trust
and wealth management) (1983 to 2004); Board Member, Investor
Education (charitable organization) (2004-2005); Director,
Viasys Health Care(3) (January 2007-June 2007)
--------------------------------------------------------------------------------------------------------------------
William N. Searcy, Jr. Private investor since October 2003; Trustee of 8 open-end 128
(1946) mutual funds managed by Sun Capital Advisers, Inc. (since
Board Member since October 1998); formerly: Pension & Savings Trust Officer,
1993 Sprint Corporation(3) (telecommunications) (November
1989-September 2003)
--------------------------------------------------------------------------------------------------------------------
Jean Gleason Stromberg Retired; formerly: Consultant (1997-2001); Director, US 128
(1943) Government Accountability Office (1996-1997); Partner,
Board Member since Fulbright & Jaworski, L.L.P. (law firm) (1978-1996);
1997 Directorships: The William and Flora Hewlett Foundation;
Service Source, Inc.; former Directorships: Mutual Fund
Directors Forum (2002-2004), American Bar Retirement
Association (funding vehicle for retirement plans) (1987-1990
and 1994-1996)
--------------------------------------------------------------------------------------------------------------------
Robert H. Wadsworth (1940) President, Robert H. Wadsworth & Associates, Inc. (consulting 137
Board Member since 1999 firm) (1983 to present).
--------------------------------------------------------------------------------------------------------------------
Interested Board Member
--------------------------------------------------------------------------------------------------------------------
Name, Year of Birth, Position Number of Funds
with the Trust and Length of Business Experience and in DWS Fund
Time Served(1) Directorships During the Past 5 Years Complex Overseen
--------------------------------------------------------------------------------------------------------------------
Axel Schwarzer(4) Managing Director(5), Deutsche Asset Management; Head of 134
(1958) Deutsche Asset Management Americas; CEO of DWS Scudder;
Board Member since formerly: board member of DWS Investments, Germany
2006 (1999-2005); Head of Sales and Product Management for the
Retail and Private Banking Division of Deutsche Bank in
Germany (1997-1999); various strategic and operational
positions for Deutsche Bank Germany Retail and Private
Banking Division in the field of investment funds, tax driven
instruments and asset management for corporates (1989-1996)
--------------------------------------------------------------------------------------------------------------------
Officers(6)
--------------------------------------------------------------------------------------------------------------------
Name, Year of Birth, Position
with the Trust and Length of Business Experience and
Time Served(7) Directorships During the Past 5 Years
--------------------------------------------------------------------------------------------------------------------
Michael G. Clark(8) (1965) Managing Director(5), Deutsche Asset Management (2006-present); President of
President, 2006-present DWS family of funds; Director, ICI Mutual Insurance Company (since
October 2007); formerly: Director of Fund Board Relations (2004-2006) and
Director of Product Development (2000-2004), Merrill Lynch Investment Managers;
Senior Vice President Operations, Merrill Lynch Asset Management (1999-2000)
--------------------------------------------------------------------------------------------------------------------
John Millette(9) (1962) Director(5), Deutsche Asset Management
Vice President and Secretary,
1999-present
--------------------------------------------------------------------------------------------------------------------
Paul H. Schubert(8) (1963) Managing Director(5), Deutsche Asset Management (since July 2004); formerly:
Chief Financial Officer, Executive Director, Head of Mutual Fund Services and Treasurer for UBS Family
2004-present of Funds (1998-2004); Vice President and Director of Mutual Fund Finance at UBS
Treasurer, 2005-present Global Asset Management (1994-1998)
--------------------------------------------------------------------------------------------------------------------
Patricia DeFilippis(8) (1963) Vice President, Deutsche Asset Management (since June 2005); formerly: Counsel,
Assistant Secretary, New York Life Investment Management LLC (2003-2005); legal associate, Lord,
2005-present Abbett & Co. LLC (1998-2003)
--------------------------------------------------------------------------------------------------------------------
Elisa D. Metzger(8) (1962) Director(5), Deutsche Asset Management (since September 2005); formerly:
Assistant Secretary, Counsel, Morrison and Foerster LLP (1999-2005)
2005-present
--------------------------------------------------------------------------------------------------------------------
Caroline Pearson(9) (1962) Managing Director(5), Deutsche Asset Management
Assistant Secretary,
1997-present
--------------------------------------------------------------------------------------------------------------------
Paul Antosca(9) Director(5), Deutsche Asset Management (since 2006); formerly: Vice President,
(1957) The Manufacturers Life Insurance Company (U.S.A.) (1990-2006)
Assistant Treasurer,
2007-present
--------------------------------------------------------------------------------------------------------------------
Jack Clark (9) Director(5), Deutsche Asset Management (since 2007); formerly: Vice President,
(1967) State Street Corporation (2002-2007)
Assistant Treasurer,
2007-present
--------------------------------------------------------------------------------------------------------------------
Kathleen Sullivan D'Eramo(9) Director(5), Deutsche Asset Management
(1957)
Assistant Treasurer,
2003-present
--------------------------------------------------------------------------------------------------------------------
Diane Kenneally(9) Director(5), Deutsche Asset Management
(1966)
Assistant Treasurer,
2007-present
--------------------------------------------------------------------------------------------------------------------
Jason Vazquez(8) (1972) Vice President, Deutsche Asset Management (since 2006); formerly: AML
Anti-Money Laundering Operations Manager for Bear Stearns (2004-2006); Supervising Compliance
Compliance Officer, Principal and Operations Manager for AXA Financial (1999-2004)
2007-present
--------------------------------------------------------------------------------------------------------------------
Robert Kloby(8) (1962) Managing Director(5), Deutsche Asset Management (2004-present); formerly: Chief
Chief Compliance Officer, Compliance Officer/Chief Risk Officer, Robeco USA (2000-2004); Vice President,
2006-present The Prudential Insurance Company of America (1988-2000); E.F. Hutton and
Company (1984-1988)
--------------------------------------------------------------------------------------------------------------------
J. Christopher Jackson(8) Director(5), Deutsche Asset Management (2006-present); formerly: Director,
(1951) Senior Vice President, General Counsel, and Assistant Secretary, Hansberger
Chief Legal Officer, Global Investors, Inc. (1996-2006); Director, National Society of Compliance
2006-present Professionals (2002-2005) (2006-2009)
--------------------------------------------------------------------------------------------------------------------
(1) The length of time served represents the year in which the Board Member
joined the board of one or more DWS funds currently overseen by the
Board.
(2) Represents the year in which Ms. Driscoll was first appointed
Chairperson of certain DWS funds.
(3) A publicly held company with securities registered pursuant to Section
12 of the Securities Exchange Act of 1934.
(4) The mailing address of Axel Schwarzer is c/o Deutsche Investment
Management Americas Inc., 345 Park Avenue, New York, New York 10154.
Mr. Schwarzer is an interested Board Member by virtue of his positions
with Deutsche Asset Management. As an interested person, Mr. Schwarzer
receives no compensation from the Portfolios.
(5) Executive title, not a board directorship.
(6) As a result of their respective positions held with the Advisor, these
individuals are considered "interested persons" of the Advisor within
the meaning of the 1940 Act. Interested persons receive no compensation
from the Portfolios.
(7) The length of time served represents the year in which the officer was
first elected in such capacity for one or more DWS funds.
(8) Address: 280 Park Avenue, New York, New York 10017.
(9) Address: Two International Place, Boston, Massachusetts 02110.
Certain officers hold similar positions for other investment companies for which
DIMA or an affiliate serves as the Advisor.
Officer's Role with Principal Underwriter: DWS Scudder Distributors, Inc.
Paul H. Schubert: Vice President
Caroline Pearson: Secretary
Board Members' Responsibilities. The officers of the Trust manage its day-to-day
operations under the direction of the Board. The primary responsibility of the
Board is to represent the interests of the Portfolio and to provide oversight of
the management of the Portfolios.
Board Committees. The Board has established the following standing committees:
Audit Committee, Nominating and Governance Committee, Contract Committee, Equity
Oversight Committee, Fixed-Income and Quant Oversight Committee, Marketing and
Shareholder Services Committee, and Operations Committee. For each committee,
the Board has adopted a written charter setting forth each committee's
responsibilities. Each committee was reconstituted effective April 1, 2008.
Audit Committee: The Audit Committee, which consists entirely of Independent
Board Members, assists the Board in fulfilling its responsibility for oversight
of (1) the integrity of the financial statements, (2) the Portfolios' accounting
and financial reporting policies and procedures, (3) the Portfolios' compliance
with legal and regulatory requirements related to accounting and financial
reporting and (4) the qualifications, independence and performance of the
independent registered public accounting firm for the Portfolios. It also
approves and recommends to the Board the appointment, retention or termination
of the independent registered public accounting firm for the Portfolios, reviews
the scope of audit and internal controls, considers and reports to the Board on
matters relating to the Portfolios' accounting and financial reporting
practices, and performs such other tasks as the full Board deems necessary or
appropriate. The Audit Committee receives annual representations from the
independent registered public accounting firm as to its independence. The
members of the Audit Committee are William McClayton (Chair), Kenneth C.
Froewiss (Vice Chair), John W. Ballantine, Henry P. Becton, Jr., Keith R. Fox
and William N. Searcy, Jr. During the calendar year 2007, the Audit Committee of
the Portfolios' Board held nine (9) meetings.
Nominating and Governance Committee: The Nominating and Governance Committee,
which consists entirely of Independent Board Members, recommends individuals for
membership on the Board, nominates officers, board and committee chairs, vice
chairs and committee members, and oversees the operations of the Board. The
Nominating and Governance Committee also reviews recommendations by shareholders
for candidates for Board positions. Shareholders may recommend candidates for
Board positions by forwarding their correspondence by US mail or courier service
to Dawn-Marie Driscoll, P.O. Box 100176, Cape Coral, FL 33904. The members of
the Nominating and Governance Committee are Henry P. Becton, Jr. (Chair),
Rebecca W. Rimel (Vice Chair), Paul K. Freeman and William McClayton. During the
calendar year 2007, the Nominating/Corporate Governance Committee of the
Portfolios' Board performed similar functions and held three (3) meetings.
Contract Committee: The Contract Committee, which consists entirely of
Independent Board Members, reviews at least annually, (a) the Portfolios'
financial arrangements with DIMA and its affiliates, and (b) the Portfolios'
expense ratios. The members of the Contract Committee are Robert H. Wadsworth
(Chair), Keith R. Fox (Vice Chair), Henry P. Becton, Jr., Richard J. Herring,
William McClayton and Jean Gleason Stromberg.
Equity Oversight Committee: The Equity Oversight Committee reviews the
investment operations of those Portfolios that primarily invest in equity
securities (except for those funds managed by a quantitative investment team).
The members of the Equity Oversight Committee are John W. Ballantine (Chair),
William McClayton (Vice Chair), Henry P. Becton, Jr., Keith R. Fox, Richard J.
Herring and Rebecca W. Rimel. During the calendar year 2007, the Equity
Oversight Committee of the Portfolios' Board performed similar functions and
held six (6) meetings.
Fixed-Income and Quant Oversight Committee: The Fixed-Income and Quant Oversight
Committee reviews the investment operations of those Portfolios that primarily
invest in fixed-income securities or are managed by a quantitative investment
team. The members of the Fixed-Income and Quant Oversight Committee are William
N. Searcy, Jr. (Chair), Jean Gleason Stromberg (Vice Chair), Dawn-Marie
Driscoll, Paul K. Freeman, Kenneth C. Froewiss and Robert H. Wadsworth. During
the calendar year 2007, the Fixed-Income Oversight Committee of the Portfolios'
Board performed similar functions and held six (6) meetings.
Marketing and Shareholder Services Committee: The Marketing and Shareholder
Services Committee reviews the Portfolios' marketing program, sales practices
and literature and shareholder services. The members of the Marketing and
Shareholder Services Committee are Richard J. Herring (Chair), Dawn-Marie
Driscoll (Vice Chair), Paul K. Freeman, Rebecca W. Rimel, Jean Gleason Stromberg
and Robert H. Wadsworth. During the calendar year 2007, the
Marketing/Distribution/Shareholder Service Committee of the Portfolios' Board
performed similar functions and held seven (7) meetings.
The Operations Committee: The Operations Committee reviews the administrative
operations, legal affairs and general compliance matters of the Portfolios. The
Operations Committee reviews administrative matters related to the operations of
the Portfolios, policies and procedures relating to portfolio transactions,
custody arrangements, fidelity bond and insurance arrangements, valuation of
Portfolio assets and securities and such other tasks as the full Board deems
necessary or appropriate. The Operations Committee also oversees the valuation
of the Portfolios' securities and other assets and determines, as needed, the
fair value of Portfolio securities or other assets under certain circumstances
as described in the Portfolios' Valuation Procedures. The Operations Committee
has appointed a Valuation Sub-Committee, which may make determinations of fair
value required when the Operations Committee is not in session. The members of
the Operations Committee are Paul K. Freeman (Chair), Dawn-Marie Driscoll (Vice
Chair), John W. Ballantine, Kenneth C. Froewiss, Rebecca W. Rimel and William N.
Searcy, Jr. The members of the Valuation Sub-Committee are Kenneth C. Froewiss
(Chair), John W. Ballantine, Dawn-Marie Driscoll (Alternate), Paul K. Freeman
(Alternate), Rebecca W. Rimel (Alternate) and William N. Searcy, Jr.
(Alternate). During the calendar year 2007, the Expenses/Operations Committee
performed similar functions and each held nine (9) meetings and eight (8)
meetings, respectively.
Ad Hoc Committees. In addition to the standing committees described above, from
time to time the Board may also form ad hoc committees to consider specific
issues.
Remuneration. Each Independent Board Member receives compensation from the
Portfolios for his or her services, which includes an annual retainer and an
attendance fee for each meeting attended. No additional compensation is paid to
any Independent Board Member for travel time to meetings, attendance at
directors' educational seminars or conferences, service on industry or
association committees, participation as speakers at directors' conferences or
service on special fund industry director task forces or subcommittees.
Independent Board Members do not receive any employee benefits such as pension
or retirement benefits or health insurance from the Portfolios or any fund in
the DWS fund complex.
Board Members who are officers, directors, employees or stockholders of Deutsche
Asset Management or its affiliates receive no direct compensation from the
Portfolios, although they are compensated as employees of Deutsche Asset
Management, or its affiliates, and as a result may be deemed to participate in
fees paid by the Portfolios. The following tables show compensation from the
Portfolios and aggregate compensation from all of the funds in the DWS fund
complex received by each Independent Board Member during the calendar year 2007.
Mr. Schwarzer is an interested person of the Portfolios and received no
compensation from the Portfolios or any fund in the DWS fund complex during the
relevant periods.
Aggregate Compensation Aggregate Compensation
Aggregate Compensation from DWS Capital from DWS Global
Name of Board Member from DWS Bond VIP Growth VIP Opportunities VIP
-------------------- ----------------- ---------- -----------------
John W. Ballantine $0 $0 $0
Henry P. Becton, Jr.(2) $516 $2,740 $845
Dawn-Marie Driscoll(2)(3) $648 $3,446 $1,061
Keith R. Fox(2) $520 $2,761 $852
Paul K. Freeman(4) $0 $0 $0
Kenneth C. Froewiss(2) $512 $2,720 $839
Richard J. Herring(2) $499 $2,648 $816
William McClayton(5) $0 $0 $0
Rebecca W. Rimel(2) $486 $2,580 $795
William N. Searcy, Jr.(2) $512 $2,720 $839
Jean Gleason Stromberg(2) $483 $2,567 $791
Robert H. Wadsworth $0 $0 $0
Aggregate Aggregate Aggregate
Compensation from Compensation from Compensation from Total Compensation from
Growth & DWS Health Care DWS International Fund and DWS
Name of Board Member Income VIP VIP VIP Fund Complex(1)
-------------------- ---------- --- --- ---------------
John W. Ballantine $0 $0 $0 $215,000
Henry P. Becton, Jr.(2) $712 $268 $1,752 $200,000
Dawn-Marie Driscoll(2)(3) $894 $336 $2,203 $253,000
Keith R. Fox(2) $717 $269 $1,766 $203,000
Paul K. Freeman(4) $0 $0 $0 $265,000
Kenneth C. Froewiss(2) $707 $265 $1,740 $200,000
Richard J. Herring(2) $688 $258 $1,694 $195,000
William McClayton(5) $0 $0 $0 $205,000
Rebecca W. Rimel(2) $670 $252 $1,650 $194,000
William N. Searcy, Jr.(2) $707 $265 $1,740 $200,000
Jean Gleason Stromberg(2) $667 $250 $1,641 $189,000
Robert H. Wadsworth $0 $0 $0 $245,250
(1) The DWS fund complex is composed of 138 funds as of December 31, 2007.
(2) Aggregate compensation includes amounts paid to the Board Members for
special meetings of ad hoc committees of the board in connection with
the consolidation of the DWS fund boards and various funds, meetings
for considering fund expense simplification initiatives, and
consideration of issues specific to the Portfolios' direct shareholders
(i.e., those shareholders who did not purchase shares through financial
intermediaries). Such amounts totaled $1,000 for Mr. Becton, $1,000 for
Ms. Driscoll, $1,000 for Mr. Fox, $1,000 for Mr. Froewiss, $1,000 for
Dr. Herring, $5,000 for Ms. Rimel, $1,000 for Mr. Searcy and $1,000 for
Ms. Stromberg. These meeting fees were borne by the Advisor.
(3) Includes $50,000 in annual retainer fees received by Ms. Driscoll as
Chairperson of certain DWS funds.
(4) Includes $25,000 paid to Dr. Freeman for numerous special meetings of
an ad hoc committee in connection with board consolidation initiatives
and $50,000 in annual retainer fees received by Dr. Freeman as
Chairperson of certain DWS funds.
(5) Does not include $15,000 to be paid to Mr. McClayton in calendar year
2008 for numerous special meetings of an ad hoc committee of the former
Chicago Board in connection with board consolidation initiatives.
Dr. Freeman, prior to his service as Independent Board Member, served as a board
member of certain funds in the Deutsche Bank complex ("DB Funds"). In connection
with his resignation and the resignation of certain other board members of the
DB Funds on July 30, 2002 (the "Effective Date"), which was part of a
restructuring of the boards overseeing the DB Funds, Deutsche Asset Management,
Inc. ("DAMI") agreed to recommend, and, if necessary obtain, directors and
officers ("D&O") liability insurance coverage for the prior board members,
including Dr. Freeman, that is at least as equivalent in scope and amount to the
D&O coverage provided to the prior board members for the six-year period
following the Effective Date. In the event that D&O insurance coverage is not
available in the commercial marketplace on commercially reasonable terms from a
conventional third party insurer, DeAM reserved the right to provide
substantially equivalent protection in the form of an indemnity or financial
guarantee from an affiliate of DeAM. The D&O policy in effect prior to the
Effective Date provided aggregate coverage of $25,000,000, subject to a $250,000
per claim deductible.
Board Member Ownership in the Portfolios
The following table shows the dollar range of equity securities beneficially
owned by each Board Member in the Portfolios and DWS fund complex as of December
31, 2007. As only certain Participating Insurance Companies are shareholders of
the Portfolios, the Trustees do not own any shares in such Portfolios, nor are
they owners of the Participating Insurance Companies.
Dollar Range of Dollar Range of
Dollar Range of Beneficial Ownership in Beneficial Ownership in
Beneficial Ownership in DWS Capital DWS Global Opportunities
Board Member DWS Bond VIP Growth VIP VIP
------------ ------------ ---------- ---
Independent Board Member:
-------------------------
John W. Ballantine None None None
Henry P. Becton, Jr. None None None
Dawn-Marie Driscoll None None None
Keith R. Fox None None None
Paul K. Freeman None None None
Kenneth C. Froewiss None None None
Richard J. Herring None None None
William McClayton None None None
Rebecca W. Rimel None None None
William N. Searcy, Jr. None None None
Jean Gleason Stromberg None None None
Robert H. Wadsworth None None None
Interested Board Member:
------------------------
Axel Schwarzer None None None
Aggregate Dollar Range
Dollar Range of Dollar Range of Dollar Range of of Ownership in all
Beneficial Ownership Beneficial Beneficial Funds Overseen by Board
in DWS Growth & Income Ownership in DWS Ownership in DWS Member in the DWS Fund
Board Member VIP Health Care VIP International VIP Complex(1)
------------ --- --------------- ----------------- ----------
Independent Board Member:
John W. Ballantine None None None Over $100,000
Henry P. Becton, Jr. None None None Over $100,000
Dawn-Marie Driscoll None None None Over $100,000
Keith R. Fox None None None Over $100,000
Paul K. Freeman None None None Over $100,000
Kenneth C. Froewiss None None None Over $100,000
Richard J. Herring None None None Over $100,000
William McClayton None None None Over $100,000
Rebecca W. Rimel None None None Over $100,000
William N. Searcy, Jr. None None None Over $100,000
Jean Gleason Stromberg None None None Over $100,000
Robert H. Wadsworth None None None Over $100,000
Interested Board Member:
------------------------
Axel Schwarzer None None None Over $100,000
(1) Securities beneficially owned as defined under the 1934 Act include
direct and/or indirect ownership of securities where the Board Member's
economic interest is tied to the securities, employment ownership and
securities when the Board Member can exert voting power, and when the
Board Member has authority to sell the securities. The dollar ranges
are: None, $1-$10,000, $10,001-$50,000, $50,001-$100,000 and over
$100,000.
Ownership in Securities of the Advisor and Related Companies
As reported to the Portfolios, the information in the following table reflects
ownership by the Independent Board Members and their immediate family members of
certain securities as of December 31, 2007. Immediate family members can be a
spouse, children residing in the same household including step and adoptive
children, and any dependents. The securities represent ownership in the Advisor
or principal underwriter of the Portfolios and any persons (other than a
registered investment company) directly or indirectly controlling, controlled
by, or under common control with the Advisor or principal underwriter of the
Portfolios (including Deutsche Bank AG).
Value of Percent of
Owner and Securities on Class on an
Independent Relationship to Title of an Aggregate Aggregate
Board Member Board Member Company Class Basis Basis
------------ ------------ ------- ----- ----- -----
John W. Ballantine None
Henry P. Becton, Jr. None
Dawn-Marie Driscoll None
Keith R. Fox None
Paul K. Freeman None
Kenneth C. Froewiss None
Richard J. Herring None
William McClayton None
Rebecca W. Rimel None
William N. Searcy, Jr. None
Jean Gleason Stromberg None
Robert H. Wadsworth None
Securities Beneficially Owned
As of April 8, 2008, the Board Members and officers of the Trust owned, as a
group, less than 1% of the outstanding shares of each Portfolio.
To the best of each Portfolio's knowledge, as of April 8, 2008, no person owned
of record or beneficially 5% or more of any class of the Portfolio's outstanding
shares, except as noted below.
DWS Bond VIP
Name and Address of Investor Ownership Shares % of Total Shares
-------------------------------------- ------ -----------------
MUTUAL OF AMERICA 14,143,611.30 43.47% of Class A
NEW YORK NY 10022-6815
MUTUAL OF AMERICA SEP ACCT 2 6,689,013.28 20.56% of Class A
SAINT LOUIS MO 63122
KEMPER INVESTORS LIFE 2,535,690.59 7.79% of Class A
C/O PRODUCT VALUATION
ONE SECURITY BENEFIT PL
TOPEKA KS 66636-0001
LINCOLN BENEFIT LIFE ANNUTIY-270 1,823,319.07 5.6% of Class A
ATTN ACCTNG FINANCIAL CONTROL TEAM
VERNON HILLS IL 60061-1826
METLIFE INSURANCE CO OF CT 56,857.60 60.17% of Class B
ATTN SHAREHOLDER ACCOUNTING DEPT
HARTFORD CT 06199-0027
METLIFE LIFE & ANNUITY CO OF CT 37,644.41 39.83% of Class B
ATTN SHAREHOLDER ACCOUNTING DEPT
HARTFORD CT 06103-3432
DWS Capital Growth VIP
Name and Address of Investor Ownership Shares % of Total Shares
-------------------------------------- ------ -----------------
ZURICH DESTINATIONS/ FARMERS FUND 13,578,115.13 27.32% of Class A
C/O KILICO
ATTN INVESTMENT ACCOUNTING LL-2W
GREENVILLE SC 29602-9097
MUTUAL OF AMERICA SEP ACCT 2 13,397,417.85 26.96% of Class A
SAINT LOUIS MO 63122
ALLMERICA LIFE SVSII 5,667,692.10 11.4% of Class A
TOPEKA KS 66636-0001
MUTUAL OF AMERICA 5,120,209.61 10.3% of Class A
NEW YORK NY 10022-6815
KEMPER INVESTORS LIFE 4,851,226.20 9.76% of Class A
C/O PRODUCT VALUATION
TOPEKA KS 66636-0001
CHARTER NAT LIFE INS CO-HORIZON 3,306,917.70 6.65% of Class A
ATTN ACCTNG FINANCIAL CONTROL TEAM
VERNON HILLS IL 60061-1826
METLIFE LIFE & ANNUITY CO OF CT 440,727.65 51.13% of Class B
ATTN SHAREHOLDER ACCOUNTING DEPT
HARTFORD CT 06103-3432
METLIFE INSURANCE CO OF CT 388,911.76 45.12% of Class B
ATTN SHAREHOLDER ACCOUNTING DEPT
HARTFORD CT 06199-0027
DWS Global Opportunities VIP
Name and Address of Investor Ownership Shares % of Total Shares
-------------------------------------- ------ -----------------
ZURICH DESTINATIONS/ FARMERS FUND 9,093,956.52 57.52% of Class A
C/O KILICO
ATTN INVESTMENT ACCOUNTING LL-2W
GREENVILLE SC 29602-9097
ALLMERICA LIFE SVSII 2,760,668.74 17.46% of Class A
TOPEKA KS 66636-0001
CHARTER NAT LIFE INS CO-HORIZON 1,585,573.87 10.03% of Class A
ATTN ACCTNG FINANCIAL CONTROL TEAM
VERNON HILLS IL 60061-1826
UNITED OF OMAHA 229,692.38 35.54% of Class B
ATTN PRODUCT ACCOUTING & REPORTING
11TH FLOOR
MUTUAL OF OMAHA PLAZA
OMAHA NE 68175-0001
METLIFE INSURANCE CO OF CT 209,844.57 32.47% of Class B
ATTN SHAREHOLDER ACCOUNTING DEPT
HARTFORD CT 06199-0027
METLIFE LIFE & ANNUITY CO OF CT 194,178.90 30.05% of Class B
ATTN SHAREHOLDER ACCOUNTING DEPT
HARTFORD CT 06103-3432
DWS Growth & Income VIP
Name and Address of Investor Ownership Shares % of Total Shares
-------------------------------------- ------ -----------------
ZURICH DESTINATIONS/ FARMERS FUND 5,195,052.59 30.88% of Class A
C/O KILICO
ATTN INVESTMENT ACCOUNTING LL-2W
GREENVILLE SC 29602-9097
ALLMERICA LIFE SVSII 5,150,995.85 30.62% of Class A
TOPEKA KS 66636-0001
CHARTER NAT LIFE INS CO-HORIZON 2,308,135.08 13.72% of Class A
ATTN ACCTNG FINANCIAL CONTROL TEAM
VERNON HILLS IL 60061-1826
KEMPER INVESTORS LIFE 898,022.94 5.34% of Class A
C/O PRODUCT VALUATION
TOPEKA KS 66636-0001
METLIFE INSURANCE CO OF CT 554,579.77 42.41% of Class B
ATTN SHAREHOLDER ACCOUNTING DEPT
HARTFORD CT 06199-0027
METLIFE LIFE & ANNUITY CO OF CT 436,397.98 33.37% of Class B
ATTN SHAREHOLDER ACCOUNTING DEPT
HARTFORD CT 06103-3432
UNITED OF OMAHA 284,512.00 21.76% of Class B
ATTN PRODUCT ACCOUTING & REPORTING
11TH FLOOR
MUTUAL OF OMAHA PLAZA
OMAHA NE 68175-0001
DWS Health Care VIP
Name and Address of Investor Ownership Shares % of Total Shares
-------------------------------------- ------ -----------------
ZURICH DESTINATIONS/ FARMERS FUND 5,159,613.45 75.5% of Class A
C/O KILICO
ATTN INVESTMENT ACCOUNTING LL-2W
GREENVILLE SC 29602-9097
ALLMERICA LIFE SVSII 1,205,717.86 17.64% of Class A
TOPEKA KS 66636-0001
METLIFE INSURANCE CO OF CT 219,697.97 60.16% of Class B
ATTN SHAREHOLDER ACCOUNTING DEPT
HARTFORD CT 06199-0027
METLIFE LIFE & ANNUITY CO OF CT 144,355.35 39.53% of Class B
ATTN SHAREHOLDER ACCOUNTING DEPT
HARTFORD CT 06103-3432
Shares % of Total Shares
DWS International VIP
Name and Address of Investor Ownership Shares % of Total Shares
-------------------------------------- ------ -----------------
MUTUAL OF AMERICA SEP ACCT 2 12,139,255.18 27.59% of Class A
SAINT LOUIS MO 63122
ZURICH DESTINATIONS/ FARMERS FUND 8,686,496.03 19.74% of Class A
C/O KILICO
ATTN INVESTMENT ACCOUNTING LL-2W
GREENVILLE SC 29602-9097
UNION CENTRAL ESP INTERNATIONAL 3,091,578.31 7.03% of Class A
CINCINNATI OH 45201-0179
CHARTER NAT LIFE INS CO-HORIZON 3,006,053.10 6.83% of Class A
ATTN ACCTNG FINANCIAL CONTROL TEAM
VERNON HILLS IL 60061-1826
MUTUAL OF AMERICA 2,952,547.02 6.71% of Class A
NEW YORK NY 10022-6815
ALLMERICA LIFE SVSII 2,576,586.61 5.86% of Class A
TOPEKA KS 66636-0001
METLIFE INV USA SEP ACCT A 2,544,631.68 5.78% of Class A
BOSTON MA 02116-3706
METLIFE INSURANCE CO OF CT 375,253.80 48.73% of Class B
ATTN SHAREHOLDER ACCOUNTING DEPT
HARTFORD CT 06199-0027
METLIFE LIFE & ANNUITY CO OF CT 339,523.34 44.09% of Class B
ATTN SHAREHOLDER ACCOUNTING DEPT
HARTFORD CT 06103-3432
Agreement to Indemnify Independent Trustees for Certain Expenses
In connection with litigation or regulatory action related to possible improper
market timing or other improper trading activity or possible improper marketing
and sales activity in certain DWS Funds (the "Affected Funds"), DIMA has agreed
to indemnify and hold harmless the Affected Funds ("Fund Indemnification
Agreement") against any and all loss, damage, liability and expense, arising
from market timing or marketing and sales matters alleged in any enforcement
actions brought by governmental authorities involving or potentially affecting
the Affected Funds or DIMA ("Enforcement Actions") or that are the basis for
private actions brought by shareholders of the Affected Funds against the
Affected Funds, their directors and officers, DIMA and/or certain other parties
("Private Litigation"), or any proceedings or actions that may be threatened or
commenced in the future by any person (including governmental authorities),
arising from or similar to the matters alleged in the Enforcement Actions or
Private Litigation. In recognition of its undertaking to indemnify the Affected
Funds and in light of the rebuttable presumption generally afforded to
independent directors/trustees of investment companies that they have not
engaged in disabling conduct, DIMA has also agreed, subject to applicable law
and regulation, to indemnify certain (or, with respect to certain Affected
Funds, all) of the Independent Trustees of the Affected Funds, against certain
liabilities the Independent Trustees may incur from the matters alleged in any
Enforcement Actions or Private Litigation or arising from or similar to the
matters alleged in the Enforcement Actions or Private Litigation, and advance
expenses that may be incurred by the Independent Trustees in connection with any
Enforcement Actions or Private Litigation. DIMA is not, however, required to
provide indemnification and advancement of expenses: (1) with respect to any
proceeding or action which the Affected Funds' Board determines that the
Independent Trustees ultimately would not be entitled to indemnification or (2)
for any liability of the Independent Trustees to the Funds or their shareholders
to which the Independent Trustee would otherwise be subject by reason of willful
misfeasance, bad faith, gross negligence or reckless disregard of the
Independent Trustee's duties as a director or trustee of the Affected Funds as
determined in a final adjudication in such action or proceeding. The estimated
amount of any expenses that may be advanced to the Independent Trustees or
indemnity that may be payable under the indemnity agreements is currently
unknown. These agreements by DIMA will survive the termination of the investment
management agreements between DIMA and the Affected Funds.
SHAREHOLDER COMMUNICATIONS
Owners of policies and contracts issued by Participating Insurance Companies for
which shares of one or more Portfolios are the investment vehicle will receive
from the Participating Insurance Companies unaudited semi-annual financial
statements and audited year-end financial statements certified by the
Portfolios' independent public accountants. Each report will show the
investments owned by a Portfolio and the market values thereof as determined by
the Trustees and will provide other information about a Portfolio and its
operations.
Participating Insurance Companies with inquiries regarding the Fund or its
Portfolios may call the Fund's underwriter, DWS Scudder Distributors, Inc., at
(800) 778-1482 or write DWS Scudder Distributors, Inc., 222 South Riverside
Plaza, Chicago, IL 60606-5808.
FUND ORGANIZATION
General
DWS Variable Series I is a Massachusetts business trust organized under the laws
of Massachusetts and is governed by an Amended and Restated Declaration of Trust
that was approved by shareholders in the second quarter of 2006, as may be
further amended from time to time (the "Declaration of Trust"). All shares
issued and outstanding are fully paid and non-assessable, transferable, have no
pre-emptive or conversion rights (except as may be determined by the Board of
Trustees) and are redeemable as described in the SAI and a Portfolio's
prospectus. Each share has equal rights with each other share of the same class
of the Portfolio as to voting, dividends, exchanges, conversion features and
liquidation.
Shareholders are entitled to one vote for each full share held and fractional
votes for fractional shares held.
A Portfolio generally is not required to hold meetings of its shareholders.
Under the Declaration of Trust, however, shareholder meetings will be held in
connection with the following matters to the extent and as provided in the
Declaration of Trust and as required by applicable law: (a) the election or
removal of trustees if a meeting is called for such purpose; (b) the termination
of the Fund or a Portfolio; (c) an amendment of the Declaration of Trust; and
(d) such additional matters as may be required by law or as the Trustees may
determine to be necessary or desirable. Shareholders also vote upon changes in
fundamental policies or restrictions.
The Declaration of Trust provides that shareholder meeting quorum requirements
shall be established in the Fund's By-laws. The By-laws currently in effect
provide that the presence in person or by proxy of the holders of thirty percent
of the shares entitled to vote at a meeting (or of an individual series or class
if required to vote separately) shall constitute a quorum for the transaction of
business at meetings of shareholders of the Fund.
On any matter submitted to a vote of shareholders, all shares of the Fund
entitled to vote shall, except as otherwise provided in the Fund's By-Laws, be
voted in the aggregate as a single class without regard to series or classes of
shares, except (a) when required by applicable law or when the Trustees shall
have determined that the matter affects one or more series or classes of shares
materially differently, shares shall be voted by individual series or class; and
(b) when the Trustees have determined that the matter affects only the interests
of one or more series or classes, only shareholders of such series or classes
shall be entitled to vote thereon.
The Declaration of Trust provides that the Board of Trustees may, in its
discretion, establish minimum investment amounts for shareholder accounts,
impose fees on accounts that do not exceed a minimum investment amount and
involuntarily redeem shares in any such account in payment of such fees. The
Board of Trustees, in its sole discretion, also may cause the Fund to redeem all
of the shares of the Fund or one or more series or classes held by any
shareholder for any reason, to the extent permissible by the 1940 Act, including
(a) if the shareholder owns shares having an aggregate net asset value of less
than a specified minimum amount, (b) if a particular shareholder's ownership of
shares would disqualify a series from being a regulated investment company, (c)
upon a shareholder's failure to provide sufficient identification to permit the
Fund to verify the shareholder's identity, (d) upon a shareholder's failure to
pay for shares or meet or maintain the qualifications for ownership of a
particular class or series of shares, (e) if the Board of Trustees determines
(or pursuant to policies established by the Board it is determined) that share
ownership by a particular shareholder is not in the best interests of remaining
shareholders, (f) when a Portfolio is requested or compelled to do so by
governmental authority or applicable law and (g) upon a shareholder's failure to
comply with a request for information with respect to the direct or indirect
ownership of shares of the Fund. The Declaration of Trust also authorizes the
Board of Trustees to terminate a Portfolio or any class without shareholder
approval, and the Fund may suspend the right of shareholders to require the Fund
to redeem shares to the extent permissible under the 1940 Act.
Upon the termination of the Fund or any series, after paying or adequately
providing for the payment of all liabilities which may include the establishment
of a liquidating trust or similar vehicle, and upon receipt of such releases,
indemnities and refunding agreements as they deem necessary for their
protection, the Trustees may distribute the remaining Fund property or property
of the series, in cash or in kind or partly each, to the shareholders of the
Fund or the series involved, ratably according to the number of shares of the
Fund or such series held by the several shareholders of the Fund or such series
on the date of termination, except to the extent otherwise required or permitted
by the preferences and special or relative rights and privileges of any classes
of shares of a series involved, provided that any distribution to the
shareholders of a particular class of shares shall be made to such shareholders
pro rata in proportion to the number of shares of such class held by each of
them. The composition of any such distribution (e.g., cash, securities or other
assets) shall be determined by the Fund in its sole discretion, and may be
different among shareholders (including differences among shareholders in the
same series or class).
Under Massachusetts law, shareholders of a Massachusetts business trust could,
under certain circumstances, be held personally liable for obligations of a
Portfolio. The Declaration of Trust, however, disclaims shareholder liability
for acts or obligations of the Portfolio and requires that notice of such
disclaimer be given in each agreement, obligation, or instrument entered into or
executed by the Portfolio or the Portfolio's trustees. Moreover, the Declaration
of Trust provides for indemnification out of Portfolio property for all losses
and expenses of any shareholder held personally liable for the obligations of
the Portfolio and the Portfolio may be covered by insurance which the Trustees
consider adequate to cover foreseeable tort claims. Thus, the risk of a
shareholder incurring financial loss on account of shareholder liability is
considered by the Advisor remote and not material, since it is limited to
circumstances in which a disclaimer is inoperative and the Portfolio itself is
unable to meet its obligations.
Shareholder and Trustee Liability
Under Massachusetts law, shareholders of a Massachusetts business trust could,
under certain circumstances, be held personally liable for obligations of a
portfolio thereof. The Declaration of Trust, however, disclaims shareholder
liability for acts or obligations of each Portfolio and requires that notice of
such disclaimer be given in each agreement, obligation, or instrument entered
into or executed by a Portfolio or the Fund's Trustees. Moreover, the
Declaration of Trust provides for indemnification out of Portfolio property for
all losses and expenses of any shareholder held personally liable for the
obligations of a Portfolio and each Portfolio will be covered by insurance which
the Trustees consider adequate to cover foreseeable tort claims. Thus, the risk
of a shareholder incurring financial loss on account of shareholder liability is
considered by the Advisor remote and not material, since it is limited to
circumstances in which a disclaimer is inoperative and such Portfolio itself is
unable to meet its obligations. It is possible that a Portfolio might become
liable for a misstatement regarding another Portfolio. The Trustees of the Fund
have considered this and approved the use of a combined Statement of Additional
Information for the Portfolios.
The Declaration of Trust provides that obligations of the Fund are not binding
upon the Trustees individually but only upon the property of the Fund, that the
Trustees and officers will not be liable for errors of judgment or mistakes of
fact or law, and that the Fund, will indemnify its Trustees and officers against
liabilities and expenses incurred in connection with litigation in which they
may be involved because of their offices with the Fund, except if it is
determined in the manner provided in the Declaration of Trust that they have not
acted in good faith in the reasonable belief that their actions were in the best
interests of the Fund. However, nothing in the Declaration of Trust protects or
indemnifies a Trustee or officer against any liability to which he or she would
otherwise be subject by reason of willful misfeasance, bad faith, gross
negligence, of reckless disregard of duties involved in the conduct of his or
her office.
Shares entitle their holders to one vote per share; however, separate votes will
be taken by each Portfolio on matters affecting an individual Portfolio.
Additionally, approval of the investment advisory agreement covering a Portfolio
is a matter to be determined separately by each Portfolio. Approval by the
shareholders of one Portfolio is effective as to that Portfolio. Shares have
noncumulative voting rights, which means that holders of more than 50% of the
shares voting for the election of Trustees can elect all Trustees and, in such
event, the holders of the remaining shares voting for the election of Trustees
will not be able to elect any person or persons as Trustees. Shares have no
preemptive or subscription rights, and are transferable.
Shareholders have certain rights, as set forth in the Declaration of Trust of
the Fund, including the right to call a meeting of shareholders for the purpose
of voting on the removal of one or more Trustees. Such removal can be effected
upon the action of two-thirds of the outstanding shares of beneficial interest
of the Fund.
PROXY VOTING GUIDELINES
The Fund has delegated proxy voting responsibilities to its investment advisor,
subject to the Board's general oversight. The Fund has delegated proxy voting to
the Advisor with the direction that proxies should be voted consistent with the
Fund's best economic interests. The Advisor has adopted its own Proxy Voting
Policies and Procedures ("Policies"), and Proxy Voting Guidelines ("Guidelines")
for this purpose. The Policies address, among other things, conflicts of
interest that may arise between the interests of the Fund, and the interests of
the Advisor and its affiliates, including the Fund's principal underwriter. The
Guidelines set forth the Advisor's general position on various proposals, such
as:
o Shareholder Rights -- The Advisor generally votes against proposals
that restrict shareholder rights.
o Corporate Governance -- The Advisor generally votes for confidential
and cumulative voting and against supermajority voting requirements for
charter and bylaw amendments. The Advisor generally votes for proposals
to restrict a chief executive officer from serving on more than three
outside boards of directors. The Advisor generally votes against
proposals that require a company to appoint a Chairman who is an
independent director.
o Anti-Takeover Matters -- The Advisor generally votes for proposals that
require shareholder ratification of poison pills or that request boards
to redeem poison pills, and votes against the adoption of poison pills
if they are submitted for shareholder ratification. The Advisor
generally votes for fair price proposals.
o Compensation Matters -- The Advisor generally votes for executive cash
compensation proposals, unless they are unreasonably excessive. The
Advisor generally votes against stock option plans that do not meet the
Advisor's criteria.
o Routine Matters -- The Advisor generally votes for the ratification of
auditors, procedural matters related to the annual meeting and changes
in company name, and against bundled proposals and adjournment.
The general provisions described above do not apply to investment companies. The
Advisor generally votes proxies solicited by investment companies in accordance
with the recommendations of an independent third party, except for proxies
solicited by or with respect to investment companies for which the Advisor or an
affiliate serves as investment advisor or principal underwriter ("affiliated
investment companies"). The Advisor votes affiliated investment company proxies
in the same proportion as the vote of the investment company's other
shareholders (sometimes called "mirror" or "echo" voting). Master fund proxies
solicited from feeder funds are voted in accordance with applicable requirements
of the Investment Company Act of 1940.
Although the Guidelines set forth the Advisor's general voting positions on
various proposals, the Advisor may, consistent with the Fund's best interests,
determine under some circumstances to vote contrary to those positions.
The Guidelines on a particular issue may or may not reflect the view of
individual members of the Board or of a majority of the Board. In addition, the
Guidelines may reflect a voting position that differs from the actual practices
of the public companies within the Deutsche Bank organization or of the
investment companies for which the Advisor or an affiliate serves as investment
advisor or sponsor.
The Advisor may consider the views of a portfolio company's management in
deciding how to vote a proxy or in establishing general voting positions for the
Guidelines, but management's views are not determinative.
As mentioned above, the Policies describe the way in which the Advisor resolves
conflicts of interest. To resolve conflicts, the advisor, under normal
circumstances, votes proxies in accordance with its Guidelines. If the Advisor
departs from the Guidelines with respect to a particular proxy or if the
Guidelines do not specifically address a certain proxy proposal, a proxy voting
committee established by the advisor will vote the proxy. Before voting any such
proxy, however, the Advisor's conflicts review committee will conduct an
investigation to determine whether any potential conflicts of interest exist in
connection with the particular proxy proposal. If the conflicts review committee
determines that the Advisor has a material conflict of interest, or certain
individuals on the proxy voting committee should be recused from participating
in a particular proxy vote, it will inform the proxy voting committee. If
notified that the Advisor has a material conflict, or fewer than three voting
members are eligible to participate in the proxy vote, typically the Advisor
will engage an independent third party to vote the proxy or follow the proxy
voting recommendations of an independent third party.
Under certain circumstances, the Advisor may not be able to vote proxies or the
Advisor may find that the expected economic costs from voting outweigh the
benefits associated with voting. For example, the Advisor may not vote proxies
on certain foreign securities due to local restrictions or customs. The Advisor
generally does not vote proxies on securities subject to share blocking
restrictions.
You may obtain information about how a fund voted proxies related to its
portfolio securities during the 12-month period ended June 30 by visiting the
Securities and Exchange Commission's Web site at www.sec.gov or by visiting our
Web site at: www.dws-scudder.com (click on "proxy voting" at the bottom of the
page).
ADDITIONAL INFORMATION
The CUSIP number of DWS Bond VIP Class A shares is 23338G 109.
The CUSIP number of DWS Bond VIP Class B shares is 23338G 208.
The CUSIP number of DWS Growth & Income VIP Class A shares is 23338G 703.
The CUSIP number of DWS Growth & Income VIP Class B shares is 23338G 802.
The CUSIP number of DWS Capital Growth VIP Class A shares is 23338G 307.
The CUSIP number of DWS Capital Growth VIP Class B shares is 23338G 406.
The CUSIP number of DWS Global Opportunities VIP Class A shares is 23338G 505.
The CUSIP number of DWS Global Opportunities VIP Class B shares is 23338G 604.
The CUSIP number of DWS International VIP Class A shares is 23338G 869.
The CUSIP number of DWS International VIP Class B shares is 23338G 851.
The CUSIP number of DWS Health Care VIP Class A shares is 23338G 885.
The CUSIP number of DWS Health Care VIP Class B shares is 23338G 877.
Each Portfolio has a December 31 fiscal year end.
The name "DWS Variable Series I" is the designation of the Trustees for the time
being under an amended and restated Declaration of Trust dated June 27, 2006, as
amended from time to time, and all persons dealing with the Fund must look
solely to the property of the Fund for the enforcement of any claims against the
Fund as neither the Trustees, officers, agents or shareholders assume any
personal liability for obligations entered into on behalf of the Fund. Upon the
initial purchase of shares, the shareholder agrees to be bound by the Fund's
Declaration of Trust, as amended from time to time. The Declaration of Trust is
on file at the Massachusetts Secretary of State's Office in Boston,
Massachusetts.
Each Portfolio, through its combined Prospectuses and combined Statement of
Additional Information, offers only its own share classes, yet it is possible
that one Portfolio might become liable for a misstatement regarding the other
Portfolio. The Trustees have considered this, and have approved the use of the
Prospectus and Statement of Additional Information.
The Fund's prospectuses and this Statement of Additional Information omit
certain information contained in the Registration Statement which the Fund has
filed with the SEC under the Securities Act of 1933 and reference is hereby made
to the Registration Statement, and its amendments, for further information with
respect to the Fund and the securities offered hereby. The Registration
Statement and its amendments are available for inspection by the public at the
SEC in Washington, D.C.
FINANCIAL STATEMENTS
The financial statements of DWS Variable Series I are comprised of the
following:
DWS Bond VIP
DWS Growth & Income VIP
DWS Capital Growth VIP
DWS Global Opportunities VIP
DWS International VIP
DWS Health Care VIP
The financial statements, including the investment portfolios of DWS Variable
Series I, together with the Report of Independent Registered Public Accounting
Firm, Financial Highlights and notes to financial statements are incorporated by
reference and attached hereto, in the Annual Report to the Shareholders of the
Fund dated December 31, 2007, and are hereby deemed to be part of this Statement
of Additional Information.
APPENDIX A
BOND AND COMMERCIAL PAPER RATINGS
Set forth below are descriptions of ratings which represent opinions as to the
quality of the securities. It should be emphasized, however, that ratings are
relative and subjective and are not absolute standards of quality.
MOODY'S INVESTORS SERVICE, INC. -- CORPORATE BOND RATINGS
Aaa: Bonds which are rated Aaa are judged to be of the highest quality. They
carry the smallest degree of investment risk and are generally referred to as
"gilt-edged." Interest payments are protected by a large or by an exceptionally
stable margin and principal is secure. While the various protective elements are
likely to change, such changes as can be visualized are most unlikely to impair
the fundamentally strong position of such issues.
Aa: Bonds which are rated Aa are judged to be of high quality by all standards.
Together with the Aaa group they comprise what are generally known as high grade
bonds. They are rated lower than the best bonds because margins of protection
may not be as large as in Aaa securities or fluctuations of protective elements
may be of greater amplitude or there may be other elements present which make
the long-term risk appear somewhat larger than in Aaa securities.
A: Bonds which are rated A possess many favorable investment attributes and are
to be considered as upper -medium grade obligations. Factors giving security to
principal and interest are considered adequate, but elements may be present
which suggest a susceptibility to impairment sometime in the future.
Baa: Bonds which are rated Baa are considered as medium grade obligations,
(i.e., they are neither highly protected nor poorly secured). Interest payments
and principal security appear adequate for the present, but certain protective
elements may be lacking or may be characteristically unreliable over any great
length of time. Such bonds lack outstanding investment characteristics and in
fact have speculative characteristics as well.
Ba: Bonds which are rated Ba are judged to have speculative elements; their
future cannot be considered as well assured. Often the protection of interest
and principal payments may be very moderate and thereby not well safe-guarded
during both good and bad times over the future. Uncertainty of position
characterizes bonds in this class.
B: Bonds which are rated B are considered speculative and generally lack
characteristics of the desirable investment. Assurance of interest and principal
payments or of maintenance of other terms of the contract over any long period
of time may be small.
Caa: Bonds which are rated Caa are of poor standing. Such issues may be in
default or there may be present elements of danger with respect to principal or
interest.
Ca: Bonds which are rated Ca represent obligations which are highly speculative.
Such issues are often in default or have other marked shortcomings.
C: Bonds which are rated C are the lowest rated class of bonds, typically are in
default and can be regarded as having extremely poor prospects of ever attaining
any real investment standing.
Note: Moody's appends numerical modifiers 1, 2 and 3 to each generic rating
classification from Aa through Caa in its corporate bond rating system. The
modifier 1 indicates that the issue ranks in the higher end of its generic
rating category; the modifier 2 indicates a mid-range ranking; and the modifier
3 indicates that the issue ranks in the lower end of its generic rating
category.
MOODY'S INVESTORS SERVICE, INC. -- SHORT-TERM RATINGS
Moody's short-term debt ratings are opinions of the ability of issuers to honor
short-term financial obligations. Ratings may be assigned to issuers, short-term
programs or to individual short-term debt instruments. Such obligations
generally have an original maturity not exceeding thirteen months, unless
explicitly noted. Issuers rated Prime-1 or P-1 (or supporting institutions) have
a superior ability for repayment of short-term debt obligations. Prime-1 or P-1
repayment ability will often be evidenced by many of the following
characteristics:
o Leading market positions in well established industries.
o High rates of return on funds employed.
o Conservative capitalization structure with moderate reliance on debt
and ample asset protection.
o Broad margins in earnings coverage of fixed financial charges and high
internal cash generation.
o Well established access to a range of financial markets and assured
sources of alternate liquidity.
Issuers rated Prime-2 or P-2 (or supporting institutions) have a strong ability
for repayment of short-term debt obligations. This will normally be evidenced by
many of the characteristics cited above but to a lesser degree. Earnings trends
and coverage ratios, while sound, may be more subject to variation.
Capitalization characteristics, while still appropriate, may be more affected by
external conditions. Ample alternate liquidity is maintained.
STANDARD & POOR'S RATINGS SERVICES -- CORPORATE BOND RATINGS
INVESTMENT GRADE
AAA: Debt rated AAA has the highest rating assigned by S&P's to a debt
obligation. Capacity to pay interest and repay principal is extremely strong.
AA: Debt rated AA has a very strong capacity to pay interest and repay principal
and differs from the higher rated issues only in small degree.
A: Debt rated A has a strong capacity to pay interest and repay principal
although it is somewhat more susceptible to the adverse effects of changes in
circumstances and economic conditions than bonds in higher rated categories.
BBB: Debt rated BBB has an adequate capacity to pay interest and repay
principal. Whereas it normally exhibits adequate protection parameters, adverse
economic conditions or changing circumstances are more likely to lead to a
weakened capacity to pay interest and repay principal for debt in this category
than in higher rated categories.
SPECULATIVE GRADE
Debt rated BB, B, CCC, CC, and C has significant speculative characteristics
with respect to capacity to pay interest and repay principal. BB indicates the
least degree of speculation and C the highest. While such debt will likely have
some quality and protective characteristics, these may be outweighed by large
uncertainties or major exposures to adverse conditions.
BB: Debt rated BB has less near-term vulnerability to default than other
speculative issues. However, it faces major ongoing uncertainties or exposure to
adverse business, financial, or economic conditions which could lead to
inadequate capacity to meet timely interest and principal payments.
The BB rating category is also used for debt subordinated to senior debt that is
assigned an actual or implied BBB- rating.
B: Debt rated B has a greater vulnerability to default but currently has the
capacity to meet interest payments and principal repayments. Adverse business,
financial, or economic conditions will likely impair capacity or willingness to
pay interest and repay principal.
The B rating category is also used for debt subordinated to senior debt that is
assigned an actual or implied BB or BB- rating.
CCC: Debt rated CCC has a current vulnerability to default, and is dependent
upon favorable business, financial, and economic conditions to meet timely
payment of interest and repayment of principal. In the event of adverse
business, financial, or economic conditions, it is not likely to have the
capacity to pay interest and repay principal.
The CCC rating category is also used for debt subordinated to senior debt that
is assigned an actual or implied B or B- rating.
CC: Debt rated CC has a current high vulnerability to default, and is dependent
upon favorable business, financial, and economic conditions to meet timely
payment of interest and repayment of principal.
The rating CC is also applied to debt subordinated to senior debt which is
assigned an actual or implied CCC debt rating.
C: The rating C is typically applied to debt subordinated to senior debt which
is assigned an actual or implied CCC- debt rating. The C rating may be used to
cover a situation where a bankruptcy petition has been filed, but debt service
payments are continued.
C1: The Rating C1 is reserved for income bonds on which no interest is being
paid.
D: Debt rated D is in payment default. The D rating category is used when
interest payments or principal payments are not made on the date due even if the
applicable grace period has not expired, unless Standard & Poor's believes that
such payments will be made during such grace period. The D rating also will be
used upon the filing of a bankruptcy petition if debt service payments are
jeopardized.
Plus (+) or Minus (-): The ratings from AA to CCC may be modified by the
addition of a plus or minus sign to show relative standing within the major
rating categories.
R: Debt rated `R' is under regulatory supervision owing to its financial
condition. During the pendency of the regulatory supervision, the regulators may
have the power to favor one class of obligations over others or pay some
obligations and not others.
N.R.: Bonds may lack a S&P's rating because no public rating has been requested,
because there is insufficient information on which to base a rating, or because
S&P's does not rate a particular type of obligation as a matter of policy.
STANDARD & POOR'S RATINGS SERVICES -- SHORT-TERM RATINGS
S&P's commercial paper rating is a current assessment of the likelihood of
timely payment of debt considered short-term in the relevant market.
A-1: This highest category indicates that the degree of safety regarding timely
payment is strong. Those issues determined to possess extremely strong safety
characteristics are denoted with a plus (+) sign designation.
A-2: Capacity for timely payment on issues with this designation is
satisfactory. However, the relative degree of safety is not as high as for
issues designated A-1.
A-3: Issues carrying this designation have adequate capacity for timely payment.
However, adverse economic conditions or changing circumstances are more likely
to lead to a weakened capacity of the issuer to meet its financial commitments.
FITCH INVESTORS SERVICE, INC. -- BOND RATINGS
INVESTMENT GRADE
AAA: Bonds considered to be investment grade and of the highest credit quality.
The obligor has an exceptionally strong ability to pay interest and repay
principal, which is unlikely to be affected by reasonably foreseeable events.
AA: Bonds considered to be investment grade and of very high credit quality. The
obligor's ability to pay interest and repay principal is very strong, although
not quite as strong as bonds rated AAA. Bonds rated in the AAA and AA categories
are not significantly vulnerable to foreseeable events.
A: Bonds considered to be investment grade and of high credit quality. The
obligor's ability to pay interest and repay principal is considered to be
strong, but may be more vulnerable to adverse changes in economic conditions and
circumstances than bonds with higher ratings.
BBB: Bonds considered to be investment grade and of good credit quality. The
obligor's ability to pay interest and repay principal is considered to be
adequate. Adverse changes in economic conditions and circumstances, however, are
more likely to have adverse impact on these bonds, and therefore, impair timely
payment. The likelihood that the ratings of these bonds will fall below
investment grade is higher than for bonds with higher ratings.
SPECULATIVE GRADE
BB: Bonds are considered speculative. The obligor's ability to pay interest and
repay principal may be affected over time by adverse economic changes. However,
business or financial alternatives may be available which could assist the
obligor in satisfying its debt service requirements.
B: Bonds are considered highly speculative. While bonds in this class are
currently meeting debt service requirements, the probability of continued timely
payment of principal and interest reflects the obligor's limited margin of
safety and the need for reasonable business and economic activity throughout the
life of the issue.
CCC: Bonds have certain identifiable characteristics which, if not remedied, may
lead to default. The ability to meet obligations requires an advantageous
business and economic environment.
CC: Bonds are minimally protected. Default in payment of interest and/or
principal seems probable over time.
C: Bonds are in imminent default in payment of interest or principal.
DDD, DD and D: Bonds are in default of interest and/or principal payments. Such
bonds are extremely speculative and should be valued on the basis of their
ultimate recovery value in liquidation or reorganization of the obligor. DDD
represents the highest potential for recovery on these bonds, and D represents
the lowest potential for recovery.
Plus (+) or Minus (-): The ratings from AA to CC may be appended by the addition
of a plus or minus sign to denote the relative status within the rating
category.
NR: Indicates that Fitch Rating does not publicly rate the specific issue.
FITCH INVESTORS SERVICE, INC. -- SHORT-TERM RATINGS
Fitch's short-term ratings apply to debt obligations that are payable on demand
or have original maturities of generally up to three years, including commercial
paper, certificates of deposit, medium-term notes, and municipal and investment
notes.
F-1+: Exceptionally Strong Credit Quality. Issues assigned this rating are
regarded as having the strongest capacity for timely payment.
F-1: Very Strong Credit Quality. Issues assigned this rating reflect a capacity
for timely payment only slightly less than issues rated F-1+.
F-2: Good Credit Quality. Issues assigned this rating have a satisfactory
capacity for timely payment, but the margin of safety is not as great as the
F-1+ and F-1 categories.
F-3: Fair Credit Quality. Issues assigned this rating have characteristics
suggesting that the capacity for timely payment is adequate; however, near-term
adverse changes could cause these securities to be rated below investment grade.
B: Speculative. Minimal capacity for timely payment of financial commitments,
plus vulnerability to near-term adverse changes in financial and economic
conditions.
C: High default risk. Default is a real possibility. Capacity for meeting
financial commitments is solely reliant upon a sustained, favorable business and
economic environment.
D: Default. Denotes actual or imminent payment default.
SUPPLEMENT TO THE CURRENTLY EFFECTIVE STATEMENTS OF ADDITIONAL INFORMATION
OF EACH OF THE LISTED PORTFOLIOS:
---------------------
DWS Investments VIT Funds
DWS Equity 500 Index VIP
DWS Small Cap Index VIP
DWS Variable Series I
DWS Bond VIP DWS Growth & Income VIP
DWS Capital Growth VIP DWS Health Care VIP
DWS Global Opportunities VIP DWS International VIP
DWS Variable Series II
DWS Balanced VIP DWS International Select Equity VIP
DWS Blue Chip VIP DWS Janus Growth & Income VIP
DWS Conservative Allocation VIP DWS Large Cap Value VIP
DWS Core Fixed Income VIP DWS Mid Cap Growth VIP
DWS Davis Venture Value VIP DWS Moderate Allocation VIP
DWS Dreman High Return Equity VIP DWS Money Market VIP
DWS Dreman Small Mid Cap Value VIP DWS Small Cap Growth VIP
DWS Global Thematic VIP DWS Strategic Income VIP
DWS Government & Agency Securities VIP DWS Technology VIP
DWS Growth Allocation VIP DWS Turner Mid Cap Growth VIP
DWS High Income VIP
--------------------------------------------------------------------------------
The following information replaces similar disclosure under "Revenue Sharing" in
the "Purchase and Redemptions" or "Net Asset Value, Purchase and Redemption of
Shares" section of each Portfolio's Statement of Additional Information:
Revenue Sharing
In light of recent regulatory developments, the Advisor, the Distributor and
their affiliates have undertaken to furnish certain additional information below
regarding the level of payments made by them to selected affiliated and
unaffiliated brokers, dealers, participating insurance companies or other
financial intermediaries ("financial advisors") in connection with the sale
and/or distribution of Portfolio shares or the retention and/or servicing of
investors and Portfolio shares ("revenue sharing").
The Advisor, the Distributor and/or their affiliates may pay additional
compensation, out of their own assets and not as an additional charge to each
Portfolio, to financial advisors in connection with the sale and/or distribution
of Portfolio shares or the retention and/or servicing of Portfolio investors and
Portfolio shares. Such revenue sharing payments are in addition to any
distribution or service fees payable under any Rule 12b-1 or service plan of any
portfolio, any record keeping/sub-transfer agency/networking fees payable by
each Portfolio (generally through the Distributor or an affiliate) and/or the
Distributor to certain financial advisors for performing such services and any
sales charges, commissions, non-cash compensation arrangements expressly
permitted under applicable rules of FINRA or other concessions described in the
fee table or elsewhere in the Prospectuses or the SAI as payable to all
financial advisors. For example, the Advisor, the Distributor and/or their
affiliates may compensate financial advisors for providing each Portfolio with
"shelf space" or access to a third party platform or portfolio offering list, or
other marketing programs including, without limitation, inclusion of each
Portfolio on preferred or recommended sales lists, mutual fund "supermarket"
platforms and other formal sales programs; granting the Distributor access to
the financial advisor's sales force; granting the Distributor access to the
financial advisor's conferences and meetings; assistance in training and
educating the financial advisor's personnel; and, obtaining other forms of
marketing support. The level of revenue sharing payments made to financial
advisors may be a fixed fee or based upon one or more of the following factors:
gross sales, current assets and/or number of accounts of each Portfolio
attributable to the financial advisor, the particular portfolio or portfolio
type or other measures as agreed to by the Advisor, the Distributor and/or their
affiliates and the financial advisors or any combination thereof. The amount of
these payments is determined at the discretion of the Advisor, the Distributor
and/or their affiliates from time to time, may be substantial, and may be
different for different financial advisors based on, for example, the nature of
the services provided by the financial advisor.
The Advisor, the Distributor and/or their affiliates currently make revenue
sharing payments from their own assets in connection with the sale and/or
distribution of DWS Fund shares, or the retention and/or servicing of investors,
to financial advisors in amounts that
generally range from .01% up to .50% of assets of the Portfolio serviced and
maintained by the financial advisor, .05% to .25% of sales of the Portfolio
attributable to the financial advisor, a flat fee of $13,350 up to $500,000, or
any combination thereof. These amounts are annual figures typically paid on a
quarterly basis and are subject to change at the discretion of the Advisor, the
Distributor and/or their affiliates. Receipt of, or the prospect of receiving,
this additional compensation, may influence your financial advisor's
recommendation of this Portfolio or of any particular share class of the
Portfolio. You should review your financial advisor's compensation disclosure
and/or talk to your financial advisor to obtain more information on how this
compensation may have influenced your financial advisor's recommendation of this
Portfolio.
The Advisor, the Distributor and/or their affiliates may also make such revenue
sharing payments to financial advisors under the terms discussed above in
connection with the distribution of both DWS funds and non-DWS funds by
financial advisors to retirement plans that obtain record keeping services from
ADP, Inc. on the DWS Scudder branded retirement plan platform (the "Platform")
with the level of revenue sharing payments being based upon sales of both the
DWS funds and the non-DWS funds by the financial advisor on the Platform or
current assets of both the DWS funds and the non-DWS funds serviced and
maintained by the financial advisor on the Platform.
As of the date hereof, each Portfolio has been advised that the Advisor, the
Distributor and their affiliates expect that the following firms will receive
revenue sharing payments at different points during the coming year as described
above:
Channel: Broker-Dealers and Financial Advisors
AIG Advisors Group
Ameriprise
Cadaret, Grant & Co. Inc.
Capital Analyst, Incorporated
Citigroup Global Markets, Inc. (dba Smith Barney)
Commonwealth Equity Services, LLP (dba Commonwealth Financial Network)
Deutsche Bank Group
Ensemble Financial Services
First Allied Securities
First Clearing/Wachovia Securities
HD Vest Investment Securities, Inc.
ING Advisors Network
John Hancock Distributors LLC
LPL Financial
M.L. Stern & Co.
Meridien Financial Group
Merrill Lynch, Pierce, Fenner & Smith Inc.
Morgan Stanley
Oppenheimer & Co., Inc.
PlanMember Services
Raymond James & Associates
Raymond James Financial Services
RBC Dain Rauscher, Inc
Securities America, Inc.
UBS Financial Services
Wells Fargo Investments, LLC
Channel: Cash Product Platform
Allegheny Investments LTD
Bank of New York (Hare & Co.)
Brown Brothers Harriman
Brown Investment Advisory & Trust Company
Cadaret Grant & Co.
Chicago Mercantile Exchange
D.A. Davidson & Company
Deutsche Bank Group
Emmett A. Larkin Company
Fiduciary Trust Co. - International
2
First Southwest Company
J.P. Morgan Clearing Corp.
Legent Clearing LLC
Lincoln Investment Planning
LPL Financial
Mellon Financial Markets LLC
Mesirow Financial, Inc.
Penson Financial Services
Pershing Choice Platform
ProFunds Distributors, Inc.
Ridge Clearing & Outsourcing Solutions
Robert W. Baird & Co.
Romano Brothers and Company
SAMCO Capital Markets
Smith Moore & Company
Sungard Institutional Brokerage Inc.
Treasury Curve LLC
US Bancorp
UBS Financial Services
William Blair & Company
Channel: Third Party Insurance Platforms
Allstate Life Insurance Company of New York
Ameritas Life Insurance Group
Annuity Investors Life Insurance Company
Columbus Life Insurance Company
Commonwealth Annuity and Life Insurance Company
Companion Life Insurance Company
Connecticut General Life Insurance Company
Farmers New World Life Insurance Company
Fidelity Security Life Insurance Company
First Allmerica Financial Life Insurance Company
First Great West Life and Annuity Company
Genworth Life Insurance Company of New York
Genworth Life and Annuity Insurance Company
Great West Life and Annuity Insurance Company
Hartford Life Insurance Company
Integrity Life Insurance Company
John Hancock Life Insurance companies
Kemper Investors Life Insurance Company
Lincoln Benefit Life Insurance Company
Lincoln Life & Annuity Company of New York
Lincoln National Life Insurance Company
Massachusetts Mutual Life Insurance Group
MetLife Group
Minnesota Life Insurance Company
National Life Insurance Company
National Integrity Life Insurance Company
Nationwide Group
New York Life Insurance and Annuity Corporation
Phoenix Life Insurance Company
Protective Life Insurance
Provident Mutual Life Insurance
Prudential Insurance Company of America
Sun Life Group
Symetra Life Insurance Company
Transamerica Life Insurance Company
3
Union Central Life Insurance Company
United of Omaha Life Insurance Company
United Investors Life Insurance Company
Western Southern Life Assurance Company
Any additions, modifications or deletions to the financial advisors identified
above that have occurred since the date hereof are not reflected.
The Advisor, the Distributor or their affiliates may enter into additional
revenue sharing arrangements or change or discontinue existing arrangements with
financial advisors at any time without notice.
The prospect of receiving, or the receipt of additional compensation or
promotional incentives described above by financial advisors may provide such
financial advisors and/or their salespersons with an incentive to favor sales of
shares of the DWS funds or a particular DWS fund over sales of shares of mutual
funds (or non-mutual fund investments) with respect to which the financial
advisor does not receive additional compensation or promotional incentives, or
receives lower levels of additional compensation or promotional incentives.
Similarly, financial advisors may receive different compensation or incentives
that may influence their recommendation of any particular share class of the
Portfolio or of other portfolios. These payment arrangements, however, will not
change the price that an investor pays for Portfolio shares or the amount that
the Portfolio receives to invest on behalf of an investor and will not increase
Portfolio expenses. You may wish to take such payment arrangements into account
when considering and evaluating any recommendations relating to Portfolio shares
and you should discuss this matter with your financial advisor and review your
financial advisor's disclosures.
It is likely that broker-dealers that execute portfolio transactions for the
Portfolio will include firms that also sell shares of the DWS funds to their
customers. However, the Advisor will not consider sales of DWS fund shares as a
factor in the selection of broker-dealers to execute portfolio transactions for
the DWS funds. Accordingly, the Advisor has implemented policies and procedures
reasonably designed to prevent its traders from considering sales of DWS fund
shares as a factor in the selection of broker-dealers to execute portfolio
transactions for the Portfolio. In addition, the Advisor, the Distributor and/or
their affiliates will not use fund brokerage to pay for their obligation to
provide additional compensation to financial advisors as described above.
Please Retain This Supplement for Future Reference
December 31, 2008
4
Supplement to the currently effective Statements of Additional Information for
the listed Portfolios:
--------------------------------------------------------------------------------
DWS Variable Series I:
DWS Bond VIP
DWS Capital Growth VIP
DWS Global Opportunities VIP
DWS Growth & Income VIP
DWS Health Care VIP
DWS International VIP
DWS Variable Series II:
DWS Balanced VIP
DWS Blue Chip VIP
DWS Conservative Allocation VIP
DWS Core Fixed Income VIP
DWS Davis Venture Value VIP
DWS Dreman High Return Equity VIP
DWS Dreman Small Mid Cap Value VIP
DWS Global Thematic VIP
DWS Government & Agency Securities VIP
DWS Growth Allocation VIP
DWS High Income VIP
DWS International Select Equity VIP
DWS Janus Growth & Income VIP
DWS Large Cap Value VIP
DWS Mid Cap Growth VIP
DWS Moderate Allocation VIP
DWS Small Cap Growth VIP
DWS Strategic Income VIP
DWS Technology VIP
DWS Turner Mid Cap Growth VIP
--------------------------------------------------------------------------------
The following replaces similar language in the "Investment Policies and
Techniques -- General Characteristics of Options" section of the Portfolios'
Statements of Additional Information:
General Characteristics of Options. Put options and call options typically have
similar structural characteristics and operational mechanics regardless of the
underlying instrument on which they are purchased or sold. Thus, the following
general discussion relates to each of the particular types of options discussed
in greater detail below. In addition, many Strategic Transactions involving
options require segregation of a Portfolio's assets in special accounts, as
described in the section entitled "Asset Segregation."
A put option gives the purchaser of the option, upon payment of a premium, the
right to sell, and the writer the obligation to buy, the underlying security,
commodity, index, currency or other instrument at the exercise price. For
instance, each Portfolio's purchase of a put option on a security might be
designed to protect its holdings in the underlying instrument (or, in some
cases, a similar instrument) against a substantial decline in the market value
by giving each Portfolio the right to sell such instrument at the option
exercise price. A call option, upon payment of a premium, gives the purchaser of
the option the right to buy, and the seller the obligation to sell, the
underlying instrument at the exercise price. Each Portfolio's purchase of a call
option on a security, financial future, index, currency or other instrument
might be intended to protect each Portfolio against an increase in the price of
the underlying instrument that it intends to purchase in the future by fixing
the price at which it may purchase such instrument. An American style put or
call option may be exercised at any time during the option period while a
European
style put or call option may be exercised only upon expiration or during a fixed
period prior thereto. Each Portfolio is authorized to purchase and sell exchange
listed options and over-the-counter options ("OTC options"). Exchange listed
options are issued by a regulated intermediary such as the Options Clearing
Corporation ("OCC"), which guarantees the performance of the obligations of the
parties to such options. The discussion below uses the OCC as an example, but is
also applicable to other financial intermediaries.
With certain exceptions, OCC issued and exchange listed options generally settle
by physical delivery of the underlying security or currency, although in the
future cash settlement may become available. Index options and Eurodollar
instruments are cash settled for the net amount, if any, by which the option is
"in-the-money" (i.e., where the value of the underlying instrument exceeds, in
the case of a call option, or is less than, in the case of a put option, the
exercise price of the option) at the time the option is exercised. Frequently,
rather than taking or making delivery of the underlying instrument through the
process of exercising the option, listed options are closed by entering into
offsetting purchase or sale transactions that do not result in ownership of the
new option.
Each Portfolio's ability to close out its position as a purchaser or seller of
an OCC or exchange listed put or call option is dependent, in part, upon the
liquidity of the option market. Among the possible reasons for the absence of a
liquid option market on an exchange are: (i) insufficient trading interest in
certain options; (ii) restrictions on transactions imposed by an exchange; (iii)
trading halts, suspensions or other restrictions imposed with respect to
particular classes or series of options or underlying securities including
reaching daily price limits; (iv) interruption of the normal operations of the
OCC or an exchange; (v) inadequacy of the facilities of an exchange or OCC to
handle current trading volume; or (vi) a decision by one or more exchanges to
discontinue the trading of options (or a particular class or series of options),
in which event the relevant market for that option on that exchange would cease
to exist, although outstanding options on that exchange would generally continue
to be exercisable in accordance with their terms.
The hours of trading for listed options may not coincide with the hours during
which the underlying financial instruments are traded. To the extent that the
option markets close before the markets for the underlying financial
instruments, significant price and rate movements can take place in the
underlying markets that may not be reflected in the option markets.
OTC options are purchased from or sold to securities dealers, financial
institutions or other parties ("Counterparties") through direct bilateral
agreement with the Counterparty. In contrast to exchange listed options, which
generally have standardized terms and performance mechanics, all the terms of an
OTC option, including such terms as method of settlement, term, exercise price,
premium, guarantees and security, are set by negotiation of the parties. Each
Portfolio expects generally to enter into OTC options that have cash settlement
provisions, although it is not required to do so.
Unless the parties provide for it, there is no central clearing or guaranty
function in an OTC option. As a result, if the Counterparty fails to make or
take delivery of the security, currency or other instrument underlying an OTC
option it has entered into with each Portfolio or fails to make a cash
settlement payment due in accordance with the terms of that option, each
Portfolio will lose any premium it paid for the option as well as any
anticipated benefit of the transaction. Accordingly, the Advisor must assess the
creditworthiness of each such Counterparty or any guarantor or credit
enhancement of the Counterparty's credit to determine the likelihood that the
terms of the OTC option will be satisfied. Each Portfolio will engage in OTC
option transactions only with US government securities dealers recognized by the
Federal Reserve Bank of New York as "primary dealers" or broker/dealers,
domestic or foreign banks or other financial institutions which have received
(or the guarantors of the obligation of which have received) a short-term credit
rating of A-1 from S&P or P-1 from Moody's or an equivalent rating from any
other nationally recognized statistical rating organization ("NRSRO") or, in the
case of OTC currency transactions, are determined to be of equivalent credit
quality by the Advisor. The staff of the SEC currently takes the position that
OTC options purchased by each Portfolio, and portfolio securities "covering" the
amount of each Portfolio's obligation pursuant to an OTC option sold by it (the
cost of any sell-back plus the in-the-money amount, if any) are illiquid, and
are subject to each Portfolio's limitation on investing no more than 15% of its
net assets in illiquid securities.
If each Portfolio sells a call option, the premium that it receives may serve as
a partial hedge, to the extent of the option premium, against a decrease in the
value of the underlying securities or instruments in its portfolio or will
increase each Portfolio's income. The sale of put options can also provide
income.
Each Portfolio may purchase and sell call options on securities including, but
not limited to, US Treasury and agency securities, mortgage-backed securities,
foreign sovereign debt, corporate debt securities, equity securities (including
convertible securities) and Eurodollar instruments that are traded on US and
foreign securities exchanges and in the over-the-counter markets, and on
securities indices, currencies and futures contracts. All calls sold by each
Portfolio must be "covered" (i.e., each Portfolio must own the securities or
futures contract subject to the call) or must meet the asset segregation
requirements described below as long as the call is outstanding. Even though
each Portfolio will receive the option premium to help protect it against loss,
a call sold by each Portfolio exposes each Portfolio during the term of the
option to possible loss of opportunity to realize appreciation in the market
price of the underlying security or instrument and may require each Portfolio to
hold a security or instrument which it might otherwise have sold.
Each Portfolio may purchase and sell put options on securities including, but
not limited to, US Treasury and agency securities, mortgage-backed securities,
foreign sovereign debt, corporate debt securities, equity securities (including
convertible securities), Eurodollar instruments (whether or not it holds the
above securities in its portfolio), and on securities indices, currencies and
futures contracts other than futures on individual corporate debt and individual
equity securities. Each Portfolio will not sell put options if, as a result,
more than 50% of each Portfolio's total assets would be required to be
segregated to cover its potential obligations under such put options other than
those with respect to futures and options thereon. In selling put options, there
is a risk that each Portfolio may be required to buy the underlying security at
a disadvantageous price above the market price.
DWS Capital Growth VIP and DWS International VIP may write covered call and put
options on no more than 5% of each Portfolio's net assets; the value of the
aggregate premiums paid for all put and call options held by each of these
Portfolios will not exceed 20% of its total assets.
Please Retain This Supplement for Future Reference
October 22, 2008
SUPPLEMENT TO THE CURRENTLY EFFECTIVE STATEMENTS OF ADDITIONAL INFORMATION
OF EACH OF THE LISTED PORTFOLIOS:
--------------------------------------------------------------------------------
DWS Investments VIT Funds
DWS Equity 500 Index VIP
DWS Small Cap Index VIP
--------------------------------------------------------------------------------
DWS Variable Series I
DWS Bond VIP DWS Growth & Income VIP
DWS Capital Growth VIP DWS Health Care VIP
DWS Global Opportunities VIP DWS International VIP
--------------------------------------------------------------------------------
DWS Variable Series II
DWS Balanced VIP DWS International Select Equity VIP
DWS Blue Chip VIP DWS Janus Growth & Income VIP
DWS Conservative Allocation VIP DWS Large Cap Value VIP
DWS Core Fixed Income VIP DWS Mid Cap Growth VIP
DWS Davis Venture Value VIP DWS Moderate Allocation VIP
DWS Dreman High Return Equity VIP DWS Small Cap Growth VIP
DWS Dreman Small Mid Cap Value VIP DWS Strategic Income VIP
DWS Global Thematic VIP DWS Technology VIP
DWS Government & Agency Securities VIP DWS Turner Mid Cap Growth VIP
DWS Growth Allocation VIP
DWS High Income VIP
Effective on or about September 2, 2008, disclosure in the Portfolio's Statement
of Additional Information that describes the methods of segregating assets or
otherwise "covering" transaction, shall no longer apply, and the following
disclosure replaces similar disclosure, or for certain funds is added as new
disclosure, in each Portfolio's Statement of Additional Information:
Asset Segregation
Certain investment transactions expose the Portfolio to an obligation to make
future payments to third parties. Examples of these types of transactions,
include, but are not limited to, reverse repurchase agreements, short sales,
dollar rolls, when-issued, delayed-delivery or forward commitment transactions
and certain derivatives such as swaps, futures, forwards, and options. To the
extent that the Portfolio engages in such transactions, the Portfolio will (to
the extent required by applicable law) either (1) segregate cash or liquid
assets in the prescribed amount or (2) otherwise "cover" its future obligations
under the transaction, such as by holding an offsetting investment. If the
Portfolio segregates sufficient cash or other liquid assets or otherwise
"covers" its obligations under such transactions, the Portfolio will not
consider the transactions to be borrowings for purposes of its investment
restrictions or "senior securities" under the Investment Company Act of 1940, as
amended (the "1940 Act"), and therefore, such transactions will not be subject
to the 300% asset coverage requirement under the 1940 Act otherwise applicable
to borrowings by the Portfolio.
In some cases (e.g., with respect to futures and forwards that are contractually
required to "cash-settle"), the Portfolio will segregate cash or other liquid
assets with respect to the amount of the daily net (marked-to-market) obligation
arising from the transaction, rather than the notional amount of the underlying
contract. By segregating assets in an amount equal to the net obligation rather
than the notional amount, the Portfolio will have the ability to employ leverage
to a greater extent than if it set aside cash or other liquid assets equal to
the notional amount of the contract, which may increase the risk associated with
such transactions.
The Portfolio may utilize methods of segregating assets or otherwise "covering"
transactions that are currently or in the future permitted under the 1940 Act,
the rules and regulation thereunder, or orders issued by the Securities and
Exchange Commission ("SEC") thereunder. For these purposes, interpretations and
guidance provided by the SEC staff may be taken into account when deemed
appropriate by the Portfolio.
Assets used as segregation or cover cannot be sold while the position in the
corresponding transaction is open, unless they are replaced with other
appropriate assets. As a result, the commitment of a large portion of a
Portfolio's assets for segregation and cover purposes could impede portfolio
management or the Portfolio's ability to meet redemption requests or other
current obligations. Segregating assets or otherwise "covering" for these
purposes does not necessarily limit the percentage of the assets of the
Portfolio that may be at risk with respect to certain derivative transactions.
Please Retain This Supplement for Future Reference
Supplement to the currently effective Statements of Additional Information of
each of the funds/portfolios listed below:
Cash Account Trust DWS Equity Partners Fund DWS Small Cap Core Fund
Government and Agency Securities DWS Europe Equity Fund DWS Small Cap Growth Fund
Portfolio DWS Floating Rate Plus Fund DWS Small Cap Value Fund
Davidson Cash Equivalent Shares DWS Global Bond Fund DWS Strategic Government Securities Fund
Davidson Cash Equivalent Plus Shares DWS Global Opportunities Fund DWS Strategic High Yield Tax-Free Fund
DWS Government & Agency Money Fund DWS Global Thematic Fund DWS Strategic Income Fund
Capital Assets Funds Shares DWS GNMA Fund DWS Target 2010 Fund
Premier Money Market Shares DWS Gold & Precious Metals Fund DWS Target 2011 Fund
Service Shares DWS Growth & Income Fund DWS Target 2012 Fund
Money Market Portfolio DWS Health Care Fund DWS Target 2013 Fund
Capital Assets Funds Shares DWS High Income Fund DWS Target 2014 Fund
Capital Assets Funds Preferred Shares DWS High Income Plus Fund DWS Technology Fund
Davidson Cash Equivalent Shares DWS Inflation Protected Plus Fund DWS U.S. Bond Index Fund
Davidson Cash Equivalent Plus Shares DWS Intermediate Tax/AMT Free Fund DWS Value Builder Fund
Premier Money Market Shares DWS International Fund DWS Variable Series I
Premium Reserve Money Market Shares DWS International Select Equity Fund DWS Bond VIP
Service Shares DWS International Value Opportunities DWS Capital Growth VIP
Tax-Exempt Portfolio Fund DWS Global Opportunities VIP
Capital Assets Funds Shares DWS Investments VIT Funds DWS Growth & Income VIP
Davidson Cash Equivalent Shares DWS Equity 500 Index VIP DWS Health Care VIP
DWS Tax-Free Money Fund Class S DWS Small Cap Index VIP DWS International VIP
DWS Tax-Exempt Money Fund DWS Japan Equity Fund DWS Variable Series II
Premier Money Market Shares DWS Large Cap Value Fund DWS Balanced VIP
Service Shares DWS Large Company Growth Fund DWS Blue Chip VIP
Tax Free Investment Class DWS Latin America Equity Fund DWS Conservative Allocation VIP
Cash Reserve Fund, Inc. DWS LifeCompass 2015 Fund DWS Core Fixed Income VIP
Prime Series DWS LifeCompass 2020 Fund DWS Davis Venture Value VIP
Prime Shares DWS LifeCompass 2030 Fund DWS Dreman High Return Equity VIP
DWS Alternative Asset Allocation Plus Fund DWS LifeCompass 2040 Fund DWS Dreman Small Mid Cap Value VIP
DWS Balanced Fund DWS LifeCompass Income Fund DWS Global Thematic VIP
DWS Blue Chip Fund DWS LifeCompass Protect Fund DWS Government & Agency Securities VIP
DWS California Tax-Free Income Fund DWS LifeCompass Retirement Fund DWS Growth Allocation VIP
DWS Capital Growth Fund DWS Lifecycle Long Range Fund DWS High Income VIP
DWS Climate Change Fund DWS Managed Municipal Bond Fund DWS International Select Equity VIP
DWS Commodity Securities Fund DWS Massachusetts Tax-Free Fund DWS Janus Growth & Income VIP
DWS Communications Fund DWS Micro Cap Fund DWS Large Cap Value VIP
DWS Core Fixed Income Fund DWS Mid Cap Growth Fund DWS Mid Cap Growth VIP
DWS Core Plus Allocation Fund DWS Money Market Prime Series DWS Moderate Allocation VIP
DWS Core Plus Income Fund DWS Money Market Fund DWS Money Market VIP
DWS Disciplined Long/Short Growth Fund DWS Cash Investment Trust Class A DWS Small Cap Growth VIP
DWS Disciplined Long/Short Value Fund DWS Cash Investment Trust Class B DWS Strategic Income VIP
DWS Disciplined Market Neutral Fund DWS Cash Investment Trust Class C DWS Technology VIP
DWS Dreman Concentrated Value Fund DWS Cash Investment Trust Class S DWS Turner Mid Cap Growth VIP
DWS Dreman High Return Equity Fund DWS Money Market Series Investors Cash Trust
DWS Dreman Mid Cap Value Fund Premium Class S Treasury Portfolio
DWS Dreman Small Cap Value Fund Prime Reserve Class S Premier Money Market Shares
DWS EAFE(R) Equity Index Fund DWS New York Tax-Free Income Fund DWS U.S. Treasury Money Fund Class S
DWS Emerging Markets Equity Fund DWS RREEF Global Infrastructure Fund Investment Class Shares
DWS Emerging Markets Fixed Income Fund DWS RREEF Global Real Estate Securities NY Tax Free Money Fund
DWS Enhanced S&P 500 Index Fund Fund Tax Free Money Fund Investment
DWS Equity 500 Index Fund DWS RREEF Real Estate Securities Fund Tax-Exempt California Money Market Fund
DWS Equity Income Fund DWS S&P 500 Index Fund
DWS Short Duration Fund
DWS Short Duration Plus Fund
DWS Short-Term Municipal Bond Fund
Effective July 16, 2008, DWS Scudder Investments will change its name to DWS
Investments. In addition, the Web site for DWS funds will change to
www.dws-investments.com.
Also, effective July 16, 2008, several service providers to the funds and
retirement plans will change their names. The new names will be as follows:
Current Name New Name, effective July 16, 2008
------------ ---------------------------------
DWS Scudder Distributors, Inc. DWS Investments Distributors, Inc. ("DIDI")
DWS Scudder Fund Accounting Corporation DWS Investments Fund Accounting Corporation ("DIFA")
DWS Scudder Investments Service Company DWS Investments Service Company ("DISC")
DWS Scudder Wholesalers DWS Investments Wholesalers
DWS Scudder Flex Plan DWS Investments Flex Plan
DWS Scudder Individual Retirement Account (IRA) DWS Investments Individual Retirement Account (IRA)
DWS Scudder Horizon Plan DWS Investments Horizon Plan
DWS Scudder Profit Sharing and Money Purchase Pension DWS Simplified Profit Sharing and Money Purchase Pension
Plans Plans
DWS Scudder 401(k) Plan DWS Investments 401(k) Plan
DWS Scudder 403(b) Plan DWS Investments 403(b) Plan
DWS Scudder IRA DWS Investments IRA
References to the designation "DWS Scudder" contained in the "Management"
section of each of the funds' Statements of Additional Information are hereby
changed to "DWS Investments." DWS Investments is part of Deutsche Bank's Asset
Management division and, within the United States, represents the retail asset
management activities of Deutsche Bank AG, Deutsche Bank Trust Company Americas,
Deutsche Investment Management Americas Inc. and DWS Trust Company.
Please Retain this Supplement for Future Reference
July 16, 2008
STATEMENT OF ADDITIONAL INFORMATION
May 1, 2008
CLASS A AND B SHARES
DWS VARIABLE SERIES II
345 Park Avenue, New York, New York 10154
1-800-778-1482
This combined Statement of Additional Information is not a prospectus. It should
be read in conjunction with the applicable prospectuses of DWS Variable Series
II (the "Fund") dated May 1, 2008, as amended from time to time. The
prospectuses may be obtained without charge from the Fund by calling the
toll-free number listed above, and are also available along with other related
materials on the Securities and Exchange Commission ("SEC") Internet Web site
(http://www.sec.gov). The prospectuses are also available from Participating
Insurance Companies.
DWS Variable Series II offers a choice of 21 portfolios, 18 of which are
described herein (each a "Portfolio," collectively, the "Portfolios"), to
holders of certain variable life insurance and variable annuity contracts
offered by participating insurance companies ("Participating Insurance
Companies").
The Portfolios described herein are:
DWS Balanced VIP
DWS Blue Chip VIP
DWS Core Fixed Income VIP
DWS Davis Venture Value VIP
DWS Dreman High Return Equity VIP
DWS Dreman Small Mid Cap Value VIP
DWS Global Thematic VIP
DWS Government & Agency Securities VIP
DWS High Income VIP
DWS International Select Equity VIP
DWS Janus Growth & Income VIP
DWS Large Cap Value VIP
DWS Mid Cap Growth VIP
DWS Money Market VIP
DWS Small Cap Growth VIP
DWS Strategic Income VIP
DWS Technology VIP
DWS Turner Mid Cap Growth VIP
TABLE OF CONTENTS
Page
----
INVESTMENT RESTRICTIONS........................................................................2
Portfolio Holdings....................................................................4
INVESTMENT POLICIES AND TECHNIQUES.............................................................5
MANAGEMENT OF THE FUND........................................................................29
Investment Advisor...................................................................29
Administrative Agreement.............................................................50
PORTFOLIO TRANSACTIONS........................................................................51
Compensation of Portfolio Managers Advised by the Advisor or its Affiliates..........61
DISTRIBUTOR...................................................................................92
FUND SERVICE PROVIDERS........................................................................95
Transfer Agent.......................................................................95
Custodian............................................................................97
Independent Registered Public Accounting Firm........................................97
Counsel..............................................................................97
Fund Accounting Agent................................................................97
PURCHASE AND REDEMPTIONS......................................................................98
DIVIDENDS, CAPITAL GAINS AND TAXES...........................................................106
NET ASSET VALUE..............................................................................106
TRUSTEES AND OFFICERS........................................................................108
FUND ORGANIZATION............................................................................135
PROXY VOTING GUIDELINES......................................................................136
ADDITIONAL INFORMATION.......................................................................138
FINANCIAL STATEMENTS.........................................................................139
APPENDIX A...................................................................................140
INVESTMENT RESTRICTIONS
Except as otherwise indicated, each Portfolio's investment objective and
policies are not fundamental and may be changed without a shareholder vote.
There can be no assurance that a Portfolio's investment objective will be met.
If a percentage restriction is adhered to at the time of the investment, a later
increase or decrease in percentage beyond the specified limit resulting from a
change in values or net assets will not be considered a violation.
The Fund has adopted for each Portfolio certain fundamental investment
restrictions that cannot be changed without approval by a "majority" of the
outstanding voting shares of a Portfolio. As defined in the Investment Company
Act of 1940, as amended (the "1940 Act"), this means the lesser of the vote of
(a) 67% of the shares of a Portfolio present at a meeting where more than 50% of
the outstanding shares are present in person or by proxy or (b) more than 50% of
the outstanding shares of a Portfolio.
Each Portfolio (except DWS Technology VIP) is classified as a diversified
open-end management investment company. A diversified portfolio may not, with
respect to 75% of total assets, invest more than 5% of total assets in the
securities of a single issuer or invest in more than 10% of the outstanding
voting securities of such issuer. DWS Technology VIP is classified as a
non-diversified open-end management investment company. A non-diversified
portfolio may invest a greater proportion of its assets in the obligations of a
small number of issuers, and may be subject to greater risk and substantial
losses as a result of changes in the financial condition or the market's
assessment of the issuers. Each of the foregoing Portfolios intends to comply
with the diversification requirements imposed by the Internal Revenue Code of
1986, as amended (the "Code") for qualification as a regulated investment
company.
Each Portfolio may not, as a fundamental policy:
(1) borrow money, except as permitted under the 1940 Act, and as
interpreted or modified by regulatory authority having jurisdiction,
from time to time;
(2) issue senior securities, except as permitted under the 1940 Act, and as
interpreted or modified by regulatory authority having jurisdiction,
from time to time;
(3) for all Portfolios except DWS Money Market VIP and DWS Technology VIP:
concentrate its investments in a particular industry, as that term is
used in the 1940 Act, and as interpreted or modified by regulatory
authority having jurisdiction, from time to time;
(4) for DWS Money Market VIP only: concentrate its investments in a
particular industry (excluding US government obligations), as that term
is used in the 1940 Act, and as interpreted or modified by regulatory
authority having jurisdiction, from time to time, except that the
Portfolio will invest more than 25% of its total assets in the
obligations of banks and other financial institutions;
(5) for DWS Technology VIP only: concentrate its investments in a
particular industry, as that term is used in the 1940 Act, and as
interpreted or modified by regulatory authority having jurisdiction,
from time to time, except that the Portfolio will concentrate its
assets in the group of industries constituting the technology sector
and may concentrate in one or more industries in the technology sector;
(6) engage in the business of underwriting securities issued by others,
except to the extent that a Portfolio may be deemed to be an
underwriter in connection with the disposition of portfolio securities;
(7) purchase or sell real estate, which term does not include securities of
companies which deal in real estate or mortgages or investments secured
by real estate or interests therein, except that a Portfolio reserves
freedom of action to hold and to sell real estate acquired as a result
of a Portfolio's ownership of securities;
(8) purchase or sell commodities, except as permitted by the 1940 Act, as
amended, and as interpreted or modified by the regulatory authority
having jurisdiction from time to time; or
(9) make loans except as permitted under the 1940 Act and as interpreted or
modified by regulatory authority having jurisdiction, from time to
time.
With regard to Restriction (4) above, for purposes of determining the percentage
of DWS Money Market VIP's total assets invested in securities of issuers having
their principal business activities in a particular industry, asset-backed
securities will be classified based on standard classifications utilized by
ratings agencies.
DWS Money Market VIP may not invest more than 50% of its assets in asset-backed
securities.
With regard to Restriction (3) above, for purposes of determining the percentage
of each Portfolio's (except DWS Money Market VIP) total assets invested in
securities of issuers having their principal business activities in a particular
industry, asset-backed securities will be classified as a single industry.
With respect to investment restriction (4) for DWS Money Market VIP, domestic
banks include US banks and US branches of foreign banks that are subject to the
same regulation as US banks. Domestic banks may also include foreign branches of
domestic banks if the investment risk associated with investing in instruments
issued by the foreign branch of a domestic bank is the same as investing in
instruments issued by the domestic parent. As a result, the Portfolio may be
more adversely affected by changes in market or economic conditions and other
circumstances affecting the banking industry than it would be if the Portfolio's
assets were not so concentrated.
The Fund has also adopted the following non-fundamental policies, which may be
changed or eliminated for each Portfolio by the Fund's Board of Trustees without
a shareholder vote:
As a matter of non-fundamental policy, each Portfolio, except DWS Money Market
VIP, does not intend to:
(1) borrow money in an amount greater than 5% of its total assets, except
(i) for temporary or emergency purposes and (ii) by engaging in reverse
repurchase agreements, dollar rolls, or other investments or
transactions described in a Portfolio's registration statement which
may be deemed to be borrowings;
(2) purchase securities on margin or make short sales, except (i) short
sales against the box, (ii) in connection with arbitrage transactions,
(iii) for margin deposits in connection with futures contracts, options
or other permitted investments, (iv) that transactions in futures
contracts and options shall not be deemed to constitute selling
securities short, and (v) that a Portfolio may obtain such short-term
credits as may be deemed necessary for the clearance of securities
transactions;
(3) purchase options, unless the aggregate premiums paid on all such
options held by a Portfolio at any time do not exceed 20% of its total
assets; or sell put options, if as a result, the aggregate value of the
obligations underlying such put options would exceed 50% of its total
assets;
(4) enter into futures contracts or purchase options thereon unless
immediately after the purchase, the value of the aggregate initial
margin with respect to such futures contracts entered into on behalf of
a Portfolio and the premium paid for such options on futures contracts
does not exceed 5% of the fair market value of a Portfolio's total
assets; provided that in the case of an option that is in-the-money at
the time of purchase, the in-the money amount may be excluded in
computing the 5% limit;
(5) purchase warrants if as a result, such securities, taken at the lower
of cost or market value, would represent more than 5% of the value of a
Portfolio's total assets (for this purpose, warrants acquired in units
or attached to securities will be deemed to have no value); and
(6) invest more than 15% of net assets in illiquid securities.
For all Portfolios, except DWS Strategic Income VIP:
(7) acquire securities of registered, open-end investment companies or
registered unit investment trusts in reliance on Sections 12(d)(1)(F)
or 12(d)(1)(G) of the 1940 Act.
For all Portfolios, except DWS Core Fixed Income VIP, DWS Government & Agency
Securities VIP, DWS High Income VIP, DWS Money Market VIP and DWS Strategic
Income VIP:
(8) enter into either of reverse repurchase agreements or dollar rolls in
an amount greater than 5% of its total assets.
For all Portfolios, except DWS Money Market VIP:
(9) lend portfolio securities in an amount greater than one third of its
total assets.
For DWS Money Market VIP only:
(10) borrow money in an amount greater than 5% of its total assets, except
for temporary emergency purposes;
(11) lend portfolio securities in an amount greater than 5% of its total
assets; and
(12) invest more than 10% of total assets in non-affiliated registered
investment companies.
Concentration. DWS Technology VIP "concentrates," for purposes of the 1940 Act,
its assets in securities of companies in the technology sector which means that
at least 25% of its net assets will be invested in these sectors at all times.
As a result, the Portfolio may be subject to greater market fluctuation than a
portfolio which has securities representing a broader range of investment
alternatives.
Portfolio Holdings
In addition to the public disclosure of portfolio holdings through required
Securities and Exchange Commission ("SEC") quarterly filings, a Portfolio may
make its portfolio holdings information publicly available on the DWS Funds' Web
site as described in each Portfolio's prospectuses. Each Portfolio does not
disseminate non-public information about portfolio holdings except in accordance
with policies and procedures adopted by each Portfolio.
Each Portfolio's procedures permit non-public portfolio holdings information to
be shared with Deutsche Asset Management and its affiliates (collectively
"DeAM"), subadvisors, if any, custodians, independent registered public
accounting firms, attorneys, officers and trustees/directors and each of their
respective affiliates and advisers who require access to this information to
fulfill their duties to each Portfolio and are subject to the duties of
confidentiality, including the duty not to trade on non-public information,
imposed by law or contract, or by each Portfolio's procedures. This non-public
information may also be disclosed, subject to the requirements described below,
to securities lending agents, financial printers, proxy voting firms, mutual
fund analysts and rating and tracking agencies, or to shareholders in connection
with in-kind redemptions (collectively, "Authorized Third Parties").
Prior to any disclosure of each Portfolio's non-public portfolio holdings
information to Authorized Third Parties, a person authorized by each Portfolio's
Trustees must make a good faith determination in light of the facts then known
that a Portfolio has a legitimate business purpose for providing the
information, that the disclosure is in the best interest of each Portfolio, and
that the recipient assents or otherwise has a duty to keep the information
confidential and to not trade based on the information received while the
information remains non-public. No compensation is received by each Portfolio or
DeAM for disclosing non-public holdings information. Periodic reports regarding
these procedures will be provided to each Portfolio's Trustees.
Portfolio holdings information distributed by the trading desks of DeAM or a
subadvisor for the purpose of facilitating efficient trading of such securities
and receipt of relevant research is not subject to the foregoing requirements.
Non-public portfolio holding information does not include portfolio
characteristics (other than holdings or subsets of holdings) about each
Portfolio and information derived therefrom, including, but not limited to, how
each Portfolio's investments are divided among various sectors, industries,
countries, value and growth stocks, bonds, currencies and cash, types of bonds,
bond maturities, duration, bond coupons and bond credit quality ratings so long
as each Portfolio's holdings could not be derived from such information.
Registered investment companies that are subadvised by DeAM may be subject to
different portfolio holdings disclosure policies, and neither DeAM nor the
Fund's Trustees exercise control over such policies. In addition, separate
account clients of DeAM have access to their portfolio holdings and are not
subject to a portfolio's portfolio holdings disclosure policy. The portfolio
holdings of some of the funds subadvised by DeAM and some of the separate
accounts managed by DeAM may substantially overlap with the portfolio holdings
of a Portfolio.
DeAM also manages certain unregistered commingled trusts and creates model
portfolios, the portfolio holdings of which may substantially overlap with the
portfolio holdings of a Portfolio. To the extent that investors in these
commingled trusts or recipients of model portfolio holdings information may
receive portfolio holdings information of their trust or of a model portfolio on
a different basis from that on which portfolio holdings information is made
public, DeAM has implemented procedures reasonably designed to encourage such
investors and recipients to keep such information confidential, and to prevent
those investors from trading on the basis of non-public holdings information.
There is no assurance that a Portfolio's policies and procedures with respect to
the disclosure of portfolio holdings information will protect a Portfolio from
the potential misuse of portfolio holdings information by those in possession of
that information.
Master-feeder Fund Structure. The Fund's Board of Trustees has the discretion
with respect to each Portfolio to retain the current distribution arrangement
for the Portfolio while investing in a master fund in a master-feeder fund
structure as described below.
A master-feeder fund structure is one in which a fund (a "feeder fund"), instead
of investing directly in a portfolio of securities, invests most or all of its
investment assets in a separate registered investment company (the "master
fund") with substantially the same investment objective and policies as the
feeder fund. Such a structure permits the pooling of assets of two or more
feeder funds, preserving separate identities or distribution channels at the
feeder fund level. Based on the premise that certain of the expenses of
operating an investment portfolio are relatively fixed, a larger investment
portfolio may eventually achieve a lower ratio of operating expenses to average
net assets. An existing investment company is able to convert to a feeder fund
by selling all of its investments, which involves brokerage and other
transaction costs and realization of a taxable gain or loss, or by contributing
its assets to the master fund and avoiding transaction costs and, if proper
procedures are followed, the realization of taxable gain or loss.
INVESTMENT POLICIES AND TECHNIQUES
General Investment Policies
Each Portfolio is an open-end management investment company which continuously
offers and redeems shares at net asset value. Two classes of shares of each
Portfolio described herein are currently offered through Participating Insurance
Companies. Class A shares are offered at net asset value and are not subject to
a Rule 12b-1 fee. Class B shares are offered at net asset value and are subject
to a Rule 12b-1 fee.
Descriptions in this Statement of Additional Information of a particular
investment practice or technique in which a Portfolio may engage (such as short
selling, hedging, etc.) or a financial instrument which a Portfolio may purchase
(such as options, forward foreign currency contracts, etc.) are meant to
describe the spectrum of investments that Deutsche Investment Management
Americas Inc. ("DIMA" or the "Advisor"), in its discretion, might, but is not
required to, use in managing each Portfolio's assets. The Advisor may, in its
discretion, at any time employ such practice, technique or instrument for one or
more Portfolios but not for all investment companies advised by it. Furthermore,
it is possible that certain types of financial instruments or investment
techniques described herein may not be available, permissible, economically
feasible or effective for their intended purposes in all markets. Certain
practices, techniques or instruments may not be principal activities of a
Portfolio but, to the extent employed, could from time to time have a material
impact on a Portfolio's performance.
It is possible that certain investment practices and techniques described below
may not be permissible for a Portfolio based on its investment restrictions, as
described herein, and in a Portfolio's applicable prospectuses.
Each Portfolio has a different investment objective which it pursues through
separate investment policies, as described below. The differences in objectives
and policies among the Portfolios can be expected to affect the degree of market
and financial risk to which each Portfolio is subject and the return of each
Portfolio. The investment objectives and policies of each Portfolio may, unless
otherwise specifically stated, be changed by the Trustees of the Fund without a
shareholder vote. There is no assurance that the objectives of each Portfolio
will be achieved.
Bank Loans. DWS Balanced VIP, DWS High Income VIP and DWS Strategic Income VIP
may each invest in bank loans, which are typically senior debt obligations of
borrowers (issuers) and as such, are considered to hold a senior position in the
capital structure of the borrower. These may include loans which hold the most
senior position, that hold an equal ranking with other senior debt, or loans
that are, in the judgment of the Advisor, in the category of senior debt of the
borrower. This capital structure position generally gives the holders of these
loans a priority claim on some or all of the borrower's assets in the event of a
default. In most cases, these loans are either partially or fully collateralized
by the assets of a corporation, partnership, limited liability company or other
business entity, or by cash flow that the Advisor believes has a market value at
the time of acquisition that equals or exceeds the principal amount of the loan.
These loans are often issued in connection with recapitalizations, acquisitions,
leveraged buy-outs and refinancings. It is important to note that Moody's and
S&P generally rate bank loans a notch or two higher than high yield bonds of the
same issuer to reflect their more senior position. A Portfolio may invest in
both fixed- and floating-rate loans. In addition, bank loans can trade either as
an "assignment" or "participation." When a Portfolio buys an assignment, it is
essentially becoming a party to the bank agreement. The vast majority of all
trades are assignments and would therefore generally represent the preponderance
of bank loans held by a Portfolio. In certain cases, a Portfolio may buy bank
loans on a participation basis, if for example, a Portfolio did not want to
become party to the bank agreement. However, in all cases, a Portfolio will not
purchase bank loans where Deutsche Bank, or an affiliate, serves as an agent
bank.
Participations and assignments involve credit risk, interest rate risk,
liquidity risk, and the risk of being a lender. If a Portfolio purchases a
participation, it may only be able to enforce its rights through the lender, and
may assume the credit risk of both the lender and the borrower.
Investments in loans through direct assignment of a financial institution's
interests with respect to a loan may involve additional risks. For example, if a
loan is foreclosed, the purchaser could become part owner of any collateral, and
would bear the costs and liabilities associated with owning and disposing of the
collateral. In addition, it is at least conceivable that under emerging legal
theories of lender liability, a purchaser could be held liable as a co-lender.
In the case of loans administered by a bank or other financial institution that
acts as agent for all holders, if assets held by the agent for the benefit of a
purchaser are determined to be subject to the claims of the agent's general
creditors, the purchaser might incur certain costs and delays in realizing
payment on the loan or loan participation and could suffer a loss of principal
or interest.
In the case of loan participations where a bank or other lending institution
serves as financial intermediary between a fund and the borrower, if the
participation does not shift to the portfolio the direct debtor-creditor
relationship with the borrower, SEC interpretations require the portfolios, in
some circumstances, to treat both the lending bank or other lending institution
and the borrower as issuers for purposes of a Portfolio's investment policies.
Treating a financial intermediary as an issuer of indebtedness may restrict a
Portfolio's ability to invest in indebtedness related to a single financial
intermediary, or a group of intermediaries engaged in the same industry, even if
the underlying borrowers represent many different companies and industries.
Borrowing. Each Portfolio will borrow only when the Advisor or a Subadvisor
believes that borrowing will benefit a Portfolio after taking into account all
considerations such as the costs of the borrowing relative to the expected
return. DWS High Income VIP may borrow up to 5% of its net assets against called
and tendered bonds held by the Portfolio. Any borrowing, including borrowing
against called and tendered bonds, is subject to the Portfolio's fundamental and
non-fundamental investment policies.
Borrowing by a Portfolio will involve special risk considerations. To the extent
a Portfolio borrows money, positive or negative performance by a Portfolio's
investments may be magnified. Any gain in the value of securities purchased with
borrowed money, or income earned on such securities, that exceeds the interest
paid on the amount borrowed would cause the net asset value of a Portfolio's
shares to increase more rapidly than otherwise would be the case. Conversely,
any decline in the value of securities purchased, or cost in excess of income
earned, would cause the net asset value of a Portfolio's shares to decrease more
rapidly than otherwise would be the case. Borrowed money thus creates an
opportunity for greater capital gain but at the same time increases exposure to
capital risk. Money borrowed will be subject to interest costs which may or may
not be recovered by appreciation of the securities purchased or from income
received as a holder of those securities. A Portfolio also may be required to
maintain minimum average balances in connection with such borrowing or to pay a
commitment or other fee to maintain a line of credit; either of these
requirements would increase the cost of borrowing over the stated interest rate.
Certificates of Deposit and Bankers' Acceptances. Certificates of deposit are
receipts issued by a depository institution in exchange for the deposit of
funds. The issuer agrees to pay the amount deposited plus interest to the bearer
of the receipt on the date specified on the certificate. The certificate usually
can be traded in the secondary market prior to maturity. Bankers' acceptances
typically arise from short-term credit arrangements designed to enable
businesses to obtain funds to finance commercial transactions. Generally, an
acceptance is a time draft drawn on a bank by an exporter or an importer to
obtain a stated amount of funds to pay for specific merchandise. The draft is
then "accepted" by a bank that, in effect, unconditionally guarantees to pay the
face value of the instrument on its maturity date. The acceptance may then be
held by the accepting bank as an earning asset or it may be sold in the
secondary market at the going rate of discount for a specific maturity. Although
maturities for acceptances can be as long as 270 days, most acceptances have
maturities of six months or less.
Banker's acceptances are credit instruments evidencing the obligations of a bank
to pay a draft drawn on it by a customer. These instruments reflect the
obligation both of the bank and of the drawer to pay the face amount of the
instrument upon maturity.
Time deposits are non-negotiable deposits maintained in a banking institution
for a specified period of time at a stated interest rate. Time deposits which
may be held by the Portfolios will not benefit from insurance from the Bank
Insurance Fund or the Savings Association Insurance Fund administered by the
Federal Deposit Insurance Corporation. Fixed time deposits may be withdrawn on
demand by the investor, but may be subject to early withdrawal penalties that
vary with market conditions and the remaining maturity of the obligation. Fixed
time deposits subject to withdrawal penalties maturing in more than seven
calendar days are subject to a Portfolio's limitation on investments in illiquid
securities.
Collateralized Obligations. Subject to its investment objectives and policies, a
Portfolio may purchase collateralized obligations, including interest only
("IO") and principal only ("PO") securities. A collateralized obligation is a
debt security issued by a corporation, trust or custodian, or by a US government
agency or instrumentality that is collateralized by a portfolio or pool of
mortgages, mortgage-backed securities, US government securities or other assets.
The issuer's obligation to make interest and principal payments is secured by
the underlying pool or portfolio of securities. Collateralized obligations
issued or guaranteed by a US government agency or instrumentality, such as the
Federal Home Loan Mortgage Corporation, are considered US government securities.
Privately-issued collateralized obligations collateralized by a portfolio of US
government securities are not direct obligations of the US government or any of
its agencies or instrumentalities and are not considered US government
securities. A variety of types of collateralized obligations are available
currently and others may become available in the future.
Collateralized obligations, depending on their structure and the rate of
prepayments, can be volatile. Some collateralized obligations may not be as
liquid as other securities. Since collateralized obligations may be issued in
classes with varying maturities and interest rates, the investor may obtain
greater predictability of maturity than with direct investments in
mortgage-backed securities. Classes with shorter maturities may have lower
volatility and lower yield while those with longer maturities may have higher
volatility and higher yield. This provides the investor with greater control
over the characteristics of the investment in a changing interest rate
environment. With respect to interest only and principal only securities, an
investor has the option to select from a pool of underlying collateral the
portion of the cash flows that most closely corresponds to the investor's
forecast of interest rate movements. These instruments tend to be highly
sensitive to prepayment rates on the underlying collateral and thus place a
premium on accurate prepayment projections by the investor.
A Portfolio, other than DWS Money Market VIP, may invest in collateralized
obligations whose yield floats inversely against a specified index rate. These
"inverse floaters" are more volatile than conventional fixed or floating rate
collateralized obligations and the yield thereon, as well as the value thereof,
will fluctuate in inverse proportion to changes in the index upon which rate
adjustments are based. As a result, the yield on an inverse floater will
generally increase when market yields (as reflected by the index) decrease and
decrease when market yields increase. The extent of the volatility of inverse
floaters depends on the extent of anticipated changes in market rates of
interest. Generally, inverse floaters provide for interest rate adjustments
based upon a multiple of the specified interest index, which further increases
their volatility. The degree of additional volatility will be directly
proportional to the size of the multiple used in determining interest rate
adjustments. Currently, none of the Portfolios intends to invest more than 5% of
its net assets in inverse floaters. DWS Money Market VIP does not invest in
inverse floaters.
A Portfolio will currently invest in only those collateralized obligations that
are fully collateralized and that meet the quality standards otherwise
applicable to a Portfolio's investments. Fully collateralized means that the
collateral will generate cash flows sufficient to meet obligations to holders of
the collateralized obligations under even the most conservative prepayment and
interest rate projections. Thus, the collateralized obligations are structured
to anticipate a worst case prepayment condition and to minimize the reinvestment
rate risk for cash flows between coupon dates for the collateralized
obligations. A worst case prepayment condition generally assumes immediate
prepayment of all securities purchased at a premium and zero prepayment of all
securities purchased at a discount. Reinvestment rate risk may be minimized by
assuming very conservative reinvestment rates and by other means such as by
maintaining the flexibility to increase principal distributions in a low
interest rate environment. The effective credit quality of the collateralized
obligations in such instances is the credit quality of the issuer of the
collateral. The requirements as to collateralization are determined by the
issuer or sponsor of the collateralized obligation in order to satisfy rating
agencies, if rated. Payments of principal and interest on the underlying
collateral securities are not passed through directly to the holders of the
collateralized obligations as such. Collateralized obligations, depending on
their structure and the rate of prepayments, can be volatile. Some
collateralized obligations may not be as liquid as other securities.
Collateralized obligations often are issued in two or more classes with varying
maturities and stated rates of interest. Because interest and principal payments
on the underlying securities are not passed through directly to holders of
collateralized obligations, such obligations of varying maturities may be
secured by a single portfolio or pool of securities, the payments on which are
used to pay interest on each class and to retire successive maturities in
sequence. These relationships may in effect "strip" the interest payments from
principal payments of the underlying securities and allow for the separate
purchase of either the interest or the principal payments. Collateralized
obligations are designed to be retired as the underlying securities are repaid.
In the event of prepayment on or call of such securities, the class of
collateralized obligation first to mature generally will be paid down first.
Therefore, although in most cases the issuer of collateralized obligations will
not supply additional collateral in the event of such prepayment, there will be
sufficient collateral to secure collateralized obligations that remain
outstanding. It is anticipated that no more than 5% of a Portfolio's net assets
will be invested in IO and PO securities. Governmentally-issued and
privately-issued IO's and PO's will be considered illiquid for purposes of a
Portfolio's limitation on illiquid securities, however, the Board of Trustees
may adopt guidelines under which governmentally-issued IO's and PO's may be
determined to be liquid.
Common Stocks. Common stock is issued by companies to raise cash for business
purposes and represents a proportionate interest in the issuing companies.
Therefore, a Portfolio participates in the success or failure of any company in
which it holds stock. The market values of common stock can fluctuate
significantly, reflecting the business performance of the issuing company,
investor perception and general economic or financial market movements. Despite
the risk of price volatility, however, common stocks have historically offered a
greater potential for long-term gain on investment, compared to other classes of
financial assets, such as bonds or cash equivalents, although there can be no
assurance that this will be true in the future.
Convertible Securities. Subject to its investment objectives and policies, each
Portfolio (except DWS Money Market VIP) may invest in convertible securities,
that is, bonds, notes, debentures, preferred stocks and other securities which
are convertible into common stock. Investments in convertible securities can
provide an opportunity for capital appreciation and/or income through interest
and dividend payments and/or by virtue of their conversion or exchange features.
The convertible securities in which a Portfolio may invest include fixed-income
or zero coupon debt securities which may be converted or exchanged at a stated
or determinable exchange ratio into underlying shares of common stock including
Liquid Yield Option Notes ("LYONs"(TM)). The exchange ratio for any particular
convertible security may be adjusted from time to time due to stock splits,
dividends, spin-offs, other corporate distributions or scheduled changes in the
exchange ratio. Convertible debt securities and convertible preferred stocks,
until converted, have general characteristics similar to both debt and equity
securities. Although to a lesser extent than with debt securities generally, the
market value of convertible securities tends to decline as interest rates
increase and, conversely, tends to increase as interest rates decline. In
addition, because of the conversion or exchange feature, the market value of
convertible securities typically changes as the market value of the underlying
common stocks changes, and, therefore, also tends to follow movements in the
general market for equity securities. A unique feature of convertible securities
is that as the market price of the underlying common stock declines, convertible
securities tend to trade increasingly on a yield basis, and so may not
experience market value declines to the same extent as the underlying common
stock. When the market price of the underlying common stock increases, the
prices of the convertible securities tend to rise as a reflection of the value
of the underlying common stock, although typically not as much as the underlying
common stock. While no securities investments are without risk, investments in
convertible securities generally entail less risk than investments in common
stock of the same issuer.
Convertible securities often provide for a stream of income (or in the case of
zero coupon securities, accretion of income) with generally higher yields than
common stocks. Convertible securities generally offer lower yields than
non-convertible securities of similar quality because of their conversion or
exchange features. Of course, like all debt securities, there can be no
assurance of income or principal payments because the issuers of the convertible
securities may default on their obligations.
Convertible securities generally are subordinated to other similar but
non-convertible securities of the same issuer, although convertible bonds, as
corporate debt obligations, enjoy seniority in right of payment to all equity
securities, and convertible preferred stock is senior to common stock of the
same issuer. However, because of the subordination feature, convertible bonds
and convertible preferred stock typically have lower ratings than similar
non-convertible securities.
Delayed Delivery Transactions. DWS Balanced VIP, DWS Core Fixed Income VIP, DWS
Davis Venture Value VIP, DWS Dreman High Return Equity, DWS Global Thematic VIP,
DWS Government & Agency Securities VIP, DWS High Income VIP, DWS Janus Growth &
Income VIP, DWS Mid Cap Growth VIP, DWS Strategic Income VIP, DWS Technology VIP
and DWS Turner Mid Cap Growth VIP may purchase or sell portfolio securities on a
when-issued or delayed delivery basis. When-issued or delayed delivery
transactions arise when securities are purchased by the Portfolio with payment
and delivery to take place in the future in order to secure what is considered
to be an advantageous price and yield to the Portfolio at the time of entering
into the transaction. When the Portfolio enters into a delayed delivery
transaction, it becomes obligated to purchase securities and it has all of the
rights and risks attendant to ownership of a security, although delivery and
payment occur at a later date. The value of fixed-income securities to be
delivered in the future will fluctuate as interest rates vary. At the time a
Portfolio makes the commitment to purchase a security on a when-issued or
delayed delivery basis, it will record the transaction and reflect the liability
for the purchase and the value of the security in determining its net asset
value. Likewise, at the time a Portfolio makes the commitment to sell a security
on a delayed delivery basis, it will record the transaction and include the
proceeds to be received in determining its net asset value; accordingly, any
fluctuations in the value of the security sold pursuant to a delayed delivery
commitment are ignored in calculating net asset value so long as the commitment
remains in effect. The Portfolio generally has the ability to close out a
purchase obligation on or before the settlement date, rather than take delivery
of the security.
Depositary Receipts. Investments in securities of foreign issuers may be in the
form of sponsored or unsponsored American Depositary Receipts ("ADRs"), European
Depositary Receipts ("EDRs"), Global Depositary Receipts ("GDRs"), International
Depositary Receipts ("IDRs") and other types of Depositary Receipts (which,
together with ADRs, EDRs, GDRs and IDRs are hereinafter referred to as
"Depositary Receipts"). Depositary Receipts provide indirect investment in
securities of foreign issuers. Prices of unsponsored Depositary Receipts may be
more volatile than if they were sponsored by the issuer of the underlying
securities. Depositary Receipts may not necessarily be denominated in the same
currency as the underlying securities into which they may be converted. In
addition, the issuers of the stock of unsponsored Depositary Receipts are not
obligated to disclose material information in the United States and, therefore,
there may not be a correlation between such information and the market value of
the Depositary Receipts. ADRs are Depository Receipts typically issued by a US
bank or trust company which evidence ownership of underlying securities issued
by a foreign corporation. GDRs, IDRs and other types of Depositary Receipts are
typically issued by foreign banks or trust companies, although they also may be
issued by United States banks or trust companies, and evidence ownership of
underlying securities issued by either a foreign or a United States corporation.
Generally, Depositary Receipts in registered form are designed for use in the
United States securities markets and Depositary Receipts in bearer form are
designed for use in securities markets outside the United States. For purposes
of a Portfolio's investment policies, a Portfolio's investments in ADRs, GDRs
and other types of Depositary Receipts will be deemed to be investments in the
underlying securities. Depositary Receipts, including those denominated in US
dollars, will be subject to foreign currency exchange rate risk. However, by
investing in US dollar-denominated ADRs rather than directly in foreign issuers'
stock, a Portfolio avoids currency risks during the settlement period. In
general, there is a large, liquid market in the United States for most ADRs.
However, certain Depositary Receipts may not be listed on an exchange and
therefore may be illiquid securities.
Direct Debt Instruments. Direct debt instruments are interests in amounts owed
by a corporate, governmental or other borrower to lenders (direct loans), to
suppliers of goods or services (trade claims or other receivables) or to other
parties. DWS Balanced VIP, DWS High Income VIP and DWS Strategic Income VIP may
invest in all types of direct debt investments, but among these investments each
Portfolio currently intends to invest primarily in direct loans and trade
claims.
When a Portfolio participates in a direct loan it will be lending money directly
to an issuer. Direct loans generally do not have an underwriter or agent bank,
but instead, are negotiated between a company's management team and a lender or
group of lenders. Direct loans typically offer better security and structural
terms than other types of high yield securities. Direct debt obligations are
often the most senior-obligations in an issuer's capital structure or are
well-collateralized so that overall risk is lessened.
Trade claims are unsecured rights of payment arising from obligations other than
borrowed funds. Trade claims include vendor claims and other receivables that
are adequately documented and available for purchase from high yield
broker-dealers. Trade claims typically may sell at a discount. In addition to
the risks otherwise associated with low-quality obligations, trade claims have
other risks, including the possibility that the amount of the claim may be
disputed by the obligor. Trade claims normally would be considered illiquid and
pricing can be volatile.
Direct debt instruments involve a risk of loss in case of default or insolvency
of the borrower. A Portfolio will rely primarily upon the creditworthiness of
the borrower and/or the collateral for payment of interest and repayment of
principal. The value of a Portfolio's investments may be adversely affected if
scheduled interest or principal payments are not made. Because most direct loans
will be secured, there will be a smaller risk of loss with direct loans than
with an investment in unsecured high yield bonds or trade claims. Indebtedness
of borrowers whose creditworthiness is poor involves substantially greater risks
and may be highly speculative. Borrowers that are in bankruptcy or restructuring
may never pay off their indebtedness or may pay only a small fraction of the
amount owed. Investments in direct debt instruments also involve interest rate
risk and liquidity risk. However, interest rate risk is lessened by the
generally short-term nature of direct debt instruments and their interest rate
structure, which typically floats. To the extent the direct debt instruments in
which a Portfolio invests are considered illiquid, the lack of a liquid
secondary market (1) will have an adverse impact on the value of such
instruments, (2) will have an adverse impact on the Portfolio's ability to
dispose of them when necessary to meet the Portfolio's liquidity needs or in
response to a specific economic event, such as a decline in creditworthiness of
the issuer, and (3) may make it more difficult for the Portfolio to assign a
value of these instruments for purposes of valuing the Portfolio's portfolio and
calculating its net asset value. In order to lessen liquidity risk, each
Portfolio anticipates investing primarily in direct debt instruments that are
quoted and traded in the high yield market and will not invest in these
instruments if it would cause more than 15% of the Portfolio's net assets to be
illiquid. Trade claims may also present a tax risk to a Portfolio. The
Portfolios will not invest in trade claims if it affects the Portfolio's
qualification as a regulated investment company under the Code.
Foreign Fixed-Income Securities. Since most foreign fixed-income securities are
not rated, a Portfolio will invest in foreign fixed-income securities based upon
the Advisor's or subadvisor's analysis without relying on published ratings.
Since such investments will be based upon the Advisor or subadvisor's analysis
rather than upon published ratings, achievement of a Portfolio's goals may
depend more upon the abilities of the Advisor or subadvisor than would otherwise
be the case.
The value of the foreign fixed-income securities held by a Portfolio, and thus
the net asset value of the Portfolio's shares, generally will fluctuate with (a)
changes in the perceived creditworthiness of the issuers of those securities,
(b) movements in interest rates, and (c) changes in the relative values of the
currencies in which a Portfolio's investments in fixed-income securities are
denominated with respect to the US dollar. The extent of the fluctuation will
depend on various factors, such as the average maturity of a Portfolio's
investments in foreign fixed-income securities, and the extent to which a
Portfolio hedges against its interest rate, credit and currency exchange rate
risks. Many of the foreign fixed-income obligations in which a Portfolio will
invest will have long maturities. A longer average maturity generally is
associated with a higher level of volatility in the market value of such
securities in response to changes in market conditions.
Investment in sovereign debt, including Brady Bonds, can involve a high degree
of risk. The governmental entity that controls the repayment of sovereign debt
may not be able or willing to repay the principal and/or interest when due in
accordance with the terms of such debt. A governmental entity's willingness or
ability to repay principal and interest due in a timely manner may be affected
by, among other factors, its cash flow situation, the extent of its foreign
reserves, the availability of sufficient foreign exchange on the date a payment
is due, the relative size of the debt service burden to the economy as a whole,
the governmental entity's policy toward the International Monetary Fund, and the
political constraints to which a governmental entity may be subject.
Governmental entities may also be dependent on expected disbursements from
foreign governments, multilateral agencies and others abroad to reduce principal
and interest arrearages on their debt. The commitment on the part of these
governments, agencies and others to make such disbursements may be conditioned
on a governmental entity's implementation of economic reforms and/or economic
performance and the timely service of such debtor's obligations. Failure to
implement such reforms, achieve such levels of economic performance or repay
principal or interest when due may result in the cancellation of such third
parties commitments to lend funds to the governmental entity, which may further
impair such debtor's ability or willingness to service its debts in a timely
manner. Consequently, governmental entities may default on their sovereign debt.
Holders of sovereign debt may be requested to participate in the rescheduling of
such debt and to extend further loans to governmental entities. There is no
bankruptcy proceeding by which sovereign debt on which governmental entities
have defaulted may be collected in whole or in part.
Brady Bonds are debt securities issued under a plan implemented to allow debtor
nations to restructure their outstanding commercial bank indebtedness. Foreign
governmental issuers of debt or the governmental authorities that control the
repayment of the debt may be unable or unwilling to repay principal or pay
interest when due. In the event of default, there may be limited or no legal
recourse in that, generally, remedies for defaults must be pursued in the courts
of the defaulting party. Political conditions, especially a sovereign entity's
willingness to meet the terms of its fixed-income securities, are of
considerable significance. Also, there can be no assurance that the holders of
commercial bank loans to the same sovereign entity may not contest payments to
the holders of sovereign debt in the event of default under commercial bank loan
agreements. In addition, there is no bankruptcy proceeding with respect to
sovereign debt on which a sovereign has defaulted, and a Portfolio may be unable
to collect all or any part of its investment in a particular issue.
Foreign investment in certain sovereign debt is restricted or controlled to
varying degrees, including requiring governmental approval for the repatriation
of income, capital or proceeds of sales by foreign investors. These restrictions
or controls may at times limit or preclude foreign investment in certain
sovereign debt or increase the costs and expenses of a Portfolio. A significant
portion of the sovereign debt in which a Portfolio may invest is issued as part
of debt restructuring and such debt is to be considered speculative. There is a
history of defaults with respect to commercial bank loans by public and private
entities issuing Brady Bonds. All or a portion of the interest payments and/or
principal repayment with respect to Brady Bonds may be uncollateralized.
Foreign Securities. DWS Mid Cap Growth VIP, DWS Blue Chip VIP, DWS Balanced VIP
and DWS Small Cap Growth VIP invest mainly in US common stocks, but may invest
up to 25% of its total assets in foreign securities. DWS High Income VIP
generally invests in US bonds or instruments, but up to 50% of its total assets
could be in bonds from foreign issuers. DWS Core Fixed Income VIP generally
invests in US bonds or instruments, but up to 25% of its total assets could be
in bonds from foreign issuers. DWS Technology VIP invests mainly in US stocks,
but may invest up to 35% and 20%, respectively, of net assets in foreign
securities. DWS Dreman High Return Equity VIP and DWS Dreman Small Mid Cap Value
VIP may invest up to 20% of net assets in US dollar-denominated American
Depositary Receipts ("ADRs") and in securities of foreign companies traded
principally in securities markets outside the US. DWS Money Market VIP and DWS
Government & Agency Securities VIP, each within its quality standards, may also
invest in securities of foreign issuers. However, such investments will be in US
dollar-denominated instruments.
Investing in foreign securities involves certain special considerations,
including those set forth below, which are not typically associated with
investing in US securities and which may favorably or unfavorably affect a
Portfolio's performance. As foreign companies are not generally subject to
uniform accounting, auditing and financial reporting standards, practices and
requirements comparable to those applicable to domestic companies, there may be
less publicly available information about a foreign company than about a
domestic company. Many foreign securities markets, while growing in volume of
trading activity, have substantially less volume than the US market, and
securities of some foreign issuers are less liquid and more volatile than
securities of domestic issuers. Similarly, volume and liquidity in most foreign
bond markets is less than in the US and, at times, volatility of price can be
greater than in the US. Fixed commissions on some foreign securities exchanges
and bid to asked spreads in foreign bond markets are generally higher than
commissions or bid to asked spreads on US markets, although the Advisor and a
subadvisor will endeavor to achieve the most favorable net results on its
portfolio transactions. There is generally less governmental supervision and
regulation of securities exchanges, brokers and listed companies in foreign
countries than in the US. It may be more difficult for a Portfolio's agents to
keep currently informed about corporate actions in foreign countries which may
affect the prices of portfolio securities. Communications between the US and
foreign countries may be less reliable than within the US, thus increasing the
risk of delayed settlements of portfolio transactions or loss of certificates
for portfolio securities. Payment for securities without delivery may be
required in certain foreign markets. In addition, with respect to certain
foreign countries, there is the possibility of expropriation or confiscatory
taxation, political or social instability, or diplomatic developments which
could affect US investments in those countries. Moreover, individual foreign
economies may differ favorably or unfavorably from the US economy in such
respects as growth of gross national product, rate of inflation, capital
reinvestment, resource self-sufficiency and balance of payments position. The
management of a Portfolio seeks to mitigate the risks associated with the
foregoing considerations through continuous professional management.
High Yield, High Risk Bonds. Certain Portfolios may also purchase debt
securities which are rated below investment-grade (commonly referred to as "junk
bonds" or "high yield"), that is, rated below Baa by Moody's or below BBB by S&P
or judged to be of equivalent quality as determined by the Advisor or
subadvisor. These securities usually entail greater risk (including the
possibility of default or bankruptcy of the issuers of such securities),
generally involve greater volatility of price and risk to principal and income,
and may be less liquid, than securities in the higher rating categories. The
lower the ratings of such debt securities, the more their risks render them like
equity securities. Securities rated D may be in default with respect to payment
of principal or interest. See the Appendix to this Statement of Additional
Information for a more complete description of the ratings assigned by ratings
organizations and their respective characteristics.
Issuers of such high yielding securities often are highly leveraged and may not
have available to them more traditional methods of financing. Therefore, the
risk associated with acquiring the securities of such issuers generally is
greater than is the case with higher rated securities. For example, during an
economic downturn or a sustained period of rising interest rates, highly
leveraged issuers of high yield securities may experience financial stress.
During such periods, such issuers may not have sufficient revenues to meet their
interest payment obligations. The issuer's ability to service its debt
obligations may also be adversely affected by specific corporate developments,
or the issuer's inability to meet specific projected business forecasts, or the
unavailability of additional financing. The risk of loss from default by the
issuer is significantly greater for the holders of high yield securities because
such securities are generally unsecured and are often subordinated to other
creditors of the issuer. Prices and yields of high yield securities will
fluctuate over time and, during periods of economic uncertainty, volatility of
high yield securities may adversely affect a Portfolio's net asset value. In
addition, investments in high yield zero coupon or pay-in-kind bonds, rather
than income-bearing high yield securities, may be more speculative and may be
subject to greater fluctuations in value due to changes in interest rates.
A Portfolio may have difficulty disposing of certain high yield (high risk)
securities because they may have a thin trading market. Because not all dealers
maintain markets in all high yield securities, a Portfolio anticipates that such
securities could be sold only to a limited number of dealers or institutional
investors. The lack of a liquid secondary market may have an adverse effect on
the market price and a Portfolio's ability to dispose of particular issues and
may also make it more difficult for a Portfolio to obtain accurate market
quotations for purposes of valuing a Portfolio's assets. Market quotations
generally are available on many high yield issues only from a limited number of
dealers and may not necessarily represent firm bids of such dealers or prices
for actual sales. Adverse publicity and investor perceptions may decrease the
values and liquidity of high yield securities. These securities may also involve
special registration responsibilities, liabilities and costs, and liquidity and
valuation difficulties.
Credit quality in the high-yield securities market can change suddenly and
unexpectedly, and even recently-issued credit ratings may not fully reflect the
actual risks posed by a particular high-yield security. For these reasons, it is
generally the policy of the Advisor and Subadvisors not to rely exclusively on
ratings issued by established credit rating agencies, but to supplement such
ratings with their own independent and ongoing review of credit quality. The
achievement of a Portfolio's investment objective by investment in such
securities may be more dependent on the Advisor's or Subadvisor's credit
analysis than is the case for higher quality bonds. Should the rating of a
portfolio security be downgraded, the Advisor or Subadvisor will determine
whether it is in the best interests of the Portfolio to retain or dispose of
such security.
Prices for below investment-grade securities may be affected by legislative and
regulatory developments. Also, Congress has from time to time considered
legislation which would restrict or eliminate the corporate tax deduction for
interest payments in these securities and regulate corporate restructurings.
Such legislation may significantly depress the prices of outstanding securities
of this type.
DWS Core Fixed Income VIP will not invest more than 5% of its net assets in junk
bonds.
iGAP Strategy (for DWS Balanced VIP and DWS Strategic Income VIP). In addition
to each portfolio's main investment strategy, the Advisor seeks to enhance
returns by employing a global tactical asset allocation overlay strategy. This
strategy, which the Advisor calls iGAP (integrated Global Alpha Platform),
attempts to take advantage of short-term mispricings within global bond,
currency markets and global equity markets (DWS Balanced VIP only). The iGAP
strategy is implemented through the use of derivatives and is expected to have a
low correlation to a portfolio's bond holdings.
Interfund Borrowing and Lending Program. The Fund has received exemptive relief
from the SEC which permits a Portfolio to participate in an interfund lending
program among certain investment companies advised by the Advisor. The interfund
lending program allows the participating portfolios to borrow money from and
loan money to each other for temporary or emergency purposes. The program is
subject to a number of conditions designed to ensure fair and equitable
treatment of all participating funds, including the following: (1) no Portfolio
may borrow money through the program unless it receives a more favorable
interest rate than a rate approximating the lowest interest rate at which bank
loans would be available to any of the participating portfolio under a loan
agreement; and (2) no Portfolio may lend money through the program unless it
receives a more favorable return than that available from an investment in
repurchase agreements and, to the extent applicable, money market cash sweep
arrangements. In addition, a Portfolio may participate in the program only if
and to the extent that such participation is consistent with the Portfolio's
investment objectives and policies (for instance, money market funds would
normally participate only as lenders and tax exempt funds only as borrowers).
Interfund loans and borrowings may extend overnight, but could have a maximum
duration of seven days. Loans may be called on one day's notice. A Portfolio may
have to borrow from a bank at a higher interest rate if an interfund loan is
called or not renewed. Any delay in repayment to a lending Portfolio could
result in a lost investment opportunity or additional costs. The program is
subject to the oversight and periodic review by the Boards of Trustees.
Borrowings through the interfund lending program are subject to each Portfolio's
policies on borrowing.
Investment Company Securities. Each Portfolio may acquire securities of other
investment companies to the extent consistent with its investment objective and
policies and subject to the limitations of the 1940 Act. The Portfolio will
indirectly bear its proportionate share of any management fees and other
expenses paid by such other investment companies. For example, a Portfolio may
invest in a variety of investment companies which seek to track the composition
and performance of specific indexes or a specific portion of an index. These
index-based investments hold substantially all of their assets in securities
representing their specific index or a specific portion of an index.
Accordingly, the main risk of investing in index-based investments is the same
as investing in a portfolio of equity securities comprising the index. The
market prices of index-based investments will fluctuate in accordance with both
changes in the market value of their underlying portfolio securities and due to
supply and demand for the instruments on the exchanges on which they are traded
(which may result in their trading at a discount or premium to their NAVs).
Index-based investments may not replicate exactly the performance of their
specified index because of transaction costs and because of the temporary
unavailability of certain component securities of the index.
Examples of index-based investments include:
SPDRs(R): SPDRs, an acronym for "Standard & Poor's Depositary Receipts," are
based on the S&P 500 Composite Stock Price Index. They are issued by the SPDR
Trust, a unit investment trust that holds shares of substantially all the
companies in the S&P 500 in substantially the same weighting and seeks to
closely track the price performance and dividend yield of the Index.
MidCap SPDRs(R): MidCap SPDRs are based on the S&P MidCap 400 Index. They are
issued by the MidCap SPDR Trust, a unit investment trust that holds a portfolio
of securities consisting of substantially all of the common stocks in the S&P
MidCap 400 Index in substantially the same weighting and seeks to closely track
the price performance and dividend yield of the S&P Mid Cap 400 Index.
Select Sector SPDRs(R): Select Sector SPDRs are based on a particular sector or
group of industries that are represented by a specified Select Sector Index
within the Standard & Poor's Composite Stock Price Index. They are issued by The
Select Sector SPDR Trust, an open-end management investment company with nine
portfolios that each seeks to closely track the price performance and dividend
yield of a particular Select Sector Index.
DIAMONDS(SM): DIAMONDS are based on the Dow Jones Industrial Average(SM). They
are issued by the DIAMONDS Trust, a unit investment trust that holds a portfolio
of all the component common stocks of the Dow Jones Industrial Average and seeks
to closely track the price performance and dividend yield of the Dow.
Nasdaq-100 Shares: Nasdaq-100 Shares are based on the Nasdaq 100 Index. They are
issued by the Nasdaq-100 Trust, a unit investment trust that holds a portfolio
consisting of substantially all of the securities, in substantially the same
weighting, as the component stocks of the Nasdaq-100 Index and seeks to closely
track the price performance and dividend yield of the Nasdaq-100 Index.
The DWS Strategic Income VIP may invest in shares of DWS Floating Rate Plus
Fund. DWS Floating Rate Plus Fund seeks to provide high current income. DWS
Floating Rate Plus Fund pursues its objective by investing, under normal
circumstances, at least 80% of its total assets in adjustable rate loans that
have a senior right to payment ("Senior Loans") and other floating rate debt
securities. DWS Floating Rate Plus Fund also seeks to enhance returns by
employing a global tactical asset allocation strategy that is implemented
through the use of derivatives.
Investment-Grade Bonds. "Investment-grade" bonds are those rated Aaa, Aa, A or
Baa by Moody's or AAA, AA, A or BBB by S&P or, if unrated, judged to be of
equivalent quality as determined by the Advisor or a Subadvisor. Moody's
considers bonds it rates Baa to have speculative elements as well as
investment-grade characteristics. To the extent that a Portfolio invests in
higher-grade securities, a Portfolio will not be able to avail itself of
opportunities for higher income which may be available at lower grades.
Investment of Uninvested Cash Balances. Each Portfolio may have cash balances
that have not been invested in portfolio securities ("Uninvested Cash").
Uninvested Cash may result from a variety of sources, including dividends or
interest received from portfolio securities, unsettled securities transactions,
reserves held for investment strategy purposes, scheduled maturity of
investments, liquidation of investment securities to meet anticipated
redemptions and dividend payments, and new cash received from investors.
Uninvested Cash may be invested directly in money market instruments or other
short-term debt obligations. Pursuant to an Exemptive Order issued by the SEC,
each Portfolio (except DWS Money Market VIP) may use Uninvested Cash to purchase
shares of affiliated funds including money market funds, short-term bond funds
and Cash Management QP Trust or one or more future entities for which DIMA acts
as trustee or investment advisor that operate as cash management investment
vehicles and that are excluded from the definition of investment company
pursuant to Section 3(c)(1) or 3(c)(7) of the 1940 Act (collectively, the
"Central Funds") in excess of the limitations of Section 12(d)(1) of the 1940
Act. Investment by each Portfolio in shares of the Central Funds will be in
accordance with the Portfolio's investment policies and restrictions as set
forth in its registration statement. Currently, DWS Money Market VIP does not
intend to invest in Central Funds.
Certain of the Central Funds comply with Rule 2a-7 under the 1940 Act. The other
Central Funds are or will be short-term bond funds that invest in fixed-income
securities and maintain a dollar-weighted average maturity of three years or
less. Each of the Central Funds will be managed specifically to maintain a
highly liquid portfolio, and access to them will enhance each Portfolio's
ability to manage Uninvested Cash.
Each Portfolio will invest Uninvested Cash in Central Funds only to the extent
that each Portfolio's aggregate investment in the Central Funds does not exceed
25% of its total assets (except DWS Core Fixed Income VIP cannot exceed 20% of
its total assets) in shares of the Central Funds. Purchase and sales of shares
of Central Funds are made at net asset value.
Lending of Portfolio Securities. Each Portfolio (with the exception of DWS Money
Market VIP) may lend its investment securities to approved institutional
borrowers who need to borrow securities in order to complete certain
transactions, such as covering short sales, avoiding failures to deliver
securities or completing arbitrage operations. By lending their investment
securities, the Portfolios attempt to increase their net investment income
through the receipt of interest on the loan. Any gain or loss in the market
price of the securities loaned that might occur during the term of the loan
would belong to a Portfolio. A Portfolio may lend its investment securities so
long as the terms, structure and the aggregate amount of such loans are not
inconsistent with the 1940 Act or the rules and regulations or interpretations
of the SEC thereunder, which currently require that (a) the borrower pledge and
maintain with a Portfolio collateral consisting of liquid, unencumbered assets
having a value at all times not less than 100% of the value of the securities
loaned, (b) the borrower add to such collateral whenever the price of the
securities loaned rises (i.e., the borrower "marks to the market" on a daily
basis), (c) the loan be made subject to termination by a Portfolio at any time,
and (d) a Portfolio receives reasonable interest on the loan (which may include
the Portfolio investing any cash collateral in interest bearing short-term
investments), and distributions on the loaned securities and any increase in
their market value. There may be risks of delay in recovery of the securities or
even loss of rights in the collateral should the borrower of the securities fail
financially. However, loans will be made only to borrowers selected by a
Portfolio's delegate after a commercially reasonable review of relevant facts
and circumstances, including the creditworthiness of the borrower.
At the present time, the staff of the SEC does not object if an investment
company pays reasonable negotiated fees in connection with loaned securities, so
long as such fees are set forth in a written contract and approved by the
investment company's Board of Trustees/Directors. In addition, voting rights may
pass with the loaned securities, but if a material event occurs affecting an
investment on loan, the loan must be called and the securities voted. Pursuant
to an exemptive order granted by the SEC, cash collateral received by a
Portfolio may be invested in a money market fund managed by the Advisor or a
subadvisor (or one of its affiliates).
Maintenance of $1.00 Net Asset Value, Credit Quality and Portfolio Maturity. DWS
Money Market VIP effects sales, redemptions and repurchases at the net asset
value per share, normally $1.00. In fulfillment of its responsibilities under
Rule 2a-7 of the 1940 Act, the Portfolio's Board has approved policies
established by the Portfolio's Advisor reasonably calculated to prevent the
Portfolio's net asset value per share from deviating from $1.00 except under
unusual or extraordinary circumstances and the Portfolio's Board will
periodically review the Advisor's operations under such policies at regularly
scheduled Board meetings. Those policies include a weekly monitoring by the
Advisor of unrealized gains and losses in the Portfolio's portfolio, and when
necessary, in an effort to avoid deviation, taking corrective action, such as
adjusting the maturity of the portfolio, or, if possible, realizing gains or
losses to offset in part unrealized losses or gains. The result of those
policies may be that the yield on shares of the Portfolio will be lower than
would be the case if the policies were not in effect. Such policies also provide
for certain action to be taken with respect to portfolio securities which
experience a downgrade in rating or suffer a default.
Mortgage-Backed and Asset-Backed Securities
General. Each Portfolio may invest in mortgage-backed securities, which
represent direct or indirect participations in, or are collateralized by and
payable from, mortgage loans secured by real property. Each Portfolio may also
invest in asset-backed securities, which represent participations in, or are
secured by and payable from, assets such as motor vehicle installment sales,
installment loan contracts, leases of various types of real and personal
property and receivables from revolving credit (credit card) agreements and
other categories of receivables. Such securities are generally issued by trusts
and special purpose corporations.
Mortgage-backed and asset-backed securities are often subject to more rapid
repayment than their stated maturity date would indicate as a result of the
pass-through of prepayments of principal on the underlying loans. During periods
of declining interest rates, prepayment of loans underlying mortgage-backed and
asset-backed securities can be expected to accelerate, and thus impair each
Portfolio's ability to reinvest the returns of principal at comparable yields.
Accordingly, the market values of such securities will vary with changes in
market interest rates generally and in yield differentials among various kinds
of US Government securities and other mortgage-backed and asset-backed
securities. Asset-backed securities present certain risks that are not presented
by mortgage-backed securities because asset-backed securities generally do not
have the benefit of a security interest in collateral that is comparable to
mortgage assets. In addition, there is the possibility that, in some cases,
recoveries on repossessed collateral may not be available to support payments on
these securities. Many mortgage and asset-backed securities may be considered
derivative instruments.
Mortgage-Backed. Each Portfolio may invest in mortgage-backed securities,
including derivative instruments. Mortgage-backed securities represent direct or
indirect participations in or obligations collateralized by and payable from
mortgage loans secured by real property. Each Portfolio may invest in
mortgage-backed securities issued or guaranteed by US Government agencies or
instrumentalities such as the Government National Mortgage Association ("GNMA"),
the Federal National Mortgage Association ("FNMA") and the Federal Home Loan
Mortgage Corporation ("FHLMC"). Obligations of GNMA are backed by the full faith
and credit of the US Government. Obligations of FNMA and FHLMC are not backed by
the full faith and credit of the US Government but are considered to be of high
quality since they are considered to be instrumentalities of the US. The market
value and yield of these mortgage-backed securities can vary due to market
interest rate fluctuations and early prepayments of underlying mortgages. These
securities represent ownership in a pool of Federally insured mortgage loans
with a maximum maturity of 30 years. The scheduled monthly interest and
principal payments relating to mortgages in the pool will be "passed through" to
investors. Government mortgage-backed securities differ from conventional bonds
in that principal is paid back to the certificate holders over the life of the
loan rather than at maturity. As a result, there will be monthly scheduled
payments of principal and interest.
Each Portfolio may invest in mortgage-backed securities issued by
non-governmental entities including collateralized mortgage obligations ("CMOs")
and real estate mortgage investment conduits ("REMICs"). CMOs are securities
collateralized by mortgages, mortgage pass-throughs, mortgage pay-through bonds
(bonds representing an interest in a pool of mortgages where the cash flow
generated from the mortgage collateral pool is dedicated to bond repayment), and
mortgage-backed bonds (general obligations of the issuers payable out of the
issuers' general funds and additionally secured by a first lien on a pool of
single family detached properties). Many CMOs are issued with a number of
classes or series that have different maturities and are retired in sequence.
Investors purchasing such CMOs in the shortest maturities receive or are
credited with their pro rata portion of the unscheduled prepayments of principal
up to a predetermined portion of the total CMO obligation. Until that portion of
such CMO obligation is repaid, investors in the longer maturities receive
interest only. Accordingly, the CMOs in the longer maturity series are less
likely than other mortgage pass-throughs to be prepaid prior to their stated
maturity. Although some of the mortgages underlying CMOs may be supported by
various types of insurance, and some CMOs may be backed by GNMA certificates or
other mortgage pass-throughs issued or guaranteed by US Government agencies or
instrumentalities, the CMOs themselves are not generally guaranteed.
REMICs are private entities formed for the purpose of holding a fixed pool of
mortgages secured by an interest in real property. REMICs are similar to CMOs in
that they issue multiple classes of securities, including "regular" interests
and "residual" interests. Each Portfolio does not intend to acquire residual
interests in REMICs, due to certain disadvantages for regulated investment
companies that acquire such interests. Mortgage-backed securities are subject to
unscheduled principal payments representing prepayments on the underlying
mortgages. Although these securities may offer yields higher than those
available from other types of securities, mortgage-backed securities may be less
effective than other types of securities as a means of "locking in" attractive
long-term rates because of the prepayment feature. For instance, when interest
rates decline, the value of these securities likely will not rise as much as
comparable debt securities due to the prepayment feature. In addition, these
prepayments can cause the price of a mortgage-backed security originally
purchased at a premium to decline in price to its par value, which may result in
a loss.
Due to prepayments of the underlying mortgage instruments, mortgage-backed
securities do not have a known actual maturity. In the absence of a known
maturity, market participants generally refer to an estimated average life. The
Advisor believes that the estimated average life is the most appropriate measure
of the maturity of a mortgage-backed security. Accordingly, in order to
determine whether such security is a permissible investment, it will be deemed
to have a remaining maturity of three years or less if the average life, as
estimated by the Advisor, is three years or less at the time of purchase of the
security by each Portfolio. An average life estimate is a function of an
assumption regarding anticipated prepayment patterns. The assumption is based
upon current interest rates, current conditions in the relevant housing markets
and other factors. The assumption is necessarily subjective, and thus different
market participants could produce somewhat different average life estimates with
regard to the same security. Although the Advisor will monitor the average life
of the portfolio securities of each Portfolio with a portfolio maturity policy
and make needed adjustments to comply with each Portfolio's policy as to average
dollar weighted portfolio maturity, there can be no assurance that the average
life of portfolio securities as estimated by the Advisor will be the actual
average life of such securities.
Asset-Backed Securities. Asset-backed securities may include pools of mortgages
("mortgage-backed securities"), loans, receivables or other assets. Payment of
principal and interest may be largely dependent upon the cash flows generated by
the assets backing the securities. Asset-backed securities present certain risks
that are not presented by mortgage-backed securities. Primarily, these
securities may not have the benefit of any security interest in the related
assets. Credit card receivables are generally unsecured and the debtors are
entitled to the protection of a number of state and federal consumer credit
laws, many of which give such debtors the right to set off certain amounts owed
on the credit cards, thereby reducing the balance due. There is the possibility
that recoveries on repossessed collateral may not, in some cases, be available
to support payments on these securities. Asset-backed securities are often
backed by a pool of assets representing the obligations of a number of different
parties. To lessen the effect of failures by obligors on underlying assets to
make payments, the securities may contain elements of credit support which fall
into two categories: (i) liquidity protection, and (ii) protection against
losses resulting from ultimate default by an obligor on the underlying assets.
Liquidity protection refers to the provision of advances, generally by the
entity administering the pool of assets, to ensure that the receipt of payments
on the underlying pool occurs in a timely fashion. Protection against losses
results from payment of the insurance obligations on at least a portion of the
assets in the pool. This protection may be provided through guarantees, policies
or letters of credit obtained by the issuer or sponsor from third parties,
through various means of structuring the transaction or through a combination of
such approaches. A Portfolio will not pay any additional or separate fees for
credit support. The degree of credit support provided for each issue is
generally based on historical information respecting the level of credit risk
associated with the underlying assets. Delinquency or loss in excess of that
anticipated or failure of the credit support could adversely affect the return
on an investment in such a security. The availability of asset-backed securities
may be affected by legislative or regulatory developments. It is possible that
such developments may require the Portfolios to dispose of any then existing
holdings of such securities. The Portfolios, except DWS Balanced VIP, DWS Core
Fixed Income VIP and DWS Money Market VIP, do not intend to invest more than 5%
of its total assets in asset-backed securities. DWS Balanced VIP and DWS Core
Fixed Income VIP currently do not intend to invest more than 25% of its total
assets in asset-backed securities. DWS Money Market VIP may not invest more than
50% of its assets in asset-backed securities.
Non-Diversified Portfolios. DWS Technology VIP is classified as a
"non-diversified" portfolio so that it will be able to invest to a greater
degree in the securities of a single issuer, subject to the diversification
requirements for qualification as a regulated investment company under the Code.
This allows the Portfolio, as to 50% of its assets, to invest more than 5% of
its assets, but not more than 25%, in the securities of an individual foreign
government or corporate issuer. Since a Portfolio may invest a relatively high
percentage of its assets in the securities (i.e., these funds purchase stock) of
a limited number of issuers, a Portfolio may be more susceptible to any single
economic, political or regulatory occurrence than a diversified portfolio.
Privatized Enterprises. Investments in foreign securities may include securities
issued by enterprises that have undergone or are currently undergoing
privatization. The governments of certain foreign countries have, to varying
degrees, embarked on privatization programs contemplating the sale of all or
part of their interests in state enterprises. A Portfolio's investments in the
securities of privatized enterprises may include privately negotiated
investments in a government or state-owned or controlled company or enterprise
that has not yet conducted an initial equity offering, investments in the
initial offering of equity securities of a state enterprise or former state
enterprise and investments in the securities of a state enterprise following its
initial equity offering.
In certain jurisdictions, the ability of foreign entities, such as a Portfolio,
to participate in privatizations may be limited by local law, or the price or
terms on which a Portfolio may be able to participate may be less advantageous
than for local investors. Moreover, there can be no assurance that governments
that have embarked on privatization programs will continue to divest their
ownership of state enterprises, that proposed privatizations will be successful
or that governments will not re-nationalize enterprises that have been
privatized.
In the case of the enterprises in which a Portfolio may invest, large blocks of
the stock of those enterprises may be held by a small group of stockholders,
even after the initial equity offerings by those enterprises. The sale of some
portion or all of those blocks could have an adverse effect on the price of the
stock of any such enterprise.
Prior to making an initial equity offering, most state enterprises or former
state enterprises go through an internal reorganization or management. Such
reorganizations are made in an attempt to better enable these enterprises to
compete in the private sector. However, certain reorganizations could result in
a management team that does not function as well as the enterprise's prior
management and may have a negative effect on such enterprise. In addition, the
privatization of an enterprise by its government may occur over a number of
years, with the government continuing to hold a controlling position in the
enterprise even after the initial equity offering for the enterprise.
Prior to privatization, most of the state enterprises in which a Portfolio may
invest enjoy the protection of and receive preferential treatment from the
respective sovereigns that own or control them. After making an initial equity
offering these enterprises may no longer have such protection or receive such
preferential treatment and may become subject to market competition from which
they were previously protected. Some of these enterprises may not be able to
effectively operate in a competitive market and may suffer losses or experience
bankruptcy due to such competition.
Real Estate Investment Trusts (REITs). Certain Portfolios may invest in REITs.
REITs are sometimes informally characterized as equity REITs, mortgage REITs and
hybrid REITs. Investment in REITs may subject the Portfolio to risks associated
with the direct ownership of real estate, such as decreases in real estate
values, overbuilding, increased competition and other risks related to local or
general economic conditions, increases in operating costs and property taxes,
changes in zoning laws, casualty or condemnation losses, possible environmental
liabilities, regulatory limitations on rent and fluctuations in rental income.
Equity REITs generally experience these risks directly through fee or leasehold
interests, whereas mortgage REITs generally experience these risks indirectly
through mortgage interests, unless the mortgage REIT forecloses on the
underlying real estate. Changes in interest rates may also affect the value of
the Portfolio's investment in REITs. For instance, during periods of declining
interest rates, certain mortgage REITs may hold mortgages that the mortgagors
elect to prepay, which prepayment may diminish the yield on securities issued by
those REITs.
Certain REITs have relatively small market capitalization, which may tend to
increase the volatility of the market price of their securities. Furthermore,
REITs are dependent upon specialized management skills, have limited
diversification and are, therefore, subject to risks inherent in operating and
financing a limited number of projects. REITs are also subject to heavy cash
flow dependency, defaults by borrowers and the possibility of failing to qualify
for tax-free pass-through of income under the Code and to maintain exemption
from the registration requirements of the 1940 Act. By investing in REITs
indirectly through the Portfolio, a shareholder will bear not only his or her
proportionate share of the expenses of the Portfolio, but also, indirectly,
similar expenses of the REITs. In addition, REITs depend generally on their
ability to generate cash flow to make distributions to shareholders.
Repurchase Agreements. Each Portfolio may invest in repurchase agreements
pursuant to its investment guidelines. In a repurchase agreement, the Portfolio
acquires ownership of a security and simultaneously commits to resell that
security to the seller, typically a bank or broker/dealer.
A repurchase agreement provides a means for a Portfolio to earn income on funds
for periods as short as overnight. It is an arrangement under which the
purchaser (i.e., the Portfolio) acquires a security ("Obligation") and the
seller agrees, at the time of sale, to repurchase the Obligation at a specified
time and price. Securities subject to a repurchase agreement are held in a
segregated account and, as described in more detail below, the value of such
securities is kept at least equal to the repurchase price on a daily basis. The
repurchase price may be higher than the purchase price, the difference being
income to a Portfolio, or the purchase and repurchase prices may be the same,
with interest at a stated rate due to a Portfolio together with the repurchase
price upon repurchase. In either case, the income to a Portfolio is unrelated to
the interest rate on the Obligation itself. Obligations will be held by the
custodian or in the Federal Reserve Book Entry System.
It is not clear whether a court would consider the Obligation purchased by a
Portfolio subject to a repurchase agreement as being owned by a Portfolio or as
being collateral for a loan by a Portfolio to the seller. In the event of the
commencement of bankruptcy or insolvency proceedings with respect to the seller
of the Obligation before repurchase of the Obligation under a repurchase
agreement, a Portfolio may encounter delay and incur costs before being able to
sell the security. Delays may involve loss of interest or decline in price of
the Obligation. If the court characterizes the transaction as a loan and a
Portfolio has not perfected a security interest in the Obligation, a Portfolio
may be required to return the Obligation to the seller's estate and be treated
as an unsecured creditor of the seller. As an unsecured creditor, a Portfolio
would be at risk of losing some or all of the principal and income involved in
the transaction. As with any unsecured debt Obligation purchased for a
Portfolio, the Advisor or a subadvisor seeks to reduce the risk of loss through
repurchase agreements by analyzing the creditworthiness of the obligor, in this
case the seller of the Obligation. Apart from the risk of bankruptcy or
insolvency proceedings, there is also the risk that the seller may fail to
repurchase the Obligation, in which case a Portfolio may incur a loss if the
proceeds to a Portfolio of the sale to a third party are less than the
repurchase price. However, if the market value (including interest) of the
Obligation subject to the repurchase agreement becomes less than the repurchase
price (including interest), a Portfolio will direct the seller of the Obligation
to deliver additional securities so that the market value (including interest)
of all securities subject to the repurchase agreement will equal or exceed the
repurchase price.
Restructuring Instruments. DWS Balanced VIP, DWS High Income VIP and DWS
Strategic Income VIP may hold distressed securities, which are securities that
are in default or in risk of being in default. In connection with an exchange or
workout of such securities, a Portfolio may accept various instruments if the
investment adviser determines it is in the best interests of a Portfolio and
consistent with a Portfolio's investment objective and policies. Such
instruments may include, but not limited to, warrants, rights, participation
interests in assets sales and contingent-interest obligations.
Reverse Repurchase Agreements. Each Portfolio (except DWS Money Market VIP) may
enter into "reverse repurchase agreements," which are repurchase agreements in
which a Portfolio, as the seller of the securities, agrees to repurchase such
securities at an agreed time and price. Each Portfolio maintains a segregated
account in connection with outstanding reverse repurchase agreements. A
Portfolio will enter into reverse repurchase agreements only when the Advisor or
Subadvisor believes that the interest income to be earned from the investment of
the proceeds of the transaction will be greater than the interest expense of the
transaction. Such transactions may increase fluctuations in the market value of
a Portfolio's assets and its yield.
Section 4(2) Paper. Subject to its investment objectives and policies, each
Portfolio may invest in commercial paper issued under the Securities Act of 1933
in reliance on the exemption from registration afforded by Section 3(a)(3)
thereof. Such commercial paper may be issued only to finance current
transactions and must mature in nine months or less. Trading of such commercial
paper is conducted primarily by institutional investors through investment
dealers, and individual investor participation in the commercial paper market is
very limited. A Portfolio also may invest in commercial paper issued in reliance
on the so-called "private placement" exemption from registration afforded by
Section 4(2) of the Securities Act of 1933 ("Section 4(2) paper"). Section 4(2)
paper is restricted as to disposition under the federal securities laws, and
generally is sold to institutional investors such as a Portfolio who agree that
they are purchasing the paper for investment and not with a view to public
distribution. Any resale by the purchaser must be in an exempt transaction.
Section 4(2) paper normally is resold to other institutional investors like the
Portfolio through or with the assistance of the issuer or investment dealers who
make a market in the Section 4(2) paper, thus providing liquidity. The Advisor
or Subadvisor considers the legally restricted but readily saleable Section 4(2)
paper to be liquid; however, pursuant to procedures approved by the Board of
Trustees of the Fund, if a particular investment in Section 4(2) paper is not
determined to be liquid, that investment will be included within the limitation
of the particular Portfolio on illiquid securities. The Advisor or Subadvisor
monitors the liquidity of each Portfolio's investments in Section 4(2) paper on
a continuing basis.
Small Company Risk. DWS Small Cap Growth VIP, DWS Balanced VIP and DWS Dreman
Small Mid Cap Value VIP intend to invest a substantial portion of their assets
in small capitalization stocks similar in size to those comprising the Russell
2000 Growth Index and the Russell 2500 Value Index, respectively. Other
Portfolios may invest in small capitalization stocks to a lesser degree. Many
small companies may have sales and earnings growth rates which exceed those of
larger companies and such growth rates may in turn be reflected in more rapid
share price appreciation over time; however, investing in smaller company stocks
involves greater risk than is customarily associated with investing in larger,
more established companies. For example, smaller companies can have limited
product lines, markets, or financial and managerial resources. Smaller companies
may also be dependent on one or a few key persons, and may be more susceptible
to losses and risks of bankruptcy. Also, the securities of smaller companies may
be thinly traded (and therefore have to be sold at a discount from current
market prices or sold in small lots over an extended period of time).
Transaction costs in smaller company stocks may be higher than those of larger
companies. Investors should therefore expect that the value of the shares of the
DWS Small Cap Growth VIP and DWS Dreman Small Mid Cap Value VIP may be more
volatile than the shares of a portfolio that invests in larger capitalization
stocks.
Short Sales Against-the-Box. All Portfolios (except DWS Money Market VIP) may
make short sales against-the-box for the purpose of, but not limited to,
deferring realization of loss when deemed advantageous for federal income tax
purposes. A short sale "against-the-box" is a short sale in which a Portfolio
owns at least an equal amount of the securities sold short or securities
convertible into or exchangeable for, without payment of any further
consideration, securities of the same issue as, and at least equal in amount to,
the securities sold short. A Portfolio will incur a loss as a result of the
short sale if the price of the security increases between the dates of the short
sale and the date on which a Portfolio replaces the borrowed security. A
Portfolio will incur transaction costs, including interest expenses in
connection with opening, maintaining, and closing short sales against the box.
Each Portfolio does not currently intend to engage in such short sales to the
extent that more than 5% of its net assets will be held as collateral.
Variable Rate Securities. DWS Money Market VIP may invest in Variable Rate
Securities, instruments having rates of interest that are adjusted periodically
or that "float" continuously according to formulae intended to minimize
fluctuation in values of the instruments. The interest rate of Variable Rate
Securities ordinarily is determined by reference to or is a percentage of an
objective standard such as a bank's prime rate, the 90-day US Treasury Bill
rate, or the rate of return on commercial paper or bank certificates of deposit.
Generally, the changes in the interest rate on Variable Rate Securities reduce
the fluctuation in the market value of such securities. Accordingly, as interest
rates decrease or increase, the potential for capital appreciation or
depreciation is less than for fixed-rate obligations. Some Variable Rate Demand
Securities ("Variable Rate Demand Securities") have a demand feature entitling
the purchaser to resell the securities at an amount approximately equal to
amortized cost or the principal amount thereof plus accrued interest. As is the
case for other Variable Rate Securities, the interest rate on Variable Rate
Demand Securities varies according to some objective standard intended to
minimize fluctuation in the values of the instruments. The Portfolio determines
the maturity of Variable Rate Securities in accordance with Rule 2a-7 which
allows the Portfolio to consider certain of such instruments as having
maturities shorter than the maturity date on the face of the instrument.
Strategic Transactions and Derivatives (all Portfolios except DWS Money Market
VIP). A Portfolio may, but is not required to, utilize various other investment
strategies as described below for a variety of purposes, such as hedging various
market risks, managing the effective maturity or duration of fixed-income
securities in a portfolio, or enhancing potential gain. These strategies may be
executed through the use of derivative contracts.
In the course of pursuing these investment strategies, a Portfolio may purchase
and sell exchange-listed and over-the-counter put and call options on
securities, equity and fixed-income indices and other instruments, purchase and
sell futures contracts and options thereon, enter into various transactions such
as swaps, caps, floors, collars, currency forward contracts, currency futures
contracts, currency swaps or options on currencies, or currency futures and
various other currency transactions (collectively, all the above are called
"Strategic Transactions"). In addition, Strategic Transactions may also include
new techniques, instruments or strategies that are permitted as regulatory
changes occur. Strategic Transactions may be used without limit (subject to
certain limitations imposed by the 1940 Act) to attempt to protect against
possible changes in the market value of securities held in or to be purchased
for a Portfolio resulting from securities markets or currency exchange rate
fluctuations, to protect a Portfolio's unrealized gains in the value of its
portfolio securities, to facilitate the sale of such securities for investment
purposes, to manage the effective maturity or duration of fixed-income
securities in a portfolio, or to establish a position in the derivatives markets
as a substitute for purchasing or selling particular securities. Some Strategic
Transactions may also be used to enhance potential gain although no more than 5%
of a Portfolio's assets will be committed to certain Strategic Transactions
entered into for non-hedging purposes, unless permitted by the investment
objective and policies of a Portfolio. Any or all of these investment techniques
may be used at any time and in any combination, and there is no particular
strategy that dictates the use of one technique rather than another, as use of
any Strategic Transaction is a function of numerous variables including market
conditions. The ability of a Portfolio to utilize these Strategic Transactions
successfully will depend on the Advisor's ability to predict pertinent market
movements, which cannot be assured. A Portfolio will comply with applicable
regulatory requirements when implementing these strategies, techniques and
instruments. Strategic Transactions will not be used to alter fundamental
investment purposes and characteristics of a Portfolio, and the Portfolio will
segregate assets (or as provided by applicable regulations, enter into certain
offsetting positions) to cover its obligations under options, futures and swaps
to limit leveraging of a Portfolio.
Strategic Transactions, including derivative contracts, have risks associated
with them including possible default by the other party to the transaction,
illiquidity and, to the extent the Advisor's or a subadvisor's view as to
certain market movements is incorrect, the risk that the use of such Strategic
Transactions could result in losses greater than if they had not been used. Use
of put and call options may result in losses to a Portfolio, force the sale or
purchase of portfolio securities at inopportune times or for prices higher than
(in the case of put options) or lower than (in the case of call options) current
market values, limit the amount of appreciation a Portfolio can realize on its
investments or cause a Portfolio to hold a security it might otherwise sell. The
use of currency transactions can result in a Portfolio incurring losses as a
result of a number of factors including the imposition of exchange controls,
suspension of settlements, or the inability to deliver or receive a specified
currency. The use of options and futures transactions entails certain other
risks. In particular, the variable degree of correlation between price movements
of futures contracts and price movements in the related portfolio position of a
Portfolio creates the possibility that losses on the hedging instrument may be
greater than gains in the value of a Portfolio's position. In addition, futures
and options markets may not be liquid in all circumstances and certain
over-the-counter options may have no markets. As a result, in certain markets, a
Portfolio might not be able to close out a transaction without incurring
substantial losses, if at all. Although the use of futures and options
transactions for hedging should tend to minimize the risk of loss due to a
decline in the value of the hedged position, at the same time they tend to limit
any potential gain which might result from an increase in value of such
position. Finally, the daily variation margin requirements for futures contracts
would create a greater ongoing potential financial risk than would purchases of
options, where the exposure is limited to the cost of the initial premium.
Losses resulting from the use of Strategic Transactions would reduce net asset
value, and possibly income, and such losses can be greater than if the Strategic
Transactions had not been utilized.
General Characteristics of Options. Put options and call options typically have
similar structural characteristics and operational mechanics regardless of the
underlying instrument on which they are purchased or sold. Thus, the following
general discussion relates to each of the particular types of options discussed
in greater detail below. In addition, many Strategic Transactions involving
options require segregation of a Portfolio's assets in special accounts, as
described below under "Use of Segregated and Other Special Accounts."
A put option gives the purchaser of the option, upon payment of a premium, the
right to sell, and the writer the obligation to buy, the underlying security,
commodity, index, currency or other instrument at the exercise price. For
instance, a Portfolio's purchase of a put option on a security might be designed
to protect its holdings in the underlying instrument (or, in some cases, a
similar instrument) against a substantial decline in the market value by giving
a Portfolio the right to sell such instrument at the option exercise price. A
call option, upon payment of a premium, gives the purchaser of the option the
right to buy, and the seller the obligation to sell, the underlying instrument
at the exercise price. A Portfolio's purchase of a call option on a security,
financial future, index, currency or other instrument might be intended to
protect a Portfolio against an increase in the price of the underlying
instrument that it intends to purchase in the future by fixing the price at
which it may purchase such instrument. An American style put or call option may
be exercised at any time during the option period while a European style put or
call option may be exercised only upon expiration or during a fixed period prior
thereto. A Portfolio is authorized to purchase and sell exchange listed options
and over-the-counter options ("OTC options"). Exchange listed options are issued
by a regulated intermediary such as the Options Clearing Corporation ("OCC"),
which guarantees the performance of the obligations of the parties to such
options. The discussion below uses the OCC as an example, but is also applicable
to other financial intermediaries.
With certain exceptions, OCC issued and exchange listed options generally settle
by physical delivery of the underlying security or currency, although in the
future cash settlement may become available. Index options and Eurodollar
instruments are cash settled for the net amount, if any, by which the option is
"in-the-money" (i.e., where the value of the underlying instrument exceeds, in
the case of a call option, or is less than, in the case of a put option, the
exercise price of the option) at the time the option is exercised. Frequently,
rather than taking or making delivery of the underlying instrument through the
process of exercising the option, listed options are closed by entering into
offsetting purchase or sale transactions that do not result in ownership of the
new option.
A Portfolio's ability to close out its position as a purchaser or seller of an
OCC or exchange listed put or call option is dependent, in part, upon the
liquidity of the option market. Among the possible reasons for the absence of a
liquid option market on an exchange are: (i) insufficient trading interest in
certain options; (ii) restrictions on transactions imposed by an exchange; (iii)
trading halts, suspensions or other restrictions imposed with respect to
particular classes or series of options or underlying securities including
reaching daily price limits; (iv) interruption of the normal operations of the
OCC or an exchange; (v) inadequacy of the facilities of an exchange or OCC to
handle current trading volume; or (vi) a decision by one or more exchanges to
discontinue the trading of options (or a particular class or series of options),
in which event the relevant market for that option on that exchange would cease
to exist, although outstanding options on that exchange would generally continue
to be exercisable in accordance with their terms.
The hours of trading for listed options may not coincide with the hours during
which the underlying financial instruments are traded. To the extent that the
option markets close before the markets for the underlying financial
instruments, significant price and rate movements can take place in the
underlying markets that cannot be reflected in the option markets.
OTC options are purchased from or sold to securities dealers, financial
institutions or other parties ("Counterparties") through direct bilateral
agreement with the Counterparty. In contrast to exchange listed options, which
generally have standardized terms and performance mechanics, all the terms of an
OTC option, including such terms as method of settlement, term, exercise price,
premium, guarantees and security, are set by negotiation of the parties. A
Portfolio will only sell OTC options (other than OTC currency options) that are
subject to a buy-back provision permitting a Portfolio to require the
Counterparty to sell the option back to a Portfolio at a formula price within
seven days. A Portfolio expects generally to enter into OTC options that have
cash settlement provisions, although it is not required to do so.
Unless the parties provide for it, there is no central clearing or guaranty
function in an OTC option. As a result, if the Counterparty fails to make or
take delivery of the security, currency or other instrument underlying an OTC
option it has entered into with a Portfolio or fails to make a cash settlement
payment due in accordance with the terms of that option, a Portfolio will lose
any premium it paid for the option as well as any anticipated benefit of the
transaction. Accordingly, the Advisor or a subadvisor must assess the
creditworthiness of each such Counterparty or any guarantor or credit
enhancement of the Counterparty's credit to determine the likelihood that the
terms of the OTC option will be satisfied. A Portfolio will engage in OTC option
transactions only with US government securities dealers recognized by the
Federal Reserve Bank of New York as "primary dealers" or broker/dealers,
domestic or foreign banks or other financial institutions which have received
(or the guarantors of the obligation of which have received) a short-term credit
rating of A-1 from Standard & Poor's Ratings Services ("S&P") or P-1 from
Moody's Investors Service ("Moody's") or an equivalent rating from any
nationally recognized statistical rating organization ("NRSRO") or, in the case
of OTC currency transactions, are determined to be of equivalent credit quality
by the Advisor or a subadvisor. The staff of the SEC currently takes the
position that OTC options purchased by a Portfolio, and portfolio securities
"covering" the amount of a Portfolio's obligation pursuant to an OTC option sold
by it (the cost of the sell-back plus the in-the-money amount, if any) are
illiquid, and are subject to a Portfolio's limitation on investing no more than
15% of its net assets in illiquid securities.
If a Portfolio sells a call option, the premium that it receives may serve as a
partial hedge, to the extent of the option premium, against a decrease in the
value of the underlying securities or instruments in its portfolio or will
increase a Portfolio's income. The sale of put options can also provide income.
A Portfolio may purchase and sell call options on securities including US
Treasury and agency securities, mortgage-backed securities, foreign sovereign
debt, corporate debt securities, equity securities (including convertible
securities) and Eurodollar instruments that are traded on US and foreign
securities exchanges and in the over-the-counter markets, and on securities
indices, currencies and futures contracts. All calls sold by a Portfolio must be
"covered" (i.e., a Portfolio must own the securities or futures contract subject
to the call) or must meet the asset segregation requirements described below as
long as the call is outstanding. Even though a Portfolio will receive the option
premium to help protect it against loss, a call sold by a Portfolio exposes a
Portfolio during the term of the option to possible loss of opportunity to
realize appreciation in the market price of the underlying security or
instrument and may require a Portfolio to hold a security or instrument which it
might otherwise have sold.
A Portfolio may purchase and sell put options on securities including US
Treasury and agency securities, mortgage-backed securities, foreign sovereign
debt, corporate debt securities, equity securities (including convertible
securities) and Eurodollar instruments (whether or not it holds the above
securities in its portfolio), and on securities indices, currencies and futures
contracts other than futures on individual corporate debt and individual equity
securities. A Portfolio will not sell put options if, as a result, more than 50%
of a Portfolio's total assets would be required to be segregated to cover its
potential obligations under such put options other than those with respect to
futures and options thereon. In selling put options, there is a risk that a
Portfolio may be required to buy the underlying security at a disadvantageous
price above the market price.
General Characteristics of Futures. A Portfolio may enter into futures contracts
or purchase or sell put and call options on such futures as a hedge against
anticipated interest rate, currency or equity market changes, and for duration
management, risk management and return enhancement purposes. Futures are
generally bought and sold on the commodities exchanges where they are listed
with payment of initial and variation margin as described below. The sale of a
futures contract creates a firm obligation by a Portfolio, as seller, to deliver
to the buyer the specific type of financial instrument called for in the
contract at a specific future time for a specified price (or, with respect to
index futures and Eurodollar instruments, the net cash amount). Options on
futures contracts are similar to options on securities except that an option on
a futures contract gives the purchaser the right in return for the premium paid
to assume a position in a futures contract and obligates the seller to deliver
such position.
The Advisor has claimed an exclusion with respect to the Portfolios and the
Portfolios are excluded from the definition of the term "commodity pool
operator" under the Commodity Exchange Act and therefore are not subject to
commodity pool operator registration and regulation under the Commodity Exchange
Act. Futures and options on futures may be entered into for bona fide hedging,
risk management (including duration management) or other portfolio and return
enhancement management purposes to the extent consistent with the exclusion from
commodity pool operator registration. Typically, maintaining a futures contract
or selling an option thereon requires a Portfolio to deposit with a financial
intermediary or futures commission merchant as security for its obligations an
amount of cash or other specified assets (initial margin) which initially is
typically 1% to 10% of the face amount of the contract (but may be higher in
some circumstances). Additional cash or assets (variation margin) may be
required to be deposited thereafter on a daily basis as the mark to market value
of the contract fluctuates. The purchase of an option on financial futures
involves payment of a premium for the option without any further obligation on
the part of a Portfolio. If a Portfolio exercises an option on a futures
contract it will be obligated to post initial margin (and potential subsequent
variation margin) for the resulting futures position just as it would for any
position. Futures contracts and options thereon are generally settled by
entering into an offsetting transaction but there can be no assurance that the
position can be offset prior to settlement at an advantageous price, nor that
delivery will occur.
Options on Securities Indices and Other Financial Indices. A Portfolio also may
purchase and sell call and put options on securities indices and other financial
indices and in so doing can achieve many of the same objectives it would achieve
through the sale or purchase of options on individual securities or other
instruments. Options on securities indices and other financial indices are
similar to options on a security or other instrument except that, rather than
settling by physical delivery of the underlying instrument, they settle by cash
settlement, i.e., an option on an index gives the holder the right to receive,
upon exercise of the option, an amount of cash if the closing level of the index
upon which the option is based exceeds, in the case of a call, or is less than,
in the case of a put, the exercise price of the option (except if, in the case
of an OTC option, physical delivery is specified). This amount of cash is equal
to the excess of the closing price of the index over the exercise price of the
option, which also may be multiplied by a formula value. The seller of the
option is obligated, in return for the premium received, to make delivery of
this amount. The gain or loss on an option on an index depends on price
movements in the instruments making up the market, market segment, industry or
other composite on which the underlying index is based, rather than price
movements in individual securities, as is the case with respect to options on
securities.
Currency Transactions. A Portfolio may engage in currency transactions with
Counterparties primarily in order to hedge, or manage the risk of the value of
portfolio holdings denominated in particular currencies against fluctuations in
relative value or to enhance returns. Currency transactions include forward
currency contracts, exchange listed currency futures, exchange listed and OTC
options on currencies, and currency swaps. A forward currency contract involves
a privately negotiated obligation to purchase or sell (with delivery generally
required) a specific currency at a future date, which may be any fixed number of
days from the date of the contract agreed upon by the parties, at a price set at
the time of the contract. A currency swap is an agreement to exchange cash flows
based on the notional difference among two or more currencies and operates
similarly to an interest rate swap, which is described below. A Portfolio may
enter into currency transactions with Counterparties which have received (or the
guarantors of the obligations which have received) a credit rating of A-1 or P-1
by S&P or Moody's, respectively, or that have an equivalent rating from a NRSRO
or (except for OTC currency options) are determined to be of equivalent credit
quality by the Advisor or a subadvisor.
With respect to hedging, a Portfolio's dealings in forward currency contracts
and other currency transactions such as futures, options, options on futures and
swaps may involve hedging either specific transactions or portfolio positions
except as described below. Transaction hedging is entering into a currency
transaction with respect to specific assets or liabilities of a Portfolio, which
will generally arise in connection with the purchase or sale of its portfolio
securities or the receipt of income therefrom. Position hedging is entering into
a currency transaction with respect to portfolio security positions denominated
in, exposed to or generally quoted in that currency.
To the extent a Portfolio intends to hedge its currency exposure, a Portfolio
generally will not enter into a transaction and obtain exposure to an extent
greater, after netting all transactions intended wholly or partially to offset
other transactions, than the aggregate market value (at the time of entering
into the transaction) of the securities held in its portfolio that are
denominated in, exposed to or generally quoted in or currently convertible into
such currency, other than with respect to proxy hedging or cross hedging as
described below.
A Portfolio may also cross-hedge currencies by entering into transactions to
purchase or sell one or more currencies that are expected to decline in value
relative to other currencies to which a Portfolio has or in which a Portfolio
expects to have portfolio exposure.
To reduce the effect of currency fluctuations on the value of existing or
anticipated holdings of portfolio securities, a Portfolio may also engage in
proxy hedging. Proxy hedging is often used when the currency to which a
Portfolio's portfolio is exposed is difficult to hedge or to hedge against the
dollar. Proxy hedging entails entering into a commitment or option to sell a
currency whose changes in value are generally considered to be correlated to a
currency or currencies in which some or all of a Portfolio's portfolio
securities are or are expected to be denominated, in exchange for US dollars.
The amount of the commitment or option would not exceed the value of a
Portfolio's securities denominated in correlated currencies. Currency hedging
involves some of the same risks and considerations as other transactions with
similar instruments. Currency transactions can result in losses to a Portfolio
if the currency being hedged fluctuates in value to a degree or in a direction
that is not anticipated. Further, there is the risk that the perceived
correlation between various currencies may not be present or may not be present
during the particular time that a Portfolio is engaging in proxy hedging. If a
Portfolio enters into a currency hedging transaction, a Portfolio will comply
with the asset segregation requirements described below.
Risks of Currency Transactions. Currency transactions are subject to risks
different from those of other portfolio transactions. Because currency control
is of great importance to the issuing governments and influences economic
planning and policy, purchases and sales of currency and related instruments can
be negatively affected by government exchange controls, blockages, and
manipulations or exchange restrictions imposed by governments. These can result
in losses to a Portfolio if it is unable to deliver or receive currency or funds
in settlement of obligations and could also cause hedges it has entered into to
be rendered useless, resulting in full currency exposure as well as incurring
transaction costs. Buyers and sellers of currency futures are subject to the
same risks that apply to the use of futures generally. Further, settlement of a
currency futures contract for the purchase of most currencies must occur at a
bank based in the issuing nation. Trading options on currency futures is
relatively new, and the ability to establish and close out positions on such
options is subject to the maintenance of a liquid market which may not always be
available. Currency exchange rates may fluctuate based on factors extrinsic to
that country's economy.
Swaps, Caps, Floors and Collars. Among the Strategic Transactions into which a
Portfolio may enter are interest rate, credit default, currency, index and other
swaps and the purchase or sale of related caps, floors and collars. A Portfolio
expects to enter into these transactions primarily to preserve a return or
spread on a particular investment or portion of its portfolio, to protect
against currency fluctuations, as a duration management technique or to protect
against any increase in the price of securities a Portfolio anticipates
purchasing at a later date or to enhance returns. A Portfolio will not sell
interest rate caps or floors where it does not own securities or other
instruments providing the income stream a Portfolio may be obligated to pay.
Interest rate swaps involve the exchange by a Portfolio with another party of
their respective commitments to pay or receive interest, e.g., an exchange of
floating rate payments for fixed rate payments with respect to a notional amount
of principal. A currency swap is an agreement to exchange cash flows on a
notional amount of two or more currencies based on the relative value
differential among them and an index swap is an agreement to swap cash flows on
a notional amount based on changes in the values of the reference indices. The
purchase of a cap entitles the purchaser to receive payments on a notional
principal amount from the party selling such cap to the extent that a specified
index exceeds a predetermined interest rate or amount. The purchase of a floor
entitles the purchaser to receive payments on a notional principal amount from
the party selling such floor to the extent that a specified index falls below a
predetermined interest rate or amount. A collar is a combination of a cap and a
floor that preserves a certain return within a predetermined range of interest
rates or values.
A Portfolio will usually enter into swaps on a net basis, i.e., the two payment
streams are netted out in a cash settlement on the payment date or dates
specified in the instrument, with a Portfolio receiving or paying, as the case
may be, only the net amount of the two payments. Inasmuch as a Portfolio will
segregate assets (or enter into offsetting positions) to cover its obligations
under swaps, the Advisor and a Portfolio believe such obligations do not
constitute senior securities under the 1940 Act and, accordingly, will not treat
them as being subject to its borrowing restrictions. A Portfolio will not enter
into any swap, cap, floor or collar transaction unless, at the time of entering
into such transaction, the unsecured long-term debt of the Counterparty,
combined with any credit enhancements, is rated at least A by S&P or Moody's or
has an equivalent rating from a NRSRO or is determined to be of equivalent
credit quality by the Advisor. If there is a default by the Counterparty, a
Portfolio may have contractual remedies pursuant to the agreements related to
the transaction. The swap market has grown substantially in recent years with a
large number of banks and investment banking firms acting both as principals and
as agents utilizing standardized swap documentation. As a result, the swap
market has become relatively liquid. Caps, floors and collars are more recent
innovations for which standardized documentation has not yet been fully
developed and, accordingly, they are less liquid than swaps.
Credit default swaps are used as a means of "buying" credit protection, i.e.,
attempting to mitigate the risk of default or credit quality deterioration in
some portion of a Portfolio's holdings, or "selling" credit protection, i.e.,
attempting to gain exposure to an underlying issuer's credit quality
characteristics without directly investing in that issuer. No more than 5% of a
Portfolio's assets may be invested in credit default swaps for the purposes of
buying credit protection. A Portfolio will only sell credit protection with
respect to securities in which it would be authorized to invest directly. A
Portfolio may also borrow up to 5% of its net assets against called and tendered
bonds in the Portfolio. For the risks associated with borrowing, please see the
"Borrowing" subsection of the "Investment Restrictions" section of this
Statement of Additional Information. DWS Balanced VIP may invest up to 15% of
its total assets in credit default swaps.
Swaps have special risks associated including possible default by the
counterparty to the transaction, illiquidity and, where swaps are used for
hedges, the risk that the use of a swap could result in losses greater than if
the swap had not been employed. Whether the use of swap agreements will be
successful in furthering its investment objective will depend on the Advisor's
ability to correctly predict whether certain types of investments are likely to
produce greater returns than other investments. Certain swap agreements may be
considered to be illiquid because they are two party contracts and because they
may have terms of greater than seven days. Moreover, a Portfolio bears the risk
of loss of the amount expected to be received under a swap agreement in the
event of the default or bankruptcy of a swap agreement counterparty.
Eurodollar Instruments. The Fund may make investments in Eurodollar instruments
for hedging purposes or to enhance potential gain. Eurodollar instruments are US
dollar-denominated futures contracts or options thereon which are linked to the
London Interbank Offered Rate ("LIBOR"), although foreign currency-denominated
instruments are available from time to time. Eurodollar futures contracts enable
purchasers to obtain a fixed rate for the lending of funds and sellers to obtain
a fixed rate for borrowings. The Fund might use Eurodollar futures contracts and
options thereon to hedge against changes in LIBOR, to which many interest rate
swaps and fixed income instruments are linked.
Risks of Strategic Transactions Outside the US. When conducted outside the US,
Strategic Transactions may not be regulated as rigorously as in the US, may not
involve a clearing mechanism and related guarantees, and are subject to the risk
of governmental actions affecting trading in, or the prices of, foreign
securities, currencies and other instruments. The value of such positions also
could be adversely affected by: (i) other complex foreign political, legal and
economic factors, (ii) lesser availability than in the US of data on which to
make trading decisions, (iii) delays in a Portfolio's ability to act upon
economic events occurring in foreign markets during non-business hours in the
US, (iv) the imposition of different exercise and settlement terms and
procedures and margin requirements than in the US, and (v) lower trading volume
and liquidity.
Use of Segregated and Other Special Accounts. Many Strategic Transactions, in
addition to other requirements, require that a Portfolio segregate cash or
liquid assets with its custodian to the extent Fund obligations are not
otherwise "covered" through ownership of the underlying security, financial
instrument or currency. In general, either the full amount of any obligation by
a Portfolio to pay or deliver securities or assets must be covered at all times
by the securities, instruments or currency required to be delivered, or, subject
to any regulatory restrictions, an amount of cash or liquid assets at least
equal to the current amount of the obligation must be segregated with the
custodian. The segregated assets cannot be sold or transferred unless equivalent
assets are substituted in their place or it is no longer necessary to segregate
them. For example, a call option written by a Portfolio will require a Portfolio
to hold the securities subject to the call (or securities convertible into the
needed securities without additional consideration) or to segregate cash or
liquid assets sufficient to purchase and deliver the securities if the call is
exercised. A call option sold by a Portfolio on an index will require a
Portfolio to own portfolio securities which correlate with the index or to
segregate cash or liquid assets equal to the excess of the index value over the
exercise price on a current basis. A put option written by a Portfolio requires
a Portfolio to segregate cash or liquid assets equal to the exercise price.
Except when a Portfolio enters into a forward contract for the purchase or sale
of a security denominated in a particular currency, which requires no
segregation, a currency contract which obligates a Portfolio to buy or sell
currency will generally require a Portfolio to hold an amount of that currency
or liquid assets denominated in that currency equal to a Portfolio's obligations
or to segregate cash or liquid assets equal to the amount of a Portfolio's
obligation.
OTC options entered into by a Portfolio, including those on securities,
currency, financial instruments or indices and OCC issued and exchange listed
index options, will generally provide for cash settlement. As a result, when a
Portfolio sells these instruments it will only segregate an amount of cash or
liquid assets equal to its accrued net obligations, as there is no requirement
for payment or delivery of amounts in excess of the net amount. These amounts
will equal 100% of the exercise price in the case of a non cash-settled put, the
same as an OCC guaranteed listed option sold by a Portfolio, or the in-the-money
amount plus any sell-back formula amount in the case of a cash-settled put or
call. In addition, when a Portfolio sells a call option on an index at a time
when the in-the-money amount exceeds the exercise price, a Portfolio will
segregate, until the option expires or is closed out, cash or cash equivalents
equal in value to such excess. OCC issued and exchange listed options sold by a
Portfolio other than those above generally settle with physical delivery, or
with an election of either physical delivery or cash settlement and a Portfolio
will segregate an amount of cash or liquid assets equal to the full value of the
option. OTC options settling with physical delivery, or with an election of
either physical delivery or cash settlement will be treated the same as other
options settling with physical delivery.
In the case of a futures contract or an option thereon, a Portfolio must deposit
initial margin and possible daily variation margin in addition to segregating
cash or liquid assets sufficient to meet its obligation to purchase or provide
securities or currencies, or to pay the amount owed at the expiration of an
index-based futures contract. Such liquid assets may consist of cash, cash
equivalents, liquid debt or equity securities or other acceptable assets.
With respect to swaps, a Portfolio will accrue the net amount of the excess, if
any, of its obligations over its entitlements with respect to each swap on a
daily basis and will segregate an amount of cash or liquid assets having a value
equal to the accrued excess. Caps, floors and collars require segregation of
assets with a value equal to a Portfolio's net obligation, if any.
Strategic Transactions may be covered by other means when consistent with
applicable regulatory policies. A Portfolio may also enter into offsetting
transactions so that its combined position, coupled with any segregated assets,
equals its net outstanding obligation in related options and Strategic
Transactions. For example, a Portfolio could purchase a put option if the strike
price of that option is the same or higher than the strike price of a put option
sold by a Portfolio. Moreover, instead of segregating cash or liquid assets if a
Portfolio held a futures or forward contract, it could purchase a put option on
the same futures or forward contract with a strike price as high or higher than
the price of the contract held. Other Strategic Transactions may also be offset
in combinations. If the offsetting transaction terminates at the time of or
after the primary transaction no segregation is required, but if it terminates
prior to such time, cash or liquid assets equal to any remaining obligation
would need to be segregated.
Combined Transactions. A Portfolio may enter into multiple transactions,
including multiple options transactions, multiple futures transactions, multiple
currency transactions (including forward currency contracts) and multiple
interest rate transactions and any combination of futures, options, currency and
interest rate transactions ("component" transactions), instead of a single
Strategic Transaction, as part of a single or combined strategy when, in the
opinion of the Advisor or Subadvisor, it is in the best interests of a Portfolio
to do so. A combined transaction will usually contain elements of risk that are
present in each of its component transactions. Although combined transactions
are normally entered into based on the Advisor's or a subadvisor's judgment that
the combined strategies will reduce risk or otherwise more effectively achieve
the desired portfolio management goal, it is possible that the combination will
instead increase such risks or hinder achievement of the portfolio management
objective.
Sub-Prime Mortgage Exposure
Each Portfolio may invest in companies that may be affected by the downturn in
the sub-prime mortgage lending market in the US. Sub-prime loans, which tend to
have higher interest rates, are made to borrowers who do not qualify for prime
rate loans because of their low credit ratings or other factors that suggest
that they have a higher probability of defaulting. The downturn in the sub-prime
mortgage-lending market has had, and may continue to have, a far-reaching impact
on the broader securities market, especially in the sub-prime, asset-backed and
other debt related securities markets. In addition to performance issues, the
reduced investor demand for sub-prime, asset-backed and other debt related
securities as a result of the downturn has created liquidity and valuation
issues for these securities. Each Portfolio's investments related to or impacted
by the downturn in the sub-prime mortgage lending market may cause the overall
value of the Portfolios to decrease.
Warrants. Each Portfolio (except DWS Money Market VIP) may invest in warrants up
to five percent of the value of its respective net assets. The holder of a
warrant has the right, until the warrant expires, to purchase a given number of
shares of a particular issuer at a specified price. Such investments can provide
a greater potential for profit or loss than an equivalent investment in the
underlying security. Prices of warrants do not necessarily move, however, in
tandem with the prices of the underlying securities and are, therefore,
considered speculative investments. Warrants pay no dividends and confer no
rights other than a purchase option. Thus, if a warrant held by a Portfolio were
not exercised by the date of its expiration, a Portfolio would lose the entire
purchase price of the warrant.
Zero Coupon Government Securities. Subject to its investment objective and
policies, a Portfolio may invest in zero coupon US Government securities. Zero
coupon bonds are purchased at a discount from the face amount. The buyer
receives only the right to receive a fixed payment on a certain date in the
future and does not receive any periodic interest payments. These securities may
include those created directly by the US Treasury and those created as
collateralized obligations through various proprietary custodial, trust or other
relationships. The effect of owning instruments which do not make current
interest payments is that a fixed yield is earned not only on the original
investment but also, in effect, on all discount accretion during the life of the
obligations. This implicit reinvestment of earnings at the same rate eliminates
the risk of being unable to reinvest distributions at a rate as high as the
implicit yield on the zero coupon bond, but at the same time eliminates any
opportunity to reinvest earnings at higher rates. For this reason, zero coupon
bonds are subject to substantially greater price fluctuations during periods of
changing market interest rates than those of comparable securities that pay
interest currently, which fluctuation is greater as the period to maturity is
longer. Zero coupon bonds created as collateralized obligations are similar to
those created through the US Treasury, but the former investments do not provide
absolute certainty of maturity or of cash flows after prior classes of the
collateralized obligations are retired. No Portfolio currently intends to invest
more than 20% of its net assets in zero coupon US Government securities.
CERTAIN INVESTMENT POLICIES AND TECHNIQUES OF DWS FLOATING RATE PLUS FUND
Of the Portfolios listed in this Statement of Additional Information, only DWS
Strategic Income VIP may invest in shares of DWS Floating Rate Plus Fund. DWS
Floating Rate Plus Fund invests primarily in Senior Loans and may borrow for
investment purposes, as described below.
Senior Loans. DWS Floating Rate Plus Fund may invest in Senior Loans. Senior
Loans are direct obligations of corporations or other business entities and are
generally arranged by banks or other commercial lending institutions and made
generally to finance internal growth, mergers, acquisitions, stock repurchases
and leveraged buyouts. Senior Loans may include restrictive covenants which must
be maintained by the borrower. Such covenants, in addition to the timely payment
of interest and principal, may include mandatory prepayment provisions arising
from free cash flow, restrictions on dividend payments and usually state that a
borrower must maintain specific minimum financial ratios as well as establishing
limits on total debt. A breach of covenant, which is not waived by the agent, is
normally an event of acceleration, i.e., the agent has the right to call the
outstanding Senior Loan. In addition, loan covenants may include mandatory
prepayment provisions stemming from free cash flow. Free cash flow is cash that
is in excess of capital expenditures plus debt service requirements of principal
and interest. The free cash flow shall be applied to prepay the Senor Loan in an
order of maturity described in the loan documents. Under certain interests in
Senior Loans, the fund may have an obligation to make additional loans upon
demand by the borrower. The fund intends to reserve against such contingent
obligations by segregating sufficient assets in high quality short-term liquid
investments or borrowing to cover such obligations.
The fund's investment in Senior Loans may take the form of purchase of an
assignment or a portion of a Senior Loan from a third party ("assignment") or
acquiring a participation in a Senior Loan ("participation"). The fund may pay a
fee or forego a portion of interest payments to the lender selling a
participation or assignment under the terms of such participation or assignment.
When the fund is a purchaser of an assignment, it typically succeeds to all the
rights and obligations under the loan agreement of the assigning lender and
becomes a lender under the loan agreement with the same rights and obligations
as the assigning lender. Assignments are, however, arranged through private
negotiations between potential assignees and potential assignors, and the rights
and obligations acquired by the purchaser of an assignment may be more limited
than those held by the assigning lender. The fund may also invest in
participations in Senior Loans. With respect to any given Senior Loan, the
rights of the fund when it acquires a participation may be more limited than the
rights of the original lenders or of investors who acquire an assignment.
Participations may entail certain risks relating to the creditworthiness of the
parties from which the participations are obtained.
In a typical interest in a Senior Loan, the agent administers the loan and has
the right to monitor the collateral. The agent is also required to segregate the
principal and interest payments received from the borrower and to hold these
payments for the benefit of the lenders. The fund normally looks to the agent to
collect and distribute principal of and interest on a Senior Loan. Furthermore,
the fund looks to the agent to use normal credit remedies, such as to foreclose
on collateral; monitor credit loan covenants; and notify the lenders of any
adverse changes in the borrower's financial condition or declarations of
insolvency. In the event of a default by the borrower, it is possible, though
unlikely, that the fund could receive a portion of the borrower's collateral. If
the fund receives collateral other than cash, such collateral will be liquidated
and the cash received from such liquidation will be available for investment as
part of the fund's portfolio. At times the fund may also negotiate with the
agent regarding the agent's exercise of credit remedies under a Senior Loan. The
agent is compensated for these services by the borrower as is set forth in the
loan agreement. Such compensation may take the form of a fee or other amount
paid upon the making of the Senior Loan and/or an ongoing fee or other amount.
The loan agreement in connection with Senior Loans sets forth the standard of
care to be exercised by the agents on behalf of the lenders and usually provides
for the termination of the agent's agency status in the event that it fails to
act properly, becomes insolvent, enters FDIC receivership, or if not FDIC
insured, enters into bankruptcy or if the agent resigns. In the event an agent
is unable to perform its obligations as agent, another lender would generally
serve in that capacity.
The fund believes that the principal credit risk associated with acquiring
Senior Loans from another lender is the credit risk associated with the borrower
of the underlying Senior Loan. The fund may incur additional credit risk,
however, when the fund acquires a participation in a Senior Loan from another
lender because the fund must assume the risk of insolvency or bankruptcy of the
other lender from which the Senior Loan was acquired. However, in acquiring
Senior Loans, the fund conducts an analysis and evaluation of the financial
condition of each such lender. The fund has taken the following measures in an
effort to reduce such risks. The fund will only acquire participations in Senior
Loans if the lender selling the participation, and any other persons
interpositioned between the fund and the lender, at the time of investment has
outstanding debt or deposit obligations rated investment grade (BBB or A-3 or
higher by Standards & Poor's Ratings Group ("S&P") or Baa or P-3 or higher by
Moody's Investors Service ("Moody's")) or determined by the Advisor to be of
comparable quality. Long-term debt rated BBB by S&P is regarded by S&P as having
adequate capacity to pay interest and repay principal and debt rated Baa by
Moody's is regarded by Moody's as a medium grade obligation, i.e., it is neither
highly protected nor poorly secured. Commercial paper rated A-1 by S&P indicates
that the degree of safety regarding timely payment is considered by S&P to be
either overwhelming or very strong and issues of commercial paper rated Prime-1
by Moody's are considered by Moody's to have a superior ability for repayment of
senior short-term debt obligations.
Senior Loans, unlike certain bonds, usually do not have call protection. This
means that interests comprising the fund's portfolio, while having a stated one
to ten-year term, may be prepaid, often without penalty. The fund generally
holds Senior Loans to maturity unless it has become necessary to sell them to
adjust the fund's portfolio in accordance with the Advisor's view of current or
expected economic or specific industry or borrower conditions.
Senior Loans frequently require full or partial prepayment of a loan when there
are asset sales or a securities issuance. Prepayments on Senior Loans may also
be made by the borrower at its election. The rate of such prepayments may be
affected by, among other things, general business and economic conditions, as
well as the financial status of the borrower. Prepayment would cause the actual
duration of a Senior Loan to be shorter than its stated maturity. Prepayment may
be deferred by the fund. This should, however, allow the fund to reinvest in a
new loan and recognize as income any unamortized loan fees. This may result in a
new facility fee payable to the fund.
Because interest rates paid on these Senior Loans periodically fluctuate with
the market, it is expected that the prepayment and a subsequent purchase of a
new Senior Loan by the fund will not have a material adverse impact on the yield
of the portfolio. See "Portfolio Transactions."
Under a Senior Loan, the borrower generally must pledge as collateral assets
which may include one or more of the following: cash; accounts receivable;
inventory; property, plant and equipment; both common and preferred stock in its
subsidiaries; trademarks, copyrights, patent rights; and franchise value. The
fund may also receive guarantees as a form of collateral. In some instances, a
Senior Loan may be secured only by stock in a borrower or its affiliates. The
fund may also invest in Senior Loans not secured by any collateral. The market
value of the assets serving as collateral (if any) will, at the time of
investment, in the opinion of the Advisor, equal or exceed the principal amount
of the Senior Loan. The valuations of these assets may be performed by an
independent appraisal. If the agent becomes aware that the value of the
collateral has declined, the agent may take action as it deemed necessary for
the protection of its own interests and the interests of the other lenders,
including, for example, giving the borrower an opportunity to provide additional
collateral or accelerating the loan. There is no assurance, however, that the
borrower would provide additional collateral or that the liquidation of the
existing collateral would satisfy the borrower's obligation in the event of
nonpayment of scheduled interest or principal, or that such collateral could be
readily liquidated.
The fund may be required to pay and may receive various fees and commissions in
the process of purchasing, selling and holding Senior Loans. The fee component
may include any, or a combination of, the following elements: arrangement fees,
non-use fees, facility fees, letter of credit fees and ticking fees. Arrangement
fees are paid at the commencement of a loan as compensation for the initiation
of the transaction. A non-use fee is paid based upon the amount committed but
not used under the loan. Facility fees are on-going annual fees paid in
connection with a loan. Letter of credit fees are paid if a loan involves a
letter of credit. Ticking fees are paid from the initial commitment indication
until loan closing if for an extended period. The amount of fees is negotiated
at the time of transaction.
If legislation or state or federal regulators impose additional requirements or
restrictions on the ability of financial institutions to make loans that are
considered highly leveraged transactions, the availability of Senior Loans for
investment by the fund may be adversely affected. In addition, such requirements
or restrictions could reduce or eliminate sources of financing for certain
borrowers. This would increase the risk of default. If legislation or federal or
state regulators require financial institutions to dispose of Senior Loans that
are considered highly leveraged transactions or subject such Senior Loans to
increased regulatory scrutiny, financial institutions may determine to sell such
Senior Loans. Such sales could result in prices that, in the opinion of the
Advisor, do not represent fair value. If the fund attempts to sell a Senior Loan
at a time when a financial institution is engaging in such a sale, the price the
fund could get for the Senior Loan may be adversely affected.
Borrowing. DWS Floating Rate Plus Fund may borrow money from banks for
investment purposes to the extent permitted by the 1940 Act. This practice is
known as leverage. Currently, under the 1940 Act, the fund may borrow up to
one-third of its total assets (including the amount borrowed) provided that it
maintains continuous asset coverage of 300% with respect to such borrowings and
sells (within three days) sufficient portfolio holdings to restore such coverage
if it should decline to less than 300% due to market fluctuations or otherwise,
even if disadvantageous from an investment standpoint. The fund may borrow
through other means to the extent permitted by the 1940 Act. In addition to
borrowing for leverage purposes, the fund also may borrow money to meet
redemptions in order to avoid forced, unplanned sales of portfolio securities or
for other temporary or emergency purposes. This allows the fund greater
flexibility to buy and sell portfolio securities for investment or tax
considerations, rather than for cash flow considerations.
The use of borrowing by the fund involves special risk considerations that may
not be associated with other funds having similar policies. Because
substantially all of the fund's assets fluctuate in value, whereas the interest
obligation resulting from a borrowing may be fixed by the terms of the fund's
agreement with its lender, the net asset value per share of the funds will tend
to increase more when its portfolio securities increase in value and decrease
more when its portfolio securities decrease in value than would otherwise be the
case if the fund did not borrow funds. In addition, interest costs on borrowings
may fluctuate with changing market rates of interest and may partially offset or
exceed the return earned on borrowed funds. Under adverse market conditions, the
fund might have to sell portfolio securities to meet interest or principal
payments at a time when fundamental investment considerations would not favor
such sales. The interest that the fund must pay on borrowed money, together with
any additional fees to establish and maintain a borrowing facility, are
additional costs that will reduce or eliminate any net investment income and may
also offset any potential capital gains. Unless appreciation and income, if any,
on assets acquired with borrowed funds exceed the costs of borrowing, the use of
leverage will diminish the investment performance of the fund compared with what
it would have been without leverage.
MANAGEMENT OF THE FUND
Investment Advisor
DIMA, which is part of Deutsche Asset Management ("DeAM"), is the investment
advisor for each Portfolio. Under the supervision of the Board of Trustees of
the Fund, with headquarters at 345 Park Avenue, New York, New York 10154, DIMA
or a subadvisor, makes each Portfolio's investment decisions, buys and sells
securities for each Portfolio and conducts research that leads to these purchase
and sale decisions. The Advisor or a subadvisor manages each Portfolio's daily
investment and business affairs subject to the policies established by the
Fund's Board of Trustees. DIMA and its predecessors have more than 80 years of
experience managing mutual funds. DIMA provides a full range of investment
advisory services to institutional and retail clients. Each Portfolio's
investment advisor or subadvisor is also responsible for selecting brokers and
dealers and for negotiating brokerage commissions and dealer charges.
Deutsche Asset Management ("DeAM") is the marketing name in the US for the asset
management activities of Deutsche Bank AG, DIMA, Deutsche Bank Trust Company
Americas and DWS Trust Company. DeAM is a global asset management organization
that offers a wide range of investing expertise and resources, including
hundreds of portfolio managers and analysts and an office network that reaches
the world's major investment centers. This well-resourced global investment
platform brings together a wide variety of experience and investment insight,
across industries, regions, asset classes and investing styles. DIMA is an
indirect, wholly owned subsidiary of Deutsche Bank AG. Deutsche Bank AG is a
major global banking institution that is engaged in a wide range of financial
services, including investment management, mutual fund, retail, private and
commercial banking, investment banking and insurance.
The Advisor provides investment counsel for many individuals and institutions,
including insurance companies, industrial corporations, and financial and
banking organizations, as well as providing investment advice to open- and
closed-end SEC registered funds.
In certain cases, the investments for a Portfolio are managed by the same
individuals who manage one or more other mutual funds advised by the Advisor
that have similar names, objectives and investment styles. You should be aware
that the Portfolios are likely to differ from these other mutual funds in size,
cash flow pattern and tax matters. Accordingly, the holdings and performance of
the Portfolios can be expected to vary from those of these other mutual funds.
The Board and the shareholders of each Portfolio recently approved an amended
and restated investment management agreement (the "Investment Management
Agreement") for the Portfolios, except DWS Large Cap Value Portfolio, which
adopted the amended and restated investment management agreement effective April
11, 2007. Pursuant to the Investment Management Agreement for each Portfolio,
the Advisor provides continuing investment management of the assets of a
Portfolio. In addition to the investment management of the assets of the
Portfolios, the Advisor determines the investments to be made for the Portfolio,
including what portion of its assets remain uninvested in cash or cash
equivalents, and with whom the orders for investments are placed, consistent
with the Portfolio's policies as stated in its prospectus and SAI, or as adopted
by the Portfolio's Board. The Advisor will also monitor, to the extent not
monitored by the Portfolio's administrator or other agent, the Portfolio's
compliance with its investment and tax guidelines and other compliance policies.
The Advisor provides assistance to the Portfolio's Board in valuing the
securities and other instruments held by the Portfolio, to the extent reasonably
required by valuation policies and procedures that may be adopted by the Fund.
Pursuant to the Investment Management Agreement, (unless otherwise provided in
the agreement or as determined by the Portfolio's Board and to the extent
permitted by applicable law), the Advisor pays the compensation and expenses of
all the Board members, officers, and executive employees of the Portfolio,
including the Portfolio's share of payroll taxes, who are affiliated persons of
the Advisor.
The Investment Management Agreement provides that the Portfolio is generally
responsible for expenses that include: fees payable to the Advisor; outside
legal, accounting or auditing expenses, including with respect to expenses
related to negotiation, acquisition or distribution of portfolio investments;
maintenance of books and records that are maintained by the Portfolio, the
Portfolio's custodian, or other agents of the Portfolio; taxes and governmental
fees; fees and expenses of the Portfolio's accounting agent, custodian,
sub-custodians, depositories, transfer agents, dividend reimbursing agents and
registrars; payment for portfolio pricing or valuation services to pricing
agents, accountants, bankers and other specialists, if any; brokerage
commissions or other costs of acquiring or disposing of any portfolio securities
or other instruments of the Portfolio; and litigation expenses and other
extraordinary expenses not incurred in the ordinary course of the Portfolio's
business.
The Investment Management Agreement allows the Advisor to delegate any of its
duties under the Agreement to a subadvisor, subject to a majority vote of the
Board of the Portfolio, including a majority of the Board who are not interested
persons of the Portfolio, and, if required by applicable law, subject to a
majority vote of the Portfolio's shareholders.
The Investment Management Agreement provides that the Advisor shall not be
liable for any error of judgment or mistake of law or for any loss suffered by
the Portfolio in connection with matters to which the agreement relates, except
a loss resulting from willful malfeasance, bad faith or gross negligence on the
part of the Advisor in the performance of its duties or from reckless disregard
by the Advisor of its obligations and duties under the agreement. The Investment
Management Agreement may be terminated at any time, without payment of penalty,
by either party or by vote of a majority of the outstanding voting securities of
the Portfolio on 60 days' written notice.
Effective May 1, 2008, for all services provided under the Investment Management
Agreement, the Portfolio pays the Advisor a fee, computed daily and paid
monthly, at the annual rate as a percentage of net assets shown below:
Portfolio Management Fee Rate
--------- -------------------
DWS Balanced VIP 0.370% to $250 million
0.345% next $750 million
0.310% thereafter
DWS Blue Chip VIP 0.550% to $250 million
0.520% to next $750 million
0.500% to next $1.5 billion
0.480% to next $2.5 billion
0.450% to next $2.5 billion
0.430% to next $2.5 billion
0.410% to next $2.5 billion
0.390% thereafter
DWS Core Fixed Income VIP 0.500% to $250 million
0.470% next $750 million
0.450% next $1.5 billion
0.430% next $2.5 billion
0.400% next $2.5 billion
0.380% next $2.5 billion
0.360% next $2.5 billion
0.340% thereafter
DWS Davis Venture Value VIP 0.865% to $250 million
0.840% next $250 million
0.815% next $500 million
0.790% next $1.5 billion
0.765% thereafter
DWS Dreman High Return Equity VIP 0.665% to $250 million
0.635% next $750 million
0.615% next $1.5 billion
0.595% next $2.5 billion
0.565% next $2.5 billion
0.555% next $2.5 billion
0.545% next $2.5 billion
0.535% thereafter
DWS Dreman Small Mid Cap Value VIP 0.650% to $250 million
0.620% next $750 million
0.600% next $1.5 billion
0.580% next $2.5 billion
0.550% next $2.5 billion
0.540% next $2.5 billion
0.530% next $2.5 billion
0.520% thereafter
DWS Global Thematic VIP 0.915% to $250 million
0.865% next $500 million
0.815% next $750 million
0.765% next $1.5 billion
0.715% thereafter
DWS Government & Agency Securities VIP 0.450% to $250 million
0.430% next $750 million
0.410% next $1.5 billion
0.400% next $2.5 billion
0.380% next $2.5 billion
0.360% next $2.5 billion
0.340% next $2.5 billion
0.320% thereafter
DWS High Income VIP 0.500% to $250 million
0.470% next $750 million
0.450% next $1.5 billion
0.430% next $2.5 billion
0.400% next $2.5 billion
0.380% next $2.5 billion
0.360% next $2.5 billion
0.340% thereafter
DWS International Select VIP Equity VIP 0.650% to $1.5 billion
0.635% next $1.75 billion
0.620% next $1.75 billion
0.605% thereafter
DWS Janus Growth & Income VIP 0.665% to $250 million
0.640% next $750 million
0.615% next $1.5 billion
0.590% thereafter
DWS Mid Cap Growth VIP 0.665% to $250 million
0.635% next $750 million
0.615% next $1.5 billion
0.595% next $2.5 billion
0.565% next $2.5 billion
0.555% next $2.5 billion
0.545% next $2.5 billion
0.535% thereafter
DWS Money Market VIP 0.285% to $500 million
0.270% next $500 million
0.255% next $1.0 billion
0.240% thereafter
DWS Small Cap Growth VIP 0.550% to $250 million
0.525% next $750 million
0.500% thereafter
DWS Strategic Income VIP 0.550% to $250 million
0.520% next $750 million
0.50% next $1.5 billion
0.48% next $2.5 billion
0.450% next $1.5 billion
0.430% next $2.5 billion
0.410% next $2.5 billion
0.390% thereafter
DWS Technology VIP 0.665% to $250 million
0.635% next $750 million
0.615% next $1.5 billion
0.595% next $2.5 billion
0.565% next $2.5 billion
0.555% next $2.5 billion
0.545% next $2.5 billion
0.535% thereafter
DWS Turner Mid Cap Growth VIP 0.715% to $250 million
0.700% next $250 million
0.685% next $500 million
0.670% thereafter
Effective April 11, 2007, DWS Large Cap Value VIP pays the Advisor a fee, under
the Investment Management Agreement, calculated daily and paid monthly, at the
annual rates shown below:
Average Daily Net Assets Fee Rate
------------------------ --------
First $250 million 0.650%
next $750 million 0.625%
next $1.5 billion 0.600%
next $2.5 billion 0.575%
next $2.5 billion 0.550%
next $2.5 billion 0.525%
next $2.5 billion 0.500%
Over $12.5 billion 0.475%
Prior to May 1, 2008, the Portfolios listed below each paid the Advisor a
graduated investment management fee, based on the average daily net assets of a
Portfolio, payable monthly, at the annual rates shown below. The prior
investment management agreement for each Portfolio, except DWS Large Cap Value
VIP, included the provision of administrative services:
DWS Blue Chip VIP and DWS Strategic Income VIP
Average Daily Net Assets Fee Rate
------------------------ --------
First $250 million 0.650%
next $750 million 0.620%
next $1.5 billion 0.600%
next $2.5 billion 0.580%
next $2.5 billion 0.550%
next $2.5 billion 0.530%
next $2.5 billion 0.510%
Over $12.5 billion 0.490%
DWS Core Fixed Income VIP and DWS High Income VIP
Average Daily Net Assets Fee Rate
------------------------ --------
First $250 million 0.600%
next $750 million 0.570%
next $1.5 billion 0.550%
next $2.5 billion 0.530%
next $2.5 billion 0.500%
next $2.5 billion 0.480%
next $2.5 billion 0.460%
Over $12.5 billion 0.440%
DWS Dreman Small Mid Cap Value VIP
Average Daily Net Assets Fee Rate
------------------------ --------
First $250 million 0.750%
next $750 million 0.720%
next $1.5 billion 0.700%
next $2.5 billion 0.680%
next $2.5 billion 0.650%
next $2.5 billion 0.640%
next $2.5 billion 0.630%
Over $12.5 billion 0.620%
DWS Government & Agency Securities VIP
Average Daily Net Assets Fee Rate
------------------------ --------
First $250 million 0.550%
next $750 million 0.530%
next $1.5 billion 0.510%
next $2.5 billion 0.500%
next $2.5 billion 0.480%
next $2.5 billion 0.460%
next $2.5 billion 0.440%
Over $12.5 billion 0.420%
DWS International Select Equity VIP
Average Daily Net Assets Fee Rate
------------------------ --------
First $1.5 billion 0.750%
next $1.75 billion 0.735%
next $1.75 billion 0.720%
Over $5 billion 0.705%
For the period from January 1, 2007 through April 10, 2007, DWS Large Cap Value
VIP paid the Advisor a fee, under the Investment Management Agreement,
calculated daily and paid monthly, at the annual rates shown below:
Average Daily Net Assets Fee Rate
------------------------ --------
First $250 million 0.750%
next $750 million 0.725%
next $1.5 billion 0.700%
next $2.5 billion 0.675%
next $2.5 billion 0.650%
next $2.5 billion 0.625%
next $2.5 billion 0.600%
Over $12.5 billion 0.575%
DWS Balanced VIP paid the Advisor a monthly investment management fee, based on
the average daily net assets of the Portfolio, computed and accrued daily and
payable monthly, at the annual rates shown below:
Average Daily Net Assets Fee Rate
------------------------ --------
First $250 million 0.470%
Next $750 million 0.445%
Over $1 billion 0.410%
DWS Davis Venture Value VIP paid the Advisor a graduated investment management
fee based on the average daily net assets of the Portfolio, computed and accrued
daily and payable monthly, at the annual rates shown below:
Average Daily Net Assets of the Portfolio Fee Rate
----------------------------------------- --------
$0-$250 million 0.950%
next $250 million 0.925%
next $500 million 0.900%
next $1.5 billion 0.875%
Over $2.5 billion 0.850%
DWS Dreman High Return Equity VIP, DWS Mid Cap Growth VIP and DWS Technology VIP
each paid the Advisor a graduated investment management fee, based on the
average daily net assets of a Portfolio, payable monthly, at the annual rates
shown below:
Average Daily Net Assets of the Portfolio Fee Rate
----------------------------------------- --------
$0-$250 million 0.750%
next $750 million 0.720%
next $1.5 billion 0.700%
next $2.5 billion 0.680%
next $2.5 billion 0.650%
next $2.5 billion 0.640%
next $2.5 billion 0.630%
Over $12.5 billion 0.620%
DWS Global Thematic VIP paid the Advisor a graduated investment management fee,
based on the average daily net assets of the Portfolio, payable monthly, at the
annual rates shown below:
Average Daily Net Assets of the Portfolio Fee Rate
----------------------------------------- --------
$0-$250 million 1.000%
next $500 million 0.950%
next $750 million 0.900%
next $1.5 billion 0.850%
Over $3 billion 0.800%
DWS Janus Growth & Income VIP paid a monthly investment management fee, based on
the average daily net assets of the Portfolio, computed and accrued daily and
payable monthly, at the annual rates shown below:
Average Daily Net Assets Fee Rate
------------------------ --------
First $250 million 0.750%
Next $750 million 0.725%
Next $1.5 billion 0.700%
Over $2.5 billion 0.675%
DWS Money Market VIP paid the Advisor a graduated investment management fee,
based on the average daily net assets of the Portfolio, computed daily and
payable monthly, at the annual rates shown below:
DWS Money Market VIP
Average Daily Net Assets Fee Rate
------------------------ --------
First $500 million 0.385%
Next $500 million 0.370%
Next $1 billion 0.355%
Over $2 billion 0.340%
DWS Small Cap Growth VIP paid the Advisor a graduated investment management fee,
based on the average daily net assets of the Portfolio, computed and accrued
daily and payable monthly, at the annual rates shown below:
Average Daily Net Assets Fee Rate
------------------------ --------
First $250 million 0.650%
Next $750 million 0.625%
Over $1 billion 0.600%
DWS Turner Mid Cap Growth VIP paid the Advisor a graduated investment management
fee based on the average daily net assets of the Portfolio, computed and accrued
daily and payable monthly, at the annual rates shown below:
Average Daily Net Assets of the Portfolio Fee Rate
----------------------------------------- --------
First $250 million 0.800%
Next $250 million 0.785%
Next $500 million 0.770%
Over $1 billion 0.755%
In addition, the Board and shareholders recently approved a new subadvisor
approval policy for the Portfolios (the "Subadvisor Approval Policy"). The
Subadvisor Approval Policy permits the Advisor, subject to the approval of the
Board, including a majority of its independent board members, to appoint and
replace subadvisors and to amend subadvisory contracts without obtaining
shareholder approval. Under the Subadvisor Approval Policy, the Board, including
its independent board members, will continue to evaluate and approve all new
sub-advisory contracts between the Advisor and any subadvisor, as well as all
changes to any existing sub-advisory contract. The Portfolios cannot implement
the Subadvisor Approval Policy without the SEC either adopting revisions to
current rules (as it proposed to do in October 2003) or granting the Portfolios
exemptive relief from existing rules. The Portfolios and the Advisor would be
subject to certain conditions imposed by the SEC (and certain conditions that
may be imposed in the future within either exemptive relief or a rule) to ensure
that the interests of the Portfolios and its shareholders are adequately
protected whenever the Advisor acts under the Subadvisor Approval Policy,
including any shareholder notice requirements.
The Advisor may enter into arrangements with affiliates and third party service
providers to perform various administrative, back-office and other services
relating to client accounts. Such service providers may be located in the US or
in non-US jurisdictions.
Certain investments may be appropriate for a Portfolio and also for other
clients advised by the Advisor. Investment decisions for a Portfolio and other
clients are made with a view to achieving their respective investment objectives
and after consideration of such factors as their current holdings, availability
of cash for investment and the size of their investments generally. Frequently,
a particular security may be bought or sold for only one client or in different
amounts and at different times for more than one but less than all clients.
Likewise, a particular security may be bought for one or more clients when one
or more other clients are selling the security. In addition, purchases or sales
of the same security may be made for two or more clients on the same day. In
such event, such transactions will be allocated among the clients in a manner
believed by the Advisor to be equitable to each. In some cases, this procedure
could have an adverse effect on the price or amount of the securities purchased
or sold by a Portfolio. Purchase and sale orders for a Portfolio may be combined
with those of other clients of the Advisor in the interest of achieving the most
favorable net results to that Portfolio.
Each Agreement continues in effect until September 30, 2008 and from year to
year thereafter only if its continuance is approved annually by the vote of a
majority of those Trustees who are not parties to such Agreements or interested
persons of the Advisor or the Fund, cast in person at a meeting called for the
purpose of voting on such approval, and either by a vote of the Fund's Trustees
or of a majority of the outstanding voting securities of the respective
Portfolio. The Agreements may be terminated at any time without payment of
penalty by either party on sixty days' written notice and automatically
terminate in the event of their assignment.
The investment management fees paid by each Portfolio for its last three fiscal
years are shown in the table below:
Portfolio Fiscal 2007 Fiscal 2006 Fiscal 2005
--------- ----------- ----------- -----------
DWS Balanced VIP(1) $2,666,534 $2,967,510 $3,294,501
DWS Blue Chip VIP(2) $2,018,922 $2,228,613 $2,118,362
DWS Core Fixed Income VIP(3) $2,144,122 $2,124,452 $1,883,098
DWS Davis Venture Value VIP(4) $3,682,130 $3,764,933 $3,353,292
DWS Dreman High Return Equity VIP(5) $7,381,802 $7,237,569 $6,460,811
DWS Dreman Small Mid Cap Value VIP(6) $4,418,373 $4,646,491 $4,088,038
DWS Global Thematic VIP(7) $1,732,290 $1,342,622 $841,064
DWS Government & Agency Securities VIP(8) $1,209,630 $1,427,977 $1,713,621
DWS High Income VIP(9) $1,912,439 $2,263,303 $2,468,117
DWS International Select Equity VIP(10) $2,007,490 $2,094,158 $1,801,345
DWS Janus Growth & Income VIP(11) $1,474,026 $1,719,994 $1,712,762
DWS Large Cap Value VIP(12) $1,950,386 $2,335,628 $2,307,055
DWS Mid Cap Growth VIP(13) $435,886 $473,444 $453,434
DWS Money Market VIP(14) $1,392,290 $1,444,203 $1,440,420
DWS Small Cap Growth VIP(15) $1,413,741 $1,738,224 $1,681,135
DWS Strategic Income VIP(16)(17) $697,461 $662,490 $586,283
DWS Technology VIP $1,237,197 $1,472,355 $1,068,872
DWS Turner Mid Cap Growth VIP(18) $1,067,206 $1,209,780 $1,287,229
(1) Through April 30, 2008, the Advisor has agreed to waive all or a
portion of its management fee and reimburse or pay operating expenses
to the extent necessary to maintain DWS Balanced VIP's total operating
expenses at 0.51% and 0.89% for Class A and Class B shares,
respectively, excluding certain expenses such as extraordinary
expenses, taxes, brokerage, interest, and organizational and offering
expenses. Effective May 2, 2005 through April 30, 2008, the Advisor
agreed to limit its fees and reimburse expenses of DWS Balanced VIP to
the extent necessary to maintain the annual expenses of Class A at
0.51% and Class B 0.89% (excluding certain expenses such as
extraordinary expenses, taxes, brokerage, interest and fund accounting
outsourcing fee savings). Accordingly, for the year ended December 31,
2005, the Advisor waived $99,176 of management fee and the fee pursuant
to the Management Agreement was equivalent to an annual effective rate
of 0.47% of the portfolio's average daily net assets. In addition, for
the year ended December 31, 2005, the Advisor waived $8,199 of record
keeping fees for Class B shares of DWS Balanced VIP.
(2) Prior to October 1, 2006, the investment management fee for DWS Blue
Chip VIP was calculated according to the following schedule: 0.650% of
average daily net assets.
(3) Through September 30, 2008, the Advisor has contractually agreed to
waive all or a portion of its management fee and reimburse or pay
certain operating expenses so that the total annual operating expenses
of the Portfolio will not exceed 0.70% for Class A shares, excluding
certain expenses such as extraordinary expenses, taxes, brokerage and
interest expenses. Although there can be no assurance that the current
waiver/expense reimbursement arrangement will be maintained beyond
September 30, 2008, the Advisor has committed to review the continuance
of waiver/expense reimbursement arrangements by September 30, 2008.
Prior to October 1, 2006, the investment management fee for DWS Core
Fixed Income VIP was calculated according to the following schedule:
0.600% of average daily net assets.
(4) Through April 30, 2009, the Advisor has contractually agreed to waive
all or a portion of its management fee and reimburse or pay certain
operating expenses so that the total annual operating expenses of the
Portfolio will not exceed 0.89% for Class A shares, excluding certain
expenses such as extraordinary expenses, taxes, brokerage and interest.
Through September 30, 2008, the Advisor has contractually agreed to
waive all or a portion of its management fee and reimburse or pay
certain operating expenses so that the total annual operating expenses
of the Portfolio will not exceed 1.29% for Class B shares, excluding
certain expenses such as extraordinary expenses, taxes, brokerage and
interest expenses. Although there can be no assurance that the current
waiver/expense reimbursement arrangement will be maintained beyond
September 30, 2008, the Advisor has committed to review the continuance
of waiver/expense reimbursement arrangements by September 30, 2008.
Through September 30, 2007, the Advisor has agreed to waive all or a
portion of its management fee and reimburse or pay operating expenses
to the extent necessary to maintain DWS Davis Venture Value VIP's total
operating expenses at 0.89% and 1.29% for Class A shares and Class B
shares, respectively, excluding certain expenses such as extraordinary
expenses, taxes, brokerage, interest, and organizational and offering
expenses. Effective October 1, 2007 through April 30, 2008, the Advisor
has agreed to waive all or a portion of its management fee and
reimburse or pay operating expenses to the extent necessary so that the
portfolio's total operating expenses will not exceed 0.86% and 1.26%
for Class A shares and Class B shares, respectively, excluding certain
expenses such as extraordinary expenses, taxes, brokerage, interest,
and organizational and offering expenses. For the period from January
1, 2005 through September 30, 2005, the Advisor agreed to limit its
fees and reimburse expenses of each class of DWS Davis Venture Value
VIP to the extent necessary to maintain the annual expenses of Class A
at 1.15% and Class B at 1.55%. Effective October 1, 2005 through
September 30, 2006, the Advisor agreed to limit its fees and reimburse
expenses of DWS Davis Venture Value VIP to the extent necessary to
maintain the annual expenses of Class A at 0.853% and Class B at 1.003%
(excluding certain expenses such as extraordinary expenses, taxes,
brokerage, interest, 12b-1 fees and fund accounting outsourcing fee
savings). Accordingly, for the year ended December 31, 2005, the
Advisor waived $187,410 of management fees. In addition, for the year
ended December 31, 2005, the Advisor waived $7,238 of record keeping
fees for Class B shares of DWS Davis Venture Value VIP.
(5) Through April 30, 2010, the Advisor has agreed to waive all or a
portion of its management fee and reimburse or pay certain operating
expenses so that the total annual operating expenses of the portfolio
will not exceed 0.78% and 1.11% for Class A shares and Class B shares,
respectively, excluding certain expenses such as extraordinary
expenses, taxes, brokerage and interest. In addition, for the fiscal
year ended December 31, 2006, the Advisor waived record keeping
expenses of Class B shares of DWS Dreman High Return Equity VIP in the
amount of $9,001.
(6) Prior to October 1, 2006, the investment management fee for DWS Dreman
Small Mid Cap Value VIP was calculated according to the following
schedule: 0.750% of average daily net assets.
(7) Through April 30, 2009, the Advisor has agreed to waive all or a
portion of its management fee and reimburse or pay certain operating
expenses so that the total annual operating expenses of the portfolio
will not exceed 1.05% and 1.45% for Class A shares and Class B shares,
respectively, excluding certain expenses such as extraordinary
expenses, taxes, brokerage, interest, and indirect expenses of
underlying DWS portfolios. Through September 30, 2007, the Advisor has
agreed to waive all or a portion of its management fee and reimburse or
pay operating expenses to the extent necessary to maintain DWS Global
Thematic VIP's total operating expenses at 1.12% and 1.52% for Class A
and Class B shares, respectively, excluding certain expenses such as
extraordinary expenses, taxes, brokerage, interest, and organizational
and offering expenses. Effective October 1, 2007 through April 30,
2008, the Advisor has agreed to waive all or a portion of its
management fee and reimburse or pay operating expenses to the extent
necessary so that the portfolio's total operating expenses will not
exceed 1.10% and 1.50% for Class A and Class B shares, respectively,
excluding certain expenses such as extraordinary expenses, taxes,
brokerage, interest, and organizational and offering expenses. For the
period from January 1, 2005 through September 30, 2005, the Advisor
agreed to limit its fees and reimburse expenses of each class of DWS
Global Thematic VIP to the extent necessary to maintain the annual
expenses of Class A at 1.56% and Class B at 1.96%. Effective October 1,
2005 through September 30, 2006, the Advisor agreed to limit its fees
and reimburse expenses of DWS Global Thematic VIP to the extent
necessary to maintain the annual expenses of Class A at 1.04% and Class
B at 1.44% (excluding certain expenses such as extraordinary expenses,
taxes, brokerage, interest and fund accounting outsourcing fee
savings). Accordingly, for the year ended December 31, 2005, the
Advisor waived $112,367 of management fees. In addition, for the year
ended December 31, 2005, the Advisor waived $1,700 of record keeping
fees for Class B shares of DWS Global Thematic VIP.
(8) Through September 30, 2008, the Advisor has agreed to waive all or a
portion of its management fee and reimburse or pay certain operating
expenses so that the total annual operating expenses of the portfolio
will not exceed 0.64% and 1.04% for Class A shares and Class B shares,
respectively, excluding certain expenses such as extraordinary
expenses, taxes, brokerage and interest. Although there can be no
assurance that the current waiver/expense reimbursement arrangement
will be maintained beyond September 30, 2008, the Advisor has committed
to review the continuance of waiver/expense reimbursement arrangements
by September 30, 2008. Prior to October 1, 2006, the investment
management fee for DWS Government & Agency Securities VIP was
calculated according to the following schedule: 0.550% of average daily
net assets. Through April 30, 2008, the Advisor has agreed to waive all
or a portion of its management fee and reimburse or pay operating
expenses to the extent necessary to maintain DWS Government & Agency
Securities VIP's total operating expenses at 0.63% for Class B shares,
excluding certain expenses such as extraordinary expenses, taxes,
brokerage, interest, and organizational and offering expenses.
(9) Prior to October 1, 2006, the investment management fee for DWS High
Income VIP was calculated according to the following schedule: 0.600%
of average daily net assets.
(10) Prior to October 1, 2006, the investment management fee for DWS
International Select Equity VIP was calculated according to the
following schedule: 0.750% of average daily net assets.
(11) For the period from January 1, 2005 through September 30, 2005, the
Advisor agreed to limit the fees and reimburse each class of DWS Janus
Growth & Income VIP to the extent necessary to maintain annual
operating expenses of Class A at 1.15% and Class B at 1.55%. Effective
May 2, 2005, through April 30, 2006, the Advisor agreed to limit the
fees and reimburse expenses of the DWS Janus Growth & Income VIP to the
extent necessary to maintain annual operating expenses of Class A at
0.95%. Effective May 2, 2005, through September 30, 2005, the Advisor
agreed to limit the fees and reimburse expenses of DWS Janus Growth &
Income VIP to the extent necessary to maintain annual operating
expenses of Class B at 1.35%. Effective October 1, 2005 through
September 30, 2006, the Advisor agreed to limit the fees and reimburse
expenses of DWS Janus Growth & Income VIP to the extent necessary to
maintain annual expenses of Class B at 1.003% (excluding certain
expenses such as extraordinary expense, taxes, brokerage, interest,
12b-1 fees and fund accounting outsourcing fee savings). Accordingly,
for the year ended December 31, 2005, the Advisor waived $6,113 of
record keeping fees for Class B shares of the portfolio.
(12) Restated on an annualized basis to reflect fee changes which took
effect on April 11, 2007. Restated on an annualized basis to reflect
fee changes which took effect on April 11, 2007. Includes a 0.10%
administrative services fee paid to the Advisor. Prior to April 11,
2007, the investment management fee for DWS Large Cap Value VIP was
calculated according to the following schedule: 0.750% of the first
$250 million of average daily net assets; 0.725% of the next $750
million of average daily net assets; 0.700% of the next $1.5 billion of
average daily net assets; 0.675% of the next $2.5 billion of average
daily net assets; 0.650% of the next $2.5 billion of average daily net
assets; 0.625% of the next $2.5 billion of average daily net assets;
0.600% of the next $2.5 billion of average daily net assets and 0.575%
of average daily net assets in excess of $12.5 billion. For the year
ended December 31, 2005, the Advisor agreed to limit its fees and
reimburse expenses of each class of DWS Large Cap Value VIP to the
extent necessary to maintain annual expenses of Class A at 0.80% and
Class B at 1.20%. For the year ended December 31, 2005, the Advisor
waived $12,690 of management fee and the fee pursuant to the Management
Agreement was equivalent to an annual effective rate of 0.75% of the
portfolio's average daily net assets. In addition, for the year ended
December 31, 2005, the Advisor waived $536 of record keeping fees for
Class B shares of the DWS Large Cap Value VIP.
(13) Through April 30, 2009, the Advisor has agreed to waive all or a
portion of its management fee and reimburse or pay certain operating
expenses so that the total annual operating expenses of the portfolio
will not exceed 0.94% for Class A shares, excluding certain expenses
such as extraordinary expenses, taxes, brokerage and interest. Through
September 30, 2008, the Advisor has agreed to waive all or a portion of
its management fee and reimburse or pay certain operating expenses so
that the total annual operating expenses of the portfolio will not
exceed 1.34% for Class B shares, excluding certain expenses such as
extraordinary expenses, taxes, brokerage, interest and organizational
and offering expenses. Although there can be no assurance that the
current waiver/expense reimbursement arrangement will be maintained
beyond September 30, 2008, the Advisor has committed to review the
continuance of waiver/expense reimbursement arrangements by September
30, 2008. Through September 30, 2007, the Advisor has agreed to waive
all or a portion of its management fee and reimburse or pay operating
expenses to the extent necessary to maintain DWS Mid Cap Growth VIP's
total operating expenses at 0.90% and 1.30% for Class A and Class B
shares, respectively, excluding certain expenses such as extraordinary
expenses, taxes, brokerage, interest, and organizational and offering
expenses. Effective October 1, 2007 through April 30, 2008, the Advisor
has agreed to waive all or a portion of its management fee and
reimburse or pay operating expenses to the extent necessary to maintain
so that the portfolio's total operating expenses will not exceed 0.94%
and 1.34% for Class A and Class B shares, respectively, excluding
certain expenses such as extraordinary expenses, taxes, brokerage,
interest, and organizational and offering expenses. In addition, for
the fiscal year ended December 31, 2006, the Advisor waived record
keeping expenses of Class B shares of DWS Mid Cap Growth VIP in the
amount of $2,088. For the period from January 1, 2005 through September
30, 2005, the Advisor agreed to limit its fees and reimburse expenses
of each class of DWS Mid Cap Growth VIP to the extent necessary to
maintain the annual expenses of Class A at 0.95% and Class B at 1.35%.
Effective October 1, 2005 through September 30, 2006, the Advisor
agreed to limit its fees and reimburse expenses of DWS Mid Cap Growth
VIP to the extent necessary to maintain the annual expenses of Class B
at 1.308% (excluding certain expenses such as extraordinary expenses,
taxes, brokerage, interest and fund accounting outsourcing fee
savings). Accordingly, for the year ended December 31, 2005, the
Advisor waived $32,030 of management fees. In addition, for the year
ended December 31, 2005, the Advisor waived $2,113 of record keeping
fees for Class B shares of DWS Mid Cap Growth VIP. For the year ended
December 31, 2004, the Advisor agreed to limit its fees and reimburse
expenses of each class of the DWS Mid Cap Growth VIP to the extent
necessary to maintain the annual expenses of Class A at 0.95% and Class
B at 1.35%. For the year ended December 31, 2004, the Advisor waived
$42,450 of management fees.
(14) Through April 30, 2010, the Advisor has agreed to waive all or a
portion of its management fee and reimburse or pay certain operating
expenses so that the total annual operating expenses of the portfolio
will not exceed 0.44% and 0.79% for Class A shares and Class B shares,
respectively, excluding certain expenses such as extraordinary
expenses, taxes, brokerage and interest. Prior to November 6, 2006, the
investment management fee for DWS Money Market VIP was calculated
according to the following schedule: 0.500% of the first $215 million
of average daily net assets; 0.375% of the next $335 million of average
daily net assets; 0.300% of the next $250 million of average daily net
assets and 0.250% of average daily net assets in excess of $800
million. Through April 30, 2008, the Advisor has agreed to waive all or
a portion of its management fee and reimburse or pay operating expenses
to the extent necessary to maintain DWS Money Market VIP's total
operating expenses at 0.44% and 0.81% for Class A and Class B shares,
respectively, excluding certain expenses such as extraordinary
expenses, taxes, brokerage, interest, and organizational and offering
expenses.
(15) Through April 30, 2008, the Advisor has agreed to waive all or a
portion of its management fee and reimburse or pay operating expenses
to the extent necessary to maintain DWS Small Cap Growth VIP's total
operating expenses at 0.72% and 1.09% for Class A and Class B shares,
respectively, excluding certain expenses such as extraordinary
expenses, taxes, brokerage, interest, and organizational and offering
expenses. Effective May 2, 2005 through April 30, 2008, the Advisor
agreed to limit its fees and reimburse expenses of DWS Small Cap Growth
VIP to the extent necessary to maintain the annual expense of Class A
at 0.72% and Class B at 1.09% (excluding certain expenses such as
extraordinary expenses, taxes, brokerage, interest and fund accounting
outsourcing fee savings). For the year ended December 31, 2005, the
Advisor waived $9,538 of record keeping fees for Class B shares of the
DWS Small Cap Growth VIP. In addition, for the fiscal year ended
December 31, 2006, the Advisor waived record keeping expenses of Class
B shares of DWS Small Cap Growth VIP in the amount of $3,729.
(16) To the extent the portfolio invests in other mutual funds advised by
the Advisor and its affiliates ("affiliated mutual funds"), the Advisor
has agreed to waive its management fee by an amount equal to the amount
of management fees borne by the portfolio as a shareholder of such
other affiliated mutual funds. In the case of an investment in DWS
Floating Rate Plus Fund, the Advisor has also agreed to apply a
management fee credit to the portfolio equal to the difference between
DWS Floating Rate Plus Fund's management fee and the portfolio's
management fee, if positive, as applied to the amount of assets
invested by the portfolio in DWS Floating Rate Plus Fund.
(17) Through September 30, 2008, the Advisor has contractually agreed to
waive all or a portion of its management fee and reimburse or pay
certain operating expenses so that the total annual operating expenses
of the portfolio will not exceed 0.83% and 1.23% for Class A shares and
Class B shares, respectively, excluding certain expenses such as
extraordinary expenses, taxes, brokerage, interest, and indirect
expenses of underlying DWS funds. Although there can be no assurance
that the current waiver/expense reimbursement arrangement will be
maintained beyond September 30, 2008, the Advisor has committed to
review the continuance of waiver/expense reimbursement arrangements by
September 30, 2008. Prior to October 1, 2006, the investment management
fee for DWS Strategic Income VIP was calculated according to the
following schedule: 0.650% of average daily net assets. For the period
from January 1, 2005, through September 30, 2005, the Advisor agreed to
limit its fees and reimburse expenses of each class of the DWS
Strategic Income VIP to the extent necessary to maintain the annual
expenses of Class A at 1.05% and Class B at 1.30%. In addition, for the
fiscal year ended December 31, 2006, the Advisor waived record keeping
expenses of Class B shares of DWS Strategic Income VIP in the amount of
$12,068. Effective October 1, 2005 through September 30, 2006, the
Advisor agreed to limit its fees and reimburse expenses of DWS
Strategic Income VIP to the extent necessary to maintain the annual
expenses of Class B at 1.199% (excluding certain expenses such as
extraordinary expenses, taxes, brokerage, interest and fund accounting
outsourcing fee savings). In addition, for the year ended December 31,
2005, the Advisor waived $5,796 of record keeping fees for Class B
shares of the DWS Strategic Income VIP.
(18) Through September 30, 2008, the Advisor has contractually agreed to
waive all or a portion of its management fee and reimburse or pay
certain operating expenses so that the total annual operating expenses
of the portfolio will not exceed 0.94% and 1.34% for Class A shares and
Class B shares, respectively, excluding certain expenses such as
extraordinary expenses, taxes, brokerage and interest. Although there
can be no assurance that the current waiver/expense reimbursement
arrangement will be maintained beyond September 30, 2008, the Advisor
has committed to review the continuance of waiver/expense reimbursement
arrangements by September 30, 2008. For the period from January 1, 2005
through September 30, 2005, the Advisor agreed to limit its fees and
reimburse expenses of each class of DWS Turner Mid Cap Growth VIP to
the extent necessary to maintain the annual expenses of Class A at
1.30% and Class B at 1.70%. In addition, for the fiscal year ended
December 31, 2006, the Advisor waived record keeping expenses of Class
B shares of DWS Turner Mid Cap Growth VIP in the amount of $535.
Effective October 1, 2005 through September 30, 2006, the Advisor
agreed to limit its fees and reimburse expenses of DWS Turner Mid Cap
Growth VIP to the extent necessary to maintain the annual expense of
Class B at 1.087% (excluding certain expenses such as extraordinary
expenses, taxes, brokerage, interest, 12b-1 fees and fund accounting
fee savings). For the year ended December 31, 2005, the Advisor waived
$6,545 of record keeping fees for Class B shares of DWS Turner Mid Cap
Growth VIP.
Subadvisor to DWS Balanced VIP
Effective May 1, 2008, Deutsche Asset Management International GmbH ("DeAMi"),
an investment advisor registered with the US Securities and Exchange Commission,
is the subadvisor to the Portfolio. Pursuant to the sub-advisory agreement (the
"Sub-Advisory Agreement") DeAMi, Mainzer Landstrasse 178-190, Frankfurt am Main,
Germany, 60327, renders investment advisory and management services to the
Portfolio pursuant to the terms of the Sub-Advisory Agreement between DeAMi and
DIMA. DeAMi is an affiliate of DIMA and a subsidiary of Deutsche Bank AG. Under
the terms of the Sub-Advisory Agreement, DeAMi manages the investment and
reinvestment of a portion of the large cap value allocation of the Portfolio's
investment portfolio and provides such investment advice, research and
assistance as DIMA may, from time to time, reasonably request.
DIMA will pay a fee to DeAMi for serving as subadvisor with respect to a portion
of the Portfolio's large cap value allocation at the annual rates shown below:
Assets Managed by DeAMi (in Euros) Sub-Advisory Fee (as a % of average daily net assets)
---------------------------------- -----------------------------------------------------
(euro)0 - (euro)250 million 0.300%
(euro)250 million - (euro)500 million 0.200%
(euro)500 million - (euro)1 billion 0.120%
(euro)1 billion - (euro)2.5 billion 0.080%
(euro)2.5 billion - (euro)5 billion 0.055%
(euro)5 billion - (euro)25 billion 0.035%
(euro)25 billion - (euro)50 billion 0.025%
over (euro)50 billion 0.015%
The Sub-Advisory Agreement provides that DeAMi will not be liable for any error
of judgment or mistake of law or for any loss suffered by the Portfolio in
connection with matters to which the Sub-Advisory Agreement relates, except a
loss resulting from willful misconduct, bad faith or gross negligence on the
part of DeAMi in the performance of its duties or from reckless disregard by
DeAMi of its obligations and duties under the Sub-Advisory Agreement.
Subadvisor to DWS Core Fixed Income VIP
Aberdeen Asset Management Inc. ("AAMI") is the sub-advisor to the Portfolio (the
"Aberdeen Subadvisory Agreement"). As subadvisor, AAMI, under the supervision of
the Board of Trustees and the Advisor, makes the Portfolio's investment
decisions, buys and sells securities for the Portfolio and conducts the research
that leads to these purchase and sale decisions. AAMI is also responsible for
selecting brokers and dealers and for negotiating brokerage commissions and
dealer charges. AAMI provides a full range of international investment advisory
services to institutional and retail clients. AAMI is a direct wholly-owned
subsidiary of Aberdeen PLC, and a registered investment advisor under the
Investment Advisers Act of 1940, as amended.
Under the terms of the Aberdeen Subadvisory Agreement, AAMI agrees, subject to
the supervision and control of the Advisor and the Board, to manage the
securities and assets of the Portfolio entrusted to it by the Advisor and in
accordance with the Portfolio's investment objective, policies and restrictions.
AAMI is paid for its services by the Advisor, and not the Portfolio, from its
fee as investment advisor to the Portfolio. As compensation for its services
under the Aberdeen Subadvisory Agreement, the Advisor pays AAMI a fee at the
annual rate of 0.38% of the average daily net assets of the Portfolio, computed
daily and paid monthly.
The Aberdeen Subadvisory Agreement was last renewed on September 19, 2007
(unless sooner terminated) and will remain in effect from year to year
thereafter if approved annually (i) by the Board or by the vote of a "majority
of the outstanding voting securities" of the Portfolio, and (ii) by a majority
of the Independent Board Members who are not parties to the Agreement, cast in
person at a meeting called for such purpose.
AAMI is obligated to pay all expenses (excluding brokerage costs, custodian
fees, fees of independent registered public accounting firms or other expenses
of the Portfolio to be borne by the Portfolio or the Trust in connection with
the performance of its services). The Portfolio bears certain other expenses
incurred in its operation. The services of AAMI are not deemed to be exclusive
and nothing in the Aberdeen Subadvisory Agreement prevents AAMI or its
affiliates from providing similar services to other investment companies and
other clients (whether or not their investment objective and policies are
similar to those of the Portfolio) or from engaging in other activities.
Under the Aberdeen Subadvisory Agreement, AAMI will be liable (i) if it causes
the Portfolio to be in violation of any applicable federal or state law, rule or
regulation or any investment policy or restriction set forth in the prospectus
or any written guidelines, policies or instructions provided in writing by the
Board or the Advisor, and (ii) for its willful misfeasance, bad faith or gross
negligence in the performance of its duties or its reckless disregard of its
obligations and duties under the Aberdeen Subadvisory Agreement.
The Advisor pays AAMI a subadvisory fee at the annual rate, payable monthly, of
0.38% of the portfolio's average daily net assets. The subadvisory fee paid by
DIMA to AAMI for DWS Core Fixed Income VIP for the fiscal year ended December
31, 2007 was $1,372,644 and December 31, 2006 was $1,348,400.
Subadvisor to DWS Davis Venture Value VIP. Davis Selected Advisors, L.P.
("DSA"), 2949 E. Elvira Road, Suite 101, Tucson, AZ 85706, is the subadvisor to
DWS Davis Venture Value VIP. DSA has served as subadvisor to the Portfolio since
its inception. DSA is a limited partnership, Davis Investments, LLC is the
general partner; Christopher C. Davis is the managing member of Davis
Investments, LLC.
Under the terms of the subadvisory agreement, DSA manages the investment and
reinvestment of the Portfolio's assets and will provide such investment advice,
research and assistance as the Advisor may, from time to time, reasonably
request.
The subadvisory agreement provides that DSA will not be liable for any error of
judgment or mistake of law or for any loss suffered by the Portfolio in
connection with matters to which the subadvisory agreement relates, except a
loss resulting from willful misfeasance, bad faith or gross negligence on the
part of DSA in the performance of its duties or from reckless disregard by DSA
of its obligations and duties under the subadvisory agreement.
The subadvisory agreement with DSA was last renewed on September 19, 2007 and
will continue in effect from year to year, but only as long as such continuance
is specifically approved at least annually (a) by a majority of the trustees who
are not parties to such agreement or interested persons of any such party except
in their capacity as trustees of the Fund, and (b) by a majority of the
shareholders or the Board of Trustees of the Fund. The subadvisory agreement may
be terminated at any time upon 60 days' notice by DSA, by DIMA or by the Board
of Trustees of the Fund or by majority vote of the outstanding shares of the
Portfolio and will terminate automatically upon assignment or upon termination
of the Portfolio's investment management agreement.
The Advisor pays DSA for its services a subadvisory fee, payable monthly, at the
annual rates shown below:
Average Daily Net Assets of the Portfolio Annual Subadvisory Fee Rate
----------------------------------------- ---------------------------
$0-$100 million 0.50%
Next $400 million 0.45%
On amounts over $500 million 0.40%
The subadvisory fees paid by DIMA to DSA for DWS Davis Venture Value VIP for the
past three fiscal years are as follows:
2007 2006 2005
---- ---- ----
DWS Davis Venture Value VIP $1,808,935 $1,851,632 $1,651,883
Subadvisor to DWS Dreman High Return Equity VIP and DWS Dreman Small Mid Cap
Value VIP. Dreman Value Management, L.L.C. ("DVM"), 520 East Cooper Avenue,
Aspen, Colorado, is the subadvisor to DWS Dreman High Return Equity VIP and DWS
Dreman Small Mid Cap Value VIP. DVM is controlled by David N. Dreman. DVM serves
as subadvisor pursuant to the terms of a subadvisory agreement between it and
the Advisor for each Portfolio. DVM was formed in April 1997 and has served as
subadvisor for DWS Dreman High Return Equity VIP since its inception and for DWS
Dreman Small Mid Cap Value VIP since January 18, 2002. DVM is controlled by
David Dreman.
Under the terms of each subadvisory agreement, DVM manages the investment and
reinvestment of each Portfolio's assets and will provide such investment advice,
research and assistance as the Advisor may, from time to time, reasonably
request.
Each subadvisory agreement provides that DVM will not be liable for any error of
judgment or mistake of law or for any loss suffered by the Portfolio in
connection with matters to which the subadvisory agreement relates, except a
loss resulting from willful misfeasance, bad faith or gross negligence on the
part of DVM in the performance of its duties or from reckless disregard by DVM
of its obligations and duties under the subadvisory agreement.
The subadvisory agreement with DVM for DWS Dreman High Return Equity VIP and DWS
Dreman Small Mid Cap Value VIP was last renewed on September 19, 2007 and will
continue in effect from year to year, but only as long as such continuance is
specifically approved at least annually (a) by a majority of the Trustees who
are not parties to such agreement or interested persons of any such party except
in their capacity as Trustees of the Fund, and (b) by the shareholders or the
Board of Trustees of the Fund. Each subadvisory agreement may be terminated at
any time upon 60 days' notice by the Advisor or by the Board of Trustees of the
Fund or by majority vote of the outstanding shares of the Portfolio, and will
terminate automatically upon assignment or upon termination of the Portfolio's
investment management agreement. DVM may terminate the subadvisory agreement
upon 90 days' notice to the Advisor.
Pursuant to the subadvisory agreement dated April 5, 2002, for DWS Dreman High
Return Equity VIP, DVM receives a subadvisory fee of 1/12 of an annualized rate,
payable monthly, of 0.3375% of 1% of the average daily net assets for DWS Dreman
High Return Equity VIP. Effective January 18, 2002, DVM receives a subadvisory
fee of 1/12 of an annualized rate, payable monthly, of 0.375% of 1% of the
average daily net assets for DWS Dreman Small Mid Cap Value VIP. Fees paid to
DVM for the last three fiscal years were as follows:
2007 2006 2005
---- ---- ----
DWS Dreman High Return Equity VIP $3,428,653 $3,196,136 $2,946,412
DWS Dreman Small Mid Cap Value VIP $2,244,769 $2,326,338 $1,995,042
Subadvisor to DWS Janus Growth & Income VIP. Janus Capital Management LLC
("Janus Capital") 151 Detroit Street, Denver, Colorado 80206-4928, is the
subadvisor to DWS Janus Growth & Income VIP. Janus Capital (together with its
predecessors) has served as an investment adviser since 1969 and currently
serves as investment adviser or sub-adviser, to Separately Managed Accounts,
Mutual Funds, as well as Commingled Pools or Private funds and Wrap Fee
Accounts. Janus Capital is a direct subsidiary of Janus Capital Group, Inc.
("JCGI"), a publicly traded company with principal operations in financial asset
management businesses. JCGI owns approximately 95% of Janus Capital, with the
remaining 5% held by Janus Management Holdings Corporation. Janus Capital has
served as subadvisor to the Portfolio since its inception on October 29, 1999.
Under the terms of the subadvisory agreement, Janus Capital manages the
investment and reinvestment of the Portfolio's assets and will provide such
investment advice, research and assistance as the Advisor may, from time to
time, reasonably request.
The subadvisory agreement provides that Janus Capital will not be liable for any
error of judgment or mistake of law or for any loss suffered by the Portfolio in
connection with matters to which the subadvisory agreement relates, except a
loss resulting from willful misfeasance, bad faith or gross negligence on the
part of Janus Capital in the performance of its duties or from reckless
disregard by Janus Capital of its obligations and duties under the subadvisory
agreement.
The subadvisory agreement with Janus Capital was last renewed on September 19,
2007 and will continue in effect from year to year, but only as long as such
continuance is specifically approved at least annually (a) by a majority of the
Trustees who are not parties to such agreement or interested persons of any such
party except in their capacity as Trustees of the Fund, and (b) by a majority of
the shareholders or the Board of Trustees of the Fund. The subadvisory agreement
may be terminated at any time upon 60 days' notice by Janus Capital, by the
Advisor or by the Board of Trustees of the Fund or by majority vote of the
outstanding shares of the Portfolio, and will terminate automatically upon
assignment or upon termination of the Portfolio's investment management
agreement.
The Advisor pays Janus Capital for its services a subadvisory fee, payable
monthly, at the annual rates shown below:
Average Daily Net Assets of the Portfolios Annual Subadvisory Fee Rate
------------------------------------------ ---------------------------
First $25 million 0.45%
Next $125 million 0.40%
Next $600 million 0.375%
Over $750 million 0.35%
The subadvisory fees paid by DIMA to Janus Capital for DWS Janus Growth & Income
VIP for the past three fiscal years are as follows:
2007 2006 2005
---- ---- ----
DWS Janus Growth & Income VIP $786,130 $909,764 $569,033
Subadvisor to DWS Large Cap Value VIP. Effective February 5, 2007, Deutsche
Asset Management International GmbH ("DeAMi"), Mainzer Landstrasse 178-190,
60325 Frankfurt am Main, Germany, an investment advisor registered with the US
Securities and Exchange Commission, is the subadvisor to the DWS Large Cap Value
VIP. DeAMi renders investment advisory and management services to DWS Large Cap
Value VIP pursuant to the terms of a Sub-Advisory Agreement (the "Sub-Advisory
Agreement") between DeAMi and DIMA. DeAMi is an affiliate of DIMA and a
subsidiary of Deutsche Bank AG. Under the terms of the Sub-Advisory Agreement,
DeAMi will manage the investment and reinvestment of the Portfolio's portfolio
and will provide such investment advice, research and assistance as DIMA may,
from time to time, reasonably request.
The subadvisory agreement with DeAMi was last renewed on September 19, 2007 and
will continue in effect from year to year, but only as long as such continuance
is specifically approved at least annually (a) by a majority of the Trustees who
are not parties to such agreement or interested persons of any such party except
in their capacity as Trustees of the Fund, and (b) by a majority of the
shareholders or the Board of Trustees of the Fund. The subadvisory agreement may
be terminated at any time upon 60 days' notice by DeAMi, by the Advisor or by
the Board of Trustees of the Fund or by majority vote of the outstanding shares
of the Portfolio, and will terminate automatically upon assignment or upon
termination of the Portfolio's investment management agreement.
DIMA will pay a fee to DeAMi for serving as subadvisor to the Fund at an annual
rate of 50% of the Advisor's annual management fee it receives from DWS Large
Cap Value VIP.
The subadvisory fee paid by DIMA to DeAMi for DWS Large Cap Value VIP for the
past fiscal year is as follows:
2007
----
DWS Large Cap Value VIP $835,420
The Sub-Advisory Agreement provides that DeAMi will not be liable for any error
of judgment or mistake of law or for any loss suffered by the Portfolio in
connection with matters to which the Sub-Advisory Agreement relates, except a
loss resulting from willful misconduct, bad faith or gross negligence on the
part of DeAMi in the performance of its duties or from reckless disregard by
DeAMi of its obligations and duties under the Sub-Advisory Agreement.
Subadvisor to DWS Turner Mid Cap Growth VIP. Turner Investment Partners, Inc.
("TIP"), 1205 Westlakes Drive, Suite 100, Berwyn, PA 19312, is the subadvisor to
DWS Turner Mid Cap Growth VIP. TIP is controlled by Robert E. Turner and Mark D.
Turner. TIP has served as subadvisor to the Portfolio since its inception on May
1, 2001.
Under the terms of the subadvisory agreement, TIP manages the investment and
reinvestment of the Portfolio's assets and will provide such investment advice,
research and assistance as the Advisor may, from time to time, reasonably
request.
The subadvisory agreement provides that TIP will not be liable for any error of
judgment or mistake of law or for any loss suffered by the Portfolio in
connection with matters to which the subadvisory agreement relates, except a
loss resulting from willful misfeasance, bad faith or gross negligence on the
part of TIP in the performance of its duties or from reckless disregard by TIP
of its obligations and duties under the subadvisory agreement.
The subadvisory agreement with TIP was last renewed on September 19, 2007 and
will continue in effect from year to year, but only as long as such continuance
is specifically approved at least annually (a) by a majority of the trustees who
are not parties to such agreement or interested persons of any such party except
in their capacity as trustees of the Fund, and (b) by a majority of the
shareholders or the Board of Trustees of the Fund. The subadvisory agreement may
be terminated at any time upon 60 days' notice by TIP, by the Advisor or by the
Board of Trustees of the Fund or by majority vote of the outstanding shares of
the Portfolio and will terminate automatically upon assignment or upon
termination of the Portfolio's investment management agreement.
The Advisor pays TIP for its services a subadvisory fee, payable monthly, at the
annual rates shown below:
Average Daily Net Assets of the Portfolio Annual Subadvisory Fee Rate
----------------------------------------- ---------------------------
$0-$50 million 0.550%
Next $200 million 0.525%
On amounts over $250 million 0.500%
The subadvisory fees paid by DIMA to TIP for DWS Turner Mid Cap Growth VIP for
the past three fiscal years are as follows:
2007 2006 2005
---- ---- ----
DWS Turner Mid Cap Growth VIP $711,772 $805,959 $725,709
Administrative Agreement
Each Portfolio recently entered into a new administrative services agreement
with the Advisor (the "Administrative Services Agreement"), pursuant to which
the Advisor provides administrative services to the Portfolio including, among
others, providing the Portfolio with personnel, preparing and making required
filings on behalf of the Portfolio, maintaining books and records for the
Portfolio, and monitoring the valuation of Portfolio securities. For all
services provided under the Administrative Services Agreement, the Portfolio
pays the Advisor a fee, computed daily and paid monthly, of 0.100% of each
Portfolio's average daily net assets.
Under the Administrative Services Agreement, the Advisor is obligated on a
continuous basis to provide such administrative services as the Board of the
Portfolio reasonably deems necessary for the proper administration of the
Portfolio. The Advisor provides the Portfolio with personnel; arranges for the
preparation and filing of the Portfolio's tax returns; prepares and submits
reports and meeting materials to the Board and the shareholders; prepares and
files updates to the Portfolio's prospectus and statement of additional
information as well as other reports required to be filed by the SEC; maintains
the Portfolio's records; provides the Portfolio with office space, equipment and
services; supervises, negotiates the contracts of and monitors the performance
of third parties contractors; oversees the tabulation of proxies; monitors the
valuation of portfolio securities and monitors compliance with Board-approved
valuation procedures; assists in establishing the accounting and tax policies of
the Portfolio; assists in the resolution of accounting issues that may arise
with respect to the Portfolio; establishes and monitors the Portfolio's
operating expense budgets; reviews and processes the Portfolio's bills; assists
in determining the amount of dividends and distributions available to be paid by
the Portfolio, prepares and arranges dividend notifications and provides
information to agents to effect payments thereof; provides to the Board periodic
and special reports; provides assistance with investor and public relations
matters; and monitors the registration of shares under applicable federal and
state law. The Advisor also performs certain fund accounting services under the
Administrative Services Agreement. The Administrative Services Agreement
provides that the Advisor will not be liable under the Administrative Services
Agreement except for willful misfeasance, bad faith or negligence in the
performance of its duties or from the reckless disregard by it of its duties and
obligations thereunder.
Because the Portfolios entered into the Administrative Service Agreement
effective May 1, 2008, and April 11, 2007 for DWS Large Cap Value VIP, the
Portfolios do not have any historical administrative fee information to report.
Pursuant to an agreement between the Advisor and State Street Bank and Trust
Company ("SSB"), the Advisor has delegated certain administrative functions to
SSB. The costs and expenses of such delegation are borne by the Advisor, not by
the Portfolios.
PORTFOLIO TRANSACTIONS
The Advisor is generally responsible for placing the orders for the purchase and
sale of portfolio securities, including the allocation of brokerage. With
respect to those funds for which a sub-investment advisor manages the fund's
investments, references in this section to the "Advisor" should be read to mean
the Sub-Advisor, except as noted below.
The policy of the Advisor in placing orders for the purchase and sale of
securities for the Portfolios is to seek best execution, taking into account
such factors, among others, as price; commission (where applicable); the
broker-dealer's ability to ensure that securities will be delivered on
settlement date; the willingness of the broker-dealer to commit its capital and
purchase a thinly traded security for its own inventory; whether the
broker-dealer specializes in block orders or large program trades; the
broker-dealer's knowledge of the market and the security; the broker-dealer's
ability to maintain confidentiality; the broker-dealer's ability to provide
access to new issues; the broker-dealer's ability to provide support when
placing a difficult trade; the financial condition of the broker-dealer; and
whether the broker-dealer has the infrastructure and operational capabilities to
execute and settle the trade. The Advisor seeks to evaluate the overall
reasonableness of brokerage commissions with commissions charged on comparable
transactions and compares the brokerage commissions (if any) paid by the
Portfolios to reported commissions paid by others. The Advisor routinely reviews
commission rates, execution and settlement services performed and makes internal
and external comparisons.
Commission rates on transactions in equity securities on US securities exchanges
are subject to negotiation. Commission rates on transactions in equity
securities on foreign securities exchanges are generally fixed. Purchases and
sales of fixed-income securities and certain over-the-counter securities are
effected on a net basis, without the payment of brokerage commissions.
Transactions in fixed income and certain over-the-counter securities are
generally placed by the Advisor with the principal market makers for these
securities unless the Advisor reasonably believes more favorable results are
available elsewhere. Transactions with dealers serving as market makers reflect
the spread between the bid and asked prices. Purchases of underwritten issues
will include an underwriting fee paid to the underwriter. Money market
instruments are normally purchased in principal transactions directly from the
issuer or from an underwriter or market maker.
It is likely that the broker-dealers selected based on the considerations
described in this section will include firms that also sell shares of the
Portfolios to their customers. However, the Advisor does not consider sales of
shares of the Portfolios as a factor in the selection of broker-dealers to
execute portfolio transactions for the Portfolios and, accordingly, has
implemented policies and procedures reasonably designed to prevent its traders
from considering sales of shares of the Portfolios as a factor in the selection
of broker-dealers to execute portfolio transactions for the Portfolios.
The Advisor is permitted by Section 28(e) of the Securities Exchange Act of
1934, as amended ("1934 Act"), when placing portfolio transactions for a
Portfolio, to cause the Portfolio to pay brokerage commissions in excess of that
which another broker-dealer might charge for executing the same transaction in
order to obtain research and brokerage services if the Advisor determines that
such commissions are reasonable in relation to the overall services provided.
The Advisor may from time to time, in reliance on Section 28(e) of the 1934 Act,
execute portfolio transactions with broker-dealers that provide research and
brokerage services to the Advisor. Consistent with the Advisor's policy
regarding best execution, where more than one broker is believed to be capable
of providing best execution for a particular trade, the Advisor may take into
consideration the receipt of research and brokerage services in selecting the
broker-dealer to execute the trade. Although certain research and brokerage
services from broker-dealers may be useful to a Portfolio and to the Advisor, it
is the opinion of the Advisor that such information only supplements its own
research effort since the information must still be analyzed, weighed and
reviewed by the Advisor's staff. To the extent that research and brokerage
services of value are received by the Advisor, the Advisor may avoid expenses
that it might otherwise incur. Research and brokerage services received from a
broker-dealer may be useful to the Advisor and its affiliates in providing
investment management services to all or some of its clients, which includes a
Portfolio. Services received from broker-dealers that executed securities
transactions for a Portfolio will not necessarily be used by the Advisor
specifically to service such Fund.
Research and brokerage services provided by broker-dealers may include, but are
not limited to, information on the economy, industries, groups of securities,
individual companies, statistical information, accounting and tax law
interpretations, political developments, legal developments affecting portfolio
securities, technical market action, pricing and appraisal services, credit
analysis, risk measurement analysis, performance analysis and measurement and
analysis of corporate responsibility issues. Research and brokerage services are
typically received in the form of written or electronic reports, access to
specialized financial publications, telephone contacts and personal meetings
with security analysts, but may also be provided in the form of access to
various computer software and meetings arranged with corporate and industry
representatives.
The Advisor may also select broker-dealers and obtain from them research and
brokerage services that are used in connection with executing trades provided
that such services are consistent with interpretations under Section 28(e) of
the 1934 Act. Typically, these services take the form of computer software
and/or electronic communication services used by the Advisor to facilitate
trading activity with those broker-dealers.
Research and brokerage services may include products obtained from third parties
if the Advisor determines that such product or service constitutes brokerage and
research as defined in Section 28(e) and interpretations thereunder. Currently,
it is the Advisor's policy that Sub-Advisors may not execute portfolio
transactions on behalf of the Portfolios to obtain third party research and
brokerage services. The Advisor may, in the future, change this policy.
Regardless, certain Sub-Advisors may, as matter of internal policy, limit or
preclude third party research and brokerage services.
The Advisor may use brokerage commissions to obtain certain brokerage products
or services that have a mixed use (i.e., it also serves a function that does not
relate to the investment decision-making process). In those circumstances, the
Advisor will make a good faith judgment to evaluate the various benefits and
uses to which it intends to put the mixed use product or service and will pay
for that portion of the mixed use product or service that it reasonably believes
does not constitute research and brokerage services with its own resources.
DIMA will monitor regulatory developments and market practice in the use of
client commissions to obtain research and brokerage services and may adjust its
portfolio transactions policies in response thereto.
Investment decisions for each Portfolio and for other investment accounts
managed by the Advisor are made independently of each other in light of
differing conditions. However, the same investment decision may be made for two
or more of such accounts. In such cases, simultaneous transactions are
inevitable. To the extent permitted by law, the Advisor may aggregate the
securities to be sold or purchased for a Portfolio with those to be sold or
purchased for other accounts in executing transactions. Purchases or sales are
then averaged as to price and commission and allocated as to amount in a manner
deemed equitable to each account. While in some cases this practice could have a
detrimental effect on the price paid or received by, or on the size of the
position obtained or disposed of for, the Portfolio, in other cases it is
believed that the ability to engage in volume transactions will be beneficial to
the Portfolio.
DIMA and its affiliates and the Portfolios' management team manage other mutual
funds and separate accounts, some of which use short sales of securities as a
part of its investment strategy. The simultaneous management of long and short
portfolios creates potential conflicts of interest including the risk that short
sale activity could adversely affect the market value of the long positions (and
vice versa), the risk arising from sequential orders in long and short
positions, and the risks associated with receiving opposing orders at the same
time.
DIMA has adopted procedures that it believes are reasonably designed to mitigate
these potential conflicts of interest. Incorporated in the procedures are
specific guidelines developed to ensure fair and equitable treatment for all
clients. DIMA and the investment team have established monitoring procedures and
a protocol for supervisory reviews, as well as compliance oversight to ensure
that potential conflicts of interest relating to this type of activity are
properly addressed.
Deutsche Bank AG or one of its affiliates (or in the case of a Sub-Advisor, the
Sub-Advisor or one of its affiliates) may act as a broker for the Funds and
receive brokerage commissions or other transaction-related compensation from the
Funds in the purchase and sale of securities, options or futures contracts when,
in the judgment of the Advisor, and in accordance with procedures approved by
the Portfolios' Boards, the affiliated broker will be able to obtain a price and
execution at least as favorable as those obtained from other qualified brokers
and if, in the transaction, the affiliated broker charges the Funds a rate
consistent with that charged to comparable unaffiliated customers in similar
transactions.
Portfolio Turnover. The portfolio turnover rates for each Portfolio, other than
DWS Money Market VIP, are listed below. Each Portfolio's average portfolio
turnover rate is the ratio of the lesser of sales or purchases to the monthly
average value of the portfolio securities owned during the year, excluding all
securities with maturities or expiration dates at the time of acquisition of one
year or less. Securities with maturities of less than one year are excluded from
portfolio turnover rate calculations. Frequency of portfolio turnover will not
be a limiting factor should the Advisor or a Subadvisor deem it desirable to
purchase or sell securities.
Purchases and sales are made for a Portfolio whenever necessary, in management's
opinion, to meet a Portfolio's objective. Higher portfolio turnover (over 100%)
involves correspondingly greater brokerage commissions or other transaction
costs. Higher portfolio turnover may result in the realization of greater net
short-term capital gains for federal income tax purposes.
The Portfolios do not generally make investments for short-term profits, but are
not restricted in policy with regard to portfolio turnover and will make changes
in their investment portfolios from time to time as business and economic
conditions and market prices may dictate and as its investment policy may
require.
Portfolio turnover rates for the years ended December 31, 2007 and 2006,
respectively, for the Portfolios are as follows:
Name December 31, 2007 December 31, 2006
---- ----------------- -----------------
DWS Balanced VIP 190% 108%
DWS Blue Chip VIP 275% 226%
DWS Core Fixed Income VIP(1) 197% 183%
DWS Davis Venture Value VIP 9% 16%
DWS Dreman High Return Equity VIP 27% 20%
DWS Dreman Small Cap Value VIP 110% 52%
DWS Global Thematic VIP 191% 136%
DWS Government & Agency Securities VIP(2) 465% 241%
DWS High Income VIP 61% 93%
DWS International Select Equity VIP 117% 122%
DWS Janus Growth & Income VIP 73% 44%
DWS Large Cap Value VIP 103% 76%
DWS Mid Cap Growth VIP 68% 46%
DWS Small Cap Growth VIP 67% 73%
DWS Strategic Income VIP 147% 143%
DWS Technology VIP 91% 49%
DWS Turner Mid Cap Growth VIP 133% 148%
(1) The portfolio turnover rates including mortgage dollar roll
transactions were 209% and 198% for the years ended December 31, 2007
and 2006, respectively.
(2) The portfolio turnover rates including mortgage dollar roll
transactions were 629% and 403% for the years ended December 31, 2007
and December 31, 2006, respectively.
DWS Balanced VIP: The Portfolio is required to identify any securities of its
"regular brokers or dealers" (as such term is defined in the 1940 Act) that the
Portfolio has acquired during the most recent fiscal year. As of December 31,
2007, the Portfolio held the following securities of its regular brokers or
dealers:
Value of Securities Owned
as of December 31, 2007
Name of Regular Broker or Dealer or Parent (Issuer) (in thousands)
--------------------------------------------------- --------------
3I Group PLC $445
Alleanza Assicurazioni SpA $3,000
Allianz SE $59
American International Group, Inc. $210
Ameriprise Financial, Inc. $1,516
Apollo Investment Corp. $138
ASX Limited $6,000
Aviva PLC $8,000
AXA Asia Pacific Holdings Ltd. $222
Banca Monte dei Paschi di Siena SpA $5,000
Banca Popolare Di Milano $5,000
Banco Bilbao Vizcaya Argenta $5,000
Bancolombia SA $204
Bank of America Corp. $4,555
Bank of East Asia $19
Bank of New York Mellon Corp. $1,146
Barclays PLC $15
BB&T Corp. $215
Canadian Imperial Bank of Commerce $14
Citigroup, Inc. $12,525
Commerzbank AG $15
Credit Suisse Group $34
Daiwa Securities Group, Inc. $9,000
Danske Bank A/S $136
DBS Group Holdings Ltd. $71
Deutsche Boerse AG $25
Deutsche Postbank AG $6,000
E*Trade Financial Corp. $156
Erste Bank Der Oesterreichischen Sparkassen $389
FirstMerit Corp. $138
Hang Seng Bank Ltd. $27
HBOS PLC $12
HSBC Holdings PLC $38
Hypo Real Estate Holding AG $8,000
Interactive Brokers Group, Inc. $133
Intesa Sanpaolo $35
JPMorgan Chase & Co. $12,434
Julius Baer Holdings AG-B $146
Jyske Bank A/S $37
KBC Groep NV $283
Legal & General Group PLC $6,000
Lehman Brothers Holdings, Inc. $3,221
Lloyds TSB Group PCL $12
Manulife Financial Corp. $33
Mediobanca SpA $7,000
Mitsubishi UFJ Financial $603
Mizuho Financial Group, Inc. $19
Morgan Stanley $3,677
National Bank of Canada $5,000
National Bank of Greece $358
Nomura Holdings, Inc. $15
Nordea Bank AB $63
Optionsxpress Holdings, Inc. $95
Oversea-Chinese Banking Corp. $69
Pacific Capital Bancorp $207
Popular North America Inc. $990
Prospect Capital Corp $97
Prudential PLC $334
Royal Bank of Canada $36
Singapore Exchange $37
State Street Corp. $1,457
Storebrand ASA $33
Sun Trust Banks, Inc. $1,019
SVB Financial Group $156
Svenska Handelsbanken $226
The Goldman Sachs Group, Inc. $2,769
UBS AG-Registered $2,501
UniCredito Italiano SpA $560
Waddell & Reed Financial, Inc. $180
Wells Fargo & Co. $9,745
Zurich Financial Services AG $23
Banco Espirito Santo SA $53
Brookfield Asset Management, Inc. $11
IGM Financial, Inc. $5,000
Sumitomo Trust & Banking Co., Ltd. $401
Unione Di Banche Italiane SCPA $10
DWS Blue Chip VIP: The Portfolio is required to identify any securities of its
"regular brokers or dealers" (as such term is defined in the 1940 Act) that the
Portfolio has acquired during the most recent fiscal year. As of December 31,
2007, the Portfolio held the following securities of its regular brokers or
dealers:
Value of Securities Owned
as of December 31, 2007
Name of Regular Broker or Dealer or Parent (Issuer) (in thousands)
--------------------------------------------------- --------------
Goldman Sachs Group, Inc. $5,656
Morgan Stanley $4,865
Bank of America Corp. $3,610
JPMorgan Chase & Co. $3,213
Citi Group, Inc. $2,626
PNC Financial Services Group, Inc. $1,175
Jones Lang LaSalle, Inc. $406
US Bancorp $340
Dun & Bradstreet Corp Del $266
Lazard Ltd. $81
DWS Core Fixed Income VIP: The Portfolio is required to identify any securities
of its "regular brokers or dealers" (as such term is defined in the 1940 Act)
that the Portfolio has acquired during the most recent fiscal year. As of
December 31, 2007, the Portfolio held the following securities of its regular
brokers or dealers:
Value of Securities Owned as
of December 31, 2007
Name of Regular Broker or Dealer or Parent (Issuer) (in thousands)
--------------------------------------------------- --------------
ICICI Bank Ltd. $890
Sumitomo Mitsui Banking Corp $668
Wachovia Bank $6,132
DWS Davis Venture Value VIP: The Portfolio is required to identify any
securities of its "regular brokers or dealers" (as such term is defined in the
1940 Act) that the Portfolio has acquired during the most recent fiscal year. As
of December 31, 2007, the Portfolio held the following securities of its regular
brokers or dealers:
Value of Securities Owned as
of December 31, 2007
Name of Regular Broker or Dealer or Parent (Issuer) (in thousands)
--------------------------------------------------- --------------
Ambac Financial Group, Inc. $683
American International Group, Inc. $11,899
E*Traded Financial Corp. $75
H&R Block, Inc. $2,581
Citigroup Inc. $2,853
HSBC Holdings PLC $1,656
JPMorgan Chase & Co. $11,588
Mellon Funding Corp. $4,423
Morgan Stanley $1,476
Principal Financial Group, Inc. $1,212
State Street Corp. $706
Wachovia Corp. $5,000
Ameriprise Financial, Inc. $3,291
Dun & Bradstreet Corp DEL $3,146
Wells Fargo $6,606
MBIA, Inc. $442
DWS Dreman High Return Equity VIP: The Portfolio is required to identify any
securities of its "regular brokers or dealers" (as such term is defined in the
1940 Act) that the Portfolio has acquired during the most recent fiscal year. As
of December 31, 2007, the Portfolio held the following securities of its regular
brokers or dealers:
Value of Securities Owned as
of December 31, 2007
Name of Regular Broker or Dealer or Parent (Issuer) (in thousands)
--------------------------------------------------- --------------
Bank of America Corp. $33,042
Citigroup, Inc. $8,264
JPMorgan Chase & Co. $1,986
Wachovia Corp. $36,090
Washington Mutual $22,892
PNC Financial Services Group $21,585
US Bancorp $9,011
DWS Dreman Small Mid Cap Value VIP: The Portfolio is required to identify any
securities of its "regular brokers or dealers" (as such term is defined in the
1940 Act) that the Portfolio has acquired during the most recent fiscal year. As
of December 31, 2007, the Portfolio held the following securities of its regular
brokers or dealers:
Value of Securities Owned as
of December 31, 2007
Name of Regular Broker or Dealer or Parent (Issuer) (in thousands)
--------------------------------------------------- --------------
Waddell & Reed Financial, Inc. $10,683
Wachovia Corp. $4,081
DWS Global Thematic VIP: The Portfolio is required to identify any securities of
its "regular brokers or dealers" (as such term is defined in the 1940 Act) that
the Portfolio has acquired during the most recent fiscal year. As of December
31, 2007, the Portfolio held the following securities of its regular brokers or
dealers:
Value of Securities Owned as
of December 31, 2007
Name of Regular Broker or Dealer or Parent (Issuer) (in thousands)
--------------------------------------------------- --------------
Erste Bank Der Oesterreichischen Sparkassen $1,038
Mediobanca SpA $1,970
Unicredito Italiano SpA $1,405
CitiGroup Inc. $1,557
Merrill Lynch & Co., Inc. $2,281
Siam City Bank Pcl-for Reg. $299
Credit Suisse Group $718
OTP Bank NYRT. $760
Mizuho Financial Group, Inc. $730
Australian Wealth Management LTD $815
UBS AG $2,008
Julius Baer Holdings AG-B $1,622
The Blackstone Group LP $799
DWS Government & Agency Securities VIP: The Portfolio is required to identify
any securities of its "regular brokers or dealers" (as such term is defined in
the 1940 Act) that the Portfolio has acquired during the most recent fiscal
year. As of December 31, 2007, the Portfolio did not hold any securities of its
regular brokers or dealers.
DWS High Income VIP: The Portfolio is required to identify any securities of its
"regular brokers or dealers" (as such term is defined in the 1940 Act) that the
Portfolio has acquired during the most recent fiscal year. As of December 31,
2007, the Portfolio held the following securities of its regular brokers or
dealers:
Value of Securities Owned as
of December 31, 2007
Name of Regular Broker or Dealer or Parent (Issuer) (in thousands)
--------------------------------------------------- --------------
E-Trade Financial Corp. $2,252
DWS International Select Equity VIP: The Portfolio is required to identify any
securities of its "regular brokers or dealers" (as such term is defined in the
1940 Act) that the Portfolio has acquired during the most recent fiscal year. As
of December 31, 2007, the Portfolio held the following securities of its regular
brokers or dealers:
Value of Securities Owned as
of December 31, 2007
Name of Regular Broker or Dealer or Parent (Issuer) (in thousands)
--------------------------------------------------- --------------
Prudential PLC $3,294
3I Group PLC $5,372
Erste Bank Der Oesterreichischen Sparkassen $2,530
KBC Groep NV $4,330
National Bank of Greece $4,635
Unicredito Italiano Bank (Ireland) PLC $5,203
DWS Janus Growth & Income VIP: The Portfolio is required to identify any
securities of its "regular brokers or dealers" (as such term is defined in the
1940 Act) that the Portfolio has acquired during the most recent fiscal year. As
of December 31, 2007, the Portfolio held the following securities of its regular
brokers or dealers:
Value of Securities Owned as
of December 31, 2007
Name of Regular Broker or Dealer or Parent (Issuer) (in thousands)
--------------------------------------------------- --------------
Goldman Sachs Group, Inc. $4,553
JPMorgan Chase & Co. $3,256
DWS Large Cap Value VIP: The Portfolio is required to identify any securities of
its "regular brokers or dealers" (as such term is defined in the 1940 Act) that
the Portfolio has acquired during the most recent fiscal year. As of December
31, 2007, the Portfolio held the following securities of its regular brokers or
dealers:
Value of Securities Owned as
of December 31, 2007
Name of Regular Broker or Dealer or Parent (Issuer) (in thousands)
--------------------------------------------------- --------------
American International Group, Inc. $
Bank of New York Mellon Corp. $4,436
Citigroup Inc. $2,374
Comerica, Inc.. $1,254
JPMorgan Chase & Co. $2,974
Lehman Brothers Holdings, Inc. $2,627
\Washington Mutual $1,092
Prudential Financial $3,771
DWS Mid Cap Growth VIP: The Portfolio is required to identify any securities of
its "regular brokers or dealers" (as such term is defined in the 1940 Act) that
the Portfolio has acquired during the most recent fiscal year. As of December
31, 2007, the Portfolio held the following securities of its regular brokers or
dealers:
Value of Securities Owned as
of December 31, 2007
Name of Regular Broker or Dealer or Parent (Issuer) (in thousands)
--------------------------------------------------- --------------
Affiliated Mangers Group, Inc. $1,751
Waddell & Reed Financial, Inc. $747
Eaton Vance Corp. $826
T. Rowe Price Group, Inc. $1,431
DWS Money Market VIP: The Portfolio is required to identify any securities of
its "regular brokers or dealers" (as such term is defined in the 1940 Act) that
the Portfolio has acquired during the most recent fiscal year. As of December
31, 2007, the Portfolio did not hold any securities of its regular brokers or
dealers.
DWS Small Cap Growth VIP: The Portfolio is required to identify any securities
of its "regular brokers or dealers" (as such term is defined in the 1940 Act)
that the Portfolio has acquired during the most recent fiscal year. As of
December 31, 2007, the Portfolio held the following securities of its regular
brokers or dealers:
Value of Securities Owned as
of December 31, 2007
Name of Regular Broker or Dealer or Parent (Issuer) (in thousands)
--------------------------------------------------- --------------
Waddell & Reed Financial, Inc. $3,887
FCStone Group, Inc. $2,960
DWS Strategic Income VIP: The Portfolio is required to identify any securities
of its "regular brokers or dealers" (as such term is defined in the 1940 Act)
that the Portfolio has acquired during the most recent fiscal year. As of
December 31, 2007, the Portfolio held the following securities of its regular
brokers or dealers:
Value of Securities Owned as
of December 31, 2007
Name of Regular Broker or Dealer or Parent (Issuer) (in thousands)
--------------------------------------------------- --------------
E-Trade Financial Corp. $299
DWS Technology VIP: The Portfolio is required to identify any securities of its
"regular brokers or dealers" (as such term is defined in the 1940 Act) that the
Portfolio has acquired during the most recent fiscal year. As of December 31,
2007, the Portfolio did not hold any securities of its regular brokers or
dealers.
DWS Turner Mid Cap Growth VIP: The Portfolio is required to identify any
securities of its "regular brokers or dealers" (as such term is defined in the
1940 Act) that the Portfolio has acquired during the most recent fiscal year. As
of December 31, 2007, the Portfolio held the following securities of its regular
brokers or dealers:
Value of Securities Owned as
of December 31, 2007
Name of Regular Broker or Dealer or Parent (Issuer) (in thousands)
--------------------------------------------------- --------------
Affiliated Managers Group, Inc. $919
BlackRock, Inc. $1,086
Northern Trust Corp. $1,747
T. Rowe Price Group, Inc. $2,955
The table below shows total brokerage commissions paid by each Portfolio for the
last three fiscal years, as applicable.
Fiscal 2007 Fiscal 2006 Fiscal 2005
----------- ----------- -----------
Portfolio
DWS Balanced VIP $0 $529,681 $559,360
DWS Blue Chip VIP $434,083 $353,271 $140,407
DWS Core Fixed Income VIP $0 $0 $0
DWS Davis Venture Value VIP $147,813 $90,519 $82,063
DWS Dreman High Return Equity VIP $581,172 $344,095 $164,905
DWS Dreman Small Mid Cap Value VIP $1,193,080 $1,450,335 $1,430,062
DWS Global Thematic VIP $982,359 $666,802 $260,871
DWS Government & Agency Securities VIP $13,354 $7,131 $8,678
DWS High Income VIP $0 $0 $0
DWS International Select Equity VIP $911,116 $1,099,630 $633,618
DWS Janus Growth & Income VIP $260,312 $157,114 $123,775
DWS Large Cap Value VIP $507,082 $485,059 $377,944
DWS Money Market VIP $0 $0 $0
DWS Mid Cap Growth VIP $80,264 $75,020 $138,639
DWS Small Cap Growth VIP $437,462 $632,776 $821,102
DWS Strategic Income VIP $0 $5,556 $11,767
DWS Technology VIP $433,195 $379,052 $1,109,118
DWS Turner Mid Cap Growth VIP $298,896 $400,264 $379,027
In addition, for the fiscal year ended December 31, 2007, the Portfolios paid no
commissions to brokers for research services.
Codes of Ethics. The Fund, Advisor and subadvisors, and principal underwriter
have each adopted codes of ethics under Rule 17j-1 under the 1940 Act. Board
Members and officers of the Fund and employees of the Advisor or Subadvisors,
and principal underwriter are permitted to make personal securities
transactions, including transactions in securities that may be purchased or held
by the Portfolios, subject to requirements and restrictions set forth in the
applicable Code of Ethics. The Advisor's Code of Ethics contains provisions and
requirements designed to identify and address certain conflicts of interest
between personal investment activities and the interests of the Portfolios.
Among other things, the Advisor's Code of Ethics prohibits certain types of
transactions absent prior approval, imposes time periods during which personal
transactions may not be made in certain securities, imposes holding periods
(generally 30 days) on most transactions and requires the submission of
duplicate broker confirmations and quarterly reporting of securities
transactions. Exceptions to these and other provisions of the Advisor's Code of
Ethics may be granted in particular circumstances after review by appropriate
personnel.
Compensation of Portfolio Managers Advised by the Advisor or its Affiliates
Portfolio managers are eligible for total compensation comprised of base salary
and discretionary incentive compensation.
Base Salary - Base salary generally represents a smaller percentage of portfolio
managers' total compensation than discretionary incentive compensation. Base
salary is linked to job function, responsibilities and financial services
industry peer comparison through the use of extensive market data surveys.
Discretionary Incentive Compensation - Generally, discretionary incentive
compensation comprises a greater proportion of total compensation as a portfolio
manager's seniority and compensation levels increase. Discretionary incentive
compensation is determined based on an analysis of a number of factors,
including among other things, the performance of Deutsche Bank, the performance
of the Asset Management division, and the employee's individual contribution. In
evaluating individual contribution, management will consider a combination of
quantitative and qualitative factors. A portion of the portfolio manager's
discretionary incentive compensation may be delivered in long-term equity
programs (usually in the form of Deutsche Bank equity) (the "Equity Plan"). Top
performing portfolio managers may earn discretionary incentive compensation that
is a multiple of their base salary.
o The quantitative analysis of a portfolio manager's individual
performance is based on, among other factors, performance of all of the
accounts managed by the portfolio manager (which includes the fund and
any other accounts managed by the portfolio manager) over a one-,
three-, and five-year period relative to the appropriate Morningstar
and Lipper peer group universes and/or benchmark index(es) with respect
to each account. Additionally, the portfolio manager's
retail/institutional asset mix is weighted, as appropriate for
evaluation purposes. Generally the benchmark index used is a benchmark
index set forth in the Portfolio's prospectus to which the Portfolio's
performance is compared. Additional or different appropriate peer group
or benchmark indices may also be used. Primary weight is given to
pre-tax portfolio performance over three-year and five-year time
periods (adjusted as appropriate if the portfolio manager has served
for less than five years) with lesser consideration given to portfolio
performance over a one-year period. The increase or decrease in a
Portfolio's assets due to the purchase or sale of Portfolio shares is
not considered a material factor.
o The qualitative analysis of a portfolio manager's individual
performance is based on, among other things, the results of an annual
management and internal peer review process, and management's
assessment of overall portfolio manager contributions to investor
relations, the investment process and overall performance (distinct
from Portfolio and other account performance). Other factors, including
contributions made to the investment team, as well as adherence to
Compliance Policies and Procedures, Risk Management procedures, the
firm's Code of Ethics and "living the values" of the Advisor are also
factors.
The quantitative analysis of a portfolio manager's performance is given more
weight in determining discretionary incentive compensation than the qualitative
portion.
Certain portfolio managers may also participate in the Equity Plan. The amount
of equity awarded under the long-term equity programs is generally based on the
individual's total compensation package and may comprise from 0% to 30% of the
total compensation award. As discretionary incentive compensation increases, the
percentage of compensation awarded in Deutsche Bank equity also increases.
Portfolio managers may receive a portion of their equity compensation in the
form of shares in the proprietary mutual funds that they manage or support.
Portfolio Ownership of Portfolio Managers. For Portfolios managed by the Advisor
or an affiliated Advisor the following table shows the dollar range of shares
owned beneficially and of record by each member of the Portfolio's management
team (except DWS Money Market VIP) in the applicable Portfolio as well as in all
DWS Funds as a group (i.e. those funds advised by Deutsche Asset Management or
its affiliates), including investments by their immediate family members sharing
the same household and amounts invested through retirement and deferred
compensation plans. This information is provided as of each Portfolio's most
recent fiscal year end.
Dollar Range of Dollar Range of All
Name of Portfolio Shares DWS Fund Shares
Name of Portfolio Portfolio Manager Owned Owned
----------------- ----------------- ----- -----
DWS Balanced VIP William Chepolis $0 $100,001-$500,000
Matthew F. MacDonald $0 $10,001-$50,000
Inna Okounkova $0(1) $100,001-$500,000
Jin Chen $0(1) $100,001-$500,000
Gary Sullivan $0 $50,001-$100,000
Julie VanCleave $0 Over $1,000,000
Robert Wang $0(1) $100,001-$500,000
Julie Abbett $0(1) $50,001-$100,000
Thomas Picciochi $0(1) $50,001-$100,000
Thomas Schuessler(19) $0 $50,001-$100,000
Matthias Knerr $0 $500,001-$1,000,000
J. Richard Robben $0 $1-$10,000
John Brennan $0 $0
DWS Blue Chip VIP Julie Abbett $0(2) $50,001-$100,000
Robert Wang $0(2) $100,001-$500,000
Jin Chen $0(2) $100,001-$500,000
DWS Global Thematic VIP Oliver Kratz $0(3) $500,001-$1,000,000
DWS Government & Agency Securities VIP William Chepolis $0(4) $100,001-$500,000
Matthew F. MacDonald $0 $10,001-$50,000
DWS High Income VIP Gary Sullivan $0(5) $50,001-$100,000
DWS International Select Equity VIP Matthias Knerr $0(6) $500,001-$1,000,000
Chris LaJaunie $0 $50,001-$100,000
DWS Large Cap Value VIP Thomas Schuessler(19) $0 $50,001-$100,000
DWS Mid Cap Growth VIP Robert S. Janis $0(7) Over $1,000,000
Joseph Axtell $0(8) $100,001-$500,000
DWS Small Cap Growth VIP Robert S. Janis $0(9) Over $1,000,000
Joseph Axtell $0(10) $100,001-$500,000
DWS Strategic Income VIP William Chepolis $0 $100,001-$500,000
Matthew F. MacDonald $0 $10,001-$50,000
Robert Wang $0(11) $100,001-$500,000
Gary Sullivan $0 $50,001-$100,000
Thomas Picciochi $0(12) $50,001-$100,000
DWS Technology VIP Kelly P. Davis $0 $50,001-$100,000
(1) Although the Portfolio Manager does not have an investment in this
variable annuity portfolio, the Portfolio Manager does hold
$10,001-$50,000 in DWS Balanced Fund, the retail mutual fund that has
the same investment strategy. This investment is included in the
"Dollar Range of All DWS Fund Shares Owned."
(2) Although the Portfolio Manager does not have an investment in this
variable annuity portfolio, the Portfolio Manager does hold
$10,001-$50,000 in DWS Blue Chip Fund, the retail mutual fund that has
the same investment strategy. This investment is included in the
"Dollar Range of All DWS Fund Shares Owned."
(3) Although the Portfolio Manager does not have an investment in this
variable annuity portfolio, the Portfolio Manager does hold
$100,001-$500,000 in DWS Global Thematic Fund, the retail mutual fund
that has the same investment strategy. This investment is included in
the "Dollar Range of All DWS Fund Shares Owned."
(4) Although the Portfolio Manager does not have an investment in this
variable annuity portfolio, the Portfolio Manager does hold
$10,001-$50,000 in DWS U.S. Government Securities Fund, the retail
mutual fund that has the same investment strategy. This investment is
included in the "Dollar Range of All DWS Fund Shares Owned."
(5) Although the Portfolio Manager does not have an investment in this
variable annuity portfolio, the Portfolio Manager does hold
$10,001-$50,000 in DWS High Income Fund, the retail mutual fund that
has the same investment strategy. This investment is included in the
"Dollar Range of All DWS Fund Shares Owned."
(6) Although the Portfolio Manager does not have an investment in this
variable annuity portfolio, the Portfolio Manager does hold
$100,001-$500,000 in DWS International Select Equity Fund, the retail
mutual fund that has the same investment strategy. This investment is
included in the "Dollar Range of All DWS Fund Shares Owned."
(7) Although the Portfolio Manager does not have an investment in this
variable annuity portfolio, the Portfolio Manager does hold
$100,001-$500,000 in DWS Mid Cap Growth Fund, the retail mutual fund
that has the same investment strategy. This investment is included in
the "Dollar Range of All DWS Fund Shares Owned."
(8) Although the Portfolio Manager does not have an investment in this
variable annuity portfolio, the Portfolio Manager does hold $1-$10,000
in DWS Mid Cap Growth Fund, the retail mutual fund that has the same
investment strategy. This investment is included in the "Dollar Range
of All DWS Fund Shares Owned."
(9) Although the Portfolio Manager does not have an investment in this
variable annuity portfolio, the Portfolio Manager does hold
$100,001-$500,000 in DWS Small Cap Growth Fund, the retail mutual fund
that has the same investment strategy. This investment is included in
the "Dollar Range of All DWS Fund Shares Owned."
(10) Although the Portfolio Manager does not have an investment in this
variable annuity portfolio, the Portfolio Manager does hold $1-$10,000
in DWS Small Cap Growth Fund, the retail mutual fund that has the same
investment strategy. This investment is included in the "Dollar Range
of All DWS Fund Shares Owned."
(11) Although the Portfolio Manager does not have an investment in this
variable annuity portfolio, the Portfolio Manager does hold $1-$10,000
in DWS Strategic Income Fund, the retail mutual fund that has the same
investment strategy. This investment is included in the "Dollar Range
of All DWS Fund Shares Owned."
(12) Although the Portfolio Manager does not have an investment in this
variable annuity portfolio, the Portfolio Manager does hold
$10,001-$50,000 in DWS Strategic Income Fund, the retail mutual fund
that has the same investment strategy. This investment is included in
the "Dollar Range of All DWS Fund Shares Owned."
(13) Because the portfolio manager is not resident in the US, the manager
generally does not invest in US registered investment companies, such
as the Portfolio, on account of US tax and other regulatory limitations
applicable to foreign investors.
Conflicts of Interest
In addition to managing the assets of the Portfolios, the portfolio managers may
have responsibility for managing other client accounts of the Advisor or its
affiliates. The tables below show, for each portfolio manager, the number and
asset size of (1) SEC registered investment companies (or series thereof) other
than the Portfolios, (2) pooled investment vehicles that are not registered
investment companies and (3) other accounts (e.g., accounts managed for
individuals or organizations) managed by each portfolio manager. Total assets
attributed to each portfolio manager in the tables below include total assets of
each account managed by them, although the manager may only manage a portion of
such account's assets. The tables also show the number of performance based fee
accounts, as well as the total assets of the accounts for which the advisory fee
is based on the performance of the account. This information is provided as of
the Portfolios' most recent fiscal year end.
Other SEC Registered Investment Companies Managed:
Number of
Investment
Number of Total Assets of Company Total Assets of
Registered Registered Accounts with Performance-
Name of Portfolio Investment Investment Performance- Based Fee
Name of Portfolio Manager Companies Companies Based Fee Accounts
----------------- ------- --------- --------- --------- --------
DWS Balanced VIP William Chepolis 17 $8,847,118,071 0 $0
Matthew F. MacDonald 17 $8,847,118,071 0 $0
Inna Okounkova 14 $3,547,136,617 0 $0
Jin Chen 23 $10,479,347,686 0 $0
Gary Sullivan 10 $6,658,277,827 0 $0
Julie VanCleave 4 $4,985,618,291 0 $0
Robert Wang 42 $13,854,741,323 0 $0
Julie Abbett 23 $10,479,347,686 0 $0
Thomas Picciochi 9 $4,790,022,714 0 $0
Thomas Schuessler 2 $2,068,823,060 0 $0
Matthias Knerr 6 $6,083,433,156 0 $0
J. Richard Robben 1 $1,694,190,916 0 $0
John Brennan 1 $1,694,190,916 0 $0
DWS Blue Chip VIP Julie Abbett 23 $10,762,131,082 0 $0
Robert Wang 42 $14,137,524,719 0 $0
Jin Chen 23 $10,762,131,082 0 $0
DWS Global Thematic VIP Oliver Kratz 1 $2,281,270,704 0 $0
DWS Government & Agency
Securities VIP William Chepolis 17 $9,178,307,011 0 $0
Matthew F. MacDonald 17 $9,178,307,011 0 $0
DWS High Income VIP Gary Sullivan 10 $6,936,429,920 0 $0
DWS International Select
Equity VIP Matthias Knerr 6 $6,368,185,002 0 $0
Chris LaJaunie 0 $0 0 $0
DWS Large Cap Value VIP Thomas Schuessler 1 $1,829,897,301 0 $0
DWS Mid Cap Growth VIP Robert S. Janis 4 $1,588,182,829 0 $0
Joseph Axtell 7 $3,302,095,722 0 $0
DWS Small Cap Growth VIP Robert S. Janis 4 $1,460,143,666 0 $0
Joseph Axtell 7 $3,174,056,559 0 $0
DWS Strategic Income VIP William Chepolis 17 $9,274,188,321 0 $0
Matthew F. MacDonald 17 $9,274,188,321 0 $0
Robert Wang 42 $14,281,811,573 0 $0
Gary Sullivan 10 $7,085,348,076 0 $0
Thomas Picciochi 9 $5,217,092,964 0 $0
DWS Technology VIP Kelly P. Davis 1 $990,445,845 0 $0
Other Pooled Investment Vehicles Managed:
Number of
Pooled
Investment Total Assets
Number of Vehicle of
Pooled Total Assets of Accounts with Performance-
Name of Portfolio Investment Pooled Performance- Based Fee
Name of Portfolio Manager Vehicles Investment Vehicles Based Fee Accounts
----------------- ------- -------- ------------------- --------- --------
DWS Balanced VIP William Chepolis 0 $0 0 $0
Matthew F. MacDonald 0 $0 0 $0
Inna Okounkova 4 $95,045,334 0 $0
Jin Chen 15 $267,818,576 0 $0
Gary Sullivan 0 $0 0 $0
Julie VanCleave 0 $0 0 $0
Robert Wang 27 $974,093,507 4 $539,680,217
Julie Abbett 15 $267,818,576 0 $0
Thomas Picciochi 6 $588,157,482 4 $539,680,217
Thomas Schuessler 0 $0 0 $0
Matthias Knerr 4 $86,797,515 0 $0
J. Richard Robben 0 $0 0 $0
John Brennan 0 $0 0 $0
DWS Blue Chip VIP Julie Abbett 15 $267,818,576 0 $0
Robert Wang 27 $974,093,507 4 $539,680,217
Jin Chen 15 $267,818,576 0 $0
DWS Global Thematic VIP Oliver Kratz 21 $4,027,550,465 0 $0
DWS Government & Agency
Securities VIP William Chepolis 0 $0 0 $0
Matthew F. MacDonald 0 $0 0 $0
DWS High Income VIP Gary Sullivan 0 $0 0 $0
DWS International Select
Equity VIP Matthias Knerr 4 $86,797,515 0 $0
Chris LaJaunie 4 $86,797,515 0 $0
DWS Large Cap Value VIP Thomas Schuessler 0 $0 0 $0
DWS Mid Cap Growth VIP Robert S. Janis 0 $0 0 $0
Joseph Axtell 0 $0 0 $0
DWS Small Cap Growth VIP Robert S. Janis 0 $0 0 $0
Joseph Axtell 0 $0 0 $0
DWS Strategic Income VIP William Chepolis 0 $0 0 $0
Matthew F. MacDonald 0 $0 0 $0
Robert Wang 27 $974,093,507 4 $539,680,217
Gary Sullivan 0 $0 0 $0
Thomas Picciochi 6 $588,157,482 4 $539,680,217
DWS Technology VIP Kelly P. Davis 0 $0 0 $0
Other Accounts Managed:
Number of Total Assets
Other of
Number Accounts with Performance-
Name of Portfolio of Other Total Assets of Performance- Based Fee
Name of Portfolio Manager Accounts Other Accounts Based Fee Accounts
----------------- ------- -------- -------------- --------- --------
DWS Balanced VIP William Chepolis 0 $0 0 $0
Matthew F. MacDonald 0 $0 0 $0
Inna Okounkova 0 $0 0 $0
Jin Chen 8 $821,248,762 0 $0
Gary Sullivan 0 $0 0 $0
Julie VanCleave 10 $700,135,085 0 $0
Robert Wang 46 $8,973,891,923 8 $232,996,736
Julie Abbett 8 $821,248,762 0 $0
Thomas Picciochi 11 $862,134,197 8 $232,996,736
Thomas Schuessler 2 $6,500,000,000 1 $1,200,000,000
Matthias Knerr 2 $114,160,972 0 $0
J. Richard Robben 0 $0 0 $0
John Brennan 0 $0 0 $0
DWS Blue Chip VIP Julie Abbett 8 $821,248,762 0 $0
Robert Wang 46 $8,973,891,923 8 $232,996,736
Jin Chen 8 $821,248,762 0 $0
DWS Global Thematic VIP Oliver Kratz 13 $2,765,482,994 0 $0
DWS Government & Agency
Securities VIP William Chepolis 0 $0 0 $0
Matthew F. MacDonald 0 $0 0 $0
DWS High Income VIP Gary Sullivan 0 $0 0 $0
DWS International Select
Equity VIP Matthias Knerr 2 $114,160,972 0 $0
Chris LaJaunie 2 $114,160,972 0 $0
DWS Large Cap Value VIP Thomas Schuessler 2 $6,500,000,000 1 $1,200,000,000
DWS Mid Cap Growth VIP Robert S. Janis 2 $290,461,367 0 $0
Joseph Axtell 3 $295,790,509 0 $0
DWS Small Cap Growth VIP Robert S. Janis 2 $290,461,367 0 $0
Joseph Axtell 3 $295,790,509 0 $0
DWS Strategic Income VIP William Chepolis 0 $0 0 $0
Matthew F. MacDonald 0 $0 0 $0
Robert Wang 46 $8,973,891,923 8 $232,996,736
Gary Sullivan 0 $0 0 $0
Thomas Picciochi 11 $862,134,197 8 $232,996,736
DWS Technology VIP Kelly P. Davis 0 $0 0 $0
In addition to the accounts above, an investment professional may manage
accounts in a personal capacity that may include holdings that are similar to,
or the same as, those of a Portfolio. The Advisor has in place a Code of Ethics
that is designed to address conflicts of interest and that, among other things,
imposes restrictions on the ability of portfolio managers and other "access
persons" to invest in securities that may be recommended or traded in a
Portfolio and other client accounts.
Real, potential or apparent conflicts of interest may arise when a portfolio
manager has day-to-day portfolio management responsibilities with respect to
more than one fund or account, including the following:
o Certain investments may be appropriate for the Portfolio and also for
other clients advised by the Advisor, including other client accounts
managed by the Portfolio's management team. Investment decisions for
the Portfolio and other clients are made with a view to achieving their
respective investment objectives and after consideration of such
factors as their current holdings, availability of cash for investment
and the size of their investments generally. A particular security may
be bought or sold for only one client or in different amounts and at
different times for more than one but less than all clients. Likewise,
because clients of the Advisor may have differing investment
strategies, a particular security may be bought for one or more clients
when one or more other clients are selling the security. The investment
results achieved for the Portfolio may differ from the results achieved
for other clients of the Advisor. In addition, purchases or sales of
the same security may be made for two or more clients on the same day.
In such event, such transactions will be allocated among the clients in
a manner believed by the Advisor to be most equitable to each client,
generally utilizing a pro rata allocation methodology. In some cases,
the allocation procedure could potentially have an adverse effect or
positive effect on the price or amount of the securities purchased or
sold by the Portfolio. Purchase and sale orders for the Portfolio may
be combined with those of other clients of the Advisor in the interest
of achieving the most favorable net results to the Portfolio and the
other clients.
o To the extent that a portfolio manager has responsibilities for
managing multiple client accounts, a portfolio manager will need to
divide time and attention among relevant accounts. The Advisor attempts
to minimize these conflicts by aligning its portfolio management teams
by investment strategy and by employing similar investment models
across multiple client accounts.
o In some cases, an apparent conflict may arise where the Advisor has an
incentive, such as a performance-based fee, in managing one account and
not with respect to other accounts it manages. The Advisor will not
determine allocations based on whether it receives a performance-based
fee from the client. Additionally, the Advisor has in place supervisory
oversight processes to periodically monitor performance deviations for
accounts with like strategies.
o The Advisor and its affiliates and the investment team of the Portfolio
may manage other mutual funds and separate accounts on a long-short
basis. The simultaneous management of long and short portfolios creates
potential conflicts of interest including the risk that short sale
activity could adversely affect the market value of the long positions
(and vice versa), the risk arising from sequential orders in long and
short positions, and the risks associated with receiving opposing
orders at the same time. The Advisor has adopted procedures that it
believes are reasonably designed to mitigate these potential conflicts
of interest. Included in these procedures are specific guidelines
developed to ensure fair and equitable treatment for all clients whose
accounts are managed by each Portfolio's management team. The Advisor
and the portfolio management team have established monitoring
procedures, a protocol for supervisory reviews, as well as compliance
oversight to ensure that potential conflicts of interest relating to
this type of activity are properly addressed.
The Advisor is owned by Deutsche Bank AG, a multi-national financial services
company. Therefore, the Advisor is affiliated with a variety of entities that
provide, and/or engage in commercial banking, insurance, brokerage, investment
banking, financial advisory, broker-dealer activities (including sales and
trading), hedge funds, real estate and private equity investing, in addition to
the provision of investment management services to institutional and individual
investors. Since Deutsche Bank AG, its affiliates, directors, officers and
employees (the "Firm") are engaged in businesses and have interests other than
managing asset management accounts, such other activities involve real,
potential or apparent conflicts of interest. These interests and activities
include potential advisory, transactional and financial activities and other
interests in securities and companies that may be directly or indirectly
purchased or sold by the Firm for its clients' advisory accounts. These are
considerations of which advisory clients should be aware and which may cause
conflicts that could be to the disadvantage of the Advisor's advisory clients.
The Advisor has instituted business and compliance policies, procedures and
disclosures that are designed to identify, monitor and mitigate conflicts of
interest and, as appropriate, to report them to the Portfolio's Board of
Trustees.
Compensation of Portfolio Managers of Non-affiliated Subadvised Portfolios
Remuneration of Personnel for DWS Core Fixed Income VIP:
Aberdeen's remuneration policy ("Policy") is designed to reflect the importance
of recruiting, retaining and motivating senior executives and portfolio managers
of the caliber necessary to maintain and improve Aberdeen's position in the
asset management industry. The Policy seeks to reward performance in a manner
which aligns the interests of clients, shareholders and executives. The elements
of the Policy as it relates to the Portfolio's portfolio managers are as
follows:
Basic salary. The salaries of all employees are reviewed annually and are
determined by reference to external market research. Aberdeen's Policy is to pay
salaries which, when taken together with other benefits, will provide a
remuneration package that is reasonable and competitive in the asset management
industry. Aberdeen participates in compensation surveys which provide salary
comparisons for a range of employees across Aberdeen. Aberdeen also considers
information included in other publicly available research and survey results.
Staff performance is reviewed formally once a year with mid-term reviews.
The review process looks at all of the ways in which an individual has
contributed to the organization, and specifically, in the case of portfolio
managers, to the investment team.
Annual bonus. The Policy is to recognize corporate and individual achievements
each year through an appropriate annual bonus plan. The aggregate amount of a
cash bonus available in any year is dependent on Aberdeen's overall performance
and profitability. Consideration will also be given to the levels of bonuses
paid in the marketplace. Individual awards, payable to all members of staff, are
determined by a rigorous assessment of achievement against defined objectives,
and are reviewed and approved by Aberdeen's Remuneration Committee.
Portfolio managers' bonuses are based on a combination of the investment team's
overall performance, the individual's performance and the overall performance of
Aberdeen. In calculating a portfolio manager's bonus, Aberdeen takes into
consideration the performance of funds managed by the team as well as more
subjective issues that benefit Aberdeen. Portfolio manager performance on
investment matters is judged over all funds to which the fund manager
contributes. Performance is measured against appropriate market indices as well
as peer universes over various time periods.
Deferred bonus. A deferred bonus plan exists and is designed to encourage the
retention of certain key employees identified as critical to Aberdeen's
achievement of its long-term goals. Deferred bonuses may be in the form of
deferred equity in Aberdeen PLC.
Retention and incentives for former Deutsche Asset Management employees. In
addition to the Policy, appropriate retention and incentive arrangements have
been put into place for certain employees of the former Deutsche Asset
Management businesses, including in some cases participation in the Long Term
Incentive Plan. The costs of these arrangements are being borne by both Deutsche
Asset Management and Aberdeen.
DWS Davis Venture Value VIP
Kenneth Feinberg's compensation for services provided consists of (i) a base
salary, (ii) an annual bonus equal to a percentage of growth in the Davis
Selected Adviser, L.P.'s ("Davis") profits, (iii) awards of equity ("Units") in
Davis including Units, options on Units, and/or phantom Units, and (iv) an
incentive plan whereby Davis purchases shares in selected funds managed by
Davis. At the end of specified periods, generally five-years following the date
of purchase, some, all, or none of the fund shares will be registered in the
employee's name based on performance after expenses on a pre-tax basis versus
the S&P 500 Index and versus peer groups as defined by Morningstar or Lipper.
Davis' portfolio managers are provided benefits packages including life
insurance, health insurance, and participation in company 401(k) plan comparable
to that received by other company employees.
Christopher Davis' compensation for services provided to Davis consists of a
base salary. Davis' portfolio managers are provided benefits packages including
life insurance, health insurance, and participation in company 401(k) plan
comparable to that received by other company employees.
DWS Dreman High Return Equity VIP and DWS Dreman Small Mid Cap Value VIP
The Portfolios have been advised that the subadvisor has implemented a highly
competitive compensation plan which seeks to attract and retain exceptional
investment professionals who have demonstrated that they can consistently
outperform their respective fund's benchmark. The compensation plan is comprised
of both a fixed component and a variable component. The variable component is
determined by assessing the investment professional's performance measured
utilizing both quantitative and qualitative factors.
The subadvisor's investment professionals are each paid a fixed base salary that
is determined based on their job function and responsibilities. The base salary
is deemed to be competitive with the marketplace and specifically with salaries
in the financial services industry by utilizing various salary surveys compiled
for the financial services industry, specifically, investment advisory firms.
The variable component of the subadvisor's compensation plan which takes the
form of a cash bonus combined with employee retention bonus units payable over
time is designed to reward and retain investment professionals including
portfolio managers and research analysts for their contributions to a
portfolio's performance relative to its benchmark.
Investment professionals may also receive equity in the form of units or
fractional units of membership interest in the subadvisor or they may receive
employee retention bonus units which enable them to participate in the growth of
the firm. Investment professionals also participate in the subadvisor's profit
sharing, defined contribution plan that allows the subadvisor to contribute up
to twenty-five percent of an employee's total compensation, subject to various
regulatory limitations, to each employee's profit sharing account. The
subadvisor maintains both a qualified and non-qualified profit sharing plan
which benefits employees of the firm including both portfolio managers and
research analysts. Contributions to the subadvisor's profit sharing plan vest
over a specified term. Finally all employees of the subadvisor including
investment professionals receive additional fringe benefits in the form of
subsidized medical, dental, vision, group-term and life insurance coverage.
The basis for determining the variable component of an investment professional's
total compensation is determined through a subjective process which evaluates an
investment professional performance against several quantitative and qualitative
factors including the following:
Quantitative factors:
o Relative ranking of a portfolio's performance against its peers in the
one, three and five year pre-tax investment performance categories. The
portfolios' performance is evaluated against peers in its fund category
and performance is ranked from one to four on a declining scale
depending on the quartile in which the portfolio manager's absolute
performance falls. The portfolio manager is rewarded on a graduated
scale for outperforming relative to his peers.
o Relative performance of a portfolio's performance against the
pre-determined indices for the product strategy against which a
portfolio's performance is measured. The portfolio manager is rewarded
on a graduated scale for outperforming relative to the fund's benchmark
index.
o Performance of a portfolio measured through attribution analysis models
which analyses the portfolio manager's contribution from both an asset
allocation or sector allocation perspective and security selection
perspective. This factor evaluates how the investment professional
performs in linking performance with the client's investment objective
including investment parameters and risk and return objectives. This
factor may include some qualitative characteristics.
Qualitative factors:
o Ability to work well with other members of the investment professional
team and mentor junior members.
o Contributions to the organizational overall success with new product
strategies.
o Other factors such as contributing to the team in a leadership role and
by being responsive to requests for assistance
DWS Janus Growth & Income VIP
The following describes the structure and method of calculating a portfolio
manager's compensation as of December 31, 2007.
The portfolio managers is compensated for managing the Portfolio and any other
funds, portfolios or accounts for which he has exclusive or shared
responsibilities (collectively, the "Managed Funds") through two components:
fixed compensation and variable compensation.
Fixed Compensation: Fixed compensation is paid in cash and is comprised of an
annual base salary based on factors such as the complexity of managing the
Portfolio and other accounts and scope of responsibility (including assets under
management).
Variable Compensation: Variable compensation is paid in the form of cash and
long-term incentive awards (consisting of a mixture of Janus Capital Group, Inc.
("JCGI") restricted stock, stock options, and a cash-deferred award that is
credited with income, gains, and losses based on the performance of Janus mutual
fund investments selected by the portfolio manager). Variable compensation is
based on the pre-tax performance of the Managed Funds. Variable compensation is
structured to pay a portfolio manager primarily on the Managed Funds'
performance, with additional discretionary compensation available from one or
more bonus pools as discussed below.
Aggregate compensation derived from the Managed Funds' performance is calculated
based upon a percentage of the total revenue received on the Managed Funds
adjusted to reflect the actual performance of such Managed Funds. Actual
performance is calculated based on the Managed Funds' aggregate asset-weighted
Lipper peer group performance ranking on a one-, three-, and five-year rolling
period basis with a predominant weighting on the Managed Funds' performance in
the three- and five-year periods. The compensation determined from the Managed
Funds' performance is then allocated to the respective portfolio manager(s).
The portfolio manager is also eligible to participate in a portfolio manager
discretionary bonus pool. The size of the portfolio manager bonus pool
fluctuates depending on both the revenue derived from firm-wide managed assets
(excluding assets managed by subadvisors) and the investment performance of such
firm-wide managed assets. Compensation from the portfolio manager bonus pool is
then allocated among the eligible respective participants at the discretion of
Janus Capital based upon, among other things: (i) teamwork and support of team
culture; (ii) mentoring of analysts; (iii) contributions to the sales process;
and (iv) client relationships.
The portfolio manager may elect to defer payment of a designated percentage of
his fixed compensation and/or up to all variable compensation in accordance with
JCGI's Executive Income Deferral Program.
The Portfolio's Lipper peer group for compensation purposes is Large-Cap Growth
Funds.
DWS Turner Mid Cap Growth VIP
Compensation. Turner's investment professionals receive a base salary
commensurate with their level of experience. Turner's goal is to maintain
competitive base salaries through review of industry standards, market
conditions, and salary surveys. Bonus compensation, which is a multiple of base
salary, is based on the performance of each individual's sector and portfolio
assignments relative to appropriate market benchmarks. In addition, each
employee is eligible for equity awards. Turner believes this compensation
provides incentive to attract and retain highly qualified people.
The objective performance criteria noted above accounts for 90% of the bonus
calculation. The remaining 10% is based upon subjective, "good will" factors
including teamwork, interpersonal relations, the individual's contribution to
overall success of the firm, media and client relations, presentation skills,
and professional development. Portfolio managers/analysts are reviewed on an
annual basis. The Chief Investment Officer, Robert E. Turner, CFA, is
responsible for setting base salaries, bonus targets, and making all subjective
judgments related to an investment professionals' compensation.
Portfolio Ownership of Portfolio Managers for each Portfolio managed by a
Subadvisor. The following table shows the dollar range of shares owned
beneficially and of record by each member of the Portfolios' management team in
the applicable Portfolio, including investments by their immediate family
members sharing the same household and amounts invested through retirement and
deferred compensation plans. This information is provided as of the Portfolios'
most recent fiscal year end.
Name of Dollar Range of
Name of Portfolio Portfolio Manager Portfolio Shares Owned
----------------- ----------------- ----------------------
DWS Core Fixed Income VIP Gary W. Bartlett $0
J. Christopher Gagnier $0
Warren S. Davis, III $0
Daniel R. Taylor $0
Thomas J. Flaherty $0
Timothy C. Vile $0
William T. Lissenden $0
DWS Davis Venture Value VIP Christopher C. Davis $0(1)
Kenneth Charles Feinberg $0(1)
DWS Dreman High Return Equity VIP David N. Dreman $0
E. Clifton Hoover, Jr. $0
F. James Hutchinson $0
DWS Dreman Small Mid Cap Value VIP David N. Dreman $0
E. Clifton Hoover, Jr. $0
Mark Roach $0
DWS Janus Growth & Income VIP Marc Pinto $0
DWS Turner Mid Cap Growth VIP Tara Hedlund $0
Jason Schrotberger $0
Christopher K. McHugh $0
(1) Although the portfolio managers do not have an investment in this
variable annuity portfolio, the portfolio managers do hold over $1
million individually in a retail mutual fund that has the same
investment strategy as the Portfolio.
Although the portfolio managers do not have an investment in the portfolios, the
portfolio managers may have an investment in the retail fund that has the same
investment strategy.
Conflicts of Interest. In addition to managing the assets of the Portfolios, the
portfolio managers may have responsibility for managing other client accounts of
the applicable subadvisor. The tables below show for each Portfolio managed by a
Subadvisor, for each portfolio manager, the number and asset size of (1) SEC
registered investment companies (or series thereof) other than a portfolio, (2)
pooled investment vehicles that are not registered investment companies and (3)
other accounts (e.g., accounts managed for individuals or organizations) managed
by each portfolio manager. The tables also show the number of performance based
fee accounts, as well as the total assets of the accounts for which the advisory
fee is based on the performance of the account. This information is provided as
of the Portfolios' most recent fiscal year end.
Other SEC Registered Investment Companies Managed:
Number of
Investment
Number of Total Assets of Company Total Assets of
Registered Registered Accounts with Performance-
Name of Portfolio Investment Investment Performance- Based Fee
Name of Portfolio Manager Companies Companies Based Fee Accounts
----------------- ------- --------- --------- --------- --------
DWS Core Fixed Income VIP Gary W. Bartlett 8 $3,290,447,808 0 $0
J. Christopher Gagnier 8 $3,290,447,808 0 $0
Warren S. Davis, III 8 $3,290,447,808 0 $0
Daniel R. Taylor 8 $3,290,447,808 0 $0
Thomas J. Flaherty 8 $3,290,447,808 0 $0
Timothy C. Vile 8 $3,290,447,808 0 $0
William T. Lissenden 8 $3,290,447,808 0 $0
DWS Davis Venture Value
VIP Christopher C. Davis 28 $83,000,000,000 0 $0
Kenneth Charles Feinberg 26 $82,600,000,000 0 $0
DWS Dreman High Return
Equity VIP David N. Dreman 21 $14,800,000,000 0 $0
E. Clifton Hoover, Jr. 16 $13,500,000,000 0 $0
F. James Hutchinson 8 $10,800,000,000 0 $0
DWS Dreman Small Mid Cap
Value VIP David N. Dreman 21 $15,100,000,000 0 $0
E. Clifton Hoover, Jr. 16 $13,800,000,000 0 $0
Mark Roach 12 $2,870,000,000 0 $0
DWS Janus Growth & Income
VIP Marc Pinto 9 $9,776,570,221 0 $0
DWS Turner Mid Cap Growth Tara Hedlund 10 $3,500,000,000 1 $103,000,000
VIP
Jason Schrotberger 15 $4,000,000,000 1 $103,000,000
Christopher K. McHugh 14 $4,900,000,000 3 $1,300,000,000
Other Pooled Investment Vehicles Managed:
Number of
Pooled
Investment Total Assets
Number of Total Assets of Vehicle of
Pooled Pooled Accounts with Performance-
Name of Portfolio Investment Investment Performance- Based Fee
Name of Portfolio Manager Vehicles Vehicles Based Fee Accounts
----------------- ------- -------- -------- --------- --------
DWS Core Fixed Income VIP Gary W. Bartlett 9 $4,251,787,278 0 $0
J. Christopher Gagnier 9 $4,251,787,278 0 $0
Warren S. Davis, III 9 $4,251,787,278 0 $0
Daniel R. Taylor 9 $4,251,787,278 0 $0
Thomas J. Flaherty 9 $4,251,787,278 0 $0
Timothy C. Vile 9 $4,251,787,278 0 $0
William T. Lissenden 9 $4,251,787,278 0 $0
DWS Davis Venture Value Christopher C. Davis 11 $1,200,000,000
VIP
Kenneth Charles Feinberg 10 $1,100,000,000
DWS Dreman High Return
Equity VIP David N. Dreman 9 $414,600,000 4 $71,900,000
E. Clifton Hoover, Jr. 0 $0 0 $0
F. James Hutchinson 0 $0 0 $0
DWS Dreman Small Mid Cap
Value VIP David N. Dreman 9 $414,600,000 4 $71,900,000
E. Clifton Hoover, Jr. 0 $0 0 $0
Mark Roach 0 $0 0 $0
DWS Janus Growth & Income
VIP Marc Pinto 2 $18,637,286 0 $0
DWS Turner Mid Cap Growth
VIP Tara Hedlund 20 $505,000,000 2 $4,300,000
Jason Schrotberger 26 $550,000,000 2 $4,300,000
Christopher K. McHugh 27 $636,000,000 2 $4,300,000
Other Accounts Managed:
Number of Total Assets
Other of
Number of Accounts with Performance-
Name of Portfolio Other Total Assets of Performance- Based Fee
Name of Portfolio Manager Accounts Other Accounts Based Fee Accounts
----------------- ------- -------- -------------- --------- --------
DWS Core Fixed Income VIP Gary W. Bartlett 178 $28,378,917,155 4 $430,038,000
J. Christopher Gagnier 178 $28,378,917,155 4 $430,038,000
Warren S. Davis, III 178 $28,378,917,155 4 $430,038,000
Daniel R. Taylor 178 $28,378,917,155 4 $430,038,000
Thomas J. Flaherty 178 $28,378,917,155 4 $430,038,000
Timothy C. Vile 178 $28,378,917,155 4 $430,038,000
William T. Lissenden 178 $28,378,917,155 4 $430,038,000
DWS Davis Venture Value VIP Christopher C. Davis 32 $12,700,000,000 0 $0
Kenneth Charles 0 $0
Feinberg 32 $12,700,000,000
DWS Dreman High Return 0 $0
Equity VIP David N. Dreman 201 $2,700,000,000
E. Clifton Hoover, Jr. 182 $2,600,000,000 0 $0
F. James Hutchinson 0 $0 0 $0
DWS Dreman Small Mid Cap 0 $0
Value VIP David N. Dreman 201 $2,700,000,000
E. Clifton Hoover, Jr. 182 $2,600,000,000 0 $0
Mark Roach 19 $108,000,000 0 $0
DWS Janus Growth & Income
VIP Marc Pinto 28 $547,053,331 1 $247,834,267
DWS Turner Mid Cap Growth
VIP Tara Hedlund 16 $915,000,000 1 $126,000,000
Jason Schrotberger 55 $3,300,000,000 4 $263,000,000
Christopher K. McHugh 23 $2,700,000,000 2 $161,000,000
In addition to the accounts above, an investment professional may manage
accounts in a personal capacity that may include holdings that are similar to,
or the same as, those of the Portfolios. The Advisor has in place a Code of
Ethics that is designed to address conflicts of interest and that, among other
things, imposes restrictions on the ability of portfolio managers and other
"access persons" to invest in securities that may be recommended or traded in
the funds and other client accounts.
Potential Conflicts of Interest for Subadvised Portfolios' Managers
DWS Core Fixed Income VIP
In addition, an investment professional may manage accounts in a personal
capacity that may include holdings that are similar to, or the same as, those of
the Portfolios. AAMI and AAMISL have in place a Code of Ethics that is designed
to address conflicts of interest and that, among other things, imposes
restrictions on the ability of portfolio managers and other "access persons" to
invest in securities that may be recommended or traded in the Portfolios and
other client accounts.
Real, potential or apparent conflicts of interest may arise when a portfolio
manager has day-to-day portfolio management responsibilities with respect to
more than one fund or account, including the following:
o Certain investments may be appropriate for the Portfolio and also for
other clients advised by AAMI and AAMISL, including other client
accounts managed by the Portfolio's portfolio management team.
Investment decisions for the Portfolio and other clients are made with
a view to achieving their respective investment objectives and after
consideration of such factors as their current holdings, availability
of cash for investment and the size of their investments generally. A
particular security may be bought or sold for only one client or in
different amounts and at different times for more than one but less
than all clients. Likewise, because clients of AAMI and AAMISL may have
differing investment strategies, a particular security may be bought
for one or more clients when one or more other clients are selling the
security. The investment results achieved for the Portfolio may differ
from the results achieved for other clients of AAMI and AAMISL. In
addition, purchases or sales of the same security may be made for two
or more clients on the same day. In such event, such transactions will
be allocated among the clients in a manner believed by AAMI and AAMISL
to be most equitable to each client, generally utilizing a pro rata
allocation methodology. In some cases, the allocation procedure could
potentially have an adverse effect or positive effect on the price or
amount of the securities purchased or sold by the Portfolio. Purchase
and sale orders for the Portfolio may be combined with those of other
clients of AAMI and AAMISL in the interest of achieving the most
favorable net results to the Portfolio and the other clients.
o To the extent that a portfolio manager has responsibilities for
managing multiple client accounts, a portfolio manager will need to
divide time and attention among relevant accounts. The Advisor attempts
to minimize these conflicts by aligning its portfolio management teams
by investment strategy and by employing similar investment models
across multiple client accounts.
In some cases, an apparent conflict may arise where AAMI and AAMISL have an
incentive, such as a performance-based fee, in managing one account and not with
respect to other accounts it manages. The Advisor will not determine allocations
based on whether it receives a performance-based fee from the client.
Additionally, AAMI and AAMISL have in place supervisory oversight processes to
periodically monitor performance deviations for accounts with like strategies.
DWS Davis Venture Value VIP
Actual or apparent conflicts of interest may arise when a portfolio manager has
day-to-day management responsibilities with respect to more than one portfolio
or other account. More specifically, portfolio managers who manage multiple
portfolios and /or other accounts are presented with the following potential
conflicts:
The management of multiple portfolios and/or other accounts may result in a
portfolio manager devoting unequal time and attention to the management of each
portfolio and/or other account. Davis seeks to manage such competing interests
for the time and attention of portfolio managers by having portfolio managers'
focus on a particular investment discipline. Most other accounts managed by a
portfolio manager are managed using the same investment weightings that are used
in connection with the management of the portfolios.
If a portfolio manager identifies a limited investment opportunity which may be
suitable for more than one portfolio or other account, a portfolio may not be
able to take full advantage of that opportunity due to an allocation of filled
purchase or sale orders across all eligible portfolios and other accounts. To
deal with these situations, Davis has adopted procedures for allocating
portfolio transactions across multiple accounts.
With respect to securities transactions for the portfolios, Davis determines
which broker to use to execute each order, consistent with its duty to seek best
execution of the transaction. However, with respect to certain other accounts
(such as mutual funds, other pooled investment vehicles that are not registered
mutual funds, and other accounts managed for organizations and individuals),
Davis may be limited by the client with respect to the selection of brokers or
may be instructed to direct trades through a particular broker. In these cases,
Davis may place separate, non-simultaneous, transactions for a portfolio and
another account which may temporarily affect the market price of the security or
the execution of the transaction, or both, to the detriment of the portfolio or
the other account.
Finally, substantial investment of Davis or Davis Family assets in certain
mutual funds may lead to conflicts of interest. To mitigate these potential
conflicts of interest, Davis has adopted policies and procedures intended to
ensure that all clients are treated fairly over time. Davis does not receive an
incentive based fee on any account.
DWS Dreman High Return Equity VIP and DWS Dreman Small Mid Cap Value VIP
The subadvisor manages clients' accounts using a contrarian value investment
strategy. For both its strategies the subadvisor utilizes a model portfolio and
rebalances clients accounts whenever changes are made to the model portfolio. In
addition the subadvisor aggregates its trades and allocates the trades to all
clients accounts in an equitable manner. The subadvisor strongly believes
aggregating its orders protect all clients from being disadvantaged by price or
time execution. The model portfolio approach and the trade aggregation policy of
the subadvisor eliminates any potential or apparent conflicts of interest that
could arise when a portfolio manager has day-to-day portfolio management
responsibilities with respect to more than one fund or account. The subadvisor
does not receive any performance-based fees from any of its accounts with the
exception of a hedge fund that is managed by an affiliated firm. However the
hedge funds are treated like any other client account and trades done for the
fund are generally aggregated with trades done for its regular client accounts.
The subadvisor's investment professional are compensated in the same manner for
all client accounts irrespective of the type of account.
DWS Janus Growth & Income VIP
The portfolio manager may manage other accounts with investment strategies
similar to the Portfolio. Those other accounts may include other Janus funds,
private-label mutual funds for which Janus Capital serves as subadvisor, and
separately managed accounts. Fees earned by Janus Capital may vary among these
accounts, the portfolio manager may personally invest in some but not all of
these accounts, and certain of these accounts may have a greater impact on his
compensation than others. These factors could create conflicts of interest
because the portfolio manager may have incentives to favor certain accounts over
others, resulting in the potential for other accounts outperforming the
Portfolio. A conflict may also exist if the portfolio manager identifies a
limited investment opportunity that may be appropriate for more than one
account, but the Portfolio is not able to take full advantage of that
opportunity due to the need to allocate that opportunity among multiple
accounts. In addition, the portfolio manager may execute transactions for
another account that may adversely impact the value of securities held by the
Portfolio. However, Janus Capital believes that these conflicts may be
mitigated, to a certain extent, by the fact that accounts with similar
investment strategies managed by a particular portfolio manager are generally
managed in a similar fashion, subject to a variety of exceptions, for example,
particular investment restrictions or policies applicable only to certain
accounts, certain portfolio holdings that may be transferred in-kind when an
account is opened, differences in cash flows and account sizes, and similar
factors. In addition, Janus Capital has adopted trade allocation procedures that
govern the allocation of securities among various Janus accounts.
DWS Turner Mid Cap Growth VIP
As is typical for many money managers, potential conflicts of interest may arise
related to Turner's management of accounts including the Portfolio where not all
accounts are able to participate in a desired Initial Public Offering ("IPO"),
or other limited opportunity, relating to use of soft dollars and other
brokerage practices, related to the voting of proxies, employee personal
securities trading related to the side by side management of accounts with
performance-based fees and accounts with fixed fees, and relating to a variety
of other circumstances. In all cases, however, Turner believes it has written
policies and procedures in place reasonably designed to prevent violations of
the federal securities laws and to prevent material conflicts of interest from
arising. Please also see Turner's Form ADV, Part II for a description of some of
its policies and procedures in this regard.
DISTRIBUTOR
DWS Scudder Distributors, Inc. ("DWS-SDI" or the "Distributor"), 222 South
Riverside Plaza, Chicago, Illinois 60606, a wholly owned subsidiary of DIMA, is
the distributor and principal underwriter for shares of each Portfolio pursuant
to an Underwriting Agreement in the continuous offering of its shares. Terms of
continuation, termination and assignment under the underwriting agreement are
identical to those described above with regard to the investment management
agreements, except that termination other than upon assignment requires sixty
days' notice.
Each Portfolio has adopted a distribution plan under Rule 12b-1 (the "Plan")
that provides for fees payable as an expense of the Class B shares. Under the
Plan, the Fund may make quarterly payments as reimbursement to the Distributor
for distribution and shareholder servicing related expenses incurred or paid by
the distributor or a participating insurance company. No such payment shall be
made with respect to any quarterly period in excess of an amount determined for
such period at the annual rate of 0.25% of the average daily net assets of Class
B shares during that quarterly period. The fee is payable by the Fund, on behalf
of each Portfolio, of up to 0.25% of the average daily net assets attributable
to the Class B shares of a Portfolio. Because 12b-1 fees are paid out of
Portfolio assets on an ongoing basis, they will, over time, increase the cost of
investment and may cost more than other types of sales charges. The Plan and any
Rule 12b-1-related agreement that is entered into by the Fund or the Distributor
in connection with the Plan will continue in effect for a period of more than
one year only so long as continuance is specifically approved at least annually
by a vote of a majority of the Fund's Board of Trustees, and of a majority of
the Trustees who are not interested persons (as defined in the 1940 Act) of the
Fund or a Portfolio ("Independent Trustees"), cast in person at a meeting called
for the purpose of voting on the Plan, or the Rule 12b-1 related agreement, as
applicable. In addition, the Plan and any Rule 12b-1 related agreement, may be
terminated as to Class B shares of a Portfolio at any time, without penalty, by
vote of a majority of the outstanding Class B shares of that Portfolio or by
vote of a majority of the Independent Trustees. The Plan and Underwriting
Agreement also provide that it may not be amended to increase materially the
amount that may be spent for distribution of Class B shares of a Portfolio
without the approval of Class B shareholders of that Portfolio.
For the fiscal year ended December 31, 2007 the distribution fees paid were as
follows:
Total Fees for Unpaid at
Portfolio Fiscal 2007 Fees Waived December 31, 2007
--------- ----------- ----------- -----------------
DWS Balanced VIP $38,042 $0 $1,423
DWS Blue Chip VIP $58,995 $0 $2,225
DWS Core Fixed Income VIP $189,948 $0 $14,316
DWS Davis Venture Value VIP $106,162 $0 $4,357
DWS Dreman High Return Equity VIP $224,891 $0 $7,211
DWS Dreman Small Mid Cap Value VIP $129,482 $0 $6,434
DWS Global Thematic VIP $38,519 $0 $1,954
DWS Government & Agency Securities VIP $38,854 $0 $1,180
DWS High Income VIP $63,359 $0 $1,923
DWS International Select Equity VIP $87,237 $0 $2,827
DWS Janus Growth & Income VIP $34,879 $0 $875
DWS Large Cap Value VIP $46,834 $0 $1,509
DWS Mid Cap Growth VIP $10,285 $0 $441
DWS Money Market VIP $88,694 $0 $4,890
DWS Small Cap Growth VIP $43,093 $0 $1,302
DWS Strategic Income VIP $36,164 $0 $1,205
DWS Technology VIP $17,126 $0 $725
DWS Turner Mid Cap Growth VIP $30,511 $0 $993
In addition, DWS-SDI may, from time to time, from its own resources pay certain
firms additional amounts for ongoing administrative services and assistance
provided to their customers and clients who are shareholders of the Fund.
Regulatory Matters and Legal Proceedings
On December 21, 2006, Deutsche Asset Management ("DeAM") settled proceedings
with the Securities and Exchange Commission ("SEC") and the New York Attorney
General on behalf of Deutsche Asset Management, Inc. ("DAMI") and DIMA, the
investment advisors to many of the DWS Scudder funds, regarding allegations of
improper trading of fund shares at DeAM and at the legacy Scudder and Kemper
organizations prior to their acquisition by DeAM in April 2002. These regulators
alleged that although the prospectuses for certain funds in the regulators' view
indicated that the funds did not permit market timing, DAMI and DIMA breached
their fiduciary duty to those funds in that their efforts to limit trading
activity in the funds were not effective at certain times. The regulators also
alleged that DAMI and DIMA breached their fiduciary duty to certain funds by
entering into certain market timing arrangements with investors. These trading
arrangements originated in businesses that existed prior to the currently
constituted DeAM organization, which came together as a result of various
mergers of the legacy Scudder, Kemper and Deutsche fund groups, and all of the
arrangements were terminated prior to the start of the regulatory investigations
that began in the summer of 2003. No current DeAM employee approved these
trading arrangements. Under the terms of the settlements, DAMI and DIMA neither
admitted nor denied any wrongdoing.
The terms of the SEC settlement, which identified improper trading in the legacy
Deutsche and Kemper mutual funds only, provide for payment of disgorgement in
the amount of $17.2 million. The terms of the settlement with the New York
Attorney General provide for payment of disgorgement in the amount of $102.3
million, which is inclusive of the amount payable under the SEC settlement, plus
a civil penalty in the amount of $20 million. The total amount payable by DeAM,
approximately $122.3 million, will be distributed to shareholders of the
affected funds in accordance with a distribution plan to be developed by a
distribution consultant. The funds' investment advisors do not believe these
amounts will have a material adverse financial impact on them or materially
affect their ability to perform under their investment management agreements
with the DWS funds. The above-described amounts are not material to Deutsche
Bank, and have already been reserved.
Among the terms of the settled orders, DeAM is subject to certain undertakings
regarding the conduct of its business in the future, including formation of a
Code of Ethics Oversight Committee to oversee all matters relating to issues
arising under the advisors' Code of Ethics; establishment of an Internal
Compliance Controls Committee having overall compliance oversight responsibility
of the advisors; engagement of an Independent Compliance Consultant to conduct a
comprehensive review of the advisors' supervisory compliance and other policies
and procedures designed to prevent and detect breaches of fiduciary duty,
breaches of the Code of Ethics and federal securities law violations by the
advisors and their employees; and commencing in 2008, the advisors shall undergo
a compliance review by an independent third party.
In addition, DeAM is subject to certain further undertakings relating to the
governance of the mutual funds, including that at least 75% of the members of
the Boards of Trustees/Directors overseeing the DWS Funds continue to be
independent of DeAM; the Chairmen of the DWS Funds' Boards of Trustees/Directors
continue to be independent of DeAM; DeAM maintain existing management fee
reductions for certain funds for a period of five years and not increase
management fees for these certain funds during this period; the funds retain a
senior officer (or independent consultants, as applicable) responsible for
assisting in the review of fee arrangements and monitoring compliance by the
funds and the investment advisors with securities laws, fiduciary duties, codes
of ethics and other compliance policies, the expense of which shall be borne by
DeAM; and periodic account statements, fund prospectuses and the mutual funds'
web site contain additional disclosure and/or tools that assist investors in
understanding the fees and costs associated with an investment in the funds and
the impact of fees and expenses on fund returns.
DeAM has also settled proceedings with the Illinois Secretary of State regarding
market timing matters. The terms of the Illinois settlement provide for investor
education contributions totaling approximately $4 million and a payment in the
amount of $2 million to the Securities Audit and Enforcement Fund.
On September 28, 2006, the SEC and the National Association of Securities
Dealers ("NASD") (now known as FINRA) announced final agreements in which
Deutsche Investment Management Americas Inc. ("DIMA"), Deutsche Asset
Management, Inc. ("DAMI") and Scudder Distributors, Inc. ("DWS-SDI") (now known
as DWS Scudder Distributors, Inc.) settled administrative proceedings regarding
disclosure of brokerage allocation practices in connection with sales of the
Scudder Funds' (now known as the DWS Scudder Funds) shares during 2001-2003. The
agreements with the SEC and NASD are reflected in orders which state, among
other things, that DIMA and DAMI failed to disclose potential conflicts of
interest to the funds' Boards and to shareholders relating to DWS-SDI's use of
certain funds' brokerage commissions to reduce revenue sharing costs to
broker-dealer firms with whom it had arrangements to market and distribute
Scudder Fund shares. These directed brokerage practices were discontinued in
October 2003.
Under the terms of the settlements, in which DIMA, DAMI and DWS-SDI neither
admitted nor denied any of the regulators' findings, DIMA, DAMI and DWS-SDI
agreed to pay disgorgement, prejudgment interest and civil penalties in the
total amount of $19.3 million. The portion of the settlements distributed to the
funds was approximately $17.8 million and was paid to the funds as prescribed by
the settlement orders based upon the amount of brokerage commissions from each
fund used to satisfy revenue sharing agreements with broker-dealers who sold
fund shares.
As part of the settlements, DIMA, DAMI and DWS-SDI also agreed to implement
certain measures and undertakings relating to revenue sharing payments including
making additional disclosures in the funds' Prospectuses or Statements of
Additional Information, adopting or modifying relevant policies and procedures
and providing regular reporting to the fund Boards.
Additional information announced by DeAM regarding the terms of the settlements
is available at www.dws-scudder.com/regulatory_settlements.
The matters alleged in the regulatory settlements described above also serve as
the general basis of a number of private class action lawsuits involving the DWS
funds. These lawsuits name as defendants various persons, including certain DWS
funds, the funds' investment advisors and their affiliates, and certain
individuals, including in some cases fund Trustees/Directors, officers, and
other parties. Each DWS fund's investment advisor has agreed to indemnify the
applicable DWS funds in connection with these lawsuits, or other lawsuits or
regulatory actions that may be filed making similar allegations.
Based on currently available information, the funds' investment advisors believe
the likelihood that the pending lawsuits will have a material adverse financial
impact on a DWS fund is remote and such actions are not likely to materially
affect their ability to perform under their investment management agreements
with the DWS funds.
FUND SERVICE PROVIDERS
Recordkeeping
Technically, the shareholders of the Portfolios of the Fund are the
Participating Insurance Companies that offer the Portfolios as investment
options for holders of certain variable annuity contracts and variable life
insurance policies. Effectively, ownership of Portfolio shares is passed through
to insurance company contract and policy holders. The holders of the shares of
the Portfolios on the records of the Fund are the Participating Insurance
Companies and no information concerning the Portfolio holdings of specific
contract and policy holders is maintained by the Fund. The insurance companies
place orders for the purchase and redemption of Portfolio shares with the Fund
reflecting the investment of premiums paid, surrender and transfer requests and
other matters on a net basis; they maintain all records of the transactions and
holdings of Portfolio shares and distributions thereon for individual contract
and policy holders; and they prepare and mail to contract and policy holders
confirmations and periodic account statements reflecting such transactions and
holdings.
The Portfolios of the Fund may compensate certain insurance companies for record
keeping and other administrative services performed with regard to holdings of
Class B Portfolio shares as an expense of the Class B shares up to 0.15%. These
fees are included within the "Other Expenses" category in the fee table for each
portfolio in the Class B Shares Prospectus (see "How Much Investors Pay" in a
Portfolio's prospectus). In addition, the Advisor may, from time to time, pay
from its own resources certain insurance companies for record keeping and other
administrative services related to Class A and Class B shares of the Portfolios
held by such insurance companies on behalf of their contract and policy holders.
Transfer Agent
DWS Scudder Investments Service Company ("DWS-SISC" or the "Transfer Agent"),
811 Main Street, Kansas City, Missouri 64105-2005, an affiliate of the Advisor,
is each Portfolio's transfer agent, dividend-paying agent and shareholder
service agent.
The Transfer Agent receives an annual service fee for each account of the Fund,
based on the type of account. For open retail accounts, the fee is a flat fee
ranging from $20.00 to $27.50 per account, for open wholesale money funds the
fee is $32.50 per account, while for certain retirement accounts serviced on the
recordkeeping system of ADP, Inc., the fee is a flat fee up to $3.60 per account
(as of 2007, indexed to inflation) plus an asset based fee of up to 0.25% of
average net assets. 1/12th of the annual service charge for each account is
charged and payable to the Transfer Agent each month. A fee is charged for any
account which at any time during the month had a share balance in the Fund.
Smaller fees are also charged for closed accounts for which information must be
retained on the Transfer Agent's system for up to 18 months after closing for
tax reporting purposes.
Fees paid to DWS-SISC for the period ended December
31, 2007 are set forth below:
Portfolio Fiscal Year 2007 Waived
--------- ---------------- ------
DWS Balanced VIP A $453 $453
DWS Balanced VIP B $160 N/A
DWS Blue Chip VIP A $348 N/A
DWS Blue Chip VIP B $102 N/A
DWS Core Fixed Income VIP A $206 N/A
DWS Core Fixed Income VIP B $162 N/A
DWS Davis Venture Value VIP A $184 $184
DWS Davis Venture Value VIP B $102 N/A
DWS Dreman High Return Equity VIP A $682 N/A
DWS Dreman High Return Equity VIP B $313 $313
DWS Dreman Small Cap Value VIP A $712 N/A
DWS Dreman Small Cap Value VIP B $301 N/A
DWS Global Thematic VIP A $313 $313
DWS Global Thematic VIP B $153 $153
DWS Government & Agency VIP A $918 $918
DWS Government & Agency VIP B $96 N/A
DWS High Income VIP A $375 N/A
DWS High Income VIP B $173 N/A
DWS International Select Equity VIP A $247 N/A
DWS International Select Equity VIP B $104 N/A
DWS Janus Growth & Income VIP A $128 N/A
DWS Janus Growth & Income VIP B $86 N/A
DWS Large Cap Value VIP A $332 N/A
DWS Large Cap Value VIP B $146 N/A
DWS Mid Cap Growth VIP A $237 $237
DWS Mid Cap Growth VIP B $102 $102
DWS Money Market VIP A $690 $690
DWS Money Market VIP B $87 $87
DWS Small Cap Growth VIP A $365 $365
DWS Small Cap Growth VIP B $118 $118
DWS Strategic Income VIP A $225 N/A
DWS Strategic Income VIP B $89 N/A
DWS Technology VIP A $258 N/A
DWS Technology VIP B $232 N/A
DWS Turner Mid Cap Growth VIP A $104 N/A
DWS Turner Mid Cap Growth VIP B $86 N/A
Certain out-of-pocket expenses incurred by the Transfer Agent, including
expenses of printing and mailing routine fund disclosure documents, costs of
record retention and transaction processing costs are reimbursed by the Fund or
are paid directly by the Fund. Certain additional out-of-pocket expenses,
including costs of computer hardware and software, third party record-keeping
and processing of proxy statements, may only be reimbursed by the Fund with the
prior approval of the Fund's Board.
Pursuant to a sub-transfer agency agreement between DWS-SISC and DST Systems,
Inc. ("DST"), DWS-SISC has delegated certain transfer agent and dividend paying
agent functions to DST. The costs and expenses of such delegation are borne by
DWS-SISC, not by the Portfolios.
Custodian
State Street Bank and Trust Company ("SSB"), 225 Franklin Street, Boston,
Massachusetts 02110, as custodian, has custody of all securities and cash of
each Portfolio (other than the DWS International Select Equity VIP and DWS
Global Thematic VIP). Brown Brothers Harriman & Co., as custodian, has custody
of all securities and cash of DWS International Select Equity VIP and DWS Global
Thematic VIP. Each custodian attends to the collection of principal and income,
and payment for and collection of proceeds of securities bought and sold by
those Portfolios.
SSB has entered into agreements with foreign subcustodians approved by the
Trustees pursuant to Rule 17f-5 under the 1940 Act. SSB uses Deutsche Bank AG,
an affiliate of DIMA, as subcustodian ("DB Subcustodian") in certain countries.
To the extent a Portfolio holds any securities in the countries in which SSB
uses DB Subcustodian as a subcustodian, those securities will be held by DB
Subcustodian as part of a larger omnibus account in the name of SSB (the
"Omnibus Account"). For its services, DB Subcustodian receives (1) an annual fee
based on a percentage of the average daily net assets of the Omnibus Account and
(2) transaction charges with respect to transactions that occur within the
Omnibus Account.
Independent Registered Public Accounting Firm
The financial highlights of the Portfolios included in the Portfolios'
prospectuses and the financial statements of the Portfolios incorporated by
reference in this Statement of Additional Information have been so included or
incorporated by reference in reliance on the report of Ernst & Young LLP,
independent registered public accounting firm, 200 Clarendon Street, Boston, MA
02116, given on the authority of said firm as experts in auditing and
accounting. Ernst & Young LLP audits the financial statements of the Portfolios
and provides other audit, tax and related services. Shareholders will receive
annual audited financial statements and semi-annual unaudited financial
statements.
Counsel
Vedder Price P.C., 222 N. LaSalle St., Chicago, Illinois, serves as legal
counsel to the Fund and its Independent Trustees.
Fund Accounting Agent
Prior to May 1, 2008 (April 11, 2007 for DWS Large Cap Value VIP), DWS Scudder
Fund Accounting Corp. ("DWS-SFAC"), Two International Place, Boston,
Massachusetts, 02210-4103, a subsidiary of DIMA, was responsible for determining
the daily net asset value per share and maintaining the Portfolios and general
accounting records of each Portfolio. DWS-SFAC received no fee for its services
to each Portfolio, other than the Portfolios noted below.
For the fiscal years ended December 31, noted below, DWS-SFAC received a fee for
its services from certain Portfolios as follows:
Portfolio Fiscal 2007 Fiscal 2006 Fiscal 2005
--------- ----------- ----------- -----------
DWS Davis Venture Value VIP $95,992 $94,006 $85,936
DWS Dreman High Return Equity VIP $141,319 $153,345 $131,840
DWS Global Thematic VIP $242,233 $175,325 $111,026
DWS Janus Growth & Income VIP $81,055 $69,130 $70,775
DWS Mid Cap Growth VIP $60,283 $59,257 $62,902
DWS Technology VIP $59,280 $66,562 $78,641
DWS Turner Mid Cap Growth VIP $81,746 $94,442 $94,542
Pursuant to a sub-administration and sub-accounting agreement among the Advisor,
DWS-SFAC and SSB, DWS-SFAC has delegated certain fund accounting functions to
SSB under each Portfolio's fund accounting agreements. The costs and expenses of
such delegation are borne by DWS-SFAC, not by the Portfolios.
PURCHASE AND REDEMPTIONS
Portfolio shares are sold at their net asset value next determined after an
order and payment are received as described below. (See "Net Asset Value.")
Upon receipt by a Portfolio's transfer agent of a request for redemption, shares
will be redeemed by the Fund, on behalf of a particular Portfolio, at the
applicable net asset value as described below.
The Fund may, on behalf of a Portfolio, suspend or postpone redemptions as
permitted pursuant to Section 22(e) of the 1940 Act. Generally, those
circumstances are when: 1) the New York Stock Exchange is closed other than
customary weekend or holiday closings; 2) trading on the New York Stock Exchange
is restricted; 3) an emergency exists which makes the disposal of securities
owned by a fund or the fair determination of the value of a Portfolio's net
assets not reasonably practicable; or 4) the SEC, by order, permits the
suspension of the right of redemption. Redemption payments by wire may also be
delayed in the event of a non-routine closure of the Federal Reserve wire
payment system.
Market timing policies and procedures. Short-term and excessive trading of
portfolio shares may present risks to a portfolio's long-term shareholders,
including potential dilution in the value of portfolio shares, interference with
the efficient management of a portfolio (including losses on the sale of
investments), and increased brokerage and administrative costs. These risks may
be more pronounced if a portfolio invests in certain securities, such as those
that trade in foreign markets, are illiquid or do not otherwise have "readily
available market quotations." Certain investors may seek to employ short-term
trading strategies aimed at exploiting variations in portfolio valuation that
arise from the nature of the securities held by a portfolio (e.g., "time zone
arbitrage"). Each portfolio discourages short-term and excessive trading. Each
portfolio has adopted policies and procedures that are intended to detect and
deter short-term and excessive trading.
Pursuant to its policies, each portfolio reserves the right to reject or cancel
a purchase or exchange order for any reason without prior notice. For example, a
portfolio may in its discretion reject or cancel a purchase or an exchange order
even if the transaction is not subject to the specific roundtrip transaction
limitation described below if the Advisor believes that there appears to be a
pattern of short-term or excessive trading activity by a shareholder or deems
any other trading activity harmful or disruptive to a portfolio. Each portfolio,
through its Advisor and Transfer Agent, will measure short-term and excessive
trading by the number of roundtrip transactions within a shareholder's account
during a rolling 12-month period. A "roundtrip" transaction is defined as any
combination of purchase and redemption activity (including exchanges) of the
same portfolio's shares. Each portfolio may take other trading activity into
account if a portfolio believes such activity is of an amount or frequency that
may be harmful to long-term shareholders or disruptive to portfolio management.
Shareholders are limited to four roundtrip transactions in the same portfolio
(excluding the money market portfolio) over a rolling 12-month period.
Shareholders with four or more roundtrip transactions in the same portfolio
within a rolling 12-month period generally will be blocked from making
additional purchases of, or exchanges into, that portfolio. Each portfolio has
sole discretion whether to remove a block from a shareholder's account. The
rights of a shareholder to redeem shares of a portfolio are not affected by the
four roundtrip transaction limitation.
The Advisor may make exceptions to the roundtrip transaction policy for certain
types of transactions if in its opinion the transactions do not represent
short-term or excessive trading or are not abusive or harmful to the portfolio,
such as, but not limited to, systematic transactions, required minimum
retirement distributions, transactions initiated by a portfolio or administrator
and transactions by certain qualified fund-of-fund(s).
In certain circumstances, the portfolio may rely upon the policy of the
insurance company or other financial intermediary to deter short-term or
excessive trading if the Advisor believes that the policy of such insurance
company or other financial intermediary is reasonably designed to detect and
deter transactions that are not in the best interest of a portfolio. An
insurance company's or other financial intermediary's policy relating to
short-term or excessive trading may be more or less restrictive than the
portfolios' policy, may permit certain transactions not permitted by the
portfolios' policies, or prohibit transactions not subject to the portfolios'
policies.
The Advisor may also accept undertakings from an insurance company or other
financial intermediary to enforce short-term or excessive trading policies on
behalf of the portfolio that provide a substantially similar level of protection
for the portfolio against such transactions. For example, certain insurance
companies may have contractual or legal restrictions that prevent them from
blocking an account. In such instances, the insurance company may use alternate
techniques that the Advisor considers to be a reasonable substitute for such a
block.
In addition, each portfolio that invests some portion of its assets in foreign
securities has adopted certain fair valuation practices intended to protect the
portfolio from "time zone arbitrage" with respect to its foreign securities
holdings and other trading practices that seek to exploit variations in
portfolio valuation that arise from the nature of the securities held by the
portfolio. (See "How each portfolio calculates share price.")
There is no assurance that these policies and procedures will be effective in
limiting short-term and excessive trading in all cases. For example, the Advisor
may not be able to effectively monitor, detect or limit short-term or excessive
trading by underlying shareholders that occurs through separate accounts
maintained by insurance companies or other financial intermediaries. The Advisor
reviews trading activity at the separate account level to detect short-term or
excessive trading. If the Advisor has reason to suspect that short-term or
excessive trading is occurring at the separate account level, the Advisor will
contact the insurance company or other financial intermediary to request
underlying shareholder level activity. Depending on the amount of portfolio
shares held in such separate account (which may represent most of a portfolio's
shares) short-term and/or excessive trading of portfolio shares could adversely
affect long-term shareholders in a portfolio. If short-term or excessive trading
is identified, the Advisor will take appropriate action.
Each portfolio's market timing policies and procedures may be modified or
terminated at any time.
Since Money Market VIP holds short-term instruments and is intended to provide
liquidity to shareholders, the advisor does not monitor or limit short-term and
excessive trading activity in Money Market VIP and, accordingly, the Board has
not approved any policies and procedures designed to limit this activity.
However, the portfolio reserves the right to and may reject or cancel a purchase
or exchange order into a money market fund for any reason, including if, in the
opinion of the advisor, there appears to be a pattern of short-term and
excessive trading by an investor in other DWS funds.
Revenue Sharing
In light of recent regulatory developments, the Advisor, the Distributor and
their affiliates have undertaken to furnish certain additional information below
regarding the level of payments made by them to selected affiliated and
unaffiliated brokers, dealers, participating insurance companies or other
financial intermediaries ("financial advisors") in connection with the sale
and/or distribution of Portfolio shares or the retention and/or servicing of
investors and Portfolio shares ("revenue sharing").
The Advisor, the Distributor and/or their affiliates may pay additional
compensation, out of their own assets and not as an additional charge to each
Portfolio, to financial advisors in connection with the sale and/or distribution
of Portfolio shares or the retention and/or servicing of Portfolio investors and
Portfolio shares. Such revenue sharing payments are in addition to any
distribution or service fees payable under any Rule 12b-1 or service plan of any
portfolio, any record keeping/sub-transfer agency/networking fees payable by
each Portfolio (generally through the Distributor or an affiliate) and/or the
Distributor to certain financial advisors for performing such services and any
sales charges, commissions, non-cash compensation arrangements expressly
permitted under applicable rules of FINRA or other concessions described in the
fee table or elsewhere in the Prospectuses or the SAI as payable to all
financial advisors. For example, the Advisor, the Distributor and/or their
affiliates may compensate financial advisors for providing each Portfolio with
"shelf space" or access to a third party platform or portfolio offering list, or
other marketing programs including, without limitation, inclusion of each
Portfolio on preferred or recommended sales lists, mutual fund "supermarket"
platforms and other formal sales programs; granting the Distributor access to
the financial advisor's sales force; granting the Distributor access to the
financial advisor's conferences and meetings; assistance in training and
educating the financial advisor's personnel; and, obtaining other forms of
marketing support. The level of revenue sharing payments made to financial
advisors may be a fixed fee or based upon one or more of the following factors:
gross sales, current assets and/or number of accounts of each Portfolio
attributable to the financial advisor, the particular portfolio or portfolio
type or other measures as agreed to by the Advisor, the Distributor and/or their
affiliates and the financial advisors or any combination thereof. The amount of
these payments is determined at the discretion of the Advisor, the Distributor
and/or their affiliates from time to time, may be substantial, and may be
different for different financial advisors based on, for example, the nature of
the services provided by the financial advisor.
The Advisor, the Distributor and/or their affiliates currently make revenue
sharing payments from their own assets in connection with the sale and/or
distribution of DWS Fund shares, or the retention and/or servicing of investors,
to financial advisors in amounts that generally range from .01% up to .50% of
assets of the Portfolio serviced and maintained by the financial advisor, .10%
to .25% of sales of the Portfolio attributable to the financial advisor, a flat
fee of $13,350 up to $500,000, or any combination thereof. These amounts are
annual figures typically paid on a quarterly basis and are subject to change at
the discretion of the Advisor, the Distributor and/or their affiliates. Receipt
of, or the prospect of receiving, this additional compensation, may influence
your financial advisor's recommendation of this Portfolio or of any particular
share class of the Portfolio. You should review your financial advisor's
compensation disclosure and/or talk to your financial advisor to obtain more
information on how this compensation may have influenced your financial
advisor's recommendation of this Portfolio.
The Advisor, the Distributor and/or their affiliates may also make such revenue
sharing payments to financial advisors under the terms discussed above in
connection with the distribution of both DWS funds and non-DWS funds by
financial advisors to retirement plans that obtain record keeping services from
ADP, Inc. on the DWS Scudder branded retirement plan platform (the "Platform")
with the level of revenue sharing payments being based upon sales of both the
DWS funds and the non-DWS funds by the financial advisor on the Platform or
current assets of both the DWS funds and the non-DWS funds serviced and
maintained by the financial advisor on the Platform.
As of the date hereof, each Portfolio has been advised that the Advisor, the
Distributor and their affiliates expect that the following firms will receive
revenue sharing payments at different points during the coming year as described
above:
Channel: Broker-Dealers and Financial Advisors
AIG Advisors Group
Ameriprise
Cadaret, Grant & Co. Inc.
Capital Analyst, Incorporated
Citigroup Global Markets, Inc. (dba Smith Barney)
Commonwealth Equity Services, LLP (dba Commonwealth Financial Network)
Deutsche Bank Group
First Clearing/Wachovia Securities
Fiserv Trust Company
HD Vest Investment Securities, Inc.
ING Group
John Hancock Distributors LLC
LPL Financial
M.L. Stern & Co.
Marsh Insurance and Investment Company
Meridien Financial Group
Merrill Lynch, Pierce, Fenner & Smith Inc.
Morgan Stanley
Oppenheimer & Co., Inc.
Raymond James & Associates
Raymond James Financial Services
RBC Dain Rauscher, Inc
Securities America, Inc.
UBS Financial Services
Wachovia Securities
Wells Fargo Investments, LLC
Channel: Cash Product Platform
Allegheny Investments LTD
Bank of New York (Hare & Co.)
Bear, Stearns Securities Corp.
Brown Brothers Harriman
Brown Investment Advisory & Trust Company
Cadaret Grant & Co.
Chicago Mercantile Exchange
D.A. Davidson & Company
Deutsche Bank Group
Emmett A. Larkin Company
Fiduciary Trust Co. - International
First Southwest Company
Huntleigh Securities
Lincoln Investment Planning
LPL Financial
Mellon Financial Markets LLC
Penson Financial Services
Pershing Choice Platform
ProFunds Distributors, Inc.
Ridge Clearing & Outsourcing Solutions
Romano Brothers and Company
SAMCO Capital Markets
Smith Moore & Company
Sungard Institutional Brokerage Inc.
US Bancorp
UBS
William Blair & Company
Channel: Third Party Insurance Platforms
Allstate Life Insurance Company of New York
Ameritas Life Insurance Group
Annuity Investors Life Insurance Company
Columbus Life Insurance Company
Commonwealth Annuity and Life Insurance Company
Companion Life Insurance Company
Connecticut General Life Insurance Company
Farmers New World Life Insurance Company
Fidelity Security Life Insurance Company
First Allmerica Financial Life Insurance Company
First Great West Life and Annuity Company
Genworth Life Insurance Company of New York
Genworth Life and Annuity Insurance Company
Great West Life and Annuity Insurance Company
Hartford Life Insurance Company
Integrity Life Insurance Company
John Hancock Life Insurance companies
Kemper Investors Life Insurance Company
Lincoln Benefit Life Insurance Company
Lincoln Life & Annuity Company of New York
Lincoln National Life Insurance Company
Massachusetts Mutual Life Insurance Group
MetLife Group
Minnesota Life Insurance Company
National Life Insurance Company
National Integrity Life Insurance Company
Nationwide Group
New York Life Insurance and Annuity Corporation
Phoenix Life Insurance Company
Protective Life Insurance
Provident Mutual Life Insurance
Prudential Insurance Company of America
Sun Life Group
Symetra Life Insurance Company
Transamerica Life Insurance Company
Union Central Life Insurance Company
United of Omaha Life Insurance Company
United Investors Life Insurance Company
Western Southern Life Assurance Company
Any additions, modifications or deletions to the financial advisors identified
above that have occurred since the date hereof are not reflected.
The Advisor, the Distributor or their affiliates may enter into additional
revenue sharing arrangements or change or discontinue existing arrangements with
financial advisors at any time without notice.
The prospect of receiving, or the receipt of additional compensation or
promotional incentives described above by financial advisors may provide such
financial advisors and/or their salespersons with an incentive to favor sales of
shares of the DWS funds or a particular DWS fund over sales of shares of mutual
funds (or non-mutual fund investments) with respect to which the financial
advisor does not receive additional compensation or promotional incentives, or
receives lower levels of additional compensation or promotional incentives.
Similarly, financial advisors may receive different compensation or incentives
that may influence their recommendation of any particular share class of the
Portfolio or of other portfolios. These payment arrangements, however, will not
change the price that an investor pays for Portfolio shares or the amount that
the Portfolio receives to invest on behalf of an investor and will not increase
Portfolio expenses. You may wish to take such payment arrangements into account
when considering and evaluating any recommendations relating to Portfolio shares
and you should discuss this matter with your financial advisor and review your
financial advisor's disclosures.
It is likely that broker-dealers that execute portfolio transactions for the
Portfolios will include firms that also sell shares of the DWS funds to their
customers. However, the Advisor will not consider sales of DWS fund shares as a
factor in the selection of broker-dealers to execute portfolio transactions for
the DWS funds. Accordingly, the Advisor has implemented policies and procedures
reasonably designed to prevent its traders from considering sales of DWS fund
shares as a factor in the selection of broker-dealers to execute portfolio
transactions for the Portfolio. In addition, the Advisor, the Distributor and/or
their affiliates will not use fund brokerage to pay for their obligation to
provide additional compensation to financial advisors as described above.
DIVIDENDS, CAPITAL GAINS AND TAXES
Dividends for DWS Money Market VIP. DWS Money Market VIP's net investment income
is declared as a dividend daily and paid monthly in additional shares. If a
shareholder withdraws its entire account, all dividends accrued to the time of
withdrawal will be paid at that time.
Dividends for All Portfolios Except DWS Money Market VIP. The Fund normally
follows the practice of declaring and distributing substantially all the net
investment income and any net capital gains of these Portfolios at least
annually.
The Fund may at any time vary the dividend practices with respect to a Portfolio
and, therefore, reserves the right from time to time to either distribute or
retain for reinvestment such of its net investment income and its net capital
gains as the Board of Trustees of the Fund determines appropriate under the then
current circumstances.
Federal Income Taxes. Each Portfolio intends to qualify as a regulated
investment company under subchapter M of the Code in order to avoid federal
income taxation of the Portfolio on income and gains distributed to
shareholders.
Pursuant to the requirements of Section 817(h) of the Code, with certain limited
exceptions, the only shareholders of the Portfolios will be insurance companies
and their separate accounts that fund variable insurance and annuity contracts.
The prospectus that describes a particular variable insurance or annuity
contract should discuss the taxation of separate accounts and the owner of the
particular variable insurance or annuity contract. Potential insurance and
annuity contract holders should review such prospectus.
Each Portfolio intends to comply with the requirements of Section 817(h) of the
Code and related regulations. Section 817(h) and the regulations issued by the
Treasury Department impose certain diversification requirements affecting the
securities in which the Portfolios may invest. These diversification
requirements are in addition to the diversification requirements under
subchapter M of the Code and the 1940 Act. A failure to meet the requirements of
Section 817(h) could result in federal income taxation of the insurance company
offering the variable insurance or annuity contract and immediate taxation of
the owner of the contract to the extent of appreciation on investment under the
contract.
If owners of a variable insurance or annuity contract possess sufficient
incidents of ownership, they may be considered for federal income tax purposes
the owners of the assets of the separate accounts used to support their
contracts. In those circumstances, income and gains from the separate account's
assets for a taxable year would be included in the owner's gross income for the
current taxable year.
The preceding is a brief summary of certain of the relevant federal income tax
considerations applicable to an investment in the Portfolios. The summary is not
intended as a complete explanation or a substitute for careful tax planning and
consultation with individual tax advisors.
NET ASSET VALUE
For all Portfolios (other than the DWS Money Market VIP). The net asset value of
shares of each Portfolio is computed as of the close of regular trading on the
New York Stock Exchange (the "Exchange") on each day the Exchange is open for
trading (the "Value Time"). The Exchange is scheduled to be closed on the
following holidays: New Year's Day, Dr. Martin Luther King, Jr. Day, Presidents'
Day, Good Friday, Memorial Day, Independence Day, Labor Day, Thanksgiving and
Christmas, and on the preceding Friday or subsequent Monday when one of these
holidays falls on a Saturday or Sunday, respectively. Net asset value per share
is determined separately for each class of shares by dividing the value of the
total assets of each Portfolio attributable to the shares of that class, less
all liabilities attributable to that class, by the total number of shares of
that class outstanding. The per share net asset value may be lower for certain
classes of each Portfolio because of higher expenses borne by these classes.
An equity security is valued at its most recent sale price on the primary
exchange or OTC market as of the Value Time. Lacking any sales, the security is
valued at the calculated mean between the most recent bid quotation and the most
recent asked quotation (the "Calculated Mean") on such exchange or OTC market as
of the Value Time. If it is not possible to determine the Calculated Mean, the
security is valued at the most recent bid quotation on such exchange or OTC
market as of the Value Time. In the case of certain foreign exchanges or OTC
markets, the closing price reported by the exchange or OTC market (which may
sometimes be referred to as the "official close" or the "official closing price"
or other similar term) will be considered the most recent sale price.
Debt securities are valued as follows. Money market instruments purchased with
an original or remaining maturity of 60 days or less, maturing at par, are
valued at amortized cost. Other money market instruments are valued based on
information obtained from an independent pricing service or, if such information
is not readily available, by using matrix pricing techniques (formula driven
calculations based primarily on current market yields). Bank loans are valued at
prices supplied by an independent pricing service (which are intended to reflect
the mean between the bid and asked prices), if available, and otherwise at the
mean of the most recent bid and asked quotations or evaluated prices, as
applicable, based on quotations or evaluated prices obtained from one or more
broker-dealers. Privately placed debt securities, other than Rule 144A debt
securities, initially are valued at cost and thereafter based on all relevant
factors including type of security, size of holding and restrictions on
disposition. Municipal debt securities are valued at prices supplied by an
approved pricing agent (which are intended to reflect the mean between the bid
and asked prices), if available, and otherwise at the mean of the most recent
bid and asked quotations or evaluated price obtained from a broker-dealer. Other
debt securities not addressed above are valued at prices supplied by an
independent pricing service, if available, and otherwise at the most recent bid
quotation or evaluated price, as applicable, obtained from one or more
broker-dealers. If it is not possible to value a particular debt security
pursuant to the above methods, the security is valued on the basis of factors
including (but not limited to) maturity, coupon, creditworthiness, currency
denomination, and the movement of the market in which the security is normally
traded.
An exchange-traded option contract on securities, currencies and other financial
instruments is valued at its most recent sale price on such exchange. Lacking
any sales, the option contract is valued at the Calculated Mean. If it is not
possible to determine the Calculated Mean, the option contract is valued at the
most recent bid quotation in the case of a purchased option contract or the most
recent asked quotation in the case of a written option contract, in each case as
of the Value Time. An option contract on securities, currencies and other
financial instruments traded in the OTC market is valued on the Value Date at
the market to market price, or if not available, at the evaluated price provided
by the broker-dealer with which it was traded. Futures contracts (and options
thereon) are valued at the most recent settlement price, if available, on the
exchange on which they are traded most extensively. With the exception of stock
index futures contracts which trade on the Chicago Mercantile Exchange, closing
settlement times are prior to the close of trading on the New York Stock
Exchange. For stock index futures contracts which trade on the Chicago
Mercantile Exchange, closing settlement prices are normally available at
approximately 4:20 Eastern time. If no settlement price is available, the last
traded price on such exchange will be used.
If market quotations for a portfolio asset are not readily available or the
value of a portfolio asset as determined in accordance with Board-approved
procedures does not represent the fair market value of a portfolio asset, the
value of the portfolio asset is taken to be an amount which, in the opinion of a
portfolio's Pricing Committee (or, in some cases, the Board's Valuation
Committee), represents fair market value. The value of other portfolio holdings
owned by a Portfolio in the Fund is determined in a manner which is intended to
reflect the fair market value of the asset on the valuation date, based on
valuation procedures adopted by the portfolio's Board and overseen by the
portfolio's Pricing Committee.
For DWS Money Market VIP. The net asset value of shares of the Portfolio is
calculated at 4:00 p.m. Eastern time or the close of business on each day the
New York Stock Exchange (the "Exchange") is open for trading. The Exchange is
scheduled to be closed on the following holidays: New Year's Day, Dr. Martin
Luther King, Jr. Day, Presidents' Day, Good Friday, Memorial Day, Independence
Day, Labor Day, Thanksgiving and Christmas, and on the preceding Friday or
subsequent Monday when one of these holidays falls on a Saturday or Sunday,
respectively.
DWS Money Market VIP values its portfolio instruments at amortized cost, which
does not take into account unrealized capital gains or losses. This involves
initially valuing an instrument at its cost and thereafter assuming a constant
amortization to maturity of any discount or premium, regardless of the impact of
fluctuating interest rates on the market value of the instrument. While this
method provides certainty in valuation, it may result in periods during which
value, as determined by amortized cost, is higher or lower than the price the
Portfolio would receive if it sold the instrument. Calculations are made to
compare the value of the Portfolio's investments valued at amortized cost with
market values. Market valuations are obtained by using actual quotations
provided by market makers, estimates of market value, or values obtained from
yield data relating to classes of money market instruments published by
reputable sources at the mean between the bid and asked prices for the
instruments. If a deviation of 1/2 of 1% or more were to occur between the net
asset value per share calculated by reference to market values and the
Portfolio's $1.00 per share net asset value, or if there were any other
deviation that the Board of Trustees believed would result in a material
dilution to shareholders or purchasers, the Board of Trustees would promptly
consider what action, if any, should be initiated. If the Portfolio's net asset
value per share (computed using market values) declined, or were expected to
decline, below $1.00 (computed using amortized cost), the Board of Trustees
might temporarily reduce or suspend dividend payments in an effort to maintain
the net asset value at $1.00 per share. As a result of such reduction or
suspension of dividends or other action by the Board of Trustees, an investor
would receive less income during a given period than if such a reduction or
suspension had not taken place. Such action could result in investors receiving
no dividend for the period during which they hold their shares and receiving,
upon redemption, a price per share lower than that which they paid. On the other
hand, if the Portfolio's net asset value per share (computed using market
values) were to increase, or were anticipated to increase above $1.00 (computed
using amortized cost), the Board of Trustees might supplement dividends in an
effort to maintain the net asset value at $1.00 per share. Redemption orders
received in connection with the administration of checkwriting programs by
certain dealers or other financial services firms prior to the determination of
the Portfolio's net asset value also may be processed on a confirmed basis in
accordance with the procedures established by DWS-SDI.
TRUSTEES AND OFFICERS
The following table presents certain information regarding the Board Members of
the Trust. Each Board Member's year of birth is set forth in parentheses after
his or her name. Unless otherwise noted, (i) each Board Member has engaged in
the principal occupation(s) noted in the table for at least the most recent five
years, although not necessarily in the same capacity, and (ii) the address of
each Board Member that is not an "interested person" (as defined in the 1940
Act) of the Trust or the Advisor (each, an "Independent Board Member") is c/o
Dawn-Marie Driscoll, PO Box 100176, Cape Coral, FL 33904. The term of office for
each Board Member is until the election and qualification of a successor, or
until such Board Member sooner dies, resigns, is removed or as otherwise
provided in the governing documents of the Trust. Because the Portfolios do not
hold an annual meeting of shareholders, each Board Member will hold office for
an indeterminate period. The Board Members may also serve in similar capacities
with other funds in the DWS fund complex.
Independent Board Members
--------------------------------------------------------------------------------------------------------------------
Name, Year of Birth, Position Number of Funds
with the Trust and Length of Business Experience and in DWS Fund
Time Served(1) Directorships During the Past 5 Years Complex Overseen
--------------------------------------------------------------------------------------------------------------------
Dawn-Marie Driscoll (1946) President, Driscoll Associates (consulting firm); Executive 128
Chairperson since 2004,(2) and Fellow, Center for Business Ethics, Bentley College;
Board Member since 1987 formerly: Partner, Palmer & Dodge (1988-1990); Vice President
of Corporate Affairs and General Counsel, Filene's
(1978-1988); Directorships: Trustee of 8 open-end mutual
funds managed by Sun Capital Advisers, Inc. (since 2007);
Director of ICI Mutual Insurance Company (since 2007);
Advisory Board, Center for Business Ethics, Bentley College;
Trustee, Southwest Florida Community Foundation (charitable
organization); former Directorships: Investment Company
Institute (audit, executive, nominating committees) and
Independent Directors Council (governance, executive
committees)
--------------------------------------------------------------------------------------------------------------------
Paul K. Freeman Consultant, World Bank/Inter-American Development Bank; 132
(1950) formerly: Project Leader, International Institute for Applied
Vice Chairperson since 2008, and Systems Analysis (1998-2001); Chief Executive Officer, The
Board Member since 1993 Eric Group, Inc. (environmental insurance) (1986-1998)
--------------------------------------------------------------------------------------------------------------------
John W. Ballantine (1946) Retired; formerly: Executive Vice President and Chief Risk 134
Board Member since 1999 Management Officer, First Chicago NBD Corporation/The First
National Bank of Chicago (1996-1998); Executive Vice
President and Head of International Banking (1995-1996);
Directorships: Healthways Inc. (provider of disease and care
management services); Portland General Electric (utility
company); Stockwell Capital Investments PLC (private equity);
former Directorships: First Oak Brook Bancshares, Inc. and
Oak Brook Bank
--------------------------------------------------------------------------------------------------------------------
Henry P. Becton, Jr. (1943) Vice Chair, WGBH Educational Foundation; Directorships: 128
Board Member since Association of Public Television Stations; Becton Dickinson
1990 and Company(3) (medical technology company); Belo
Corporation(3) (media company); Boston Museum of Science;
Public Radio International; former Directorships: American
Public Television; Concord Academy; New England Aquarium;
Mass. Corporation for Educational Telecommunications;
Committee for Economic Development; Public Broadcasting
Service
--------------------------------------------------------------------------------------------------------------------
Keith R. Fox (1954) Managing General Partner, Exeter Capital Partners (a series 128
Board Member since of private equity funds); Directorships: Progressive Holding
1996 Corporation (kitchen goods importer and distributor); Natural
History, Inc. (magazine publisher); Box Top Media Inc.
(advertising); The Kennel Shop (retailer)
--------------------------------------------------------------------------------------------------------------------
Kenneth C. Froewiss Clinical Professor of Finance, NYU Stern School of Business 128
(1945) (1997-present); Member, Finance Committee, Association for
Board Member since Asian Studies (2002-present); Director, Mitsui Sumitomo
2001 Insurance Group (US) (2004-present); prior thereto, Managing
Director, J.P. Morgan (investment banking firm) (until 1996)
--------------------------------------------------------------------------------------------------------------------
Richard J. Herring Jacob Safra Professor of International Banking and Professor, 128
(1946) Finance Department, The Wharton School, University of
Board Member since Pennsylvania (since July 1972); Co-Director, Wharton
1990 Financial Institutions Center (since July 2000); Director,
Japan Equity Fund, Inc. (since September 2007), Thai Capital
Fund, Inc. (since September 2007), Singapore Fund, Inc.
(since September 2007); formerly: Vice Dean and Director,
Wharton Undergraduate Division (July 1995-June 2000);
Director, Lauder Institute of International Management
Studies (July 2000-June 2006)
--------------------------------------------------------------------------------------------------------------------
William McClayton (1944) Chief Administrative Officer, Diamond Management & Technology 134
Board Member since 2004 Consultants, Inc. (global management consulting firm)
(2001-present); Directorship: Board of Managers, YMCA of
Metropolitan Chicago; formerly: Senior Partner, Arthur
Andersen LLP (accounting) (1966-2001); Trustee, Ravinia
Festival
--------------------------------------------------------------------------------------------------------------------
Rebecca W. Rimel President and Chief Executive Officer, The Pew Charitable 128
(1951) Trusts (charitable organization) (1994 to present); Trustee,
Board Member since Thomas Jefferson Foundation (charitable organization) (1994
1995 to present); Trustee, Executive Committee, Philadelphia
Chamber of Commerce (2001 to 2007); Trustee, Pro Publica
(2007-present) (charitable organization); formerly: Executive
Vice President, The Glenmede Trust Company (investment trust
and wealth management) (1983 to 2004); Board Member, Investor
Education (charitable organization) (2004-2005); Director,
Viasys Health Care(3) (January 2007-June 2007)
--------------------------------------------------------------------------------------------------------------------
William N. Searcy, Jr. Private investor since October 2003; Trustee of 8 open-end 128
(1946) mutual funds managed by Sun Capital Advisers, Inc. (since
Board Member since October 1998); formerly: Pension & Savings Trust Officer,
1993 Sprint Corporation(3) (telecommunications) (November
1989-September 2003)
--------------------------------------------------------------------------------------------------------------------
Jean Gleason Stromberg Retired; formerly: Consultant (1997-2001); Director, US 128
(1943) Government Accountability Office (1996-1997); Partner,
Board Member since Fulbright & Jaworski, L.L.P. (law firm) (1978-1996);
1997 Directorships: The William and Flora Hewlett Foundation;
Service Source, Inc.; former Directorships: Mutual Fund
Directors Forum (2002-2004), American Bar Retirement
Association (funding vehicle for retirement plans) (1987-1990
and 1994-1996)
--------------------------------------------------------------------------------------------------------------------
Robert H. Wadsworth (1940) President, Robert H. Wadsworth & Associates, Inc. (consulting 137
Board Member since 1999 firm) (1983 to present).
--------------------------------------------------------------------------------------------------------------------
Interested Board Member
--------------------------------------------------------------------------------------------------------------------
Name, Year of Birth, Position Number of Funds
with the Trust and Length of Business Experience and in DWS Fund
Time Served(1) Directorships During the Past 5 Years Complex Overseen
--------------------------------------------------------------------------------------------------------------------
Axel Schwarzer(4) Managing Director(5), Deutsche Asset Management; Head of 134
(1958) Deutsche Asset Management Americas; CEO of DWS Scudder;
Board Member since formerly: board member of DWS Investments, Germany
2006 (1999-2005); Head of Sales and Product Management for the
Retail and Private Banking Division of Deutsche Bank in
Germany (1997-1999); various strategic and operational
positions for Deutsche Bank Germany Retail and Private
Banking Division in the field of investment funds, tax driven
instruments and asset management for corporates (1989-1996)
--------------------------------------------------------------------------------------------------------------------
Officers(6)
--------------------------------------------------------------------------------------------------------------------
Name, Year of Birth, Position
with the Trust and Length of Business Experience and
Time Served(7) Directorships During the Past 5 Years
--------------------------------------------------------------------------------------------------------------------
Michael G. Clark(8) (1965) Managing Director(5), Deutsche Asset Management (2006-present); President of
President, 2006-present DWS family of funds; Director, ICI Mutual Insurance Company (since
October 2007); formerly: Director of Fund Board Relations (2004-2006) and
Director of Product Development (2000-2004), Merrill Lynch Investment Managers;
Senior Vice President Operations, Merrill Lynch Asset Management (1999-2000)
--------------------------------------------------------------------------------------------------------------------
John Millette(9) (1962) Director(5), Deutsche Asset Management
Vice President and Secretary,
1999-present
--------------------------------------------------------------------------------------------------------------------
Paul H. Schubert(8) (1963) Managing Director(5), Deutsche Asset Management (since July 2004); formerly:
Chief Financial Officer, Executive Director, Head of Mutual Fund Services and Treasurer for UBS Family
2004-present of Funds (1998-2004); Vice President and Director of Mutual Fund Finance at UBS
Treasurer, 2005-present Global Asset Management (1994-1998)
--------------------------------------------------------------------------------------------------------------------
Patricia DeFilippis(8) (1963) Vice President, Deutsche Asset Management (since June 2005); formerly: Counsel,
Assistant Secretary, New York Life Investment Management LLC (2003-2005); legal associate, Lord,
2005-present Abbett & Co. LLC (1998-2003)
--------------------------------------------------------------------------------------------------------------------
Elisa D. Metzger(8) (1962) Director(5), Deutsche Asset Management (since September 2005); formerly:
Assistant Secretary, Counsel, Morrison and Foerster LLP (1999-2005)
2005-present
--------------------------------------------------------------------------------------------------------------------
Caroline Pearson(9) (1962) Managing Director(5), Deutsche Asset Management
Assistant Secretary,
1997-present
--------------------------------------------------------------------------------------------------------------------
Paul Antosca(9) Director(5), Deutsche Asset Management (since 2006); formerly: Vice President,
(1957) The Manufacturers Life Insurance Company (U.S.A.) (1990-2006)
Assistant Treasurer,
2007-present
--------------------------------------------------------------------------------------------------------------------
Jack Clark (9) Director(5), Deutsche Asset Management (since 2007); formerly: Vice President,
(1967) State Street Corporation (2002-2007)
Assistant Treasurer,
2007-present
--------------------------------------------------------------------------------------------------------------------
Kathleen Sullivan D'Eramo(9) Director(5), Deutsche Asset Management
(1957)
Assistant Treasurer,
2003-present
--------------------------------------------------------------------------------------------------------------------
Diane Kenneally(9) Director(5), Deutsche Asset Management
(1966)
Assistant Treasurer,
2007-present
--------------------------------------------------------------------------------------------------------------------
Jason Vazquez(8) (1972) Vice President, Deutsche Asset Management (since 2006); formerly: AML
Anti-Money Laundering Operations Manager for Bear Stearns (2004-2006); Supervising Compliance
Compliance Officer, Principal and Operations Manager for AXA Financial (1999-2004)
2007-present
--------------------------------------------------------------------------------------------------------------------
Robert Kloby(8) (1962) Managing Director(5), Deutsche Asset Management (2004-present); formerly: Chief
Chief Compliance Officer, Compliance Officer/Chief Risk Officer, Robeco USA (2000-2004); Vice President,
2006-present The Prudential Insurance Company of America (1988-2000); E.F. Hutton and
Company (1984-1988)
--------------------------------------------------------------------------------------------------------------------
J. Christopher Jackson(8) Director(5), Deutsche Asset Management (2006-present); formerly: Director,
(1951) Senior Vice President, General Counsel, and Assistant Secretary, Hansberger
Chief Legal Officer, Global Investors, Inc. (1996-2006); Director, National Society of Compliance
2006-present Professionals (2002-2005) (2006-2009)
--------------------------------------------------------------------------------------------------------------------
(1) The length of time served represents the year in which the Board Member
joined the board of one or more DWS funds currently overseen by the
Board.
(2) Represents the year in which Ms. Driscoll was first appointed
Chairperson of certain DWS funds.
(3) A publicly held company with securities registered pursuant to Section
12 of the Securities Exchange Act of 1934.
(4) The mailing address of Axel Schwarzer is c/o Deutsche Investment
Management Americas Inc., 345 Park Avenue, New York, New York 10154.
Mr. Schwarzer is an interested Board Member by virtue of his positions
with Deutsche Asset Management. As an interested person, Mr. Schwarzer
receives no compensation from the Portfolios.
(5) Executive title, not a board directorship.
(6) As a result of their respective positions held with the Advisor, these
individuals are considered "interested persons" of the Advisor within
the meaning of the 1940 Act. Interested persons receive no compensation
from the Portfolios.
(7) The length of time served represents the year in which the officer was
first elected in such capacity for one or more DWS funds.
(8) Address: 280 Park Avenue, New York, New York 10017.
(9) Address: Two International Place, Boston, Massachusetts 02110.
Certain officers hold similar positions for other investment companies for which
DIMA or an affiliate serves as the Advisor.
Officer's Role with Principal Underwriter: DWS Scudder Distributors, Inc.
Paul H. Schubert: Vice President
Caroline Pearson: Secretary
Board Members' Responsibilities. The officers of the Trust manage its day-to-day
operations under the direction of the Board. The primary responsibility of the
Board is to represent the interests of the Portfolios and to provide oversight
of the management of the Portfolios.
Board Committees. The Board has established the following standing committees:
Audit Committee, Nominating and Governance Committee, Contract Committee, Equity
Oversight Committee, Fixed-Income and Quant Oversight Committee, Marketing and
Shareholder Services Committee, and Operations Committee. For each committee,
the Board has adopted a written charter setting forth each committee's
responsibilities. Each committee was reconstituted effective April 1, 2008.
Audit Committee: The Audit Committee, which consists entirely of Independent
Board Members, assists the Board in fulfilling its responsibility for oversight
of (1) the integrity of the financial statements, (2) the Portfolios' accounting
and financial reporting policies and procedures, (3) the Portfolios' compliance
with legal and regulatory requirements related to accounting and financial
reporting and (4) the qualifications, independence and performance of the
independent registered public accounting firm for the Portfolios. It also
approves and recommends to the Board the appointment, retention or termination
of the independent registered public accounting firm for the Portfolios, reviews
the scope of audit and internal controls, considers and reports to the Board on
matters relating to the Portfolios' accounting and financial reporting
practices, and performs such other tasks as the full Board deems necessary or
appropriate. The Audit Committee receives annual representations from the
independent registered public accounting firm as to its independence. The
members of the Audit Committee are William McClayton (Chair), Kenneth C.
Froewiss (Vice Chair), John W. Ballantine, Henry P. Becton, Jr., Keith R. Fox
and William N. Searcy, Jr. During the calendar year 2007, the Audit Committee of
the Portfolios' Board held eight (8) meetings.
Nominating and Governance Committee: The Nominating and Governance Committee,
which consists entirely of Independent Board Members, recommends individuals for
membership on the Board, nominates officers, board and committee chairs, vice
chairs and committee members, and oversees the operations of the Board. The
Nominating and Governance Committee also reviews recommendations by shareholders
for candidates for Board positions. Shareholders may recommend candidates for
Board positions by forwarding their correspondence by US mail or courier service
to Dawn-Marie Driscoll, P.O. Box 100176, Cape Coral, FL 33904. The members of
the Nominating and Governance Committee are Henry P. Becton, Jr. (Chair),
Rebecca W. Rimel (Vice Chair), Paul K. Freeman and William McClayton. During the
calendar year 2007, the Nominating and Governance Committee of the Portfolios'
Board performed similar functions and held six (6) meetings.
Contract Committee: The Contract Committee, which consists entirely of
Independent Board Members, reviews at least annually, (a) the Portfolios'
financial arrangements with DIMA and its affiliates, and (b) the Portfolios'
expense ratios. The members of the Contract Committee are Robert H. Wadsworth
(Chair), Keith R. Fox (Vice Chair), Henry P. Becton, Jr., Richard J. Herring,
William McClayton and Jean Gleason Stromberg. During the calendar year 2007, the
Contract Review Committee of the Portfolios' Board performed similar functions
and held two (2) meetings.
Equity Oversight Committee: The Equity Oversight Committee reviews the
investment operations of those Portfolios that primarily invest in equity
securities (except for those funds managed by a quantitative investment team).
The members of the Equity Oversight Committee are John W. Ballantine (Chair),
William McClayton (Vice Chair), Henry P. Becton, Jr., Keith R. Fox, Richard J.
Herring and Rebecca W. Rimel. During the calendar year 2007, the Equity
Oversight Committee of the Portfolios' Board performed similar functions and
held five (5) meetings.
Fixed-Income and Quant Oversight Committee: The Fixed-Income and Quant Oversight
Committee reviews the investment operations of those Portfolios that primarily
invest in fixed-income securities or are managed by a quantitative investment
team. The members of the Fixed-Income and Quant Oversight Committee are William
N. Searcy, Jr. (Chair), Jean Gleason Stromberg (Vice Chair), Dawn-Marie
Driscoll, Paul K. Freeman, Kenneth C. Froewiss and Robert H. Wadsworth. During
the calendar year 2007, the Fixed-Income Oversight Committee of the Portfolios'
Board performed similar functions and held five (5) meetings.
Marketing and Shareholder Services Committee: The Marketing and Shareholder
Services Committee reviews the Portfolios' marketing program, sales practices
and literature and shareholder services. The members of the Marketing and
Shareholder Services Committee are Richard J. Herring (Chair), Dawn-Marie
Driscoll (Vice Chair), Paul K. Freeman, Rebecca W. Rimel, Jean Gleason Stromberg
and Robert H. Wadsworth.
The Operations Committee: The Operations Committee reviews the administrative
operations, legal affairs and general compliance matters of the Portfolios. The
Operations Committee reviews administrative matters related to the operations of
the Portfolios, policies and procedures relating to portfolio transactions,
custody arrangements, fidelity bond and insurance arrangements, valuation of
Portfolio assets and securities and such other tasks as the full Board deems
necessary or appropriate. The Operations Committee also oversees the valuation
of the Portfolios' securities and other assets and determines, as needed, the
fair value of Portfolio securities or other assets under certain circumstances
as described in the Portfolios' Valuation Procedures. The Operations Committee
has appointed a Valuation Sub-Committee, which may make determinations of fair
value required when the Operations Committee is not in session. The members of
the Operations Committee are Paul K. Freeman (Chair), Dawn-Marie Driscoll (Vice
Chair), John W. Ballantine, Kenneth C. Froewiss, Rebecca W. Rimel and William N.
Searcy, Jr. The members of the Valuation Sub-Committee are Kenneth C. Froewiss
(Chair), John W. Ballantine, Dawn-Marie Driscoll (Alternate), Paul K. Freeman
(Alternate), Rebecca W. Rimel (Alternate) and William N. Searcy, Jr.
(Alternate). During the calendar year 2007, the Operations Committee and
Valuation Committee performed similar functions and each held six (6) meetings
and eight (8) meetings, respectively.
Ad Hoc Committees. In addition to the standing committees described above, from
time to time the Board may also form ad hoc committees to consider specific
issues.
Remuneration. Each Independent Board Member receives compensation from the
Portfolios for his or her services, which includes an annual retainer and an
attendance fee for each meeting attended. No additional compensation is paid to
any Independent Board Member for travel time to meetings, attendance at
directors' educational seminars or conferences, service on industry or
association committees, participation as speakers at directors' conferences or
service on special fund industry director task forces or subcommittees.
Independent Board Members do not receive any employee benefits such as pension
or retirement benefits or health insurance from the Portfolios or any fund in
the DWS fund complex.
Board Members who are officers, directors, employees or stockholders of Deutsche
Asset Management or its affiliates receive no direct compensation from the
Portfolios, although they are compensated as employees of Deutsche Asset
Management, or its affiliates, and as a result may be deemed to participate in
fees paid by the Portfolios. The following tables show compensation from the
Portfolios and aggregate compensation from all of the funds in the DWS fund
complex received by each Independent Board Member during the calendar year 2007.
Mr. Schwarzer is an interested person of the Portfolios and received no
compensation from the Portfolios or any fund in the DWS fund complex during the
relevant periods.
Aggregate
Aggregate Compensation Aggregate
Aggregate Compensation from DWS Compensation
Compensation from DWS Blue Conservative from DWS Core
Name of Board Member from DWS Balanced VIP Chip VIP Allocation VIP Fixed VIP
-------------------- --------------------- -------- -------------- ---------
John W. Ballantine $4,300 $3,480 $1,890 $3,610
Henry P. Becton, Jr.(2) $0 $0 $0 $0
Dawn-Marie Driscoll(2)((3)) $0 $0 $0 $0
Keith R. Fox((2)) $0 $0 $0 $0
Paul K. Freeman(4) $5,300 $4,286 $2,355 $4,473
Kenneth C. Froewiss(2) $0 $0 $0 $0
Richard J. Herring(2) $0 $0 $0 $0
William McClayton(5) $4,100 $3,320 $1,810 $3,450
Rebecca W. Rimel(2) $0 $0 $0 $0
William N. Searcy, Jr.(2) $0 $0 $0 $0
Jean Gleason Stromberg((2)) $0 $0 $0 $0
Robert H. Wadsworth $4,100 $3,320 $1,810 $3,450
Aggregate Aggregate
Aggregate Compensation Compensation Aggregate
Compensation from DWS Dreman from DWS Dreman Compensation
from DWS Davis High Return Small Mid Cap from DWS Global
Name of Board Member Venture Value VIP Equity VIP Value VIP Thematic VIP
-------------------- ----------------- ---------- --------- ------------
John W. Ballantine $3,720 $5,260 $4,350 $2,770
Henry P. Becton, Jr.(2) $0 $0 $0 $0
Dawn-Marie Driscoll(2)((3)) $0 $0 $0 $0
Keith R. Fox((2)) $0 $0 $0 $0
Paul K. Freeman(4) $4,593 $6,474 $5,344 $3,409
Kenneth C. Froewiss(2) $0 $0 $0 $0
Richard J. Herring(2) $0 $0 $0 $0
William McClayton(5) $3,550 $5,010 $4,150 $2,630
Rebecca W. Rimel(2) $0 $0 $0 $0
William N. Searcy, Jr.(2) $0 $0 $0 $0
Jean Gleason Stromberg((2)) $0 $0 $0 $0
Robert H. Wadsworth $3,550 $5,010 $4,150 $2,630
Aggregate
Aggregate Aggregate Aggregate Compensation
Compensation Compensation Compensation from DWS
from DWS Government from DWS Growth from DWS High International
Name of Board Member & Agency VIP Allocation VIP Income VIP Select Equity VIP
-------------------- ------------ -------------- ---------- -----------------
John W. Ballantine $3,050 $2,960 $3,510 $3,240
Henry P. Becton, Jr.(2) $0 $0 $0 $0
Dawn-Marie Driscoll(2)((3)) $0 $0 $0 $0
Keith R. Fox((2)) $0 $0 $0 $0
Paul K. Freeman(4) $3,764 $3,650 $4,302 $3,991
Kenneth C. Froewiss(2) $0 $0 $0 $0
Richard J. Herring(2) $0 $0 $0 $0
William McClayton(5) $2,900 $2,820 $3,350 $3,090
Rebecca W. Rimel(2) $0 $0 $0 $0
William N. Searcy, Jr.(2) $0 $0 $0 $0
Jean Gleason Stromberg((2)) $0 $0 $0 $0
Robert H. Wadsworth $2,900 $2,820 $3,350 $3,090
Aggregate
Compensation Aggregate Aggregate Aggregate
from DWS Janus Compensation Compensation Compensation
Growth & from DWS Large from DWS Mid Cap from DWS Moderate
Name of Board Member Income VIP Cap Value VIP Growth VIP Allocation VIP
-------------------- ---------- ------------- ---------- --------------
John W. Ballantine $2,950 $3,350 $1,910 $2,800
Henry P. Becton, Jr.(2) $0 $0 $0 $0
Dawn-Marie Driscoll(2)((3)) $0 $0 $0 $0
Keith R. Fox((2)) $0 $0 $0 $0
Paul K. Freeman(4) $3,628 $4,118 $2,351 $3,463
Kenneth C. Froewiss(2) $0 $0 $0 $0
Richard J. Herring(2) $0 $0 $0 $0
William McClayton(5) $2,810 $3,190 $1,830 $2,670
Rebecca W. Rimel(2) $0 $0 $0 $0
William N. Searcy, Jr.(2) $0 $0 $0 $0
Jean Gleason Stromberg((2)) $0 $0 $0 $0
Robert H. Wadsworth $2,810 $3,190 $1,830 $2,670
Aggregate
Aggregate Aggregate Compensation Aggregate
Compensation Compensation from DWS Compensation
from DWS Money from DWS Small Strategic from DWS
Name of Board Member Market VIP Cap Growth VIP Income VIP Technology VIP
-------------------- ---------- -------------- ---------- --------------
John W. Ballantine $3,560 $3,070 $2,330 $2,750
Henry P. Becton, Jr.(2) $0 $0 $0 $0
Dawn-Marie Driscoll(2)((3)) $0 $0 $0 $0
Keith R. Fox((2)) $0 $0 $0 $0
Paul K. Freeman(4) $4,403 $3,784 $2,885 $3,391
Kenneth C. Froewiss(2) $0 $0 $0 $0
Richard J. Herring(2) $0 $0 $0 $0
William McClayton(5) $3,390 $2,910 $2,230 $2,630
Rebecca W. Rimel(2) $0 $0 $0 $0
William N. Searcy, Jr.(2) $0 $0 $0 $0
Jean Gleason Stromberg((2)) $0 $0 $0 $0
Robert H. Wadsworth $3,390 $2,910 $2,230 $2,630
Aggregate Compensation Total Compensation
from DWS Turner Mid from Fund and
Name of Board Member Cap Growth VIP DWS Fund Complex(1)
-------------------- -------------- -------------------
John W. Ballantine $2,530 $215,000
Henry P. Becton, Jr.(2) $0 $200,000
Dawn-Marie Driscoll(2)((3)) $0 $253,000
Keith R. Fox((2)) $0 $203,000
Paul K. Freeman(4) $3,136 $265,000
Kenneth C. Froewiss(2) $0 $200,000
Richard J. Herring(2) $0 $195,000
William McClayton(5) $2,410 $205,000
Rebecca W. Rimel(2) $0 $194,000
William N. Searcy, Jr.(2) $0 $200,000
Jean Gleason Stromberg((2)) $0 $189,000
Robert H. Wadsworth $2,410 $245,250
(1) The DWS fund complex is composed of 138 funds as of December 31, 2007.
(2) Aggregate compensation includes amounts paid to the Board Members for
special meetings of ad hoc committees of the board in connection with
the consolidation of the DWS fund boards and various funds, meetings
for considering fund expense simplification initiatives, and
consideration of issues specific to the Portfolios' direct shareholders
(i.e., those shareholders who did not purchase shares through financial
intermediaries). Such amounts totaled $1,000 for Mr. Becton, $1,000 for
Ms. Driscoll, $1,000 for Mr. Fox, $1,000 for Mr. Froewiss, $1,000 for
Dr. Herring, $5,000 for Ms. Rimel, $1,000 for Mr. Searcy and $1,000 for
Ms. Stromberg. These meeting fees were borne by the Advisor.
(3) Includes $50,000 in annual retainer fees received by Ms. Driscoll as
Chairperson of certain DWS funds.
(4) Includes $25,000 paid to Dr. Freeman for numerous special meetings of
an ad hoc committee in connection with board consolidation initiatives
and $50,000 in annual retainer fees received by Dr. Freeman as
Chairperson of certain DWS funds.
(5) Does not include $15,000 to be paid to Mr. McClayton in calendar year
2008 for numerous special meetings of an ad hoc committee of the former
Chicago Board in connection with board consolidation initiatives.
Dr. Freeman, prior to his service as Independent Board Member, served as a board
member of certain funds in the Deutsche Bank complex ("DB Funds"). In connection
with his resignation and the resignation of certain other board members of the
DB Funds on July 30, 2002 (the "Effective Date"), which was part of a
restructuring of the boards overseeing the DB Funds, Deutsche Asset Management,
Inc. ("DAMI") agreed to recommend, and, if necessary obtain, directors and
officers ("D&O") liability insurance coverage for the prior board members,
including Dr. Freeman, that is at least as equivalent in scope and amount to the
D&O coverage provided to the prior board members for the six-year period
following the Effective Date. In the event that D&O insurance coverage is not
available in the commercial marketplace on commercially reasonable terms from a
conventional third party insurer, DeAM reserved the right to provide
substantially equivalent protection in the form of an indemnity or financial
guarantee from an affiliate of DeAM. The D&O policy in effect prior to the
Effective Date provided aggregate coverage of $25,000,000, subject to a $250,000
per claim deductible.
Board Member Ownership in the Fund
The following table shows the dollar range of equity securities beneficially
owned by each Board Member in the Portfolios and DWS fund complex as of December
31, 2007. As only certain participating insurance companies are shareholders of
the Portfolios, the Trustees do not own any shares in such Portfolios, nor are
they contract owners of the participating insurance companies.
Aggregate Dollar Range of
Dollar Range of Beneficial Ownership in all Funds Overseen by
Ownership Board Member
Board Member in DWS Variable Series II in the DWS Fund Complex(1)
------------ ------------------------- --------------------------
Independent Board Member:
John W. Ballantine None Over $100,000
Henry P. Becton, Jr. None Over $100,000
Dawn-Marie Driscoll None Over $100,000
Keith R. Fox None Over $100,000
Paul K. Freeman None Over $100,000
Kenneth C. Froewiss None Over $100,000
Richard J. Herring None Over $100,000
William McClayton None Over $100,000
Rebecca W. Rimel None Over $100,000
William N. Searcy, Jr. None Over $100,000
Jean Gleason Stromberg None Over $100,000
Robert H. Wadsworth None Over $100,000
Interested Board Member:
Axel Schwarzer None Over $100,000
(1) Securities beneficially owned as defined under the 1934 Act include
direct and/or indirect ownership of securities where the Board Member's
economic interest is tied to the securities, employment ownership and
securities when the Board Member can exert voting power, and when the
Board Member has authority to sell the securities. The dollar ranges
are: None, $1-$10,000, $10,001-$50,000, $50,001-$100,000 and over
$100,000.
Ownership in Securities of the Advisor and Related Companies
As reported to the Portfolios, the information in the following table reflects
ownership by the Independent Board Members and their immediate family members of
certain securities as of December 31, 2007. Immediate family members can be a
spouse, children residing in the same household including step and adoptive
children, and any dependents. The securities represent ownership in the Advisor
or principal underwriter of the Portfolios and any persons (other than a
registered investment company) directly or indirectly controlling, controlled
by, or under common control with the Advisor or principal underwriter of the
Portfolios (including Deutsche Bank AG).
Value of
Owner and Securities on Percent of Class
Independent Relationship to Title of an Aggregate on an Aggregate
Board Member Board Member Company Class Basis Basis
------------ ------------ ------- ----- ----- -----
John W. Ballantine None
Henry P. Becton, Jr. None
Dawn-Marie Driscoll None
Keith R. Fox None
Paul K. Freeman None
Kenneth C. Froewiss None
Richard J. Herring None
William McClayton None
Rebecca W. Rimel None
William N. Searcy, Jr. None
Jean Gleason Stromberg None
Robert H. Wadsworth None
Securities Beneficially Owned
As of April 8, 2008, the Board Members and officers of the Trust owned, as a
group, less than 1% of the outstanding shares of each Portfolio.
To the best of each Portfolio's knowledge, as of April 8, 2008, no person owned
of record or beneficially 5% or more of any class of the Portfolio's outstanding
shares, except as noted below.
DWS Balanced VIP
Name and Address of Investor Ownership Shares % of Total Shares
-------------------------------------- ------ -----------------
KEMPER INVESTORS LIFE 8,347,214.80 39.74% of Class A
C/O PRODUCT VALUATION
TOPEKA KS 66636-0001
ALLMERICA LIFE SVSII 5,077,569.48 24.18% of Class A
TOPEKA KS 66636-0001
ZURICH DESTINATIONS FARMERS SVSII 3,689,641.33 17.57% of Class A
C/O KILICO
ATTN INVESTMENT ACCOUNTING LL-2W
GREENVILLE SC 29602-9097
SYMETRA LIFE INSURANCE CO 1,375,602.07 6.55% of Class A
ATTN LIFE FINANCE
SEPARATE ACCOUNTS
BELLEVUE WA 98004-5130
CHARTER NAT LIFE INS CO-HORIZON 1,288,036.01 6.13% of Class A
ATTN ACCTNG FINANCIAL CONTROL TEAM
VERNON HILLS IL 60061-1826
METLIFE INSURANCE CO OF CT 151,194.89 52.01% of Class B
ATTN SHAREHOLDER ACCOUNTING DEPT
HARTFORD CT 06199-0027
METLIFE LIFE & ANNUITY CO OF CT 136,471.48 46.94% of Class B
ATTN SHAREHOLDER ACCOUNTING DEPT
HARTFORD CT 06103-3432
DWS Blue Chip VIP
Name and Address of Investor Ownership Shares % of Total Shares
-------------------------------------- ------ -----------------
ZURICH DESTINATIONS FARMERS SVSII 11,549,864.57 60.82% of Class A
C/O KILICO
ATTN INVESTMENT ACCOUNTING LL-2W
GREENVILLE SC 29602-9097
ALLMERICA LIFE SVSII 6,213,962.92 32.72% of Class A
TOPEKA KS 66636-0001
METLIFE INSURANCE CO OF CT 480,561.96 54.55% of Class B
ATTN SHAREHOLDER ACCOUNTING DEPT
HARTFORD CT 06199-0027
METLIFE LIFE & ANNUITY CO OF CT 380,155.73 43.15% of Class B
ATTN SHAREHOLDER ACCOUNTING DEPT
HARTFORD CT 06103-3432
DWS Core Fixed Income VIP
Name and Address of Investor Ownership Shares % of Total Shares
-------------------------------------- ------ -----------------
ZURICH DESTINATIONS FARMERS SVSII 7,439,802.39 42.57% of Class A
C/O KILICO
ATTN INVESTMENT ACCOUNTING LL-2W
GREENVILLE SC 29602-9097
ALLMERICA LIFE SVSII 5,495,951.86 31.45% of Class A
TOPEKA KS 66636-0001
KEMPER INVESTORS LIFE 1,857,283.75 10.63% of Class A
C/O PRODUCT VALUATION
TOPEKA KS 66636-0001
STATE STREET BANK & TR CUST FBO 1,083,000.19 6.2% of Class A
DWS MODERATE ALLOCATION VIP
ATTN MARYLOU MCPHEE
NORTH QUINCY MA 02171-2119
THE MANUFACTURES LIFE INS CO (USA) 4,618,034.46 77.5% of Class B
BOSTON MA 02116-3787
METLIFE LIFE & ANNUITY CO OF CT 704,720.90 11.83% of Class B
ATTN SHAREHOLDER ACCOUNTING DEPT
HARTFORD CT 06103-3432
METLIFE INSURANCE CO OF CT 624,283.73 10.48% of Class B
ATTN SHAREHOLDER ACCOUNTING DEPT
HARTFORD CT 06199-0027
DWS Davis Venture Value VIP
Name and Address of Investor Ownership Shares % of Total Shares
-------------------------------------- ------ -----------------
ZURICH DESTINATIONS FARMERS SVSII 17,631,195.12 76.89% of Class A
C/O KILICO
ATTN INVESTMENT ACCOUNTING LL-2W
GREENVILLE SC 29602-9097
ALLMERICA LIFE SVSII 4,627,999.35 20.18% of Class A
TOPEKA KS 66636-0001
METLIFE LIFE & ANNUITY CO OF CT 899,009.35 53.38% of Class B
ATTN SHAREHOLDER ACCOUNTING DEPT
HARTFORD CT 06103-3432
METLIFE INSURANCE CO OF CT 749,296.11 44.49% of Class B
ATTN SHAREHOLDER ACCOUNTING DEPT
HARTFORD CT 06199-0027
DWS Dreman High Return Equity VIP
Name and Address of Investor Ownership Shares % of Total Shares
-------------------------------------- ------ -----------------
ZURICH DESTINATIONS FARMERS SVSII 42,951,564.98 66.23% of Class A
C/O KILICO
ATTN INVESTMENT ACCOUNTING LL-2W
GREENVILLE SC 29602-9097
ALLMERICA LIFE SVSII 15,840,196.70 24.42% of Class A
TOPEKA KS 66636-0001
METLIFE INSURANCE CO OF CT 1,511,995.40 50.5% of Class B
ATTN SHAREHOLDER ACCOUNTING DEPT
HARTFORD CT 06199-0027
METLIFE LIFE & ANNUITY CO OF CT 1,153,402.26 38.52% of Class B
ATTN SHAREHOLDER ACCOUNTING DEPT
HARTFORD CT 06103-3432
DWS Dreman Small Mid Cap Value VIP
Name and Address of Investor Ownership Shares % of Total Shares
-------------------------------------- ------ -----------------
ZURICH DESTINATIONS FARMERS SVSII 20,856,424.36 56.55% of Class A
C/O KILICO
ATTN INVESTMENT ACCOUNTING LL-2W
GREENVILLE SC 29602-9097
ALLMERICA LIFE SVSII 8,279,766.80 22.45% of Class A
TOPEKA KS 66636-0001
KEMPER INVESTORS LIFE 4,221,923.62 11.45% of Class A
C/O PRODUCT VALUATION
TOPEKA KS 66636-0001
NATIONAL LIFE INS CO 742,282.15 23.13% of Class B
SENTINEL ADVANTAGE (VA)
MONTPELIER VT 05604-0001
METLIFE LIFE & ANNUITY CO OF CT 732,065.03 22.81% of Class B
ATTN SHAREHOLDER ACCOUNTING DEPT
HARTFORD CT 06103-3432
METLIFE INSURANCE CO OF CT 667,670.11 20.81% of Class B
ATTN SHAREHOLDER ACCOUNTING DEPT
HARTFORD CT 06199-0027
NATIONWIDE INSURANCE CO 417,911.97 13.02% of Class B
NWPP
IPO PORTFOLIO ACCOUNTING
COLUMBUS OH 43218-2029
NATIONAL LIFE INS CO 306,282.09 9.54% of Class B
VARITRAK (VUL)
MONTPELIER VT 05604-0001
NATIONWIDE INSURANCE CO 188,918.87 5.89% of Class B
NWVL14
C/O IPO PORTFOLIO ACCOUNTING
COLUMBUS OH 43218-2029
DWS Global Thematic VIP
Name and Address of Investor Ownership Shares % of Total Shares
-------------------------------------- ------ -----------------
ZURICH DESTINATIONS FARMERS SVSII 9,328,056.89 70.79% of Class A
C/O KILICO
ATTN INVESTMENT ACCOUNTING LL-2W
GREENVILLE SC 29602-9097
ALLMERICA LIFE SVSII 3,524,958.53 26.75% of Class A
TOPEKA KS 66636-0001
METLIFE LIFE & ANNUITY CO OF CT 418,123.16 51.24% of Class B
ATTN SHAREHOLDER ACCOUNTING DEPT
HARTFORD CT 06103-3432
METLIFE INSURANCE CO OF CT 393,082.91 48.17% of Class B
ATTN SHAREHOLDER ACCOUNTING DEPT
HARTFORD CT 06199-0027
DWS Government & Agency Securities VIP
Name and Address of Investor Ownership Shares % of Total Shares
-------------------------------------- ------ -----------------
ZURICH DESTINATIONS FARMERS SVSII 7,465,247.00 41.49% of Class A
C/O KILICO
ATTN INVESTMENT ACCOUNTING LL-2W
GREENVILLE SC 29602-9097
ALLMERICA LIFE SVSII 6,934,794.92 38.55% of Class A
TOPEKA KS 66636-0001
KEMPER INVESTORS LIFE 2,293,820.46 12.75% of Class A
C/O PRODUCT VALUATION
TOPEKA KS 66636-0001
METLIFE LIFE & ANNUITY CO OF CT 315,442.94 50.91% of Class B
ATTN SHAREHOLDER ACCOUNTING DEPT
HARTFORD CT 06103-3432
METLIFE INSURANCE CO OF CT 281,623.05 45.45% of Class B
ATTN SHAREHOLDER ACCOUNTING DEPT
HARTFORD CT 06199-0027
DWS High Income VIP
Name and Address of Investor Ownership Shares % of Total Shares
-------------------------------------- ------ -----------------
ZURICH DESTINATIONS FARMERS SVSII 11,611,064.46 33.55% of Class A
C/O KILICO
ATTN INVESTMENT ACCOUNTING LL-2W
GREENVILLE SC 29602-9097
ALLMERICA LIFE SVSII 11,540,013.96 33.35% of Class A
TOPEKA KS 66636-0001
KEMPER INVESTORS LIFE 9,076,519.61 26.23% of Class A
C/O PRODUCT VALUATION
TOPEKA KS 66636-0001
METLIFE INSURANCE CO OF CT 696,110.75 51.31% of Class B
ATTN SHAREHOLDER ACCOUNTING DEPT
HARTFORD CT 06199-0027
METLIFE LIFE & ANNUITY CO OF CT 622,509.30 45.89% of Class B
ATTN SHAREHOLDER ACCOUNTING DEPT
HARTFORD CT 06103-3432
DWS International Select Equity VIP
Name and Address of Investor Ownership Shares % of Total Shares
-------------------------------------- ------ -----------------
ZURICH DESTINATIONS FARMERS SVSII 10,001,757.66 53.5% of Class A
C/O KILICO
ATTN INVESTMENT ACCOUNTING LL-2W
GREENVILLE SC 29602-9097
ALLMERICA LIFE SVSII 4,517,121.92 24.16% of Class A
TOPEKA KS 66636-0001
KEMPER INVESTORS LIFE 4,005,966.97 21.43% of Class A
C/O PRODUCT VALUATION
TOPEKA KS 66636-0001
METLIFE LIFE & ANNUITY CO OF CT 643,948.93 53.36% of Class B
ATTN SHAREHOLDER ACCOUNTING DEPT
HARTFORD CT 06103-3432
METLIFE INSURANCE CO OF CT 545,895.31 45.24% of Class B
ATTN SHAREHOLDER ACCOUNTING DEPT
HARTFORD CT 06199-0027
DWS Janus Growth & Income VIP
Name and Address of Investor Ownership Shares % of Total Shares
-------------------------------------- ------ -----------------
ZURICH DESTINATIONS FARMERS SVSII 10,272,138.86 73% of Class A
C/O KILICO
ATTN INVESTMENT ACCOUNTING LL-2W
GREENVILLE SC 29602-9097
ALLMERICA LIFE SVSII 3,649,526.49 25.94% of Class A
TOPEKA KS 66636-0001
METLIFE LIFE & ANNUITY CO OF CT 208,046.65 52.14% of Class B
ATTN SHAREHOLDER ACCOUNTING DEPT
HARTFORD CT 06103-3432
METLIFE INSURANCE CO OF CT 189,266.35 47.44% of Class B
ATTN SHAREHOLDER ACCOUNTING DEPT
HARTFORD CT 06199-0027
DWS Large Cap Value VIP
Name and Address of Investor Ownership Shares % of Total Shares
-------------------------------------- ------ -----------------
ZURICH DESTINATIONS FARMERS SVSII 6,822,921.26 43.9% of Class A
C/O KILICO
ATTN INVESTMENT ACCOUNTING LL-2W
GREENVILLE SC 29602-9097
ALLMERICA LIFE SVSII 4,562,365.13 29.35% of Class A
TOPEKA KS 66636-0001
KEMPER INVESTORS LIFE 2,553,196.51 16.43% of Class A
C/O PRODUCT VALUATION
TOPEKA KS 66636-0001
METLIFE LIFE & ANNUITY CO OF CT 300,677.11 56.15% of Class B
ATTN SHAREHOLDER ACCOUNTING DEPT
HARTFORD CT 06103-3432
METLIFE INSURANCE CO OF CT 226,817.95 42.36% of Class B
ATTN SHAREHOLDER ACCOUNTING DEPT
HARTFORD CT 06199-0027
DWS Mid Cap Growth VIP
Name and Address of Investor Ownership Shares % of Total Shares
-------------------------------------- ------ -----------------
ZURICH DESTINATIONS FARMERS SVSII 2,321,201.58 68.37% of Class A
C/O KILICO
ATTN INVESTMENT ACCOUNTING LL-2W
GREENVILLE SC 29602-9097
ALLMERICA LIFE SVSII 1,018,937.23 30.01% of Class A
TOPEKA KS 66636-0001
METLIFE LIFE & ANNUITY CO OF CT 69,169.74 50.55% of Class B
ATTN SHAREHOLDER ACCOUNTING DEPT
HARTFORD CT 06103-3432
METLIFE INSURANCE CO OF CT 64,223.79 46.94% of Class B
ATTN SHAREHOLDER ACCOUNTING DEPT
HARTFORD CT 06199-0027
DWS Money Market VIP
Name and Address of Investor Ownership Shares % of Total Shares
-------------------------------------- ------ -----------------
ZURICH DESTINATIONS FARMERS SVSII 155,832,856.03 41.73% of Class A
C/O KILICO
ATTN INVESTMENT ACCOUNTING LL-2W
GREENVILLE SC 29602-9097
ALLMERICA LIFE SVSII 80,719,533.71 21.62% of Class A
TOPEKA KS 66636-0001
KEMPER INVESTORS LIFE 46,568,740.85 12.47% of Class A
C/O PRODUCT VALUATION
TOPEKA KS 66636-0001
CHARTER NAT LIFE INS CO-HORIZON 21,973,275.28 5.88% of Class A
ATTN ACCTNG FINANCIAL CONTROL TEAM
VERNON HILLS IL 60061-1826
METLIFE LIFE & ANNUITY CO OF CT 6,139,105.16 53.22% of Class B
ATTN SHAREHOLDER ACCOUNTING DEPT
HARTFORD CT 06103-3432
METLIFE INSURANCE CO OF CT 5,368,616.58 46.54% of Class B
ATTN SHAREHOLDER ACCOUNTING DEPT
HARTFORD CT 06199-0027
DWS Small Cap Growth VIP
Name and Address of Investor Ownership Shares % of Total Shares
-------------------------------------- ------ -----------------
ZURICH DESTINATIONS FARMERS SVSII 5,470,055.31 49.64% of Class A
C/O KILICO
ATTN INVESTMENT ACCOUNTING LL-2W
GREENVILLE SC 29602-9097
ALLMERICA LIFE SVSII 2,507,179.02 22.75% of Class A
TOPEKA KS 66636-0001
KEMPER INVESTORS LIFE 2,219,937.17 20.15% of Class A
C/O PRODUCT VALUATION
TOPEKA KS 66636-0001
METLIFE LIFE & ANNUITY CO OF CT 245,859.17 54.05% of Class B
ATTN SHAREHOLDER ACCOUNTING DEPT
HARTFORD CT 06103-3432
METLIFE INSURANCE CO OF CT 207,304.19 45.58% of Class B
ATTN SHAREHOLDER ACCOUNTING DEPT
HARTFORD CT 06199-0027
DWS Strategic Income VIP
Name and Address of Investor Ownership Shares % of Total Shares
-------------------------------------- ------ -----------------
ZURICH DESTINATIONS FARMERS SVSII 6,128,786.76 65.35% of Class A
C/O KILICO
ATTN INVESTMENT ACCOUNTING LL-2W
GREENVILLE SC 29602-9097
ALLMERICA LIFE SVSII 3,017,159.16 32.17% of Class A
TOPEKA KS 66636-0001
METLIFE INSURANCE CO OF CT 472,174.99 58.1% of Class B
ATTN SHAREHOLDER ACCOUNTING DEPT
HARTFORD CT 06199-0027
METLIFE LIFE & ANNUITY CO OF CT 335,554.82 41.29% of Class B
ATTN SHAREHOLDER ACCOUNTING DEPT
HARTFORD CT 06103-3432
DWS Technology VIP
Name and Address of Investor Ownership Shares % of Total Shares
-------------------------------------- ------ -----------------
ZURICH DESTINATIONS FARMERS SVSII 8,470,948.56 63.36% of Class A
C/O KILICO
ATTN INVESTMENT ACCOUNTING LL-2W
GREENVILLE SC 29602-9097
ALLMERICA LIFE SVSII 4,156,417.85 31.09% of Class A
TOPEKA KS 66636-0001
METLIFE LIFE & ANNUITY CO OF CT 156,666.26 50.91% of Class B
ATTN SHAREHOLDER ACCOUNTING DEPT
HARTFORD CT 06103-3432
METLIFE INSURANCE CO OF CT 127,801.93 41.53% of Class B
ATTN SHAREHOLDER ACCOUNTING DEPT
HARTFORD CT 06199-0027
GE CAPITAL LIFE ASSURANCE CO 19,316.27 6.28% of Class B
OF NEW YORK
RICHMOND VA 23230-1702
DWS Turner Mid Cap Growth VIP
Name and Address of Investor Ownership Shares % of Total Shares
-------------------------------------- ------ -----------------
ZURICH DESTINATIONS FARMERS SVSII 10,622,246.64 83.79% of Class A
C/O KILICO
ATTN INVESTMENT ACCOUNTING LL-2W
GREENVILLE SC 29602-9097
ALLMERICA LIFE SVSII 2,005,314.96 15.82% of Class A
TOPEKA KS 66636-0001
METLIFE LIFE & ANNUITY CO OF CT 267,605.89 50.22% of Class B
ATTN SHAREHOLDER ACCOUNTING DEPT
HARTFORD CT 06103-3432
METLIFE INSURANCE CO OF CT 263,119.05 49.37% of Class B
ATTN SHAREHOLDER ACCOUNTING DEPT
HARTFORD CT 06199-0027
Agreement to Indemnify Independent Trustees for Certain Expenses
In connection with litigation or regulatory action related to possible improper
market timing or other improper trading activity or possible improper marketing
and sales activity in certain DWS Funds (the "Affected Funds"), DIMA has agreed
to indemnify and hold harmless the Affected Funds ("Fund Indemnification
Agreement") against any and all loss, damage, liability and expense, arising
from market timing or marketing and sales matters alleged in any enforcement
actions brought by governmental authorities involving or potentially affecting
the Affected Funds or DIMA ("Enforcement Actions") or that are the basis for
private actions brought by shareholders of the Affected Funds against the
Affected Funds, their directors and officers, DIMA and/or certain other parties
("Private Litigation"), or any proceedings or actions that may be threatened or
commenced in the future by any person (including governmental authorities),
arising from or similar to the matters alleged in the Enforcement Actions or
Private Litigation. In recognition of its undertaking to indemnify the Affected
Funds and in light of the rebuttable presumption generally afforded to
independent directors/trustees of investment companies that they have not
engaged in disabling conduct, DIMA has also agreed, subject to applicable law
and regulation, to indemnify certain (or, with respect to certain Affected
Funds, all) of the Independent Trustees of the Affected Funds, against certain
liabilities the Independent Trustees may incur from the matters alleged in any
Enforcement Actions or Private Litigation or arising from or similar to the
matters alleged in the Enforcement Actions or Private Litigation, and advance
expenses that may be incurred by the Independent Trustees in connection with any
Enforcement Actions or Private Litigation. DIMA is not, however, required to
provide indemnification and advancement of expenses: (1) with respect to any
proceeding or action which the Affected Funds' Board determines that the
Independent Trustees ultimately would not be entitled to indemnification or (2)
for any liability of the Independent Trustees to the Funds or their shareholders
to which the Independent Trustee would otherwise be subject by reason of willful
misfeasance, bad faith, gross negligence or reckless disregard of the
Independent Trustee's duties as a director or trustee of the Affected Funds as
determined in a final adjudication in such action or proceeding. The estimated
amount of any expenses that may be advanced to the Independent Trustees or
indemnity that may be payable under the indemnity agreements is currently
unknown. These agreements by DIMA will survive the termination of the investment
management agreements between DIMA and the Affected Funds.
FUND ORGANIZATION
The Fund was organized as a business trust under the laws of Massachusetts on
January 22, 1987. On February 6, 2006 the Fund changed its name from "Scudder
Variable Series II" to "DWS Variable Series II." The Fund may issue an unlimited
number of shares of beneficial interest all having no par value. Since the Fund
offers multiple Portfolios, it is known as a "series company." Currently, each
Portfolio offered herein offers two classes of shares: Class A and Class B
shares. Shares of each Portfolio have equal noncumulative voting rights except
that each Portfolio's Class B shares have separate and exclusive voting rights
with respect to the Portfolios' Rule 12b-1 Plan. Shares of each class also have
equal rights with respect to dividends, assets and liquidation subject to any
preferences (such as resulting from different Rule 12b-1 distribution fees),
rights or privileges of any classes of shares of a Portfolio. Shares are fully
paid and nonassessable when issued, and have no preemptive or conversion rights.
Information about the Portfolios' investment performance is contained in the
Fund's 2007 Annual Report to Shareholders, which may be obtained without charge
from the Fund or from Participating Insurance Companies which offer the
Portfolios.
Shareholder inquiries should be made by writing the Fund at the address shown on
the front cover or from Participating Insurance Companies which offer the
Portfolios.
The Fund is generally not required to hold meetings of its shareholders. Under
the Agreement and Declaration of Trust of the Fund ("Declaration of Trust"),
however, shareholder meetings will be held in connection with the following
matters: (a) the election or removal of trustees if a meeting is called for such
purpose; (b) the adoption of any contract for which approval is required by the
1940 Act; (c) any termination or reorganization of the Fund to the extent and as
provided in the Declaration of Trust; (d) any amendment of the Declaration of
Trust (other than amendments changing the name of the Fund or any Portfolio,
establishing a Portfolio, supplying any omission, curing any ambiguity or
curing, correcting or supplementing any defective or inconsistent provision
thereof); (e) as to whether a court action, preceding or claim should or should
not be brought or maintained derivatively or as a class action on behalf of the
Fund or the shareholders, to the same extent as the stockholders of a
Massachusetts business corporation; and (f) such additional matters as may be
required by law, the Declaration of Trust, the By-laws of the Fund, or any
registration of the Fund with the SEC or any state, or as the trustees may
consider necessary or desirable. The shareholders also would vote upon changes
in fundamental investment objectives, policies or restrictions.
The Board may, at any time, terminate the Fund, a Portfolio or a class without
shareholder approval.
Under current interpretations of the 1940 Act, the Fund expects that
Participating Insurance Company shareholders will offer VLI and VA contract
holders the opportunity to instruct them as to how Fund shares attributable to
such contracts will be voted with respect to the matters described above. The
separate prospectuses describing the VLI and VA contracts include additional
disclosure of how contract holder voting rights are computed.
Under Massachusetts law, shareholders of a Massachusetts business trust could,
under certain circumstances, be held personally liable for obligations of the
Fund. The Declaration of Trust, however, contains provisions designed to protect
shareholders from liability for acts or obligations of the Fund and requires
that notice of such provisions be given in each agreement, obligation or
instrument entered into or executed by the Fund or the trustees. Moreover, the
Declaration of Trust provides for indemnification out of Fund property for all
losses and expenses of any shareholders held personally liable for the
obligations of the Fund and the Fund will be covered by insurance which the
trustees consider adequate to cover foreseeable tort claims. Thus, the risk of a
shareholder incurring financial loss on account of shareholder liability is
considered by DIMA remote and not material since it is limited to circumstances
in which the provisions limiting liability are inoperative and the Fund itself
is unable to meet its obligations.
The Declaration of Trust further provides that the trustees will not be liable
for errors of judgment or mistakes of fact or law. The Declaration of Trust does
not protect a trustee against any liability to which he or she should otherwise
be subject by reason of willful misfeasance, bad faith, gross negligence or
reckless disregard of the duties of a trustee. The Declaration of Trust permits
the Fund to purchase insurance against certain liabilities on behalf of the
Trustees.
PROXY VOTING GUIDELINES
The Fund has delegated proxy voting responsibilities to the Advisor, subject to
the Board's general oversight. The Fund has delegated proxy voting to the
Advisor with the direction that proxies should be voted consistent with the
Fund's best economic interests. The Advisor has adopted its own Proxy Voting
Policies and Procedures ("Policies"), and Proxy Voting Guidelines ("Guidelines")
for this purpose. The Policies address, among other things, conflicts of
interest that may arise between the interests of the Fund, and the interests of
the Advisor and its affiliates, including the Fund's principal underwriter. The
Guidelines set forth the Advisor's general position on various proposals, such
as:
o Shareholder Rights -- The Advisor generally votes against proposals
that restrict shareholder rights.
o Corporate Governance -- The Advisor generally votes for confidential
and cumulative voting and against supermajority voting requirements for
charter and bylaw amendments. The Advisor generally votes for proposals
to restrict a chief executive officer from serving on more than three
outside boards of directors. The Advisor generally votes against
proposals that require a company to appoint a Chairman who is an
independent director.
o Anti-Takeover Matters -- The Advisor generally votes for proposals that
require shareholder ratification of poison pills or that request boards
to redeem poison pills, and votes against the adoption of poison pills
if they are submitted for shareholder ratification. The Advisor
generally votes for fair price proposals.
o Compensation Matters -- The Advisor generally votes for executive cash
compensation proposals, unless they are unreasonably excessive. The
Advisor generally votes against stock option plans that do not meet the
Advisor's criteria.
o Routine Matters -- The Advisor generally votes for the ratification of
auditors, procedural matters related to the annual meeting and changes
in company name, and against bundled proposals and adjournment.
The general provisions described above do not apply to investment companies. The
Advisor generally votes proxies solicited by investment companies in accordance
with the recommendations of an independent third party, except for proxies
solicited by or with respect to investment companies for which the Advisor or an
affiliate serves as the Advisor or principal underwriter ("affiliated investment
companies"). The Advisor votes affiliated investment company proxies in the same
proportion as the vote of the investment company's other shareholders (sometimes
called "mirror" or "echo" voting). Master fund proxies solicited from feeder
funds are voted in accordance with applicable requirements of the 1940 Act.
Although the Guidelines set forth the Advisor's general voting positions on
various proposals, the Advisor may, consistent with the Funds' best interests,
determine under some circumstances to vote contrary to those positions.
The Guidelines on a particular issue may or may not reflect the view of
individual members of the Board or of a majority of the Board. In addition, the
Guidelines may reflect a voting position that differs from the actual practices
of the public companies within the Deutsche Bank organization or of the
investment companies for which the Advisor or an affiliate serves as investment
advisor or sponsor.
The Advisor may consider the views of a portfolio company's management in
deciding how to vote a proxy or in establishing general voting positions for the
Guidelines, but management's views are not determinative.
As mentioned above, the Policies describe the way in which the Advisor resolves
conflicts of interest. To resolve conflicts, the advisor, under normal
circumstances, votes proxies in accordance with its Guidelines.
If the Advisor departs from the Guidelines with respect to a particular proxy or
if the Guidelines do not specifically address a certain proxy proposal, a proxy
voting committee established by the advisor will vote the proxy. Before voting
any such proxy, however, the Advisor's conflicts review committee will conduct
an investigation to determine whether any potential conflicts of interest exist
in connection with the particular proxy proposal. If the conflicts review
committee determines that the Advisor has a material conflict of interest, or
certain individuals on the proxy voting committee should be recused from
participating in a particular proxy vote, it will inform the proxy voting
committee. If notified that the Advisor has a material conflict, or fewer than
three voting members are eligible to participate in the proxy vote, typically
the Advisor will engage an independent third party to vote the proxy or follow
the proxy voting recommendations of an independent third party.
Under certain circumstances, the Advisor may not be able to vote proxies or the
Advisor may find that the expected economic costs from voting outweigh the
benefits associated with voting. For example, the Advisor may not vote proxies
on certain foreign securities due to local restrictions or customs. The Advisor
generally does not vote proxies on securities subject to share blocking
restrictions.
You may obtain information about how the Fund voted proxies related to its
portfolio securities during the 12-month period ended June 30 by visiting the
SEC's Web site at www.sec.gov or by visiting our Web site at:
www.dws-scudder.com (click on "proxy voting" at the bottom of the page).
ADDITIONAL INFORMATION
Other Information
The CUSIP number for each Portfolio is as follows:
DWS Balanced VIP - Class A 23338H685
DWS Balanced VIP - Class B 23338H677
DWS Blue Chip VIP - Class A 23338H305
DWS Blue Chip VIP - Class B 23338H404
DWS Core Fixed Income VIP - Class A 23338H826
DWS Core Fixed Income VIP - Class B 23338H818
DWS Davis Venture Value VIP - Class A 23338H537
DWS Davis Venture Value VIP - Class B 23338H529
DWS Dreman High Return Equity VIP - Class A 23338H628
DWS Dreman High Return Equity VIP - Class B 23338H610
DWS Dreman Small Mid Cap Value VIP - Class A 23338H750
DWS Dreman Small Mid Cap Value VIP - Class B 23338H743
DWS Global Thematic VIP - Class A 23338H701
DWS Global Thematic VIP - Class B 23338H800
DWS Government & Agency Securities VIP - Class A 23338H883
DWS Government & Agency Securities VIP - Class B 23338H875
DWS High Income VIP - Class A 23338H867
DWS High Income VIP - Class B 23338H859
DWS International Select Equity VIP - Class A 23338H842
DWS International Select Equity VIP - Class B 23338H834
DWS Janus Growth & Income VIP - Class A 23338H594
DWS Janus Growth & Income VIP - Class B 23338H586
DWS Large Cap Value VIP - Class A 23338H503
DWS Large Cap Value VIP - Class B 23338H602
DWS Mid Cap Growth VIP - Class A 23338H107
DWS Mid Cap Growth VIP - Class B 23338H206
DWS Money Market VIP - Class A 23338H792
DWS Money Market VIP - Class B 23338H784
DWS Small Cap Growth VIP - Class A 23338H776
DWS Small Cap Growth VIP - Class B 23338H768
DWS Strategic Income VIP - Class A 23338H735
DWS Strategic Income VIP - Class B 23338H727
DWS Technology VIP - Class A 23338H719
DWS Technology VIP - Class B 23338H693
DWS Turner Mid Cap Growth VIP - Class A 23338H578
DWS Turner Mid Cap Growth VIP - Class B 23338H560
Each series of DWS Variable Series II has a fiscal year ending December 31.
Many of the investment changes in the Portfolios will be made at prices
different from those prevailing at the time they may be reflected in a regular
report to shareholders of the Fund. These transactions will reflect investment
decisions made by the Advisor in light of each Portfolio's investment objectives
and policies, its other portfolio holdings and tax considerations, and should
not be construed as recommendations for similar action by other investors.
The Portfolios' prospectuses and this Statement of Additional Information omit
certain information contained in the Registration Statement and its amendments
which the Fund has filed with the SEC under the Securities Act of 1933 and
reference is hereby made to the Registration Statement for further information
with respect to the Fund and the securities offered hereby. The Registration
Statement and its amendments are available for inspection by the public at the
SEC in Washington, D.C.
FINANCIAL STATEMENTS
The audited financial statements, including the investment portfolios of each
Portfolio, as applicable, together with the Report of Independent Registered
Public Accounting Firm, Financial Highlights and notes to financial statements
in the Annual Report to the Shareholders of each Portfolio dated December 31,
2007 are incorporated herein by reference and are hereby deemed to be a part of
this Statement of Additional Information. A copy of the Fund's Annual Report may
be obtained without charge by contacting the Customer Service Center at the
telephone number shown in the contract prospectus.
APPENDIX A
BOND AND COMMERCIAL PAPER RATINGS
Set forth below are descriptions of ratings which represent opinions as to the
quality of the securities. It should be emphasized, however, that ratings are
relative and subjective and are not absolute standards of quality.
MOODY'S INVESTORS SERVICE, INC. -- CORPORATE BOND RATINGS
Aaa: Bonds which are rated Aaa are judged to be of the highest quality. They
carry the smallest degree of investment risk and are generally referred to as
"gilt-edged." Interest payments are protected by a large or by an exceptionally
stable margin and principal is secure. While the various protective elements are
likely to change, such changes as can be visualized are most unlikely to impair
the fundamentally strong position of such issues.
Aa: Bonds which are rated Aa are judged to be of high quality by all standards.
Together with the Aaa group they comprise what are generally known as high grade
bonds. They are rated lower than the best bonds because margins of protection
may not be as large as in Aaa securities or fluctuations of protective elements
may be of greater amplitude or there may be other elements present which make
the long-term risk appear somewhat larger than in Aaa securities.
A: Bonds which are rated A possess many favorable investment attributes and are
to be considered as upper -medium grade obligations. Factors giving security to
principal and interest are considered adequate, but elements may be present
which suggest a susceptibility to impairment sometime in the future.
Baa: Bonds which are rated Baa are considered as medium grade obligations,
(i.e., they are neither highly protected nor poorly secured). Interest payments
and principal security appear adequate for the present, but certain protective
elements may be lacking or may be characteristically unreliable over any great
length of time. Such bonds lack outstanding investment characteristics and in
fact have speculative characteristics as well.
Ba: Bonds which are rated Ba are judged to have speculative elements; their
future cannot be considered as well assured. Often the protection of interest
and principal payments may be very moderate and thereby not well safe-guarded
during both good and bad times over the future. Uncertainty of position
characterizes bonds in this class.
B: Bonds which are rated B are considered speculative and generally lack
characteristics of the desirable investment. Assurance of interest and principal
payments or of maintenance of other terms of the contract over any long period
of time may be small.
Caa: Bonds which are rated Caa are of poor standing. Such issues may be in
default or there may be present elements of danger with respect to principal or
interest.
Ca: Bonds which are rated Ca represent obligations which are highly speculative.
Such issues are often in default or have other marked shortcomings.
C: Bonds which are rated C are the lowest rated class of bonds, typically are in
default and can be regarded as having extremely poor prospects of ever attaining
any real investment standing.
Note: Moody's appends numerical modifiers 1, 2 and 3 to each generic rating
classification from Aa through Caa in its corporate bond rating system. The
modifier 1 indicates that the issue ranks in the higher end of its generic
rating category; the modifier 2 indicates a mid-range ranking; and the modifier
3 indicates that the issue ranks in the lower end of its generic rating
category.
MOODY'S INVESTORS SERVICE, INC. -- SHORT-TERM RATINGS
Moody's short-term debt ratings are opinions of the ability of issuers to honor
short-term financial obligations. Ratings may be assigned to issuers, short-term
programs or to individual short-term debt instruments. Such obligations
generally have an original maturity not exceeding thirteen months, unless
explicitly noted. Issuers rated Prime-1 or P-1 (or supporting institutions) have
a superior ability for repayment of short-term debt obligations. Prime-1 or P-1
repayment ability will often be evidenced by many of the following
characteristics:
o Leading market positions in well established industries.
o High rates of return on funds employed.
o Conservative capitalization structure with moderate reliance on debt
and ample asset protection.
o Broad margins in earnings coverage of fixed financial charges and high
internal cash generation.
o Well established access to a range of financial markets and assured
sources of alternate liquidity.
Issuers rated Prime-2 or P-2 (or supporting institutions) have a strong ability
for repayment of short-term debt obligations. This will normally be evidenced by
many of the characteristics cited above but to a lesser degree. Earnings trends
and coverage ratios, while sound, may be more subject to variation.
Capitalization characteristics, while still appropriate, may be more affected by
external conditions. Ample alternate liquidity is maintained.
STANDARD & POOR'S RATINGS SERVICES -- CORPORATE BOND RATINGS
INVESTMENT GRADE
AAA: Debt rated AAA has the highest rating assigned by S&P's to a debt
obligation. Capacity to pay interest and repay principal is extremely strong.
AA: Debt rated AA has a very strong capacity to pay interest and repay principal
and differs from the higher rated issues only in small degree.
A: Debt rated A has a strong capacity to pay interest and repay principal
although it is somewhat more susceptible to the adverse effects of changes in
circumstances and economic conditions than bonds in higher rated categories.
BBB: Debt rated BBB has an adequate capacity to pay interest and repay
principal. Whereas it normally exhibits adequate protection parameters, adverse
economic conditions or changing circumstances are more likely to lead to a
weakened capacity to pay interest and repay principal for debt in this category
than in higher rated categories.
SPECULATIVE GRADE
Debt rated BB, B, CCC, CC, and C has significant speculative characteristics
with respect to capacity to pay interest and repay principal. BB indicates the
least degree of speculation and C the highest. While such debt will likely have
some quality and protective characteristics, these may be outweighed by large
uncertainties or major exposures to adverse conditions.
BB: Debt rated BB has less near-term vulnerability to default than other
speculative issues. However, it faces major ongoing uncertainties or exposure to
adverse business, financial, or economic conditions which could lead to
inadequate capacity to meet timely interest and principal payments.
The BB rating category is also used for debt subordinated to senior debt that is
assigned an actual or implied BBB- rating.
B: Debt rated B has a greater vulnerability to default but currently has the
capacity to meet interest payments and principal repayments. Adverse business,
financial, or economic conditions will likely impair capacity or willingness to
pay interest and repay principal.
The B rating category is also used for debt subordinated to senior debt that is
assigned an actual or implied BB or BB- rating.
CCC: Debt rated CCC has a current vulnerability to default, and is dependent
upon favorable business, financial, and economic conditions to meet timely
payment of interest and repayment of principal. In the event of adverse
business, financial, or economic conditions, it is not likely to have the
capacity to pay interest and repay principal.
The CCC rating category is also used for debt subordinated to senior debt that
is assigned an actual or implied B or B- rating.
CC: Debt rated CC has a current high vulnerability to default, and is dependent
upon favorable business, financial, and economic conditions to meet timely
payment of interest and repayment of principal.
The rating CC is also applied to debt subordinated to senior debt which is
assigned an actual or implied CCC debt rating.
C: The rating C is typically applied to debt subordinated to senior debt which
is assigned an actual or implied CCC- debt rating. The C rating may be used to
cover a situation where a bankruptcy petition has been filed, but debt service
payments are continued.
C1: The Rating C1 is reserved for income bonds on which no interest is being
paid.
D: Debt rated D is in payment default. The D rating category is used when
interest payments or principal payments are not made on the date due even if the
applicable grace period has not expired, unless Standard & Poor's believes that
such payments will be made during such grace period. The D rating also will be
used upon the filing of a bankruptcy petition if debt service payments are
jeopardized.
Plus (+) or Minus (-): The ratings from AA to CCC may be modified by the
addition of a plus or minus sign to show relative standing within the major
rating categories.
R: Debt rated `R' is under regulatory supervision owing to its financial
condition. During the pendency of the regulatory supervision, the regulators may
have the power to favor one class of obligations over others or pay some
obligations and not others.
N.R.: Bonds may lack a S&P's rating because no public rating has been requested,
because there is insufficient information on which to base a rating, or because
S&P's does not rate a particular type of obligation as a matter of policy.
STANDARD & POOR'S RATINGS SERVICES -- SHORT-TERM RATINGS
S&P's commercial paper rating is a current assessment of the likelihood of
timely payment of debt considered short-term in the relevant market.
A-1: This highest category indicates that the degree of safety regarding timely
payment is strong. Those issues determined to possess extremely strong safety
characteristics are denoted with a plus (+) sign designation.
A-2: Capacity for timely payment on issues with this designation is
satisfactory. However, the relative degree of safety is not as high as for
issues designated A-1.
A-3: Issues carrying this designation have adequate capacity for timely payment.
However, adverse economic conditions or changing circumstances are more likely
to lead to a weakened capacity of the issuer to meet its financial commitments.
FITCH INVESTORS SERVICE, INC. -- BOND RATINGS
INVESTMENT GRADE
AAA: Bonds considered to be investment grade and of the highest credit quality.
The obligor has an exceptionally strong ability to pay interest and repay
principal, which is unlikely to be affected by reasonably foreseeable events.
AA: Bonds considered to be investment grade and of very high credit quality. The
obligor's ability to pay interest and repay principal is very strong, although
not quite as strong as bonds rated AAA. Bonds rated in the AAA and AA categories
are not significantly vulnerable to foreseeable events.
A: Bonds considered to be investment grade and of high credit quality. The
obligor's ability to pay interest and repay principal is considered to be
strong, but may be more vulnerable to adverse changes in economic conditions and
circumstances than bonds with higher ratings.
BBB: Bonds considered to be investment grade and of good credit quality. The
obligor's ability to pay interest and repay principal is considered to be
adequate. Adverse changes in economic conditions and circumstances, however, are
more likely to have adverse impact on these bonds, and therefore, impair timely
payment. The likelihood that the ratings of these bonds will fall below
investment grade is higher than for bonds with higher ratings.
SPECULATIVE GRADE
BB: Bonds are considered speculative. The obligor's ability to pay interest and
repay principal may be affected over time by adverse economic changes. However,
business or financial alternatives may be available which could assist the
obligor in satisfying its debt service requirements.
B: Bonds are considered highly speculative. While bonds in this class are
currently meeting debt service requirements, the probability of continued timely
payment of principal and interest reflects the obligor's limited margin of
safety and the need for reasonable business and economic activity throughout the
life of the issue.
CCC: Bonds have certain identifiable characteristics which, if not remedied, may
lead to default. The ability to meet obligations requires an advantageous
business and economic environment.
CC: Bonds are minimally protected. Default in payment of interest and/or
principal seems probable over time.
C: Bonds are in imminent default in payment of interest or principal.
DDD, DD and D: Bonds are in default of interest and/or principal payments. Such
bonds are extremely speculative and should be valued on the basis of their
ultimate recovery value in liquidation or reorganization of the obligor. DDD
represents the highest potential for recovery on these bonds, and D represents
the lowest potential for recovery.
Plus (+) or Minus (-): The ratings from AA to CC may be appended by the addition
of a plus or minus sign to denote the relative status within the rating
category.
NR: Indicates that Fitch Rating does not publicly rate the specific issue.
FITCH INVESTORS SERVICE, INC. -- SHORT-TERM RATINGS
Fitch's short-term ratings apply to debt obligations that are payable on demand
or have original maturities of generally up to three years, including commercial
paper, certificates of deposit, medium-term notes, and municipal and investment
notes.
F-1+: Exceptionally Strong Credit Quality. Issues assigned this rating are
regarded as having the strongest capacity for timely payment.
F-1: Very Strong Credit Quality. Issues assigned this rating reflect a capacity
for timely payment only slightly less than issues rated F-1+.
F-2: Good Credit Quality. Issues assigned this rating have a satisfactory
capacity for timely payment, but the margin of safety is not as great as the
F-1+ and F-1 categories.
F-3: Fair Credit Quality. Issues assigned this rating have characteristics
suggesting that the capacity for timely payment is adequate; however, near-term
adverse changes could cause these securities to be rated below investment grade.
B: Speculative. Minimal capacity for timely payment of financial commitments,
plus vulnerability to near-term adverse changes in financial and economic
conditions.
C: High default risk. Default is a real possibility. Capacity for meeting
financial commitments is solely reliant upon a sustained, favorable business and
economic environment.
D: Default. Denotes actual or imminent payment default.
</pre>

December 31, 2008
ANNUAL REPORT
DWS VARIABLE SERIES I
DWS Bond VIP DWS Growth & Income VIP DWS Capital Growth VIP DWS Global Opportunities VIP DWS International VIP DWS Health Care VIP |
Contents
Performance Summary, Information About Your Portfolio's Expenses, Management Summary, Portfolio Summary, Investment Portfolio, Financial Statements and Financial Highlights for:
3 DWS Bond VIP 23 DWS Growth & Income VIP 38 DWS Capital Growth VIP 51 DWS Global Opportunities VIP 65 DWS International VIP 77 DWS Health Care VIP 88 Notes to Financial Statements 97 Report of Independent Registered Public Accounting Firm 98 Tax Information 99 Proxy Voting 100 Investment Management Agreement Approval 114 Summary of Management Fee Evaluation by Independent Fee Consultant 117 Summary of Administrative Fee Evaluation by Independent Fee Consultant 118 Board Members and Officers |
This report must be preceded or accompanied by a prospectus. To obtain an additional prospectus, call (800) 778-1482 or your financial representative. We advise you to consider the product's objectives, risks, charges and expenses carefully before investing. The prospectus contains this and other important information about the investment product. Please read the prospectus carefully before you invest.
NOT FDIC/NCUA INSURED NO BANK GUARANTEE MAY LOSE VALUE NOT A DEPOSIT
NOT INSURED BY ANY FEDERAL GOVERNMENT AGENCY
Investments in variable portfolios involve risk. Some portfolios have more risk than others. These include portfolios that allow exposure to or otherwise concentrate investments in certain sectors, geographic regions, security types, market capitalization or foreign securities (e.g., political or economic instability, which can be accentuated in Emerging Market countries). Please read the prospectus for specific details regarding its investments and risk profile.
DWS Investments is part of Deutsche Bank's Asset Management division and, within the US, represents the retail asset management activities of Deutsche Bank AG, Deutsche Bank Trust Company Americas, Deutsche Investment Management Americas Inc. and DWS Trust Company.
Performance Summary December 31, 2008
DWS Bond VIP
All performance shown is historical, assumes reinvestment of all dividend and capital gain distributions, and does not guarantee future results. Investment return and principal value fluctuate with changing market conditions so that, when redeemed, shares may be worth more or less than their original cost. Current performance may be lower or higher than the performance data quoted. Please contact your participating insurance company for the Portfolio's most recent month-end performance. Performance doesn't reflect charges and fees ("contract charges") associated with the separate account that invests in the Portfolio or any variable life insurance policy or variable annuity contract for which the Portfolio is an investment option. These charges and fees will reduce returns. While all share classes have the same underlying portfolio, their performance will differ.
The total annual portfolio operating expense ratio, gross of any fee waivers or expense reimbursements, as stated in the fee table of the prospectus dated May 1, 2008 is 0.57% for Class A shares. Please see the Information About Your Portfolio's Expenses, the Financial Highlights and Notes to the Financial Statements (Note C, Related Parties) sections of this report for gross and net expense related disclosure for the period ended December 31, 2008.
Portfolio returns during 3-year, 5-year and 10-year periods shown reflect a fee waiver and/or expense reimbursement. Without this waiver/reimbursement, returns would have been lower.
Risk Considerations
Investments by the Portfolio in lower-rated bonds present greater risk to principal and income than investments in higher-quality securities. This Portfolio invests in individual bonds whose yields and market values fluctuate so that your investment may be worth more or less than its original cost. Bond investments are subject to interest-rate risk such that when interest rates rise, the prices of the bonds, and thus the value of the investment, can decline and the investor can lose principal value. Additionally, investing in foreign securities presents certain risks, such as currency fluctuation and changes in political/economic conditions and market risks. All of these factors may result in greater share price volatility. In the current market environment, mortgage-backed securities are experiencing increased volatility. Please see this Portfolio's prospectus for specific details regarding its investments and risk profile.
Growth of an Assumed $10,000 Investment |
[] DWS Bond VIP — Class A [] Barclays Capital US Aggregate Index | The Barclays Capital US Aggregate Index (name changed from Lehman Brothers US Aggregate Index, effective November 3, 2008) is an unmanaged, market value-weighted measure of Treasury issues, agency issues, corporate bond issues and mortgage securities. Index returns, unlike portfolio returns, do not reflect any fees or expenses. It is not possible to invest directly into an index. |
 | |
Yearly periods ended December 31 |
|
Comparative Results |
DWS Bond VIP | 1-Year | 3-Year | 5-Year | 10-Year |
Class A | Growth of $10,000
| $8,323 | $9,080 | $9,817 | $12,858 |
Average annual total return
| -16.77% | -3.17% | -.37% | 2.55% |
Barclays Capital US Aggregate Index
| Growth of $10,000
| $10,524 | $11,745 | $12,552 | $17,297 |
Average annual total return
| 5.24% | 5.51% | 4.65% | 5.63% |
The growth of $10,000 is cumulative.
Information About Your Portfolio's Expenses
DWS Bond VIP
As an investor of the Portfolio, you incur two types of costs: ongoing expenses and transaction costs. Ongoing expenses include management fees, distribution and service (12b-1) fees and other Portfolio expenses. Examples of transaction costs include contract charges, redemption fees and account maintenance fees, which are not shown in this section. The following tables are intended to help you understand your ongoing expenses (in dollars) of investing in the Portfolio and to help you compare these expenses with the ongoing expenses of investing in other mutual funds. The example in the table is based on an investment of $1,000 invested at the beginning of the six-month period and held for the entire period (July 1, 2008 to December 31, 2008).
The tables illustrate your Portfolio's expenses in two ways:
• Actual Portfolio Return. This helps you estimate the actual dollar amount of ongoing expenses (but not transaction costs) paid on a $1,000 investment in the Portfolio using the Portfolio's actual return during the period. To estimate the expenses you paid over the period, simply divide your account value by $1,000 (for example, an $8,600 account value divided by $1,000 = 8.6), then multiply the result by the number in the "Expenses Paid per $1,000" line under the share class you hold.
• Hypothetical 5% Portfolio Return. This helps you to compare your Portfolio's ongoing expenses (but not transaction costs) with those of other mutual funds using the Portfolio's actual expense ratio and a hypothetical rate of return of 5% per year before expenses. Examples using a 5% hypothetical Portfolio return may be found in the shareholder reports of other mutual funds. The hypothetical account values and expenses may not be used to estimate the actual ending account balance or expenses you paid for the period.
Please note that the expenses shown in these tables are meant to highlight your ongoing expenses only and do not reflect any transaction costs. The "Expenses Paid per $1,000" line of the tables is useful in comparing ongoing expenses only and will not help you determine the relative total expense of owning different funds. If these transaction costs had been included, your costs would have been higher.
Expenses and Value of a $1,000 Investment for the six months ended December 31, 2008 |
Actual Portfolio Return | Class A |
Beginning Account Value 7/1/08
| $ 1,000.00 |
Ending Account Value 12/31/08
| $ 846.20 |
Expenses Paid per $1,000*
| $ 2.78 |
Hypothetical 5% Portfolio Return | Class A |
Beginning Account Value 7/1/08
| $ 1,000.00 |
Ending Account Value 12/31/08
| $ 1,022.12 |
Expenses Paid per $1,000*
| $ 3.05 |
* Expenses are equal to the Portfolio's annualized expense ratio for each share class, multiplied by the average account value over the period, multiplied by the number of days in the most recent six-month period, then divided by 366.Annualized Expense Ratios | Class A |
DWS Variable Series I — DWS Bond VIP
| .60% |
For more information, please refer to the Portfolio's prospectus.
These tables do not reflect charges and fees ("contract charges") associated with the separate account that invests in the Portfolio or any variable life insurance policy or variable annuity contract for which the Portfolio is an investment option.
Management Summary December 31, 2008
DWS Bond VIP
Entering the year, banks were pulling back financing from the markets as they were forced to come to terms with losses related to the subprime mortgage crisis that had emerged in the summer of 2007. As 2008 progressed, ongoing fallout from the collapse in housing and mortgages led to the failure, forced merger or government bailout of a number of leading global financial institutions in both the US and Europe. The result was a further tightening of credit that caused global economic growth to pull back sharply during the fourth quarter. Given this backdrop, investors' risk tolerance approached zero and liquidity all but evaporated. What ensued was a frantic "flight to quality" into the safe haven of US Treasuries and underperformance for all other segments of the bond market. Emerging-market and high-yield corporate bonds underperformed the broader bond market by a wide margin for the year. As investor risk aversion peaked in October and November, even AAA-rated mortgage-backed issues experienced a collapse in demand.1
During the 12-month period ended December 31, 2008, the Portfolio provided a total return of -16.77% (Class A shares, unadjusted for contract charges) compared with the 5.24% return of its benchmark, the Barclays Capital US Aggregate Index.
The Portfolio's focus on fixed-income sectors that trade at a yield spread to Treasuries detracted from performance for the period, driven by the unprecedented flight to quality that boosted Treasuries.2 The Portfolio's high-yield corporate and emerging-market holdings fell significantly, although its relatively defensive positioning helped to limit the downside impact to some degree. Within the domestic portion of the Portfolio, commercial mortgage-backed securities and non-agency residential mortgage-backed securities suffered historically poor performance, especially late in the year. Late in the period, the Portfolio's exposure to high-yield corporate bonds was trimmed as we upgraded the Portfolio's quality profile.
Effective December 1, 2008, Deutsche Investment Management Americas Inc. (the "Advisor") assumed all advisory responsibilities for the portfolio that were previously delegated to the Portfolio's subadvisor and sub-subadvisor. The following portfolio managers handle the day-to-day management of the fund's investment portfolio. |
Kenneth R. Bowling, CFA
Jamie Guenther, CFA | John Brennan
Bruce Harley, CFA, CEBS | J. Richard Robben, CFA
David Vignolo, CFA | J. Kevin Horsley, CFA, CPA
Stephen Willer, CFA |
The Barclays Capital US Aggregate Index (name changed from Lehman Brothers US Aggregate Index, effective November 3, 2008) is an unmanaged, market-value-weighted measure of Treasury issues, agency issues, corporate bond issues and mortgage securities.
Index returns, unlike portfolio returns, do not reflect any fees or expenses. It is not possible to invest directly into an index.
1 Credit quality (credit rating) is a measure of a bond issuer's ability to repay interest and principal in a timely manner. Rating agencies assign letter designations such as AAA, AA and so forth. The lower the rating, the higher the probability of default.2 The yield spread is the difference between the yield of a security and the yield of a comparable-duration Treasury. A large spread indicates that investors require yields substantially above those of Treasuries in order to invest in lower-quality bonds. This is generally indicative of a higher-risk environment. A smaller spread generally indicates a more positive environment, since investors are less concerned about risk and therefore willing to accept lower yields. A drop in the yield spread is a positive.Portfolio management market commentary is as of December 31, 2008, and may not come to pass. This information is subject to change at any time based on market and other conditions. Past performance does not guarantee future results. Current and future portfolio holdings are subject to risk.
Portfolio Summary
DWS Bond VIP
Asset Allocation (As a % of Investment Portfolio excluding Securities Lending Collateral) | 12/31/08 | 12/31/07 |
| | |
Corporate Bonds | 24% | 19% |
Commercial and Non-Agency Mortgage-Backed Securities | 22% | 35% |
Mortgage-Backed Securities Pass-Throughs | 20% | 15% |
Government & Agency Obligations | 12% | 17% |
Collateralized Mortgage Obligations | 8% | 4% |
Cash Equivalents | 6% | 2% |
Municipal Bonds and Notes | 5% | 2% |
Preferred Securities | 2% | 5% |
Asset Backed | 1% | 1% |
| 100% | 100% |
Quality (Excludes Securities Lending Collateral) | 12/31/08 | 12/31/07 |
| | |
US Government & Treasury Obligations | 29% | 36% |
AAA* | 26% | 35% |
AA | 8% | 3% |
A | 8% | 7% |
BBB | 15% | 13% |
BB or Below | 3% | 6% |
Not Rated | 11% | — |
| 100% | 100% |
Effective Maturity (Excludes Cash Equivalents and Securities Lending Collateral) | 12/31/08 | 12/31/07 |
| | |
Under 1 year | 10% | 3% |
1-4.99 years | 47% | 45% |
5-9.99 years | 27% | 41% |
10-14.99 years | 7% | 1% |
15+ years | 9% | 10% |
| 100% | 100% |
* Category includes cash equivalentsWeighted average effective maturity: 7.43 and 6.99 years, respectively.
Asset allocation, quality and effective maturity are subject to change.
The quality ratings represent the lower of Moody's Investors Service, Inc. ("Moody's") or Standard & Poor's Corporation ("S&P") credit ratings. The ratings of Moody's and S&P represent their opinions as to the quality of the securities they rate. Ratings are relative and subjective and are not absolute standards of quality. The Portfolio's credit quality does not remove market risk.
For more complete details about the Portfolio's investment portfolio, see page 9. A complete list of portfolio holdings of the Portfolio is posted as of the month end on www.dws-investments.com on or about the 15th day of the following month. More frequent posting of portfolio holdings information may be made from time to time on www.dws-investments.com.
Following the Portfolio's fiscal first and third quarter-end, a complete portfolio holdings listing is filed with the SEC on Form N-Q. The form will be available on the SEC's Web site at www.sec.gov, and it also may be reviewed and copied at the SEC's Public Reference Room in Washington, D.C. Information on the operation of the SEC's Public Reference Room may be obtained by calling (800) SEC-0330.
Investment Portfolio December 31, 2008
DWS Bond VIP
| Principal Amount ($)(a) | Value ($) |
| |
Corporate Bonds 24.1% |
Consumer Discretionary 3.0% |
British Sky Broadcasting Group PLC, 144A, 9.5%, 11/15/2018 | 590,000 | 602,333 |
Comcast Cable Communications Holdings, Inc., 9.455%, 11/15/2022 (b) | 235,000 | 263,284 |
Comcast Cable Holdings LLC, 10.125%, 4/15/2022 | 168,000 | 202,724 |
Comcast Corp., 6.4%, 5/15/2038 | 55,000 | 54,871 |
D.R. Horton, Inc., 5.375%, 6/15/2012 | 76,000 | 56,050 |
Grupo Televisa SA, 6.0%, 5/15/2018 | 500,000 | 420,450 |
Omnicom Group, Inc., Zero Coupon, 7/31/2032 | 405,000 | 386,269 |
TCI Communications, Inc., 8.75%, 8/1/2015 | 511,000 | 543,938 |
Time Warner Cable, Inc.: | | |
6.75%, 7/1/2018 | 445,000 | 428,448 |
7.3%, 7/1/2038 | 40,000 | 41,555 |
Time Warner, Inc.: | | |
7.625%, 4/15/2031 | 350,000 | 343,984 |
7.7%, 5/1/2032 | 305,000 | 305,376 |
Viacom, Inc.: | | |
5.75%, 4/30/2011 | 458,000 | 415,950 |
6.25%, 4/30/2016 | 775,000 | 642,392 |
| 4,707,624 |
Consumer Staples 1.4% |
CVS Caremark Corp.: | | |
6.25%, 6/1/2027 | 332,000 | 308,694 |
6.302%, 6/1/2037 | 1,050,000 | 535,500 |
Delhaize America, Inc., 9.0%, 4/15/2031 | 400,000 | 404,528 |
Kroger Co., 6.8%, 4/1/2011 | 505,000 | 521,418 |
Miller Brewing Co., 144A, 5.5%, 8/15/2013 | 425,000 | 396,264 |
| 2,166,404 |
Energy 2.6% |
Baker Hughes, Inc., 7.5%, 11/15/2018 | 420,000 | 465,636 |
Enbridge Energy Partners LP, 8.05%, 10/1/2037 | 61,000 | 29,697 |
Enterprise Products Operating LP: | | |
Series B, 5.6%, 10/15/2014 | 680,000 | 576,937 |
8.375%, 8/1/2066 | 82,000 | 45,100 |
EOG Co. of Canada, 144A, 7.0%, 12/1/2011 | 850,000 | 873,475 |
Kinder Morgan Energy Partners LP, 6.95%, 1/15/2038 | 510,000 | 412,461 |
Petro-Canada, 6.8%, 5/15/2038 | 545,000 | 411,276 |
Southern Union Co., 7.2%, 11/1/2066 | 190,000 | 65,550 |
TransCanada PipeLines Ltd.: | | |
5.85%, 3/15/2036 | 185,000 | 157,351 |
6.5%, 8/15/2018 | 420,000 | 412,046 |
Transocean Ltd., Series C, 1.5%, 12/15/2037 | 415,000 | 319,550 |
Transocean, Inc., 6.8%, 3/15/2038 | 280,000 | 249,745 |
| 4,018,824 |
| Principal Amount ($)(a) | Value ($) |
| |
Financials 9.3% |
AES El Salvador Trust, 144A, 6.75%, 2/1/2016 | 475,000 | 338,581 |
American Express Credit Corp., Series C, 7.3%, 8/20/2013 (b) | 155,000 | 158,657 |
American International Group, Inc., 144A, 8.175%, 5/15/2058 | 170,000 | 66,134 |
ANZ National International Ltd., 144A, 6.2%, 7/19/2013 | 400,000 | 387,024 |
Banco Mercantil del Norte SA, 144A, 6.862%, 10/13/2021 | 362,000 | 217,200 |
Bank of New York Mellon Corp., Series G, 4.95%, 11/1/2012 (b) | 654,000 | 663,985 |
Berkshire Hathaway Finance Corp., 4.6%, 5/15/2013 | 515,000 | 514,990 |
BP Capital Markets PLC, 5.25%, 11/7/2013 | 735,000 | 767,293 |
Discover Financial Services, 2.629%*, 6/11/2010 | 515,000 | 440,972 |
Erac USA Finance Co.: | | |
144A, 5.8%, 10/15/2012 | 340,000 | 284,420 |
144A, 8.0%, 1/15/2011 | 330,000 | 309,569 |
ESI Tractebel Acquisition Corp., Series B, 7.99%, 12/30/2011 | 99,000 | 91,610 |
Farmers Exchange Capital, 144A, 7.2%, 7/15/2048 | 385,000 | 213,391 |
FPL Group Capital, Inc.: | | |
6.65%, 6/15/2067 | 360,000 | 187,200 |
Series D, 7.3%, 9/1/2067 | 20,000 | 11,200 |
Glen Meadow Pass-Through
Trust, 144A, 6.505%,
2/12/2067 | 330,000 | 147,541 |
HBOS PLC, 144A, 6.75%, 5/21/2018 | 175,000 | 154,017 |
John Deere Capital Corp., Series D, 2.875%,
6/19/2012 (b) | 3,000,000 | 3,085,473 |
JPMorgan Chase & Co.,
5.125%, 9/15/2014 | 435,000 | 421,549 |
Merrill Lynch & Co., Inc.: | | |
6.875%, 4/25/2018 | 245,000 | 256,276 |
7.75%, 5/14/2038 | 455,000 | 501,265 |
Metropolitan Life Global
Funding I, 144A, 5.125%, 4/10/2013 | 565,000 | 526,444 |
Morgan Stanley, Series F, 6.0%, 4/28/2015 | 955,000 | 823,907 |
National Australia Bank Ltd.,
144A, 5.35%, 6/12/2013 | 435,000 | 419,257 |
National Rural Utilities
Cooperative Finance Corp., 10.375%, 11/1/2018 | 630,000 | 737,357 |
NLV Financial Corp., 144A,
6.5%, 3/15/2035 | 734,000 | 465,665 |
NYSE Euronext, 4.8%,
6/28/2013 | 455,000 | 441,329 |
Red Arrow International
Leasing, "A", 8.375%, 6/30/2012 RUB | 2,685,435 | 32,540 |
SPI Electricity & Gas Australia Holdings Property Ltd.,
144A, 6.15%, 11/15/2013 | 425,000 | 425,895 |
Standard Chartered Bank,
144A, 6.4%, 9/26/2017 | 345,000 | 286,940 |
| Principal Amount ($)(a) | Value ($) |
| |
UDR, Inc., Series E, (REIT), 3.9%, 3/15/2010 | 245,000 | 212,453 |
US Bancorp., 0.704%*, 12/11/2035 | 255,000 | 232,688 |
Wells Fargo & Co., 5.25%, 10/23/2012 | 210,000 | 213,892 |
Xstrata Finance Canada Ltd., 144A, 6.9%, 11/15/2037 | 585,000 | 350,024 |
| 14,386,738 |
Health Care 0.9% |
Advanced Medical Optics, Inc., 7.5%, 5/1/2017 | 21,000 | 10,710 |
Medco Health Solutions, Inc.: | | |
6.125%, 3/15/2013 | 725,000 | 676,065 |
7.125%, 3/15/2018 | 715,000 | 660,727 |
| 1,347,502 |
Industrials 0.6% |
Allied Waste North America, Inc., 7.875%, 4/15/2013 | 193,000 | 183,350 |
America West Airlines, Inc., Series 99-1, 7.93%, 1/2/2019 | 196,587 | 157,761 |
Northwest Pipelines Corp., 5.95%, 4/15/2017 (b) | 450,000 | 394,875 |
Overseas Shipholding Group, Inc., 7.5%, 2/15/2024 | 58,000 | 38,570 |
Toll Corp., 8.25%, 12/1/2011 (b) | 83,000 | 75,530 |
| 850,086 |
Information Technology 0.9% |
Broadridge Financial Solutions, Inc., 6.125%, 6/1/2017 | 114,000 | 82,771 |
International Business Machines Corp., 6.5%, 10/15/2013 | 200,000 | 219,247 |
Tyco Electronics Group SA, 6.0%, 10/1/2012 | 695,000 | 626,962 |
Xerox Corp.: | | |
6.35%, 5/15/2018 | 415,000 | 324,569 |
7.2%, 4/1/2016 (b) | 175,000 | 130,660 |
| 1,384,209 |
Materials 0.1% |
Pliant Corp., 11.85%, 6/15/2009 (PIK) | 7 | 4 |
Sappi Papier Holding AG, 144A, 6.75%, 6/15/2012 | 85,000 | 63,456 |
The Mosaic Co., 144A, 7.375%, 12/1/2014 | 157,000 | 128,740 |
| 192,200 |
Telecommunication Services 1.8% |
AT&T, Inc., 6.7%, 11/15/2013 (b) | 790,000 | 836,864 |
Cellco Partnership: | | |
144A, 7.375%, 11/15/2013 | 295,000 | 311,249 |
144A, 8.5%, 11/15/2018 | 370,000 | 433,520 |
Telecom Italia Capital: | | |
6.2%, 7/18/2011 | 175,000 | 155,313 |
7.721%, 6/4/2038 (b) | 310,000 | 254,587 |
Verizon Communications, Inc.: | | |
5.25%, 4/15/2013 (b) | 105,000 | 105,402 |
8.75%, 11/1/2018 | 595,000 | 698,067 |
| 2,795,002 |
Utilities 3.5% |
Baltimore Gas & Electric Co., 6.35%, 10/1/2036 | 260,000 | 213,975 |
CenterPoint Energy Resources Corp., 7.75%, 2/15/2011 (b) | 500,000 | 478,575 |
| Principal Amount ($)(a) | Value ($) |
| |
CMS Energy Corp., 8.5%, 4/15/2011 | 17,000 | 16,742 |
Commonwealth Edison Co.: | | |
Series 98, 6.15%, 3/15/2012 | 550,000 | 536,046 |
6.95%, 7/15/2018 | 310,000 | 293,500 |
Dominion Resources, Inc.: | | |
Series 06-B, 6.3%, 9/30/2066 | 330,000 | 148,500 |
7.5%, 6/30/2066 | 935,000 | 467,500 |
Energy Future Competitive Holdings Corp., 7.48%, 1/1/2017 | 339,527 | 199,611 |
Integrys Energy Group, Inc., 6.11%, 12/1/2066 | 580,000 | 278,400 |
Intergen NV, 144A, 9.0%, 6/30/2017 | 75,000 | 61,500 |
Majapahit Holding BV, REG S, 7.75%, 10/17/2016 | 100,000 | 55,030 |
New York State Electric & Gas Corp., 144A, 6.15%, 12/15/2017 | 1,055,000 | 960,151 |
Orion Power Holdings, Inc., 12.0%, 5/1/2010 | 120,000 | 120,000 |
PNM Resources, Inc., 9.25%, 5/15/2015 | 99,000 | 78,705 |
PPL Capital Funding, Inc., Series A, 6.7%, 3/30/2067 | 830,000 | 365,200 |
Regency Energy Partners LP, 8.375%, 12/15/2013 | 176,000 | 120,560 |
Union Electric Co., 6.7%, 2/1/2019 | 645,000 | 587,712 |
Wisconsin Energy Corp., Series A, 6.25%, 5/15/2067 | 955,000 | 472,725 |
| 5,454,432 |
Total Corporate Bonds (Cost $42,540,818) | 37,303,021 |
|
Asset-Backed 0.9% |
Automobile Receivables 0.3% |
Household Automotive Trust, "A4", Series 2006-1, 5.52%, 3/18/2013 | 500,000 | 436,736 |
Credit Card Receivables 0.5% |
Household Credit Card Master Note Trust I, "A", Series 2007-1, 1.245%*, 4/15/2013 | 1,214,000 | 763,094 |
Home Equity Loans 0.1% |
First Franklin Mortgage Loan Asset-Backed Certificates, "A2A", Series 2007-FFC, 0.621%*, 6/25/2027 | 724,280 | 247,171 |
Total Asset-Backed (Cost $2,044,101) | 1,447,001 |
|
Mortgage-Backed Securities Pass-Throughs 19.9% |
Federal Home Loan Mortgage Corp.: | | |
5.305%*, 6/1/2035 | 819,092 | 829,021 |
5.5%, with various maturities from 10/1/2023 until 8/1/2024 | 696,646 | 715,422 |
5.518%*, 2/1/2038 | 962,067 | 972,746 |
6.5%, 3/1/2026 | 1,261,082 | 1,329,313 |
7.0%, 1/1/2038 | 400,870 | 417,390 |
Federal National Mortgage Association: | | |
4.5%, 6/1/2034 | 942,222 | 957,496 |
5.0%, with various maturities from 2/1/2021 until 5/1/2034 | 2,696,107 | 2,766,544 |
| Principal Amount ($)(a) | Value ($) |
| |
5.166%*, 9/1/2038 | 881,106 | 893,001 |
5.458%*, 1/1/2038 | 1,080,059 | 1,103,891 |
5.5%, with various maturities from 1/1/2025 until 7/1/2037 | 14,265,130 | 14,608,005 |
6.0%, with various maturities from 4/1/2024 until 3/1/2025 | 1,287,328 | 1,335,000 |
6.5%, with various maturities from 3/1/2017 until 1/1/2038 | 4,692,261 | 4,883,148 |
8.0%, 9/1/2015 | 27,461 | 29,161 |
Total Mortgage-Backed Securities Pass-Throughs (Cost $29,878,224) | 30,840,138 |
|
Commercial and Non-Agency Mortgage-Backed Securities 21.7% |
Adjustable Rate Mortgage Trust, "3A31", Series 2005-10, 5.414%*, 1/25/2036 | 820,000 | 397,062 |
American Home Mortgage Investment Trust, "5A3", Series 2005-2, 5.077%, 9/25/2035 | 990,124 | 821,632 |
Banc of America Commercial Mortgage, Inc., "A4", Series 2007-3, 5.658%*, 6/10/2049 | 1,085,000 | 793,540 |
Banc of America Mortgage Securities, Inc., "1A20", Series 2005-3, 5.5%, 4/25/2035 | 1,095,000 | 913,932 |
Bear Stearns Adjustable Rate Mortgage Trust: | | |
"A1", Series 2006-1, 4.625%*, 2/25/2036 | 1,681,536 | 1,066,877 |
"3A1", Series 2007-5, 5.98%*, 8/25/2047 | 1,514,696 | 877,432 |
Bear Stearns Commercial Mortgage Securities, "AAB", Series 2007-PW16, 5.712%*, 6/11/2040 | 1,200,000 | 860,543 |
Chase Mortgage Finance Corp., "3A1", Series 2007-A3, 5.98%*, 12/25/2037 | 844,049 | 547,737 |
Citigroup Mortgage Loan Trust, Inc., "2A1A", Series 2007-AR8, 5.912%*, 7/25/2037 | 648,531 | 382,525 |
Citigroup/Deutsche Bank Commercial Mortgage Trust, "A4", Series 2007-CD4, 5.322%, 12/11/2049 | 1,460,000 | 1,019,221 |
Countrywide Alternative Loan Trust: | | |
"1A1", Series 2004-2CB, 4.25%, 3/25/2034 | 251,106 | 219,831 |
"A1", Series 2004-1T1, 5.0%, 2/25/2034 | 278,089 | 234,253 |
"A2", Series 2002-18, 5.25%, 2/25/2033 | 577,033 | 503,326 |
"A2", Series 2003-21T1, 5.25%, 12/25/2033 | 481,789 | 420,871 |
"A2", Series 2004-1T1, 5.5%, 2/25/2034 | 184,689 | 157,015 |
Countrywide Home Loans: | | |
"A1", Series 2005-29, 5.75%, 12/25/2035 | 1,139,228 | 830,925 |
"A2", Series 2006-1, 6.0%, 3/25/2036 | 824,918 | 552,180 |
Credit Suisse Mortgage Capital Certificates, Inc.: | | |
"3A1", Series 2006-9, 6.0%, 11/25/2036 | 1,250,046 | 661,743 |
| Principal Amount ($)(a) | Value ($) |
| |
"3A19", Series 2007-5, 6.0%, 8/25/2037 | 1,044,058 | 845,035 |
CS First Boston Mortgage Securities Corp., "10A3", Series 2005-10, 6.0%, 11/25/2035 | 209,125 | 161,067 |
GMAC Mortgage Corp. Loan Trust, "A1", Series 2006-J1, 5.75%, 4/25/2036 | 1,005,635 | 710,288 |
Greenwich Capital Commercial Funding Corp.: | | |
"AM", Series 2007-GG9, 5.475%, 3/10/2039 | 1,025,000 | 519,432 |
"AJ", Series 2007-GG9, 5.505%, 3/10/2039 | 108,000 | 28,114 |
"A4", Series 2007-GG11, 5.736%, 12/10/2049 | 700,000 | 522,610 |
GS Mortgage Securities Corp. II: | | |
"AAB", Series 2007-GG10, 5.799%*, 8/10/2045 | 1,620,000 | 1,131,789 |
"J", Series 2007-GG10, 144A, 5.799%*, 8/10/2045 | 1,096,000 | 80,398 |
"K", Series 2007-GG10, 144A, 5.799%*, 8/10/2045 | 767,000 | 47,660 |
"AM", Series 2007-GG10, 5.799%*, 8/10/2045 | 225,000 | 103,040 |
"A4", Series 2007-GG10, 5.799%*, 8/10/2045 | 1,235,000 | 896,186 |
GSR Mortgage Loan Trust, "1A1", Series 2007-AR2, 5.775%*, 5/25/2047 | 1,118,821 | 575,185 |
Indymac Inda Mortgage Loan Trust, "1A2", Series 2007-AR1, 5.703%*, 3/25/2037 | 995,778 | 667,417 |
Indymac Index Mortgage Loan Trust, "3A1", Series 2006-AR33, 5.766%*, 1/25/2037 | 717,807 | 467,589 |
JPMorgan Chase Commercial Mortgage Securities Corp.: | | |
"ASB", Series 2007-CB19, 5.73%*, 2/12/2049 | 880,000 | 638,654 |
"A4", Series 2007-LD11, 5.819%*, 6/15/2049 | 805,000 | 568,512 |
"F", Series 2007-LD11, 5.819%*, 6/15/2049 | 650,000 | 94,346 |
"G", Series 2007-LD11, 144A, 5.819%*, 6/15/2049 | 760,000 | 105,148 |
"H", Series 2007-LD11, 144A, 5.819%*, 6/15/2049 | 460,000 | 45,124 |
"E", Series 2007-LD11, 5.819%*, 6/15/2049 | 590,000 | 88,913 |
"ASB", Series 2007-LD12, 5.833%*, 2/15/2051 | 1,175,000 | 855,398 |
"A4", Series 2007-LD12, 5.882%*, 2/15/2051 | 575,000 | 408,911 |
"AM", Series 2007-LD12, 6.062%*, 2/15/2051 | 800,000 | 375,675 |
JPMorgan Mortgage Trust, "2A4", Series 2006-A2, 5.754%*, 4/25/2036 | 1,420,000 | 611,691 |
LB-UBS Commercial Mortgage Trust, "A4", Series 2007-C6, 5.858%, 7/15/2040 | 690,000 | 490,950 |
Master Alternative Loans Trust: | | |
"5A1", Series 2005-2, 6.5%, 12/25/2034 | 103,844 | 61,105 |
"8A1", Series 2004-3, 7.0%, 4/25/2034 | 18,972 | 14,128 |
| Principal Amount ($)(a) | Value ($) |
| |
Merrill Lynch Mortgage Investors Trust, "A2", Series 2005-A5, 4.566%, 6/25/2035 | 105,000 | 60,288 |
Merrill Lynch Mortgage Trust, "ASB", Series 2007-C1, 5.829%*, 6/12/2050 | 590,000 | 420,302 |
Merrill Lynch/Countrywide Commercial Mortgage Trust, "ASB", Series 2007-5, 5.362%, 8/12/2048 | 1,000,000 | 705,684 |
Morgan Stanley Capital I: | | |
"AM", Series 2007-HQ12, 5.632%*, 4/12/2049 | 600,000 | 275,268 |
"AAB", Series 2007-IQ14, 5.654%, 4/15/2049 | 1,105,000 | 786,085 |
New York Mortgage Trust, "2A3", Series 2006-1, 5.652%*, 5/25/2036 | 1,100,000 | 546,424 |
Residential Accredit Loans, Inc., "CB", Series 2004-QS2, 5.75%, 2/25/2034 | 489,789 | 308,261 |
Structured Adjustable Rate Mortgage Loan Trust: | | |
"1A4", Series 2005-22, 5.25%, 12/25/2035 | 1,160,000 | 429,604 |
"6A3", Series 2005-21, 5.4%, 11/25/2035 | 740,000 | 307,107 |
"7A4", Series 2006-1, 5.62%, 2/25/2036 | 930,000 | 361,805 |
Structured Asset Securities Corp., "2A1", Series 2003-1, 6.0%, 2/25/2018 | 3,722 | 3,564 |
SunTrust Adjustable Rate Mortgage Loan Trust, "3A1", Series 2007-4, 5.993%*, 10/25/2037 | 1,517,528 | 989,329 |
Wachovia Bank Commercial Mortgage Trust: | | |
"APB", Series 2007-C30, 5.294%, 12/15/2043 | 610,000 | 429,741 |
"H", Series 2007-C32, 144A, 5.741%*, 6/15/2049 | 770,000 | 74,447 |
"ABP", Series 2007-C32, 5.741%*, 6/15/2049 | 720,000 | 516,576 |
Washington Mutual Mortgage Pass-Through Certificates Trust: | | |
"1A3", Series 2005-AR16, 5.102%*, 12/25/2035 | 825,000 | 440,113 |
"1A1", Series 2006-AR18, 5.339%*, 1/25/2037 | 1,105,673 | 622,858 |
"4A1", Series 2007-HY3, 5.347%*, 3/25/2037 | 1,492,793 | 854,087 |
"2A3", Series 2006-AR6, 5.948%*, 8/25/2036 | 1,055,000 | 484,944 |
Wells Fargo Mortgage Backed Securities Trust: | | |
"B1", Series 2005-AR12, 4.362%*, 7/25/2035 | 755,886 | 242,760 |
"2A5", Series 2006-AR2, 5.093%*, 3/25/2036 | 2,388,990 | 1,480,531 |
"A4", Series 2005-AR14, 5.387%*, 8/25/2035 | 945,000 | 483,934 |
"2A5", Series 2006-AR1, 5.548%*, 3/25/2036 | 935,000 | 374,861 |
Total Commercial and Non-Agency Mortgage-Backed Securities (Cost $55,383,179) | 33,573,583 |
|
| Principal Amount ($)(a) | Value ($) |
| |
Collateralized Mortgage Obligations 7.5% |
Fannie Mae Whole Loan, "1A1", Series 2004-W15, 6.0%, 8/25/2044 | 271,150 | 281,813 |
Federal Home Loan Mortgage Corp.: | | |
"WJ", Series 2557, 5.0%, 7/15/2014 | 213,535 | 214,985 |
"TA", Series 2750, 5.0%, 2/15/2032 | 1,010,000 | 1,031,985 |
"PD", Series 2774, 5.0%, 8/15/2032 | 1,010,000 | 1,032,001 |
"ME", Series 2775, 5.0%, 12/15/2032 | 460,000 | 469,978 |
"EG", Series 2836, 5.0%, 12/15/2032 | 1,580,000 | 1,612,718 |
"PD", Series 2893, 5.0%, 2/15/2033 | 800,000 | 816,021 |
"OG", Series 2889, 5.0%, 5/15/2033 | 685,000 | 698,229 |
"PE", Series 2898, 5.0%, 5/15/2033 | 335,000 | 341,515 |
"PD", Series 2939, 5.0%, 7/15/2033 | 535,000 | 543,582 |
"KG", Series 2987, 5.0%, 12/15/2034 | 1,470,000 | 1,488,632 |
Federal National Mortgage Association: | | |
"EG", Series 2005-22, 5.0%, 11/25/2033 | 750,000 | 761,479 |
"WD", Series 2005-86, 5.0%, 3/25/2034 | 1,525,000 | 1,550,845 |
"PG", Series 2002-3, 5.5%, 2/25/2017 | 424,841 | 434,090 |
"TC", Series 2007-77, 5.5%, 9/25/2034 | 370,000 | 380,162 |
"ZQ", Series G92-9, 7.0%, 12/25/2021 | 19,200 | 19,211 |
Total Collateralized Mortgage Obligations (Cost $11,256,691) | 11,677,246 |
|
Government & Agency Obligations 12.0% |
Sovereign Bonds 2.0% |
Dominican Republic, REG S, 8.625%, 4/20/2027 | 200,000 | 102,000 |
Government of Indonesia: | | |
REG S, 8.5%, 10/12/2035 | 100,000 | 83,912 |
Series FR-49, 9.0%,
9/15/2013 IDR | 700,000,000 | 56,344 |
Series FR-23, 11.0%,
12/15/2012 IDR | 1,600,000,000 | 141,885 |
Series FR-18, 13.175%, 7/15/2012 IDR | 270,000,000 | 25,462 |
Series FR-16, 13.45%,
8/15/2011 IDR | 480,000,000 | 45,188 |
Government of Ukraine,
REG S, 6.75%, 11/14/2017 | 390,000 | 142,754 |
Mexican Bonds: | | |
Series A, 6.05%, 1/11/2040 | 90,000 | 87,300 |
Series M-10, 7.25%,
12/15/2016 MXN | 800,000 | 55,359 |
Series M-20, 10.0%,
12/5/2024 MXN | 700,000 | 58,063 |
Series M-30, 10.0%,
11/20/2036 MXN | 1,700,000 | 144,755 |
| Principal Amount ($)(a) | Value ($) |
| |
Nota do Tesouro Nacional,
10.0%, 1/1/2017 BRL | 810,000 | 303,096 |
Republic of Argentina: | | |
GDP Linked Note,
12/15/2035 | 410,000 | 9,835 |
3.0%*, 4/30/2013 | 43,750 | 23,577 |
Series X, 7.0%, 4/17/2017 | 260,000 | 90,249 |
Republic of Egypt, 9.1%,
9/20/2012 EGP | 230,000 | 38,818 |
Republic of El Salvador: | | |
REG S, 7.65%, 6/15/2035 | 90,000 | 57,600 |
REG S, 8.25%, 4/10/2032 | 40,000 | 26,000 |
Republic of Georgia, 7.5%, 4/15/2013 | 170,000 | 98,812 |
Republic of Panama: | | |
6.7%, 1/26/2036 | 170,000 | 153,000 |
7.125%, 1/29/2026 | 220,000 | 207,350 |
7.25%, 3/15/2015 | 80,000 | 81,600 |
Republic of Philippines: | | |
7.75%, 1/14/2031 | 100,000 | 101,000 |
8.25%, 1/15/2014 | 70,000 | 72,800 |
9.0%, 2/15/2013 | 120,000 | 127,200 |
9.5%, 2/2/2030 | 60,000 | 67,200 |
Republic of Serbia, REG S,
Step-up Coupon, 3.75% to 11/1/2009, 6.75%
to 11/1/2024 | 90,000 | 54,000 |
Republic of Turkey: | | |
Series CPI, 10.0%,
2/15/2012 TRY | 190,045 | 112,045 |
16.0%, 3/7/2012 TRY | 220,000 | 139,683 |
Republic of Uruguay: | | |
7.625%, 3/21/2036 | 10,000 | 8,400 |
7.875%, 1/15/2033 (PIK) | 160,000 | 137,600 |
8.0%, 11/18/2022 | 70,000 | 64,750 |
State of Qatar, REG S, 9.75%, 6/15/2030 | 140,000 | 172,200 |
| 3,089,837 |
US Government Sponsored Agencies 0.9% |
Federal National Mortgage Association, 6.625%, 11/15/2030 (b) | 950,000 | 1,371,612 |
US Treasury Obligations 9.1% |
US Treasury Bill, 0.13%**, 6/18/2009 | 327,000 | 326,759 |
US Treasury Bonds: | | |
4.75%, 2/15/2037 | 460,000 | 640,981 |
8.125%, 8/15/2019 (b) | 5,590,000 | 8,261,847 |
US Treasury Notes: | | |
1.75%, 11/15/2011 (b) | 3,750,000 | 3,835,537 |
3.5%, 2/15/2018 | 560,000 | 619,850 |
4.5%, 4/30/2012 | 400,000 | 443,000 |
| 14,127,974 |
Total Government & Agency Obligations (Cost $18,990,198) | 18,589,423 |
|
Municipal Bonds and Notes 5.1% |
Alameda, CA, Corridor Transportation Authority Revenue, Series C, 6.6%, 10/1/2029 (c) | 525,000 | 483,903 |
Chicago, IL, Transit Authority, Transfer Tax Receipts Revenue, Series B, 6.3%, 12/1/2021 | 1,200,000 | 1,181,412 |
| Principal Amount ($)(a) | Value ($) |
| |
Florida, State Board of Education, Capital Outlay 2006, Series E, 5.0%, 6/1/2035 | 465,000 | 442,099 |
Gwinnett County, GA, Development Authority Revenue, Gwinnett Stadium Project, 6.4%, 1/1/2028 | 655,000 | 647,487 |
Jicarilla, NM, Sales & Special Tax Revenue, Apache Nation Revenue, 144A, 5.2%,
12/1/2013 | 670,000 | 684,499 |
Los Angeles, CA, Community Development Agency Tax Allocation Revenue, Adelante Eastside Project, Series C, 6.49%, 9/1/2037 (c) | 325,000 | 245,788 |
McLennan County, TX, Junior College, 5.0%, 8/15/2032 (c) | 340,000 | 320,651 |
New Jersey, Economic Development Authority Revenue, Series B, 6.5%, 11/1/2013 (c) | 860,000 | 900,067 |
Port Authority New York & New Jersey, One Hundred Fiftieth Series, 4.75%, 9/15/2016 | 930,000 | 849,034 |
Rhode Island, Convention Center Authority Revenue, Civic
Center, Series A, 6.06%, 5/15/2035 (c) | 515,000 | 492,664 |
Virgin Islands, Port Authority Marine Revenue, Series B, 5.08%, 9/1/2013 (c) | 1,420,000 | 1,428,222 |
Washington, Central Puget
Sound, Regional Transit Authority, Sales & Use Tax Revenue, Series A, 5.0%, 11/1/2036 | 285,000 | 267,102 |
Total Municipal Bonds and Notes (Cost $8,179,659) | 7,942,928 |
|
Loan Participations and Assignments 0.1% |
Sovereign Loans |
Gazprombank, 7.25%,
2/22/2010 RUB | 2,000,000 | 48,148 |
Russian Agricultural Bank,
REG S, 7.75%, 5/29/2018 | 100,000 | 63,732 |
Total Loan Participations and Assignments (Cost $177,519) | 111,880 |
|
Preferred Securities 2.0% |
Financials |
Bank of America Corp.: | | |
Series K, 8.0%, 1/30/2018 (d) | 390,000 | 280,522 |
Series M, 8.125%, 5/15/2018 (d) | 705,000 | 527,340 |
Citigroup Capital XXI, 8.3%, 12/21/2057 | 490,000 | 377,906 |
Citigroup, Inc., Series E, 8.4%, 4/30/2018 (d) | 628,000 | 414,662 |
ComEd Financing III, 6.35%, 3/15/2033 | 238,000 | 149,150 |
PNC Preferred Funding Trust I, 144A, 8.7%, 3/15/2013 (d) | 700,000 | 517,433 |
Royal Bank of Scotland Group PLC: | | |
144A, 6.99%, 10/5/2017(d) | 800,000 | 374,029 |
Series U, 7.64%, 9/29/2017 (d) | 1,000,000 | 398,284 |
Total Preferred Securities (Cost $4,236,666) | 3,039,326 |
|
Shares
| Value ($) |
| |
Preferred Stocks 0.2% |
Financials |
XL Capital Ltd., Series C, 6.102% | 21,600 | 220,679 |
Ford Motor Credit Co., LLC, 7.375% | 1,180 | 12,744 |
Total Preferred Stocks (Cost $552,242) | 233,423 |
|
Securities Lending Collateral 8.0% |
Daily Assets Fund Institutional, 1.69% (e) (f) (Cost $12,381,645) | 12,381,645 | 12,381,645 |
| Shares | Value ($) |
| |
Cash Equivalents 5.8% |
Cash Management QP Trust, 1.42% (e) (Cost $8,910,588) | 8,910,588 | 8,910,588 |
| % of Net Assets | Value ($) |
| |
Total Investment Portfolio (Cost $194,531,530)+ | 107.3 | 166,050,202 |
Other Assets and Liabilities, Net | (7.3) | (11,226,690) |
Net Assets | 100.0 | 154,823,512 |
* Floating rate notes are securities whose yields vary with a designated market index or market rate, such as the coupon-equivalent of the US Treasury bill rate. These securities are shown at their current rate as of December 31, 2008.** Annualized yield at time of purchase; not a coupon rate.+ The cost for federal income tax purposes was $194,554,381. At December 31, 2008, net unrealized depreciation for all securities based on tax cost was $28,504,179. This consisted of aggregate gross unrealized appreciation for all securities in which there was an excess of value over tax cost of $3,482,477 and aggregate gross unrealized depreciation for all securities in which there was an excess of tax cost over value of $31,986,656.(a) Principal amount stated in US dollars unless otherwise noted.(b) All or a portion of these securities were on loan (see Notes to Financial Statements). The value of all securities loaned at December 31, 2008 amounted to $11,972,348, which is 7.7% of net assets.(c) Bond is insured by one of these companies:Insurance Coverage | As a % of Total Investment Portfolio |
Assured Guaranty Corp.
| 0.5 |
Financial Guaranty Insurance Co.
| 1.4 |
MBIA Corp.
| 0.3 |
Radian
| 0.1 |
(d) Date shown is call date; not a maturity date for the perpetual preferred securities.(e) Affiliated fund managed by Deutsche Investment Management Americas Inc. The rate shown is the annualized seven-day yield at period end.(f) Represents collateral held in connection with securities lending. Income earned by the Portfolio is net of borrower rebates.144A: Security exempt from registration under Rule 144A of the Securities Act of 1933. These securities may be resold in transactions exempt from registration, normally to qualified institutional buyers.
PIK: Denotes that all or a portion of the income is paid in kind.
REG S: Securities sold under Regulation S may not be offered, sold or delivered within the United States or to, or for the account or benefit of, US persons, except pursuant to an exemption from, or in a transaction not subject to, the registration requirements of the Securities Act of 1933.
REIT: Real Estate Investment Trust
As of December 31, 2008, the Portfolio had the following open forward foreign currency exchange contracts:
Contracts to Deliver | | In Exchange For | | Settlement Date | | Unrealized Appreciation ($) |
JPY
| 623,043 |
| AUD
| 11,000 |
| 1/23/2009 |
| 324 |
AUD
| 38,551 |
| JPY
| 2,553,509 |
| 1/23/2009 |
| 1,937 |
RUB
| 2,607,000 |
| USD
| 89,297 |
| 1/23/2009 |
| 7,271 |
NZD
| 351,000 |
| USD
| 213,837 |
| 1/23/2009 |
| 9,494 |
USD
| 398,069 |
| NZD
| 729,000 |
| 1/23/2009 |
| 26,336 |
TRY
| 278,000 |
| USD
| 195,651 |
| 1/23/2009 |
| 17,203 |
MXN
| 1,622,000 |
| USD
| 134,803 |
| 1/23/2009 |
| 18,657 |
USD
| 233,775 |
| EUR
| 184,000 |
| 1/23/2009 |
| 21,721 |
Total unrealized appreciation | 102,943 |
Contracts to Deliver | | In Exchange For | | Settlement Date | | Unrealized Depreciation ($) |
USD
| 275,234 |
| NOK
| 1,689,000 |
| 1/23/2009 |
| (34,459) |
USD
| 80,185 |
| UAH
| 416,000 |
| 1/23/2009 |
| (26,810) |
AUD
| 349,000 |
| USD
| 226,569 |
| 1/23/2009 |
| (16,106) |
BRL
| 338,000 |
| USD
| 134,324 |
| 1/23/2009 |
| (9,256) |
EUR
| 184,000 |
| USD
| 251,473 |
| 1/23/2009 |
| (4,022) |
USD
| 214,682 |
| AUD
| 305,000 |
| 1/23/2009 |
| (2,603) |
IDR
| 845,167,000 |
| USD
| 74,333 |
| 1/23/2009 |
| (2,130) |
JPY
| 2,163,509 |
| USD
| 22,690 |
| 1/23/2009 |
| (1,188) |
USD
| 23,182 |
| AUD
| 33,000 |
| 1/23/2009 |
| (866) |
NZD
| 378,000 |
| USD
| 219,494 |
| 1/23/2009 |
| (568) |
JPY
| 390,000 |
| USD
| 3,852 |
| 1/23/2009 |
| (453) |
NOK
| 1,689,000 |
| USD
| 240,489 |
| 1/23/2009 |
| (286) |
Total unrealized depreciation | (98,747) |
Currency Abbreviations |
AUD Australian Dollar
BRL Brazilian Real
EGP Egyptian Pound
EUR Euro
IDR Indonesian Rupiah
JPY Japanese Yen
MXN Mexican Peso
NOK Norwegian Krone
NZD New Zealand Dollar
RUB Russian Ruble
TRY Turkish Lira
UAH Ukraine Hryvna
USD United States Dollar
|
Included in the portfolio are investments in mortgage or asset-backed securities which are interests in separate pools of mortgages or assets. Effective maturities of these investments may be shorter than stated maturities due to prepayments. Some separate investments in the Federal National Mortgage Association and Federal Home Loan Mortgage Corp. issues have similar coupon rates and have been aggregated for presentation purposes in the investment portfolio.
Fair Value Measurements
The following is a summary of the inputs used as of December 31, 2008 in valuing the Portfolio's investments. For information on the Portfolio's policy regarding the valuation of investments and of the valuation inputs, and the aggregate levels used in the tables below, please refer to the Security Valuation section of Note A in the accompanying Notes to the Financial Statements.
Valuation Inputs | Investments in Securities | Other Financial Instruments++ |
Level 1
| $ 12,394,389 | $ — |
Level 2
| 153,306,176 | 4,196 |
Level 3
| 349,637 | — |
Total | $ 166,050,202 | $ 4,196 |
++ Other financial instruments are derivative instruments not reflected in the Investment Portfolio, such as forward foreign currency exchange contracts, which are valued at the unrealized appreciation (depreciation) on the instrument.The following is a reconciliation of the Portfolio's Level 3 investments for which significant unobservable inputs were used in determining value at December 31, 2008:
| Investments in Securities |
Balance as of January 1, 2008 | $ 1,298,669 |
Total realized gain (loss)
| (131,401) |
Change in unrealized appreciation (depreciation)
| (481,826) |
Amortization Premium/Discount
| (930) |
Net purchases (sales)
| (334,875) |
Net transfers in (out) of Level 3
| — |
Balance as of December 31, 2008 | $ 349,637 |
The accompanying notes are an integral part of the financial statements.
Financial Statements
Statement of Assets and Liabilities as of December 31, 2008
|
Assets |
Investments:
Investments in securities, at value (cost $173,239,297), including $11,972,348 of securities loaned | $ 144,757,969 |
Investment in Daily Assets Fund Institutional (cost $12,381,645)* | 12,381,645 |
Investment in Cash Management QP Trust (cost $8,910,588) | 8,910,588 |
Total investments, at value (cost $194,531,530)
| 166,050,202 |
Cash
| 9,960 |
Foreign currency, at value (cost $49,360)
| 49,043 |
Receivable for investments sold
| 329,776 |
Dividends receivable
| 563 |
Interest receivable
| 1,515,002 |
Receivable for Portfolio shares sold
| 5,909 |
Foreign taxes recoverable
| 6,132 |
Net receivable on closed forward foreign currency exchange contracts
| 13,927 |
Unrealized appreciation on open forward foreign currency exchange contracts
| 102,943 |
Other assets
| 5,559 |
Total assets
| 168,089,016 |
Liabilities |
Payable for Portfolio shares redeemed
| 626,892 |
Payable upon return of securities loaned
| 12,381,645 |
Unrealized depreciation on open forward foreign currency exchange contracts
| 98,747 |
Accrued management fee
| 47,703 |
Other accrued expenses and payables
| 110,517 |
Total liabilities
| 13,265,504 |
Net assets, at value | $ 154,823,512 |
Net Assets Consist of |
Undistributed net investment income
| 11,846,280 |
Net unrealized appreciation (depreciation) on:
Investments | (28,481,328) |
Foreign currency | 2,245 |
Accumulated net realized gain (loss)
| (21,419,194) |
Paid-in capital
| 192,875,509 |
Net assets, at value | $ 154,823,512 |
Class A Net Asset Value, offering and redemption price per share ($154,823,512 ÷ 28,147,936 outstanding shares of beneficial interest, no par value, unlimited number of shares authorized)
| $ 5.50 |
* Represents collateral on securities loaned.The accompanying notes are an integral part of the financial statements.
Statement of Operations for the year ended December 31, 2008
|
Investment Income |
Dividends
| $ 40,393 |
Interest (net of foreign taxes withheld of $2,141)
| 12,376,086 |
Interest — Cash Management QP Trust
| 132,373 |
Securities lending income, including income from Daily Assets Fund Institutional, net of borrower rebates
| 191,513 |
Total Income
| 12,740,365 |
Expenses:
Management fee
| 782,296 |
Administration fee
| 200,589 |
Custodian fee
| 41,210 |
Distribution service fee (Class B)
| 506 |
Services to shareholders
| 1,629 |
Record keeping fee (Class B)
| 202 |
Professional fees
| 85,778 |
Trustees' fees and expenses
| 6,830 |
Reports to shareholders
| 41,760 |
Other
| 33,183 |
Total expenses before expense reductions
| 1,193,983 |
Expense reductions
| (1,769) |
Total expenses after expense reductions
| 1,192,214 |
Net investment income | 11,548,151 |
Realized and Unrealized Gain (Loss) |
Net realized gain (loss) from:
Investments (net of foreign taxes of $1,058)
| (20,123,676) |
Futures
| 226,776 |
Foreign currency
| 331,617 |
Payments by affiliates (see Note H)
| 221 |
| (19,565,062) |
Change in net unrealized appreciation (depreciation) on:
Investments
| (26,247,691) |
Foreign currency
| (35,300) |
| (26,282,991) |
Net gain (loss) | (45,848,053) |
Net increase (decrease) in net assets resulting from operations | $ (34,299,902) |
The accompanying notes are an integral part of the financial statements.
Statement of Changes in Net Assets |
| Years Ended December 31, |
Increase (Decrease) in Net Assets | 2008 | 2007 |
Operations:
Net investment income
| $ 11,548,151 | $ 11,251,529 |
Net realized gain (loss)
| (19,565,062) | (121,794) |
Change in net unrealized appreciation (depreciation)
| (26,282,991) | (1,978,095) |
Net increase (decrease) in net assets resulting from operations
| (34,299,902) | 9,151,640 |
Distributions to shareholders from:
Net investment income:
Class A | (10,882,399) | (10,313,794) |
Class B | (31,809) | (83,297) |
Total distributions
| (10,914,208) | (10,397,091) |
Portfolio share transactions:
Class A Proceeds from shares sold
| 21,447,131 | 38,092,545 |
Reinvestment of distributions
| 10,882,399 | 10,313,794 |
Cost of shares redeemed
| (61,233,965) | (36,534,184) |
Net increase (decrease) in net assets from Class A share transactions
| (28,904,435) | 11,872,155 |
Class B* Proceeds from shares sold
| 292,257 | 1,299,403 |
Reinvestment of distributions
| 31,809 | 83,297 |
Cost of shares redeemed
| (890,260) | (2,108,764) |
Net increase (decrease) in net assets from Class B share transactions
| (566,194) | (726,064) |
Increase (decrease) in net assets | (74,684,739) | 9,900,640 |
Net assets at beginning of period
| 229,508,251 | 219,607,611 |
Net assets at end of period (including undistributed net investment income of $11,846,280 and $10,802,062, respectively)
| $ 154,823,512 | $ 229,508,251 |
Other Information |
Class A Shares outstanding at beginning of period
| 32,791,859 | 31,026,023 |
Shares sold
| 3,262,319 | 5,515,644 |
Shares issued to shareholders in reinvestment of distributions
| 1,674,215 | 1,510,072 |
Shares redeemed
| (9,580,457) | (5,259,880) |
Net increase (decrease) in Class A shares
| (4,643,923) | 1,765,836 |
Shares outstanding at end of period
| 28,147,936 | 32,791,859 |
Class B* Shares outstanding at beginning of period
| 87,887 | 198,161 |
Shares sold
| 42,354 | 183,436 |
Shares issued to shareholders in reinvestment of distributions
| 4,894 | 12,196 |
Shares redeemed
| (135,135) | (305,906) |
Net increase (decrease) in Class B shares
| (87,887) | (110,274) |
Shares outstanding at end of period
| — | 87,887 |
* On May 22, 2008 Class B shares were liquidated.The accompanying notes are an integral part of the financial statements.
Financial Highlights
Class A Years Ended December 31, | 2008 | 2007 | 2006 | 2005 | 2004 |
Selected Per Share Data |
Net asset value, beginning of period | $ 6.98 | $ 7.03 | $ 6.99 | $ 7.13 | $ 7.04 |
Income (loss) from investment operations: Net investment incomea | .37 | .35 | .33 | .29 | .29 |
Net realized and unrealized gain (loss) | (1.48) | (.06) | (.01) | (.10) | .08 |
Total from investment operations | (1.11) | .29 | .32 | .19 | .37 |
Less distributions from: Net investment income | (.37) | (.34) | (.27) | (.26) | (.28) |
Net realized gains | — | — | (.01) | (.07) | — |
Total distributions | (.37) | (.34) | (.28) | (.33) | (.28) |
Net asset value, end of period | $ 5.50 | $ 6.98 | $ 7.03 | $ 6.99 | $ 7.13 |
Total Return (%)
| (16.77) | 4.18 | 4.72b | 2.60 | 5.38 |
Ratios to Average Net Assets and Supplemental Data |
Net assets, end of period ($ millions)
| 155 | 229 | 218 | 209 | 177 |
Ratio of expenses before expense reductions (%)
| .59 | .61 | .66 | .68 | .60 |
Ratio of expenses after expense reductions (%)
| .59 | .61 | .62 | .68 | .60 |
Ratio of net investment income (%)
| 5.76 | 5.03 | 4.82 | 4.11 | 4.18 |
Portfolio turnover rate (%)
| 196 | 185 | 186 | 197 | 245 |
a Based on average shares outstanding during the period.
b Total return would have been lower had certain expenses not been reduced.
|
Performance Summary December 31, 2008
DWS Growth & Income VIP
All performance shown is historical, assumes reinvestment of all dividend and capital gain distributions, and does not guarantee future results. Investment return and principal value fluctuate with changing market conditions so that, when redeemed, shares may be worth more or less than their original cost. Current performance may be lower or higher than the performance data quoted. Please contact your participating insurance company for the Portfolio's most recent month-end performance. Performance doesn't reflect charges and fees ("contract charges") associated with the separate account that invests in the Portfolio or any variable life insurance policy or variable annuity contract for which the Portfolio is an investment option. These charges and fees will reduce returns. While all share classes have the same underlying portfolio, their performance will differ.
The total annual portfolio operating expense ratios, gross of any fee waivers or expense reimbursements, as stated in the fee table of the prospectus dated May 1, 2008 are 0.54% and 0.79% for Class A and Class B shares, respectively. Please see the Information About Your Portfolio's Expenses, the Financial Highlights and Notes to the Financial Statements (Note C, Related Parties) sections of this report for gross and net expense related disclosure for the period ended December 31, 2008.
Portfolio returns during all periods shown reflect a fee waiver and/or expense reimbursement. Without this waiver/reimbursement, returns would have been lower.
Risk Considerations
The Portfolio is subject to stock market risk, meaning stocks in the Portfolio may decline in value for extended periods of time due to the activities and financial prospects of individual companies, or due to general market and economic conditions. Please read this Portfolio's prospectus for specific information regarding its investments and risk profile.
Growth of an Assumed $10,000 Investment |
[] DWS Growth & Income VIP — Class A [] Russell 1000 ® Index | The Russell 1000® Index is an unmanaged index that measures the performance of the 1,000 largest companies in the Russell 3000 Index, which represents approximately 92% of the total market capitalization of the Russell 3000 Index. Index returns assume the reinvestment of dividends and, unlike portfolio returns, do not reflect any fees or expenses. It is not possible to invest directly into an index. |
 | |
Yearly periods ended December 31 |
|
Comparative Results |
DWS Growth & Income VIP | 1-Year | 3-Year | 5-Year | 10-Year |
Class A | Growth of $10,000
| $6,169 | $7,105 | $8,301 | $7,431 |
Average annual total return
| -38.31% | -10.77% | -3.65% | -2.93% |
Russell 1000 Index
| Growth of $10,000
| $6,240 | $7,621 | $9,022 | $8,963 |
Average annual total return
| -37.60% | -8.66% | -2.04% | -1.09% |
DWS Growth & Income VIP | 1-Year | 3-Year | 5-Year | 10-Year |
Class B | Growth of $10,000
| $6,171 | $7,060 | $8,195 | $7,238 |
Average annual total return
| -38.29% | -10.95% | -3.90% | -3.18% |
Russell 1000 Index
| Growth of $10,000
| $6,240 | $7,621 | $9,022 | $8,963 |
Average annual total return
| -37.60% | -8.66% | -2.04% | -1.09% |
The growth of $10,000 is cumulative.
Information About Your Portfolio's Expenses
DWS Growth & Income VIP
As an investor of the Portfolio, you incur two types of costs: ongoing expenses and transaction costs. Ongoing expenses include management fees, distribution and service (12b-1) fees and other Portfolio expenses. Examples of transaction costs include contract charges, redemption fees and account maintenance fees, which are not shown in this section. The following tables are intended to help you understand your ongoing expenses (in dollars) of investing in the Portfolio and to help you compare these expenses with the ongoing expenses of investing in other mutual funds. In the most recent six-month period, the Portfolio limited these expenses; had it not done so, expenses would have been higher. The example in the table is based on an investment of $1,000 invested at the beginning of the six-month period and held for the entire period (July 1, 2008 to December 31, 2008).
The tables illustrate your Portfolio's expenses in two ways:
• Actual Portfolio Return. This helps you estimate the actual dollar amount of ongoing expenses (but not transaction costs) paid on a $1,000 investment in the Portfolio using the Portfolio's actual return during the period. To estimate the expenses you paid over the period, simply divide your account value by $1,000 (for example, an $8,600 account value divided by $1,000 = 8.6), then multiply the result by the number in the "Expenses Paid per $1,000" line under the share class you hold.
• Hypothetical 5% Portfolio Return. This helps you to compare your Portfolio's ongoing expenses (but not transaction costs) with those of other mutual funds using the Portfolio's actual expense ratio and a hypothetical rate of return of 5% per year before expenses. Examples using a 5% hypothetical Portfolio return may be found in the shareholder reports of other mutual funds. The hypothetical account values and expenses may not be used to estimate the actual ending account balance or expenses you paid for the period.
Please note that the expenses shown in these tables are meant to highlight your ongoing expenses only and do not reflect any transaction costs. The "Expenses Paid per $1,000" line of the tables is useful in comparing ongoing expenses only and will not help you determine the relative total expense of owning different funds. If these transaction costs had been included, your costs would have been higher.
Expenses and Value of a $1,000 Investment for the six months ended December 31, 2008 |
Actual Portfolio Return | Class A | | Class B | |
Beginning Account Value 7/1/08
| $ 1,000.00 | | $ 1,000.00 | |
Ending Account Value 12/31/08
| $ 691.90 | | $ 693.80 | |
Expenses Paid per $1,000*
| $ 2.30 | | $ 2.90 | |
Hypothetical 5% Portfolio Return | Class A | | Class B | |
Beginning Account Value 7/1/08
| $ 1,000.00 | | $ 1,000.00 | |
Ending Account Value 12/31/08
| $ 1,022.42 | | $ 1,021.72 | |
Expenses Paid per $1,000*
| $ 2.75 | | $ 3.46 | |
* Expenses are equal to the Portfolio's annualized expense ratio for each share class, multiplied by the average account value over the period, multiplied by the number of days in the most recent six-month period, then divided by 366.Annualized Expense Ratios | Class A | | Class B | |
DWS Variable Series I — DWS Growth & Income VIP
| .54% | | .68% | |
For more information, please refer to the Portfolio's prospectus.
These tables do not reflect charges and fees ("contract charges") associated with the separate account that invests in the Portfolio or any variable life insurance policy or variable annuity contract for which the Portfolio is an investment option.
Management Summary December 31, 2008
DWS Growth & Income VIP
The year just ended was the worst in many decades for the US equity markets. Essentially all equity indices posted negative returns for this period, as markets reflected economic problems including a housing slump, rising unemployment, a crisis of confidence and an extreme credit crunch. The Russell 3000® Index, which is generally regarded as a good indicator of the broad stock market, had a negative return of -37.31% for the 12 months ended December 31, 2008. With a return of -38.31% during the period ended December 31, 2008 (Class A shares, unadjusted for contract charges), the Portfolio's return was in line with that of the Russell 1000® Index, which posted a return of -37.60%.
Contributors to the Portfolio's relative performance were underweights and stock selection in the financials and consumer discretionary sectors.1 In the financials sector, the Portfolio's performance benefited from not owning many of the worst-performing stocks. In the consumer discretionary sector, performance benefited from overweight positions in The DIRECTV Group, Inc., AutoZone, Inc. and McDonald's Corp.
A detractor from the Portfolio's relative performance was stock selection in the energy and materials sectors. In the energy sector, performance was hurt by an underweight position in ExxonMobil Corp., which was down less than the sector, and by overweights in coal producers Walter Industries, Inc. and Massey Energy Co. In the materials sector, overweight positions in Terra Industries Inc. and CF Industries Holdings Inc., both of which produce fertilizer and other agricultural products, detracted from performance.
Robert Wang James B. Francis, CFA
Julie Abbett
Portfolio Managers
The Russell 3000 Index is an unmanaged index that measures the performance of the 3,000 largest US companies based on total market capitalization, which represents approximately 98% of the investable US equity market.
The Russell 1000 Index is an unmanaged index that measures the performance of the 1,000 largest companies in the Russell 3000 Index, which represents approximately 92% of the total market capitalization of the Russell 3000 Index.
Index returns assume the reinvestment of dividends and, unlike portfolio returns, do not reflect any fees or expenses. It is not possible to invest directly into an index.
1 "Overweight" means the portfolio holds a higher weighting in a given sector or security than the benchmark. "Underweight" means the portfolio holds a lower weighting.Portfolio management market commentary is as of December 31, 2008, and may not come to pass. This information is subject to change at any time based on market and other conditions. Past performance does not guarantee future results. Current and future portfolio holdings are subject to risk.
Portfolio Summary
DWS Growth & Income VIP
Asset Allocation (As a % of Investment Portfolio Excluding Securities Lending Collateral) | 12/31/08 | 12/31/07 |
| | |
Common Stocks | 97% | 97% |
Cash Equivalents | 2% | 3% |
Government & Agency Obligation | 1% | — |
| 100% | 100% |
Sector Diversification (As a % of Common Stocks) | 12/31/08 | 12/31/07 |
| | |
Health Care | 16% | 14% |
Information Technology | 16% | 15% |
Industrials | 14% | 13% |
Consumer Staples | 13% | 9% |
Energy | 12% | 14% |
Financials | 11% | 15% |
Consumer Discretionary | 10% | 11% |
Telecommunication Services | 4% | 4% |
Materials | 2% | 3% |
Utilities | 2% | 2% |
| 100% | 100% |
Asset allocation and sector diversification are subject to change.
For more complete details about the Portfolio's investment portfolio, see page 28. A complete list of portfolio holdings of the Portfolio is posted as of the month end on www.dws-investments.com on or about the 15th day of the following month. More frequent posting of portfolio holdings information may be made from time to time on www.dws-investments.com.
Following the Portfolio's fiscal first and third quarter-end, a complete portfolio holdings listing is filed with the SEC on Form N-Q. The form will be available on the SEC's Web site at www.sec.gov, and it also may be reviewed and copied at the SEC's Public Reference Room in Washington, D.C. Information on the operation of the SEC's Public Reference Room may be obtained by calling (800) SEC-0330.
Investment Portfolio December 31, 2008
DWS Growth & Income VIP
| Shares | Value ($) |
| |
Common Stocks 97.0% |
Consumer Discretionary 9.6% |
Auto Components 0.1% |
Autoliv, Inc. | 2,700 | 57,942 |
Lear Corp.* | 20,300 | 28,623 |
| 86,565 |
Hotels Restaurants & Leisure 1.7% |
McDonald's Corp. | 19,800 | 1,231,362 |
Yum! Brands, Inc. | 13,500 | 425,250 |
| 1,656,612 |
Household Durables 0.2% |
Leggett & Platt, Inc. | 15,800 | 240,002 |
Internet & Catalog Retail 0.3% |
Amazon.com, Inc.* | 5,800 | 297,424 |
Leisure Equipment & Products 0.2% |
Hasbro, Inc. | 7,000 | 204,190 |
Media 3.6% |
Comcast Corp. "A" | 91,900 | 1,551,272 |
Comcast Corp., Special "A" | 24,500 | 395,675 |
DISH Network Corp. "A"* | 17,700 | 196,293 |
Liberty Media Corp. Entertainment "A"* | 7,100 | 124,108 |
The DIRECTV Group, Inc.* | 51,100 | 1,170,701 |
| 3,438,049 |
Specialty Retail 3.4% |
AutoZone, Inc.* | 6,100 | 850,767 |
Best Buy Co., Inc. (a) | 27,500 | 773,025 |
Children's Place Retail Stores, Inc.* | 2,800 | 60,704 |
RadioShack Corp. | 27,000 | 322,380 |
Rent-A-Center, Inc.* | 6,000 | 105,900 |
The Gap, Inc. | 30,000 | 401,700 |
TJX Companies, Inc. | 35,200 | 724,064 |
| 3,238,540 |
Textiles, Apparel & Luxury Goods 0.1% |
Quiksilver, Inc.* | 16,100 | 29,624 |
Wolverine World Wide, Inc. | 2,900 | 61,016 |
| 90,640 |
Consumer Staples 12.7% |
Beverages 1.5% |
Pepsi Bottling Group, Inc. | 9,100 | 204,841 |
PepsiCo, Inc. | 21,900 | 1,199,463 |
| 1,404,304 |
Food & Staples Retailing 3.9% |
Kroger Co. | 49,300 | 1,302,013 |
Pantry, Inc.* | 1,400 | 30,030 |
Sysco Corp. | 12,500 | 286,750 |
Wal-Mart Stores, Inc. | 39,000 | 2,186,340 |
| 3,805,133 |
Food Products 1.6% |
Archer-Daniels-Midland Co. | 6,800 | 196,044 |
Bunge Ltd. | 4,900 | 253,673 |
Chiquita Brands International, Inc.* | 13,300 | 196,574 |
Darling International, Inc.* | 9,200 | 50,508 |
Fresh Del Monte Produce, Inc.* | 9,900 | 221,958 |
| Shares | Value ($) |
| |
General Mills, Inc. | 10,700 | 650,025 |
| 1,568,782 |
Household Products 3.6% |
Church & Dwight Co., Inc. | 1,700 | 95,404 |
Colgate-Palmolive Co. | 27,400 | 1,877,996 |
Procter & Gamble Co. | 23,500 | 1,452,770 |
| 3,426,170 |
Personal Products 0.2% |
Herbalife Ltd. (a) | 7,800 | 169,104 |
Tobacco 1.9% |
Altria Group, Inc. | 50,520 | 760,831 |
Philip Morris International, Inc. | 24,700 | 1,074,697 |
| 1,835,528 |
Energy 11.1% |
Oil, Gas & Consumable Fuels |
Alpha Natural Resources, Inc.* | 10,700 | 173,233 |
Apache Corp. | 23,400 | 1,744,002 |
Arch Coal, Inc. | 18,200 | 296,478 |
Chevron Corp. | 9,700 | 717,509 |
Cimarex Energy Co. | 16,600 | 444,548 |
ConocoPhillips | 4,700 | 243,460 |
Encore Acquisition Co.* | 21,200 | 541,024 |
ExxonMobil Corp. | 7,739 | 617,804 |
Frontline Ltd. (a) | 27,300 | 808,353 |
Hess Corp. | 27,600 | 1,480,464 |
Mariner Energy, Inc.* | 22,400 | 228,480 |
Massey Energy Co. | 24,400 | 336,476 |
McMoRan Exploration Co.* (a) | 27,500 | 269,500 |
Occidental Petroleum Corp. | 31,400 | 1,883,686 |
W&T Offshore, Inc. | 17,800 | 254,896 |
Walter Industries, Inc. | 39,800 | 696,898 |
| 10,736,811 |
Financials 11.1% |
Capital Markets 2.3% |
Bank of New York Mellon Corp. | 56,000 | 1,586,480 |
State Street Corp. | 16,100 | 633,213 |
| 2,219,693 |
Commercial Banks 2.1% |
Banco Itau Holding Financeira SA (ADR) (Preferred) | 24,100 | 279,560 |
Unibanco — Uniao de Bancos Brasileiros SA (ADR) | 6,100 | 394,182 |
Wells Fargo & Co. | 44,800 | 1,320,704 |
| 1,994,446 |
Consumer Finance 0.1% |
Cash America International, Inc. | 2,300 | 62,905 |
Diversified Financial Services 2.2% |
JPMorgan Chase & Co. | 68,800 | 2,169,264 |
Insurance 4.0% |
ACE Ltd. | 32,100 | 1,698,732 |
Aflac, Inc. | 5,600 | 256,704 |
Allied World Assurance Co. Holdings Ltd. | 2,200 | 89,320 |
Aon Corp. | 7,200 | 328,896 |
Arch Capital Group Ltd.* | 1,100 | 77,110 |
Arthur J. Gallagher & Co. | 2,600 | 67,366 |
| Shares | Value ($) |
| |
Assurant, Inc. | 3,700 | 111,000 |
Berkshire Hathaway, Inc. "B"* | 200 | 642,800 |
The Travelers Companies, Inc. | 6,700 | 302,840 |
Unum Group | 4,500 | 83,700 |
XL Capital Ltd. "A" (a) | 51,100 | 189,070 |
| 3,847,538 |
Real Estate Investment Trusts 0.4% |
Boston Properties, Inc. (REIT) | 1,600 | 88,000 |
Essex Property Trust, Inc. (REIT) | 1,800 | 138,150 |
Rayonier, Inc. (REIT) (a) | 3,700 | 115,995 |
Simon Property Group, Inc. (REIT) | 1,600 | 85,008 |
| 427,153 |
Health Care 16.1% |
Biotechnology 2.7% |
Amgen, Inc.* | 2,200 | 127,050 |
Gilead Sciences, Inc.* | 35,700 | 1,825,698 |
OSI Pharmaceuticals, Inc.* | 15,700 | 613,085 |
| 2,565,833 |
Health Care Equipment & Supplies 2.8% |
Baxter International, Inc. | 26,200 | 1,404,058 |
Becton, Dickinson & Co. | 14,200 | 971,138 |
Covidien Ltd. | 6,000 | 217,440 |
Kinetic Concepts, Inc.* | 2,600 | 49,868 |
Varian Medical Systems, Inc.* | 1,300 | 45,552 |
| 2,688,056 |
Health Care Providers & Services 4.5% |
Aetna, Inc. | 53,400 | 1,521,900 |
Express Scripts, Inc.* | 24,500 | 1,347,010 |
Humana, Inc.* | 13,400 | 499,552 |
Kindred Healthcare, Inc.* | 5,400 | 70,308 |
Magellan Health Services, Inc.* | 700 | 27,412 |
Medco Health Solutions, Inc.* | 20,500 | 859,155 |
Universal Health Services, Inc. "B" | 1,600 | 60,112 |
| 4,385,449 |
Pharmaceuticals 6.1% |
Abbott Laboratories | 13,200 | 704,484 |
Eli Lilly & Co. | 43,000 | 1,731,610 |
Johnson & Johnson | 11,700 | 700,011 |
Merck & Co., Inc. | 25,000 | 760,000 |
Perrigo Co. | 1,100 | 35,541 |
Pfizer, Inc. | 28,700 | 508,277 |
Schering-Plough Corp. | 72,500 | 1,234,675 |
Sepracor, Inc.* | 6,900 | 75,762 |
Teva Pharmaceutical Industries Ltd. (ADR) | 3,500 | 148,995 |
| 5,899,355 |
Industrials 13.3% |
Aerospace & Defense 3.4% |
General Dynamics Corp. | 9,900 | 570,141 |
Goodrich Corp. | 9,900 | 366,498 |
Honeywell International, Inc. | 41,520 | 1,363,102 |
L-3 Communications Holdings, Inc. | 6,500 | 479,570 |
Lockheed Martin Corp. | 2,600 | 218,608 |
Northrop Grumman Corp. | 5,200 | 234,208 |
Spirit AeroSystems Holdings, Inc. "A"* | 3,700 | 37,629 |
| 3,269,756 |
Commercial Services & Supplies 0.3% |
The Brink's Co. | 10,400 | 279,552 |
| Shares | Value ($) |
| |
Construction & Engineering 1.5% |
Chicago Bridge & Iron Co. NV (NY Registered Shares) | 3,000 | 30,150 |
EMCOR Group, Inc.* | 16,400 | 367,852 |
Fluor Corp. | 11,400 | 511,518 |
Foster Wheeler Ltd.* | 15,300 | 357,714 |
Perini Corp.* | 9,500 | 222,110 |
| 1,489,344 |
Electrical Equipment 1.1% |
Acuity Brands, Inc. | 1,400 | 48,874 |
Energy Conversion Devices, Inc.* | 11,800 | 297,478 |
GrafTech International Ltd.* | 77,100 | 641,472 |
Woodward Governor Co. | 2,100 | 48,342 |
| 1,036,166 |
Industrial Conglomerates 0.1% |
General Electric Co. | 5,450 | 88,290 |
Machinery 4.2% |
AGCO Corp.* (a) | 23,400 | 552,006 |
Caterpillar, Inc. | 24,600 | 1,098,882 |
CNH Global NV | 3,600 | 56,160 |
Cummins, Inc. | 21,200 | 566,676 |
Dover Corp. | 2,200 | 72,424 |
Flowserve Corp. | 6,500 | 334,750 |
Gardner Denver, Inc.* | 1,500 | 35,010 |
Joy Global, Inc. | 9,700 | 222,033 |
Parker Hannifin Corp. | 24,400 | 1,037,976 |
Trinity Industries, Inc. | 5,500 | 86,680 |
| 4,062,597 |
Road & Rail 2.7% |
Burlington Northern Santa Fe Corp. | 12,900 | 976,659 |
Norfolk Southern Corp. | 15,000 | 705,750 |
Ryder System, Inc. | 22,600 | 876,428 |
| 2,558,837 |
Information Technology 15.1% |
Communications Equipment 0.3% |
Cisco Systems, Inc.* | 18,500 | 301,550 |
Computers & Peripherals 6.5% |
Hewlett-Packard Co. | 54,900 | 1,992,321 |
International Business Machines Corp. | 24,500 | 2,061,920 |
Lexmark International, Inc. "A"* | 29,000 | 780,100 |
QLogic Corp.* | 38,200 | 513,408 |
Western Digital Corp.* | 82,600 | 945,770 |
| 6,293,519 |
Electronic Equipment, Instruments & Components 0.4% |
Dolby Laboratories, Inc. "A"* (a) | 3,200 | 104,832 |
Jabil Circuit, Inc. | 38,200 | 257,850 |
| 362,682 |
Internet Software & Services 1.4% |
eBay, Inc.* | 16,470 | 229,921 |
Google, Inc. "A"* | 3,520 | 1,082,928 |
Yahoo!, Inc.* | 4,200 | 51,240 |
| 1,364,089 |
IT Services 3.5% |
Accenture Ltd. "A" | 28,600 | 937,794 |
Automatic Data Processing, Inc. | 23,800 | 936,292 |
Computer Sciences Corp.* | 19,000 | 667,660 |
Visa, Inc. "A" | 16,000 | 839,200 |
| 3,380,946 |
| Shares | Value ($) |
| |
Software 3.0% |
Microsoft Corp. | 139,375 | 2,709,450 |
Symantec Corp.* | 12,230 | 165,350 |
| 2,874,800 |
Materials 2.3% |
Chemicals |
CF Industries Holdings, Inc. | 19,700 | 968,452 |
Terra Industries, Inc. | 72,700 | 1,211,909 |
The Mosaic Co. | 2,500 | 86,500 |
| 2,266,861 |
Telecommunication Services 3.9% |
Diversified Telecommunication Services |
AT&T, Inc. | 41,380 | 1,179,330 |
Embarq Corp. | 21,300 | 765,948 |
Verizon Communications, Inc. | 52,700 | 1,786,530 |
| 3,731,808 |
Utilities 1.8% |
Electric Utilities 0.6% |
Duke Energy Corp. | 2,700 | 40,527 |
Edison International | 8,200 | 263,384 |
Hawaiian Electric Industries, Inc. | 1,100 | 24,354 |
Pepco Holdings, Inc. | 5,000 | 88,800 |
Portland General Electric Co. | 1,500 | 29,205 |
Southern Co. | 3,800 | 140,600 |
| 586,870 |
Gas Utilities 0.3% |
Atmos Energy Corp. | 1,600 | 37,920 |
ONEOK, Inc. | 6,500 | 189,280 |
UGI Corp. | 1,400 | 34,188 |
| 261,388 |
| Shares | Value ($) |
| |
Independent Power Producers & Energy Traders 0.4% |
AES Corp.* | 45,600 | 375,744 |
Multi-Utilities 0.5% |
Dominion Resources, Inc. | 7,500 | 268,800 |
Integrys Energy Group, Inc. | 1,300 | 55,874 |
Sempra Energy | 2,700 | 115,101 |
TECO Energy, Inc. | 2,100 | 25,935 |
| 465,710 |
Total Common Stocks (Cost $123,483,787) | 93,508,055 |
| Principal Amount ($) | Value ($) |
| |
Government & Agency Obligation 0.7% |
US Treasury Obligation |
US Treasury Bill, 0.17%**, 1/15/2009 (b) (Cost $685,955) | 686,000 | 685,997 |
|
| Shares | Value ($) |
| |
Securities Lending Collateral 1.9% |
Daily Assets Fund Institutional, 1.69% (c) (d) (Cost $1,836,942) | 1,836,942 | 1,836,942 |
|
Cash Equivalents 2.1% |
Cash Management QP Trust, 1.42% (c) (Cost $1,992,006) | 1,992,006 | 1,992,006 |
| % of Net Assets | Value ($) |
| |
Total Investment Portfolio (Cost $127,998,690) + | 101.7 | 98,023,000 |
Other Assets and Liabilities, Net | (1.7) | (1,667,905) |
Net Assets | 100.0 | 96,355,095 |
* Non-income producing security.** Annualized yield at time of purchase; not a coupon rate.+ The cost for federal income tax purposes was $130,913,694. At December 31, 2008, net unrealized depreciation for all securities based on tax cost was $32,890,694. This consisted of aggregate gross unrealized appreciation for all securities in which there was an excess of value over tax cost of $2,992,031 and aggregate gross unrealized depreciation for all securities in which there was an excess of tax cost over value of $35,882,725.(a) All or a portion of these securities were on loan (see Notes to Financial Statements). The value of all securities loaned at December 31, 2008 amounted to $1,842,633, which is 1.9% of net assets.(b) At December 31, 2008, this security has been pledged, in whole or in part, to cover initial margin requirements for open futures contracts.(c) Affiliated fund managed by Deutsche Investment Management Americas Inc. The rate shown is the annualized seven-day yield at period end.(d) Represents collateral held in connection with securities lending. Income earned by the Portfolio is net of borrower rebates.ADR: American Depositary Receipt
REIT: Real Estate Investment Trust
At December 31, 2008, open futures contracts purchased were as follows:
Futures | Expiration Date | Contracts | Aggregated Face Value ($) | Value ($) | Unrealized Appreciation ($) |
S&P 500 Index
| 3/20/2009 | 57 | 2,523,416 | 2,565,285 | 41,869 |
Fair Value Measurements
The following is a summary of the inputs used as of December 31, 2008 in valuing the Portfolio's investments. For information on the Portfolio's policy regarding the valuation of investments and of the valuation inputs, and the aggregate levels used in the table below, please refer to the Security Valuation section of Note A in the accompanying Notes to the Financial Statements.
Valuation Inputs | Investments in Securities | Other Financial Instruments++ |
Level 1
| $ 95,344,997 | $ 41,869 |
Level 2
| 2,678,003 | — |
Level 3
| — | — |
Total | $ 98,023,000 | $ 41,869 |
++ Other financial instruments are derivative instruments not reflected in the Investment Portfolio, such as futures contracts, which are valued at the unrealized appreciation (depreciation) on the instrument.The accompanying notes are an integral part of the financial statements.
Financial Statements
Statement of Assets and Liabilities as of December 31, 2008
|
Assets |
Investments:
Investments in securities, at value (cost $124,169,742), including $1,842,633 of securities loaned | $ 94,194,052 |
Investment in Daily Assets Fund Institutional (cost $1,836,942)* | 1,836,942 |
Investment in Cash Management QP Trust (cost $1,992,006) | 1,992,006 |
Total investments, at value (cost $127,998,690)
| 98,023,000 |
Foreign currency, at value (cost $1,794)
| 1,487 |
Dividends receivable
| 146,070 |
Interest receivable
| 7,510 |
Receivable for Portfolio shares sold
| 98,945 |
Receivable for daily variation margin on open futures contracts
| 34,653 |
Other assets
| 3,793 |
Total assets
| 98,315,458 |
Liabilities |
Cash overdraft
| 2,349 |
Payable for Portfolio shares redeemed
| 20,565 |
Payable upon return of securities loaned
| 1,836,942 |
Accrued management fee
| 36,895 |
Accrued distribution service fee (Class B)
| 380 |
Other accrued expenses and payables
| 63,232 |
Total liabilities
| 1,960,363 |
Net assets, at value | $ 96,355,095 |
Net Assets Consist of |
Undistributed net investment income
| 1,938,429 |
Net unrealized appreciation (depreciation) on:
Investments | (29,975,690) |
Futures | 41,869 |
Foreign currency | (307) |
Accumulated net realized gain (loss)
| (41,101,142) |
Paid-in capital
| 165,451,936 |
Net assets, at value | $ 96,355,095 |
Class A Net Asset Value, offering and redemption price per share ($94,487,711 ÷ 18,437,278 outstanding shares of beneficial interest, no par value, unlimited number of shares authorized)
| $ 5.12 |
Class B Net Asset Value, offering and redemption price per share ($1,867,384 ÷ 364,787 outstanding shares of beneficial interest, no par value, unlimited number of shares authorized)
| $ 5.12 |
* Represents collateral on securities loaned.The accompanying notes are an integral part of the financial statements.
Statement of Operations for the year ended December 31, 2008
|
Investment Income |
Income:
Dividends (net of foreign taxes withheld of $6,028)
| $ 2,702,211 |
Interest
| 11,151 |
Interest — Cash Management QP Trust
| 109,069 |
Securities lending income, including income from Daily Assets Fund Institutional, net of borrower rebates
| 39,191 |
Total Income
| 2,861,622 |
Expenses:
Management fee
| 592,051 |
Administration fee
| 151,808 |
Custodian fee
| 25,213 |
Distribution service fee (Class B)
| 15,010 |
Services to shareholders
| 969 |
Professional fees
| 73,438 |
Trustees' fees and expenses
| 7,575 |
Reports to shareholders
| 41,438 |
Other
| 11,113 |
Total expenses before expense reductions
| 918,615 |
Expense reductions
| (84,926) |
Total expenses after expense reductions
| 833,689 |
Net investment income (loss) | 2,027,933 |
Realized and Unrealized Gain (Loss) |
Net realized gain (loss) from:
Investments
| (27,301,950) |
Futures
| (1,897,725) |
Foreign currency
| (89) |
| (29,199,764) |
Change in net unrealized appreciation (depreciation) on:
Investments
| (40,861,638) |
Futures
| 61,425 |
Foreign currency
| (319) |
| (40,800,532) |
Net gain (loss) | (70,000,296) |
Net increase (decrease) in net assets resulting from operations | $ (67,972,363) |
The accompanying notes are an integral part of the financial statements.
Statement of Changes in Net Assets |
| Years Ended December 31, |
Increase (Decrease) in Net Assets | 2008 | 2007 |
Operations:
Net investment income (loss)
| $ 2,027,933 | $ 3,281,163 |
Net realized gain (loss)
| (29,199,764) | 38,689,859 |
Change in net unrealized appreciation (depreciation)
| (40,800,532) | (35,739,490) |
Net increase (decrease) in net assets resulting from operations
| (67,972,363) | 6,231,532 |
Distributions to shareholders from:
Net investment income:
Class A | (3,050,163) | (3,254,218) |
Class B | (190,157) | (431,057) |
Net realized gains:
Class A | (35,948,939) | (3,589,531) |
Class B | (2,803,004) | (675,883) |
Total distributions
| (41,992,263) | (7,950,689) |
Portfolio share transactions:
Class A Proceeds from shares sold
| 5,212,323 | 7,943,494 |
Reinvestment of distributions
| 38,999,102 | 6,843,749 |
Cost of shares redeemed
| (40,183,360) | (96,721,167) |
Net increase (decrease) in net assets from Class A share transactions
| 4,028,065 | (81,933,924) |
Class B Proceeds from shares sold
| 295,876 | 1,756,094 |
Reinvestment of distributions
| 2,993,161 | 1,106,940 |
Cost of shares redeemed
| (11,145,692) | (40,893,714) |
Net increase (decrease) in net assets from Class B share transactions
| (7,856,655) | (38,030,680) |
Increase (decrease) in net assets | (113,793,216) | (121,683,761) |
Net assets at beginning of period
| 210,148,311 | 331,832,072 |
Net assets at end of period (including undistributed net investment income of $1,938,429 and $3,269,183, respectively)
| $ 96,355,095 | $ 210,148,311 |
Other Information |
Class A Shares outstanding at beginning of period
| 18,082,818 | 25,561,711 |
Shares sold
| 749,218 | 724,126 |
Shares issued to shareholders in reinvestment of distributions
| 5,038,643 | 621,594 |
Shares redeemed
| (5,433,401) | (8,824,613) |
Net increase (decrease) in Class A shares
| 354,460 | (7,478,893) |
Shares outstanding at end of period
| 18,437,278 | 18,082,818 |
Class B Shares outstanding at beginning of period
| 1,355,326 | 4,788,468 |
Shares sold
| 42,150 | 161,143 |
Shares issued to shareholders in reinvestment of distributions
| 387,214 | 100,722 |
Shares redeemed
| (1,419,903) | (3,695,007) |
Net increase (decrease) in Class B shares
| (990,539) | (3,433,142) |
Shares outstanding at end of period
| 364,787 | 1,355,326 |
The accompanying notes are an integral part of the financial statements.
Financial Highlights
Class A Years Ended December 31, | 2008 | 2007 | 2006 | 2005 | 2004 |
Selected Per Share Data |
Net asset value, beginning of period | $ 10.81 | $ 10.94 | $ 9.72 | $ 9.29 | $ 8.50 |
Income (loss) from investment operations: Net investment income (loss)a | .10 | .13 | .13c | .10 | .12 |
Net realized and unrealized gain (loss) | (3.45) | .02 | 1.19 | .45 | .74 |
Total from investment operations | (3.35) | .15 | 1.32 | .55 | .86 |
Less distributions from: Net investment income | (.18) | (.13) | (.10) | (.12) | (.07) |
Net realized gains | (2.16) | (.15) | — | — | — |
Total distributions | (2.34) | (.28) | (.10) | (.12) | (.07) |
Net asset value, end of period | $ 5.12 | $ 10.81 | $ 10.94 | $ 9.72 | $ 9.29 |
Total Return (%)
| (38.31)b | 1.36b | 13.63b,c | 6.07b | 10.16 |
Ratios to Average Net Assets and Supplemental Data |
Net assets, end of period ($ millions)
| 94 | 196 | 280 | 294 | 172 |
Ratio of expenses before expense reductions (%)
| .60 | .57 | .56 | .57 | .56 |
Ratio of expenses after expense reductions (%)
| .54 | .56 | .54 | .54 | .56 |
Ratio of net investment income (loss) (%)
| 1.34 | 1.18 | 1.24c | 1.10 | 1.37 |
Portfolio turnover rate (%)
| 130 | 310 | 105 | 115 | 33 |
a Based on average shares outstanding during the period.
b Total return would have been lower had certain expenses not been reduced.
c Includes non-recurring income from the Advisor recorded as a result of an administrative proceeding regarding disclosure of brokerage allocation practices in connection with sales of DWS Funds. The non-recurring income resulted in an increase in net investment income of $0.007 per share and an increase in the ratio of net investment income of 0.07%. Excluding this non-recurring income, total return would have been 0.06% lower.
|
Class B Years Ended December 31, | 2008 | 2007 | 2006 | 2005 | 2004 |
Selected Per Share Data |
Net asset value, beginning of period | $ 10.77 | $ 10.90 | $ 9.68 | $ 9.25 | $ 8.47 |
Income (loss) from investment operations: Net investment income (loss)a | .08 | .09 | .09c | .07 | .09 |
Net realized and unrealized gain (loss) | (3.42) | .02 | 1.19 | .45 | .73 |
Total from investment operations | (3.34) | .11 | 1.28 | .52 | .82 |
Less distributions from: Net investment income | (.15) | (.09) | (.06) | (.09) | (.04) |
Net realized gains | (2.16) | (.15) | — | — | — |
Total distributions | (2.31) | (.24) | (.06) | (.09) | (.04) |
Net asset value, end of period | 5.12 | $ 10.77 | $ 10.90 | $ 9.68 | $ 9.25 |
Total Return (%)
| (38.29)b | 1.00b | 13.28b,c | 5.73b | 9.78 |
Ratios to Average Net Assets and Supplemental Data |
Net assets, end of period ($ millions)
| 2 | 15 | 52 | 47 | 33 |
Ratio of expenses before expense reductions (%)
| .82 | .95 | .94 | .95 | .89 |
Ratio of expenses after expense reductions (%)
| .77 | .92 | .89 | .89 | .89 |
Ratio of net investment income (loss) (%)
| 1.12 | .82 | .89c | .75 | 1.04 |
Portfolio turnover rate (%)
| 130 | 310 | 105 | 115 | 33 |
a Based on average shares outstanding during the period.
b Total return would have been lower had certain expenses not been reduced.
c Includes non-recurring income from the Advisor recorded as a result of an administrative proceeding regarding disclosure of brokerage allocation practices in connection with sales of DWS Funds. The non-recurring income resulted in an increase in net investment income of $0.007 per share and an increase in the ratio of net investment income of 0.07%. Excluding this non-recurring income, total return would have been 0.06% lower.
|
Performance Summary December 31, 2008
DWS Capital Growth VIP
All performance shown is historical, assumes reinvestment of all dividend and capital gain distributions, and does not guarantee future results. Investment return and principal value fluctuate with changing market conditions so that, when redeemed, shares may be worth more or less than their original cost. Current performance may be lower or higher than the performance data quoted. Please contact your participating insurance company for the Portfolio's most recent month-end performance. Performance doesn't reflect charges and fees ("contract charges") associated with the separate account that invests in the Portfolio or any variable life insurance policy or variable annuity contract for which the Portfolio is an investment option. These charges and fees will reduce returns. While all share classes have the same underlying portfolio, their performance will differ.
The total annual portfolio operating expense ratios, gross of any fee waivers or expense reimbursements, as stated in the fee table of the prospectus dated May 1, 2008 are 0.50% and 0.88% for Class A and Class B shares, respectively. Please see the Information About Your Portfolio's Expenses, the Financial Highlights and Notes to the Financial Statements (Note C, Related Parties) sections of this report for gross and net expense related disclosure for the period ended December 31, 2008.
Portfolio returns during all periods shown reflect a fee waiver and/or expense reimbursement. Without this waiver/reimbursement, returns would have been lower.
Risk Considerations
The Portfolio is subject to stock market risk, meaning stocks in the Portfolio may decline in value for extended periods of time due to the activities and financial prospects of individual companies, or due to general market and economic conditions. Please read this Portfolio's prospectus for specific information regarding its investments and risk profile.
Growth of an Assumed $10,000 Investment |
[] DWS Capital Growth VIP — Class A [] Russell 1000® Growth Index [] S&P 500® Index | The Russell 1000® Growth Index is an unmanaged, capitalization- weighted index containing those securities in the Russell 1000 Index with higher price-to-book ratios and higher forecasted growth values. The Standard & Poor's 500® (S&P 500) Index is an unmanaged capitalization-weighted index of 500 stocks. The index is designed to measure performance of the broad domestic economy through changes in the aggregate market value of 500 stocks representing all major industries. Index returns assume the reinvestment of dividends and, unlike portfolio returns, do not reflect any fees or expenses. It is not possible to invest directly into an index. |
 | |
Yearly periods ended December 31 |
|
Comparative Results |
DWS Capital Growth VIP | 1-Year | 3-Year | 5-Year | 10-Year |
Class A | Growth of $10,000
| $6,702 | $8,189 | $9,635 | $8,507 |
Average annual total return
| -32.98% | -6.44% | -.74% | -1.60% |
Russell 1000 Growth Index
| Growth of $10,000
| $6,156 | $7,508 | $8,401 | $6,462 |
Average annual total return
| -38.44% | -9.11% | -3.42% | -4.27% |
S&P 500 Index
| Growth of $10,000
| $6,300 | $7,696 | $8,953 | $8,700 |
Average annual total return
| -37.00% | -8.36% | -2.19% | -1.38% |
DWS Capital Growth VIP | 1-Year | 3-Year | 5-Year | 10-Year |
Class B | Growth of $10,000
| $6,680 | $8,105 | $9,460 | $8,234 |
Average annual total return
| -33.20% | -6.76% | -1.11% | -1.92% |
Russell 1000 Growth Index
| Growth of $10,000
| $6,156 | $7,508 | $8,401 | $6,462 |
Average annual total return
| -38.44% | -9.11% | -3.42% | -4.27% |
S&P 500 Index
| Growth of $10,000
| $6,300 | $7,696 | $8,953 | $8,700 |
Average annual total return
| -37.00% | -8.36% | -2.19% | -1.38% |
The growth of $10,000 is cumulative.
Information About Your Portfolio's Expenses
DWS Capital Growth VIP
As an investor of the Portfolio, you incur two types of costs: ongoing expenses and transaction costs. Ongoing expenses include management fees, distribution and service (12b-1) fees and other Portfolio expenses. Examples of transaction costs include contract charges, redemption fees and account maintenance fees, which are not shown in this section. The following tables are intended to help you understand your ongoing expenses (in dollars) of investing in the Portfolio and to help you compare these expenses with the ongoing expenses of investing in other mutual funds. In the most recent six-month period, the Portfolio limited these expenses; had it not done so, expenses would have been higher. The example in the table is based on an investment of $1,000 invested at the beginning of the six-month period and held for the entire period (July 1, 2008 to December 31, 2008).
The tables illustrate your Portfolio's expenses in two ways:
• Actual Portfolio Return. This helps you estimate the actual dollar amount of ongoing expenses (but not transaction costs) paid on a $1,000 investment in the Portfolio using the Portfolio's actual return during the period. To estimate the expenses you paid over the period, simply divide your account value by $1,000 (for example, an $8,600 account value divided by $1,000 = 8.6), then multiply the result by the number in the "Expenses Paid per $1,000" line under the share class you hold.
• Hypothetical 5% Portfolio Return. This helps you to compare your Portfolio's ongoing expenses (but not transaction costs) with those of other mutual funds using the Portfolio's actual expense ratio and a hypothetical rate of return of 5% per year before expenses. Examples using a 5% hypothetical Portfolio return may be found in the shareholder reports of other mutual funds. The hypothetical account values and expenses may not be used to estimate the actual ending account balance or expenses you paid for the period.
Please note that the expenses shown in these tables are meant to highlight your ongoing expenses only and do not reflect any transaction costs. The "Expenses Paid per $1,000" line of the tables is useful in comparing ongoing expenses only and will not help you determine the relative total expense of owning different funds. If these transaction costs had been included, your costs would have been higher.
Expenses and Value of a $1,000 Investment for the six months ended December 31, 2008 |
Actual Portfolio Return | Class A | | Class B | |
Beginning Account Value 7/1/08
| $ 1,000.00 | | $ 1,000.00 | |
Ending Account Value 12/31/08
| $ 712.40 | | $ 711.10 | |
Expenses Paid per $1,000*
| $ 2.11 | | $ 3.53 | |
Hypothetical 5% Portfolio Return | Class A | | Class B | |
Beginning Account Value 7/1/08
| $ 1,000.00 | | $ 1,000.00 | |
Ending Account Value 12/31/08
| $ 1,022.67 | | $ 1,021.01 | |
Expenses Paid per $1,000*
| $ 2.49 | | $ 4.17 | |
* Expenses are equal to the Portfolio's annualized expense ratio for each share class, multiplied by the average account value over the period, multiplied by the number of days in the most recent six-month period, then divided by 366.Annualized Expense Ratios | Class A | | Class B | |
DWS Variable Series I — DWS Capital Growth VIP
| .49% | | .82% | |
For more information, please refer to the Portfolio's prospectus.
These tables do not reflect charges and fees ("contract charges") associated with the separate account that invests in the Portfolio or any variable life insurance policy or variable annuity contract for which the Portfolio is an investment option.
Management Summary December 31, 2008
DWS Capital Growth VIP
The year just ended was the worst in many decades for the US equity markets. Essentially all equity indices posted negative returns for this period, as markets reflected economic problems including a housing slump, rising unemployment, a crisis of confidence and an extreme credit crunch. The Russell 3000® Index, which is generally regarded as a good indicator of the broad stock market, had a negative return of -37.31% for the 12 months ended December 31, 2008. Value stocks, as measured by the Russell 1000® Value Index, performed somewhat better than growth stocks, as measured by the Russell 1000® Growth Index over the same period. With a return of -32.98% during the 12-month period ended December 31, 2008 (Class A shares, unadjusted for contract charges), the Portfolio performed better than its benchmark, the Russell 1000 Growth Index, which had a negative return of -38.44%.
The greatest contributor to performance was an overweight and stock selection in the health care sector.1 Holdings that performed especially well were biopharmaceutical companies Gilead Sciences, Inc. and Genentech, Inc., which soared on news that Roche Holding Ltd. had offered to acquire the 44% of Genentech it does not already own. Also, Johnson & Johnson performed much better than the market, although the stock was down modestly.
The major detractor from performance was stock selection in the consumer discretionary sector. Positions in this sector that hurt performance were GameStop Corp., Harley-Davidson, Inc.* and Dick's Sporting Goods.* However, an overweight position in McDonald's Corp., also in the consumer discretionary sector, was one of the top contributors to performance.
Owen Fitzpatrick, CFA (as of February 15, 2009) and Richard Shepley
Co-Lead Portfolio Managers
Brendan O'Neill, CFA
Portfolio Manager
The Russell 3000 Index is an unmanaged index that measures the performance of the 3,000 largest US companies based on total market capitalization, which represents approximately 98% of the investable US equity market.
The Russell 1000 Value Index measures the performance of those Russell 1000 companies with lower price-to-book ratios and lower forecasted growth values.
The Russell 1000 Growth Index is an unmanaged, capitalization-weighted index containing those securities in the Russell 1000 Index with higher price-to-book ratios and higher forecasted growth values.
Index returns assume the reinvestment of dividends and, unlike portfolio returns, do not reflect any fees or expenses. It is not possible to invest directly in an index.
1 "Overweight" means the portfolio holds a higher weighting in a given sector or security than the benchmark. "Underweight" means the portfolio holds a lower weighting.* Not held in the Portfolio as of December 31, 2008.Portfolio management market commentary is as of December 31, 2008, and may not come to pass. This information is subject to change at any time based on market and other conditions. Past performance does not guarantee future results. Current and future portfolio holdings are subject to risk.
Portfolio Summary
DWS Capital Growth VIP
Asset Allocation (As a % of Investment Portfolio excluding Securities Lending Collateral) | 12/31/08 | 12/31/07 |
| | |
Common Stocks | 97% | 98% |
Cash Equivalents | 3% | 2% |
| 100% | 100% |
Sector Diversification (As a % of Common Stocks) | 12/31/08 | 12/31/07 |
| | |
Health Care | 22% | 18% |
Information Technology | 22% | 24% |
Consumer Staples | 15% | 11% |
Energy | 10% | 14% |
Industrials | 10% | 11% |
Consumer Discretionary | 8% | 10% |
Materials | 8% | 4% |
Financials | 3% | 5% |
Telecommunication Services | 1% | 2% |
Utilities | 1% | 1% |
| 100% | 100% |
Asset allocation and sector diversification are subject to change.
For more complete details about the Portfolio's investment portfolio, see page 43. A complete list of portfolio holdings of the Portfolio is posted as of the month end on www.dws-investments.com on or about the 15th day of the following month. More frequent posting of portfolio holdings information may be made from time to time on www.dws-investments.com.
Following the Portfolio's fiscal first and third quarter-end, a complete portfolio holdings listing is filed with the SEC on Form N-Q. The form will be available on the SEC's Web site at www.sec.gov, and it also may be reviewed and copied at the SEC's Public Reference Room in Washington, D.C. Information on the operation of the SEC's Public Reference Room may be obtained by calling (800) SEC-0330.
Investment Portfolio December 31, 2008
DWS Capital Growth VIP
|
Shares
| Value ($) |
| |
Common Stocks 97.3% |
Consumer Discretionary 7.9% |
Hotels Restaurants & Leisure 2.7% |
McDonald's Corp. (a) | 265,700 | 16,523,883 |
Media 0.5% |
Walt Disney Co. (a) | 133,200 | 3,022,308 |
Multiline Retail 1.4% |
Kohl's Corp.* (a) | 238,200 | 8,622,840 |
Specialty Retail 2.5% |
GameStop Corp. "A"* | 210,100 | 4,550,766 |
Staples, Inc. | 413,565 | 7,411,085 |
Tiffany & Co. | 136,700 | 3,230,221 |
| 15,192,072 |
Textiles, Apparel & Luxury Goods 0.8% |
NIKE, Inc. "B" | 88,400 | 4,508,400 |
Consumer Staples 14.2% |
Beverages 4.3% |
Diageo PLC | 506,526 | 6,998,559 |
PepsiCo, Inc. | 349,325 | 19,132,530 |
| 26,131,089 |
Food & Staples Retailing 4.3% |
Shoppers Drug Mart Corp. | 105,100 | 4,090,770 |
Wal-Mart Stores, Inc. (a) | 294,400 | 16,504,064 |
Walgreen Co. | 216,800 | 5,348,456 |
| 25,943,290 |
Food Products 3.3% |
Dean Foods Co.* | 181,618 | 3,263,676 |
General Mills, Inc. | 49,400 | 3,001,050 |
Groupe DANONE | 110,035 | 6,604,556 |
Kellogg Co. | 162,200 | 7,112,470 |
| 19,981,752 |
Household Products 2.3% |
Colgate-Palmolive Co. | 139,240 | 9,543,510 |
Procter & Gamble Co. | 72,770 | 4,498,641 |
| 14,042,151 |
Energy 10.2% |
Energy Equipment & Services 2.6% |
Halliburton Co. | 242,200 | 4,403,196 |
Noble Corp. | 152,700 | 3,373,143 |
Schlumberger Ltd. | 126,400 | 5,350,512 |
Transocean Ltd.* (a) | 56,927 | 2,689,801 |
| 15,816,652 |
Oil, Gas & Consumable Fuels 7.6% |
ConocoPhillips | 104,660 | 5,421,388 |
Devon Energy Corp. | 165,700 | 10,888,147 |
EOG Resources, Inc. (a) | 119,725 | 7,971,290 |
ExxonMobil Corp. | 143,000 | 11,415,690 |
XTO Energy, Inc. (a) | 281,982 | 9,945,505 |
| 45,642,020 |
|
Shares
| Value ($) |
| |
Financials 3.3% |
Capital Markets 1.2% |
Charles Schwab Corp. | 239,000 | 3,864,630 |
State Street Corp. (a) | 84,470 | 3,322,205 |
| 7,186,835 |
Diversified Financial Services 0.7% |
CME Group, Inc. (a) | 19,937 | 4,149,089 |
Insurance 1.4% |
Aflac, Inc. | 187,724 | 8,605,268 |
Health Care 21.9% |
Biotechnology 6.5% |
Celgene Corp.* | 146,900 | 8,120,632 |
Genentech, Inc.* (a) | 110,350 | 9,149,118 |
Gilead Sciences, Inc.* (a) | 429,620 | 21,970,767 |
| 39,240,517 |
Health Care Equipment & Supplies 6.2% |
Baxter International, Inc. | 287,800 | 15,423,202 |
C.R. Bard, Inc. | 96,500 | 8,131,090 |
Hologic, Inc.* (a) | 181,500 | 2,372,205 |
Medtronic, Inc. | 194,300 | 6,104,906 |
Zimmer Holdings, Inc.* | 135,840 | 5,490,653 |
| 37,522,056 |
Health Care Providers & Services 1.3% |
Laboratory Corp. of America Holdings* (a) | 105,300 | 6,782,373 |
UnitedHealth Group, Inc. | 34,685 | 922,621 |
| 7,704,994 |
Life Sciences Tools & Services 1.1% |
Thermo Fisher Scientific, Inc.* (a) | 193,400 | 6,589,138 |
Pharmaceuticals 6.8% |
Abbott Laboratories | 292,200 | 15,594,714 |
Eli Lilly & Co. | 92,400 | 3,720,948 |
Johnson & Johnson (a) | 365,466 | 21,865,831 |
| 41,181,493 |
Industrials 9.8% |
Aerospace & Defense 4.4% |
Goodrich Corp. (a) | 208,300 | 7,711,266 |
Honeywell International, Inc. (a) | 244,700 | 8,033,501 |
United Technologies Corp. | 200,200 | 10,730,720 |
| 26,475,487 |
Electrical Equipment 1.8% |
Emerson Electric Co. (a) | 301,900 | 11,052,559 |
Machinery 1.3% |
Caterpillar, Inc. | 32,200 | 1,438,374 |
Parker Hannifin Corp. (a) | 149,200 | 6,346,968 |
| 7,785,342 |
Road & Rail 2.3% |
Canadian National Railway Co. (a) | 254,900 | 9,370,124 |
Norfolk Southern Corp. | 102,800 | 4,836,740 |
| 14,206,864 |
|
Shares
| Value ($) |
| |
Information Technology 21.1% |
Communications Equipment 3.2% |
Cisco Systems, Inc.* | 558,720 | 9,107,136 |
QUALCOMM, Inc. | 275,700 | 9,878,331 |
| 18,985,467 |
Computers & Peripherals 6.7% |
Apple, Inc.* | 142,835 | 12,190,967 |
EMC Corp.* | 378,615 | 3,964,099 |
Hewlett-Packard Co. (a) | 365,000 | 13,245,850 |
International Business Machines Corp. (a) | 134,700 | 11,336,352 |
| 40,737,268 |
Electronic Equipment, Instruments & Components 1.1% |
Mettler-Toledo International, Inc.* (a) | 97,300 | 6,558,020 |
Internet Software & Services 0.9% |
Google, Inc. "A"* | 17,825 | 5,483,861 |
IT Services 3.7% |
Accenture Ltd. "A" | 324,300 | 10,633,797 |
Fiserv, Inc.* (a) | 137,400 | 4,997,238 |
Visa, Inc. "A" | 129,000 | 6,766,050 |
| 22,397,085 |
Semiconductors & Semiconductor Equipment 2.3% |
Broadcom Corp. "A"* (a) | 156,200 | 2,650,714 |
Intel Corp. (a) | 763,090 | 11,186,900 |
| 13,837,614 |
Software 3.2% |
Adobe Systems, Inc.* (a) | 268,475 | 5,715,833 |
Electronic Arts, Inc.* | 147,700 | 2,369,108 |
Microsoft Corp. (a) | 585,380 | 11,379,787 |
| 19,464,728 |
|
Shares
| Value ($) |
| |
Materials 7.4% |
Chemicals 5.1% |
Ecolab, Inc. | 294,100 | 10,337,615 |
Monsanto Co. | 154,700 | 10,883,145 |
Praxair, Inc. (a) | 161,300 | 9,574,768 |
| 30,795,528 |
Metals & Mining 2.3% |
Barrick Gold Corp. (a) | 316,500 | 11,637,705 |
Freeport-McMoRan Copper & Gold, Inc. | 85,800 | 2,096,952 |
| 13,734,657 |
Telecommunication Services 1.0% |
Diversified Telecommunication Services |
AT&T, Inc. | 219,000 | 6,241,500 |
Utilities 0.5% |
Electric Utilities |
Allegheny Energy, Inc. | 80,100 | 2,712,186 |
Total Common Stocks (Cost $574,082,567) | 588,074,013 |
|
Securities Lending Collateral 22.8% |
Daiy Assets Fund Institutional, 1.69% (b) (c) (Cost $137,751,495) | 137,751,495 | 137,751,495 |
|
Cash Equivalents 2.7% |
Cash Management QP Trust, 1.42% (b) (Cost $16,636,327) | 16,636,327 | 16,636,327 |
| % of Net Assets | Value ($) |
| |
Total Investment Portfolio (Cost $728,470,389)+ | 122.8 | 742,461,835 |
Other Assets and Liabilities, Net | (22.8) | (138,040,166) |
Net Assets | 100.0 | 604,421,669 |
* Non-income producing security.+ The cost for federal income tax purposes was $731,887,395. At December 31, 2008, net unrealized appreciation for all securities based on tax cost was $10,574,440. This consisted of aggregate gross unrealized appreciation for all securities in which there was an excess of value over tax cost of $110,906,577 and aggregate gross unrealized depreciation for all securities in which there was an excess of tax cost over value of $100,332,137.(a) All or a portion of these securities were on loan (see Notes to Financial Statements). The value of all securities loaned at December 31, 2008 amounted to $135,983,737, which is 22.5% of net assets.(b) Affiliated fund managed by Deutsche Investment Management Americas Inc. The rate shown is the annualized seven-day yield at period end.(c) Represents collateral held in connection with securities lending. Income earned by the Portfolio is net of borrower rebates.Fair Value Measurements
The following is a summary of the inputs used as of December 31, 2008 in valuing the Portfolio's investments. For information on the Portfolio's policy regarding the valuation of investments and of the valuation inputs, and the aggregate levels used in the table below, please refer to the Security Valuation section of Note A in the accompanying Notes to the Financial Statements.
Valuation Inputs | Investments in Securities |
Level 1
| $ 712,222,393 |
Level 2
| 30,239,442 |
Level 3
| — |
Total | $ 742,461,835 |
The accompanying notes are an integral part of the financial statements.
Financial Statements
Statement of Assets and Liabilities as of December 31, 2008
|
Assets |
Investments:
Investments in securities, at value (cost $574,082,567), including $135,983,737 of securities loaned | $ 588,074,013 |
Investment in Daily Assets Fund Institutional (cost $137,751,495)* | 137,751,495 |
Investment in Cash Management QP Trust (cost $16,636,327) | 16,636,327 |
Total investments, at value (cost $728,470,389)
| 742,461,835 |
Receivable for investments sold
| 82,215 |
Dividends receivable
| 714,396 |
Interest receivable
| 104,795 |
Receivable for Portfolio shares sold
| 16,799 |
Foreign taxes recoverable
| 64,757 |
Other assets
| 28,207 |
Total assets
| 743,473,004 |
Liabilities |
Cash overdraft
| 78,290 |
Payable for Portfolio shares redeemed
| 909,371 |
Payable upon return of securities loaned
| 137,751,495 |
Accrued management fee
| 142,926 |
Accrued distribution service fee (Class B)
| 1,481 |
Other accrued expenses and payables
| 167,772 |
Total liabilities
| 139,051,335 |
Net assets, at value | $ 604,421,669 |
Net Assets Consist of |
Undistributed net investment income
| 7,945,917 |
Net unrealized appreciation (depreciation) on:
Investments | 13,991,446 |
Foreign currency | 5,875 |
Accumulated net realized gain (loss)
| (239,522,654) |
Paid-in capital
| 822,001,085 |
Net assets, at value | $ 604,421,669 |
Class A Net Asset Value, offering and redemption price per share ($593,927,716 ÷ 43,844,542 outstanding shares of beneficial interest, no par value, unlimited number of shares authorized)
| $ 13.55 |
Class B Net Asset Value, offering and redemption price per share ($10,493,953 ÷ 777,803 outstanding shares of beneficial interest, no par value, unlimited number of shares authorized)
| $ 13.49 |
* Represents collateral on securities loaned.The accompanying notes are an integral part of the financial statements.
Statement of Operations for the year ended December 31, 2008
|
Investment Income |
Income:
Dividends (net of foreign taxes withheld of $92,798)
| $ 11,275,199 |
Interest
| 626 |
Interest — Cash Management QP Trust
| 424,008 |
Securities lending income, including income from Daily Assets Fund Institutional, net of borrower rebates
| 486,686 |
Total Income
| 12,186,519 |
Expenses:
Management fee
| 3,273,016 |
Administration fee
| 879,862 |
Custodian fee
| 66,128 |
Distribution service fee (Class B)
| 37,000 |
Services to shareholders
| 874 |
Record keeping fee (Class B)
| 14,172 |
Professional fees
| 95,226 |
Trustees' fees and expenses
| 45,567 |
Reports to shareholders
| 49,388 |
Other
| 30,997 |
Total expenses before expense reductions
| 4,492,230 |
Expense reductions
| (119,918) |
Total expenses after expense reductions
| 4,372,312 |
Net investment income (loss) | 7,814,207 |
Realized and Unrealized Gain (Loss) |
Net realized gain (loss) from:
Investments
| 23,279,165 |
Foreign currency
| (106,168) |
| 23,172,997 |
Change in net unrealized appreciation (depreciation) on:
Investments
| (355,391,930) |
Foreign currency
| 2,427 |
| (355,389,503) |
Net gain (loss) | (332,216,506) |
Net increase (decrease) in net assets resulting from operations | $ (324,402,299) |
The accompanying notes are an integral part of the financial statements.
Statement of Changes in Net Assets |
| Years Ended December 31, |
Increase (Decrease) in Net Assets | 2008 | 2007 |
Operations:
Net investment income (loss)
| $ 7,814,207 | $ 9,712,813 |
Net realized gain (loss)
| 23,172,997 | 108,270,953 |
Change in net unrealized appreciation (depreciation)
| (355,389,503) | 19,841,624 |
Net increase (decrease) in net assets resulting from operations
| (324,402,299) | 137,825,390 |
Distributions to shareholders from:
Net investment income:
Class A | (9,355,147) | (6,887,657) |
Class B | (96,190) | (258,683) |
Total distributions
| (9,451,337) | (7,146,340) |
Portfolio share transactions:
Class A Proceeds from shares sold
| 23,952,264 | 22,292,590 |
Reinvestment of distributions
| 9,355,147 | 6,887,657 |
Cost of shares redeemed
| (169,314,485) | (225,450,131) |
Net increase (decrease) in net assets from Class A share transactions
| (136,007,074) | (196,269,884) |
Class B Proceeds from shares sold
| 1,473,846 | 1,548,433 |
Reinvestment of distributions
| 96,190 | 258,683 |
Cost of shares redeemed
| (4,263,172) | (97,598,529) |
Net increase (decrease) in net assets from Class B share transactions
| (2,693,136) | (95,791,413) |
Increase (decrease) in net assets | (472,553,846) | (161,382,247) |
Net assets at beginning of period
| 1,076,975,515 | 1,238,357,762 |
Net assets at end of period (including undistributed net investment income of $7,945,917 and $9,689,216, respectively)
| $ 604,421,669 | $ 1,076,975,515 |
Other Information |
Class A Shares outstanding at beginning of period
| 51,857,448 | 62,005,444 |
Shares sold
| 1,366,508 | 1,165,102 |
Shares issued to shareholders in reinvestment of distributions
| 468,930 | 362,508 |
Shares redeemed
| (9,848,344) | (11,675,606) |
Net increase (decrease) in Class A shares
| (8,012,906) | (10,147,996) |
Shares outstanding at end of period
| 43,844,542 | 51,857,448 |
Class B Shares outstanding at beginning of period
| 920,834 | 5,921,673 |
Shares sold
| 89,671 | 80,681 |
Shares issued to shareholders in reinvestment of distributions
| 4,831 | 13,644 |
Shares redeemed
| (237,533) | (5,095,164) |
Net increase (decrease) in Class B shares
| (143,031) | (5,000,839) |
Shares outstanding at end of period
| 777,803 | 920,834 |
The accompanying notes are an integral part of the financial statements.
Financial Highlights
Class A Years Ended December 31, | 2008 | 2007 | 2006 | 2005 | 2004 |
Selected Per Share Data |
Net asset value, beginning of period | $ 20.41 | $18.24 | $ 16.90 | $ 15.67 | $ 14.59 |
Income (loss) from investment operations: Net investment income (loss)a | .16 | .17d | .13c | .10 | .14 |
Net realized and unrealized gain (loss) | (6.83) | 2.12 | 1.31 | 1.29 | 1.02 |
Total from investment operations | (6.67) | 2.29 | 1.44 | 1.39 | 1.16 |
Less distributions from: Net investment income | (.19) | (.12) | (.10) | (.16) | (.08) |
Net asset value, end of period | $ 13.55 | $ 20.41 | $ 18.24 | $ 16.90 | $ 15.67 |
Total Return (%)
| (32.98)b | 12.59b | 8.53b,c | 8.96b | 7.99 |
Ratios to Average Net Assets and Supplemental Data |
Net assets, end of period ($ millions)
| 594 | 1,058 | 1,131 | 1,031 | 698 |
Ratio of expenses before expense reductions (%)
| .50 | .53 | .52 | .50 | .50 |
Ratio of expenses after expense reductions (%)
| .49 | .52 | .49 | .49 | .50 |
Ratio of net investment income (loss) (%)
| .89 | .86d | .73c | .61 | .98 |
Portfolio turnover rate (%)
| 21 | 30 | 16 | 17 | 15 |
a Based on average shares outstanding during the period.
b Total return would have been lower had certain expenses not been reduced.
c Includes non-recurring income from the Advisor recorded as a result of an administrative proceeding regarding disclosure of brokerage allocation practices in connection with sales of DWS Funds. The non-recurring income resulted in an increase in net investment income of $0.007 per share and an increase in the ratio of net investment income of 0.04%. Excluding this non-recurring income, total return would have been 0.03% lower.
d Net investment income per share and ratio of net investment income include non-recurring dividend income amounting to $0.03 per share and 0.17% of average daily net assets, respectively.
|
Class B Years Ended December 31, | 2008 | 2007 | 2006 | 2005 | 2004 |
Selected Per Share Data |
Net asset value, beginning of period | $ 20.31 | $ 18.15 | $ 16.81 | $ 15.59 | $ 14.52 |
Income (loss) from investment operations: Net investment income (loss)a | .10 | .09d | .06c | .04 | .09 |
Net realized and unrealized gain (loss) | (6.81) | 2.12 | 1.31 | 1.28 | 1.01 |
Total from investment operations | (6.71) | 2.21 | 1.37 | 1.32 | 1.10 |
Less distributions from: Net investment income | (.11) | (.05) | (.03) | (.10) | (.03) |
Net asset value, end of period | $ 13.49 | $ 20.31 | $ 18.15 | $ 16.81 | $ 15.59 |
Total Return (%)
| (33.20)b | 12.18b | 8.17b,c | 8.51b | 7.56 |
Ratios to Average Net Assets and Supplemental Data |
Net assets, end of period ($ millions)
| 10 | 19 | 107 | 73 | 23 |
Ratio of expenses before expense reductions (%)
| .85 | .94 | .91 | .89 | .88 |
Ratio of expenses after expense reductions (%)
| .82 | .90 | .86 | .86 | .88 |
Ratio of net investment income (loss) (%)
| .56 | .48d | .36c | .24 | .60 |
Portfolio turnover rate (%)
| 21 | 30 | 16 | 17 | 15 |
a Based on average shares outstanding during the period.
b Total return would have been lower had certain expenses not been reduced.
c Includes non-recurring income from the Advisor recorded as a result of an administrative proceeding regarding disclosure of brokerage allocation practices in connection with sales of DWS Funds. The non-recurring income resulted in an increase in net investment income of $0.007 per share and an increase in the ratio of net investment income of 0.04%. Excluding this non-recurring income, total return would have been 0.03% lower.
d Net investment income per share and ratio of net investment income include non-recurring dividend income amounting to $0.03 per share and 0.17% of average daily net assets, respectively.
|
Performance Summary December 31, 2008
DWS Global Opportunities VIP
All performance shown is historical, assumes reinvestment of all dividend and capital gain distributions, and does not guarantee future results. Investment return and principal value fluctuate with changing market conditions so that, when redeemed, shares may be worth more or less than their original cost. Current performance may be lower or higher than the performance data quoted. Please contact your participating insurance company for the Portfolio's most recent month-end performance. Performance doesn't reflect charges and fees ("contract charges") associated with the separate account that invests in the Portfolio or any variable life insurance policy or variable annuity contract for which the Portfolio is an investment option. These charges and fees will reduce returns. While all share classes have the same underlying portfolio, their performance will differ.
The total annual portfolio operating expense ratios, gross of any fee waivers or expense reimbursements, as stated in the fee table of the prospectus dated May 1, 2008 are 1.10% and 1.46% for Class A and Class B shares, respectively. Please see the Information About Your Portfolio's Expenses, the Financial Highlights and Notes to the Financial Statements (Note C, Related Parties) sections of this report for gross and net expense related disclosure for the period ended December 31, 2008.
Portfolio returns during all periods shown reflect a fee waiver and/or reimbursement. Without this waiver/reimbursement, returns would have been lower.
Risk Considerations
This Portfolio is subject to stock market risk. Investing in foreign securities presents certain risks, such as currency fluctuations, political and economic changes and market risks. Additionally, stocks of small-sized companies involve greater risk as they often have limited product lines, markets, or financial resources and may be sensitive to erratic and abrupt market movements more so than securities of larger, more-established companies. All of these factors may result in greater share price volatility. Please read this Portfolio's prospectus for specific details regarding its investments and risk profile.
Growth of an Assumed $10,000 Investment |
[] DWS Global Opportunities VIP — Class A [] S&P® Developed SmallCap Index | The S&P® Developed SmallCap Index (formerly the S&P/Citigroup Extended Market Index-World), is an unmanaged index of small-capitalization stocks within 26 countries around the globe. Index returns assume the reinvestment of dividends net of withholding tax and, unlike portfolio returns, do not reflect any fees or expenses. It is not possible to invest directly into an index. |
 | |
Yearly periods ended December 31 |
|
Comparative Results |
DWS Global Opportunities VIP | 1-Year | 3-Year | 5-Year | 10-Year |
Class A | Growth of $10,000
| $5,004 | $6,678 | $9,735 | $13,776 |
Average annual total return
| -49.96% | -12.59% | -.54% | 3.26% |
S&P Developed SmallCap Index
| Growth of $10,000
| $5,625 | $7,301 | $10,410 | $14,967 |
Average annual total return
| -43.75% | -9.96% | .81% | 4.12% |
DWS Global Opportunities VIP | 1-Year | 3-Year | 5-Year | 10-Year |
Class B | Growth of $10,000
| $4,984 | $6,616 | $9,617 | $13,444 |
Average annual total return
| -50.16% | -12.86% | -.78% | 3.00% |
S&P Developed SmallCap Index
| Growth of $10,000
| $5,625 | $7,301 | $10,410 | $14,967 |
Average annual total return
| -43.75% | -9.96% | .81% | 4.12% |
The growth of $10,000 is cumulative.
Information About Your Portfolio's Expenses
DWS Global Opportunities VIP
As an investor of the Portfolio, you incur two types of costs: ongoing expenses and transaction costs. Ongoing expenses include management fees, distribution and service (12b-1) fees and other Portfolio expenses. Examples of transaction costs include contract charges, redemption fees and account maintenance fees, which are not shown in this section. The following tables are intended to help you understand your ongoing expenses (in dollars) of investing in the Portfolio and to help you compare these expenses with the ongoing expenses of investing in other mutual funds. In the most recent six-month period, the Portfolio limited these expenses; had it not done so, expenses would have been higher. The example in the table is based on an investment of $1,000 invested at the beginning of the six-month period and held for the entire period (July 1, 2008 to December 31, 2008).
The tables illustrate your Portfolio's expenses in two ways:
• Actual Portfolio Return. This helps you estimate the actual dollar amount of ongoing expenses (but not transaction costs) paid on a $1,000 investment in the Portfolio using the Portfolio's actual return during the period. To estimate the expenses you paid over the period, simply divide your account value by $1,000 (for example, an $8,600 account value divided by $1,000 = 8.6), then multiply the result by the number in the "Expenses Paid per $1,000" line under the share class you hold.
• Hypothetical 5% Portfolio Return. This helps you to compare your Portfolio's ongoing expenses (but not transaction costs) with those of other mutual funds using the Portfolio's actual expense ratio and a hypothetical rate of return of 5% per year before expenses. Examples using a 5% hypothetical Portfolio return may be found in the shareholder reports of other mutual funds. The hypothetical account values and expenses may not be used to estimate the actual ending account balance or expenses you paid for the period.
Please note that the expenses shown in these tables are meant to highlight your ongoing expenses only and do not reflect any transaction costs. The "Expenses Paid per $1,000" line of the tables is useful in comparing ongoing expenses only and will not help you determine the relative total expense of owning different funds. If these transaction costs had been included, your costs would have been higher.
Expenses and Value of a $1,000 Investment for the six months ended December 31, 2008 |
Actual Portfolio Return | Class A | | Class B | |
Beginning Account Value 7/1/08
| $ 1,000.00 | | $ 1,000.00 | |
Ending Account Value 12/31/08
| $ 563.30 | | $ 561.70 | |
Expenses Paid per $1,000*
| $ 3.85 | | $ 5.10 | |
Hypothetical 5% Portfolio Return | Class A | | Class B | |
Beginning Account Value 7/1/08
| $ 1,000.00 | | $ 1,000.00 | |
Ending Account Value 12/31/08
| $ 1,020.21 | | $ 1,018.60 | |
Expenses Paid per $1,000*
| $ 4.98 | | $ 6.60 | |
* Expenses are equal to the Portfolio's annualized expense ratio for each share class, multiplied by the average account value over the period, multiplied by the number of days in the most recent six-month period, then divided by 366.Annualized Expense Ratios | Class A | | Class B | |
DWS Variable Series I — DWS Global Opportunities VIP
| .98% | | 1.30% | |
For more information, please refer to the Portfolio's prospectus.
These tables do not reflect charges and fees ("contract charges") associated with the separate account that invests in the Portfolio or any variable life insurance policy or variable annuity contract for which the Portfolio is an investment option.
Management Summary December 31, 2008
DWS Global Opportunities VIP
Amid the extremely negative investment environment of the 12-month period ended December 31, 2008, DWS Global Opportunities VIP Class A shares (unadjusted for contract charges) declined -49.96% and lagged the -43.75% return of the S&P® Developed SmallCap Index (formerly the S&P/Citigroup Extended Market Index-World).
We are disappointed to report that stock selection was the primary cause of the Portfolio's underperformance. Our emphasis on using fundamental research to find high-quality growth companies was not rewarded during the past year, reflecting the fact that investor fear caused higher-quality companies to decline in tandem with other, less attractive companies. In these unusual market conditions, our focus on fundamentals did not translate into outperformance.
Stock selections in the financial, information technology and consumer staples sectors were notable sources of underperformance in 2008. On the plus side, we generated the best relative performance in the health care and consumer discretionary sectors. The top individual contributors were Thoratec Corp. and Fresenius Medical Care AG & Co., while the leading detractors were SunOpta, Inc., Piraeus Bank S.A.* and Anglo Irish Bank Corp. PLC.
While the past year has been a difficult time to be invested in small-cap stocks, the extreme market volatility has provided an opportunity to establish long-term positions in fast-growing companies at very attractive valuation levels. Overall, we believe the portfolio is defensively positioned due to our preference for the highest-quality fundamentally sound growth companies. We believe this is the most effective way to approach a market characterized by both high risks and increasingly compelling opportunities.
Joseph Axtell, CFA Jeffrey Saeger, CFA
Portfolio Managers
The S&P Developed SmallCap Index (formerly the S&P/Citigroup Extended Market Index-World), is an unmanaged index of small-capitalization stocks within 26 countries around the globe.
Index returns assume the reinvestment of dividends net of withholding tax and, unlike portfolio returns, do not reflect any fees or expenses. It is not possible to invest directly into an index.
* Not held in the Portfolio as of December 31, 2008.Portfolio management market commentary is as of December 31, 2008, and may not come to pass. This information is subject to change at any time based on market and other conditions. Past performance does not guarantee future results. Current and future portfolio holdings are subject to risk.
Portfolio Summary
DWS Global Opportunities VIP
Asset Allocation (As a % of Investment Portfolio excluding Securities Lending Collateral) | 12/31/08 | 12/31/07 |
| | |
Common Stocks | 99% | 98% |
Cash Equivalents | 1% | 2% |
| 100% | 100% |
Geographical Diversification (As a % of Investment Portfolio excluding Cash Equivalents and Securities Lending Collateral) | 12/31/08 | 12/31/07 |
| | |
United States | 41% | 31% |
Continental Europe | 35% | 38% |
United Kingdom | 8% | 9% |
Japan | 7% | 6% |
Pacific Basin | 5% | 10% |
Canada | 1% | 2% |
Australia | 1% | 2% |
Latin America | 1% | 1% |
Other | 1% | 1% |
| 100% | 100% |
Sector Diversification (As a % of Common Stocks) | 12/31/08 | 12/31/07 |
| | |
Health Care | 21% | 16% |
Industrials | 20% | 16% |
Information Technology | 18% | 18% |
Financials | 12% | 21% |
Consumer Discretionary | 10% | 10% |
Energy | 9% | 10% |
Consumer Staples | 5% | 3% |
Utilities | 4% | 4% |
Materials | 1% | 1% |
Telecommunication Services | — | 1% |
| 100% | 100% |
Asset allocation, geographical diversification and sector diversification are subject to change.
For more complete details about the Portfolio's investment portfolio, see page 57 . A complete list of portfolio holdings of the Portfolio is posted as of the month end on www.dws-investments.com on or about the 15th day of the following month. More frequent posting of portfolio holdings information may be made from time to time on www.dws-investments.com.
Following the Portfolio's fiscal first and third quarter-end, a complete portfolio holdings listing is filed with the SEC on Form N-Q. The form will be available on the SEC's Web site at www.sec.gov, and it also may be reviewed and copied at the SEC's Public Reference Room in Washington, D.C. Information on the operation of the SEC's Public Reference Room may be obtained by calling (800) SEC-0330.
Investment Portfolio December 31, 2008
DWS Global Opportunities VIP
| Shares | Value ($) |
| |
Common Stocks 98.0% |
Australia 0.6% |
Austal Ltd. (Cost $1,028,811) | 538,533 | 735,763 |
Bahrain 0.4% |
Gulf Finance House EC (GDR) 144A (Cost $1,138,485) | 50,082 | 425,697 |
Belgium 0.4% |
Hansen Transmissions International NV* (Cost $1,014,963) | 286,190 | 482,621 |
Brazil 0.5% |
Diagnosticos da America SA (Cost $1,502,673) | 66,100 | 643,535 |
Canada 1.4% |
CAE, Inc. | 153,300 | 1,005,857 |
OPTI Canada, Inc.* | 155,100 | 226,295 |
SunOpta, Inc.* | 336,500 | 528,305 |
(Cost $5,479,171) | 1,760,457 |
China 1.2% |
Minth Group Ltd. | 1,782,200 | 718,935 |
Soho China Ltd. | 732,500 | 317,160 |
VanceInfo Technologies, Inc. (ADR)* | 97,800 | 464,550 |
(Cost $1,838,606) | 1,500,645 |
Cyprus 0.8% |
Prosafe Production Public Ltd.*(a) | 247,423 | 396,307 |
ProSafe SE (b) | 152,963 | 583,175 |
(Cost $2,275,949) | 979,482 |
France 2.4% |
Financiere Marc de Lacharriere SA (a) | 21,810 | 680,290 |
Flamel Technologies SA (ADR)* (a) | 200,700 | 786,744 |
JC Decaux SA | 82,396 | 1,418,659 |
(Cost $6,219,557) | 2,885,693 |
Germany 15.4% |
Fresenius Medical Care AG & Co. KGaA | 129,507 | 6,072,988 |
Grenkeleasing AG | 22,417 | 562,511 |
M.A.X. Automation AG | 284,739 | 896,684 |
QSC AG* | 219,612 | 388,028 |
Rational AG (a) | 10,184 | 1,208,254 |
SGL Carbon AG* (a) | 42,100 | 1,438,445 |
Software AG | 29,904 | 1,688,234 |
Stada Arzneimittel AG | 81,334 | 2,378,854 |
Tognum AG | 45,157 | 576,811 |
United Internet AG (Registered) (a) | 237,543 | 2,126,030 |
Wincor Nixdorf AG | 31,634 | 1,508,246 |
(Cost $15,472,529) | 18,845,085 |
Greece 1.7% |
Coca-Cola Hellenic Bottling Co. SA | 101,300 | 1,477,724 |
Hellenic Exchanges SA | 81,800 | 644,018 |
(Cost $2,173,850) | 2,121,742 |
| Shares | Value ($) |
| |
Hong Kong 3.4% |
K Wah International Holdings Ltd. | 2,598,000 | 424,581 |
Kingboard Chemical Holdings Ltd. | 799,640 | 1,446,996 |
Midland Holdings Ltd. | 1,550,357 | 557,281 |
Wing Hang Bank Ltd. | 196,700 | 1,139,534 |
Xinyi Glass Holdings Co., Ltd. (c) | 2,160,000 | 584,028 |
(Cost $4,353,189) | 4,152,420 |
Ireland 4.9% |
Anglo Irish Bank Corp. PLC | 236,421 | 56,779 |
C&C Group PLC | 465,849 | 943,174 |
FBD Holdings PLC | 26,000 | 265,415 |
ICON PLC (ADR)* | 76,400 | 1,504,316 |
Kingspan Group PLC | 91,146 | 397,368 |
Norkom Group PLC* | 297,432 | 206,723 |
Paddy Power PLC | 67,729 | 1,267,822 |
Ryanair Holdings PLC* | 319,528 | 1,326,859 |
(Cost $8,277,547) | 5,968,456 |
Italy 1.3% |
Prysmian SpA (Cost $2,222,420) | 100,453 | 1,577,725 |
Japan 7.0% |
AEON Credit Service Co., Ltd. | 77,200 | 816,783 |
AEON Mall Co., Ltd. | 121,000 | 2,336,004 |
JAFCO Co., Ltd. | 19,100 | 488,272 |
Mitsubishi UFJ Lease & Finance Co., Ltd. | 34,660 | 880,587 |
Nidec Corp. | 19,000 | 738,866 |
Shinko Plantech Co., Ltd. | 181,300 | 1,534,634 |
Sumitomo Realty & Development Co., Ltd. | 86,000 | 1,281,320 |
Wacom Co., Ltd. (a) | 541 | 478,598 |
(Cost $9,046,289) | 8,555,064 |
Netherlands 5.7% |
Arcadis NV (a) | 60,716 | 800,443 |
Chicago Bridge & Iron Co. NV (NY Registered Shares) | 60,700 | 610,035 |
Koninklijke Vopak NV | 27,573 | 1,046,212 |
QIAGEN NV* (a) | 156,000 | 2,726,175 |
SBM Offshore NV | 133,045 | 1,743,441 |
(Cost $7,507,816) | 6,926,306 |
Spain 0.5% |
Tecnicas Reunidas SA (Cost $1,500,429) | 24,688 | 645,132 |
Sweden 0.0% |
Micronic Laser Systems AB* (a) (Cost $607,066) | 63,300 | 48,029 |
Switzerland 1.2% |
Advanced Digital Broadcast Holdings SA (ADB Group) (Registered)* | 15,290 | 418,211 |
Partners Group Holding AG | 15,400 | 1,094,891 |
(Cost $1,592,201) | 1,513,102 |
Taiwan 0.7% |
Siliconware Precision Industries Co. (Cost $636,347) | 1,010,743 | 883,338 |
| Shares | Value ($) |
| |
United Arab Emirates 0.5% |
Lamprell PLC (Cost $1,204,470) | 368,174 | 624,665 |
United Kingdom 8.1% |
Aegis Group PLC | 406,459 | 438,205 |
ARM Holdings PLC | 805,246 | 1,007,643 |
Ashmore Group PLC | 491,229 | 946,681 |
Babcock International Group PLC | 166,156 | 1,142,990 |
Carphone Warehouse Group PLC | 307,703 | 399,505 |
John Wood Group PLC | 170,975 | 466,384 |
Kofax PLC | 289,575 | 580,053 |
Michael Page International PLC | 288,739 | 898,656 |
Serco Group PLC | 410,345 | 2,670,727 |
Xchanging PLC (a) | 405,910 | 1,379,823 |
(Cost $15,272,784) | 9,930,667 |
United States 39.9% |
Advance Auto Parts, Inc. | 38,850 | 1,307,302 |
Aecom Technology Corp.* | 77,368 | 2,377,519 |
Aeropostale, Inc.* | 36,900 | 594,090 |
Allegheny Energy, Inc. | 149,500 | 5,062,070 |
American Eagle Outfitters, Inc. | 74,200 | 694,512 |
AMERIGROUP Corp.* | 69,100 | 2,039,832 |
ANSYS, Inc.* | 11,700 | 326,313 |
BE Aerospace, Inc.* | 64,100 | 492,929 |
Cameron International Corp.* | 13,700 | 280,850 |
Carter's, Inc.* | 65,200 | 1,255,752 |
Chattem, Inc.* | 13,100 | 937,043 |
Cogent, Inc.* | 89,400 | 1,213,158 |
Deckers Outdoor Corp.* | 10,000 | 798,700 |
Diamond Foods, Inc. | 58,300 | 1,174,745 |
Dresser-Rand Group, Inc.* | 79,100 | 1,364,475 |
EMS Technologies, Inc.* | 46,600 | 1,205,542 |
Foundation Coal Holdings, Inc. | 44,100 | 618,282 |
FTI Consulting, Inc.* (a) | 52,950 | 2,365,806 |
Green Mountain Coffee Roasters, Inc.* (a) | 32,400 | 1,253,880 |
Itron, Inc.* (a) | 52,100 | 3,320,854 |
Jefferies Group, Inc. | 46,500 | 653,790 |
| Shares | Value ($) |
| |
Joy Global, Inc. | 66,475 | 1,521,613 |
Lam Research Corp.* | 25,300 | 538,384 |
Life Technologies Corp.* | 45,400 | 1,058,274 |
Martin Marietta Materials, Inc. (a) | 6,800 | 660,144 |
Metabolix, Inc.* (a) | 42,500 | 540,600 |
Mueller Water Products, Inc. "A" | 62,100 | 521,640 |
Mylan, Inc.* (a) | 134,900 | 1,334,161 |
NeuStar, Inc. "A"* | 58,900 | 1,126,757 |
NxStage Medical, Inc.* | 175,600 | 468,852 |
Owens & Minor, Inc. | 48,300 | 1,818,495 |
Perficient, Inc.* | 49,500 | 236,610 |
Phillips-Van Heusen Corp. | 28,800 | 579,744 |
Schawk, Inc. | 78,400 | 898,464 |
Somanetics Corp.* | 75,900 | 1,253,109 |
Thoratec Corp.* | 93,200 | 3,028,068 |
THQ, Inc.* | 121,200 | 507,828 |
Ultra Petroleum Corp.* | 77,800 | 2,684,878 |
Waddell & Reed Financial, Inc. "A" | 48,500 | 749,810 |
(Cost $47,468,907) | 48,864,875 |
Total Common Stocks (Cost $137,834,059) | 120,070,499 |
|
Securities Lending Collateral 13.9% |
Daily Assets Fund Institutional, 1.69% (d) (e) (Cost $17,084,496) | 17,084,496 | 17,084,496 |
|
Cash Equivalents 1.3% |
Cash Management QP Trust, 1.42% (d) (Cost $1,583,652) | 1,583,652 | 1,583,652 |
| % of Net Assets | Value ($) |
| |
Total Investment Portfolio (Cost $156,502,207)+ | 113.2 | 138,738,647 |
Other Assets and Liabilities, Net | (13.2) | (16,194,822) |
Net Assets | 100.0 | 122,543,825 |
* Non-income producing security.+ The cost for federal income tax purposes was $158,829,287. At December 31, 2008, net unrealized depreciation for all securities based on tax cost was $20,090,640. This consisted of aggregate gross unrealized appreciation for all securities in which there was an excess of value over tax cost of $24,728,164 and aggregate gross unrealized depreciation for all securities in which there was an excess of tax cost over value of $44,818,804.(a) All or a portion of these securities were on loan (see Notes to Financial Statements). The value of all securities loaned at December 31, 2008 amounted to $16,526,028, which is 13.5% of net assets.(b) Security is listed in country of domicile. Significant business activities of the company are in Norway.(c) Security is listed in country of domicile. Significant business activities of the company are in China.(d) Affiliated fund managed by Deutsche Investment Management Americas Inc. The rate shown is the annualized seven-day yield at period end.(e) Represents collateral held in connection with securities lending. Income earned by the Portfolio is net of borrower rebates.144A: Security exempt from registration under Rule 144A of the Securities Act of 1933. These securities may be resold in transactions exempt from registration, normally to qualified institutional buyers.ADR: American Depositary ReceiptGDR: Global Depositary ReceiptFair Value Measurements
The following is a summary of the inputs used as of December 31, 2008 in valuing the Portfolio's investments. For information on the Portfolio's policy regarding the valuation of investments and of the valuation inputs, and the aggregate levels used in the table below, please refer to the Security Valuation section of Note A in the accompanying Notes to the Financial Statements.
Valuation Inputs | Investments in Securities |
Level 1
| $ 71,719,009 |
Level 2
| 67,019,638 |
Level 3
| — |
Total | $ 138,738,647 |
The accompanying notes are an integral part of the financial statements.
Financial Statements
Statement of Assets and Liabilities as of December 31, 2008
|
Assets |
Investments:
Investments in securities, at value (cost $137,834,059), including $16,526,028 of securities loaned | $ 120,070,499 |
Investment in Daily Assets Fund Institutional (cost $17,084,496)* | 17,084,496 |
Investment in Cash Management QP Trust (cost $1,583,652) | 1,583,652 |
Total investments, at value (cost $156,502,207)
| 138,738,647 |
Cash
| 418 |
Foreign currency, at value (cost $27,783)
| 28,197 |
Receivable for investments sold
| 847,640 |
Dividends receivable
| 39,412 |
Interest receivable
| 31,710 |
Receivable for Portfolio shares sold
| 82,512 |
Foreign taxes recoverable
| 24,745 |
Other assets
| 38,829 |
Total assets
| 139,832,110 |
Liabilities |
Payable for Portfolio shares redeemed
| 15,150 |
Payable upon return of securities loaned
| 17,084,496 |
Accrued management fee
| 60,395 |
Accrued distribution service fee (Class B)
| 1,040 |
Other accrued expenses and payables
| 127,204 |
Total liabilities
| 17,288,285 |
Net assets, at value | $ 122,543,825 |
Net Assets Consist of |
Undistributed net investment income
| 298,854 |
Net unrealized appreciation (depreciation) on:
Investments | (17,763,560) |
Foreign currency | (915) |
Accumulated net realized gain (loss)
| (14,322,470) |
Paid-in capital
| 154,331,916 |
Net assets, at value | $ 122,543,825 |
Class A Net Asset Value, offering and redemption price per share ($117,421,297 ÷ 15,069,861 outstanding shares of beneficial interest, no par value, unlimited number of shares authorized)
| $ 7.79 |
Class B Net Asset Value, offering and redemption price per share ($5,122,528 ÷ 669,567 outstanding shares of beneficial interest, no par value, unlimited number of shares authorized)
| $ 7.65 |
* Represents collateral on securities loaned.The accompanying notes are an integral part of the financial statements.
Statement of Operations for the year ended December 31, 2008
|
Investment Income |
Income:
Dividends (net of foreign taxes withheld of $323,075)
| $ 5,015,732 |
Interest
| 4,084 |
Interest — Cash Management QP Trust
| 117,270 |
Securities lending income, including income from Daily Assets Fund Institutional, net of borrower rebates
| 623,481 |
Total Income
| 5,760,567 |
Expenses:
Management fee
| 2,040,460 |
Administration fee
| 229,265 |
Custodian fee
| 152,041 |
Distribution service fee (Class B)
| 22,275 |
Services to shareholders
| 1,037 |
Record keeping fee (Class B)
| 5,578 |
Professional fees
| 79,387 |
Trustees' fees and expenses
| 11,624 |
Reports to shareholders
| 9,453 |
Other
| 19,828 |
Total expenses before expense reductions
| 2,570,948 |
Expense reductions
| (283,039) |
Total expenses after expense reductions
| 2,287,909 |
Net investment income (loss) | 3,472,658 |
Realized and Unrealized Gain (Loss) |
Net realized gain (loss) from:
Investments
| (11,343,628) |
Foreign currency
| (70,789) |
| (11,414,417) |
Change in net unrealized appreciation (depreciation) on:
Investments
| (135,414,718) |
Foreign currency
| (18,560) |
| (135,433,278) |
Net gain (loss) | (146,847,695) |
Net increase (decrease) in net assets resulting from operations | $ (143,375,037) |
The accompanying notes are an integral part of the financial statements.
Statement of Changes in Net Assets |
| Years Ended December 31, |
Increase (Decrease) in Net Assets | 2008 | 2007 |
Operations:
Net investment income (loss)
| $ 3,472,658 | $ 1,523,675 |
Net realized gain (loss)
| (11,414,417) | 41,714,536 |
Change in net unrealized appreciation (depreciation)
| (135,433,278) | (9,538,525) |
Net increase (decrease) in net assets resulting from operations
| (143,375,037) | 33,699,686 |
Distributions to shareholders from:
Net investment income:
Class A | (606,759) | (4,162,201) |
Class B | — | (385,143) |
Net realized gains:
Class A | (38,799,742) | (23,747,876) |
Class B | (1,584,503) | (2,659,501) |
Total distributions
| (40,991,004) | (30,954,721) |
Portfolio share transactions:
Class A Proceeds from shares sold
| 9,798,954 | 25,551,412 |
Reinvestment of distributions
| 39,406,501 | 27,910,077 |
Cost of shares redeemed
| (64,901,647) | (76,124,259) |
Net increase (decrease) in net assets from Class A share transactions
| (15,696,192) | (22,662,770) |
Class B Proceeds from shares sold
| 887,328 | 2,661,166 |
Reinvestment of distributions
| 1,584,503 | 3,044,644 |
Cost of shares redeemed
| (2,362,537) | (30,666,540) |
Net increase (decrease) in net assets from Class B share transactions
| 109,294 | (24,960,730) |
Increase (decrease) in net assets | (199,952,939) | (44,878,535) |
Net assets at beginning of period
| 322,496,764 | 367,375,299 |
Net assets at end of period (including undistributed net investment income and accumulated distributions in excess of net investment income of $298,854 and $4,870,687, respectively)
| $ 122,543,825 | $ 322,496,764 |
Other Information |
Class A Shares outstanding at beginning of period
| 16,980,253 | 18,234,839 |
Shares sold
| 754,392 | 1,377,801 |
Shares issued to shareholders in reinvestment of distributions
| 2,730,873 | 1,512,741 |
Shares redeemed
| (5,395,657) | (4,145,128) |
Net increase (decrease) in Class A shares
| (1,910,392) | (1,254,586) |
Shares outstanding at end of period
| 15,069,861 | 16,980,253 |
Class B Shares outstanding at beginning of period
| 673,793 | 2,034,192 |
Shares sold
| 67,771 | 144,813 |
Shares issued to shareholders in reinvestment of distributions
| 111,428 | 167,013 |
Shares redeemed
| (183,425) | (1,672,225) |
Net increase (decrease) in Class B shares
| (4,226) | (1,360,399) |
Shares outstanding at end of period
| 669,567 | 673,793 |
The accompanying notes are an integral part of the financial statements.
Financial Highlights
Class A Years Ended December 31, | 2008 | 2007 | 2006 | 2005 | 2004 |
Selected Per Share Data |
Net asset value, beginning of period | $ 18.28 | $ 18.15 | $ 15.00 | $ 12.77 | $ 10.38 |
Income (loss) from investment operations: Net investment income (loss)a | .20e | .08d | .03c | .04 | .01 |
Net realized and unrealized gain (loss) | (8.18) | 1.61 | 3.28 | 2.27 | 2.41 |
Total from investment operations | (7.98) | 1.69 | 3.31 | 2.31 | 2.42 |
Less distributions from: Net investment income | (.04) | (.23) | (.16) | (.08) | (.03) |
Net realized gains | (2.47) | (1.33) | — | — | — |
Total distributions | (2.51) | (1.56) | (.16) | (.08) | (.03) |
Net asset value, end of period | $ 7.79 | $ 18.28 | $ 18.15 | $ 15.00 | $ 12.77 |
Total Return (%)
| (49.96)b | 9.33b | 22.08c | 18.19 | 23.35 |
Ratios to Average Net Assets and Supplemental Data |
Net assets, end of period ($ millions)
| 117 | 310 | 331 | 285 | 232 |
Ratio of expenses before expense reductions (%)
| 1.11 | 1.14 | 1.12 | 1.17 | 1.18 |
Ratio of expenses after expense reductions (%)
| .99 | 1.12 | 1.12 | 1.17 | 1.18 |
Ratio of net investment income (loss) (%)
| 1.53e | .45d | .16c | .32 | .09 |
Portfolio turnover rate (%)
| 21 | 19 | 28 | 30 | 24 |
a Based on average shares outstanding during the period.
b Total return would have been lower had certain expenses not been reduced.
c Includes non-recurring income from the Advisor recorded as a result of an administrative proceeding regarding disclosure of brokerage allocation practices in connection with sales of DWS Funds. The non-recurring income resulted in an increase in net investment income of $0.002 per share and an increase in the ratio of net investment income of 0.01%. Excluding this non-recurring income, total return would have been 0.01% lower.
d Net investment income per share and the ratio of net investment income include non-recurring dividend income amounting to $0.02 per share and 0.09% of average daily net assets, respectively.
e Net investment income per share and the ratio of net investment income include non-recurring dividend income amounting to $0.05 per share and 0.37% of average daily net assets, respectively.
|
Class B Years Ended December 31, | 2008 | 2007 | 2006 | 2005 | 2004 |
Selected Per Share Data |
Net asset value, beginning of period | $ 18.03 | $ 17.93 | $ 14.84 | $ 12.62 | $ 10.25 |
Income (loss) from investment operations: Net investment income (loss)a | .16f | .01e | (.00)b,d | .03 | (.01) |
Net realized and unrealized gain (loss) | (8.07) | 1.61 | 3.24 | 2.24 | 2.38 |
Total from investment operations | (7.91) | 1.62 | 3.24 | 2.27 | 2.37 |
Less distributions from: Net investment income | — | (.19) | (.15) | (.05) | — |
Net realized gains | (2.47) | (1.33) | — | — | — |
Total distributions | (2.47) | (1.52) | (.15) | (.05) | — |
Net asset value, end of period | $ 7.65 | $ 18.03 | $ 17.93 | $ 14.84 | $ 12.62 |
Total Return (%)
| (50.16)c | 8.92c | 21.88c,d | 18.06c | 23.12c |
Ratios to Average Net Assets and Supplemental Data |
Net assets, end of period ($ millions)
| 5 | 12 | 37 | 33 | 24 |
Ratio of expenses before expense reductions (%)
| 1.42 | 1.53 | 1.51 | 1.54 | 1.52 |
Ratio of expenses after expense reductions (%)
| 1.30 | 1.50 | 1.31 | 1.24 | 1.39 |
Ratio of net investment income (loss) (%)
| 1.21f | .07e | (.03)d | .25 | (.12) |
Portfolio turnover rate (%)
| 21 | 19 | 28 | 30 | 24 |
a Based on average shares outstanding during the period.
b Amount is less than $.005.
c Total return would have been lower had certain expenses not been reduced.
d Includes non-recurring income from the Advisor recorded as a result of an administrative proceeding regarding disclosure of brokerage allocation practices in connection with sales of DWS Funds. The non-recurring income resulted in an increase in net investment income of $0.002 per share and an increase in the ratio of net investment income of 0.01%. Excluding this non-recurring income, total return would have been 0.01% lower.
e Net investment income per share and the ratio of net investment income include non-recurring dividend income amounting to $0.02 per share and 0.09% of average daily net assets, respectively.
f Net investment income per share and the ratio of net investment income include non-recurring dividend income amounting to $0.05 per share and 0.37% of average daily net assets, respectively.
|
Performance Summary December 31, 2008
DWS International VIP
All performance shown is historical, assumes reinvestment of all dividend and capital gain distributions, and does not guarantee future results. Investment return and principal value fluctuate with changing market conditions so that, when redeemed, shares may be worth more or less than their original cost. Current performance may be lower or higher than the performance data quoted. Please contact your participating insurance company for the Portfolio's most recent month-end performance. Performance doesn't reflect charges and fees ("contract charges") associated with the separate account that invests in the Portfolio or any variable life insurance policy or variable annuity contract for which the Portfolio is an investment option. These charges and fees will reduce returns. While all share classes have the same underlying portfolio, their performance will differ.
The total annual portfolio operating expense ratios, gross of any fee waivers or expense reimbursements, as stated in the fee table of the prospectus dated May 1, 2008 are 0.94% and 1.19% for Class A and Class B shares, respectively. Please see the Information About Your Portfolio's Expenses, the Financial Highlights and Notes to the Financial Statements (Note C, Related Parties) sections of this report for gross and net expense related disclosure for the period ended December 31, 2008.
Portfolio returns during all periods shown reflect a fee waiver and/or reimbursement. Without this waiver/reimbursement, returns would have been lower.
Risk Considerations
This Portfolio is subject to stock market risk. Investing in foreign securities presents certain risks, such as currency fluctuation, political and economic changes and market risks. This may result in greater share price volatility. Derivatives may be more volatile and less liquid than traditional securities, and the Portfolio could suffer losses on an underlying Portfolio's derivative position. Investing in securities of emerging markets presents certain risks, such as currency fluctuation, political and economic changes and market risks. Please read this Portfolio's prospectus for specific details regarding its investments and risk profile.
Growth of an Assumed $10,000 Investment |
[] DWS International VIP — Class A [] MSCI EAFE® Index | The Morgan Stanley Capital International (MSCI) Europe, Australasia and Far East (EAFE®) Index is an unmanaged index that tracks international stock performance in the 21 developed markets in Europe, Australasia and the Far East. The index is calculated using closing local market prices and translates into US dollars using the London close foreign exchange rates. Index returns assume the reinvestment of dividends net of withholding tax and, unlike portfolio returns, do not reflect any fees or expenses. It is not possible to invest directly into an index. |
 | |
Yearly periods ended December 31 |
|
Comparative Results |
DWS International VIP | 1-Year | 3-Year | 5-Year | 10-Year |
Class A | Growth of $10,000
| $5,179 | $7,472 | $10,115 | $8,824 |
Average annual total return
| -48.21% | -9.26% | .23% | -1.24% |
MSCI EAFE® Index
| Growth of $10,000
| $5,662 | $7,953 | $10,857 | $10,828 |
Average annual total return
| -43.38% | -7.35% | 1.66% | .80% |
DWS International VIP | 1-Year | 3-Year | 5-Year | 10-Year |
Class B | Growth of $10,000
| $5,175 | $7,417 | $9,976 | $8,623 |
Average annual total return
| -48.25% | -9.48% | -.05% | -1.47% |
MSCI EAFE® Index
| Growth of $10,000
| $5,662 | $7,953 | $10,857 | $10,828 |
Average annual total return
| -43.38% | -7.35% | 1.66% | .80% |
The growth of $10,000 is cumulative.
Information About Your Portfolio's Expenses
DWS International VIP
As an investor of the Portfolio, you incur two types of costs: ongoing expenses and transaction costs. Ongoing expenses include management fees, distribution and service (12b-1) fees and other Portfolio expenses. Examples of transaction costs include contract charges, redemption fees and account maintenance fees, which are not shown in this section. The following tables are intended to help you understand your ongoing expenses (in dollars) of investing in the Portfolio and to help you compare these expenses with the ongoing expenses of investing in other mutual funds. In the most recent six-month period, the Portfolio limited these expenses; had it not done so, expenses would have been higher. The example in the table is based on an investment of $1,000 invested at the beginning of the six-month period and held for the entire period (July 1, 2008 to December 31, 2008).
The tables illustrate your Portfolio's expenses in two ways:
• Actual Portfolio Return. This helps you estimate the actual dollar amount of ongoing expenses (but not transaction costs) paid on a $1,000 investment in the Portfolio using the Portfolio's actual return during the period. To estimate the expenses you paid over the period, simply divide your account value by $1,000 (for example, an $8,600 account value divided by $1,000 = 8.6), then multiply the result by the number in the "Expenses Paid per $1,000" line under the share class you hold.
• Hypothetical 5% Portfolio Return. This helps you to compare your Portfolio's ongoing expenses (but not transaction costs) with those of other mutual funds using the Portfolio's actual expense ratio and a hypothetical rate of return of 5% per year before expenses. Examples using a 5% hypothetical Portfolio return may be found in the shareholder reports of other mutual funds. The hypothetical account values and expenses may not be used to estimate the actual ending account balance or expenses you paid for the period.
Please note that the expenses shown in these tables are meant to highlight your ongoing expenses only and do not reflect any transaction costs. The "Expenses Paid per $1,000" line of the tables is useful in comparing ongoing expenses only and will not help you determine the relative total expense of owning different funds. If these transaction costs had been included, your costs would have been higher.
Expenses and Value of a $1,000 Investment for the six months ended December 31, 2008 |
Actual Portfolio Return | Class A | | Class B | |
Beginning Account Value 7/1/08
| $ 1,000.00 | | $ 1,000.00 | |
Ending Account Value 12/31/08
| $ 556.30 | | $ 557.20 | |
Expenses Paid per $1,000*
| $ 3.79 | | $ 4.78 | |
Hypothetical 5% Portfolio Return | Class A | | Class B | |
Beginning Account Value 7/1/08
| $ 1,000.00 | | $ 1,000.00 | |
Ending Account Value 12/31/08
| $ 1,020.26 | | $ 1,019.00 | |
Expenses Paid per $1,000*
| $ 4.93 | | $ 6.19 | |
* Expenses are equal to the Portfolio's annualized expense ratio for each share class, multiplied by the average account value over the period, multiplied by the number of days in the most recent six-month period, then divided by 366.Annualized Expense Ratios | Class A | | Class B | |
DWS Variable Series I — DWS International VIP
| .97% | | 1.22% | |
For more information, please refer to the Portfolio's prospectus.
These tables do not reflect charges and fees ("contract charges") associated with the separate account that invests in the Portfolio or any variable life insurance policy or variable annuity contract for which the Portfolio is an investment option.
Management Summary December 31, 2008
DWS International VIP
The MSCI EAFE® Index (the Portfolio's benchmark) returned -43.38% during the 12-month period ended December 31, 2008, a year that was characterized by the rapid expansion of the global financial crisis, slowing economic growth and sharply elevated investor risk aversion. During the same period, Class A shares of the Portfolio returned -48.21% (unadjusted for contract charges), underperforming the index. The primary reason for underperformance was the Portfolio's level of risk exposure coming into the autumn downturn. Starting in mid-August, we sought to reduce risk by decreasing the Portfolio's weightings in higher-risk areas such as mid- and small-caps, emerging-market stocks and cyclicals. Unfortunately, we did not make these changes quickly enough to prevent underperformance.
For the full year, the Portfolio's return was helped by an underweight in financials and favorable stock selection in the information technology and health care sectors, but this was offset by weaker stock selection in the consumer staples and consumer discretionary sectors.1 The leading contributors to performance included iShares MSCI Japan Index Fund, BASF SE and China Mobile Ltd. The most significant detractors were the Russian gas company Gazprom and the brewer Carlsberg AS.
Believing that recovery in the global economy will likely occur slowly, we are maintaining a defensive positioning in the Portfolio. We believe sectors with high cash flows, stable earnings and a low sensitivity to economic trends, such as health care and telecommunications are well positioned in this market. At the same time, the Portfolio is underweight in areas that are more dependent on economic growth, such as industrials, financials and the consumer discretionary sector. Although defensive for now, we are also keeping a close eye on stock-specific opportunities given that dividend yields are attractive and price-to-book values are at their lowest level of the past 10-15 years.
Joseph Axtell, CFA
Portfolio Manager
The Morgan Stanley Capital International (MSCI) Europe, Australasia and Far East (EAFE®) Index is an unmanaged index that tracks international stock performance in the 21 developed markets in Europe, Australasia and the Far East. The index is calculated using closing local market prices and translates into US dollars using the London close foreign exchange rates.
Index returns assume the reinvestment of dividends net of withholding tax and, unlike portfolio returns, do not reflect any fees or expenses. It is not possible to invest directly into an index.
1 "Overweight" means the portfolio holds a higher weighting in a given sector or security than the benchmark. "Underweight" means the portfolio holds a lower weighting.Portfolio management market commentary is as of December 31, 2008, and may not come to pass. This information is subject to change at any time based on market and other conditions. Past performance does not guarantee future results. Current and future portfolio holdings are subject to risk.
Portfolio Summary
DWS International VIP
Asset Allocation (As a % of Investment Portfolio excluding Securities Lending Collateral) | 12/31/08 | 12/31/07 |
| | |
Common Stocks | 93% | 98% |
Exchange Traded Funds | 5% | — |
Cash Equivalents | 2% | — |
Preferred Stocks | — | 2% |
| 100% | 100% |
Geographical Diversification
(As a % of Investment Portfolio excluding Cash Equivalents and Securities Lending Collateral) | 12/31/08 | 12/31/07 |
| | |
Continental Europe | 62% | 53% |
Japan | 22% | 14% |
United Kingdom | 8% | 15% |
Pacific Basin | 5% | 7% |
Latin America | 2% | 3% |
Australia | — | 3% |
Middle East | — | 3% |
Other | 1% | 2% |
| 100% | 100% |
Sector Diversification (As a % of Common and Preferred Stocks) | 12/31/08 | 12/31/07 |
| | |
Health Care | 22% | 6% |
Financials | 20% | 22% |
Telecommunication Services | 12% | 9% |
Energy | 11% | 5% |
Consumer Staples | 10% | 7% |
Utilities | 4% | 5% |
Industrials | 8% | 17% |
Materials | 8% | 10% |
Information Technology | 5% | 5% |
Consumer Discretionary | — | 14% |
| 100% | 100% |
Asset allocation, geographical diversification and sector diversification are subject to change.
For more complete details about the Portfolio's investment portfolio, see page 70 . A complete list of portfolio holdings of the Portfolio is posted as of the month end on www.dws-investments.com on or about the 15th day of the following month. More frequent posting of portfolio holdings information may be made from time to time on www.dws-investments.com.
Following the Portfolio's fiscal first and third quarter-end, a complete portfolio holdings listing is filed with the SEC on Form N-Q. The form will be available on the SEC's Web site at www.sec.gov, and it also may be reviewed and copied at the SEC's Public Reference Room in Washington, D.C. Information on the operation of the SEC's Public Reference Room may be obtained by calling (800) SEC-0330.
Investment Portfolio December 31, 2008
DWS International VIP
|
Shares
| Value ($) |
| |
Common Stocks 93.1% |
Austria 2.1% |
Intercell AG* (a) (Cost $5,900,688) | 203,044 | 6,225,455 |
Brazil 1.1% |
Petroleo Brasileiro SA (ADR) (Cost $6,908,534) | 132,700 | 3,249,823 |
Canada 0.8% |
Potash Corp. of Saskatchewan, Inc. (Cost $4,038,322) | 31,221 | 2,264,543 |
China 2.1% |
China Life Insurance Co., Ltd. "H" (Cost $7,675,110) | 2,054,200 | 6,330,186 |
Denmark 3.5% |
Carlsberg AS "B" | 122,625 | 4,025,899 |
Novo Nordisk AS "B" | 127,500 | 6,488,396 |
(Cost $20,683,392) | 10,514,295 |
Finland 2.9% |
Fortum Oyj | 253,300 | 5,440,729 |
Nokia Oyj | 201,000 | 3,116,089 |
(Cost $15,817,151) | 8,556,818 |
France 8.7% |
Alstom SA | 50,830 | 3,001,655 |
AXA SA | 225,021 | 5,016,775 |
BNP Paribas | 91,224 | 3,852,060 |
Societe Generale | 100,059 | 5,067,741 |
Total SA | 166,273 | 9,064,817 |
(Cost $29,786,169) | 26,003,048 |
Germany 18.4% |
Allianz SE (Registered) | 57,948 | 6,215,391 |
BASF SE | 133,400 | 5,271,239 |
Bayer AG | 117,992 | 6,931,411 |
Deutsche Boerse AG | 83,700 | 6,096,062 |
Deutsche Telekom AG (Registered) | 441,000 | 6,700,361 |
E.ON AG | 128,504 | 5,196,337 |
Fresenius Medical Care AG & Co. KGaA | 99,682 | 4,674,401 |
Gerresheimer AG | 128,308 | 3,517,674 |
Linde AG | 46,200 | 3,909,605 |
Muenchener Rueckversicherungs-Gesellschaft AG (Registered) | 39,700 | 6,238,736 |
(Cost $53,732,769) | 54,751,217 |
Hong Kong 2.2% |
China Mobile Ltd. (Cost $7,033,629) | 637,500 | 6,463,488 |
Ireland 1.0% |
CRH PLC (Cost $2,997,259) | 114,700 | 2,894,760 |
Italy 2.7% |
Intesa Sanpaolo | 1,337,500 | 4,817,583 |
Saipem SpA | 197,500 | 3,316,293 |
(Cost $16,369,994) | 8,133,876 |
|
Shares
| Value ($) |
| |
Japan 16.4% |
Astellas Pharma, Inc. | 124,100 | 5,049,802 |
Canon, Inc. | 189,150 | 5,937,710 |
East Japan Railway Co. | 85,500 | 6,657,465 |
Japan Tobacco, Inc. | 1,869 | 6,189,013 |
Mitsubishi Corp. | 250,500 | 3,516,630 |
Mitsubishi UFJ Financial Group, Inc. | 660,100 | 4,095,870 |
Nintendo Co., Ltd. | 11,600 | 4,456,661 |
Nippon Telegraph & Telephone Corp. | 81,000 | 4,334,502 |
Seven & I Holdings Co., Ltd. | 128,000 | 4,385,245 |
Terumo Corp. | 90,300 | 4,228,840 |
(Cost $52,715,201) | 48,851,738 |
Luxembourg 0.9% |
ArcelorMittal (Cost $4,915,693) | 114,170 | 2,751,863 |
Mexico 0.6% |
America Movil SAB de CV "L" (ADR) (Cost $3,372,337) | 59,600 | 1,847,004 |
Norway 2.4% |
DnB NOR ASA | 448,100 | 1,789,984 |
StatoilHydro ASA | 325,400 | 5,359,426 |
(Cost $14,620,371) | 7,149,410 |
Russia 1.1% |
Gazprom (ADR) (Cost $8,840,547) | 219,400 | 3,139,524 |
Singapore 1.2% |
United Overseas Bank Ltd. (Cost $5,690,961) | 397,000 | 3,583,743 |
Spain 3.1% |
Telefonica SA (Cost $7,881,341) | 411,463 | 9,223,134 |
Switzerland 13.9% |
ABB Ltd. (Registered)* | 329,231 | 4,962,898 |
Lonza Group AG (Registered) | 53,091 | 4,907,996 |
Nestle SA (Registered) | 239,973 | 9,457,954 |
Novartis AG (Registered) | 183,869 | 9,212,662 |
Roche Holding AG (Genusschein) | 61,048 | 9,397,344 |
Xstrata PLC | 366,059 | 3,412,633 |
(Cost $44,490,633) | 41,351,487 |
United Kingdom 8.0% |
AMEC PLC | 296,311 | 2,114,926 |
Babcock International Group PLC | 178,511 | 1,227,980 |
BAE Systems PLC | 427,314 | 2,328,969 |
BG Group PLC | 310,040 | 4,304,523 |
HSBC Holdings PLC | 254,314 | 2,434,097 |
Imperial Tobacco Group PLC | 179,325 | 4,790,332 |
Vodafone Group PLC | 3,363,709 | 6,771,529 |
(Cost $33,019,533) | 23,972,356 |
Total Common Stocks (Cost $346,489,634) | 277,257,768 |
|
|
Shares
| Value ($) |
| |
Exchange Traded Fund 4.8% |
Japan |
iShares MSCI Japan Index Fund (a) (Cost $17,641,521) | 1,477,990 | 14,188,704 |
|
Securities Lending Collateral 1.2% |
Daily Assets Fund Institutional, 1.69% (b) (c) (Cost $3,581,750) | 3,581,750 | 3,581,750 |
|
|
Shares
| Value ($) |
| |
Cash Equivalents 1.6% |
Cash Management QP Trust, 1.42% (b) (Cost $4,912,228) | 4,912,228 | 4,912,228 |
| % of Net Assets | Value ($) |
| |
Total Investment Portfolio (Cost $372,625,133)+ | 100.7 | 299,940,450 |
Other Assets and Liabilities, Net | (0.7) | (2,180,816) |
Net Assets | 100.0 | 297,759,634 |
* Non-income producing security.+ The cost for federal income tax purposes was $375,669,028. At December 31, 2008, net unrealized depreciation for all securities based on tax cost was $75,728,578. This consisted of aggregate gross unrealized appreciation for all securities in which there was an excess of value over tax cost of $21,641,676 and aggregate gross unrealized depreciation for all securities in which there was an excess of tax cost over value of $97,370,254.(a) All or a portion of these securities were on loan (see Notes to Financial Statements). The value of all securities loaned at December 31, 2008 amounted to $3,462,631, which is 1.2% of net assets.(b) Affiliated fund managed by Deutsche Investment Management Americas Inc. The rate shown is the annualized seven-day yield at period end.(c) Represents collateral held in connection with securities lending. Income earned by the Portfolio is net of borrower rebates.ADR: American Depositary Receipt
MSCI: Morgan Stanley Capital International
Fair Value Measurements
The following is a summary of the inputs used as of December 31, 2008 in valuing the Portfolio's investments. For information on the Portfolio's policy regarding the valuation of investments and of the valuation inputs, and the aggregate levels used in the table below, please refer to the Security Valuation section of Note A in the accompanying Notes to the Financial Statements.
Valuation Inputs | Investments in Securities |
Level 1
| $ 28,271,348 |
Level 2
| 271,669,102 |
Level 3
| — |
Total | $ 299,940,450 |
The accompanying notes are an integral part of the financial statements.
Financial Statements
Statement of Assets and Liabilities as of December 31, 2008
|
Assets |
Investments:
Investments in securities, at value (cost $364,131,155), including $3,462,631 of securities loaned | $ 291,446,472 |
Investment in Daily Assets Fund Institutional (cost $3,581,750)* | 3,581,750 |
Investment in Cash Management QP Trust (cost $4,912,228) | 4,912,228 |
Total investments, at value (cost $372,625,133)
| 299,940,450 |
Foreign currency, at value (cost $1,144,364)
| 1,139,056 |
Dividends receivable
| 528,481 |
Interest receivable
| 12,638 |
Receivable for Portfolio shares sold
| 294,967 |
Foreign taxes recoverable
| 174,253 |
Other assets
| 13,892 |
Total assets
| 302,103,737 |
Liabilities |
Cash overdraft
| 3,198 |
Payable for Portfolio shares redeemed
| 422,617 |
Payable upon return of securities loaned
| 3,581,750 |
Accrued management fee
| 72,431 |
Accrued distriubtion service fee (Class B)
| 81 |
Other accrued expenses and payables
| 264,026 |
Total liabilities
| 4,344,103 |
Net assets, at value | $ 297,759,634 |
Net Assets Consist of |
Undistributed net investment income
| 13,320,593 |
Net unrealized appreciation (depreciation) on:
Investments | (72,684,683) |
Foreign currency | (22,154) |
Accumulated net realized gain (loss)
| (120,039,058) |
Paid-in capital
| 477,184,936 |
Net assets, at value | $ 297,759,634 |
Class A Net Asset Value, offering and redemption price per share ($297,365,049 ÷ 45,605,566 outstanding shares of beneficial interest, no par value, unlimited number of shares authorized)
| $ 6.52 |
Class B Net Asset Value, offering and redemption price per share ($394,585 ÷ 60,497 outstanding shares of beneficial interest, no par value, unlimited number of shares authorized)
| $ 6.52 |
* Represents collateral on securities loaned.The accompanying notes are an integral part of the financial statements.
Statement of Operations for the year ended December 31, 2008
|
Investment Income |
Income:
Dividends (net of foreign taxes withheld of $1,421,293)
| $ 18,201,162 |
Interest
| 49,110 |
Interest — Cash Management QP Trust
| 203,706 |
Securities lending income, including income from Daily Assets Fund Institutional, net of borrower rebates
| 759,041 |
Other income
| 6,749 |
Total Income
| 19,219,768 |
Expenses:
Management fee
| 3,994,718 |
Administration fee
| 519,230 |
Custodian fee
| 473,256 |
Distribution service fee (Class B)
| 9,785 |
Services to shareholders
| 2,789 |
Record keeping fee (Class B)
| 3,228 |
Professional fees
| 94,496 |
Trustees' fees and expenses
| 27,641 |
Reports to shareholders
| 50,009 |
Other
| 67,427 |
Total expenses before expense reductions
| 5,242,579 |
Expense reductions
| (216,496) |
Total expenses after expense reductions
| 5,026,083 |
Net investment income (loss) | 14,193,685 |
Realized and Unrealized Gain (Loss) |
Net realized gain (loss) from:
Investments (net of foreign taxes of $13,109)
| (117,379,961) |
Foreign currency
| (708,199) |
Payments by affiliates (See Note H)
| 304,364 |
| (117,783,796) |
Change in net unrealized appreciation (depreciation) on:
Investments (net of deferred foreign tax credit of $152,816)
| (202,765,850) |
Foreign currency
| (45,588) |
| (202,811,438) |
Net gain (loss) | (320,595,234) |
Net increase (decrease) in net assets resulting from operations | $ (306,401,549) |
The accompanying notes are an integral part of the financial statements.
Statement of Changes in Net Assets |
| Years Ended December 31, |
Increase (Decrease) in Net Assets | 2008 | 2007 |
Operations:
Net investment income (loss)
| $ 14,193,685 | $ 11,097,935 |
Net realized gain (loss)
| (117,783,796) | 163,447,235 |
Change in net unrealized appreciation (depreciation)
| (202,811,438) | (70,490,293) |
Net increase (decrease) in net assets resulting from operations
| (306,401,549) | 104,054,877 |
Distributions to shareholders from:
Net investment income:
Class A | (7,239,383) | (17,645,331) |
Class B | (82,273) | (1,050,909) |
Net realized gains:
Class A | (94,147,000) | — |
Class B | (1,663,249) | — |
Total distributions
| (103,131,905) | (18,696,240) |
Portfolio share transactions:
Class A Proceeds from shares sold
| 22,286,975 | 64,649,737 |
Reinvestment of distributions
| 101,386,383 | 17,645,331 |
Cost of shares redeemed
| (121,263,622) | (163,705,768) |
Net increase (decrease) in net assets from Class A share transactions
| 2,409,736 | (81,410,700) |
Class B Proceeds from shares sold
| 338,048 | 1,213,337 |
Reinvestment of distributions
| 1,745,522 | 1,050,909 |
Cost of shares redeemed
| (11,371,669) | (45,235,722) |
Net increase (decrease) in net assets from Class B share transactions
| (9,288,099) | (42,971,476) |
Increase (decrease) in net assets | (416,411,817) | (39,023,539) |
Net assets at beginning of period
| 714,171,451 | 753,194,990 |
Net assets at end of period (including undistributed net investment income of $13,320,593 and $7,187,701, respectively)
| $ 297,759,634 | $ 714,171,451 |
Other Information |
Class A Shares outstanding at beginning of period
| 46,761,118 | 52,299,023 |
Shares sold
| 2,117,696 | 4,471,485 |
Shares issued to shareholders in reinvestment of distributions
| 8,413,808 | 1,243,505 |
Shares redeemed
| (11,687,056) | (11,252,895) |
Net increase (decrease) in Class A shares
| (1,155,552) | (5,537,905) |
Shares outstanding at end of period
| 45,605,566 | 46,761,118 |
Class B Shares outstanding at beginning of period
| 818,856 | 3,829,429 |
Shares sold
| 26,121 | 84,891 |
Shares issued to shareholders in reinvestment of distributions
| 144,736 | 74,060 |
Shares redeemed
| (929,216) | (3,169,524) |
Net increase (decrease) in Class B shares
| (758,359) | (3,010,573) |
Shares outstanding at end of period
| 60,497 | 818,856 |
The accompanying notes are an integral part of the financial statements.
Financial Highlights
Class A Years Ended December 31, | 2008 | 2007 | 2006 | 2005 | 2004 |
Selected Per Share Data |
Net asset value, beginning of period | $ 15.01 | $ 13.42 | $ 10.85 | $ 9.50 | $ 8.26 |
Income (loss) from investment operations: Net investment income (loss)a | .29e | .21d | .28c | .15 | .09 |
Net realized and unrealized gain (loss) | (6.46) | 1.73 | 2.51 | 1.36 | 1.26 |
Total from investment operations | (6.17) | 1.94 | 2.79 | 1.51 | 1.35 |
Less distributions from: Net investment income | (.17) | (.35) | (.22) | (.16) | (.11) |
Net realized gains | (2.15) | — | — | — | — |
Total distributions | (2.32) | (.35) | (.22) | (.16) | (.11) |
Net asset value, end of period | $ 6.52 | $ 15.01 | $ 13.42 | $ 10.85 | $ 9.50 |
Total Return (%)
| (48.21)b,f | 14.59 | 25.91 | 16.17 | 16.53 |
Ratios to Average Net Assets and Supplemental Data |
Net assets, end of period ($ millions)
| 297 | 702 | 702 | 558 | 533 |
Ratio of expenses before expense reductions (%)
| 1.01 | .98 | .98 | 1.02 | 1.04 |
Ratio of expenses after expense reductions (%)
| .97 | .98 | .98 | 1.02 | 1.04 |
Ratio of net investment income (loss) (%)
| 2.74e | 1.48d | 2.32c | 1.59 | 1.05 |
Portfolio turnover rate (%)
| 123 | 108 | 105 | 59 | 73 |
a Based on average shares outstanding during the period.
b Total return would have been lower had certain expenses not been reduced.
c Net investment income per share and the ratio of net investment income include non-recurring dividend income amounting to $0.11 per share and 0.92% of average daily net assets, respectively.
d Net investment income per share and the ratio of net investment income include non-recurring dividend income amounting to $0.05 per share and 0.33% of average daily net assets, respectively.
e Net investment income per share and the ratio of net investment income include non-recurring dividend income amounting to $0.09 per share and 0.82% of average daily net assets, respectively.
f Includes a reimbursement from the Advisor to reimburse the effect of losses incurred as the result of certain operation errors during the period. Excluding this reimbursement, total return would have been 0.06% lower.
|
Class B Years Ended December 31, | 2008 | 2007 | 2006 | 2005 | 2004 |
Selected Per Share Data |
Net asset value, beginning of period | $ 14.98 | $ 13.38 | $ 10.82 | $ 9.48 | $ 8.24 |
Income (loss) from investment operations: Net investment income (loss)a | .23e | .16d | .24c | .12 | .06 |
Net realized and unrealized gain (loss) | (6.43) | 1.73 | 2.50 | 1.35 | 1.27 |
Total from investment operations | (6.20) | 1.89 | 2.74 | 1.47 | 1.33 |
Less distributions from: Net investment income | (.11) | (.29) | (.18) | (.13) | (.09) |
Net realized gains | (2.15) | — | — | — | — |
Total distributions | (2.26) | (.29) | (.18) | (.13) | (.09) |
Net asset value, end of period | $ 6.52 | $ 14.98 | $ 13.38 | $ 10.82 | $ 9.48 |
Total Return (%)
| (48.25)b,f | 14.25b | 25.44b | 15.71b | 16.24b |
Ratios to Average Net Assets and Supplemental Data |
Net assets, end of period ($ millions)
| .40 | 12 | 51 | 40 | 35 |
Ratio of expenses before expense reductions (%)
| 1.33 | 1.41 | 1.37 | 1.41 | 1.38 |
Ratio of expenses after expense reductions (%)
| 1.28 | 1.39 | 1.36 | 1.37 | 1.35 |
Ratio of net investment income (loss) (%)
| 2.42e | 1.07d | 1.94c | 1.24 | .74 |
Portfolio turnover rate (%)
| 123 | 108 | 105 | 59 | 73 |
a Based on average shares outstanding during the period.
b Total return would have been lower had certain expenses not been reduced.
c Net investment income per share and the ratio of net investment income include non-recurring dividend income amounting to $0.11 per share and 0.92% of average daily net assets, respectively.
d Net investment income per share and the ratio of net investment income include non-recurring dividend income amounting to $0.05 per share and 0.33% of average daily net assets, respectively.
e Net investment income per share and the ratio of net investment income include non-recurring dividend income amounting to $0.09 per share and 0.82% of average daily net assets, respectively.
f Includes a reimbursement from the Advisor to reimburse the effect of losses incurred as the result of certain operation errors during the period. Excluding this reimbursement, total return would have been 0.06% lower.
|
Performance Summary December 31, 2008
DWS Health Care VIP
All performance shown is historical, assumes reinvestment of all dividend and capital gain distributions, and does not guarantee future results. Investment return and principal value fluctuate with changing market conditions so that, when redeemed, shares may be worth more or less then their original cost. Current performance may be lower or higher than the performance data quoted. Please contact your participating insurance company for the Portfolio's most recent month-end performance. Performance doesn't reflect charges and fees ("contract charges") associated with the separate account that invests in the Portfolio or any variable life insurance policy or variable annuity contract for which the Portfolio is an investment option. These charges and fees will reduce returns. While all share classes have the same underlying portfolio, their performance will differ.
The total annual portfolio operating expense ratios, gross of any fee waivers or expense reimbursements, as stated in the fee table of the prospectus dated May 1, 2008 are 0.90% and 1.28% for Class A and Class B shares, respectively. Please see the Information About Your Portfolio's Expenses, the Financial Highlights and Notes to the Financial Statements (Note C, Related Parties) sections of this report for gross and net expense related disclosure for the period ended December 31, 2008.
Risk Considerations
This Portfolio is subject to stock market risk. The Portfolio may focus its investments on certain industry sectors, thereby increasing its vulnerability to any single industry or regulatory development. All of these factors may result in greater share price volatility. Please read this Portfolio's prospectus for specific details regarding its investments and risk profile.
Growth of an Assumed $10,000 Investment |
[] DWS Health Care VIP — Class A [] S&P 500® Index [] S&P® GSSI Health Care Sector Index | The Standard & Poor's® 500 (S&P 500) Index is an unmanaged, capitalization-weighted index of 500 stocks. The index is designed to measure performance of the broad domestic economy through changes in the aggregate market value of 500 stocks representing all major industries. The S&P® GSSI Health Care Sector Index is an unmanaged, market capitalization-weighted index of 133 stocks designed to measure the performance of companies in the health care sector. Index returns assume the reinvestment of dividends and, unlike portfolio returns, do not reflect any fees or expenses. It is not possible to invest directly into an index. |
 | |
Yearly periods ended December 31 |
|
Comparative Results |
DWS Health Care VIP | 1-Year | 3-Year | 5-Year | Life of Portfolio* |
Class A | Growth of $10,000
| $7,680 | $9,230 | $10,975 | $12,017 |
Average annual total return
| -23.20% | -2.64% | 1.88% | 2.42% |
S&P 500 Index
| Growth of $10,000
| $6,300 | $7,696 | $8,953 | $8,325 |
Average annual total return
| -37.00% | -8.36% | -2.19% | -2.36% |
S&P GSSI Health Care Sector Index
| Growth of $10,000
| $7,641 | $8,721 | $10,390 | $10,354 |
Average annual total return
| -23.59% | -4.46% | .77% | .45% |
DWS Health Care VIP | 1-Year | 3-Year | 5-Year | Life of Class** |
Class B | Growth of $10,000
| $7,650 | $9,134 | $10,775 | $14,531 |
Average annual total return
| -23.50% | -2.97% | 1.50% | 5.92% |
S&P 500 Index
| Growth of $10,000
| $6,300 | $7,696 | $8,953 | $10,335 |
Average annual total return
| -37.00% | -8.36% | -2.19% | .51% |
S&P GSSI Health Care Sector Index
| Growth of $10,000
| $7,641 | $8,721 | $10,390 | $12,396 |
Average annual total return
| -23.59% | -4.46% | .77% | 3.35% |
The growth of $10,000 is cumulative.
* The Portfolio commenced operations on May 1, 2001. Index returns began on April 30, 2001.** The Portfolio commenced offering Class B shares on July 1, 2002. Index returns began on June 30, 2002.Information About Your Portfolio's Expenses
DWS Health Care VIP
As an investor of the Portfolio, you incur two types of costs: ongoing expenses and transaction costs. Ongoing expenses include management fees, distribution and service (12b-1) fees and other Portfolio expenses. Examples of transaction costs include contract charges, redemption fees and account maintenance fees, which are not shown in this section. The following tables are intended to help you understand your ongoing expenses (in dollars) of investing in the Portfolio and to help you compare these expenses with the ongoing expenses of investing in other mutual funds. The example in the table is based on an investment of $1,000 invested at the beginning of the six-month period and held for the entire period (July 1, 2008 to December 31, 2008).
The tables illustrate your Portfolio's expenses in two ways:
• Actual Portfolio Return. This helps you estimate the actual dollar amount of ongoing expenses (but not transaction costs) paid on a $1,000 investment in the Portfolio using the Portfolio's actual return during the period. To estimate the expenses you paid over the period, simply divide your account value by $1,000 (for example, an $8,600 account value divided by $1,000 = 8.6), then multiply the result by the number in the "Expenses Paid per $1,000" line under the share class you hold.
• Hypothetical 5% Portfolio Return. This helps you to compare your Portfolio's ongoing expenses (but not transaction costs) with those of other mutual funds using the Portfolio's actual expense ratio and a hypothetical rate of return of 5% per year before expenses. Examples using a 5% hypothetical Portfolio return may be found in the shareholder reports of other mutual funds. The hypothetical account values and expenses may not be used to estimate the actual ending account balance or expenses you paid for the period.
Please note that the expenses shown in these tables are meant to highlight your ongoing expenses only and do not reflect any transaction costs. The "Expenses Paid per $1,000" line of the tables is useful in comparing ongoing expenses only and will not help you determine the relative total expense of owning different funds. If these transaction costs had been included, your costs would have been higher.
Expenses and Value of a $1,000 Investment for the six months ended December 31, 2008 |
Actual Portfolio Return | Class A | | Class B | |
Beginning Account Value 7/1/08
| $ 1,000.00 | | $ 1,000.00 | |
Ending Account Value 12/31/08
| $ 824.60 | | $ 822.60 | |
Expenses Paid per $1,000*
| $ 4.17 | | $ 5.77 | |
Hypothetical 5% Portfolio Return | Class A | | Class B | |
Beginning Account Value 7/1/08
| $ 1,000.00 | | $ 1,000.00 | |
Ending Account Value 12/31/08
| $ 1,020.56 | | $ 1,018.80 | |
Expenses Paid per $1,000*
| $ 4.62 | | $ 6.39 | |
* Expenses are equal to the Portfolio's annualized expense ratio for each share class, multiplied by the average account value over the period, multiplied by the number of days in the most recent six-month period, then divided by 366.Annualized Expense Ratios | Class A | | Class B | |
DWS Variable Series I — DWS Health Care VIP
| .91% | | 1.26% | |
For more information, please refer to the Portfolio's prospectus.
These tables do not reflect charges and fees ("contract charges") associated with the separate account that invests in the Portfolio or any variable life insurance policy or variable annuity contract for which the Portfolio is an investment option.
The accompanying notes are an integral part of the financial statements.
Management Summary December 31, 2008
DWS Health Care VIP
During a period of economic weakness and instability in the financial system, which led investors to favor more defensive sectors such as health care, DWS Health Care VIP posted a negative return but strongly outperformed the general market with a -23.20% total return for its most recent fiscal year ended December 31, 2008 (Class A shares, unadjusted for contract charges). In comparison, the Standard & Poor's® 500 (S&P 500) Index returned -37.00% and the S&P GSSI Healthcare Sector Index returned -23.59% over the same period.
The portfolio's underweight positions in Medtronic, Inc., Merck & Co., Inc. and UnitedHealth Group, Inc., relative to the benchmark, helped performance during the annual period.1 Medtronic shares declined due to deteriorating trends in four of its five major businesses, while Merck shares were negatively impacted by concerns over its cholesterol drug franchise following disappointing data from clinical studies. In addition, sales trends for the company's key drugs were weaker than expected. UnitedHealth shares also declined significantly, as the company lowered its earnings forecast to reflect pressure on profit margins from higher medical costs and weaker than expected enrollment trends. The largest detractors from the Portfolio's relative performance came from underweight positions in Pfizer, Inc. and Johnson & Johnson. These companies' shares, representing meaningful weightings within the portfolio's benchmarks, held up better than industry averages during the period as investors favored more defensive, large-cap issues during the financial and economic crisis.
We believe that health care stocks should continue to outperform the general market as worries about the global economy and the credit crisis overshadow concerns over the potential impact of health care reform on sector financials. Despite the potential for declines in health care consumption due to higher drug co-payments, rising unemployment and the deferral of medical procedures, we think this sector is well positioned in the current environment. We expect health care reform to eventually lower overall health care spending. However, we are not convinced that major changes to the industry will be enacted and implemented before 2010.
The following person is responsible for the day-to-day management of the Portfolio.
Leefin Lai, CFA, CPA
Portfolio Manager
The following person serves as a consultant to the Advisor of the Portfolio.
Thomas E. Bucher, CFA
Consultant
The Standard & Poor's 500 (S&P 500) Index is an unmanaged, capitalization-weighted index of 500 stocks. The index is designed to measure performance of the broad domestic economy through changes in the aggregate market value of 500 stocks representing all major industries.
The S&P GSSI Health Care Sector Index is an unmanaged, market-capitalization-weighted index of 133 stocks designed to measure the performance of companies in the health care sector.
Index returns assume the reinvestment of dividends and, unlike portfolio returns, do not reflect any fees or expenses. It is not possible to invest directly into an index.
1 "Overweight" means the portfolio holds a higher weighting in a given sector or security than the benchmark. "Underweight" means the portfolio holds a lower weighting.Portfolio management market commentary is as of December 31, 2008, and may not come to pass. This information is subject to change at any time based on market and other conditions. Past performance does not guarantee future results. Current and future portfolio holdings are subject to risk.
Portfolio Summary
DWS Health Care VIP
Asset Allocation (As a % of Investment Portfolio excluding Securities Lending Collateral) | 12/31/08 | 12/31/07 |
| | |
Common Stocks | 98% | 99% |
Cash Equivalents | 2% | 1% |
| 100% | 100% |
Industry Diversification (As a % of Common Stocks) | 12/31/08 | 12/31/07 |
| | |
Pharmaceuticals | 31% | 31% |
Biotechnology | 26% | 21% |
Medical Supply & Specialty | 20% | 21% |
Health Care Services | 17% | 22% |
Life Sciences Equipment | 6% | 5% |
| 100% | 100% |
Asset allocation and industry diversification are subject to change.
For more complete details about the Portfolio's investment portfolio, see page 82. A complete list of portfolio holdings of the Portfolio is posted as of the month end on www.dws-investments.com on or about the 15th day of the following month. More frequent posting of portfolio holdings information may be made from time to time on www.dws-investments.com.
Following the Portfolio's fiscal first and third quarter-end, a complete portfolio holdings listing is filed with the SEC on Form N-Q. The form will be available on the SEC's Web site at www.sec.gov, and it also may be reviewed and copied at the SEC's Public Reference Room in Washington, D.C. Information on the operation of the SEC's Public Reference Room may be obtained by calling (800) SEC-0330.
Investment Portfolio December 31, 2008
DWS Health Care VIP
|
Shares
| Value ($) |
| |
Common Stocks 98.3% |
Health Care 98.3% |
Biotechnology 25.6% |
Acorda Therapeutics, Inc.* | 9,100 | 186,641 |
Alexion Pharmaceuticals, Inc.* (a) | 23,500 | 850,465 |
Allos Therapeutics, Inc.* | 35,300 | 216,036 |
Amgen, Inc.* | 36,450 | 2,104,987 |
Biogen Idec, Inc.* | 25,720 | 1,225,044 |
BioMarin Pharmaceutical, Inc.* (a) | 37,100 | 660,380 |
Celera Corp.* | 33,800 | 376,194 |
Celgene Corp.* | 32,460 | 1,794,389 |
Cepheid, Inc.* | 17,400 | 180,612 |
Gen-Probe, Inc.* | 11,000 | 471,240 |
Genentech, Inc.* | 21,500 | 1,782,565 |
Genmab A/S* | 4,500 | 173,620 |
Genzyme Corp.* | 32,800 | 2,176,936 |
Gilead Sciences, Inc.* | 50,800 | 2,597,912 |
Human Genome Sciences, Inc.* | 48,200 | 102,184 |
Incyte Corp.* | 52,200 | 197,838 |
OSI Pharmaceuticals, Inc.* | 5,200 | 203,060 |
Regeneron Pharmaceuticals, Inc.* | 18,100 | 332,316 |
Rigel Pharmaceuticals, Inc.* | 11,300 | 90,400 |
United Therapeutics Corp.* | 5,400 | 337,770 |
Vertex Pharmaceuticals, Inc.* (a) | 7,200 | 218,736 |
| 16,279,325 |
Health Care Services 16.1% |
Aetna, Inc. | 24,700 | 703,950 |
Allscripts-Misys Healthcare Solutions, Inc. (a) | 43,500 | 431,520 |
Covance, Inc.* | 8,900 | 409,667 |
CVS Caremark Corp. | 32,931 | 946,437 |
Express Scripts, Inc.* | 14,400 | 791,712 |
Fresenius Medical Care AG & Co. KGaA | 24,097 | 1,129,984 |
Laboratory Corp. of America Holdings* | 16,400 | 1,056,324 |
McKesson Corp. | 22,200 | 859,806 |
Medco Health Solutions, Inc.* | 22,268 | 933,252 |
Quality Systems, Inc. (a) | 9,500 | 414,390 |
Quest Diagnostics, Inc. | 24,300 | 1,261,413 |
UnitedHealth Group, Inc. | 21,900 | 582,540 |
WellPoint, Inc.* | 18,200 | 766,766 |
| 10,287,761 |
Life Sciences Tools & Services 5.8% |
Charles River Laboratories International, Inc.* | 10,900 | 285,580 |
Illumina, Inc.* | 10,600 | 276,130 |
Life Technologies Corp.* | 17,028 | 396,932 |
Mettler-Toledo International, Inc.* | 8,800 | 593,120 |
Pharmaceutical Product Development, Inc. | 14,700 | 426,447 |
Thermo Fisher Scientific, Inc.* | 50,000 | 1,703,500 |
| 3,681,709 |
|
Shares
| Value ($) |
| |
Medical Supply & Specialty 20.0% |
Alcon, Inc. | 8,400 | 749,196 |
Baxter International, Inc. | 49,600 | 2,658,064 |
Beckman Coulter, Inc. | 6,900 | 303,186 |
Becton, Dickinson & Co. | 27,600 | 1,887,564 |
C.R. Bard, Inc. | 15,800 | 1,331,308 |
Covidien Ltd. | 43,100 | 1,561,944 |
Hologic, Inc.* | 26,400 | 345,048 |
Masimo Corp.* | 11,600 | 346,028 |
Medtronic, Inc. | 34,900 | 1,096,558 |
ResMed, Inc.* | 10,200 | 382,296 |
Stryker Corp. (a) | 26,400 | 1,054,680 |
Wright Medical Group, Inc.* | 13,400 | 273,762 |
Zimmer Holdings, Inc.* | 18,900 | 763,938 |
| 12,753,572 |
Pharmaceuticals 30.8% |
Abbott Laboratories | 31,600 | 1,686,492 |
Allergan, Inc. | 18,600 | 749,952 |
Astellas Pharma, Inc. | 21,800 | 887,072 |
Bristol-Myers Squibb Co. | 61,500 | 1,429,875 |
Cardiome Pharma Corp.* | 22,000 | 100,100 |
Eli Lilly & Co. | 32,100 | 1,292,667 |
Johnson & Johnson | 31,600 | 1,890,628 |
Merck & Co., Inc. | 52,400 | 1,592,960 |
Merck KGaA | 9,462 | 860,262 |
Mylan, Inc.* (a) | 92,100 | 910,869 |
Novartis AG (Registered) | 17,897 | 896,720 |
Pfizer, Inc. | 63,940 | 1,132,377 |
Roche Holding AG (Genusschein) | 14,711 | 2,264,519 |
Sanofi-Aventis | 7,538 | 478,768 |
Schering-Plough Corp. | 61,500 | 1,047,345 |
Shire PLC (ADR) | 17,400 | 779,172 |
Wyeth | 37,400 | 1,402,874 |
XenoPort, Inc.* | 9,500 | 238,261 |
| 19,640,913 |
Total Common Stocks (Cost $56,129,449) | 62,643,280 |
|
Securities Lending Collateral 6.1% |
Daily Assets Fund Institutional, 1.69% (b) (c) (Cost $3,866,250) | 3,866,250 | 3,866,250 |
|
Cash Equivalents 1.8% |
Cash Management QP Trust, 1.42% (b) (Cost $1,166,346) | 1,166,346 | 1,166,346 |
| % of Net Assets | Value ($) |
| |
Total Investment Portfolio (Cost $61,162,045)+ | 106.2 | 67,675,876 |
Other Assets and Liabilities, Net | (6.2) | (3,944,170) |
Net Assets | 100.0 | 63,731,706 |
* Non-income producing security.+ The cost for federal income tax purposes was $61,733,891. At December 31, 2008, net unrealized appreciation for all securities based on tax cost was $5,941,985. This consisted of aggregate gross unrealized appreciation for all securities in which there was an excess of value over tax cost of $14,546,491 and aggregate gross unrealized depreciation for all securities in which there was an excess of tax cost over value of $8,604,506.(a) All or a portion of these securities were on loan (see Notes to Financial Statements). The value of all securities loaned at December 31, 2008 amounted to $3,875,282, which is 6.1% of net assets.(b) Affiliated fund managed by Deutsche Investment Management Americas Inc. The rate shown is the annualized seven-day yield at period end.(c) Represents collateral held in connection with securities lending. Income earned by the Portfolio is net of borrower rebates.ADR: American Depositary Receipt
Fair Value Measurements
The following is a summary of the inputs used as of December 31, 2008 in valuing the Portfolio's investments. For information on the Portfolio's policy regarding the valuation of investments and of the valuation inputs, and the aggregate levels used in the table below, please refer to the Security Valuation section of Note A in the accompanying Notes to the Financial Statements.
Valuation Inputs | Investments in Securities |
Level 1
| $ 59,818,585 |
Level 2
| 7,857,291 |
Level 3
| — |
Total | $ 67,675,876 |
The accompanying notes are an integral part of the financial statements.
Financial Statements
Statement of Assets and Liabilities as of December 31, 2008
|
Assets |
Investments:
Investments in securities, at value (cost $56,129,449), including $3,875,282 of securities loaned | $ 62,643,280 |
Investment in Daily Assets Fund Institutional (cost $3,866,250)* | 3,866,250 |
Investment in Cash Management QP Trust (cost $1,166,346) | 1,166,346 |
Total investments, at value (cost $61,162,045)
| 67,675,876 |
Cash
| 7,698 |
Foreign currency, at value (cost $78,358)
| 79,948 |
Receivable for investments sold
| 225,791 |
Dividends receivable
| 85,037 |
Interest receivable
| 5,956 |
Receivable for Portfolio shares sold
| 61 |
Foreign taxes recoverable
| 19,992 |
Other assets
| 2,845 |
Total assets
| 68,103,204 |
Liabilities |
Payable for investments purchased
| 223,490 |
Payable for Portfolio shares redeemed
| 152,105 |
Payable upon return of securities loaned
| 3,866,250 |
Accrued management fee
| 34,689 |
Accrued distribution service fee (Class B)
| 707 |
Other accrued expenses and payables
| 94,257 |
Total liabilities
| 4,371,498 |
Net assets, at value | $ 63,731,706 |
Net Assets Consist of |
Undistributed net investment income
| 724,957 |
Net unrealized appreciation (depreciation) on:
Investments | 6,513,831 |
Foreign currency | 934 |
Accumulated net realized gain (loss)
| (589,149) |
Paid-in capital
| 57,081,133 |
Net assets, at value | $ 63,731,706 |
Class A Net Asset Value, offering and redemption price per share ($60,232,294 ÷ 6,373,629 outstanding shares of beneficial interest, no par value, unlimited number of shares authorized)
| $ 9.45 |
Class B Net Asset Value, offering and redemption price per share ($3,499,412 ÷ 379,018 outstanding shares of beneficial interest, no par value, unlimited number of shares authorized)
| $ 9.23 |
* Represents collateral on securities loaned.The accompanying notes are an integral part of the financial statements.
Statement of Operations for the year ended December 31, 2008
|
Investment Income |
Income:
Dividends (net of foreign taxes withheld of $35,437)
| $ 1,356,362 |
Interest
| 1,294 |
Interest — Cash Management QP Trust
| 46,802 |
Securities lending income, including income from Daily Assets Fund Institutional, net of borrower rebates
| 131,903 |
Total Income
| 1,536,361 |
Expenses:
Management fee
| 600,311 |
Administration fee
| 90,272 |
Custodian fee
| 14,355 |
Distribution service fee (Class B)
| 11,468 |
Services to shareholders
| 419 |
Record keeping fee (Class B)
| 4,587 |
Professional fees
| 59,999 |
Trustees' fees and expenses
| 4,905 |
Reports to shareholders
| 36,465 |
Other
| 21,239 |
Total expenses before expense reductions
| 844,020 |
Expense reductions
| (606) |
Total expenses after expense reductions
| 843,414 |
Net investment income (loss) | 692,947 |
Realized and Unrealized Gain (Loss) |
Net realized gain (loss) from:
Investments
| (152,841) |
Foreign currency
| 61,295 |
| (91,546) |
Change in net unrealized appreciation (depreciation) on:
Investments
| (24,348,732) |
Foreign currency
| (17,254) |
| (24,365,986) |
Net gain (loss) | (24,457,532) |
Net increase (decrease) in net assets resulting from operations | $ (23,764,585) |
The accompanying notes are an integral part of the financial statements.
Statement of Changes in Net Assets |
| Years Ended December 31, |
Increase (Decrease) in Net Assets | 2008 | 2007 |
Operations:
Net investment income (loss)
| $ 692,947 | $ 173,147 |
Net realized gain (loss)
| (91,546) | 15,451,366 |
Change in net unrealized appreciation (depreciation)
| (24,365,986) | (1,128,994) |
Net increase (decrease) in net assets resulting from operations
| (23,764,585) | 14,495,519 |
Distributions to shareholders from:
Net investment income:
Class A | (269,428) | — |
Net realized gains:
Class A | (14,518,785) | (6,096,998) |
Class B | (789,529) | (1,254,197) |
Total distributions
| (15,577,742) | (7,351,195) |
Portfolio share transactions:
Class A Proceeds from shares sold
| 15,385,334 | 9,495,145 |
Reinvestment of distributions
| 14,788,213 | 6,096,998 |
Cost of shares redeemed
| (31,046,167) | (24,413,031) |
Net increase (decrease) in net assets from Class A share transactions
| (872,620) | (8,820,888) |
Class B Proceeds from shares sold
| 674,757 | 827,879 |
Reinvestment of distributions
| 789,529 | 1,254,197 |
Cost of shares redeemed
| (1,414,568) | (18,374,489) |
Net increase (decrease) in net assets from Class B share transactions
| 49,718 | (16,292,413) |
Increase (decrease) in net assets | (40,165,229) | (17,968,977) |
Net assets at beginning of period
| 103,896,935 | 121,865,912 |
Net assets at end of period (including undistributed net investment income of $724,957 and $254,916, respectively)
| $ 63,731,706 | $ 103,896,935 |
Other Information |
Class A Shares outstanding at beginning of period
| 6,708,658 | 7,330,897 |
Shares sold
| 1,209,692 | 663,065 |
Shares issued to shareholders in reinvestment of distributions
| 1,271,557 | 431,188 |
Shares redeemed
| (2,816,278) | (1,716,492) |
Net increase (decrease) in Class A shares
| (335,029) | (622,239) |
Shares outstanding at end of period
| 6,373,629 | 6,708,658 |
Class B Shares outstanding at beginning of period
| 376,902 | 1,544,881 |
Shares sold
| 56,147 | 59,012 |
Shares issued to shareholders in reinvestment of distributions
| 69,318 | 90,295 |
Shares redeemed
| (123,349) | (1,317,286) |
Net increase (decrease) in Class B shares
| 2,116 | (1,167,979) |
Shares outstanding at end of period
| 379,018 | 376,902 |
The accompanying notes are an integral part of the financial statements.
Financial Highlights
Class A Years Ended December 31, | 2008 | 2007 | 2006 | 2005 | 2004 |
Selected Per Share Data |
Net asset value, beginning of period | $ 14.68 | $ 13.77 | $ 13.02 | $ 12.00 | $ 10.95 |
Income (loss) from investment operations: Net investment income (loss)a | .09d | .03c | (.01)b | (.02) | (.03) |
Net realized and unrealized gain (loss) | (3.08) | 1.75 | .81 | 1.04 | 1.08 |
Total from investment operations | (2.99) | 1.78 | .80 | 1.02 | 1.05 |
Less distributions from: Net investment income | (.04) | — | — | — | — |
Net realized gains | (2.20) | (.87) | (.05) | — | — |
Total distributions | (2.24) | (.87) | (.05) | — | — |
Net asset value, end of period | $ 9.45 | $ 14.68 | $ 13.77 | $ 13.02 | $ 12.00 |
Total Return (%)
| (23.20) | 13.20 | 6.17b | 8.50 | 9.59 |
Ratios to Average Net Assets and Supplemental Data |
Net assets, end of period ($ millions)
| 60 | 98 | 101 | 109 | 109 |
Ratio of expenses (%)
| .92 | .93 | .89 | .88 | .88 |
Ratio of net investment income (loss) (%)
| .79d | .19c | (.03)b | (.18) | (.29) |
Portfolio turnover rate (%)
| 24 | 37 | 47 | 43 | 77 |
a Based on average shares outstanding during the period.
b Includes non-recurring income from the Advisor recorded as a result of an administrative proceeding regarding disclosure of brokerage allocation practices in connection with sales of DWS Funds. The non-recurring income resulted in an increase in net investment income of $0.003 per share and an increase in the ratio of net investment income of 0.02%. Excluding this non-recurring income, total return would have been 0.02% lower.
c Net investment income per share and ratio of net investment income include non-recurring dividend income amounting to $0.02 per share and 0.13% of average daily net assets, respectively.
d Net investment income per share and ratio of net investment income include non-recurring dividend income amounting to $0.03 per share and 0.28% of average daily net assets, respectively.
|
Class B Years Ended December 31, | 2008 | 2007 | 2006 | 2005 | 2004 |
Selected Per Share Data |
Net asset value, beginning of period | $ 14.40 | $ 13.55 | $ 12.87 | $ 11.91 | $ 10.91 |
Income (loss) from investment operations: Net investment income (loss)a | .05d | (.03)c | (.06)b | (.07) | (.08) |
Net realized and unrealized gain (loss) | (3.02) | 1.75 | .79 | 1.03 | 1.08 |
Total from investment operations | (2.97) | 1.72 | .73 | .96 | 1.00 |
Less distributions from: Net realized gains | (2.20) | (.87) | (.05) | — | — |
Net asset value, end of period | $ 9.23 | $ 14.40 | $ 13.55 | $ 12.87 | $ 11.91 |
Total Return (%)
| (23.50) | 12.88 | 5.77b | 8.06 | 9.17 |
Ratios to Average Net Assets and Supplemental Data |
Net assets, end of period ($ millions)
| 3 | 5 | 21 | 23 | 20 |
Ratio of expenses (%)
| 1.27 | 1.34 | 1.28 | 1.27 | 1.27 |
Ratio of net investment income (loss) (%)
| .43d | (.22)c | (.42)b | (.57) | (.68) |
Portfolio turnover rate (%)
| 24 | 37 | 47 | 43 | 77 |
a Based on average shares outstanding during the period.
b Includes non-recurring income from the Advisor recorded as a result of an administrative proceeding regarding disclosure of brokerage allocation practices in connection with sales of DWS Funds. The non-recurring income resulted in an increase in net investment income of $0.003 per share and an increase in the ratio of net investment income of 0.02%. Excluding this non-recurring income, total return would have been 0.02% lower.
c Net investment income per share and ratio of net investment income include non-recurring dividend income amounting to $0.02 per share and 0.13% of average daily net assets, respectively.
d Net investment income per share and ratio of net investment income include non-recurring dividend income amounting to $0.03 per share and 0.28% of average daily net assets, respectively.
|
Notes to Financial Statements
A. Significant Accounting Policies
DWS Variable Series I (the "Series") is registered under the Investment Company Act of 1940, as amended (the "1940 Act"), as an open-end, registered management investment company organized as a Massachusetts business trust. The Series consists of six diversified portfolios: DWS Bond VIP, DWS Growth & Income VIP, DWS Capital Growth VIP, DWS Global Opportunities VIP, DWS International VIP and DWS Health Care VIP (individually or collectively hereinafter referred to as a "Portfolio" or the "Portfolios"). The Series is intended to be the underlying investment vehicle for variable annuity contracts and variable life insurance policies to be offered by the separate accounts of certain life insurance companies ("Participating Insurance Companies").
Multiple Classes of Shares of Beneficial Interest. DWS Bond VIP offers only one class of shares (Class A shares). DWS Growth & Income VIP, DWS Capital Growth VIP, DWS Global Opportunities VIP, DWS International VIP and DWS Health Care VIP each offer two classes of shares (Class A shares and Class B shares). Class B shares are subject to Rule 12b-1 distribution fees under the 1940 Act and record keeping fees equal to an annual rate of 0.25% and up to 0.15%, respectively, of the average daily net assets of the Class B shares of the applicable Portfolio. Class A shares are not subject to such fees. On May 22, 2008, Class B shares of DWS Bond VIP were liquidated.
Investment income, realized and unrealized gains and losses, and certain portfolio-level expenses and expense reductions, if any, are borne pro rata on the basis of relative net assets by the holders of all classes of shares, except that each class bears certain expenses unique to that class (including the applicable 12b-1 distribution fees and record keeping fees). Differences in class-level expenses may result in payment of different per share dividends by class. All shares have equal rights with respect to voting subject to class-specific arrangements.
The Series' financial statements are prepared in accordance with accounting principles generally accepted in the United States of America, which require the use of management estimates. Actual results could differ from those estimates. The policies described below are followed consistently by the Series in the preparation of the financial statements for its Portfolios.
Security Valuation. Investments are stated at value determined as of the close of regular trading on the New York Stock Exchange on each day the exchange is open for trading. Equity securities are valued at the most recent sale price or official closing price reported on the exchange (US or foreign) or over-the-counter market on which the security is traded most extensively. Securities for which no sales are reported are valued at the calculated mean between the most recent bid and asked quotations on the relevant market or, if a mean cannot be determined, at the most recent bid quotation.
Debt securities are valued by independent pricing services approved by the Trustees of the Series. If the pricing services are unable to provide valuations, securities are valued at the most recent bid quotation or evaluated price, as applicable, obtained from one or more broker-dealers. Such services may use various pricing techniques which take into account appropriate factors such as yield, quality, coupon rate, maturity, type of issue, trading characteristics and other data, as well as broker quotes.
Money market instruments purchased with an original or remaining maturity of sixty days or less, maturing at par, are valued at amortized cost. Investments in open-end investment companies and Cash Management QP Trust are valued at their net asset value each business day.
Securities and other assets for which market quotations are not readily available or for which the above valuation procedures are deemed not to reflect fair value are valued in a manner that is intended to reflect their fair value as determined in accordance with procedures approved by the Trustees. The Series may use a fair valuation model to value international equity securities in order to adjust for events which may occur between the close of the foreign exchanges and the close of the New York Stock Exchange.
The Portfolio adopted Financial Accounting Standards Board ("FASB") Statement of Financial Accounting Standards No. 157, "Fair Value Measurements" ("FAS 157"), effective at the beginning of the Portfolio's fiscal year. FAS 157 establishes a three-tier hierarchy to maximize the use of observable market data and minimize the use of unobservable inputs and requires additional disclosure about the classification of fair value measurements.
Various inputs are used in determining the value of the Portfolio's investments. These inputs are summarized in three broad levels. Level 1 includes quoted prices in active markets for identical securities. Level 2 includes other significant observable inputs (including quoted prices for similar securities, interest rates, prepayment speeds and credit risk). Level 3 includes significant unobservable inputs (including the Portfolio's own assumptions in determining the fair value of investments). The inputs or methodology used for valuing securities are not necessarily an indication of the risk associated with investing in those securities.
The aggregate value by input level, as of December 31, 2008, for the Portfolio's investments, as well as a reconciliation of Level 3 assets for which significant unobservable inputs were used in determining value, is included at the end of the Portfolio's Investment Portfolio.
New Accounting Pronouncement. In March 2008, the FASB issued Statement of Financial Accounting Standards No. 161 ("FAS 161"), "Disclosures about Derivative Instruments and Hedging Activities". FAS 161 requires enhanced disclosure about an entity's derivative and hedging activities including qualitative disclosures about the objectives and strategies for using derivatives, quantitative disclosures about fair value amounts of gains and losses on derivative instruments, and disclosures about credit-risk-related contingent features in derivative agreements. FAS 161 is effective for fiscal years and interim periods beginning after November 15, 2008. Management is currently reviewing the enhanced disclosure requirements for the adoption of FAS 161.
Securities Lending. The Portfolio may lend securities to financial institutions. The Portfolio retains beneficial ownership of the securities it has loaned and continues to receive interest and dividends paid by the issuer of securities and to participate in any changes in their market value. The Portfolio requires the borrowers of the securities to maintain collateral with the Portfolio consisting of liquid, unencumbered assets having a value at least equal to the value of the securities loaned. When the collateral falls below specified amounts, the lending agents will use their best efforts to obtain additional collateral on the next business day to meet required amounts under the security lending agreement. The Portfolio may invest the cash collateral into a joint trading account in an affiliated money market fund pursuant to Exemptive Orders issued by the SEC. The Portfolio receives compensation for lending its securities either in the form of fees or by earning interest on invested cash collateral net of borrower rebates and fees paid to a lending agent. Either the Portfolio or the borrower may terminate the loan. There may be risks of delay and costs in recovery of securities or even loss of rights in the collateral should the borrower of the securities fail financially. The Portfolio is also subject to all investment risks associated with the reinvestment of any cash collateral received, including, but not limited to, interest rate, credit and liquidity risk associated with such investments.
Futures Contracts. A futures contract is an agreement between a buyer or seller and an established futures exchange or its clearinghouse in which the buyer or seller agrees to take or make a delivery of a specific amount of a financial instrument at a specified price on a specific date (settlement date). Each Portfolio may use futures in circumstances where portfolio management believes they offer an economic means of gaining exposure to a particular asset class or to keep cash on hand to meet shareholder redemptions or other needs while maintaining exposure to the market. In addition, the DWS Bond VIP, DWS Capital Growth VIP, DWS Global Opportunities VIP and DWS Health Care VIP Portfolios may use futures for hedging and for risk management or for non-hedging purposes to seek to enhance potential gains.
Upon entering into a futures contract, the Portfolio is required to deposit with a financial intermediary an amount ("initial margin") equal to a certain percentage of the face value indicated in the futures contract. Subsequent payments ("variation margin") are made or received by the Portfolio dependent upon the daily fluctuations in the value of the underlying security and are recorded for financial reporting purposes as unrealized gains or losses by the Portfolio. When entering into a closing transaction, the Portfolio will realize a gain or loss equal to the difference between the value of the futures contract to sell and the futures contract to buy. Futures contracts are valued at the most recent settlement price.
Certain risks may arise upon entering into futures contracts, including the risk that an illiquid secondary market will limit the Portfolio's ability to close out a futures contract prior to the settlement date and that a change in the value of a futures contract may not correlate exactly with the changes in the value of the securities or currencies hedged. When utilizing futures contracts to hedge, the Portfolio gives up the opportunity to profit from favorable price movements in the hedged positions during the term of the contract. Risk of loss may exceed amounts recognized on the Statement of Assets and Liabilities.
Foreign Currency Translations. The books and records of the Portfolios are maintained in US dollars. Investment securities and other assets and liabilities denominated in a foreign currency are translated into US dollars at the prevailing exchange rates at period end. Purchases and sales of investment securities, income and expenses are translated into US dollars at the prevailing exchange rates on the respective dates of the transactions.
Net realized and unrealized gains and losses on foreign currency transactions represent net gains and losses between trade and settlement dates on securities transactions, the disposition of forward foreign currency exchange contracts and foreign currencies, and the difference between the amount of net investment income accrued and the US dollar amount actually received. That portion of both realized and unrealized gains and losses on investments that results from fluctuations in foreign currency exchange rates is not separately disclosed but is included with net realized and unrealized gain/appreciation and loss/depreciation on investments.
Forward Foreign Currency Exchange Contracts. A forward foreign currency exchange contract ("forward currency contract") is a commitment to purchase or sell a foreign currency at the settlement date at a negotiated rate. The Portfolios may enter into forward currency contracts in order to hedge their exposure to changes in foreign currency exchange rates on their foreign currency denominated portfolio holdings and to facilitate transactions in foreign currency denominated securities. The Portfolio may also engage in forward currency contracts for non-hedging purposes.
Forward currency contracts are valued at the prevailing forward exchange rate of the underlying currencies and unrealized gain (loss) is recorded daily. Sales and purchases of forward currency contracts having the same settlement date and broker are offset and any gain (loss) is realized on the date of offset; otherwise, gain (loss) is realized on settlement date. Realized and unrealized gains and losses which represent the difference between the value of a forward currency contract to buy and a forward currency contract to sell are included in net realized and unrealized gain (loss) from foreign currency related transactions.
Certain risks may arise upon entering into forward currency contracts from the potential inability of counterparties to meet the terms of their contracts. Additionally, when utilizing forward currency contracts to hedge, the Portfolio gives up the opportunity to profit from favorable exchange rate movements during the term of the contract.
Mortgage Dollar Rolls. DWS Bond VIP may enter into mortgage dollar rolls in which the Portfolio sells to a bank or broker/dealer (the "counterparty") mortgage-backed securities for delivery in the current month and simultaneously contracts to repurchase similar, but not identical, securities on a fixed date. The counterparty receives all principal and interest payments, including prepayments, made on the security while it is the holder. The Portfolio receives compensation as consideration for entering into the commitment to repurchase. The compensation is paid in the form of a lower price for the security upon its repurchase, or alternatively, a fee. Mortgage dollar rolls may be renewed with a new sale and repurchase price and a cash settlement made at each renewal without physical delivery of the securities subject to the contract.
Certain risks may arise upon entering into mortgage dollar rolls from the potential inability of counterparties to meet the terms of their commitments. Additionally, the value of such securities may change adversely before the Portfolio is able to repurchase them. There can be no assurance that the Portfolio's use of the cash that it receives from a mortgage dollar roll will provide a return that exceeds its costs.
Senior Loans. DWS Bond VIP may invest in Senior Loans. Senior Loans are portions of loans originated by banks and sold in pieces to investors. These US dollar-denominated fixed and floating rate loans ("Loans") in which the Portfolio invests, are arranged between the borrower and one or more financial institutions ("Lenders"). These loans are corporate obligations often issued in connection with recapitalizations, acquisitions, leveraged buy-outs and refinancings. The Portfolio invests in such Loans in the form of participations in Loans ("Participations") or assignments of all or a portion of Loans from third parties ("Assignments"). Participations typically result in the Portfolio having a contractual relationship only with the Lender, not with the borrower. The Portfolio has the right to receive payments of principal, interest and any fees to which it is entitled from the Lender selling the Participation and only upon receipt by the Lender of the payments from the borrower. In connection with purchasing Participations, the Portfolio generally has no right to enforce compliance by the borrower with the terms of the loan agreement relating to the Loan, or any rights of set-off against the borrower, and the Portfolio will not benefit directly from any collateral supporting the Loan in which it has purchased the Participation. As a result, the Portfolio assumes the credit risk of both the borrower and the Lender that is selling the Participation. Assignments typically result in the Portfolio having a direct contractual relationship with the borrower, and the Portfolio may enforce compliance by the borrower with the terms of the loan agreement. All Senior Loans involve interest rate risk, liquidity risk and credit risk, including the potential default or insolvency of the borrower.
Taxes. Each Portfolio is treated as a separate taxpayer as provided for in the Internal Revenue Code, as amended. It is each Portfolio's policy to comply with the requirements of the Internal Revenue Code, as amended, which are applicable to regulated investment companies, and to distribute all of its taxable income to the separate accounts of the Participating Insurance Companies which hold its shares.
Additionally, based on the Series' understanding of the tax rules and rates related to income, gains and transactions for the foreign jurisdictions in which each Portfolio invests, the Series will provide for foreign taxes, and where appropriate, deferred foreign taxes.
At December 31, 2008, the following Portfolios had an approximate net tax basis capital loss carryforward which may be applied against any realized net taxable capital gains of each succeeding year until fully utilized or until the following expiration dates, whichever occurs first:
Portfolio | Capital Loss Carryforwards ($) | Expiration
Date | Capital Loss Carryforwards Utilized ($) | Capital Loss Carryforwards Expired ($) |
DWS Bond VIP
| 4,957,000 | 12/31/2014-12/31/2016 | — | — |
DWS Growth & Income VIP
| 27,889,000 | 12/31/2010-12/31/2016 | — | — |
DWS Capital Growth VIP
| 227,747,000 | 12/31/2009-12/31/2012 | 29,828,000 | 19,244,000 |
DWS Global Opportunities VIP
| 3,019,000 | 12/31/2016 | — | — |
DWS International VIP
| 77,707,000 | 12/31/2016 | — | — |
In addition, from November 1, 2008 through December 31, 2008, DWS Bond VIP, DWS Growth & Income VIP, DWS Capital Growth VIP, DWS Global Opportunities VIP, DWS International VIP and DWS Health Care VIP incurred approximately $16,439,000, $10,255,000, 8,359,000, 10,758,000, 39,288,000 and $736,000, respectively, of net realized capital losses. As permitted by tax regulations, the Portfolios intend to elect to defer these losses and treat them as arising in the fiscal year ended December 31, 2009.
At December 31, 2008, DWS Capital Growth VIP had a net tax basis capital loss carryforward of approximately $227,747,000, of which a portion was inherited from its mergers with the SVS Eagle Focused Large Cap Growth Portfolio, Scudder Growth Portfolio, DWS Oak Strategic Equity VIP and DWS Janus Growth Opportunities VIP, and which is included in the table above and may be applied against any realized net taxable capital gains of each succeeding year until fully utilized or until the expiration dates, range from December 31, 2009, to December 31, 2012, whichever occurs first, and which may be subject to certain limitations under Section 382-384 of the Internal Revenue Code. DWS Capital Growth VIP utilized approximately $8,084,000 of non-merger related losses. In addition, the Portfolio utilized approximately $21,744,000 of the inherited amounts, which is included in the table above. Due to certain limitations under Sections 382-384 of the Internal Revenue Code, approximately $19,244,000 of the losses from SVS Eagle Focused Large Cap Growth Portfolio and Scudder Growth Portfolio expired and approximately $332,000 of the losses from DWS Janus Growth Opportunities VIP cannot be used. These losses are excluded from the capital loss carryforward amount of $227,747,000 disclosed above.
Each Portfolio has reviewed the tax positions for the open tax years as of December 31, 2008 and has determined that no provision for income tax is required in each Portfolio's financial statements. Each of the Portfolio's federal tax returns for the prior three fiscal years remains subject to examination by the Internal Revenue Service.
Distribution of Income and Gains. Each Portfolio will declare and distribute dividends from their net investment income, if any, annually, although additional distributions may be made if necessary. Net realized gains from investment transactions, in excess of available capital loss carryforwards, would be taxable to each Portfolio if not distributed, and, therefore, will be distributed to shareholders at least annually.
The timing and characterization of certain income and capital gains distributions are determined annually in accordance with federal tax regulations which may differ from accounting principles generally accepted in the United States of America. These differences primarily relate to investments in foreign denominated investments, investments in forward foreign currency exchange contracts, passive foreign investment companies, post October loss deferrals and certain securities sold at a loss. As a result, net investment income (loss) and net realized gain (loss) on investment transactions for a reporting period may differ significantly from distributions during such period. Accordingly, each Portfolio may periodically make reclassifications among certain of its capital accounts without impacting the net asset value of the Portfolio.
At December 31, 2008, the Portfolios' components of distributable earnings (accumulated losses) on a tax-basis are as follows:
Portfolio | Undistributed Ordinary Income ($)* | Undistributed Net Long-Term Capital Gains ($) | Capital Loss Carryforwards ($) | Net Unrealized Gain (Loss) on Investments ($) |
DWS Bond VIP
| 11,876,139 | — | (4,957,000) | (28,504,179) |
DWS Growth & Income VIP
| 1,938,429 | — | (27,889,000) | (32,890,694) |
DWS Capital Growth VIP
| 7,945,917 | — | (227,747,000) | 10,574,440 |
DWS Global Opportunities VIP
| 2,083,686 | — | (3,019,000) | (20,090,640) |
DWS International VIP
| 13,320,593 | — | (77,707,000) | (75,728,578) |
DWS Health Care VIP
| 724,957 | 718,209 | — | 5,941,985 |
In addition, the tax character of distributions paid to shareholders by the Portfolios is summarized as follows:
| Distributions from Ordinary Income ($)* Years Ended December 31, | Distributions from Long-Term Capital Gains ($) Years Ended December 31, |
Portfolio | 2008 | 2007 | 2008 | 2007 |
DWS Bond VIP
| 10,914,208 | 10,397,091 | — | — |
DWS Growth & Income VIP
| 15,760,111 | 3,685,275 | 26,232,152 | 4,265,414 |
DWS Capital Growth VIP
| 9,451,337 | 7,146,340 | — | — |
DWS Global Opportunities VIP
| 979,171 | 5,220,901 | 40,011,833 | 25,733,820 |
DWS International VIP
| 7,386,477 | 18,696,240 | 95,745,428 | — |
DWS Health Care VIP
| 3,006,032 | — | 12,571,710 | 7,351,195 |
* For tax purposes short-term capital gains distributions are considered ordinary income distributions.Expenses. Expenses of the Series arising in connection with a specific Portfolio are allocated to that Portfolio. Other Series expenses which cannot be directly attributed to a Portfolio are apportioned among the Portfolios in the Series.
Contingencies. In the normal course of business, each Portfolio may enter into contracts with service providers that contain general indemnification clauses. Each Portfolio's maximum exposure under these arrangements is unknown as this would involve future claims that may be made against each Portfolio that have not yet been made. However, based on experience, each Portfolio expects the risk of loss to be remote.
Other. For each Portfolio, investment transactions are accounted for on a trade date plus one basis for daily net asset value calculations. However, for financial reporting purposes, investment transactions are reported on trade date. Interest income is recorded on the accrual basis net of foreign withholding taxes. Dividend income is recorded on the ex-dividend date net of foreign withholding taxes. Certain dividends from foreign securities may be recorded subsequent to the ex-dividend date as soon as the Portfolio is informed of such dividends. Realized gains and losses from investment transactions are recorded on an identified cost basis. All discounts and premiums are accreted/amortized for both tax and financial reporting purposes.
B. Purchases and Sales of Securities
During the year ended December 31, 2008, purchases and sales of investment securities (excluding short-term investments) were as follows:
Portfolio | Purchases ($) | Sales ($) |
DWS Bond VIP
excluding US Treasury Obligations | 116,593,956 | 126,836,594 |
US Treasury Obligations | 264,754,396 | 288,981,537 |
DWS Growth & Income VIP
| 192,386,286 | 234,069,964 |
DWS Capital Growth VIP
| 182,722,249 | 315,927,818 |
DWS Global Opportunities VIP
| 47,740,750 | 96,017,563 |
DWS International VIP
| 630,020,593 | 730,062,614 |
DWS Health Care VIP
| 20,839,055 | 35,904,837 |
C. Related Parties
Under the Investment Management Agreement with Deutsche Investment Management Americas Inc. ("DIMA" or the "Advisor"), an indirect, wholly owned subsidiary of Deutsche Bank AG, the Advisor directs the investments of the Portfolios in accordance with their investment objectives, policies and restrictions. The Advisor determines the securities, instruments and other contracts relating to investments to be purchased, sold or entered into by the Portfolios.
Under the Investment Management Agreement with the Advisor, the Portfolios pay a monthly management fee, based on the average daily net assets of each Portfolio, computed and accrued daily and payable monthly, at the annual rates shown below:
Portfolio | Annual Management Fee Rate |
DWS Bond VIP
first $250 million of average daily net assets | .390% |
next $750 million of average daily net assets | .365% |
over $1 billion of average daily net assets | .340% |
DWS Growth & Income VIP
first $250 million of average daily net assets | .390% |
next $750 million of average daily net assets | .365% |
over $1 billion of average daily net assets | .340% |
DWS Capital Growth VIP
first $250 million of average daily net assets | .390% |
next $750 million of average daily net assets | .365% |
over $1 billion of average daily net assets | .340% |
DWS Global Opportunities VIP
first $500 million of average daily net assets | .890% |
next $500 million of average daily net assets | .875% |
next $1 billion of average daily net assets | .860% |
over $2 billion of average daily net assets | .845% |
DWS International VIP
first $500 million of average daily net assets | .790% |
over $500 million of average daily net assets | .640% |
DWS Health Care VIP
first $250 million of average daily net assets | .665% |
next $750 million of average daily net assets | .640% |
next $1.5 billion of average daily net assets | .615% |
next $2.5 billion of average daily net assets | .595% |
next $2.5 billion of average daily net assets | .565% |
next $2.5 billion of average daily net assets | .555% |
next $2.5 billion of average daily net assets | .545% |
over $12.5 billion of average daily net assets | .535% |
Prior to December 1, 2008, Aberdeen Asset Management, Inc. ("AAMI") and Aberdeen Asset Management Investment Services Limited ("AAMISL") served as DWS Bond VIP's subadvisor and sub-subadvisor, respectively. AAMI was responsible for the day to day operation of the high-yield and core bond, active fixed-income and high-yield portions of DWS Bond VIP. AAMISL was responsible for the day-to-day management of the foreign securities, foreign currencies and related investments for DWS Bond VIP. The Portfolio's board has approved the termination of AAMI and AAMISL as the Portfolio's subadvisor and sub-subadvisor, respectively. Effective December 1, 2008, the Advisor assumed all day-to-day advisory responsibilities that were previously delegated to AAMI and AAMISL.
For the period from January 1, 2008 through April 30, 2008, the Advisor, the underwriter and accounting agent contractually agreed to waive a portion of their fee to the extent necessary to maintain the operating expenses (excluding certain expenses such as extraordinary expenses, taxes, brokerage and interest) as follows:
Portfolio | Annual Rate |
DWS Bond VIP Class B
| 1.03% |
In addition, for the period from January 1, 2008 through September 30, 2008, the Advisor, the underwriter and accounting agent contractually agreed to waive a portion of their fee to the extent necessary to maintain the operating expenses of each class (excluding certain expenses such as extraordinary expenses, taxes, brokerage and interest) as follows:
Portfolio | Annual Rate |
DWS Bond VIP Class A
| .63% |
DWS Global Opportunities VIP Class A
| .99% |
DWS Global Opportunities VIP Class B
| 1.39% |
In addition, for the period from October 1, 2008 through September 30, 2009, the Advisor, the underwriter and accounting agent contractually agreed to waive a portion of their fee to the extent necessary to maintain the operating expenses of each class (excluding certain expenses such as extraordinary expenses, taxes, brokerage and interest) as follows:
Portfolio | Annual Rate |
DWS Global Opportunities VIP Class A
| .95% |
DWS Global Opportunities VIP Class B
| 1.35% |
DWS Health Care VIP Class B
| 1.49% |
In addition, for the period from January 1, 2008 through April 30, 2010, the Advisor, the underwriter and accounting agent contractually agreed to waive a portion of their fee to the extent necessary to maintain the operating expenses of each class (excluding certain expenses such as extraordinary expenses, taxes, brokerage and interest) as follows:
Portfolio | Annual Rate |
DWS Capital Growth VIP Class A
| .49% |
DWS Capital Growth VIP Class B
| .82% |
DWS Growth & Income VIP Class A
| .54% |
DWS Growth & Income VIP Class B
| .87% |
DWS International VIP Class A
| .96% |
DWS International VIP Class B
| 1.29% |
In addition, for the period from January 1, 2008 through April 27, 2010, the Advisor has contractually agreed to waive 0.01% of the management fee for DWS Growth & Income VIP.
Accordingly, for the year ended December 31, 2008, the total management fee, management fee waived, and effective management fee rate are as follows:
Portfolio | Total Aggregated ($) | Waived ($) | Annual Effective Rate |
DWS Bond VIP
| 782,296 | — | .39% |
DWS Growth & Income VIP
| 592,051 | 83,657 | .33% |
DWS Capital Growth VIP
| 3,273,016 | 111,183 | .36% |
DWS Global Opportunities VIP
| 2,040,460 | 281,092 | .77% |
DWS International VIP
| 3,994,718 | 211,855 | .73% |
DWS Health Care VIP
| 600,311 | — | .67% |
In addition, for the year ended December 31, 2008, the Advisor waived record keeping expenses of Class B shares of each Portfolio as follows:
Portfolio | Waived ($) |
DWS Capital Growth VIP
| 2,532 |
DWS International VIP
| 585 |
Administration Fee. Pursuant to an Administrative Services Agreement, DIMA provides most administrative services to the Series. For all services provided under the Administrative Services Agreement, each Portfolio pays the Advisor an annual fee ("Administration Fee") of 0.10% of each Portfolio's average daily net assets, computed and accrued daily and payable monthly. For the year ended December 31, 2008, the Advisor received an Administration Fee as follows:
Portfolio | Total Aggregated ($) | Unpaid at December 31, 2008 ($) |
DWS Bond VIP
| 200,589 | 13,039 |
DWS Growth & Income VIP
| 151,808 | 7,812 |
DWS Capital Growth VIP
| 879,862 | 50,075 |
DWS Global Opportunities VIP
| 229,265 | 10,114 |
DWS International VIP
| 519,230 | 24,304 |
DWS Health Care VIP
| 90,272 | 5,275 |
Service Provider Fees. DWS Investments Service Company ("DISC"), an affiliate of the Advisor, is the transfer agent, dividend-paying agent and shareholder service agent for the Series. Pursuant to a sub-transfer agency agreement between DISC and DST Systems, Inc. ("DST"), DISC has delegated certain transfer agent, dividend-paying agent and shareholder service agent functions to DST. DISC compensates DST out of the shareholder servicing fee it receives from each Portfolio. For the year ended December 31, 2008, the amounts charged to the Portfolios by DISC were as follows:
Portfolio | Total Aggregated ($) | Waived ($) | Unpaid at December 31, 2008 ($) |
DWS Bond VIP Class A
| 741 | — | 189 |
DWS Bond VIP Class B
| 19 | — | — |
DWS Growth & Income VIP Class A
| 622 | 241 | 381 |
DWS Growth & Income VIP Class B
| 121 | — | 23 |
DWS Capital Growth VIP Class A
| 886 | 886 | — |
DWS Capital Growth VIP Class B
| 94 | 94 | — |
DWS Global Opportunities VIP Class A
| 501 | 501 | — |
DWS Global Opportunities VIP Class B
| 159 | — | 63 |
DWS International VIP Class A
| 805 | 805 | — |
DWS International VIP Class B
| 45 | — | — |
DWS Health Care VIP Class A
| 254 | — | 57 |
DWS Health Care VIP Class B
| 99 | — | 33 |
DWS Investments Distributors, Inc. ("DIDI"), also an affiliate of the Advisor, is the Series' Distributor. In accordance with the Master Distribution Plan, DIDI receives 12b-1 fees of 0.25% of average daily net assets of Class B shares. Pursuant to the Master Distribution Plan, DIDI remits these fees to the Participating Insurance Companies for various costs incurred or paid by these companies in connection with marketing and distribution of Class B shares. These fees are detailed in each Portfolio's Statement of Operations.
Typesetting and Filing Service Fees. Under an agreement with DIMA, DIMA is compensated for providing typesetting and certain regulatory filing services to the Portfolios. For the year ended December 31, 2008, the amount charged to the Portfolios by DIMA included in the Statement of Operations under "reports to shareholders" was as follows:
Portfolio | Total Aggregated ($) | Unpaid at December 31, 2008 ($) |
DWS Bond VIP
| 4,623 | 2,567 |
DWS Growth & Income VIP
| 8,322 | 2,495 |
DWS Capital Growth VIP
| 7,133 | 2,193 |
DWS Global Opportunities VIP
| 9,453 | 2,367 |
DWS International VIP
| 9,460 | 3,345 |
DWS Health Care VIP
| 8,427 | 3,447 |
Trustees' Fees and Expenses. Each Portfolio paid each Trustee not affiliated with the Advisor retainer fees plus specified amounts for various committee services and for the Board Chairperson and Vice Chairperson.
In connection with the board consolidation on April 1, 2008, of the two DWS Funds Boards of Trustees, certain Independent Board Members retired prior to their normal retirement date, and received a one-time retirement benefit. DIMA has agreed to reimburse the Portfolios for the cost of this benefit. During the period ended December 31, 2008, each Portfolio paid its allocated portion, as follows, of the retirement benefit to the non-continuing Independent Board Members, and each Portfolio was reimbursed by DIMA for this payment:
Portfolio | Amount ($) |
DWS Bond VIP
| 1,213 |
DWS Growth & Income VIP
| 988 |
DWS Capital Growth VIP
| 5,091 |
DWS Global Opportunities VIP
| 1,446 |
DWS International VIP
| 3,251 |
DWS Health Care VIP
| 535 |
Cash Management QP Trust. Pursuant to an Exemptive Order issued by the SEC, the Series may invest in the Cash Management QP Trust (the ``QP Trust''), and other affiliated funds managed by the Advisor. The QP Trust seeks to provide as high a level of current income as is consistent with the preservation of capital and the maintenance of liquidity. The QP Trust does not pay the Advisor a management fee for the affiliated funds' investments in the QP Trust.
D. Investing in Emerging Markets
The DWS Bond VIP, DWS Global Opportunities VIP and DWS International VIP may invest in emerging markets. Investing in emerging markets may involve special risks and considerations not typically associated with investing in the United States of America. These risks include revaluation of currencies, high rates of inflation, repatriation restrictions on income and capital, and future adverse political, social and economic developments. Moreover, securities issued in these markets may be less liquid, subject to government ownership controls or delayed settlements and may have prices more volatile than those of comparable securities of issuers in the United States of America.
E. Fee Reductions
DWS Bond VIP, DWS Growth & Income VIP, DWS Capital Growth VIP and DWS Health Care VIP have entered into an arrangement with their custodian whereby credits realized as a result of uninvested cash balances are used to reduce a portion of the custodian expenses. During the year ended December 31, 2008, the custodian fees were reduced as follows:
Portfolio | Custody Credits ($) |
DWS Bond VIP
| 556 |
DWS Growth & Income VIP
| 40 |
DWS Capital Growth VIP
| 132 |
DWS Health Care VIP
| 71 |
F. Ownership of the Portfolios
At the end of the period, the beneficial ownership in the Portfolios was as follows:
DWS Bond VIP: One participating insurance company was an owner of record of 10% or more of the total outstanding Class A shares of the Portfolio, owning 63%.
DWS Growth & Income VIP: Three participating insurance companies were owners of record of 10% or more of the total outstanding Class A shares of the Portfolio, each owning 32%, 28% and 15%. One participating insurance company was an owner of record, owning 89% of the total outstanding Class B shares of the Portfolio.
DWS Capital Growth VIP: Four participating insurance companies were owners of record of 10% or more of the total outstanding Class A shares of the Portfolio, each owning 40%, 23%, 11% and 10%. One participating insurance company was an owner of record, owning 92% of the total outstanding Class B shares of the Portfolio.
DWS Global Opportunities VIP: Three participating insurance companies were owners of record of 10% or more of the total outstanding Class A shares of the Portfolio, each owning 53%, 18% and 11%. Two participating insurance companies were owners of record, each owning 63% and 35% of the total outstanding Class B shares of the Portfolio.
DWS International VIP: Two participating insurance companies were owners of record of 10% or more of the total outstanding Class A shares of the Portfolio, each owning 37% and 16%. Three participating insurance companies were owners of record, each owning 65%, 20% and 15% of the total outstanding Class B shares of the Portfolio.
DWS Health Care VIP: Two participating insurance companies were owners of record of 10% or more of the total outstanding Class A shares of the Portfolio, each owning 70% and 20%. One participating insurance company was an owner of record, owning 100% of the total outstanding Class B shares of the Portfolio.
G. Line of Credit
The Series and other affiliated funds (the "Participants") share in a $490 million revolving credit facility provided by a syndication of banks. The Portfolio may borrow for temporary or emergency purposes, including the meeting of redemption requests that otherwise might require the untimely disposition of securities. The Participants are charged an annual commitment fee which is allocated based on net assets, among each of the Participants. Interest is calculated at the Federal Funds Rate plus 0.35 percent. Each Portfolio may borrow up to a maximum of 33 percent of its net assets under the agreement.
H. Payments Made by Affiliates
During the year ended December 31, 2008, the Advisor fully reimbursed DWS Bond VIP $221 for losses incurred on trades executed incorrectly. The amount of the losses was less than 0.01% of the Portfolio's average net asset, thus having no impact on the Portfolio's total return.
In addition, during the year ended December 31, 2008, the Advisor fully reimbursed DWS International VIP $304,364 for losses incurred on trades executed incorrectly.
Report of Independent Registered Public Accounting Firm
To the Trustees and Shareholders of DWS Variable Series I:
In our opinion, the accompanying statements of assets and liabilities, including the investment portfolios, and the related statements of operations and of changes in net assets and the financial highlights present fairly, in all material respects, the financial position of the six Portfolios (identified in Note A) of DWS Variable Series I (the "Series") at December 31, 2008 and the results of each of their operations, the changes in each of their net assets, and the financial highlights for each of the periods indicated therein, in conformity with accounting principles generally accepted in the United States of America. These financial statements and financial highlights (hereafter referred to as "financial statements") are the responsibility of the Series' management. Our responsibility is to express an opinion on these financial statements based on our audits. We conducted our audits of these financial statements in accordance with the standards of the Public Company Accounting Oversight Board (United States). Those standards require that we plan and perform the audit to obtain reasonable assurance about whether the financial statements are free of material misstatement. An audit includes examining, on a test basis, evidence supporting the amounts and disclosures in the financial statements, assessing the accounting principles used and significant estimates made by management, and evaluating the overall financial statement presentation. We believe that our audits, which included confirmation of securities at December 31, 2008 by correspondence with the custodians and brokers, provide a reasonable basis for our opinion.
Boston, Massachusetts PricewaterhouseCoopers LLP
February 13, 2009
Tax Information (Unaudited)
DWS Growth & Income VIP, DWS Global Opportunities VIP, DWS International VIP and DWS Health Care VIP paid distributions of $1.46, $2.45, $2.15 and $1.81 per share, respectively, from net long-term capital gains during their year ended December 31, 2008, of which 100% represents 15% rate gains.
Pursuant to Section 852 of the Internal Revenue Code, DWS Health Care VIP designates approximately $804,000 as capital gain dividends for its year ended December 31, 2008, of which 100% represents 15% rate gains.
For corporate shareholders of DWS Growth & Income VIP, DWS Capital Growth VIP, DWS Global Opportunities VIP and DWS Health Care VIP, 74%, 100%, 42% and 100%, respectively, of their respective income dividends paid during the Portfolios' fiscal year ended December 31, 2008 qualified for the dividends received deduction.
DWS Global Opportunities VIP and DWS International VIP paid foreign taxes of $236,000 and $1,140,104, respectively, and earned $1,947,000 and $14,248,491, respectively, of foreign source income during the year ended December 31, 2008. Pursuant to Section 853 of the Internal Revenue Code, DWS Global Opportunities VIP and DWS International VIP designate $0.01 and $0.02 per share, respectively, as foreign taxes paid and $0.06 and $0.31 per share, respectively, as income earned from foreign sources for the year ended December 31, 2008.
Please consult a tax advisor if you have questions about federal or state income tax laws, or on how to prepare your tax returns. If you have specific questions about your account, please call (800) 728-3337.
Proxy Voting
The Series' policies and procedures for voting proxies for portfolio securities and information about how the Series voted proxies related to its portfolio securities during the 12-month period ended June 30 are available on our Web site — www.dws-investments.com (click on "proxy voting"at the bottom of the page) — or on the SEC's Web site — www.sec.gov. To obtain a written copy of the Series' policies and procedures without charge, upon request, call us toll free at (800) 621-1048.
Investment Management Agreement Approval
DWS Bond VIP
The Board of Trustees, including the Independent Trustees, approved the renewal of your Fund's investment management agreement (the "Agreement") with Deutsche Investment Management Americas Inc. ("DIMA"), the sub-advisory agreement (the "Sub-Advisory Agreement") between DIMA and Aberdeen Asset Management, Inc. ("AAMI"), and the sub-sub-advisory agreement (the "Sub-Sub-Advisory Agreement," and together with the Agreement and Sub-Advisory Agreement, the "Agreements") between AAMI and Aberdeen Asset Management Investment Services Limited ("Aberdeen IS") in September 2008. As noted below, in the case of AAMI and Aberdeen IS, the Board also determined to terminate the Sub-Advisory Agreement and Sub-Sub-Advisory Agreement as of December 1, 2008.
In terms of the process that the Board followed prior to approving the Agreements, shareholders should know that:
• At the present time, all but one of your Fund's Trustees are independent of DIMA and its affiliates.
• The Trustees meet frequently to discuss fund matters. Each year, the Trustees dedicate part or all of several meetings to contract review matters. Over the course of several months, the Board's Contract Committee, in coordination with the Board's Fixed Income and Quant Oversight Committee, reviewed comprehensive materials received from DIMA, independent third parties and independent counsel. These materials included an analysis of the Fund's performance, fees and expenses, and profitability compiled by the Fund's independent fee consultant. The Board also received extensive information throughout the year regarding performance of the Fund.
• The Trustees regularly meet privately with their independent counsel (and, as needed, other advisors) to discuss contract review and other matters. In addition, the Trustees were also advised by the Fund's independent fee consultant in the course of their review of the Fund's contractual arrangements and considered a comprehensive report prepared by the independent fee consultant in connection with their deliberations (the "IFC Report").
• In connection with reviewing the Agreements, the Board also reviewed the terms of the administrative services agreement, transfer agency agreement and other material service agreements.
• Based on its evaluation of the information provided, the Contract Committee presented its findings and recommendations to the Independent Trustees as a group. The Independent Trustees reviewed the Contract Committee's findings and recommendations and presented their recommendations to the full Board.
In connection with the contract review process, the Contract Committee and the Board considered the factors discussed below, among others. The Board also considered that DIMA and its predecessors have managed the Fund since its inception, and the Board believes that a long-term relationship with a capable, conscientious advisor is in the best interests of the Fund. The Board considered, generally, that shareholders chose to invest or remain invested in the Fund knowing that DIMA managed the Fund, and that the Agreement was approved by the Fund's shareholders at a special meeting held in 2006. DIMA is part of Deutsche Bank, a major global banking institution that is engaged in a wide range of financial services. The Board believes that there are significant advantages to being part of a global asset management business that offers a wide range of investing expertise and resources, including hundreds of portfolio managers and analysts with research capabilities in many countries throughout the world.
While shareholders may focus primarily on fund performance and fees, the Fund's Board considers these and many other factors, including the quality and integrity of DIMA's, AAMI's and Aberdeen IS's personnel and such other issues as back-office operations, fund valuations, and compliance policies and procedures.
Nature, Quality and Extent of Services. The Board considered the terms of the Agreements, including the scope of advisory services provided under the Agreements. The Board noted that, under the Agreements, DIMA, AAMI and Aberdeen IS provide portfolio management services to the Fund and that, pursuant to a separate administrative services agreement, DIMA provides administrative services to the Fund. The Board considered the experience and skills of senior management and investment personnel, the resources made available to such personnel, the ability of DIMA, AAMI and Aberdeen IS to attract and retain high-quality personnel, and the organizational depth and stability of DIMA, AAMI and Aberdeen IS. The Board reviewed the Fund's performance over short-term and long-term periods and compared those returns to various agreed-upon performance measures, including market indices and a peer universe compiled by the independent fee consultant using information supplied by Lipper Inc. ("Lipper"). The Board also noted that it has put a process into place of identifying "Focus Funds" (e.g., funds performing poorly relative to their benchmark or a peer group compiled by Lipper), and receives more frequent reporting and information from DIMA regarding such funds, along with DIMA's remedial plans to address underperformance. The Board believes this process is an effective manner of identifying and addressing underperforming funds. Based on the information provided, the Board noted that for the one-, three- and five-year periods ended December 31, 2007, the Fund's performance (Class A shares) was in the 3rd quartile, 3rd quartile and 2nd quartile, respectively, of the applicable Lipper universe (the 1st quartile being the best performers and the 4th quartile being the worst performers). The Board also observed that the Fund has underperformed its benchmark in each of the one-, three- and five-year periods ended December 31, 2007. The Board recognized that there have been significant changes in the Fund's management structure, including the termination of AAMI and Aberdeen IS as the Fund's sub-advisor and sub-sub-advisor, respectively, and the introduction of a new portfolio management team effective December 1, 2008.
On the basis of this evaluation and the ongoing review of investment results by the Board, the Board concluded that the nature, quality and extent of services provided by DIMA, AAMI and Aberdeen IS historically have been and continue to be satisfactory.
Fees and Expenses. The Board considered the Fund's investment management fee schedule, sub-advisory and sub-sub-advisory fee schedules, operating expenses, and total expense ratios, and comparative information provided by Lipper and the independent fee consultant regarding investment management fee rates paid to other investment advisors by similar funds (1st quartile being the most favorable and 4th quartile being the least favorable). With respect to management fees paid to other investment advisors by similar funds, the Board noted that the contractual fee rates paid by the Fund, which include the 0.10% fee paid to DIMA under the Fund's administrative services agreement, were equal to the median (2nd quartile) of the applicable Lipper peer group (based on Lipper data provided as of December 31, 2007). With respect to the sub-advisory and sub-sub-advisory fees paid to AAMI and Aberdeen IS, the Board noted that the fees are paid by DIMA and AAMI, respectively, out of their fees and not directly by the Fund. The Board noted that the Fund's Class A shares' total (net) operating expenses were expected to be higher than the median (3rd quartile) of the applicable Lipper expense universe (based on Lipper data provided as of December 31, 2007). The Board considered the Fund's management fee rate as compared to fees charged by DIMA and certain of its affiliates for comparable mutual funds and considered differences in fund and fee structures between the DWS Funds. The Board also considered how the Fund's total (net) operating expenses compared to the total (net) operating expenses of a more customized peer group selected by Lipper (based on such factors as asset size).
On the basis of the information provided, the Board concluded that management fees were reasonable and appropriate in light of the nature, quality and extent of services provided by DIMA, AAMI and Aberdeen IS.
Profitability. The Board reviewed detailed information regarding revenues received by DIMA under the Agreement. The Board considered the estimated costs and pre-tax profits realized by DIMA from advising the DWS Funds, as well as estimates of the pre-tax profits attributable to managing the Fund in particular. The Board also received information regarding the estimated enterprise-wide profitability of the DWS Investments organization with respect to all fund services in totality and by fund. The Board reviewed DIMA's methodology in allocating its costs to the management of the Fund. Based on the information provided, the Board concluded that the pre-tax profits realized by DIMA in connection with the management of the Fund were not unreasonable. The Board also reviewed information regarding the profitability of certain similar investment management firms. The Board noted that while information regarding the profitability of such firms is limited (and in some cases is not necessarily prepared on a comparable basis), DIMA and its affiliates' overall profitability with respect to the DWS Investments fund complex (after taking into account distribution and other services provided to the funds by DIMA and its affiliates) was lower than the overall profitability levels of many comparable firms for which such data was available.
Economies of Scale. The Board considered whether there are economies of scale with respect to the management of the Fund and whether the Fund benefits from any economies of scale. The Board noted that the Fund's management fee schedule includes fee breakpoints. The Board concluded that the Fund's fee schedule represents an appropriate sharing between the Fund and DIMA of such economies of scale as may exist in the management of the Fund at current asset levels.
Other Benefits to DIMA and Its Affiliates. The Board also considered the character and amount of other incidental benefits received by DIMA and its affiliates, including any fees received by DIMA for administrative services provided to the Fund and any fees received by an affiliate of DIMA for distribution services. The Board also considered benefits to DIMA related to brokerage and soft-dollar allocations, including allocating brokerage to pay for research generated by parties other than the executing broker dealers, which pertain primarily to funds investing in equity securities, along with the incidental public relations benefits to DIMA related to DWS Funds advertising and cross-selling opportunities among DWS Investments products and services. The Board concluded that management fees were reasonable in light of these fallout benefits.
Compliance. The Board considered the significant attention and resources dedicated by DIMA to documenting and enhancing its compliance processes in recent years. The Board noted in particular (i) the experience and seniority of DIMA's chief compliance officer; (ii) the large number of compliance personnel who report to DIMA's chief compliance officer; and (iii) the substantial commitment of resources by DIMA and its affiliates to compliance matters.
Based on all of the information considered and the conclusions reached, the Board (including a majority of the Independent Trustees) determined that the continuation of the Agreements is in the best interests of the Fund. In making this determination the Board did not give particular weight to any single factor identified above. The Board considered these factors over the course of numerous meetings, certain of which were in executive session with only the Independent Trustees and their counsel present. It is possible that individual Trustees may have weighed these factors differently in reaching their individual decisions to approve the continuation of the Agreements.
DWS Growth & Income VIP
The Board of Trustees, including the Independent Trustees, approved the renewal of your Fund's investment management agreement (the "Agreement") with Deutsche Investment Management Americas Inc. ("DIMA") in September 2008.
In terms of the process that the Board followed prior to approving the Agreement, shareholders should know that:
• At the present time, all but one of your Fund's Trustees are independent of DIMA and its affiliates.
• The Trustees meet frequently to discuss fund matters. Each year, the Trustees dedicate part or all of several meetings to contract review matters. Over the course of several months, the Board's Contract Committee, in coordination with the Board's Fixed Income and Quant Oversight Committee, reviewed comprehensive materials received from DIMA, independent third parties and independent counsel. These materials included an analysis of the Fund's performance, fees and expenses, and profitability compiled by the Fund's independent fee consultant. The Board also received extensive information throughout the year regarding performance of the Fund.
• The Trustees regularly meet privately with their independent counsel (and, as needed, other advisors) to discuss contract review and other matters. In addition, the Trustees were also advised by the Fund's independent fee consultant in the course of their review of the Fund's contractual arrangements and considered a comprehensive report prepared by the independent fee consultant in connection with their deliberations (the "IFC Report").
• In connection with reviewing the Agreement, the Board also reviewed the terms of the Fund's Rule 12b-1 plan, distribution agreement, administrative services agreement, transfer agency agreement and other material service agreements.
• Based on its evaluation of the information provided, the Contract Committee presented its findings and recommendations to the Independent Trustees as a group. The Independent Trustees reviewed the Contract Committee's findings and recommendations and presented their recommendations to the full Board.
In connection with the contract review process, the Contract Committee and the Board considered the factors discussed below, among others. The Board also considered that DIMA and its predecessors have managed the Fund since its inception, and the Board believes that a long-term relationship with a capable, conscientious advisor is in the best interests of the Fund. The Board considered, generally, that shareholders chose to invest or remain invested in the Fund knowing that DIMA managed the Fund, and that the Agreement was approved by the Fund's shareholders at a special meeting held in 2006. DIMA is part of Deutsche Bank, a major global banking institution that is engaged in a wide range of financial services. The Board believes that there are significant advantages to being part of a global asset management business that offers a wide range of investing expertise and resources, including hundreds of portfolio managers and analysts with research capabilities in many countries throughout the world.
While shareholders may focus primarily on fund performance and fees, the Fund's Board considers these and many other factors, including the quality and integrity of DIMA's personnel and such other issues as back-office operations, fund valuations, and compliance policies and procedures.
Nature, Quality and Extent of Services. The Board considered the terms of the Agreement, including the scope of advisory services provided under the Agreement. The Board noted that, under the Agreement, DIMA provides portfolio management services to the Fund and that, pursuant to a separate administrative services agreement, DIMA provides administrative services to the Fund. The Board considered the experience and skills of senior management and investment personnel, the resources made available to such personnel, the ability of DIMA to attract and retain high-quality personnel, and the organizational depth and stability of DIMA. The Board reviewed the Fund's performance over short-term and long-term periods and compared those returns to various agreed-upon performance measures, including market indices and a peer universe compiled by the independent fee consultant using information supplied by Lipper Inc. ("Lipper"). The Board also noted that it has put a process into place of identifying "Focus Funds" (e.g., funds performing poorly relative to their benchmark or a peer group compiled by Lipper), and receives more frequent reporting and information from DIMA regarding such funds, along with DIMA's remedial plans to address underperformance. The Board believes this process is an effective manner of identifying and addressing underperforming funds. Based on the information provided, the Board noted that for the one-, three- and five-year periods ended December 31, 2007, the Fund's performance (Class A shares) was in the 4th quartile, 4th quartile and 3rd quartile, respectively, of the applicable Lipper universe (the 1st quartile being the best performers and the 4th quartile being the worst performers). The Board also observed that the Fund has underperformed its benchmark in each of the one-, three- and five-year periods ended December 31, 2007. The Board noted the disappointing investment performance of the Fund in recent periods and continued to discuss with senior management of DIMA the factors contributing to such underperformance and actions being taken to improve performance. The Board also observed that the Fund had experienced improved relative performance during the first six months of 2008. The Board recognized that DIMA has made significant changes in its investment personnel and processes in recent years in an effort to improve long-term performance.
On the basis of this evaluation and the ongoing review of investment results by the Board, the Board concluded that the nature, quality and extent of services provided by DIMA historically have been and continue to be satisfactory.
Fees and Expenses. The Board considered the Fund's investment management fee schedule, operating expenses, and total expense ratios, and comparative information provided by Lipper and the independent fee consultant regarding investment management fee rates paid to other investment advisors by similar funds (1st quartile being the most favorable and 4th quartile being the least favorable). With respect to management fees paid to other investment advisors by similar funds, the Board noted that the contractual fee rates paid by the Fund, which include the 0.10% fee paid to DIMA under the Fund's administrative services agreement, were lower than the median (1st quartile) of the applicable Lipper peer group (based on Lipper data provided as of December 31, 2007). The Board noted that the Fund's Class A shares' total (net) operating expenses (excluding 12b-1 fees) were expected to be lower than the median (1st quartile) of the applicable Lipper expense universe (based on Lipper data provided as of December 31, 2007, and analyzing Lipper expense universe Class A expenses less any applicable 12b-1 fees) ("Lipper Universe Expenses"). The Board also reviewed each other share class's total (net) operating expenses relative to the Lipper Universe Expenses. The Board considered the Fund's management fee rate as compared to fees charged by DIMA and certain of its affiliates for comparable mutual funds and considered differences in fund and fee structures between the DWS Funds. The Board also considered how the Fund's total (net) operating expenses compared to the total (net) operating expenses of a more customized peer group selected by Lipper (based on such factors as asset size). The Board also noted that the expense limitations agreed to by DIMA helped to ensure that the Fund's total (net) operating expenses would be competitive relative to the applicable Lipper universe.
On the basis of the information provided, the Board concluded that management fees were reasonable and appropriate in light of the nature, quality and extent of services provided by DIMA.
Profitability. The Board reviewed detailed information regarding revenues received by DIMA under the Agreement. The Board considered the estimated costs and pre-tax profits realized by DIMA from advising the DWS Funds, as well as estimates of the pre-tax profits attributable to managing the Fund in particular. The Board also received information regarding the estimated enterprise-wide profitability of the DWS Investments organization with respect to all fund services in totality and by fund. The Board reviewed DIMA's methodology in allocating its costs to the management of the Fund. Based on the information provided, the Board concluded that the pre-tax profits realized by DIMA in connection with the management of the Fund were not unreasonable. The Board also reviewed information regarding the profitability of certain similar investment management firms. The Board noted that while information regarding the profitability of such firms is limited (and in some cases is not necessarily prepared on a comparable basis), DIMA and its affiliates' overall profitability with respect to the DWS Investments fund complex (after taking into account distribution and other services provided to the funds by DIMA and its affiliates) was lower than the overall profitability levels of many comparable firms for which such data was available.
Economies of Scale. The Board considered whether there are economies of scale with respect to the management of the Fund and whether the Fund benefits from any economies of scale. The Board noted that the Fund's management fee schedule includes fee breakpoints. The Board concluded that the Fund's fee schedule represents an appropriate sharing between the Fund and DIMA of such economies of scale as may exist in the management of the Fund at current asset levels.
Other Benefits to DIMA and Its Affiliates. The Board also considered the character and amount of other incidental benefits received by DIMA and its affiliates, including any fees received by DIMA for administrative services provided to the Fund and any fees received by an affiliate of DIMA for distribution services. The Board also considered benefits to DIMA related to brokerage and soft-dollar allocations, including allocating brokerage to pay for research generated by parties other than the executing broker dealers, which pertain primarily to funds investing in equity securities, along with the incidental public relations benefits to DIMA related to DWS Funds advertising and cross-selling opportunities among DWS Investments products and services. The Board concluded that management fees were reasonable in light of these fallout benefits.
Compliance. The Board considered the significant attention and resources dedicated by DIMA to documenting and enhancing its compliance processes in recent years. The Board noted in particular (i) the experience and seniority of DIMA's chief compliance officer; (ii) the large number of compliance personnel who report to DIMA's chief compliance officer; and (iii) the substantial commitment of resources by DIMA and its affiliates to compliance matters.
Based on all of the information considered and the conclusions reached, the Board (including a majority of the Independent Trustees) determined that the continuation of the Agreement is in the best interests of the Fund. In making this determination the Board did not give particular weight to any single factor identified above. The Board considered these factors over the course of numerous meetings, certain of which were in executive session with only the Independent Trustees and their counsel present. It is possible that individual Trustees may have weighed these factors differently in reaching their individual decisions to approve the continuation of the Agreement.
DWS Capital Growth VIP
The Board of Trustees, including the Independent Trustees, approved the renewal of your Fund's investment management agreement (the "Agreement") with Deutsche Investment Management Americas Inc. ("DIMA") in September 2008.
In terms of the process that the Board followed prior to approving the Agreement, shareholders should know that:
• At the present time, all but one of your Fund's Trustees are independent of DIMA and its affiliates.
• The Trustees meet frequently to discuss fund matters. Each year, the Trustees dedicate part or all of several meetings to contract review matters. Over the course of several months, the Board's Contract Committee, in coordination with the Board's Equity Oversight Committee, reviewed comprehensive materials received from DIMA, independent third parties and independent counsel. These materials included an analysis of the Fund's performance, fees and expenses, and profitability compiled by the Fund's independent fee consultant. The Board also received extensive information throughout the year regarding performance of the Fund.
• The Trustees regularly meet privately with their independent counsel (and, as needed, other advisors) to discuss contract review and other matters. In addition, the Trustees were also advised by the Fund's independent fee consultant in the course of their review of the Fund's contractual arrangements and considered a comprehensive report prepared by the independent fee consultant in connection with their deliberations (the "IFC Report").
• In connection with reviewing the Agreement, the Board also reviewed the terms of the Fund's Rule 12b-1 plan, distribution agreement, administrative services agreement, transfer agency agreement and other material service agreements.
• Based on its evaluation of the information provided, the Contract Committee presented its findings and recommendations to the Independent Trustees as a group. The Independent Trustees reviewed the Contract Committee's findings and recommendations and presented their recommendations to the full Board.
In connection with the contract review process, the Contract Committee and the Board considered the factors discussed below, among others. The Board also considered that DIMA and its predecessors have managed the Fund since its inception, and the Board believes that a long-term relationship with a capable, conscientious advisor is in the best interests of the Fund. The Board considered, generally, that shareholders chose to invest or remain invested in the Fund knowing that DIMA managed the Fund, and that the Agreement was approved by the Fund's shareholders at a special meeting held in 2006. DIMA is part of Deutsche Bank, a major global banking institution that is engaged in a wide range of financial services. The Board believes that there are significant advantages to being part of a global asset management business that offers a wide range of investing expertise and resources, including hundreds of portfolio managers and analysts with research capabilities in many countries throughout the world.
While shareholders may focus primarily on fund performance and fees, the Fund's Board considers these and many other factors, including the quality and integrity of DIMA's personnel and such other issues as back-office operations, fund valuations, and compliance policies and procedures.
Nature, Quality and Extent of Services. The Board considered the terms of the Agreements, including the scope of advisory services provided under the Agreement. The Board noted that, under the Agreement, DIMA provides portfolio management services to the Fund and that, pursuant to a separate administrative services agreement, DIMA provides administrative services to the Fund. The Board considered the experience and skills of senior management and investment personnel, the resources made available to such personnel, the ability of DIMA to attract and retain high-quality personnel, and the organizational depth and stability of DIMA. The Board reviewed the Fund's performance over short-term and long-term periods and compared those returns to various agreed-upon performance measures, including market indices and a peer universe compiled by the independent fee consultant using information supplied by Lipper Inc. ("Lipper"). The Board also noted that it has put a process into place of identifying "Focus Funds" (e.g., funds performing poorly relative to their benchmark or a peer group compiled by Lipper), and receives more frequent reporting and information from DIMA regarding such funds, along with DIMA's remedial plans to address underperformance. The Board believes this process is an effective manner of identifying and addressing underperforming funds. Based on the information provided, the Board noted that for the one-, three- and five-year periods ended December 31, 2007, the Fund's performance (Class A shares) was in the 3rd quartile, 2nd quartile and 2nd quartile, respectively, of the applicable Lipper universe (the 1st quartile being the best performers and the 4th quartile being the worst performers). The Board also observed that the Fund has outperformed its benchmark in each of the one-, three- and five-year periods ended December 31, 2007. The Board recognized that DIMA has made significant changes in its investment personnel and processes in recent years in an effort to improve long-term performance.
On the basis of this evaluation and the ongoing review of investment results by the Board, the Board concluded that the nature, quality and extent of services provided by DIMA historically have been and continue to be satisfactory.
Fees and Expenses. The Board considered the Fund's investment management fee schedule, operating expenses, and total expense ratios, and comparative information provided by Lipper and the independent fee consultant regarding investment management fee rates paid to other investment advisors by similar funds (1st quartile being the most favorable and 4th quartile being the least favorable). With respect to management fees paid to other investment advisors by similar funds, the Board noted that the contractual fee rates paid by the Fund, which include the 0.10% fee paid to DIMA under the Fund's administrative services agreement, were lower than the median (1st quartile) of the applicable Lipper peer group (based on Lipper data provided as of December 31, 2007). The Board noted that the Fund's Class A shares' total (net) operating expenses (excluding 12b-1 fees) were expected to be lower than the median (1st quartile) of the applicable Lipper expense universe (based on Lipper data provided as of December 31, 2007, and analyzing Lipper expense universe Class A expenses less any applicable 12b-1 fees) ("Lipper Universe Expenses"). The Board also reviewed each other share class's total (net) operating expenses relative to the Lipper Universe Expenses. The Board considered the Fund's management fee rate as compared to fees charged by DIMA and certain of its affiliates for comparable mutual funds and considered differences in fund and fee structures between the DWS Funds. The Board also considered how the Fund's total (net) operating expenses compared to the total (net) operating expenses of a more customized peer group selected by Lipper (based on such factors as asset size). The Board also noted that the expense limitations agreed to by DIMA helped to ensure that the Fund's total (net) operating expenses would be competitive relative to the applicable Lipper universe.
On the basis of the information provided, the Board concluded that management fees were reasonable and appropriate in light of the nature, quality and extent of services provided by DIMA.
Profitability. The Board reviewed detailed information regarding revenues received by DIMA under the Agreement. The Board considered the estimated costs and pre-tax profits realized by DIMA from advising the DWS Funds, as well as estimates of the pre-tax profits attributable to managing the Fund in particular. The Board also received information regarding the estimated enterprise-wide profitability of the DWS Investments organization with respect to all fund services in totality and by fund. The Board reviewed DIMA's methodology in allocating its costs to the management of the Fund. Based on the information provided, the Board concluded that the pre-tax profits realized by DIMA in connection with the management of the Fund were not unreasonable. The Board also reviewed information regarding the profitability of certain similar investment management firms. The Board noted that while information regarding the profitability of such firms is limited (and in some cases is not necessarily prepared on a comparable basis), DIMA and its affiliates' overall profitability with respect to the DWS Investments fund complex (after taking into account distribution and other services provided to the funds by DIMA and its affiliates) was lower than the overall profitability levels of many comparable firms for which such data was available.
Economies of Scale. The Board considered whether there are economies of scale with respect to the management of the Fund and whether the Fund benefits from any economies of scale. The Board noted that the Fund's management fee schedule includes fee breakpoints. The Board concluded that the Fund's fee schedule represents an appropriate sharing between the Fund and DIMA of such economies of scale as may exist in the management of the Fund at current asset levels.
Other Benefits to DIMA and Its Affiliates. The Board also considered the character and amount of other incidental benefits received by DIMA and its affiliates, including any fees received by DIMA for administrative services provided to the Fund and any fees received by an affiliate of DIMA for distribution services. The Board also considered benefits to DIMA related to brokerage and soft-dollar allocations, including allocating brokerage to pay for research generated by parties other than the executing broker dealers, which pertain primarily to funds investing in equity securities, along with the incidental public relations benefits to DIMA related to DWS Funds advertising and cross-selling opportunities among DWS Investments products and services. The Board concluded that management fees were reasonable in light of these fallout benefits.
Compliance. The Board considered the significant attention and resources dedicated by DIMA to documenting and enhancing its compliance processes in recent years. The Board noted in particular (i) the experience and seniority of DIMA's chief compliance officer; (ii) the large number of compliance personnel who report to DIMA's chief compliance officer; and (iii) the substantial commitment of resources by DIMA and its affiliates to compliance matters.
Based on all of the information considered and the conclusions reached, the Board (including a majority of the Independent Trustees) determined that the continuation of the Agreement is in the best interests of the Fund. In making this determination the Board did not give particular weight to any single factor identified above. The Board considered these factors over the course of numerous meetings, certain of which were in executive session with only the Independent Trustees and their counsel present. It is possible that individual Trustees may have weighed these factors differently in reaching their individual decisions to approve the continuation of the Agreement.
DWS Global Opportunities VIP
The Board of Trustees, including the Independent Trustees, approved the renewal of your Fund's investment management agreement (the "Agreement") with Deutsche Investment Management Americas Inc. ("DIMA") in September 2008.
In terms of the process that the Board followed prior to approving the Agreement, shareholders should know that:
• At the present time, all but one of your Fund's Trustees are independent of DIMA and its affiliates.
• The Trustees meet frequently to discuss fund matters. Each year, the Trustees dedicate part or all of several meetings to contract review matters. Over the course of several months, the Board's Contract Committee, in coordination with the Board's Equity Oversight Committee, reviewed comprehensive materials received from DIMA, independent third parties and independent counsel. These materials included an analysis of the Fund's performance, fees and expenses, and profitability compiled by the Fund's independent fee consultant. The Board also received extensive information throughout the year regarding performance of the Fund.
• The Trustees regularly meet privately with their independent counsel (and, as needed, other advisors) to discuss contract review and other matters. In addition, the Trustees were also advised by the Fund's independent fee consultant in the course of their review of the Fund's contractual arrangements and considered a comprehensive report prepared by the independent fee consultant in connection with their deliberations (the "IFC Report").
• In connection with reviewing the Agreement, the Board also reviewed the terms of the Fund's Rule 12b-1 plan, distribution agreement, administrative services agreement, transfer agency agreement and other material service agreements.
• Based on its evaluation of the information provided, the Contract Committee presented its findings and recommendations to the Independent Trustees as a group. The Independent Trustees reviewed the Contract Committee's findings and recommendations and presented their recommendations to the full Board.
In connection with the contract review process, the Contract Committee and the Board considered the factors discussed below, among others. The Board also considered that DIMA and its predecessors have managed the Fund since its inception, and the Board believes that a long-term relationship with a capable, conscientious advisor is in the best interests of the Fund. The Board considered, generally, that shareholders chose to invest or remain invested in the Fund knowing that DIMA managed the Fund, and that the Agreement was approved by the Fund's shareholders at a special meeting held in 2006. DIMA is part of Deutsche Bank, a major global banking institution that is engaged in a wide range of financial services. The Board believes that there are significant advantages to being part of a global asset management business that offers a wide range of investing expertise and resources, including hundreds of portfolio managers and analysts with research capabilities in many countries throughout the world.
While shareholders may focus primarily on fund performance and fees, the Fund's Board considers these and many other factors, including the quality and integrity of DIMA's personnel and such other issues as back-office operations, fund valuations, and compliance policies and procedures.
Nature, Quality and Extent of Services. The Board considered the terms of the Agreement, including the scope of advisory services provided under the Agreement. The Board noted that, under the Agreement, DIMA provides portfolio management services to the Fund and that, pursuant to a separate administrative services agreement, DIMA provides administrative services to the Fund. The Board considered the experience and skills of senior management and investment personnel, the resources made available to such personnel, the ability of DIMA to attract and retain high-quality personnel, and the organizational depth and stability of DIMA. The Board reviewed the Fund's performance over short-term and long-term periods and compared those returns to various agreed-upon performance measures, including market indices and a peer universe compiled by the independent fee consultant using information supplied by Lipper Inc. ("Lipper"). The Board also noted that it has put a process into place of identifying "Focus Funds" (e.g., funds performing poorly relative to their benchmark or a peer group compiled by Lipper), and receives more frequent reporting and information from DIMA regarding such funds, along with DIMA's remedial plans to address underperformance. The Board believes this process is an effective manner of identifying and addressing underperforming funds. Based on the information provided, the Board noted that for the one-, three- and five-year periods ended December 31, 2007, the Fund's performance (Class A shares) was in the 3rd quartile, 1st quartile and 1st quartile, respectively, of the applicable Lipper universe (the 1st quartile being the best performers and the 4th quartile being the worst performers). The Board also observed that the Fund has outperformed its benchmark in each of the one-, three- and five-year periods ended December 31, 2007. The Board recognized that DIMA has made significant changes in its investment personnel and processes in recent years in an effort to improve long-term performance.
On the basis of this evaluation and the ongoing review of investment results by the Board, the Board concluded that the nature, quality and extent of services provided by DIMA historically have been and continue to be satisfactory.
Fees and Expenses. The Board considered the Fund's investment management fee schedule, operating expenses, and total expense ratios, and comparative information provided by Lipper and the independent fee consultant regarding investment management fee rates paid to other investment advisors by similar funds (1st quartile being the most favorable and 4th quartile being the least favorable). With respect to management fees paid to other investment advisors by similar funds, the Board noted that the contractual fee rates paid by the Fund, which include the 0.10% fee paid to DIMA under the Fund's administrative services agreement, were higher than the median (4th quartile) of the applicable Lipper peer group (based on Lipper data provided as of December 31, 2007). The Board noted that the Fund's Class A shares' total (net) operating expenses (excluding 12b-1 fees) were expected to be higher than the median (3rd quartile) of the applicable Lipper expense universe (based on Lipper data provided as of December 31, 2007, and analyzing Lipper expense universe Class A expenses less any applicable 12b-1 fees) ("Lipper Universe Expenses"). The Board also reviewed each other share class's total (net) operating expenses relative to the Lipper Universe Expenses. The Board considered the Fund's management fee rate as compared to fees charged by DIMA and certain of its affiliates for comparable mutual funds and considered differences in fund and fee structures between the DWS Funds. The Board also considered how the Fund's total (net) operating expenses compared to the total (net) operating expenses of a more customized peer group selected by Lipper (based on such factors as asset size). The Board also noted that the expense limitations agreed to by DIMA helped to ensure that the Fund's total (net) operating expenses would be competitive relative to the applicable Lipper universe.
On the basis of the information provided, the Board concluded that management fees were reasonable and appropriate in light of the nature, quality and extent of services provided by DIMA.
Profitability. The Board reviewed detailed information regarding revenues received by DIMA under the Agreement. The Board considered the estimated costs and pre-tax profits realized by DIMA from advising the DWS Funds, as well as estimates of the pre-tax profits attributable to managing the Fund in particular. The Board also received information regarding the estimated enterprise-wide profitability of the DWS Investments organization with respect to all fund services in totality and by fund. The Board reviewed DIMA's methodology in allocating its costs to the management of the Fund. Based on the information provided, the Board concluded that the pre-tax profits realized by DIMA in connection with the management of the Fund were not unreasonable. The Board also reviewed information regarding the profitability of certain similar investment management firms. The Board noted that while information regarding the profitability of such firms is limited (and in some cases is not necessarily prepared on a comparable basis), DIMA and its affiliates' overall profitability with respect to the DWS Investments fund complex (after taking into account distribution and other services provided to the funds by DIMA and its affiliates) was lower than the overall profitability levels of many comparable firms for which such data was available.
Economies of Scale. The Board considered whether there are economies of scale with respect to the management of the Fund and whether the Fund benefits from any economies of scale. The Board noted that the Fund's management fee schedule includes fee breakpoints. The Board concluded that the Fund's fee schedule represents an appropriate sharing between the Fund and DIMA of such economies of scale as may exist in the management of the Fund at current asset levels.
Other Benefits to DIMA and Its Affiliates. The Board also considered the character and amount of other incidental benefits received by DIMA and its affiliates, including any fees received by DIMA for administrative services provided to the Fund and any fees received by an affiliate of DIMA for distribution services. The Board also considered benefits to DIMA related to brokerage and soft-dollar allocations, including allocating brokerage to pay for research generated by parties other than the executing broker dealers, which pertain primarily to funds investing in equity securities, along with the incidental public relations benefits to DIMA related to DWS Funds advertising and cross-selling opportunities among DWS Investments products and services. The Board concluded that management fees were reasonable in light of these fallout benefits.
Compliance. The Board considered the significant attention and resources dedicated by DIMA to documenting and enhancing its compliance processes in recent years. The Board noted in particular (i) the experience and seniority of DIMA's chief compliance officer; (ii) the large number of compliance personnel who report to DIMA's chief compliance officer; and (iii) the substantial commitment of resources by DIMA and its affiliates to compliance matters.
Based on all of the information considered and the conclusions reached, the Board (including a majority of the Independent Trustees) determined that the continuation of the Agreement is in the best interests of the Fund. In making this determination the Board did not give particular weight to any single factor identified above. The Board considered these factors over the course of numerous meetings, certain of which were in executive session with only the Independent Trustees and their counsel present. It is possible that individual Trustees may have weighed these factors differently in reaching their individual decisions to approve the continuation of the Agreement.
DWS International VIP
The Board of Trustees, including the Independent Trustees, approved the renewal of your Fund's investment management agreement (the "Agreement") with Deutsche Investment Management Americas Inc. ("DIMA") in September 2008.
In terms of the process that the Board followed prior to approving the Agreement, shareholders should know that:
• At the present time, all but one of your Fund's Trustees are independent of DIMA and its affiliates.
• The Trustees meet frequently to discuss fund matters. Each year, the Trustees dedicate part or all of several meetings to contract review matters. Over the course of several months, the Board's Contract Committee, in coordination with the Board's Equity Oversight Committee, reviewed comprehensive materials received from DIMA, independent third parties and independent counsel. These materials included an analysis of the Fund's performance, fees and expenses, and profitability compiled by the Fund's independent fee consultant. The Board also received extensive information throughout the year regarding performance of the Fund.
• The Trustees regularly meet privately with their independent counsel (and, as needed, other advisors) to discuss contract review and other matters. In addition, the Trustees were also advised by the Fund's independent fee consultant in the course of their review of the Fund's contractual arrangements and considered a comprehensive report prepared by the independent fee consultant in connection with their deliberations (the "IFC Report").
• In connection with reviewing the Agreement, the Board also reviewed the terms of the Fund's Rule 12b-1 plan, distribution agreement, administrative services agreement, transfer agency agreement and other material service agreements.
• Based on its evaluation of the information provided, the Contract Committee presented its findings and recommendations to the Independent Trustees as a group. The Independent Trustees reviewed the Contract Committee's findings and recommendations and presented their recommendations to the full Board.
In connection with the contract review process, the Contract Committee and the Board considered the factors discussed below, among others. The Board also considered that DIMA and its predecessors have managed the Fund since its inception, and the Board believes that a long-term relationship with a capable, conscientious advisor is in the best interests of the Fund. The Board considered, generally, that shareholders chose to invest or remain invested in the Fund knowing that DIMA managed the Fund, and that the Agreement was approved by the Fund's shareholders at a special meeting held in 2006. DIMA is part of Deutsche Bank, a major global banking institution that is engaged in a wide range of financial services. The Board believes that there are significant advantages to being part of a global asset management business that offers a wide range of investing expertise and resources, including hundreds of portfolio managers and analysts with research capabilities in many countries throughout the world.
While shareholders may focus primarily on fund performance and fees, the Fund's Board considers these and many other factors, including the quality and integrity of DIMA's personnel and such other issues as back-office operations, fund valuations, and compliance policies and procedures.
Nature, Quality and Extent of Services. The Board considered the terms of the Agreement, including the scope of advisory services provided under the Agreement. The Board noted that, under the Agreement, DIMA provides portfolio management services to the Fund and that, pursuant to a separate administrative services agreement, DIMA provides administrative services to the Fund. The Board considered the experience and skills of senior management and investment personnel, the resources made available to such personnel, the ability of DIMA to attract and retain high-quality personnel, and the organizational depth and stability of DIMA. The Board reviewed the Fund's performance over short-term and long-term periods and compared those returns to various agreed-upon performance measures, including market indices and a peer universe compiled by the independent fee consultant using information supplied by Lipper Inc. ("Lipper"). The Board also noted that it has put a process into place of identifying "Focus Funds" (e.g., funds performing poorly relative to their benchmark or a peer group compiled by Lipper), and receives more frequent reporting and information from DIMA regarding such funds, along with DIMA's remedial plans to address underperformance. The Board believes this process is an effective manner of identifying and addressing underperforming funds. Based on the information provided, the Board noted that for the one-, three- and five-year periods ended December 31, 2007, the Fund's performance (Class A shares) was in the 2nd quartile, 1st quartile and 3rd quartile, respectively, of the applicable Lipper universe (the 1st quartile being the best performers and the 4th quartile being the worst performers). The Board also observed that the Fund has outperformed its benchmark in the one- and three-year periods ended December 31, 2007 and has underperformed its benchmark in the five-year period ended December 31, 2007. The Board recognized that DIMA has made significant changes in its investment personnel and processes in recent years in an effort to improve long-term performance.
On the basis of this evaluation and the ongoing review of investment results by the Board, the Board concluded that the nature, quality and extent of services provided by DIMA historically have been and continue to be satisfactory.
Fees and Expenses. The Board considered the Fund's investment management fee schedule, operating expenses, and total expense ratios, and comparative information provided by Lipper and the independent fee consultant regarding investment management fee rates paid to other investment advisors by similar funds (1st quartile being the most favorable and 4th quartile being the least favorable). With respect to management fees paid to other investment advisors by similar funds, the Board noted that the contractual fee rates paid by the Fund, which include the 0.10% fee paid to DIMA under the Fund's administrative services agreement, were higher than the median (4th quartile) of the applicable Lipper peer group (based on Lipper data provided as of December 31, 2007). The Board noted that the Fund's Class A shares' total (net) operating expenses (excluding 12b-1 fees) were expected to be higher than the median (3rd quartile) of the applicable Lipper expense universe (based on Lipper data provided as of December 31, 2007, and analyzing Lipper expense universe Class A expenses less any applicable 12b-1 fees) ("Lipper Universe Expenses"). The Board also reviewed each other share class's total (net) operating expenses relative to the Lipper Universe Expenses. The Board considered the Fund's management fee rate as compared to fees charged by DIMA and certain of its affiliates for comparable mutual funds and considered differences in fund and fee structures between the DWS Funds. The Board also considered how the Fund's total (net) operating expenses compared to the total (net) operating expenses of a more customized peer group selected by Lipper (based on such factors as asset size). The Board also noted that the expense limitations agreed to by DIMA helped to ensure that the Fund's total (net) operating expenses would be competitive relative to the applicable Lipper universe.
On the basis of the information provided, the Board concluded that management fees were reasonable and appropriate in light of the nature, quality and extent of services provided by DIMA.
Profitability. The Board reviewed detailed information regarding revenues received by DIMA under the Agreement. The Board considered the estimated costs and pre-tax profits realized by DIMA from advising the DWS Funds, as well as estimates of the pre-tax profits attributable to managing the Fund in particular. The Board also received information regarding the estimated enterprise-wide profitability of the DWS Investments organization with respect to all fund services in totality and by fund. The Board reviewed DIMA's methodology in allocating its costs to the management of the Fund. Based on the information provided, the Board concluded that the pre-tax profits realized by DIMA in connection with the management of the Fund were not unreasonable. The Board also reviewed information regarding the profitability of certain similar investment management firms. The Board noted that while information regarding the profitability of such firms is limited (and in some cases is not necessarily prepared on a comparable basis), DIMA and its affiliates' overall profitability with respect to the DWS Investments fund complex (after taking into account distribution and other services provided to the funds by DIMA and its affiliates) was lower than the overall profitability levels of many comparable firms for which such data was available.
Economies of Scale. The Board considered whether there are economies of scale with respect to the management of the Fund and whether the Fund benefits from any economies of scale. The Board noted that the Fund's management fee schedule includes fee breakpoints. The Board concluded that the Fund's fee schedule represents an appropriate sharing between the Fund and DIMA of such economies of scale as may exist in the management of the Fund at current asset levels.
Other Benefits to DIMA and Its Affiliates. The Board also considered the character and amount of other incidental benefits received by DIMA and its affiliates, including any fees received by DIMA for administrative services provided to the Fund and any fees received by an affiliate of DIMA for distribution services. The Board also considered benefits to DIMA related to brokerage and soft-dollar allocations, including allocating brokerage to pay for research generated by parties other than the executing broker dealers, which pertain primarily to funds investing in equity securities, along with the incidental public relations benefits to DIMA related to DWS Funds advertising and cross-selling opportunities among DWS Investments products and services. The Board concluded that management fees were reasonable in light of these fallout benefits.
Compliance. The Board considered the significant attention and resources dedicated by DIMA to documenting and enhancing its compliance processes in recent years. The Board noted in particular (i) the experience and seniority of DIMA's chief compliance officer; (ii) the large number of compliance personnel who report to DIMA's chief compliance officer; and (iii) the substantial commitment of resources by DIMA and its affiliates to compliance matters.
Based on all of the information considered and the conclusions reached, the Board (including a majority of the Independent Trustees) determined that the continuation of the Agreement is in the best interests of the Fund. In making this determination the Board did not give particular weight to any single factor identified above. The Board considered these factors over the course of numerous meetings, certain of which were in executive session with only the Independent Trustees and their counsel present. It is possible that individual Trustees may have weighed these factors differently in reaching their individual decisions to approve the continuation of the Agreement.
DWS Health Care VIP
The Board of Trustees, including the Independent Trustees, approved the renewal of your Fund's investment management agreement (the "Agreement") with Deutsche Investment Management Americas Inc. ("DIMA") in September 2008.
In terms of the process that the Board followed prior to approving the Agreement, shareholders should know that:
• At the present time, all but one of your Fund's Trustees are independent of DIMA and its affiliates.
• The Trustees meet frequently to discuss fund matters. Each year, the Trustees dedicate part or all of several meetings to contract review matters. Over the course of several months, the Board's Contract Committee, in coordination with the Board's Equity, reviewed comprehensive materials received from DIMA, independent third parties and independent counsel. These materials included an analysis of the Fund's performance, fees and expenses, and profitability compiled by the Fund's independent fee consultant. The Board also received extensive information throughout the year regarding performance of the Fund.
• The Trustees regularly meet privately with their independent counsel (and, as needed, other advisors) to discuss contract review and other matters. In addition, the Trustees were also advised by the Fund's independent fee consultant in the course of their review of the Fund's contractual arrangements and considered a comprehensive report prepared by the independent fee consultant in connection with their deliberations (the "IFC Report").
• In connection with reviewing the Agreement, the Board also reviewed the terms of the Fund's Rule 12b-1 plan, distribution agreement, administrative services agreement, transfer agency agreement and other material service agreements.
• Based on its evaluation of the information provided, the Contract Committee presented its findings and recommendations to the Independent Trustees as a group. The Independent Trustees reviewed the Contract Committee's findings and recommendations and presented their recommendations to the full Board.
In connection with the contract review process, the Contract Committee and the Board considered the factors discussed below, among others. The Board also considered that DIMA and its predecessors have managed the Fund since its inception, and the Board believes that a long-term relationship with a capable, conscientious advisor is in the best interests of the Fund. The Board considered, generally, that shareholders chose to invest or remain invested in the Fund knowing that DIMA managed the Fund, and that the Agreement was approved by the Fund's shareholders at a special meeting held in 2006. DIMA is part of Deutsche Bank, a major global banking institution that is engaged in a wide range of financial services. The Board believes that there are significant advantages to being part of a global asset management business that offers a wide range of investing expertise and resources, including hundreds of portfolio managers and analysts with research capabilities in many countries throughout the world.
While shareholders may focus primarily on fund performance and fees, the Fund's Board considers these and many other factors, including the quality and integrity of DIMA's personnel and such other issues as back-office operations, fund valuations, and compliance policies and procedures.
Nature, Quality and Extent of Services. The Board considered the terms of the Agreement, including the scope of advisory services provided under the Agreement. The Board noted that, under the Agreement, DIMA provides portfolio management services to the Fund and that, pursuant to a separate administrative services agreement, DIMA provides administrative services to the Fund. The Board considered the experience and skills of senior management and investment personnel, the resources made available to such personnel, the ability of DIMA to attract and retain high-quality personnel, and the organizational depth and stability of DIMA. The Board reviewed the Fund's performance over short-term and long-term periods and compared those returns to various agreed-upon performance measures, including market indices and a peer universe compiled by the independent fee consultant using information supplied by Lipper Inc. ("Lipper"). The Board also noted that it has put a process into place of identifying "Focus Funds" (e.g., funds performing poorly relative to their benchmark or a peer group compiled by Lipper), and receives more frequent reporting and information from DIMA regarding such funds, along with DIMA's remedial plans to address underperformance. The Board believes this process is an effective manner of identifying and addressing underperforming funds. Based on the information provided, the Board noted that for the one-, three- and five-year periods ended December 31, 2007, the Fund's performance (Class A shares) was in the 2nd quartile, 3rd quartile and 3rd quartile, respectively, of the applicable Lipper universe (the 1st quartile being the best performers and the 4th quartile being the worst performers). The Board also observed that the Fund has outperformed its benchmark in the one-, three- and five-year periods ended December 31, 2007. The Board recognized that DIMA has made significant changes in its investment personnel and processes in recent years in an effort to improve long-term performance.
On the basis of this evaluation and the ongoing review of investment results by the Board, the Board concluded that the nature, quality and extent of services provided by DIMA historically have been and continue to be satisfactory.
Fees and Expenses. The Board considered the Fund's investment management fee schedule, operating expenses, and total expense ratios, and comparative information provided by Lipper and the independent fee consultant regarding investment management fee rates paid to other investment advisors by similar funds (1st quartile being the most favorable and 4th quartile being the least favorable). With respect to management fees paid to other investment advisors by similar funds, the Board noted that the contractual fee rates paid by the Fund, which include the 0.10% fee paid to DIMA under the Fund's administrative services agreement, were lower than the median (2nd quartile) of the applicable Lipper peer group (based on Lipper data provided as of December 31, 2007). The Board noted that the Fund's Class A shares' total (net) operating expenses (excluding 12b-1 fees) were expected to be lower than the median (2nd quartile) of the applicable Lipper expense universe (based on Lipper data provided as of December 31, 2007, and analyzing Lipper expense universe Class A expenses less any applicable 12b-1 fees) ("Lipper Universe Expenses"). The Board also reviewed each other share class's total (net) operating expenses relative to the Lipper Universe Expenses. The Board considered the Fund's management fee rate as compared to fees charged by DIMA and certain of its affiliates for comparable mutual funds and considered differences in fund and fee structures between the DWS Funds. The Board also considered how the Fund's total (net) operating expenses compared to the total (net) operating expenses of a more customized peer group selected by Lipper (based on such factors as asset size). The Board also noted that the expense limitation agreed to by DIMA helped to ensure that the Fund's total (net) operating expenses would be competitive relative to the applicable Lipper universe.
On the basis of the information provided, the Board concluded that management fees were reasonable and appropriate in light of the nature, quality and extent of services provided by DIMA.
Profitability. The Board reviewed detailed information regarding revenues received by DIMA under the Agreement. The Board considered the estimated costs and pre-tax profits realized by DIMA from advising the DWS Funds, as well as estimates of the pre-tax profits attributable to managing the Fund in particular. The Board also received information regarding the estimated enterprise-wide profitability of the DWS Investments organization with respect to all fund services in totality and by fund. The Board reviewed DIMA's methodology in allocating its costs to the management of the Fund. Based on the information provided, the Board concluded that the pre-tax profits realized by DIMA in connection with the management of the Fund were not unreasonable. The Board also reviewed information regarding the profitability of certain similar investment management firms. The Board noted that while information regarding the profitability of such firms is limited (and in some cases is not necessarily prepared on a comparable basis), DIMA and its affiliates' overall profitability with respect to the DWS Investments fund complex (after taking into account distribution and other services provided to the funds by DIMA and its affiliates) was lower than the overall profitability levels of many comparable firms for which such data was available.
Economies of Scale. The Board considered whether there are economies of scale with respect to the management of the Fund and whether the Fund benefits from any economies of scale. The Board noted that the Fund's management fee schedule includes fee breakpoints. The Board concluded that the Fund's fee schedule represents an appropriate sharing between the Fund and DIMA of such economies of scale as may exist in the management of the Fund at current asset levels.
Other Benefits to DIMA and Its Affiliates. The Board also considered the character and amount of other incidental benefits received by DIMA and its affiliates, including any fees received by DIMA for administrative services provided to the Fund and any fees received by an affiliate of DIMA for distribution services. The Board also considered benefits to DIMA related to brokerage and soft-dollar allocations, including allocating brokerage to pay for research generated by parties other than the executing broker dealers, which pertain primarily to funds investing in equity securities, along with the incidental public relations benefits to DIMA related to DWS Funds advertising and cross-selling opportunities among DWS Investments products and services. The Board concluded that management fees were reasonable in light of these fallout benefits.
Compliance. The Board considered the significant attention and resources dedicated by DIMA to documenting and enhancing its compliance processes in recent years. The Board noted in particular (i) the experience and seniority of DIMA's chief compliance officer; (ii) the large number of compliance personnel who report to DIMA's chief compliance officer; and (iii) the substantial commitment of resources by DIMA and its affiliates to compliance matters.
Based on all of the information considered and the conclusions reached, the Board (including a majority of the Independent Trustees) determined that the continuation of the Agreement is in the best interests of the Fund. In making this determination the Board did not give particular weight to any single factor identified above. The Board considered these factors over the course of numerous meetings, certain of which were in executive session with only the Independent Trustees and their counsel present. It is possible that individual Trustees may have weighed these factors differently in reaching their individual decisions to approve the continuation of the Agreement.
Summary of Management Fee Evaluation by Independent Fee Consultant
October 24, 2008
Pursuant to an Order entered into by Deutsche Investment Management Americas and affiliates (collectively, "DeAM") with the Attorney General of New York, I, Thomas H. Mack, have been appointed the Independent Fee Consultant for the DWS Funds (formerly the DWS Scudder Funds). My duties include preparing an annual written evaluation of the management fees DeAM charges the Funds, considering among other factors the management fees charged by other mutual fund companies for like services, management fees DeAM charges other clients for like services, DeAM's costs of supplying services under the management agreements and related profit margins, possible economies of scale if a Fund grows larger, and the nature and quality of DeAM's services, including fund performance. This report summarizes my evaluation for 2008, including my qualifications, the evaluation process for each of the DWS Funds, consideration of certain complex-level factors, and my conclusions. I served in substantially the same capacity in 2007.
Qualifications
For more than 35 years I have served in various professional capacities within the investment management business. I have held investment analysis and advisory positions, including securities analyst, portfolio strategist and director of investment policy with a large investment firm. I have also performed business management functions, including business development, financial management and marketing research and analysis.
Since 1991, I have been an independent consultant within the asset management industry. I have provided services to over 125 client organizations, including investment managers, mutual fund boards, product distributors and related organizations. Over the past ten years I have completed a number of assignments for mutual fund boards, specifically including assisting boards with management contract renewal.
I hold a Master of Business Administration degree, with highest honors, from Harvard University and Master of Science and Bachelor of Science (highest honors) degrees from the University of California at Berkeley. I am an independent director and audit committee financial expert for two closed-end mutual funds, serve on the board of directors of a private market research company, and have served in various leadership and financial oversight capacities with non-profit organizations.
Evaluation of Fees for each DWS Fund
My work focused primarily on evaluating, fund-by-fund, the fees charged to each of the 129 Fund portfolios in the DWS Fund family. For each Fund, I considered each of the key factors mentioned above, as well as any other relevant information. In doing so I worked closely with the Funds' Independent Directors in their annual contract renewal process, as well as in their approval of contracts for several new funds (documented separately).
In evaluating each Fund's fees, I reviewed comprehensive materials provided by or on behalf of DeAM, including expense information prepared by Lipper Analytical, comparative performance information, profitability data, manager histories, and other materials. I also accessed certain additional information from the Lipper, Strategic Insight, and Morningstar databases and drew on my industry knowledge and experience.
To facilitate evaluating this considerable body of information, I prepared for each Fund a document summarizing the key data elements in each area as well as additional analytics discussed below. This made it possible to consider each key data element in the context of the others.
In the course of contract renewal, DeAM agreed to implement a number of fee and expense adjustments requested by the Independent Directors which will favorably impact future fees and expenses, and my evaluation includes the effects of these changes.
Fees and Expenses Compared with Other Funds
The competitive fee and expense evaluation for each fund focused on two primary comparisons:
The Fund's contractual management fee (the advisory fee plus the administration fee where applicable) compared with those of a group of typically 12-15 funds in the same Lipper investment category (e.g. Large Capitalization Growth) having similar distribution arrangements and being of similar size.
The Fund's total expenses compared with a broader universe of funds from the same Lipper investment category and having similar distribution arrangements.
These two comparisons provide a view of not only the level of the fee compared with funds of similar scale but also the total expense the Fund bears for all the services it receives, in comparison with the investment choices available in the Fund's investment category and distribution channel. The principal figure-of-merit used in these comparisons was the subject Fund's percentile ranking against peers.
DeAM's Fees for Similar Services to Others
DeAM provided management fee schedules for all of its US domiciled fund and non-fund investment management accounts in any of the investment categories where there is a DWS Fund. These similar products included the other DWS Funds, non-fund pooled accounts, institutional accounts and sub-advisory accounts. Using this information, I calculated for each Fund the fee that would be charged to each similar product, at the subject Fund's asset level.
Evaluating information regarding non-fund products is difficult because there are varying levels of services required for different types of accounts, with mutual funds generally requiring considerably more regulatory and administrative types of service as well as having more frequent cash flows than other types of accounts. Also, while mutual fund fees for similar fund products can be expected to be similar, there will be some differences due to different pricing conditions in different distribution channels (e.g. retail funds versus those used in variable insurance products), differences in underlying investment processes and other factors.
Costs and Profit Margins
DeAM provided a detailed profitability analysis for each Fund. After making some adjustments so that the presentation would be more comparable to the available industry figures, I reviewed profit margins from investment management alone, from investment management plus other fund services (excluding distribution) provided to the Funds by DeAM (principally shareholder services), and DeAM profits from all sources, including distribution. A later section comments on overall profitability.
Economies of Scale
Economies of scale — an expected decline in management cost per dollar of fund assets as fund assets grow — are very rarely quantified and documented because of inherent difficulties in collecting and analyzing relevant data. However, in virtually every investment category that I reviewed, larger funds tend to have lower fees and lower total expenses than smaller funds. To see how each DWS Fund compares with this industry observation, I reviewed:
The trend in Fund assets over the last five years and the accompanying trend in total expenses. This shows if the Fund has grown and, if so, whether total expense (management fees as well as other expenses) have declined as a percent of assets.
Whether the Fund has break-points in its management fee schedule, the extent of the fee reduction built into the schedule and the asset levels where the breaks take effect, and in the case of a sub-advised Fund how the Fund's break-points compare with those of the sub-advisory fee schedule.
How the Fund's contractual fee schedule compares with trends in the industry data. To accomplish this, I constructed a chart showing how actual latest-fiscal-year contractual fees of the Fund and of other similar funds relate to average fund assets, with the subject Fund's contractual fee schedule superimposed.
Quality of Service — Performance
The quality-of-service evaluation focused on investment performance, which is the principal result of the investment management service. Each Fund's performance was reviewed over the past 1, 3, 5 and 10 years, as applicable, and compared with that of other funds in the same investment category and with a suitable market index.
In addition, I calculated and reviewed risk-adjusted returns relative to an index of similar mutual funds' returns and a suitable market index. The risk-adjusted returns analysis provides a way of determining the extent to which the Fund's return comparisons are mainly the product of investment value-added (or lack thereof) or alternatively taking considerably more or less risk than is typical in its investment category.
I also received and considered the history of portfolio manager changes for each Fund, as this provided an important context for evaluating the performance results.
Complex-Level Considerations
While this evaluation was conducted mainly at the individual fund level, there are some issues relating to the reasonableness of fees that can alternatively be considered across the whole fund complex:
I reviewed DeAM's profitability analysis for all DWS Funds, with a view toward determining if the allocation procedures used were reasonable and how profit levels compared with public data for other investment managers.
I considered whether DeAM and affiliates receive any significant ancillary or "fall-out" benefits that should be considered in interpreting the direct profitability results. These would be situations where serving as the investment manager of the Funds is beneficial to another part of the Deutsche Bank organization.
I considered how aggregated DWS Fund expenses had varied over the years, by asset class and in the context of trends in asset levels.
I reviewed the structure of the DeAM organization, trends in staffing levels, and information on compensation of investment management and other professionals compared with industry data.
Findings
Based on the process and analysis discussed above, which included reviewing a wide range of information from management and external data sources and considering among other factors the fees DeAM charges other clients, the fees charged by other fund managers, DeAM's costs and profits associated with managing the Funds, economies of scale, possible fall-out benefits, and the nature and quality of services provided, in my opinion the management fees charged the DWS Funds are reasonable.

Thomas H. Mack
Summary of Administrative Fee Evaluation by Independent Fee Consultant
September 29, 2008
Pursuant to an Order entered into by Deutsche Asset Management (DeAM) with the Attorney General of New York, I, Thomas H. Mack, have been appointed the Independent Fee Consultant for the DWS Funds and have as part of my duties evaluated the reasonableness of the proposed management fees to be charged by DeAM to the DWS Funds, taking onto account a proposal to pass through to the funds certain fund accounting-related charges in connection with new regulatory requirements. My evaluation considered the following:
• While the proposal would alter the services to be provided under the Administration Agreement, which I consider to be part of fund management under the Order, it is my opinion that the change in services is slight and that the scope of prospective services under the combination of the Advisory and Administration Agreements continues to be comparable with those typically provided to competitive funds under their management agreements.
• While the proposal would increase fund expenses, according to a pro forma analysis performed by management, the prospective effect is less than .01% for all but seven of the DeAM Funds' 438 active share classes, and in all cases the effect is less than .03% and overall expenses would remain reasonable in my opinion.
Based on the foregoing considerations, in my opinion the fees and expenses for all of the DWS Funds will remain reasonable if the Directors adopt this proposal.

Thomas H. Mack
Board Members and Officers
The following table presents certain information regarding the Board Members and Officers of the Trust as of December 31, 2008. Each Board Member's year of birth is set forth in parentheses after his or her name. Unless otherwise noted, (i) each Board Member has engaged in the principal occupation(s) noted in the table for at least the most recent five years, although not necessarily in the same capacity; and (ii) the address of each Independent Board Member is c/o Dawn-Marie Driscoll, PO Box 100176, Cape Coral, FL 33904. Except as otherwise noted below, the term of office for each Board Member is until the election and qualification of a successor, or until such Board Member sooner dies, resigns, is removed or as otherwise provided in the governing documents of the fund. Because the fund does not hold an annual meeting of shareholders, each Board Member will hold office for an indeterminate period. The Board Members may also serve in similar capacities with other funds in the fund complex. The Length of Time Served represents the year in which the Board Member joined the board of one or more DWS funds now overseen by the Board.
Independent Board Members |
Name, Year of Birth, Position with the Fund and Length of Time Served1 | Business Experience and Directorships During the Past Five Years | Number of Funds in DWS Fund Complex Overseen |
Paul K. Freeman (1950)
Chairperson since 20092
Board Member since 1993
| Consultant, World Bank/Inter-American Development Bank; Governing Council of the Independent Directors Council (governance, executive committees); formerly, Project Leader, International Institute for Applied Systems Analysis (1998-2001); Chief Executive Officer, The Eric Group, Inc. (environmental insurance) (1986-1998)
| 134 |
Dawn-Marie Driscoll (1946)
Board Member since 1987
| President, Driscoll Associates (consulting firm); Executive Fellow, Center for Business Ethics, Bentley University; formerly, Partner, Palmer & Dodge (1988-1990); Vice President of Corporate Affairs and General Counsel, Filene's (1978-1988). Directorships: Trustee of 20 open-end mutual funds managed by Sun Capital Advisers, Inc. (since 2007); Director of ICI Mutual Insurance Company (since 2007); Advisory Board, Center for Business Ethics, Bentley University; Trustee, Southwest Florida Community Foundation (charitable organization). Former Directorships: Investment Company Institute (audit, executive, nominating committees) and Independent Directors Council (governance, executive committees)
| 134 |
John W. Ballantine (1946)
Board Member since 1999
| Retired; formerly, Executive Vice President and Chief Risk Management Officer, First Chicago NBD Corporation/The First National Bank of Chicago (1996-1998); Executive Vice President and Head of International Banking (1995-1996). Directorships: Healthways, Inc. (provider of disease and care management services); Portland General Electric (utility company); Stockwell Capital Investments PLC (private equity). Former Directorships: First Oak Brook Bancshares, Inc. and Oak Brook Bank
| 134 |
Henry P. Becton, Jr. (1943)
Board Member since 1990
| Vice Chair, WGBH Educational Foundation. Directorships: Association of Public Television Stations; Becton Dickinson and Company3 (medical technology company); Belo Corporation3 (media company); Boston Museum of Science; Public Radio International; PRX, The Public Radio Exchange; The PBS Foundation. Former Directorships: American Public Television; Concord Academy; New England Aquarium; Mass. Corporation for Educational Telecommunications; Committee for Economic Development; Public Broadcasting Service
| 134 |
Keith R. Fox (1954)
Board Member since 1996
| Managing General Partner, Exeter Capital Partners (a series of private investment funds). Directorships: Progressive Holding Corporation (kitchen goods importer and distributor); Box Top Media Inc. (advertising); The Kennel Shop (retailer)
| 134 |
Kenneth C. Froewiss (1945)
Board Member since 2001
| Clinical Professor of Finance, NYU Stern School of Business (1997-present); Member, Finance Committee, Association for Asian Studies (2002-present); Director, Mitsui Sumitomo Insurance Group (US) (2004-present); prior thereto, Managing Director, J.P. Morgan (investment banking firm) (until 1996)
| 134 |
Richard J. Herring (1946)
Board Member since 1990
| Jacob Safra Professor of International Banking and Professor, Finance Department, The Wharton School, University of Pennsylvania (since July 1972); Co-Director, Wharton Financial Institutions Center (since July 2000); Director, Japan Equity Fund, Inc. (since September 2007), Thai Capital Fund, Inc. (since September 2007), Singapore Fund, Inc. (since September 2007). Formerly, Vice Dean and Director, Wharton Undergraduate Division (July 1995-June 2000); Director, Lauder Institute of International Management Studies (July 2000-June 2006)
| 134 |
William McClayton (1944)
Board Member since 2004
| Managing Director, Diamond Management & Technology Consultants, Inc. (global management consulting firm) (2001-present); Directorship: Board of Managers, YMCA of Metropolitan Chicago; formerly: Senior Partner, Arthur Andersen LLP (accounting) (1966-2001); Trustee, Ravinia Festival
| 134 |
Rebecca W. Rimel (1951)
Board Member since 1995
| President and Chief Executive Officer, The Pew Charitable Trusts (charitable organization) (1994 to present); Trustee, Thomas Jefferson Foundation (charitable organization) (1994 to present); Trustee, Executive Committee, Philadelphia Chamber of Commerce (2001-2007); Trustee, Pro Publica (2007-present) (charitable organization). Formerly, Executive Vice President, The Glenmede Trust Company (investment trust and wealth management) (1983-2004); Board Member, Investor Education (charitable organization) (2004-2005); Director, Viasys Health Care3 (January 2007-June 2007)
| 134 |
William N. Searcy, Jr. (1946)
Board Member since 1993
| Private investor since October 2003; Trustee of 20 open-end mutual funds managed by Sun Capital Advisers, Inc. (since October 1998). Formerly, Pension & Savings Trust Officer, Sprint Corporation3 (telecommunications) (November 1989-September 2003)
| 134 |
Jean Gleason Stromberg (1943)
Board Member since 1997
| Retired. Formerly, Consultant (1997-2001); Director, US Government Accountability Office (1996-1997); Partner, Fulbright & Jaworski, L.L.P. (law firm) (1978-1996). Directorships: The William and Flora Hewlett Foundation; Business Leadership Council, Wellesley College. Former Directorships: Service Source, Inc., Mutual Fund Directors Forum (2002-2004), American Bar Retirement Association (funding vehicle for retirement plans) (1987-1990 and 1994-1996)
| 134 |
Robert H. Wadsworth
(1940)
Board Member since 1999
| President, Robert H. Wadsworth & Associates, Inc. (consulting firm) (1983 to present); Director, The Phoenix Boys Choir Association
| 137 |
Interested Board Member |
Name, Year of Birth, Position with the Fund and Length of Time Served1 | Business Experience and Directorships During the Past Five Years | Number of Funds in Fund Complex Overseen |
Axel Schwarzer4 (1958)
Board Member since 2006
| Managing Director5, Deutsche Asset Management; Head of Deutsche Asset Management Americas; CEO of DWS Investments; formerly, board member of DWS Investments, Germany (1999-2005); formerly, Head of Sales and Product Management for the Retail and Private Banking Division of Deutsche Bank in Germany (1997-1999); formerly, various strategic and operational positions for Deutsche Bank Germany Retail and Private Banking Division in the field of investment funds, tax driven instruments and asset management for corporates (1989-1996)
| 134 |
Officers6 |
Name, Year of Birth, Position with the Fund and Length of Time Served7 | Principal Occupation(s) During Past 5 Years and Other Directorships Held |
Michael G. Clark8 (1965)
President, 2006-present
| Managing Director5, Deutsche Asset Management (2006-present); President of DWS family of funds; Director, ICI Mutual Insurance Company (since October 2007); formerly, Director of Fund Board Relations (2004-2006) and Director of Product Development (2000-2004), Merrill Lynch Investment Managers; Senior Vice President Operations, Merrill Lynch Asset Management (1999-2000)
|
John Millette9 (1962)
Vice President and Secretary, 1999-present
| Director5, Deutsche Asset Management
|
Paul H. Schubert8 (1963)
Chief Financial Officer, 2004-present
Treasurer, 2005-present
| Managing Director5, Deutsche Asset Management (since July 2004); formerly, Executive Director, Head of Mutual Fund Services and Treasurer for UBS Family of Funds (1998-2004); Vice President and Director of Mutual Fund Finance at UBS Global Asset Management (1994-1998)
|
Caroline Pearson9 (1962)
Assistant Secretary, 1997-present
| Managing Director5, Deutsche Asset Management
|
Rita Rubin10 (1970)
Assistant Secretary, 2009-present
| Vice President and Counsel, Deutsche Asset Management (since October 2007); formerly, Vice President, Morgan Stanley Investment Management (2004-2007); Attorney, Shearman & Sterling LLP (2004); Vice President and Associate General Counsel, UBS Global Asset Management (2001-2004)
|
Paul Antosca9 (1957)
Assistant Treasurer, 2007-present
| Director5, Deutsche Asset Management (since 2006); Vice President, The Manufacturers Life Insurance Company (U.S.A.) (1990-2006)
|
Jack Clark9 (1967)
Assistant Treasurer, 2007-present
| Director5, Deutsche Asset Management (since 2007); formerly, Vice President, State Street Corporation (2002-2007)
|
Diane Kenneally9 (1966)
Assistant Treasurer, 2007-present
| Director5, Deutsche Asset Management
|
Jason Vazquez10 (1972)
Anti-Money Laundering Compliance Officer, 2007-present
| Vice President, Deutsche Asset Management (since 2006); formerly, AML Operations Manager for Bear Stearns (2004-2006), Supervising Compliance Principal and Operations Manager for AXA Financial (1999-2004)
|
Robert Kloby10 (1962)
Chief Compliance Officer, 2006-present
| Managing Director5, Deutsche Asset Management (2004-present); formerly, Chief Compliance Officer/Chief Risk Officer, Robeco USA (2000-2004); Vice President, The Prudential Insurance Company of America (1988-2000); E.F. Hutton and Company (1984-1988)
|
J. Christopher Jackson10 (1951)
Chief Legal Officer, 2006-present
| Director5, Deutsche Asset Management (2006-present); formerly, Director, Senior Vice President, General Counsel and Assistant Secretary, Hansberger Global Investors, Inc. (1996-2006); Director, National Society of Compliance Professionals (2002-2005) (2006-2009)
|
1 The length of time served represents the year in which the Board Member joined the board of one or more DWS funds currently overseen by the Board.2 Mr. Freeman assumed the Chairperson role as of January 1, 2009. Prior to that Ms. Driscoll served as Chairperson of certain DWS funds since 2004.3 A publicly held company with securities registered pursuant to Section 12 of the Securities Exchange Act of 1934.4 The mailing address of Axel Schwarzer is c/o Deutsche Investment Management Americas Inc., 345 Park Avenue, New York, New York 10154. Mr. Schwarzer is an interested Board Member by virtue of his positions with Deutsche Asset Management. As an interested person, Mr. Schwarzer receives no compensation from the fund.5 Executive title, not a board directorship.6 As a result of their respective positions held with the Advisor, these individuals are considered "interested persons" of the Advisor within the meaning of the 1940 Act. Interested persons receive no compensation from the fund.7 The length of time served represents the year in which the officer was first elected in such capacity for one or more DWS funds.8 Address: 345 Park Avenue, New York, New York 10154.9 Address: One Beacon Street, Boston, MA 02108.10 Address: 280 Park Avenue, New York, New York 10017.The fund's Statement of Additional Information ("SAI") includes additional information about the Board Members. The SAI is available, without charge, upon request. If you would like to request a copy of the SAI, you may do so by calling the following toll-free number: (800) 621-1048.
Notes
DWS Investments is part of Deutsche Bank's Asset Management division and, within the US, represents the retail asset management activities of Deutsche Bank AG, Deutsche Bank Trust Company Americas, Deutsche Investment Management Americas Inc. and DWS Trust Company.
The views expressed in this report reflect those of the portfolio managers only through the end of the period of the report as stated on the cover. The managers' views are subject to change at any time based on market and other conditions and should not be construed as a recommendation.
This information must be preceded or accompanied by a current prospectus.
Portfolio changes should not be considered recommendations for action by individual investors.
DWS Investments Distributors, Inc.
222 South Riverside Plaza
Chicago, IL 60606
(800) 778-1482
VS1-2 (R-9041-1 2/09)
December 31, 2008
ANNUAL REPORT
DWS VARIABLE SERIES II
DWS Balanced VIP DWS Blue Chip VIP DWS Conservative Allocation VIP DWS Core Fixed Income VIP DWS Davis Venture Value VIP DWS Dreman High Return Equity VIP DWS Dreman Small Mid Cap Value VIP DWS Global Thematic VIP DWS Government & Agency Securities VIP DWS Growth Allocation VIP DWS High Income VIP DWS International Select Equity VIP DWS Janus Growth & Income VIP DWS Large Cap Value VIP DWS Mid Cap Growth VIP DWS Moderate Allocation VIP DWS Money Market VIP DWS Small Cap Growth VIP DWS Strategic Income VIP DWS Technology VIP DWS Turner Mid Cap Growth VIP |

Contents
Information About Your Portfolio's Expenses, Management Summary, Portfolio Summary, Investment Portfolio, Financial Statements and Financial Highlights for:
4 DWS Balanced VIP 46 DWS Blue Chip VIP 60 DWS Conservative Allocation VIP 71 DWS Core Fixed Income VIP 85 DWS Davis Venture Value VIP 97 DWS Dreman High Return Equity VIP 108 DWS Dreman Small Mid Cap Value VIP 120 DWS Global Thematic VIP 132 DWS Government & Agency Securities VIP 143 DWS Growth Allocation VIP 154 DWS High Income VIP 171 DWS International Select Equity VIP 182 DWS Janus Growth & Income VIP 194 DWS Large Cap Value VIP 206 DWS Mid Cap Growth VIP 217 DWS Moderate Allocation VIP 228 DWS Money Market VIP 238 DWS Small Cap Growth VIP 249 DWS Strategic Income VIP 271 DWS Technology VIP 281 DWS Turner Mid Cap Growth VIP 293 Notes to Financial Statements 318 Report of Independent Registered Public Accounting Firm 319 Tax Information 320 Proxy Voting 321 Investment Management Agreement Approval 332 Summary of Management Fee Evaluation by Independent Fee Consultant 335 Summary of Administrative Fee Evaluation by Independent Fee Consultant 336 Board Members and Officers |
This report must be preceded or accompanied by a prospectus. To obtain an additional prospectus, call (800) 778-1482 or your financial representative. We advise you to carefully consider the product's objectives, risks, charges and expenses before investing. The prospectus contains this and other important information about the product. Please read the prospectus carefully before you invest.
NOT FDIC/NCUA INSURED NO BANK GUARANTEE MAY LOSE VALUE NOT A DEPOSIT
NOT INSURED BY ANY FEDERAL GOVERNMENT AGENCY
Investments in variable portfolios involve risk. Some portfolios have more risk than others. These include portfolios that allow exposure to or otherwise concentrate investments in certain sectors, geographic regions, security types, market capitalization or foreign securities (e.g., political or economic instability, which can be accentuated in Emerging Market countries). Please read the prospectus for specific details regarding its investments and risk profile.
DWS Investments is part of Deutsche Bank's Asset Management division and, within the US, represents the retail asset management activities of Deutsche Bank AG, Deutsche Bank Trust Company Americas, Deutsche Investment Management Americas Inc. and DWS Trust Company.
Performance Summary December 31, 2008
DWS Balanced VIP
All performance shown is historical, assumes reinvestment of all dividend and capital gain distributions and does not guarantee future results. Investment return and principal value fluctuate with changing market conditions so that, when redeemed, shares may be worth more or less than their original cost. Current performance may be lower or higher than the performance data quoted. Please contact your participating insurance company for the Portfolio's most recent month-end performance. Performance doesn't reflect charges and fees ("contract charges") associated with the separate account that invests in the Portfolio or any variable life insurance policy or variable annuity contract for which the Portfolio is an investment option. These charges and fees will reduce returns. While all share classes have the same underlying portfolio, their performance will differ.
The total annual Portfolio operating expense ratios, gross of any fee waivers or expense reimbursements, as stated in the fee table of the prospectus dated May 1, 2008 are 0.52% and 0.77% for Class A and Class B shares, respectively. Please see the Information About Your Portfolio's Expenses, the Financial Highlights and Notes to the Financial Statements (Note C, Related Parties) sections of this report for gross and net expense related disclosure for the period ended December 31, 2008.
Risk Considerations
The Portfolio is subject to stock market risk, meaning stocks in the Portfolio may decline in value for extended periods of time due to the activities and financial prospects of individual companies, or due to general market and economic conditions. The Portfolio also invests in individual bonds whose yields and market values fluctuate so that your investment may be worth more or less than its original cost. Bond investments are subject to interest-rate risk such that when interest rates rise, the prices of the bonds, and thus the value of the bond portfolio, can decline and the investor can lose principal value. The Portfolio invests in derivatives seeking to hedge positions in certain securities and to generate income in order to enhance the Portfolio's returns. Derivatives can be more volatile and less liquid than traditional fixed-income securities. In the current market environment, mortgage-backed securities are experiencing increased volatility. Please read this Portfolio's prospectus for specific details regarding its investments and risk profile.
Portfolio returns for all periods shown reflect a fee waiver and/or expense reimbursement. Without this waiver/reimbursement, returns would have been lower.
Growth of an Assumed $10,000 Investment in DWS Balanced VIP |
[] DWS Balanced VIP — Class A [] Russell 1000® Index [] Barclays Capital US Aggregate Index | The Russell 1000® Index is an unmanaged index that measures the performance of the 1,000 largest companies in the Russell 3000 Index, which represents approximately 92% of the total market capitalization of the Russell 3000 Index. Index returns assume reinvestment of dividends and, unlike portfolio returns, do not reflect any fees or expenses. It is not possible to invest directly into an index. The Barclays Capital US Aggregate Index (name changed from Lehman Brothers US Aggregate Index, effective November 3, 2008) is an unmanaged, market value-weighted measure of treasury issues, agency issues, corporate bond issues and mortgage securities. Index returns, unlike portfolio returns, do not reflect any fees or expenses. It is not possible to invest directly into an index. |
 | |
Yearly periods ended December 31 |
|
Comparative Results |
DWS Balanced VIP | 1-Year | 3-Year | 5-Year | 10-Year |
Class A | Growth of $10,000
| $7,267 | $8,399 | $9,342 | $9,826 |
Average annual total return
| -27.33% | -5.65% | -1.35% | -.18% |
Russell 1000 Index
| Growth of $10,000
| $6,240 | $7,621 | $9,022 | $8,963 |
Average annual total return
| -37.60% | -8.66% | -2.04% | -1.09% |
Barclays Capital US Aggregate Index
| Growth of $10,000
| $10,524 | $11,745 | $12,552 | $17,297 |
Average annual total return
| 5.24% | 5.51% | 4.65% | 5.63% |
The growth of $10,000 is cumulative.
DWS Balanced VIP | 1-Year | 3-Year | 5-Year | Life of Class* |
Class B | Growth of $10,000
| $7,235 | $8,298 | $9,162 | $10,326 |
Average annual total return
| -27.65% | -6.03% | -1.74% | .49% |
Russell 1000 Index
| Growth of $10,000
| $6,240 | $7,621 | $9,022 | $10,532 |
Average annual total return
| -37.60% | -8.66% | -2.04% | .80% |
Barclays Capital US Aggregate Index
| Growth of $10,000
| $10,524 | $11,745 | $12,552 | $13,881 |
Average annual total return
| 5.24% | 5.51% | 4.65% | 5.17% |
The growth of $10,000 is cumulative.
* The Portfolio commenced offering Class B shares on July 1, 2002. Index returns began on June 30, 2002.Information About Your Portfolio's Expenses
DWS Balanced VIP
As an investor of the Portfolio, you incur two types of costs: ongoing expenses and transaction costs. Ongoing expenses include management fees, distribution and service (12b-1) fees and other Portfolio expenses. Examples of transaction costs include contract charges, redemption fees and account maintenance fees, which are not shown in this section. The following tables are intended to help you understand your ongoing expenses (in dollars) of investing in the Portfolio and to help you compare these expenses with the ongoing expenses of investing in other mutual funds. In the most recent six-month period, the Portfolio limited these expenses, had it not done so, expenses would have been higher. The example in the table is based on an investment of $1,000 invested at the beginning of the six-month period and held for the entire period (July 1, 2008 to December 31, 2008).
The tables illustrate your Portfolio's expenses in two ways:
• Actual Portfolio Return. This helps you estimate the actual dollar amount of ongoing expenses (but not transaction costs) paid on a $1,000 investment in the Portfolio using the Portfolio's actual return during the period. To estimate the expenses you paid over the period, simply divide your account value by $1,000 (for example, an $8,600 account value divided by $1,000 = 8.6), then multiply the result by the number in the "Expenses Paid per $1,000" line under the share class you hold.
• Hypothetical 5% Portfolio Return. This helps you to compare your Portfolio's ongoing expenses (but not transaction costs) with those of other mutual funds using the Portfolio's actual expense ratio and a hypothetical rate of return of 5% per year before expenses. Examples using a 5% hypothetical Portfolio return may be found in the shareholder reports of other mutual funds. The hypothetical account values and expenses may not be used to estimate the actual ending account balance or expenses you paid for the period.
Please note that the expenses shown in these tables are meant to highlight your ongoing expenses only and do not reflect any transaction costs. The "Expenses Paid per $1,000" line of the tables is useful in comparing ongoing expenses only and will not help you determine the relative total expense of owning different funds. If these transaction costs had been included, your costs would have been higher.
Expenses and Value of a $1,000 Investment for the six months ended December 31, 2008 |
Actual Portfolio Return | Class A | | Class B | |
Beginning Account Value 7/1/08
| $ 1,000.00 | | $ 1,000.00 | |
Ending Account Value 12/31/08
| $ 760.70 | | $ 756.40 | |
Expenses Paid per $1,000*
| $ 2.88 | | $ 3.66 | |
Hypothetical 5% Portfolio Return | Class A | | Class B | |
Beginning Account Value 7/1/08
| $ 1,000.00 | | $ 1,000.00 | |
Ending Account Value 12/31/08
| $ 1,021.87 | | $ 1,020.96 | |
Expenses Paid per $1,000*
| $ 3.30 | | $ 4.22 | |
* Expenses are equal to the Portfolio's annualized expense ratio for each share class, multiplied by the average account value over the period, multiplied by the number of days in the most recent six-month period, then divided by 366.Annualized Expense Ratios | Class A | | Class B | |
DWS Variable Series II — DWS Balanced VIP
| .65% | | .83% | |
For more information, please refer to the Portfolio's prospectus.
These tables do not reflect charges and fees ("contract charges") associated with the separate account that invests in the Portfolio or any variable life insurance policy or variable annuity contract for which the Portfolio is an investment option.
Management Summary December 31, 2008
DWS Balanced VIP
For the 12 months ended December 31, 2008, the DWS Balanced VIP had a return of -27.33% (Class A shares, unadjusted for contract charges.) The Russell 3000® Index, which is generally regarded as a good indicator of the broad stock market, had a negative return of -37.31% for the year. The Barclays Capital US Aggregate Index, the Portfolio's bond benchmark, which is considered indicative of broad bond market trends, returned 5.24% for the year. The Russell 1000® Index, the Portfolio's equity benchmark, returned -37.60%.
In December of 2007, the managers transitioned the Portfolio to a new strategic asset allocation, expanded the global tactical asset allocation overlay strategy, which the Advisor calls iGAP (integrated Global Alpha Platform), to 100% of the Portfolio's assets and increased diversification by adding more managers and investment styles. The full transition was completed in the beginning of April of 2008. The Portfolio's underperformance during 2008 was due to the underperformance of the underlying strategies, in particular the core fixed income strategy and the iGap strategy.
During 2008, in the large-cap US equity portion of the Portfolio, the quantitative strategy underperformed. Within the international portion of the Portfolio, the quantitative strategy outperformed. During this extremely volatile period, broad diversification in terms of asset classes as well as investment styles within asset classes has been more important than ever.
William Chepolis, CFA | Matthew F. MacDonald, CFA | Inna Okounkova | Gary Sullivan, CFA |
Robert Wang | Thomas Picciochi | James B. Francis, CFA3 | Julie Abbett |
Thomas Schuessler, PhD | John Brennan | J. Richard Robben, CFA | |
Joseph Axtell, CFA1 | Owen Fitzpatrick, CFA2 | Richard Shepley4 | |
Portfolio Managers, Deutsche Investment Management Americas Inc. |
Michael Sieghart, CFA5
Consultant, Deutsche Investment Management Americas Inc. |
The Russell 3000 Index measures the performance of the 3,000 largest US companies based on total market capitalization, which represents approximately 98% of the investable US equity market. Index returns assume reinvestment of dividends and, unlike portfolio returns, do not reflect any fees or expenses. It is not possible to invest directly into an index.
The Barclays Capital US Aggregate Index (name changed from Lehman Brothers US Aggregate Index, effective November 3, 2008) is an unmanaged, market value-weighted measure of Treasury issues, agency issues, corporate bond issues and mortgage securities. Index returns, unlike fund returns, do not include fees or expenses. It is not possible to invest directly into an index.
The Russell 1000 Index is an unmanaged index that measures the performance of the 1,000 largest companies in the Russell 3000 Index, which represents approximately 92% of the total market capitalization of the Russell 3000 Index. Index returns assume reinvestment of dividends and, unlike portfolio returns, do not reflect any fees or expenses. It is not possible to invest directly into an index.
1 Mr. Axtell joined the Portfolio on August 19, 2008.2 Mr. Fitzpatrick joined the Portfolio on February 15, 2009.3 Mr. Francis joined the Portfolio on July 1, 2008.4 Mr. Shepley joined the Portfolio on January 9, 2009.5 Mr. Sieghart became consultant to the Advisor on August 19, 2008.Portfolio management market commentary is as of December 31, 2008, and may not come to pass. This information is subject to change at any time based on market and other conditions. Past performance does not guarantee future results. Current and future portfolio holdings are subject to risk.
Portfolio Summary
DWS Balanced VIP
Asset Allocation (As a % of Investment Portfolio excluding Securities Lending Collateral) | 12/31/08 | 12/31/07 |
| | |
Common Stocks | 59% | 59% |
Corporate Bonds | 12% | 7% |
Mortgage-Backed Securities Pass-Throughs | 9% | 1% |
Government & Agency Obligations | 6% | 5% |
Cash Equivalents | 5% | 5% |
Commercial and Non-Agency Mortgage-Backed Securities | 5% | 16% |
Collateralized Mortgage Obligations | 3% | 3% |
Asset Backed | 1% | 3% |
Loan Participations and Assignments | — | 1% |
| 100% | 100% |
Sector Diversification (Excludes Cash Equivalents and Securities Lending) | 12/31/08 | 12/31/07 |
| | |
Financials | 18% | 18% |
Health Care | 14% | 12% |
Information Technology | 12% | 12% |
Consumer Staples | 11% | 8% |
Energy | 11% | 12% |
Industrials | 10% | 12% |
Consumer Discretionary | 7% | 11% |
Utilities | 6% | 4% |
Telecommunication Services | 6% | 6% |
Materials | 5% | 5% |
| 100% | 100% |
Asset allocation and sector diversification are subject to change.
For more complete details about the Portfolio's investment portfolio, see page 8. A complete list of portfolio holdings of the portfolio is posted as of the month end on www.dws-investments.com on or about the 15th day of the following month. More frequent posting of portfolio holdings information may be made from time to time on www.dws-investments.com.
Following the Portfolio's fiscal first and third quarter-end, a complete portfolio holdings listing is filed with the SEC on Form N-Q. The form will be available on the SEC's Web site at www.sec.gov, and it also may be reviewed and copied at the SEC's Public Reference Room in Washington, D.C. Information on the operation of the SEC's Public Reference Room may be obtained by calling (800) SEC-0330.
Investment Portfolio December 31, 2008
DWS Balanced VIP
|
Shares
| Value ($) |
| |
Common Stocks 58.9% |
Consumer Discretionary 4.2% |
Auto Components 0.1% |
Aisin Seiki Co., Ltd. | 100 | 1,419 |
Autoliv, Inc. | 2,400 | 51,504 |
Bridgestone Corp. | 300 | 4,506 |
Compagnie Generale des Etablissements Michelin "B" | 105 | 5,506 |
Denso Corp. | 200 | 3,327 |
Fuel Systems Solutions, Inc.* | 500 | 16,380 |
GKN PLC | 897 | 1,270 |
Magna International, Inc. "A" | 400 | 11,908 |
Rieter Holding AG (Registered) | 16 | 2,587 |
Toyota Industries Corp. | 100 | 2,142 |
WABCO Holdings, Inc. | 11,300 | 178,427 |
| 278,976 |
Automobiles 0.1% |
Bayerische Motoren Werke (BMW) AG | 257 | 7,900 |
Daimler AG (Registered) | 552 | 20,974 |
Fiat SpA | 5,500 | 35,860 |
Honda Motor Co., Ltd. | 700 | 15,181 |
Isuzu Motors Ltd. | 1,000 | 1,283 |
Mazda Motor Corp. | 1,000 | 1,690 |
Mitsubishi Motors Corp.* | 2,000 | 2,745 |
Nissan Motor Co., Ltd. | 900 | 3,260 |
PSA Peugeot Citroen | 112 | 1,910 |
Renault SA | 129 | 3,365 |
Suzuki Motor Corp. | 200 | 2,765 |
Toyota Motor Corp. | 1,300 | 42,553 |
Volkswagen AG | 93 | 32,579 |
| 172,065 |
Distributors 0.2% |
Genuine Parts Co. | 13,625 | 515,842 |
Li & Fung Ltd. | 18,000 | 31,056 |
| 546,898 |
Diversified Consumer Services 0.0% |
Brink's Home Security Holdings, Inc.* | 3,700 | 81,104 |
Hotels Restaurants & Leisure 1.1% |
Accor SA | 151 | 7,431 |
Brinker International, Inc. | 7,500 | 79,050 |
Buffalo Wild Wings, Inc.* | 6,100 | 156,465 |
California Pizza Kitchen, Inc.* | 1,800 | 19,296 |
Carnival Corp. (Unit) | 15,059 | 366,235 |
Carnival PLC | 148 | 3,224 |
CEC Entertainment, Inc.* | 3,100 | 75,175 |
CKE Restaurants, Inc. | 1,700 | 14,756 |
Compass Group PLC | 2,000 | 9,925 |
Cracker Barrel Old Country Store, Inc. | 1,800 | 37,062 |
Crown Ltd. | 8,273 | 34,633 |
InterContinental Hotel Group PLC | 251 | 2,042 |
Ladbrokes PLC | 788 | 2,107 |
Lottomatica SpA | 498 | 12,296 |
McDonald's Corp. | 32,200 | 2,002,518 |
P.F. Chang's China Bistro, Inc.* | 6,300 | 131,922 |
|
Shares
| Value ($) |
| |
Panera Bread Co. "A"* | 3,700 | 193,288 |
Shangri-La Asia Ltd. | 12,000 | 13,870 |
Sodexo | 85 | 4,704 |
TABCORP Holding Ltd. | 6,752 | 33,051 |
Tatts Group Ltd. | 14,815 | 28,942 |
TUI AG | 155 | 1,768 |
Whitbread PLC | 229 | 3,029 |
WMS Industries, Inc.* | 5,900 | 158,710 |
| 3,391,499 |
Household Durables 0.1% |
Blyth, Inc. | 2,600 | 20,384 |
Centex Corp. | 8,600 | 91,504 |
CSS Industries, Inc. | 1,100 | 19,514 |
Electrolux AB "B" | 800 | 6,881 |
Husqvarna AB "B" | 900 | 4,769 |
M/I Homes, Inc. | 3,500 | 36,890 |
NVR, Inc.* | 200 | 91,250 |
Panasonic Corp. | 1,000 | 12,530 |
Ryland Group, Inc. | 3,400 | 60,078 |
Sony Corp. | 400 | 8,695 |
Taylor Wimpey PLC | 1,128 | 221 |
Tupperware Brands Corp. | 5,500 | 124,850 |
| 477,566 |
Internet & Catalog Retail 0.0% |
Amazon.com, Inc.* | 2,000 | 102,560 |
Home Retail Group PLC | 703 | 2,156 |
Stamps.com, Inc.* | 1,000 | 9,830 |
| 114,546 |
Leisure Equipment & Products 0.1% |
Hasbro, Inc. | 6,200 | 180,854 |
Polaris Industries, Inc. | 1,700 | 48,705 |
| 229,559 |
Media 0.9% |
British Sky Broadcasting Group PLC | 1,232 | 8,572 |
Comcast Corp. "A" | 70,200 | 1,184,976 |
DISH Network Corp. "A"* | 10,900 | 120,881 |
Fairfax Media Ltd. | 13,871 | 15,915 |
Gestevision Telecinco SA | 345 | 3,676 |
Global Sources Ltd.* | 5,361 | 29,217 |
Interpublic Group of Companies, Inc.* | 20,400 | 80,784 |
ITV PLC | 3,194 | 1,831 |
Lagardere SCA | 107 | 4,343 |
Liberty Media Corp. — Entertainment "A"* | 13,500 | 235,980 |
Marvel Entertainment, Inc.* | 5,900 | 181,425 |
Mediaset SpA | 5,320 | 30,381 |
Modern Times Group MTG AB "B" | 175 | 3,801 |
Morningstar, Inc.* | 3,100 | 110,050 |
Pearson PLC | 1,119 | 10,385 |
Publicis Groupe | 132 | 3,398 |
Reed Elsevier NV | 3,828 | 45,102 |
Reed Elsevier PLC | 1,779 | 12,967 |
SES "A" (FDR) | 184 | 3,542 |
Shaw Communications, Inc. "B" | 1,600 | 28,008 |
Singapore Press Holdings Ltd. | 78,000 | 168,896 |
Thomson Reuters Corp. | 1,800 | 51,908 |
|
Shares
| Value ($) |
| |
Thomson Reuters PLC | 285 | 6,303 |
Time Warner, Inc. | 12,300 | 123,738 |
United Business Media Ltd. | 388 | 2,856 |
Vertis Holdings, Inc.* | 1,645 | 0 |
Vivendi | 790 | 25,721 |
Walt Disney Co. | 7,200 | 163,368 |
Wolters Kluwer NV | 1,709 | 32,276 |
WPP PLC | 1,683 | 9,811 |
Yellow Pages Income Fund (Unit) | 400 | 2,187 |
| 2,702,298 |
Multiline Retail 0.3% |
Big Lots, Inc.* | 7,500 | 108,675 |
Canadian Tire Corp., Ltd. "A" | 300 | 10,559 |
Family Dollar Stores, Inc. | 8,300 | 216,381 |
Kohl's Corp.* | 13,680 | 495,216 |
Marks & Spencer Group PLC | 1,148 | 3,573 |
Next PLC | 169 | 2,646 |
PPR | 57 | 3,723 |
Sears Holdings Corp.* | 1,900 | 73,853 |
| 914,626 |
Specialty Retail 1.0% |
AutoNation, Inc.* | 4,900 | 48,412 |
Best Buy Co., Inc. | 3,800 | 106,818 |
Children's Place Retail Stores, Inc.* | 6,400 | 138,752 |
Coldwater Creek, Inc.* | 24,500 | 69,825 |
Esprit Holdings Ltd. | 8,400 | 47,880 |
Foot Locker, Inc. | 13,900 | 102,026 |
GameStop Corp. "A"* | 11,000 | 238,260 |
Hennes & Mauritz AB "B" | 1,525 | 59,591 |
Hot Topic, Inc.* | 13,200 | 122,364 |
Industria de Diseno Textil SA | 2,432 | 107,498 |
Jo-Ann Stores, Inc.* | 1,400 | 21,686 |
Jos. A. Bank Clothiers, Inc.* | 3,300 | 86,295 |
Kingfisher PLC | 1,961 | 3,835 |
Lowe's Companies, Inc. | 18,174 | 391,105 |
RadioShack Corp. | 22,100 | 263,874 |
Rent-A-Center, Inc.* | 8,100 | 142,965 |
Staples, Inc. | 22,710 | 406,963 |
The Buckle, Inc. | 4,800 | 104,736 |
The Gap, Inc. | 15,500 | 207,545 |
Tiffany & Co. | 7,400 | 174,862 |
Tractor Supply Co.* | 4,900 | 177,086 |
Yamada Denki Co., Ltd. | 50 | 3,471 |
| 3,025,849 |
Textiles, Apparel & Luxury Goods 0.3% |
Adidas AG | 129 | 4,961 |
Billabong International Ltd. | 204 | 1,141 |
Burberry Group PLC | 424 | 1,360 |
Carter's, Inc.* | 7,400 | 142,524 |
Christian Dior SA | 123 | 6,938 |
Compagnie Financiere Richemont SA "A" | 3,079 | 59,777 |
Fuqi International, Inc.* | 2,400 | 15,024 |
Gildan Activewear, Inc.* | 300 | 3,448 |
Hermes International | 54 | 7,543 |
Luxottica Group SpA | 492 | 8,795 |
LVMH Moet Hennessy Louis Vuitton SA | 165 | 11,086 |
NIKE, Inc. "B" | 6,400 | 326,400 |
Phillips-Van Heusen Corp. | 4,600 | 92,598 |
Swatch Group AG (Bearer) | 192 | 26,820 |
Swatch Group AG (Registered) | 356 | 9,732 |
|
Shares
| Value ($) |
| |
The Warnaco Group, Inc.* | 1,600 | 31,408 |
Timberland Co. "A"* | 3,200 | 36,960 |
True Religion Apparel, Inc.* | 4,800 | 59,712 |
UniFirst Corp. | 1,500 | 44,535 |
| 890,762 |
Consumer Staples 6.5% |
Beverages 1.1% |
Anheuser-Busch InBev NV | 1,563 | 36,237 |
Asahi Breweries Ltd. | 500 | 8,605 |
Boston Beer Co., Inc. "A"* | 900 | 25,560 |
Carlsberg AS "B" | 7,326 | 240,520 |
Coca-Cola Amatil Ltd. | 614 | 3,968 |
Coca-Cola Enterprises, Inc. | 8,700 | 104,661 |
Diageo PLC | 28,863 | 398,975 |
Foster's Group Ltd. | 4,320 | 16,620 |
Heineken NV | 407 | 12,505 |
Kirin Holdings Co., Ltd. | 1,000 | 13,182 |
Pepsi Bottling Group, Inc. | 19,800 | 445,698 |
PepsiCo, Inc. | 33,416 | 1,830,194 |
Pernod Ricard SA | 266 | 19,725 |
SABMiller PLC | 698 | 11,752 |
The Coca-Cola Co. | 1,600 | 72,432 |
| 3,240,634 |
Food & Staples Retailing 1.8% |
AEON Co., Ltd. | 1,200 | 12,019 |
BJ's Wholesale Club, Inc.* | 5,000 | 171,300 |
Carrefour SA | 847 | 32,527 |
Casino Guichard-Perrachon SA | 82 | 6,235 |
Colruyt SA | 81 | 17,347 |
CVS Caremark Corp. | 20,512 | 589,515 |
Delhaize Group | 449 | 27,705 |
George Weston Ltd. | 300 | 14,569 |
J Sainsbury PLC | 1,318 | 6,267 |
Kesko Oyj "B" | 133 | 3,333 |
Koninklijke Ahold NV | 2,426 | 29,817 |
Kroger Co. | 26,200 | 691,942 |
Lawson, Inc. | 100 | 5,767 |
Loblaw Companies Ltd. | 600 | 16,996 |
Metro AG | 770 | 31,211 |
Metro, Inc. "A" | 500 | 14,986 |
Nash Finch Co. | 400 | 17,956 |
Seven & I Holdings Co., Ltd. | 8,200 | 280,930 |
Shoppers Drug Mart Corp. | 7,000 | 272,459 |
Sysco Corp. | 23,800 | 545,972 |
Tesco PLC | 5,893 | 30,702 |
Wal-Mart Stores, Inc. | 39,500 | 2,214,370 |
Walgreen Co. | 19,910 | 491,180 |
Wesfarmers Ltd. | 1,325 | 16,732 |
Wesfarmers Ltd. (PPS) | 167 | 2,110 |
William Morrison Supermarkets PLC | 1,655 | 6,712 |
Woolworths Ltd. | 2,545 | 47,484 |
| 5,598,143 |
Food Products 1.6% |
Ajinomoto Co., Inc. | 1,000 | 10,894 |
Archer-Daniels-Midland Co. | 15,300 | 441,099 |
Aryzta AG* | 77 | 2,466 |
Bunge Ltd. | 11,700 | 605,709 |
Cadbury PLC | 1,029 | 9,008 |
Danisco AS | 796 | 32,443 |
Darling International, Inc.* | 18,700 | 102,663 |
Dean Foods Co.* | 10,160 | 182,575 |
|
Shares
| Value ($) |
| |
Diamond Foods, Inc. | 2,000 | 40,300 |
Fresh Del Monte Produce, Inc.* | 4,300 | 96,406 |
General Mills, Inc. | 14,250 | 865,687 |
Groupe DANONE | 6,347 | 381,169 |
H.J. Heinz Co. | 4,700 | 176,720 |
Kellogg Co. | 8,810 | 386,318 |
Kerry Group PLC "A" | 3,686 | 68,163 |
Kraft Foods, Inc. "A" | 20,797 | 558,399 |
Nestle SA (Registered) | 17,009 | 670,368 |
Nissin Foods Holdings Co., Ltd. | 100 | 3,507 |
Parmalat SpA | 2,981 | 4,886 |
Ralcorp Holdings, Inc.* | 3,300 | 192,720 |
Saputo, Inc. | 1,000 | 17,959 |
Tate & Lyle PLC | 461 | 2,678 |
Unilever NV (CVA) | 3,038 | 73,611 |
Unilever PLC | 966 | 21,953 |
Wilmar International Ltd. | 1,000 | 1,958 |
Yakult Honsha Co., Ltd. | 200 | 4,277 |
| 4,953,936 |
Household Products 1.0% |
Central Garden & Pet Co. "A"* | 1,400 | 8,260 |
Colgate-Palmolive Co. | 17,370 | 1,190,540 |
Henkel AG & Co. KGaA | 557 | 14,769 |
Kao Corp. | 1,000 | 30,283 |
Procter & Gamble Co. | 28,090 | 1,736,524 |
Reckitt Benckiser Group PLC | 343 | 12,778 |
Unicharm Corp. | 100 | 7,558 |
| 3,000,712 |
Personal Products 0.1% |
Beiersdorf AG | 570 | 33,910 |
Herbalife Ltd. | 11,500 | 249,320 |
L'Oreal SA | 362 | 31,456 |
Nu Skin Enterprises, Inc. "A" | 2,300 | 23,989 |
Shiseido Co., Ltd. | 1,000 | 20,471 |
| 359,146 |
Tobacco 0.9% |
Altria Group, Inc. | 54,553 | 821,568 |
British American Tobacco PLC | 1,617 | 42,015 |
Imperial Tobacco Group PLC | 10,530 | 281,289 |
Japan Tobacco, Inc. | 106 | 351,009 |
Philip Morris International, Inc. | 30,410 | 1,323,139 |
Swedish Match AB | 7,492 | 107,249 |
| 2,926,269 |
Energy 7.0% |
Energy Equipment & Services 1.1% |
Aker Solutions ASA | 700 | 4,627 |
AMEC PLC | 16,366 | 116,813 |
Compagnie Generale de Geophysique-Veritas* | 89 | 1,329 |
Complete Production Services, Inc.* | 5,600 | 45,640 |
ENSCO International, Inc. | 12,278 | 348,572 |
Fugro NV (CVA) | 1,159 | 33,274 |
Halliburton Co. | 41,382 | 752,325 |
ION Geophysical Corp.* | 37,000 | 126,910 |
National-Oilwell Varco, Inc.* | 10,273 | 251,072 |
Noble Corp. | 8,260 | 182,463 |
Oil States International, Inc.* | 10,400 | 194,376 |
ProSafe SE* | 300 | 1,144 |
RPC, Inc. | 14,200 | 138,592 |
Saipem SpA | 7,731 | 129,814 |
|
Shares
| Value ($) |
| |
SBM Offshore NV | 2,753 | 36,076 |
Schlumberger Ltd. | 6,860 | 290,384 |
Seadrill Ltd. | 800 | 6,521 |
Technip SA | 75 | 2,298 |
Tenaris SA | 434 | 4,488 |
Transocean Ltd.* | 16,014 | 756,661 |
WorleyParsons Ltd. | 564 | 5,619 |
| 3,428,998 |
Oil, Gas & Consumable Fuels 5.9% |
Alpha Natural Resources, Inc.* | 5,600 | 90,664 |
Anadarko Petroleum Corp. | 3,300 | 127,215 |
Apache Corp. | 8,100 | 603,693 |
BG Group PLC | 17,616 | 244,576 |
Bill Barrett Corp.* | 3,400 | 71,842 |
BP PLC | 5,158 | 39,522 |
Callon Petroleum Co.* | 6,900 | 17,940 |
Cameco Corp. | 100 | 1,705 |
Canadian Natural Resources Ltd. | 200 | 7,898 |
Canadian Oil Sands Trust (Unit) | 100 | 1,709 |
Chevron Corp. | 22,492 | 1,663,733 |
Cimarex Energy Co. | 11,300 | 302,614 |
Clayton Williams Energy, Inc.* | 3,900 | 177,216 |
ConocoPhillips | 25,281 | 1,309,556 |
Devon Energy Corp. | 16,263 | 1,068,642 |
El Paso Corp. | 14,300 | 111,969 |
Enbridge, Inc. | 100 | 3,205 |
EnCana Corp. | 300 | 13,842 |
Encore Acquisition Co.* | 22,200 | 566,544 |
Eni SpA | 2,945 | 69,784 |
EOG Resources, Inc. | 10,320 | 687,106 |
ExxonMobil Corp. | 42,604 | 3,401,077 |
Frontline Ltd. | 200 | 5,833 |
Gazprom (ADR)* | 11,850 | 169,846 |
Hess Corp. | 6,100 | 327,204 |
Husky Energy, Inc. | 100 | 2,501 |
Imperial Oil Ltd. | 300 | 9,961 |
INPEX Corp. | 4 | 31,602 |
James River Coal Co.* | 10,300 | 157,899 |
Knightsbridge Tankers Ltd. | 1,500 | 21,975 |
Marathon Oil Corp. | 28,692 | 785,013 |
Mariner Energy, Inc.* | 22,900 | 233,580 |
Massey Energy Co. | 11,900 | 164,101 |
Murphy Oil Corp. | 5,800 | 257,230 |
Neste Oil Oyj | 113 | 1,688 |
Nexen, Inc. | 19,184 | 333,331 |
Nippon Mining Holdings, Inc. | 3,500 | 15,039 |
Nippon Oil Corp. | 5,000 | 25,182 |
Noble Energy, Inc. | 11,112 | 546,933 |
Occidental Petroleum Corp. | 12,601 | 755,934 |
OMV AG | 2,811 | 74,938 |
Origin Energy Ltd. | 2,654 | 29,936 |
Petro-Canada | 200 | 4,329 |
Petroleo Brasileiro SA (ADR) | 7,300 | 178,777 |
PetroQuest Energy, Inc.* | 8,000 | 54,080 |
Repsol YPF SA | 7,373 | 157,034 |
Rosetta Resources, Inc.* | 600 | 4,248 |
Royal Dutch Shell PLC "A" | 756 | 19,762 |
Royal Dutch Shell PLC "B" | 877 | 22,072 |
Santos Ltd. | 1,792 | 18,728 |
Showa Shell Sekiyu KK | 1,100 | 10,853 |
StatoilHydro ASA | 20,850 | 343,405 |
Suncor Energy, Inc. | 19,485 | 374,390 |
Sunoco, Inc. | 17,900 | 777,934 |
|
Shares
| Value ($) |
| |
Swift Energy Co.* | 2,200 | 36,982 |
Talisman Energy, Inc. | 500 | 4,933 |
TonenGeneral Sekiyu KK | 1,000 | 10,010 |
Total SA | 10,408 | 567,420 |
VAALCO Energy, Inc.* | 10,800 | 80,352 |
Whiting Petroleum Corp.* | 6,100 | 204,106 |
Woodside Petroleum Ltd. | 1,342 | 34,633 |
World Fuel Services Corp. | 4,600 | 170,200 |
XTO Energy, Inc. | 14,920 | 526,228 |
| 18,132,254 |
Financials 7.7% |
Capital Markets 1.1% |
Affiliated Managers Group, Inc.* | 2,703 | 113,310 |
Ameriprise Financial, Inc. | 3,400 | 79,424 |
Bank of New York Mellon Corp. | 20,800 | 589,264 |
BGC Partners, Inc. "A" | 2,200 | 6,072 |
Charles Schwab Corp. | 33,800 | 546,546 |
Credit Suisse Group AG (Registered) | 825 | 22,613 |
Daiwa Securities Group, Inc. | 1,000 | 5,959 |
Eaton Vance Corp. | 6,190 | 130,052 |
IGM Financial, Inc. | 100 | 2,872 |
Jefferies Group, Inc. | 9,522 | 133,879 |
Julius Baer Holding AG (Registered) | 259 | 9,963 |
LaBranche & Co., Inc.* | 2,900 | 13,891 |
Macquarie Group Ltd. | 396 | 8,049 |
Man Group PLC | 485 | 1,674 |
Mediobanca SpA | 349 | 3,544 |
Nomura Holdings, Inc. | 900 | 7,422 |
Prospect Capital Corp. | 12,669 | 151,648 |
Reinet Investments SCA* | 213 | 2,074 |
State Street Corp. | 9,940 | 390,940 |
SWS Group, Inc. | 1,800 | 34,110 |
T. Rowe Price Group, Inc. | 8,700 | 308,328 |
TD Ameritrade Holding Corp.* | 17,368 | 247,494 |
The Goldman Sachs Group, Inc. | 4,200 | 354,438 |
thinkorswim Group, Inc.* | 7,400 | 41,588 |
UBS AG (Registered)* | 2,308 | 33,475 |
| 3,238,629 |
Commercial Banks 2.2% |
1st Source Corp. | 1,200 | 28,356 |
Allied Irish Banks PLC | 15,183 | 36,983 |
Anglo Irish Bank Corp. PLC | 14,896 | 3,577 |
Australia & New Zealand Banking Group Ltd. | 888 | 9,531 |
Banca Monte dei Paschi di Siena SpA | 915 | 1,972 |
Banca Popolare di Milano Scarl | 2,224 | 13,172 |
Banco Bilbao Vizcaya Argentaria SA | 2,168 | 26,603 |
Banco Comercial Portugues SA (Registered)* | 86,212 | 98,815 |
Banco Espirito Santo SA (Registered) | 8,338 | 78,376 |
Banco Latinoamericano de Exportaciones SA "E" | 8,400 | 120,624 |
Banco Popolare Societa Cooperativa | 1,432 | 10,032 |
Banco Popular Espanol SA | 560 | 4,862 |
Banco Santander SA | 4,119 | 39,753 |
Bank of East Asia Ltd. | 1,800 | 3,797 |
Bank of Montreal | 300 | 7,594 |
Bank of Nova Scotia | 500 | 13,491 |
|
Shares
| Value ($) |
| |
Barclays PLC | 1,486 | 3,350 |
BNP Paribas | 5,692 | 240,353 |
BOC Hong Kong (Holdings) Ltd. | 4,500 | 5,137 |
Canadian Imperial Bank of Commerce | 9,242 | 382,482 |
Chuo Mitsui Trust Holdings, Inc. | 1,000 | 4,887 |
Commerzbank AG | 1,202 | 11,458 |
Commonwealth Bank of Australia | 608 | 12,327 |
Community Bank System, Inc. | 2,800 | 68,292 |
Credit Agricole SA | 364 | 4,140 |
Danske Bank AS | 3,201 | 32,366 |
DBS Group Holdings Ltd. | 3,000 | 17,797 |
Deutsche Postbank AG | 64 | 1,415 |
Dexia SA | 2,958 | 13,314 |
DnB NOR ASA | 44,200 | 176,562 |
Erste Group Bank AG | 4,350 | 101,975 |
First Financial Bankshares, Inc. | 1,300 | 71,773 |
First Merchants Corp. | 1,000 | 22,210 |
FirstMerit Corp. | 6,600 | 135,894 |
FNB Corp. | 3,400 | 44,880 |
Governor and Co. of the Bank of Ireland | 18,141 | 21,375 |
Hang Seng Bank Ltd. | 1,100 | 14,528 |
HBOS PLC | 2,928 | 2,972 |
HSBC Holdings PLC | 16,707 | 159,907 |
Hypo Real Estate Holding AG | 816 | 3,590 |
International Bancshares Corp. | 2,700 | 58,941 |
Intesa Sanpaolo | 82,053 | 295,549 |
Intesa Sanpaolo (RSP) | 412 | 1,055 |
Jyske Bank AS (Registered)* | 375 | 8,833 |
KBC Groep NV | 895 | 27,033 |
Lakeland Bancorp., Inc. | 1,400 | 15,764 |
Lloyds TSB Group PLC | 1,300 | 2,379 |
Mitsubishi UFJ Financial Group, Inc. | 41,900 | 259,986 |
Mizuho Financial Group, Inc. | 6,000 | 17,719 |
National Australia Bank Ltd. | 790 | 11,582 |
National Bank of Canada | 100 | 2,536 |
National Penn Bancshares, Inc. | 10,700 | 155,257 |
NBT Bancorp., Inc. | 4,700 | 131,412 |
Nordea Bank AB | 3,800 | 26,749 |
Oriental Financial Group, Inc. | 1,000 | 6,050 |
Oversea-Chinese Banking Corp., Ltd. | 7,000 | 24,389 |
PNC Financial Services Group, Inc. | 12,164 | 596,036 |
PrivateBancorp., Inc. | 4,600 | 149,316 |
Raiffeisen International Bank-Holding AG | 1,134 | 31,737 |
Republic Bancorp., Inc. "A" | 700 | 19,040 |
Resona Holdings, Inc. | 300 | 4,719 |
Royal Bank of Canada | 700 | 20,470 |
Royal Bank of Scotland Group PLC | 7,868 | 5,688 |
S&T Bancorp., Inc. | 3,400 | 120,700 |
Santander BanCorp. | 5,000 | 62,450 |
Skandinaviska Enskilda Banken AB "A" | 900 | 7,230 |
Societe Generale | 5,903 | 298,972 |
Southside Bancshares, Inc. | 1,900 | 44,650 |
Standard Chartered PLC | 682 | 8,718 |
Sumitomo Mitsui Financial Group, Inc. | 300 | 13,078 |
Sumitomo Trust & Banking Co., Ltd. | 1,000 | 5,918 |
Susquehanna Bancshares, Inc. | 1,000 | 15,910 |
|
Shares
| Value ($) |
| |
SVB Financial Group* | 1,700 | 44,591 |
Svenska Handelsbanken AB "A" | 1,150 | 18,718 |
Swedbank AB "A" | 1,596 | 9,154 |
Sydbank AS | 400 | 4,956 |
Synovus Financial Corp. | 13,681 | 113,552 |
The Bank of Yokohama Ltd. | 1,000 | 5,915 |
Tompkins Financial Corp. | 1,600 | 92,720 |
Toronto-Dominion Bank | 200 | 7,039 |
UMB Financial Corp. | 2,900 | 142,506 |
UniCredit SpA | 8,775 | 21,846 |
Unione di Banche Italiane ScpA | 685 | 9,914 |
United Bankshares, Inc. | 2,400 | 79,728 |
United Overseas Bank Ltd. | 22,000 | 198,595 |
US Bancorp. | 17,500 | 437,675 |
Wells Fargo & Co. | 38,438 | 1,133,152 |
Westpac Banking Corp. | 1,387 | 16,517 |
| 6,836,966 |
Consumer Finance 0.1% |
Capital One Financial Corp. | 4,498 | 143,441 |
Cash America International, Inc. | 3,300 | 90,255 |
Credit Saison Co., Ltd. | 200 | 2,761 |
ORIX Corp. | 50 | 2,841 |
| 239,298 |
Diversified Financial Services 1.2% |
ASX Ltd. | 282 | 6,585 |
Bank of America Corp. | 39,252 | 552,668 |
CME Group, Inc. | 1,155 | 240,367 |
Compagnie Nationale a Portefeuille | 369 | 17,943 |
Deutsche Boerse AG | 4,725 | 344,133 |
Encore Capital Group, Inc.* | 2,000 | 14,400 |
Fortis | 13,670 | 18,143 |
Groupe Bruxelles Lambert SA | 473 | 37,640 |
Hong Kong Exchanges & Clearing Ltd. | 1,600 | 15,340 |
ING Groep NV (CVA) | 5,402 | 56,468 |
Interactive Brokers Group, Inc. "A"* | 1,100 | 19,679 |
Investor AB "B" | 600 | 9,029 |
JPMorgan Chase & Co. | 55,048 | 1,735,664 |
KBC Ancora | 49 | 844 |
NYSE Euronext | 11,488 | 314,541 |
Singapore Exchange Ltd. | 1,000 | 3,583 |
The NASDAQ OMX Group, Inc.* | 7,100 | 175,441 |
| 3,562,468 |
Insurance 2.1% |
ACE Ltd. | 8,791 | 465,220 |
Aegon NV | 3,859 | 24,626 |
Aflac, Inc. | 9,880 | 452,899 |
Alleanza Assicurazioni SpA | 232 | 1,890 |
Alleghany Corp.* | 575 | 162,150 |
Allianz SE (Registered) | 3,244 | 347,945 |
Allied World Assurance Co. Holdings Ltd. | 2,500 | 101,500 |
Allstate Corp. | 18,700 | 612,612 |
American Physicians Capital, Inc. | 600 | 28,860 |
AMP Ltd. | 965 | 3,668 |
AmTrust Financial Services, Inc. | 11,700 | 135,720 |
Aon Corp. | 11,726 | 535,644 |
Argo Group International Holdings Ltd.* | 4,500 | 152,640 |
Arthur J. Gallagher & Co. | 8,353 | 216,426 |
Assicurazioni Generali SpA | 1,167 | 31,992 |
|
Shares
| Value ($) |
| |
Assured Guaranty Ltd. | 1,100 | 12,540 |
Aviva PLC | 589 | 3,334 |
AXA Asia Pacific Holdings Ltd. | 529 | 1,834 |
AXA SA | 13,359 | 297,835 |
Baloise Holding AG (Registered) | 92 | 6,915 |
Brown & Brown, Inc. | 5,500 | 114,950 |
China Life Insurance Co., Ltd. "H" | 110,500 | 340,515 |
CNP Assurances | 24 | 1,737 |
Crawford & Co. "B"* | 3,000 | 43,620 |
Enstar Group Ltd.* | 600 | 35,484 |
First American Corp. | 6,100 | 176,229 |
Great-West Lifeco, Inc. | 100 | 1,677 |
Hallmark Financial Services, Inc.* | 2,000 | 17,540 |
Hartford Financial Services Group, Inc. | 9,515 | 156,236 |
Insurance Australia Group Ltd. | 1,063 | 2,900 |
Irish Life & Permanent PLC | 1,959 | 4,347 |
Legal & General Group PLC | 2,181 | 2,433 |
Lincoln National Corp. | 3,600 | 67,824 |
Manulife Financial Corp. | 800 | 13,479 |
MetLife, Inc. | 4,636 | 161,611 |
Mitsui Sumitomo Insurance Group Holdings, Inc. | 300 | 9,568 |
Muenchener Rueckversicherungs- Gesellschaft AG (Registered) | 2,369 | 372,281 |
Navigators Group, Inc.* | 2,700 | 148,257 |
Odyssey Re Holdings Corp. | 1,000 | 51,810 |
Old Mutual PLC | 9,082 | 7,256 |
PartnerRe Ltd. | 2,425 | 172,830 |
Power Corp. of Canada | 200 | 3,632 |
Power Financial Corp. | 100 | 1,936 |
Principal Financial Group, Inc. | 5,200 | 117,364 |
Progressive Corp. | 8,100 | 119,961 |
Prudential Financial, Inc. | 5,578 | 168,790 |
Prudential PLC | 566 | 3,446 |
QBE Insurance Group Ltd. | 387 | 7,035 |
Reinsurance Group of America, Inc. | 2,200 | 94,204 |
Sampo Oyj "A" | 4,681 | 87,433 |
Sompo Japan Insurance, Inc. | 1,000 | 7,323 |
State Auto Financial Corp. | 2,200 | 66,132 |
Sun Life Financial, Inc. | 300 | 6,911 |
Suncorp-Metway Ltd. | 457 | 2,698 |
Swiss Life Holding (Registered)* | 19 | 1,318 |
Swiss Re (Registered) | 190 | 9,230 |
T&D Holdings, Inc. | 100 | 4,193 |
Tokio Marine Holdings, Inc. | 300 | 8,791 |
Topdanmark AS* | 125 | 16,228 |
Trygvesta AS | 245 | 15,201 |
Unum Group | 10,600 | 197,160 |
Vienna Insurance Group | 895 | 30,877 |
Zurich Financial Services AG (Registered) | 118 | 25,615 |
| 6,494,312 |
Real Estate Investment Trusts 0.6% |
Annaly Capital Management, Inc. (REIT) | 4,200 | 66,654 |
Apartment Investment & Management Co. "A" (REIT) | 2,002 | 23,123 |
AvalonBay Communities, Inc. (REIT) | 1,100 | 66,638 |
BioMed Realty Trust, Inc. (REIT) | 2,200 | 25,784 |
Boston Properties, Inc. (REIT) | 1,900 | 104,500 |
CapitaMall Trust (REIT) | 3,000 | 3,340 |
Corio NV (REIT) | 72 | 3,301 |
|
Shares
| Value ($) |
| |
Corporate Office Properties Trust (REIT) | 2,500 | 76,750 |
Cousins Properties, Inc. (REIT) | 3,100 | 42,935 |
Equity Lifestyle Properties, Inc. (REIT) | 1,500 | 57,540 |
Equity Residential (REIT) | 3,600 | 107,352 |
First Industrial Realty Trust, Inc. (REIT) | 3,500 | 26,425 |
Franklin Street Properties Corp. (REIT) | 1,300 | 19,175 |
Glimcher Realty Trust (REIT) | 3,200 | 8,992 |
GPT Group (REIT) | 1,538 | 995 |
HCP, Inc. (REIT) | 1,800 | 49,986 |
Healthcare Realty Trust, Inc. (REIT) | 2,200 | 51,656 |
Home Properties, Inc. (REIT) | 2,000 | 81,200 |
Hospitality Properties Trust (REIT) | 3,000 | 44,610 |
Host Hotels & Resorts, Inc. (REIT) | 5,100 | 38,607 |
Kimco Realty Corp. (REIT) | 3,400 | 62,152 |
LaSalle Hotel Properties (REIT) | 4,800 | 53,040 |
Lexington Realty Trust (REIT) | 5,300 | 26,500 |
Link (REIT) | 2,500 | 4,156 |
Maguire Properties, Inc. (REIT) | 2,400 | 3,504 |
Mid-America Apartment Communities, Inc. (REIT) | 1,600 | 59,456 |
National Retail Properties, Inc. (REIT) | 4,700 | 80,793 |
OMEGA Healthcare Investors, Inc. (REIT) | 2,500 | 39,925 |
Parkway Properties, Inc. (REIT) | 2,300 | 41,400 |
Pennsylvania Real Estate Investment Trust (REIT) | 1,600 | 11,920 |
Potlatch Corp. (REIT) | 1,900 | 49,419 |
ProLogis (REIT) | 3,000 | 41,670 |
Realty Income Corp. (REIT) | 4,500 | 104,175 |
Redwood Trust, Inc. (REIT) | 1,100 | 16,401 |
Senior Housing Properties Trust (REIT) | 4,500 | 80,640 |
Simon Property Group, Inc. (REIT) | 2,300 | 122,199 |
Sovran Self Storage, Inc. (REIT) | 1,400 | 50,400 |
Stockland (REIT) | 923 | 2,671 |
Strategic Hotels & Resorts, Inc. (REIT) | 4,400 | 7,392 |
Sunstone Hotel Investors, Inc. (REIT) | 4,200 | 25,998 |
Unibail-Rodamco (REIT) | 40 | 5,958 |
Vornado Realty Trust (REIT) | 1,600 | 96,560 |
Washington Real Estate Investment Trust (REIT) | 2,600 | 73,580 |
Wereldhave NV (REIT) | 48 | 4,240 |
Westfield Group (REIT) | 891 | 8,209 |
| 1,971,921 |
Real Estate Management & Development 0.0% |
Atrium European Real Estate Ltd.* | 2,003 | 7,301 |
Brookfield Asset Management, Inc. "A" | 300 | 4,508 |
CapitaLand Ltd. | 5,000 | 10,985 |
Cheung Kong (Holdings) Ltd. | 2,000 | 19,068 |
City Developments Ltd. | 1,000 | 4,462 |
Hang Lung Properties Ltd. | 2,000 | 4,387 |
Henderson Land Development Co., Ltd. | 1,000 | 3,736 |
Hopewell Holdings Ltd. | 1,000 | 3,308 |
Kerry Properties Ltd. | 1,000 | 2,691 |
Lend Lease Corp., Ltd. | 287 | 1,451 |
Mitsubishi Estate Co., Ltd. | 1,000 | 16,491 |
|
Shares
| Value ($) |
| |
Mitsui Fudosan Co., Ltd. | 1,000 | 16,618 |
New World Development Co., Ltd. | 6,000 | 6,130 |
Sino Land Co., Ltd. | 6,000 | 6,271 |
Sun Hung Kai Properties Ltd. | 2,000 | 16,817 |
Swire Pacific Ltd. "A" | 1,000 | 6,934 |
Wharf Holdings Ltd. | 2,000 | 5,526 |
| 136,684 |
Thrifts & Mortgage Finance 0.4% |
Astoria Financial Corp. | 3,200 | 52,736 |
Capitol Federal Financial | 3,433 | 156,545 |
Dime Community Bancshares | 12,300 | 163,590 |
Doral Financial Corp.* | 7,500 | 56,250 |
Flushing Financial Corp. | 4,600 | 55,016 |
Hudson City Bancorp., Inc. | 29,800 | 475,608 |
Ocwen Financial Corp.* | 7,700 | 70,686 |
WSFS Financial Corp. | 700 | 33,593 |
| 1,064,024 |
Health Care 9.8% |
Biotechnology 1.6% |
Actelion Ltd. (Registered)* | 83 | 4,675 |
Alexion Pharmaceuticals, Inc.* | 800 | 28,952 |
Alnylam Pharmaceuticals, Inc.* | 6,700 | 165,691 |
Amgen, Inc.* | 11,200 | 646,800 |
Celgene Corp.* | 14,300 | 790,504 |
CSL Ltd. | 3,003 | 70,911 |
Cubist Pharmaceuticals, Inc.* | 6,900 | 166,704 |
CV Therapeutics, Inc.* | 17,100 | 157,491 |
Emergent Biosolutions, Inc.* | 700 | 18,277 |
Facet Biotech Corp.* | 2,600 | 24,934 |
Genentech, Inc.* | 5,990 | 496,631 |
Genomic Health, Inc.* | 1,300 | 25,324 |
Gilead Sciences, Inc.* | 32,880 | 1,681,483 |
Grifols SA | 301 | 5,228 |
Intercell AG* | 10,870 | 333,281 |
Myriad Genetics, Inc.* | 3,100 | 205,406 |
NPS Pharmaceuticals, Inc.* | 6,500 | 40,365 |
PDL BioPharma, Inc. | 25,500 | 157,590 |
| 5,020,247 |
Health Care Equipment & Supplies 2.0% |
ArthroCare Corp.* | 10,400 | 49,608 |
Baxter International, Inc. | 37,287 | 1,998,210 |
Becton, Dickinson & Co. | 18,822 | 1,287,237 |
C.R. Bard, Inc. | 7,850 | 661,441 |
Cochlear Ltd. | 314 | 12,362 |
Essilor International SA | 494 | 23,178 |
Getinge AB "B" | 200 | 2,397 |
Hologic, Inc.* | 9,900 | 129,393 |
Medtronic, Inc. | 25,700 | 807,494 |
Merit Medical Systems, Inc.* | 4,900 | 87,857 |
Nobel Biocare Holding AG (Bearer) | 155 | 3,175 |
Olympus Corp. | 1,000 | 20,081 |
Smith & Nephew PLC | 1,343 | 8,521 |
Sonova Holding AG (Registered) | 59 | 3,559 |
STERIS Corp. | 5,600 | 133,784 |
Synthes, Inc. | 35 | 4,424 |
Terumo Corp. | 5,100 | 238,838 |
Thoratec Corp.* | 5,900 | 191,691 |
Varian Medical Systems, Inc.* | 5,300 | 185,712 |
William Demant Holding AS* | 50 | 2,077 |
Zimmer Holdings, Inc.* | 7,490 | 302,746 |
| 6,153,785 |
|
Shares
| Value ($) |
| |
Health Care Providers & Services 1.4% |
Aetna, Inc. | 14,000 | 399,000 |
Alliance Imaging, Inc.* | 8,900 | 70,933 |
Celesio AG | 338 | 9,231 |
Centene Corp.* | 6,300 | 124,173 |
Community Health Systems, Inc.* | 5,700 | 83,106 |
CorVel Corp.* | 4,600 | 101,108 |
Emergency Medical Services Corp. "A"* | 4,100 | 150,101 |
Express Scripts, Inc.* | 3,200 | 175,936 |
Fresenius Medical Care AG & Co. KGaA | 5,993 | 281,031 |
Gentiva Health Services, Inc.* | 5,100 | 149,226 |
Healthspring, Inc.* | 1,500 | 29,955 |
Humana, Inc.* | 1,800 | 67,104 |
Kindred Healthcare, Inc.* | 5,800 | 75,516 |
Laboratory Corp. of America Holdings* | 5,800 | 373,578 |
Landauer, Inc. | 100 | 7,330 |
LHC Group, Inc.* | 4,500 | 162,000 |
LifePoint Hospitals, Inc.* | 10,700 | 244,388 |
Magellan Health Services, Inc.* | 2,000 | 78,320 |
McKesson Corp. | 1,800 | 69,714 |
Medco Health Solutions, Inc.* | 9,486 | 397,558 |
Mediceo Paltac Holdings Co., Ltd. | 400 | 4,821 |
Owens & Minor, Inc. | 3,000 | 112,950 |
RehabCare Group, Inc.* | 3,300 | 50,028 |
Sonic Healthcare Ltd. | 1,874 | 19,077 |
Suzuken Co., Ltd. | 200 | 6,026 |
Triple-S Management Corp. "B"* | 1,900 | 21,850 |
UnitedHealth Group, Inc. | 5,330 | 141,778 |
Universal Health Services, Inc. "B" | 4,800 | 180,336 |
WellPoint, Inc.* | 13,640 | 574,653 |
| 4,160,827 |
Life Sciences Tools & Services 0.6% |
Albany Molecular Research, Inc.* | 800 | 7,792 |
eResearchTechnology, Inc.* | 22,500 | 149,175 |
Gerresheimer AG | 7,449 | 204,221 |
Lonza Group AG (Registered) | 2,905 | 268,553 |
Luminex Corp.* | 7,900 | 168,744 |
Thermo Fisher Scientific, Inc.* | 26,745 | 911,202 |
| 1,709,687 |
Pharmaceuticals 4.2% |
Abbott Laboratories | 35,803 | 1,910,806 |
Astellas Pharma, Inc. | 7,700 | 313,324 |
AstraZeneca PLC | 1,584 | 64,182 |
Bayer AG | 9,255 | 543,683 |
Bristol-Myers Squibb Co. | 2,300 | 53,475 |
Caraco Pharmaceutical Laboratories Ltd.* | 8,700 | 51,504 |
Chugai Pharmaceutical Co., Ltd. | 600 | 11,614 |
Daiichi Sankyo Co., Ltd. | 1,700 | 40,408 |
Eisai Co., Ltd. | 700 | 29,008 |
Elan Corp. PLC* | 26,440 | 155,770 |
Eli Lilly & Co. | 23,820 | 959,231 |
GlaxoSmithKline PLC | 5,467 | 101,492 |
Hisamitsu Pharmaceutical Co., Inc. | 200 | 8,165 |
Johnson & Johnson | 33,682 | 2,015,194 |
Medicines Co.* | 3,100 | 45,663 |
Medicis Pharmaceutical Corp. "A" | 5,200 | 72,280 |
Merck & Co., Inc. | 31,601 | 960,670 |
Merck KGaA | 235 | 21,366 |
Mitsubishi Tanabe Pharma Corp. | 1,000 | 15,119 |
|
Shares
| Value ($) |
| |
Novartis AG (Registered) | 11,615 | 581,964 |
Novo Nordisk AS "B" | 9,474 | 482,126 |
Ono Pharmaceutical Co., Ltd. | 300 | 15,599 |
Perrigo Co. | 4,800 | 155,088 |
Pfizer, Inc. | 110,223 | 1,952,049 |
POZEN, Inc.* | 17,300 | 87,192 |
Roche Holding AG (Genusschein) | 4,024 | 619,429 |
Salix Pharmaceuticals Ltd.* | 4,400 | 38,852 |
Sanofi-Aventis | 2,661 | 169,011 |
Shionogi & Co., Ltd. | 1,000 | 25,685 |
Shire PLC | 640 | 9,359 |
Takeda Pharmaceutical Co., Ltd. | 1,800 | 93,370 |
Teva Pharmaceutical Industries Ltd. (ADR) | 15,295 | 651,108 |
UCB SA | 3,843 | 125,180 |
ViroPharma, Inc.* | 12,700 | 165,354 |
VIVUS, Inc.* | 3,300 | 17,556 |
Wyeth | 13,250 | 497,008 |
| 13,058,884 |
Industrials 6.7% |
Aerospace & Defense 1.6% |
BAE Systems PLC | 30,297 | 165,126 |
Bombardier, Inc. "B" | 3,500 | 12,616 |
CAE, Inc. | 700 | 4,593 |
Cobham PLC | 1,159 | 3,446 |
European Aeronautic Defence & Space Co. | 222 | 3,748 |
Finmeccanica SpA | 206 | 3,156 |
General Dynamics Corp. | 10,500 | 604,695 |
Goodrich Corp. | 11,400 | 422,028 |
Honeywell International, Inc. | 37,591 | 1,234,112 |
L-3 Communications Holdings, Inc. | 3,800 | 280,364 |
Lockheed Martin Corp. | 8,500 | 714,680 |
Northrop Grumman Corp. | 5,800 | 261,232 |
Precision Castparts Corp. | 1,400 | 83,272 |
Rolls-Royce Group PLC* | 1,977 | 9,685 |
Singapore Technologies Engineering Ltd. | 9,000 | 14,886 |
Teledyne Technologies, Inc.* | 1,600 | 71,280 |
Thales SA | 71 | 2,963 |
United Technologies Corp. | 20,033 | 1,073,769 |
| 4,965,651 |
Air Freight & Logistics 0.0% |
Atlas Air Worldwide Holdings, Inc.* | 1,300 | 24,570 |
Deutsche Post AG (Registered) | 825 | 13,957 |
TNT NV | 1,012 | 19,437 |
Toll Holdings Ltd. | 2,758 | 11,925 |
| 69,889 |
Airlines 0.1% |
Air France-KLM | 113 | 1,452 |
Allegiant Travel Co.* | 600 | 29,142 |
AMR Corp.* | 17,700 | 188,859 |
Deutsche Lufthansa AG (Registered) | 185 | 2,929 |
Hawaiian Holdings, Inc.* | 3,700 | 23,606 |
Iberia Lineas Aereas de Espana SA | 855 | 2,395 |
Qantas Airways Ltd. | 7,435 | 13,710 |
Singapore Airlines Ltd. | 3,000 | 23,550 |
| 285,643 |
Building Products 0.2% |
AAON, Inc. | 7,100 | 148,248 |
Ameron International Corp. | 1,100 | 69,212 |
|
Shares
| Value ($) |
| |
Apogee Enterprises, Inc. | 5,500 | 56,980 |
Asahi Glass Co., Ltd. | 1,000 | 5,680 |
Assa Abloy AB "B" | 400 | 4,538 |
Compagnie de Saint-Gobain | 180 | 8,490 |
Daikin Industries Ltd. | 100 | 2,637 |
Geberit AG (Registered) | 59 | 6,356 |
Gibraltar Industries, Inc. | 6,000 | 71,640 |
Insteel Industries, Inc. | 10,700 | 120,803 |
Wienerberger AG | 44 | 735 |
| 495,319 |
Commercial Services & Supplies 0.3% |
Babcock International Group PLC | 10,510 | 72,299 |
Brambles Ltd. | 7,108 | 36,934 |
Comfort Systems USA, Inc. | 13,900 | 148,174 |
Deluxe Corp. | 800 | 11,968 |
G4S PLC | 2,453 | 7,280 |
Knoll, Inc. | 13,700 | 123,574 |
Loomis AB "B"* | 80 | 496 |
Rentokil Initial PLC | 1,774 | 1,135 |
Ritchie Bros. Auctioneers, Inc. | 400 | 8,509 |
Secom Co., Ltd. | 100 | 5,151 |
Securitas AB "B" | 886 | 7,272 |
Serco Group PLC | 451 | 2,935 |
Standard Register Co. | 5,400 | 48,222 |
Sykes Enterprises, Inc.* | 8,300 | 158,696 |
The Brink's Co. | 15,200 | 408,576 |
| 1,041,221 |
Construction & Engineering 0.3% |
ACS, Actividades de Construccion y Servicios SA | 1,251 | 57,508 |
Balfour Beatty PLC | 491 | 2,339 |
Bouygues SA | 209 | 8,847 |
EMCOR Group, Inc.* | 9,300 | 208,599 |
FLSmidth & Co. AS | 306 | 10,648 |
Fluor Corp. | 1,700 | 76,279 |
Fomento de Construcciones y Contratas SA | 208 | 6,845 |
Grupo Ferrovial SA | 303 | 8,347 |
Hochtief AG | 208 | 10,552 |
Koninklijke Boskalis Westminster NV | 311 | 7,224 |
Leighton Holdings Ltd. | 669 | 13,012 |
MasTec, Inc.* | 3,300 | 38,214 |
Michael Baker Corp.* | 4,600 | 169,786 |
Perini Corp.* | 8,200 | 191,716 |
Shaw Group, Inc.* | 10,600 | 216,982 |
Skanska AB "B" | 600 | 5,981 |
SNC-Lavalin Group, Inc. | 400 | 12,860 |
Vinci SA | 266 | 11,202 |
YIT Oyj | 36 | 232 |
| 1,057,173 |
Electrical Equipment 0.7% |
ABB Ltd. (Registered)* | 21,314 | 321,292 |
Alstom SA | 2,873 | 169,659 |
AZZ, Inc.* | 200 | 5,020 |
Emerson Electric Co. | 38,662 | 1,415,416 |
Gamesa Corp. Tecnologica SA | 1,365 | 24,759 |
GrafTech International Ltd.* | 23,900 | 198,848 |
Mitsubishi Electric Corp. | 1,000 | 6,258 |
Q-Cells SE* | 123 | 4,464 |
Schneider Electric SA | 133 | 9,934 |
Solarworld AG | 59 | 1,284 |
|
Shares
| Value ($) |
| |
Sumitomo Electric Industries Ltd. | 400 | 3,075 |
Vestas Wind Systems AS* | 925 | 54,976 |
| 2,214,985 |
Industrial Conglomerates 0.4% |
3M Co. | 3,700 | 212,898 |
Carlisle Companies, Inc. | 2,700 | 55,890 |
CSR Ltd. | 3,192 | 3,940 |
Fraser & Neave Ltd. | 5,000 | 10,306 |
General Electric Co. | 45,900 | 743,580 |
Hutchison Whampoa Ltd. | 14,000 | 70,620 |
Keppel Corp., Ltd. | 11,000 | 33,340 |
Koninklijke (Royal) Philips Electronics NV | 2,376 | 46,211 |
Orkla ASA | 900 | 5,985 |
SembCorp Industries Ltd. | 12,000 | 19,497 |
Siemens AG (Registered) | 870 | 65,163 |
Smiths Group PLC | 412 | 5,305 |
Wendel | 118 | 5,862 |
| 1,278,597 |
Machinery 1.6% |
AGCO Corp.* | 11,600 | 273,644 |
Alfa Laval AB | 938 | 8,144 |
Ampco-Pittsburgh Corp. | 300 | 6,510 |
Atlas Copco AB "A" | 2,312 | 19,902 |
Atlas Copco AB "B" | 1,266 | 9,731 |
Caterpillar, Inc. | 5,770 | 257,746 |
Chart Industries, Inc.* | 14,600 | 155,198 |
CIRCOR International, Inc. | 5,000 | 137,500 |
Columbus McKinnon Corp.* | 2,500 | 34,125 |
Cummins, Inc. | 5,100 | 136,323 |
Dover Corp. | 18,549 | 610,633 |
EnPro Industries, Inc.* | 3,000 | 64,620 |
FANUC Ltd. | 100 | 7,112 |
Federal Signal Corp. | 10,400 | 85,384 |
Flowserve Corp. | 3,700 | 190,550 |
Force Protection, Inc.* | 23,700 | 141,726 |
Gardner Denver, Inc.* | 9,100 | 212,394 |
GEA Group AG | 285 | 4,887 |
Gorman-Rupp Co. | 400 | 12,448 |
Invensys PLC* | 823 | 2,073 |
Joy Global, Inc. | 6,700 | 153,363 |
KCI Konecranes Oyj | 84 | 1,439 |
Komatsu Ltd. | 400 | 5,067 |
Kone Oyj "B" | 1,749 | 38,349 |
Kubota Corp. | 1,000 | 7,188 |
MAN AG | 163 | 8,990 |
Manitowoc Co., Inc. | 9,600 | 83,136 |
Metso Oyj | 1,439 | 17,399 |
Mitsubishi Heavy Industries Ltd. | 2,000 | 8,924 |
Mueller Water Products, Inc. "A" | 1,400 | 11,760 |
Pall Corp. | 12,500 | 355,375 |
Parker Hannifin Corp. | 20,134 | 856,500 |
Robbins & Myers, Inc. | 3,600 | 58,212 |
Sandvik AB | 1,727 | 10,972 |
Sauer-Danfoss, Inc. | 9,000 | 78,750 |
Scania AB "B" | 839 | 8,397 |
Schindler Holding AG | 84 | 3,839 |
SembCorp Marine Ltd. | 2,000 | 2,357 |
SKF AB "B" | 600 | 5,973 |
Sulzer AG (Registered) | 40 | 2,306 |
Sun Hydraulics Corp. | 4,400 | 82,896 |
Terex Corp.* | 3,400 | 58,888 |
|
Shares
| Value ($) |
| |
Timken Co. | 15,000 | 294,450 |
Titan International, Inc. | 11,800 | 97,350 |
Trinity Industries, Inc. | 5,600 | 88,256 |
Vallourec SA | 33 | 3,753 |
Volvo AB "A" | 300 | 1,689 |
Volvo AB "B" | 1,864 | 10,299 |
Wartsila Oyj | 1,043 | 31,037 |
Xerium Technologies, Inc.* | 5,000 | 3,300 |
Zardoya Otis SA | 934 | 16,628 |
| 4,777,492 |
Marine 0.1% |
A P Moller-Maersk AS "A" | 2 | 10,855 |
A P Moller-Maersk AS "B" | 5 | 26,790 |
American Commercial Lines, Inc.* | 15,100 | 73,990 |
Kuehne & Nagel International AG (Registered) | 78 | 5,057 |
Mitsui O.S.K. Lines Ltd. | 1,000 | 6,141 |
Nippon Yusen Kabushiki Kaisha | 1,000 | 6,167 |
Pacific Basin Shipping Ltd. | 15,000 | 6,896 |
TBS International Ltd. "A"* | 16,800 | 168,504 |
| 304,400 |
Professional Services 0.1% |
Adecco SA (Registered) | 181 | 6,143 |
Capita Group PLC | 467 | 4,976 |
COMSYS IT Partners, Inc.* | 3,100 | 6,944 |
Experian PLC | 763 | 4,778 |
Exponent, Inc.* | 2,200 | 66,176 |
Manpower, Inc. | 4,900 | 166,551 |
Randstad Holdings NV | 312 | 6,334 |
SGS SA (Registered) | 7 | 7,329 |
| 269,231 |
Road & Rail 1.0% |
Burlington Northern Santa Fe Corp. | 6,300 | 476,973 |
Canadian National Railway Co. | 15,000 | 544,107 |
Canadian Pacific Railway Ltd. | 400 | 13,278 |
Central Japan Railway Co. | 1 | 8,643 |
ComfortDelGro Corp., Ltd. | 12,000 | 12,147 |
CSX Corp. | 8,000 | 259,760 |
DSV AS | 1,127 | 12,273 |
East Japan Railway Co. | 4,700 | 365,966 |
FirstGroup PLC | 431 | 2,696 |
Kintetsu Corp. | 1,000 | 4,595 |
Marten Transport Ltd.* | 1,000 | 18,960 |
MTR Corp., Ltd. | 9,000 | 20,985 |
Norfolk Southern Corp. | 18,200 | 856,310 |
Ryder System, Inc. | 11,300 | 438,214 |
Tokyu Corp. | 1,000 | 5,033 |
Werner Enterprises, Inc. | 8,100 | 140,454 |
West Japan Railway Co. | 1 | 4,550 |
| 3,184,944 |
Trading Companies & Distributors 0.2% |
Bunzl PLC | 366 | 3,124 |
Finning International, Inc. | 500 | 5,772 |
Itochu Corp. | 1,000 | 5,017 |
Marubeni Corp. | 1,000 | 3,811 |
Mitsubishi Corp. | 14,600 | 204,961 |
Mitsui & Co., Ltd. | 1,000 | 10,229 |
Noble Group Ltd. | 6,000 | 4,298 |
Sumitomo Corp. | 500 | 4,407 |
TAL International Group, Inc. | 5,100 | 71,910 |
United Rentals, Inc.* | 19,300 | 176,016 |
|
Shares
| Value ($) |
| |
Wolseley PLC | 527 | 2,938 |
| 492,483 |
Transportation Infrastructure 0.1% |
Abertis Infraestructuras SA | 1,697 | 30,198 |
Atlantia SpA | 186 | 3,420 |
Brisa | 14,625 | 109,277 |
Cintra Concesiones de Infraestructuras de Transporte SA | 1,277 | 9,608 |
Macquarie Infrastructure Group (Unit) | 11,784 | 14,134 |
Transurban Group (Unit) | 6,344 | 24,361 |
| 190,998 |
Information Technology 8.0% |
Communications Equipment 1.0% |
Alcatel-Lucent* | 9,271 | 20,018 |
Brocade Communications Systems, Inc.* | 137,721 | 385,619 |
Cisco Systems, Inc.* | 46,070 | 750,941 |
Comtech Telecommunications Corp.* | 1,600 | 73,312 |
DG Fastchannel, Inc.* | 4,800 | 59,904 |
Nokia Oyj | 16,623 | 257,705 |
Nokia Oyj (ADR) | 32,996 | 514,737 |
Plantronics, Inc. | 3,400 | 44,880 |
QUALCOMM, Inc. | 15,130 | 542,108 |
Research In Motion Ltd.* | 1,900 | 76,185 |
Tandberg ASA | 100 | 1,101 |
Tekelec* | 9,800 | 130,732 |
Telefonaktiebolaget LM Ericsson "B" | 11,141 | 85,446 |
| 2,942,688 |
Computers & Peripherals 1.9% |
Apple, Inc.* | 12,900 | 1,101,015 |
EMC Corp.* | 36,091 | 377,873 |
Fujitsu Ltd. | 1,000 | 4,834 |
Hewlett-Packard Co. | 49,900 | 1,810,871 |
International Business Machines Corp. | 21,640 | 1,821,223 |
Lexmark International, Inc. "A"* | 2,800 | 75,320 |
Logitech International SA (Registered)* | 13,814 | 215,658 |
NCR Corp.* | 6,700 | 94,738 |
NEC Corp. | 1,000 | 3,356 |
Synaptics, Inc.* | 7,400 | 122,544 |
Toshiba Corp. | 2,000 | 8,235 |
Western Digital Corp.* | 17,000 | 194,650 |
Wincor Nixdorf AG | 83 | 3,957 |
| 5,834,274 |
Electronic Equipment, Instruments & Components 0.5% |
Arrow Electronics, Inc.* | 3,300 | 62,172 |
Avnet, Inc.* | 17,600 | 320,496 |
Benchmark Electronics, Inc.* | 1,100 | 14,047 |
Daktronics, Inc. | 6,600 | 61,776 |
Electro Rent Corp. | 4,500 | 50,220 |
Electrocomponents PLC | 2,281 | 4,663 |
Fujifilm Holdings Corp. | 200 | 4,402 |
Hitachi Ltd. | 4,000 | 15,512 |
HOYA Corp. | 200 | 3,474 |
IBIDEN Co., Ltd. | 100 | 2,062 |
Jabil Circuit, Inc. | 75,300 | 508,275 |
Kyocera Corp. | 100 | 7,214 |
|
Shares
| Value ($) |
| |
Mettler-Toledo International, Inc.* | 5,500 | 370,700 |
Multi-Fineline Electronix, Inc.* | 11,600 | 135,604 |
Murata Manufacturing Co., Ltd. | 100 | 3,920 |
Nidec Corp. | 100 | 3,889 |
RadiSys Corp.* | 3,700 | 20,461 |
TDK Corp. | 100 | 3,673 |
Technitrol, Inc. | 11,000 | 38,280 |
| 1,630,840 |
Internet Software & Services 0.5% |
EarthLink, Inc.* | 7,100 | 47,996 |
eBay, Inc.* | 10,900 | 152,164 |
Google, Inc. "A"* | 2,915 | 896,800 |
GSI Commerce, Inc.* | 2,500 | 26,300 |
InfoSpace, Inc. | 2,400 | 18,120 |
Liquidity Services, Inc.* | 2,200 | 18,326 |
ModusLink Global Solutions, Inc.* | 5,300 | 15,317 |
SAVVIS, Inc.* | 16,000 | 110,240 |
United Internet AG (Registered) | 218 | 1,951 |
United Online, Inc. | 6,900 | 41,883 |
ValueClick, Inc.* | 5,500 | 37,620 |
Websense, Inc.* | 1,500 | 22,455 |
Yahoo! Japan Corp. | 9 | 3,682 |
Yahoo!, Inc.* | 9,800 | 119,560 |
| 1,512,414 |
IT Services 1.4% |
Accenture Ltd. "A" | 24,910 | 816,799 |
Alliance Data Systems Corp.* | 1,800 | 83,754 |
Atos Origin SA | 177 | 4,442 |
Automatic Data Processing, Inc. | 11,600 | 456,344 |
Broadridge Financial Solutions, Inc. | 12,100 | 151,734 |
Cap Gemini SA | 629 | 24,244 |
CGI Group, Inc. "A"* | 600 | 4,666 |
Computer Sciences Corp.* | 8,600 | 302,204 |
CSG Systems International, Inc.* | 9,300 | 162,471 |
Fiserv, Inc.* | 7,600 | 276,412 |
Gartner, Inc.* | 9,500 | 169,385 |
iGATE Corp.* | 12,300 | 80,073 |
Indra Sistemas SA | 8,986 | 204,180 |
Logica PLC | 24,583 | 24,552 |
ManTech International Corp. "A"* | 3,300 | 178,827 |
NTT Data Corp. | 1 | 4,014 |
SAIC, Inc.* | 28,000 | 545,440 |
Sapient Corp.* | 9,200 | 40,848 |
Syntel, Inc. | 1,000 | 23,120 |
TNS, Inc.* | 1,400 | 13,146 |
Visa, Inc. "A" | 11,300 | 592,685 |
| 4,159,340 |
Office Electronics 0.1% |
Canon, Inc. | 11,000 | 345,307 |
Konica Minolta Holdings, Inc. | 500 | 3,875 |
Neopost SA | 90 | 8,146 |
Ricoh Co., Ltd. | 1,000 | 12,735 |
| 370,063 |
Semiconductors & Semiconductor Equipment 1.2% |
Analog Devices, Inc. | 15,600 | 296,712 |
ARM Holdings PLC | 1,833 | 2,294 |
ASML Holding NV | 5,496 | 98,077 |
Broadcom Corp. "A"* | 14,640 | 248,441 |
Infineon Technologies AG* | 2,218 | 3,053 |
Intel Corp. | 95,131 | 1,394,620 |
IXYS Corp. | 2,400 | 19,824 |
|
Shares
| Value ($) |
| |
Linear Technology Corp. | 3,200 | 70,784 |
Microsemi Corp.* | 11,900 | 150,416 |
ROHM Co., Ltd. | 100 | 5,049 |
Skyworks Solutions, Inc.* | 25,800 | 142,932 |
STMicroelectronics NV | 2,700 | 18,029 |
Taiwan Semiconductor Manufacturing Co., Ltd. (ADR) | 67,097 | 530,066 |
Texas Instruments, Inc. | 33,700 | 523,024 |
Tokyo Electron Ltd. | 100 | 3,512 |
Ultratech, Inc.* | 4,800 | 57,408 |
Volterra Semiconductor Corp.* | 18,500 | 132,275 |
| 3,696,516 |
Software 1.4% |
ACI Worldwide, Inc.* | 10,300 | 163,770 |
Adobe Systems, Inc.* | 14,650 | 311,899 |
Advent Software, Inc.* | 700 | 13,979 |
Compuware Corp.* | 17,300 | 116,775 |
Dassault Systemes SA | 339 | 15,319 |
Electronic Arts, Inc.* | 8,100 | 129,924 |
i2 Technologies, Inc.* | 5,200 | 33,228 |
Intuit, Inc.* | 2,400 | 57,096 |
JDA Software Group, Inc.* | 7,700 | 101,101 |
Mentor Graphics Corp.* | 2,100 | 10,857 |
Microsoft Corp. | 120,568 | 2,343,842 |
Misys PLC | 1,295 | 1,860 |
Nintendo Co., Ltd. | 800 | 307,356 |
Oracle Corp.* | 18,850 | 334,210 |
Pegasystems, Inc. | 1,300 | 16,068 |
Renaissance Learning, Inc. | 1,600 | 14,384 |
SAP AG | 2,145 | 76,875 |
Symantec Corp.* | 3,300 | 44,616 |
The Sage Group PLC | 21,974 | 54,035 |
Tyler Technologies, Inc.* | 13,200 | 158,136 |
| 4,305,330 |
Materials 3.0% |
Chemicals 1.8% |
Agrium, Inc. | 100 | 3,359 |
Air Liquide SA | 303 | 27,723 |
Air Products & Chemicals, Inc. | 11,220 | 564,029 |
Airgas, Inc. | 3,300 | 128,667 |
Akzo Nobel NV | 1,417 | 58,433 |
Asahi Kasei Corp. | 1,000 | 4,395 |
Ashland, Inc. | 14,700 | 154,497 |
BASF SE | 8,127 | 321,135 |
CF Industries Holdings, Inc. | 2,800 | 137,648 |
Ecolab, Inc. | 15,850 | 557,128 |
GenTek, Inc.* | 1,600 | 24,080 |
Givaudan SA (Registered) | 8 | 6,302 |
Incitec Pivot Ltd. | 520 | 920 |
Innophos Holdings, Inc. | 8,200 | 162,442 |
JSR Corp. | 200 | 2,251 |
K&S AG | 221 | 12,688 |
Koninklijke DSM NV | 897 | 22,994 |
Kuraray Co., Ltd. | 500 | 3,892 |
Linde AG | 2,568 | 217,313 |
LSB Industries, Inc.* | 4,100 | 34,112 |
Mitsubishi Chemical Holdings Corp. | 1,000 | 4,413 |
Mitsubishi Gas Chemical Co., Inc. | 1,000 | 4,087 |
Mitsui Chemicals, Inc. | 1,000 | 3,696 |
Monsanto Co. | 14,700 | 1,034,145 |
Nitto Denko Corp. | 200 | 3,842 |
Novozymes AS "B" | 1,650 | 131,453 |
|
Shares
| Value ($) |
| |
Orica Ltd. | 1,199 | 11,772 |
Potash Corp. of Saskatchewan, Inc. | 1,901 | 137,867 |
Praxair, Inc. | 17,152 | 1,018,143 |
Shin-Etsu Chemical Co., Ltd. | 400 | 18,346 |
Showa Denko KK | 2,000 | 2,896 |
Solvay SA | 1,411 | 104,905 |
Sumitomo Chemical Co., Ltd. | 2,000 | 6,826 |
Syngenta AG (Registered) | 212 | 41,071 |
Teijin Ltd. | 1,000 | 2,827 |
Terra Industries, Inc. | 9,100 | 151,697 |
The Mosaic Co. | 2,300 | 79,580 |
Toray Industries, Inc. | 2,000 | 10,185 |
Ube Industries Ltd. | 1,000 | 2,807 |
Umicore | 3,028 | 59,747 |
Wacker Chemie AG | 47 | 4,998 |
Yara International ASA | 6,460 | 141,195 |
| 5,420,506 |
Construction Materials 0.1% |
CRH PLC | 13,831 | 349,062 |
Fletcher Building Ltd. | 4,252 | 14,348 |
Holcim Ltd. (Registered) | 403 | 23,204 |
Imerys SA | 73 | 3,320 |
Lafarge SA | 142 | 8,634 |
| 398,568 |
Containers & Packaging 0.2% |
Amcor Ltd. | 605 | 2,459 |
Rock-Tenn Co. "A" | 2,400 | 82,032 |
Sealed Air Corp. | 4,800 | 71,712 |
Sonoco Products Co. | 19,266 | 446,201 |
Toyo Seikan Kaisha Ltd. | 300 | 5,168 |
| 607,572 |
Metals & Mining 0.8% |
Acerinox SA | 5,793 | 92,992 |
Agnico-Eagle Mines Ltd. | 100 | 5,085 |
Alumina Ltd. | 738 | 722 |
Anglo American PLC | 997 | 22,773 |
ArcelorMittal | 7,371 | 177,665 |
Barrick Gold Corp. | 18,100 | 655,530 |
BHP Billiton Ltd. | 2,466 | 51,937 |
BHP Billiton PLC | 1,501 | 28,274 |
BlueScope Steel Ltd. | 470 | 1,154 |
Compass Minerals International, Inc. | 3,200 | 187,712 |
First Quantum Minerals Ltd. | 300 | 4,279 |
Fortescue Metals Group Ltd.* | 700 | 957 |
Freeport-McMoRan Copper & Gold, Inc. | 14,624 | 357,411 |
Goldcorp, Inc. | 700 | 21,842 |
JFE Holdings, Inc. | 600 | 15,870 |
Kinross Gold Corp. | 400 | 7,290 |
Kobe Steel Ltd. | 3,000 | 5,525 |
Mitsubishi Materials Corp. | 4,000 | 10,085 |
Newcrest Mining Ltd. | 264 | 6,261 |
Nippon Steel Corp. | 6,000 | 19,703 |
Nisshin Steel Co., Ltd. | 3,000 | 6,171 |
Norsk Hydro ASA | 22,600 | 91,273 |
OneSteel Ltd. | 1,038 | 1,797 |
Outokumpu Oyj | 1,187 | 13,947 |
OZ Minerals Ltd. | 1,031 | 395 |
Rautaruukki Oyj | 857 | 14,770 |
Reliance Steel & Aluminum Co. | 3,600 | 71,784 |
Rio Tinto Ltd. | 360 | 9,643 |
|
Shares
| Value ($) |
| |
Rio Tinto PLC | 696 | 15,080 |
Salzgitter AG | 31 | 2,448 |
Sherritt International Corp. | 500 | 1,270 |
SSAB Svenskt Stal AB "A" | 2,280 | 20,083 |
Steel Dynamics, Inc. | 25,400 | 283,972 |
Stillwater Mining Co.* | 6,300 | 31,122 |
Sumitomo Metal Industries Ltd. | 6,000 | 14,787 |
Sumitomo Metal Mining Co., Ltd. | 1,000 | 10,629 |
Teck Cominco Ltd. "B" | 324 | 1,580 |
ThyssenKrupp AG | 248 | 6,707 |
voestalpine AG | 341 | 7,311 |
Xstrata PLC | 20,368 | 189,883 |
Yamana Gold, Inc. | 300 | 2,296 |
| 2,470,015 |
Paper & Forest Products 0.1% |
Clearwater Paper Corp.* | 514 | 4,312 |
Oji Paper Co., Ltd. | 1,000 | 5,879 |
Stora Enso Oyj "R" | 7,986 | 62,341 |
Svenska Cellulosa AB "B" | 7,800 | 66,702 |
UPM-Kymmene Oyj | 6,191 | 78,498 |
| 217,732 |
Telecommunication Services 3.0% |
Diversified Telecommunication Services 2.4% |
AT&T, Inc. | 70,602 | 2,012,157 |
Atlantic Tele-Network, Inc. | 4,100 | 108,855 |
BCE, Inc. | 18,539 | 377,387 |
Belgacom SA | 541 | 20,636 |
BT Group PLC | 9,801 | 19,257 |
Cable & Wireless PLC | 3,199 | 7,236 |
Deutsche Telekom AG (Registered) | 31,007 | 471,107 |
Elisa Oyj | 491 | 8,499 |
France Telecom SA | 5,720 | 159,995 |
Global Crossing Ltd.* | 10,500 | 83,370 |
Koninklijke (Royal) KPN NV | 7,006 | 101,593 |
Nippon Telegraph & Telephone Corp. | 6,300 | 337,128 |
NTELOS Holdings Corp. | 1,400 | 34,524 |
Portugal Telecom SGPS SA (Registered) | 12,213 | 103,638 |
Premiere Global Services, Inc.* | 1,500 | 12,915 |
Singapore Telecommunications Ltd. | 129,000 | 229,687 |
Swisscom AG (Registered) | 357 | 115,251 |
Tele2 AB "B" | 1,500 | 13,333 |
Telecom Corp. of New Zealand Ltd. | 160,665 | 214,432 |
Telecom Italia SpA | 54,709 | 88,987 |
Telecom Italia SpA (RSP) | 27,168 | 30,316 |
Telefonica SA | 31,356 | 702,859 |
Telekom Austria AG | 6,774 | 97,912 |
Telenor ASA | 30,700 | 205,440 |
TeliaSonera AB | 12,473 | 62,082 |
Telstra Corp., Ltd. | 39,332 | 105,316 |
Telus Corp. | 100 | 3,011 |
Telus Corp. (Non-Voting Shares) | 400 | 11,308 |
Verizon Communications, Inc. | 46,787 | 1,586,079 |
Windstream Corp. | 6,300 | 57,960 |
| 7,382,270 |
Wireless Telecommunication Services 0.6% |
America Movil SAB de CV "L" (ADR) | 3,300 | 102,267 |
China Mobile Ltd. | 34,500 | 349,789 |
KDDI Corp. | 11 | 78,346 |
|
Shares
| Value ($) |
| |
Millicom International Cellular SA (SDR) | 451 | 20,868 |
Mobistar SA | 53 | 3,817 |
NTT DoCoMo, Inc. | 57 | 112,364 |
Rogers Communications, Inc. "B" | 1,400 | 41,495 |
Softbank Corp. | 2,900 | 52,518 |
Syniverse Holdings, Inc.* | 5,800 | 69,252 |
Telephone & Data Systems, Inc. | 14,300 | 454,025 |
USA Mobility, Inc.* | 13,700 | 158,509 |
Vodafone Group PLC | 263,053 | 529,556 |
| 1,972,806 |
Utilities 3.0% |
Electric Utilities 2.0% |
Acciona SA | 91 | 11,510 |
Allegheny Energy, Inc. | 20,001 | 677,234 |
American Electric Power Co., Inc. | 16,900 | 562,432 |
British Energy Group PLC | 2,200 | 24,502 |
Cheung Kong Infrastructure Holdings Ltd. | 1,000 | 3,773 |
Chubu Electric Power Co., Inc. | 1,300 | 39,510 |
Chugoku Electric Power Co., Inc. | 700 | 18,441 |
CLP Holdings Ltd. | 15,000 | 101,987 |
Duke Energy Corp. | 33,985 | 510,115 |
E.ON AG | 9,802 | 396,365 |
Edison International | 17,500 | 562,100 |
EDP — Energias de Portugal SA | 25,897 | 97,604 |
Electricite de France | 389 | 22,609 |
Enel SpA | 21,075 | 134,777 |
Entergy Corp. | 4,672 | 388,383 |
Exelon Corp. | 6,577 | 365,747 |
FirstEnergy Corp. | 12,301 | 597,583 |
Fortis, Inc. | 1,800 | 35,854 |
Fortum Oyj | 14,698 | 315,704 |
FPL Group, Inc. | 8,429 | 424,231 |
Hokkaido Electric Power Co., Inc. | 600 | 15,187 |
Hokuriku Electric Power Co. | 500 | 14,153 |
HongKong Electric Holdings Ltd. | 11,000 | 61,879 |
Iberdrola SA | 10,143 | 94,180 |
Kansai Electric Power Co., Inc. | 1,500 | 43,466 |
Kyushu Electric Power Co., Inc. | 800 | 21,279 |
Oesterreichische Elektrizitaetswirtschafts AG (Verbund) "A" | 68 | 3,120 |
PPL Corp. | 7,700 | 236,313 |
Red Electrica Corporacion SA | 229 | 11,602 |
Scottish & Southern Energy PLC | 1,783 | 31,395 |
Shikoku Electric Power Co., Inc. | 500 | 16,863 |
Southern Co. | 6,470 | 239,390 |
Terna-Rete Elettrica Nazionale SpA | 6,478 | 21,211 |
Tohoku Electric Power Co., Inc. | 1,000 | 27,066 |
Tokyo Electric Power Co., Inc. | 2,400 | 80,134 |
Union Fenosa SA | 861 | 21,280 |
| 6,228,979 |
Gas Utilities 0.3% |
Enagas | 311 | 6,823 |
Gas Natural SDG SA | 302 | 8,237 |
Hong Kong & China Gas Co., Ltd. | 29,500 | 44,723 |
New Jersey Resources Corp. | 4,800 | 188,880 |
ONEOK, Inc. | 5,900 | 171,808 |
Osaka Gas Co., Ltd. | 5,000 | 23,094 |
Snam Rete Gas SpA | 4,641 | 25,634 |
South Jersey Industries, Inc. | 1,900 | 75,715 |
The Laclede Group, Inc. | 3,100 | 145,204 |
|
Shares
| Value ($) |
| |
Tokyo Gas Co., Ltd. | 5,000 | 25,337 |
WGL Holdings, Inc. | 3,000 | 98,070 |
| 813,525 |
Independent Power Producers & Energy Traders 0.0% |
Drax Group PLC | 680 | 5,512 |
Electric Power Development Co., Ltd. | 400 | 15,712 |
Iberdrola Renovables SA* | 1,405 | 6,075 |
International Power PLC | 4,087 | 14,190 |
TransAlta Corp. | 2,300 | 45,273 |
| 86,762 |
Multi-Utilities 0.7% |
A2A SpA | 4,548 | 8,151 |
AGL Energy Ltd. | 22,035 | 235,172 |
Avista Corp. | 4,700 | 91,086 |
Canadian Utilities Ltd. "A" | 700 | 22,965 |
CenterPoint Energy, Inc. | 3,600 | 45,432 |
Centrica PLC | 8,869 | 34,081 |
Dominion Resources, Inc. | 4,600 | 164,864 |
GDF Suez | 2,156 | 106,780 |
National Grid PLC | 5,608 | 55,422 |
NiSource, Inc. | 6,800 | 74,596 |
PG&E Corp. | 21,059 | 815,194 |
RWE AG | 658 | 59,152 |
Sempra Energy | 4,000 | 170,520 |
Suez Environnement SA* | 342 | 5,767 |
TECO Energy, Inc. | 8,100 | 100,035 |
United Utilities Group PLC | 1,332 | 12,054 |
Veolia Environnement | 808 | 25,359 |
| 2,026,630 |
Water Utilities 0.0% |
California Water Service Group | 2,700 | 125,361 |
Severn Trent PLC | 474 | 8,208 |
| 133,569 |
Total Common Stocks (Cost $215,568,654) | 180,951,997 |
|
Preferred Stocks 0.0% |
Consumer Discretionary 0.0% |
Porsche Automobil Holding SE | 50 | 3,895 |
Volkswagen AG | 62 | 3,309 |
| 7,204 |
Consumer Staples 0.0% |
Henkel AG & Co. KGaA | 1,125 | 36,069 |
Financial 0.0% |
Preferred Blocker Inc., 144A, 9.0% | 28 | 7,996 |
Health Care 0.0% |
Fresenius SE | 338 | 19,806 |
Utilities 0.0% |
RWE AG | 22 | 1,663 |
Total Preferred Stocks (Cost $122,753) | 72,738 |
|
Convertible Preferred Stocks 0.0% |
Consumer Discretionary |
ION Media Networks, Inc., 144A, 12.0%* (Cost $8,344) | 60,000 | 0 |
|
|
Shares
| Value ($) |
| |
Rights 0.0% |
Financials |
DBS Group Holdings Ltd., Expiration Date 1/20/2009* | 1,500 | 3,123 |
Fortis, Expiration Date 7/4/2014* | 6,275 | 0 |
HBOS PLC, Expiration Date 1/9/2009* | 4,052 | 0 |
Lloyds TSB Group PLC, Expiration Date 1/12/2009* | 565 | 0 |
Total Rights (Cost $0) | 3,123 |
|
Warrants 0.0% |
Financials |
New ASAT (Finance) Ltd., Expiration Date 2/1/2011* (Cost $0) | 24,700 | 1,938 |
| Principal Amount ($)(a) | Value ($) |
| |
Corporate Bonds 11.7% |
Consumer Discretionary 0.9% |
AMC Entertainment, Inc., 8.0%, 3/1/2014 | 45,000 | 27,675 |
American Achievement Corp., 144A, 8.25%, 4/1/2012 | 15,000 | 11,550 |
American Achievement Group Holding Corp., 16.75%, 10/1/2012 (PIK) | 22,571 | 5,417 |
Asbury Automotive Group, Inc.: | | |
7.625%, 3/15/2017 | 35,000 | 16,275 |
8.0%, 3/15/2014 | 15,000 | 7,125 |
British Sky Broadcasting Group PLC, 144A, 9.5%, 11/15/2018 | 500,000 | 510,451 |
Cablevision Systems Corp., Series B, 8.334%***, 4/1/2009 | 15,000 | 14,962 |
CanWest MediaWorks LP, 144A, 9.25%, 8/1/2015 | 25,000 | 9,500 |
Carrols Corp., 9.0%, 1/15/2013 | 15,000 | 10,125 |
Charter Communications Operating LLC, 144A, 10.875%, 9/15/2014 | 75,000 | 60,000 |
Comcast Corp., 6.4%, 5/15/2038 | 400,000 | 399,065 |
CSC Holdings, Inc.: | | |
6.75%, 4/15/2012 | 25,000 | 22,875 |
Series B, 8.125%, 7/15/2009 | 25,000 | 24,875 |
Series B, 8.125%, 8/15/2009 | 55,000 | 54,725 |
Denny's Holdings, Inc., 10.0%, 10/1/2012 | 10,000 | 6,925 |
DIRECTV Holdings LLC, 7.625%, 5/15/2016 | 70,000 | 67,900 |
Dollarama Group LP, 8.073%***, 8/15/2012 (b) | 24,000 | 15,240 |
EchoStar DBS Corp.: | | |
6.625%, 10/1/2014 | 40,000 | 33,400 |
7.125%, 2/1/2016 | 35,000 | 29,225 |
Fontainebleau Las Vegas Holdings LLC, 144A, 10.25%, 6/15/2015 | 25,000 | 2,438 |
Great Canadian Gaming Corp., 144A, 7.25%, 2/15/2015 | 30,000 | 20,400 |
Group 1 Automotive, Inc., 8.25%, 8/15/2013 | 15,000 | 10,050 |
Hertz Corp., 8.875%, 1/1/2014 | 85,000 | 52,275 |
Idearc, Inc., 8.0%, 11/15/2016 | 55,000 | 4,125 |
| Principal Amount ($)(a) | Value ($) |
| |
Indianapolis Downs LLC, 144A, 11.0%, 11/1/2012 | 20,000 | 10,900 |
Isle of Capri Casinos, Inc., 7.0%, 3/1/2014 | 30,000 | 12,750 |
Kabel Deutschland GmbH, 10.625%, 7/1/2014 | 75,000 | 66,750 |
Lamar Media Corp., Series C, 6.625%, 8/15/2015 | 20,000 | 14,450 |
Liberty Media LLC, 5.7%, 5/15/2013 | 5,000 | 3,278 |
MediMedia USA, Inc., 144A, 11.375%, 11/15/2014 | 15,000 | 9,000 |
MGM MIRAGE: | | |
6.625%, 7/15/2015 | 25,000 | 15,250 |
8.375%, 2/1/2011 | 20,000 | 11,900 |
MTR Gaming Group, Inc., Series B, 9.75%, 4/1/2010 | 40,000 | 30,000 |
Norcraft Holdings LP, 9.75%, 9/1/2012 | 80,000 | 59,600 |
Penske Automotive Group, Inc., 7.75%, 12/15/2016 | 50,000 | 23,250 |
Pinnacle Entertainment, Inc., 8.75%, 10/1/2013 | 20,000 | 15,800 |
Quebecor Media, Inc., 7.75%, 3/15/2016 | 20,000 | 13,500 |
Quebecor World, Inc., 144A, 9.75%, 1/15/2015** | 25,000 | 1,969 |
Reader's Digest Association, Inc., 9.0%, 2/15/2017 | 25,000 | 2,156 |
Sabre Holdings Corp., 8.35%, 3/15/2016 | 25,000 | 5,563 |
Seminole Hard Rock Entertainment, Inc., 144A, 4.496%***, 3/15/2014 | 30,000 | 15,225 |
Shingle Springs Tribal Gaming Authority, 144A, 9.375%, 6/15/2015 | 25,000 | 12,500 |
Simmons Co., Step-up Coupon, 0% to 12/15/2009, 10.0% to 12/15/2014 | 105,000 | 12,075 |
Sinclair Television Group, Inc., 8.0%, 3/15/2012 | 26,000 | 19,565 |
Sirius XM Radio, Inc., 9.625%, 8/1/2013 | 55,000 | 10,244 |
Sonic Automotive,
Inc., Series B, 8.625%, 8/15/2013 | 30,000 | 11,175 |
TCI Communications, Inc., 8.75%, 8/1/2015 | 135,000 | 143,702 |
Time Warner Cable, Inc., 8.25%, 2/14/2014 | 750,000 | 760,849 |
Travelport LLC: | | |
6.828%***, 9/1/2014 | 20,000 | 5,900 |
9.875%, 9/1/2014 | 5,000 | 1,875 |
Trump Entertainment Resorts, Inc.,
8.5%, 6/1/2015** | 5,000 | 663 |
United Components, Inc., 9.375%, 6/15/2013 | 5,000 | 2,100 |
Unity Media GmbH, 144A, 8.75%, 2/15/2015 EUR | 50,000 | 54,559 |
Vertis, Inc., 13.5%,
4/1/2014 (PIK) | 32,999 | 7,699 |
Vitro SAB de CV,
9.125%, 2/1/2017 | 40,000 | 12,000 |
Young Broadcasting, Inc., 8.75%, 1/15/2014 | 130,000 | 1,300 |
| 2,784,145 |
| Principal Amount ($)(a) | Value ($) |
| |
Consumer Staples 1.3% |
Alliance One International, Inc., 8.5%, 5/15/2012 | 15,000 | 11,025 |
Coca-Cola Enterprises, Inc., 7.375%, 3/3/2014 | 1,000,000 | 1,098,105 |
CVS Caremark Corp., 6.25%, 6/1/2027 | 750,000 | 697,351 |
Delhaize America, Inc.: | | |
8.05%, 4/15/2027 | 30,000 | 27,763 |
9.0%, 4/15/2031 | 56,000 | 56,634 |
General Nutrition Centers, Inc., 7.584%***, 3/15/2014 (PIK) | 15,000 | 8,400 |
Kroger Co., 6.15%, 1/15/2020 | 1,250,000 | 1,233,280 |
North Atlantic Trading Co., 144A, 10.0%, 3/1/2012 | 108,750 | 59,813 |
Reynolds American, Inc., 7.75%, 6/1/2018 | 750,000 | 615,322 |
Smithfield Foods, Inc., 7.75%, 7/1/2017 | 5,000 | 2,850 |
Viskase Companies, Inc., 11.5%, 6/15/2011 | 480,000 | 312,000 |
| 4,122,543 |
Energy 0.3% |
Atlas Energy Resources LLC, 144A, 10.75%, 2/1/2018 | 55,000 | 33,550 |
Belden & Blake Corp., 8.75%, 7/15/2012 | 130,000 | 89,050 |
Bristow Group, Inc., 7.5%, 9/15/2017 | 30,000 | 20,100 |
Chaparral Energy, Inc., 8.5%, 12/1/2015 | 40,000 | 8,000 |
Chesapeake Energy Corp.: | | |
6.25%, 1/15/2018 | 20,000 | 14,800 |
6.875%, 1/15/2016 | 90,000 | 72,000 |
7.5%, 6/15/2014 | 10,000 | 8,450 |
Cimarex Energy Co., 7.125%, 5/1/2017 | 25,000 | 19,500 |
Delta Petroleum Corp., 7.0%, 4/1/2015 | 45,000 | 9,000 |
Dynegy Holdings, Inc., 6.875%, 4/1/2011 | 10,000 | 8,750 |
El Paso Corp., 7.25%, 6/1/2018 | 40,000 | 31,747 |
Forest Oil Corp., 144A, 7.25%, 6/15/2019 | 15,000 | 10,950 |
Frontier Oil Corp., 6.625%, 10/1/2011 | 20,000 | 18,100 |
KCS Energy, Inc., 7.125%, 4/1/2012 | 105,000 | 78,750 |
Mariner Energy, Inc.: | | |
7.5%, 4/15/2013 | 25,000 | 16,000 |
8.0%, 5/15/2017 | 20,000 | 10,400 |
Newfield Exploration Co., 7.125%, 5/15/2018 | 40,000 | 31,600 |
OPTI Canada, Inc.: | | |
7.875%, 12/15/2014 | 35,000 | 17,850 |
8.25%, 12/15/2014 | 70,000 | 37,800 |
Petrohawk Energy Corp., 144A, 7.875%, 6/1/2015 | 15,000 | 11,100 |
Plains Exploration & Production Co., 7.0%, 3/15/2017 | 15,000 | 10,275 |
Quicksilver Resources, Inc., 7.125%, 4/1/2016 | 70,000 | 37,450 |
Range Resources Corp., 7.25%, 5/1/2018 | 10,000 | 8,350 |
SandRidge Energy, Inc., 144A, 8.0%, 6/1/2018 | 20,000 | 11,100 |
| Principal Amount ($)(a) | Value ($) |
| |
Stone Energy Corp.: | | |
6.75%, 12/15/2014 | 40,000 | 19,600 |
8.25%, 12/15/2011 | 75,000 | 46,500 |
Tennessee Gas Pipeline Co., 7.625%, 4/1/2037 | 25,000 | 19,843 |
Tesoro Corp., 6.5%, 6/1/2017 | 25,000 | 13,719 |
Whiting Petroleum Corp.: | | |
7.0%, 2/1/2014 | 20,000 | 14,100 |
7.25%, 5/1/2012 | 50,000 | 37,250 |
Williams Companies, Inc.: | | |
8.125%, 3/15/2012 | 85,000 | 78,306 |
8.75%, 3/15/2032 | 50,000 | 37,250 |
Williams Partners LP, 7.25%, 2/1/2017 | 25,000 | 19,750 |
| 900,990 |
Financials 5.0% |
Algoma Acquisition Corp., 144A, 9.875%, 6/15/2015 | 60,000 | 22,800 |
Ashton Woods USA LLC, 9.5%, 10/1/2015** | 70,000 | 14,000 |
BB&T Corp., 5.2%, 12/23/2015 | 1,000,000 | 950,420 |
Buffalo Thunder Development Authority, 144A, 9.375%, 12/15/2014 | 15,000 | 3,000 |
Citigroup, Inc.: | | |
2.875%, 12/9/2011 | 3,000,000 | 3,093,516 |
6.125%, 5/15/2018 | 500,000 | 505,561 |
6.5%, 8/19/2013 | 530,000 | 534,816 |
Conproca SA de CV, REG S, 12.0%, 6/16/2010 | 279,855 | 284,752 |
Countrywide Home Loans, Inc., Series H, 6.25%, 4/15/2009 | 125,000 | 125,026 |
FIA Card Services NA, 144A, 7.125%, 11/15/2012 | 1,250,000 | 1,278,095 |
Ford Motor Credit Co., LLC: | | |
7.25%, 10/25/2011 | 155,000 | 113,229 |
7.875%, 6/15/2010 | 65,000 | 52,012 |
General Electric Capital Corp., Series A, 5.25%, 10/19/2012 | 1,250,000 | 1,259,014 |
GMAC LLC, 144A, 6.875%, 9/15/2011 | 132,000 | 94,324 |
Hawker Beechcraft Acquisition Co., LLC, 8.5%, 4/1/2015 | 65,000 | 26,650 |
Hexion US Finance Corp., 9.75%, 11/15/2014 | 20,000 | 5,700 |
Inmarsat Finance PLC, 10.375%, 11/15/2012 | 30,000 | 26,587 |
iPayment, Inc., 9.75%, 5/15/2014 | 25,000 | 12,500 |
JPMorgan Chase & Co., 4.75%, 5/1/2013 | 875,000 | 863,423 |
Local TV Finance LLC, 144A, 9.25%, 6/15/2015 (PIK) | 25,000 | 5,500 |
Merrill Lynch & Co., Inc., 6.875%, 4/25/2018 | 750,000 | 784,519 |
New ASAT (Finance) Ltd., 9.25%, 2/1/2011 | 95,000 | 9,975 |
Orascom Telecom Finance SCA, 144A, 7.875%, 2/8/2014 | 100,000 | 53,000 |
PNC Bank NA, 6.875%, 4/1/2018 | 1,000,000 | 1,063,968 |
PNC Funding Corp., 2.3%, 6/22/2012 | 3,000,000 | 3,029,967 |
Qwest Capital Funding, Inc., 7.0%, 8/3/2009 | 25,000 | 24,500 |
Rainbow National Services LLC, 144A, 10.375%, 9/1/2014 | 4,000 | 3,560 |
SLM Corp., Series A, 4.5%, 7/26/2010 | 125,000 | 108,483 |
| Principal Amount ($)(a) | Value ($) |
| |
Sprint Capital Corp.: | | |
7.625%, 1/30/2011 | 20,000 | 16,700 |
8.375%, 3/15/2012 | 10,000 | 8,000 |
The Goldman Sachs Group, Inc., 6.15%, 4/1/2018 | 1,000,000 | 960,961 |
Tropicana Entertainment LLC, 9.625%, 12/15/2014** | 75,000 | 750 |
UCI Holdco, Inc., 9.996%***, 12/15/2013 (PIK) | 34,934 | 5,939 |
Universal City Development Partners Ltd., 11.75%, 4/1/2010 | 125,000 | 80,625 |
| 15,421,872 |
Health Care 0.2% |
Advanced Medical Optics, Inc., 7.5%, 5/1/2017 | 45,000 | 22,950 |
Boston Scientific Corp., 6.0%, 6/15/2011 | 25,000 | 23,750 |
Community Health Systems, Inc., 8.875%, 7/15/2015 | 185,000 | 170,200 |
HCA, Inc.: | | |
9.125%, 11/15/2014 | 35,000 | 32,463 |
9.25%, 11/15/2016 | 130,000 | 119,275 |
9.625%, 11/15/2016 (PIK) | 40,000 | 31,200 |
HEALTHSOUTH Corp., 10.75%, 6/15/2016 | 20,000 | 18,350 |
IASIS Healthcare LLC, 8.75%, 6/15/2014 | 30,000 | 23,250 |
Psychiatric Solutions, Inc., 7.75%, 7/15/2015 | 25,000 | 18,375 |
Surgical Care Affiliates, Inc., 144A, 8.875%, 7/15/2015 (PIK) | 30,000 | 18,300 |
The Cooper Companies, Inc., 7.125%, 2/15/2015 | 45,000 | 37,800 |
Vanguard Health Holding Co. I, LLC, Step-up Coupon, 0% to 10/1/2009, 11.25% to 10/1/2015 | 25,000 | 19,625 |
Vanguard Health Holding Co. II, LLC, 9.0%, 10/1/2014 | 75,000 | 62,625 |
| 598,163 |
Industrials 0.6% |
Actuant Corp., 6.875%, 6/15/2017 | 20,000 | 15,050 |
ARAMARK Corp., 8.5%, 2/1/2015 | 10,000 | 9,050 |
Baldor Electric Co., 8.625%, 2/15/2017 | 25,000 | 18,625 |
BE Aerospace, Inc., 8.5%, 7/1/2018 | 50,000 | 45,000 |
Belden, Inc., 7.0%, 3/15/2017 | 25,000 | 18,750 |
Browning-Ferris Industries, Inc., 7.4%, 9/15/2035 | 75,000 | 61,873 |
Cenveo Corp., 144A, 10.5%, 8/15/2016 | 10,000 | 5,800 |
Congoleum Corp., 8.625%, 8/1/2008** | 190,000 | 142,500 |
DRS Technologies, Inc.: | | |
6.625%, 2/1/2016 | 10,000 | 10,000 |
6.875%, 11/1/2013 | 65,000 | 64,675 |
7.625%, 2/1/2018 | 80,000 | 80,000 |
Esco Corp., 144A, 8.625%, 12/15/2013 | 45,000 | 31,500 |
General Cable Corp., 7.125%, 4/1/2017 | 15,000 | 9,900 |
Great Lakes Dredge & Dock Co., 7.75%, 12/15/2013 | 20,000 | 15,425 |
K. Hovnanian Enterprises, Inc., 8.875%, 4/1/2012 | 25,000 | 7,250 |
| Principal Amount ($)(a) | Value ($) |
| |
Kansas City Southern de Mexico SA de CV: | | |
7.375%, 6/1/2014 | 20,000 | 16,364 |
9.375%, 5/1/2012 | 60,000 | 54,900 |
Kansas City Southern Railway Co., 7.5%, 6/15/2009 | 20,000 | 20,050 |
Lockheed Martin Corp., 4.121%, 3/14/2013 | 500,000 | 487,411 |
Mobile Mini, Inc., 9.75%, 8/1/2014 | 25,000 | 17,750 |
Moog, Inc., 144A, 7.25%, 6/15/2018 | 10,000 | 8,000 |
Navios Maritime Holdings, Inc., 9.5%, 12/15/2014 | 35,000 | 19,425 |
R.H. Donnelley Corp., Series A-4, 8.875%, 10/15/2017 | 75,000 | 11,250 |
RBS Global & Rexnord Corp., 9.5%, 8/1/2014 | 20,000 | 14,900 |
Seitel, Inc., 9.75%, 2/15/2014 | 15,000 | 5,400 |
Titan International, Inc., 8.0%, 1/15/2012 | 85,000 | 62,900 |
TransDigm, Inc., 7.75%, 7/15/2014 | 15,000 | 12,300 |
Union Pacific Corp., 5.7%, 8/15/2018 | 500,000 | 481,368 |
United Rentals North America, Inc.: | | |
6.5%, 2/15/2012 | 15,000 | 11,850 |
7.0%, 2/15/2014 | 65,000 | 39,650 |
US Concrete, Inc., 8.375%, 4/1/2014 | 30,000 | 16,200 |
| 1,815,116 |
Information Technology 0.4% |
Alion Science & Technology Corp., 10.25%, 2/1/2015 | 20,000 | 9,025 |
L-3 Communications Corp.: | | |
5.875%, 1/15/2015 | 80,000 | 72,000 |
Series B, 6.375%, 10/15/2015 | 35,000 | 32,725 |
Lucent Technologies, Inc., 6.45%, 3/15/2029 | 75,000 | 30,000 |
MasTec, Inc., 7.625%, 2/1/2017 | 35,000 | 26,293 |
Seagate Technology HDD Holdings, 6.8%, 10/1/2016 | 45,000 | 23,400 |
SunGard Data Systems, Inc., 10.25%, 8/15/2015 | 60,000 | 39,600 |
Vangent, Inc., 9.625%, 2/15/2015 | 15,000 | 8,719 |
Xerox Corp., 5.65%, 5/15/2013 | 1,300,000 | 1,020,344 |
| 1,262,106 |
Materials 0.5% |
Appleton Papers, Inc., Series B, 8.125%, 6/15/2011 | 15,000 | 10,350 |
ARCO Chemical Co., 9.8%, 2/1/2020 | 195,000 | 21,450 |
Cascades, Inc., 7.25%, 2/15/2013 | 57,000 | 29,070 |
Chemtura Corp., 6.875%, 6/1/2016 | 50,000 | 25,500 |
CPG International I, Inc., 10.5%, 7/1/2013 | 50,000 | 28,000 |
Exopack Holding Corp., 11.25%, 2/1/2014 | 80,000 | 46,800 |
Freeport-McMoRan Copper & Gold, Inc.: | | |
8.25%, 4/1/2015 | 65,000 | 55,250 |
8.375%, 4/1/2017 | 120,000 | 98,400 |
GEO Specialty Chemicals, Inc.: | | |
144A, 7.5%***, 3/31/2015 (PIK) | 200,330 | 144,237 |
144A, 9.968%***, 12/31/2009 | 322,000 | 231,840 |
Georgia-Pacific LLC, 144A, 7.125%, 1/15/2017 | 15,000 | 12,600 |
Hexcel Corp., 6.75%, 2/1/2015 | 95,000 | 72,200 |
| Principal Amount ($)(a) | Value ($) |
| |
Huntsman LLC, 11.625%, 10/15/2010 | 122,000 | 106,750 |
Innophos, Inc., 8.875%, 8/15/2014 | 10,000 | 7,000 |
Jefferson Smurfit Corp., 8.25%, 10/1/2012 | 30,000 | 5,100 |
Koppers Holdings, Inc., Step-up Coupon, 0% to 11/15/2009, 9.875% to 11/15/2014 | 70,000 | 54,250 |
Metals USA Holdings Corp., 10.883%***, 7/1/2012 (PIK) | 15,408 | 4,314 |
Millar Western Forest Products Ltd., 7.75%, 11/15/2013 | 15,000 | 7,500 |
Monsanto Co.,
5.875%, 4/15/2038 | 500,000 | 536,232 |
NewMarket Corp., 7.125%, 12/15/2016 | 65,000 | 48,750 |
Radnor Holdings Corp., 11.0%, 3/15/2010** | 40,000 | 50 |
Smurfit-Stone Container Enterprises, Inc., 8.0%, 3/15/2017 | 35,000 | 6,650 |
Terra Capital, Inc., Series B, 7.0%, 2/1/2017 | 50,000 | 36,750 |
The Mosaic Co., 144A, 7.375%, 12/1/2014 | 40,000 | 32,800 |
Witco Corp.,
6.875%, 2/1/2026 | 60,000 | 16,800 |
Wolverine Tube, Inc., 10.5%, 4/1/2009 | 40,000 | 32,200 |
| 1,670,843 |
Telecommunication Services 1.2% |
AT&T Mobility LLC, 6.5%, 12/15/2011 | 750,000 | 752,996 |
BCM Ireland Preferred Equity Ltd., 144A, 11.245%***, 2/15/2017 (PIK) EUR | 91,648 | 10,869 |
Cellco Partnership, 144A, 7.375%, 11/15/2013 | 750,000 | 791,310 |
Centennial
Communications Corp.: | | |
10.0%, 1/1/2013 | 15,000 | 15,525 |
10.125%, 6/15/2013 | 40,000 | 40,400 |
Cincinnati Bell, Inc.: | | |
7.25%, 7/15/2013 | 70,000 | 61,600 |
8.375%, 1/15/2014 | 25,000 | 19,250 |
Cricket Communications, Inc.: | | |
9.375%, 11/1/2014 | 55,000 | 49,500 |
144A, 10.0%, 7/15/2015 | 50,000 | 45,750 |
Intelsat Corp.: | | |
144A, 9.25%, 8/15/2014 | 10,000 | 9,300 |
144A, 9.25%, 6/15/2016 | 110,000 | 100,100 |
Intelsat Subsidiary Holding Co., Ltd., 144A, 8.875%, 1/15/2015 | 60,000 | 54,600 |
iPCS, Inc.,
5.318%***, 5/1/2013 | 10,000 | 7,100 |
MetroPCS Wireless, Inc., 9.25%, 11/1/2014 | 60,000 | 53,700 |
Millicom International Cellular SA, 10.0%, 12/1/2013 | 80,000 | 72,000 |
Qwest Corp.: | | |
7.25%, 9/15/2025 | 10,000 | 6,700 |
7.875%, 9/1/2011 | 65,000 | 59,800 |
8.875%, 3/15/2012 | 15,000 | 13,875 |
| Principal Amount ($)(a) | Value ($) |
| |
Rogers Communications, Inc., 6.8%, 8/15/2018 | 500,000 | 505,216 |
Sprint Nextel Corp., 6.0%, 12/1/2016 | 25,000 | 17,625 |
Stratos Global Corp., 9.875%, 2/15/2013 | 15,000 | 14,175 |
Telesat Canada, 144A, 11.0%, 11/1/2015 | 225,000 | 160,875 |
Verizon Communications, Inc., 8.95%, 3/1/2039 | 500,000 | 645,845 |
Virgin Media Finance PLC: | | |
8.75%, 4/15/2014 | 55,000 | 41,250 |
8.75%, 4/15/2014 EUR | 45,000 | 44,099 |
Windstream Corp.: | | |
7.0%, 3/15/2019 | 25,000 | 19,250 |
8.625%, 8/1/2016 | 10,000 | 8,850 |
| 3,621,560 |
Utilities 1.3% |
AES Corp.: | | |
8.0%, 10/15/2017 | 45,000 | 36,900 |
144A, 8.0%, 6/1/2020 | 50,000 | 38,750 |
144A, 8.75%, 5/15/2013 | 152,000 | 145,920 |
9.5%, 6/1/2009 | 25,000 | 24,812 |
Allegheny Energy Supply Co., LLC, 144A, 8.25%, 4/15/2012 | 190,000 | 187,150 |
American Electric Power Co., Inc., Series C, 5.375%, 3/15/2010 | 1,000,000 | 992,662 |
Appalachian Power Co., 7.0%, 4/1/2038 | 750,000 | 741,881 |
CenterPoint Energy, Inc., 6.5%, 5/1/2018 | 750,000 | 612,754 |
CMS Energy Corp., 8.5%, 4/15/2011 | 110,000 | 108,329 |
DPL, Inc., 6.875%, 9/1/2011 | 500,000 | 491,989 |
Edison Mission Energy, 7.0%, 5/15/2017 | 50,000 | 43,500 |
Energy Future Holdings Corp., 144A, 10.875%, 11/1/2017 | 70,000 | 49,700 |
Knight, Inc., 6.5%, 9/1/2012 | 15,000 | 12,675 |
Mirant Americas Generation LLC, 8.3%, 5/1/2011 | 45,000 | 43,650 |
Mirant North America LLC, 7.375%, 12/31/2013 | 20,000 | 19,200 |
NRG Energy, Inc.: | | |
7.25%, 2/1/2014 | 55,000 | 51,425 |
7.375%, 2/1/2016 | 50,000 | 46,500 |
7.375%, 1/15/2017 | 20,000 | 18,400 |
NV Energy, Inc.: | | |
6.75%, 8/15/2017 | 50,000 | 38,382 |
8.625%, 3/15/2014 | 8,000 | 7,213 |
Regency Energy Partners LP, 8.375%, 12/15/2013 | 31,000 | 21,235 |
Reliant Energy, Inc., 7.875%, 6/15/2017 | 55,000 | 44,550 |
Texas Competitive Electric Holdings Co., LLC, 144A, 10.5%, 11/1/2015 | 105,000 | 74,550 |
| 3,852,127 |
Total Corporate Bonds (Cost $39,552,234) | 36,049,465 |
|
| Principal Amount ($)(a) | Value ($) |
| |
Asset-Backed 0.8% |
Automobile Receivables 0.3% |
Capital Auto Receivables Asset Trust, "B",
Series 2006-1, 5.26%, 10/15/2010 | 566,000 | 552,324 |
Ford Credit Auto Owner Trust, "B", Series 2007-B, 5.69%, 11/15/2012 | 379,000 | 289,195 |
| 841,519 |
Home Equity Loans 0.5% |
Countrywide Asset-Backed Certificates, "1AF2", Series 2005-17, 5.363%, 5/25/2036 | 642,582 | 552,803 |
Credit-Based Asset Servicing and Securitization LLC, "AF2", Series 2006-CB2, 5.501%, 12/25/2036 | 1,135,415 | 941,923 |
| 1,494,726 |
Total Asset-Backed (Cost $2,722,798) | 2,336,245 |
|
Mortgage-Backed Securities Pass-Throughs 9.2% |
Federal Home Loan Mortgage Corp.: | | |
5.0%, 10/1/2035 | 2,383,295 | 2,433,381 |
5.5%, 4/1/2038 | 8,489,516 | 8,699,434 |
6.0%,with various maturities from 8/1/2035 until 3/1/2038 | 599,352 | 607,469 |
Federal National Mortgage Association: | | |
4.5%,with various maturities from 11/1/2028 until 9/1/2035 | 1,585,106 | 1,610,738 |
5.5%,with various maturities from 2/1/2037 until 4/1/2038 | 10,828,968 | 10,923,311 |
6.0%,with various maturities from 1/1/2024 until 8/1/2037 | 3,723,261 | 3,840,987 |
6.5%,with various maturities from 5/1/2017 until 1/1/2038 | 103,742 | 108,022 |
8.0%, 9/1/2015 | 119,491 | 126,892 |
Total Mortgage-Backed Securities Pass-Throughs (Cost $27,556,072) | 28,350,234 |
|
Commercial and Non-Agency Mortgage-Backed Securities 4.6% |
Adjustable Rate Mortgage Trust, "3A31", Series 2005-10, 5.414%***, 1/25/2036 | 1,000,000 | 484,222 |
Bear Stearns Adjustable Rate Mortgage Trust, "12A5", Series 2004-1, 4.565%***, 4/25/2034 | 1,443,377 | 883,840 |
Countrywide Alternative Loan Trust: | | |
"3A11", Series 2005-20CB, 0.771%***, 7/25/2035 | 1,075,677 | 740,674 |
"A1", Series 2004-1T1, 5.0%, 2/25/2034 | 337,717 | 284,482 |
"1A5", Series 2003-J1, 5.25%, 10/25/2033 | 379,183 | 329,186 |
"4A3", Series 2005-43, 5.67%***, 10/25/2035 | 636,605 | 243,474 |
| Principal Amount ($)(a) | Value ($) |
| |
"A1", Series 2004-35T2, 6.0%, 2/25/2035 | 379,811 | 331,574 |
"3A5", Series 2005-28CB, 6.0%, 8/25/2035 | 1,774,475 | 1,307,132 |
"1A4", Series 2006-43CB, 6.0%, 2/25/2037 | 995,512 | 618,878 |
First Horizon Alternative Mortgage Securities, "1A7", Series 2006-FA8, 6.0%, 2/25/2037 | 1,631,026 | 734,360 |
GS Mortgage Securities Corp. II, "AAB", Series 2006-GG8, 5.535%, 11/10/2039 | 1,800,000 | 1,362,765 |
LB-UBS Commercial Mortgage Trust, "A2", Series 2005-C2, 4.821%, 4/15/2030 | 127,801 | 121,350 |
Structured Adjustable Rate Mortgage Loan Trust: | | |
"6A3", Series 2005-21, 5.4%, 11/25/2035 | 900,000 | 373,509 |
"1A1", Series 2005-17, 5.701%***, 8/25/2035 | 1,094,538 | 727,641 |
Structured Asset Securities Corp., "4A1", Series 2005-6, 5.0%, 5/25/2035 | 127,667 | 107,360 |
Wachovia Bank Commercial Mortgage Trust: | | |
"APB", Series 2006-C23, 5.446%, 1/15/2045 | 2,100,000 | 1,615,115 |
"APB", Series 2007-C34, 5.617%, 5/15/2046 | 2,875,000 | 2,021,578 |
Wachovia Mortgage Loan Trust LLC, "1A1", Series 2006-A, 5.581%***, 5/20/2036 | 2,292,737 | 1,242,492 |
Washington Mutual Mortgage Pass-Through Certificates Trust: | | |
"A6", Series 2004-AR4, 3.792%***, 6/25/2034 | 190,000 | 182,419 |
"1A3", Series 2005-AR16, 5.102%***, 12/25/2035 | 1,005,000 | 536,138 |
Total Commercial and Non-Agency Mortgage-Backed Securities (Cost $22,084,515) | 14,248,189 |
|
Collateralized Mortgage Obligations 2.4% |
Fannie Mae Whole Loan, "1A1", Series 2004-W15, 6.0%, 8/25/2044 | 607,751 | 631,650 |
Federal Home Loan Mortgage Corp.: | | |
"OS", Series 3102, Principal Only, Zero Coupon, 1/15/2036 | 4,337,616 | 3,646,591 |
"H", Series 2278, 6.5%, 1/15/2031 | 17,882 | 18,504 |
Government National Mortgage Association, "CK", Series 2007-31, 5.0%, 5/16/2037 | 3,000,000 | 3,020,889 |
Total Collateralized Mortgage Obligations (Cost $6,658,744) | 7,317,634 |
|
Loan Participations and Assignments 0.2% |
Senior Loans*** |
Advanced Medical Optics, Inc., Term Loan B, LIBOR plus 1.75%, 3.754%, 4/2/2014 | 15,528 | 10,118 |
| Principal Amount ($)(a) | Value ($) |
| |
Buffets, Inc.: | | |
Letter of Credit, LIBOR plus 7.25%, 9.254%, 5/1/2013 | 26,839 | 6,750 |
Term Loan B, LIBOR plus 7.25%, 9.254%, 11/1/2013 | 136,563 | 34,346 |
Term Loan DIP, LIBOR plus 7.25%, 9.254%, 1/22/2009 | 65,653 | 16,512 |
Energy Future Holdings Corp.: | | |
Term Loan B2, LIBOR plus 3.5%, 5.504%, 10/10/2014 | 212,675 | 148,873 |
Term Loan B3, LIBOR plus 3.5%, 5.504%, 10/10/2014 | 88,476 | 61,564 |
Essar Steel Algoma, Inc., Term Loan B, LIBOR plus 2.5%, 4.504%, 6/30/2013 | 19,949 | 12,369 |
Ford Motor Co., Term Loan B, LIBOR plus 3.0%, 5.004%, 12/16/2013 | 24,873 | 10,205 |
General Nutrition Centers, Inc., Term Loan B, LIBOR plus 2.25%, 4.254%, 9/16/2013 | 14,849 | 9,949 |
Golden Nugget, Term Loan, 3.73%, 6/16/2014 | 35,000 | 3,675 |
Hawker Beechcraft, Inc.: | | |
Letter of Credit, LIBOR plus 2.0%, 4.004%, 3/26/2014 | 1,336 | 701 |
Term Loan B, LIBOR plus 2.0%, 4.004%, 3/26/2014 | 22,809 | 11,965 |
HCA, Inc., Term Loan A, LIBOR plus 1.5%, 3.504%, 11/17/2012 | 88,441 | 75,130 |
Hexion Specialty Chemicals: | | |
Term Loan C1, LIBOR plus 2.25%, 4.254%, 5/6/2013 | 72,654 | 30,805 |
Term Loan C2, LIBOR plus 2.25%, 4.254%, 5/6/2013 | 10,926 | 4,633 |
IASIS Healthcare LLC, Term Loan, LIBOR plus 5.25%, 7.254%, 6/15/2014 (PIK) | 80,660 | 46,379 |
Longview Power LLC: | | |
Demand Draw, 3.75%, 4/1/2014 | 26,667 | 16,667 |
Letter of Credit, 1.35%, 4/1/2014 | 13,333 | 8,333 |
Term Loan B, 4.25%, 4/1/2014 | 25,000 | 15,625 |
Sabre, Inc., Term Loan B, LIBOR plus 2.0%, 4.004%, 9/30/2014 | 23,027 | 10,049 |
Symbion, Inc.: | | |
Term Loan A, LIBOR plus 3.25%, 5.254%, 8/23/2013 | 10,171 | 6,357 |
Term Loan B, LIBOR plus 3.25%, 5.254%, 8/23/2014 | 10,171 | 6,357 |
Telesat Canada: | | |
Delayed Draw Term Loan, LIBOR plus 3.0%, 5.004%, 10/31/2014 | 6,283 | 4,307 |
Term Loan B, LIBOR plus 3.0%, 5.004%, 10/31/2014 | 73,148 | 50,143 |
Tribune Co., Tranche B, LIBOR plus 3.0%, 5.004%, 5/19/2014** | 49,152 | 14,184 |
Total Loan Participations and Assignments (Cost $1,117,706) | 615,996 |
|
| Principal Amount ($)(a) | Value ($) |
| |
Preferred Securities 0.1% |
Financials |
Citigroup, Inc., Series E, 8.4%, 4/30/2018 (c) | 35,000 | 23,110 |
Farm Credit Bank of Texas, Series 1, 7.561%, 12/15/2013 (c) | 218,000 | 115,570 |
Xerox Capital Trust I, 8.0%, 2/1/2027 | 15,000 | 10,243 |
Total Preferred Securities (Cost $276,067) | 148,923 |
|
Government & Agency Obligations 6.3% |
US Treasury Obligations |
US Treasury Bill, 0.17%****, 1/15/2009 (d) | 3,791,000 | 3,790,981 |
US Treasury Bonds: | | |
4.75%, 2/15/2037 | 500,000 | 696,719 |
8.125%, 8/15/2019 | 1,000,000 | 1,477,969 |
US Treasury Notes: | | |
2.75%, 10/31/2013 (e) | 6,000,000 | 6,378,750 |
3.75%, 11/15/2018 | 4,500,000 | 5,094,135 |
4.5%, 11/15/2015 | 1,500,000 | 1,778,908 |
Total Government & Agency Obligations (Cost $18,627,280) | 19,217,462 |
|
Units
| Value ($) |
| |
Other Investments 0.0% |
Materials |
Hercules, Inc., (Bond Unit), 6.5%, 6/30/2029 (Cost $116,987) | 170,000 | 81,600 |
|
Shares
| Value ($) |
| |
Exchange Traded Fund 0.3% |
iShares MSCI Japan Index Fund (Cost $943,697) | 83,841 | 804,874 |
|
Securities Lending Collateral 1.8% |
Daily Assets Fund Institutional, 1.69% (f) (g) (Cost $5,493,750) | 5,493,750 | 5,493,750 |
|
Cash Equivalents 4.9% |
Cash Management QP Trust, 1.42% (f) (Cost $15,034,729) | 15,034,729 | 15,034,729 |
| % of Net Assets | Value ($) |
| |
Total Investment Portfolio (Cost $355,884,330)+ | 101.2 | 310,728,897 |
Other Assets and Liabilities, Net | (1.2) | (3,562,992) |
Net Assets | 100.0 | 307,165,905 |
* Non-income producing security.** Non-income producing security. Issuer has defaulted on the payment of principal or the interest or has filed for bankruptcy. The following table represents bonds that are in default:Securities | Coupon | Maturity Date | Principal Amount | Acquisition Cost ($) | Value ($) |
Ashton Woods USA LLC
| 9.5% | 10/1/2015 | 70,000 | USD
| 63,467 | 14,000 |
Congoleum Corp.
| 8.625% | 8/1/2008 | 190,000 | USD
| 190,156 | 142,500 |
Quebecor World, Inc.
| 9.75% | 1/15/2015 | 25,000 | USD
| 25,000 | 1,969 |
Radnor Holdings Corp.
| 11.0% | 3/15/2010 | 40,000 | USD
| 25,775 | 50 |
Tribune Co.
| 5.004% | 5/19/2014 | 49,152 | USD
| 49,122 | 14,184 |
Tropicana Entertainment LLC
| 9.625% | 12/15/2014 | 75,000 | USD
| 55,245 | 750 |
Trump Entertainment Resorts, Inc.
| 8.5% | 6/1/2015 | 5,000 | USD
| 4,788 | 663 |
| | | |
| 413,553 | 174,116 |
*** Floating rate notes are securities whose yields vary with a designated market index or market rate, such as the coupon-equivalent of the US Treasury bill rate. These securities are shown at their current rate as of December 31, 2008.**** Annualized yield at time of purchase; not a coupon rate.+ The cost for federal income tax purposes was $362,091,444. At December 31, 2008, net unrealized depreciation for all securities based on tax cost was $51,362,547. This consisted of aggregate gross unrealized appreciation for all securities in which there was an excess of value over tax cost of $13,170,091 and aggregate gross unrealized depreciation for all securities in which there was an excess of tax cost over value of $64,532,638.(a) Principal amount is stated in US dollars unless otherwise noted.(b) Security has deferred its 6/15/2008 interest payment until 6/30/2009.(c) Date shown is call date; not a maturity date for the perpetual preferred securities.(d) At December 31, 2008, this security has been pledged, in whole or in part, to cover initial margin requirements for open futures contracts.(e) All or a portion of these securities were on loan (see Notes to Financial Statements). The value of all securities loaned at December 31, 2008 amounted to $5,315,625, which is 1.7% of net assets.(f) Affiliated fund managed by Deutsche Investment Management Americas Inc. The rate shown is the annualized seven-day yield at period end.(g) Represents collateral held in connection with securities lending. Income earned by the Portfolio is net of borrower rebates.144A: Security exempt from registration under Rule 144A of the Securities Act of 1933. These securities may be resold in transactions exempt from registration, normally to qualified institutional buyers.
ADR: American Depositary Receipt
CVA: Certificaten van Aandelen
FDR: Fiduciary Depositary Receipt
LIBOR: Represents the London InterBank Offered Rate.
MSCI: Morgan Stanley Capital International
PIK: Denotes that all or a portion of the income is paid in-kind.
PPS: Price Protected Shares
Principal Only: Principal Only (PO) bonds represent the "principal only" portion of payments on a pool of underlying mortgage or mortgage-backed securities.
REG S: Securities sold under Regulation S may not be offered, sold or delivered within the United States or to, or for the account or benefit of, US persons, except pursuant to an exemption from, or in a transaction not subject to, the registration requirements of the Securities Act.
REIT: Real Estate Investment Trust
RSP: Risparmio (Convertible Savings Shares)
SDR: Swedish Depositary Receipt
Included in the portfolio are investments in mortgage or asset-backed securities which are interests in separate pools of mortgages or assets. Effective maturities of these investments may be shorter than stated maturities due to prepayments. Some separate investments in the Federal National Mortgage Association and the Federal Home Loan Mortgage Corp. issues which have similar coupon rates have been aggregated for presentation purposes in this investment portfolio.
At December 31, 2008, open futures contracts purchased were as follows:
Futures | Expiration Date | Contracts | Aggregated Face Value ($) | Value ($) | Unrealized Appreciation/ (Depreciation) ($) |
10 Year Australian Treasury Bond
| 3/16/2009 | 43 | 3,370,020 | 3,489,513 | 119,493 |
10 Year Canadian Government Bond
| 3/20/2009 | 44 | 4,244,640 | 4,517,975 | 273,335 |
2 Year US Treasury Note
| 3/31/2009 | 23 | 4,954,407 | 5,015,437 | 61,030 |
AEX Index
| 1/16/2009 | 24 | 1,650,941 | 1,643,705 | (7,236) |
ASX SPI 200 Index
| 3/19/2009 | 20 | 1,244,073 | 1,305,855 | 61,782 |
DAX Index
| 3/20/2009 | 2 | 330,022 | 336,010 | 5,988 |
DJ Euro Stoxx 50 Index
| 3/20/2009 | 19 | 641,782 | 647,068 | 5,286 |
Federal Republic of Germany Euro-Bund
| 3/6/2009 | 43 | 7,435,123 | 7,461,951 | 26,828 |
Federal Republic of Germany Euro-Schatz
| 3/6/2009 | 106 | 15,804,065 | 15,835,190 | 31,125 |
FTSE 100 Index
| 3/20/2009 | 1 | 60,683 | 63,117 | 2,434 |
Hang Seng Stock Index
| 1/29/2009 | 5 | 468,381 | 464,665 | (3,716) |
IBEX 35 Index
| 1/16/2009 | 1 | 125,868 | 126,675 | 807 |
Nikkei 225 Index
| 3/12/2009 | 1 | 43,479 | 45,700 | 2,221 |
Russell 2000 Mini Index
| 3/20/2009 | 71 | 3,336,412 | 3,535,090 | 198,678 |
S&P 500 E Mini Index
| 3/20/2009 | 49 | 2,167,523 | 2,205,245 | 37,722 |
S&P MIB
| 3/20/2009 | 4 | 533,247 | 539,951 | 6,704 |
United Kingdom Long Gilt Bond
| 3/27/2009 | 15 | 2,498,562 | 2,662,786 | 164,224 |
Total net unrealized appreciation | 986,705 |
At December 31, 2008, open futures contracts sold were as follows:
Futures | Expiration Date | Contracts | Aggregated Face Value ($) | Value ($) | Unrealized Depreciation ($) |
10 Year Japanese Government Bond
| 3/11/2009 | 4 | 6,148,867 | 6,182,901 | (34,034) |
10 Year US Treasury Note
| 3/20/2009 | 110 | 13,411,739 | 13,832,500 | (420,761) |
CAC 40 Index
| 1/16/2009 | 25 | 1,117,009 | 1,119,337 | (2,328) |
FTSE 100 Index
| 3/20/2009 | 6 | 367,939 | 378,703 | (10,764) |
Nasdaq E-Mini 100 Index
| 3/20/2009 | 28 | 669,245 | 679,000 | (9,755) |
Russell 2000 Mini Index
| 3/20/2009 | 9 | 409,614 | 448,110 | (38,496) |
S&P 500 E Mini Index
| 3/20/2009 | 14 | 610,577 | 630,070 | (19,493) |
S&P TSE 60 Index
| 3/19/2009 | 5 | 414,843 | 437,343 | (22,500) |
TOPIX Index
| 3/13/2009 | 28 | 2,505,946 | 2,662,548 | (156,602) |
Total unrealized depreciation | (714,733) |
At December 31, 2008, open credit default swap contract purchased was as follows:
Effective/ Expiration Dates | Notional Amount ($) | Fixed Cash Flows Paid | Underlying Debt Obligation/Quality Rating (i) | Value ($) | Upfront Premiums Paid/ (Received) ($) | Unrealized Appreciation/ ($) |
5/2/2008
6/20/2013 | 25,0001 | 7.25% | ARCO Chemical Co.,
9/8%, 2/1/2020, D | 18,061 | — | 18,061 |
At December 31, 2008, open credit default swap contracts sold were as follows:
Effective/ Expiration Dates | Notional Amount ($) (h) | Fixed Cash Flows Received | Underlying Debt Obligation/Quality Rating (i) | Value ($) | Upfront Premiums Paid/ (Received) ($) | Unrealized Appreciation/ (Depreciation) ($) |
2/14/2008
3/20/2009 | 35,0001 | 3.8% | HCA, Inc.
6.375%, 1/15/2015, B- | (107) | — | (107) |
2/26/2008
3/20/2009 | 25,0001 | 5.0% | Tenet Healthcare Corp.,
7.375%, 2/1/2013, B | 51 | — | 51 |
Total net unrealized depreciation | | | (56) |
(h) The maximum potential amount of future undiscounted payments that the Portfolio could be required to make under a credit default swap contract would be the notional amount of the contract. These potential amounts would be partially offset by any recovery values of the referenced debt obligation or net amounts received from the settlement of buy protection credit default swap contracts entered into by the Portfolio for the same referenced debt obligation.
(i) The quality ratings represent the lower of Moody's Investors Service, Inc. ("Moody's") or Standard & Poor's Corporation ("S&P") credit ratings.
Counterparty:
1 Merrill Lynch, Pierce, Fenner & Smith, Inc.
|
At December 31, 2008, the Portfolio had the following open forward foreign currency exchange contracts:
Contracts to Deliver | | In Exchange For | | Settlement Date | | Unrealized Appreciation ($) |
EUR
| 84,700 |
| USD
| 121,817 |
| 1/15/2009 |
| 4,161 |
GBP
| 4,812,000 |
| USD
| 7,047,174 |
| 1/21/2009 |
| 132,931 |
USD
| 5,319,009 |
| EUR
| 4,221,000 |
| 1/21/2009 |
| 542,654 |
USD
| 3,214,521 |
| CHF
| 3,896,000 |
| 1/21/2009 |
| 446,796 |
USD
| 204,580 |
| NZD
| 386,000 |
| 1/21/2009 |
| 20,214 |
USD
| 4,951,817 |
| SEK
| 41,417,000 |
| 1/21/2009 |
| 283,369 |
USD
| 8,703,630 |
| SGD
| 13,282,000 |
| 1/21/2009 |
| 508,466 |
Total unrealized appreciation | 1,938,591 |
Contracts to Deliver | | In Exchange For | | Settlement Date | | Unrealized Depreciation ($) |
USD
| 15,965 |
| JPY
| 1,440,000 |
| 1/6/2009 |
| (77) |
AUD
| 604,000 |
| USD
| 388,438 |
| 1/21/2009 |
| (31,646) |
CAD
| 1,427,000 |
| USD
| 1,131,462 |
| 1/21/2009 |
| (24,052) |
JPY
| 360,226,000 |
| USD
| 3,898,550 |
| 1/21/2009 |
| (77,015) |
NOK
| 34,773,000 |
| USD
| 4,825,897 |
| 1/21/2009 |
| (131,932) |
Total unrealized depreciation | (264,722) |
Currency Abbreviations |
AUD Australian Dollar
CAD Canadian Dollar
CHF Swiss Franc
EUR Euro
GBP British Pound
JPY Japanese Yen
NOK Norwegian Krone
NZD New Zealand Dollar
SEK Swedish Krona
SGD Singapore Dollar
USD United States Dollar
|
Fair Value Measurements
The following is a summary of the inputs used as of December 31, 2008 in valuing the Portfolio's investments. For information on the Portfolio's policy regarding the valuation of investments and of the valuation inputs, and the aggregate levels used in the tables below, please refer to the Security Valuation section of Note A in the accompanying Notes to the Financial Statements.
Valuation Inputs | Investments in Securities | Other Financial Instruments++ |
Level 1
| $ 151,137,200 | $ 271,972 |
Level 2
| 159,428,604 | 1,691,874 |
Level 3
| 163,093 | — |
Total | $ 310,728,897 | $ 1,963,846 |
++ Other financial instruments are derivative instruments not reflected in the Investment Portfolio, such as futures contracts, forward foreign currency exchange contracts and swap contracts, which are valued at the unrealized appreciation (depreciation) on the instrument.The following is a reconciliation of the Portfolio's Level 3 investments for which significant unobservable inputs were used in determining value at December 31, 2008:
| Investments in Securities |
Balance as of January 1, 2008 | $ 109,579 |
Total realized gain (loss)
| (3,540) |
Change in unrealized appreciation (depreciation)
| (230,402) |
Amortization Premium/Discount
| 698 |
Net purchases (sales)
| (43,324) |
Net transfers in (out) of Level 3
| 330,082 |
Balance as of December 31, 2008 | $ 163,093 |
The accompanying notes are an integral part of the financial statements.
Financial Statements
Statement of Assets and Liabilities as of December 31, 2008
|
Assets |
Investments:
Investments in securities, at value (cost $335,355,851) — including $5,315,625 of securities loaned | $ 290,200,418 |
Investment in Daily Assets Fund Institutional (cost $5,493,750)* | 5,493,750 |
Investment in Cash Management QP Trust (cost $15,034,729) | 15,034,729 |
Total investments, at value (cost $355,884,330)
| 310,728,897 |
Cash
| 117,254 |
Foreign currency, at value (cost $161,792)
| 165,282 |
Deposits with broker for open futures contracts
| 23,425 |
Receivable for investments sold
| 4,039,636 |
Dividends receivable
| 321,151 |
Interest receivable
| 937,710 |
Foreign taxes recoverable
| 25,834 |
Receivable for Portfolio shares sold
| 11,501 |
Receivable for variation margin on open futures contracts
| 463,472 |
Unrealized appreciation on forward foreign currency exchange contracts
| 1,938,591 |
Unrealized appreciation on credit default swap contracts
| 18,112 |
Other assets
| 11,030 |
Total assets
| 318,801,895 |
Liabilities |
Payable upon return of securities loaned
| 5,493,750 |
Payable for investments purchased
| 4,803,569 |
Payable for Portfolio shares redeemed
| 583,221 |
Payable for closed credit default swap contracts
| 3,926 |
Unrealized depreciation on forward foreign currency exchange contracts
| 264,722 |
Unrealized depreciation on credit default swap contracts
| 107 |
Accrued management fee
| 104,307 |
Other accrued expenses and payables
| 382,388 |
Total liabilities
| 11,635,990 |
Net assets, at value | $ 307,165,905 |
Net Assets Consist of |
Undistributed net investment income
| 10,418,830 |
Net unrealized appreciation (depreciation) on:
Investments | (45,155,433) |
Futures | 271,972 |
Credit default swap contracts | 18,005 |
Foreign currency | 1,675,785 |
Accumulated net realized gain (loss)
| (50,973,947) |
Paid-in capital
| 390,910,693 |
Net assets, at value | $ 307,165,905 |
Class A Net Asset Value, offering and redemption price per share ($307,119,228 ÷ 17,697,143 outstanding shares of beneficial interest, $.01 par value, unlimited number of shares authorized)
| $ 17.35 |
Class B Net Asset Value, offering and redemption price per share ($46,677 ÷ 2,694 outstanding shares of beneficial interest, $.01 par value, unlimited number of shares authorized)
| $ 17.33 |
* Represents collateral on securities loaned.The accompanying notes are an integral part of the financial statements.
Statement of Operations for the year ended December 31, 2008
|
Investment Income |
Income:
Dividends (net of foreign taxes withheld of $158,065)
| $ 5,590,844 |
Interest
| 8,359,778 |
Interest — Cash Management QP Trust
| 848,791 |
Securities lending income, including income from Daily Assets Fund Institutional, net of borrower rebates
| 90,758 |
Total Income
| 14,890,171 |
Expenses:
Management fee
| 1,716,044 |
Administration fee
| 267,755 |
Custodian fee
| 332,641 |
Services to shareholders
| 420 |
Distribution service fee (Class B)
| 5,567 |
Record keeping fees (Class B)
| 2,124 |
Professional fees
| 136,591 |
Trustees' fees and expenses
| 51,947 |
Reports to shareholders and shareholder meeting
| 150,922 |
Other
| 87,880 |
Total expenses before expense reductions
| 2,751,891 |
Expense reductions
| (77,536) |
Total expenses after expense reductions
| 2,674,355 |
Net investment income (loss) | 12,215,816 |
Realized and Unrealized Gain (Loss) |
Net realized gain (loss) from:
Investments
| (42,865,467) |
Futures
| (631,031) |
Credit default swap contracts
| (119,513) |
Foreign currency
| (3,763,540) |
Payments by affiliates (see Note I)
| 11,599 |
| (47,367,952) |
Change in net unrealized appreciation (depreciation) on:
Investments
| (94,917,429) |
Futures
| (373,384) |
Credit default swap contracts
| 23,823 |
Unfunded loan commitments
| 545 |
Foreign currency
| 1,568,924 |
| (93,697,521) |
Net gain (loss) | (141,065,473) |
Net increase (decrease) in net assets resulting from operations | $ (128,849,657) |
The accompanying notes are an integral part of the financial statements.
Statement of Changes in Net Assets |
| Years Ended December 31, |
Increase (Decrease) in Net Assets | 2008 | 2007 |
Operations:
Net investment income (loss)
| $ 12,215,816 | $ 17,503,276 |
Net realized gain (loss)
| (47,367,952) | 51,427,436 |
Change in net unrealized appreciation (depreciation)
| (93,697,521) | (39,914,299) |
Net increase (decrease) in net assets resulting from operations
| (128,849,657) | 29,016,413 |
Distributions to shareholders from:
Net investment income:
Class A | (17,655,048) | (18,973,533) |
Class B | (219,769) | (849,365) |
Total distributions
| (17,874,817) | (19,822,898) |
Portfolio share transactions:
Class A Proceeds from shares sold
| 13,590,722 | 13,218,397 |
Reinvestment of distributions
| 17,655,048 | 18,973,533 |
Cost of shares redeemed
| (105,746,417) | (113,345,811) |
Net increase (decrease) in net assets from Class A share transactions
| (74,500,647) | (81,153,881) |
Class B Proceeds from shares sold
| 106,733 | 575,499 |
Reinvestment of distributions
| 219,769 | 849,365 |
Cost of shares redeemed
| (7,155,899) | (25,041,162) |
Net increase (decrease) in net assets from Class B share transactions
| (6,829,397) | (23,616,298) |
Increase (decrease) in net assets | (228,054,518) | (95,576,664) |
Net assets at beginning of period
| 535,220,423 | 630,797,087 |
Net assets at end of period (including undistributed net investment income of $10,418,830 and $17,895,386, respectively)
| $ 307,165,905 | $ 535,220,423 |
Other Information |
Class A Shares outstanding at beginning of period
| 21,278,440 | 24,544,133 |
Shares sold
| 607,834 | 536,248 |
Shares issued to shareholders in reinvestment of distributions
| 782,235 | 792,545 |
Shares redeemed
| (4,971,366) | (4,594,486) |
Net increase (decrease) in Class A shares
| (3,581,297) | (3,265,693) |
Shares outstanding at end of period
| 17,697,143 | 21,278,440 |
Class B Shares outstanding at beginning of period
| 293,818 | 1,244,941 |
Shares sold
| 4,568 | 23,371 |
Shares issued to shareholders in reinvestment of distributions
| 9,716 | 35,405 |
Shares redeemed
| (305,408) | (1,009,899) |
Net increase (decrease) in Class B shares
| (291,124) | (951,123) |
Shares outstanding at end of period
| 2,694 | 293,818 |
The accompanying notes are an integral part of the financial statements.
Financial Highlights
Class A Years Ended December 31, | 2008 | 2007 | 2006 | 2005 | 2004 |
Selected Per Share Data |
Net asset value, beginning of period | $ 24.81 | $ 24.46 | $ 22.75 | $ 22.37 | $ 21.32 |
Income (loss) from investment operations: Net investment incomea | .61 | .74 | .69c | .59 | .47 |
Net realized and unrealized gain (loss) | (7.20) | .42 | 1.60 | .34 | .93 |
Total from investment operations | (6.59) | 1.16 | 2.29 | .93 | 1.40 |
Less distributions from: Net investment income | (.87) | (.81) | (.58) | (.55) | (.35) |
Net asset value, end of period | $ 17.35 | $ 24.81 | $ 24.46 | $ 22.75 | $ 22.37 |
Total Return (%)
| (27.33)b | 4.84b | 10.24b,c | 4.30b | 6.64 |
Ratios to Average Net Assets and Supplemental Data |
Net assets, end of period ($ millions)
| 307 | 528 | 600 | 653 | 622 |
Ratio of expenses before expense reductions (%)
| .64 | .52 | .55 | .55 | .59 |
Ratio of expenses after expense reductions (%)
| .62 | .51 | .51 | .53 | .59 |
Ratio of net investment income (%)
| 2.83 | 3.00 | 2.99c | 2.66 | 2.18 |
Portfolio turnover rate (%)
| 263 | 199 | 108 | 122 | 140 |
a Based on average shares outstanding during the period.
b Total return would have been lower had certain expenses not been reduced.
c Includes non-recurring income from the Advisor recorded as a result of an administrative proceeding regarding disclosure of brokerage allocation practices in connection with sales of DWS Funds. The non-recurring income resulted in an increase in net investment income of $0.024 per share and an increase in the ratio of net investment income of 0.10%. Excluding this non-recurring income, total return would have been 0.10% lower.
|
Class B Years Ended December 31, | 2008 | 2007 | 2006 | 2005 | 2004 |
Selected Per Share Data |
Net asset value, beginning of period | $ 24.78 | $ 24.43 | $ 22.72 | $ 22.33 | $ 21.28 |
Income (loss) from investment operations: Net investment incomea | .53 | .65 | .60c | .51 | .39 |
Net realized and unrealized gain (loss) | (7.20) | .41 | 1.60 | .35 | .92 |
Total from investment operations | (6.67) | 1.06 | 2.20 | .86 | 1.31 |
Less distributions from: Net investment income | (.78) | (.71) | (.49) | (.47) | (.26) |
Net asset value, end of period | $ 17.33 | $ 24.78 | $ 24.43 | $ 22.72 | $ 22.33 |
Total Return (%)
| (27.65)b | 4.43b | 9.82b,c | 3.90b | 6.26 |
Ratios to Average Net Assets and Supplemental Data |
Net assets, end of period ($ millions)
| .05 | 7 | 30 | 34 | 33 |
Ratio of expenses before expense reductions (%)
| .96 | .89 | .93 | .95 | .97 |
Ratio of expenses after expense reductions (%)
| .93 | .88 | .89 | .91 | .97 |
Ratio of net investment income (%)
| 2.52 | 2.63 | 2.61c | 2.28 | 1.80 |
Portfolio turnover rate (%)
| 263 | 199 | 108 | 122 | 140 |
a Based on average shares outstanding during the period.
b Total return would have been lower had certain expenses not been reduced.
c Includes non-recurring income from the Advisor recorded as a result of an administrative proceeding regarding disclosure of brokerage allocation practices in connection with sales of DWS Funds. The non-recurring income resulted in an increase in net investment income of $0.024 per share and an increase in the ratio of net investment income of 0.10%. Excluding this non-recurring income, total return would have been 0.10% lower.
|
Performance Summary December 31, 2008
DWS Blue Chip VIP
All performance shown is historical, assumes reinvestment of all dividend and capital gain distributions and does not guarantee future results. Investment return and principal value fluctuate with changing market conditions so that, when redeemed, shares may be worth more or less than their original cost. Current performance may be lower or higher than the performance data quoted. Please contact your participating insurance company for the Portfolio's most recent month-end performance. Performance doesn't reflect charges and fees ("contract charges") associated with the separate account that invests in the Portfolio or any variable life insurance policy or variable annuity contract for which the Portfolio is an investment option. These charges and fees will reduce returns. While all share classes have the same underlying portfolio, their performance will differ.
The total annual Portfolio operating expense ratios, gross of any fee waivers or expense reimbursements, as stated in the fee table of the prospectus dated May 1, 2008 are 0.71% and 0.96% for Class A and Class B shares, respectively. Please see the Information About Your Portfolio's Expenses, the Financial Highlights and Notes to the Financial Statements (Note C, Related Parties) sections of this report for gross and net expense related disclosure for the period ended December 31, 2008.
Risk Considerations
This Portfolio is subject to stock market risk, meaning stocks in the Portfolio may decline in value for extended periods of time due to the activities and financial prospects of individual companies, or due to general market and economic conditions. It may focus its investments on certain economic sectors, thereby increasing its vulnerability to any single economic, political or regulatory development. This may result in greater share price volatility. Derivatives may be more volatile and less liquid than traditional securities, and the Portfolio could suffer losses on its derivative positions. Please read this Portfolio's prospectus for specific details regarding its investments and risk profile.
Portfolio returns shown during all periods reflect a fee waiver and/or expense reimbursement. Without this waiver/reimbursement, returns would have been lower.
Growth of an Assumed $10,000 Investment in DWS Blue Chip VIP |
[] DWS Blue Chip VIP — Class A [] Russell 1000® Index | The Russell 1000® Index is an unmanaged index that measures the performance of the 1,000 largest companies in the Russell 3000® Index, which measures the performance of the 3,000 largest US companies based on total market capitalization. The Russell 1000 Index represents approximately 92% of the total market capitalization of the Russell 3000 Index. Index returns assume reinvestment of dividends and, unlike portfolio returns, do not reflect any fees or expenses. It is not possible to invest directly into an index. |
 | |
Yearly periods ended December 31 |
|
Comparative Results |
DWS Blue Chip VIP | 1-Year | 3-Year | 5-Year | 10-Year |
Class A | Growth of $10,000
| $6,151 | $7,362 | $9,402 | $9,054 |
Average annual total return
| -38.49% | -9.71% | -1.23% | -.99% |
Russell 1000 Index
| Growth of $10,000
| $6,240 | $7,621 | $9,022 | $8,963 |
Average annual total return
| -37.60% | -8.66% | -2.04% | -1.09% |
DWS Blue Chip VIP | 1-Year | 3-Year | 5-Year | Life of Class* |
Class B | Growth of $10,000
| $6,152 | $7,310 | 9,264 | $10,681 |
Average annual total return
| -38.48% | -9.92% | -1.52% | 1.02% |
Russell 1000 Index
| Growth of $10,000
| $6,240 | $7,621 | $9,022 | $10,532 |
Average annual total return
| -37.60% | -8.66% | -2.04% | .80% |
The growth of $10,000 is cumulative.
* The Portfolio commenced offering Class B shares on July 1, 2002. Index returns began on June 30, 2002.Information About Your Portfolio's Expenses
DWS Blue Chip VIP
As an investor of the Portfolio, you incur two types of costs: ongoing expenses and transaction costs. Ongoing expenses include management fees, distribution and service (12b-1) fees and other Portfolio expenses. Examples of transaction costs include contract charges, redemption fees and account maintenance fees, which are not shown in this section. The following tables are intended to help you understand your ongoing expenses (in dollars) of investing in the Portfolio and to help you compare these expenses with the ongoing expenses of investing in other mutual funds. In the most recent six-month period, the Portfolio limited these expenses; had it not done so, expenses would have been higher. The example in the table is based on an investment of $1,000 invested at the beginning of the six-month period and held for the entire period (July 1, 2008 to December 31, 2008).
The tables illustrate your Portfolio's expenses in two ways:
• Actual Portfolio Return. This helps you estimate the actual dollar amount of ongoing expenses (but not transaction costs) paid on a $1,000 investment in the Portfolio using the Portfolio's actual return during the period. To estimate the expenses you paid over the period, simply divide your account value by $1,000 (for example, an $8,600 account value divided by $1,000 = 8.6), then multiply the result by the number in the "Expenses Paid per $1,000" line under the share class you hold.
• Hypothetical 5% Portfolio Return. This helps you to compare your Portfolio's ongoing expenses (but not transaction costs) with those of other mutual funds using the Portfolio's actual expense ratio and a hypothetical rate of return of 5% per year before expenses. Examples using a 5% hypothetical Portfolio return may be found in the shareholder reports of other mutual funds. The hypothetical account values and expenses may not be used to estimate the actual ending account balance or expenses you paid for the period.
Please note that the expenses shown in these tables are meant to highlight your ongoing expenses only and do not reflect any transaction costs. The "Expenses Paid per $1,000" line of the tables is useful in comparing ongoing expenses only and will not help you determine the relative total expense of owning different funds. If these transaction costs had been included, your costs would have been higher.
Expenses and Value of a $1,000 Investment for the six months ended December 31, 2008 |
Actual Portfolio Return | Class A | | Class B | |
Beginning Account Value 7/1/08
| $ 1,000.00 | | $ 1,000.00 | |
Ending Account Value 12/31/08
| $ 691.80 | | $ 693.40 | |
Expenses Paid per $1,000*
| $ 3.27 | | $ 5.02 | |
Hypothetical 5% Portfolio Return | Class A | | Class B | |
Beginning Account Value 7/1/08
| $ 1,000.00 | | $ 1,000.00 | |
Ending Account Value 12/31/08
| $ 1,021.27 | | $ 1,019.20 | |
Expenses Paid per $1,000*
| $ 3.91 | | $ 5.99 | |
* Expenses are equal to the Portfolio's annualized expense ratio for each share class, multiplied by the average account value over the period, multiplied by the number of days in the most recent six-month period, then divided by 366.Annualized Expense Ratios | Class A | | Class B | |
DWS Variable Series II — DWS Blue Chip VIP
| .77% | | 1.18% | |
For more information, please refer to the Portfolio's prospectus.
These tables do not reflect charges and fees ("contract charges") associated with the separate account that invests in the Portfolio or any variable life insurance policy or variable annuity contract for which the Portfolio is an investment option.
Management Summary December 31, 2008
DWS Blue Chip VIP
The year just ended was the worst in many decades for the US equity markets. Essentially all equity indices posted negative returns for this period, as markets reflected economic problems including a housing slump, rising unemployment, a crisis of confidence and an extreme credit crunch. The Russell 3000® Index, which is generally regarded as a good indicator of the broad stock market, had a return of -37.31% for the 12 months ended December 31, 2008. With a return of -38.49% (Class A shares, unadjusted for contract charges), the Portfolio's return was in line with that of its benchmark, the Russell 1000® Index, which posted a return of -37.60%.
The major contributors to the Portfolio's performance were underweights and stock selection in the financials and consumer discretionary sectors.1 In the financials sector, the Portfolio's performance benefited from not owning many of the worst-performing stocks. In the consumer discretionary sector, performance benefited from overweight positions in The DIRECTV Group, Inc., AutoZone, Inc. and McDonald's Corp.
The major detractors from the Portfolio's performance relative to its benchmark were stock selection in the energy and materials sectors. In the energy sector, performance was hurt by an underweight position in ExxonMobil Corp., which was down less than the sector, and by overweights in coal producers Walter Industries, Inc. and Massey Energy Co. In the materials sector, overweight positions in Terra Industries, Inc. and CF Industries Holdings, Inc., both of which produce fertilizer and other agricultural products, detracted from performance.
Robert Wang, Julie Abbett and James B. Francis, CFA
Portfolio Managers, Deutsche Investment Management Americas Inc.
The Russell 3000 Index is an unmanaged index that measures the performance of the 3,000 largest US companies based on total market capitalization, which represents approximately 98% of the investable US equity market.
The Russell 1000 Index is an unmanaged index that measures the performance of the 1,000 largest companies in the Russell 3000 Index, which measures the performance of the 3,000 largest US companies based on total market capitalization. The Russell 1000 Index represents approximately 92% of the total market capitalization of the Russell 3000 Index.
Index returns assume the reinvestment of dividends and, unlike portfolio returns, do not reflect any fees or expenses. It is not possible to invest directly into an index.
1 "Overweight" means the portfolio holds a higher weighting in a given sector or security than the benchmark. "Underweight" means the portfolio holds a lower weighting.Portfolio management market commentary is as of December 31, 2008, and may not come to pass. This information is subject to change at any time based on market and other conditions. Past performance does not guarantee future results. Current and future portfolio holdings are subject to risk.
Portfolio Summary
DWS Blue Chip VIP
Asset Allocation (As a % of Investment Portfolio excluding Securities Lending Collateral) | 12/31/08 | 12/31/07 |
| | |
Common Stocks | 99% | 97% |
Government & Agency Obligation | 1% | — |
Cash Equivalents | — | 3% |
| 100% | 100% |
Sector Diversification (As a % of Common Stocks) | 12/31/08 | 12/31/07 |
|
| |
Health Care | 17% | 14% |
Information Technology | 16% | 15% |
Industrials | 14% | 13% |
Consumer Staples | 13% | 9% |
Energy | 11% | 14% |
Financials | 11% | 15% |
Consumer Discretionary | 10% | 11% |
Telecommunication Services | 4% | 4% |
Materials | 2% | 3% |
Utilities | 2% | 2% |
| 100% | 100% |
Asset allocation and sector diversification are subject to change.
For more complete details about the Portfolio's investment portfolio, see page 50. A complete list of portfolio holdings of the portfolio is posted as of the month end on www.dws-investments.com on or about the 15th day of the following month. More frequent posting of portfolio holdings information may be made from time to time on www.dws-investments.com.
Following the Portfolio's fiscal first and third quarter-end, a complete portfolio holdings listing is filed with the SEC on Form N-Q. The form will be available on the SEC's Web site at www.sec.gov, and it also may be reviewed and copied at the SEC's Public Reference Room in Washington, D.C. Information on the operation of the SEC's Public Reference Room may be obtained by calling (800) SEC-0330.
Investment Portfolio December 31, 2008
DWS Blue Chip VIP
| Shares | Value ($) |
| |
Common Stocks 99.1% |
Consumer Discretionary 9.8% |
Auto Components 0.1% |
Autoliv, Inc. | 3,100 | 66,526 |
Lear Corp.* | 22,900 | 32,289 |
| 98,815 |
Hotels Restaurants & Leisure 1.8% |
McDonald's Corp. | 22,300 | 1,386,837 |
Yum! Brands, Inc. | 15,200 | 478,800 |
| 1,865,637 |
Household Durables 0.3% |
Leggett & Platt, Inc. | 17,800 | 270,382 |
Internet & Catalog Retail 0.3% |
Amazon.com, Inc.* | 6,600 | 338,448 |
Leisure Equipment & Products 0.2% |
Hasbro, Inc. | 7,900 | 230,443 |
Media 3.6% |
Comcast Corp. "A" | 103,700 | 1,750,456 |
Comcast Corp., Special "A" | 27,600 | 445,740 |
DISH Network Corp. "A"* | 19,900 | 220,691 |
Liberty Media Corp. — Entertainment "A"* | 8,100 | 141,588 |
The DIRECTV Group, Inc.* | 57,600 | 1,319,616 |
| 3,878,091 |
Specialty Retail 3.4% |
AutoZone, Inc.* | 6,900 | 962,343 |
Best Buy Co., Inc. | 31,000 | 871,410 |
Children's Place Retail Stores, Inc.* | 3,100 | 67,208 |
RadioShack Corp. | 30,400 | 362,976 |
Rent-A-Center, Inc.* | 6,700 | 118,255 |
The Gap, Inc. | 33,800 | 452,582 |
TJX Companies, Inc. | 39,700 | 816,629 |
| 3,651,403 |
Textiles, Apparel & Luxury Goods 0.1% |
Quiksilver, Inc.* | 18,100 | 33,304 |
Wolverine World Wide, Inc. | 3,200 | 67,328 |
| 100,632 |
Consumer Staples 12.9% |
Beverages 1.5% |
Pepsi Bottling Group, Inc. | 10,300 | 231,853 |
PepsiCo, Inc. | 24,700 | 1,352,819 |
| 1,584,672 |
Food & Staples Retailing 4.0% |
Kroger Co. | 55,700 | 1,471,037 |
Pantry, Inc.* | 1,600 | 34,320 |
Sysco Corp. | 14,100 | 323,454 |
Wal-Mart Stores, Inc. (a) | 44,000 | 2,466,640 |
| 4,295,451 |
Food Products 1.7% |
Archer-Daniels-Midland Co. | 7,600 | 219,108 |
Bunge Ltd. (a) | 5,500 | 284,735 |
Chiquita Brands International, Inc.* | 15,000 | 221,700 |
Darling International, Inc.* | 10,400 | 57,096 |
Fresh Del Monte Produce, Inc.* | 11,100 | 248,862 |
General Mills, Inc. | 12,000 | 729,000 |
| 1,760,501 |
| Shares | Value ($) |
| |
Household Products 3.6% |
Church & Dwight Co., Inc. | 1,900 | 106,628 |
Colgate-Palmolive Co. | 30,900 | 2,117,886 |
Procter & Gamble Co. | 26,500 | 1,638,230 |
| 3,862,744 |
Personal Products 0.2% |
Herbalife Ltd. | 8,700 | 188,616 |
Tobacco 1.9% |
Altria Group, Inc. | 57,000 | 858,420 |
Philip Morris International, Inc. | 27,900 | 1,213,929 |
| 2,072,349 |
Energy 11.4% |
Oil, Gas & Consumable Fuels |
Alpha Natural Resources, Inc.* | 12,100 | 195,899 |
Apache Corp. | 26,500 | 1,975,045 |
Arch Coal, Inc. | 20,500 | 333,945 |
Chevron Corp. | 11,000 | 813,670 |
Cimarex Energy Co. | 18,700 | 500,786 |
ConocoPhillips | 5,300 | 274,540 |
Encore Acquisition Co.* | 23,900 | 609,928 |
ExxonMobil Corp. | 8,740 | 697,714 |
Frontline Ltd. (a) | 30,800 | 911,988 |
Hess Corp. | 31,200 | 1,673,568 |
Mariner Energy, Inc.* | 25,300 | 258,060 |
Massey Energy Co. | 27,600 | 380,604 |
McMoRan Exploration Co.* (a) | 31,000 | 303,800 |
Occidental Petroleum Corp. | 35,400 | 2,123,646 |
W&T Offshore, Inc. | 20,100 | 287,832 |
Walter Industries, Inc. | 44,900 | 786,199 |
| 12,127,224 |
Financials 11.3% |
Capital Markets 2.3% |
Bank of New York Mellon Corp. | 63,200 | 1,790,456 |
State Street Corp. | 18,200 | 715,806 |
| 2,506,262 |
Commercial Banks 2.1% |
Banco Itau Holding Financeira SA (ADR) (Preferred) | 27,500 | 319,000 |
Unibanco — Uniao de Bancos Brasileiros SA (GDR) | 6,900 | 445,878 |
Wells Fargo & Co. | 50,600 | 1,491,688 |
| 2,256,566 |
Consumer Finance 0.1% |
Cash America International, Inc. | 2,600 | 71,110 |
Diversified Financial Services 2.3% |
JPMorgan Chase & Co. | 77,600 | 2,446,728 |
Insurance 4.0% |
ACE Ltd. | 36,300 | 1,920,996 |
Aflac, Inc. | 6,300 | 288,792 |
Allied World Assurance Co. Holdings Ltd. | 2,500 | 101,500 |
Aon Corp. | 8,100 | 370,008 |
Arch Capital Group Ltd.* | 1,200 | 84,120 |
Arthur J. Gallagher & Co. | 2,900 | 75,139 |
Assurant, Inc. | 4,100 | 123,000 |
Berkshire Hathaway, Inc. "B"* | 200 | 642,800 |
The Travelers Companies, Inc. | 7,600 | 343,520 |
| Shares | Value ($) |
| |
Unum Group | 5,100 | 94,860 |
XL Capital Ltd. "A" (a) | 57,700 | 213,490 |
| 4,258,225 |
Real Estate Investment Trusts 0.5% |
Boston Properties, Inc. (REIT) | 1,800 | 99,000 |
Essex Property Trust, Inc. (REIT) | 2,100 | 161,175 |
Rayonier, Inc. (REIT) | 4,200 | 131,670 |
Simon Property Group, Inc. (REIT) | 1,900 | 100,947 |
| 492,792 |
Health Care 16.5% |
Biotechnology 2.7% |
Amgen, Inc.* | 2,500 | 144,375 |
Gilead Sciences, Inc.* | 40,300 | 2,060,942 |
OSI Pharmaceuticals, Inc.* | 17,800 | 695,090 |
| 2,900,407 |
Health Care Equipment & Supplies 2.9% |
Baxter International, Inc. | 29,600 | 1,586,264 |
Becton, Dickinson & Co. | 16,000 | 1,094,240 |
Covidien Ltd. | 6,800 | 246,432 |
Kinetic Concepts, Inc.* | 2,900 | 55,622 |
Varian Medical Systems, Inc.* | 1,500 | 52,560 |
| 3,035,118 |
Health Care Providers & Services 4.6% |
Aetna, Inc. | 60,200 | 1,715,700 |
Express Scripts, Inc.* | 27,600 | 1,517,448 |
Humana, Inc.* | 15,100 | 562,928 |
Kindred Healthcare, Inc.* | 6,100 | 79,422 |
Magellan Health Services, Inc.* | 800 | 31,328 |
Medco Health Solutions, Inc.* | 23,100 | 968,121 |
Universal Health Services, Inc. "B" | 1,800 | 67,626 |
| 4,942,573 |
Pharmaceuticals 6.3% |
Abbott Laboratories | 14,900 | 795,213 |
Eli Lilly & Co. | 48,500 | 1,953,095 |
Johnson & Johnson | 13,200 | 789,756 |
Merck & Co., Inc. | 28,200 | 857,280 |
Perrigo Co. | 1,300 | 42,003 |
Pfizer, Inc. | 32,400 | 573,804 |
Schering-Plough Corp. | 81,800 | 1,393,054 |
Sepracor, Inc.* | 7,700 | 84,546 |
Teva Pharmaceutical Industries Ltd. (ADR) | 3,900 | 166,023 |
| 6,654,774 |
Industrials 13.5% |
Aerospace & Defense 3.4% |
General Dynamics Corp. | 11,200 | 645,008 |
Goodrich Corp. | 11,200 | 414,624 |
Honeywell International, Inc. | 46,800 | 1,536,444 |
L-3 Communications Holdings, Inc. | 7,300 | 538,594 |
Lockheed Martin Corp. | 2,900 | 243,832 |
Northrop Grumman Corp. | 5,800 | 261,232 |
Spirit AeroSystems Holdings, Inc. "A"* | 4,200 | 42,714 |
| 3,682,448 |
Commercial Services & Supplies 0.3% |
The Brink's Co. | 11,700 | 314,496 |
Construction & Engineering 1.6% |
Chicago Bridge & Iron Co. NV (NY Registered Shares) | 3,400 | 34,170 |
EMCOR Group, Inc.* | 18,500 | 414,955 |
| Shares | Value ($) |
| |
Fluor Corp. | 12,900 | 578,823 |
Foster Wheeler Ltd.* | 17,300 | 404,474 |
Perini Corp.* | 10,700 | 250,166 |
| 1,682,588 |
Electrical Equipment 1.1% |
Acuity Brands, Inc. | 1,500 | 52,365 |
Energy Conversion Devices, Inc.* | 13,300 | 335,293 |
GrafTech International Ltd.* | 87,000 | 723,840 |
Woodward Governor Co. | 2,400 | 55,248 |
| 1,166,746 |
Industrial Conglomerates 0.1% |
General Electric Co. | 6,200 | 100,440 |
Machinery 4.3% |
AGCO Corp.* | 26,400 | 622,776 |
Caterpillar, Inc. | 27,800 | 1,241,826 |
CNH Global NV | 4,000 | 62,400 |
Cummins, Inc. | 23,900 | 638,847 |
Dover Corp. | 2,500 | 82,300 |
Flowserve Corp. | 7,300 | 375,950 |
Gardner Denver, Inc.* | 1,700 | 39,678 |
Joy Global, Inc. | 11,000 | 251,790 |
Parker Hannifin Corp. | 27,600 | 1,174,104 |
Trinity Industries, Inc. | 6,200 | 97,712 |
| 4,587,383 |
Road & Rail 2.7% |
Burlington Northern Santa Fe Corp. | 14,500 | 1,097,795 |
Norfolk Southern Corp. | 16,900 | 795,145 |
Ryder System, Inc. | 25,400 | 985,012 |
| 2,877,952 |
Information Technology 15.5% |
Communications Equipment 0.3% |
Cisco Systems, Inc.* | 20,900 | 340,670 |
Computers & Peripherals 6.7% |
Hewlett-Packard Co. | 61,900 | 2,246,351 |
International Business Machines Corp. | 27,600 | 2,322,816 |
Lexmark International, Inc. "A"* | 32,700 | 879,630 |
QLogic Corp.* | 43,000 | 577,920 |
Western Digital Corp.* | 93,200 | 1,067,140 |
| 7,093,857 |
Electronic Equipment, Instruments & Components 0.4% |
Dolby Laboratories, Inc. "A"* (a) | 3,600 | 117,936 |
Jabil Circuit, Inc. | 43,100 | 290,925 |
| 408,861 |
Internet Software & Services 1.5% |
eBay, Inc.* | 18,600 | 259,656 |
Google, Inc. "A"* | 4,000 | 1,230,600 |
Yahoo!, Inc.* | 4,700 | 57,340 |
| 1,547,596 |
IT Services 3.6% |
Accenture Ltd. "A" | 32,200 | 1,055,838 |
Automatic Data Processing, Inc. | 26,900 | 1,058,246 |
Computer Sciences Corp.* | 21,400 | 751,996 |
Visa, Inc. "A" | 18,100 | 949,345 |
| 3,815,425 |
Software 3.0% |
Microsoft Corp. | 157,300 | 3,057,912 |
Symantec Corp.* | 13,800 | 186,576 |
| 3,244,488 |
| Shares | Value ($) |
| |
Materials 2.4% |
Chemicals |
CF Industries Holdings, Inc. | 22,200 | 1,091,352 |
Terra Industries, Inc. | 82,000 | 1,366,940 |
The Mosaic Co. | 2,800 | 96,880 |
| 2,555,172 |
Telecommunication Services 4.0% |
Diversified Telecommunication Services |
AT&T, Inc. | 46,700 | 1,330,950 |
Embarq Corp. | 24,000 | 863,040 |
Verizon Communications, Inc. | 59,400 | 2,013,660 |
| 4,207,650 |
Utilities 1.8% |
Electric Utilities 0.6% |
Duke Energy Corp. | 3,000 | 45,030 |
Edison International | 9,300 | 298,716 |
Hawaiian Electric Industries, Inc. | 1,300 | 28,782 |
Pepco Holdings, Inc. | 5,700 | 101,232 |
Portland General Electric Co. | 1,700 | 33,099 |
Southern Co. | 4,300 | 159,100 |
| 665,959 |
Gas Utilities 0.3% |
Atmos Energy Corp. | 1,800 | 42,660 |
ONEOK, Inc. | 7,300 | 212,576 |
UGI Corp. | 1,500 | 36,630 |
| 291,866 |
Independent Power Producers & Energy Traders 0.4% |
AES Corp.* | 51,400 | 423,536 |
| Shares | Value ($) |
| |
Multi-Utilities 0.5% |
Dominion Resources, Inc. | 8,500 | 304,640 |
Integrys Energy Group, Inc. | 1,400 | 60,172 |
Sempra Energy | 3,000 | 127,891 |
TECO Energy, Inc. | 2,400 | 29,640 |
| 522,343 |
Total Common Stocks (Cost $137,138,756) | 105,419,439 |
| Principal Amount ($) | Value ($) |
| |
Government & Agency Obligation 0.5% |
US Treasury Obligation |
US Treasury Bill, 0.17%**, 1/15/2009 (b) (Cost $508,951) | 509,000 | 508,997 |
| Shares | Value ($) |
| |
Securities Lending Collateral 3.7% |
Daily Assets Fund Institutional, 1.69% (c) (d) (Cost $3,998,652) | 3,998,652 | 3,998,652 |
|
Cash Equivalents 0.4% |
Cash Management QP Trust, 1.42% (c) (Cost $391,004) | 391,004 | 391,004 |
| % of Net Assets | Value ($) |
| |
Total Investment Portfolio (Cost $142,037,363)+ | 103.7 | 110,318,092 |
Other Assets and Liabilities, Net | (3.7) | (3,950,560) |
Net Assets | 100.0 | 106,367,532 |
* Non-income producing security.** Annualized yield at time of purchase; not a coupon rate.+ The cost for federal income tax purposes was $145,284,545. At December 31, 2008, net unrealized depreciation for all securities based on tax cost was $34,966,453. This consisted of aggregate gross unrealized appreciation for all securities in which there was an excess of value over tax cost of $4,176,823 and aggregate gross unrealized depreciation for all securities in which there was an excess of tax cost over value of $39,143,276.(a) All or a portion of these securities were on loan (see Notes to Financial Statements). The value of all securities loaned at December 31, 2008 amounted to $3,967,514, which is 3.7% of net assets.(b) At December 31, 2008, this security has been pledged, in whole or in part, to cover initial margin requirements for open futures contracts.(c) Affiliated fund managed by Deutsche Investment Management Americas Inc. The rate shown is the annualized seven-day yield at period end.(d) Represents collateral held in connection with securities lending. Income earned by the Portfolio is net of borrower rebates.ADR: American Depositary Receipt
GDR: Global Depositary Receipt
REIT: Real Estate Investment Trust
At December 31, 2008, open futures contracts purchased were as follows:
Futures | Expiration Date | Contracts | Aggregate Face Value ($) | Value ($) | Unrealized Appreciation ($) |
S&P 500 Index
| 3/20/2009 | 18 | 796,812 | 810,090 | 13,278 |
Fair Value Measurements
The following is a summary of the inputs used as of December 31, 2008 in valuing the Portfolio's investments. For information on the Portfolio's policy regarding the valuation of investments and of the valuation inputs, and the aggregate levels used in the table below, please refer to the Security Valuation section of Note A in the accompanying Notes to the Financial Statements.
Valuation Inputs | Investments in Securities | Other Financial Instruments++ |
Level 1
| $ 109,418,091 | $ 13,278 |
Level 2
| 900,001 | — |
Level 3
| — | — |
Total | $ 110,318,092 | $ 13,278 |
++ Other financial instruments are derivative instruments not reflected in the Investment Portfolio, such as future contracts, which are valued at the unrealized appreciation (depreciation) on the instrument.The accompanying notes are an integral part of the financial statements.
Financial Statements
Statement of Assets and Liabilities as of December 31, 2008
|
Assets |
Investments:
Investments in securities, at value (cost $137,647,707 — including $3,967,514 of securities loaned) | $ 105,928,436 |
Investment in Daily Assets Fund Institutional (cost $3,998,652)* | 3,998,652 |
Investment in Cash Management QP Trust (cost $391,004) | 391,004 |
Total investments, at value (cost $142,037,363)
| 110,318,092 |
Foreign currency, at value (cost $2,166)
| 1,799 |
Dividends receivable
| 166,218 |
Interest receivable
| 7,465 |
Receivable for Portfolio shares sold
| 138,879 |
Receivable for daily variation margin on open futures contracts
| 15,886 |
Other assets
| 4,951 |
Total assets
| 110,653,290 |
Liabilities |
Payable for Portfolio shares redeemed
| 130,960 |
Payable upon return of securities loaned
| 3,998,652 |
Accrued management fee
| 44,971 |
Other accrued expenses and payables
| 111,175 |
Total liabilities
| 4,285,758 |
Net assets, at value | $ 106,367,532 |
Net Assets Consist of |
Undistributed net investment income
| 1,989,745 |
Net unrealized appreciation (depreciation) on:
Investments | (31,719,271) |
Futures | 13,278 |
Foreign currency | (367) |
Accumulated net realized gain (loss)
| (42,126,808) |
Paid-in capital
| 178,210,955 |
Net assets, at value | $ 106,367,532 |
Class A Net Asset Value, offering and redemption price per share ($106,234,053 ÷ 14,644,836 outstanding shares of beneficial interest, $.01 par value, unlimited number of shares authorized)
| $ 7.25 |
Class B Net Asset Value, offering and redemption price per share ($133,479 ÷ 18,379 outstanding shares of beneficial interest, $.01 par value, unlimited number of shares authorized)
| $ 7.26 |
* Represents collateral on securities loaned.The accompanying notes are an integral part of the financial statements.
Statement of Operations for the year ended December 31, 2008
|
Investment Income |
Income:
Dividends (net of foreign taxes withheld of $6,442)
| $ 3,198,442 |
Interest
| 11,205 |
Interest — Cash Management QP Trust
| 112,527 |
Securities lending income, including income from Daily Assets Fund Institutional, net of borrower rebates
| 47,234 |
Total Income
| 3,369,408 |
Expenses:
Management fee
| 1,059,617 |
Administration fee
| 105,793 |
Custodian fee
| 21,180 |
Distribution service fee (Class B)
| 8,244 |
Record keeping fees (Class B)
| 4,171 |
Services to shareholders
| 611 |
Professional fees
| 68,734 |
Trustees' fees and expenses
| 22,463 |
Reports to shareholders and shareholder meeting
| 83,035 |
Other
| 11,869 |
Total expenses before expense reductions
| 1,385,717 |
Expense reductions
| (11,238) |
Total expenses after expense reductions
| 1,374,479 |
Net investment income (loss) | 1,994,929 |
Realized and Unrealized Gain (Loss) |
Net realized gain (loss) from:
Investments
| (34,670,300) |
Futures
| (1,922,293) |
Foreign currency
| 173 |
| (36,592,420) |
Change in net unrealized appreciation (depreciation) on:
Investments
| (46,235,581) |
Futures
| 29,101 |
Foreign currency
| (379) |
| (46,206,859) |
Net gain (loss) | (82,799,279) |
Net increase (decrease) in net assets resulting from operations | $ (80,804,350) |
The accompanying notes are an integral part of the financial statements.
Statement of Changes in Net Assets |
| Year Ended December 31, |
Increase (Decrease) in Net Assets | 2008 | 2007 |
Operations:
Net investment income (loss)
| $ 1,994,929 | $ 3,464,188 |
Net realized gain (loss)
| (36,592,420) | 33,055,813 |
Change in net unrealized appreciation (depreciation)
| (46,206,859) | (21,646,324) |
Net increase (decrease) in net assets resulting from operations
| (80,804,350) | 14,873,677 |
Distributions to shareholders from:
Net investment income:
Class A | (3,297,531) | (3,290,254) |
Class B | (117,139) | (315,334) |
Net realized gain:
Class A | (35,917,893) | (34,899,465) |
Class B | (1,664,515) | (5,204,548) |
Total distributions
| (40,997,078) | (43,709,601) |
Portfolio share transactions:
Class A Proceeds from shares sold
| 5,194,608 | 16,482,598 |
Reinvestment of distributions
| 39,215,424 | 38,189,719 |
Cost of shares redeemed
| (60,894,125) | (100,561,920) |
Net increase (decrease) in net assets from Class A share transactions
| (16,484,093) | (45,889,603) |
Class B Proceeds from shares sold
| 238,193 | 5,401,154 |
Reinvestment of distributions
| 1,781,654 | 5,519,882 |
Cost of shares redeemed
| (10,423,558) | (42,573,159) |
Net increase (decrease) in net assets from Class B share transactions
| (8,403,711) | (31,652,123) |
Increase (decrease) in net assets | (146,689,232) | (106,377,650) |
Net assets at beginning of period
| 253,056,764 | 359,434,414 |
Net assets at end of period (including undistributed net investment income of $1,989,745 and $3,469,179, respectively)
| $ 106,367,532 | $ 253,056,764 |
Other Information |
Class A Shares outstanding at beginning of period
| 16,515,920 | 19,412,716 |
Shares sold
| 519,469 | 1,075,933 |
Shares issued to shareholders in reinvestment of distributions
| 3,731,248 | 2,657,601 |
Shares redeemed
| (6,121,801) | (6,630,330) |
Net increase (decrease) in Class A shares
| (1,871,084) | (2,896,796) |
Shares outstanding at end of period
| 14,644,836 | 16,515,920 |
Class B Shares outstanding at beginning of period
| 755,480 | 2,824,828 |
Shares sold
| 18,580 | 372,774 |
Shares issued to shareholders in reinvestment of distributions
| 169,520 | 384,392 |
Shares redeemed
| (925,201) | (2,826,514) |
Net increase (decrease) in Class B shares
| (737,101) | (2,069,348) |
Shares outstanding at end of period
| 18,379 | 755,480 |
The accompanying notes are an integral part of the financial statements.
Financial Highlights
Class A Years Ended December 31, | 2008 | 2007 | 2006 | 2005 | 2004 |
Selected Per Share Data |
Net asset value, beginning of period | $ 14.65 | $ 16.17 | $ 14.88 | $ 13.65 | $ 11.84 |
Income (loss) from investment operations: Net investment incomea | .12 | .17 | .17c | .14 | .13 |
Net realized and unrealized gain (loss) | (4.97) | .36 | 2.07 | 1.22 | 1.76 |
Total from investment operations | (4.85) | .53 | 2.24 | 1.36 | 1.89 |
Less distributions from: Net investment income | (.21) | (.18) | (.14) | (.13) | (.08) |
Net realized gains | (2.34) | (1.87) | (.81) | — | — |
Total distributions | (2.55) | (2.05) | (.95) | (.13) | (.08) |
Net asset value, end of period | $ 7.25 | $ 14.65 | $ 16.17 | $ 14.88 | $ 13.65 |
Total Return (%)
| (38.49)b | 3.50 | 15.65c | 10.06 | 16.04 |
Ratios to Average Net Assets and Supplemental Data |
Net assets, end of period ($ millions)
| 106 | 242 | 314 | 294 | 283 |
Ratio of expenses before expense reductions (%)
| .76 | .71 | .71 | .70 | .70 |
Ratio of expenses after expense reductions (%)
| .76 | .71 | .71 | .70 | .70 |
Ratio of net investment income (%)
| 1.12 | 1.13 | 1.12c | 1.00 | 1.08 |
Portfolio turnover rate (%)
| 127 | 275 | 226 | 288 | 249 |
a Based on average shares outstanding during the period.
b Total return would have been lower had certain expenses not been reduced.
c Includes non-recurring income from the Advisor recorded as a result of an administrative proceeding regarding disclosure of brokerage allocation practices in connection with sales of DWS Funds. The non-recurring income resulted in an increase in net investment income of $0.003 per share and an increase in the ratio of net investment income of 0.02%. Excluding this non-recurring income, total return would have been 0.02% lower.
|
Class B Years Ended December 31, | 2008 | 2007 | 2006 | 2005 | 2004 |
Selected Per Share Data |
Net asset value, beginning of period | $ 14.61 | $ 16.12 | $ 14.83 | $ 13.60 | $ 11.80 |
Income (loss) from investment operations: Net investment incomea | .04 | .11 | .11c | .09 | .09 |
Net realized and unrealized gain (loss) | (4.89) | .36 | 2.07 | 1.22 | 1.74 |
Total from investment operations | (4.85) | .47 | 2.18 | 1.31 | 1.83 |
Less distributions from: Net investment income | (.16) | (.11) | (.08) | (.08) | (.03) |
Net realized gains | (2.34) | (1.87) | (.81) | — | — |
Total distributions | (2.50) | (1.98) | (.89) | (.08) | (.03) |
Net asset value, end of period | $ 7.26 | $ 14.61 | $ 16.12 | $ 14.83 | $ 13.60 |
Total Return (%)
| (38.48)b | 3.15 | 15.19c | 9.68 | 15.55 |
Ratios to Average Net Assets and Supplemental Data |
Net assets, end of period ($ millions)
| .13 | 11 | 46 | 44 | 37 |
Ratio of expenses before expense reductions (%)
| 1.22 | 1.09 | 1.09 | 1.09 | 1.08 |
Ratio of expenses after expense reductions (%)
| 1.21 | 1.09 | 1.09 | 1.09 | 1.08 |
Ratio of net investment income (%)
| .67 | .75 | .74c | .61 | .70 |
Portfolio turnover rate (%)
| 127 | 275 | 226 | 288 | 249 |
a Based on average shares outstanding during the period.
b Total return would have been lower had certain expenses not been reduced.
c Includes non-recurring income from the Advisor recorded as a result of an administrative proceeding regarding disclosure of brokerage allocation practices in connection with sales of DWS Funds. The non-recurring income resulted in an increase in net investment income of $0.003 per share and an increase in the ratio of net investment income of 0.02%. Excluding this non-recurring income, total return would have been 0.02% lower.
|
Performance Summary December 31, 2008
DWS Conservative Allocation VIP
All performance shown is historical, assumes reinvestment of all dividend and capital gain distributions and does not guarantee future results. Investment return and principal value fluctuate with changing market conditions so that, when redeemed, shares may be worth more or less than their original cost. Current performance may be lower or higher than the performance data quoted. Please contact your participating insurance company for the Portfolio's most recent month-end performance. Performance doesn't reflect charges and fees ("contract charges") associated with the separate account that invests in the Portfolio or any variable life insurance policy or variable annuity contract for which the Portfolio is an investment option. These charges and fees will reduce returns.
The total annual Portfolio direct operating expense ratio, gross of any fee waivers or expense reimbursements, as stated in the fee table of the prospectus dated May 1, 2008 is 0.69% for Class B shares. The total Portfolio direct and estimated indirect Underlying DWS Portfolio operating expense ratio, gross of any fee waivers or expense reimbursements, as presented in the fee table of the prospectus dated May 1, 2008 is 1.33% for Class B shares. Please see the Information About Your Portfolio's Expenses, the Financial Highlights and Notes to the Financial Statements (Note C, Related Parties) sections of this report for gross and net expense related disclosure for the period ended December 31, 2008.
Risk Considerations
Diversification does not eliminate risk. The underlying portfolios invest in individual equity and bond funds whose yields and market values fluctuate, so that your investment may be worth more or less that its original cost. In addition, the underlying portfolios are subject to stock market risk, meaning stocks in the Portfolio may decline in value for extended periods of time due to the activities and financial prospects of individual companies, or due to general market and economic conditions. Investing in foreign securities presents certain risks, such as currency fluctuation, political and economic changes, and market risks. Derivatives may be more volatile and less liquid than traditional securities, and the Portfolio could suffer losses on its derivative positions. Bond investments are subject to interest-rate risk such that when interest rates rise, the prices of the bonds, and thus the value of the Portfolio, can decline and the investor can lose principal value. An investment in underlying money market investments is not insured or guaranteed by the Federal Deposit Insurance Corporation or by any government agency. Although money market investments seek to preserve the value of your investment at $1.00 per share, it is possible to lose money by investing in these investments. Please read this Portfolio's prospectus for specific details regarding its risk profile.
Portfolio returns shown for all periods reflect a fee waiver and/or expense reimbursement. Without this waiver/reimbursement, returns would have been lower.
Growth of an Assumed $10,000 Investment in DWS Conservative Allocation VIP from 8/16/2004 to 12/31/2008 |
[] DWS Conservative Allocation VIP — Class B [] Barclays Capital US Aggregate Index [] Russell 1000® Index | The Barclays Capital US Aggregate Index (name changed from Lehman Brothers US Aggregate Index, effective November 3, 2008) is an unmanaged, market value-weighted measure of Treasury issues, agency issues, corporate bond issues and mortgage securities. Index returns, unlike Portfolio returns, do not reflect any fees or expenses. It is not possible to invest directly into an index. The Russell 1000® Index is an unmanaged Index that measures the performance of the 1,000 largest companies in the Russell® 3000 Index, which represents approximately 92% of the total market capitalization of the Russell 3000 Index. Index returns assume reinvestment of dividends and, unlike Portfolio returns, do not reflect any fees or expenses. It is not possible to invest directly into an index. |
 | |
|
|
Comparative Results |
DWS Conservative Allocation VIP | 1-Year | 3-Year | Life of Portfolio* |
Class B | Growth of $10,000
| $7,712 | $8,784 | $9,774 |
Average annual total return
| -22.88% | -4.23% | -.52% |
Barclays Capital US Aggregate Index
| Growth of $10,000
| $10,524 | $11,745 | $12,178 |
Average annual total return
| 5.24% | 5.51% | 4.65% |
Russell 1000 Index
| Growth of $10,000
| $6,240 | $7,621 | $9,005 |
Average annual total return
| -37.60% | -8.66% | -2.39% |
The growth of $10,000 is cumulative.
* The Portfolio commenced operations on August 16, 2004. Index returns began on August 31, 2004.Information About Your Portfolio's Expenses
DWS Conservative Allocation VIP
As an investor of the Portfolio, you incur two types of costs: ongoing expenses and transaction costs. Ongoing expenses include management fees, distribution and service (12b-1) fees and other Portfolio expenses. Examples of transaction costs include contract charges, redemption fees and account maintenance fees, which are not shown in this section. The following tables are intended to help you understand your ongoing expenses (in dollars) of investing in the Portfolio and to help you compare these expenses with the ongoing expenses of investing in other mutual funds. In addition to the ongoing expenses which the Portfolio bears directly, the Portfolio's shareholders indirectly bear the expense of the Underlying DWS Portfolios and non-affiliated funds ("Underlying Portfolios") in which the Portfolio invests. The Portfolio's estimated indirect expense from investing in the Underlying Portfolios is based on the expense ratios from the Underlying Portfolios' most recent shareholder report. In the most recent six-month period, the Portfolio limited these expenses; had it not done so, expenses would have been higher. The example in the table is based on an investment of $1,000 invested at the beginning of the six-month period and held for the entire period (July 1, 2008 to December 31, 2008) .
The tables illustrate your Portfolio's expenses in two ways:
• Actual Portfolio Return. This helps you estimate the actual dollar amount of ongoing expenses (but not transaction costs) paid on a $1,000 investment in the Portfolio using the Portfolio's actual return during the period. To estimate the expenses you paid over the period, simply divide your account value by $1,000 (for example, an $8,600 account value divided by $1,000 = 8.6), then multiply the result by the number in the "Expenses Paid per $1,000" line under the share class you hold.
• Hypothetical 5% Portfolio Return. This helps you to compare your Portfolio's ongoing expenses (but not transaction costs) with those of other mutual funds using the Portfolio's actual expense ratio and a hypothetical rate of return of 5% per year before expenses. Examples using a 5% hypothetical Portfolio return may be found in the shareholder reports of other mutual funds. The hypothetical account values and expenses may not be used to estimate the actual ending account balance or expenses you paid for the period.
Please note that the expenses shown in these tables are meant to highlight your ongoing expenses only and do not reflect any transaction costs. The "Expenses Paid per $1,000" line of the tables is useful in comparing ongoing expenses only and will not help you determine the relative total expense of owning different funds. If these transaction costs had been included, your costs would have been higher.
Direct Portfolio Expenses and Value of a $1,000 Investment for the six months ended December 31, 2008 |
Actual Portfolio Return | | Class B |
Beginning Account Value 7/1/08
| | $ 1,000.00 |
Ending Account Value 12/31/08
| | $ 807.80 |
Expenses Paid per $1,000*
| | $ 3.09 |
Hypothetical 5% Portfolio Return | | Class B |
Beginning Account Value 7/1/08
| | $ 1,000.00 |
Ending Account Value 12/31/08
| | $ 1,021.72 |
Expenses Paid per $1,000*
| | $ 3.46 |
Direct Portfolio Expenses and Acquired Portfolios (Underlying Portfolios) Fees and Expenses and Value of a $1,000 Investment for the six months ended December 31, 2008 |
Actual Portfolio Return | | Class B |
Beginning Account Value 7/1/08
| | $ 1,000.00 |
Ending Account Value 12/31/08
| | $ 807.80 |
Expenses Paid per $1,000**
| | $ 6.18 |
Hypothetical 5% Portfolio Return | | Class B |
Beginning Account Value 7/1/08
| | $ 1,000.00 |
Ending Account Value 12/31/08
| | $ 1,018.30 |
Expenses Paid per $1,000**
| | $ 6.90 |
* Expenses are equal to the Portfolio's annualized expense ratio multiplied by the average account value over the period, multiplied by the number of days in the most recent six-month period, then divided by 366.** Expenses are equal to the Portfolio's annualized expense ratio plus the Acquired Portfolios (Underlying Portfolios) Fees and Expenses, multiplied by the number of days in the most recent six-month period, then divided by 366.Annualized Expense Ratios | | Class B |
Direct Portfolio Expense Ratio
| | .68% |
Acquired Portfolios (Underlying Portfolios) Fees and Expenses
| | .68% |
Net Annual Portfolio and Acquired Portfolios (Underlying Portfolios) Operating Expenses
| | 1.36% |
For more information, please refer to the Portfolio's prospectus.
These tables do not reflect charges and fees ("contract charges") associated with the separate account that invests in the Portfolio or any variable life insurance policy or variable annuity contract for which the Portfolio is an investment option.
Management Summary December 31, 2008
DWS Conservative Allocation VIP
For the 12 months ended December 31, 2008, the DWS Conservative Allocation VIP's Class B shares (unadjusted for contract charges) had a return of -22.88%. For the 12-month period, the Russell 3000® Index, which is generally regarded as a good indicator of the broad stock market, had a return of -37.31%. Since this Portfolio invests in stock and bond funds in several different categories, performance is analyzed by comparing the Portfolio's return with indexes that represent each asset class. The Portfolio's return was below that of its bond benchmark, the Barclays Capital US Aggregate Index, which returned 5.24%, but above the returns of its equity benchmark, the Russell 1000® Index, which returned -37.60%.
There are three major determinants of the Portfolio's performance: strategic asset allocation, tactical asset allocation and the performance of the underlying funds in which the Portfolio's assets are invested. During 2008, strategic asset allocation contributed to the Portfolio's performance relative to its peer group of comparable funds, while tactical asset allocation and performance of the underlying funds detracted.
Strategic asset allocation refers to the longer-term allocation among asset classes. The Portfolio's allocation between equity and fixed-income funds remained close to its target of 40% equity and 60% fixed income during 2008. Tactical allocation decisions are short-term underweights or overweights of particular asset classes relative to their longer-term strategic asset allocation targets.1 Overall tactical asset allocation, with an underweight of cash equivalents and investment-grade bonds balanced by an overweight in large-cap and international equities, detracted from performance, as fixed-income securities performed better than stocks.
Performance of each of the underlying funds is compared to a suitable benchmark for that particular fund's asset class and management style. The underlying funds as a group detracted from performance relative to their respective benchmarks. However, large-cap equity funds added value relative to their peers, as did high-yield funds, although these funds had negative absolute returns.
Inna Okounkova Robert Wang
Portfolio Managers, Deutsche Investment Management Americas Inc.
The Russell 3000 Index measures the performance of the 3,000 largest US companies based on total market capitalization, which represents approximately 98% of the investable US equity market. Index returns assume reinvestment of dividends and, unlike portfolio returns, do not include fees or expenses. It is not possible to invest directly into an index.
The Barclays Capital US Aggregate Index (name changed from Lehman Brothers US Aggregate Index, effective November 3, 2008) is an unmanaged, market value-weighted measure of Treasury issues, agency issues, corporate bond issues and mortgage securities. Index returns, unlike portfolio returns, do not include fees or expenses. It is not possible to invest directly into an index.
The Russell 1000 Index is an unmanaged index that measures the performance of the 1,000 largest companies in the Russell 3000 Index, which represents approximately 92% of the total market capitalization of the Russell 3000 Index. Index returns assume reinvestment of dividends and, unlike portfolio returns, do not include fees or expenses. It is not possible to invest directly into an index.
1 "Overweight" means the portfolio holds a higher weighting in a given sector or security than the benchmark. "Underweight" means the portfolio holds a lower weighting.Portfolio management market commentary is as of December 31, 2008, and may not come to pass. This information is subject to change at any time based on market and other conditions. Past performance does not guarantee future results. Current and future portfolio holdings are subject to risk.
Portfolio Summary
DWS Conservative Allocation VIP
Asset Allocation (As a % of Investment Portfolio) | 12/31/08 | 12/31/07 |
| | |
Fixed Income — Bond Funds | 56% | 46% |
Equity — Equity Funds | 35% | 43% |
Equity — Exchange Traded Funds | 5% | — |
Fixed Income — Money Market Funds | 4% | 11% |
| 100% | 100% |
Target Allocation (As a % of Investment Portfolio) | 12/31/08 | 12/31/07 |
| | |
Fixed Income | 60% | 60% |
Equity | 40% | 40% |
Asset allocation is subject to change.
For more complete details about the Portfolio's investment portfolio, see page 65. A complete list of portfolio holdings of the portfolio is posted as of the month end on www.dws-investments.com on or about the 15th day of the following month. More frequent posting of portfolio holdings information may be made from time to time on www.dws-investments.com.
Following the Portfolio's fiscal first and third quarter-end, a complete portfolio holdings listing is filed with the SEC on Form N-Q. The form will be available on the SEC's Web site at www.sec.gov, and it also may be reviewed and copied at the SEC's Public Reference Room in Washington, D.C. Information on the operation of the SEC's Public Reference Room may be obtained by calling (800) SEC-0330.
Investment Portfolio December 31, 2008
DWS Conservative Allocation VIP
| Shares | Value ($) |
| |
Equity — Equity Funds 35.3% |
DWS Blue Chip VIP "A" | 3,478 | 25,216 |
DWS Capital Growth VIP "A" | 18,954 | 256,833 |
DWS Communications Fund "Institutional" | 1,413 | 13,866 |
DWS Davis Venture Value VIP "A" | 60,842 | 456,920 |
DWS Dreman High Return Equity VIP "A" | 3,403 | 21,132 |
DWS Dreman Small Cap Value Fund "Institutional" | 2,240 | 54,314 |
DWS Dreman Small Mid Cap Value VIP "A" | 29,503 | 233,961 |
DWS Emerging Markets Equity Fund "Institutional" | 6,484 | 66,006 |
DWS Equity 500 Index VIP "A" | 15,256 | 145,693 |
DWS Global Opportunities VIP "A" | 23,488 | 182,971 |
DWS Global Thematic VIP "A" | 28,882 | 168,673 |
DWS Growth & Income VIP "A" | 121,911 | 624,186 |
DWS Health Care VIP "A" | 19,278 | 182,180 |
DWS International Select Equity VIP "A" | 3,974 | 24,720 |
DWS International VIP "A" | 53,261 | 347,260 |
DWS Janus Growth & Income VIP "A" | 12,884 | 87,483 |
DWS Japan Equity Fund "S" | 3,599 | 26,527 |
DWS Large Cap Value VIP "A" | 123,443 | 1,101,115 |
DWS Micro Cap Fund "Institutional" | 1,170 | 11,287 |
DWS Mid Cap Growth VIP "A" | 725 | 4,928 |
DWS RREEF Global Real Estate Securities Fund "Institutional" | 8,167 | 43,940 |
DWS RREEF Real Estate Securities Fund "Institutional" | 773 | 8,594 |
DWS Small Cap Core Fund "S" | 1,400 | 15,331 |
DWS Small Cap Growth VIP "A" | 12,250 | 93,220 |
DWS Small Cap Index VIP "A" | 12,905 | 111,370 |
DWS Technology VIP "A" | 28,582 | 164,633 |
Total Equity Funds (Cost $7,651,779) | 4,472,359 |
|
Equity — Exchange Traded Funds 4.6% |
Consumer Discretionary Select Sector SPDR Fund | 1,812 | 39,085 |
Consumer Staples Select Sector SPDR Fund | 2,203 | 52,586 |
| Shares | Value ($) |
| |
Energy Select Sector SPDR Fund | 600 | 28,704 |
Financial Select Sector SPDR Fund | 3,609 | 45,546 |
Industrial Select Sector SPDR Fund | 2,516 | 59,076 |
iShares MSCI Australia Index Fund | 2,719 | 38,093 |
iShares MSCI Canada Index Fund | 4,964 | 86,523 |
iShares MSCI EAFE Small Cap Index Fund | 934 | 24,013 |
iShares MSCI France Index Fund | 725 | 15,174 |
iShares MSCI Netherlands Investable Market Index Fund | 995 | 14,845 |
iShares MSCI Switzerland Index Fund | 3,821 | 70,841 |
iShares MSCI United Kingdom Index Fund | 7,596 | 93,051 |
Utilities Select Sector SPDR Fund | 547 | 15,879 |
Total Exchange Traded Funds (Cost $794,476) | 583,416 |
|
Fixed Income — Bond Funds 56.4% |
DWS Core Fixed Income VIP "A" | 250,081 | 2,225,721 |
DWS Emerging Markets Fixed Income Fund "Institutional" | 7,487 | 61,843 |
DWS Global Bond Fund "S" | 66,867 | 669,341 |
DWS Government & Agency Securities VIP "A" | 118,173 | 1,465,344 |
DWS High Income VIP "A" | 84,794 | 451,106 |
DWS Inflation Protected Plus Fund "Institutional" | 29,574 | 269,719 |
DWS Short Duration Plus Fund "Institutional" | 33,594 | 294,620 |
DWS US Bond Index Fund "Institutional" | 165,915 | 1,708,927 |
Total Fixed Income — Bond Funds (Cost $7,968,294) | 7,146,621 |
|
Fixed Income — Money Market Fund 4.0% |
Cash Management QP Trust (Cost $505,699) | 505,699 | 505,699 |
| % of Net Assets | Value ($) |
| |
Total Investment Portfolio (Cost $16,920,248)+ | 100.3 | 12,708,095 |
Other Assets and Liabilities, Net | (0.3) | (34,867) |
Net Assets | 100.0 | 12,673,228 |
+ The cost for federal income tax purposes was $16,977,704. At December 31, 2008, net unrealized depreciation for all securities based on tax cost was $4,269,609. This consisted of aggregate gross unrealized appreciation for all securities in which there was an excess of value over tax cost of $62,844 and aggregate gross unrealized depreciation for all securities in which there was an excess of tax cost over value of $4,332,453.EAFE: Europe, Australasia and Far East
MSCI: Morgan Stanley Capital International
SPDR: Standard & Poor's Depositary Receipt
Fair Value Measurements
The following is a summary of the inputs used as of December 31, 2008 in valuing the Portfolio's investments. For information on the Portfolio's policy regarding the valuation of investments and of the valuation inputs, and the aggregate levels used in the table below, please refer to the Security Valuation section of Note A in the accompanying Notes to the Financial Statements.
Valuation Inputs | Investments in Securities |
Level 1
| $ 12,202,396 |
Level 2
| 505,699 |
Level 3
| — |
Total | $ 12,708,095 |
The accompanying notes are an integral part of the financial statements.
Financial Statements
Statement of Assets and Liabilities as of December 31, 2008
|
Assets |
Investments:
Investments in Underlying Affiliated Portfolios, at value (cost $15,620,073) | $ 11,618,980 |
Investments in Non-affiliated funds (cost $794,476) | 583,416 |
Investment in Cash Management QP Trust (cost $505,699) | 505,699 |
Total investments, at value (cost $16,920,248)
| 12,708,095 |
Interest receivable
| 651 |
Dividends receivable
| 206 |
Due from Advisor
| 20,199 |
Other assets
| 484 |
Total assets
| 12,729,635 |
Liabilities |
Payable for Portfolio shares redeemed
| 661 |
Other accrued expenses and payables
| 55,746 |
Total liabilities
| 56,407 |
Net assets, at value | $ 12,673,228 |
Net Assets Consist of: |
Undistributed net investment income
| 1,032,166 |
Net unrealized appreciation (depreciation) on investments
| (4,212,153) |
Accumulated net realized gain (loss)
| (119,667) |
Paid-in capital
| 15,972,882 |
Net assets, at value | $ 12,673,228 |
Class B Net Asset Value, offering and redemption price per share ($12,673,228 ÷ 1,971,510 outstanding shares of beneficial interest, $.01 par value, unlimited number of shares authorized)
| $ 6.43 |
The accompanying notes are an integral part of the financial statements.
Statement of Operations for the year ended December 31, 2008
|
Investment Income |
Income:
Income distributions from Underlying Affiliated Portfolios
| $ 776,846 |
Dividends
| 12,482 |
Interest — Cash Management QP Trust
| 34,156 |
Total Income
| 823,484 |
Expenses:
Management fee
| 15,317 |
Administration fee
| 10,198 |
Services to shareholders
| 66 |
Custodian and accounting fees
| 20,998 |
Distribution service fee
| 39,976 |
Record keeping fees
| 16,607 |
Audit and tax fees
| 45,135 |
Legal
| 25,916 |
Trustees' fees and expenses
| 6,315 |
Reports to shareholders and shareholder meeting
| 14,715 |
Other
| 3,752 |
Total expenses before expense reductions
| 198,995 |
Expense reductions
| (86,963) |
Total expenses after expense reductions
| 112,032 |
Net investment income (loss) | 711,452 |
Realized and Unrealized Gain (Loss) |
Net realized gain (loss) from investments
| (1,181,605) |
Capital gain distributions from Underlying Affiliated Portfolios
| 1,411,975 |
| 230,370 |
Change in net unrealized appreciation (depreciation) on investments
| (4,886,046) |
Net gain (loss) | (4,655,676) |
Net increase (decrease) in net assets resulting from operations | $ (3,944,224) |
The accompanying notes are an integral part of the financial statements.
Statement of Changes in Net Assets |
| Year Ended December 31, |
Increase (Decrease) in Net Assets | 2008 | 2007 |
Operations:
Net investment income (loss)
| $ 711,452 | $ 1,473,106 |
Net realized gain (loss)
| 230,370 | 3,969,944 |
Change in net unrealized appreciation (depreciation)
| (4,886,046) | (2,632,084) |
Net increase (decrease) in net assets resulting from operations
| (3,944,224) | 2,810,966 |
Distributions to shareholders from:
Net investment income:
Class B | (1,920,781) | (1,186,066) |
Net realized gains:
Class B | (3,261,704) | (1,601,633) |
Total distributions
| (5,182,485) | (2,787,699) |
Portfolio share transactions:
Class B Proceeds from shares sold
| 2,652,766 | 2,669,740 |
Reinvestment of distributions
| 5,182,485 | 2,787,699 |
Cost of shares redeemed
| (3,836,502) | (47,127,563) |
Net increase (decrease) in net assets from Class B share transactions
| 3,998,749 | (41,670,124) |
Increase (decrease) in net assets | (5,127,960) | (41,646,857) |
Net assets at beginning of period
| 17,801,188 | 59,448,045 |
Net assets at end of period (including undistributed net investment income of $1,032,166 and $1,914,850, respectively)
| $ 12,673,228 | $ 17,801,188 |
Other Information |
Class B Shares outstanding at beginning of period
| 1,504,098 | 5,014,229 |
Shares sold
| 291,401 | 226,057 |
Shares issued to shareholders in reinvestment of distributions
| 654,354 | 243,893 |
Shares redeemed
| (478,343) | (3,980,081) |
Net increase (decrease) in Class B shares
| 467,412 | (3,510,131) |
Shares outstanding at end of period
| 1,971,510 | 1,504,098 |
The accompanying notes are an integral part of the financial statements.
Financial Highlights
Class B Years Ended December 31, | 2008 | 2007 | 2006 | 2005 | 2004a |
Selected Per Share Data |
Net asset value, beginning of period | $ 11.84 | $ 11.86 | $ 11.10 | $ 10.66 | $ 10.00 |
Income (loss) from investment operations: Net investment income (loss)b | .37 | .31 | .22 | .19 | (.03) |
Net realized and unrealized gain (loss) | (2.46) | .23 | .74 | .28 | .69 |
Total from investment operations | (2.09) | .54 | .96 | .47 | .66 |
Less distributions from: Net investment income | (1.23) | (.24) | (.14) | — | — |
Net realized gain | (2.09) | (.32) | (.06) | (.03) | — |
Total distributions | (3.32) | (.56) | (.20) | (.03) | — |
Net asset value, end of period | $ 6.43 | $ 11.84 | $ 11.86 | $ 11.10 | $ 10.66 |
Total Return (%)c,d
| (22.88) | 4.68 | 8.81 | 4.38 | 6.60** |
Ratios to Average Net Assets and Supplemental Data |
Net assets, end of period ($ millions)
| 13 | 18 | 59 | 46 | 14 |
Ratio of expenses before expense reductions (%)e
| 1.24 | .77 | .79 | .94 | 2.96* |
Ratio of expenses after expense reductions (%)e
| .70 | .71 | .74 | .75 | .75* |
Ratio of net investment income (loss) (%)
| 4.45 | 2.65 | 1.90 | 1.73 | (.67)* |
Portfolio turnover rate (%)
| 59 | 32 | 31 | 27 | 18 |
a For the period from August 16, 2004 (commencement of operations) to December 31, 2004.
b Based on average shares outstanding during the period.
c Total return would have been lower had certain expenses not been reduced.
d Total return would have been lower if the Advisor had not reduced some Underlying Portfolios' expenses.
e The Portfolio invests in other DWS Portfolios and non-affiliated funds and indirectly bears its proportionate share of fees and expenses incurred by the Underlying DWS Portfolios and non-affiliated funds in which the Portfolio is invested. This ratio does not include these indirect fees and expenses.
* Annualized
** Not annualized
|
Performance Summary December 31, 2008
DWS Core Fixed Income VIP
All performance shown is historical, assumes reinvestment of all dividend and capital gain distributions and does not guarantee future results. Investment return and principal value fluctuate with changing market conditions so that, when redeemed, shares may be worth more or less than their original cost. Current performance may be lower or higher than the performance data quoted. Please contact your participating insurance company for the Portfolio's most recent month-end performance. Performance doesn't reflect charges and fees ("contract charges") associated with the separate account that invests in the Portfolio or any variable life insurance policy or variable annuity contract for which the Portfolio is an investment option. These charges and fees will reduce returns. While all share classes have the same underlying portfolio, their performance will differ.
The total annual portfolio operating expense ratios, gross of any fee waivers or expense reimbursements, as stated in the fee table of the prospectus dated May 1, 2008 are 0.66% and 0.91% for Class A and Class B shares, respectively. Please see the Information About Your Portfolio's Expenses, the Financial Highlights and Notes to the Financial Statements (Note C, Related Parties) sections of this report for gross and net expense related disclosure for the period ended December 31, 2008.
Risk Considerations
This Portfolio invests in individual bonds whose yields and market values fluctuate so that your investment may be worth more or less than its original cost. Bond investments are subject to interest-rate risk such that when interest rates rise, the prices of the bonds, and thus the value of the Portfolio, can decline and the investor can lose principal value. In the recent market environment, mortgage-backed securities are experiencing increased volatility. Investments by the Portfolio in lower-rated bonds present greater risk to principal and income than investments in higher-quality securities. Additionally, investing in foreign securities presents certain risks, such as currency fluctuation and changes in political/economic conditions and market risks. All of these factors may result in greater share price volatility. Please see this Portfolio's prospectus for specific details regarding its investments and risk profile.
Portfolio returns shown for all periods reflect a fee waiver and/or expense reimbursement. Without this waiver/reimbursement, returns would have been lower.
Growth of an Assumed $10,000 Investment in DWS Core Fixed Income VIP |
[] DWS Core Fixed Income VIP — Class A [] Barclays Capital US Aggregate Index | The Barclays Capital US Aggregate Index (name changed from Lehman Brothers US Aggregate Index, effective November 3, 2008) is an unmanaged, market value-weighted measure of Treasury issues, agency issues, corporate bond issues and mortgage securities. Index returns, unlike Portfolio returns, do not reflect any fees or expenses. It is not possible to invest directly into an index. |
 | |
Yearly periods ended December 31 |
|
Comparative Results |
DWS Core Fixed Income VIP | 1-Year | 3-Year | 5-Year | 10-Year |
Class A | Growth of $10,000
| $8,067 | $8,762 | $9,364 | $12,099 |
Average annual total return
| -19.33% | -4.31% | -1.31% | 1.92% |
Barclays Capital US Aggregate Index
| Growth of $10,000
| $10,524 | $11,745 | $12,552 | $17,297 |
Average annual total return
| 5.24% | 5.51% | 4.65% | 5.63% |
DWS Core Fixed Income VIP | 1-Year | 3-Year | 5-Year | Life of Class* |
Class B | Growth of $10,000
| $8,029 | $8,654 | $9,176 | $10,121 |
Average annual total return
| -19.71% | -4.70% | -1.70% | .18% |
Barclays Capital US Aggregate Index
| Growth of $10,000
| $10,524 | $11,745 | $12,552 | $13,881 |
Average annual total return
| 5.24% | 5.51% | 4.65% | 5.17% |
The growth of $10,000 is cumulative.
* The Portfolio commenced offering Class B shares on July 1, 2002. Index returns began on June 30, 2002.Information About Your Portfolio's Expenses
DWS Core Fixed Income VIP
As an investor of the Portfolio, you incur two types of costs: ongoing expenses and transaction costs. Ongoing expenses include management fees, distribution and service (12b-1) fees and other Portfolio expenses. Examples of transaction costs include contract charges, redemption fees and account maintenance fees, which are not shown in this section. The following tables are intended to help you understand your ongoing expenses (in dollars) of investing in the Portfolio and to help you compare these expenses with the ongoing expenses of investing in other mutual funds. In the most recent six-month period, the Portfolio limited these expenses, had it not done so, expenses would have been higher. The example in the table is based on an investment of $1,000 invested at the beginning of the six-month period and held for the entire period (July 1, 2008 to December 31, 2008).
The tables illustrate your Portfolio's expenses in two ways:
• Actual Portfolio Return. This helps you estimate the actual dollar amount of ongoing expenses (but not transaction costs) paid on a $1,000 investment in the Portfolio using the Portfolio's actual return during the period. To estimate the expenses you paid over the period, simply divide your account value by $1,000 (for example, an $8,600 account value divided by $1,000 = 8.6), then multiply the result by the number in the "Expenses Paid per $1,000" line under the share class you hold.
• Hypothetical 5% Portfolio Return. This helps you to compare your Portfolio's ongoing expenses (but not transaction costs) with those of other mutual funds using the Portfolio's actual expense ratio and a hypothetical rate of return of 5% per year before expenses. Examples using a 5% hypothetical Portfolio return may be found in the shareholder reports of other mutual funds. The hypothetical account values and expenses may not be used to estimate the actual ending account balance or expenses you paid for the period.
Please note that the expenses shown in these tables are meant to highlight your ongoing expenses only and do not reflect any transaction costs. The "Expenses Paid per $1,000" line of the tables is useful in comparing ongoing expenses only and will not help you determine the relative total expense of owning different funds. If these transaction costs had been included, your costs would have been higher.
Expenses and Value of a $1,000 Investment for the six months ended December 31, 2008 |
Actual Portfolio Return | Class A | | Class B | |
Beginning Account Value 7/1/08
| $ 1,000.00 | | $ 1,000.00 | |
Ending Account Value 12/31/08
| $ 825.60 | | $ 823.70 | |
Expenses Paid per $1,000*
| $ 3.07 | | $ 4.91 | |
Hypothetical 5% Portfolio Return | Class A | | Class B | |
Beginning Account Value 7/1/08
| $ 1,000.00 | | $ 1,000.00 | |
Ending Account Value 12/31/08
| $ 1,021.77 | | $ 1,019.76 | |
Expenses Paid per $1,000*
| $ 3.40 | | $ 5.43 | |
* Expenses are equal to the Portfolio's annualized expense ratio for each share class, multiplied by the average account value over the period, multiplied by the number of days in the most recent six-month period, then divided by 366.Annualized Expense Ratios | Class A | | Class B | |
DWS Variable Series II — DWS Core Fixed Income VIP
| .67% | | 1.07% | |
For more information, please refer to the Portfolio's prospectus.
These tables do not reflect charges and fees ("contract charges") associated with the separate account that invests in the Portfolio or any variable life insurance policy or variable annuity contract for which the Portfolio is an investment option.
Management Summary December 31, 2008
DWS Core Fixed Income VIP
Entering the year, banks were pulling back financing from the markets as they were forced to come to terms with losses related to the subprime mortgage crisis that had emerged in the summer of 2007. As 2008 progressed, ongoing fallout from the collapse in housing and mortgages led to the failure, forced merger or government bailout of a number of leading global financial institutions in both the US and Europe. The result was further tightening of credit that caused global economic growth to pull back sharply during the fourth quarter. Given this backdrop, investors' risk tolerance approached zero and liquidity all but evaporated. What ensued was a frantic "flight to quality" into the safe haven of US Treasuries and underperformance for all other segments of the bond market. As investor risk aversion peaked in October and November, even AAA-rated mortgage-backed issues experienced a collapse in demand.1 Over the 12-month period, the US Federal Reserve Board (the Fed) cut the benchmark federal funds rate (the overnight rate charged by banks when they borrow money from each other) from 4.25% to basically zero as it sought to provide market participants with liquidity, and Treasury yields fell dramatically.
During the 12-month period ended December 31, 2008, the Portfolio provided a total return of -19.33% (Class A shares, unadjusted for contract charges) compared with the 5.24% return of its benchmark, the Barclays Capital US Aggregate Index.
The portfolio's underperformance versus the benchmark is the result of our focus on fixed-income sectors that trade at a yield spread to Treasuries.2 The positive return of the benchmark is the result of extraordinary Treasury performance driven by the unprecedented flight to quality, and masks steep declines in other, credit-sensitive segments of the bond market. In particular, our holdings of commercial mortgage-backed securities and non-agency residential mortgage-backed securities suffered historically poor performance, especially late in the year. Entering 2009, yield spreads are at all-time highs in many sectors. We have repositioned the Portfolio to maximize the potential upside when the credit cycle ultimately turns for the better. This has meant selling the Portfolio's below-AAA-rated positions in favor of AAA-rated securities that are structured to provide a significant degree of protection against rising defaults. We believe the rapid deterioration in the outlook and pricing of AAA-rated bonds toward the end of the year has made this positioning very attractive at this time.
The following portfolio managers were responsible for the day-to-day management of the Portfolio for the period covered by this report. |
Gary W. Bartlett, CFA
Warren S. Davis, III | J. Christopher Gagnier
William T. Lissenden | Daniel R. Taylor, CFA
Timothy C. Vile, CFA | |
Portfolio Managers, Aberdeen Asset Management Inc., Subadvisor to the Portfolio |
Effective on or about February 27, 2009, Deutsche Investment Management Americas Inc. (the "Advisor") assumed all advisory responsibilities for the Portfolio that were previously delegated to the Portfolio's subadvisor. The following portfolio managers handle the day-to-day management of the Portfolio. |
Kenneth R. Bowling, CFA
Jamie Guenther, CFA | John Brennan
Bruce Harley, CFA | J. Richard Robben, CFA
David Vignolo, CFA | J. Kevin Horsley, CFA, CPA
Stephen Willer, CFA |
The Barclays Capital US Aggregate Index (name changed from Lehman Brothers US Aggregate Index, effective November 3, 2008) is an unmanaged, market-value-weighted measure of Treasury issues, agency issues, corporate bond issues and mortgage securities. Index returns, unlike Portfolio returns, do not reflect any fees or expenses. It is not possible to invest directly into an index.
1 Credit quality (credit rating) is a measure of a bond issuer's ability to repay interest and principal in a timely manner. Rating agencies assign letter designations such as AAA, AA and so forth. The lower the rating, the higher the probability of default.2 The yield spread is the difference between the yield of a security and the yield of a comparable-duration Treasury. A large spread indicates that investors require yields substantially above those of Treasuries in order to invest in lower-quality bonds. This is generally indicative of a higher-risk environment. A smaller spread generally indicates a more positive environment, since investors are less concerned about risk and therefore willing to accept lower yields. A drop in the yield spread is a positive.Portfolio management market commentary is as of December 31, 2008, and may not come to pass. This information is subject to change at any time based on market and other conditions. Past performance does not guarantee future results. Current and future portfolio holdings are subject to risk.
Portfolio Summary
DWS Core Fixed Income VIP
Asset Allocation (As a % of Investment Portfolio excluding Securities Lending Collateral) | 12/31/08 | 12/31/07 |
| | |
Commercial and Non-Agency Mortgage-Backed Securities | 30% | 37% |
Corporate Bonds | 24% | 17% |
Mortgage-Backed Securities Pass-Throughs | 21% | 17% |
Collateralized Mortgage Obligations | 10% | 7% |
Government & Agency Obligations | 7% | 14% |
Municipal Bonds and Notes | 5% | 2% |
Asset-Backed | 2% | 3% |
Preferred Securities | 1% | 3% |
| 100% | 100% |
Bond Diversification (Excludes Cash Equivalents and Securities Lending Collateral) | 12/31/08 | 12/31/07 |
| | |
Financials | 39% | 59% |
Utilities | 16% | 20% |
Consumer Discretionary | 12% | 2% |
Energy | 12% | 2% |
Consumer Staples | 6% | 6% |
Materials | 4% | 5% |
Telecommunication Services | 3% | 1% |
Industrials | 3% | 2% |
Information Technology | 3% | 3% |
Health Care | 2% | — |
| 100% | 100% |
Quality (Excludes Securities Lending Collateral) | 12/31/08 | 12/31/07 |
| | |
US Government and Agencies | 38% | 38% |
AAA* | 32% | 42% |
AA | 2% | 2% |
A | 9% | 7% |
BBB | 19% | 11% |
| 100% | 100% |
* Includes cash equivalentsEffective Maturity (Excludes Cash Equivalents and Securities Lending Collateral) | 12/31/08 | 12/31/07 |
| | |
Under 1 year | 1% | 2% |
1-4.99 years | 44% | 48% |
5-9.99 years | 37% | 39% |
10-14.99 years | 4% | 1% |
15 years or greater | 14% | 10% |
| 100% | 100% |
Asset allocation, bond diversification, quality and effective maturity are subject to change.
Weighted average effective maturity: 7.9 years and 6.7 years, respectively.
The quality ratings represent the lower of Moody's Investors Service, Inc. ("Moody's") or Standard & Poor's Corporation ("S&P") credit ratings. The ratings of Moody's and S&P represent their opinions as to the quality of the securities they rate. Ratings are relative and subjective and are not absolute standards of quality. The Portfolio's quality does not remove market risk.
For more complete details about the Portfolio's investment portfolio, see page 75. A complete list of portfolio holdings of the portfolio is posted as of the month end on www.dws-investments.com on or about the 15th day of the following month. More frequent posting of portfolio holdings information may be made from time to time on www.dws-investments.com.
Following the Portfolio's fiscal first and third quarter-end, a complete portfolio holdings listing is filed with the SEC on Form N-Q. The form will be available on the SEC's Web site at www.sec.gov, and it also may be reviewed and copied at the SEC's Public Reference Room in Washington, D.C. Information on the operation of the SEC's Public Reference Room may be obtained by calling (800) SEC-0330.
Investment Portfolio December 31, 2008
DWS Core Fixed Income VIP
| Principal Amount ($) | Value ($) |
| |
Corporate Bonds 23.8% |
Consumer Discretionary 3.1% |
British Sky Broadcasting Group PLC, 144A, 9.5%, 11/15/2018 | 605,000 | 617,646 |
Comcast Cable Holdings LLC: | | |
7.875%, 8/1/2013 | 435,000 | 447,274 |
9.875%, 6/15/2022 | 250,000 | 296,884 |
10.125%, 4/15/2022 | 363,000 | 438,029 |
Comcast Corp., 6.5%, 1/15/2017 | 55,000 | 54,324 |
Grupo Televisa SA, 6.0%, 5/15/2018 | 600,000 | 504,540 |
Omnicom Group, Inc., Zero Coupon, 7/31/2032 | 197,000 | 187,889 |
Time Warner Cable, Inc., 6.75%, 7/1/2018 | 122,000 | 117,462 |
Time Warner Entertainment Co., LP, 10.15%, 5/1/2012 | 460,000 | 474,155 |
Time Warner, Inc.: | | |
7.625%, 4/15/2031 | 360,000 | 353,812 |
7.7%, 5/1/2032 | 325,000 | 325,401 |
Viacom, Inc.: | | |
6.25%, 4/30/2016 | 130,000 | 107,756 |
6.75%, 10/5/2037 | 550,000 | 423,931 |
| 4,349,103 |
Consumer Staples 1.5% |
CVS Caremark Corp., 6.302%, 6/1/2037 | 1,949,000 | 993,990 |
Kroger Co., 7.0%, 5/1/2018 (a) | 375,000 | 392,170 |
Miller Brewing Co., 144A, 5.5%, 8/15/2013 | 840,000 | 783,203 |
| 2,169,363 |
Energy 3.0% |
Energy Transfer Partners LP, 9.7%, 3/15/2019 | 735,000 | 757,352 |
Enterprise Products Operating LP, Series B, 5.6%, 10/15/2014 | 510,000 | 432,703 |
EOG Resources, Inc., 6.875%, 10/1/2018 (a) | 470,000 | 512,609 |
Northwest Pipeline GP, 6.05%, 6/15/2018 | 585,000 | 510,362 |
Petro-Canada, 6.8%, 5/15/2038 | 705,000 | 532,017 |
TransCanada PipeLines Ltd.: | | |
6.2%, 10/15/2037 | 435,000 | 377,860 |
6.35%, 5/15/2067 | 825,000 | 368,769 |
Transocean Ltd.: | | |
Series C, 1.5%, 12/15/2037 | 349,000 | 268,730 |
Series A, 1.625%, 12/15/2037 | 198,000 | 172,508 |
Valero Energy Corp., 7.5%, 4/15/2032 | 365,000 | 291,826 |
| 4,224,736 |
Financials 8.6% |
Banco Mercantil del Norte SA, 144A, 6.862%, 10/13/2021 | 355,000 | 213,000 |
Corp. Andina de Fomento: | | |
5.75%, 1/12/2017(a) | 295,000 | 246,706 |
6.875%, 3/15/2012 | 210,000 | 203,158 |
| Principal Amount ($) | Value ($) |
| |
Erac USA Finance Co.: | | |
144A, 5.8%, 10/15/2012 | 545,000 | 455,908 |
144A, 7.0%, 10/15/2037 | 1,285,000 | 707,747 |
144A, 8.0%, 1/15/2011 | 1,346,000 | 1,262,668 |
Farmers Insurance Exchange, 144A, 8.625%, 5/1/2024 | 940,000 | 628,185 |
FPL Group Capital, Inc.: | | |
Series D, 7.3%, 9/1/2067 | 135,000 | 75,600 |
7.875%, 12/15/2015 | 545,000 | 590,187 |
Glen Meadow Pass-Through Trust, 144A, 6.505%, 2/12/2067 | 445,000 | 198,956 |
HBOS PLC, 144A, 6.75%, 5/21/2018 | 195,000 | 171,619 |
HSBC Finance Corp., 5.25%, 1/15/2014 (a) | 390,000 | 369,637 |
International Lease Finance Corp.: | | |
6.375%, 3/25/2013 | 262,000 | 177,976 |
Series R, 6.625%, 11/15/2013 | 90,000 | 60,641 |
Merrill Lynch & Co., Inc.: | | |
6.22%, 9/15/2026 | 500,000 | 461,668 |
7.75%, 5/14/2038 | 410,000 | 451,689 |
Morgan Stanley, Series F, 6.0%, 4/28/2015 | 990,000 | 854,103 |
National Australia Bank Ltd., 144A, 5.35%, 6/12/2013 | 485,000 | 467,448 |
National Rural Utilities Cooperative Finance Corp., 10.375%, 11/1/2018 | 645,000 | 754,913 |
PartnerRe Finance II, 6.44%, 12/1/2066 | 697,000 | 277,067 |
Rio Tinto Finance (USA) Ltd.: | | |
5.875%, 7/15/2013 (a) | 675,000 | 537,646 |
6.5%, 7/15/2018 (a) | 315,000 | 230,949 |
StanCorp. Financial Group, Inc., 6.9%, 5/29/2067 | 940,000 | 512,696 |
Standard Chartered PLC, 144A, 7.014%, 12/30/2049 | 900,000 | 402,889 |
TNK-BP Finance SA, Series 5, 144A, 7.5%, 3/13/2013 | 245,000 | 151,900 |
UDR, Inc., Series E, (REIT), 3.9%, 3/15/2010 | 345,000 | 299,168 |
US Bancorp., 0.704%**, 12/11/2035 | 265,000 | 241,813 |
Woori Bank, 144A, 6.208%, 5/2/2037 | 165,000 | 65,809 |
Xstrata Finance Canada Ltd.: | | |
144A, 5.8%, 11/15/2016 | 940,000 | 593,403 |
144A, 6.9%, 11/15/2037 | 895,000 | 535,507 |
| 12,200,656 |
Health Care 0.5% |
Medco Health Solutions, Inc., 7.125%, 3/15/2018 | 740,000 | 683,829 |
Industrials 0.8% |
Rockies Express Pipeline LLC, 144A, 6.25%, 7/15/2013 | 1,175,000 | 1,156,856 |
Information Technology 0.8% |
Broadridge Financial Solutions, Inc., 6.125%, 6/1/2017 | 190,000 | 137,952 |
| Principal Amount ($) | Value ($) |
| |
Hewlett Packard Co., 6.125%, 3/1/2014 | 355,000 | 377,366 |
Tyco Electronics Group SA, 6.0%, 10/1/2012 | 695,000 | 626,962 |
| 1,142,280 |
Materials 1.0% |
ArcelorMittal, 5.375%, 6/1/2013 | 375,000 | 282,805 |
ArcelorMittal USA, 6.5%, 4/15/2014 (a) | 380,000 | 270,190 |
Barrick North America Finance LLC, 7.5%, 9/15/2038 | 605,000 | 528,994 |
Celulosa Arauco y Constitucion SA, 5.625%, 4/20/2015 (a) | 425,000 | 400,776 |
| 1,482,765 |
Telecommunication Services 0.8% |
British Telecommunications PLC, 8.625%, 12/15/2010 | 600,000 | 617,219 |
Qwest Corp., 7.625%, 6/15/2015 | 234,000 | 191,880 |
Telecom Italia Capital, 7.721%, 6/4/2038 (a) | 445,000 | 365,456 |
| 1,174,555 |
Utilities 3.7% |
Arizona Public Service Co., 6.875%, 8/1/2036 | 1,045,000 | 727,095 |
Commonwealth Edison Co., Series 98, 6.15%, 3/15/2012 | 685,000 | 667,622 |
Dominion Resources, Inc.: | | |
Series 06-B, 6.3%, 9/30/2066 | 560,000 | 252,000 |
7.5%, 6/30/2066 | 640,000 | 320,000 |
Integrys Energy Group, Inc., 6.11%, 12/1/2066 | 1,305,000 | 626,400 |
New York State Electric & Gas Corp., 144A, 6.15%, 12/15/2017 | 1,125,000 | 1,023,858 |
PPL Capital Funding, Inc., Series A, 6.7%, 3/30/2067 | 1,580,000 | 695,200 |
Southwestern Public Service Co., Series G, 8.75%, 12/1/2018 | 680,000 | 748,581 |
Union Electric Co., 6.7%, 2/1/2019 | 153,000 | 139,411 |
| 5,200,167 |
Total Corporate Bonds (Cost $42,852,839) | 33,784,310 |
|
Asset-Backed 1.8% |
Home Equity Loans |
Countrywide Asset-Backed Certificates: | | |
"A6", Series 2006-S6, 5.657%, 3/25/2034 | 1,840,000 | 804,646 |
"A6", Series 2006-15, 5.826%, 10/25/2046 | 640,000 | 372,802 |
"A1B", Series 2007-S1, 5.888%, 11/25/2036 | 677,617 | 437,983 |
"1AF6", Series 2006-11, 6.15%, 9/25/2046 | 1,830,000 | 900,009 |
Securitized Asset-Backed NIM Trust, "NIM", Series 2005-FR4, 144A, 6.0%, 1/25/2036* | 459,930 | 46 |
Total Asset-Backed (Cost $5,439,773) | 2,515,486 |
| Principal Amount ($) | Value ($) |
| |
Mortgage-Backed Securities Pass-Throughs 21.5% |
Federal Home Loan Mortgage Corp., 6.0%, 12/1/2034 | 898,996 | 928,389 |
Federal National Mortgage Association: | | |
4.5%, with various maturities from 8/1/2033 until 10/1/2033 | 2,735,458 | 2,779,804 |
5.0%, with various maturities from 8/1/2033 until 7/1/2037 | 1,319,523 | 1,351,530 |
5.166%**, 9/1/2038 | 686,964 | 696,238 |
5.5%, with various maturities from 2/1/2024 until 7/1/2037 | 16,876,562 | 17,295,591 |
6.0%, 4/1/2024 | 1,183,966 | 1,227,809 |
6.5%, with various maturities from 3/1/2017 until 4/1/2037 | 5,981,058 | 6,224,912 |
8.0%, 9/1/2015 | 21,523 | 22,856 |
Total Mortgage-Backed Securities Pass-Throughs (Cost $29,493,733) | 30,527,129 |
|
Commercial and Non-Agency Mortgage-Backed Securities 29.8% |
Adjustable Rate Mortgage Trust: | | |
"3A31", Series 2005-10, 5.414%**, 1/25/2036 | 1,265,000 | 612,540 |
"1A4", Series 2006-2, 5.751%**, 5/25/2036 | 1,705,000 | 735,355 |
Banc of America Commercial Mortgage, Inc.: | | |
"A4", Series 2007-1, 5.451%, 1/15/2049 | 855,000 | 634,999 |
"A2", Series 2007-2, 5.634%, 4/10/2049 | 1,050,000 | 823,084 |
"A4", Series 2007-3, 5.658%**, 6/10/2049 | 1,035,000 | 756,971 |
"A4", Series 2007-2, 5.689%**, 4/10/2049 | 675,000 | 512,824 |
"AM", Series 2007-4, 5.812%**, 2/10/2051 | 545,000 | 250,566 |
Banc of America Mortgage Securities, Inc., "1A20", Series 2005-3, 5.5%, 4/25/2035 | 1,840,000 | 1,535,740 |
Bear Stearns Adjustable Rate Mortgage Trust: | | |
"A1", Series 2006-1, 4.625%**, 2/25/2036 | 2,398,498 | 1,521,766 |
"22A1", Series 2007-4, 5.995%**, 6/25/2047 | 1,260,295 | 766,168 |
Chase Mortgage Finance Corp., "3A1", Series 2005-A1, 5.284%**, 12/25/2035 | 2,204,936 | 1,436,193 |
Citicorp Mortgage Securities, Inc., "1A1", Series 2004-8, 5.5%, 10/25/2034 | 876,307 | 738,955 |
Citigroup Mortgage Loan Trust, Inc.: | | |
"2A1", Series 2006-AR1, 4.7%**, 3/25/2036 | 1,117,873 | 671,337 |
"1A1", Series 2006-AR1, 4.9%**, 10/25/2035 | 366,159 | 231,147 |
"1A2", Series 2006-AR2, 5.521%**, 3/25/2036 | 1,710,326 | 921,377 |
"1CB2", Series 2004-NCM2, 6.75%, 8/25/2034 | 895,160 | 675,566 |
| Principal Amount ($) | Value ($) |
| |
Citigroup/Deutsche Bank Commercial Mortgage Trust, "A4", Series 2007-CD4, 5.322%, 12/11/2049 | 846,000 | 590,590 |
Countrywide Alternative Loan Trust: | | |
"A2", Series 2003-21T1, 5.25%, 12/25/2033 | 865,799 | 756,326 |
"A6", Series 2004-14T2, 5.5%, 8/25/2034 | 777,122 | 690,063 |
"7A1", Series 2004-J2, 6.0%, 12/25/2033 | 186,000 | 118,924 |
"1A1", Series 2004-J1, 6.0%, 2/25/2034 | 112,958 | 88,037 |
Greenwich Capital Commercial Funding Corp., "AM", Series 2007-GG9, 5.475%, 3/10/2039 | 600,000 | 304,058 |
GS Mortgage Securities Corp., "2A1", Series 2008-2R, 144A, 7.5%, 10/25/2036 | 999,074 | 649,398 |
GS Mortgage Securities Corp. II, "AM", Series 2007-GG10, 5.799%**, 8/10/2045 | 1,375,000 | 629,688 |
IndyMac Index Mortgage Loan Trust, "3A1", Series 2006-AR33, 5.766%**, 1/25/2037 | 1,218,603 | 793,814 |
JPMorgan Chase Commercial Mortgage Securities Corp.: | | |
"A2", Series 2007-LD11, 5.804%**, 6/15/2049 | 2,430,000 | 1,857,553 |
"ASB", Series 2007-LD11, 5.819%**, 6/15/2049 | 3,180,000 | 2,314,003 |
"A4", Series 2007-LD12, 5.882%, 2/15/2051 | 338,000 | 240,369 |
"AM", Series 2007-LD12, 6.062%**, 2/15/2051 | 900,000 | 422,635 |
JPMorgan Mortgage Trust: | | |
"2A4L", Series 2006-A6, 5.556%**, 10/25/2036 | 1,840,000 | 813,928 |
"2A4", Series 2006-A2, 5.754%**, 4/25/2036 | 2,565,000 | 1,104,921 |
LB-UBS Commercial Mortgage Trust, "A4", Series 2007-C6, 5.858%, 7/15/2040 | 940,000 | 668,830 |
Lehman Mortgage Trust, "3A3", Series 2006-1, 5.5%, 2/25/2036 | 1,587,268 | 1,291,070 |
MASTR Alternative Loans Trust: | | |
"5A1", Series 2005-1, 5.5%, 1/25/2020 | 460,248 | 356,692 |
"5A1", Series 2005-2, 6.5%, 12/25/2034 | 137,653 | 81,000 |
"8A1", Series 2004-3, 7.0%, 4/25/2034 | 28,167 | 20,976 |
MASTR Asset Securitization Trust, "2A7", Series 2003-9, 5.5%, 10/25/2033 | 1,025,659 | 794,885 |
Merrill Lynch Mortgage Investors Trust, "A2", Series 2005-A5, 4.566%, 6/25/2035 | 210,000 | 120,577 |
Merrill Lynch Mortgage Trust, "ASB", Series 2007-C1, 5.829%**, 6/12/2050 | 900,000 | 641,139 |
Morgan Stanley Capital I: | | |
"A2", Series 2007-HQ11, 5.359%, 2/12/2044 | 1,800,000 | 1,425,824 |
"AM", Series 2007-HQ12, 5.632%**, 4/12/2049 | 675,000 | 309,677 |
| Principal Amount ($) | Value ($) |
| |
"AAB", Series 2007-IQ14, 5.654%, 4/15/2049 | 1,845,000 | 1,312,513 |
Residential Accredit Loans, Inc., "CB", Series 2004-QS2, 5.75%, 2/25/2034 | 593,930 | 373,805 |
Sequoia Mortgage Trust, "2A1", Series 2007-1, 5.814%**, 2/20/2047 | 2,085,257 | 1,145,952 |
Structured Adjustable Rate Mortgage Loan Trust, "6A3", Series 2005-21, 5.4%, 11/25/2035 | 1,485,000 | 616,290 |
Structured Asset Securities Corp., "4A1", Series 2005-6, 5.0%, 5/25/2035 | 616,539 | 518,471 |
Wachovia Bank Commercial Mortgage Trust, "A3", Series 2007-C30, 5.246%, 12/15/2043 | 1,310,000 | 993,400 |
Wachovia Mortgage Loan Trust LLC, "3A1", Series 2005-B, 5.158%**, 10/20/2035 | 2,094,192 | 1,475,985 |
Washington Mutual Mortgage Pass-Through Certificates Trust: | | |
"1A3", Series 2005-AR16, 5.102%**, 12/25/2035 | 1,660,000 | 885,562 |
"1A1", Series 2006-AR16, 5.605%**, 12/25/2036 | 1,925,183 | 1,112,772 |
"1A1", Series 2007-HY2, 5.606%**, 12/25/2036 | 2,293,328 | 1,135,502 |
Wells Fargo Mortgage Backed Securities Trust: | | |
"A4", Series 2005-AR14, 5.387%**, 8/25/2035 | 1,700,000 | 870,570 |
"A1", Series 2006-3, 5.5%, 3/25/2036 | 1,637,025 | 1,315,864 |
"2A5", Series 2006-AR1, 5.548%**, 3/25/2036 | 1,700,000 | 681,565 |
Total Commercial and Non-Agency Mortgage-Backed Securities (Cost $65,085,627) | 42,347,816 |
|
Collateralized Mortgage Obligations 10.1% |
Fannie Mae Whole Loan, "1A1", Series 2004-W15, 6.0%, 8/25/2044 | 890,199 | 925,205 |
Federal Home Loan Mortgage Corp.: | | |
"LN", Series 3145, 4.5%, 10/15/2034 | 1,598,552 | 1,617,720 |
"ME", Series 2775, 5.0%, 12/15/2032 | 1,165,000 | 1,190,271 |
"PD", Series 2890, 5.0%, 3/15/2033 | 1,485,000 | 1,513,747 |
"OG", Series 2889, 5.0%, 5/15/2033 | 1,770,000 | 1,804,183 |
"XD", Series 2941, 5.0%, 5/15/2033 | 1,055,000 | 1,074,573 |
"BG", Series 2869, 5.0%, 7/15/2033 | 335,000 | 342,568 |
"PE", Series 2165, 6.0%, 6/15/2029 | 1,300,205 | 1,344,230 |
Federal National Mortgage Association: | | |
"QD", Series 2005-29, 5.0%, 8/25/2033 | 435,000 | 441,671 |
| Principal Amount ($) | Value ($) |
| |
"HE", Series 2005-22, 5.0%, 10/25/2033 | 1,540,000 | 1,563,566 |
"PG", Series 2002-3, 5.5%, 2/25/2017 | 424,841 | 434,090 |
"PH", Series 1999-19, 6.0%, 5/25/2029 | 1,287,572 | 1,334,923 |
"Z", Series 2001-14, 6.0%, 5/25/2031 | 819,913 | 844,350 |
Total Collateralized Mortgage Obligations (Cost $13,900,024) | 14,431,097 |
|
Municipal Bonds and Notes 4.8% |
Arizona, Salt River Project, Agricultural Improvement & Power District Electric Systems Revenue, Series A, 5.0%, 1/1/2038 | 480,000 | 461,539 |
Florida, State Board of Education, Capital Outlay 2006, Series E, 5.0%, 6/1/2035 | 500,000 | 475,375 |
Glendale, AZ, Municipal Property Corp., Excise Tax Revenue, Series B, 6.157%, 7/1/2033 (b) | 420,000 | 408,673 |
Jicarilla, NM, Sales & Special Tax Revenue, Apache Nation Revenue, 144A, 5.2%, 12/1/2013 | 945,000 | 965,450 |
Miami-Dade County, FL, Educational Facilities Authority Revenue, University of Miami, Series B, 6.1%, 4/1/2015 | 1,145,000 | 1,151,000 |
Michigan, Western Michigan University Revenue, 4.41%, 11/15/2014 (b) | 885,000 | 879,893 |
New Jersey, Economic Development Authority Revenue, Series B, 6.5%, 11/1/2014 (b) | 585,000 | 614,782 |
New Jersey, State Educational Facilities Authority Revenue, NJ City University, Series F, 6.85%, 7/1/2036 (b) | 395,000 | 409,212 |
Newark, NJ, Pension Obligation, 5.853%, 4/1/2022 (b) | 865,000 | 862,465 |
Texas, Pharr-San Juan-Alamo Independent School District, School Building, 5.0%, 2/1/2038 | 295,000 | 287,053 |
Texas, Eagle Mountain & Saginaw Independent School District, School Building, 5.0%, 8/15/2038 | 315,000 | 307,374 |
Total Municipal Bonds and Notes (Cost $6,843,223) | 6,822,816 |
|
Government & Agency Obligations 6.9% |
US Treasury Obligations |
US Treasury Bonds: | | |
4.5%, 5/15/2038 (a) | 1,298,000 | 1,771,568 |
5.5%, 8/15/2028 (a) | 2,901,000 | 3,920,881 |
| Principal Amount ($) | Value ($) |
| |
US Treasury Notes: | | |
1.5%, 12/31/2013 | 200,000 | 199,547 |
3.75%, 11/15/2018 (a) | 2,300,000 | 2,603,669 |
4.875%, 5/31/2011 (a) (c) | 500,000 | 549,649 |
5.125%, 5/15/2016 (a) | 643,000 | 778,582 |
Total Government & Agency Obligations (Cost $9,508,268) | 9,823,896 |
|
Preferred Securities 1.6% |
Financials |
Bank of America Corp.: | | |
Series K, 8.0%, 1/30/2018 (d) | 365,000 | 262,540 |
Series M, 8.125%, 5/15/2018 (d) | 10,000 | 7,480 |
Citigroup Capital XXI, 8.3%, 12/21/2057 | 500,000 | 385,619 |
Citigroup, Inc., Series E, 8.4%, 4/30/2018 (d) | 572,000 | 377,686 |
Dresdner Funding Trust I, 144A, 8.151%, 6/30/2031 | 400,000 | 158,396 |
Oil Insurance Ltd., 144A, 7.558%, 6/30/2011 (d) | 890,000 | 335,041 |
PNC Preferred Funding Trust I, 144A, 8.7%, 3/15/2013 (d) | 400,000 | 295,676 |
Royal Bank of Scotland Group PLC: | | |
144A, 6.99%, 10/5/2017 (d) | 430,000 | 201,040 |
Series U, 7.64%, 9/29/2017 (d) | 600,000 | 238,970 |
Stoneheath Re, 6.868%, 10/15/2011 (d) | 250,000 | 50,000 |
Total Preferred Securities (Cost $3,956,005) | 2,312,448 |
| Shares | Value ($) |
| |
Preferred Stocks 0.1% |
Financials |
XL Capital Ltd., Series C, 6.102% (Cost $354,186) | 14,400 | 147,119 |
|
Securities Lending Collateral 6.0% |
Daily Assets Fund Institutional, 1.69% (e) (f) (Cost $8,500,441) | 8,500,441 | 8,500,441 |
|
Cash Equivalents 0.0% |
Cash Management QP Trust, 1.42% (e) (Cost $20,720) | 20,720 | 20,720 |
| % of Net Assets | Value ($) |
| |
Total Investment Portfolio (Cost $185,954,839)+ | 106.4 | 151,233,278 |
Other Assets and Liabilities, Net | (6.4) | (9,142,606) |
Net Assets | 100.0 | 142,090,672 |
* Non-income producing security.** Floating rate notes are securities whose yields vary with a designated market index or market rate, such as the coupon-equivalent of the US Treasury bill rate. These securities are shown at their current rate as of December 31, 2008.+ The cost for federal income tax purposes was $185,975,228. At December 31, 2008, net unrealized depreciation for all securities based on tax cost was $34,741,950. This consisted of aggregate gross unrealized appreciation for all securities in which there was an excess of value over tax cost of $3,032,806 and aggregate gross unrealized depreciation for all securities in which there was an excess of tax cost over value of $37,774,756.(a) All or a portion of these securities were on loan (see Notes to Financial Statements). The value of all securities loaned at December 31, 2008 amounted to $8,124,165, which is 5.7% of net assets.(b) Bond is insured by one of these companies:Insurance Coverage | As a % of Total Investment Portfolio |
Ambac Financial Group, Inc.
| 0.6 |
Assured Guaranty Corp.
| 0.7 |
Financial Security Assurance, Inc.
| 0.8 |
(c) At December 31, 2008, this security has been pledged, in whole or in part, to cover initial margin requirements for open futures contracts.(d) Date shown is call date; not a maturity date for the perpetual preferred securities.(e) Affiliated fund managed by Deutsche Investment Management Americas Inc. The rate shown is the annualized seven-day yield at period end.(f) Represents collateral held in connection with securities lending. Income earned by the Portfolio is net of borrower rebates.144A: Security exempt from registration under Rule 144A of the Securities Act of 1933. These securities may be resold in transactions exempt from registration, normally to qualified institutional buyers.
REIT: Real Estate Investment Trust
At December 31, 2008, open future contracts purchased were as follows:
Futures | Expiration Date | Contracts | Aggregated Face Value ($) | Value ($) | Unrealized Appreciation ($) |
5 Year US Treasury Note
| 3/31/2009 | 157 | 18,051,752 | 18,691,586 | 639,834 |
At December 31, 2008, open future contracts sold were as follows:
Futures | Expiration Date | Contracts | Aggregated Face Value ($) | Value ($) | Unrealized Depreciation ($) |
10 Year US Treasury Note
| 3/20/2009 | 106 | 12,614,537 | 13,329,500 | (714,963) |
Included in the portfolio are investments in mortgage or asset-backed securities which are interests in separate pools of mortgages or assets. Effective maturities of these investments may be shorter than stated maturities due to prepayments. Some separate investments in the Federal National Mortgage Association issues which have similar coupon rates have been aggregated for presentation purposes in the investment portfolio.
Fair Value Measurements
The following is a summary of the inputs used as of December 31, 2008 in valuing the Portfolio's investments. For information on the Portfolio's policy regarding the valuation of investments and of the valuation inputs, and the aggregate levels used in the tables below, please refer to the Security Valuation section of Note A in the accompanying Notes to the Financial Statements.
Valuation Inputs | Investments in Securities | Other Financial Instruments++ |
Level 1
| $ 8,500,441 | $ (75,129) |
Level 2
| 142,535,718 | — |
Level 3
| 197,119 | — |
Total | $ 151,233,278 | $ (75,129) |
++ Other financial instruments are derivative instruments not reflected in the Investment Portfolio, such as future contracts, which are valued at the unrealized appreciation (depreciation) on the instrument.The following is a reconciliation of the Portfolio's Level 3 investments for which significant unobservable inputs were used in determining value at December 31, 2008:
| Investments in Securities |
Balance as of January 1, 2008 | $ 249,925 |
Total realized gain (loss)
| (558,566) |
Change in unrealized appreciation (depreciation)
| (406,992) |
Amortization Premium/Discount
| — |
Net purchases (sales)
| 912,752 |
Net transfers in (out) of Level 3
| — |
Balance as of December 31, 2008 | $ 197,119 |
The accompanying notes are an integral part of the financial statements.
Financial Statements
Statement of Assets and Liabilities as of December 31, 2008
|
Assets |
Investments:
Investments in securities, at value (cost $177,433,678) — including $8,124,165 of securities loaned | $ 142,712,117 |
Investment in Daily Assets Fund Institutional (cost $8,500,441)* | 8,500,441 |
Investment in Cash Management QP Trust (cost $20,720) | 20,720 |
Total investments, at value (cost $185,954,839)
| 151,233,278 |
Cash
| 4,578 |
Receivable for investments sold
| 278,913 |
Receivable for Portfolio shares sold
| 191,165 |
Interest receivable
| 1,403,440 |
Foreign taxes recoverable
| 1,181 |
Receivable for daily variation margin on open futures
| 80,563 |
Other assets
| 6,566 |
Total assets
| 153,199,684 |
Liabilities |
Notes payable
| 250,000 |
Payable upon return of securities loaned
| 8,500,441 |
Payable for investments purchased
| 1,420,499 |
Payable for Portfolio shares redeemed
| 670,992 |
Accrued management fee
| 63,928 |
Other accrued expenses and payables
| 203,152 |
Total liabilities
| 11,109,012 |
Net assets, at value | $ 142,090,672 |
Net Assets Consist of |
Undistributed net investment income
| 11,316,317 |
Net unrealized appreciation (depreciation) on investments
| (34,721,561) |
Futures
| (75,129) |
Accumulated net realized gain (loss)
| (24,351,413) |
Paid-in capital
| 189,922,458 |
Net assets, at value | $ 142,090,672 |
Class A Net Asset Value, offering and redemption price per share ($109,869,522 ÷ 12,351,718 outstanding shares of beneficial interest, $.01 par value, 24,7742,586 shares authorized)
| $ 8.90 |
Class B Net Asset Value, offering and redemption price per share ($32,221,150 ÷ 3,628,194 outstanding shares of beneficial interest, $.01 par value, 7,316,641 shares authorized)
| $ 8.88 |
* Represents collateral on securities loaned.The accompanying notes are an integral part of the financial statements.
Statement of Operations for the year ended December 31, 2008
|
Investment Income |
Income:
Dividends
| $ 50,445 |
Interest (net of foreign taxes withheld of $1,638)
| 12,678,538 |
Interest — Cash Management QP Trust
| 74,465 |
Securities lending income, including income from Daily Assets Fund Institutional, net of borrower rebates
| 216,337 |
Total Income
| 13,019,785 |
Expenses:
Management fee
| 1,158,767 |
Administration fee
| 129,626 |
Services to shareholders
| 486 |
Custodian fee
| 16,926 |
Distribution service fee (Class B)
| 126,837 |
Record keeping fees (Class B)
| 73,477 |
Professional fees
| 72,391 |
Trustees' fees and expenses
| 25,735 |
Reports to shareholders and shareholder meeting
| 75,742 |
Interest expense
| 8,024 |
Other
| 20,919 |
Total expenses before expense reductions
| 1,708,930 |
Expense reductions
| (13,880) |
Total expenses after expense reductions
| 1,695,050 |
Net investment income (loss) | 11,324,735 |
Realized and Unrealized Gain (Loss) |
Net realized gain (loss) from:
Investments
| (19,913,074) |
Futures
| 184,428 |
| (19,728,646) |
Change in net unrealized appreciation (depreciation) on:
Investments
| (31,725,239) |
Futures
| (75,129) |
| (31,800,368) |
Net gain (loss) | (51,529,014) |
Net increase (decrease) in net assets resulting from operations | $ (40,204,279) |
The accompanying notes are an integral part of the financial statements.
Statement of Changes in Net Assets |
| Years Ended December 31, |
Increase (Decrease) in Net Assets | 2008 | 2007 |
Operations:
Net investment income
| $ 11,324,735 | $ 16,962,355 |
Net realized gain (loss)
| (19,728,646) | (784,875) |
Change in net unrealized appreciation (depreciation)
| (31,800,368) | (1,784,782) |
Net increase (decrease) in net assets resulting from operations
| (40,204,279) | 14,392,698 |
Distributions to shareholders from:
Net investment income:
Class A | (12,658,879) | (12,441,885) |
Class B | (4,079,055) | (3,150,565) |
Total distributions
| (16,737,934) | (15,592,450) |
Portfolio share transactions:
Class A Proceeds from shares sold
| 25,960,265 | 84,886,024 |
Reinvestment of distributions
| 12,658,879 | 12,441,885 |
Cost of shares redeemed
| (71,653,396) | (187,114,199) |
Net increase (decrease) in net assets from Class A share transactions
| (33,034,252) | (89,786,290) |
Class B Proceeds from shares sold
| 1,828,386 | 2,831,011 |
Reinvestment of distributions
| 4,079,055 | 3,150,565 |
Cost of shares redeemed
| (29,114,932) | (19,070,128) |
Net increase (decrease) in net assets from Class B share transactions
| (23,207,491) | (13,088,552) |
Increase (decrease) in net assets | (113,183,956) | (104,074,594) |
Net assets at beginning of period
| 255,274,628 | 359,349,222 |
Net assets at end of period (including undistributed net investment income of $11,316,317 and $16,731,325, respectively)
| $ 142,090,672 | $ 255,274,628 |
Other Information |
Class A Shares outstanding at beginning of period
| 15,754,867 | 23,346,010 |
Shares sold
| 2,332,157 | 7,294,758 |
Shares issued to shareholders in reinvestment of distributions
| 1,171,035 | 1,080,025 |
Shares redeemed
| (6,906,341) | (15,965,926) |
Net increase (decrease) in Class A shares
| (3,403,149) | (7,591,143) |
Shares outstanding at end of period
| 12,351,718 | 15,754,867 |
Class B Shares outstanding at beginning of period
| 5,850,161 | 6,968,915 |
Shares sold
| 159,817 | 242,748 |
Shares issued to shareholders in reinvestment of distributions
| 376,992 | 273,249 |
Shares redeemed
| (2,758,776) | (1,634,751) |
Net increase (decrease) in Class B shares
| (2,221,967) | (1,118,754) |
Shares outstanding at end of period
| 3,628,194 | 5,850,161 |
The accompanying notes are an integral part of the financial statements.
Financial Highlights
Class A Years Ended December 31, | 2008 | 2007 | 2006 | 2005 | 2004 |
Selected Per Share Date |
Net asset value, beginning of period | $ 11.82 | $ 11.86 | $ 11.81 | $ 12.07 | $ 12.16 |
Income (loss) from investment operations: Net investment incomea | .57 | .56 | .53 | .47 | .50 |
Net realized and unrealized gain (loss) | (2.72) | (.08) | (.05) | (.21) | .05 |
Total from investment operations | (2.15) | .48 | .48 | .26 | .55 |
Less distributions from: Net investment income | (.77) | (.52) | (.43) | (.41) | (.43) |
Net realized gains | — | — | (.00)* | (.11) | (.21) |
Total distributions | (.77) | (.52) | (.43) | (.52) | (.64) |
Net asset value, end of period | $ 8.90 | $ 11.82 | $ 11.86 | $ 11.81 | $ 12.07 |
Total Return (%)
| (19.33)b | 4.17 | 4.26 | 2.25 | 4.53 |
Ratios to Average Net Assets and Supplemental Data |
Net assets, end of period ($ millions)
| 110 | 186 | 277 | 252 | 210 |
Ratio of expenses before expense reductions (%)
| .70 | .66 | .68 | .67 | .66 |
Ratio of expenses after expense reductions (%)
| .70 | .66 | .68 | .67 | .66 |
Ratio of net investment income (loss) (%)
| 5.36 | 4.78 | 4.56 | 3.96 | 4.18 |
Portfolio turnover rate (%)
| 215 | 209 | 198 | 241 | 176 |
a Based on average shares outstanding during the period.
b Total returns would have been lower had certain expenses not been reduced.
* Amount is less than $.005.
|
Class B Years Ended December 31, | 2008 | 2007 | 2006 | 2005 | 2004 |
Selected Per Share Data |
Net asset value, beginning of period | $ 11.80 | $ 11.84 | $ 11.78 | $ 12.04 | $ 12.13 |
Income (loss) from investment operations: Net investment incomea | .53 | .51 | .49 | .42 | .45 |
Net realized and unrealized gain (loss) | (2.73) | (.08) | (.05) | (.21) | .05 |
Total from investment operations | (2.20) | .43 | .44 | .21 | .50 |
Less distributions from: Net investment income | (.72) | (.47) | (.38) | (.36) | (.38) |
Net realized gains | — | — | (.00)* | (.11) | (.21) |
Total distributions | (.72) | (.47) | (.38) | (.47) | (.59) |
Net asset value, end of period | $ 8.88 | $ 11.80 | $ 11.84 | $ 11.78 | $ 12.04 |
Total Return (%)
| (19.71)b | 3.75 | 3.89 | 1.85 | 4.10 |
Ratios to Average Net Assets and Supplemental Data |
Net assets, end of period ($ millions)
| 32 | 69 | 82 | 89 | 88 |
Ratio of expenses before expense reductions (%)
| 1.10 | 1.05 | 1.07 | 1.07 | 1.03 |
Ratio of expenses after expense reductions (%)
| 1.09 | 1.05 | 1.07 | 1.07 | 1.03 |
Ratio of net investment income (loss) (%)
| 4.97 | 4.39 | 4.17 | 3.56 | 3.81 |
Portfolio turnover rate (%)
| 215 | 209 | 198 | 241 | 176 |
a Based on average shares outstanding during the period.
b Total returns would have been lower had certain expenses not been reduced.
* Amount is less than $.005.
|
Performance Summary December 31, 2008
DWS Davis Venture Value VIP
All performance shown is historical, assumes reinvestment of all dividend and capital gain distributions and does not guarantee future results. Investment return and principal value fluctuate with changing market conditions so that, when redeemed, shares may be worth more or less than their original cost. Current performance may be lower or higher than the performance data quoted. Please contact your participating insurance company for the Portfolio's most recent month-end performance. Performance doesn't reflect charges and fees ("contract charges") associated with the separate account that invests in the Portfolio or any variable life insurance policy or variable annuity contract for which the Portfolio is an investment option. These charges and fees will reduce returns. While all share classes have the same underlying portfolio, their performance will differ.
The total annual Portfolio operating expense ratios, gross of any fee waivers or expense reimbursements, as stated in the fee table of the prospectus dated May 1, 2008 are 1.02% and 1.27% for Class A and Class B shares, respectively. Please see the Information About Your Portfolio's Expenses, the Financial Highlights and Notes to the Financial Statements (Note C, Related Parties) sections of this report for gross and net expense related disclosure for the period ended December 31, 2008.
Risk Considerations
The Portfolio is subject to stock market and equity risks, meaning stocks in the Portfolio may decline in value for extended periods of time due to the activities and financial prospects of individual companies, or due to general market and economic conditions. Additionally, investing in foreign securities presents certain risks such as currency fluctuation, political and economic changes and market risks. Please read this Portfolio's prospectus for specific details regarding its investments and risk profile.
Portfolio returns shown for all periods reflect a fee waiver and/or expense reimbursement. Without this waiver/reimbursement, returns would have been lower.
Growth of an Assumed $10,000 Investment in DWS Davis Venture Value VIP from 5/1/2001 to 12/31/2008 |
[] DWS Davis Venture Value VIP — Class A [] Russell 1000® Value Index | The Russell 1000® Value Index is an unmanaged index that consists of those stocks in the Russell 1000® Index with lower price-to-book ratios and lower forecasted-growth values. Index returns assume reinvestment of dividends and, unlike portfolio returns, do not reflect any fees or expenses. It is not possible to invest directly into an index. |
 | |
Yearly periods ended December 31 |
|
Comparative Results |
DWS Davis Venture Value VIP | 1-Year | 3-Year | 5-Year | Life of Portfolio* |
Class A | Growth of $10,000
| $5,977 | $7,170 | $8,791 | $9,132 |
Average annual total return
| -40.23% | -10.50% | -2.54% | -1.18% |
Russell 1000 Value Index
| Growth of $10,000
| $6,315 | $7,707 | $9,611 | $10,092 |
Average annual total return
| -36.85% | -8.32% | -.79% | .12% |
DWS Davis Venture Value VIP | 1-Year | 3-Year | 5-Year | Life of Class** |
Class B | Growth of $10,000
| $5,922 | $7,052 | $8,582 | $10,402 |
Average annual total return
| -40.78% | -10.99% | -3.01% | .61% |
Russell 1000 Value Index
| Growth of $10,000
| $6,315 | $7,707 | $9,611 | $11,087 |
Average annual total return
| -36.85% | -8.32% | -.79% | 1.60% |
The growth of $10,000 is cumulative.
* The Portfolio commenced operations on May 1, 2001. Index returns began on April 30, 2001.** The Portfolio commenced offering Class B shares on July 1, 2002. Index returns began on June 30, 2002.Information About Your Portfolio's Expenses
DWS Davis Venture Value VIP
As an investor of the Portfolio, you incur two types of costs: ongoing expenses and transaction costs. Ongoing expenses include management fees, distribution and service (12b-1) fees and other Portfolio expenses. Examples of transaction costs include contract charges, redemption fees and account maintenance fees, which are not shown in this section. The following tables are intended to help you understand your ongoing expenses (in dollars) of investing in the Portfolio and to help you compare these expenses with the ongoing expenses of investing in other mutual funds. In the most recent six-month period, the Portfolio limited these expenses; had it not done so, expenses would have been higher. The example in the table is based on an investment of $1,000 invested at the beginning of the six-month period and held for the entire period (July 1, 2008 to December 31, 2008).
The tables illustrate your Portfolio's expenses in two ways:
• Actual Portfolio Return. This helps you estimate the actual dollar amount of ongoing expenses (but not transaction costs) paid on a $1,000 investment in the Portfolio using the Portfolio's actual return during the period. To estimate the expenses you paid over the period, simply divide your account value by $1,000 (for example, an $8,600 account value divided by $1,000 = 8.6), then multiply the result by the number in the "Expenses Paid per $1,000" line under the share class you hold.
• Hypothetical 5% Portfolio Return. This helps you to compare your Portfolio's ongoing expenses (but not transaction costs) with those of other mutual funds using the Portfolio's actual expense ratio and a hypothetical rate of return of 5% per year before expenses. Examples using a 5% hypothetical Portfolio return may be found in the shareholder reports of other mutual funds. The hypothetical account values and expenses may not be used to estimate the actual ending account balance or expenses you paid for the period.
Please note that the expenses shown in these tables are meant to highlight your ongoing expenses only and do not reflect any transaction costs. The "Expenses Paid per $1,000" line of the tables is useful in comparing ongoing expenses only and will not help you determine the relative total expense of owning different funds. If these transaction costs had been included, your costs would have been higher.
Expenses and Value of a $1,000 Investment for the six months ended December 31, 2008 |
Actual Portfolio Return | Class A | | Class B | |
Beginning Account Value 7/1/08
| $ 1,000.00 | | $ 1,000.00 | |
Ending Account Value 12/31/08
| $ 676.00 | | $ 674.50 | |
Expenses Paid per $1,000*
| $ 3.88 | | $ 4.92 | |
Hypothetical 5% Portfolio Return | Class A | | Class B | |
Beginning Account Value 7/1/08
| $ 1,000.00 | | $ 1,000.00 | |
Ending Account Value 12/31/08
| $ 1,020.51 | | $ 1,019.25 | |
Expenses Paid per $1,000*
| $ 4.67 | | $ 5.94 | |
* Expenses are equal to the Portfolio's annualized expense ratio for each share class, multiplied by the average account value over the period, multiplied by the number of days in the most recent six-month period, then divided by 366.Annualized Expense Ratios | Class A | | Class B | |
DWS Variable Series II — DWS Davis Venture Value VIP
| .92% | | 1.17% | |
For more information, please refer to the Portfolio's prospectus.
These tables do not reflect charges and fees ("contract charges") associated with the separate account that invests in the Portfolio or any variable life insurance policy or variable annuity contract for which the Portfolio is an investment option.
Management Summary December 31, 2008
DWS Davis Venture Value VIP
For the year ended December 31, 2008, Class A shares of DWS Davis Venture Value VIP returned -40.23% (unadjusted for contract charges), compared to its benchmark, the Russell 1000® Value Index, which returned -36.85%.
The Portfolio's financial companies outperformed the corresponding sector within the index (-49% versus -52% for the index), but were still the largest detractors from performance. A higher relative average weighting in this sector (32% versus 27% for the index) detracted from both absolute and relative performance. American International Group, Inc., American Express Co., Merrill Lynch & Co., Inc., Berkshire Hathaway, Inc., Loews Companies, Inc., Wachovia Corp. and JPMorgan Chase & Co. were among the top detractors from performance. Two financial companies, Wells Fargo & Co. and Hartford Financial Services Group, Inc., were among the top contributors to the Portfolio's performance.
The second-largest detractors from performance were energy companies. The Portfolio's energy companies underperformed the corresponding sector within the index (-36% versus -27%). A higher relative average weighting in this sector (18% versus 17% for the index) also detracted from performance. ConocoPhillips was among the top detractors.
Individual companies among the largest contributors to performance over the year included H&R Block, Inc. (a consumer discretionary company) and Wal-Mart Stores (a consumer staples company). The Portfolio no longer owns Wal-Mart Stores.
The Portfolio held 12% of net assets in foreign companies at year-end December 31, 2008. As a whole, these companies underperformed the domestic companies held by the Portfolio.
Christopher C. Davis
Kenneth Charles Feinberg
Portfolio Managers, Davis Selected Advisers, L.P., Subadvisor to the Portfolio
The Russell 1000 Value Index is an unmanaged index that consists of those stocks in the Russell 1000 Index with lower price-to-book ratios and lower forecasted growth values. Index returns assume reinvestment of dividends and, unlike portfolio returns, do not reflect any fees or expenses. It is not possible to invest directly into an index.
Portfolio management market commentary is as of December 31, 2008, and may not come to pass. This information is subject to change at any time based on market and other conditions. Past performance does not guarantee future results. Current and future portfolio holdings are subject to risk.
Portfolio Summary
DWS Davis Venture Value VIP
Asset Allocation (As a % of Investment Portfolio excluding Securities Lending Collateral) | 12/31/08 | 12/31/07 |
| | |
Common Stocks | 99% | 100% |
Cash Equivalents | 1% | — |
| 100% | 100% |
Sector Diversification (As a % of Common Stocks and Corporate Bonds) | 12/31/08 | 12/31/07 |
| | |
Financials | 30% | 33% |
Energy | 18% | 16% |
Consumer Staples | 16% | 16% |
Consumer Discretionary | 11% | 10% |
Information Technology | 8% | 9% |
Industrials | 7% | 7% |
Materials | 5% | 4% |
Health Care | 5% | 4% |
Telecommunication Services | — | 1% |
| 100% | 100% |
Asset allocation and sector diversification are subject to change.
For more complete details about the Portfolio's investment portfolio, see page 89. A complete list of portfolio holdings of the portfolio is posted as of the month end on www.dws-investments.com on or about the 15th day of the following month. More frequent posting of portfolio holdings information may be made from time to time on www.dws-investments.com.
Following the Portfolio's fiscal first and third quarter-end, a complete portfolio holdings listing is filed with the SEC on Form N-Q. The form will be available on the SEC's Web site at www.sec.gov, and it also may be reviewed and copied at the SEC's Public Reference Room in Washington, D.C. Information on the operation of the SEC's Public Reference Room may be obtained by calling (800) SEC-0330.
Investment Portfolio December 31, 2008
DWS Davis Venture Value VIP
|
Shares
| Value ($) |
| |
Common Stocks 98.1% |
Consumer Discretionary 10.3% |
Automobiles 0.8% |
Harley-Davidson, Inc. (a) | 60,610 | 1,028,552 |
Diversified Consumer Services 1.6% |
H&R Block, Inc. | 94,650 | 2,150,448 |
Household Durables 0.2% |
Garmin Ltd. (a) | 8,315 | 159,398 |
Hunter Douglas NV | 6,062 | 199,411 |
| 358,809 |
Internet & Catalog Retail 0.6% |
Amazon.com, Inc.* | 13,010 | 667,153 |
Liberty Media Corp. — Interactive "A"* | 31,670 | 98,810 |
| 765,963 |
Media 5.1% |
Comcast Corp. Special "A" (a) | 199,410 | 3,220,471 |
Grupo Televisa SA (ADR) | 96,490 | 1,441,561 |
Liberty Media Corp. — Entertainment "A"* | 25,270 | 441,720 |
News Corp. "A" | 172,750 | 1,570,297 |
WPP PLC (ADR) | 1,100 | 32,549 |
| 6,706,598 |
Multiline Retail 0.1% |
Sears Holdings Corp.* (a) | 2,100 | 81,627 |
Specialty Retail 1.9% |
Bed Bath & Beyond, Inc.* (a) | 48,000 | 1,220,160 |
CarMax, Inc.* (a) | 65,900 | 519,292 |
Lowe's Companies, Inc. | 33,915 | 729,851 |
| 2,469,303 |
Consumer Staples 15.3% |
Beverages 2.4% |
Diageo PLC (ADR) | 34,920 | 1,981,361 |
Heineken Holding NV | 41,200 | 1,179,504 |
| 3,160,865 |
Food & Staples Retailing 7.3% |
Costco Wholesale Corp. | 128,340 | 6,737,850 |
CVS Caremark Corp. | 98,519 | 2,831,436 |
Whole Foods Market, Inc. | 12,600 | 118,944 |
| 9,688,230 |
Food Products 0.2% |
The Hershey Co. (a) | 9,460 | 328,640 |
Household Products 1.7% |
Procter & Gamble Co. | 36,050 | 2,228,611 |
Personal Products 0.3% |
Avon Products, Inc. | 16,800 | 403,704 |
Tobacco 3.4% |
Altria Group, Inc. | 5,150 | 77,559 |
Philip Morris International, Inc. | 100,090 | 4,354,916 |
| 4,432,475 |
|
Shares
| Value ($) |
| |
Energy 17.7% |
Energy Equipment & Services 0.5% |
Transocean Ltd.* | 15,141 | 715,412 |
Oil, Gas & Consumable Fuels 17.2% |
Canadian Natural Resources Ltd. | 50,620 | 2,023,788 |
China Coal Energy Co. "H" | 934,200 | 754,933 |
ConocoPhillips | 111,320 | 5,766,376 |
Devon Energy Corp. | 67,690 | 4,447,910 |
EOG Resources, Inc. | 57,955 | 3,858,644 |
Occidental Petroleum Corp. | 92,800 | 5,567,072 |
OGX Petroleo e Gas Participacoes SA* | 800 | 182,497 |
| 22,601,220 |
Financials 29.8% |
Capital Markets 3.5% |
Ameriprise Financial, Inc. | 30,220 | 705,939 |
Bank of New York Mellon Corp. | 89,205 | 2,527,178 |
E*TRADE Financial Corp.* (a) | 13,200 | 15,180 |
Merrill Lynch & Co., Inc. | 54,702 | 636,731 |
Morgan Stanley | 6,300 | 101,052 |
State Street Corp. | 5,100 | 200,583 |
The Goldman Sachs Group, Inc. | 5,260 | 443,892 |
| 4,630,555 |
Commercial Banks 4.8% |
Wachovia Corp. | 44,537 | 246,735 |
Wells Fargo & Co. | 204,180 | 6,019,226 |
| 6,265,961 |
Consumer Finance 2.5% |
American Express Co. (a) | 173,200 | 3,212,860 |
Discover Financial Services | 9,650 | 91,964 |
| 3,304,824 |
Diversified Financial Services 5.2% |
Citigroup, Inc. | 42,900 | 287,859 |
JPMorgan Chase & Co. | 180,124 | 5,679,310 |
Moody's Corp. | 42,200 | 847,798 |
| 6,814,967 |
Insurance 12.8% |
American International Group, Inc. (a) | 174,570 | 274,075 |
Berkshire Hathaway, Inc. "B"* | 2,109 | 6,778,326 |
Hartford Financial Services Group, Inc. | 28,600 | 469,612 |
Loews Corp. | 106,650 | 3,012,863 |
Markel Corp.* (a) | 400 | 119,600 |
MBIA, Inc.* (a) | 10,920 | 44,444 |
NIPPONKOA Insurance Co., Ltd. | 196,200 | 1,525,239 |
Principal Financial Group, Inc. (a) | 12,000 | 270,840 |
Progressive Corp. | 187,292 | 2,773,795 |
Sun Life Financial, Inc. (a) | 7,370 | 170,542 |
Transatlantic Holdings, Inc. | 35,973 | 1,441,078 |
| 16,880,414 |
|
Shares
| Value ($) |
| |
Real Estate Management & Development 1.0% |
Brookfield Asset Management Inc. "A" | 43,500 | 664,245 |
Hang Lung Group Ltd. | 223,000 | 680,657 |
| 1,344,902 |
Health Care 4.5% |
Health Care Providers & Services 2.7% |
Cardinal Health, Inc. | 29,440 | 1,014,797 |
Express Scripts, Inc.* | 22,445 | 1,234,026 |
UnitedHealth Group, Inc. | 47,600 | 1,266,160 |
| 3,514,983 |
Pharmaceuticals 1.8% |
Johnson & Johnson | 13,790 | 825,056 |
Schering-Plough Corp. | 93,800 | 1,597,414 |
| 2,422,470 |
Industrials 7.1% |
Air Freight & Logistics 0.6% |
United Parcel Service, Inc. "B" | 13,500 | 744,660 |
Commercial Services & Supplies 1.8% |
Iron Mountain, Inc.* (a) | 97,282 | 2,405,784 |
Electrical Equipment 0.2% |
ABB Ltd. (ADR) (Registered) | 12,980 | 194,830 |
Industrial Conglomerates 1.1% |
Siemens AG (Registered) | 8,340 | 624,670 |
Tyco International Ltd. | 36,950 | 798,120 |
| 1,422,790 |
Machinery 0.3% |
PACCAR, Inc. (a) | 15,060 | 430,716 |
Marine 0.8% |
China Shipping Development Co., Ltd. "H" | 400,000 | 402,603 |
Kuehne & Nagel International AG (Registered) | 9,620 | 623,724 |
| 1,026,327 |
Professional Services 1.3% |
Dun & Bradstreet Corp. | 22,500 | 1,737,000 |
Transportation Infrastructure 1.0% |
China Merchants Holdings International Co., Ltd. | 519,223 | 1,023,160 |
Cosco Pacific Ltd. | 320,600 | 330,070 |
| 1,353,230 |
Information Technology 7.8% |
Communications Equipment 0.5% |
Cisco Systems, Inc.* | 45,500 | 741,650 |
Computers & Peripherals 1.5% |
Dell, Inc.* (a) | 42,440 | 434,586 |
Hewlett-Packard Co. | 41,220 | 1,495,874 |
| 1,930,460 |
Electronic Equipment, Instruments & Components 1.2% |
Agilent Technologies, Inc.* | 63,330 | 989,848 |
Tyco Electronics Ltd. | 36,950 | 598,959 |
| 1,588,807 |
|
Shares
| Value ($) |
| |
Internet Software & Services 1.0% |
eBay, Inc.* | 18,455 | 257,632 |
Google, Inc. "A"* | 3,297 | 1,014,322 |
| 1,271,954 |
IT Services 0.2% |
Visa, Inc. "A" (a) | 5,240 | 274,838 |
Semiconductors & Semiconductor Equipment 1.4% |
Texas Instruments, Inc. | 117,700 | 1,826,704 |
Software 2.0% |
Microsoft Corp. | 135,400 | 2,632,176 |
Materials 5.2% |
Chemicals 0.5% |
Monsanto Co. | 9,450 | 664,807 |
Construction Materials 2.1% |
Martin Marietta Materials, Inc. (a) | 17,000 | 1,650,360 |
Vulcan Materials Co. (a) | 16,860 | 1,173,119 |
| 2,823,479 |
Containers & Packaging 1.6% |
Sealed Air Corp. | 142,900 | 2,134,926 |
Metals & Mining 0.5% |
BHP Billiton PLC | 24,750 | 466,213 |
Rio Tinto PLC | 8,800 | 190,668 |
| 656,881 |
Paper & Forest Products 0.5% |
Sino-Forest Corp.* | 78,600 | 628,418 |
Telecommunication Services 0.2% |
Wireless Telecommunication Services |
Sprint Nextel Corp.* | 141,270 | 258,524 |
Utilities 0.2% |
Independent Power Producers & Energy Traders |
AES Corp.* (a) | 34,400 | 283,456 |
Total Common Stocks (Cost $135,496,146) | 129,331,950 |
| Principal Amount ($) | Value ($) |
| |
Corporate Bonds 0.2% |
Materials |
Sino-Forest Corp., 144A, 5.0%, 8/1/2013 (Cost $340,000) | 340,000 | 243,100 |
|
Shares
| Value ($) |
| |
Securities Lending Collateral 10.7% |
Daily Assets Fund Institutional, 1.69% (b) (c) (Cost $14,051,468) | 14,051,468 | 14,051,468 |
|
Cash Equivalents 1.3% |
Cash Management QP Trust, 1.42% (b) (Cost $1,731,005) | 1,731,005 | 1,731,005 |
| % of Net Assets | Value ($) |
| |
Total Investment Portfolio (Cost $151,618,619)+ | 110.3 | 145,357,523 |
Other Assets and Liabilities, Net | (10.3) | (13,564,866) |
Net Assets | 100.0 | 131,792,657 |
* Non-income producing security.+ The cost for federal income tax purposes was $152,071,271. At December 31, 2008, net unrealized depreciation for all securities based on tax cost was $6,713,748. This consisted of aggregate gross unrealized appreciation for all securities in which there was an excess of value over tax cost of $30,817,617 and aggregate gross unrealized depreciation for all securities in which there was an excess of tax cost over value of $37,531,365.(a) All or a portion of these securities were on loan (see Notes to Financial Statements). The value of all securities loaned at December 31, 2008 amounted to $14,060,943, which is 10.7% of net assets.(b) Affiliated fund managed by Deutsche Investment Management Americas Inc. The rate shown is the annualized seven-day yield at period end.(c) Represents collateral held in connection with securities lending. Income earned by the Portfolio is net of borrower rebates.ADR: American Depositary Receipt
Fair Value Measurements
The following is a summary of the inputs used as of December 31, 2008 in valuing the Portfolio's investments. For information on the Portfolio's policy regarding the valuation of investments and of the valuation inputs, and the aggregate levels used in the table below, please refer to the Security Valuation section of Note A in the accompanying Notes to the Financial Statements.
Valuation Inputs | Investments in Securities |
Level 1
| $ 135,382,566 |
Level 2
| 9,974,957 |
Level 3
| — |
Total | $ 145,357,523 |
The accompanying notes are an integral part of the financial statements.
Financial Statements
Statement of Assets and Liabilities as of December 31, 2008
|
Assets |
Investments:
Investments in securities, at value (cost $135,836,146) — including $14,060,943 of securities loaned | $ 129,575,050 |
Investment in Daily Assets Fund Institutional (cost $14,051,468)* | 14,051,468 |
Investment in Cash Management QP Trust (cost $1,731,005) | 1,731,005 |
Total investments in securities, at value (cost $151,618,619)
| 145,357,523 |
Cash
| 7,101 |
Receivable for investments sold
| 640,095 |
Receivable for Portfolio shares sold
| 7,625 |
Dividends receivable
| 127,232 |
Interest receivable
| 40,953 |
Foreign taxes recoverable
| 14,422 |
Due from Advisor
| 1,309 |
Other assets
| 6,597 |
Total assets
| 146,202,857 |
Liabilities |
Payable upon return of securities loaned
| 14,051,468 |
Payable for Portfolio shares redeemed
| 112,899 |
Accrued management fee
| 119,563 |
Other accrued expenses and payables
| 126,270 |
Total liabilities
| 14,410,200 |
Net assets, at value | $ 131,792,657 |
Net Assets Consist of |
Undistributed net investment income
| 2,432,744 |
Net unrealized appreciation (depreciation) on:
Investments | (6,261,096) |
Foreign currency | 1,020 |
Accumulated net realized gain (loss)
| 10,222,749 |
Paid-in capital
| 125,397,240 |
Net assets, at value | $ 131,792,657 |
Class A Net Asset Value, offering and redemption price per share ($131,579,381 ÷ 17,516,923 outstanding shares of beneficial interest, $.01 par value, unlimited number of shares authorized)
| $ 7.51 |
Class B Net Asset Value, offering and redemption price per share ($213,276 ÷ 28,559 outstanding shares of beneficial interest, $.01 par value, unlimited number of shares authorized)
| $ 7.47 |
* Represents collateral on securities loaned.The accompanying notes are an integral part of the financial statements.
Statement of Operations for the year ended December 31, 2008
|
Investment Income |
Income:
Dividends (net of foreign taxes withheld of $34,007)
| $ 4,161,878 |
Interest
| 6,633 |
Interest — Cash Management QP Trust
| 68,642 |
Securities lending income, including income from Daily Assets Fund Institutional, net of borrower rebates
| 411,543 |
Total Income
| 4,648,696 |
Expenses:
Management fee
| 2,136,001 |
Administrative fee
| 140,451 |
Custodian and accounting fees
| 80,597 |
Distribution service fee (Class B)
| 17,012 |
Record keeping fees (Class B)
| 9,985 |
Services to shareholders
| 506 |
Professional fees
| 71,353 |
Trustees' fees and expenses
| 32,179 |
Reports to shareholders and shareholder meeting
| 55,465 |
Other
| 25,316 |
Total expenses before expense reductions
| 2,568,865 |
Expense reductions
| (392,699) |
Total expenses after expense reductions
| 2,176,166 |
Net investment income (loss) | 2,472,530 |
Realized and Unrealized Gain (Loss) |
Net realized gain (loss) from:
Investments
| 10,438,043 |
Foreign currency
| (32,097) |
| 10,405,946 |
Change in net unrealized appreciation (depreciation) on:
Investments
| (123,229,979) |
Foreign currency
| 1,349 |
| (123,228,630) |
Net gain (loss) | (112,822,684) |
Net increase (decrease) in net assets resulting from operations | $ (110,350,154) |
The accompanying notes are an integral part of the financial statements.
Statement of Changes in Net Assets |
| Years Ended December 31, |
Increase (Decrease) in Net Assets | 2008 | 2007 |
Operations:
Net investment income (loss)
| $ 2,472,530 | $ 3,809,524 |
Net realized gain (loss)
| 10,405,946 | 36,053,016 |
Change in net unrealized appreciation (depreciation)
| (123,228,630) | (20,326,582) |
Net increase (decrease) in net assets resulting from operations
| (110,350,154) | 19,535,958 |
Distributions to shareholders from:
Net investment income:
Class A | (3,580,646) | (2,451,514) |
Class B | (190,630) | (255,608) |
Net realized gains:
Class A | (33,139,891) | (4,403,063) |
Class B | (2,425,280) | (989,328) |
Total distributions
| (39,336,447) | (8,099,513) |
Portfolio share transactions:
Class A Proceeds from shares sold
| 3,164,462 | 14,075,726 |
Reinvestment of distributions
| 36,720,537 | 6,854,577 |
Cost of shares redeemed
| (69,334,956) | (68,408,104) |
Net increase (decrease) in net assets from Class A share transactions
| (29,449,957) | (47,477,801) |
Class B Proceeds from shares sold
| 988,175 | 4,124,041 |
Reinvestment of distributions
| 2,615,910 | 1,244,936 |
Cost of shares redeemed
| (22,494,892) | (65,157,088) |
Net increase (decrease) in net assets from Class B share transactions
| (18,890,807) | (59,788,111) |
Increase (decrease) in net assets | (198,027,365) | (95,829,467) |
Net assets at beginning of period
| 329,820,022 | 425,649,489 |
Net assets at end of period (including undistributed net investment income of $2,432,744 and $3,748,514, respectively)
| $ 131,792,657 | $ 329,820,022 |
Other Information |
Class A Shares outstanding at beginning of period
| 21,062,118 | 24,284,177 |
Shares sold
| 291,614 | 967,409 |
Shares issued to shareholders in reinvestment of distributions
| 3,209,837 | 490,313 |
Shares redeemed
| (7,046,646) | (4,679,781) |
Net increase (decrease) in Class A shares
| (3,545,195) | (3,222,059) |
Shares outstanding at end of period
| 17,516,923 | 21,062,118 |
Class B Shares outstanding at beginning of period
| 1,546,251 | 5,597,014 |
Shares sold
| 73,239 | 287,676 |
Shares issued to shareholders in reinvestment of distributions
| 228,264 | 88,987 |
Shares redeemed
| (1,819,195) | (4,427,426) |
Net increase (decrease) in Class B shares
| (1,517,692) | (4,050,763) |
Shares outstanding at end of period
| 28,559 | 1,546,251 |
The accompanying notes are an integral part of the financial statements.
Financial Highlights
Class A Years Ended December 31, | 2008 | 2007 | 2006 | 2005 | 2004 |
Selected Per Share Data |
Net asset value, beginning of period | $ 14.59 | $ 14.25 | $ 12.49 | $ 11.48 | $ 10.31 |
Income (loss) from investment operations: Net investment income (loss)a | .12 | .15 | .10 | .09 | .08 |
Net realized and unrealized gain (loss) | (5.36) | .47 | 1.74 | 1.01 | 1.14 |
Total from investment operations | (5.24) | .62 | 1.84 | 1.10 | 1.22 |
Less distributions from: Net investment income | (.18) | (.10) | (.08) | (.09) | (.05) |
Net realized gains | (1.66) | (.18) | — | — | — |
Total distributions | (1.84) | (.28) | (.08) | (.09) | (.05) |
Net asset value, end of period | $ 7.51 | $ 14.59 | $ 14.25 | $ 12.49 | $ 11.48 |
Total Return (%)
| (40.23)b | 4.46b | 14.84b | 9.64b | 11.83 |
Ratios to Average Net Assets and Supplemental Data |
Net assets, end of period ($ millions)
| 132 | 307 | 346 | 309 | 268 |
Ratio of expenses before expense reductions (%)
| 1.07 | 1.02 | 1.02 | 1.02 | 1.05 |
Ratio of expenses after expense reductions (%)
| .90 | .88 | .85 | .96 | 1.05 |
Ratio of net investment income (%)
| 1.05 | 1.01 | .77 | .78 | .74 |
Portfolio turnover rate (%)
| 17 | 9 | 16 | 8 | 3 |
a Based on average shares outstanding during the period.
b Total return would have been lower had certain expenses not been reduced.
|
Class B Years Ended December 31, | 2008 | 2007 | 2006 | 2005 | 2004 |
Selected Per Share Data |
Net asset value, beginning of period | $ 14.57 | $ 14.22 | $ 12.47 | $ 11.46 | $ 10.29 |
Income (loss) from investment operations: Net investment income (loss)a | .04 | .09 | .05 | .04 | .04 |
Net realized and unrealized gain (loss) | (5.35) | .49 | 1.73 | 1.01 | 1.13 |
Total from investment operations | (5.31) | .58 | 1.78 | 1.05 | 1.17 |
Less distributions from: Net investment income | (.13) | (.05) | (.03) | (.04) | (.00)* |
Net realized gains | (1.66) | (.18) | — | — | — |
Total distributions | (1.79) | (.23) | (.03) | (.04) | (.00)* |
Net asset value, end of period | $ 7.47 | $ 14.57 | $ 14.22 | $ 12.47 | $ 11.46 |
Total Return (%)
| (40.78)b | 4.14b | 14.34b | 9.23b | 11.42 |
Ratios to Average Net Assets and Supplemental Data |
Net assets, end of period ($ millions)
| .21 | 23 | 80 | 78 | 66 |
Ratio of expenses before expense reductions (%)
| 1.53 | 1.39 | 1.40 | 1.41 | 1.44 |
Ratio of expenses after expense reductions (%)
| 1.32 | 1.25 | 1.23 | 1.34 | 1.44 |
Ratio of net investment income (%)
| .63 | .64 | .39 | .40 | .36 |
Portfolio turnover rate (%)
| 17 | 9 | 16 | 8 | 3 |
a Based on average shares outstanding during the period.
b Total return would have been lower had certain expenses not been reduced.
* Amount is less than $.005.
|
Performance Summary December 31, 2008
DWS Dreman High Return Equity VIP
All performance shown is historical, assumes reinvestment of all dividend and capital gain distributions and does not guarantee future results. Investment return and principal value fluctuate with changing market conditions so that, when redeemed, shares may be worth more or less than their original cost. Current performance may be lower or higher than the performance data quoted. Please contact your participating insurance company for the Portfolio's most recent month-end performance. Performance doesn't reflect charges and fees ("contract charges") associated with the separate account that invests in the Portfolio or any variable life insurance policy or variable annuity contract for which the Portfolio is an investment option. These charges and fees will reduce returns. While all share classes have the same underlying portfolio, their performance will differ.
The total annual portfolio operating expense ratios, gross of any fee waivers or expense reimbursements, as stated in the fee table of the prospectus dated May 1, 2008 are 0.78% and 1.13% for Class A and Class B shares, respectively. Please see the Information About Your Portfolio's Expenses, the Financial Highlights and Notes to the Financial Statements (Note C, Related Parties) sections of this report for gross and net expense related disclosure for the period ended December 31, 2008.
Risk Considerations
This Portfolio is subject to stock market risk, meaning stocks in the Portfolio may decline in value for extended periods of time due to the activities and financial prospects of individual companies, or due to general market and economic conditions. In addition, the Portfolio may focus its investments on certain economic sectors, thereby increasing its vulnerability to any single economic, political or regulatory development. This may result in greater share price volatility. Please read this Portfolio's prospectus for specific details regarding this product's investments and risk profile.
Portfolio returns shown for all periods reflect a waiver and/or expense reimbursement. Without this waiver/reimbursement, returns would have been lower.
Growth of an Assumed $10,000 Investment in DWS Dreman High Return Equity VIP |
[] DWS Dreman High Return Equity VIP — Class A [] S&P 500® Index | The Standard & Poor's 500® (S&P 500) Index is an unmanaged capitalization-weighted index of 500 stocks. The index is designed to measure performance of the broad domestic economy through changes in the aggregate market value of 500 stocks representing all major industries. Index returns assume reinvestment of dividends and, unlike portfolio returns, do not reflect any fees or expenses. It is not possible to invest directly into an index. |
 | |
Yearly periods ended December 31 |
|
Comparative Results |
DWS Dreman High Return Equity VIP | 1-Year | 3-Year | 5-Year | 10-Year |
Class A | Growth of $10,000
| $5,402 | $6,295 | $7,741 | $9,879 |
Average annual total return
| -45.98% | -14.30% | -4.99% | -.12% |
S&P 500 Index
| Growth of $10,000
| $6,300 | $7,696 | $8,953 | $8,700 |
Average annual total return
| -37.00% | -8.36% | -2.19% | -1.38% |
DWS Dreman High Return Equity VIP | 1-Year | 3-Year | 5-Year | Life of Class* |
Class B | Growth of $10,000
| $5,384 | $6,225 | $7,598 | $9,143 |
Average annual total return
| -46.16% | -14.61% | -5.34% | -1.37% |
S&P 500 Index
| Growth of $10,000
| $6,300 | $7,696 | $8,953 | $10,335 |
Average annual total return
| -37.00% | -8.36% | -2.19% | .51% |
The growth of $10,000 is cumulative.
* The Portfolio commenced offering Class B shares on July 1, 2002. Index returns began on June 30, 2002.Information About Your Portfolio's Expenses
DWS Dreman High Return Equity VIP
As an investor of the Portfolio, you incur two types of costs: ongoing expenses and transaction costs. Ongoing expenses include management fees, distribution and service (12b-1) fees and other Portfolio expenses. Examples of transaction costs include contract charges, redemption fees and account maintenance fees, which are not shown in this section. The following tables are intended to help you understand your ongoing expenses (in dollars) of investing in the Portfolio and to help you compare these expenses with the ongoing expenses of investing in other mutual funds. In the most recent six-month period, the Portfolio limited these expenses; had it not done so, expenses would have been higher. The example in the table is based on an investment of $1,000 invested at the beginning of the six-month period and held for the entire period (July 1, 2008 to December 31, 2008).
The tables illustrate your Portfolio's expenses in two ways:
• Actual Portfolio Return. This helps you estimate the actual dollar amount of ongoing expenses (but not transaction costs) paid on a $1,000 investment in the Portfolio using the Portfolio's actual return during the period. To estimate the expenses you paid over the period, simply divide your account value by $1,000 (for example, an $8,600 account value divided by $1,000 = 8.6), then multiply the result by the number in the "Expenses Paid per $1,000" line under the share class you hold.
• Hypothetical 5% Portfolio Return. This helps you to compare your Portfolio's ongoing expenses (but not transaction costs) with those of other mutual funds using the Portfolio's actual expense ratio and a hypothetical rate of return of 5% per year before expenses. Examples using a 5% hypothetical Portfolio return may be found in the shareholder reports of other mutual funds. The hypothetical account values and expenses may not be used to estimate the actual ending account balance or expenses you paid for the period.
Please note that the expenses shown in these tables are meant to highlight your ongoing expenses only and do not reflect any transaction costs. The "Expenses Paid per $1,000" line of the tables is useful in comparing ongoing expenses only and will not help you determine the relative total expense of owning different funds. If these transaction costs had been included, your costs would have been higher.
Expenses and Value of a $1,000 Investment for the six months ended December 31, 2008 |
Actual Portfolio Return | Class A | | Class B | |
Beginning Account Value 7/1/08
| $ 1,000.00 | | $ 1,000.00 | |
Ending Account Value 12/31/08
| $ 652.30 | | $ 651.30 | |
Expenses Paid per $1,000*
| $ 3.36 | | $ 4.77 | |
Hypothetical 5% Portfolio Return | Class A | | Class B | |
Beginning Account Value 7/1/08
| $ 1,000.00 | | $ 1,000.00 | |
Ending Account Value 12/31/08
| $ 1,021.06 | | $ 1,019.36 | |
Expenses Paid per $1,000*
| $ 4.12 | | $ 5.84 | |
* Expenses are equal to the Portfolio's annualized expense ratio for each share class, multiplied by the average account value over the period, multiplied by the number of days in the most recent six-month period, then divided by 366.Annualized Expense Ratios | Class A | | Class B | |
DWS Variable Series II — DWS Dreman High Return Equity VIP
| .81% | | 1.15% | |
For more information, please refer to the Portfolio's prospectus.
These tables do not reflect charges and fees ("contract charges") associated with the separate account that invests in the Portfolio or any variable life insurance policy or variable annuity contract for which the Portfolio is an investment option.
Management Summary December 31, 2008
DWS Dreman High Return Equity VIP
The year just ended was the worst in many decades for the US equity markets. Essentially all equity indices posted negative returns for this period, as markets reflected economic problems including a housing slump, rising unemployment, a crisis of confidence and an extreme credit crunch. The Russell 3000® Index, which is generally regarded as a good indicator of the broad stock market, had a negative return of -37.31% for the 12 months ended December 31, 2008. With a return of -45.98% (Class A shares, unadjusted for contract charges), DWS Dreman High Return Equity VIP underperformed its benchmark, the Standard & Poor's® 500 (S&P 500) Index, which posted a return of -37.00%.
The Portfolio's underperformance relative to the benchmark resulted mainly from a significant overweight and stock selection in the financial sector. Large positions that performed poorly included Washington Mutual, Inc., Fannie Mae, Freddie Mac and Wachovia Corp.; all of these except Washington Mutual have been eliminated from the Portfolio, and the overweight position in financials has been reduced.1 Severe liquidity problems throughout the financial industry have caused essentially all financial stocks to perform poorly.
An overweight position in energy contributed to performance relative to the benchmark. We find this sector attractive because we believe there is likely to be substantial long-term growth in worldwide demand for energy. Other positives were positions in retailer Lowe's Companies, Inc. and UST, Inc., a producer of smokeless tobacco products, which was acquired by Altria Group, Inc. after the end of the period.
David N. Dreman F. James Hutchinson E. Clifton Hoover, Jr.
Lead Portfolio Manager Portfolio Managers, Dreman Value Management L.L.C., Subadvisor to the Portfolio
The Russell 3000 Index is an unmanaged index that measures the performance of the 3,000 largest US companies based on total market capitalization, which represents approximately 98% of the investable US equity market.
The Standard & Poor's 500 (S&P 500) Index is an unmanaged, capitalization-weighted index of 500 stocks. The index is designed to measure performance of the broad domestic economy through changes in the aggregate market value of 500 stocks representing all major industries.
Index returns assume reinvestment of dividends and, unlike portfolio returns, do not reflect any fees or expenses. It is not possible to invest directly into an index.
1 "Overweight" means the portfolio holds a higher weighting in a given sector or security than the benchmark. "Underweight" means the portfolio holds a lower weighting.Portfolio management market commentary is as of December 31, 2008, and may not come to pass. This information is subject to change at any time based on market and other conditions. Past performance does not guarantee future results. Current and future portfolio holdings are subject to risk.
Portfolio Summary
DWS Dreman High Return Equity VIP
Asset Allocation (As a % of Investment Portfolio excluding Securities Lending Collateral) | 12/31/08 | 12/31/07 |
| | |
Common Stocks | 100% | 100% |
Sector Diversification (As a % of Common Stocks) | 12/31/08 | 12/31/07 |
| | |
Energy | 29% | 26% |
Financials | 20% | 30% |
Health Care | 19% | 16% |
Industrials | 10% | 8% |
Consumer Discretionary | 10% | 6% |
Consumer Staples | 7% | 12% |
Materials | 3% | — |
Telecommunication Services | 2% | 2% |
| 100% | 100% |
Asset allocation and sector diversification are subject to change.
For more complete details about the Portfolio's investment portfolio, see page 101. A complete list of portfolio holdings of the portfolio is posted as of the month end on www.dws-investments.com on or about the 15th day of the following month. More frequent posting of portfolio holdings information may be made from time to time on www.dws-investments.com.
Following the Portfolio's fiscal first and third quarter-end, a complete portfolio holdings listing is filed with the SEC on Form N-Q. The form will be available on the SEC's Web site at www.sec.gov, and it also may be reviewed and copied at the SEC's Public Reference Room in Washington, D.C. Information on the operation of the SEC's Public Reference Room may be obtained by calling (800) SEC-0330.
Investment Portfolio December 31, 2008
DWS Dreman High Return Equity VIP
|
Shares
| Value ($) |
| |
Common Stocks 99.6% |
Consumer Discretionary 10.2% |
Hotels Restaurants & Leisure 1.2% |
Carnival Corp. (Unit) | 152,305 | 3,704,057 |
Media 1.7% |
Walt Disney Co. (a) | 239,830 | 5,441,743 |
Multiline Retail 0.2% |
Macy's, Inc. | 51,730 | 535,405 |
Specialty Retail 7.1% |
Lowe's Companies, Inc. | 408,367 | 8,788,058 |
Staples, Inc. | 741,165 | 13,281,677 |
| 22,069,735 |
Consumer Staples 6.8% |
Tobacco |
Altria Group, Inc. | 960,227 | 14,461,019 |
Philip Morris International, Inc. | 119,594 | 5,203,535 |
UST, Inc. | 21,840 | 1,515,259 |
| 21,179,813 |
Energy 28.6% |
Oil, Gas & Consumable Fuels |
Anadarko Petroleum Corp. | 332,690 | 12,825,200 |
Apache Corp. | 166,530 | 12,411,481 |
Chesapeake Energy Corp. | 388,790 | 6,286,734 |
Chevron Corp. | 138,165 | 10,220,065 |
ConocoPhillips | 386,204 | 20,005,367 |
Devon Energy Corp. | 260,380 | 17,109,570 |
Occidental Petroleum Corp. | 96,990 | 5,818,430 |
Valero Energy Corp. | 184,820 | 3,999,505 |
| 88,676,352 |
Financials 19.7% |
Capital Markets 1.9% |
The Goldman Sachs Group, Inc. | 69,375 | 5,854,556 |
Commercial Banks 6.0% |
KeyCorp. | 113,610 | 967,957 |
PNC Financial Services Group, Inc. | 148,851 | 7,293,699 |
SunTrust Banks, Inc. | 135,600 | 4,005,624 |
US Bancorp. (a) | 175,595 | 4,391,631 |
Wells Fargo & Co. | 62,625 | 1,846,185 |
| 18,505,096 |
Consumer Finance 1.2% |
American Express Co. | 207,434 | 3,847,901 |
Diversified Financial Services 7.1% |
Bank of America Corp. | 723,434 | 10,185,951 |
Citigroup, Inc. (a) | 559,155 | 3,751,930 |
JPMorgan Chase & Co. | 254,750 | 8,032,267 |
| 21,970,148 |
Insurance 3.5% |
Allstate Corp. | 76,414 | 2,503,323 |
Chubb Corp. | 77,931 | 3,974,481 |
Hartford Financial Services Group, Inc. (a) | 68,918 | 1,131,633 |
The Travelers Companies, Inc. | 72,065 | 3,257,338 |
| 10,866,775 |
|
Shares
| Value ($) |
| |
Thrifts & Mortgage Finance 0.0% |
Washington Mutual, Inc. | 1,394,944 | 29,992 |
Health Care 19.0% |
Biotechnology 0.6% |
Amgen, Inc.* | 30,550 | 1,764,263 |
Health Care Providers & Services 9.3% |
Aetna, Inc. | 352,405 | 10,043,542 |
UnitedHealth Group, Inc. | 706,855 | 18,802,343 |
| 28,845,885 |
Pharmaceuticals 9.1% |
Eli Lilly & Co. | 73,055 | 2,941,925 |
Pfizer, Inc. | 884,036 | 15,656,278 |
Wyeth | 259,950 | 9,750,724 |
| 28,348,927 |
Industrials 10.3% |
Aerospace & Defense 4.3% |
Northrop Grumman Corp. | 111,278 | 5,011,961 |
United Technologies Corp. | 157,795 | 8,457,812 |
| 13,469,773 |
Air Freight & Logistics 1.3% |
FedEx Corp. | 64,010 | 4,106,242 |
Industrial Conglomerates 3.1% |
3M Co. | 29,606 | 1,703,529 |
General Electric Co. | 477,690 | 7,738,578 |
| 9,442,107 |
Machinery 1.6% |
Caterpillar, Inc. | 65,595 | 2,930,129 |
Eaton Corp. | 37,795 | 1,878,789 |
| 4,808,918 |
Materials 3.2% |
Metals & Mining |
BHP Billiton Ltd. (ADR) (a) | 187,105 | 8,026,804 |
Newmont Mining Corp. | 49,315 | 2,007,121 |
| 10,033,925 |
Telecommunication Services 1.8% |
Diversified Telecommunication Services |
Verizon Communications, Inc. | 165,450 | 5,608,755 |
Total Common Stocks (Cost $345,053,205) | 309,110,368 |
|
Securities Lending Collateral 4.3% |
Daily Assets Fund Institutional, 1.69% (b) (c) (Cost $13,251,485) | 13,251,485 | 13,251,485 |
| % of Net Assets | Value ($) |
| |
Total Investment Portfolio (Cost $358,304,690)+ | 103.9 | 322,361,853 |
Other Assets and Liabilities, Net | (3.9) | (12,059,253) |
Net Assets | 100.0 | 310,302,600 |
* Non-income producing security.+ The cost for federal income tax purposes was $359,927,600. At December 31, 2008, net unrealized depreciation for all securities based on tax cost was $37,565,747. This consisted of aggregate gross unrealized appreciation for all securities in which there was an excess of value over tax cost of $48,500,450 and aggregate gross unrealized depreciation for all securities in which there was an excess of tax cost over value of $86,066,197.(a) All or a portion of these securities were on loan (see Notes to Financial Statements). The value of all securities loaned at December 31, 2008 amounted to $12,970,979, which is 4.2% of net assets.(b) Affiliated fund managed by Deutsche Investment Management Americas Inc. The rate shown is the annualized seven-day yield at period end.(c) Represents collateral held in connection with securities lending. Income earned by the Portfolio is net of borrower rebates.ADR: American Depositary Receipt
Fair Value Measurements
The following is a summary of the inputs used as of December 31, 2008 in valuing the Portfolio's investments. For information on the Portfolio's policy regarding the valuation of investments and of the valuation inputs, and the aggregate levels used in the table below, please refer to the Security Valuation section of Note A in the accompanying Notes to the Financial Statements.
Valuation Inputs | Investments in Securities |
Level 1
| $ 322,361,853 |
Level 2
| — |
Level 3
| — |
Total | $ 322,361,853 |
The accompanying notes are an integral part of the financial statements.
Financial Statements
Statement of Assets and Liabilities as of December 31, 2008
|
Assets |
Investments:
Investments in securities, at value (cost $345,053,205) — including $12,970,979 of securities loaned | $ 309,110,368 |
Investment in Daily Assets Fund Institutional (cost $13,251,485)* | 13,251,485 |
Total investments at value (cost $358,304,690)
| 322,361,853 |
Cash
| 25,087 |
Dividends receivable
| 874,284 |
Receivable for investments sold
| 1,714,667 |
Receivable for Portfolio shares sold
| 25,285 |
Interest receivable
| 13,652 |
Other assets
| 12,226 |
Total assets
| 325,027,054 |
Liabilities |
Payable upon return of securities loaned
| 13,251,485 |
Payable for investments purchased
| 600,306 |
Payable for Portfolio shares redeemed
| 63,822 |
Accrued management fee
| 169,463 |
Note payable
| 450,000 |
Other accrued expenses and payables
| 189,378 |
Total liabilities
| 14,724,454 |
Net assets, at value | $ 310,302,600 |
Net Assets Consist of |
Undistributed net investment income
| 12,673,806 |
Net unrealized appreciation (depreciation) on investments
| (35,942,837) |
Accumulated net realized gain (loss)
| (148,694,230) |
Paid-in capital
| 482,265,861 |
Net assets, at value | $ 310,302,600 |
Class A Net Asset Value, offering and redemption price per share ($308,264,855 ÷ 49,642,073 outstanding shares of beneficial interest, $.01 par value, unlimited number of shares authorized)
| $ 6.21 |
Class B Net Asset Value, offering and redemption price per share ($2,037,745 ÷ 327,546 outstanding shares of beneficial interest, $.01 par value, unlimited number of shares authorized)
| $ 6.22 |
The accompanying notes are an integral part of the financial statements.
Statement of Operations for the year ended December 31, 2008
|
Investment Income |
Income:
Dividends (net of foreign taxes withheld of $186)
| $ 17,082,533 |
Interest
| 220 |
Interest — Cash Management QP Trust
| 32,930 |
Securities lending income, including income from Daily Assets Fund Institutional, net of borrower rebates
| 258,210 |
Total Income
| 17,373,893 |
Expenses:
Management fee
| 3,949,911 |
Administration fee
| 331,580 |
Custodian and accounting fees
| 68,023 |
Distribution service fee (Class B)
| 31,412 |
Services to shareholders
| 1,051 |
Record keeping fees (Class B)
| 11,164 |
Professional fees
| 87,307 |
Trustees' fees and expenses
| 57,333 |
Reports to shareholders and shareholder meeting
| 145,448 |
Interest expense
| 15,847 |
Other
| 27,545 |
Total expenses before expense reductions
| 4,726,621 |
Expense reductions
| (41,375) |
Total expenses after expense reductions
| 4,685,246 |
Net investment income (loss) | 12,688,647 |
Realized and Unrealized Gain (Loss) |
Net realized gain (loss) from:
Investments
| (145,580,587) |
Futures
| (102,946) |
| (145,683,533) |
Change in net unrealized appreciation (depreciation) on:
Investments
| (192,880,861) |
| (192,880,861) |
Net gain (loss) | (338,564,394) |
Net increase (decrease) in net assets resulting from operations | $ (325,875,747) |
* Represents collateral on securities loaned.The accompanying notes are an integral part of the financial statements.
Statement of Changes in Net Assets |
| Years Ended December 31, |
Increase (Decrease) in Net Assets | 2008 | 2007 |
Operations:
Net investment income (loss)
| $ 12,688,647 | $ 19,420,427 |
Net realized gain (loss)
| (145,683,533) | 122,846,409 |
Change in net unrealized appreciation (depreciation)
| (192,880,861) | (150,271,931) |
Net increase (decrease) in net assets resulting from operations
| (325,875,747) | (8,005,095) |
Distributions to shareholders from:
Net investment income:
Class A | (18,513,153) | (13,677,685) |
Class B | (745,822) | (1,939,768) |
Net realized gains:
Class A | (116,884,417) | (7,925,978) |
Class B | (5,393,183) | (1,537,591) |
Total distributions
| (141,536,575) | (25,081,022) |
Portfolio share transactions:
Class A Proceeds from shares sold
| 14,533,917 | 30,297,612 |
Reinvestment of distributions
| 135,397,570 | 21,603,663 |
Cost of shares redeemed
| (175,333,071) | (218,373,492) |
Net increase (decrease) in net assets from Class A share transactions
| (25,401,584) | (166,472,217) |
Class B Proceeds from shares sold
| 1,441,659 | 4,409,581 |
Reinvestment of distributions
| 6,139,005 | 3,477,359 |
Cost of shares redeemed
| (32,996,043) | (163,138,034) |
Net increase (decrease) in net assets from Class B share transactions
| (25,415,379) | (155,251,094) |
Increase (decrease) in net assets | (518,229,285) | (354,809,428) |
Net assets at beginning of period
| 828,531,885 | 1,183,341,313 |
Net assets at end of period (including undistributed net investment income of $12,673,806 and $19,200,356, respectively)
| $ 310,302,600 | $ 828,531,885 |
Other Information |
Class A Shares outstanding at beginning of period
| 54,976,574 | 66,083,197 |
Shares sold
| 1,441,589 | 2,028,711 |
Shares issued to shareholders in reinvestment of distributions
| 13,132,645 | 1,492,997 |
Shares redeemed
| (19,908,735) | (14,628,331) |
Net increase (decrease) in Class A shares
| (5,334,501) | (11,106,623) |
Shares outstanding at end of period
| 49,642,073 | 54,976,574 |
Class B Shares outstanding at beginning of period
| 2,551,709 | 12,713,676 |
Shares sold
| 160,248 | 292,792 |
Shares issued to shareholders in reinvestment of distributions
| 593,141 | 239,488 |
Shares redeemed
| (2,977,552) | (10,694,247) |
Net increase (decrease) in Class B shares
| (2,224,163) | (10,161,967) |
Shares outstanding at end of period
| 327,546 | 2,551,709 |
The accompanying notes are an integral part of the financial statements.
Financial Highlights
Class A Years Ended December 31, | 2008 | 2007 | 2006 | 2005 | 2004 |
Selected Per Share Data |
Net asset value, beginning of period | $ 14.40 | $ 15.02 | $ 13.41 | $ 12.65 | $ 11.29 |
Income (loss) from investment operations: Net investment income (loss)a | .22 | .29 | .27 | .24 | .23 |
Net realized and unrealized gain (loss) | (5.80) | (.56) | 2.21 | .75 | 1.32 |
Total from investment operations | (5.58) | (.27) | 2.48 | .99 | 1.55 |
Less distributions from: Net investment income | (.36) | (.22) | (.28) | (.23) | (.19) |
Net realized gains | (2.25) | (.13) | (.59) | — | — |
Total distributions | (2.61) | (.35) | (.87) | (.23) | (.19) |
Net asset value, end of period | $ 6.21 | $ 14.40 | $ 15.02 | $ 13.41 | $ 12.65 |
Total Return (%)
| (45.98)b | (1.86) | 18.74 | 7.92 | 13.95 |
Ratios to Average Net Assets and Supplemental Data |
Net assets, end of period ($ millions)
| 308 | 792 | 992 | 785 | 747 |
Ratio of expenses before expense reductions (%)
| .81 | .78 | .77 | .78 | .78 |
Ratio of expenses after expense reductions(%)
| .80 | .78 | .77 | .78 | .78 |
Ratio of net investment income (%)
| 2.21 | 1.94 | 1.87 | 1.84 | 1.96 |
Portfolio turnover rate (%)
| 28 | 27 | 20 | 10 | 9 |
a Based on average shares outstanding during the period.
b Total return would have been lower had certain expenses not been reduced.
|
Class B Years Ended December 31, | 2008 | 2007 | 2006 | 2005 | 2004 |
Selected Per Share Data |
Net asset value, beginning of period | $ 14.41 | $ 15.02 | $ 13.39 | $ 12.63 | $ 11.27 |
Income (loss) from investment operations: Net investment income (loss)a | .16 | .24 | .22 | .19 | .18 |
Net realized and unrealized gain (loss) | (5.79) | (.56) | 2.19 | .75 | 1.33 |
Total from investment operations | (5.63) | (.32) | 2.41 | .94 | 1.51 |
Less distributions from: Net investment income | (.31) | (.16) | (.19) | (.18) | (.15) |
Net realized gains | (2.25) | (.13) | (.59) | — | — |
Total distributions | (2.56) | (.29) | (.78) | (.18) | (.15) |
Net asset value, end of period | $ 6.22 | $ 14.41 | $ 15.02 | $ 13.39 | $ 12.63 |
Total Return (%)
| (46.16)b | (2.19)b | 18.21b | 7.51 | 13.53 |
Ratios to Average Net Assets and Supplemental Data |
Net assets, end of period ($ millions)
| 2 | 37 | 191 | 135 | 117 |
Ratio of expenses before expense reduction (%)
| 1.21 | 1.15 | 1.16 | 1.17 | 1.16 |
Ratio of expenses after expense reduction (%)
| 1.17 | 1.13 | 1.16 | 1.17 | 1.16 |
Ratio of net investment income (%)
| 1.84 | 1.59 | 1.48 | 1.45 | 1.58 |
Portfolio turnover rate (%)
| 28 | 27 | 20 | 10 | 9 |
a Based on average shares outstanding during the period.
b Total return would have been lower had certain expenses not been reduced.
|
Performance Summary December 31, 2008
DWS Dreman Small Mid Cap Value VIP
All performance shown is historical, assumes reinvestment of all dividend and capital gain distributions and does not guarantee future results. Investment return and principal value fluctuate with changing market conditions so that, when redeemed, shares may be worth more or less than their original cost. Current performance may be lower or higher than the performance data quoted. Please contact your participating insurance company for the Portfolio's most recent month-end performance. Performance doesn't reflect charges and fees ("contract charges") associated with the separate account that invests in the Portfolio or any variable life insurance policy or variable annuity contract for which the Portfolio is an investment option. These charges and fees will reduce returns. While all share classes have the same underlying portfolio, their performance will differ.
The total annual Portfolio operating expense ratios, gross of any fee waivers or expense reimbursements, as stated in the fee table of the prospectus dated May 1, 2008 are 0.78% and 1.17% for Class A and Class B shares, respectively. Please see the Information About Your Portfolio's Expenses, the Financial Highlights and Notes to the Financial Statements (Note C, Related Parties) sections of this report for gross and net expense related disclosure for the period ended December 31, 2008.
Risk Considerations
This Portfolio is subject to stock market risk. Stocks of small and medium-sized companies involve greater risk than securities of larger, more-established companies, as they often have limited product lines, markets or financial resources and may be exposed to more erratic and abrupt market movements. Small and mid-cap company stocks tend to experience steeper price fluctuations — down as well as up — than stocks of larger companies. Small and mid-cap company stocks are typically less liquid than large company stocks. The Portfolio may focus its investments on certain economic sectors, thereby increasing its vulnerability to any single economic, political, or regulatory development. This may result in greater share price volatility. Please read this Portfolio's prospectus for specific details regarding this product's investments and risk profile.
Portfolio returns shown for all periods reflect a fee waiver and/or expense reimbursement. Without this waiver/reimbursement, returns would have been lower.
Growth of an Assumed $10,000 Investment in DWS Dreman Small Mid Cap Value VIP |
[] DWS Dreman Small Mid Cap Value VIP — Class A [] Russell 2500™ Value Index | The Russell 2500™ Value Index is an unmanaged Index of those securities in the Russell 3000® Index with a lower price-to-book and lower forecasted growth values. Index returns assume reinvestment of dividends and, unlike portfolio returns, do not reflect any fees or expenses. It is not possible to invest directly into an index. |
 | |
Yearly periods ended December 31 |
|
Comparative Results |
DWS Dreman Small Mid Cap Value VIP | 1-Year | 3-Year | 5-Year | 10-Year |
Class A | Growth of $10,000
| $6,658 | $8,581 | $11,923 | $18,894 |
Average annual total return
| -33.42% | -4.97% | 3.58% | 6.57% |
Russell 2500 Value Index
| Growth of $10,000
| $6,801 | $7,579 | $9,928 | $17,445 |
Average annual total return
| -31.99% | -8.83% | -.15% | 5.72% |
DWS Dreman Small Mid Cap Value VIP | 1-Year | 3-Year | 5-Year | Life of Class* |
Class B | Growth of $10,000
| $6,633 | $8,484 | $11,691 | $13,920 |
Average annual total return
| -33.67% | -5.33% | 3.17% | 5.22% |
Russell 2500 Value Index
| Growth of $10,000
| $6,801 | $7,579 | $9,928 | $12,383 |
Average annual total return
| -31.99% | -8.83% | -.15% | 3.34% |
The growth of $10,000 is cumulative.
* The Portfolio commenced offering Class B shares on July 1, 2002. Index returns began on June 30, 2002.Information About Your Portfolio's Expenses
DWS Dreman Small Mid Cap Value VIP
As an investor of the Portfolio, you incur two types of costs: ongoing expenses and transaction costs. Ongoing expenses include management fees, distribution and service (12b-1) fees and other Portfolio expenses. Examples of transaction costs include contract charges, redemption fees and account maintenance fees, which are not shown in this section. The following tables are intended to help you understand your ongoing expenses (in dollars) of investing in the Portfolio and to help you compare these expenses with the ongoing expenses of investing in other mutual funds. In the most recent six-month period, the Portfolio limited these expenses, had it not done so, expenses would have been higher. The example in the table is based on an investment of $1,000 invested at the beginning of the six-month period and held for the entire period (July 1, 2008 to December 31, 2008).
The tables illustrate your Portfolio's expenses in two ways:
• Actual Portfolio Return. This helps you estimate the actual dollar amount of ongoing expenses (but not transaction costs) paid on a $1,000 investment in the Portfolio using the Portfolio's actual return during the period. To estimate the expenses you paid over the period, simply divide your account value by $1,000 (for example, an $8,600 account value divided by $1,000 = 8.6), then multiply the result by the number in the "Expenses Paid per $1,000" line under the share class you hold.
• Hypothetical 5% Portfolio Return. This helps you to compare your Portfolio's ongoing expenses (but not transaction costs) with those of other mutual funds using the Portfolio's actual expense ratio and a hypothetical rate of return of 5% per year before expenses. Examples using a 5% hypothetical Portfolio return may be found in the shareholder reports of other mutual funds. The hypothetical account values and expenses may not be used to estimate the actual ending account balance or expenses you paid for the period.
Please note that the expenses shown in these tables are meant to highlight your ongoing expenses only and do not reflect any transaction costs. The "Expenses Paid per $1,000" line of the tables is useful in comparing ongoing expenses only and will not help you determine the relative total expense of owning different funds. If these transaction costs had been included, your costs would have been higher.
Expenses and Value of a $1,000 Investment for the six months ended December 31, 2008 |
Actual Portfolio Return | Class A | | Class B | |
Beginning Account Value 7/1/08
| $ 1,000.00 | | $ 1,000.00 | |
Ending Account Value 12/31/08
| $ 735.60 | | $ 734.00 | |
Expenses Paid per $1,000*
| $ 3.62 | | $ 5.10 | |
Hypothetical 5% Portfolio Return | Class A | | Class B | |
Beginning Account Value 7/1/08
| $ 1,000.00 | | $ 1,000.00 | |
Ending Account Value 12/31/08
| $ 1,020.96 | | $ 1,019.25 | |
Expenses Paid per $1,000*
| $ 4.22 | | $ 5.94 | |
* Expenses are equal to the Portfolio's annualized expense ratio for each share class, multiplied by the average account value over the period, multiplied by the number of days in the most recent six-month period, then divided by 366.Annualized Expense Ratios | Class A | | Class B | |
DWS Variable Series II — DWS Dreman Small Mid Cap Value VIP
| .83% | | 1.17% | |
For more information, please refer to the Portfolio's prospectus.
These tables do not reflect charges and fees ("contract charges") associated with the separate account that invests in the Portfolio or any variable life insurance policy or variable annuity contract for which the Portfolio is an investment option.
Management Summary December 31, 2008
DWS Dreman Small Mid Cap Value VIP
The year just ended was the worst in many decades for the US equity markets. Essentially all equity indices posted negative returns for this period, as markets reflected economic problems including a housing slump, rising unemployment, a crisis of confidence and an extreme credit crunch. The Russell 3000® Index, which is generally regarded as a good indicator of the broad stock market, had a return of -37.31% for the 12 months ended December 31, 2008. Small-cap stocks, as measured by the Russell 2000® Index, were slightly stronger than large-cap, as measured by the Russell 1000® Index. Mid-cap stocks were the weakest category, as measured by the Russell Midcap® Index, which returned -41.46%. Within the Portfolio's capitalization range, value stocks were stronger than growth stocks: the Russell 2500 Value™ Index returned -31.99%, while the Russell 2500™ Growth Index returned -41.50%. The DWS Dreman Small Mid Cap VIP (Class A shares, unadjusted for contract charges) returned -33.42% for 2008, underperforming its benchmark, the Russell 2500 Value Index.
In this very difficult market environment, the Portfolio's performance benefited from avoiding some of the worst-performing stocks, particularly in information technology and health care. Holdings with positive returns included IPC Holdings Ltd., a provider of catastrophe reinsurance, and Healthspring, Inc., a managed care organization focused on Medicare. An overweight and stock selection in the energy sector detracted from performance; stock selection in financials also detracted.1 Positions that performed particularly well included Walter Industries, Inc., a company with a diversified line of products and services, including coal and natural gas, furnace and foundry coke and slag fiber, mortgage financing and home construction; and Superior Energy Services, Inc., a provider of specialized oilfield services and equipment. Positions that detracted from performance included Protective Life Corp.*, a life insurance company; CommScope, Inc., which provides infrastructure solutions for communications networks; and General Cable Corp., which produces copper, aluminum and fiber optic wire and cable products.
David N. Dreman E. Clifton Hoover, Jr. Mark Roach
Lead Portfolio Manager Portfolio Managers
Dreman Value Management, L.L.C., Subadvisor to the Portfolio
The Russell 3000 Index is an unmanaged index that measures the performance of the 3,000 largest US companies based on total market capitalization, which represents approximately 98% of the investable US equity market.
The Russell 2000 Index is an unmanaged, capitalization-weighted measure of approximately 2,000 of the smallest companies in the Russell 3000 Index.The Russell 1000 Index is an unmanaged index that measures the performance of the 1,000 largest companies in the Russell 3000 Index, which represents approximately 92% of the total market capitalization of the Russell 3000 Index.The Russell Midcap Index measures the performance of the 800 smallest companies in the Russell 1000 Index, which represents approximately 25% of the total market capitalization of the Russell 1000 Index.The Russell 2500 Value Index is an unmanaged index of those securities in the Russell 3000 Index with a lower price-to-book ratio and lower forecasted growth values.
The Russell 2500 Growth Index is an unmanaged index of those securities with high price-to-book and higher forecasted growth values.Index returns assume reinvestment of dividends and, unlike portfolio returns, do not reflect any fees or expenses. It is not possible to invest directly into an index.
1 "Overweight" means the portfolio holds a higher weighting in a given sector or security than the benchmark. "Underweight" means the portfolio holds a lower weighting.* Not held in the Portfolio as of December 31, 2008.Portfolio management market commentary is as of December 31, 2008, and may not come to pass. This information is subject to change at any time based on market and other conditions. Past performance does not guarantee future results. Current and future portfolio holdings are subject to risk.
Portfolio Summary
DWS Dreman Small Mid Cap Value VIP
Asset Allocation (As a % of Investment Portfolio excluding Securities Lending Collateral) | 12/31/08 | 12/31/07 |
| | |
Common Stocks | 99% | 97% |
Cash Equivalents | 1% | 3% |
| 100% | 100% |
Sector Diversification (As a % of Common Stocks) | 12/31/08 | 12/31/07 |
| | |
Industrials | 23% | 20% |
Financials | 22% | 25% |
Consumer Staples | 12% | 12% |
Health Care | 11% | 8% |
Information Technology | 9% | 7% |
Energy | 6% | 12% |
Consumer Discretionary | 6% | 7% |
Utilities | 5% | 4% |
Materials | 4% | 4% |
Telecommunications Services | 2% | 1% |
| 100% | 100% |
Asset allocation and sector diversification are subject to change.
For more complete details about the Portfolio's investment portfolio, see page 112. A complete list of portfolio holdings of the portfolio is posted as of the month end on www.dws-investments.com on or about the 15th day of the following month. More frequent posting of portfolio holdings information may be made from time to time on www.dws-investments.com.
Following the Portfolio's fiscal first and third quarter-end, a complete portfolio holdings listing is filed with the SEC on Form N-Q. The form will be available on the SEC's Web site at www.sec.gov, and it also may be reviewed and copied at the SEC's Public Reference Room in Washington, D.C. Information on the operation of the SEC's Public Reference Room may be obtained by calling (800) SEC-0330.
Investment Portfolio December 31, 2008
DWS Dreman Small Mid Cap Value VIP
|
Shares
| Value ($) |
| |
Common Stocks 98.8% |
Consumer Discretionary 6.0% |
Auto Components 0.8% |
Autoliv, Inc. | 92,900 | 1,993,634 |
Diversified Consumer Services 1.4% |
Regis Corp. | 238,650 | 3,467,585 |
Leisure Equipment & Products 1.8% |
Mattel, Inc. (a) | 274,000 | 4,384,000 |
Specialty Retail 0.8% |
The Men's Wearhouse, Inc. (a) | 153,150 | 2,073,651 |
Textiles, Apparel & Luxury Goods 1.2% |
Hanesbrands, Inc.* (a) | 236,600 | 3,016,650 |
Consumer Staples 12.1% |
Food & Staples Retailing 3.5% |
Ruddick Corp. (a) | 152,250 | 4,209,712 |
Weis Markets, Inc. | 133,817 | 4,500,266 |
| 8,709,978 |
Food Products 6.9% |
Del Monte Foods Co. | 716,350 | 5,114,739 |
Ralcorp Holdings, Inc.* | 98,150 | 5,731,960 |
Sanderson Farms, Inc. (a) | 74,400 | 2,571,264 |
The J.M. Smucker Co. | 80,400 | 3,486,144 |
| 16,904,107 |
Tobacco 1.7% |
Vector Group Ltd. (a) | 310,260 | 4,225,741 |
Energy 6.2% |
Energy Equipment & Services 2.6% |
Atwood Oceanics, Inc.* (a) | 103,500 | 1,581,480 |
Hercules Offshore, Inc.* (a) | 200,100 | 950,475 |
Key Energy Services, Inc.* (a) | 406,250 | 1,791,563 |
Superior Energy Services, Inc.* | 129,650 | 2,065,324 |
| 6,388,842 |
Oil, Gas & Consumable Fuels 3.6% |
Arch Coal, Inc. (a) | 150,400 | 2,450,016 |
Cimarex Energy Co. (a) | 90,600 | 2,426,268 |
Pinnacle Gas Resources, Inc. 144A* | 241,000 | 74,710 |
St. Mary Land & Exploration Co. (a) | 150,850 | 3,063,764 |
Walter Industries, Inc. (a) | 53,900 | 943,789 |
| 8,958,547 |
Financials 22.0% |
Capital Markets 0.2% |
FBR Capital Markets Corp. 144A* | 95,600 | 464,616 |
Commercial Banks 2.6% |
Boston Private Financial Holdings, Inc. (a) | 233,200 | 1,595,088 |
MB Financial, Inc. (a) | 178,100 | 4,977,895 |
| 6,572,983 |
Insurance 16.5% |
Arch Capital Group Ltd.* (a) | 73,300 | 5,138,330 |
Argo Group International Holdings Ltd.* | 182,188 | 6,179,817 |
Endurance Specialty Holdings Ltd. | 220,250 | 6,724,232 |
|
Shares
| Value ($) |
| |
Hanover Insurance Group, Inc. | 110,000 | 4,726,700 |
HCC Insurance Holdings, Inc. (a) | 226,550 | 6,060,213 |
IPC Holdings Ltd. | 186,900 | 5,588,310 |
Platinum Underwriters Holdings Ltd. | 143,550 | 5,179,284 |
Willis Group Holdings Ltd. (a) | 47,159 | 1,173,316 |
| 40,770,202 |
Real Estate Investment Trusts 2.7% |
Hospitality Properties Trust (REIT) (a) | 199,200 | 2,962,104 |
Ventas, Inc. (REIT) (a) | 109,600 | 3,679,272 |
| 6,641,376 |
Health Care 10.8% |
Health Care Equipment & Supplies 1.1% |
Teleflex, Inc. | 54,600 | 2,735,460 |
Health Care Providers & Services 9.7% |
Amedisys, Inc.* (a) | 98,200 | 4,059,588 |
AmSurg Corp.* | 199,800 | 4,663,332 |
Healthspring, Inc.* (a) | 330,400 | 6,598,088 |
LifePoint Hospitals, Inc.* (a) | 137,200 | 3,133,648 |
Lincare Holdings, Inc.* (a) | 209,300 | 5,636,449 |
| 24,091,105 |
Industrials 22.7% |
Aerospace & Defense 3.7% |
Alliant Techsystems, Inc.* (a) | 65,700 | 5,634,432 |
Curtiss-Wright Corp. (a) | 105,100 | 3,509,289 |
| 9,143,721 |
Commercial Services & Supplies 2.5% |
Republic Services, Inc. | 103,455 | 2,564,649 |
The Brink's Co. | 135,900 | 3,652,992 |
| 6,217,641 |
Construction & Engineering 1.8% |
URS Corp.* | 110,000 | 4,484,700 |
Electrical Equipment 5.7% |
General Cable Corp.* (a) | 112,300 | 1,986,587 |
Hubbell, Inc. "B" (a) | 168,500 | 5,506,580 |
Regal-Beloit Corp. (a) | 173,900 | 6,606,461 |
| 14,099,628 |
Machinery 5.7% |
Barnes Group, Inc. (a) | 261,450 | 3,791,025 |
Joy Global, Inc. (a) | 117,700 | 2,694,153 |
Kennametal, Inc. | 195,000 | 4,327,050 |
Mueller Water Products, Inc. "A" (a) | 406,650 | 3,415,860 |
| 14,228,088 |
Professional Services 1.7% |
Kelly Services, Inc. "A" (a) | 326,250 | 4,244,513 |
Road & Rail 0.8% |
Ryder System, Inc. | 51,686 | 2,004,383 |
Trading Companies & Distributors 0.8% |
WESCO International, Inc.* | 99,600 | 1,915,308 |
Information Technology 8.5% |
Communications Equipment 0.9% |
CommScope, Inc.* (a) | 149,000 | 2,315,460 |
|
Shares
| Value ($) |
| |
Electronic Equipment, Instruments & Components 3.3% |
Anixter International, Inc.* (a) | 105,700 | 3,183,684 |
Arrow Electronics, Inc.* | 163,000 | 3,070,920 |
Jabil Circuit, Inc. | 284,600 | 1,921,050 |
| 8,175,654 |
IT Services 1.7% |
Affiliated Computer Services, Inc. "A"* (a) | 88,500 | 4,066,575 |
Software 2.6% |
Jack Henry & Associates, Inc. | 332,750 | 6,458,677 |
Materials 4.1% |
Chemicals 0.9% |
Ashland, Inc. | 1,278 | 13,432 |
CF Industries Holdings, Inc. | 46,300 | 2,276,108 |
| 2,289,540 |
Metals & Mining 3.2% |
IAMGOLD Corp. | 602,900 | 3,683,719 |
Reliance Steel & Aluminum Co. | 141,700 | 2,825,498 |
RTI International Metals, Inc.* (a) | 92,650 | 1,325,821 |
| 7,835,038 |
Telecommunication Services 1.4% |
Diversified Telecommunication Services |
Windstream Corp. (a) | 375,800 | 3,457,360 |
|
Shares
| Value ($) |
| |
Utilities 5.0% |
Electric Utilities 3.4% |
ALLETE, Inc. | 109,850 | 3,544,860 |
IDACORP, Inc. (a) | 170,650 | 5,025,642 |
| 8,570,502 |
Multi-Utilities 1.6% |
Integrys Energy Group, Inc. (a) | 90,600 | 3,893,988 |
Total Common Stocks (Cost $328,312,064) | 244,799,253 |
|
Securities Lending Collateral 29.1% |
Daily Assets Fund Institutional, 1.69% (b) (c) (Cost $72,016,899) | 72,016,899 | 72,016,899 |
|
Cash Equivalents 1.3% |
Cash Management QP Trust, 1.42% (b) (Cost $3,330,639) | 3,330,639 | 3,330,639 |
| % of Net Assets | Value ($) |
| |
Total Investment Portfolio (Cost $403,659,602)+ | 129.2 | 320,146,791 |
Other Assets and Liabilities, Net | (29.2) | (72,386,703) |
Net Assets | 100.0 | 247,760,088 |
* Non-income producing security.+ The cost for federal income tax purposes was $405,384,576. At December 31, 2008, net unrealized depreciation for all securities based on tax cost was $85,237,785. This consisted of aggregate gross unrealized appreciation for all securities in which there was an excess of value over tax cost of $8,914,929 and aggregate gross unrealized depreciation for all securities in which there was an excess of tax cost over value of $94,152,714.(a) All or a portion of these securities were on loan (see Notes to Financial Statements). The value of all securities loaned at December 31, 2008 amounted to $72,442,673, which is 29.2% of net assets.(b) Affiliated fund managed by Deutsche Investment Management Americas Inc. The rate shown is the annualized seven-day yield at period end.(c) Represents collateral held in connection with securities lending. Income earned by the Portfolio is net of borrower rebates.144A: Security exempt from registration under Rule 144A of the Securities Act of 1933. These securities may be resold in transactions exempt from registration, normally to qualified institutional buyers.
REIT: Real Estate Investment Trust
Fair Value Measurements
The following is a summary of the inputs used as of December 31, 2008 in valuing the Portfolio's investments. For information on the Portfolio's policy regarding the valuation of investments and of the valuation inputs, and the aggregate levels used in the table below, please refer to the Security Valuation section of Note A in the accompanying Notes to the Financial Statements.
Valuation Inputs | Investments in Securities |
Level 1
| $ 316,816,152 |
Level 2
| 3,330,639 |
Level 3
| — |
Total | $ 320,146,791 |
The accompanying notes are an integral part of the financial statements.
Financial Statements
Statement of Assets and Liabilities as of December 31, 2008
|
Assets |
Investments:
Investments in securities, at value (cost $328,312,064 — including $72,442,673 of securities loaned) | $ 244,799,253 |
Investment in Daily Assets Fund Institutional (cost $72,016,899)* | 72,016,899 |
Investment in Cash Management QP Trust (cost $3,330,639) | 3,330,639 |
Total investments, at value (cost $403,659,602)
| 320,146,791 |
Dividends receivable
| 299,612 |
Interest receivable
| 79,231 |
Receivable for Portfolio shares sold
| 25,581 |
Other assets
| 11,517 |
Total assets
| 320,562,732 |
Liabilities |
Payable upon return of securities loaned
| 72,016,899 |
Payable for Portfolio shares redeemed
| 436,489 |
Payable for investments purchased
| 13,053 |
Accrued management fee
| 142,277 |
Other accrued expenses and payables
| 193,926 |
Total liabilities
| 72,802,644 |
Net assets, at value | $ 247,760,088 |
Net Assets Consist of: |
Undistributed net investment income
| 4,324,008 |
Net unrealized appreciation (depreciation) on:
Investments | (83,512,811) |
Foreign currency | (320) |
Accumulated net realized gain (loss)
| (64,286,752) |
Paid-in capital
| 391,235,963 |
Net assets, at value | $ 247,760,088 |
Class A Net Asset Value, offering and redemption price per share ($223,409,162 ÷ 28,178,465 outstanding shares of beneficial interest, $.01 par value, unlimited number of shares authorized)
| $ 7.93 |
Class B Net Asset Value, offering and redemption price per share ($24,350,926 ÷ 3,073,371 outstanding shares of beneficial interest, $.01 par value, unlimited number of shares authorized)
| $ 7.92 |
* Represents collateral on securities loaned.The accompanying notes are an integral part of the financial statements.
Statement of Operations for the year ended December 31, 2008
|
Investment Income |
Income:
Dividends (net of foreign taxes withheld of $4,441)
| $ 6,673,749 |
Interest — Cash Management QP Trust
| 507,598 |
Securities lending income, including income from Daily Assets Fund Institutional, net of borrower rebates
| 448,109 |
Total Income
| 7,629,456 |
Expenses:
Management fee
| 2,646,998 |
Administration fee
| 244,036 |
Custodian fee
| 19,117 |
Distribution service fee (Class B)
| 83,016 |
Record keeping fees (Class B)
| 35,202 |
Services to shareholders
| 1,069 |
Professional fees
| 74,382 |
Trustees' fees and expenses
| 33,021 |
Reports to shareholders and shareholder meeting
| 205,868 |
Other
| 14,891 |
Total expenses before expense reductions
| 3,357,600 |
Expense reductions
| (23,067) |
Total expenses after expense reductions
| 3,334,533 |
Net investment income (loss) | 4,294,923 |
Realized and Unrealized Gain (Loss) |
Net realized gain (loss) from investments
| (64,286,752) |
Change in net unrealized appreciation (depreciation) on:
Investments
| (96,934,851) |
Foreign currency
| (772) |
| (96,935,623) |
Net gain (loss) | (161,222,375) |
Net increase (decrease) in net assets resulting from operations | $ (156,927,452) |
The accompanying notes are an integral part of the financial statements.
Statement of Changes in Net Assets |
| Years Ended December 31, |
Increase (Decrease) in Net Assets | 2008 | 2007 |
Operations:
Net investment income (loss)
| $ 4,294,923 | $ 4,898,627 |
Net realized gain (loss)
| (64,286,752) | 173,994,914 |
Change in net unrealized appreciation (depreciation)
| (96,935,623) | (153,503,878) |
Net increase (decrease) in net assets resulting from operations
| (156,927,452) | 25,389,663 |
Distributions to shareholders from:
Net investment income:
Class A | (6,363,604) | (5,615,367) |
Class B | (427,114) | (521,975) |
Distributions to shareholders from:
Net realized gains:
Class A | (155,713,279) | (79,369,510) |
Class B | (13,714,537) | (12,524,743) |
Total distributions | (176,218,534) | (98,031,595) |
Portfolio share transactions:
Class A Proceeds from shares sold
| 37,425,632 | 42,602,597 |
Reinvestment of distributions
| 162,076,883 | 84,984,877 |
Cost of shares redeemed
| (139,030,105) | (156,265,470) |
Net increase (decrease) in net assets from Class A share transactions
| 60,472,410 | (28,677,996) |
Class B Proceeds from shares sold
| 14,371,044 | 12,637,109 |
Reinvestment of distributions
| 14,141,651 | 13,046,718 |
Cost of shares redeemed
| (9,977,946) | (74,159,545) |
Net increase (decrease) in net assets from Class B share transactions
| 18,534,749 | (48,475,718) |
Increase (decrease) in net assets | (254,138,827) | (149,795,646) |
Net assets at beginning of period
| 501,898,915 | 651,694,561 |
Net assets at end of period (including undistributed net investment income of $4,324,008 and $6,809,899, respectively)
| $ 247,760,088 | $ 501,898,915 |
Other Information |
Class A Shares outstanding at beginning of period
| 23,283,418 | 24,500,577 |
Shares sold
| 3,355,802 | 1,968,230 |
Shares issued to shareholders in reinvestment of distributions
| 15,105,022 | 4,200,933 |
Shares redeemed
| (13,565,777) | (7,386,322) |
Net increase (decrease) in Class A shares
| 4,895,047 | (1,217,159) |
Shares outstanding at end of period
| 28,178,465 | 23,283,418 |
Class B Shares outstanding at beginning of period
| 1,669,556 | 3,927,983 |
Shares sold
| 1,078,541 | 603,769 |
Shares issued to shareholders in reinvestment of distributions
| 1,315,502 | 644,282 |
Shares redeemed
| (990,228) | (3,506,478) |
Net increase (decrease) in Class B shares
| 1,403,815 | (2,258,427) |
Shares outstanding at end of period
| 3,073,371 | 1,669,556 |
The accompanying notes are an integral part of the financial statements.
Financial Highlights
Class A Years Ended December 31, | 2008 | 2007 | 2006 | 2005 | 2004 |
Selected Per Share Data |
Net asset value, beginning of period | $ 20.12 | $ 22.93 | $ 19.98 | $ 20.05 | $ 16.06 |
Income (loss) from investment operations: Net investment income (loss)a | .13 | .18 | .15 | .19 | .17 |
Net realized and unrealized gain (loss) | (4.92) | .54 | 4.69 | 1.67 | 3.98 |
Total from investment operations | (4.79) | .72 | 4.84 | 1.86 | 4.15 |
Less distributions from: Net investment income | (.29) | (.23) | (.18) | (.15) | (.16) |
Net realized gains | (7.11) | (3.30) | (1.71) | (1.78) | — |
Total distributions | (7.40) | (3.53) | (1.89) | (1.93) | (.16) |
Net asset value, end of period | $ 7.93 | $ 20.12 | $ 22.93 | $ 19.98 | $ 20.05 |
Total Return (%)
| (33.42)b | 3.06 | 25.06 | 10.25 | 26.03 |
Ratios to Average Net Assets and Supplemental Data |
Net assets, end of period ($ millions)
| 223 | 468 | 562 | 493 | 467 |
Ratio of expenses before expense reductions (%)
| .83 | .78 | .79 | .79 | .79 |
Ratio of expenses after expense reductions (%)
| .82 | .78 | .79 | .79 | .79 |
Ratio of net investment income (%)
| 1.13 | .85 | .71 | .96 | .96 |
Portfolio turnover rate (%)
| 49 | 110 | 52 | 61 | 73 |
a Based on average shares outstanding during the period.
b Total return would have been lower had certain expenses not been reduced.
|
Class B Years Ended December 31, | 2008 | 2007 | 2006 | 2005 | 2004 |
Selected Per Share Data |
Net asset value, beginning of period | $ 20.08 | $ 22.88 | $ 19.93 | $ 20.01 | $ 16.03 |
Income (loss) from investment operations: Net investment income (loss)a | .09 | .10 | .07 | .11 | .10 |
Net realized and unrealized gain (loss) | (4.92) | .54 | 4.67 | 1.66 | 3.97 |
Total from investment operations | (4.83) | .64 | 4.74 | 1.77 | 4.07 |
Less distributions from: Net investment income | (.22) | (.14) | (.08) | (.07) | (.09) |
Net realized gains | (7.11) | (3.30) | (1.71) | (1.78) | — |
Total distributions | (7.33) | (3.44) | (1.79) | (1.85) | (.09) |
Net asset value, end of period | $ 7.92 | $ 20.08 | $ 22.88 | $ 19.93 | $ 20.01 |
Total Return (%)
| (33.67)b | 2.67 | 24.59 | 9.78 | 25.52 |
Ratios to Average Net Assets and Supplemental Data |
Net assets, end of period ($ millions)
| 24 | 34 | 90 | 83 | 71 |
Ratio of expenses before expense reductions (%)
| 1.18 | 1.16 | 1.17 | 1.19 | 1.16 |
Ratio of expenses after expense reductions (%)
| 1.17 | 1.16 | 1.17 | 1.19 | 1.16 |
Ratio of net investment income (%)
| .78 | .47 | .33 | .56 | .59 |
Portfolio turnover rate (%)
| 49 | 110 | 52 | 61 | 73 |
a Based on average shares outstanding during the period.
b Total return would have been lower had certain expenses not been reduced.
|
Performance Summary December 31, 2008
DWS Global Thematic VIP
All performance shown is historical, assumes reinvestment of all dividend and capital gain distributions and does not guarantee future results. Investment return and principal value fluctuate with changing market conditions so that, when redeemed, shares may be worth more or less than their original cost. Current performance may be lower or higher than the performance data quoted. Please contact your participating insurance company for the Portfolio's most recent month-end performance. Performance doesn't reflect charges and fees ("contract charges") associated with the separate account that invests in the Portfolio or any variable life insurance policy or variable annuity contract for which the Portfolio is an investment option. These charges and fees will reduce returns. While all share classes have the same underlying portfolio, their performance will differ.
The total annual Portfolio operating expense ratios, gross of any fee waivers or expense reimbursements, as stated in the fee table of the prospectus dated May 1, 2008 are 1.33% and 1.68% for Class A and Class B shares, respectively. Please see the Information About Your Portfolio's Expenses, the Financial Highlights and Notes to the Financial Statements (Note C, Related Parties) sections of this report for gross and net expense related disclosure for the period ended December 31, 2008.
Risk Considerations
This Portfolio is subject to stock market risk, meaning stocks in the Portfolio may decline in value for extended periods of time due to the activities and financial prospects of individual companies, or due to general market and economic conditions. Additionally, investing in foreign securities presents certain risks, such as currency fluctuation, political and economic changes and market risks. This may result in greater share price volatility. Please read this Portfolio's prospectus for specific details regarding its investments and risk profile.
Portfolio returns shown for all periods reflect a fee waiver and/or expense reimbursement. Without this waiver/reimbursement, returns would have been lower.
Growth of an Assumed $10,000 Investment in DWS Global Thematic VIP |
[] DWS Global Thematic VIP — Class A [] MSCI World Index | The Morgan Stanley Capital International (MSCI) World Index is an unmanaged, capitalization weighted measure of global stock markets including the US, Canada, Europe, Australia and the Far East. The index is calculated using closing local market prices and translates into US dollars using the London close foreign exchange rates. Index returns assume reinvestment of dividends and, unlike Portfolio returns, do not reflect any fees or expenses. It is not possible to invest directly into an index. |
 | |
Yearly periods ended December 31 |
|
Comparative Results |
DWS Global Thematic VIP | 1-Year | 3-Year | 5-Year | 10-Year |
Class A | Growth of $10,000
| $5,225 | $7,228 | $10,198 | $11,480 |
Average annual total return
| -47.75% | -10.26% | .39% | 1.39% |
MSCI World Index
| Growth of $10,000
| $5,929 | $7,762 | $9,749 | $9,379 |
Average annual total return
| -40.71% | -8.10% | -.51% | -.64% |
DWS Global Thematic VIP | 1-Year | 3-Year | 5-Year | Life of Class* |
Class B | Growth of $10,000
| $5,213 | $7,153 | $10,018 | $11,596 |
Average annual total return
| -47.87% | -10.57% | .04% | 2.30% |
MSCI World Index
| Growth of $10,000
| $5,929 | $7,762 | $9,749 | $11,401 |
Average annual total return
| -40.71% | -8.10% | -.51% | 2.04% |
The growth of $10,000 is cumulative.
* The Portfolio commenced offering Class B shares on July 1, 2002. Index returns began on June 30, 2002.Information About Your Portfolio's Expenses
DWS Global Thematic VIP
As an investor of the Portfolio, you incur two types of costs: ongoing expenses and transaction costs. Ongoing expenses include management fees, distribution and service (12b-1) fees and other Portfolio expenses. Examples of transaction costs include contract charges, redemption fees and account maintenance fees, which are not shown in this section. The following tables are intended to help you understand your ongoing expenses (in dollars) of investing in the Portfolio and to help you compare these expenses with the ongoing expenses of investing in other mutual funds. In the most recent six-month period, the Portfolio limited these expenses; had it not done so, expenses would have been higher. The example in the table is based on an investment of $1,000 invested at the beginning of the six-month period and held for the entire period (July 1, 2008 to December 31, 2008).
The tables illustrate your Portfolio's expenses in two ways:
• Actual Portfolio Return. This helps you estimate the actual dollar amount of ongoing expenses (but not transaction costs) paid on a $1,000 investment in the Portfolio using the Portfolio's actual return during the period. To estimate the expenses you paid over the period, simply divide your account value by $1,000 (for example, an $8,600 account value divided by $1,000 = 8.6), then multiply the result by the number in the "Expenses Paid per $1,000" line under the share class you hold.
• Hypothetical 5% Portfolio Return. This helps you to compare your Portfolio's ongoing expenses (but not transaction costs) with those of other mutual funds using the Portfolio's actual expense ratio and a hypothetical rate of return of 5% per year before expenses. Examples using a 5% hypothetical Portfolio return may be found in the shareholder reports of other mutual funds. The hypothetical account values and expenses may not be used to estimate the actual ending account balance or expenses you paid for the period.
Please note that the expenses shown in these tables are meant to highlight your ongoing expenses only and do not reflect any transaction costs. The "Expenses Paid per $1,000" line of the tables is useful in comparing ongoing expenses only and will not help you determine the relative total expense of owning different funds. If these transaction costs had been included, your costs would have been higher.
Expenses and Value of a $1,000 Investment for the six months ended December 31, 2008 |
Actual Portfolio Return | Class A | | Class B | |
Beginning Account Value 7/1/08
| $ 1,000.00 | | $ 1,000.00 | |
Ending Account Value 12/31/08
| $ 594.10 | | $ 593.30 | |
Expenses Paid per $1,000*
| $ 4.41 | | $ 5.85 | |
Hypothetical 5% Portfolio Return | Class A | | Class B | |
Beginning Account Value 7/1/08
| $ 1,000.00 | | $ 1,000.00 | |
Ending Account Value 12/31/08
| $ 1,019.61 | | $ 1,017.80 | |
Expenses Paid per $1,000*
| $ 5.58 | | $ 7.41 | |
* Expenses are equal to the Portfolio's annualized expense ratio for each share class, multiplied by the average account value over the period, multiplied by the number of days in the most recent six-month period, then divided by 366.Annualized Expense Ratios | Class A | | Class B | |
DWS Variable Series II — DWS Global Thematic VIP
| 1.10% | | 1.46% | |
For more information, please refer to the Portfolio's prospectus.
These tables do not reflect charges and fees ("contract charges") associated with the separate account that invests in the Portfolio or any variable life insurance policy or variable annuity contract for which the Portfolio is an investment option.
Management Summary December 31, 2008
DWS Global Thematic VIP
Global equities performed poorly during 2008, the worst perfomance in many decades, reflecting an environment characterized by slowing economic growth, the evolution of the financial and credit crises, and elevated risk aversion among investors. The Class A shares of the Portfolio (unadjusted for contract charges) returned -47.75%, underperforming the -40.71% return of the MSCI World Index.
In managing the Portfolio, we look for long-term themes in the global economy, then we use a combination of quantitative analysis and intensive fundamental research to identify companies that can benefit as these themes unfold. During the past year, our themes related to global agribusiness, energy and basic materials led us to hold above-market weightings in these sectors — a negative for performance at a time of sharply slowing global growth.1 Among the leading individual detractors in these sectors were the Russian energy company Gazprom, the Brazilian port operator Santos Brasil Participacoes SA and the food company Bunge Ltd.* On the plus side, we added value through themes that invest in health care stocks, including Mylan, Inc., and gold mining companies, such as Newmont Mining Corp.* and Barrick Gold Corp.*
We remain committed to investing in high-quality franchises with unique competitive advantages. Specifically, we want to own those companies that can expand their assets with little leverage and, in most cases, also grow their earnings despite the difficult environment. We continue to believe that emerging markets and global agribusiness are among the best opportunities over the next three to five years. In our view, current valuations reflect a selling panic that is inconsistent with the outstanding growth potential in both areas.
Oliver Kratz
Portfolio Manager, Deutsche Investment Management Americas Inc.
The Morgan Stanley Capital International (MSCI) World Index is an unmanaged, capitalization-weighted measure of global stock markets around the world, including North America, Europe, Australia and the Far East. The index is calculated using closing local market prices and translates into US dollars using the London close foreign exchange rates. Index returns assume reinvestment of dividends and, unlike portfolio returns, do not reflect any fees or expenses. It is not possible to invest directly into an index.
1 Above market weightings means the Portfolio holds a higher weighting in a given sector or security than the benchmark.* Not held in the Portfolio as of December 31, 2008.Portfolio management market commentary is as of December 31, 2008, and may not come to pass. This information is subject to change at any time based on market and other conditions. Past performance does not guarantee future results. Current and future portfolio holdings are subject to risk.
Portfolio Summary
DWS Global Thematic VIP
Asset Allocation (As a % of Investment Portfolio excluding Securities Lending Collateral) | 12/31/08 | 12/31/07 |
| | |
Common Stocks | 95% | 92% |
Exchange Traded Funds | 2% | 2% |
Cash Equivalents | 1% | 4% |
Preferred Stocks | 1% | 2% |
Participatory Notes | 1% | — |
| 100% | 100% |
Sector Diversification (As a % of Common, Preferred Stocks and Participatory Notes) | 12/31/08 | 12/31/07 |
| | |
Health Care | 18% | 11% |
Industrials | 16% | 21% |
Financials | 16% | 24% |
Consumer Staples | 13% | 8% |
Energy | 11% | 4% |
Consumer Discretionary | 8% | 13% |
Materials | 7% | 5% |
Information Technology | 6% | 11% |
Telecommunication Services | 5% | 3% |
| 100% | 100% |
Geographical Diversification (As a % of Investment Portfolio excluding Cash Equivalents and Securities Lending Collateral) | 12/31/08 | 12/31/07 |
| | |
United States | 40% | 28% |
Continental Europe | 24% | 39% |
Asia (excluding Japan) | 11% | 12% |
Latin America | 9% | 7% |
United Kingdom | 5% | 3% |
Japan | 5% | 6% |
Canada | 2% | 1% |
Middle East | 2% | 2% |
Bermuda | 1% | — |
Africa | — | 2% |
Other | 1% | — |
| 100% | 100% |
Asset allocation, sector and geographical diversifications are subject to change.
For more complete details about the Portfolio's investment portfolio, see page 124. A complete list of portfolio holdings of the portfolio is posted as of the month end on www.dws-investments.com on or about the 15th day of the following month. More frequent posting of portfolio holdings information may be made from time to time on www.dws-investments.com.
Following the Portfolio's fiscal first and third quarter-end, a complete portfolio holdings listing is filed with the SEC on Form N-Q. The form will be available on the SEC's Web site at www.sec.gov, and it also may be reviewed and copied at the SEC's Public Reference Room in Washington, D.C. Information on the operation of the SEC's Public Reference Room may be obtained by calling (800) SEC-0330.
Investment Portfolio December 31, 2008
DWS Global Thematic VIP
|
Shares
| Value ($) |
| |
Common Stocks 96.9% |
Australia 0.7% |
Australian Wealth Management Ltd. (Cost $1,052,743) | 572,100 | 442,742 |
Austria 1.3% |
Flughafen Wien AG (Cost $1,970,009) | 19,000 | 849,541 |
Bermuda 1.4% |
Lazard Ltd. "A" (Cost $977,909) | 29,200 | 868,408 |
Brazil 5.6% |
BM&F BOVESPA SA | 119,200 | 313,665 |
Companhia de Bebidas das Americas (ADR) (Preferred) (a) | 14,500 | 642,495 |
Companhia Vale do Rio Doce (ADR) | 81,400 | 985,754 |
Petroleo Brasileiro SA (ADR) | 26,000 | 636,740 |
Santos Brasil Participacoes SA (Unit) | 166,100 | 461,824 |
SLC Agricola SA | 74,600 | 454,790 |
(Cost $5,112,410) | 3,495,268 |
Canada 1.7% |
Canadian National Railway Co. | 19,000 | 698,446 |
Viterra, Inc.* | 47,000 | 361,685 |
(Cost $1,349,636) | 1,060,131 |
Cayman Islands 0.7% |
Fresh Del Monte Produce, Inc.* (Cost $452,414) | 18,900 | 423,738 |
China 2.8% |
Industrial & Commercial Bank of China Ltd. "H" | 602,000 | 319,944 |
Ping An Insurance (Group) Co. of China Ltd. "H" | 295,000 | 1,441,618 |
Sunshine Holdings Ltd.* | 1,571,000 | 32,893 |
(Cost $2,431,245) | 1,794,455 |
France 2.1% |
BNP Paribas | 6,819 | 287,942 |
Compagnie de Saint-Gobain | 8,820 | 415,996 |
Total SA | 11,373 | 620,029 |
(Cost $1,469,545) | 1,323,967 |
Germany 7.4% |
Axel Springer AG | 6,302 | 456,065 |
BASF SE | 10,000 | 395,145 |
Daimler AG (Registered) | 10,100 | 383,762 |
Deutsche Post AG (Registered) | 51,600 | 872,969 |
Deutsche Postbank AG (a) | 16,800 | 371,530 |
Fraport AG | 10,200 | 445,451 |
Hamburger Hafen und Logistik AG | 13,200 | 439,644 |
Siemens AG (Registered) | 7,000 | 524,303 |
Stada Arzneimittel AG | 26,900 | 786,770 |
(Cost $5,871,696) | 4,675,639 |
Hong Kong 3.4% |
Cheung Kong (Holdings) Ltd. | 49,000 | 467,164 |
China Mobile Ltd. | 44,500 | 451,177 |
China Water Affairs Group Ltd.* | 1,001,700 | 123,686 |
|
Shares
| Value ($) |
| |
CNOOC Ltd. (ADR) | 3,800 | 361,912 |
GOME Electrical Appliances Holdings Ltd. | 2,135,000 | 344,346 |
Hongkong & Shanghai Hotels Ltd. | 553,242 | 416,666 |
(Cost $3,968,474) | 2,164,951 |
India 2.1% |
Bharti Airtel Ltd.* (Cost $1,743,974) | 89,547 | 1,318,856 |
Indonesia 0.2% |
PT Bumi Resources Tbk (Cost $1,153,255) | 1,406,100 | 121,329 |
Israel 1.6% |
Teva Pharmaceutical Industries Ltd. (ADR) (a) (Cost $961,694) | 23,400 | 996,138 |
Italy 0.4% |
Gemina SpA* (Cost $861,060) | 518,706 | 269,639 |
Japan 4.9% |
Central Japan Railway Co. | 41 | 354,358 |
Mitsui Fudosan Co., Ltd. | 76,000 | 1,262,962 |
Mizuho Financial Group, Inc. | 206,000 | 608,360 |
Toyota Motor Corp. | 26,600 | 870,693 |
(Cost $3,504,101) | 3,096,373 |
Kazakhstan 0.2% |
Kazakhstan Kagazy PLC (GDR) 144A* | 181,200 | 52,548 |
Steppe Cement Ltd.* | 124,003 | 50,980 |
(Cost $1,577,114) | 103,528 |
Korea 1.0% |
Daesang Corp. | 17,036 | 80,128 |
Samsung Electronics Co., Ltd. | 1,595 | 579,173 |
(Cost $704,403) | 659,301 |
Luxembourg 0.5% |
ArcelorMittal (Cost $309,618) | 13,046 | 308,288 |
Malaysia 0.8% |
AMMB Holdings Bhd. (Cost $531,235) | 698,200 | 500,769 |
Mexico 4.1% |
America Movil SAB de CV "L" (ADR) | 27,950 | 866,171 |
Cemex SAB de CV (ADR)* | 34,400 | 314,416 |
Grupo Aeroportuario del Pacifico SAB de CV "B" (ADR) | 33,400 | 768,868 |
Grupo Financiero Banorte SAB de CV "O" | 163,100 | 294,436 |
Grupo Televisa SA (ADR) | 21,600 | 322,704 |
(Cost $3,035,401) | 2,566,595 |
Netherlands 2.2% |
QIAGEN NV* (a) (Cost $1,330,113) | 78,800 | 1,377,068 |
Russia 2.3% |
Far Eastern Shipping Co.* | 689,000 | 199,810 |
Gazprom (ADR)* | 38,682 | 554,371 |
Globaltrans Investment PLC (GDR) 144A* | 47,000 | 65,800 |
|
Shares
| Value ($) |
| |
Novorossiysk Sea Trade Port (GDR) 144A | 36,300 | 245,025 |
Rosneft Oil Co. (GDR)* | 43,350 | 162,563 |
Vimpel-Communications (ADR) | 27,500 | 196,900 |
(Cost $3,164,746) | 1,424,469 |
Singapore 0.3% |
Food Empire Holdings Ltd. (Cost $362,240) | 715,000 | 169,083 |
Sweden 0.4% |
Autoliv, Inc. (Cost $227,818) | 11,400 | 244,644 |
Switzerland 6.1% |
Julius Baer Holding AG (Registered) | 14,716 | 566,091 |
Nestle SA (Registered) | 17,743 | 699,297 |
Roche Holding AG (Genusschein) | 12,671 | 1,950,494 |
Swiss Re (Registered) | 12,179 | 591,672 |
(Cost $3,759,520) | 3,807,554 |
Thailand 0.3% |
Seamico Securities PCL (Foreign Registered) | 1,852,800 | 69,254 |
Siam City Bank PCL (Foreign Registered)* | 523,300 | 106,074 |
(Cost $459,041) | 175,328 |
United Kingdom 5.4% |
Aberdeen Asset Management PLC | 391,046 | 680,192 |
Anglo American PLC | 22,619 | 516,653 |
BHP Billiton PLC | 16,759 | 315,687 |
G4S PLC | 462,639 | 1,373,041 |
GlaxoSmithKline PLC | 28,850 | 535,583 |
Tesco PLC | 625 | 3,256 |
(Cost $4,527,355) | 3,424,412 |
United States 37.0% |
AGCO Corp.* | 17,300 | 408,107 |
Altria Group, Inc. | 46,900 | 706,314 |
Anadarko Petroleum Corp. | 12,000 | 462,600 |
Apache Corp. | 4,100 | 305,573 |
Berkshire Hathaway, Inc. "A"* | 3 | 289,800 |
Campbell Soup Co. | 15,000 | 450,150 |
ConocoPhillips | 10,100 | 523,180 |
CSX Corp. | 13,500 | 438,345 |
CVS Caremark Corp. | 42,400 | 1,218,576 |
Expedia, Inc.* | 29,000 | 238,960 |
ExxonMobil Corp. | 19,500 | 1,556,685 |
General Mills, Inc. | 13,900 | 844,425 |
Google, Inc. "A"* | 2,000 | 615,300 |
Hess Corp. | 2,900 | 155,556 |
Intrepid Potash, Inc.* | 13,500 | 280,395 |
Johnson & Johnson | 9,650 | 577,360 |
Laboratory Corp. of America Holdings* | 11,700 | 753,597 |
Liberty Media Corp. — Entertainment "A"* | 23,200 | 405,536 |
Life Technologies Corp.* | 20,900 | 487,179 |
Marathon Oil Corp. | 5,900 | 161,424 |
Mattel, Inc. | 56,700 | 907,200 |
McCormick & Co., Inc. | 7,500 | 238,950 |
Microsoft Corp. | 60,100 | 1,168,344 |
Monster Worldwide, Inc.* | 31,700 | 383,253 |
Mylan, Inc.* (a) | 144,950 | 1,433,555 |
|
Shares
| Value ($) |
| |
National-Oilwell Varco, Inc.* | 14,200 | 347,048 |
Oracle Corp.* | 37,800 | 670,194 |
Owens-Illinois, Inc.* | 41,000 | 1,120,530 |
Pfizer, Inc. | 105,575 | 1,869,733 |
Philip Morris International, Inc. | 9,700 | 422,047 |
Schlumberger Ltd. | 11,100 | 469,863 |
Stryker Corp. (a) | 14,300 | 571,285 |
The J.M. Smucker Co. | 4,100 | 177,776 |
Union Pacific Corp. | 11,100 | 530,580 |
Wal-Mart Stores, Inc. | 15,700 | 880,142 |
XTO Energy, Inc. | 9,300 | 328,011 |
Yahoo!, Inc.* | 71,300 | 869,861 |
(Cost $26,138,535) | 23,267,434 |
Total Common Stocks (Cost $79,007,304) | 60,929,648 |
|
Preferred Stock 0.6% |
Germany |
Porsche Automobil Holding SE (Cost $334,815) | 4,850 | 377,839 |
|
Participatory Note 0.6% |
United States |
Merrill Lynch Frontier Index Trust (issuer Merrill Lynch International & Co.), Expiration Date 2/27/2009 (Cost $1,023,048) | 10,000 | 368,200 |
|
Exchange Traded Fund 2.8% |
United States |
iShares Nasdaq Biotechnology Index Fund (a) (Cost $1,750,455) | 24,725 | 1,756,711 |
|
Call Options Purchased 0.0% |
United States |
General Electric Co., Expiration Date 1/16/2010, Strike Price $30.0 (Cost $212,772) | 510 | 9,180 |
|
Securities Lending Collateral 10.2% |
Daily Assets Fund Institutional, 1.69% (b) (c) (Cost $6,423,337) | 6,423,337 | 6,423,337 |
|
Cash Equivalents 0.8% |
Cash Management QP Trust, 1.42% (b) (Cost $460,549) | 460,549 | 460,549 |
| % of Net Assets | Value ($) |
| |
Total Investment Portfolio (Cost $89,212,280)+ | 111.9 | 70,325,464 |
Other Assets and Liabilities, Net (a) | (11.9) | (7,458,656) |
Net Assets | 100.0 | 62,866,808 |
* Non-income producing security.+ The cost for federal income tax purposes was $92,552,472. At December 31, 2008, net unrealized depreciation for all securities based on tax cost was $22,227,008 This consisted of aggregate gross unrealized appreciation for all securities in which there was an excess of value over tax cost of $1,966,217 and aggregate gross unrealized depreciation for all securities in which there was an excess of tax cost over value of $24,193,225.(a) All or a portion of these securities were on loan amounting to $6,151,506. In addition, included in other assets and liabilities, net is a pending sale, amounting to $147,815, that is also on loan (see Notes to Financial Statements). The value of all securities loaned at December 31, 2008 amounted to $6,299,321, which is 10.0% of net assets.(b) Affiliated fund managed by Deutsche Investment Management Americas Inc. The rate shown is the annualized seven-day yield at period end.(c) Represents collateral held in connection with securities lending. Income earned by the Portfolio is net of borrower rebates.144A: Security exempt from registration under Rule 144A of the Securities Act of 1933. This security may be resold in transactions exempt from registration, normally to qualified institutional buyers.
ADR: American Depositary Receipt
GDR: Global Depositary Receipt
Fair Value Measurements
The following is a summary of the inputs used as of December 31, 2008 in valuing the Portfolio's investments. For information on the Portfolio's policy regarding the valuation of investments and of the valuation inputs, and the aggregate levels used in the tables below, please refer to the Security Valuation section of Note A in the accompanying Notes to the Financial Statements.
Valuation Inputs | Investments in Securities |
Level 1
| $ 42,755,529 |
Level 2
| 27,225,589 |
Level 3
| 344,346 |
Total | $ 70,325,464 |
The following is a reconciliation of the Portfolio's Level 3 investments for which significant unobservable inputs were used in determining value at December 31, 2008:
| Investments in Securities |
Balance as of January 1, 2008 | $ — |
Total realized gain (loss)
| (436,550) |
Change in unrealized appreciation (depreciation)
| (997,618) |
Amortization Premium/Discount
| — |
Net purchases (sales)
| 172,439 |
Net transfers in (out) of Level 3
| 1,606,075 |
Balance as of December 31, 2008 | $ 344,346 |
The accompanying notes are an integral part of the financial statements.
Financial Statements
Statement of Assets and Liabilities as of December 31, 2008
|
Assets |
Investments:
Investments in securities, at value (cost $82,328,394) — including $6,151,506 of securities loaned | $ 63,441,578 |
Investment in Daily Assets Fund Institutional (cost $6,423,337)* | 6,423,337 |
Investment in Cash Management QP Trust (cost $460,549) | 460,549 |
Total investments, at value (cost $89,212,280)
| 70,325,464 |
Cash
| 2,867 |
Foreign currency, at value (cost $313,212)
| 320,297 |
Receivable for investments sold
| 1,771,811 |
Receivable for Portfolio shares sold
| 7,761 |
Dividends receivable
| 127,876 |
Interest receivable
| 7,483 |
Foreign taxes recoverable
| 23,641 |
Due from Advisor
| 69 |
Other assets
| 3,515 |
Total assets
| 72,590,784 |
Liabilities |
Payable for investments purchased
| 3,059,019 |
Payable upon return of securities loaned
| 6,423,337 |
Payable for Portfolio shares redeemed
| 13,150 |
Accrued management fee
| 38,168 |
Other accrued expenses and payables
| 190,302 |
Total liabilities
| 9,723,976 |
Net assets, at value | $ 62,866,808 |
Net Assets Consist of |
Undistributed net investment income
| 932,658 |
Net unrealized appreciation (depreciation) on:
Investments | (18,886,816) |
Foreign currency | (2,555) |
Accumulated net realized gain (loss)
| (57,628,318) |
Paid-in capital
| 138,451,839 |
Net assets, at value | $ 62,866,808 |
Class A Net Asset Value, offering and redemption price per share ($58,760,432 ÷ 10,056,541 outstanding shares of beneficial interest, $.01 par value, unlimited number of shares authorized)
| $ 5.84 |
Class B Net Asset Value, offering and redemption price per share ($4,106,376 ÷ 702,064 outstanding shares of beneficial interest, $.01 par value, unlimited number of shares authorized)
| $ 5.85 |
* Represents collateral on securities loaned.The accompanying notes are an integral part of the financial statements.
Statement of Operations for the year ended December 31, 2008
|
Investment Income |
Income:
Dividends (net of foreign taxes withheld of $170,729)
| $ 2,339,060 |
Interest
| 2,853 |
Interest — Cash Management QP Trust
| 75,228 |
Securities lending income, including income from Daily Assets Fund Institutional, net of borrower rebates
| 198,312 |
Total Income
| 2,615,453 |
Expenses:
Management fee
| 1,138,988 |
Administration fee
| 72,094 |
Services to shareholders
| 671 |
Custodian and accounting fees
| 326,276 |
Distribution service fee (Class B)
| 17,747 |
Record keeping fees (Class B)
| 7,067 |
Professional fees
| 77,893 |
Trustees' fees and expenses
| 17,002 |
Reports to shareholders and shareholder meeting
| 93,163 |
Other
| 34,109 |
Total expenses before expense reductions
| 1,785,010 |
Expense reductions
| (448,802) |
Total expenses after expense reductions
| 1,336,208 |
Net investment income (loss) | 1,279,245 |
Realized and Unrealized Gain (Loss) |
Net realized gain (loss) from:
Investments (including foreign taxes of $924)
| (55,515,117) |
Foreign currency
| (248,995) |
| (55,764,112) |
Change in net unrealized appreciation (depreciation) on:
Investments
| (16,917,301) |
Foreign currency
| (5,809) |
| (16,923,110) |
Net gain (loss) | (72,687,222) |
Net increase (decrease) in net assets resulting from operations | $ (71,407,977) |
The accompanying notes are an integral part of the financial statements.
Statement of Changes in Net Assets |
| Years Ended December 31, |
Increase (Decrease) in Net Assets | 2008 | 2007 |
Operations:
Net investment income (loss)
| $ 1,279,245 | $ 1,371,727 |
Net realized gain (loss)
| (55,764,112) | 38,322,515 |
Change in net unrealized appreciation (depreciation)
| (16,923,110) | (28,184,790) |
Net increase (decrease) in net assets resulting from operations
| (71,407,977) | 11,509,452 |
Distributions to shareholders from:
Net investment income:
Class A | (1,766,760) | (976,630) |
Class B | (79,972) | (67,864) |
Net realized gains:
Class A | (36,684,662) | (22,498,351) |
Class B | (2,286,851) | (3,879,598) |
Total distributions
| (40,818,245) | (27,422,443) |
Portfolio share transactions:
Class A Proceeds from shares sold
| 9,403,619 | 32,962,118 |
Reinvestment of distributions
| 38,451,422 | 23,474,981 |
Cost of shares redeemed
| (34,733,222) | (33,544,797) |
Net increase (decrease) in net assets from Class A share transactions
| 13,121,819 | 22,892,302 |
Class B Proceeds from shares sold
| 925,746 | 5,026,580 |
Reinvestment of distributions
| 2,366,823 | 3,947,462 |
Cost of shares redeemed
| (2,548,724) | (22,340,318) |
Net increase (decrease) in net assets from Class B share transactions
| 743,845 | (13,366,276) |
Increase (decrease) in net assets | (98,360,558) | (6,386,965) |
Net assets at beginning of period
| 161,227,366 | 167,614,331 |
Net assets at end of period (including undistributed net investment income of $932,658 and $1,638,227, respectively)
| $ 62,866,808 | $ 161,227,366 |
Other Information |
Class A Shares outstanding at beginning of period
| 9,660,413 | 8,197,243 |
Shares sold
| 875,157 | 1,983,290 |
Shares issued to shareholders in reinvestment of distributions
| 3,769,747 | 1,533,310 |
Shares redeemed
| (4,248,776) | (2,053,430) |
Net increase (decrease) in Class A shares
| 396,128 | 1,463,170 |
Shares outstanding at end of period
| 10,056,541 | 9,660,413 |
Class B Shares outstanding at beginning of period
| 632,933 | 1,443,479 |
Shares sold
| 95,557 | 302,846 |
Shares issued to shareholders in reinvestment of distributions
| 231,135 | 257,164 |
Shares redeemed
| (257,561) | (1,370,556) |
Net increase (decrease) in Class B shares
| 69,131 | (810,546) |
Shares outstanding at end of period
| 702,064 | 632,933 |
The accompanying notes are an integral part of the financial statements.
Financial Highlights
Class A Years Ended December 31, | 2008 | 2007 | 2006 | 2005 | 2004 |
Selected Per Share Data |
Net asset value, beginning of period | $ 15.66 | $ 17.39 | $ 14.44 | $ 11.78 | $ 10.39 |
Income (loss) from investment operations: Net investment income (loss)a | .11 | .14 | .15c | .12 | .04 |
Net realized and unrealized gain (loss) | (5.83) | .88 | 4.02 | 2.58 | 1.48 |
Total from investment operations | (5.72) | 1.02 | 4.17 | 2.70 | 1.52 |
Less distributions from: Net investment income | (.19) | (.11) | (.09) | (.04) | (.13) |
Net realized gains | (3.91) | (2.64) | (1.13) | — | — |
Total distributions | (4.10) | (2.75) | (1.22) | (.04) | (.13) |
Net asset value, end of period | $ 5.84 | $ 15.66 | $ 17.39 | $ 14.44 | $ 11.78 |
Total Return (%)b
| (47.75) | 6.29 | 30.14c | 22.94 | 14.76 |
Ratios to Average Net Assets and Supplemental Data |
Net assets, end of period ($ millions)
| 59 | 151 | 143 | 85 | 63 |
Ratio of expenses before expense reductions (%)
| 1.47 | 1.44 | 1.38 | 1.41 | 1.44 |
Ratio of expenses after expense reductions (%)
| 1.09 | 1.11 | 1.04 | 1.28 | 1.43 |
Ratio of net investment income (%)
| 1.09 | .82 | .92c | .98 | .38 |
Portfolio turnover rate (%)
| 229 | 191 | 136 | 95 | 81 |
a Based on average shares outstanding during the period.
b Total return would have been lower had certain expenses not been reduced.
c Includes non-recurring income from the Advisor recorded as a result of an administrative proceeding regarding disclosure of brokerage allocation practices in connection with sales of DWS Funds. The non-recurring income resulted in an increase in net investment income of $0.004 per share and an increase in the ratio of net investment income of 0.03%. Excluding this non-recurring income, total return would have been 0.02% lower.
|
Class B Years Ended December 31, | 2008 | 2007 | 2006 | 2005 | 2004 |
Selected Per Share Data |
Net asset value, beginning of period | $ 15.66 | $ 17.38 | $ 14.43 | $ 11.78 | $ 10.38 |
Income (loss) from investment operations: Net investment income (loss)a | .07 | .07 | .09c | .07 | .00d |
Net realized and unrealized gain (loss) | (5.83) | .90 | 4.02 | 2.58 | 1.48 |
Total from investment operations | (5.76) | .97 | 4.11 | 2.65 | 1.48 |
Less distributions from: Net investment income | (.14) | (.05) | (.03) | — | (.08) |
Net realized gains | (3.91) | (2.64) | (1.13) | — | — |
Total distributions | (4.05) | (2.69) | (1.16) | — | (.08) |
Net asset value, end of period | $ 5.85 | $ 15.66 | $ 17.38 | $ 14.43 | $ 11.78 |
Total Return (%)b
| (47.87) | 5.84 | 29.65c | 22.50 | 14.33 |
Ratios to Average Net Assets and Supplemental Data |
Net assets, end of period ($ millions)
| 4 | 10 | 25 | 20 | 13 |
Ratio of expenses before expense reductions (%)
| 1.82 | 1.81 | 1.76 | 1.79 | 1.84 |
Ratio of expenses after expense reductions (%)
| 1.45 | 1.47 | 1.43 | 1.65 | 1.83 |
Ratio of net investment income (%)
| .73 | .46 | .53c | .61 | .02 |
Portfolio turnover rate (%)
| 229 | 191 | 136 | 95 | 81 |
a Based on average shares outstanding during the period.
b Total return would have been lower had certain expenses not been reduced.
c Includes non-recurring income from the Advisor recorded as a result of an administrative proceeding regarding disclosure of brokerage allocation practices in connection with sales of DWS Funds. The non-recurring income resulted in an increase in net investment income of $0.004 per share and an increase in the ratio of net investment income of 0.03%. Excluding this non-recurring income, total return would have been 0.02% lower.
d Amount is less than $.005 per share.
|
Performance Summary December 31, 2008
DWS Government & Agency Securities VIP
All performance shown is historical, assumes reinvestment of all dividend and capital gain distributions and does not guarantee future results. Investment return and principal value fluctuate with changing market conditions so that, when redeemed, shares may be worth more or less than their original cost. Current performance may be lower or higher than the performance data quoted. Please contact your participating insurance company for the Portfolio's most recent month-end performance. Performance doesn't reflect charges and fees ("contract charges") associated with the separate account that invests in the Portfolio or any variable life insurance policy or variable annuity contract for which the Portfolio is an investment option. These charges and fees will reduce returns. While all share classes have the same underlying portfolio, their performance will differ.
The total annual portfolio operating expense ratios, gross of any fee waivers or expense reimbursements, as stated in the fee table of the prospectus dated May 1, 2008 are 0.66% and 1.04% for Class A and Class B shares, respectively. Please see the Information About Your Portfolio's Expenses, the Financial Highlights and Notes to the Financial Statements (Note C, Related Parties) sections of this report for gross and net expense related disclosure for the period ended December 31, 2008.
Risk Considerations
The guarantee on US Government Guaranteed Securities relates only to the prompt payment of principal and interest and does not remove market risks. Additionally, yields will fluctuate in response to changing interest rates and may be affected by the prepayment of mortgage-backed securities. Bond investments are subject to interest-rate risk such that when interest rates rise, the prices of the bonds, and thus the value of the investment, can decline and the investor can lose principal value. In the current market environment, mortgage-backed securities are experiencing increased volatility. Please read this Portfolio's prospectus for specific details regarding its investments and risk profile.
Portfolio returns shown for all periods reflect a fee waiver and/or expense reimbursement. Without this waiver/reimbursement, returns would have been lower.
Growth of an Assumed $10,000 Investment in DWS Government & Agency Securities VIP |
[] DWS Government & Agency Securities VIP — Class A [] Barclays Capital GNMA Index | The Barclays Capital GNMA Index (name changed from Lehman Brothers GNMA Index, effective November 3, 2008) is an unmanaged market-value-weighted measure of all fixed-rate securities backed by mortgage pools of the Government National Mortgage Association. Index returns, unlike portfolio returns, do not reflect any fees or expenses. It is not possible to invest directly into an index. |
 | |
Yearly periods ended December 31 |
|
Comparative Results |
DWS Government & Agency Securities VIP | 1-Year | 3-Year | 5-Year | 10-Year |
Class A | Growth of $10,000
| $10,493 | $11,581 | $12,325 | $16,347 |
Average annual total return
| 4.93% | 5.01% | 4.27% | 5.04% |
Barclays Capital GNMA Index
| Growth of $10,000
| $10,787 | $12,072 | $13,001 | $17,812 |
Average annual total return
| 7.87% | 6.48% | 5.39% | 5.94% |
DWS Government & Agency Securities VIP | 1-Year | 3-Year | 5-Year | Life of Class* |
Class B | Growth of $10,000
| $10,460 | $11,441 | $12,090 | $12,770 |
Average annual total return
| 4.60% | 4.59% | 3.87% | 3.83% |
Barclays Capital GNMA Index
| Growth of $10,000
| $10,787 | $12,072 | $13,001 | $13,928 |
Average annual total return
| 7.87% | 6.48% | 5.39% | 5.23% |
The growth of $10,000 is cumulative.
* The Portfolio commenced offering Class B shares on July 1, 2002. Index returns began on June 30, 2002.Information About Your Portfolio's Expenses
DWS Government & Agency Securities VIP
As an investor of the Portfolio, you incur two types of costs: ongoing expenses and transaction costs. Ongoing expenses include management fees, distribution and service (12b-1) fees and other Portfolio expenses. Examples of transaction costs include contract charges, redemption fees and account maintenance fees, which are not shown in this section. The following tables are intended to help you understand your ongoing expenses (in dollars) of investing in the Portfolio and to help you compare these expenses with the ongoing expenses of investing in other mutual funds. In the most recent six-month period, the Portfolio limited these expenses; had it not done so, expenses would have been higher. The example in the table is based on an investment of $1,000 invested at the beginning of the six-month period and held for the entire period (July 1, 2008 to December 31, 2008).
The tables illustrate your Portfolio's expenses in two ways:
• Actual Portfolio Return. This helps you estimate the actual dollar amount of ongoing expenses (but not transaction costs) paid on a $1,000 investment in the Portfolio using the Portfolio's actual return during the period. To estimate the expenses you paid over the period, simply divide your account value by $1,000 (for example, an $8,600 account value divided by $1,000 = 8.6), then multiply the result by the number in the "Expenses Paid per $1,000" line under the share class you hold.
• Hypothetical 5% Portfolio Return. This helps you to compare your Portfolio's ongoing expenses (but not transaction costs) with those of other mutual funds using the Portfolio's actual expense ratio and a hypothetical rate of return of 5% per year before expenses. Examples using a 5% hypothetical Portfolio return may be found in the shareholder reports of other mutual funds. The hypothetical account values and expenses may not be used to estimate the actual ending account balance or expenses you paid for the period.
Please note that the expenses shown in these tables are meant to highlight your ongoing expenses only and do not reflect any transaction costs. The "Expenses Paid per $1,000" line of the tables is useful in comparing ongoing expenses only and will not help you determine the relative total expense of owning different funds. If these transaction costs had been included, your costs would have been higher.
Expenses and Value of a $1,000 Investment for the six months ended December 31, 2008 |
Actual Portfolio Return | Class A | | Class B | |
Beginning Account Value 7/1/08
| $ 1,000.00 | | $ 1,000.00 | |
Ending Account Value 12/31/08
| $ 1,032.50 | | $ 1,030.80 | |
Expenses Paid per $1,000*
| $ 3.32 | | $ 5.00 | |
Hypothetical 5% Portfolio Return | Class A | | Class B | |
Beginning Account Value 7/1/08
| $ 1,000.00 | | $ 1,000.00 | |
Ending Account Value 12/31/08
| $ 1,021.87 | | $ 1,020.21 | |
Expenses Paid per $1,000*
| $ 3.30 | | $ 4.98 | |
* Expenses are equal to the Portfolio's annualized expense ratio for each share class, multiplied by the average account value over the period, multiplied by the number of days in the most recent six-month period, then divided by 366.Annualized Expense Ratios | Class A | | Class B | |
DWS Variable Series II — DWS Government & Agency Securities VIP
| .65% | | .98% | |
For more information, please refer to the Portfolio's prospectus.
These tables do not reflect charges and fees ("contract charges") associated with the separate account that invests in the Portfolio or any variable life insurance policy or variable annuity contract for which the Portfolio is an investment option.
Management Summary December 31, 2008
DWS Government & Agency Securities VIP
Throughout 2008, the fixed-income markets continued to deal with the fallout from the housing and credit crises, which led to the outright failure or forced mergers of numerous financial institutions in both the United States and Europe. In the first half of September alone, Federal National Mortgage Association (Fannie Mae) and Federal Home Loan Mortgage Corporation (Freddie Mac) were placed into conservatorship by the government, leading investment bank Lehman Brothers failed and global insurance conglomerate AIG was bailed out by the US Treasury. This was followed shortly by the conversion of Morgan Stanley and Goldman Sachs to bank holding companies as they sought shelter from the credit market storm, and the Federal Deposit Insurance Corporation (FDIC) seizure and sale of certain operations to JPMorgan Chase of giant thrift Washington Mutual. As these events unfolded, the Bush administration won approval of a mammoth rescue package designed to unfreeze the credit markets. This failed, however, to prevent a credit crunch from spurring a dramatic slowdown in global economic growth late in the year. In this environment, investors' risk appetites evaporated and liquidity all but disappeared. This led to a frantic "flight to quality" into the safe haven of US Treasuries. Over the 12-month period, the US Federal Reserve Board (the Fed) cut the benchmark federal funds rate (the overnight rate banks charge when they borrow money from each other) from 4.25% to basically zero as it sought to provide market participants with liquidity.
During the 12-month period ended December 31, 2008, the Portfolio provided a total return of 4.93% (Class A shares, unadjusted for contract charges) compared with the 7.87% return of its benchmark, the Barclays Capital GNMA Index.
The Portfolio's underweight position of 15-year mortgages and relatively long-duration profile helped performance in a declining rate environment.1 Concentration on lower-coupon mortgage-backed securities was the principal constraint on performance during the year. We purchased these lower coupons, expecting falling interest rates to result in a pickup in prepayments on higher-coupon issues. The Portfolio's modest exposure to Fannie Mae and Freddie Mac securities also held back performance to a degree, as risk-averse investors favored the explicit government guarantee offered by GNMAs. As the period progressed, the Portfolio's holdings of securities selling at a discount to their par value began to add to performance as falling market interest rates caused previously issued mortgage-backed securities to trade at a premium. Late in the year, our focus on lower coupons and managing prepayment risk began to be rewarded as well. We believe the Portfolio is well positioned going into the new fiscal period given the Fed's focus on lowering borrowing rates. We will continue to monitor the credit and interest rate environment closely as we seek to maintain an attractive dividend for investors.
William Chepolis, CFA Matthew F. MacDonald, CFA
Co-Managers, Deutsche Investment Management Americas Inc.
The Barclays Capital GNMA Index (name changed from Lehman Brothers GNMA Index, effective November 3, 2008) is an unmanaged, market-value-weighted measure of all fixed-rate securities backed by mortgage pools of the Government National Mortgage Association. Index returns, unlike portfolio returns, do not reflect any fees or expenses. It is not possible to invest directly into an index.
1 "Overweight" means the portfolio holds a higher weighting in a given sector or security than the benchmark. "Underweight" means the portfolio holds a lower weighting.Portfolio management market commentary is as of December 31, 2008, and may not come to pass. This information is subject to change at any time based on market and other conditions. Past performance does not guarantee future results. Current and future portfolio holdings are subject to risk.
Portfolio Summary
DWS Government & Agency Securities VIP
Asset Allocation (As a % of Investment Portfolio) | 12/31/08 | 12/31/07 |
| | |
Mortgage-Backed Securities Pass-Throughs | 65% | 72% |
Collateralized Mortgage Obligation | 17% | 13% |
Government & Agency Obligations | 14% | 13% |
Cash Equivalents | 4% | 2% |
| 100% | 100% |
Credit Quality | 12/31/08 | 12/31/07 |
| | |
US Government and Agencies | 92% | 97% |
AAA* | 6% | — |
Not Rated | 2% | 3% |
* Includes cash equivalentsInterest Rate Sensitivity | 12/31/08 | 12/31/07 |
| | |
Effective Maturity | 3.4 years | 5.9 years |
Average Duration | 1.0 years | 3.5 years |
Asset allocation, quality and interest rate sensitivity are subject to change.
The quality ratings represent the lower of Moody's Investors Service, Inc. ("Moody's") or Standard & Poor's Corporation ("S&P") credit ratings. The ratings of Moody's and S&P represent their opinions as to the quality of the securities they rate. Ratings are relative and subjective and are not absolute standards of quality. The Portfolio's quality does not remove market risk.
For more complete details about the Portfolio's investment portfolio, see page 136 . A complete list of portfolio holdings of the portfolio is posted as of the month end on www.dws-investments.com on or about the 15th day of the following month. More frequent posting of portfolio holdings information may be made from time to time on www.dws-investments.com.
Following the Portfolio's fiscal first and third quarter-end, a complete portfolio holdings listing is filed with the SEC on Form N-Q. The form will be available on the SEC's Web site at www.sec.gov, and it also may be reviewed and copied at the SEC's Public Reference Room in Washington, D.C. Information on the operation of the SEC's Public Reference Room may be obtained by calling (800) SEC-0330.
Investment Portfolio December 31, 2008
DWS Government & Agency Securities VIP
| Principal Amount ($) | Value ($) |
| |
Mortgage-Backed Securities Pass-Throughs 69.2% |
Federal Home Loan Mortgage Corp.: | | |
4.5%, 5/1/2019 | 44,621 | 45,844 |
5.0%, 1/1/2034 (c) | 20,000,000 | 20,404,688 |
5.5%, 2/1/2017 | 37,677 | 38,903 |
6.5%, 9/1/2032 | 189,450 | 145,633 |
7.0%, with various maturities from 6/1/2032 until 8/1/2035 | 504,374 | 515,104 |
8.5%, 7/1/2030 | 2,336 | 2,520 |
Federal National Mortgage Association: | | |
5.0%, 10/1/2033 | 574,489 | 588,291 |
6.0%, 2/1/2035 | 20,000,000 | 20,604,688 |
6.5%, 1/1/2038 | 1,808,719 | 1,882,128 |
7.0%, 9/1/2013 | 443 | 456 |
8.0%, 12/1/2024 | 11,264 | 11,923 |
Government National Mortgage Association: | | |
4.5%, 1/1/2033 (c) | 2,000,000 | 2,025,625 |
5.0%, with various maturities from 5/20/2023 until 8/20/2035 (c) | 5,664,211 | 5,862,401 |
5.5%, with various maturities from 10/15/2032 until 3/15/2038 (c) | 35,855,560 | 37,140,094 |
6.0%, with various maturities from 4/15/2013 until 10/15/2038 (c) | 41,366,311 | 42,859,746 |
6.5%, with various maturities from 3/15/2014 until 6/15/2038 | 9,644,836 | 10,081,964 |
7.0%, with various maturities from 10/15/2026 until 11/15/2038 | 7,393,887 | 7,727,443 |
7.5%, with various maturities from 4/15/2026 until 1/15/2037 | 1,811,941 | 1,905,820 |
9.5%, with various maturities from 7/15/2016 until 12/15/2022 | 49,601 | 55,217 |
10.0%, with various maturities from 2/15/2016 until 3/15/2016 | 15,141 | 17,008 |
Total Mortgage-Backed Securities Pass-Throughs (Cost $148,889,475) | 151,915,496 |
|
Collateralized Mortgage Obligations 18.4% |
FannieMae Grantor Trust, "A2", Series 2001-T10, 7.5%, 12/25/2041 | 250,961 | 258,352 |
FannieMae Whole Loan, "3A", Series 2004-W8, 7.5%, 6/25/2044 | 965,400 | 997,563 |
Federal Home Loan Mortgage Corp.: | | |
"AF", Series 2892, 1.495%*, 5/15/2021 | 951,179 | 942,110 |
"FT", Series 3346, 1.545%*, 10/15/2033 | 2,553,325 | 2,447,389 |
"FA", Series 3237, 1.545%*, 11/15/2036 | 779,088 | 752,295 |
| Principal Amount ($) | Value ($) |
| |
"FP", Series 3069, 1.695%*, 6/15/2035 | 888,343 | 865,495 |
"GZ", Series 2906, 5.0%, 9/15/2034 | 1,526,119 | 1,451,696 |
"SL", Series 2882, Interest Only, 6.005%**, 10/15/2034 | 1,198,123 | 122,709 |
"1A1", Series T-59, 6.5%, 10/25/2043 | 1,851,610 | 1,882,639 |
"ST", Series 2411, Interest Only, 7.328%**, 6/15/2021 | 4,075,291 | 382,489 |
Federal National Mortgage Association: | | |
"LO", Series 2005-50, Principal Only, Zero Coupon, 6/25/2035 | 1,077,541 | 998,804 |
"ZA", Series 2008-24, 5.0%, 4/25/2038 | 545,024 | 499,220 |
"AN", Series 2007-108, 8.897%*, 11/25/2037 | 2,384,358 | 2,531,881 |
Government National Mortgage Association: | | |
"OD", Series 2006-36, Principal Only, Zero Coupon, 7/16/2036 | 446,272 | 388,427 |
"FH", Series 2007-33, 0.808%*, 6/20/2037 | 889,933 | 888,011 |
"FH", Series 1999-18, 1.29%*, 5/16/2029 | 2,422,481 | 2,299,383 |
"FE", Series 2003-57, 1.34%*, 3/16/2033 | 151,058 | 147,481 |
"FB", Series 2001-28, 1.54%*, 6/16/2031 | 669,043 | 654,816 |
"GD", Series 2004-26, 5.0%, 11/16/2032 | 2,184,000 | 2,226,696 |
"LG", Series 2003-70, 5.0%, 8/20/2033 | 4,000,000 | 3,945,196 |
"KE", Series 2004-19, 5.0%, 3/16/2034 | 500,000 | 492,666 |
"ZM", Series 2004-24, 5.0%, 4/20/2034 | 1,893,285 | 1,820,810 |
"LE", Series 2004-87, 5.0%, 10/20/2034 | 1,000,000 | 974,975 |
"ZB", Series 2005-15, 5.0%, 2/16/2035 | 1,331,863 | 1,273,383 |
"CK", Series 2007-31, 5.0%, 5/16/2037 | 1,000,000 | 1,006,963 |
"SF", Series 2002-63, Interest Only, 5.24%**, 9/16/2032 | 2,876,291 | 275,938 |
"SP", Series 2005-61, Interest Only, 5.24%**, 8/16/2035 | 1,354,699 | 89,702 |
"ZB", Series 2003-85, 5.5%, 10/20/2033 | 2,537,410 | 2,382,871 |
"B", Series 2005-88, 5.5%, 11/20/2035 | 1,804,000 | 1,781,773 |
"ZA", Series 2006-7, 5.5%, 2/20/2036 | 1,985,966 | 1,890,512 |
"SA", Series 2002-65, Interest Only, 5.743%**, 9/20/2032 | 4,298,014 | 490,845 |
"SB", Series 2008-36, Interest Only, 5.763%**, 4/20/2038 | 2,593,928 | 112,725 |
"PH" Series 2002- 84, 6.0%, 11/16/2032 | 500,000 | 507,573 |
"SY", Series 2004-47, Interest Only, 6.02%**, 1/16/2034 | 1,125,608 | 101,382 |
"NS", Series 2007-72, Interest Only, 6.023%**, 11/20/2037 | 731,067 | 29,374 |
"SJ", Series 2004-22, Interest Only, 6.093%**, 4/20/2034 | 6,328,976 | 331,472 |
| Principal Amount ($) | Value ($) |
| |
"SN", Series 2005-68, Interest Only, 6.239%**, 1/17/2034 | 4,461,935 | 258,385 |
"GS", Series 2006-16, Interest Only, 6.483%**, 4/20/2036 | 1,392,668 | 111,770 |
"KS", Series 2004-96, Interest Only, 6.493%**, 7/20/2034 | 725,086 | 49,040 |
"PB", Series 2001-53, 6.5%, 11/20/2031 | 1,500,000 | 1,590,274 |
"QS", Series 2003-34, Interest Only, 6.643%**, 3/20/2033 | 573,654 | 58,086 |
"SJ", Series 1999-43, Interest Only, 6.96%**, 11/16/2029 | 334,974 | 35,423 |
Total Collateralized Mortgage Obligations (Cost $38,952,258) | 40,348,594 |
|
Government & Agency Obligations 15.3% |
US Government Sponsored Agencies 10.6% |
Federal Home Loan Bank, 3.625%, 9/16/2011 | 20,000,000 | 21,162,160 |
Federal National Mortgage Association, 8.45%*, 2/27/2023 | 2,000,000 | 2,000,000 |
| 23,162,160 |
| Principal Amount ($) | Value ($) |
| |
US Treasury Obligations 4.7% |
US Treasury Bill: | | |
0.04%***, 5/21/2009 (a) | 75,000 | 74,978 |
0.17%***, 1/15/2009 (a) | 912,000 | 911,996 |
US Treasury Inflation-Indexed Notes: | | |
0.625%, 4/15/2013 | 1,024,970 | 979,968 |
3.875%, 1/15/2009 | 7,926,000 | 7,864,700 |
US Treasury Note, 3.375%, 7/31/2013 | 500,000 | 546,133 |
| 10,377,775 |
Total Government & Agency Obligations (Cost $33,377,285) | 33,539,935 |
| Shares | Value ($) |
| |
Cash Equivalents 4.9% |
Cash Management QP Trust, 1.42% (b) (Cost $10,642,753) | 10,642,753 | 10,642,753 |
| % of Net Assets | Value ($) |
| |
Total Investment Portfolio (Cost $231,861,771)+ | 107.8 | 236,446,778 |
Other Assets and Liabilities, Net | (7.8) | (17,185,662) |
Net Assets | 100.0 | 219,261,116 |
* Floating rate notes are securities whose yields vary with a designated market index or market rate, such as the coupon-equivalent of the US Treasury bill rate. These securities are shown at their current rate as of December 31, 2008.** These securities are shown at their current rate as of December 31, 2008.*** Annualized yield at time of purchase; not a coupon rate.+ The cost for federal income tax purposes was $231,862,148. At December 31, 2008, net unrealized appreciation for all securities based on tax cost was $4,584,630. This consisted of aggregate gross unrealized appreciation for all securities in which there was an excess of value over tax cost of $5,175,130 and aggregate gross unrealized depreciation for all securities in which there was an excess of tax cost over value of $590,500.(a) At December 31, 2008, this security has been pledged, in whole or in part, to cover initial margin requirements for open futures contracts.(b) Affiliated fund managed by Deutsche Investment Management Americas Inc. The rate shown is the annualized seven-day yield at period end.(c) When-issued or delayed delivery securities included.Interest Only: Interest Only (IO) bonds represent the "interest only" portion of payments on a pool of underlying mortgages or mortgage-backed securities. IO securities are subject to prepayment risk of the pool of underlying mortgages.
Principal Only: Principal Only (PO) bonds represent the "principal only" portion of payments on a pool of underlying mortgages or mortgage-backed securities.
At December 31, 2008, open futures contracts purchased were as follows:
Futures | Expiration
Date | Contracts | Aggregate Face Value ($) | Value ($) | Unrealized Appreciation ($) |
2 Year US Treasury Note
| 3/31/2009 | 78 | 16,743,406 | 17,008,875 | 265,469 |
At December 31, 2008, open futures contracts sold were as follows:
Futures | Expiration
Date | Contracts | Aggregate Face Value ($) | Value ($) | Unrealized Appreciation/
(Depreciation) ($) |
10 Year US Treasury Note
| 3/20/2009 | 428 | 50,187,097 | 53,821,000 | (3,633,903) |
5 Year US Treasury Note
| 3/31/2009 | 19 | 2,280,244 | 2,262,039 | 18,205 |
Total net unrealized depreciation | (3,615,698) |
Included in the portfolio are investments in mortgage or asset-backed securities which are interests in separate pools of mortgages or assets. Effective maturities of these investments may be shorter than stated maturities due to prepayments. Some separate investments in the Federal Home Loan Mortgage Corp., Federal National Mortgage Association and Government National Mortgage Association issues which have similar coupon rates have been aggregated for presentation purposes in this investment portfolio.
Fair Value Measurements
The following is a summary of the inputs used as of December 31, 2008 in valuing the Portfolio's investments. For information on the Portfolio's policy regarding the valuation of investments and of the valuation inputs, and the aggregate levels used in the table below, please refer to the Security Valuation section of Note A in the accompanying Notes to the Financial Statements.
Valuation Inputs | Investments in Securities | Other Financial Instruments++ |
Level 1
| $ — | $ (3,350,229) |
Level 2
| 236,446,778 | — |
Level 3
| — | — |
Total | $ 236,446,778 | $ (3,350,229) |
++ Other financial instruments are derivative instruments not reflected in the Investment Portfolio, such as futures contracts, which are valued at the unrealized appreciation (depreciation) on the instrument.The accompanying notes are an integral part of the financial statements.
Financial Statements
Statement of Assets and Liabilities as of December 31, 2008
|
Assets |
Investments
Investments in securities, at value (cost $221,219,018) | $ 225,804,025 |
Investments in Cash Management QP Trust (cost $10,642,753) | 10,642,753 |
Total investments, at value (cost $231,861,771)
| 236,446,778 |
Cash
| 2,011,444 |
Receivable for investments sold
| 71,866,161 |
Receivable for daily variation margin on open futures contracts
| 669,720 |
Interest receivable
| 1,359,903 |
Other assets
| 5,882 |
Total assets
| 312,359,888 |
Liabilities |
Payable for when-issued and delayed delivery securities purchased
| 68,551,647 |
Payable for investments purchased
| 23,239,470 |
Payable for Portfolio shares redeemed
| 993,689 |
Accrued management fee
| 77,681 |
Other accrued expenses and payables
| 236,285 |
Total liabilities
| 93,098,772 |
Net assets, at value | $ 219,261,116 |
Net Assets Consist of |
Undistributed net investment income
| 9,842,645 |
Net unrealized appreciation (depreciation) on:
Investments | 4,585,007 |
Futures | (3,350,229) |
Accumulated net realized gain (loss)
| (3,129,170) |
Paid-in capital
| 211,312,863 |
Net assets, at value | $ 219,261,116 |
Class A Net Asset Value, offering and redemption price per share ($211,348,740 ÷ 17,044,556 outstanding shares of beneficial interest, $.01 par value, unlimited number of shares authorized)
| $ 12.40 |
Class B Net Asset Value, offering and redemption price per share ($7,912,376 ÷ 639,523 outstanding shares of beneficial interest, $.01 par value, unlimited number of shares authorized)
| $ 12.37 |
The accompanying notes are an integral part of the financial statements.
Statement of Operations for the year ended December 31, 2008
|
Investment Income |
Income:
Interest
| $ 11,096,939 |
Interest — Cash Management QP Trust
| 202,323 |
Securities lending income, including income from Daily Assets Fund Institutional, net of borrower rebates
| 11,566 |
Total Income
| 11,310,828 |
Expenses:
Management fee
| 1,045,390 |
Administration fee
| 143,349 |
Custodian fee
| 18,692 |
Distribution service fee (Class B)
| 18,374 |
Services to shareholders
| 674 |
Record keeping fees (Class B)
| 7,043 |
Professional fees
| 85,762 |
Trustees' fees and expenses
| 18,411 |
Reports to shareholders and shareholder meeting
| 105,985 |
Other
| 15,728 |
Total expenses before expense reductions
| 1,459,408 |
Expense reductions
| (21,069) |
Total expenses after expense reductions
| 1,438,339 |
Net investment income | 9,872,489 |
Realized and Unrealized Gain (Loss) |
Net realized gain (loss) from:
Investments
| 2,090,535 |
Futures
| (2,538,655) |
| (448,120) |
Change in net unrealized appreciation (depreciation) on:
Investments
| 3,918,330 |
Futures
| (3,141,054) |
| 777,276 |
Net gain (loss) | 329,156 |
Net increase (decrease) in net assets resulting from operations | $ 10,201,645 |
The accompanying notes are an integral part of the financial statements.
Statement of Changes in Net Assets |
| Years Ended December 31, |
Increase (Decrease) in Net Assets | 2008 | 2007 |
Operations:
Net investment income
| $ 9,872,489 | $ 10,439,394 |
Net realized gain (loss)
| (448,120) | (1,286,321) |
Change in net unrealized appreciation (depreciation)
| 777,276 | 3,273,665 |
Net increase (decrease) in net assets resulting from operations
| 10,201,645 | 12,426,738 |
Distributions to shareholders from:
Net investment income:
Class A | (9,943,580) | (10,212,645) |
Class B | (313,588) | (1,469,899) |
Total distributions
| (10,257,168) | (11,682,544) |
Portfolio share transactions:
Class A Proceeds from shares sold
| 78,211,163 | 30,397,968 |
Reinvestment of distributions
| 9,943,580 | 10,212,645 |
Cost of shares redeemed
| (75,825,560) | (53,955,468) |
Net increase (decrease) in net assets from Class A share transactions
| 12,329,183 | (13,344,855) |
Class B Proceeds from shares sold
| 7,001,909 | 9,440,856 |
Reinvestment of distributions
| 313,588 | 1,469,899 |
Cost of shares redeemed
| (4,358,212) | (38,336,134) |
Net increase (decrease) in net assets from Class B share transactions
| 2,957,285 | (27,425,379) |
Increase (decrease) in net assets | 15,230,945 | (40,026,040) |
Net assets at beginning of period
| 204,030,171 | 244,056,211 |
Net assets at end of period (including undistributed net investment income of $9,842,645 and $10,227,324, respectively)
| $ 219,261,116 | $ 204,030,171 |
Other Information |
Class A Shares outstanding at beginning of period
| 16,080,508 | 17,174,275 |
Shares sold
| 6,375,775 | 2,509,518 |
Shares issued to shareholders in reinvestment of distributions
| 823,144 | 862,554 |
Shares redeemed
| (6,234,871) | (4,465,839) |
Net increase (decrease) in Class A shares
| 964,048 | (1,093,767) |
Shares outstanding at end of period
| 17,044,556 | 16,080,508 |
Class B Shares outstanding at beginning of period
| 403,813 | 2,706,547 |
Shares sold
| 569,092 | 788,569 |
Shares issued to shareholders in reinvestment of distributions
| 25,938 | 124,042 |
Shares redeemed
| (359,320) | (3,215,345) |
Net increase (decrease) in Class B shares
| 235,710 | (2,302,734) |
Shares outstanding at end of period
| 639,523 | 403,813 |
The accompanying notes are an integral part of the financial statements.
Financial Highlights
Class A Years Ended December 31, | 2008 | 2007 | 2006 | 2005 | 2004 |
Selected Per Share Data |
Net asset value, beginning of period | $ 12.38 | $ 12.28 | $ 12.26 | $ 12.55 | $ 12.54 |
Income (loss) from investment operations: Net investment incomea | .56 | .58 | .55 | .51 | .44 |
Net realized and unrealized gain (loss) | .04 | .12 | (.06) | (.20) | .03 |
Total from investment operations | .60 | .70 | .49 | .31 | .47 |
Less distributions from: Net investment income | (.58) | (.60) | (.47) | (.50) | (.35) |
Net realized gains | — | — | — | (.10) | (.11) |
Total distributions | (.58) | (.60) | (.47) | (.60) | (.46) |
Net asset value, end of period | $ 12.40 | $ 12.38 | $ 12.28 | $ 12.26 | $ 12.55 |
Total Return (%)
| 4.93b | 5.95b | 4.16 | 2.57 | 3.75 |
Ratios to Average Net Assets and Supplemental Data |
Net assets, end of period ($ millions)
| 211 | 199 | 211 | 243 | 280 |
Ratio of expenses before expense reductions (%)
| .66 | .66 | .67 | .63 | .61 |
Ratio of expenses after expense reductions (%)
| .65 | .63 | .67 | .63 | .61 |
Ratio of net investment income (loss) (%)
| 4.58 | 4.77 | 4.56 | 4.17 | 3.59 |
Portfolio turnover rate (%)
| 543 | 465 | 241 | 191 | 226 |
a Based on average shares outstanding during the period.
b Total return would have been lower had certain expenses not been reduced.
|
Class B Years Ended December 31, | 2008 | 2007 | 2006 | 2005 | 2004 |
Selected Per Share Data |
Net asset value, beginning of period | $ 12.35 | $ 12.25 | $ 12.23 | $ 12.52 | $ 12.51 |
Income (loss) from investment operations: Net investment incomea | .52 | .53 | .50 | .47 | .40 |
Net realized and unrealized gain (loss) | .03 | .12 | (.06) | (.21) | .02 |
Total from investment operations | .55 | .65 | .44 | .26 | .42 |
Less distributions from: Net investment income | (.53) | (.55) | (.42) | (.45) | (.30) |
Net realized gains | — | — | — | (.10) | (.11) |
Total distributions | (.53) | (.55) | (.42) | (.55) | (.41) |
Net asset value, end of period | $ 12.37 | $ 12.35 | $ 12.25 | $ 12.23 | $ 12.52 |
Total Return (%)
| 4.60b | 5.43b | 3.74 | 2.24 | 3.36 |
Ratios to Average Net Assets and Supplemental Data |
Net assets, end of period ($ millions)
| 8 | 5 | 33 | 47 | 49 |
Ratio of expenses before expense reductions (%)
| 1.00 | 1.04 | 1.07 | 1.02 | 1.00 |
Ratio of expenses after expense reductions (%)
| 1.00 | 1.01 | 1.07 | 1.02 | 1.00 |
Ratio of net investment income (%)
| 4.24 | 4.39 | 4.16 | 3.78 | 3.21 |
Portfolio turnover rate (%)
| 543 | 465 | 241 | 191 | 226 |
a Based on average shares outstanding during the period.
b Total return would have been lower had certain expenses not been reduced.
|
Performance Summary December 31, 2008
DWS Growth Allocation VIP
All performance shown is historical, assumes reinvestment of all dividend and capital gain distributions and does not guarantee future results. Investment return and principal value fluctuate with changing market conditions so that, when redeemed, shares may be worth more or less than their original cost. Current performance may be lower or higher than the performance data quoted. Please contact your participating insurance company for the Portfolio's most recent month-end performance. Performance doesn't reflect charges and fees ("contract charges") associated with the separate account that invests in the Portfolio or any variable life insurance policy or variable annuity contract for which the Portfolio is an investment option. These charges and fees will reduce returns.
The total annual Portfolio direct operating expense ratio, gross of any fee waivers or expense reimbursements, as stated in the fee table of the prospectus dated May 1, 2008 is 0.59% for Class B shares. The total Portfolio direct and estimated indirect Underlying DWS Portfolio operating expense ratio, gross of any fee waivers or expense reimbursements, as presented in the fee table of the prospectus dated May 1, 2008 is 1.32% for Class B shares. Please see the Information About Your Portfolio's Expenses, the Financial Highlights and Notes to the Financial Statements (Note C, Related Parties) sections of this report for gross and net expense related disclosure for the period ended December 31, 2008.
Risk Considerations
Diversification does not eliminate risk. The underlying portfolios invest in individual equity and bond funds whose yields and market values fluctuate, so that your investment may be worth more or less than its original cost. In addition, the underlying portfolios are subject to stock market risk, meaning stocks in the Portfolio may decline in value for extended periods of time due to the activities and financial prospects of individual companies, or due to general market and economic conditions. Investing in foreign securities presents certain risks, such as currency fluctuation, political and economic changes, and market risks. Derivatives may be more volatile and less liquid than traditional securities, and the Portfolio could suffer losses on its derivative positions. Bond investments are subject to interest-rate risk such that when interest rates rise, the prices of the bonds, and thus the value of the Portfolio, can decline and the investor can lose principal value. An investment in underlying money market investments is not insured or guaranteed by the Federal Deposit Insurance Corporation or by any government agency. Although money market investments seek to preserve the value of your investment at $1.00 per share, it is possible to lose money by investing in these investments. Please read this Portfolio's prospectus for specific details regarding its risk profile.
Portfolio returns shown for all periods reflect a fee waiver and/or expense reimbursement. Without this waiver/reimbursement, returns would have been lower.
Growth of an Assumed $10,000 Investment in DWS Growth Allocation VIP from 8/16/2004 to 12/31/2008 |
[] DWS Growth Allocation VIP — Class B [] Russell 1000® Index [] Barclays Capital US Aggregate Index | The Russell 1000® Index is an unmanaged Index that measures the performance of the 1,000 largest companies in the Russell 3000® Index, which represents approximately 92% of the total market capitalization of the Russell 3000 Index. Index returns assume reinvestment of dividends and, unlike Portfolio returns, do not reflect any fees or expenses. It is not possible to invest directly into an index. The Barclays Capital US Aggregate Index (name changed from Lehman Brothers US Aggregate Index, effective November 3, 2008) is an unmanaged, market value-weighted measure of Treasury issues, agency issues, corporate bond issues and mortgage securities. Index returns, unlike Portfolio returns, do not reflect any fees or expenses. It is not possible to invest directly into an index. |
 | |
|
|
Comparative Results |
DWS Growth Allocation VIP | 1-Year | 3-Year | Life of Portfolio* |
Class B | Growth of $10,000
| $6,545 | $7,784 | $9,103 |
Average annual total return
| -34.55% | -8.01% | -2.13% |
Russell 1000 Index
| Growth of $10,000
| $6,240 | $7,621 | $9,005 |
Average annual total return
| -37.60% | -8.66% | -2.39% |
Barclays Capital US Aggregate Index
| Growth of $10,000
| $10,524 | $11,745 | $12,178 |
Average annual total return
| 5.24% | 5.51% | 4.65% |
The growth of $10,000 is cumulative.
* The Portfolio commenced operations on August 16, 2004. Index returns began on August 31, 2004.Information About Your Portfolio's Expenses
DWS Growth Allocation VIP
As an investor of the Portfolio, you incur two types of costs: ongoing expenses and transaction costs. Ongoing expenses include management fees, distribution and service (12b-1) fees and other Portfolio expenses. Examples of transaction costs include contract charges, redemption fees and account maintenance fees, which are not shown in this section. The following tables are intended to help you understand your ongoing expenses (in dollars) of investing in the Portfolio and to help you compare these expenses with the ongoing expenses of investing in other mutual funds. In addition to the ongoing expenses which the Portfolio bears directly, the Portfolio's shareholders indirectly bear the expense of the Underlying DWS Portfolios and non-affiliated funds ("Underlying Portfolios") in which the Portfolio invests. The Portfolio's estimated indirect expense from investing in the Underlying Portfolios is based on the expense ratios from the Underlying Portfolios' most recent shareholder report. In the most recent six-month period, the Portfolio limited these expenses; had it not done so, expenses would have been higher. The example in the table is based on an investment of $1,000 invested at the beginning of the six-month period and held for the entire period (July 1, 2008 to December 31, 2008).
The tables illustrate your Portfolio's expenses in two ways:
• Actual Portfolio Return. This helps you estimate the actual dollar amount of ongoing expenses (but not transaction costs) paid on a $1,000 investment in the Portfolio using the Portfolio's actual return during the period. To estimate the expenses you paid over the period, simply divide your account value by $1,000 (for example, an $8,600 account value divided by $1,000 = 8.6), then multiply the result by the number in the "Expenses Paid per $1,000" line under the share class you hold.
• Hypothetical 5% Portfolio Return. This helps you to compare your Portfolio's ongoing expenses (but not transaction costs) with those of other mutual funds using the Portfolio's actual expense ratio and a hypothetical rate of return of 5% per year before expenses. Examples using a 5% hypothetical Portfolio return may be found in the shareholder reports of other mutual funds. The hypothetical account values and expenses may not be used to estimate the actual ending account balance or expenses you paid for the period.
Please note that the expenses shown in these tables are meant to highlight your ongoing expenses only and do not reflect any transaction costs. The "Expenses Paid per $1,000" line of the tables is useful in comparing ongoing expenses only and will not help you determine the relative total expense of owning different funds. If these transaction costs had been included, your costs would have been higher.
Direct Portfolio Expenses and Value of a $1,000 Investment for the six months ended December 31, 2008 |
Actual Portfolio Return | | Class B |
Beginning Account Value 7/1/08
| | $ 1,000.00 |
Ending Account Value 12/31/08
| | $ 703.40 |
Expenses Paid per $1,000*
| | $ 3.00 |
Hypothetical 5% Portfolio Return | | Class B |
Beginning Account Value 7/1/08
| | $ 1,000.00 |
Ending Account Value 12/31/08
| | $ 1,021.62 |
Expenses Paid per $1,000*
| | $ 3.56 |
Direct Portfolio Expenses and Acquired Portfolios (Underlying Portfolios) Fees and Expenses and Value of a $1,000 Investment for the six months ended December 31, 2008 |
Actual Portfolio Return | | Class B |
Beginning Account Value 7/1/08
| | $ 1,000.00 |
Ending Account Value 12/31/08
| | $ 703.40 |
Expenses Paid per $1,000**
| | $ 6.38 |
Hypothetical 5% Portfolio Return | | Class B |
Beginning Account Value 7/1/08
| | $ 1,000.00 |
Ending Account Value 12/31/08
| | $ 1,017.65 |
Expenses Paid per $1,000**
| | $ 7.56 |
* Expenses are equal to the Portfolio's annualized expense ratio, multiplied by the average account value over the period, multiplied by the number of days in the most recent six-month period, then divided by 366.** Expenses are equal to the Portfolio's annualized expense ratio plus the Acquired Portfolios (Underlying Portfolios) Fees and Expenses, multiplied by the average account value over the period, multiplied by the number of days in the most recent six-month period, then divided by 366.Annualized Expense Ratios | | Class B |
Direct Portfolio Expense Ratio
| | .70% |
Acquired Portfolios (Underlying Portfolios) Fees and Expenses
| | .79% |
Net Annual Portfolio and Acquired Portfolios (Underlying Portfolios) Operating Expenses
| | 1.49% |
For more information, please refer to the Portfolio's prospectus.
These tables do not reflect charges and fees ("contract charges") associated with the separate account that invests in the Portfolio or any variable life insurance policy or variable annuity contract for which the Portfolio is an investment option.
Management Summary December 31, 2008
DWS Growth Allocation VIP
For the 12 months ended December 31, 2008, the DWS Growth Allocation VIP's Class B shares (unadjusted for contract charges) had a return of -34.55%. For the 12-month period, the Russell 3000® Index, which is generally regarded as a good indicator of the broad stock market, had a return of -37.31%. Since this Portfolio invests in stock and bond funds in several different categories, performance is analyzed by comparing the Portfolio's return with indexes that represent each asset class. The Portfolio's return was below that of its bond benchmark, the Barclays Capital US Aggregate Index, which returned 5.24%, but above the returns of its equity benchmark, the Russell 1000® Index, which returned -37.60%.
There are three major determinants of the Portfolio's performance; strategic asset allocation, tactical asset allocation and the performance of the underlying funds in which the Portfolio's assets are invested. During 2008, strategic asset allocation contributed to the Portfolio's performance relative to its peer group of comparable funds, while tactical asset allocation and performance of the underlying funds detracted.
Strategic asset allocation refers to the longer-term allocation among asset classes. The Portfolio's allocation between equity and fixed-income funds remained close to its target of 75% equity and 25% fixed income during 2008. Tactical allocation decisions are short-term underweights or overweights of particular asset classes relative to their longer-term strategic asset allocation targets.1 Overall tactical asset allocation, with an underweight of cash equivalents and investment-grade bonds balanced by an overweight in large-cap and international equities, detracted from performance, as fixed-income securities performed better than stocks.
Performance of each of the underlying funds is compared to a suitable benchmark for that particular fund's asset class and management style. The underlying funds as a group detracted from performance relative to their respective benchmarks. However, large-cap equity funds added value relative to their peers, as did high-yield funds, although these funds had negative absolute returns.
Inna Okounkova Robert Wang
Portfolio Managers, Deutsche Investment Management Americas Inc.
The Russell 3000 Index measures the performance of the 3,000 largest US companies based on total market capitalization, which represents approximately 98% of the investable US equity market.
The Barclays Capital US Aggregate Index (name changed from Lehman Brothers US Aggregate Index, effective November 3, 2008) is an unmanaged, market value-weighted measure of Treasury issues, agency issues, corporate bond issues and mortgage securities. Index returns, unlike portfolio returns, do not include fees or expenses. It is not possible to invest directly into an index.
The Russell 1000 Index is an unmanaged index that measures the performance of the 1,000 largest companies in the Russell 3000 Index, which represents approximately 92% of the total market capitalization of the Russell 3000 Index. Index returns assume reinvestment of dividends and, unlike portfolio returns, do not include fees or expenses. It is not possible to invest directly into an index.
1 "Overweight" means the portfolio holds a higher weighting in a given sector or security than the benchmark. "Underweight" means the portfolio holds a lower weighting.Portfolio management market commentary is as of December 31, 2008, and may not come to pass. This information is subject to change at any time based on market and other conditions. Past performance does not guarantee future results. Current and future portfolio holdings are subject to risk.
Portfolio Summary
DWS Growth Allocation VIP
Asset Allocation (As a % of Investment Portfolio) | 12/31/08 | 12/31/07 |
| | |
Equity — Equity Funds | 69% | 79% |
Fixed Income — Bond Funds | 21% | 19% |
Equity — Exchange Traded Funds | 6% | — |
Fixed Income — Money Market Funds | 4% | 2% |
| 100% | 100% |
Target Allocation (As a % of Investment Portfolio) | 12/31/08 | 12/31/07 |
| | |
Equity | 75% | 75% |
Fixed Income | 25% | 25% |
Asset allocation is subject to change.
For more complete details about the Portfolio's investment portfolio, see page 148. A complete list of portfolio holdings of the portfolio is posted as of the month end on www.dws-investments.com on or about the 15th day of the following month. More frequent posting of portfolio holdings information may be made from time to time on www.dws-investments.com.
Following the Portfolio's fiscal first and third quarter-end, a complete portfolio holdings listing is filed with the SEC on Form N-Q. The form will be available on the SEC's Web site at www.sec.gov, and it also may be reviewed and copied at the SEC's Public Reference Room in Washington, D.C. Information on the operation of the SEC's Public Reference Room may be obtained by calling (800) SEC-0330.
Investment Portfolio December 31, 2008
DWS Growth Allocation VIP
| Shares | Value ($) |
| |
Equity — Equity Funds 69.5% |
DWS Blue Chip VIP "A" | 2,917 | 21,146 |
DWS Capital Growth VIP "A" | 49,840 | 675,325 |
DWS Communications Fund "Institutional" | 1,885 | 18,488 |
DWS Davis Venture Value VIP "A" | 209,326 | 1,572,035 |
DWS Dreman High Return Equity VIP "A" | 7,233 | 44,917 |
DWS Dreman Small Cap Value Fund "Institutional" | 3,015 | 73,115 |
DWS Dreman Small Mid Cap Value VIP "A" | 92,671 | 734,881 |
DWS Emerging Markets Equity Fund "Institutional" | 29,790 | 303,266 |
DWS Equity 500 Index VIP "A" | 30,487 | 291,155 |
DWS Global Opportunities VIP "A" | 65,537 | 510,537 |
DWS Global Thematic VIP "A" | 85,098 | 496,972 |
DWS Growth & Income VIP "A" | 358,443 | 1,835,226 |
DWS Health Care VIP "A" | 66,930 | 632,487 |
DWS International Select Equity VIP "A" | 4,324 | 26,897 |
DWS International VIP "A" | 160,952 | 1,049,410 |
DWS Janus Growth & Income VIP "A" | 7,182 | 48,766 |
DWS Japan Equity Fund "S" | 12,101 | 89,181 |
DWS Large Cap Value VIP "A" | 433,360 | 3,865,573 |
DWS Mid Cap Growth VIP "A" | 1,913 | 13,006 |
DWS RREEF Global Real Estate Securities Fund "Institutional" | 24,586 | 132,272 |
DWS Small Cap Core Fund "S" | 4,953 | 54,236 |
DWS Small Cap Growth VIP "A" | 48,514 | 369,193 |
DWS Small Cap Index VIP "A" | 25,295 | 218,294 |
DWS Technology VIP "A" | 113,981 | 656,533 |
Total Equity Funds (Cost $24,398,892) | 13,732,911 |
|
Equity — Exchange Traded Funds 5.7% |
Consumer Discretionary Select Sector SPDR Fund | 899 | 19,391 |
Consumer Staples Select Sector SPDR Fund | 3,802 | 90,754 |
Energy Select Sector SPDR Fund | 653 | 31,240 |
Financial Select Sector SPDR Fund | 4,001 | 50,493 |
| Shares | Value ($) |
| |
Industrial Select Sector SPDR Fund | 2,950 | 69,266 |
iShares MSCI Australia Index Fund | 6,895 | 96,599 |
iShares MSCI Canada Index Fund | 12,936 | 225,475 |
iShares MSCI EAFE Small Cap Index Fund | 3,385 | 87,028 |
iShares MSCI France Index Fund | 3,379 | 70,722 |
iShares MSCI Switzerland Index Fund | 3,383 | 62,721 |
iShares MSCI United Kingdom Index Fund | 26,556 | 325,311 |
Total Exchange Traded Funds (Cost $1,635,831) | 1,129,000 |
|
Fixed Income — Bond Funds 20.9% |
DWS Core Fixed Income VIP "A" | 215,420 | 1,917,235 |
DWS Emerging Markets Fixed Income Fund "Institutional" | 6,676 | 55,143 |
DWS Global Bond Fund "S" | 66,328 | 663,941 |
DWS Government & Agency Securities VIP "A" | 67,071 | 831,678 |
DWS High Income VIP "A" | 37,200 | 197,907 |
DWS Inflation Protected Plus Fund "Institutional" | 22,522 | 205,402 |
DWS Short Duration Plus Fund "Institutional" | 19,017 | 166,778 |
DWS US Bond Index Fund "Institutional" | 8,191 | 84,363 |
Total Fixed Income — Bond Funds (Cost $4,788,205) | 4,122,447 |
|
Fixed Income — Money Market Fund 4.2% |
Cash Management QP Trust (Cost $828,709) | 828,709 | 828,709 |
| % of Net Assets | Value ($) |
| |
Total Investment Portfolio (Cost $31,651,637)+ | 100.3 | 19,813,067 |
Other Assets and Liabilities, Net | (0.3) | (53,717) |
Net Assets | 100.0 | 19,759,350 |
+ The cost for federal income tax purposes was $31,711,314. At December 31, 2008, net unrealized depreciation for all securities based on tax cost was $11,898,247. This consisted of aggregate gross unrealized appreciation for all securities in which there was an excess of value over tax cost of $23,939 and aggregate gross unrealized depreciation for all securities in which there was an excess of tax cost over value of $11,922,186.EAFE: Europe, Australasia and Far East
MSCI: Morgan Stanley Capital International
SPDR: Standard & Poor's Depositary Receipt
Fair Value Measurements
The following is a summary of the inputs used as of December 31, 2008 in valuing the Portfolio's investments. For information on the Portfolio's policy regarding the valuation of investments and of the valuation inputs, and the aggregate levels used in the table below, please refer to the Security Valuation section of Note A in the accompanying Notes to the Financial Statements.
Valuation Inputs | Investments in Securities |
Level 1
| $ 18,984,358 |
Level 2
| 828,709 |
Level 3
| — |
Total | $ 19,813,067 |
The accompanying notes are an integral part of the financial statements.
Financial Statements
Statement of Assets and Liabilities as of December 31, 2008
|
Assets |
Investments:
Investments in Underlying Affiliated Portfolios, at value (cost $29,187,097) | $ 17,855,358 |
Investments in Non-affiliated funds (cost $1,635,831) | 1,129,000 |
Investment in Cash Management QP Trust (cost $828,709) | 828,709 |
Total investments, at value (cost $31,651,637)
| 19,813,067 |
Interest receivable
| 1,049 |
Due from Advisor
| 19,773 |
Other assets
| 787 |
Total assets
| 19,834,676 |
Liabilities |
Payable for Portfolio shares redeemed
| 4,017 |
Accrued management fee
| 572 |
Other accrued expenses and payables
| 70,737 |
Total liabilities
| 75,326 |
Net assets, at value | $ 19,759,350 |
Net Assets Consist of |
Undistributed net investment income
| 1,559,705 |
Net unrealized appreciation (depreciation) on investments
| (11,838,570) |
Accumulated net realized gain (loss)
| 1,022,942 |
Paid-in capital
| 29,015,273 |
Net assets, at value | $ 19,759,350 |
Class B Net Asset Value, offering and redemption price per share ($19,759,350 ÷ 3,154,766 outstanding shares of beneficial interest, $.01 par value, unlimited number of shares authorized)
| $ 6.26 |
The accompanying notes are an integral part of the financial statements.
Statement of Operations for the year ended December 31, 2008
|
Investment Income |
Income:
Income distributions from Underlying Affiliated Portfolios
| $ 804,522 |
Dividends
| 28,715 |
Interest — Cash Management QP Trust
| 13,268 |
Total Income
| 846,505 |
Expenses:
Management fee
| 26,040 |
Administration fee
| 16,931 |
Services to shareholders
| 48 |
Custodian and accounting fees
| 21,109 |
Distribution service fee
| 67,386 |
Record keeping fees
| 28,321 |
Audit and tax fees
| 44,645 |
Legal
| 27,214 |
Trustees' fees and expenses
| 8,731 |
Reports to shareholders and shareholder meeting
| 22,121 |
Other
| 5,942 |
Total expenses before expense reductions
| 268,488 |
Expense reductions
| (76,513) |
Total expenses after expense reductions
| 191,975 |
Net investment income (loss) | 654,530 |
Realized and Unrealized Gain (Loss) |
Net realized gain (loss) from investments
| (2,360,576) |
Capital gain distributions from Underlying Affiliated Portfolios
| 4,298,081 |
| 1,937,505 |
Change in net unrealized appreciation (depreciation) on investments
| (13,298,575) |
Net gain (loss) | (11,361,070) |
Net increase (decrease) in net assets resulting from operations | $ (10,706,540) |
The accompanying notes are an integral part of the financial statements.
Statement of Changes in Net Assets |
| Years Ended December 31, |
Increase (Decrease) in Net Assets | 2008 | 2007 |
Operations:
Net investment income (loss)
| $ 654,530 | $ 3,174,829 |
Net realized gain (loss)
| 1,937,505 | 26,468,783 |
Change in net unrealized appreciation (depreciation)
| (13,298,575) | (16,832,031) |
Net increase (decrease) in net assets resulting from operations
| (10,706,540) | 12,811,581 |
Distributions to shareholders from:
Net investment income:
Class B | (1,288,633) | (4,126,872) |
Net realized gains:
Class B | (5,948,945) | (10,532,122) |
Total share distributions
| (7,237,578) | (14,658,994) |
Portfolio share transactions:
Class B Proceeds from shares sold
| 1,876,798 | 5,915,221 |
Reinvestment of distributions
| 7,237,578 | 14,658,994 |
Cost of shares redeemed
| (4,325,172) | (194,804,275) |
Net increase (decrease) in net assets from Class B share transactions
| 4,789,204 | (174,230,060) |
Increase (decrease) in net assets | (13,154,914) | (176,077,473) |
Net assets at beginning of period
| 32,914,264 | 208,991,737 |
Net assets at end of period (including undistributed net investment income of $1,559,705 and $5,144,244, respectively)
| $ 19,759,350 | $ 32,914,264 |
Other Information |
Class B Shares outstanding at beginning of period
| 2,590,950 | 16,154,379 |
Shares sold
| 227,845 | 462,860 |
Shares issued to shareholders in reinvestment of distributions
| 820,587 | 1,205,509 |
Shares redeemed
| (484,616) | (15,231,798) |
Net increase (decrease) in Class B shares
| 563,816 | (13,563,429) |
Shares outstanding at end of period
| 3,154,766 | 2,590,950 |
The accompanying notes are an integral part of the financial statements.
Financial Highlights
Class B Years Ended December 31, | 2008 | 2007 | 2006 | 2005 | 2004a |
Selected Per Share Data |
Net asset value, beginning of period | $ 12.70 | $ 12.94 | $ 11.67 | $ 11.03 | $ 10.00 |
Income (loss) from investment operations: Net investment income (loss)b | .21 | .21 | .14 | .11 | (.03) |
Net realized and unrealized gain (loss) | (3.76) | .47 | 1.33 | .55 | 1.06 |
Total from investment operations | (3.55) | .68 | 1.47 | .66 | 1.03 |
Less distributions from: Net investment income | (.51) | (.26) | (.10) | — | — |
Net realized gains | (2.38) | (.66) | (.10) | (.02) | — |
Total distributions | (2.89) | (.92) | (.20) | (.02) | — |
Net asset value, end of period | $ 6.26 | $ 12.70 | $ 12.94 | $ 11.67 | $ 11.03 |
Total Return (%)c,d
| (34.55) | 5.58 | 12.66 | 6.02 | 10.30** |
Ratios to Average Net Assets and Supplemental Data |
Net assets, end of period ($ millions)
| 20 | 33 | 209 | 197 | 47 |
Ratio of expenses before expense reductions (%)e
| 1.00 | .63 | .62 | .65 | 1.38* |
Ratio of expenses after expense reductions (%)e
| .71 | .58 | .57 | .60 | 0.75* |
Ratio of net investment income (loss) (%)
| 2.43 | 1.60 | 1.20 | 1.01 | (0.69)* |
Portfolio turnover rate (%)
| 45 | 31 | 45 | 20 | 15 |
a For the period from August 16, 2004 (commencement of operations) to December 31, 2004.
b Based on average shares outstanding during the period.
c Total return would have been lower had certain expenses not been reduced.
d Total return would have been lower if the Advisor had not reduced some Underlying Portfolios' expenses.
e The Portfolio invests in other DWS Portfolios and non-affiliated funds and indirectly bears its proportionate share of fees and expenses incurred by the Underlying DWS Portfolios and non-affiliated funds in which the Portfolio is invested. This ratio does not include these indirect fees and expenses.
* Annualized
** Not annualized
|
Performance Summary December 31, 2008
DWS High Income VIP
All performance shown is historical, assumes reinvestment of all dividend and capital gain distributions and does not guarantee future results. Investment return and principal value fluctuate with changing market conditions so that, when redeemed, shares may be worth more or less than their original cost. Current performance may be lower or higher than the performance data quoted. Please contact your participating insurance company for the Portfolio's most recent month-end performance. Performance doesn't reflect charges and fees ("contract charges") associated with the separate account that invests in the Portfolio or any variable life insurance policy or variable annuity contract for which the Portfolio is an investment option. These charges and fees will reduce returns. While all share classes have the same underlying portfolio, their performance will differ.
The total annual portfolio operating expense ratios, gross of any fee waivers or expense reimbursements, as stated in the fee table of the prospectus dated May 1, 2008 are 0.69% and 0.94% for Class A and Class B shares, respectively. Please see the Information About Your Portfolio's Expenses, the Financial Highlights and Notes to the Financial Statements (Note C, Related Parties) sections of this report for gross and net expense related disclosure for the period ended December 31, 2008.
Risk Considerations
Investing in foreign securities presents certain risks, such as currency fluctuation, political and economic changes and market risks. Additionally, the Portfolio may invest in lower-quality and nonrated securities which present greater risk of loss of principal and interest than higher-quality securities. All of these factors may result in greater share price volatility. Bond investments are subject to interest-rate risk such that when interest rates rise, the prices of the bonds, and thus the value of the investment, can decline and the investor can lose principal value. Please read this Portfolio's prospectus for specific details regarding its investments and risk profile.
Portfolio returns shown for all periods reflect a fee waiver and/or expense reimbursement. Without this waiver/reimbursement, returns would have been lower.
Growth of an Assumed $10,000 Investment in DWS High Income VIP |
[] DWS High Income VIP — Class A [] Credit Suisse High Yield Index | The Credit Suisse High Yield Index is an unmanaged, trader-priced portfolio constructed to mirror the global high-yield debt market. Index returns, unlike portfolio returns, do not reflect any fees or expenses. It is not possible to invest directly into an index. |
 | |
Yearly periods ended December 31 |
|
Comparative Results |
DWS High Income VIP | 1-Year | 3-Year | 5-Year | 10-Year |
Class A | Growth of $10,000
| $7,606 | $8,483 | $9,907 | $11,784 |
Average annual total return
| -23.94% | -5.34% | -.19% | 1.66% |
Credit Suisse High Yield Index
| Growth of $10,000
| $7,383 | $8,481 | $9,710 | $13,266 |
Average annual total return
| -26.17% | -5.34% | -.59% | 2.87% |
DWS High Income VIP | 1-Year | 3-Year | 5-Year | Life of Class* |
Class B | Growth of $10,000
| $7,587 | $8,400 | $9,736 | $12,388 |
Average annual total return
| -24.13% | -5.65% | -.53% | 3.35% |
Credit Suisse High Yield Index
| Growth of $10,000
| $7,383 | $8,481 | $9,710 | $12,787 |
Average annual total return
| -26.17% | -5.34% | -.59% | 3.85% |
The growth of $10,000 is cumulative.
* The Portfolio commenced offering Class B shares on July 1, 2002. Index returns began on June 30, 2002.Information About Your Portfolio's Expenses
DWS High Income VIP
As an investor of the Portfolio, you incur two types of costs: ongoing expenses and transaction costs. Ongoing expenses include management fees, distribution and service (12b-1) fees and other Portfolio expenses. Examples of transaction costs include contract charges, redemption fees and account maintenance fees, which are not shown in this section. The following tables are intended to help you understand your ongoing expenses (in dollars) of investing in the Portfolio and to help you compare these expenses with the ongoing expenses of investing in other mutual funds. The example in the table is based on an investment of $1,000 invested at the beginning of the six-month period and held for the entire period (July 1, 2008 to December 31, 2008).
The tables illustrate your Portfolio's expenses in two ways:
• Actual Portfolio Return. This helps you estimate the actual dollar amount of ongoing expenses (but not transaction costs) paid on a $1,000 investment in the Portfolio using the Portfolio's actual return during the period. To estimate the expenses you paid over the period, simply divide your account value by $1,000 (for example, an $8,600 account value divided by $1,000 = 8.6), then multiply the result by the number in the "Expenses Paid per $1,000" line under the share class you hold.
• Hypothetical 5% Portfolio Return. This helps you to compare your Portfolio's ongoing expenses (but not transaction costs) with those of other mutual funds using the Portfolio's actual expense ratio and a hypothetical rate of return of 5% per year before expenses. Examples using a 5% hypothetical Portfolio return may be found in the shareholder reports of other mutual funds. The hypothetical account values and expenses may not be used to estimate the actual ending account balance or expenses you paid for the period.
Please note that the expenses shown in these tables are meant to highlight your ongoing expenses only and do not reflect any transaction costs. The "Expenses Paid per $1,000" line of the tables is useful in comparing ongoing expenses only and will not help you determine the relative total expense of owning different funds. If these transaction costs had been included, your costs would have been higher.
Expenses and Value of a $1,000 Investment for the six months ended December 31, 2008 |
Actual Portfolio Return | Class A | | Class B | |
Beginning Account Value 7/1/08
| $ 1,000.00 | | $ 1,000.00 | |
Ending Account Value 12/31/08
| $ 771.00 | | $ 771.30 | |
Expenses Paid per $1,000*
| $ 3.52 | | $ 4.59 | |
Hypothetical 5% Portfolio Return | Class A | | Class B | |
Beginning Account Value 7/1/08
| $ 1,000.00 | | $ 1,000.00 | |
Ending Account Value 12/31/08
| $ 1,021.17 | | $ 1,019.96 | |
Expenses Paid per $1,000*
| $ 4.01 | | $ 5.23 | |
* Expenses are equal to the Portfolio's annualized expense ratio for each share class, multiplied by the average account value over the period, multiplied by the number of days in the most recent six-month period, then divided by 366.Annualized Expense Ratios | Class A | | Class B | |
DWS Variable Series II — DWS High Income VIP
| .79% | | 1.03% | |
For more information, please refer to the Portfolio's prospectus.
These tables do not reflect charges and fees ("contract charges") associated with the separate account that invests in the Portfolio or any variable life insurance policy or variable annuity contract for which the Portfolio is an investment option.
Management Summary December 31, 2008
DWS High Income VIP
High-yield bonds were particularly vulnerable to the crosscurrents affecting the broader financial system in 2008, producing a negative absolute return and underperforming the broader bond market by a wide margin. First, concerns about a sharp economic slowdown fueled speculation that the high-yield default rate would move considerably higher. Second, the financial crisis caused a number of corporations to lose access to credit — at least temporarily — an issue of particular importance for companies in the high-yield sector. And third, forced selling by institutional investors put additional pressure on bond prices. While the market recovered somewhat in December, the Credit Suisse High Yield Index, the Portfolio's benchmark, finished the year with a return of -26.17%. Class A shares of the Portfolio outperformed its benchmark with a return of -23.94% (unadjusted for contract charges).
From a sector standpoint, the Portfolio benefited from its above-benchmark weightings in less cyclical groups such as health care, utilities and wireless telecommunication. Among individual securities, some of the leading contributors to performance were Charter Communications Operating LLC; Kansas City Southern Railway Co.; and DRS Technologies, Inc., a defense-related firm that was bid for by the investment-grade-rated company Finmeccanica SpA. Notable detractors included Lyondell Chemical Co.*, Young Broadcasting, Inc. and Hawker Beechcraft Acquisition Co., LLC.
We believe a cautious investment approach remains necessary in the current environment. Given the uncertainty in the global financial markets, we believe that the key to outperformance throughout 2009 will be the avoidance of individual credit defaults. We continue to focus carefully on research and the fundamental credit strength of issuers in the Portfolio in order to minimize default risk to the greatest extent possible.
Gary Sullivan, CFA
Portfolio Manager, Deutsche Investment Management Americas Inc.
The Credit Suisse High Yield Index is an unmanaged, trader-priced portfolio constructed to mirror the global high-yield debt market. Index returns, unlike portfolio returns, do not reflect any fees or expenses. It is not possible to invest directly into an index.
* Not held in the Portfolio as of December 31, 2008.Portfolio management market commentary is as of December 31, 2008, and may not come to pass. This information is subject to change at any time based on market and other conditions. Past performance does not guarantee future results. Current and future portfolio holdings are subject to risk.
Portfolio Summary
DWS High Income VIP
Asset Allocation (As a % of Investment Portfolio excluding Securities Lending Collateral) | 12/31/08 | 12/31/07 |
| | |
Corporate Bonds | 84% | 89% |
Cash Equivalents | 9% | 3% |
Loan Participations and Assignments | 7% | 7% |
Other Investments | — | 1% |
| 100% | 100% |
Sector Diversification (Excludes Cash Equivalents and Securities Lending Collateral) | 12/31/08 | 12/31/07 |
| | |
Energy | 15% | 11% |
Consumer Discretionary | 13% | 22% |
Materials | 12% | 11% |
Telecommunication Services | 12% | 8% |
Utilities | 11% | 7% |
Financials | 10% | 14% |
Industrials | 10% | 13% |
Health Care | 9% | 6% |
Consumer Staples | 4% | 4% |
Information Technology | 4% | 4% |
| 100% | 100% |
Quality (Excludes Securities Lending Collateral) | 12/31/08 | 12/31/07 |
| | |
Cash Equivalents | 8% | 3% |
BBB | 12% | 4% |
BB | 35% | 29% |
B | 31% | 51% |
CCC | 7% | 13% |
CC | 3% | — |
D | 1% | — |
Not Rated | 3% | — |
| 100% | 100% |
Effective Maturity (Excludes Cash Equivalents and Securities Lending Collateral) | 12/31/08 | 12/31/07 |
| | |
Under 1 year | 5% | 6% |
1-4.99 years | 41% | 32% |
5-9.99 years | 50% | 56% |
10-14.99 years | 1% | 2% |
15 years or greater | 3% | 4% |
| 100% | 100% |
Interest Rate Sensitivity | 12/31/08 | 12/31/07 |
| | |
Effective maturity | 5.6 years | 6.2 years |
Average duration | 3.7 years | 4.1 years |
Asset allocation, sector diversification, quality, effective maturity and interest rate sensitivity are subject to change.
For more complete details about the Portfolio's investment portfolio, see page 158. A complete list of portfolio holdings of the portfolio is posted as of the month end on www.dws-investments.com on or about the 15th day of the following month. More frequent posting of portfolio holdings information may be made from time to time on www.dws-investments.com.
Following the Portfolio's fiscal first and third quarter-end, a complete portfolio holdings listing is filed with the SEC on Form N-Q. The form will be available on the SEC's Web site at www.sec.gov, and it also may be reviewed and copied at the SEC's Public Reference Room in Washington, D.C. Information on the operation of the SEC's Public Reference Room may be obtained by calling (800) SEC-0330.
Investment Portfolio December 31, 2008
DWS High Income VIP
| Principal Amount ($)(a) | Value ($) |
| |
Corporate Bonds 81.9% |
Consumer Discretionary 10.8% |
AMC Entertainment, Inc., 8.0%, 3/1/2014 | 740,000 | 455,100 |
American Achievement Corp., 144A, 8.25%, 4/1/2012 | 255,000 | 196,350 |
American Achievement Group Holding Corp., 16.75%, 10/1/2012 (PIK) | 404,107 | 96,986 |
Asbury Automotive Group, Inc.: | | |
7.625%, 3/15/2017 | 590,000 | 274,350 |
8.0%, 3/15/2014 | 250,000 | 118,750 |
Ashtead Holdings PLC, 144A, 8.625%, 8/1/2015 | 380,000 | 199,500 |
CanWest MediaWorks LP, 144A, 9.25%, 8/1/2015 | 340,000 | 129,200 |
Carrols Corp., 9.0%, 1/15/2013 | 225,000 | 151,875 |
Charter Communications Operating LLC, 144A, 10.875%, 9/15/2014 | 1,085,000 | 868,000 |
CSC Holdings, Inc.: | | |
6.75%, 4/15/2012 | 355,000 | 324,825 |
Series B, 7.625%, 4/1/2011 | 355,000 | 334,587 |
Series B, 8.125%, 7/15/2009 | 125,000 | 124,375 |
Series B, 8.125%, 8/15/2009 | 345,000 | 343,275 |
Denny's Holdings, Inc., 10.0%, 10/1/2012 | 165,000 | 114,263 |
DIRECTV Holdings LLC, 7.625%, 5/15/2016 | 1,055,000 | 1,023,350 |
Dollarama Group LP, 8.073%***, 8/15/2012 (b) | 347,000 | 220,345 |
EchoStar DBS Corp.: | | |
6.375%, 10/1/2011 | 555,000 | 516,150 |
6.625%, 10/1/2014 | 665,000 | 555,275 |
7.125%, 2/1/2016 | 465,000 | 388,275 |
Fontainebleau Las Vegas Holdings LLC, 144A, 10.25%, 6/15/2015 | 490,000 | 47,775 |
Great Canadian Gaming Corp., 144A, 7.25%, 2/15/2015 | 505,000 | 343,400 |
Group 1 Automotive, Inc., 8.25%, 8/15/2013 | 250,000 | 167,500 |
Hertz Corp., 8.875%, 1/1/2014 | 1,340,000 | 824,100 |
Idearc, Inc., 8.0%, 11/15/2016 | 920,000 | 69,000 |
Indianapolis Downs LLC, 144A, 11.0%, 11/1/2012 | 330,000 | 179,850 |
Isle of Capri Casinos, Inc., 7.0%, 3/1/2014 | 425,000 | 180,625 |
Kabel Deutschland GmbH, 10.625%, 7/1/2014 | 620,000 | 551,800 |
Lamar Media Corp., Series C, 6.625%, 8/15/2015 | 295,000 | 213,137 |
Liberty Media LLC, 5.7%, 5/15/2013 | 95,000 | 62,280 |
MediMedia USA, Inc., 144A, 11.375%, 11/15/2014 | 255,000 | 153,000 |
MGM MIRAGE: | | |
6.625%, 7/15/2015 | 410,000 | 250,100 |
8.375%, 2/1/2011 | 425,000 | 252,875 |
MTR Gaming Group, Inc., Series B, 9.75%, 4/1/2010 | 630,000 | 472,500 |
Norcraft Holdings LP, 9.75%, 9/1/2012 | 1,385,000 | 1,031,825 |
| Principal Amount ($)(a) | Value ($) |
| |
Penske Automotive Group, Inc., 7.75%, 12/15/2016 | 905,000 | 420,825 |
Pinnacle Entertainment, Inc., 8.75%, 10/1/2013 | 300,000 | 237,000 |
Quebecor Media, Inc., 7.75%, 3/15/2016 | 290,000 | 195,750 |
Quebecor World, Inc., 144A, 9.75%, 1/15/2015** | 420,000 | 33,075 |
Quiksilver, Inc.,
6.875%, 4/15/2015 | 405,000 | 130,613 |
Reader's Digest Association, Inc., 9.0%, 2/15/2017 | 350,000 | 30,188 |
Sabre Holdings Corp., 8.35%, 3/15/2016 | 460,000 | 102,350 |
Seminole Hard Rock Entertainment, Inc., 144A, 4.496%***, 3/15/2014 | 590,000 | 299,425 |
Shaw Communications, Inc., 8.25%, 4/11/2010 | 605,000 | 595,925 |
Shingle Springs Tribal Gaming Authority, 144A, 9.375%, 6/15/2015 | 370,000 | 185,000 |
Simmons Co., Step-up Coupon, 0% to 12/15/2009, 10.0% to 12/15/2014 | 1,655,000 | 190,325 |
Sinclair Television Group, Inc., 8.0%, 3/15/2012 (c) | 367,000 | 276,167 |
Sirius XM Radio, Inc., 9.625%, 8/1/2013 | 860,000 | 160,175 |
Sonic Automotive,
Inc., Series B,
8.625%, 8/15/2013 | 490,000 | 182,525 |
Travelport LLC: | | |
6.828%***, 9/1/2014 | 390,000 | 115,050 |
9.875%, 9/1/2014 | 65,000 | 24,375 |
Trump Entertainment Resorts, Inc., 8.5%, 6/1/2015 | 105,000 | 13,913 |
United Components, Inc., 9.375%, 6/15/2013 | 80,000 | 33,600 |
Unity Media GmbH: | | |
144A, 8.75%, 2/15/2015 EUR | 785,000 | 856,583 |
144A, 10.375%, 2/15/2015 | 255,000 | 198,262 |
UPC Holding BV: | | |
144A, 7.75%, 1/15/2014 EUR | 365,000 | 388,136 |
144A, 8.0%, 11/1/2016 EUR | 190,000 | 183,556 |
Vertis, Inc.,
13.5%, 4/1/2014 (PIK) | 200,357 | 46,743 |
Vitro SAB de CV,
9.125%, 2/1/2017 | 1,470,000 | 441,000 |
Young Broadcasting, Inc., 8.75%, 1/15/2014 | 2,040,000 | 20,400 |
| 16,595,559 |
Consumer Staples 3.4% |
Alliance One International, Inc., 8.5%, 5/15/2012 | 250,000 | 183,750 |
Altria Group, Inc.: | | |
8.5%, 11/10/2013 | 330,000 | 341,796 |
9.7%, 11/10/2018 | 165,000 | 178,337 |
Delhaize America, Inc.: | | |
8.05%, 4/15/2027 | 190,000 | 175,829 |
9.0%, 4/15/2031 | 917,000 | 927,381 |
General Nutrition Centers, Inc., 7.584%***, 3/15/2014 (PIK) | 280,000 | 156,800 |
| Principal Amount ($)(a) | Value ($) |
| |
North Atlantic Trading Co., 144A, 10.0%, 3/1/2012 | 2,081,750 | 1,144,963 |
Smithfield Foods, Inc., 7.75%, 7/1/2017 | 145,000 | 82,650 |
Viskase Companies, Inc., 11.5%, 6/15/2011 | 3,100,000 | 2,015,000 |
| 5,206,506 |
Energy 11.1% |
Atlas Energy Resources LLC, 144A, 10.75%, 2/1/2018 | 845,000 | 515,450 |
Belden & Blake Corp., 8.75%, 7/15/2012 | 2,050,000 | 1,404,250 |
Bristow Group, Inc., 7.5%, 9/15/2017 | 450,000 | 301,500 |
Chaparral Energy, Inc., 8.5%, 12/1/2015 | 600,000 | 120,000 |
Chesapeake Energy Corp.: | | |
6.25%, 1/15/2018 | 525,000 | 388,500 |
6.875%, 1/15/2016 | 1,166,000 | 932,800 |
7.25%, 12/15/2018 | 800,000 | 624,000 |
7.5%, 6/15/2014 | 180,000 | 152,100 |
Cimarex Energy Co., 7.125%, 5/1/2017 | 370,000 | 288,600 |
Colorado Interstate Gas Co., 6.8%, 11/15/2015 | 220,000 | 189,528 |
Delta Petroleum Corp., 7.0%, 4/1/2015 | 715,000 | 143,000 |
Dynegy Holdings, Inc., 6.875%, 4/1/2011 | 195,000 | 170,625 |
El Paso Corp.: | | |
7.25%, 6/1/2018 | 985,000 | 781,767 |
7.75%, 6/15/2010 | 165,000 | 152,950 |
9.625%, 5/15/2012 | 320,000 | 271,715 |
EXCO Resources, Inc., 7.25%, 1/15/2011 | 580,000 | 452,400 |
Forest Oil Corp., 144A, 7.25%, 6/15/2019 | 210,000 | 153,300 |
Frontier Oil Corp.: | | |
6.625%, 10/1/2011 | 330,000 | 298,650 |
8.5%, 9/15/2016 | 575,000 | 507,437 |
GulfSouth Pipeline Co., LP, 144A, 5.75%, 8/15/2012 | 100,000 | 89,398 |
KCS Energy, Inc., 7.125%, 4/1/2012 | 1,495,000 | 1,121,250 |
Mariner Energy, Inc.: | | |
7.5%, 4/15/2013 | 305,000 | 195,200 |
8.0%, 5/15/2017 | 470,000 | 244,400 |
Newfield Exploration Co., 7.125%, 5/15/2018 | 640,000 | 505,600 |
OPTI Canada, Inc., 8.25%, 12/15/2014 | 1,025,000 | 553,500 |
Petrohawk Energy Corp.: | | |
144A, 7.875%, 6/1/2015 | 220,000 | 162,800 |
9.125%, 7/15/2013 | 450,000 | 364,500 |
Plains Exploration & Production Co.: | | |
7.0%, 3/15/2017 | 220,000 | 150,700 |
7.625%, 6/1/2018 | 720,000 | 493,200 |
Quicksilver Resources, Inc., 7.125%, 4/1/2016 | 1,040,000 | 556,400 |
Range Resources Corp., 7.25%, 5/1/2018 | 65,000 | 54,275 |
SandRidge Energy, Inc., 144A, 8.0%, 6/1/2018 | 285,000 | 158,175 |
Southwestern Energy Co., 144A, 7.5%, 2/1/2018 | 585,000 | 511,875 |
| Principal Amount ($)(a) | Value ($) |
| |
Stone Energy Corp.: | | |
6.75%, 12/15/2014 | 590,000 | 289,100 |
8.25%, 12/15/2011 | 1,285,000 | 796,700 |
Tennessee Gas Pipeline Co., 7.625%, 4/1/2037 | 165,000 | 130,968 |
Tesoro Corp., 6.5%, 6/1/2017 | 425,000 | 233,219 |
Whiting Petroleum Corp.: | | |
7.0%, 2/1/2014 | 500,000 | 352,500 |
7.25%, 5/1/2012 | 545,000 | 406,025 |
7.25%, 5/1/2013 | 140,000 | 99,400 |
Williams Companies, Inc.: | | |
8.125%, 3/15/2012 | 1,040,000 | 958,100 |
8.75%, 3/15/2032 | 810,000 | 603,450 |
Williams Partners LP, 7.25%, 2/1/2017 | 420,000 | 331,800 |
| 17,211,107 |
Financials 8.1% |
Algoma Acquisition Corp., 144A, 9.875%, 6/15/2015 | 925,000 | 351,500 |
Ashton Woods USA LLC, 9.5%, 10/1/2015** | 1,370,000 | 274,000 |
Buffalo Thunder Development Authority, 144A, 9.375%, 12/15/2014 | 250,000 | 50,000 |
Conproca SA de CV, REG S, 12.0%, 6/16/2010 | 1,648,035 | 1,676,876 |
Ford Motor Credit Co., LLC: | | |
7.25%, 10/25/2011 | 2,665,000 | 1,946,806 |
7.875%, 6/15/2010 | 1,015,000 | 812,183 |
GMAC LLC, 144A, 6.875%, 9/15/2011 | 2,118,000 | 1,513,459 |
Hawker Beechcraft Acquisition Co., LLC: | | |
8.5%, 4/1/2015 | 1,035,000 | 424,350 |
8.875%, 4/1/2015 (PIK) | 895,000 | 304,300 |
Hexion US Finance Corp., 9.75%, 11/15/2014 | 205,000 | 58,425 |
Inmarsat Finance PLC, 10.375%, 11/15/2012 | 820,000 | 726,725 |
iPayment, Inc.,
9.75%, 5/15/2014 | 475,000 | 237,500 |
Local TV Finance LLC, 144A, 9.25%, 6/15/2015 (PIK) | 430,000 | 94,600 |
New ASAT (Finance) Ltd., 9.25%, 2/1/2011 | 575,000 | 60,375 |
NiSource Finance Corp.: | | |
6.15%, 3/1/2013 | 50,000 | 38,527 |
7.875%, 11/15/2010 | 745,000 | 681,742 |
Orascom Telecom Finance SCA, 144A, 7.875%, 2/8/2014 | 370,000 | 196,100 |
Qwest Capital Funding, Inc., 7.0%, 8/3/2009 | 355,000 | 347,900 |
Rainbow National Services LLC, 144A, 10.375%, 9/1/2014 | 112,000 | 99,680 |
Sprint Capital Corp.: | | |
7.625%, 1/30/2011 | 360,000 | 300,600 |
8.375%, 3/15/2012 | 145,000 | 116,000 |
Tropicana Entertainment LLC, 9.625%, 12/15/2014** | 1,220,000 | 12,200 |
UCI Holdco, Inc., 9.996%***, 12/15/2013 (PIK) | 639,775 | 108,762 |
Universal City Development Partners, 11.75%, 4/1/2010 | 2,125,000 | 1,370,625 |
Wind Acquisition Finance SA: | | |
144A, 9.75%, 12/1/2015 EUR | 570,000 | 645,747 |
144A, 10.75%, 12/1/2015 | 85,000 | 73,100 |
| 12,522,082 |
| Principal Amount ($)(a) | Value ($) |
| |
Health Care 6.4% |
Advanced Medical Optics, Inc., 7.5%, 5/1/2017 | 560,000 | 285,600 |
Boston Scientific Corp., 6.0%, 6/15/2011 | 520,000 | 494,000 |
Community Health Systems, Inc., 8.875%, 7/15/2015 | 2,865,000 | 2,635,800 |
HCA, Inc.: | | |
9.125%, 11/15/2014 | 760,000 | 704,900 |
9.25%, 11/15/2016 | 2,040,000 | 1,871,700 |
9.625%, 11/15/2016 (PIK) | 770,000 | 600,600 |
HEALTHSOUTH Corp., 10.75%, 6/15/2016 | 290,000 | 266,075 |
IASIS Healthcare LLC, 8.75%, 6/15/2014 | 525,000 | 406,875 |
Psychiatric Solutions, Inc., 7.75%, 7/15/2015 | 420,000 | 308,700 |
Surgical Care Affiliates, Inc., 144A, 8.875%, 7/15/2015 (PIK) | 515,000 | 314,150 |
The Cooper Companies, Inc., 7.125%, 2/15/2015 | 840,000 | 705,600 |
Vanguard Health Holding Co. I, LLC, Step-up Coupon, 0% to 10/1/2009, 11.25% to 10/1/2015 | 455,000 | 357,175 |
Vanguard Health Holding Co. II, LLC, 9.0%, 10/1/2014 | 1,095,000 | 914,325 |
| 9,865,500 |
Industrials 9.1% |
Actuant Corp., 6.875%, 6/15/2017 | 300,000 | 225,750 |
Allied Waste North America, Inc., 6.5%, 11/15/2010 | 250,000 | 241,250 |
ARAMARK Corp., 8.5%, 2/1/2015 (c) | 140,000 | 126,700 |
Baldor Electric Co., 8.625%, 2/15/2017 (c) | 380,000 | 283,100 |
BE Aerospace, Inc., 8.5%, 7/1/2018 | 300,000 | 270,000 |
Belden, Inc., 7.0%, 3/15/2017 | 420,000 | 315,000 |
Browning-Ferris Industries, Inc., 7.4%, 9/15/2035 | 1,405,000 | 1,159,080 |
Congoleum Corp., 8.625%, 8/1/2008** | 1,200,000 | 900,000 |
DRS Technologies, Inc.: | | |
6.625%, 2/1/2016 | 45,000 | 45,000 |
6.875%, 11/1/2013 | 590,000 | 587,050 |
7.625%, 2/1/2018 | 1,450,000 | 1,450,000 |
Esco Corp.: | | |
144A, 5.871%***, 12/15/2013 | 430,000 | 275,200 |
144A, 8.625%, 12/15/2013 | 610,000 | 427,000 |
General Cable Corp.: | | |
6.258%***, 4/1/2015 | 505,000 | 236,087 |
7.125%, 4/1/2017 | 400,000 | 264,000 |
Great Lakes Dredge & Dock Co., 7.75%, 12/15/2013 | 300,000 | 231,375 |
K. Hovnanian Enterprises, Inc., 8.875%, 4/1/2012 | 435,000 | 126,150 |
Kansas City Southern de Mexico SA de CV: | | |
7.375%, 6/1/2014 | 500,000 | 409,100 |
7.625%, 12/1/2013 | 1,085,000 | 889,700 |
9.375%, 5/1/2012 | 1,075,000 | 983,625 |
Kansas City Southern Railway Co., 8.0%, 6/1/2015 | 655,000 | 517,450 |
Mobile Mini, Inc., 9.75%, 8/1/2014 | 420,000 | 298,200 |
Moog, Inc., 144A, 7.25%, 6/15/2018 | 140,000 | 112,000 |
| Principal Amount ($)(a) | Value ($) |
| |
Navios Maritime Holdings, Inc., 9.5%, 12/15/2014 | 605,000 | 335,775 |
Ply Gem Industries, Inc., 11.75%, 6/15/2013 (c) | 250,000 | 135,000 |
R.H. Donnelley Corp., Series A-4, 8.875%, 10/15/2017 | 1,185,000 | 177,750 |
RBS Global, Inc. & Rexnord Corp., 9.5%, 8/1/2014 | 335,000 | 249,575 |
Seitel, Inc., 9.75%, 2/15/2014 | 210,000 | 75,600 |
Titan International, Inc., 8.0%, 1/15/2012 | 1,190,000 | 880,600 |
TransDigm, Inc., 7.75%, 7/15/2014 | 260,000 | 213,200 |
United Rentals North America, Inc.: | | |
6.5%, 2/15/2012 | 735,000 | 580,650 |
7.0%, 2/15/2014 | 985,000 | 600,850 |
US Concrete, Inc., 8.375%, 4/1/2014 | 470,000 | 253,800 |
Vought Aircraft Industries, Inc., 8.0%, 7/15/2011 | 250,000 | 168,750 |
| 14,044,367 |
Information Technology 3.4% |
Alion Science & Technology Corp., 10.25%, 2/1/2015 | 390,000 | 175,988 |
L-3 Communications Corp.: | | |
5.875%, 1/15/2015 | 1,280,000 | 1,152,000 |
Series B, 6.375%, 10/15/2015 | 705,000 | 659,175 |
7.625%, 6/15/2012 | 1,055,000 | 1,031,262 |
Lucent Technologies, Inc., 6.45%, 3/15/2029 | 1,185,000 | 474,000 |
MasTec, Inc., 7.625%, 2/1/2017 | 610,000 | 458,262 |
Seagate Technology HDD Holdings, 6.8%, 10/1/2016 | 720,000 | 374,400 |
SunGard Data Systems, Inc., 10.25%, 8/15/2015 | 980,000 | 646,800 |
Vangent, Inc., 9.625%, 2/15/2015 | 350,000 | 203,438 |
| 5,175,325 |
Materials 10.1% |
Appleton Papers, Inc., Series B, 8.125%, 6/15/2011 | 235,000 | 162,150 |
ARCO Chemical Co., 9.8%, 2/1/2020** | 3,270,000 | 359,700 |
Cascades, Inc., 7.25%, 2/15/2013 | 1,096,000 | 558,960 |
Chemtura Corp., 6.875%, 6/1/2016 | 705,000 | 359,550 |
Clondalkin Acquisition BV, 144A, 3.996%***, 12/15/2013 | 540,000 | 272,700 |
CPG International I, Inc., 10.5%, 7/1/2013 | 880,000 | 492,800 |
Exopack Holding Corp., 11.25%, 2/1/2014 | 1,415,000 | 827,775 |
Freeport-McMoRan Copper & Gold, Inc.: | | |
6.875%, 2/1/2014 | 80,000 | 72,000 |
8.25%, 4/1/2015 | 1,005,000 | 854,250 |
8.375%, 4/1/2017 | 1,965,000 | 1,611,300 |
GEO Specialty Chemicals, Inc.: | | |
144A, 7.5%***, 3/31/2015 (PIK) | 1,242,271 | 894,433 |
144A, 9.968%***, 12/31/2009 | 1,996,000 | 1,437,120 |
Georgia-Pacific LLC: | | |
144A, 7.125%, 1/15/2017 | 260,000 | 218,400 |
9.5%, 12/1/2011 | 330,000 | 311,850 |
Hexcel Corp., 6.75%, 2/1/2015 | 1,560,000 | 1,185,600 |
Huntsman LLC, 11.625%, 10/15/2010 | 1,277,000 | 1,117,375 |
Innophos, Inc., 8.875%, 8/15/2014 | 170,000 | 119,000 |
| Principal Amount ($)(a) | Value ($) |
| |
Jefferson Smurfit Corp., 8.25%, 10/1/2012 | 460,000 | 78,200 |
Koppers Holdings, Inc., Step-up Coupon, 0% to 11/15/2009, 9.875% to 11/15/2014 | 1,030,000 | 798,250 |
Metals USA Holdings Corp., 10.883%***, 7/1/2012 (PIK) | 261,937 | 73,343 |
Millar Western Forest Products Ltd., 7.75%, 11/15/2013 | 200,000 | 100,000 |
NewMarket Corp., 7.125%, 12/15/2016 | 1,005,000 | 753,750 |
OI European Group BV, 144A, 6.875%, 3/31/2017 EUR | 475,000 | 482,000 |
Pliant Corp., 11.85%, 6/15/2009 (PIK) | 11 | 6 |
Radnor Holdings Corp., 11.0%, 3/15/2010** | 265,000 | 331 |
Rhodia SA, 144A, 8.068%***, 10/15/2013 EUR | 475,000 | 330,137 |
Smurfit-Stone Container Enterprises, Inc., 8.0%, 3/15/2017 | 550,000 | 104,500 |
Steel Dynamics, Inc., 7.375%, 11/1/2012 | 70,000 | 51,100 |
Terra Capital, Inc., Series B, 7.0%, 2/1/2017 | 815,000 | 599,025 |
The Mosaic Co., 144A, 7.375%, 12/1/2014 | 680,000 | 557,600 |
Witco Corp., 6.875%, 2/1/2026 | 360,000 | 100,800 |
Wolverine Tube, Inc., 10.5%, 4/1/2009 | 770,000 | 619,850 |
| 15,503,855 |
Telecommunication Services 9.1% |
BCM Ireland Preferred Equity Ltd., 144A, 11.245%***, 2/15/2017 (PIK) EUR | 539,588 | 63,994 |
Centennial
Communications Corp.: | | |
10.0%, 1/1/2013 | 290,000 | 300,150 |
10.125%, 6/15/2013 | 625,000 | 631,250 |
Cincinnati Bell, Inc.: | | |
7.25%, 7/15/2013 | 1,030,000 | 906,400 |
8.375%, 1/15/2014(c) | 450,000 | 346,500 |
Cricket Communications, Inc.: | | |
9.375%, 11/1/2014 | 730,000 | 657,000 |
144A, 10.0%, 7/15/2015 | 780,000 | 713,700 |
Frontier Communications Corp.: | | |
6.25%, 1/15/2013 | 430,000 | 365,500 |
9.25%, 5/15/2011 | 255,000 | 242,250 |
Grupo Iusacell Celular SA de CV, 10.0%, 3/31/2012 | 274,071 | 180,887 |
Hellas Telecommunications Luxembourg V, 144A, 8.818%***, 10/15/2012 EUR | 230,000 | 188,630 |
Intelsat Corp.: | | |
144A, 9.25%, 8/15/2014 | 160,000 | 148,800 |
144A, 9.25%, 6/15/2016 | 1,735,000 | 1,578,850 |
Intelsat Subsidiary Holding Co., Ltd., 144A, 8.875%, 1/15/2015 | 960,000 | 873,600 |
iPCS, Inc.,
5.318%***, 5/1/2013 | 200,000 | 142,000 |
MetroPCS Wireless, Inc., 9.25%, 11/1/2014 | 875,000 | 783,125 |
Millicom International Cellular SA, 10.0%, 12/1/2013 | 1,530,000 | 1,377,000 |
| Principal Amount ($)(a) | Value ($) |
| |
Qwest Corp.: | | |
7.25%, 9/15/2025 | 145,000 | 97,150 |
7.875%, 9/1/2011 | 995,000 | 915,400 |
8.875%, 3/15/2012 | 215,000 | 198,875 |
Sprint Nextel Corp., 6.0%, 12/1/2016 | 530,000 | 373,650 |
Stratos Global Corp., 9.875%, 2/15/2013 | 330,000 | 311,850 |
Telesat Canada, 144A, 11.0%, 11/1/2015 | 1,285,000 | 918,775 |
Virgin Media Finance PLC: | | |
8.75%, 4/15/2014 | 820,000 | 615,000 |
8.75%, 4/15/2014 EUR | 700,000 | 685,989 |
Windstream Corp.: | | |
7.0%, 3/15/2019 | 430,000 | 331,100 |
8.625%, 8/1/2016 | 70,000 | 61,950 |
| 14,009,375 |
Utilities 10.4% |
AES Corp.: | | |
8.0%, 10/15/2017 | 415,000 | 340,300 |
144A, 8.0%, 6/1/2020 | 790,000 | 612,250 |
144A, 8.75%, 5/15/2013 | 2,519,000 | 2,418,240 |
9.5%, 6/1/2009 | 540,000 | 535,950 |
Allegheny Energy Supply Co., LLC, 144A, 8.25%, 4/15/2012 | 3,080,000 | 3,033,800 |
CMS Energy Corp., 8.5%, 4/15/2011 | 925,000 | 910,946 |
Edison Mission Energy, 7.0%, 5/15/2017 | 685,000 | 595,950 |
Energy Future Holdings Corp., 144A, 10.875%, 11/1/2017 | 1,115,000 | 791,650 |
Knight, Inc., 6.5%, 9/1/2012 | 215,000 | 181,675 |
Mirant Americas Generation LLC, 8.3%, 5/1/2011 | 550,000 | 533,500 |
Mirant North America LLC, 7.375%, 12/31/2013 | 270,000 | 259,200 |
NRG Energy, Inc.: | | |
7.25%, 2/1/2014 | 915,000 | 855,525 |
7.375%, 2/1/2016 | 755,000 | 702,150 |
7.375%, 1/15/2017 | 660,000 | 607,200 |
NV Energy, Inc.: | | |
6.75%, 8/15/2017 | 855,000 | 656,333 |
8.625%, 3/15/2014 | 200,000 | 180,315 |
Oncor Electric Delivery Co., 7.0%, 9/1/2022 | 320,000 | 299,011 |
Regency Energy Partners LP, 8.375%, 12/15/2013 | 515,000 | 352,775 |
Reliant Energy, Inc., 7.875%, 6/15/2017 | 830,000 | 672,300 |
Texas Competitive Electric Holdings Co., LLC, 144A, 10.5%, 11/1/2015 | 1,965,000 | 1,395,150 |
| 15,934,220 |
Total Corporate Bonds (Cost $182,713,458) | 126,067,896 |
|
Loan Participations and Assignments 6.4% |
Senior Loans*** |
Advanced Medical Optics, Inc., Term Loan B, LIBOR plus 1.75%, 3.754%, 4/2/2014 | 244,396 | 159,265 |
Alliance Mortgage Cycle Loan, Term Loan A, LIBOR plus 7.25%, 9.254%, 6/1/2010** | 700,000 | 0 |
| Principal Amount ($)(a) | Value ($) |
| |
Alltel Communications, Inc., Term Loan B1, LIBOR plus 2.75%, 4.754%, 5/15/2015 | 675,000 | 669,657 |
Buffets, Inc.: | | |
Letter of Credit, LIBOR plus 7.25%, 9.254%, 5/1/2013 | 147,030 | 36,978 |
Term Loan B, LIBOR plus 7.25%, 9.254%, 11/1/2013 | 748,130 | 188,155 |
Term Loan DIP, LIBOR plus 7.25%, 9.254%, 1/22/2009 | 359,663 | 90,455 |
Charter Communications Operating LLC: | | |
Incremental Term Loan, LIBOR plus 5.0%, 7.004%, 3/6/2014 | 751,225 | 596,289 |
Term Loan, LIBOR plus 2.0%, 4.004%, 3/6/2014 | 704,675 | 521,706 |
Energy Future Holdings Corp.: | | |
Term Loan B2, LIBOR plus 3.5%, 5.504%, 10/10/2014 | 3,766,950 | 2,636,865 |
Term Loan B3, LIBOR plus 3.5%, 5.504%, 10/10/2014 | 365,250 | 254,154 |
Essor Steel Algoma, Inc., Term Loan B, LIBOR plus 2.5%, 4.504%, 6/30/2013 | 284,280 | 176,254 |
Ford Motor Co., Term Loan B, LIBOR plus 3.0%, 5.004%, 12/16/2013 | 368,122 | 151,031 |
General Nutrition Centers, Inc., Term Loan B, LIBOR plus 2.25%, 4.254%, 9/16/2013 | 247,487 | 165,817 |
Golden Nugget, Term Loan, 3.73%, 6/16/2014 | 460,000 | 48,300 |
Hawker Beechcraft, Inc.: | | |
Letter of Credit, LIBOR plus 2.0%, 4.004%, 3/26/2014 | 12,291 | 6,447 |
Term Loan B, LIBOR plus 2.0%, 4.004%, 3/26/2014 | 209,843 | 110,081 |
HCA, Inc., Term Loan A, LIBOR plus 1.5%, 3.504%, 11/17/2012 | 1,816,113 | 1,542,788 |
Hexion Specialty Chemicals: | | |
Term Loan C1, LIBOR plus 2.25%, 4.254%, 5/6/2013 | 1,100,615 | 466,661 |
Term Loan C2, LIBOR plus 2.25%, 4.254%, 5/6/2013 | 258,110 | 109,438 |
IASIS Healthcare LLC, Term Loan, LIBOR plus 5.25%, 7.254%, 6/15/2014 (PIK) | 521,196 | 299,688 |
Longview Power LLC: | | |
Letter of Credit, 1.35%, 4/1/2014 | 30,000 | 18,750 |
Demand Draw, 3.75%, 4/1/2014 | 105,000 | 65,625 |
Term Loan B, 4.25%, 4/1/2014 | 90,000 | 56,250 |
Sabre, Inc., Term Loan B, LIBOR plus 2.0%, 4.004%, 9/30/2014 | 412,595 | 180,069 |
Symbion, Inc.: | | |
Term Loan A, LIBOR plus 3.25%, 5.254%, 8/23/2013 | 169,253 | 105,783 |
Term Loan B, LIBOR plus 3.25%, 5.254%, 8/23/2014 | 169,253 | 105,783 |
Telesat Canada: | | |
Delayed Draw Term Loan, LIBOR plus 3.0%, 5.004%, 10/31/2014 | 97,377 | 66,752 |
Term Loan B, LIBOR plus 3.0%, 5.004%, 10/31/2014 | 1,133,795 | 777,216 |
Tribune Co., Tranche B, LIBOR plus 3.0%, 5.004%, 5/19/2014** | 829,426 | 239,347 |
Total Loan Participations and Assignments (Cost $16,197,151) | 9,845,604 |
| Principal Amount ($)(a) | Value ($) |
| |
Preferred Securities 0.4% |
Financials |
Citigroup, Inc., Series E, 8.4%, 4/30/2018 (d) | 575,000 | 379,667 |
Xerox Capital Trust I, 8.0%, 2/1/2027 | 315,000 | 215,110 |
Total Preferred Securities (Cost $831,609) | 594,777 |
|
Shares
| Value ($) |
| |
Warrants 0.0% |
Financials 0.0% |
New ASAT (Finance) Ltd., Expiration Date 2/1/2011* | 149,500 | 11,730 |
Industrials 0.0% |
Dayton Superior Corp., 144A, Expiration Date 6/15/2009* | 95 | 0 |
Total Warrants (Cost $1) | 11,730 |
|
Units
| Value ($) |
| |
Other Investments 0.3% |
Materials |
Hercules, Inc., (Bond Unit), 6.5%, 6/30/2029 (Cost $945,336) | 1,100,000 | 528,000 |
|
Shares
| Value ($) |
| |
Common Stocks 0.0% |
Consumer Discretionary 0.0% |
Vertis Holdings, Inc.* | 9,993 | 0 |
Materials 0.0% |
GEO Specialty Chemicals, Inc.* | 24,225 | 20,591 |
GEO Specialty Chemicals, Inc. 144A* | 2,206 | 1,875 |
Total Common Stocks (Cost $290,952) | 22,466 |
|
Preferred Stocks 0.1% |
Consumer Discretionary 0.0% |
ION Media Networks, Inc.: | | |
144A, 12.0%* | 2 | 0 |
Series AI, 144A, 12.0%* | 30,000 | 0 |
Series B, 12.0%* | 5,000 | 0 |
| 0 |
Financials 0.1% |
Preferred Blocker Inc., 144A, 9.0% | 449 | 128,209 |
Total Preferred Stocks (Cost $174,228) | 128,209 |
|
Securities Lending Collateral 0.7% |
Daily Assets Fund Institutional, 1.69% (e) (f) (Cost $1,127,073) | 1,127,073 | 1,127,073 |
|
Cash Equivalents 8.7% |
Cash Management QP Trust, 1.42% (e) (Cost $13,321,871) | 13,321,871 | 13,321,871 |
| % of Net Assets | Value ($) |
| |
Total Investment Portfolio (Cost $215,601,679)+ | 98.5 | 151,647,626 |
Other Assets and Liabilities, Net | 1.5 | 2,231,587 |
Net Assets | 100.0 | 153,879,213 |
* Non-income producing security.** Non-income producing security. Issuer has defaulted on the payment of principal or interest or has filed for bankruptcy. The following table represents bonds that are in default:Securities | Coupon | Maturity Date | Principal Amount | Acquisition Cost ($) | Value ($) |
Alliance Mortgage Cycle Loan
| 9.254% | 6/1/2010 | 700,000 | USD
| 700,000 | 0 |
Ashton Woods USA LLC
| 9.5% | 10/1/2015 | 1,370,000 | USD
| 1,292,830 | 274,000 |
Congoleum Corp.
| 8.625% | 8/1/2008 | 1,200,000 | USD
| 1,021,050 | 900,000 |
Quebecor World, Inc.
| 9.75% | 1/15/2015 | 420,000 | USD
| 420,000 | 33,075 |
Radnor Holdings Corp.
| 11.0% | 3/15/2010 | 265,000 | USD
| 234,313 | 331 |
Tribune Co.
| 5.004% | 5/19/2014 | 829,426 | USD
| 828,907 | 239,347 |
Trump Entertainment Resorts, Inc.
| 8.5% | 6/1/2015 | 105,000 | USD
| 107,100 | 13,913 |
Tropicana Entertainment LLC
| 9.625% | 12/15/2014 | 1,220,000 | USD
| 959,601 | 12,200 |
| | | |
| 5,563,801 | 1,472,866 |
*** Floating rate notes are securities whose yields vary with a designated market index or market rate, such as the coupon-equivalent of the US Treasury bill rate. These securities are shown at their current rate as of December 31, 2008.+ The cost for federal income tax purposes was $215,921,526. At December 31, 2008, net unrealized depreciation for all securities based on tax cost was $64,273,900. This consisted of aggregate gross unrealized appreciation for all securities in which there was an excess of value over tax cost of $234,812 and aggregate gross unrealized depreciation for all securities in which there was an excess of tax cost over value of $64,508,712.(a) Principal amount stated in US dollars unless otherwise noted.(b) Security has deferred its 6/15/2008 interest payment until 6/30/2009.(c) All or a portion of these securities were on loan (see Notes to Financial Statements). The value of all securities loaned at December 31, 2008 amounted to $1,052,835, which is 0.7% of net assets.(d) Date shown is call date; not a maturity date for the perpetual preferred securities.(e) Affiliated fund managed by Deutsche Investment Management Americas Inc. The rate shown is the annualized seven-day yield at period end.(f) Represents collateral held in connection with securities lending. Income earned by the Portfolio is net of borrower rebates.144A: Security exempt from registration under Rule 144A of the Securities Act of 1933. These securities may be resold in transactions exempt from registration, normally to qualified institutional buyers.
LIBOR: Represents the London InterBank Offered Rate.
PIK: Denotes that all or a portion of the income is paid in-kind.
REG S: Securities sold under Regulation S may not be offered, sold or delivered within the United States or to, or for the account or benefit of, US persons, except pursuant to an exemption from, or in a transaction not subject to, the registration requirements of the Securities Act.
At December 31, 2008, open credit default swap contracts purchased were as follows:
Effective/
Expiration Date | Notional Amount ($) (g) | Fixed Cash Flows Paid by the Portfolio | Underlying Debt Obligation/Quality Rating (h) | Value ($) | Upfront Premiums Paid/(Received) ($) | Unrealized Appreciation ($) |
5/2/2008
6/20/2013 | 400,0001 | 7.25% | ARCO Chemical Co., 9.8%, 2/1/2020, D | 289,930 | — | 288,963 |
At December 31, 2008, open credit default swap contracts sold were as follows:
Effective/
Expiration Date | Notional Amount ($) (g) | Fixed Cash Flows Received by the Portfolio | Underlying Debt Obligation/Quality Rating (h) | Value ($) | Upfront Premiums Paid/(Received) ($) | Unrealized Appreciation/ (Depreciation) ($) |
2/14/2008
3/20/2009 | 405,0001 | 3.8% | HCA, Inc., 6.375%, 1/15/2015, B- | (1,746) | — | (1,276) |
2/26/2008
3/20/2009 | 430,0001 | 5.0% | Tenet Healthcare Corp., 7.375%, 2/1/2013, B | 152 | — | 869 |
Total net unrealized depreciation | (407) |
Counterparty:
1 Merrill Lynch, Pierce, Fenner & Smith, Inc.
|
(g) The maximum potential amount of future undiscounted payments that the Portfolio could be required to make under a credit default swap contract would be the notional amount of the contract. These potential amounts would be partially offset by any recovery values of the referenced debt obligation or net amounts received from the settlement of buy protection credit default swap contracts entered into by the Portfolio for the same referenced debt obligation.(h) The quality ratings represent the lower of Moody's Investors Service, Inc. ("Moody's") or Standard & Poor's Corporation ("S&P") credit ratings.At December 31, 2008, the Portfolio had the following open forward foreign currency exchange contracts:
Contracts to Deliver | | In Exchange For | | Settlement Date | | Unrealized Appreciation ($) |
EUR
| 2,656,100 |
| USD
| 3,824,293 |
| 1/15/2009 |
| 134,761 |
EUR
| 62,100 |
| USD
| 86,729 |
| 1/15/2009 |
| 467 |
Total unrealized appreciation | 135,228 |
Contracts to Deliver | | In Exchange For | | Settlement Date | | Unrealized Depreciation ($) |
EUR
| 37,600 |
| USD
| 52,036 |
| 1/15/2009 |
| (194) |
Currency Abbreviations |
EUR Euro
USD United States Dollar
|
Fair Value Measurements
The following is a summary of the inputs used as of December 31, 2008 in valuing the Portfolio's investments. For information on the Portfolio's policy regarding the valuation of investments and of the valuation inputs, and the aggregate levels used in the tables below, please refer to the Security Valuation section of Note A in the accompanying Notes to the Financial Statements.
Valuation Inputs | Investments in Securities | Other Financial Instruments++ |
Level 1
| $ 1,127,073 | $ — |
Level 2
| 148,519,776 | 423,590 |
Level 3
| 2,000,777 | — |
Total | $ 151,647,626 | $ 423,590 |
++ Other financial instruments are derivative instruments not reflected in the Investment Portfolio, such as forward foreign currency exchange contracts and credit default swap contacts, which are valued at the unrealized appreciation (depreciation) on the instrument.The following is a reconciliation of the Portfolio's Level 3 investments for which significant unobservable inputs were used in determining value at December 31, 2008:
| Investments in Securities |
Balance as of January 1, 2008 | $ 999,801 |
Total realized gain (loss)
| (2,252) |
Change in unrealized appreciation (depreciation)
| (1,853,276) |
Amortization Premium/Discount
| 12,609 |
Net purchases (sales)
| 975,542 |
Net transfers in (out) of Level 3
| 1,868,353 |
Balance as of December 31, 2008 | $ 2,000,777 |
The accompanying notes are an integral part of the financial statements.
Financial Statements
Statement of Assets and Liabilities as of December 31, 2008
|
Assets |
Investments:
Investments in securities, at value (cost $201,152,735) — including $1,052,835 of securities loaned | $ 137,198,682 |
Investments in Daily Assets Fund Institutional (cost $1,127,073)* | 1,127,073 |
Investment in Cash Management QP Trust (cost $13,321,871) | 13,321,871 |
Total investments, at value (cost $215,601,679)
| 151,647,626 |
Cash
| 707,087 |
Foreign currency, at value (cost $3,164)
| 3,164 |
Receivable for investments sold
| 157,215 |
Receivable for Portfolio shares sold
| 3,325 |
Receivable for closed credit default swaps contracts
| 3,333 |
Interest receivable
| 4,019,470 |
Unrealized appreciation on forward foreign currency exchange contracts
| 135,228 |
Foreign taxes recoverable
| 3,029 |
Unrealized appreciation on credit default swaps contracts
| 289,832 |
Other assets
| 21,463 |
Total assets
| 156,990,772 |
Liabilities |
Payable for investments purchased
| 1,457,397 |
Payable for Portfolio shares redeemed
| 184,954 |
Payable upon return of securities loaned
| 1,127,073 |
Payable for closed credit default swap contracts
| 14,344 |
Unrealized depreciation on forward foreign currency exchange contracts
| 194 |
Unrealized depreciation on credit default swaps contracts
| 1,276 |
Accrued management fee
| 58,941 |
Other accrued expenses and payables
| 267,380 |
Total liabilities
| 3,111,559 |
Net assets, at value | $ 153,879,213 |
Net Assets Consist of |
Undistributed net investment income
| 18,004,319 |
Net unrealized appreciation (depreciation) on:
Investments | (63,954,053) |
Credit default swap contracts | 288,556 |
Foreign currency | 140,514 |
Accumulated net realized gain (loss)
| (120,784,149) |
Paid-in capital
| 320,184,026 |
Net assets, at value | $ 153,879,213 |
Class A Net Asset Value, offering and redemption price per share ($153,745,043 ÷ 29,000,230 outstanding shares of beneficial interest, $.01 par value, unlimited number of shares authorized)
| $ 5.30 |
Class B Net Asset Value, offering and redemption price per share ($134,170 ÷ 25,274 outstanding shares of beneficial interest, $.01 par value, unlimited number of shares authorized)
| $ 5.31 |
* Represents collateral on securities loaned.Statement of Operations for the year ended December 31, 2008
|
Investment Income |
Interest
| $ 19,150,527 |
Dividends
| 1,289 |
Interest — Cash Management QP Trust
| 285,007 |
Securities lending income, including income from Daily Assets Fund Institutional, net of borrower rebates
| 64,421 |
Total Income
| 19,501,244 |
Expenses:
Management fee
| 1,139,273 |
Administration fee
| 131,305 |
Custodian fee
| 22,297 |
Distribution service fee (Class B)
| 8,000 |
Services to shareholders
| 476 |
Record keeping fees (Class B)
| 2,935 |
Professional fees
| 96,073 |
Trustees' fees and expenses
| 25,367 |
Reports to shareholders and shareholder meeting
| 203,799 |
Other
| 77,978 |
Total expenses before expense reductions
| 1,707,503 |
Expense reductions
| (14,024) |
Total expenses after expense reductions
| 1,693,479 |
Net investment income (loss) | 17,807,765 |
Realized and Unrealized Gain (Loss) |
Net realized gain (loss) from:
Investments
| (22,491,277) |
Credit default swap contracts
| (251,669) |
Foreign currency
| 275,339 |
Payments by affiliates (see Note I)
| 6 |
| (22,467,601) |
Change in net unrealized appreciation (depreciation) on:
Investments
| (46,404,643) |
Credit default swap contracts
| 322,027 |
Unfunded loan commitments
| 495 |
Foreign currency
| 45,110 |
| (46,037,011) |
Net gain (loss) | (68,504,612) |
Net increase (decrease) in net assets resulting from operations | $ (50,696,847) |
The accompanying notes are an integral part of the financial statements.
Statement of Changes in Net Assets |
| Years Ended December 31, |
Increase (Decrease) in Net Assets | 2008 | 2007 |
Operations:
Net investment income
| $ 17,807,765 | $ 25,179,014 |
Net realized gain (loss)
| (22,467,601) | (2,365,006) |
Change in net unrealized appreciation (depreciation)
| (46,037,011) | (17,331,415) |
Net increase (decrease) in net assets resulting from operations
| (50,696,847) | 5,482,593 |
Distributions to shareholders from:
Net investment income:
Class A | (23.705,161) | (24,698,902) |
Class B | (925,654) | (3,765,571) |
Total distributions
| (24,630,815) | (28,464,473) |
Portfolio share transactions:
Class A Proceeds from shares sold
| 34,048,144 | 39,622,315 |
Reinvestment of distributions
| 23,705,161 | 24,698,902 |
Cost of shares redeemed
| (77,354,304) | (117,470,499) |
Net increase (decrease) in net assets from Class A share transactions
| (19,600,999) | (53,149,282) |
Class B Proceeds from shares sold
| 76,767 | 3,273,156 |
Reinvestment of distributions
| 925,654 | 3,765,571 |
Cost of shares redeemed
| (9,671,811) | (48,245,391) |
Net increase (decrease) in net assets from Class B share transactions
| (8,669,390) | (41,206,664) |
Increase (decrease) in net assets | (103,598,051) | (117,337,826) |
Net assets at beginning of period
| 257,477,264 | 374,815,090 |
Net assets at end of period (including undistributed net investment income of $18,004,319 and $24,527,293, respectively)
| $ 153,879,213 | $ 257,477,264 |
Other Information |
Class A Shares outstanding at beginning of period
| 31,702,335 | 38,357,993 |
Shares sold
| 5,474,310 | 4,945,319 |
Shares issued to shareholders in reinvestment of distributions
| 3,511,876 | 3,110,693 |
Shares redeemed
| (11,688,291) | (14,711,670) |
Net increase (decrease) in Class A shares
| (2,702,105) | (6,655,658) |
Shares outstanding at end of period
| 29,000,230 | 31,702,335 |
Class B Shares outstanding at beginning of period
| 1,262,331 | 6,354,214 |
Shares sold
| 10,281 | 397,938 |
Shares issued to shareholders in reinvestment of distributions
| 136,728 | 473,062 |
Shares redeemed
| (1,384,066) | (5,962,883) |
Net increase (decrease) in Class B shares
| (1,237,057) | (5,091,883) |
Shares outstanding at end of period
| 25,274 | 1,262,331 |
The accompanying notes are an integral part of the financial statements.
Financial Highlights
Class A Years Ended December 31, | 2008 | 2007 | 2006 | 2005 | 2004 |
Selected Per Share Data |
Net asset value, beginning of period | $ 7.81 | $ 8.38 | $ 8.23 | $ 8.78 | $ 8.43 |
Income (loss) from investment operations: Net investment incomea | .57 | .63 | .62 | .68 | .67 |
Net realized and unrealized gain (loss) | (2.29) | (.54) | .19 | (.38) | .31 |
Total from investment operations | (1.72) | .09 | .81 | .30 | .98 |
Less distributions from: Net investment income | (.79) | (.66) | (.66) | (.85) | (.63) |
Net asset value, end of period | $ 5.30 | $ 7.81 | $ 8.38 | $ 8.23 | $ 8.78 |
Total Return (%)
| (23.94)b | .96 | 10.47 | 3.89 | 12.42 |
Ratios to Average Net Assets and Supplemental Data |
Net assets, end of period ($ millions)
| 154 | 248 | 322 | 344 | 393 |
Ratio of expenses before expense reductions (%)
| .80 | .69 | .71 | .70 | .66 |
Ratio of expenses after expense reductions (%)
| .79 | .69 | .71 | .70 | .66 |
Ratio of net investment income (%)
| 8.42 | 7.84 | 7.73 | 8.27 | 8.11 |
Portfolio turnover rate (%)
| 38 | 61 | 93 | 100 | 162 |
a Based on average shares outstanding during the period.
b Total return would have been lower had certain expenses not been reduced.
|
Class B Years Ended December 31, | 2008 | 2007 | 2006 | 2005 | 2004 |
Selected Per Share Data |
Net asset value, beginning of period | $ 7.81 | $ 8.38 | $ 8.22 | $ 8.77 | $ 8.41 |
Income (loss) from investment operations: Net investment incomea | .53 | .60 | .59 | .65 | .64 |
Net realized and unrealized gain (loss) | (2.27) | (.54) | .20 | (.39) | .32 |
Total from investment operations | (1.74) | .06 | .79 | .26 | .96 |
Less distributions from: Net investment income | (.76) | (.63) | (.63) | (.81) | (.60) |
Net asset value, end of period | $ 5.31 | $ 7.81 | $ 8.38 | $ 8.22 | $ 8.77 |
Total Return (%)
| (24.13)b | .54 | 10.11 | 3.41 | 12.08 |
Ratios to Average Net Assets and Supplemental Data |
Net assets, end of period ($ millions)
| .1 | 10 | 53 | 56 | 57 |
Ratio of expenses before expense reductions (%)
| 1.25 | 1.08 | 1.10 | 1.10 | 1.06 |
Ratio of expenses after expense reductions (%)
| 1.23 | 1.08 | 1.10 | 1.10 | 1.06 |
Ratio of net investment income (%)
| 7.98 | 7.45 | 7.34 | 7.87 | 7.71 |
Portfolio turnover rate (%)
| 38 | 61 | 93 | 100 | 162 |
a Based on average shares outstanding during the period.
b Total return would have been lower had certain expenses not been reduced.
|
Performance Summary December 31, 2008
DWS International Select Equity VIP
All performance shown is historical, assumes reinvestment of all dividend and capital gain distributions and does not guarantee future results. Investment return and principal value fluctuate with changing market conditions so that, when redeemed, shares may be worth more or less than their original cost. Current performance may be lower or higher than the performance data quoted. Please contact your participating insurance company for the Portfolio's most recent month-end performance. Performance doesn't reflect charges and fees ("contract charges") associated with the separate account that invests in the Portfolio or any variable life insurance policy or variable annuity contract for which the Portfolio is an investment option. These charges and fees will reduce returns. While all share classes have the same underlying portfolio, their performance will differ.
The total annual Portfolio operating expense ratios, gross of any fee waivers or expense reimbursements, as stated in the fee table of the prospectus dated May 1, 2008 are 0.93% and 1.18% for Class A and Class B shares, respectively. Please see the Information About Your Portfolio's Expenses, the Financial Highlights and Notes to the Financial Statements (Note C, Related Parties) sections of this report for gross and net expense related disclosure for the period ended December 31, 2008.
Risk Considerations
This Portfolio is subject to stock market risk, meaning stocks in the Portfolio may decline in value for extended periods of time due to the activities and financial prospects of individual companies, or due to general market and economic conditions. Additionally, investing in foreign securities presents certain risks, such as currency fluctuation, political and economic changes and market risks. This may result in greater share price volatility. Please read this Portfolio's prospectus for specific details regarding its investments and risk profile.
Portfolio returns shown for all periods reflect a fee waiver and/or expense reimbursement. Without this waiver/reimbursement, returns would have been lower.
Growth of an Assumed $10,000 Investment in DWS International Select Equity VIP |
[] DWS International Select Equity VIP — Class A [] MSCI EAFE® + EMF Index | The MSCI EAFE® + EMF Index (Morgan Stanley Capital International Europe, Australasia, Far East and Emerging Markets Free Index) is an unmanaged index generally accepted as a benchmark for major overseas markets plus emerging markets. The index is calculated using closing local market prices and translates into US dollars using the London close foreign exchange rates. Index returns assume reinvestment of dividends and, unlike portfolio returns, do not reflect any fees or expenses. It is not possible to invest directly into an index. |
 | |
Yearly periods ended December 31 |
|
Comparative Results |
DWS International Select Equity VIP | 1-Year | 3-Year | 5-Year | 10-Year |
Class A | Growth of $10,000
| $5,119 | $7,502 | $10,157 | $9,990 |
Average annual total return
| -48.81% | -9.14% | .31% | -.01% |
MSCI EAFE + EMF Index
| Growth of $10,000
| $5,476 | $8,136 | $11,485 | $12,162 |
Average annual total return
| -45.24% | -6.64% | 2.81% | 1.98% |
DWS International Select Equity VIP | 1-Year | 3-Year | 5-Year | Life of Class* |
Class B | Growth of $10,000
| $5,093 | $7,402 | $9,943 | $11,378 |
Average annual total return
| -49.07% | -9.54% | -.12% | 2.00% |
MSCI EAFE + EMF Index
| Growth of $10,000
| $5,476 | $8,136 | $11,485 | $13,910 |
Average annual total return
| -45.24% | -6.64% | 2.81% | 5.21% |
The growth of $10,000 is cumulative.
* The Portfolio commenced offering Class B shares on July 1, 2002. Index returns began on June 30, 2002.Information About Your Portfolio's Expenses
DWS International Select Equity VIP
As an investor of the Portfolio, you incur two types of costs: ongoing expenses and transaction costs. Ongoing expenses include management fees, distribution and service (12b-1) fees and other Portfolio expenses. Examples of transaction costs include contract charges, redemption fees and account maintenance fees, which are not shown in this section. The following tables are intended to help you understand your ongoing expenses (in dollars) of investing in the Portfolio and to help you compare these expenses with the ongoing expenses of investing in other mutual funds. The example in the table is based on an investment of $1,000 invested at the beginning of the six-month period and held for the entire period (July 1, 2008 to December 31, 2008).
The tables illustrate your Portfolio's expenses in two ways:
• Actual Portfolio Return. This helps you estimate the actual dollar amount of ongoing expenses (but not transaction costs) paid on a $1,000 investment in the Portfolio using the Portfolio's actual return during the period. To estimate the expenses you paid over the period, simply divide your account value by $1,000 (for example, an $8,600 account value divided by $1,000 = 8.6), then multiply the result by the number in the "Expenses Paid per $1,000" line under the share class you hold.
• Hypothetical 5% Portfolio Return. This helps you to compare your Portfolio's ongoing expenses (but not transaction costs) with those of other mutual funds using the Portfolio's actual expense ratio and a hypothetical rate of return of 5% per year before expenses. Examples using a 5% hypothetical Portfolio return may be found in the shareholder reports of other mutual funds. The hypothetical account values and expenses may not be used to estimate the actual ending account balance or expenses you paid for the period.
Please note that the expenses shown in these tables are meant to highlight your ongoing expenses only and do not reflect any transaction costs. The "Expenses Paid per $1,000" line of the tables is useful in comparing ongoing expenses only and will not help you determine the relative total expense of owning different funds. If these transaction costs had been included, your costs would have been higher.
Expenses and Value of a $1,000 Investment for the six months ended December 31, 2008 |
Actual Portfolio Return | Class A | | Class B | |
Beginning Account Value 7/1/08
| $ 1,000.00 | | $ 1,000.00 | |
Ending Account Value 12/31/08
| $ 544.70 | | $ 543.90 | |
Expenses Paid per $1,000*
| $ 4.04 | | $ 5.05 | |
Hypothetical 5% Portfolio Return | Class A | | Class B | |
Beginning Account Value 7/1/08
| $ 1,000.00 | | $ 1,000.00 | |
Ending Account Value 12/31/08
| $ 1,019.91 | | $ 1,018.60 | |
Expenses Paid per $1,000*
| $ 5.28 | | $ 6.60 | |
* Expenses are equal to the Portfolio's annualized expense ratio for each share class, multiplied by the average account value over the period, multiplied by the number of days in the most recent six-month period, then divided by 366.Annualized Expense Ratios | Class A | | Class B | |
DWS Variable Series II — DWS International Select Equity VIP
| 1.04% | | 1.30% | |
For more information, please refer to the Portfolio's prospectus.
These tables do not reflect charges and fees ("contract charges") associated with the separate account that invests in the Portfolio or any variable life insurance policy or variable annuity contract for which the Portfolio is an investment option.
Management Summary December 31, 2008
DWS International Select Equity VIP
The MSCI EAFE® + EMF Index (the Portfolio's benchmark) returned -45.24% during 2008, a year that was characterized by the rapid expansion of the global financial crisis, slowing economic growth and sharply elevated investor risk aversion. Class A shares of the Portfolio returned -48.81% (unadjusted for contract charges), underperforming the index. The primary reason for underperformance was that the Portfolio held a substantial exposure to higher-risk stocks coming into the autumn downturn. Upon taking over for the previous management team in mid-August, we sought to reduce risk by decreasing the Portfolio's weightings in higher-risk areas such as mid- and small-caps, emerging-market stocks, and cyclicals. Unfortunately, we did not make these changes quickly enough to prevent underperformance.
For the full year, the Portfolio's return was helped by an underweight in financials and favorable stock selection in the information technology and health care sectors, but this was offset by weaker stock selection in the consumer staples and consumer discretionary sectors.1 The leading contributors to performance included iShares MSCI Japan Index Fund, Telefonica SA and BASF SE. The most significant detractors were the Russian gas company Gazprom and the brewer Carlsberg AS.
Believing that recovery in the global economy will likely occur slowly, we are maintaining a defensive positioning in the Portfolio. We are favoring sectors with high cash flows, stable earnings, and a low sensitivity to economic trends, such as health care and telecommunications. At the same time, the Portfolio is underweight in areas that are more dependent on economic growth, such as industrials, financials and the consumer discretionary sector. Although defensive for now, we are also keeping a close eye on stock-specific opportunities given that dividend yields are attractive and price-to-book values are at their lowest level of the past 10-15 years.
Joseph Axtell, CFA
Lead Portfolio Manager, Deutsche Investment Management Americas Inc.
Michael Sieghart, CFA
Consultant, Deutsche Investment Management Americas Inc.
The MSCI EAFE + EMF Index (Morgan Stanley Capital International Europe, Australasia, Far East and Emerging Markets Free Index) is an unmanaged index generally accepted as a benchmark for major overseas markets plus emerging markets. The index is calculated using closing local market prices and translates into US dollars using the London close foreign exchange rates. Index returns assume reinvested dividends and, unlike portfolio returns, do not reflect any fees or expenses. It is not possible to invest directly into an index.
1 "Overweight" means the portfolio holds a higher weighting in a given sector or security than the benchmark. "Underweight" means the portfolio holds a lower weighting.Portfolio management market commentary is as of December 31, 2008, and may not come to pass. This information is subject to change at any time based on market and other conditions. Past performance does not guarantee future results. Current and future portfolio holdings are subject to risk.
Portfolio Summary
DWS International Select Equity VIP
Asset Allocation (As a % of Investment Portfolio excluding Securities Lending Collateral) | 12/31/08 | 12/31/07 |
| | |
Common Stocks | 95% | 94% |
Exchange Traded Fund | 5% | — |
Cash Equivalents | — | 3% |
Preferred Stocks | — | 3% |
| 100% | 100% |
Sector Diversification (As a % of Common and Preferred Stocks) | 12/31/08 | 12/31/07 |
| | |
Health Care | 21% | 5% |
Financials | 19% | 23% |
Telecommunications Services | 14% | 6% |
Energy | 11% | 5% |
Consumer Staples | 10% | 7% |
Industrials | 8% | 18% |
Materials | 7% | 9% |
Information Technology | 6% | 5% |
Utilities | 4% | 6% |
Consumer Discretionary | — | 16% |
| 100% | 100% |
Geographical Diversification (As a % of Investment Portfolio excluding Cash Equivalents and Securities Lending Collateral) | 12/31/08 | 12/31/07 |
| | |
Continental Europe | 59% | 52% |
Japan | 24% | 15% |
United Kingdom | 7% | 12% |
Asia (excluding Japan) | 6% | 9% |
Latin America | 2% | 2% |
Russia | 1% | 4% |
Canada | 1% | — |
Middle East | — | 2% |
Australia | — | 2% |
Africa | — | 2% |
| 100% | 100% |
Asset allocation, geographical and sector diversifications are subject to change.
For more complete details about the Portfolio's investment portfolio, see page 175 . A complete list of portfolio holdings of the portfolio is posted as of the month end on www.dws-investments.com on or about the 15th day of the following month. More frequent posting of portfolio holdings information may be made from time to time on www.dws-investments.com.
Following the Portfolio's fiscal first and third quarter-end, a complete portfolio holdings listing is filed with the SEC on Form N-Q. The form will be available on the SEC's Web site at www.sec.gov, and it also may be reviewed and copied at the SEC's Public Reference Room in Washington, D.C. Information on the operation of the SEC's Public Reference Room may be obtained by calling (800) SEC-0330.
Investment Portfolio December 31, 2008
DWS International Select Equity VIP
|
Shares
| Value ($) |
| |
Common Stocks 94.5% |
Austria 2.0% |
Intercell AG* (Cost $1,671,371) | 59,154 | 1,813,698 |
Brazil 1.1% |
Petroleo Brasileiro SA (ADR) (Cost $2,014,976) | 38,800 | 950,212 |
Canada 0.9% |
Potash Corp. of Saskatchewan, Inc. (Cost $1,412,403) | 11,514 | 835,132 |
China 2.5% |
China Life Insurance Co., Ltd. "H" (Cost $2,758,208) | 720,000 | 2,218,739 |
Denmark 5.1% |
Carlsberg AS "B" (a) | 49,700 | 1,631,700 |
Novo Nordisk AS "B" | 59,200 | 3,012,651 |
(Cost $9,081,105) | 4,644,351 |
Finland 2.9% |
Fortum Oyj | 73,400 | 1,576,587 |
Nokia Oyj | 69,500 | 1,077,454 |
(Cost $4,785,260) | 2,654,041 |
France 7.6% |
Alstom SA | 15,592 | 920,752 |
Axa | 53,845 | 1,200,458 |
BNP Paribas | 22,803 | 962,888 |
Societe Generale | 31,059 | 1,573,061 |
Total SA | 41,180 | 2,245,038 |
(Cost $8,605,296) | 6,902,197 |
Germany 17.5% |
Allianz SE (Registered) | 13,941 | 1,495,285 |
BASF SE | 41,600 | 1,643,804 |
Bayer AG (a) | 61,711 | 3,625,197 |
Deutsche Boerse AG | 24,800 | 1,806,241 |
Deutsche Telekom AG (Registered) (a) | 141,100 | 2,143,812 |
E.ON AG | 38,414 | 1,553,353 |
Linde AG | 20,100 | 1,700,932 |
Muenchener Rueckversicherungs-
Gesellschaft AG (Registered) | 12,300 | 1,932,908 |
(Cost $14,041,948) | 15,901,532 |
Hong Kong 2.1% |
China Mobile Ltd. (Cost $1,972,181) | 186,000 | 1,885,818 |
Italy 1.5% |
Intesa Sanpaolo (Cost $2,309,847) | 373,100 | 1,322,643 |
Japan 18.6% |
Astellas Pharma, Inc. | 27,500 | 1,119,013 |
Canon, Inc. | 75,400 | 2,366,922 |
East Japan Railway Co. | 23,200 | 1,806,470 |
Japan Tobacco, Inc. | 638 | 2,112,675 |
Mitsubishi Corp. | 121,000 | 1,698,651 |
Mitsubishi UFJ Financial Group, Inc. | 235,000 | 1,458,157 |
Nintendo Co., Ltd. | 4,500 | 1,728,877 |
|
Shares
| Value ($) |
| |
Nippon Telegraph & Telephone Corp. | 25,900 | 1,385,971 |
Seven & I Holdings Co., Ltd. | 41,000 | 1,404,649 |
Terumo Corp. | 37,200 | 1,742,114 |
(Cost $19,296,964) | 16,823,499 |
Luxembourg 0.9% |
ArcelorMittal (Cost $2,080,196) | 35,343 | 851,880 |
Mexico 0.9% |
America Movil SAB de CV "L" (ADR) (Cost $1,493,798) | 26,600 | 824,334 |
Norway 2.8% |
DnB NOR ASA | 121,500 | 485,345 |
StatoilHydro ASA | 125,400 | 2,065,372 |
(Cost $4,959,643) | 2,550,717 |
Russia 1.2% |
Gazprom (ADR)* (Cost $2,976,319) | 76,300 | 1,092,177 |
Singapore 1.5% |
United Overseas Bank Ltd. (Cost $2,089,882) | 146,000 | 1,317,951 |
Spain 3.9% |
Telefonica SA (Cost $2,826,342) | 157,364 | 3,527,387 |
Switzerland 14.1% |
ABB Ltd. (Registered)* | 100,988 | 1,522,315 |
Lonza Group AG (Registered) | 20,203 | 1,867,666 |
Nestle SA (Registered) | 83,883 | 3,306,045 |
Novartis AG (Registered) | 44,409 | 2,225,090 |
Roche Holding AG (Genusschein) | 18,265 | 2,811,599 |
Xstrata PLC | 116,412 | 1,085,266 |
(Cost $14,213,473) | 12,817,981 |
United Kingdom 7.4% |
AMEC PLC | 127,649 | 911,098 |
Babcock International Group PLC | 80,802 | 555,838 |
BG Group PLC | 151,093 | 2,097,740 |
HSBC Holdings PLC | 91,303 | 873,882 |
Vodafone Group PLC | 1,125,872 | 2,266,508 |
(Cost $9,179,092) | 6,705,066 |
Total Common Stocks (Cost $107,768,304) | 85,639,355 |
|
Exchange Traded Fund 4.9% |
Japan |
iShares MSCI Japan Index Fund (a) (Cost $5,387,329) | 463,726 | 4,451,770 |
|
Securities Lending Collateral 9.6% |
Daily Assets Fund Institutional, 1.69% (b) (c) (Cost $8,690,918) | 8,690,918 | 8,690,918 |
|
Cash Equivalents 0.4% |
Cash Management QP Trust, 1.42% (b) (Cost $369,189) | 369,189 | 369,189 |
| % of Net Assets | Value ($) |
| |
Total Investment Portfolio (Cost $122,215,740)+ | 109.4 | 99,151,232 |
Other Assets and Liabilities, Net | (9.4) | (8,502,160) |
Net Assets | 100.0 | 90,649,072 |
* Non-income producing security.+ The cost for federal income tax purposes was $123,010,114. At December 31, 2008, net unrealized depreciation for all securities based on tax cost was $23,858,882. This consisted of aggregate gross unrealized appreciation for all securities in which there was an excess of value over tax cost of $6,936,104 and aggregate gross unrealized depreciation for all securities in which there was an excess of tax cost over value of $30,794,986.(a) All or a portion of these securities were on loan (see Notes to Financial Statements). The value of all securities loaned at December 31, 2008 amounted to $8,315,612, which is 9.2% of net assets.(b) Affiliated fund managed by Deutsche Investment Management Americas Inc. The rate shown is the annualized seven-day yield at period end.(c) Represents collateral held in connection with securities lending. Income earned by the Portfolio is net of borrower rebates.ADR: American Depositary Receipt
MSCI: Morgan Stanley Capital International
Fair Value Measurements
The following is a summary of the inputs used as of December 31, 2008 in valuing the Portfolio's investments. For information on the Portfolio's policy regarding the valuation of investments and of the valuation inputs, and the aggregate levels used in the table below, please refer to the Security Valuation section of Note A in the accompanying Notes to the Financial Statements.
Valuation Inputs | Investments in Securities |
Level 1
| $ 16,844,543 |
Level 2
| 82,306,689 |
Level 3
| — |
Total | $ 99,151,232 |
The accompanying notes are an integral part of the financial statements.
Financial Statements
Statement of Assets and Liabilities as of December 31, 2008
|
Assets |
Investments:
Investments in securities, at value (cost $113,155,633) — including $8,315,612 of securities loaned | $ 90,091,125 |
Investment in Daily Assets Fund Institutional (cost $8,690,918)* | 8,690,918 |
Investment in Cash Management QP Trust (cost $369,189) | 369,189 |
Total investments, at value (cost $122,215,740)
| 99,151,232 |
Foreign currency, at value (cost $209,574)
| 209,614 |
Dividends receivable
| 177,391 |
Interest receivable
| 10,536 |
Foreign taxes recoverable
| 145,889 |
Other assets
| 3,602 |
Total assets
| 99,698,264 |
Liabilities |
Payable for Portfolio shares redeemed
| 84,094 |
Payable upon return of securities loaned
| 8,690,918 |
Accrued management fee
| 59,652 |
Other accrued expenses and payables
| 214,528 |
Total liabilities
| 9,049,192 |
Net assets, at value | $ 90,649,072 |
Net Assets Consist of |
Undistributed net investment income
| 5,131,928 |
Net unrealized appreciation (depreciation) on:
Investments | (23,064,508) |
Foreign currency | 13,407 |
Accumulated net realized gain (loss)
| (48,835,637) |
Paid-in capital
| 157,403,882 |
Net assets, at value | $ 90,649,072 |
Class A Net Asset Value, offering and redemption price per share ($90,552,029 ÷ 14,554,587 outstanding shares of beneficial interest, $.01 par value, unlimited number of shares authorized)
| $ 6.22 |
Class B Net Asset Value, offering and redemption price per share ($97,043 ÷ 15,672 outstanding shares of beneficial interest, $.01 par value, unlimited number of shares authorized)
| $ 6.19 |
* Represents collateral on securities loaned.The accompanying notes are an integral part of the financial statements.
Statement of Operations for the year ended December 31, 2008
|
Investment Income |
Income:
Dividends (net of foreign taxes withheld of $485,492)
| $ 6,904,106 |
Interest
| 23,025 |
Interest — Cash Management QP Trust
| 111,832 |
Securities lending income, including income from Daily Assets Fund Institutional, net of borrower rebates
| 254,593 |
Total Income
| 7,293,556 |
Expenses:
Management fee
| 1,244,991 |
Administration fee
| 105,669 |
Custodian fee
| 275,682 |
Distribution service fee (Class B)
| 11,230 |
Services to shareholders
| 219 |
Record keeping fees (Class B)
| 6,257 |
Professional fees
| 82,959 |
Trustees' fees and expenses
| 18,554 |
Reports to shareholders and shareholder meeting
| 78,226 |
Other
| 29,970 |
Total expenses before expense reductions
| 1,853,757 |
Expense reductions
| (11,048) |
Total expenses after expense reductions
| 1,842,709 |
Net investment income (loss) | 5,450,847 |
Realized and Unrealized Gain (Loss) |
Net realized gain (loss) from:
Investments
| (48,344,004) |
Foreign currency
| (316,140) |
Payments by affiliates (see Note I)
| 354,782 |
| (48,305,362) |
Change in net unrealized appreciation (depreciation) on:
Investments (including deferred foreign tax credit of $15,499)
| (62,634,390) |
Foreign currency
| (2,735) |
| (62,637,125) |
Net gain (loss) on investment transactions | (110,942,487) |
Net increase (decrease) in net assets resulting from operations | $ (105,491,640) |
The accompanying notes are an integral part of the financial statements.
Statement of Changes in Net Assets |
| Years Ended December 31, |
Increase (Decrease) in Net Assets | 2008 | 2007 |
Operations:
Net investment income (loss)
| $ 5,450,847 | $ 3,970,300 |
Net realized gain (loss)
| (48,305,362) | 62,491,196 |
Change in net unrealized appreciation (depreciation)
| (62,637,125) | (23,087,118) |
Net increase (decrease) in net assets resulting from operations
| (105,491,640) | 43,374,378 |
Distributions to shareholders from:
Net investment income:
Class A | (1,777,801) | (6,153,181) |
Class B | (65,124) | (1,706,211) |
Net realized gains:
Class A | (55,032,003) | (21,172,091) |
Class B | (3,550,840) | (6,853,490) |
Total distributions
| (60,425,768) | (35,884,973) |
Portfolio share transactions:
Class A Proceeds from shares sold
| 11,757,062 | 26,016,717 |
Reinvestment of distributions
| 56,809,804 | 27,325,272 |
Cost of shares redeemed
| (52,019,794) | (48,603,167) |
Net increase (decrease) in net assets from Class A share transactions
| 16,547,072 | 4,738,822 |
Class B Proceeds from shares sold
| 830,161 | 3,741,916 |
Reinvestment of distributions
| 3,615,964 | 8,559,701 |
Cost of shares redeemed
| (15,396,520) | (69,011,239) |
Net increase (decrease) in net assets from Class B share transactions
| (10,950,395) | (56,709,622) |
Increase (decrease) in net assets | (160,320,731) | (44,481,395) |
Net assets at beginning of period
| 250,969,803 | 295,451,198 |
Net assets at end of period (including undistributed net investment income of $5,131,928 and $1,838,472, respectively)
| $ 90,649,072 | $ 250,969,803 |
Other Information |
Class A Shares outstanding at beginning of period
| 14,064,172 | 13,653,834 |
Shares sold
| 1,040,380 | 1,594,102 |
Shares issued to shareholders in reinvestment of distributions
| 5,131,870 | 1,820,471 |
Shares redeemed
| (5,681,835) | (3,004,235) |
Net increase (decrease) in Class A shares
| 490,415 | 410,338 |
Shares outstanding at end of period
| 14,554,587 | 14,064,172 |
Class B Shares outstanding at beginning of period
| 912,661 | 4,475,081 |
Shares sold
| 60,348 | 229,248 |
Shares issued to shareholders in reinvestment of distributions
| 326,645 | 570,267 |
Shares redeemed
| (1,283,982) | (4,361,935) |
Net increase (decrease) in Class B shares
| (896,989) | (3,562,420) |
Shares outstanding at end of period
| 15,672 | 912,661 |
The accompanying notes are an integral part of the financial statements.
Financial Highlights
Class A Years Ended December 31, | 2008 | 2007 | 2006 | 2005 | 2004 |
Selected Per Share Data |
Net asset value, beginning of period | $ 16.76 | $ 16.31 | $ 13.25 | $ 11.91 | $ 10.18 |
Income (loss) from investment operations: Net investment incomea | .33d | .25 | .24b | .20 | .17 |
Net realized and unrealized gain (loss) | (6.67) | 2.24 | 3.11 | 1.48 | 1.67 |
Total from investment operations | (6.34) | 2.49 | 3.35 | 1.68 | 1.84 |
Less distributions from: Net investment income | (.13) | (.46) | (.29) | (.34) | (.11) |
Net realized gains | (4.07) | (1.58) | — | — | — |
Total distributions | (4.20) | (2.04) | (.29) | (.34) | (.11) |
Net asset value, end of period | $ 6.22 | $ 16.76 | $ 16.31 | $ 13.25 | $ 11.91 |
Total Return (%)
| (48.81)c,e | 16.71 | 25.56 | 14.51 | 18.25 |
Ratios to Average Net Assets and Supplemental Data |
Net assets, end of period ($ millions)
| 91 | 236 | 223 | 196 | 184 |
Ratio of expenses before expense reductions (%)
| 1.02 | .93 | .88 | .87 | .89 |
Ratio of expenses after expense reductions (%)
| 1.01 | .93 | .88 | .87 | .89 |
Ratio of net investment income (%)
| 3.04d | 1.53 | 1.65b | 1.59 | 1.58 |
Portfolio turnover rate (%)
| 132 | 117 | 122 | 93 | 88 |
a Based on average shares outstanding during the period.
b Net investment income per share and the ratio of net investment income without non-recurring dividend income amounting to $0.20 per share and 1.39% of average daily net assets, respectively.
c Total return would have been lower had certain expenses not been reimbursed.
d Net investment income per share and ratio of net investment income include non-recurring dividend income amounting to $0.16 per share and 1.49% of average daily net assets, respectively.
e Includes a reimbursement from the Advisor to reimburse the effect of losses incurred as the result of certain operation errors during the period. Excluding this reimbursement, total return would have been 0.14% lower.
|
Class B Years Ended December 31, | 2008 | 2007 | 2006 | 2005 | 2004 |
Selected Per Share Data |
Net asset value, beginning of period | $ 16.70 | $ 16.26 | $ 13.21 | $ 11.88 | $ 10.15 |
Income (loss) from investment operations: Net investment incomea | .24d | .19 | .19b | .15 | .13 |
Net realized and unrealized gain (loss) | (6.61) | 2.22 | 3.09 | 1.47 | 1.67 |
Total from investment operations | (6.37) | 2.41 | 3.28 | 1.62 | 1.80 |
Less distributions from: Net investment income | (.07) | (.39) | (.23) | (.29) | (.07) |
Net realized gains | (4.07) | (1.58) | — | — | — |
Total distributions | (4.14) | (1.97) | (.23) | (.29) | (.07) |
Net asset value, end of period | $ 6.19 | $ 16.70 | $ 16.26 | $ 13.21 | $ 11.88 |
Total Return (%)
| (49.07)c,e | 16.20 | 25.06 | 14.00 | 17.84 |
Ratios to Average Net Assets and Supplemental Data |
Net assets, end of period ($ millions)
| .1 | 15 | 73 | 62 | 47 |
Ratio of expenses before expense reductions (%)
| 1.39 | 1.30 | 1.26 | 1.26 | 1.28 |
Ratio of expenses after expense reductions (%)
| 1.38 | 1.30 | 1.26 | 1.26 | 1.28 |
Ratio of net investment income (%)
| 2.67d | 1.16 | 1.27b | 1.20 | 1.19 |
Portfolio turnover rate (%)
| 132 | 117 | 122 | 93 | 88 |
a Based on average shares outstanding during the period.
b Net investment income per share and the ratio of net investment income without non-recurring dividend income amounting to $0.15 per share and 1.01% of average daily net assets, respectively.
c Total return would have been lower had certain expenses not been reimbursed.
d Net investment income per share and ratio of net investment income include non-recurring dividend income amounting to $0.16 per share and 1.49% of average daily net assets, respectively.
e Includes a reimbursement from the Advisor to reimburse the effect of losses incurred as the result of certain operation errors during the period. Excluding this reimbursement, total return would have been 0.14% lower.
|
Performance Summary December 31, 2008
DWS Janus Growth & Income VIP
All performance shown is historical, assumes reinvestment of all dividend and capital gain distributions and does not guarantee future results. Investment return and principal value fluctuate with changing market conditions so that, when redeemed, shares may be worth more or less than their original cost. Current performance may be lower or higher than the performance data quoted. Please contact your participating insurance company for the Portfolio's most recent month-end performance. Performance doesn't reflect charges and fees ("contract charges") associated with the separate account that invests in the Portfolio or any variable life insurance policy or variable annuity contract for which the Portfolio is an investment option. These charges and fees will reduce returns. While all share classes have the same underlying portfolio, their performance will differ.
The total annual Portfolio operating expense ratio, gross of any fee waivers or expense reimbursements, as stated in the fee table of the prospectus dated May 1, 2008 is 0.90% for Class A shares. Please see the Information About Your Portfolio's Expenses, the Financial Highlights and Notes to the Financial Statements (Note C, Related Parties) sections of this report for gross and net expense related disclosure for the period ended December 31, 2008.
Risk Considerations
The Portfolio is subject to stock market risk, meaning stocks in the Portfolio may decline in value for extended periods of time due to the activities and financial prospects of individual companies, or due to general market and economic conditions. The Portfolio also invests in individual bonds whose yields and market values fluctuate so that your investment may be worth more or less than its original cost. Bond investments are subject to interest-rate risk such that when interest rates rise, the prices of the bonds, and thus the value of the Portfolio, can decline and the investor can lose principal value. Please read this Portfolio's prospectus for specific details regarding its investments and risk profile.
Portfolio returns shown for all periods reflect a fee waiver and/or expense reimbursement. Without this waiver/reimbursement, returns would have been lower.
Growth of an Assumed $10,000 Investment in DWS Janus Growth & Income VIP from 10/29/1999 to 12/31/2008 |
[] DWS Janus Growth & Income VIP — Class A [] Russell 1000® Growth Index | The Russell 1000® Growth Index is an unmanaged index composed of common stocks of larger US companies with higher price-to-book ratios and higher forecasted growth values. Index returns assume reinvestment dividends and, unlike portfolio returns, do not reflect any fees or expenses. It is not possible to invest directly into an index. |
 | |
Yearly periods ended December 31 |
|
Comparative Results |
DWS Janus Growth & Income VIP | 1-Year | 3-Year | 5-Year | Life of Portfolio* |
Class A | Growth of $10,000
| $5,871 | $6,786 | $8,483 | $7,707 |
Average annual total return
| -41.29% | -12.13% | -3.24% | -2.80% |
Russell 1000 Growth Index
| Growth of $10,000
| $6,156 | $7,508 | $8,401 | $5,647 |
Average annual total return
| -38.44% | -9.11% | -3.42% | -6.04% |
The growth of $10,000 is cumulative.
* The Portfolio commenced operations October 29, 1999. Index returns began on October 31, 1999. Total returns would have been lower for the Life of Portfolio period if the Portfolio's expenses were not maintained.Information About Your Portfolio's Expenses
DWS Janus Growth & Income VIP
As an investor of the Portfolio, you incur two types of costs: ongoing expenses and transaction costs. Ongoing expenses include management fees and other Portfolio expenses. Examples of transaction costs include contract charges, redemption fees and account maintenance fees, which are not shown in this section. The following tables are intended to help you understand your ongoing expenses (in dollars) of investing in the Portfolio and to help you compare these expenses with the ongoing expenses of investing in other mutual funds. The example in the table is based on an investment of $1,000 invested at the beginning of the six-month period and held for the entire period (July 1, 2008 to December 31, 2008).
The tables illustrate your Portfolio's expenses in two ways:
• Actual Portfolio Return. This helps you estimate the actual dollar amount of ongoing expenses (but not transaction costs) paid on a $1,000 investment in the Portfolio using the Portfolio's actual return during the period. To estimate the expenses you paid over the period, simply divide your account value by $1,000 (for example, an $8,600 account value divided by $1,000 = 8.6), then multiply the result by the number in the "Expenses Paid per $1,000" line under the share class you hold.
• Hypothetical 5% Portfolio Return. This helps you to compare your Portfolio's ongoing expenses (but not transaction costs) with those of other mutual funds using the Portfolio's actual expense ratio and a hypothetical rate of return of 5% per year before expenses. Examples using a 5% hypothetical Portfolio return may be found in the shareholder reports of other mutual funds. The hypothetical account values and expenses may not be used to estimate the actual ending account balance or expenses you paid for the period.
Please note that the expenses shown in these tables are meant to highlight your ongoing expenses only and do not reflect any transaction costs. The "Expenses Paid per $1,000" line of the tables is useful in comparing ongoing expenses only and will not help you determine the relative total expense of owning different funds. If these transaction costs had been included, your costs would have been higher.
Expenses and Value of a $1,000 Investment for the six months ended December 31, 2008 |
Actual Portfolio Return | Class A | |
Beginning Account Value 7/1/08
| $ 1,000.00 | |
Ending Account Value 12/31/08
| $ 662.40 | |
Expenses Paid per $1,000*
| $ 3.55 | |
Hypothetical 5% Portfolio Return | Class A | |
Beginning Account Value 7/1/08
| $ 1,000.00 | |
Ending Account Value 12/31/08
| $ 1,020.86 | |
Expenses Paid per $1,000*
| $ 4.32 | |
* Expenses are equal to the Portfolio's annualized expense ratio, multiplied by the average account value over the period, multiplied by the number of days in the most recent six-month period, then divided by 366.Annualized Expense Ratios | Class A | |
DWS Variable Series II — DWS Janus Growth & Income VIP
| .85% | |
For more information, please refer to the Portfolio's prospectus.
These tables do not reflect charges and fees ("contract charges") associated with the separate account that invests in the Portfolio or any variable life insurance policy or variable annuity contract for which the Portfolio is an investment option.
Management Summary December 31, 2008
DWS Janus Growth & Income VIP
Continuing turmoil from the credit crisis and concerns over a prolonged recession characterized US equity markets during the 12-month period ending December 31, 2008. For that same period, the Portfolio's Class A shares (unadjusted for contract charges) returned -41.29%, while its benchmark, the Russell 1000® Growth Index, returned -38.44%.
Holdings within the consumer discretionary and information technology sectors were the main laggards during the period. In terms of contributors, select materials names coupled with a significant underweight in financials aided relative performance.1
Google, Inc. has been impacted by investor worries that the current Internet advertising climate favors advertisers who can pay less for clicks. Given the difficult economic climate, we chose to exit the position during the fourth quarter. Hess Corp., an exploration and production company and a key contributor to the Portfolio in 2008, was impacted by the steep decline in oil prices during the second half of the year.
Yahoo! Inc. was one of the top contributors to performance for the year. We sold the Portfolio's position in the Internet software company early in the period after Microsoft Corp. made an offer to buy the company. Genentech, Inc., a California-based biotechnology leader, moved ahead during the second half of the year after receiving a take-out bid from Swiss-based Roche, which already owned a majority share of the company.
The magnitude of the economic and financial downturn in 2008 caught many of us by surprise. While we recognize the potential for a long series of negative economic data points hitting financial markets, we believe there is ample reason to be optimistic, recognizing that valuations are at historically low levels by any measure and that the market typically discounts an eventual economic recovery prior to it showing up in the data.
Marc Pinto, CFA
Portfolio Manager, Janus Capital Management LLC, Subadvisor to the Portfolio
The Russell 1000 Growth Index is an unmanaged index composed of common stocks of larger US companies with higher price-to-book ratios and higher forecasted growth values. Index returns assume reinvestment of dividends and, unlike portfolio returns, do not reflect any fees or expenses. It is not possible to invest directly into an index.
1 "Overweight" means the portfolio holds a higher weighting in a given sector or security than the benchmark. "Underweight" means the portfolio holds a lower weighting.Portfolio management market commentary is as of December 31, 2008, and may not come to pass. This information is subject to change at any time based on market and other conditions. Past performance does not guarantee future results. Current and future portfolio holdings are subject to risk.
Portfolio Summary
DWS Janus Growth & Income VIP
Asset Allocation (As a % of Investment Portfolio excluding Securities Lending Collateral) | 12/31/08 | 12/31/07 |
| | |
Common Stocks | 91% | 95% |
Government & Agency Obligations | 7% | — |
Cash Equivalents | 1% | 1% |
Corporate Bonds | 1% | — |
Preferred Stocks | — | 1% |
Participatory Notes | — | 2% |
Equity Linked Structured Notes | — | 1% |
| 100% | 100% |
Sector Diversification (As a % of Common and Preferred Stocks and Corporate Bonds) | 12/31/08 | 12/31/07 |
| | |
Information Technology | 24% | 25% |
Consumer Staples | 22% | 14% |
Health Care | 17% | 11% |
Energy | 13% | 16% |
Consumer Discretionary | 10% | 14% |
Industrials | 5% | 8% |
Financials | 5% | 10% |
Materials | 4% | 2% |
| 100% | 100% |
Asset allocation and sector diversification are subject to change.
For more complete details about the Portfolio's investment portfolio, see page 186. A complete list of portfolio holdings of the portfolio is posted as of the month end on www.dws-investments.com on or about the 15th day of the following month. More frequent posting of portfolio holdings information may be made from time to time on www.dws-investments.com.
Following the Portfolio's fiscal first and third quarter-end, a complete portfolio holdings listing is filed with the SEC on Form N-Q. The form will be available on the SEC's Web site at www.sec.gov, and it also may be reviewed and copied at the SEC's Public Reference Room in Washington, D.C. Information on the operation of the SEC's Public Reference Room may be obtained by calling (800) SEC-0330.
Investment Portfolio December 31, 2008
DWS Janus Growth & Income VIP
|
Shares
| Value ($) |
| |
Common Stocks 90.9% |
Consumer Discretionary 8.4% |
Hotels Restaurants & Leisure 3.1% |
Crown Ltd. (a) | 37,830 | 158,361 |
MGM MIRAGE* (a) | 57,340 | 788,998 |
Starwood Hotels & Resorts Worldwide, Inc. (a) | 27,005 | 483,390 |
Wynn Resorts Ltd.* (a) | 18,875 | 797,658 |
| 2,228,407 |
Internet & Catalog Retail 0.0% |
Liberty Media Corp. — Interactive "A"* (a) | 11,640 | 36,317 |
Media 1.1% |
The DIRECTV Group, Inc.* (a) | 33,515 | 767,829 |
Specialty Retail 2.8% |
Esprit Holdings Ltd. | 264,025 | 1,504,951 |
Tiffany & Co. (a) | 22,250 | 525,767 |
| 2,030,718 |
Textiles, Apparel & Luxury Goods 1.4% |
NIKE, Inc. "B" | 20,425 | 1,041,675 |
Consumer Staples 20.2% |
Beverages 5.0% |
Anheuser-Busch InBev NV (a) | 155,601 | 3,607,505 |
Anheuser-Busch InBev NV (VVPR Strip)* | 88,376 | 492 |
| 3,607,997 |
Food & Staples Retailing 4.0% |
CVS Caremark Corp. | 101,200 | 2,908,488 |
Food Products 6.2% |
Nestle SA (ADR) (Registered) | 44,982 | 1,785,785 |
Nestle SA (Registered) | 68,430 | 2,697,003 |
| 4,482,788 |
Household Products 1.7% |
Reckitt Benckiser Group PLC | 33,918 | 1,263,596 |
Tobacco 3.3% |
Altria Group, Inc. | 41,620 | 626,797 |
Philip Morris International, Inc. | 41,620 | 1,810,886 |
| 2,437,683 |
Energy 11.6% |
Oil, Gas & Consumable Fuels |
ConocoPhillips | 45,000 | 2,331,000 |
EnCana Corp. | 45,668 | 2,122,648 |
EOG Resources, Inc. | 17,195 | 1,144,843 |
Hess Corp. | 53,259 | 2,856,813 |
| 8,455,304 |
Financials 4.2% |
Capital Markets 3.7% |
Credit Suisse Group AG (ADR) | 27,295 | 771,356 |
Morgan Stanley | 70,720 | 1,134,349 |
The Goldman Sachs Group, Inc. | 9,315 | 786,093 |
| 2,691,798 |
|
Shares
| Value ($) |
| |
Real Estate Management & Development 0.5% |
Hang Lung Properties Ltd. | 140,725 | 308,694 |
Health Care 15.7% |
Biotechnology 2.3% |
Celgene Corp.* | 11,295 | 624,388 |
Genentech, Inc.* | 12,210 | 1,012,331 |
| 1,636,719 |
Health Care Equipment & Supplies 3.4% |
Alcon, Inc. | 13,505 | 1,204,511 |
Baxter International, Inc. | 13,245 | 709,799 |
Covidien Ltd. | 16,345 | 592,343 |
| 2,506,653 |
Health Care Providers & Services 2.7% |
UnitedHealth Group, Inc. | 75,070 | 1,996,862 |
Pharmaceuticals 7.3% |
Allergan, Inc. | 24,635 | 993,283 |
Bristol-Myers Squibb Co. | 27,660 | 643,095 |
Merck & Co., Inc. | 45,490 | 1,382,896 |
Roche Holding AG (Genusschein) | 8,737 | 1,344,919 |
Wyeth | 24,865 | 932,686 |
| 5,296,879 |
Industrials 5.1% |
Aerospace & Defense 3.3% |
BAE Systems PLC (ADR) | 17,805 | 397,230 |
Boeing Co. | 28,590 | 1,219,935 |
Empresa Brasiliera de Aeronautica SA (ADR) | 50,013 | 810,711 |
| 2,427,876 |
Electrical Equipment 0.7% |
JA Solar Holdings Co., Ltd. (ADR)* (a) | 52,345 | 228,748 |
Suntech Power Holdings Co., Ltd. (ADR)* (a) | 24,612 | 287,960 |
| 516,708 |
Machinery 1.1% |
Danaher Corp. (a) | 13,820 | 782,350 |
Information Technology 21.9% |
Communications Equipment 6.9% |
Cisco Systems, Inc.* | 35,285 | 575,146 |
Corning, Inc. (a) | 149,242 | 1,422,276 |
Nokia Oyj (ADR) (a) | 43,038 | 671,393 |
QUALCOMM, Inc. | 36,645 | 1,312,990 |
Research In Motion Ltd.* | 26,135 | 1,060,558 |
| 5,042,363 |
Computers & Peripherals 4.0% |
Apple, Inc.* | 23,694 | 2,022,283 |
EMC Corp.* | 80,680 | 844,720 |
| 2,867,003 |
Electronic Equipment, Instruments & Components 0.4% |
Amphenol Corp. "A" | 11,845 | 284,043 |
Internet Software & Services 0.8% |
eBay, Inc.* | 39,690 | 554,072 |
|
Shares
| Value ($) |
| |
IT Services 1.9% |
Visa, Inc. "A" (a) | 9,960 | 522,402 |
Western Union Co. | 61,260 | 878,469 |
| 1,400,871 |
Software 7.9% |
Citrix Systems, Inc.* | 11,845 | 279,187 |
Microsoft Corp. | 53,575 | 1,041,498 |
Nintendo Co., Ltd. (ADR) (a) | 21,100 | 1,007,525 |
Oracle Corp.* | 192,650 | 3,415,684 |
| 5,743,894 |
Materials 3.8% |
Chemicals |
Monsanto Co. | 5,455 | 383,759 |
Praxair, Inc. | 8,530 | 506,341 |
Syngenta AG (ADR) | 48,250 | 1,888,505 |
| 2,778,605 |
Total Common Stocks (Cost $81,633,867) | 66,096,192 |
|
Preferred Stock 0.4% |
Financials |
Citigroup, Inc., Series AA, 8.125% (Cost $413,997) | 18,325 | 292,284 |
| Principal Amount ($) | Value ($) |
| |
Corporate Bonds 0.7% |
Consumer Discretionary 0.4% |
MGM MIRAGE, 8.5%, 9/15/2010 | 346,000 | 290,640 |
| Principal Amount ($) | Value ($) |
| |
Energy 0.3% |
Suntech Power Holdings Co., Ltd., 144A, 3.0%, 3/15/2013 | 623,000 | 249,979 |
Total Corporate Bonds (Cost $850,506) | 540,619 |
|
Government & Agency Obligations 7.3% |
US Treasury Obligations |
US Treasury Notes: | | |
1.5%, 10/31/2010 (a) | 844,000 | 856,594 |
2.125%, 1/31/2010 (a) | 2,326,000 | 2,368,612 |
2.75%, 7/31/2010 | 646,000 | 669,216 |
3.375%, 7/31/2013 (a) | 646,000 | 705,604 |
4.875%, 7/31/2011 (a) | 646,000 | 712,972 |
Total Government & Agency Obligations (Cost $5,164,642) | 5,312,998 |
|
Shares
| Value ($) |
| |
Securities Lending Collateral 14.8% |
Daily Assets Fund Institutional, 1.69% (b) (c) (Cost $10,735,723) | 10,735,723 | 10,735,723 |
|
Cash Equivalents 0.9% |
Cash Management QP Trust, 1.42% (b) (Cost $646,439) | 646,439 | 646,439 |
| % of Net Assets | Value ($) |
| |
Total Investment Portfolio (Cost $99,445,174)+ | 115.0 | 83,624,255 |
Other Assets and Liabilities, Net | (15.0) | (10,876,343) |
Net Assets | 100.0 | 72,747,912 |
* Non-income producing security.+ The cost for federal income tax purposes was $99,875,076. At December 31, 2008, net unrealized depreciation for all securities based on tax cost was $16,250,821. This consisted of aggregate gross unrealized appreciation for all securities in which there was an excess of value over tax cost of $5,338,897 and aggregate gross unrealized depreciation for all securities in which there was an excess of tax cost over value of $21,589,718.(a) All or a portion of these securities were on loan (see Notes to Financial Statements). The value of all securities loaned at December 31, 2008 amounted to $10,631,296, which is 14.6% of net assets.(b) Affiliated Fund is managed by Deutsche Investment Management Americas Inc. The rate shown is the annualized seven-day yield at period end.(c) Represents collateral held in connection with securities lending. Income earned by the Portfolio is net of borrower rebates.144A: Security exempt from registration under Rule 144A of the Securities Act of 1933. These securities may be resold in transactions exempt from registration, normally to qualified institutional buyers.
ADR: American Depositary Receipt
At December 31, 2008, the Portfolio had the following open forward foreign currency exchange contracts:
Contracts to Deliver | | In Exchange For | | Settlement Date | | Unrealized Appreciation ($) |
GBP
| 500,000 |
| USD
| 786,000 |
| 1/23/2009 |
| 68,204 |
Contracts to Deliver | | In Exchange For | | Settlement Date | | Unrealized Depreciation ($) |
CHF
| 925,000 |
| USD
| 787,858 |
| 1/23/2009 |
| (81,443) |
EUR
| 480,000 |
| USD
| 610,668 |
| 1/23/2009 |
| (55,841) |
CHF
| 1,355,000 |
| USD
| 1,189,118 |
| 2/6/2009 |
| (84,474) |
EUR
| 770,000 |
| USD
| 1,060,752 |
| 2/6/2009 |
| (7,918) |
Total unrealized depreciation | (229,676) |
Currency Abbreviations |
CHF Swiss Franc
EUR Euro
GBP British Pound
USD United States Dollar
|
Fair Value Measurements
The following is a summary of the inputs used as of December 31, 2008 in valuing the Portfolio's investments. For information on the Portfolio's policy regarding the valuation of investments and of the valuation inputs, and the aggregate levels used in the table below, please refer to the Security Valuation section of Note A in the accompanying Notes to the Financial Statements.
Valuation Inputs | Investments in Securities | Other Financial Instruments++ |
Level 1
| $ 66,238,678 | $ — |
Level 2
| 17,385,577 | (161,472) |
Level 3
| — | — |
Total | $ 83,624,255 | $ (161,472) |
++ Other financial instruments are derivative instruments not reflected in the Investment Portfolio, such as forward foreign currency exchange contracts, which are valued at the unrealized appreciation (depreciation) on the instrument.The accompanying notes are an integral part of the financial statements.
Financial Statements
Statement of Assets and Liabilities as of December 31, 2008
|
Assets |
Investments:
Investments in securities, at value (cost $88,063,012) — including $10,631,788 of securities loaned | $ 72,242,093 |
Investments in Daily Assets Fund Institutional, (cost $10,735,723)* | 10,735,723 |
Investment in Cash Management QP Trust (cost $646,439) | 646,439 |
Total investments, at value (cost $99,445,174)
| 83,624,255 |
Dividends receivable
| 106,629 |
Interest receivable
| 95,582 |
Foreign taxes recoverable
| 15,115 |
Net receivable on closed forward foreign currency exchange contracts
| 2,696 |
Unrealized appreciation on forward foreign currency exchange contracts
| 68,204 |
Other assets
| 3,827 |
Total assets
| 83,916,308 |
Liabilities |
Foreign cash overdraft
| 42,545 |
Payable upon return of securities loaned
| 10,735,723 |
Payable for Portfolio shares redeemed
| 33,280 |
Unrealized depreciation on forward foreign currency exchange contracts
| 229,676 |
Accrued management fee
| 32,488 |
Other accrued expenses and payables
| 94,684 |
Total liabilities
| 11,168,396 |
Net assets, at value | $ 72,747,912 |
Net Assets Consist of |
Undistributed net investment income
| 1,451,246 |
Net unrealized appreciation (depreciation) on:
Investments | (15,820,919) |
Foreign currency | (166,440) |
Accumulated net realized gain (loss)
| (16,266,163) |
Paid-in capital
| 103,550,188 |
Net assets, at value | $ 72,747,912 |
Class A Net Asset Value, offering and redemption price per share ($72,747,912 ÷ 10,707,778 outstanding shares of beneficial interest, $.01 par value, unlimited number of shares authorized)
| $ 6.79 |
* Represents collateral on securities loaned.The accompanying notes are an integral part of the financial statements.
Statement of Operations for the year ended December 31, 2008
|
Investment Income |
Income:
Dividends (net of foreign taxes withheld of $92,750)
| $ 2,151,856 |
Interest — Cash Management QP Trust
| 54,714 |
Interest
| 123,457 |
Securities lending income, including income from Daily Assets Fund Institutional, net of borrower rebates
| 241,363 |
Total Income
| 2,571,390 |
Expenses:
Management fee
| 897,800 |
Administration fee
| 76,972 |
Services to shareholders
| 50 |
Custodian and accounting fees
| 58,454 |
Distribution service fee (Class B)
| 3,511 |
Record keeping fees (Class B)
| 1,388 |
Professional fees
| 69,314 |
Trustees' fees and expenses
| 19,156 |
Reports to shareholders and shareholder meeting
| 26,734 |
Other
| 17,765 |
Total expenses before expense reductions
| 1,171,144 |
Expense reductions
| (7,973) |
Total expenses after expense reductions
| 1,163,171 |
Net investment income (loss) | 1,408,219 |
Realized and Unrealized Gain (Loss) |
Net realized gain (loss) from:
Investments
| (15,768,982) |
Foreign currency
| 72,581 |
| (15,696,401) |
Change in net unrealized appreciation (depreciation) on:
Investments
| (48,908,666) |
Foreign currency
| (170,089) |
| (49,078,755) |
Net gain (loss) | (64,775,156) |
Net increase (decrease) in net assets resulting from operations | $ (63,366,937) |
The accompanying notes are an integral part of the financial statements.
Statement of Changes in Net Assets |
| Years Ended December 31, |
Increase (Decrease) in Net Assets | 2008 | 2007 |
Operations:
Net investment income (loss)
| $ 1,408,219 | $ 1,783,281 |
Net realized gain (loss)
| (15,696,401) | 26,158,518 |
Change in net unrealized appreciation (depreciation)
| (49,078,755) | (14,652,159) |
Net increase (decrease) in net assets resulting from operations
| (63,366,937) | 13,289,640 |
Distributions to shareholders from:
Net investment income:
Class A | (1,498,719) | (1,085,636) |
Class B | (26,339) | (60,241) |
Net realized gains:
Class A | (10,758,388) | — |
Class B | (307,896) | — |
Total distributions
| (12,591,342) | (1,145,877) |
Portfolio share transactions:
Class A Proceeds from shares sold
| 3,988,301 | 3,234,514 |
Reinvestment of distributions
| 12,257,107 | 1,085,636 |
Cost of shares redeemed
| (36,686,072) | (39,897,035) |
Net increase (decrease) in net assets from Class A share transactions
| (20,440,664) | (35,576,885) |
Class B* Proceeds from shares sold
| 34,143 | 923,888 |
Reinvestment of distributions
| 334,235 | 60,241 |
Cost of shares redeemed
| (4,769,414) | (29,091,879) |
Net increase (decrease) in net assets from Class B share transactions
| (4,401,036) | (28,107,750) |
Increase (decrease) in net assets | (100,799,979) | (51,540,872) |
Net assets at beginning of period
| 173,547,891 | 225,088,763 |
Net assets at end of period (including undistributed net investment income of $1,451,246 and $1,499,729, respectively)
| $ 72,747,912 | $ 173,547,891 |
Other Information |
Class A Shares outstanding at beginning of period
| 13,362,156 | 16,236,105 |
Shares sold
| 377,805 | 261,428 |
Shares issued to shareholders in reinvestment of distributions
| 1,171,808 | 92,159 |
Shares redeemed
| (4,203,991) | (3,227,536) |
Net increase (decrease) in Class A shares
| (2,654,378) | (2,873,949) |
Shares outstanding at end of period
| 10,707,778 | 13,362,156 |
Class B* Shares outstanding at beginning of period
| 392,971 | 2,676,871 |
Shares sold
| 3,098 | 77,171 |
Shares issued to shareholders in reinvestment of distributions
| 32,107 | 5,135 |
Shares redeemed
| (428,176) | (2,366,206) |
Net increase (decrease) in Class B shares
| (392,971) | (2,283,900) |
Shares outstanding at end of period
| — | 392,971 |
* On July 31, 2008, Class B shares were liquidated.The accompanying notes are an integral part of the financial statements.
Financial Highlights
Class A Years Ended December 31, | 2008 | 2007 | 2006 | 2005 | 2004 |
Selected Per Share Data |
Net asset value, beginning of period | $ 12.62 | $ 11.91 | $ 11.05 | $ 9.88 | $ 8.86 |
Income (loss) from investment operations: Net investment income (loss)a | .11 | .12 | .07 | .05 | .03 |
Net realized and unrealized gain (loss) | (4.98) | .66 | .86 | 1.14 | .99 |
Total from investment operations | (4.87) | .78 | .93 | 1.19 | 1.02 |
Less distributions from: Net investment income | (.12) | (.07) | (.07) | (.02) | — |
Net realized and unrealized gain (loss) on investment transactions | (.84) | — | — | — | — |
Total distributions | (.96) | (.07) | (.07) | (.02) | — |
Net asset value, end of period | $ 6.79 | $ 12.62 | $ 11.91 | $ 11.05 | $ 9.88 |
Total Return (%)
| (41.29)b | 6.59 | 8.43 | 12.11 | 11.51 |
Ratios to Average Net Assets and Supplemental Data |
Net assets, end of period ($ millions)
| 73 | 169 | 193 | 195 | 187 |
Ratio of expenses before expense reductions (%)
| .91 | .90 | .85 | .92 | 1.06 |
Ratio of expenses after expense reductions (%)
| .90 | .90 | .85 | .92 | 1.06 |
Ratio of net investment income (loss) (%)
| 1.10 | .93 | .68 | .45 | .34 |
Portfolio turnover rate (%)
| 58 | 73 | 44 | 32 | 52 |
a Based on average shares outstanding during the period.
b Total return would have been lower had certain expenses not been reduced.
|
Performance Summary December 31, 2008
DWS Large Cap Value VIP
All performance shown is historical, assumes reinvestment of all dividend and capital gain distributions and does not guarantee future results. Investment return and principal value fluctuate with changing market conditions so that, when redeemed, shares may be worth more or less than their original cost. Current performance may be lower or higher than the performance data quoted. Please contact your participating insurance company for the Portfolio's most recent month-end performance. Performance doesn't reflect charges and fees ("contract charges") associated with the separate account that invests in the Portfolio or any variable life insurance policy or variable annuity contract for which the Portfolio is an investment option. These charges and fees will reduce returns. While all share classes have the same underlying portfolio, their performance will differ.
The total annual Portfolio operating expense ratios, gross of any fee waivers or expense reimbursements, as stated in the fee table of the prospectus dated May 1, 2008 are 0.83% and 1.08% for Class A and Class B shares, respectively. Please see the Information About Your Portfolio's Expenses, the Financial Highlights and Notes to the Financial Statements (Note C, Related Parties) sections of this report for gross and net expense related disclosure for the period ended December 31, 2008.
Risk Considerations
The Portfolio is subject to stock market risk. The Portfolio may focus its investments on certain economic sectors, thereby increasing its vulnerability to any single economic, political or regulatory development. This may result in greater share price volatility. Please read this Portfolio's prospectus for specific details regarding its investments and risk profile.
Portfolio returns shown for all periods reflect a fee waiver and/or expense reimbursement. Without this waiver/reimbursement, returns would have been lower.
Growth of an Assumed $10,000 Investment in DWS Large Cap Value VIP |
[] DWS Large Cap Value VIP — Class A [] Russell 1000® Value Index | The Russell 1000® Value Index is an unmanaged index, which consists of those stocks in the Russell 1000 Index with lower price-to-book ratios and lower forecasted-growth values. Index returns assume reinvestment of dividends and, unlike portfolio returns, do not reflect any fees or expenses. It is not possible to invest directly into an index. |
 | |
Yearly periods ended December 31 |
|
Comparative Results |
DWS Large Cap Value VIP | 1-Year | 3-Year | 5-Year | 10-Year |
Class A | Growth of $10,000
| $6,360 | $8,306 | $9,322 | $11,161 |
Average annual total return
| -36.40% | -6.00% | -1.39% | 1.10% |
Russell 1000 Value Index
| Growth of $10,000
| $6,315 | $7,707 | $9,611 | $11,450 |
Average annual total return
| -36.85% | -8.32% | -.79% | 1.36% |
DWS Large Cap Value VIP | 1-Year | 3-Year | 5-Year | Life of Class* |
Class B | Growth of $10,000
| $6,336 | $8,213 | $9,148 | $10,634 |
Average annual total return
| -36.64% | -6.35% | -1.77% | .95% |
Russell 1000 Value Index
| Growth of $10,000
| $6,315 | $7,707 | $9,611 | $11,087 |
Average annual total return
| -36.85% | -8.32% | -.79% | 1.60% |
The growth of $10,000 is cumulative.
* The Portfolio commenced offering Class B shares on July 1, 2002. Index returns began on June 30, 2002.Information About Your Portfolio's Expenses
DWS Large Cap Value VIP
As an investor of the Portfolio, you incur two types of costs: ongoing expenses and transaction costs. Ongoing expenses include management fees, distribution and service (12b-1) fees and other Portfolio expenses. Examples of transaction costs include contract charges, redemption fees and account maintenance fees, which are not shown in this section. The following tables are intended to help you understand your ongoing expenses (in dollars) of investing in the Portfolio and to help you compare these expenses with the ongoing expenses of investing in other mutual funds. In the most recent six-month period, the Portfolio limited these expenses, had it not done so, expenses would have been higher. The example in the table is based on an investment of $1,000 invested at the beginning of the six-month period and held for the entire period (July 1, 2008 to December 31, 2008).
The tables illustrate your Portfolio's expenses in two ways:
• Actual Portfolio Return. This helps you estimate the actual dollar amount of ongoing expenses (but not transaction costs) paid on a $1,000 investment in the Portfolio using the Portfolio's actual return during the period. To estimate the expenses you paid over the period, simply divide your account value by $1,000 (for example, an $8,600 account value divided by $1,000 = 8.6), then multiply the result by the number in the "Expenses Paid per $1,000" line under the share class you hold.
• Hypothetical 5% Portfolio Return. This helps you to compare your Portfolio's ongoing expenses (but not transaction costs) with those of other mutual funds using the Portfolio's actual expense ratio and a hypothetical rate of return of 5% per year before expenses. Examples using a 5% hypothetical Portfolio return may be found in the shareholder reports of other mutual funds. The hypothetical account values and expenses may not be used to estimate the actual ending account balance or expenses you paid for the period.
Please note that the expenses shown in these tables are meant to highlight your ongoing expenses only and do not reflect any transaction costs. The "Expenses Paid per $1,000" line of the tables is useful in comparing ongoing expenses only and will not help you determine the relative total expense of owning different funds. If these transaction costs had been included, your costs would have been higher.
Expenses and Value of a $1,000 Investment for the six months ended December 31, 2008 |
Actual Portfolio Return | Class A | | Class B | |
Beginning Account Value 7/1/08
| $ 1,000.00 | | $ 1,000.00 | |
Ending Account Value 12/31/08
| $ 658.30 | | $ 657.30 | |
Expenses Paid per $1,000*
| $ 3.54 | | $ 5.00 | |
Hypothetical 5% Portfolio Return | Class A | | Class B | |
Beginning Account Value 7/1/08
| $ 1,000.00 | | $ 1,000.00 | |
Ending Account Value 12/31/08
| $ 1,020.86 | | $ 1,019.10 | |
Expenses Paid per $1,000*
| $ 4.32 | | $ 6.09 | |
* Expenses are equal to the Portfolio's annualized expense ratio for each share class, multiplied by the average account value over the period, multiplied by the number of days in the most recent six-month period, then divided by 366.Annualized Expense Ratios | Class A | | Class B | |
DWS Variable Series II — DWS Large Cap Value VIP
| .85% | | 1.20% | |
For more information, please refer to the Portfolio's prospectus.
These tables do not reflect charges and fees ("contract charges") associated with the separate account that invests in the Portfolio or any variable life insurance policy or variable annuity contract for which the Portfolio is an investment option.
Management Summary December 31, 2008
DWS Large Cap Value VIP
The year just ended was the worst in many decades for the US equity markets. Essentially all equity indices posted negative returns for this period, as markets reflected economic problems including a housing slump, rising unemployment, a crisis of confidence and an extreme credit crunch. The Russell 3000® Index, which is generally regarded as a good indicator of the broad stock market, had a negative return of -37.31% for the 12 months ended December 31, 2008. Value stocks, as measured by the Russell 1000® Value index, performed somewhat better than growth stocks, as measured by the Russell 1000® Growth Index. With a return of -36.40% (Class A shares, unadjusted for contract charges), the Portfolio's performance was in line with that of its benchmark, the Russell 1000 Value Index, which had a return of -36.85%.
The major contributor to performance relative to the benchmark was an underweight and stock selection in the financials sector, where the Portfolio benefited from avoiding many of the worst-performing stocks.1 Also positive was a position in PG&E Corp. in the utilities sector, a regulated company with an attractive yield.
Performance relative to the benchmark was hurt by an overweight and stock selection in the energy sector, which weakened significantly as oil prices dropped. Energy positions that detracted from performance include Suncor Energy, Inc. and Transocean Ltd.
Thomas Schuessler, Ph.D.
Portfolio Manager, Deutsche Asset Management International GmbH, Subadvisor to the Portfolio
The Russell 3000 Index is an unmanaged index that measures the performance of the 3,000 largest US companies based on total market capitalization, which represents approximately 98% of the investable US equity market.
The Russell 1000 Value Index is an unmanaged, capitalization-weighted index which consists of those stocks in the Russell 1000 Index with lower price-to-book ratios and lower forecasted growth values.
The Russell 1000 Growth Index is an unmanaged, capitalization-weighted index, consisting of those stocks in the Russell 1000 Index that have greater-than-average growth orientation.
Index returns assume the reinvestment of all dividends and, unlike portfolio returns, do not include fees or expenses. It is not possible to invest directly into an index.
1 "Overweight" means the portfolio holds a higher weighting in a given sector or security than the benchmark. "Underweight" means the portfolio holds a lower weighting.Portfolio management market commentary is as of December 31, 2008, and may not come to pass. This information is subject to change at any time based on market and other conditions. Past performance does not guarantee future results. Current and future portfolio holdings are subject to risk.
Portfolio Summary
DWS Large Cap Value VIP
Asset Allocation (As a % of Investment Portfolio excluding Securities Lending Collateral) | 12/31/08 | 12/31/07 |
| | |
Common Stocks | 100% | 100% |
Sector Diversification (As a % of Common Stocks) | 12/31/08 | 12/31/07 |
| | |
Energy | 18% | 26% |
Health Care | 16% | 8% |
Financials | 14% | 20% |
Utilities | 11% | 13% |
Consumer Staples | 9% | 9% |
Information Technology | 9% | 6% |
Industrials | 9% | 6% |
Materials | 5% | 4% |
Telecommunication Services | 5% | 4% |
Consumer Discretionary | 4% | 4% |
| 100% | 100% |
Asset allocation and sector diversification are subject to change.
For more complete details about the Portfolio's investment portfolio, see page 198. A complete list of portfolio holdings of the portfolio is posted as of the month end on www.dws-investments.com on or about the 15th day of the following month. More frequent posting of portfolio holdings information may be made from time to time on www.dws-investments.com.
Following the Portfolio's fiscal first and third quarter-end, a complete portfolio holdings listing is filed with the SEC on Form N-Q. The form will be available on the SEC's Web site at www.sec.gov, and it also may be reviewed and copied at the SEC's Public Reference Room in Washington, D.C. Information on the operation of the SEC's Public Reference Room may be obtained by calling (800) SEC-0330.
Investment Portfolio December 31, 2008
DWS Large Cap Value VIP
|
Shares
| Value ($) |
| |
Common Stocks 102.1% |
Consumer Discretionary 4.1% |
Distributors 1.7% |
Genuine Parts Co. | 51,928 | 1,965,994 |
Hotels Restaurants & Leisure 1.2% |
Carnival Corp. (Unit) | 57,115 | 1,389,037 |
Specialty Retail 1.2% |
Lowe's Companies, Inc. | 68,098 | 1,465,469 |
Consumer Staples 9.5% |
Beverages 1.1% |
PepsiCo, Inc. | 23,443 | 1,283,973 |
Food & Staples Retailing 1.9% |
CVS Caremark Corp. | 76,599 | 2,201,456 |
Food Products 2.8% |
General Mills, Inc. | 20,353 | 1,236,445 |
Kraft Foods, Inc. "A" | 78,857 | 2,117,310 |
| 3,353,755 |
Tobacco 3.7% |
Altria Group, Inc. | 139,619 | 2,102,662 |
Philip Morris International, Inc. | 51,700 | 2,249,467 |
| 4,352,129 |
Energy 18.2% |
Energy Equipment & Services 5.0% |
ENSCO International, Inc. | 46,040 | 1,307,076 |
Halliburton Co. | 105,501 | 1,918,008 |
National-Oilwell Varco, Inc.* | 37,711 | 921,657 |
Transocean Ltd.* | 38,072 | 1,798,902 |
| 5,945,643 |
Oil, Gas & Consumable Fuels 13.2% |
Chevron Corp. | 31,711 | 2,345,663 |
ConocoPhillips | 41,604 | 2,155,087 |
Devon Energy Corp. | 20,747 | 1,363,285 |
ExxonMobil Corp. | 30,352 | 2,423,000 |
Marathon Oil Corp. | 73,580 | 2,013,149 |
Nexen, Inc. (a) | 71,738 | 1,261,154 |
Noble Energy, Inc. | 31,753 | 1,562,883 |
Occidental Petroleum Corp. | 18,231 | 1,093,678 |
Suncor Energy, Inc. | 72,463 | 1,413,028 |
| 15,630,927 |
Financials 14.3% |
Capital Markets 1.7% |
Affiliated Managers Group, Inc.* | 9,927 | 416,140 |
Eaton Vance Corp. | 22,730 | 477,557 |
Jefferies Group, Inc. | 34,968 | 491,650 |
TD Ameritrade Holding Corp.* | 47,617 | 678,542 |
| 2,063,889 |
Commercial Banks 3.0% |
Canadian Imperial Bank of Commerce | 34,343 | 1,433,820 |
PNC Financial Services Group, Inc. | 9,553 | 468,097 |
Synovus Financial Corp. (a) | 49,923 | 414,361 |
Wells Fargo & Co. | 39,979 | 1,178,581 |
| 3,494,859 |
|
Shares
| Value ($) |
| |
Consumer Finance 0.5% |
Capital One Financial Corp. | 16,821 | 536,422 |
Diversified Financial Services 2.8% |
Bank of America Corp. | 40,787 | 574,281 |
JPMorgan Chase & Co. | 49,502 | 1,560,798 |
NYSE Euronext | 42,876 | 1,173,945 |
| 3,309,024 |
Insurance 5.8% |
ACE Ltd. | 32,384 | 1,713,761 |
Alleghany Corp.* | 2,115 | 596,430 |
Aon Corp. | 29,703 | 1,356,833 |
Arthur J. Gallagher & Co. | 30,672 | 794,711 |
Hartford Financial Services Group, Inc. | 34,747 | 570,546 |
MetLife, Inc. | 17,060 | 594,712 |
PartnerRe Ltd. | 9,029 | 643,497 |
Prudential Financial, Inc. | 20,352 | 615,851 |
| 6,886,341 |
Thrifts & Mortgage Finance 0.5% |
Capitol Federal Financial (a) | 12,711 | 579,622 |
Health Care 15.7% |
Health Care Equipment & Supplies 3.6% |
Baxter International, Inc. | 31,401 | 1,682,780 |
Becton, Dickinson & Co. | 37,318 | 2,552,178 |
| 4,234,958 |
Health Care Providers & Services 2.5% |
Medco Health Solutions, Inc.* | 35,335 | 1,480,890 |
WellPoint, Inc.* | 35,879 | 1,511,582 |
| 2,992,472 |
Life Sciences Tools & Services 1.7% |
Thermo Fisher Scientific, Inc.* | 59,544 | 2,028,664 |
Pharmaceuticals 7.9% |
Abbott Laboratories | 11,304 | 603,294 |
Merck & Co., Inc. | 64,802 | 1,969,981 |
Pfizer, Inc. | 136,969 | 2,425,721 |
Teva Pharmaceutical Industries Ltd. (ADR) (a) | 56,283 | 2,395,967 |
Wyeth | 50,317 | 1,887,391 |
| 9,282,354 |
Industrials 8.7% |
Aerospace & Defense 3.4% |
Honeywell International, Inc. | 66,304 | 2,176,760 |
United Technologies Corp. | 33,943 | 1,819,345 |
| 3,996,105 |
Electrical Equipment 2.2% |
Emerson Electric Co. | 72,781 | 2,664,512 |
Machinery 3.1% |
Dover Corp. | 53,823 | 1,771,853 |
Parker Hannifin Corp. | 43,642 | 1,856,531 |
| 3,628,384 |
|
Shares
| Value ($) |
| |
Information Technology 9.4% |
Communications Equipment 2.4% |
Brocade Communications Systems, Inc.* | 328,090 | 918,652 |
Nokia Oyj (ADR) | 123,145 | 1,921,062 |
| 2,839,714 |
Computers & Peripherals 0.5% |
EMC Corp.* | 57,391 | 600,884 |
Semiconductors & Semiconductor Equipment 3.8% |
Intel Corp. | 129,198 | 1,894,043 |
Taiwan Semiconductor Manufacturing Co., Ltd. (ADR) | 253,605 | 2,003,479 |
Texas Instruments, Inc. | 37,000 | 574,240 |
| 4,471,762 |
Software 2.7% |
Microsoft Corp. | 102,252 | 1,987,779 |
Oracle Corp.* | 71,205 | 1,262,464 |
| 3,250,243 |
Materials 5.5% |
Chemicals 3.4% |
Air Products & Chemicals, Inc. | 41,508 | 2,086,607 |
Praxair, Inc. | 32,038 | 1,901,776 |
| 3,988,383 |
Containers & Packaging 1.4% |
Sonoco Products Co. | 72,823 | 1,686,581 |
Metals & Mining 0.7% |
Freeport-McMoRan Copper & Gold, Inc. | 35,566 | 869,233 |
Telecommunication Services 5.3% |
Diversified Telecommunication Services |
AT&T, Inc. | 119,781 | 3,413,758 |
|
Shares
| Value ($) |
| |
BCE, Inc. | 62,667 | 1,284,047 |
Verizon Communications, Inc. | 45,999 | 1,559,366 |
| 6,257,171 |
Utilities 11.4% |
Electric Utilities 9.1% |
Allegheny Energy, Inc. | 59,022 | 1,998,485 |
Duke Energy Corp. | 128,716 | 1,932,027 |
Entergy Corp. | 13,720 | 1,140,544 |
Exelon Corp. | 15,863 | 882,141 |
FirstEnergy Corp. | 46,472 | 2,257,610 |
FPL Group, Inc. | 31,324 | 1,576,537 |
Southern Co. | 23,997 | 887,889 |
| 10,675,233 |
Multi-Utilities 2.3% |
PG&E Corp. | 71,041 | 2,749,998 |
Total Common Stocks (Cost $139,608,097) | 120,675,191 |
|
Securities Lending Collateral 2.0% |
Daily Assets Fund Institutional, 1.69% (b) (c) (Cost $2,379,975) | 2,379,975 | 2,379,975 |
| % of Net Assets | Value ($) |
| |
Total Investment Portfolio (Cost $141,988,072)+ | 104.1 | 123,055,166 |
Other Assets and Liabilities, Net | (4.1) | (4,818,822) |
Net Assets | 100.0 | 118,236,344 |
* Non-income producing security.+ The cost for federal income tax purposes was $145,375,182. At December 31, 2008, net unrealized depreciation for all securities based on tax cost was $22,320,016. This consisted of aggregate gross unrealized appreciation for all securities in which there was an excess of value over tax cost of $5,597,260 and aggregate gross unrealized depreciation for all securities in which there was an excess of tax cost over value of $27,917,276.(a) All or a portion of these securities were on loan (see Notes to Financial Statements). The value of all securities loaned at December 31, 2008 amounted to $2,357,044 which is 2.0% of net assets.(b) Affiliated fund managed by Deutsche Investment Management Americas Inc. The rate shown is the annualized seven-day yield at period end.(c) Represents collateral held in connection with securities lending. Income earned by the Portfolio is net of borrower rebates.ADR: American Depositary Receipt
Fair Value Measurements
The following is a summary of the inputs used as of December 31, 2008 in valuing the Portfolio's investments. For information on the Portfolio's policy regarding the valuation of investments and of the valuation inputs, and the aggregate levels used in the table below, please refer to the Security Valuation section of Note A in the accompanying Notes to the Financial Statements.
Valuation Inputs | Investments in Securities |
Level 1
| $ 123,055,166 |
Level 2
| — |
Level 3
| — |
Total | $ 123,055,166 |
The accompanying notes are an integral part of the financial statements.
Financial Statements
Statement of Assets and Liabilities as of December 31, 2008
|
Assets |
Investments:
Investments in securities, at value (cost $139,608,097) — including $2,357,044 of securities loaned | $ 120,675,191 |
Investment in Daily Assets Fund Institutional (cost $2,379,975)* | 2,379,975 |
Total investments, at value (cost $141,988,072)
| 123,055,166 |
Cash
| 39,788 |
Dividends receivable
| 274,190 |
Interest receivable
| 4,062 |
Receivable for Portfolio shares sold
| 1,133,615 |
Due from Advisor
| 154 |
Other assets
| 5,215 |
Total assets
| 124,512,190 |
Liabilities |
Notes payable
| 750,000 |
Payable upon return of securities loaned
| 2,379,975 |
Payable for Portfolio shares redeemed
| 297,616 |
Payable for investments purchased
| 2,615,687 |
Accrued management fee
| 61,803 |
Other accrued expenses and payables
| 170,765 |
Total liabilities
| 6,275,846 |
Net assets, at value | $ 118,236,344 |
Net Assets Consist of |
Undistributed net investment income
| 2,799,366 |
Net unrealized appreciation (depreciation) on:
Investments | (18,932,906) |
Foreign currency | (366) |
Accumulated net realized gain (loss)
| (28,851,060) |
Paid-in capital
| 163,221,310 |
Net assets, at value | $ 118,236,344 |
Class A Net Asset Value, offering and redemption price per share ($117,944,074 ÷ 13,220,277 outstanding shares of beneficial interest, $.01 par value, unlimited number of shares authorized)
| $ 8.92 |
Class B Net Asset Value, offering and redemption price per share ($292,270 ÷ 32,776 outstanding shares of beneficial interest, $.01 par value, unlimited number of shares authorized)
| $ 8.92 |
* Represents collateral on securities loaned.The accompanying notes are an integral part of the financial statements.
Statement of Operations for the year ended December 31, 2008
|
Investment Income |
Income:
Dividends (net of foreign taxes withheld of $60,124)
| $ 4,272,348 |
Interest — Cash Management QP Trust
| 261,072 |
Securities lending income, including income from Daily Assets Fund Institutional, net of borrower rebates
| 49,531 |
Total Income
| 4,582,951 |
Expenses:
Management fee
| 1,214,541 |
Administration fee
| 186,852 |
Services to shareholders
| 297 |
Custodian fee
| 15,698 |
Professional fees
| 63,000 |
Distribution service fee (Class B)
| 6,151 |
Record keeping fees (Class B)
| 2,582 |
Trustees' fees and expenses
| 20,856 |
Reports to shareholders and shareholder meeting
| 115,320 |
Interest expense
| 197 |
Other
| 6,781 |
Total expenses before expense reductions
| 1,632,275 |
Expense reductions
| (11,364) |
Total expenses after expense reductions
| 1,620,911 |
Net investment income (loss) | 2,962,040 |
Realized and Unrealized Gain (Loss) |
Net realized gain (loss) from:
Investments
| (26,827,361) |
Foreign currency
| (13,387) |
| (26,840,748) |
Change in net unrealized appreciation (depreciation) on:
Investments
| (52,635,232) |
Foreign currency
| (430) |
| (52,635,662) |
Net gain (loss) | (79,476,410) |
Net increase (decrease) in net assets resulting from operations | $ (76,514,370) |
The accompanying notes are an integral part of the financial statements.
Statement of Changes in Net Assets |
| Years Ended December 31, |
Increase (Decrease) in Net Assets | 2008 | 2007 |
Operations:
Net investment income (loss)
| $ 2,962,040 | $ 4,055,644 |
Net realized gain (loss)
| (26,840,748) | 52,371,462 |
Change in net unrealized appreciation (depreciation)
| (52,635,662) | (20,593,300) |
Net increase (decrease) in net assets resulting from operations
| (76,514,370) | 35,833,806 |
Distributions to shareholders from:
Net investment income:
Class A | (3,899,692) | (4,770,707) |
Class B | (108,225) | (538,814) |
Net realized gains:
Class A | (50,886,890) | (9,924,139) |
Class B | (1,761,177) | (1,431,558) |
Total Distributions
| $ (56,655,984) | $ (16,665,218) |
Portfolio share transactions:
Class A Proceeds from shares sold
| 23,340,147 | 14,988,182 |
Reinvestment of distributions
| 54,786,582 | 14,694,846 |
Cost of shares redeemed
| (58,393,451) | (93,544,614) |
Net increase (decrease) in net assets from Class A share transactions
| 19,733,278 | (63,861,586) |
Class B Proceeds from shares sold
| 480,950 | 699,209 |
Reinvestment of distributions
| 1,869,402 | 1,970,372 |
Cost of shares redeemed
| (7,955,451) | (35,609,682) |
Net increase (decrease) in net assets from Class B share transactions
| (5,605,099) | (32,940,101) |
Increase (decrease) in net assets | (119,042,175) | (77,633,099) |
Net assets at beginning of period
| 237,278,519 | 314,911,618 |
Net assets at end of period (including undistributed net investment income of $2,799,366 and $3,977,565, respectively)
| $ 118,236,344 | $ 237,278,519 |
Other Information |
Class A Shares outstanding at beginning of period
| 11,941,625 | 15,303,964 |
Shares sold
| 1,675,530 | 804,074 |
Shares issued to shareholders in reinvestment of distributions
| 4,201,425 | 857,842 |
Shares redeemed
| (4,598,303) | (5,024,255) |
Net increase (decrease) in Class A shares
| 1,278,652 | (3,362,339) |
Shares outstanding at end of period
| 13,220,277 | 11,941,625 |
Class B Shares outstanding at beginning of period
| 412,771 | 2,232,310 |
Shares sold
| 38,113 | 38,354 |
Shares issued to shareholders in reinvestment of distributions
| 143,030 | 114,823 |
Shares redeemed
| (561,138) | (1,972,716) |
Net increase (decrease) in Class B shares
| (379,995) | (1,819,539) |
Shares outstanding at end of period
| 32,776 | 412,771 |
The accompanying notes are an integral part of the financial statements.
Financial Highlights
Class A Years Ended December 31, | 2008 | 2007 | 2006 | 2005 | 2004 |
Selected Per Share Data |
Net asset value, beginning of period | $ 19.21 | $ 17.96 | $ 15.81 | $ 15.79 | $ 14.57 |
Income (loss) from investment operations: Net investment income (loss)a | .21 | .26 | .29c | .26 | .27 |
Net realized and unrealized gain (loss) | (5.68) | 1.98 | 2.12 | .04 | 1.18 |
Total from investment operations | (5.47) | 2.24 | 2.41 | .30 | 1.45 |
Less distributions from: Net investment income | (.34) | (.32) | (.26) | (.28) | (.23) |
Net realized gains | (4.48) | (.67) | — | — | — |
Total Distributions | (4.82) | (.99) | (.26) | (.28) | (.23) |
Net asset value, end of period | $ 8.92 | $ 19.21 | $ 17.96 | $ 15.81 | $ 15.79 |
Total Return (%)
| (36.40)b | 13.15b,d | 15.41c | 1.97b | 10.07 |
Ratios to Average Net Assets and Supplemental Data |
Net assets, end of period ($ millions)
| 118 | 229 | 275 | 268 | 274 |
Ratio of expenses before expense reductions (%)
| .87 | .83 | .83 | .80 | .80 |
Ratio of expenses after expense reductions (%)
| .86 | .82 | .83 | .80 | .80 |
Ratio of net investment income (loss) (%)
| 1.59 | 1.43 | 1.73c | 1.64 | 1.84 |
Portfolio turnover rate (%)
| 97 | 103 | 76 | 64 | 40 |
a Based on average shares outstanding during the period.
b Total return would have been lower had certain expenses not been reduced.
c Includes non-recurring income from the Advisor recorded as a result of an administrative proceeding regarding disclosure of brokerage allocation practices in connection with sales of DWS Funds. The non-recurring income resulted in an increase in net investment income of $0.008 per share and an increase in the ratio of net investment income of 0.04%. Excluding this non-recurring income, total return would have been 0.04% lower.
d Includes a reimbursement from the Advisor to reimburse the effect of losses incurred as the result of certain operation errors during the period. Excluding this reimbursement, total return would have been 0.04% lower.
|
Class B Years Ended December 31, | 2008 | 2007 | 2006 | 2005 | 2004 |
Selected Per Share Data |
Net asset value, beginning of period | $ 19.20 | $ 17.94 | $ 15.79 | $ 15.77 | $ 14.55 |
Income (loss) from investment operations: Net investment income (loss)a | .12 | .19 | .23c | .19 | .22 |
Net realized and unrealized gain (loss) | (5.64) | 1.99 | 2.11 | .05 | 1.17 |
Total from investment operations | (5.52) | 2.18 | 2.34 | .24 | 1.39 |
Less distributions from: Net investment income | (.28) | (.25) | (.19) | (.22) | (.17) |
Net realized gains | (4.48) | (.67) | — | — | — |
Total Distributions | (4.76) | (.92) | (.19) | (.22) | (.17) |
Net asset value, end of period | $ 8.92 | $ 19.20 | $ 17.94 | $ 15.79 | $ 15.77 |
Total Return (%)
| (36.64)b | 12.77b,d | 14.96c | 1.58b | 9.65 |
Ratios to Average Net Assets and Supplemental Data |
Net assets, end of period ($ millions)
| .29 | 8 | 40 | 40 | 40 |
Ratio of expenses before expense reductions (%)
| 1.28 | 1.21 | 1.21 | 1.21 | 1.18 |
Ratio of expenses after expense reductions (%)
| 1.26 | 1.20 | 1.21 | 1.20 | 1.18 |
Ratio of net investment income (loss) (%)
| 1.20 | 1.06 | 1.35c | 1.24 | 1.46 |
Portfolio turnover rate (%)
| 97 | 103 | 76 | 64 | 40 |
a Based on average shares outstanding during the period.
b Total return would have been lower had certain expenses not been reduced.
c Includes non-recurring income from the Advisor recorded as a result of an administrative proceeding regarding disclosure of brokerage allocation practices in connection with sales of DWS Funds. The non-recurring income resulted in an increase in net investment income of $0.008 per share and an increase in the ratio of net investment income of 0.04%. Excluding this non-recurring income, total return would have been 0.04% lower.
d Includes a reimbursement from the Advisor to reimburse the effect of losses incurred as the result of certain operation errors during the period. Excluding this reimbursement, total return would have been 0.04% lower.
|
Performance Summary December 31, 2008
DWS Mid Cap Growth VIP
All performance shown is historical, assumes reinvestment of all dividend and capital gain distributions and does not guarantee future results. Investment return and principal value fluctuate with changing market conditions so that, when redeemed, shares may be worth more or less than their original cost. Current performance may be lower or higher than the performance data quoted. Please contact your participating insurance company for the Portfolio's most recent month-end performance. Performance doesn't reflect charges and fees ("contract charges") associated with the separate account that invests in the Portfolio or any variable life insurance policy or variable annuity contract for which the Portfolio is an investment option. These charges and fees will reduce returns. While all share classes have the same underlying portfolio, their performance will differ.
The total annual Portfolio operating expense ratios, gross of any fee waivers or expense reimbursements, as stated in the fee table of the prospectus dated May 1, 2008 are 0.95% and 1.20% for Class A and Class B shares, respectively. Please see the Information About Your Portfolio's Expenses, the Financial Highlights and Notes to the Financial Statements (Note C, Related Parties) sections of this report for gross and net expense related disclosure for the period ended December 31, 2008.
Risk Considerations
This Portfolio is subject to stock market risk, meaning stocks in the Portfolio may decline in value for extended periods of time due to the activities and financial prospects of individual companies, or due to general market and economic conditions. Stocks of medium-sized companies involve greater risk than securities of larger, more established companies, as they often have limited product lines, markets or financial resources and may be subject to more-erratic and more-abrupt market movements. Please read this Portfolio's prospectus for specific details regarding its investments and risk profile.
Portfolio returns shown for all periods reflect a fee waiver and/or expense reimbursement. Without this waiver/reimbursement, returns would have been lower.
Growth of an Assumed $10,000 Investment in DWS Mid Cap Growth VIP from 5/1/1999 to 12/31/2008 |
[] DWS Mid Cap Growth VIP — Class A [] Russell Midcap® Growth Index | Russell Midcap® Growth Index is an unmanaged index that measures the performance of those Russell Midcap companies with higher price-to-book ratios and higher forecasted growth values. The stocks are also members of the Russell 1000® Growth Index. Index returns assume reinvestment of dividends and, unlike portfolio returns, do not reflect any fees or expenses. It is not possible to invest directly into an index. |
 | |
Yearly periods ended December 31 |
|
Comparative Results |
DWS Mid Cap Growth VIP | 1-Year | 3-Year | 5-Year | Life of Portfolio* |
Class A | Growth of $10,000
| $4,996 | $6,007 | $7,181 | $6,947 |
Average annual total return
| -50.04% | -15.62% | -6.41% | -3.70% |
Russell Midcap Growth Index
| Growth of $10,000
| $5,568 | $6,865 | $8,887 | $9,077 |
Average annual total return
| -44.32% | -11.79% | -2.33% | -1.00% |
DWS Mid Cap Growth VIP | 1-Year | 3-Year | 5-Year | Life of Class** |
Class B | Growth of $10,000
| $4,974 | $5,934 | $7,049 | $8,937 |
Average annual total return
| -50.04% | -15.97% | -6.76% | -1.71% |
Russell Midcap Growth Index
| Growth of $10,000
| $5,568 | $6,865 | $8,887 | $11,466 |
Average annual total return
| -44.32% | -11.79% | -2.33% | 2.13% |
The growth of $10,000 is cumulative.
* The Portfolio commenced operations on May 1, 1999. Index returns began on April 30, 1999.** The Portfolio commenced offering Class B shares on July 1, 2002. Index returns began on June 30, 2002.Information About Your Portfolio's Expenses
DWS Mid Cap Growth VIP
As an investor of the Portfolio, you incur two types of costs: ongoing expenses and transaction costs. Ongoing expenses include management fees, distribution and service (12b-1) fees and other Portfolio expenses. Examples of transaction costs include contract charges, redemption fees and account maintenance fees, which are not shown in this section. The following tables are intended to help you understand your ongoing expenses (in dollars) of investing in the Portfolio and to help you compare these expenses with the ongoing expenses of investing in other mutual funds. In the most recent six-month period, the Portfolio limited these expenses; had it not done so, expenses would have been higher. The example in the table is based on an investment of $1,000 invested at the beginning of the six-month period and held for the entire period (July 1, 2008 to December 31, 2008) .
The tables illustrate your Portfolio's expenses in two ways:
• Actual Portfolio Return. This helps you estimate the actual dollar amount of ongoing expenses (but not transaction costs) paid on a $1,000 investment in the Portfolio using the Portfolio's actual return during the period. To estimate the expenses you paid over the period, simply divide your account value by $1,000 (for example, an $8,600 account value divided by $1,000 = 8.6), then multiply the result by the number in the "Expenses Paid per $1,000" line under the share class you hold.
• Hypothetical 5% Portfolio Return. This helps you to compare your Portfolio's ongoing expenses (but not transaction costs) with those of other mutual funds using the Portfolio's actual expense ratio and a hypothetical rate of return of 5% per year before expenses. Examples using a 5% hypothetical Portfolio return may be found in the shareholder reports of other mutual funds. The hypothetical account values and expenses may not be used to estimate the actual ending account balance or expenses you paid for the period.
Please note that the expenses shown in these tables are meant to highlight your ongoing expenses only and do not reflect any transaction costs. The "Expenses Paid per $1,000" line of the tables is useful in comparing ongoing expenses only and will not help you determine the relative total expense of owning different funds. If these transaction costs had been included, your costs would have been higher.
Expenses and Value of a $1,000 Investment for the six months ended December 31, 2008 |
Actual Portfolio Return | Class A | | Class B | |
Beginning Account Value 7/1/08
| $ 1,000.00 | | $ 1,000.00 | |
Ending Account Value 12/31/08
| $ 554.20 | | $ 552.00 | |
Expenses Paid per $1,000*
| $ 4.06 | | $ 6.20 | |
Hypothetical 5% Portfolio Return | Class A | | Class B | |
Beginning Account Value 7/1/08
| $ 1,000.00 | | $ 1,000.00 | |
Ending Account Value 12/31/08
| $ 1,019.91 | | $ 1,017.14 | |
Expenses Paid per $1,000*
| $ 5.28 | | $ 8.06 | |
* Expenses are equal to the Portfolio's annualized expense ratio for each share class, multiplied by the average account value over the period, multiplied by the number of days in the most recent six-month period, then divided by 366.Annualized Expense Ratios | Class A | | Class B | |
DWS Variable Series II — DWS Mid Cap Growth VIP
| 1.04% | | 1.59% | |
For more information, please refer to the Portfolio's prospectus.
These tables do not reflect charges and fees ("contract charges") associated with the separate account that invests in the Portfolio of any variable life insurance policy or variable annuity contract for which the Portfolio is an investment option.
Management Summary December 31, 2008
DWS Mid Cap Growth VIP
The past year has proven to be the most difficult period for global financial markets since the 1930s, with virtually all market indices posting decisively negative results. The bursting of the US housing market bubble set in motion a chain of events that culminated late last summer in the near paralysis of the global financial system. These events led to a widening in credit spreads and a complete seize-up of credit-related activity.1 As the crisis grew, and market volatility hit an all-time high, the federal government intervened to prevent the failure of once venerable institutions such as AIG, Fannie Mae and Freddie Mac. The growing inability of businesses and consumers to access credit led to a sharp contraction in global economic activity by the fourth quarter. Central banks around the world cut key interest rates in an effort to jump-start economic activity. Determined not to repeat the policy errors that led to the Great Depression, the US Federal Reserve Board (the Fed) gradually lowered its target for short-term interest rates to a range between 0% and 0.25%, and has aggressively used its balance sheet to provide credit market liquidity. President-elect Obama has called the revival of the economy his first priority, and the new administration intends to implement a huge fiscal stimulus plan.
For the 12-month period ended December 31, 2008, the Portfolio returned -50.04% (Class A shares, unadjusted for contract charges), compared with the -44.32% return of the Russell Midcap® Growth Index.
Positive contributors to performance for the 12-month period included an overweight position in telecom services and underweight positions in utilities and materials.2 Stock selection was positive in the energy and utilities sectors but was offset by unfavorable stock selection within financials, industrials, health care and consumer staples. Individual detractors from performance included Affiliated Managers Group, Inc.* in the financials sector, and BE Aerospace, Inc.* from the industrials sector. Within the energy and utilities sectors, respectively, the Portfolio's holdings in Southwestern Energy Co. and Constellation Energy Group, Inc.* contributed to performance. We continue to maintain a long-term perspective, investing in quality mid-cap growth stocks.
Joseph Axtell, CFA Rafaelina M. Lee Jeffrey Saeger, CFA
Portfolio Managers, Deutsche Investment Management Americas Inc.
The Russell Midcap Growth Index is an unmanaged index that measures the performance of those Russell Midcap companies with higher price-to-book ratios and higher forecasted growth values. The stocks are also members of the Russell 1000® Growth Index. Index returns assume reinvestment of dividends and, unlike portfolio returns, do not reflect any fees or expenses. It is not possible to invest directly into an index.
1 Credit spread is the additional yield provided by non-Treasury fixed-income securities versus Treasury securities.2 "Overweight" means the portfolio holds a higher weighting in a given sector or security than the benchmark. "Underweight" means the portfolio holds a lower weighting.* Not held in the Portfolio as of December 31, 2008.Portfolio management market commentary is as of December 31, 2008, and may not come to pass. This information is subject to change at any time based on market and other conditions. Past performance does not guarantee future results. Current and future portfolio holdings are subject to risk.
Portfolio Summary
DWS Mid Cap Growth VIP
Asset Allocation (As a% of Investment Portfolio Excluding Securities Lending Collateral) | 12/31/08 | 12/31/07 |
| | |
Common Stocks | 97% | 99% |
Cash Equivalents | 3% | 1% |
| 100% | 100% |
Sector Diversification (As a % of Common Stocks) | 12/31/08 | 12/31/07 |
| | |
Information Technology | 22% | 26% |
Health Care | 17% | 12% |
Consumer Discretionary | 17% | 14% |
Industrials | 13% | 18% |
Energy | 10% | 11% |
Financials | 8% | 9% |
Materials | 4% | 3% |
Consumer Staples | 4% | 2% |
Telecommunication Services | 3% | 5% |
Utilities | 2% | — |
| 100% | 100% |
Asset allocation and sector diversification are subject to change.
For more complete details about the Portfolio's investment portfolio, see page 210. A complete list of portfolio holdings of the portfolio is posted as of the month end on www.dws-investments.com on or about the 15th day of the following month. More frequent posting of portfolio holdings information may be made from time to time on www.dws-investments.com.
Following the Portfolio's fiscal first and third quarter-end, a complete portfolio holdings listing is filed with the SEC on Form N-Q. The form will be available on the SEC's Web site at www.sec.gov, and it also may be reviewed and copied at the SEC's Public Reference Room in Washington, D.C. Information on the operation of the SEC's Public Reference Room may be obtained by calling (800) SEC-0330.
Investment Portfolio December 31, 2008
DWS Mid Cap Growth VIP
| Shares | Value ($) |
| |
Common Stocks 97.1% |
Consumer Discretionary 16.5% |
Diversified Consumer Services 1.1% |
Strayer Education, Inc. (a) | 900 | 192,969 |
Hotels Restaurants & Leisure 1.6% |
Darden Restaurants, Inc. (a) | 10,200 | 287,436 |
Internet & Catalog Retail 1.5% |
Priceline.com, Inc.* (a) | 3,850 | 283,552 |
Specialty Retail 9.9% |
American Eagle Outfitters, Inc. (a) | 21,000 | 196,560 |
Children's Place Retail Stores, Inc.* (a) | 17,500 | 379,400 |
Guess?, Inc. | 28,400 | 435,940 |
Limited Brands, Inc. | 17,800 | 178,712 |
Tiffany & Co. (a) | 5,600 | 132,328 |
Urban Outfitters, Inc.* (a) | 33,300 | 498,834 |
| 1,821,774 |
Textiles, Apparel & Luxury Goods 2.4% |
Deckers Outdoor Corp.* | 2,500 | 199,675 |
Lululemon Athletica, Inc.* (a) | 12,500 | 99,125 |
Polo Ralph Lauren Corp. (a) | 3,000 | 136,230 |
| 435,030 |
Consumer Staples 3.6% |
Personal Products |
Herbalife Ltd. | 22,500 | 487,800 |
NBTY, Inc.* | 10,500 | 164,325 |
| 652,125 |
Energy 10.1% |
Energy Equipment & Services 3.1% |
Cameron International Corp.* | 9,000 | 184,500 |
CARBO Ceramics, Inc. (a) | 6,100 | 216,733 |
FMC Technologies, Inc.* | 7,500 | 178,725 |
| 579,958 |
Oil, Gas & Consumable Fuels 7.0% |
Alpha Natural Resources, Inc.* | 5,600 | 90,664 |
Petrohawk Energy Corp.* | 16,500 | 257,895 |
Range Resources Corp. | 7,500 | 257,925 |
Southwestern Energy Co.* | 13,000 | 376,610 |
Ultra Petroleum Corp.* (a) | 8,530 | 294,370 |
| 1,277,464 |
Financials 7.3% |
Capital Markets 5.5% |
Northern Trust Corp. | 3,500 | 182,490 |
T. Rowe Price Group, Inc. (a) | 9,700 | 343,768 |
TD Ameritrade Holding Corp.* (a) | 19,100 | 272,175 |
Waddell & Reed Financial, Inc. "A" | 13,700 | 211,802 |
| 1,010,235 |
Diversified Financial Services 1.8% |
MSCI, Inc. "A"* | 18,164 | 322,593 |
| Shares | Value ($) |
| |
Health Care 16.9% |
Biotechnology 2.6% |
Alexion Pharmaceuticals, Inc.* (a) | 1,200 | 43,428 |
BioMarin Pharmaceutical, Inc.* (a) | 3,000 | 53,400 |
Cephalon, Inc.* (a) | 3,700 | 285,048 |
Genzyme Corp.* | 1,400 | 92,918 |
| 474,794 |
Health Care Providers & Services 5.7% |
AMERIGROUP Corp.* | 10,700 | 315,864 |
Humana, Inc.* | 4,700 | 175,216 |
McKesson Corp. | 7,500 | 290,475 |
Pediatrix Medical Group, Inc.* (a) | 8,400 | 266,280 |
| 1,047,835 |
Life Sciences Tools & Services 4.4% |
Covance, Inc.* | 4,900 | 225,547 |
Pharmaceutical Product Development, Inc. | 20,100 | 583,101 |
| 808,648 |
Pharmaceuticals 4.2% |
Mylan, Inc.* (a) | 56,700 | 560,763 |
Shire PLC (ADR) (a) | 4,800 | 214,944 |
| 775,707 |
Industrials 12.5% |
Aerospace & Defense 1.5% |
Curtiss-Wright Corp. | 8,400 | 280,476 |
Construction & Engineering 0.8% |
Aecom Technology Corp.* | 4,700 | 144,431 |
Electrical Equipment 3.3% |
First Solar, Inc.* (a) | 1,500 | 206,940 |
Roper Industries, Inc. (a) | 9,150 | 397,202 |
| 604,142 |
Machinery 2.3% |
Harsco Corp. | 8,600 | 238,048 |
Joy Global, Inc. (a) | 8,000 | 183,120 |
| 421,168 |
Professional Services 4.6% |
FTI Consulting, Inc.* (a) | 2,900 | 129,572 |
Huron Consulting Group, Inc.* (a) | 7,000 | 400,890 |
Robert Half International, Inc. (a) | 15,200 | 316,464 |
| 846,926 |
Information Technology 21.3% |
Communications Equipment 5.3% |
Ciena Corp.* (a) | 43,800 | 293,460 |
F5 Networks, Inc.* (a) | 16,200 | 370,332 |
Juniper Networks, Inc.* (a) | 17,800 | 311,678 |
| 975,470 |
Electronic Equipment, Instruments & Components 1.7% |
Itron, Inc.* (a) | 4,850 | 309,139 |
Internet Software & Services 2.7% |
Omniture, Inc.* (a) | 23,000 | 244,720 |
VeriSign, Inc.* | 13,200 | 251,856 |
| 496,576 |
| Shares | Value ($) |
| |
IT Services 0.5% |
ManTech International Corp. "A"* | 1,800 | 97,542 |
Semiconductors & Semiconductor Equipment 4.5% |
Broadcom Corp. "A"* | 19,000 | 322,430 |
Marvell Technology Group Ltd.* | 27,600 | 184,092 |
Microchip Technology, Inc. (a) | 8,900 | 173,817 |
Tessera Technologies, Inc.* | 12,000 | 142,560 |
| 822,899 |
Software 6.6% |
Adobe Systems, Inc.* | 8,300 | 176,707 |
Autodesk, Inc.* | 10,600 | 208,290 |
Blackboard, Inc.* (a) | 11,300 | 296,399 |
Concur Technologies, Inc.* (a) | 6,300 | 206,766 |
Electronic Arts, Inc.* | 8,000 | 128,320 |
Salesforce.com, Inc.* (a) | 6,000 | 192,060 |
| 1,208,542 |
Materials 4.1% |
Chemicals 0.9% |
Intrepid Potash, Inc.* (a) | 8,200 | 170,314 |
Construction Materials 0.7% |
Martin Marietta Materials, Inc. (a) | 1,400 | 135,912 |
Containers & Packaging 1.0% |
Owens-Illinois, Inc.* | 6,800 | 185,844 |
Metals & Mining 1.5% |
Gerdau Ameristeel Corp. | 44,000 | 266,640 |
| Shares | Value ($) |
| |
Telecommunication Services 2.8% |
Wireless Telecommunication Services |
American Tower Corp. "A"* | 17,200 | 504,304 |
Utilities 2.0% |
Electric Utilities |
Allegheny Energy, Inc. | 11,100 | 375,846 |
Total Common Stocks (Cost $23,178,904) | 17,816,291 |
|
Securities Lending Collateral 30.3% |
Daily Assets Fund Institutional, 1.69% (b) (c) (Cost $5,559,666) | 5,559,666 | 5,559,666 |
|
Cash Equivalents 2.9% |
Cash Management QP Trust, 1.42% (b) (Cost $528,882) | 528,882 | 528,882 |
| % of Net Assets | Value ($) |
| |
Total Investment Portfolio (Cost $29,267,452)+ | 130.3 | 23,904,839 |
Other Assets and Liabilities, Net (a) | (30.3) | (5,556,900) |
Net Assets | 100.0 | 18,347,939 |
* Non-income producing security.+ The cost for federal income tax purposes was $29,521,967. At December 31, 2008, net unrealized depreciation for all securities based on tax cost was $5,617,128. This consisted of aggregate gross unrealized appreciation for all securities in which there was an excess of value over tax cost of $798,063 and aggregate gross unrealized depreciation for all securities in which there was an excess of tax cost over value of $6,415,191.(a) All or a portion of these securities were on loan amounting to $5,557,998 (see Notes to Financial Statements). In addition, included in other assets and liabilities, net is a pending sale, amounting to $13,097, that is also on loan. The value of all securities loaned at December 31, 2008 amounted to $5,571,095, which is 30.4% of net assets.(b) Affiliated fund managed by Deutsche Investment Management Americas Inc. The rate shown is the annualized seven-day yield at period end.(c) Represents collateral held in connection with securities lending. Income earned by the Portfolio is net of borrower rebates.ADR: American Depositary Receipt
Fair Value Measurements
The following is a summary of the inputs used as of December 31, 2008 in valuing the Portfolio's investments. For information on the Portfolio's policy regarding the valuation of investments and of the valuation inputs, and the aggregate levels used in the table below, please refer to the Security Valuation section of Note A in the accompanying Notes to the Financial Statements.
Valuation Inputs | Investments in Securities |
Level 1
| $ 23,375,957 |
Level 2
| 528,882 |
Level 3
| — |
Total | $ 23,904,839 |
The accompanying notes are an integral part of the financial statements.
Financial Statements
Statement of Assets and Liabilities as of December 31, 2008
|
Assets |
Investments:
Investments in securities, at value (cost $23,178,904) — including $5,557,998 of securities loaned | $ 17,816,291 |
Investment in Daily Assets Fund Institutional (cost $5,559,666)* | 5,559,666 |
Investment in Cash Management QP Trust (cost $528,882) | 528,882 |
Total investments, at value (cost $29,267,452)
| 23,904,839 |
Cash
| 4,522 |
Receivable for investments sold
| 46,802 |
Receivable for Portfolio shares sold
| 28,503 |
Dividends receivable
| 10,780 |
Interest receivable
| 8,020 |
Due from Advisor
| 92 |
Other assets
| 1,117 |
Total assets
| 24,004,675 |
Liabilities |
Payable for Portfolio shares redeemed
| 1,063 |
Payable upon return of securities loaned
| 5,559,666 |
Accrued management fee
| 13,397 |
Other accrued expenses and payables
| 82,610 |
Total liabilities
| 5,656,736 |
Net assets, at value | $ 18,347,939 |
Net Assets Consist of |
Accumulated net investment loss
| (4,978) |
Net unrealized appreciation (depreciation) on
investments
| (5,362,613) |
Accumulated net realized gain (loss)
| (24,846,885) |
Paid-in capital
| 48,562,415 |
Net assets, at value | $ 18,347,939 |
Class A Net Asset Value, offering and redemption price per share ($18,326,779 ÷ 2,694,618 outstanding shares of beneficial interest, $.01 par value, unlimited number of shares authorized)
| $ 6.80 |
Class B Net Asset Value, offering and redemption price per share ($21,160 ÷ 3,171 outstanding shares of beneficial interest, $.01 par value, unlimited number of shares authorized)
| $ 6.67 |
* Represents collateral on securities loaned.The accompanying notes are an integral part of the financial statements.
Statement of Operations for the year ended December 31, 2008
|
Investment Income |
Dividends (net of foreign taxes withheld of $3,370)
| $ 183,829 |
Interest — Cash Management QP Trust
| 18,417 |
Securities lending income, including income from Daily Assets Fund Institutional, net of borrower rebates
| 97,401 |
Total Income
| 299,647 |
Expenses:
Management fee
| 252,379 |
Administration fee
| 21,460 |
Services to shareholders
| 154 |
Custodian and accounting fees
| 30,531 |
Distribution service fee (Class B)
| 1,412 |
Record keeping fees (Class B)
| 571 |
Legal
| 11,231 |
Audit and tax fees
| 50,159 |
Trustees' fees and expenses
| 6,241 |
Reports to shareholders and shareholder meeting
| 47,095 |
Other
| 2,891 |
Total expenses before expense reductions
| 424,124 |
Expense reductions
| (54,105) |
Total expenses after expense reductions
| 370,019 |
Net investment income (loss) | (70,372) |
Realized and Unrealized Gain (Loss) |
Net realized gain (loss) from investments
| (4,292,837) |
Change in net unrealized appreciation (depreciation) on investments
| (17,648,743) |
Net gain (loss) | (21,941,580) |
Net increase (decrease) in net assets resulting from operations | $ (22,011,952) |
The accompanying notes are an integral part of the financial statements.
Statement of Changes in Net Assets |
| Years Ended December 31, |
Increase (Decrease) in Net Assets | 2008 | 2007 |
Operations:
Net investment income (loss)
| $ (70,372) | $ (238,874) |
Net realized gain (loss)
| (4,292,837) | 8,021,447 |
Change in net unrealized appreciation (depreciation)
| (17,648,743) | (2,652,715) |
Net increase (decrease) in net assets resulting from operations
| (22,011,952) | 5,129,858 |
Portfolio share transactions:
Class A Proceeds from shares sold
| 3,106,392 | 7,675,878 |
Cost of shares redeemed
| (13,526,182) | (14,497,003) |
Net increase (decrease) in net assets from Class A share transactions
| (10,419,790) | (6,821,125) |
Class B Proceeds from shares sold
| 46,809 | 1,053,940 |
Cost of shares redeemed
| (1,840,021) | (7,779,098) |
Net increase (decrease) in net assets from Class B share transactions
| (1,793,212) | (6,725,158) |
Increase (decrease) in net assets | (34,224,954) | (8,416,425) |
Net assets at beginning of period
| 52,572,893 | 60,989,318 |
Net assets at end of period (including accumulated net investment loss of $4,978 and $6,766, respectively)
| $ 18,347,939 | $ 52,572,893 |
Other Information |
Class A Shares outstanding at beginning of period
| 3,720,929 | 4,226,008 |
Shares sold
| 300,045 | 567,035 |
Shares redeemed
| (1,326,356) | (1,072,114) |
Net increase (decrease) in Class A shares
| (1,026,311) | (505,079) |
Shares outstanding at end of period
| 2,694,618 | 3,720,929 |
Class B Shares outstanding at beginning of period
| 145,552 | 640,328 |
Shares sold
| 4,043 | 79,290 |
Shares redeemed
| (146,424) | (574,066) |
Net increase (decrease) in Class B shares
| (142,381) | (494,776) |
Shares outstanding at end of period
| 3,171 | 145,552 |
The accompanying notes are an integral part of the financial statements.
Financial Highlights
Class A Years Ended December 31, | 2008 | 2007 | 2006 | 2005 | 2004 |
Selected Per Share Data |
Net asset value, beginning of period | $ 13.61 | $ 12.56 | $ 11.32 | $ 9.84 | $ 9.46 |
Income (loss) from investment operations: Net investment income (loss)a | (.02) | (.05) | (.06)c | (.05) | (.01) |
Net realized and unrealized gain (loss) | (6.79) | 1.10 | 1.30 | 1.53 | .39 |
Total from investment operations | (6.81) | 1.05 | 1.24 | 1.48 | .38 |
Net asset value, end of period | $ 6.80 | $ 13.61 | $ 12.56 | $ 11.32 | $ 9.84 |
Total Return (%)b
| (50.04) | 8.36 | 10.95c | 15.04 | 4.02 |
Ratios to Average Net Assets and Supplemental Data |
Net assets, end of period ($ millions)
| 18 | 51 | 53 | 57 | 53 |
Ratio of expenses before expense reductions (%)
| 1.17 | 1.05 | 1.03 | 1.01 | 1.02 |
Ratio of expenses after expense reductions (%)
| 1.02 | .90 | .93 | .95 | .95 |
Ratio of net investment income (loss) (%)
| (.19) | (.38) | (.51)c | (.45) | (.11) |
Portfolio turnover rate (%)
| 82 | 68 | 46 | 104 | 103 |
a Based on average shares outstanding during the period.
b Total return would have been lower had certain expenses not been reduced.
c Includes non-recurring income from the Advisor recorded as a result of an administrative proceeding regarding disclosure of brokerage allocation practices in connection with sales of DWS Funds. The non-recurring income resulted in an increase in net investment income of $0.003 per share and an increase in the ratio of net investment income of 0.03%. Excluding this non-recurring income, total return would have been 0.03% lower.
|
Class B Years Ended December 31, | 2008 | 2007 | 2006 | 2005 | 2004 |
Selected Per Share Data |
Net asset value, beginning of period | $ 13.35 | $ 12.37 | $ 11.19 | $ 9.76 | $ 9.42 |
Income (loss) from investment operations: Net investment income (loss)a | (.09) | (.10) | (.10)c | (.09) | (.05) |
Net realized and unrealized gain (loss) | (6.59) | 1.08 | 1.28 | 1.52 | .39 |
Total from investment operations | (6.68) | .98 | 1.18 | 1.43 | .34 |
Net asset value, end of period | $ 6.67 | $ 13.35 | $ 12.37 | $ 11.19 | $ 9.76 |
Total Return (%)b
| (50.04) | 7.92 | 10.55c | 14.65 | 3.61 |
Ratios to Average Net Assets and Supplemental Data |
Net assets, end of period ($ millions)
| .02 | 2 | 8 | 7 | 6 |
Ratio of expenses before expense reductions (%)
| 1.68 | 1.43 | 1.42 | 1.40 | 1.41 |
Ratio of expenses after expense reductions (%)
| 1.49 | 1.28 | 1.29 | 1.32 | 1.34 |
Ratio of net investment income (loss) (%)
| (.66) | (.76) | (.87)c | (.82) | (.50) |
Portfolio turnover rate (%)
| 82 | 68 | 46 | 104 | 103 |
a Based on average shares outstanding during the period.
b Total return would have been lower had certain expenses not been reduced.
c Includes non-recurring income from the Advisor recorded as a result of an administrative proceeding regarding disclosure of brokerage allocation practices in connection with sales of DWS Funds. The non-recurring income resulted in an increase in net investment income of $0.003 per share and an increase in the ratio of net investment income of 0.03%. Excluding this non-recurring income, total return would have been 0.03% lower.
|
Performance Summary December 31, 2008
DWS Moderate Allocation VIP
All performance shown is historical, assumes reinvestment of all dividend and capital gain distributions and does not guarantee future results. Investment return and principal value fluctuate with changing market conditions so that, when redeemed, shares may be worth more or less than their original cost. Current performance may be lower or higher than the performance data quoted. Please contact your participating insurance company for the Portfolio's most recent month-end performance. Performance doesn't reflect charges and fees ("contract charges") associated with the separate account that invests in the Portfolio or any variable life insurance policy or variable annuity contract for which the Portfolio is an investment option. These charges and fees will reduce returns.
The total annual Portfolio direct operating expense ratio, gross of any fee waivers or expense reimbursements, as stated in the fee table of the prospectus dated May 1, 2008 is 0.59% for Class B shares. The total Portfolio direct and estimated indirect Underlying DWS Portfolio operating expense ratio, gross of any fee waivers or expense reimbursements, as presented in the fee table of the prospectus dated May 1, 2008 is 1.30% for Class B shares. Please see the Information About Your Portfolio's Expenses, the Financial Highlights and Notes to the Financial Statements (Note C, Related Parties) sections of this report for gross and net expense related disclosure for the period ended December 31, 2008.
Risk Considerations
Diversification does not eliminate risk. The underlying portfolios invest in individual bonds whose yields and market values fluctuate, so that your investment may be worth more or less than its original cost. Bond investments are subject to interest-rate risk such that when interest rates rise, the prices of the bonds, and thus the value of the bond investment, can decline and the investor can lose principal value. In addition, the underlying portfolios are subject to stock market risk, meaning stocks in the Portfolio may decline in value for extended periods of time due to the activities and financial prospects of individual companies, or due to general market and economic conditions. Investing in foreign securities presents certain risks, such as currency fluctuation, political and economic changes, and market risks. Derivatives may be more volatile and less liquid than traditional securities, and the Portfolio could suffer losses on its derivative positions. An investment in underlying money market investments is not insured or guaranteed by the Federal Deposit Insurance Corporation or by any government agency. Although money market investments seek to preserve the value of your investment at $1.00 per share, it is possible to lose money by investing in these investments. Please read this Portfolio's prospectus for specific details regarding its risk profile.
Portfolio returns shown for all periods reflect a fee waiver and/or expense reimbursement. Without this waiver/reimbursement, returns would have been lower.
Growth of an Assumed $10,000 Investment in DWS Moderate Allocation VIP from 8/16/2004 to 12/31/2008 |
[] DWS Moderate Allocation VIP — Class B [] Russell 1000® Index [] Barclays Capital US Aggregate Index | The Russell 1000® Index is an unmanaged Index that measures the performance of the 1,000 largest companies in the Russell 3000® Index, which represents approximately 92% of the total market capitalization of the Russell 3000 Index. Index returns assume reinvestment of dividends and, unlike Portfolio returns, do not reflect any fees or expenses. It is not possible to invest directly into an index. The Barclays Capital US Aggregate Index (name changed from Lehman Brothers US Aggregate Index, effective November 3, 2008) is an unmanaged, market value-weighted measure of Treasury issues, agency issues, corporate bond issues and mortgage securities. Index returns, unlike Portfolio returns, do not reflect any fees or expenses. It is not possible to invest directly into an index. |
 | |
|
|
Comparative Results |
DWS Moderate Allocation VIP | 1-Year | 3-Year | Life of Portfolio* |
Class B | Growth of $10,000
| $6,964 | $8,119 | $9,246 |
Average annual total return
| -30.36% | -6.71% | -1.78% |
Russell 1000 Index
| Growth of $10,000
| $6,240 | $7,621 | $9,005 |
Average annual total return
| -37.60% | -8.66% | -2.39% |
Barclays Capital US Aggregate Index
| Growth of $10,000
| $10,524 | $11,745 | $12,178 |
Average annual total return
| 5.24% | 5.51% | 4.65% |
The growth of $10,000 is cumulative.
* The Portfolio commenced operations on August 16, 2004. Index returns began on August 31, 2004.Information About Your Portfolio's Expenses
DWS Moderate Allocation VIP
As an investor of the Portfolio, you incur two types of costs: ongoing expenses and transaction costs. Ongoing expenses include management fees, distribution and service (12b-1) fees and other Portfolio expenses. Examples of transaction costs include contract charges, redemption fees and account maintenance fees, which are not shown in this section. The following tables are intended to help you understand your ongoing expenses (in dollars) of investing in the Portfolio and to help you compare these expenses with the ongoing expenses of investing in other mutual funds. In addition to the ongoing expenses which the Portfolio bears directly, the Portfolio's shareholders indirectly bear the expense of the Underlying DWS Portfolios and non-affiliated funds ("Underlying Portfolios") in which the Portfolio invests. The Portfolio's estimated indirect expense from investing in the Underlying Portfolios is based on the expense ratios from the Underlying Portfolios' most recent shareholder report. In the most recent six-month period, the Portfolio limited these expenses; had it not done so, expenses would have been higher. The example in the table is based on an investment of $1,000 invested at the beginning of the six-month period and held for the entire period (July 1, 2008 to December 31, 2008) .
The tables illustrate your Portfolio's expenses in two ways:
• Actual Portfolio Return. This helps you estimate the actual dollar amount of ongoing expenses (but not transaction costs) paid on a $1,000 investment in the Portfolio using the Portfolio's actual return during the period. To estimate the expenses you paid over the period, simply divide your account value by $1,000 (for example, an $8,600 account value divided by $1,000 = 8.6), then multiply the result by the number in the "Expenses Paid per $1,000" line under the share class you hold.
• Hypothetical 5% Portfolio Return. This helps you to compare your Portfolio's ongoing expenses (but not transaction costs) with those of other mutual funds using the Portfolio's actual expense ratio and a hypothetical rate of return of 5% per year before expenses. Examples using a 5% hypothetical Portfolio return may be found in the shareholder reports of other mutual funds. The hypothetical account values and expenses may not be used to estimate the actual ending account balance or expenses you paid for the period.
Please note that the expenses shown in these tables are meant to highlight your ongoing expenses only and do not reflect any transaction costs. The "Expenses Paid per $1,000" line of the tables is useful in comparing ongoing expenses only and will not help you determine the relative total expense of owning different funds. If these transaction costs had been included, your costs would have been higher.
Direct Portfolio Expenses and Value of a $1,000 Investment for the six months ended December 31, 2008 |
Actual Portfolio Return | | Class B |
Beginning Account Value 7/1/08
| | $ 1,000.00 |
Ending Account Value 12/31/08
| | $ 741.80 |
Expenses Paid per $1,000*
| | $ 3.02 |
Hypothetical 5% Portfolio Return | | Class B |
Beginning Account Value 7/1/08
| | $ 1,000.00 |
Ending Account Value 12/31/08
| | $ 1,021.67 |
Expenses Paid per $1,000*
| | $ 3.51 |
Direct Portfolio Expenses and Acquired Portfolios (Underlying Portfolios) Fees and Expenses and Value of a $1,000 Investment for the six months ended December 31, 2008 |
Actual Portfolio Return | | Class B |
Beginning Account Value 7/1/08
| | $ 1,000.00 |
Ending Account Value 12/31/08
| | $ 741.80 |
Expenses Paid per $1,000**
| | $ 6.30 |
Hypothetical 5% Portfolio Return | | Class B |
Beginning Account Value 7/1/08
| | $ 1,000.00 |
Ending Account Value 12/31/08
| | $ 1,017.90 |
Expenses Paid per $1,000**
| | $ 7.30 |
* Expenses are equal to the Portfolio's annualized expense ratio multiplied by the average account value over the period, multiplied by the number of days in the most recent six-month period, then divided by 366.** Expenses are equal to the Portfolio's annualized expense ratio plus the Acquired Portfolios (Underlying Portfolios) Fees and Expenses, multiplied by the average account value over the period, multiplied by the number of days in the most recent six-month period, then divided by 366.Annualized Expense Ratios | | Class B |
Direct Portfolio Expense Ratio
| | .69% |
Acquired Portfolios (Underlying Portfolios) Fees and Expenses
| | .75% |
Net Annual Portfolio and Acquired Portfolios (Underlying Portfolios) Operating Expenses
| | 1.44% |
For more information, please refer to the Portfolio's prospectus.
These tables do not reflect charges and fees ("contract charges") associated with the separate account that invests in the Portfolio or any variable life insurance policy or variable annuity contract for which the Portfolio is an investment option.
Management Summary December 31, 2008
DWS Moderate Allocation VIP
For the 12 months ended December 31, 2008, the DWS Moderate Allocation VIP's Class B shares (unadjusted for contract charges) had a return of -30.36%. For the 12-month period, the Russell 3000® Index, which is generally regarded as a good indicator of the broad stock market, had a return of -37.31%. Since this Portfolio invests in stock and bond funds in several different categories, performance is analyzed by comparing the Portfolio's return with indexes that represent each asset class. The Portfolio's return was below that of its bond benchmark, the Barclays Capital US Aggregate Index, which returned 5.24%, but above the returns of its equity benchmark, the Russell 1000® Index, which returned -37.60%.
There are three major determinants of the Portfolio's performance: strategic asset allocation, tactical asset allocation and the performance of the underlying funds in which the Portfolio's assets are invested. During 2008, strategic asset allocation, tactical asset allocation and performance of the underlying funds detracted from the Portfolio's performance relative to its peer group of comparable funds.
Strategic asset allocation refers to the longer-term allocation among asset classes. The Portfolio's allocation between equity and fixed-income funds remained close to its target of 60% equity and 40% fixed income during 2008. Tactical allocation decisions are short-term underweights or overweights of particular asset classes relative to their longer-term strategic asset allocation targets.1 Overall tactical asset allocation, with an underweight of cash equivalents and investment-grade bonds balanced by an overweight in large-cap and international equities, detracted from performance, as fixed-income securities performed better than stocks.
Performance of each of the underlying funds is compared to a suitable benchmark for that particular fund's asset class and management style. The underlying funds as a group detracted from performance relative to their respective benchmarks. However, large-cap equity funds added value relative to their peers, as did high-yield funds, although these funds had negative absolute returns.
Inna Okounkova Robert Wang
Portfolio Managers, Deutsche Investment Management Americas Inc.
The Russell 3000 Index measures the performance of the 3,000 largest US companies based on total market capitalization, which represents approximately 98% of the investable US equity market. Index returns assume reinvestment of dividends and, unlike portfolio returns, do not include fees or expenses. It is not possible to invest directly into an index.
The Barclays Capital US Aggregate Index (name changed from Lehman Brothers US Aggregate Index, effective November 3, 2008) is an unmanaged, market value-weighted measure of Treasury issues, agency issues, corporate bond issues and mortgage securities. Index returns, unlike portfolio returns, do not include fees or expenses. It is not possible to invest directly into an index.
The Russell 1000 Index is an unmanaged index that measures the performance of the 1,000 largest companies in the Russell 3000 Index, which represents approximately 92% of the total market capitalization of the Russell 3000 Index. Index returns assume reinvestment of dividends and, unlike portfolio returns, do not include fees or expenses. It is not possible to invest directly into an index.
1 "Overweight" means the portfolio holds a higher weighting in a given sector or security than the benchmark. "Underweight" means the portfolio holds a lower weighting.Portfolio management market commentary is as of December 31, 2008, and may not come to pass. This information is subject to change at any time based on market and other conditions. Past performance does not guarantee future results. Current and future portfolio holdings are subject to risk.
Portfolio Summary
DWS Moderate Allocation VIP
Asset Allocation (As a % of Investment Portfolio) | 12/31/08 | 12/31/07 |
| | |
Equity — Equity Funds | 57% | 63% |
Fixed Income — Bond Funds | 34% | 33% |
Equity — Exchange Traded Funds | 5% | — |
Fixed Income — Money Market Funds | 4% | 4% |
| 100% | 100% |
Target Allocation (As a % of Investment Portfolio) | 12/31/08 | 12/31/07 |
| | |
Equity | 60% | 60% |
Fixed Income | 40% | 40% |
Asset allocation is subject to change.
For more complete details about the Portfolio's investment portfolio, see page 222. A complete list of portfolio holdings of the portfolio is posted as of the month end on www.dws-investments.com on or about the 15th day of the following month. More frequent posting of portfolio holdings information may be made from time to time on www.dws-investments.com.
Following the Portfolio's fiscal first and third quarter-end, a complete portfolio holdings listing is filed with the SEC on Form N-Q. The form will be available on the SEC's Web site at www.sec.gov, and it also may be reviewed and copied at the SEC's Public Reference Room in Washington, D.C. Information on the operation of the SEC's Public Reference Room may be obtained by calling (800) SEC-0330.
Portfolio management market commentary is as of December 31, 2008, and may not come to pass. This information is subject to change at any time based on market and other conditions. Past performance does not guarantee future results. Current and future portfolio holdings are subject to risk.
Investment Portfolio December 31, 2008
DWS Moderate Allocation VIP
| Shares | Value ($) |
| |
Equity — Equity Funds 57.5% |
DWS Blue Chip VIP "A" | 3,203 | 23,219 |
DWS Capital Growth VIP "A" | 61,085 | 827,707 |
DWS Communications Fund "Institutional" | 4,349 | 42,659 |
DWS Davis Venture Value VIP "A" | 196,526 | 1,475,912 |
DWS Dreman High Return Equity VIP "A" | 7,583 | 47,092 |
DWS Dreman Small Cap Value Fund "Institutional" | 3,446 | 83,562 |
DWS Dreman Small Mid Cap Value VIP "A" | 74,771 | 592,933 |
DWS Emerging Markets Equity Fund "Institutional" | 29,285 | 298,118 |
DWS Equity 500 Index VIP "A" | 89,178 | 851,647 |
DWS Global Opportunities VIP "A" | 58,730 | 457,505 |
DWS Global Thematic VIP "A" | 83,474 | 487,489 |
DWS Growth & Income VIP "A" | 331,283 | 1,696,168 |
DWS Health Care VIP "A" | 79,131 | 747,784 |
DWS International Select Equity VIP "A" | 8,589 | 53,422 |
DWS International VIP "A" | 131,635 | 858,259 |
DWS Janus Growth & Income VIP "A" | 19,855 | 134,817 |
DWS Japan Equity Fund "S" | 7,928 | 58,426 |
DWS Large Cap Value VIP "A" | 355,284 | 3,169,137 |
DWS Mid Cap Growth VIP "A" | 1,310 | 8,910 |
DWS RREEF Global Real Estate Securities Fund "Institutional" | 16,218 | 87,254 |
DWS RREEF Real Estate Securities Fund "Institutional" | 4,637 | 51,566 |
DWS Small Cap Core Fund "S" | 5,030 | 55,075 |
DWS Small Cap Growth VIP "A" | 35,381 | 269,249 |
DWS Small Cap Index VIP "A" | 22,978 | 198,304 |
DWS Technology VIP "A" | 103,645 | 596,992 |
Total Equity Funds (Cost $22,483,023) | 13,173,206 |
|
Equity — Exchange Traded Funds 4.8% |
Consumer Discretionary Select Sector SPDR Fund | 2,199 | 47,432 |
Consumer Staples Select Sector SPDR Fund | 2,741 | 65,428 |
Energy Select Sector SPDR Fund | 1,018 | 48,701 |
| Shares | Value ($) |
| |
Financial Select Sector SPDR Fund | 3,788 | 47,805 |
Industrial Select Sector SPDR Fund | 2,893 | 67,928 |
iShares MSCI Australia Index Fund | 7,328 | 102,665 |
iShares MSCI Canada Index Fund | 12,485 | 217,614 |
iShares MSCI EAFE Small Cap Index Fund | 3,852 | 99,035 |
iShares MSCI France Index Fund | 967 | 20,239 |
iShares MSCI Switzerland Index Fund | 6,492 | 120,362 |
iShares MSCI United Kingdom Index Fund | 20,377 | 249,618 |
Utilities Select Sector SPDR Fund | 912 | 26,475 |
Total Exchange Traded Funds (Cost $1,614,219) | 1,113,302 |
|
Fixed Income — Bond Funds 34.1% |
DWS Core Fixed Income VIP "A" | 323,621 | 2,880,224 |
DWS Emerging Markets Fixed Income Fund "Institutional" | 14,479 | 119,597 |
DWS Global Bond Fund "S" | 118,913 | 1,190,320 |
DWS Government & Agency Securities VIP "A" | 114,852 | 1,424,161 |
DWS High Income VIP "A" | 154,656 | 822,772 |
DWS Inflation Protected Plus Fund "Institutional" | 39,087 | 356,469 |
DWS Short Duration Plus Fund "Institutional" | 32,164 | 282,074 |
DWS US Bond Index Fund "Institutional" | 71,293 | 734,320 |
Total Fixed Income — Bond Funds (Cost $9,057,326) | 7,809,937 |
|
Fixed Income — Money Market Fund 3.7% |
Cash Management QP Trust (Cost $857,478) | 857,478 | 857,478 |
| % of Net Assets | Value ($) |
| |
Total Investment Portfolio (Cost $34,012,046)+ | 100.1 | 22,953,923 |
Other Assets and Liabilities, Net | (0.1) | (32,066) |
Net Assets | 100.0 | 22,921,857 |
+ The cost for federal income tax purposes was $34,344,751. At December 31, 2008, net unrealized depreciation for all securities based on tax cost was $11,390,828. This consisted of aggregate gross unrealized appreciation for all securities in which there was an excess of value over tax cost of $44,346 and aggregate gross unrealized depreciation for all securities in which there was an excess of tax cost over value of $11,435,174.EAFE: Europe, Australasia and Far East
MSCI: Morgan Stanley Capital International
SPDR: Standard & Poor's Depositary Receipt
Fair Value Measurements
The following is a summary of the inputs used as of December 31, 2008 in valuing the Portfolio's investments. For information on the Portfolio's policy regarding the valuation of investments and of the valuation inputs, and the aggregate levels used in the table below, please refer to the Security Valuation section of Note A in the accompanying Notes to the Financial Statements.
Valuation Inputs | Investments in Securities |
Level 1
| $ 22,096,445 |
Level 2
| 857,478 |
Level 3
| — |
Total | $ 22,953,923 |
The accompanying notes are an integral part of the financial statements.
Financial Statements
Statement of Assets and Liabilities as of December 31, 2008
|
Assets |
Investments:
Investments in Underlying Affiliated Portfolios, at value (cost $31,540,349) | $ 20,983,143 |
Investments in Non-affiliated funds (cost $1,614,219) | 1,113,302 |
Investment in Cash Management QP Trust (cost $857,478) | 857,478 |
Total investments, at value (cost $34,012,046)
| 22,953,923 |
Interest receivable
| 1,126 |
Due from Advisor
| 35,206 |
Other assets
| 881 |
Total assets
| 22,991,136 |
Liabilities |
Payable for Portfolio shares redeemed
| 1,233 |
Other accrued expenses and payables
| 68,046 |
Total liabilities
| 69,279 |
Net assets, at value | $ 22,921,857 |
Net Assets Consist of |
Undistributed net investment income
| 2,003,565 |
Net unrealized appreciation (depreciation) on investments
| (11,058,123) |
Accumulated net realized gain (loss)
| 147,678 |
Paid-in capital
| 31,828,737 |
Net assets, at value | $ 22,921,857 |
Class B Net Asset Value, offering and redemption price per share ($22,921,857 ÷ 3,167,493 outstanding shares of beneficial interest, $.01 par value, unlimited number of shares authorized)
| $ 7.24 |
The accompanying notes are an integral part of the financial statements.
Statement of Operations for the year ended December 31, 2008
|
Investment Income |
Income:
Income distributions from Underlying Affiliated Portfolios
| 1,267,672 |
Dividends
| 27,502 |
Interest — Cash Management QP Trust
| 19,499 |
Total Income
| 1,314,673 |
Expenses:
Management fee
| 30,022 |
Administration fee
| 19,414 |
Services to shareholders
| 48 |
Custodian and accounting fees
| 21,064 |
Distribution service fee
| 77,539 |
Record keeping fees
| 32,491 |
Audit and tax fees
| 44,641 |
Legal
| 27,425 |
Trustees' fees and expenses
| 8,705 |
Reports to shareholders and shareholder meeting
| 26,476 |
Other
| 7,160 |
Total expenses before expense reductions
| 294,985 |
Expense reductions
| (75,771) |
Total expenses after expense reductions
| 219,214 |
Net investment income (loss) | 1,095,459 |
Realized and Unrealized Gain (Loss) |
Net realized gain (loss) from investments
| (3,008,065) |
Capital gain distributions from Underlying Affiliated Portfolios
| 4,088,752 |
Payments by affiliates (see Note I)
| 2,194 |
| 1,082,881 |
Change in net unrealized appreciation (depreciation) on investments
| (12,690,829) |
Net gain (loss) | (11,607,948) |
Net increase (decrease) in net assets resulting from operations | $ (10,512,489) |
The accompanying notes are an integral part of the financial statements.
Statement of Changes in Net Assets |
| Years Ended December 31, |
Increase (Decrease) in Net Assets | 2008 | 2007 |
Operations:
Net investment income (loss)
| $ 1,095,459 | $ 3,570,896 |
Net realized gain (loss)
| 1,082,881 | 18,433,740 |
Change in net unrealized appreciation (depreciation)
| (12,690,829) | (12,317,475) |
Net increase (decrease) in net assets resulting from operations
| (10,512,489) | 9,687,161 |
Distributions to shareholders from:
Net investment income:
Class B | (1,275,845) | (3,955,828) |
Net realized gains:
Class B | (4,026,048) | (6,545,482) |
Total distributions
| (5,301,893) | (10,501,310) |
Portfolio share transactions:
Class B Proceeds from shares sold
| 7,398,819 | 4,472,231 |
Reinvestment of distributions
| 5,301,893 | 10,501,310 |
Cost of shares redeemed
| (8,175,397) | (158,853,998) |
Net increase (decrease) in net assets from Class B share transactions
| 4,525,315 | (143,880,457) |
Increase (decrease) in net assets | (11,289,067) | (144,694,606) |
Net assets at beginning of period
| 34,210,924 | 178,905,530 |
Net assets at end of period (including undistributed net investment income of $2,003,565 and $5,098,423, respectively)
| $ 22,921,857 | $ 34,210,924 |
Other Information |
Class B Shares outstanding at beginning of period
| 2,785,245 | 14,409,131 |
Shares sold
| 678,400 | 363,437 |
Shares issued to shareholders in reinvestment of distributions
| 546,587 | 888,436 |
Shares redeemed
| (842,739) | (12,875,759) |
Net increase (decrease) in Class B shares
| 382,248 | (11,623,886) |
Shares outstanding at end of period
| 3,167,493 | 2,785,245 |
The accompanying notes are an integral part of the financial statements.
Financial Highlights
Class B Years Ended December 31, | 2008 | 2007 | 2006 | 2005 | 2004a |
Selected Per Share Data |
Net asset value, beginning of period | $ 12.28 | $ 12.42 | $ 11.37 | $ 10.84 | $ 10.00 |
Income (loss) from investment operations: Net investment income (loss)b | .34 | .26 | .19 | .12 | (.03) |
Net realized and unrealized gain (loss) | (3.63) | .34 | 1.04 | .43 | .87 |
Total from investment operations | (3.29) | .60 | 1.23 | .55 | .84 |
Less distributions from: Net investment income | (.42) | (.28) | (.10) | — | — |
Net realized gains | (1.33) | (.46) | (.08) | (.02) | — |
Total distributions | (1.75) | (.74) | (.18) | (.02) | — |
Net asset value, end of period | $ 7.24 | $ 12.28 | $ 12.42 | $ 11.37 | $ 10.84 |
Total Return (%)c,d
| (30.36) | 5.09 | 10.93 | 5.06 | 8.40** |
Ratios to Average Net Assets and Supplemental Data |
Net assets, end of period ($ millions)
| 23 | 34 | 179 | 171 | 39 |
Ratio of expenses before expense reductions (%)e
| .95 | .63 | .62 | .66 | 1.53* |
Ratio of expenses after expense reductions (%)e
| .71 | .58 | .57 | .61 | .75* |
Ratio of net investment income (loss) (%)
| 3.53 | 2.11 | 1.65 | 1.15 | (.68)* |
Portfolio turnover rate (%)
| 59 | 30 | 35 | 14 | 13 |
a For the period from August 16, 2004 (commencement of operations) to December 31, 2004.
b Based on average shares outstanding during the period.
c Total return would have been lower had certain expenses not been reduced.
d Total return would have been lower if the Advisor had not reduced some Underlying Portfolios' expenses.
e The Portfolio invests in other DWS Portfolios and non-affiliated funds and indirectly bears its proportionate share of fees and expenses incurred by the Underlying DWS Portfolios and non-affiliated funds in which the Portfolio is invested. This ratio does not include these indirect fees and expenses.
* Annualized
** Not annualized
|
Information About Your Portfolio's Expenses
DWS Money Market VIP
As an investor of the Portfolio, you incur two types of costs: ongoing expenses and transaction costs. Ongoing expenses include management fees, distribution and service (12b-1) fees and other Portfolio expenses. Examples of transaction costs include contract charges, redemption fees and account maintenance fees, which are not shown in this section. The following tables are intended to help you understand your ongoing expenses (in dollars) of investing in the Portfolio and to help you compare these expenses with the ongoing expenses of investing in other mutual funds. In the most recent six-month period, the Portfolio limited these expenses; had they not done so, expenses would have been higher. The example in the table is based on an investment of $1,000 invested at the beginning of the six-month period and held for the entire period (July 1, 2008 to December 31, 2008).
The tables illustrate your Portfolio's expenses in two ways:
• Actual Portfolio Return. This helps you estimate the actual dollar amount of ongoing expenses (but not transaction costs) paid on a $1,000 investment in the Portfolio using the Portfolio's actual return during the period. To estimate the expenses you paid over the period, simply divide your account value by $1,000 (for example, an $8,600 account value divided by $1,000 = 8.6), then multiply the result by the number in the "Expenses Paid per $1,000" line under the share class you hold.
• Hypothetical 5% Portfolio Return. This helps you to compare your Portfolio's ongoing expenses (but not transaction costs) with those of other mutual funds using the Portfolio's actual expense ratio and a hypothetical rate of return of 5% per year before expenses. Examples using a 5% hypothetical Portfolio return may be found in the shareholder reports of other mutual funds. The hypothetical account values and expenses may not be used to estimate the actual ending account balance or expenses you paid for the period.
Please note that the expenses shown in these tables are meant to highlight your ongoing expenses only and do not reflect any transaction costs. The "Expenses Paid per $1,000" line of the tables is useful in comparing ongoing expenses only and will not help you determine the relative total expense of owning different funds. If these transaction costs had been included, your costs would have been higher.
Expenses and Value of a $1,000 Investment for the six months ended December 31, 2008 |
Actual Portfolio Return | Class A | | Class B | |
Beginning Account Value 7/1/08
| $ 1,000.00 | | $ 1,000.00 | |
Ending Account Value 12/31/08
| $ 1,011.50 | | $ 1,010.30 | |
Expenses Paid per $1,000*
| $ 2.58 | | $ 3.59 | |
Hypothetical 5% Portfolio Return | Class A | | Class B | |
Beginning Account Value 7/1/08
| $ 1,000.00 | | $ 1,000.00 | |
Ending Account Value 12/31/08
| $ 1,022.57 | | $ 1,021.57 | |
Expenses Paid per $1,000*
| $ 2.59 | | $ 3.61 | |
* Expenses are equal to the Portfolio's annualized expense ratio for each share class, multiplied by the average account value over the period, multiplied by the number of days in the most recent six-month period, then divided by 366.Annualized Expense Ratios | Class A | | Class B | |
DWS Variable Series II — DWS Money Market VIP
| .51% | | .71% | |
For more information, please refer to the Portfolio's prospectus.
These tables do not reflect charges and fees ("contract charges") associated with the separate account that invests in the Portfolio or any variable life insurance policy or variable annuity contract for which the Portfolio is an investment option.
Management Summary December 31, 2008
DWS Money Market VIP
Over the course of 2008, we witnessed unprecedented events in the money markets as well as in financial markets worldwide. The massive credit crunch that originated with problems in the US subprime mortgage market as well as securitized mortgages eventually brought down several financial firms, including Bear Stearns and Lehman Brothers, and transformed Wall Street. September in particular was a traumatic month for the financial industry as severe losses and the general liquidity squeeze forced major financial companies such as Merrill Lynch, AIG, Washington Mutual and Wachovia to seek a rescue through government bailout or merger. In response to a general freeze-up in money market liquidity, the US government created new lending facilities for commercial paper and asset-backed commercial paper, as well for the money markets. The government also issued new short-term Treasury instruments to meet strong investor demand. By the fourth quarter, these new government programs seemed to be restoring some measure of liquidity in the money markets, though we believe it will take some time for normalcy to be restored.
During the 12-month period ended December 31, 2008, the Portfolio provided a total return of 2.64% (Class A shares, unadjusted for contract charges) compared with the 2.23% average return for the 106 funds in the Lipper Money Market Variable Annuity Funds category for the same period, according to Lipper Inc. The 7-day current yield as of December 31, 2008 was 1.59%. The investment advisor has agreed to waive certain fees/reimburse expenses. Without such fee waivers/expense reimbursements, the 7-day current yield would have been 1.31% as of December 31, 2008.
Given the difficult situation throughout the investment markets, and understanding that the credit crunch would not be a short-term phenomenon, our strategy for DWS Money Market VIP during the earlier part of 2008 was to emphasize liquidity and high credit quality while looking for ways to maximize yield potential when opportunities presented themselves. In mid-September, when conditions in the money markets worsened drastically, we enacted a significantly more defensive strategy for the Portfolio, holding more overnight securities in the form of repurchase agreements.1 We also purchased Treasury and agency instruments as well as corporate commercial paper, seeking the highest quality portfolio given the extremely difficult market conditions. As market conditions eased, we extended maturity with the highest quality securities.
A group of investment professionals is responsible for the day-to-day management of the Portfolio. These investment professionals have a broad range of experience managing money market funds.
Deutsche Investment Management Americas Inc.
All performance shown is historical, assumes reinvestment of all dividend and capital gain distributions and does not guarantee future results. Investment return and principal value fluctuate with changing market conditions so that, when redeemed, shares may be worth more or less than their original cost. Current performance may be lower or higher than the performance data quoted. Please contact your participating insurance company for the Portfolio's most recent month-end performance. Performance doesn't reflect charges and fees ("contract charges") associated with the separate account that invests in the Portfolio or any variable life insurance policy or variable annuity contract for which the Portfolio is an investment option. These charges and fees will reduce returns. The yield quotation more closely reflects the current earnings of the Portfolio than the total return quotation.
Yields are historical, will fluctuate and do not guarantee future performance. The 7-day current yield refers to the income paid by the Portfolio over a 7-day period expressed as an annual percentage rate of the Portfolio's shares outstanding.
Risk Considerations
An investment in this Portfolio is not insured or guaranteed by the Federal Deposit Insurance Corporation or by any other government agency. Although the Portfolio seeks to preserve the value of your investment at $1.00 per share, it is possible to lose money by investing in the Portfolio. Please read this Portfolio's prospectus for specific details regarding its investment and risk profile.
The Lipper Money Market Variable Annuity Funds category includes funds that invest in high-quality financial instruments rated in the top two grades with dollar-weighted average maturities of less than 90 days, and that intend to keep a constant net asset value. It is not possible to invest directly in a Lipper category.
1 Repurchase Agreements (Repos) — an agreement between a seller and a buyer, usually of government securities, where the seller agrees to repurchase the securities at a given price and usually at a stated time. Repos are widely used money market instruments that serve as an interest-bearing, short-term "parking place" for large sums of money.Portfolio management market commentary is as of December 31, 2008, and may not come to pass. This information is subject to change at any time based on market and other conditions. Past performance does not guarantee future results. Current and future portfolio holdings are subject to risk.
Portfolio Summary
DWS Money Market VIP
Asset Allocation (As a % of Investment Portfolio) | 12/31/08 | 12/31/07 |
| | |
Commercial Paper | 41% | 46% |
Government & Agency Obligations | 17% | 4% |
Certificates of Deposit and Bank Notes | 16% | 20% |
Short-Term Notes | 14% | 22% |
Repurchase Agreements | 6% | 2% |
Time Deposit | 4% | 1% |
Master Notes | 2% | 2% |
Promissory Notes | — | 2% |
Asset Backed | — | 1% |
| 100% | 100% |
Weighted Average Maturity* | | |
| | |
DWS Variable Series II — DWS Money Market VIP | 61 days | 41 days |
First Tier Retail Money Fund Average | 42 days | 41 days |
* The Portfolio is compared to its respective iMoneyNet Category: First Tier Retail Money Fund Average — Category includes a widely-recognized composite of money market funds that invest in only first tier (highest rating) securities. Portfolio Holdings of First Tier funds include US Treasury, US Other, Repos, Time Deposits, Domestic Bank Obligations, Foreign Bank Obligations, First Tier Commercial Paper, Floating Rate Notes and Asset Backed Commercial Paper.Asset allocation and weighted average maturity are subject to change.
For more complete details about the Portfolio's investment portfolio, see page 232. A complete list of portfolio holdings of the portfolio is posted as of the month end on www.dws-investments.com on or about the 15th day of the following month. More frequent posting of portfolio holdings information may be made from time to time on www.dws-investments.com.
Following the Portfolio's fiscal first and third quarter-end, a complete portfolio holdings listing is filed with the SEC on Form N-Q. The form will be available on the SEC's Web site at www.sec.gov, and it also may be reviewed and copied at the SEC's Public Reference Room in Washington, D.C. Information on the operation of the SEC's Public Reference Room may be obtained by calling (800) SEC-0330.
Investment Portfolio December 31, 2008
DWS Money Market VIP
| Principal Amount ($) | Value ($) |
| |
Certificates of Deposit and Bank Notes 16.2% |
Banco Bilbao Vizcaya Argentaria SA: | | |
3.09%, 3/9/2009 | 3,900,000 | 3,900,036 |
3.155%, 1/5/2009 | 2,600,000 | 2,600,001 |
Bank of America NA, 2.35%, 5/5/2009 | 3,500,000 | 3,500,000 |
Bank of Nova Scotia, 3.35%, 1/23/2009 | 4,500,000 | 4,500,000 |
Bank of Tokyo-Mitsubishi UFJ Ltd., 1.85%, 2/12/2009 | 4,500,000 | 4,500,000 |
BNP Paribas, 2.29%, 2/10/2009 | 2,000,000 | 2,000,022 |
Calyon, 2.2%, 3/11/2009 | 5,000,000 | 5,006,774 |
DNB NOR Bank ASA, 3.7%, 1/23/2009 | 5,000,000 | 5,000,000 |
Metropolitan Life Global Funding I, 144A, 3.8%, 1/20/2009 | 750,000 | 750,000 |
Mizuho Corporate Bank Ltd., 1.21%, 3/23/2009 | 6,500,000 | 6,500,146 |
Nordea Bank Finland PLC, 3.76%, 1/21/2009 | 6,250,000 | 6,251,812 |
Rabobank Nederland NV, 3.0%, 2/26/2009 | 3,000,000 | 3,000,000 |
Svenska Handelsbanken AB, 2.0%, 3/12/2009 | 6,500,000 | 6,500,000 |
Toronto-Dominion Bank: | | |
2.0%, 5/12/2009 | 3,000,000 | 3,000,000 |
2.52%, 5/12/2009 | 2,200,000 | 2,200,155 |
Westpac Banking Corp., 1.2%, 4/13/2009 | 5,000,000 | 5,000,000 |
Total Certificates of Deposit and Bank Notes (Cost $64,208,946) | 64,208,946 |
|
Commercial Paper 40.8% |
Issued at Discount** |
ASB Finance Ltd., 3.1%, 3/6/2009 | 1,500,000 | 1,491,733 |
Australia & New Zealand Banking Group Ltd., 2.2%, 2/6/2009 | 4,500,000 | 4,490,100 |
Bank of America Corp.: | | |
3.1%, 2/12/2009 | 3,500,000 | 3,487,342 |
3.22%, 2/6/2009 | 4,300,000 | 4,286,154 |
BP Capital Markets PLC, 1.285%, 3/5/2009 | 5,000,000 | 4,988,756 |
CBA (Delaware) Finance, Inc., 1.0%, 2/17/2009 | 4,879,000 | 4,874,541 |
Danske Corp., 3.81%, 1/28/2009 | 4,300,000 | 4,287,713 |
DNB NOR Bank ASA, 2.0%, 3/13/2009 | 5,000,000 | 4,980,278 |
European Investment Bank: | | |
0.85%, 6/11/2009 | 2,500,000 | 2,490,496 |
1.775%, 3/6/2009 | 4,000,000 | 3,987,378 |
2.13%, 5/5/2009 | 3,500,000 | 3,474,322 |
General Electric Co., 3.35%, 4/20/2009 | 4,000,000 | 3,959,428 |
Greenwich Capital Markets, Inc., 3.1%, 3/9/2009 | 3,500,000 | 3,479,807 |
Hewlett-Packard Co., 0.38%, 2/13/2009 | 5,800,000 | 5,797,367 |
Kingdom of Denmark, 0.75%, 4/22/2009 | 4,000,000 | 3,990,750 |
Liberty Street Funding LLC, 4.6%, 1/16/2009 | 6,000,000 | 5,988,500 |
| Principal Amount ($) | Value ($) |
| |
Nieuw Amsterdam Receivables Corp., 1.7%, 1/15/2009 | 4,000,000 | 3,997,356 |
Nissan Motor Acceptance Corp., 6.0%, 1/6/2009 | 3,000,000 | 2,997,500 |
Old Line Funding LLC, 4.25%, 1/15/2009 | 7,000,000 | 6,988,430 |
Pfizer, Inc.: | | |
0.5%, 5/11/2009 | 4,000,000 | 3,992,778 |
1.15%, 4/6/2009 | 2,000,000 | 1,993,931 |
1.2%, 3/19/2009 | 4,000,000 | 3,989,733 |
1.3%, 4/15/2009 | 3,000,000 | 2,988,733 |
2.52%, 3/2/2009 | 2,950,000 | 2,937,610 |
Procter & Gamble International Funding SCA: | | |
1.4%, 3/4/2009 | 4,000,000 | 3,990,356 |
2.23%, 2/12/2009 | 2,000,000 | 1,994,797 |
Shell International Finance BV: | | |
2.4%, 5/11/2009 | 2,000,000 | 1,982,667 |
2.5%, 3/9/2009 | 5,200,000 | 5,175,806 |
Starbird Funding Corp.: | | |
1.85%, 3/23/2009 | 5,000,000 | 4,979,187 |
3.2%, 2/6/2009 | 4,000,000 | 3,987,200 |
4.1%, 1/20/2009 | 6,400,000 | 6,386,151 |
Swedbank AB, 3.22%, 3/3/2009 | 2,000,000 | 1,989,088 |
Thunder Bay Funding LLC, 4.15%, 4/20/2009 | 4,000,000 | 3,949,739 |
Toyota Motor Credit Corp.: | | |
0.75%, 2/3/2009 | 5,000,000 | 4,996,562 |
2.1%, 4/1/2009 | 5,000,000 | 4,973,750 |
2.35%, 3/6/2009 | 4,000,000 | 3,983,289 |
3.4%, 1/26/2009 | 4,200,000 | 4,190,083 |
Victory Receivables Corp., 3.9%, 1/16/2009 | 6,400,000 | 6,389,600 |
Wal-Mart Stores, Inc., 0.75%, 9/8/2009 | 2,000,000 | 1,989,583 |
Westpac Banking Corp., 2.25%, 3/9/2009 | 5,500,000 | 5,476,969 |
Total Commercial Paper (Cost $162,375,563) | 162,375,563 |
|
Short-Term Notes* 14.2% |
Abbey National Treasury Services PLC: | | |
0.881%, 4/24/2009 | 1,500,000 | 1,500,000 |
2.417%, 2/20/2009 | 2,000,000 | 2,000,000 |
Allied Irish Banks North America, Inc., 2.463%, 3/11/2009 | 3,000,000 | 3,000,000 |
Australia & New Zealand Banking Group Ltd.: | | |
144A, 2.409%, 7/10/2009 | 1,000,000 | 1,000,000 |
144A, 2.426%, 7/2/2009 | 2,000,000 | 2,000,000 |
Bank of America NA, 144A, 4.35%, 7/6/2009 | 1,900,000 | 1,900,000 |
Bank of Nova Scotia, 3.056%, 5/6/2009 | 3,300,000 | 3,300,000 |
Bank of Scotland PLC, 2.916%, 6/5/2009 | 1,200,000 | 1,200,000 |
Barclays Bank PLC, 0.097%, 2/27/2009 | 3,000,000 | 3,000,000 |
BNP Paribas, 2.445%, 5/13/2009 | 1,500,000 | 1,500,000 |
Credit Agricole SA, 144A, 1.775%, 7/22/2009 | 2,500,000 | 2,500,000 |
| Principal Amount ($) | Value ($) |
| |
General Electric Co., 0.501%, 9/24/2009 | 10,000,000 | 10,000,000 |
ING Bank NV, 144A, 1.716%, 3/26/2009 | 750,000 | 750,000 |
Intesa Sanpaolo SpA: | | |
1.695%, 5/13/2009 | 2,800,000 | 2,800,000 |
2.451%, 3/5/2009 | 3,000,000 | 3,000,000 |
JPMorgan Chase & Co., 4.19%, 4/3/2009 | 4,000,000 | 3,999,949 |
Metropolitan Life Global Funding I, 144A, 4.57%, 5/11/2009 | 750,000 | 750,000 |
National Australia Bank Ltd.: | | |
144A, 2.438%, 2/19/2009 | 2,000,000 | 2,000,000 |
4.543%, 4/7/2009 | 1,250,000 | 1,250,000 |
Natixis, 2.442%, 4/6/2009 | 3,000,000 | 3,000,000 |
Procter & Gamble International Funding SCA, 2.308%, 2/19/2009 | 750,000 | 750,000 |
Rabobank Nederland NV, 144A, 2.577%, 10/9/2009 | 2,000,000 | 2,000,000 |
Royal Bank of Canada, 144A, 1.595%, 7/15/2009 | 1,800,000 | 1,800,000 |
Svenska Handelsbanken AB, 144A, 3.885%, 5/26/2009 | 1,500,000 | 1,500,000 |
Total Short-Term Notes (Cost $56,499,949) | 56,499,949 |
|
Master Notes 2.0% |
Citigroup Global Markets, Inc., 0.19%*, 1/2/2009 (a) (Cost $8,000,000) | 8,000,000 | 8,000,000 |
|
Time Deposit 4.0% |
Canadian Imperial Bank of Commerce, 0.01%, 1/2/2009 (Cost $15,937,000) | 15,937,000 | 15,937,000 |
|
Government & Agency Obligations 16.6% |
US Government Sponsored Agencies 16.1% |
Federal Home Loan Bank: | | |
0.39%*, 4/3/2009 | 1,200,000 | 1,200,000 |
2.35%**, 2/11/2009 | 1,800,000 | 1,795,182 |
| Principal Amount ($) | Value ($) |
| |
2.36%**, 5/12/2009 | 1,250,000 | 1,239,265 |
2.5%**, 4/14/2009 | 5,200,000 | 5,162,805 |
2.53%**, 1/26/2009 | 3,500,000 | 3,493,851 |
2.73%**, 1/20/2009 | 4,000,000 | 3,994,237 |
2.74%**, 2/24/2009 | 1,750,000 | 1,742,807 |
3.0%**, 4/20/2009 | 2,000,000 | 1,981,833 |
Federal Home Loan Mortgage Corp.: | | |
0.55%**, 8/3/2009 | 5,000,000 | 4,983,653 |
1.3%**, 4/2/2009 | 5,000,000 | 4,983,569 |
1.75%**, 5/27/2009 | 2,000,000 | 1,985,806 |
2.41%**, 3/19/2009 | 2,000,000 | 1,989,691 |
Federal National Mortgage Association: | | |
0.45%**, 5/20/2009 | 4,500,000 | 4,492,181 |
1.25%**, 6/11/2009 | 4,000,000 | 3,977,639 |
1.7%**, 6/30/2009 | 2,500,000 | 2,478,750 |
1.75%**, 5/29/2009 | 4,300,000 | 4,269,064 |
1.9%**, 7/27/2009 | 8,000,000 | 7,912,600 |
2.46%**, 3/19/2009 | 2,000,000 | 1,989,477 |
2.75%**, 3/16/2009 | 4,250,000 | 4,225,976 |
| 63,898,386 |
US Treasury Obligation 0.5% |
US Treasury Bill, 0.99%**, 5/15/2009 | 2,200,000 | 2,191,893 |
Total Government & Agency Obligations (Cost $66,090,279) | 66,090,279 |
|
Repurchase Agreements 6.3% |
JPMorgan Securities, Inc., 0.04%, dated 12/31/2008, to be repurchased at $25,000,056 on 1/2/2009 (b) (Cost $25,000,000) | 25,000,000 | 25,000,000 |
| % of Net Assets | Value ($) |
| |
Total Investment Portfolio (Cost $398,111,737)+ | 100.1 | 398,111,737 |
Other Assets and Liabilities, Net | (0.1) | (320,742) |
Net Assets | 100.0 | 397,790,995 |
+ The cost for federal income tax purposes was $398,111,737.* Floating rate notes are securities whose yields vary with a designated market index or market rate, such as the coupon-equivalent of the US Treasury bill rate. These securities are shown at their current rate as of December 31, 2008.** Annualized yield at time of purchase; not a coupon rate.(a) Reset date; not a maturity date.(b) Collateralized by $24,644,933 Federal National Mortgage Association, with various coupon rates from 5.0-6.0%, with various maturity dates of 6/1/2018-10/1/2038, with a value of $25,500,681.144A: Security exempt from registration under Rule 144A of the Securities Act of 1933. These securities may be resold in transactions exempt from registration, normally to qualified institutional buyers.
Fair Value Measurements
The following is a summary of the inputs used as of December 31, 2008 in valuing the Portfolio's investments. For information on the Portfolio's policy regarding the valuation of investments and of the valuation inputs, and the aggregate levels used in the table below, please refer to the Security Valuation section of Note A in the accompanying Notes to the Financial Statements.
Valuation Inputs | Investments in Securities |
Level 1
| $ — |
Level 2
| 398,111,737 |
Level 3
| — |
Total | $ 398,111,737 |
The accompanying notes are an integral part of the financial statements.
Financial Statements
Statement of Assets and Liabilities as of December 31, 2008
|
Assets |
Investments:
Investment in securities, valued at amortized cost | $ 398,111,737 |
Cash
| 176,048 |
Interest receivable
| 481,504 |
Receivable for Portfolio shares sold
| 169,537 |
Due from Advisor
| 127 |
Other assets
| 65,592 |
Total assets
| 399,004,545 |
Liabilities |
Payable for Portfolio shares redeemed
| 643,663 |
Distributions payable
| 293,151 |
Accrued management fee
| 25,489 |
Other accrued expenses and payables
| 251,247 |
Total liabilities
| 1,213,550 |
Net assets, at value | $ 397,790,995 |
Net Assets Consist of |
Distributions in excess of net investment income
| (130,622) |
Paid-in capital
| 397,921,617 |
Net assets, at value | $ 397,790,995 |
Class A Net Asset Value, offering and redemption price per share ($397,749,879 ÷ 397,868,262 outstanding shares of beneficial interest, $.01 par value, unlimited number of shares authorized)
| $ 1.00 |
Class B Net Asset Value, offering and redemption price per share ($41,116 ÷ 41,037 outstanding shares of beneficial interest, $.01 par value, unlimited number of shares authorized)
| $ 1.00 |
Statement of Operations for the year ended December 31, 2008
|
Investment Income |
Income:
Interest
| $ 11,982,120 |
Expenses:
Management fee
| 1,247,502 |
Administration fee
| 263,770 |
Services to shareholders
| 763 |
Custodian fee
| 39,912 |
Distribution service fee (Class B)
| 10,318 |
Professional fees
| 76,177 |
Record keeping fees (Class B)
| 4,081 |
Trustees' fee and expenses
| 37,309 |
Reports to shareholders and shareholder meeting
| 326,625 |
Other
| 56,419 |
Total expenses, before expense reductions
| 2,062,876 |
Expense reductions
| (95,999) |
Total expenses, after expense reductions
| 1,966,877 |
Net investment income | 10,015,243 |
Net realized gain (loss) | 109,674 |
Net increase (decrease) in net assets resulting from operations | $ 10,124,917 |
The accompanying notes are an integral part of the financial statements.
Statement of Changes in Net Assets |
| Years Ended December 31, |
Increase (Decrease) in Net Assets | 2008 | 2007 |
Operations:
Net investment income
| $ 10,015,243 | $ 17,547,804 |
Net realized gain (loss)
| 109,674 | 15,068 |
Net increase (decrease) in net assets resulting from operations
| 10,124,917 | 17,562,872 |
Distributions to shareholders from:
Net investment income:
Class A | (10,103,886) | (15,932,890) |
Class B | (127,775) | (1,617,257) |
Total distributions
| $ (10,231,661) | $ (17,550,147) |
Portfolio share transactions:
Class A Proceeds from shares sold
| 264,441,713 | 266,620,495 |
Reinvestment of distributions
| 10,438,782 | 15,863,609 |
Cost of shares redeemed
| (232,250,984) | (221,020,237) |
Net increase (decrease) in net assets from Class A share transactions
| 42,629,511 | 61,463,867 |
Class B Proceeds from shares sold
| 4,026,431 | 36,113,440 |
Reinvestment of distributions
| 158,921 | 1,612,484 |
Cost of shares redeemed
| (28,403,441) | (71,843,157) |
Net increase (decrease) in net assets from Class B share transactions
| (24,218,089) | (34,117,233) |
Increase (decrease) in net assets | 18,304,678 | 27,359,359 |
Net assets at beginning of period
| 379,486,317 | 352,126,958 |
Net assets at end of period (including distributions in excess of net investment income of $130,622 and $23,878, respectively)
| $ 397,790,995 | $ 379,486,317 |
Other Information |
Class A Shares outstanding at beginning of period
| 355,238,751 | 293,774,884 |
Shares sold
| 264,441,713 | 266,620,495 |
Shares issued to shareholders in reinvestment of distributions
| 10,438,782 | 15,863,609 |
Shares redeemed
| (232,250,984) | (221,020,237) |
Net increase (decrease) in Class A shares
| 42,629,511 | 61,463,867 |
Shares outstanding at end of period
| 397,868,262 | 355,238,751 |
Class B Shares outstanding at beginning of period
| 24,259,126 | 58,376,359 |
Shares sold
| 4,026,431 | 36,113,440 |
Shares issued to shareholders in reinvestment of distributions
| 158,921 | 1,612,484 |
Shares redeemed
| (28,403,441) | (71,843,157) |
Net increase (decrease) in Class B shares
| (24,218,089) | (34,117,233) |
Shares outstanding at end of period
| 41,037 | 24,259,126 |
The accompanying notes are an integral part of the financial statements.
Financial Highlights
Class A Years Ended December 31, | 2008 | 2007 | 2006 | 2005 | 2004 |
Selected Per Share Data |
Net asset value, beginning of period | $ 1.000 | $ 1.000 | $ 1.000 | $ 1.000 | $ 1.000 |
Income from investment operations: Net investment income | .026 | .049 | .046 | .028 | .009 |
Total from investment operations | .026 | .049 | .046 | .028 | .009 |
Less distributions from: Net investment income | (.026) | (.049) | (.046) | (.028) | (.009) |
Net asset value, end of period | $ 1.000 | $ 1.000 | $ 1.000 | $ 1.000 | $ 1.000 |
Total Return (%)
| 2.64a | 5.00a | 4.65a | 2.80 | .91 |
Ratios to Average Net Assets and Supplemental Data |
Net assets, end of period ($ millions)
| 398 | 355 | 294 | 235 | 241 |
Ratio of expenses before expense reductions (%)
| .52 | .46 | .52 | .52 | .53 |
Ratio of expenses after expense reductions (%)
| .50 | .45 | .51 | .52 | .53 |
Ratio of net investment income (%)
| 2.56 | 4.88 | 4.58 | 2.77 | .88 |
a Total return would have been lower had certain expenses not been reduced.
|
Class B Years Ended December 31, | 2008 | 2007 | 2006 | 2005 | 2004 |
Selected Per Share Data |
Net asset value, beginning of period | $ 1.000 | $ 1.000 | $ 1.000 | $ 1.000 | $ 1.000 |
Income from investment operations: Net investment income | .023 | .046 | .042 | .024 | .005 |
Total from investment operations | .023 | .046 | .042 | .024 | .005 |
Less distributions from: Net investment income | (.023) | (.046) | (.042) | (.024) | (.005) |
Net asset value, end of period | $ 1.000 | $ 1.000 | $ 1.000 | $ 1.000 | $ 1.000 |
Total Return (%)
| 2.34a | 4.65a | 4.25a | 2.42 | .52 |
Ratios to Average Net Assets and Supplemental Data |
Net assets, end of period ($ millions)
| .04 | 24 | 58 | 58 | 53 |
Ratio of expenses before expense reductions (%)
| .93 | .82 | .90 | .89 | .91 |
Ratio of expenses after expense reductions (%)
| .88 | .80 | .89 | .89 | .91 |
Ratio of net investment income (%)
| 2.17 | 4.53 | 4.20 | 2.40 | .50 |
a Total return would have been lower had certain expenses not been reduced.
|
Performance Summary December 31, 2008
DWS Small Cap Growth VIP
All performance shown is historical, assumes reinvestment of all dividend and capital gain distributions and does not guarantee future results. Investment return and principal value fluctuate with changing market conditions so that, when redeemed, shares may be worth more or less than their original cost. Current performance may be lower or higher than the performance data quoted. Please contact your participating insurance company for the Portfolio's most recent month-end performance. Performance doesn't reflect charges and fees ("contract charges") associated with the separate account that invests in the Portfolio or any variable life insurance policy or variable annuity contract for which the Portfolio is an investment option. These charges and fees will reduce returns. While all share classes have the same underlying portfolio, their performance will differ.
The total annual Portfolio operating expense ratios, gross of any fee waivers or expense reimbursements, as stated in the fee table of the prospectus dated May 1, 2008 are 0.75% and 1.00% for Class A and Class B shares, respectively. Please see the Information About Your Portfolio's Expenses, the Financial Highlights and Notes to the Financial Statements (Note C, Related Parties) sections of this report for gross and net expense related disclosure for the period ended December 31, 2008.
Risk Considerations
This Portfolio is subject to stock market risk, meaning stocks in the Portfolio may decline in value for extended periods of time due to the activities and financial prospects of individual companies, or due to general market and economic conditions. Additionally, stocks of small companies involve greater risk than securities of larger, more-established companies, as they often have limited product lines, markets or financial resources and may be subject to more erratic and abrupt market movements. Finally, derivatives may be more volatile and less liquid than traditional securities and the Portfolio could suffer losses on its derivatives positions. Please read this Portfolio's prospectus for specific details regarding this product's investments and risk profile.
Portfolio returns shown for all periods reflect a fee waiver and/or expense reimbursement. Without this waiver/reimbursement, returns would have been lower.
Growth of an Assumed $10,000 Investment in DWS Small Cap Growth VIP |
[] DWS Small Cap Growth VIP — Class A [] Russell 2000® Growth Index | The Russell 2000® Growth Index is an unmanaged, capitalization-weighted measure of 2,000 of the smallest capitalized US companies with a greater-than-average growth orientation and whose common stocks trade on the NYSE, NYSE Alternext US (formerly known as the American Stock Exchange (AMEX)) and Nasdaq. Index returns assume reinvestment of dividends and, unlike portfolio returns, do not reflect any fees or expenses. It is not possible to invest directly into an index. |
 | |
Yearly periods ended December 31 |
|
Comparative Results |
DWS Small Cap Growth VIP | 1-Year | 3-Year | 5-Year | 10-Year |
Class A | Growth of $10,000
| $5,050 | $5,645 | $6,711 | $5,078 |
Average annual total return
| -49.50% | -17.35% | -7.67% | -6.55% |
Russell 2000 Growth Index
| Growth of $10,000
| $6,146 | $7,457 | $8,878 | $9,266 |
Average annual total return
| -38.54% | -9.32% | -2.35% | -.76% |
DWS Small Cap Growth VIP | 1-Year | 3-Year | 5-Year | Life of Class* |
Class B | Growth of $10,000
| $5,098 | $5,653 | $6,670 | $8,019 |
Average annual total return
| -49.09% | -17.31% | -7.78% | -3.34% |
Russell 2000 Growth Index
| Growth of $10,000
| $6,146 | $7,457 | $8,878 | $11,127 |
Average annual total return
| -38.54% | -9.32% | -2.35% | 1.66% |
The growth of $10,000 is cumulative.
* The Portfolio commenced offering Class B shares on July 1, 2002. Index returns began on June 30, 2002.Information About Your Portfolio's Expenses
DWS Small Cap Growth VIP
As an investor of the Portfolio, you incur two types of costs: ongoing expenses and transaction costs. Ongoing expenses include management fees, distribution and service (12b-1) fees and other Portfolio expenses. Examples of transaction costs include contract charges, redemption fees and account maintenance fees, which are not shown in this section. The following tables are intended to help you understand your ongoing expenses (in dollars) of investing in the Portfolio and to help you compare these expenses with the ongoing expenses of investing in other mutual funds. In the most recent six-month period, the Portfolio limited these expenses; had it not done so, expenses would have been higher. The example in the table is based on an investment of $1,000 invested at the beginning of the six-month period and held for the entire period (July 1, 2008 to December 31, 2008).
The tables illustrate your Portfolio's expenses in two ways:
• Actual Portfolio Return. This helps you estimate the actual dollar amount of ongoing expenses (but not transaction costs) paid on a $1,000 investment in the Portfolio using the Portfolio's actual return during the period. To estimate the expenses you paid over the period, simply divide your account value by $1,000 (for example, an $8,600 account value divided by $1,000 = 8.6), then multiply the result by the number in the "Expenses Paid per $1,000" line under the share class you hold.
• Hypothetical 5% Portfolio Return. This helps you to compare your Portfolio's ongoing expenses (but not transaction costs) with those of other mutual funds using the Portfolio's actual expense ratio and a hypothetical rate of return of 5% per year before expenses. Examples using a 5% hypothetical Portfolio return may be found in the shareholder reports of other mutual funds. The hypothetical account values and expenses may not be used to estimate the actual ending account balance or expenses you paid for the period.
Please note that the expenses shown in these tables are meant to highlight your ongoing expenses only and do not reflect any transaction costs. The "Expenses Paid per $1,000" line of the tables is useful in comparing ongoing expenses only and will not help you determine the relative total expense of owning different funds. If these transaction costs had been included, your costs would have been higher.
Expenses and Value of a $1,000 Investment for the six months ended December 31, 2008 |
Actual Portfolio Return | Class A | | Class B | |
Beginning Account Value 7/1/08
| $ 1,000.00 | | $ 1,000.00 | |
Ending Account Value 12/31/08
| $ 602.10 | | $ 614.70 | |
Expenses Paid per $1,000*
| $ 3.58 | | $ 5.07 | |
Hypothetical 5% Portfolio Return | Class A | | Class B | |
Beginning Account Value 7/1/08
| $ 1,000.00 | | $ 1,000.00 | |
Ending Account Value 12/31/08
| $ 1,020.66 | | $ 1,018.85 | |
Expenses Paid per $1,000*
| $ 4.52 | | $ 6.34 | |
* Expenses are equal to the Portfolio's annualized expense ratio for each share class, multiplied by the average account value over the period, multiplied by the number of days in the most recent six-month period, then divided by 366.Annualized Expense Ratios | Class A | | Class B | |
DWS Variable Series II — DWS Small Cap Growth VIP
| .89% | | 1.25% | |
For more information, please refer to the Portfolio's prospectus.
These tables do not reflect charges and fees ("contract charges") associated with the separate account that invests in the Portfolio or any variable life insurance policy or variable annuity contract for which the Portfolio is an investment option.
Management Summary December 31, 2008
DWS Small Cap Growth VIP
The past year has proven to be the most difficult period for global financial markets since the 1930s, with virtually all market indices posting decisively negative results. The bursting of the US housing market bubble set in motion a chain of events that culminated late last summer in the near paralysis of the global financial system. This led to a widening in credit spreads and a complete seize-up of credit-related activity.1 As the crisis grew, and market volatility hit an all-time high, the federal government intervened to prevent the failure of once venerable institutions such as AIG, Federal National Mortgage Association (Fannie Mae) and Federal Home Loan Mortgage Corporation (Freddie Mac). The growing inability of businesses and consumers to access credit led to a sharp contraction in global economic activity by the fourth quarter. Central banks around the world cut key interest rates in an effort to jump-start economic activity. Determined not to repeat the policy errors that led to the Great Depression, the US Federal Reserve Board (the Fed) gradually lowered its target for short-term interest rates to a range between 0% and 0.25%, and has aggressively used its balance sheet to provide credit market liquidity. President-elect Obama has called the revival of the economy his first priority, and the new administration intends to implement a huge fiscal stimulus plan that could reach $1 trillion.
For the 12-month period ended December 31, 2008, the Portfolio returned -49.50% (Class A shares, unadjusted for contract charges) compared with the -38.54% return of the Russell 2000® Growth Index.
Positive contributors to performance over the 12-month period included an overweight position in consumer staples, and underweights to telecom services, utilities and materials.2 Stock selection was positive within the consumer staples sector, and contributions to performance from the sector came from Green Mountain Coffee Roasters, Inc. and Pantry, Inc. Detractors from performance included unfavorable stock selection in health care, financials and energy. Individual detractors from returns included positions in the energy company Tesco Corp. and from financials, E*TRADE Financial Corp. Overweight positions in consumer discretionary and information technology also subtracted from returns, as did an underweight to health care. We continue to maintain a long-term perspective, investing in quality small-cap growth stocks.
Joseph Axtell, CFA Rafaelina M. Lee Jeffrey Saeger, CFA
Portfolio Managers, Deutsche Investment Management Americas Inc.
The Russell 2000 Growth Index is an unmanaged, capitalization-weighted index of those securities in the Russell 2000 Index with a higher price-to-book ratio and higher forecasted growth values. Index returns assume reinvestment of dividends and, unlike portfolio returns, do not reflect any fees or expenses. It is not possible to invest directly into an index.
1 Credit spread is the additional yield provided by non-Treasury fixed-income securities versus Treasury securities.2 "Overweight" means the portfolio holds a higher weighting in a given sector or security than the benchmark. "Underweight" means the portfolio holds a lower weighting.Portfolio management market commentary is as of December 31, 2008, and may not come to pass. This information is subject to change at any time based on market and other conditions. Past performance does not guarantee future results. Current and future portfolio holdings are subject to risk.
Portfolio Summary
DWS Small Cap Growth VIP
Asset Allocation (As a % of Investment Portfolio excluding Securities Lending Collateral) | 12/31/08 | 12/31/07 |
| | |
Common Stocks | 94% | 98% |
Cash Equivalents | 6% | 2% |
| 100% | 100% |
Sector Diversification (As a % of Common Stocks) | 12/31/08 | 12/31/07 |
| | |
Information Technology | 33% | 29% |
Health Care | 18% | 13% |
Consumer Discretionary | 16% | 20% |
Industrials | 11% | 15% |
Financials | 9% | 8% |
Energy | 8% | 11% |
Consumer Staples | 5% | 2% |
Materials | — | 2% |
| 100% | 100% |
Asset allocation and sector diversification are subject to change.
For more complete details about the Portfolio's investment portfolio, see page 242. A complete list of portfolio holdings of the portfolio is posted as of the month end on www.dws-investments.com on or about the 15th day of the following month. More frequent posting of portfolio holdings information may be made from time to time on www.dws-investments.com.
Following the Portfolio's fiscal first and third quarter-end, a complete portfolio holdings listing is filed with the SEC on Form N-Q. The form will be available on the SEC's Web site at www.sec.gov, and it also may be reviewed and copied at the SEC's Public Reference Room in Washington, D.C. Information on the operation of the SEC's Public Reference Room may be obtained by calling (800) SEC-0330.
Investment Portfolio December 31, 2008
DWS Small Cap Growth VIP
| Shares | Value ($) |
| |
Common Stocks 95.0% |
Consumer Discretionary 15.4% |
Diversified Consumer Services 1.4% |
Capella Education Co.* | 17,000 | 998,920 |
Hotels Restaurants & Leisure 4.3% |
Buffalo Wild Wings, Inc.* (a) | 115,200 | 2,954,880 |
Specialty Retail 9.7% |
bebe stores, inc. | 207,600 | 1,550,772 |
Children's Place Retail Stores, Inc.* (a) | 70,700 | 1,532,776 |
Citi Trends, Inc.* | 53,600 | 788,992 |
Guess?, Inc. | 142,300 | 2,184,305 |
Zumiez, Inc.* (a) | 90,000 | 670,500 |
| 6,727,345 |
Consumer Staples 5.0% |
Food & Staples Retailing 2.2% |
Casey's General Stores, Inc. | 30,000 | 683,100 |
Pantry, Inc.* | 37,700 | 808,665 |
| 1,491,765 |
Food Products 1.1% |
Green Mountain Coffee Roasters, Inc.* (a) | 18,000 | 696,600 |
Zhongpin, Inc.* | 4,800 | 57,600 |
| 754,200 |
Personal Products 1.7% |
Chattem, Inc.* | 9,900 | 708,147 |
NBTY, Inc.* | 31,000 | 485,150 |
| 1,193,297 |
Energy 8.1% |
Energy Equipment & Services 2.4% |
CARBO Ceramics, Inc. | 17,800 | 632,434 |
Dril-Quip, Inc.* | 40,900 | 838,859 |
T-3 Energy Services, Inc.* | 19,000 | 179,360 |
| 1,650,653 |
Oil, Gas & Consumable Fuels 5.7% |
Arena Resources, Inc.* | 28,700 | 806,183 |
BPZ Resources, Inc.* (a) | 169,200 | 1,082,880 |
Carrizo Oil & Gas, Inc.* (a) | 59,800 | 962,780 |
EXCO Resources, Inc.* | 48,500 | 439,410 |
Goodrich Petroleum Corp.* | 22,400 | 670,880 |
| 3,962,133 |
Financials 8.1% |
Capital Markets 2.2% |
Riskmetrics Group, Inc.* | 60,200 | 896,378 |
Waddell & Reed Financial, Inc. "A" | 39,500 | 610,670 |
| 1,507,048 |
Commercial Banks 1.0% |
PrivateBancorp., Inc. | 22,200 | 720,612 |
Diversified Financial Services 2.5% |
Portfolio Recovery Associates, Inc.* (a) | 52,120 | 1,763,741 |
| Shares | Value ($) |
| |
Insurance 2.4% |
eHealth, Inc.* | 124,300 | 1,650,704 |
Health Care 17.0% |
Biotechnology 2.8% |
Alexion Pharmaceuticals, Inc.* | 18,500 | 669,515 |
Celera Corp.* | 15,200 | 169,176 |
Regeneron Pharmaceuticals, Inc.* | 20,700 | 380,052 |
United Therapeutics Corp.* | 11,900 | 744,345 |
| 1,963,088 |
Health Care Equipment & Supplies 2.0% |
Masimo Corp.* | 12,900 | 384,807 |
NuVasive, Inc.* | 19,100 | 661,815 |
Thoratec Corp.* | 11,100 | 360,639 |
| 1,407,261 |
Health Care Providers & Services 11.5% |
AMERIGROUP Corp.* | 39,000 | 1,151,280 |
Centene Corp.* | 60,400 | 1,190,484 |
Genoptix, Inc.* | 44,600 | 1,519,968 |
Gentiva Health Services, Inc.* | 55,400 | 1,621,004 |
Pediatrix Medical Group, Inc.* | 29,500 | 935,150 |
Psychiatric Solutions, Inc.* (a) | 56,500 | 1,573,525 |
| 7,991,411 |
Life Sciences Tools & Services 0.7% |
ICON PLC (ADR)* | 23,600 | 464,684 |
Industrials 10.1% |
Aerospace & Defense 2.8% |
BE Aerospace, Inc.* | 122,800 | 944,332 |
Curtiss-Wright Corp. | 29,800 | 995,022 |
| 1,939,354 |
Commercial Services & Supplies 1.5% |
Team, Inc.* | 37,300 | 1,033,210 |
Electrical Equipment 1.0% |
Baldor Electric Co. | 39,600 | 706,860 |
Machinery 0.9% |
Astec Industries, Inc.* | 20,700 | 648,531 |
Professional Services 3.0% |
Huron Consulting Group, Inc.* | 25,100 | 1,437,477 |
Korn/Ferry International* | 55,100 | 629,242 |
| 2,066,719 |
Road & Rail 0.9% |
Old Dominion Freight Line, Inc.* | 22,200 | 631,812 |
Information Technology 31.3% |
Communications Equipment 1.1% |
Ciena Corp.* | 112,400 | 753,080 |
Electronic Equipment, Instruments & Components 4.0% |
Itron, Inc.* (a) | 43,200 | 2,753,568 |
Internet Software & Services 5.7% |
Bankrate, Inc.* (a) | 38,900 | 1,478,200 |
LoopNet, Inc.* (a) | 235,200 | 1,604,064 |
Omniture, Inc.* | 80,300 | 854,392 |
| 3,936,656 |
| Shares | Value ($) |
| |
IT Services 6.0% |
CyberSource Corp.* (a) | 200,500 | 2,403,995 |
Forrester Research, Inc.* | 62,900 | 1,774,409 |
| 4,178,404 |
Semiconductors & Semiconductor Equipment 7.2% |
Atheros Communications* | 92,100 | 1,317,951 |
Cavium Networks, Inc.* (a) | 77,100 | 810,321 |
Microsemi Corp.* | 47,400 | 599,136 |
Netlogic Microsystems, Inc.* | 56,000 | 1,232,560 |
Tessera Technologies, Inc.* | 90,600 | 1,076,328 |
| 5,036,296 |
Software 7.3% |
Blackboard, Inc.* | 67,300 | 1,765,279 |
Concur Technologies, Inc.* (a) | 33,100 | 1,086,342 |
FalconStor Software, Inc.* (a) | 190,300 | 529,034 |
Fundtech Ltd.* | 93,585 | 649,480 |
Informatica Corp.* | 32,000 | 439,360 |
Ultimate Software Group, Inc.* (a) | 43,100 | 629,260 |
| 5,098,755 |
Total Common Stocks (Cost $91,009,942) | 65,984,987 |
| Shares | Value ($) |
| |
Securities Lending Collateral 21.6% |
Daily Assets Fund Institutional, 1.69% (b) (c) (Cost $14,998,940) | 14,998,940 | 14,998,940 |
|
Cash Equivalents 6.5% |
Cash Management QP Trust, 1.42% (b) (Cost $4,508,380) | 4,508,380 | 4,508,380 |
| % of Net Assets | Value ($) |
| |
Total Investment Portfolio (Cost $110,517,262)+ | 123.1 | 85,492,307 |
Other Assets and Liabilities, Net (a) | (23.1) | (16,062,595) |
Net Assets | 100.0 | 69,429,712 |
|
* Non-income producing security.+ The cost for federal income tax purposes was $110,551,428. At December 31, 2008, net unrealized depreciation for all securities based on tax cost was $25,059,121. This consisted of aggregate gross unrealized appreciation for all securities in which there was an excess of value over tax cost of $4,803,766 and aggregate gross unrealized depreciation for all securities in which there was an excess of tax cost over value of $29,862,887.(a) All or a portion of these securities were on loan amounting to $14,779,614. In addition, included in other assets and liabilities, net is a pending sale, amounting to $147,346 that is also on loan (see Notes to Financial Statements). The value of all securities loaned at December 31, 2008 amounted to $14,926,960, which is 21.5% of net assets.(b) Affiliated fund managed by Deutsche Investment Management Americas Inc. The rate shown is the annualized seven-day yield at period end.(c) Represents collateral held in connection with securities lending. Income earned by the Portfolio is net of borrower rebates.ADR: American Depositary Receipt
Fair Value Measurements
The following is a summary of the inputs used as of December 31, 2008 in valuing the Portfolio's investments. For information on the Portfolio's policy regarding the valuation of investments and of the valuation inputs, and the aggregate levels used in the table below, please refer to the Security Valuation section of Note A in the accompanying Notes to the Financial Statements.
Valuation Inputs | Investments in Securities |
Level 1
| $ 80,983,927 |
Level 2
| 4,508,380 |
Level 3
| — |
Total | $ 85,492,307 |
The accompanying notes are an integral part of the financial statements.
Financial Statements
Statement of Assets and Liabilities as of December 31, 2008
|
Assets |
Investments:
Investments in securities, at value (cost $91,009,942) — including $14,779,614 of securities loaned | $ 65,984,987 |
Investment in Daily Assets Fund Institutional (cost $14,998,940)* | 14,998,940 |
Investment in Cash Management QP Trust (cost $4,508,380) | 4,508,380 |
Total investments, at value (cost $110,517,262)
| 85,492,307 |
Receivable for investments sold
| 207,998 |
Cash
| 25,618 |
Dividends receivable
| 11,171 |
Interest receivable
| 35,960 |
Receivable for Portfolio shares sold
| 142,705 |
Other assets
| 4,009 |
Total assets
| 85,919,768 |
Liabilities |
Payable for Portfolio shares redeemed
| 50,296 |
Payable upon return of securities loaned
| 14,998,940 |
Payable for investments purchased
| 1,243,640 |
Accrued management fee
| 31,186 |
Other accrued expenses and payables
| 165,994 |
Total liabilities
| 16,490,056 |
Net assets, at value | $ 69,429,712 |
Net Assets Consist of |
Accumulated net investment loss
| (16,609) |
Net unrealized appreciation (depreciation) on investments
| (25,024,955) |
Accumulated net realized gain (loss)
| (110,019,530) |
Paid-in capital
| 204,490,806 |
Net assets, at value | $ 69,429,712 |
Class A Net Asset Value, offering and redemption price per share ($69,415,664 ÷ 9,122,504 outstanding shares of beneficial interest, $.01 par value, unlimited number of shares authorized)
| $ 7.61 |
Class B Net Asset Value, offering and redemption price per share ($14,048 ÷ 1,867 outstanding shares of beneficial interest, $.01 par value, unlimited number of shares authorized)
| $ 7.52 |
* Represents collateral on securities loaned.The accompanying notes are an integral part of the financial statements.
Statement of Operations for the year ended December 31, 2008
|
Investment Income |
Income:
Dividends
| $ 287,746 |
Interest — Cash Management QP Trust
| 71,575 |
Securities lending income, including income from Daily Assets Fund Institutional, net of borrower rebates
| 645,012 |
Total Income
| 1,004,333 |
Expenses:
Management fee
| 733,616 |
Administration fee
| 74,373 |
Services to shareholders
| 316 |
Custodian fee
| 13,605 |
Distribution service fee (Class B)
| 4,740 |
Record keeping fees (Class B)
| 2,687 |
Legal fees
| 15,482 |
Audit and tax fees
| 63,831 |
Trustees' fees and expenses
| 20,529 |
Reports to shareholders and shareholder meeting
| 171,117 |
Other
| 5,375 |
Total expenses before expense reductions
| 1,105,671 |
Expense reductions
| (37,746) |
Total expenses after expense reductions
| 1,067,925 |
Net investment income (loss) | (63,592) |
Realized and Unrealized Gain (Loss) |
Net realized gain (loss) from investments
| (22,641,797) |
Change in net unrealized appreciation (depreciation) on investments
| (56,010,791) |
Net gain (loss) | (78,652,588) |
Net increase (decrease) in net assets resulting from operations | $ (78,716,180) |
The accompanying notes are an integral part of the financial statements.
Statement of Changes in Net Assets |
| Years Ended December 31, |
Increase (Decrease) in Net Assets | 2008 | 2007 |
Operations:
Net investment income (loss)
| $ (63,592) | $ (266,680) |
Net realized gain (loss)
| (22,641,797) | 29,911,986 |
Change in net unrealized appreciation (depreciation)
| (56,010,791) | (13,909,833) |
Net increase (decrease) in net assets resulting from operations
| (78,716,180) | 15,735,473 |
Portfolio share transactions:
Class A Proceeds from shares sold
| 5,995,281 | 7,088,648 |
Cost of shares redeemed
| (32,499,758) | (54,833,999) |
Net increase (decrease) in net assets from Class A share transactions
| (26,504,477) | (47,745,351) |
Class B Proceeds from shares sold
| 210,787 | 890,860 |
Cost of shares redeemed
| (6,249,807) | (33,397,002) |
Net increase (decrease) in net assets from Class B share transactions
| (6,039,020) | (32,506,142) |
Increase (decrease) in net assets | (111,259,677) | (64,516,020) |
Net assets at beginning of period
| 180,689,389 | 245,205,409 |
Net assets at end of period (including accumulated net investment loss of $16,609 and $16,875, respectively)
| $ 69,429,712 | $ 180,689,389 |
Other Information |
Class A Shares outstanding at beginning of period
| 11,529,906 | 14,686,087 |
Shares sold
| 539,106 | 469,331 |
Shares redeemed
| (2,946,508) | (3,625,512) |
Net increase (decrease) in Class A shares
| (2,407,402) | (3,156,181) |
Shares outstanding at end of period
| 9,122,504 | 11,529,906 |
Class B Shares outstanding at beginning of period
| 468,018 | 2,636,495 |
Shares sold
| 16,827 | 59,404 |
Shares redeemed
| (482,978) | (2,227,881) |
Net increase (decrease) in Class B shares
| (466,151) | (2,168,477) |
Shares outstanding at end of period
| 1,867 | 468,018 |
The accompanying notes are an integral part of the financial statements.
Financial Highlights
Class A Years Ended December 31, | 2008 | 2007 | 2006 | 2005 | 2004 |
Selected Per Share Data |
Net asset value, beginning of period | $ 15.07 | $ 14.19 | $ 13.48 | $ 12.59 | $ 11.34 |
Income (loss) from investment operations: Net investment income (loss)a | (.01) | (.01) | (.04)d | (.06) | (.05) |
Net realized and unrealized gain (loss) | (7.45) | .89 | .75 | .95 | 1.30 |
Total from investment operations | (7.46) | .88 | .71 | .89 | 1.25 |
Net asset value, end of period | $ 7.61 | $ 15.07 | $ 14.19 | $ 13.48 | $ 12.59 |
Total Return (%)
| (49.50)b | 6.20b | 5.27b,d | 7.07c | 11.02 |
Ratios to Average Net Assets and Supplemental Data |
Net assets, end of period ($ millions)
| 69 | 174 | 208 | 243 | 210 |
Ratio of expenses before expense reductions (%)
| .88 | .75 | .73 | .72 | .71 |
Ratio of expenses after expense reductions (%)
| .85 | .72 | .72 | .72 | .71 |
Ratio of net investment income (loss) (%)
| (.04) | (.09) | (.32)d | (.47) | (.47) |
Portfolio turnover rate (%)
| 67 | 67 | 73 | 94 | 117 |
a Based on average shares outstanding during the period.
b Total return would have been lower had certain expenses been reduced.
c In 2005, the Portfolio realized a gain of $49,496 on the disposal of an investment not meeting the Portfolio's investment restrictions. This violation had no negative impact on the total return.
d Includes non-recurring income from the Advisor recorded as a result of an administrative proceeding regarding disclosure of brokerage allocation practices in connection with sales of DWS Funds. The non-recurring income resulted in an increase in net investment income of $0.008 per share and an increase in the ratio of net investment income of 0.06%. Excluding this non-recurring income, total return would have been 0.06% lower.
|
Class B Years Ended December 31, | 2008 | 2007 | 2006 | 2005 | 2004 |
Selected Per Share Data |
Net asset value, beginning of period | $ 14.77 | $ 13.96 | $ 13.32 | $ 12.48 | $ 11.29 |
Income (loss) from investment operations: Net investment income (loss)a | (.07) | (.07) | (.09)d | (.11) | (.10) |
Net realized and unrealized gain (loss) | (7.18) | .88 | .73 | .95 | 1.29 |
Total from investment operations | (7.25) | .81 | .64 | .84 | 1.19 |
Net asset value, end of period | $ 7.52 | $ 14.77 | $ 13.96 | $ 13.32 | $ 12.48 |
Total Return (%)b
| (49.09) | 5.80 | 4.80d | 6.73c | 10.54 |
Ratios to Average Net Assets and Supplemental Data |
Net assets, end of period ($ millions)
| .01 | 7 | 37 | 39 | 28 |
Ratio of expenses before expense reductions (%)
| 1.39 | 1.13 | 1.12 | 1.12 | 1.10 |
Ratio of expenses after expense reductions (%)
| 1.29 | 1.09 | 1.09 | 1.09 | 1.09 |
Ratio of net investment income (loss) (%)
| (.48) | (.46) | (.69)d | (.84) | (.85) |
Portfolio turnover rate (%)
| 67 | 67 | 73 | 94 | 117 |
a Based on average shares outstanding during the period.
b Total return would have been lower had certain expenses not been reduced.
c In 2005, the Portfolio realized a gain of $49,496 on the disposal of an investment not meeting the Portfolio's investment restrictions. This violation had no negative impact on the total return.
d Includes non-recurring income from the Advisor recorded as a result of an administrative proceeding regarding disclosure of brokerage allocation practices in connection with sales of DWS Funds. The non-recurring income resulted in an increase in net investment income of $0.008 per share and an increase in the ratio of net investment income of 0.06%. Excluding this non-recurring income, total return would have been 0.06% lower.
|
Performance Summary December 31, 2008
DWS Strategic Income VIP
All performance shown is historical, assumes reinvestment of all dividend and capital gain distributions and does not guarantee future results. Investment return and principal value fluctuate with changing market conditions so that, when redeemed, shares may be worth more or less than their original cost. Current performance may be lower or higher than the performance data quoted. Please contact your participating insurance company for the Portfolio's most recent month-end performance. Performance doesn't reflect charges and fees ("contract charges") associated with the separate account that invests in the Portfolio or any variable life insurance policy or variable annuity contract for which the Portfolio is an investment option. These charges and fees will reduce returns. While all share classes have the same underlying portfolio, their performance will differ.
The total annual portfolio operating expense ratios, gross of any fee waivers or expense reimbursements, as stated in the fee table of the prospectus dated May 1, 2008 are 0.89% and 1.14% for Class A and Class B shares, respectively. Please see the Information About Your Portfolio's Expenses, the Financial Highlights and Notes to the Financial Statements (Note C, Related Parties) sections of this report for gross and net expense related disclosure for the period ended December 31, 2008.
Risk Considerations
The Portfolio invests in individual bonds whose yields and market values fluctuate so that your investment may be worth more or less than its original cost. Bond investments are subject to interest-rate risk such that when interest rates rise, the prices of the bonds, and thus the value of the bond investment, can decline and the investor can lose principal value. Additionally, investments by the Portfolio in lower-rated bonds present greater risk to principal and income than investments in higher-quality securities. The Portfolio invests in derivatives seeking to hedge positions in certain securities and to generate income in order to enhance the Portfolio's returns. Derivatives can be more volatile and less liquid than traditional fixed-income securities. Finally, investing in foreign securities presents certain risks, such as currency fluctuation, political and economic changes and market risks. All of these factors may result in greater share price volatility. Please read this Portfolio's prospectus for specific details regarding its investments and risk profile.
Portfolio returns for all periods shown reflect a fee waiver and/or expense reimbursement. Without this waiver/reimbursement, returns would have been lower.
Growth of an Assumed $10,000 Investment in DWS Strategic Income VIP |
[] DWS Strategic Income VIP — Class A [] Citigroup World Government Bond Index [] JP Morgan Emerging Markets Bond Index Plus [] Credit Suisse High Yield Index [] Barclays Capital US Treasury Index | The Citigroup World Government Bond Index is an unmanaged index comprised of government bonds from 22 developed countries (including the US) with maturities greater than one year. The JP Morgan Emerging Markets Bond Index Plus is an unmanaged foreign securities index of US dollar- and other external-currency-denominated Brady bonds, loans, Eurobonds and local market debt instruments traded in emerging markets. The Credit Suisse High Yield Index is an unmanaged, trader-priced portfolio constructed to mirror the global high-yield debt market. The Barclays Capital US Treasury Index (name changed from Lehman Brothers US Treasury Index, effective November 3, 2008) is an unmanaged index reflecting the performance of all public obligations and does not focus on one particular segment of the Treasury market. Index returns, unlike portfolio returns, do not reflect any fees or expenses. It is not possible to invest directly into an index. |
 | |
Yearly periods ended December 31 |
|
Comparative Results |
DWS Strategic Income VIP | 1-Year | 3-Year | 5-Year | 10-Year |
Class A | Growth of $10,000
| $9,225 | $10,600 | $11,786 | $14,377 |
Average annual total return
| -7.75% | 1.96% | 3.34% | 3.70% |
Citigroup World Government Bond Index
| Growth of $10,000
| $11,089 | $13,056 | $13,416 | $17,739 |
Average annual total return
| 10.89% | 9.30% | 6.05% | 5.90% |
JP Morgan Emerging Markets Bond Index Plus
| Growth of $10,000
| $9,030 | $10,620 | $13,278 | $28,249 |
Average annual total return
| -9.70% | 2.03% | 5.83% | 10.94% |
Credit Suisse High Yield Index
| Growth of $10,000
| $7,383 | $8,481 | $9,710 | $13,266 |
Average annual total return
| -26.17% | -5.34% | -.59% | 2.87% |
Barclays Capital US Treasury Index
| Growth of $10,000
| $11,374 | $12,781 | $13,602 | $18,358 |
Average annual total return
| 13.74% | 8.52% | 6.35% | 6.26% |
The growth of $10,000 is cumulative.
Comparative Results |
DWS Strategic Income VIP | 1-Year | 3-Year | 5-Year | Life of Class* |
Class B | Growth of $10,000
| $9,200 | $10,512 | $11,600 | $11,945 |
Average annual total return
| -8.00% | 1.68% | 3.01% | 3.18% |
Citigroup World Government Bond Index
| Growth of $10,000
| $11,089 | $13,056 | $13,416 | $14,775 |
Average annual total return
| 10.89% | 9.30% | 6.05% | 7.13% |
JP Morgan Emerging Markets Bond Index Plus
| Growth of $10,000
| $9,030 | $10,620 | $13,278 | $14,965 |
Average annual total return
| -9.70% | 2.03% | 5.83% | 7.37% |
Credit Suisse High Yield Index
| Growth of $10,000
| $7,383 | $8,481 | $9,710 | $11,056 |
Average annual total return
| -26.17% | -5.34% | -.59% | 1.78% |
Barclays Capital US Treasury Index
| Growth of $10,000
| $11,374 | $12,781 | $13,602 | $13,707 |
Average annual total return
| 13.74% | 8.52% | 6.35% | 5.72% |
The growth of $10,000 is cumulative.
* The Portfolio commenced offering Class B shares on May 1, 2003. Index returns began on April 30, 2003.Information About Your Portfolio's Expenses
DWS Strategic Income VIP
As an investor of the Portfolio, you incur two types of costs: ongoing expenses and transaction costs. Ongoing expenses include management fees, distribution and service (12b-1) fees and other Portfolio expenses. Examples of transaction costs include contract charges, redemption fees and account maintenance fees, which are not shown in this section. The following tables are intended to help you understand your ongoing expenses (in dollars) of investing in the Portfolio and to help you compare these expenses with the ongoing expenses of investing in other mutual funds. In the most recent six-month period, the Portfolio limited these expenses; had it not done so, expenses would have been higher. The example in the table is based on an investment of $1,000 invested at the beginning of the six-month period and held for the entire period (July 1, 2008 to December 31, 2008).
The tables illustrate your Portfolio's expenses in two ways:
• Actual Portfolio Return. This helps you estimate the actual dollar amount of ongoing expenses (but not transaction costs) paid on a $1,000 investment in the Portfolio using the Portfolio's actual return during the period. To estimate the expenses you paid over the period, simply divide your account value by $1,000 (for example, an $8,600 account value divided by $1,000 = 8.6), then multiply the result by the number in the "Expenses Paid per $1,000" line under the share class you hold.
• Hypothetical 5% Portfolio Return. This helps you to compare your Portfolio's ongoing expenses (but not transaction costs) with those of other mutual funds using the Portfolio's actual expense ratio and a hypothetical rate of return of 5% per year before expenses. Examples using a 5% hypothetical Portfolio return may be found in the shareholder reports of other mutual funds. The hypothetical account values and expenses may not be used to estimate the actual ending account balance or expenses you paid for the period.
Please note that the expenses shown in these tables are meant to highlight your ongoing expenses only and do not reflect any transaction costs. The "Expenses Paid per $1,000" line of the tables is useful in comparing ongoing expenses only and will not help you determine the relative total expense of owning different funds. If these transaction costs had been included, your costs would have been higher.
Expenses and Value of a $1,000 Investment for the six months ended December 31, 2008 |
Actual Portfolio Return | Class A | | Class B | |
Beginning Account Value 7/1/08
| $ 1,000.00 | | $ 1,000.00 | |
Ending Account Value 12/31/08
| $ 920.90 | | $ 932.60 | |
Expenses Paid per $1,000*
| $ 4.15 | | $ 5.49 | |
Hypothetical 5% Portfolio Return | Class A | | Class B | |
Beginning Account Value 7/1/08
| $ 1,000.00 | | $ 1,000.00 | |
Ending Account Value 12/31/08
| $ 1,020.81 | | $ 1,019.46 | |
Expenses Paid per $1,000*
| $ 4.37 | | $ 5.74 | |
* Expenses are equal to the Portfolio's annualized expense ratio for each share class, multiplied by the average account value over the period, multiplied by the number of days in the most recent six-month period, then divided by 366.Annualized Expense Ratios | Class A | | Class B | |
DWS Variable Series II — DWS Strategic Income VIP
| .86% | | 1.13% | |
For more information, please refer to the Portfolio's prospectus.
These tables do not reflect charges and fees ("contract charges") associated with the separate account that invests in the Portfolio or any variable life insurance policy or variable annuity contract for which the Portfolio is an investment option.
Management Summary December 31, 2008
DWS Strategic Income VIP
While the rapid swings and overall decline in stock prices garnered most of the headlines during the past 12 months, the bond market also had its share of volatility. The cause of this volatility was the ongoing fallout from the housing and credit crises, which led to the outright failure or forced mergers of numerous financial institutions in both the United States and Europe. The resulting credit crunch led to a slowdown in global economic growth, which accelerated late in the period. In this environment, investors' risk appetites evaporated and liquidity all but disappeared. This led to a frantic "flight to quality" into the safe haven of US Treasuries and underperformance for virtually all other segments of the bond market. Lower-quality issues — most notably corporate bonds with the lowest credit ratings — underperformed the broader bond market by a wide margin. The situation was largely the same overseas, where the best performance was generated by the government bond markets of the developed economies.
The Portfolio posted a -7.75% return for the period ending December 31, 2008 (Class A shares, unadjusted for contract charges). This compares with the Portfolio benchmarks' returns of -9.70% for the JPMorgan Emerging Markets Bond Index Plus, -26.17% for the Credit Suisse High Yield Index, 13.74% for the Barclays Capital US Treasury Index and 10.89% for the Citigroup World Government Bond Index.
In the past, the Portfolio's broad exposure to a wide range of fixed-income asset classes has been one of the most important factors in its strong long-term track record. During the past year, however, the severe underperformance of the non-government segments of the bond market made such diversification a liability. During the year, we maintained significant exposure to both high-yield and emerging-markets bonds. This positioning had a negative impact on the Portfolio's relative return for the period, as both asset classes were down sharply. On the positive side, the Portfolio's relatively long overall duration during the year aided performance in a declining interest rate environment.1 Over the second half of the year, we began shifting the Portfolio to a higher-quality profile in view of the continued weak outlook for the global economy, trimming our exposure to high-yield and emerging-markets bonds. In addition, we have been seeking to increase exposure to the Eurozone, UK and Canada, where central banks have more room to lower rates than in the US.
In addition to the main investment strategy, we employ a global tactical asset allocation strategy. This strategy, which the Advisor calls iGAP (integrated Global Alpha Platform) detracted from the Portfolio's return.
Gary Sullivan, CFA William Chepolis, CFA
Matthew F. MacDonald, CFA Thomas Picciochi
Robert Wang
Portfolio Managers, Deutsche Investment Management Americas Inc.
The JPMorgan Emerging Markets Bond Index Plus is an unmanaged foreign securities index of US dollar and other external-currency-denominated Brady bonds, loans, Eurobonds and local market debt instruments traded in emerging markets.
Credit Suisse High Yield Index is an unmanaged, trader-priced portfolio constructed to mirror the global high-yield debt market.
The Barclays Capital US Treasury Index (name changed from Lehman Brothers US Treasury Index, effective November 3, 2008) is an unmanaged index reflecting the performance of all public obligations and does not focus on one particular segment of the Treasury market.
The Citigroup World Government Bond Index is an unmanaged index comprised of government bonds from 22 developed countries, including the US, with maturities greater than one year.
Index returns, unlike portfolio returns, do not reflect fees or expenses. It is not possible to invest directly into an index.
1 Duration is a measure of bond price volatility. Duration can be defined as the approximate percentage change in price for a 100-basis-point (one single percentage point) change in market interest rate levels. A duration of 1.25, for example, means that the price of a bond or bond portfolio should rise by approximately 1.25% for a one-percentage-point drop in interest rates, and that it should fall by 1.25% for a one-percentage-point rise in interest rates.Portfolio management market commentary is as of December 31, 2008, and may not come to pass. This information is subject to change at any time based on market and other conditions. Past performance does not guarantee future results. Current and future portfolio holdings are subject to risk.
Portfolio Summary
DWS Strategic Income VIP
Asset Allocation (As a % of Investment Portfolio excluding Securities Lending Collateral) | 12/31/08 | 12/31/07 |
| | |
Government & Agency Obligations | 42% | 44% |
Corporate Bonds | 42% | 34% |
Cash Equivalents | 6% | 13% |
Mortgage-Backed Securities Pass-Throughs | 3% | — |
Commercial and Non-Agency Mortgage-Backed Securities | 2% | 5% |
Loan Participations and Assignments | 2% | 3% |
Municipal Bonds and Notes | 1% | — |
Collateralized Mortgage Obligations | 1% | — |
Asset Backed | 1% | 1% |
| 100% | 100% |
Quality (Excludes Securities Lending Collateral) | 12/31/08 | 12/31/07 |
| | |
Cash Equivalents | 5% | 15% |
AAA | 31% | 17% |
AA | 1% | 1% |
A | 15% | 5% |
BBB | 8% | 7% |
BB | 15% | 20% |
B | 15% | 16% |
CCC | 3% | 4% |
Below CCC | 1% | — |
Not Rated | 6% | 15% |
| 100% | 100% |
Effective Maturity (Excludes Cash Equivalents and Securities Lending Collateral) | 12/31/08 | 12/31/07 |
| | |
Under 1 year | — | — |
1-4.99 years | 46% | 52% |
5-9.99 years | 35% | 33% |
10-14.99 years | 6% | 2% |
15 years or greater | 13% | 13% |
| 100% | 100% |
Interest Rate Sensitivity | 12/31/08 | 12/31/07 |
| | |
Effective maturity | 7.4 years | 6.6 years |
Average duration | 5.1 years | 3.5 years |
Asset allocation, quality, effective maturity and interest rate sensitivity are subject to change.
The quality ratings represent the lower of Moody's Investors Service, Inc. ("Moody's") or Standard & Poor's Corporation ("S&P") credit ratings. The ratings of Moody's and S&P represent their opinions as to the quality of the securities they rate. Ratings are relative and subjective and are not absolute standards of quality. The Portfolio's credit quality does not remove market risk.
For more complete details about the Portfolio's investment portfolio, see page 254. A complete list of portfolio holdings of the portfolio is posted as of the month end on www.dws-investments.com on or about the 15th day of the following month. More frequent posting of portfolio holdings information may be made from time to time on www.dws-investments.com.
Following the Portfolio's fiscal first and third quarter-end, a complete portfolio holdings listing is filed with the SEC on Form N-Q. The form will be available on the SEC's Web site at www.sec.gov, and it also may be reviewed and copied at the SEC's Public Reference Room in Washington, D.C. Information on the operation of the SEC's Public Reference Room may be obtained by calling (800) SEC-0330.
Investment Portfolio December 31, 2008
DWS Strategic Income VIP
| Principal Amount ($)(a) | Value ($) |
| |
Corporate Bonds 41.5% |
Consumer Discretionary 3.9% |
AMC Entertainment, Inc., 8.0%, 3/1/2014 | 105,000 | 64,575 |
American Achievement Corp., 144A, 8.25%, 4/1/2012 | 30,000 | 23,100 |
American Achievement Group Holding Corp., 16.75%, 10/1/2012 (PIK) | 54,911 | 13,179 |
Asbury Automotive Group, Inc.: | | |
7.625%, 3/15/2017 | 65,000 | 30,225 |
8.0%, 3/15/2014 | 30,000 | 14,250 |
Ashtead Holdings PLC, 144A, 8.625%, 8/1/2015 | 120,000 | 63,000 |
Cablevision Systems Corp., Series B, 8.334%***, 4/1/2009 | 25,000 | 24,937 |
CanWest MediaWorks LP, 144A, 9.25%, 8/1/2015 | 50,000 | 19,000 |
Carrols Corp., 9.0%, 1/15/2013 | 30,000 | 20,250 |
Charter Communications Operating LLC, 144A, 10.875%, 9/15/2014 | 160,000 | 128,000 |
Cox Communications, Inc., 144A, 9.375%, 1/15/2019 | 400,000 | 418,520 |
CSC Holdings, Inc.: | | |
6.75%, 4/15/2012 (b) | 50,000 | 45,750 |
Series B, 7.625%, 4/1/2011 (b) | 55,000 | 51,837 |
Series B, 8.125%, 7/15/2009 | 55,000 | 54,725 |
Series B, 8.125%, 8/15/2009 | 110,000 | 109,450 |
Denny's Holdings, Inc., 10.0%, 10/1/2012 | 20,000 | 13,850 |
DIRECTV Holdings LLC, 7.625%, 5/15/2016 (b) | 145,000 | 140,650 |
Dollarama Group LP, 8.073%***, 8/15/2012 (c) | 52,000 | 33,020 |
EchoStar DBS Corp.: | | |
6.375%, 10/1/2011 | 100,000 | 93,000 |
6.625%, 10/1/2014 | 65,000 | 54,275 |
7.125%, 2/1/2016 (b) | 80,000 | 66,800 |
Fontainebleau Las Vegas Holdings LLC, 144A, 10.25%, 6/15/2015 | 65,000 | 6,338 |
Great Canadian Gaming Corp., 144A, 7.25%, 2/15/2015 | 55,000 | 37,400 |
Group 1 Automotive, Inc., 8.25%, 8/15/2013 | 30,000 | 20,100 |
Hertz Corp., 8.875%, 1/1/2014 (b) | 115,000 | 70,725 |
Idearc, Inc., 8.0%, 11/15/2016 | 125,000 | 9,375 |
Indianapolis Downs LLC, 144A, 11.0%, 11/1/2012 | 40,000 | 21,800 |
Isle of Capri Casinos, Inc., 7.0%, 3/1/2014 | 70,000 | 29,750 |
Kabel Deutschland GmbH, 10.625%, 7/1/2014 | 150,000 | 133,500 |
Lamar Media Corp., Series C, 6.625%, 8/15/2015 (b) | 40,000 | 28,900 |
Liberty Media LLC, 5.7%, 5/15/2013 | 10,000 | 6,556 |
MediMedia USA, Inc., 144A, 11.375%, 11/15/2014 | 30,000 | 18,000 |
MGM MIRAGE: | | |
6.625%, 7/15/2015 (b) | 65,000 | 39,650 |
8.375%, 2/1/2011 | 65,000 | 38,675 |
MTR Gaming Group, Inc., Series B, 9.75%, 4/1/2010 | 85,000 | 63,750 |
| Principal Amount ($)(a) | Value ($) |
| |
Norcraft Holdings LP, 9.75%, 9/1/2012 | 155,000 | 115,475 |
Penske Automotive Group, Inc., 7.75%, 12/15/2016 | 125,000 | 58,125 |
Pinnacle Entertainment, Inc., 8.75%, 10/1/2013 | 40,000 | 31,600 |
Quebecor Media, Inc., 7.75%, 3/15/2016 | 40,000 | 27,000 |
Quebecor World, Inc., 144A, 9.75%, 1/15/2015** | 45,000 | 3,544 |
Reader's Digest Association, Inc., 9.0%, 2/15/2017 | 50,000 | 4,313 |
Sabre Holdings Corp., 8.35%, 3/15/2016 | 50,000 | 11,125 |
Seminole Hard Rock Entertainment, Inc., 144A, 4.496%***, 3/15/2014 | 65,000 | 32,987 |
Shingle Springs Tribal Gaming Authority, 144A, 9.375%, 6/15/2015 | 50,000 | 25,000 |
Simmons Co., Step-up Coupon, 0% to 12/15/2009, 10.0% to 12/15/2014 | 185,000 | 21,275 |
Sinclair Television Group, Inc., 8.0%, 3/15/2012 (b) | 49,000 | 36,872 |
Sirius XM Radio, Inc., 9.625%, 8/1/2013 | 120,000 | 22,350 |
Sonic Automotive,
Inc., Series B, 8.625%, 8/15/2013 | 55,000 | 20,488 |
Travelport LLC: | | |
6.828%***, 9/1/2014 | 45,000 | 13,275 |
9.875%, 9/1/2014 | 10,000 | 3,750 |
Trump Entertainment Resorts, Inc., 8.5%, 6/1/2015 | 15,000 | 1,988 |
United Components, Inc., 9.375%, 6/15/2013 | 10,000 | 4,200 |
Unity Media GmbH, 144A, 8.75%, 2/15/2015 EUR | 150,000 | 163,678 |
UPC Holding BV: | | |
144A, 7.75%, 1/15/2014 EUR | 100,000 | 106,339 |
144A, 8.0%, 11/1/2016 EUR | 50,000 | 48,304 |
Vertis, Inc.,
13.5%, 4/1/2014 (PIK) | 18,857 | 4,399 |
Vitro SAB de CV,
9.125%, 2/1/2017 | 220,000 | 66,000 |
Young Broadcasting, Inc., 8.75%, 1/15/2014 | 275,000 | 2,750 |
| 2,831,749 |
Consumer Staples 1.4% |
Alliance One International, Inc., 8.5%, 5/15/2012 | 20,000 | 14,700 |
Altria Group, Inc.: | | |
8.5%, 11/10/2013 | 45,000 | 46,609 |
9.7%, 11/10/2018 | 25,000 | 27,021 |
Delhaize America, Inc.: | | |
8.05%, 4/15/2027 | 20,000 | 18,508 |
9.0%, 4/15/2031 | 132,000 | 133,494 |
General Nutrition Centers, Inc., 7.584%***, 3/15/2014 (PIK) | 40,000 | 22,400 |
North Atlantic Trading Co., 144A, 10.0%, 3/1/2012 | 223,000 | 122,650 |
Reynolds American, Inc., 6.75%, 6/15/2017 | 600,000 | 476,272 |
| Principal Amount ($)(a) | Value ($) |
| |
Smithfield Foods, Inc., 7.75%, 7/1/2017 | 20,000 | 11,400 |
Viskase Companies, Inc., 11.5%, 6/15/2011 | 225,000 | 146,250 |
| 1,019,304 |
Energy 4.4% |
Atlas Energy Resources LLC, 144A, 10.75%, 2/1/2018 | 115,000 | 70,150 |
Belden & Blake Corp., 8.75%, 7/15/2012 | 310,000 | 212,350 |
Bristow Group, Inc., 7.5%, 9/15/2017 | 70,000 | 46,900 |
Chaparral Energy, Inc., 8.5%, 12/1/2015 | 110,000 | 22,000 |
Chesapeake Energy Corp.: | | |
6.25%, 1/15/2018 | 75,000 | 55,500 |
6.875%, 1/15/2016 | 170,000 | 136,000 |
7.25%, 12/15/2018 (b) | 110,000 | 85,800 |
7.5%, 6/15/2014 | 25,000 | 21,125 |
Cimarex Energy Co., 7.125%, 5/1/2017 | 45,000 | 35,100 |
Colorado Interstate Gas Co., 6.8%, 11/15/2015 | 30,000 | 25,845 |
Delta Petroleum Corp., 7.0%, 4/1/2015 | 100,000 | 20,000 |
Dynegy Holdings, Inc., 6.875%, 4/1/2011 (b) | 15,000 | 13,125 |
El Paso Corp.: | | |
7.25%, 6/1/2018 (b) | 140,000 | 111,114 |
9.625%, 5/15/2012 | 50,000 | 42,455 |
EXCO Resources, Inc., 7.25%, 1/15/2011 | 95,000 | 74,100 |
Forest Oil Corp., 144A, 7.25%, 6/15/2019 | 35,000 | 25,550 |
Frontier Oil Corp.: | | |
6.625%, 10/1/2011 | 40,000 | 36,200 |
8.5%, 9/15/2016 | 80,000 | 70,600 |
GAZ Capital (Gazprom), 144A, 6.51%, 3/7/2022 | 130,000 | 77,350 |
GulfSouth Pipeline Co., LP, 144A, 5.75%, 8/15/2012 | 15,000 | 13,410 |
KCS Energy, Inc., 7.125%, 4/1/2012 | 240,000 | 180,000 |
Kinder Morgan Energy Partners LP, 9.0%, 2/1/2019 | 155,000 | 161,717 |
Mariner Energy, Inc.: | | |
7.5%, 4/15/2013 | 60,000 | 38,400 |
8.0%, 5/15/2017 | 95,000 | 49,400 |
Newfield Exploration Co., 7.125%, 5/15/2018 | 90,000 | 71,100 |
OPTI Canada, Inc.: | | |
7.875%, 12/15/2014 | 90,000 | 45,900 |
8.25%, 12/15/2014 (b) | 160,000 | 86,400 |
Pemex Project Funding Master Trust, 144A, 5.75%, 3/1/2018 | 460,000 | 405,950 |
Petrohawk Energy Corp.: | | |
144A, 7.875%, 6/1/2015 | 30,000 | 22,200 |
9.125%, 7/15/2013 | 65,000 | 52,650 |
Plains Exploration & Production Co.: | | |
7.0%, 3/15/2017 | 60,000 | 41,100 |
7.625%, 6/1/2018 | 110,000 | 75,350 |
Quicksilver Resources, Inc., 7.125%, 4/1/2016 | 170,000 | 90,950 |
Range Resources Corp., 7.25%, 5/1/2018 | 10,000 | 8,350 |
| Principal Amount ($)(a) | Value ($) |
| |
SandRidge Energy, Inc., 144A, 8.0%, 6/1/2018 | 45,000 | 24,975 |
Southwestern Energy Co., 144A, 7.5%, 2/1/2018 | 85,000 | 74,375 |
Stone Energy Corp.: | | |
6.75%, 12/15/2014 | 105,000 | 51,450 |
8.25%, 12/15/2011 | 160,000 | 99,200 |
Tennessee Gas Pipeline Co., 7.625%, 4/1/2037 | 25,000 | 19,843 |
Tesoro Corp., 6.5%, 6/1/2017 | 60,000 | 32,925 |
Whiting Petroleum Corp.: | | |
7.25%, 5/1/2012 | 125,000 | 93,125 |
7.25%, 5/1/2013 | 20,000 | 14,200 |
Williams Companies, Inc.: | | |
8.125%, 3/15/2012 | 180,000 | 165,825 |
8.75%, 3/15/2032 | 115,000 | 85,675 |
Williams Partners LP, 7.25%, 2/1/2017 | 45,000 | 35,550 |
| 3,221,284 |
Financials 14.7% |
Algoma Acquisition Corp., 144A, 9.875%, 6/15/2015 | 125,000 | 47,500 |
Ashton Woods USA LLC, 9.5%, 10/1/2015** | 145,000 | 29,000 |
Buffalo Thunder Development Authority, 144A, 9.375%, 12/15/2014 | 30,000 | 6,000 |
CIT Group, Inc.,
5.4%, 2/13/2012 | 400,000 | 322,723 |
Citigroup, Inc.,
6.5%, 8/19/2013 | 70,000 | 70,636 |
Commonwealth Bank
of Australia,
8.7%***, 7/21/2016 | 1,000,000 | 987,190 |
Conproca SA de CV, REG S, 12.0%, 6/16/2010 | 207,300 | 210,928 |
Depfa ACS Bank, 144A, 9.5%***, 10/6/2023 | 1,000,000 | 920,000 |
Ford Motor Credit Co., LLC: | | |
7.25%, 10/25/2011 | 125,000 | 91,314 |
7.875%, 6/15/2010 | 140,000 | 112,025 |
GMAC LLC, 144A, 6.875%, 9/15/2011 | 297,000 | 212,227 |
Hawker Beechcraft Acquisition Co., LLC: | | |
8.5%, 4/1/2015 | 145,000 | 59,450 |
8.875%, 4/1/2015 (PIK) | 100,000 | 34,000 |
Hexion US Finance Corp., 9.75%, 11/15/2014 | 35,000 | 9,975 |
Inmarsat Finance PLC, 10.375%, 11/15/2012 | 135,000 | 119,644 |
iPayment, Inc.,
9.75%, 5/15/2014 | 45,000 | 22,500 |
Kreditanstalt fuer
Wiederaufbau: | | |
2.05%, 2/16/2026 JPY | 300,000,000 | 3,206,178 |
5.0%, 7/4/2011 EUR | 2,350,000 | 3,442,905 |
Local TV Finance LLC, 144A, 9.25%, 6/15/2015 (PIK) | 50,000 | 11,000 |
New ASAT (Finance) Ltd., 9.25%, 2/1/2011 | 90,000 | 9,450 |
NiSource Finance Corp.: | | |
6.15%, 3/1/2013 | 10,000 | 7,705 |
7.875%, 11/15/2010 | 75,000 | 68,632 |
Orascom Telecom Finance SCA, 144A, 7.875%, 2/8/2014 | 100,000 | 53,000 |
| Principal Amount ($)(a) | Value ($) |
| |
Qwest Capital Funding, Inc., 7.0%, 8/3/2009 | 50,000 | 49,000 |
Rainbow National Services LLC, 144A,
10.375%, 9/1/2014 | 13,000 | 11,570 |
Sprint Capital Corp.: | | |
7.625%, 1/30/2011 | 50,000 | 41,750 |
8.375%, 3/15/2012 (b) | 20,000 | 16,000 |
Tropicana Entertainment LLC, 9.625%, 12/15/2014** | 150,000 | 1,500 |
UCI Holdco, Inc., 9.996%***, 12/15/2013 (PIK) | 69,429 | 11,803 |
Universal City Development Partners, 11.75%, 4/1/2010 | 235,000 | 151,575 |
Wachovia Corp., 3.625%, 2/17/2009 | 250,000 | 248,974 |
Williams Companies, Inc., Credit Linked Certificate
Trust, 144A,
6.75%, 4/15/2009 | 10,000 | 9,912 |
Wind Acquisition Finance SA, 144A, 9.75%, 12/1/2015 EUR | 100,000 | 113,289 |
| 10,709,355 |
Health Care 1.9% |
Advanced Medical Optics, Inc., 7.5%, 5/1/2017 | 90,000 | 45,900 |
Boston Scientific Corp., 6.0%, 6/15/2011 | 75,000 | 71,250 |
Community Health Systems, Inc., 8.875%, 7/15/2015 | 400,000 | 368,000 |
HCA, Inc.: | | |
9.125%, 11/15/2014 (b) | 95,000 | 88,113 |
9.25%, 11/15/2016 | 290,000 | 266,075 |
9.625%, 11/15/2016 (PIK) | 145,000 | 113,100 |
HEALTHSOUTH Corp., 10.75%, 6/15/2016 | 50,000 | 45,875 |
IASIS Healthcare LLC, 8.75%, 6/15/2014 | 75,000 | 58,125 |
Psychiatric Solutions, Inc., 7.75%, 7/15/2015 | 60,000 | 44,100 |
Surgical Care Affiliates, Inc., 144A, 8.875%,
7/15/2015 (PIK) | 55,000 | 33,550 |
The Cooper Companies, Inc., 7.125%, 2/15/2015 | 95,000 | 79,800 |
Vanguard Health Holding Co. I, LLC, Step-up Coupon, 0% to 10/1/2009, 11.25% to 10/1/2015 | 75,000 | 58,875 |
Vanguard Health Holding Co. II, LLC, 9.0%, 10/1/2014 | 150,000 | 125,250 |
| 1,398,013 |
Industrials 3.6% |
Actuant Corp.,
6.875%, 6/15/2017 | 40,000 | 30,100 |
Allied Waste North America, Inc., 6.5%, 11/15/2010 | 40,000 | 38,600 |
ARAMARK Corp., 8.5%, 2/1/2015 (b) | 20,000 | 18,100 |
Baldor Electric Co., 8.625%, 2/15/2017 (b) | 45,000 | 33,525 |
BE Aerospace, Inc., 8.5%, 7/1/2018 (b) | 105,000 | 94,500 |
Belden, Inc., 7.0%, 3/15/2017 | 45,000 | 33,750 |
Bombardier, Inc., 144A, 6.75%, 5/1/2012 | 100,000 | 88,750 |
Browning-Ferris Industries, Inc., 7.4%, 9/15/2035 | 165,000 | 136,120 |
| Principal Amount ($)(a) | Value ($) |
| |
Cenveo Corp., 144A, 10.5%, 8/15/2016 | 55,000 | 31,900 |
Congoleum Corp., 8.625%, 8/1/2008** | 125,000 | 93,750 |
DRS Technologies, Inc.: | | |
6.625%, 2/1/2016 | 135,000 | 135,000 |
6.875%, 11/1/2013 | 195,000 | 194,025 |
7.625%, 2/1/2018 | 165,000 | 165,000 |
Esco Corp., 144A, 8.625%, 12/15/2013 | 95,000 | 66,500 |
General Cable Corp.: | | |
6.258%***, 4/1/2015 | 55,000 | 25,713 |
7.125%, 4/1/2017 | 55,000 | 36,300 |
Great Lakes Dredge & Dock Co., 7.75%, 12/15/2013 | 50,000 | 38,562 |
K. Hovnanian Enterprises, Inc., 8.875%, 4/1/2012 | 55,000 | 15,950 |
Kansas City Southern de Mexico SA de CV: | | |
7.375%, 6/1/2014 | 95,000 | 77,729 |
7.625%, 12/1/2013 | 155,000 | 127,100 |
9.375%, 5/1/2012 | 150,000 | 137,250 |
Kansas City Southern Railway Co.: | | |
7.5%, 6/15/2009 | 45,000 | 45,112 |
8.0%, 6/1/2015 (b) | 100,000 | 79,000 |
Mobile Mini, Inc., 9.75%, 8/1/2014 | 65,000 | 46,150 |
Moog, Inc., 144A, 7.25%, 6/15/2018 | 20,000 | 16,000 |
Navios Maritime Holdings, Inc., 9.5%, 12/15/2014 | 75,000 | 41,625 |
Ply Gem Industries, Inc., 11.75%, 6/15/2013 | 40,000 | 21,600 |
R.H. Donnelley Corp., Series A-4, 8.875%, 10/15/2017 | 165,000 | 24,750 |
RBS Global & Rexnord Corp., 9.5%, 8/1/2014 | 45,000 | 33,525 |
Seitel, Inc., 9.75%, 2/15/2014 | 35,000 | 12,600 |
Titan International, Inc., 8.0%, 1/15/2012 | 195,000 | 144,300 |
TransDigm, Inc., 7.75%, 7/15/2014 | 30,000 | 24,600 |
United Rentals North America, Inc.: | | |
6.5%, 2/15/2012 | 125,000 | 98,750 |
7.0%, 2/15/2014 | 175,000 | 106,750 |
United Technologies Corp., 6.125%, 2/1/2019 | 235,000 | 251,425 |
US Concrete, Inc., 8.375%, 4/1/2014 | 55,000 | 29,700 |
Vought Aircraft Industries, Inc., 8.0%, 7/15/2011 | 35,000 | 23,625 |
| 2,617,736 |
Information Technology 1.0% |
Alion Science & Technology Corp., 10.25%, 2/1/2015 | 40,000 | 18,050 |
L-3 Communications Corp.: | | |
5.875%, 1/15/2015 | 160,000 | 144,000 |
Series B, 6.375%, 10/15/2015 | 80,000 | 74,800 |
7.625%, 6/15/2012 | 195,000 | 190,613 |
Lucent Technologies, Inc., 6.45%, 3/15/2029 | 165,000 | 66,000 |
MasTec, Inc., 7.625%, 2/1/2017 | 65,000 | 48,831 |
Seagate Technology HDD Holdings, 6.8%, 10/1/2016 (b) | 90,000 | 46,800 |
SunGard Data Systems, Inc., 10.25%, 8/15/2015 | 135,000 | 89,100 |
Vangent, Inc., 9.625%, 2/15/2015 | 35,000 | 20,344 |
| 698,538 |
| Principal Amount ($)(a) | Value ($) |
| |
Materials 3.2% |
Appleton Papers,
Inc., Series B, 8.125%, 6/15/2011 | 25,000 | 17,250 |
ARCO Chemical Co., 9.8%, 2/1/2020** | 405,000 | 44,550 |
Cascades, Inc.,
7.25%, 2/15/2013 | 130,000 | 66,300 |
Chemtura Corp.,
6.875%, 6/1/2016 | 115,000 | 58,650 |
Clondalkin Acquisition
BV, 144A,
3.996%***, 12/15/2013 | 75,000 | 37,875 |
CPG International I, Inc., 10.5%, 7/1/2013 | 130,000 | 72,800 |
Exopack Holding Corp., 11.25%, 2/1/2014 | 160,000 | 93,600 |
Freeport-McMoRan Copper & Gold, Inc.: | | |
6.875%, 2/1/2014 (b) | 10,000 | 9,000 |
8.25%, 4/1/2015 (b) | 145,000 | 123,250 |
8.375%, 4/1/2017 | 280,000 | 229,600 |
GEO Specialty Chemicals, Inc.: | | |
144A, 7.5%***,
3/31/2015 (PIK) | 115,036 | 82,826 |
144A, 9.968%***,
12/31/2009 | 186,000 | 133,920 |
Georgia-Pacific LLC: | | |
144A, 7.125%, 1/15/2017 | 35,000 | 29,400 |
9.5%, 12/1/2011 | 50,000 | 47,250 |
Hexcel Corp., 6.75%, 2/1/2015 | 195,000 | 148,200 |
Huntsman LLC, 11.625%, 10/15/2010 | 243,000 | 212,625 |
Innophos, Inc.,
8.875%, 8/15/2014 | 35,000 | 24,500 |
International Paper Co., 7.4%, 6/15/2014 | 400,000 | 327,884 |
Jefferson Smurfit Corp., 8.25%, 10/1/2012 | 65,000 | 11,050 |
Koppers Holdings, Inc., Step-up Coupon, 0% to 11/15/2009, 9.875% to 11/15/2014 | 130,000 | 100,750 |
Metals USA Holdings
Corp., 10.883%***, 7/1/2012 (PIK) | 35,952 | 10,067 |
Millar Western Forest Products Ltd., 7.75%, 11/15/2013 | 35,000 | 17,500 |
NewMarket Corp., 7.125%, 12/15/2016 | 110,000 | 82,500 |
NewPage Corp., 10.0%, 5/1/2012 (b) | 110,000 | 48,400 |
OI European Group BV, 144A, 6.875%, 3/31/2017 EUR | 65,000 | 65,958 |
Pliant Corp., 11.85%, 6/15/2009 (PIK) | 10 | 5 |
Radnor Holdings Corp., 11.0%, 3/15/2010** | 25,000 | 31 |
Smurfit-Stone Container Enterprises, Inc., 8.0%, 3/15/2017 | 75,000 | 14,250 |
Steel Dynamics, Inc., 7.375%, 11/1/2012 | 10,000 | 7,300 |
Terra Capital, Inc., Series B, 7.0%, 2/1/2017 | 110,000 | 80,850 |
The Mosaic Co., 144A, 7.375%, 12/1/2014 | 85,000 | 69,700 |
Witco Corp., 6.875%, 2/1/2026 | 35,000 | 9,800 |
| Principal Amount ($)(a) | Value ($) |
| |
Wolverine Tube, Inc., 10.5%, 4/1/2009 | 85,000 | 68,733 |
| 2,346,374 |
Telecommunication Services 2.9% |
BCM Ireland Preferred Equity Ltd., 144A, 11.245%***, 2/15/2017 (PIK) EUR | 67,207 | 7,971 |
Centennial
Communications Corp.: | | |
10.0%, 1/1/2013 | 40,000 | 41,400 |
10.125%, 6/15/2013 | 90,000 | 90,900 |
Cincinnati Bell, Inc.: | | |
7.25%, 7/15/2013 | 145,000 | 127,600 |
8.375%, 1/15/2014 (b) | 55,000 | 42,350 |
Cricket Communications, Inc.: | | |
9.375%, 11/1/2014 | 120,000 | 108,000 |
144A, 10.0%, 7/15/2015 | 100,000 | 91,500 |
Frontier Communications Corp.: | | |
6.25%, 1/15/2013 | 45,000 | 38,250 |
9.25%, 5/15/2011 | 35,000 | 33,250 |
Grupo Iusacell Celular SA de CV, 10.0%, 3/31/2012 | 28,848 | 19,039 |
Hellas Telecommunications Luxembourg V, 144A, 8.818%***, 10/15/2012 EUR | 200,000 | 164,026 |
Intelsat Corp.: | | |
144A, 9.25%, 8/15/2014 | 25,000 | 23,250 |
144A, 9.25%, 6/15/2016 | 250,000 | 227,500 |
Intelsat Subsidiary Holding Co., Ltd., 144A, 8.875%, 1/15/2015 | 130,000 | 118,300 |
iPCS, Inc.,
5.318%***, 5/1/2013 | 35,000 | 24,850 |
MetroPCS Wireless, Inc., 9.25%, 11/1/2014 | 150,000 | 134,250 |
Millicom International Cellular SA, 10.0%, 12/1/2013 | 265,000 | 238,500 |
Qwest Corp.: | | |
7.25%, 9/15/2025 | 20,000 | 13,400 |
7.875%, 9/1/2011 | 135,000 | 124,200 |
8.875%, 3/15/2012 | 30,000 | 27,750 |
Sprint Nextel Corp., 6.0%, 12/1/2016 | 75,000 | 52,875 |
Stratos Global Corp., 9.875%, 2/15/2013 | 30,000 | 28,350 |
Telesat Canada, 144A, 11.0%, 11/1/2015 | 170,000 | 121,550 |
Virgin Media Finance PLC: | | |
8.75%, 4/15/2014 | 120,000 | 90,000 |
8.75%, 4/15/2014 EUR | 85,000 | 83,299 |
Windstream Corp.: | | |
7.0%, 3/15/2019 | 60,000 | 46,200 |
8.625%, 8/1/2016 | 10,000 | 8,850 |
| 2,127,410 |
Utilities 4.5% |
AES Corp.: | | |
8.0%, 10/15/2017 | 100,000 | 82,000 |
144A, 8.0%, 6/1/2020 | 110,000 | 85,250 |
144A, 8.75%, 5/15/2013 | 315,000 | 302,400 |
9.5%, 6/1/2009 | 75,000 | 74,438 |
Allegheny Energy Supply
Co., LLC, 144A, 8.25%, 4/15/2012 | 470,000 | 462,950 |
CMS Energy Corp., 8.5%, 4/15/2011 | 225,000 | 221,581 |
| Principal Amount ($)(a) | Value ($) |
| |
Dominion Resources, Inc., Series D, 8.875%, 1/15/2019 | 500,000 | 539,195 |
Edison Mission Energy, 7.0%, 5/15/2017 | 105,000 | 91,350 |
Energy Future Holdings Corp., 144A, 10.875%, 11/1/2017 | 150,000 | 106,500 |
Intergas Finance BV, REG S, 6.875%, 11/4/2011 | 275,000 | 214,500 |
Knight, Inc., 6.5%, 9/1/2012 | 90,000 | 76,050 |
Mirant Americas Generation LLC, 8.3%, 5/1/2011 | 130,000 | 126,100 |
Mirant North America LLC, 7.375%, 12/31/2013 | 60,000 | 57,600 |
NRG Energy, Inc.: | | |
7.25%, 2/1/2014 | 125,000 | 116,875 |
7.375%, 2/1/2016 | 105,000 | 97,650 |
7.375%, 1/15/2017 | 90,000 | 82,800 |
NV Energy, Inc.: | | |
6.75%, 8/15/2017 | 105,000 | 80,602 |
8.625%, 3/15/2014 | 25,000 | 22,539 |
Oncor Electric Delivery Co., 7.0%, 9/1/2022 | 45,000 | 42,048 |
Regency Energy Partners LP, 8.375%, 12/15/2013 | 80,000 | 54,800 |
Reliant Energy, Inc., 7.875%, 6/15/2017 | 125,000 | 101,250 |
Texas Competitive Electric Holdings Co., LLC, 144A, 10.5%, 11/1/2015 | 275,000 | 195,250 |
| 3,233,728 |
Total Corporate Bonds (Cost $37,279,304) | 30,203,491 |
|
Commercial and Non-Agency Mortgage-Backed Securities 1.9% |
Credit Suisse Mortgage Capital Certificates Trust, "A2", Series 2007-C1, 5.268%, 2/15/2040 | 814,000 | 623,318 |
JPMorgan Chase Commercial Mortgage Securities Corp., "F", Series 2004-LN2, 144A, 5.448%***, 7/15/2041 | 500,000 | 133,537 |
Wachovia Bank Commercial Mortgage Trust, "A2", Series 2007-C32, 5.736%***, 6/15/2049 | 780,000 | 610,032 |
Total Commercial and Non-Agency Mortgage-Backed Securities (Cost $1,955,101) | 1,366,887 |
|
Collateralized Mortgage Obligations 1.5% |
FannieMae Grantor Trust, "1A4", Series 2004-T2, 7.5%, 11/25/2043 (Cost $1,041,071) | 1,003,544 | 1,056,544 |
|
Asset-Backed 1.0% |
Credit Card Receivables |
Washington Mutual Master Note Trust, "C1", Series 2007-C1, 144A, 1.595%***, 5/15/2014 (Cost $954,141) | 1,000,000 | 742,280 |
|
| Principal Amount ($)(a) | Value ($) |
| |
Mortgage-Backed Securities Pass-Throughs 2.8% |
Government National Mortgage Association: | | |
4.5%, 12/1/2033 (i) | 1,000,000 | 1,012,812 |
5.0%, 6/1/2034 (i) | 1,000,000 | 1,026,250 |
Total Mortgage-Backed Securities Pass-Throughs (Cost $2,023,867) | 2,039,062 |
|
Government & Agency Obligations 42.2% |
Sovereign Bonds 34.0% |
Aries Vermogensverwaltung GmbH, Series C, REG S, 9.6%, 10/25/2014 | 250,000 | 315,950 |
Dominican Republic, REG S, 9.5%, 9/27/2011 | 135,694 | 115,340 |
Federal Republic of Germany, Series 06, 4.0%, 7/4/2016 EUR | 1,700,000 | 2,546,412 |
Federative Republic of Brazil: | | |
8.875%, 10/14/2019 | 715,000 | 872,300 |
12.5%, 1/5/2016 BRL | 250,000 | 106,013 |
Government of Canada, 4.5%, 6/1/2015 CAD | 900,000 | 831,747 |
Kingdom of Spain, 3.15%, 1/31/2016 EUR | 1,300,000 | 1,753,069 |
Province of Quebec, Series PO, 1.6%, 5/9/2013 JPY | 600,000,000 | 6,847,632 |
Republic of Argentina, 5.83%, 12/31/2033 (PIK) ARS | 436 | 61 |
Republic of Colombia: | | |
8.25%, 12/22/2014 | 170,000 | 183,175 |
10.0%, 1/23/2012 (b) | 238,000 | 265,965 |
Republic of El Salvador, 144A, 7.65%, 6/15/2035 | 541,000 | 343,535 |
Republic of Greece: | | |
3.6%, 7/20/2016 EUR | 1,400,000 | 1,768,938 |
4.5%, 9/20/2037 EUR | 1,750,000 | 1,960,387 |
Republic of Indonesia, 144A, 6.875%, 3/9/2017 | 340,000 | 278,800 |
Republic of Panama: | | |
7.125%, 1/29/2026 | 166,000 | 156,455 |
9.375%, 1/16/2023 | 500,000 | 520,000 |
Republic of Peru: | | |
6.55%, 3/14/2037 (b) | 470,000 | 419,475 |
7.35%, 7/21/2025 | 815,000 | 810,925 |
Republic of Philippines, 8.375%, 2/15/2011 | 20,000 | 20,800 |
Republic of Turkey: | | |
7.0%, 9/26/2016 | 305,000 | 297,375 |
7.25%, 3/15/2015 | 80,000 | 79,600 |
11.75%, 6/15/2010 | 475,000 | 508,250 |
Republic of Uruguay: | | |
7.625%, 3/21/2036 | 60,000 | 50,400 |
9.25%, 5/17/2017 | 105,000 | 107,100 |
Republic of Venezuela, 10.75%, 9/19/2013 | 605,000 | 396,275 |
Russian Federation, REG S, 7.5%, 3/31/2030 | 656,600 | 572,660 |
Socialist Republic of Vietnam, 144A, 6.875%, 1/15/2016 | 510,000 | 423,300 |
United Kingdom Treasury Bond, 4.75%, 9/7/2015 GBP | 1,250,000 | 1,991,176 |
United Mexican States,
Series A, 5.875%, 1/15/2014 | 220,000 | 224,950 |
| 24,768,065 |
| Principal Amount ($)(a) | Value ($) |
| |
US Government Sponsored Agencies 1.1% |
Federal Home Loan Bank, 7.45%***, 10/16/2023 | 600,000 | 594,000 |
Federal National Mortgage Association, 8.45%***, 2/27/2023 | 250,000 | 250,000 |
| 844,000 |
|
US Treasury Obligations 7.1% |
US Treasury Bills: | | |
0.04%****, 5/21/2009 (d) | 41,000 | 40,988 |
0.17%****, 1/15/2009 (d) | 736,000 | 735,996 |
US Treasury Bonds, 4.375%, 2/15/2038 | 1,010,000 | 1,352,769 |
US Treasury Notes: | | |
2.75%, 10/31/2013 | 1,050,000 | 1,116,281 |
3.75%, 11/15/2018 | 1,665,000 | 1,884,830 |
| 5,130,864 |
Total Government & Agency Obligations (Cost $30,914,463) | 30,742,929 |
|
Loan Participations and Assignments 1.8% |
Senior Loans*** 1.7% |
Advanced Medical Optics, Inc., Term Loan B, LIBOR plus 1.75%, 3.754%, 4/2/2014 | 29,333 | 19,116 |
Buffets, Inc.: | | |
Letter of Credit, LIBOR plus 7.25%, 9.254%, 5/1/2013 | 18,670 | 4,695 |
Term Loan B, LIBOR plus 7.25%, 9.254%, 11/1/2013 | 95,001 | 23,893 |
Term Loan DIP, LIBOR plus 7.25%, 9.254%, 11/1/2013 | 45,671 | 11,486 |
Charter Communications Operating LLC: | | |
Term Loan, LIBOR plus 2.0%, 4.004%, 3/6/2014 | 104,213 | 77,154 |
Incremental Term Loan, LIBOR plus 5.0%, 7.004%, 3/6/2014 | 114,425 | 90,825 |
Energy Future Holdings Corp.: | | |
Term Loan B2, LIBOR plus 3.5%, 5.504%, 10/10/2014 | 460,350 | 322,245 |
Term Loan B3, LIBOR plus 3.5%, 5.504%, 10/10/2014 | 192,000 | 133,600 |
Essar Steel Algoma, Inc., Term Loan B, LIBOR plus 2.5%, 4.504%, 6/30/2013 | 37,664 | 23,352 |
Ford Motor Co., Term Loan B, LIBOR plus 3.0%, 5.004%, 12/16/2013 | 49,746 | 20,410 |
General Nutrition Centers, Inc., Term Loan B, LIBOR plus 2.25%, 4.254%, 9/16/2013 | 29,698 | 19,898 |
Golden Nugget, Term Loan, 3.73%, 6/16/2014 | 55,000 | 5,775 |
Hawker Beechcraft, Inc.: | | |
Letter of Credit, LIBOR plus 2.0%, 4.004%, 3/26/2014 | 2,405 | 1,262 |
Term Loan B, LIBOR plus 2.0%, 4.004%, 3/26/2014 | 41,056 | 21,538 |
HCA, Inc., Term Loan A, LIBOR plus 1.5%, 3.504%, 11/17/2012 | 161,125 | 136,876 |
| Principal Amount ($)(a) | Value ($) |
| |
Hexion Specialty Chemicals: | | |
Term Loan C1, LIBOR plus 2.25%, 4.254%, 5/6/2013 | 152,345 | 64,595 |
Term Loan C2, LIBOR plus 2.25%, 4.254%, 5/6/2013 | 41,335 | 17,526 |
IASIS Healthcare LLC, Term Loan, LIBOR plus 5.25%, 7.254%, 6/15/2014 (PIK) | 72,913 | 41,925 |
Longview Power LLC: | | |
Letter of Credit, 1.35%, 4/1/2014 | 4,000 | 2,500 |
Demand Draw, 3.75%, 4/1/2014 | 14,000 | 8,750 |
Term Loan B, 4.25%, 4/1/2014 | 12,000 | 7,500 |
NewPage Corp., Term Loan, LIBOR plus 3.75%, 5.754%, 12/19/2014 | 14,888 | 9,664 |
Sabre, Inc., Term Loan B, LIBOR plus 2.0%, 4.004%, 9/30/2014 | 48,590 | 21,206 |
Symbion, Inc.: | | |
Term Loan A, LIBOR plus 3.25%, 5.254%, 8/23/2013 | 23,650 | 14,781 |
Term Loan B, LIBOR plus 3.25%, 5.254%, 8/23/2014 | 23,650 | 14,781 |
Telesat Canada: | | |
Delayed Draw Term Loan, LIBOR plus 3.0%, 5.004%, 10/31/2014 | 11,780 | 8,075 |
Term Loan B, LIBOR plus 3.0%, 5.004%, 10/31/2014 | 137,153 | 94,018 |
Tribune Co., Tranche B, LIBOR plus 3.0%, 5.004%, 5/19/2014** | 88,875 | 25,647 |
| 1,243,093 |
Sovereign Loans 0.1% |
CSFB International (Exim Ukraine), 6.8%, 10/4/2012 | 105,000 | 42,000 |
Total Loan Participations and Assignments (Cost $2,117,171) | 1,285,093 |
|
Municipal Bonds and Notes 1.5% |
Tacoma, WA, Electric System Revenue, Series A, Prerefunded, 5.75%, 1/1/2020 (e) (Cost $1,069,209) | 1,000,000 | 1,093,240 |
|
Preferred Securities 0.1% |
Financials |
Citigroup, Inc., Series E, 8.4%, 4/30/2018 (f) | 80,000 | 52,823 |
Xerox Capital Trust I, 8.0%, 2/1/2027 (b) | 35,000 | 23,901 |
Total Preferred Securities (Cost $106,681) | 76,724 |
|
Preferred Stock 0.0% |
Financial |
Preferred Blocker Inc., 144A, 9.0% | 63 | 17,989 |
Total Preferred Stocks (Cost $17,989) | 17,989 |
|
Shares
| Value ($) |
| |
Warrants 0.0% |
Financials 0.0% |
New ASAT (Finance) Ltd., Expiration Date 2/1/2011* | 15,600 | 1,224 |
Industrials 0.0% |
Dayton Superior Corp., 144A, Expiration Date 6/15/2009* | 10 | 0 |
Total Warrants (Cost $0) | 1,224 |
|
Units
| Value ($) |
| |
Other Investments 0.1% |
Materials |
Hercules, Inc., (Bond Unit), 6.5%, 6/30/2029 (Cost $67,414) | 85,000 | 40,800 |
|
Shares
| Value ($) |
| |
Common Stocks 0.0% |
Consumer Discretionary 0.0% |
Vertis Holdings, Inc.* | 940 | 0 |
Materials 0.0% |
GEO Specialty Chemicals, Inc.* | 2,058 | 1,749 |
Total Common Stocks (Cost $19,822) | 1,749 |
|
Shares
| Value ($) |
| |
Convertible Preferred Stocks 0.0% Consumer Discretionary |
ION Media Networks, Inc. | | |
144A, 12.0%* | 10,000 | 0 |
Series AI, 144A, 12.0%* | 20,000 | 0 |
Total Convertible Preferred Stocks (Cost $4,191) | 0 |
|
Securities Lending Collateral 2.6% |
Daily Assets Fund Institutional, 1.69% (g) (h) (Cost $1,898,503) | 1,898,503 | 1,898,503 |
|
Cash Equivalents 6.0% |
Cash Management QP Trust, 1.42% (g) (Cost $4,357,924) | 4,357,924 | 4,357,924 |
| % of Net Assets | Value ($) |
| |
Total Investment Portfolio (Cost $83,826,851)+ | 103.0 | 74,924,439 |
Other Assets and Liabilities, Net | (3.0) | (2,161,774) |
Net Assets | 100.0 | 72,762,665 |
* Non-income producing security.** Non-income producing security. Issuer has defaulted on the payment of principal or interest or has filed for bankruptcy. The following table represents bonds that are in default:Securities | Coupon | Maturity Date | Principal Amount | Acquisition Cost ($) | Value ($) |
Ashton Woods USA LLC
| 9.5% | 10/1/2015 | 145,000 | USD
| 132,667 | 29,000 |
Congoleum Corp.
| 8.625% | 8/1/2008 | 125,000 | USD
| 105,994 | 93,750 |
Quebecor World, Inc.
| 9.75% | 1/15/2015 | 45,000 | USD
| 45,000 | 3,544 |
Radnor Holdings Corp.
| 11.0% | 3/15/2010 | 25,000 | USD
| 15,888 | 31 |
Tribune Co.
| 5.004% | 5/19/2014 | 88,875 | USD
| 88,819 | 25,647 |
Tropicana Entertainment LLC
| 9.625% | 12/15/2014 | 150,000 | USD
| 122,979 | 1,500 |
Trump Entertainment Resorts, Inc.
| 8.5% | 6/1/2015 | 15,000 | USD
| 10,838 | 1,988 |
| | | |
| 522,185 | 155,460 |
*** Floating rate notes are securities whose yields vary with a designated market index or market rate, such as the coupon-equivalent of the US Treasury bill rate. These securities are shown at their current rate as of December 31, 2008.**** Annualized yield at time of purchase; not a coupon rate.+ The cost for federal income tax purposes was $83,894,744. At December 31, 2008, net unrealized depreciation for all securities based on tax cost was $8,970,305. This consisted of aggregate gross unrealized appreciation for all securities in which there was an excess of value over tax cost of $2,592,990 and aggregate gross unrealized depreciation for all securities in which there was an excess of tax cost over value of $11,563,295.(a) Principal amount stated in US dollars unless otherwise noted.(b) All or a portion of these securities were on loan (see Notes to Financial Statements). The value of all securities loaned at December 31, 2008 amounted to $1,822,255, which is 2.5% of net assets.(c) Security has deferred its 6/15/2008 interest payment until 6/30/2009.(d) At December 31, 2008, this security has been pledged, in whole or in part, to cover initial margin requirements for open futures contracts.(e) Bond is insured by one of these companies:Insurance Coverage | As a % of Total Investment Portfolio |
Financial Security Assurance, Inc.
| 1.5 |
(f) Date shown is call date; not a maturity date for the perpetual preferred securities.(g) Affiliated fund managed by Deutsche Investment Management Americas Inc. The rate shown is the annualized seven-day yield at period end.(h) Represents collateral held in connection with securities lending. Income earned by the Portfolio is net of borrower rebates.(i) When-issued or delayed delivery securities included.144A: Security exempt from registration under Rule 144A of the Securities Act of 1933. These securities may be resold in transactions exempt from registration, normally to qualified institutional buyers.
LIBOR: Represents the London InterBank Offered Rate.
PIK: Denotes that all or a portion of the income is paid in-kind.
Prerefunded: Bonds which are prerefunded are collateralized usually by US Treasury securities which are held in escrow and used to pay principal and interest on tax-exempt issues and to retire the bonds in full at the earliest refunding date.
REG S: Securities sold under Regulation S may not be offered, sold or delivered within the United States or to, or for the account or benefit of, US persons, except pursuant to an exemption from, or in a transaction not subject to, the registration requirements of the Securities Act.
At December 31, 2008, open futures contracts purchased were as follows:
Futures | Expiration Date | Contracts | Aggregate Face Value ($) | Value ($) | Unrealized Appreciation/ (Depreciation) ($) |
10 Year Australian Treasury Bond
| 3/16/2009 | 16 | 1,253,954 | 1,298,423 | 44,469 |
10 Year Canadian Government Bond
| 3/20/2009 | 9 | 868,246 | 924,131 | 55,885 |
2 Year US Treasury Note
| 3/31/2009 | 7 | 1,507,863 | 1,526,438 | 18,575 |
AEX Index
| 1/16/2009 | 8 | 550,314 | 547,902 | (2,412) |
ASX SPI 200 Index
| 3/19/2009 | 6 | 373,259 | 391,757 | 18,498 |
DAX Index
| 3/20/2009 | 1 | 165,124 | 168,005 | 2,881 |
DJ Euro Stoxx 50 Index
| 3/20/2009 | 1 | 33,865 | 34,056 | 191 |
Federal Republic of Germany Euro-Bund
| 3/6/2009 | 11 | 1,902,012 | 1,908,871 | 6,859 |
Federal Republic of Germany Euro-Schatz
| 3/6/2009 | 28 | 4,174,657 | 4,182,880 | 8,223 |
Hang Seng Index
| 1/29/2009 | 1 | 93,676 | 92,933 | (743) |
S&P MIB Index
| 3/20/2009 | 1 | 133,312 | 134,988 | 1,676 |
Swiss Market Index
| 3/20/2009 | 9 | 461,381 | 460,929 | (452) |
United Kingdom Long Gilt Bond
| 3/27/2009 | 7 | 1,163,841 | 1,242,633 | 78,792 |
Total net unrealized appreciation | 232,442 |
At December 31, 2008, open futures contracts sold were as follows:
Futures | Expiration Date | Contracts | Aggregate Face Value ($) | Value ($) | Unrealized Depreciation ($) |
10 Year Japanese Government Bond
| 3/11/2009 | 1 | 1,537,216 | 1,545,725 | (8,509) |
10 Year US Treasury Note
| 3/20/2009 | 34 | 4,130,092 | 4,275,500 | (145,408) |
CAC 40 Index
| 1/16/2009 | 10 | 446,804 | 447,735 | (931) |
FTSE 100 Index
| 3/20/2009 | 2 | 122,656 | 126,235 | (3,579) |
NASDAQ E-Mini 100 Index
| 3/20/2009 | 7 | 167,312 | 169,750 | (2,438) |
Russell E Mini 2000 Index
| 3/20/2009 | 2 | 91,025 | 99,580 | (8,555) |
S&P E-Mini 500 Index
| 3/20/2009 | 7 | 305,289 | 315,035 | (9,746) |
S&P TSE 60 Index
| 3/19/2009 | 2 | 165,937 | 174,937 | (9,000) |
TOPIX Index
| 3/13/2009 | 9 | 805,483 | 855,819 | (50,336) |
Total net unrealized depreciation | (238,502) |
At December 31, 2008, open written options contracts were as follows:
Written Options | Contract Amount | Expiration Date | Value ($) |
Call Options Option on an interest rate swap for the obligation to receive a fixed rate of 2.7% versus the one-year LIBOR expiring on October 13, 2010
| 3,000,000 | 10/13/2009 | 36,742 |
Option on an interest rate swap for the obligation to receive a fixed rate of 3.12% versus the one-year LIBOR expiring on September 18, 2010
| 3,000,000 | 9/18/2009 | 1,395 |
Total Call Options (Premiums received $35,475) | 38,137 |
Put Options Option on an interest rate swap for the obligation to pay a fixed rate of 2.7% versus the one-year LIBOR expiring on October 13, 2010
| 3,000,000 | 10/13/2009 | 2,852 |
Option on an interest rate swap for the obligation to pay a fixed rate of 3.12% versus the one-year LIBOR expiring on September 18, 2010
| 3,000,000 | 9/18/2009 | 77,716 |
Total Put Options (Premiums received $35,475) | 80,568 |
Total Written Options (Premiums received $70,950) | 118,705 |
At December 31, 2008, open credit default swap contracts purchased were as follows:
Effective/Expiration Date | Notional Amount ($) | Fixed
Cash Flows Paid | Underlying Debt Obligation/Quality Rating (k) | Value ($) | Upfront Premiums Paid/ (Received) ($) | Unrealized Appreciation/ (Depreciation) ($) |
5/2/2008
6/20/2013 | 50,0001 | 7.25% | ARCO Chemical Co., 9.8%, 2/1/2020, D | 36,120 | — | 36,120 |
8/14/2008
9/20/2013 | 200,0002 | 3.0% | Expedia, Inc., 7.456%, 8/15/2018, BB | 25,151 | — | 25,151 |
9/29/2008
12/20/2013 | 400,0002 | 2.2% | Darden Restaurants, Inc., 6.0%, 8/15/2035, BBB | 6,998 | — | 6,998 |
10/8/2008
12/20/2013 | 200,0005 | 0.87% | Arrow Electronics, Inc., 6.875%, 6/1/2018, BBB- | 10,443 | — | 10,443 |
10/17/2008
12/20/2013 | 400,0004 | 0.75% | Walt Disney Co., 5.625%, 9/15/2016, A | 2,144 | — | 2,144 |
11/20/2008
12/20/2013 | 160,0004 | 1.25% | ACE INA Holdings, Inc., 8.875%, 8/15/2029, A- | (1,926) | — | (1,926) |
11/21/2008
12/20/2013 | 320,0003 | 3.5% | Kohl's Corp., 6.25%, 12/15/2017, BBB+ | (9,424) | — | (9,424) |
11/20/2008
12/22/2013 | 160,0004 | 3.15% | Allstate Corp., 6.75%, 5/15/2018, A+ | (8,641) | — | (8,641) |
12/3/2008
6/20/2014 | 300,0005 | 4.4% | International Paper Co., 5.3%, 4/1/2015, BBB | 10,379 | — | 10,379 |
12/31/2008
3/20/2014 | 160,0002 | 5.5% | Limited Brands, Inc., 6.9%, 7/15/2017, BB+ | 0 | — | 0 |
12/31/2008
3/20/2014 | 160,0003 | 7.0% | Macy's Retail Holdings, Inc., 7.45%, 7/15/2017, BBB- | 0 | — | 0 |
12/31/2008
3/20/2014 | 160,0002 | 5.25% | Nordstrom, Inc., 6.95%, 5/15/2028, A- | 0 | — | 0 |
Total net unrealized appreciation | 71,244 |
At December 31, 2008, open credit default swap contracts sold were as follows:
Effective/Expiration Date | Notional Amount ($) (j) | Fixed
Cash Flows Received | Underlying Debt Obligation/
Quality Rating (k) | Value ($) | Upfront Premiums Paid/ (Received) ($) | Unrealized Appreciation/ (Depreciation) ($) |
2/26/2008
3/20/2009 | 150,0001 | 5.0% | Tenet Healthcare Corp., 7.375%, 2/1/2013, B | 303 | — | 303 |
2/14/2008
3/20/2009 | 190,0001 | 3.8% | HCA, Inc., 6.375%, 1/15/2015, B- | (578) | — | (578) |
Total net unrealized depreciation |
|
| (275) |
(j) The maximum potential amount of future undiscounted payments that the Portfolio could be required to make under a credit default swap contract would be the notional amount of the contract. These potential amounts would be partially offset by any recovery values of the referenced debt obligation or net amounts received from the settlement of buy protection credit default swap contracts entered into by the Portfolio for the same referenced debt obligation.(k) The quality ratings represent the lower of Moody's Investors Service, Inc. ("Moody's") or Standard & Poor's Corporation ("S&P") credit ratings.At December 31, 2008, open total return swap contracts were as follows:
Effective/Expiration Date | Notional Amount ($) | Fixed Cash Flows Paid | Reference Entity | Value ($) | Upfront Premiums Paid/(Received) ($) | Unrealized Appreciation ($) |
12/1/2008
12/1/2010 | 1,900,0003 | 0.35% | Citi Global Interest Rate Strategy Index | 89,237 | 3,800 | 85,437 |
Counterparties:
1 Merrill Lynch, Pierce, Fenner & Smith, Inc.
2 JPMorgan Chase Securities, Inc.
3 Citigroup, Inc.
4 Bank of America
5 The Goldman Sachs & Co.
|
At December 31, 2008, the Portfolio had the following open forward foreign currency exchange contracts:
Contracts to Deliver | | In Exchange For | | Settlement Date | | Unrealized Appreciation ($) |
CHF
| 5,490 |
| USD
| 5,180 |
| 1/5/2009 |
| 21 |
EUR
| 12,300 |
| USD
| 17,178 |
| 1/15/2009 |
| 92 |
EUR
| 520,200 |
| USD
| 748,992 |
| 1/15/2009 |
| 26,393 |
EUR
| 1,323,000 |
| USD
| 1,667,152 |
| 1/21/2009 |
| 170,086 |
GBP
| 1,464,000 |
| USD
| 2,144,028 |
| 1/21/2009 |
| 40,443 |
USD
| 28,620 |
| NZD
| 54,000 |
| 1/21/2009 |
| 2,828 |
USD
| 1,452,654 |
| SEK
| 12,150,000 |
| 1/21/2009 |
| 83,128 |
USD
| 1,009,901 |
| CHF
| 1,224,000 |
| 1/21/2009 |
| 140,369 |
USD
| 2,552,374 |
| SGD
| 3,895,000 |
| 1/21/2009 |
| 149,110 |
Total unrealized appreciation | 612,470 |
Contracts to Deliver | | In Exchange For | | Settlement Date | | Unrealized Depreciation ($) |
USD
| 6,188 |
| JPY
| 560,000 |
| 1/5/2009 |
| (10) |
AUD
| 17,298 |
| USD
| 11,939 |
| 1/6/2009 |
| (112) |
EUR
| 5,300 |
| USD
| 7,335 |
| 1/15/2009 |
| (27) |
AUD
| 103,000 |
| USD
| 66,240 |
| 1/21/2009 |
| (5,397) |
CAD
| 398,000 |
| USD
| 315,572 |
| 1/21/2009 |
| (6,708) |
JPY
| 99,512,000 |
| USD
| 1,076,970 |
| 1/21/2009 |
| (21,275) |
NOK
| 9,780,000 |
| USD
| 1,357,297 |
| 1/21/2009 |
| (37,106) |
USD
| 941,300 |
| GBP
| 650,000 |
| 1/30/2009 |
| (7,418) |
USD
| 141,358 |
| EUR
| 100,000 |
| 1/30/2009 |
| (2,510) |
JPY
| 25,000,000 |
| USD
| 270,140 |
| 2/4/2009 |
| (5,814) |
Total unrealized depreciation | (86,377) |
Currency Abbreviations |
ARS Argentine Peso
AUD Australian Dollar
BRL Brazilian Real
CAD Canadian Dollar
CHF Swiss Franc
EUR Euro
GBP British Pound
JPY Japanese Yen
NOK Norwegian Krone
NZD New Zealand Dollar
SEK Swedish Krona
SGD Singapore Dollar
USD United States Dollar
|
Fair Value Measurements
The following is a summary of the inputs used as of December 31, 2008 in valuing the Portfolio's investments. For information on the Portfolio's policy regarding the valuation of investments and of the valuation inputs, and the aggregate levels used in the tables below, please refer to the Security Valuation section of Note A in the accompanying Notes to the Financial Statements.
Valuation Inputs | Investments in Securities | Options Written, at value | Other Financial Instruments++ |
Level 1
| $ 1,916,492 | $ — | $ (6,060) |
Level 2
| 71,130,364 | (118,705) | 682,499 |
Level 3
| 1,877,583 | — | — |
Total | $ 74,924,439 | $ (118,705) | $ 676,439 |
++ Other financial instruments are derivative instruments not reflected in the Investment Portfolio, such as futures contracts, forward foreign exchange contracts, credit default and total return swap contracts, which are valued at the unrealized appreciation (depreciation) on the instrument.The following is a reconciliation of the Portfolio's Level 3 investments for which significant unobservable inputs were used in determining value at December 31, 2008:
| Investments in Securities |
Balance as of January 1, 2008 | $ 533,240 |
Net realized gain (loss)
| (10,075) |
Change in unrealized appreciation (depreciation)
| (370,181) |
Amortization Premium/Discount
| (32) |
Net purchases (sales)
| 1,546,583 |
Net transfers in (out) of Level 3
| 178,048 |
Balance as of December 31, 2008 | $ 1,877,583 |
The accompanying notes are an integral part of the financial statements.
Financial Statements
Statement of Assets and Liabilities as of December 31, 2008
|
Assets |
Investments:
Investments in securities, at value (cost $77,570,424) — including $1,822,255 of securities loaned | $ 68,668,012 |
Investment in Daily Assets Fund Institutional (cost $1,898,503)* | 1,898,503 |
Investment in Cash Management QP Trust (cost $4,357,924) | 4,357,924 |
Total investments, at value (cost $83,826,851)
| 74,924,439 |
Cash
| 99,351 |
Foreign currency, at value (cost $227,366)
| 220,632 |
Receivable for investments sold
| 1,036,730 |
Interest receivable
| 1,243,610 |
Receivable for variation margin on open futures contracts
| 59,336 |
Unrealized appreciation on forward foreign currency exchange contracts
| 612,470 |
Unrealized appreciation on swap contracts
| 176,975 |
Other assets
| 2,259 |
Total assets
| 78,375,802 |
Liabilities |
Payable for when-issued and delayed delivery securities purchased
| 3,048,810 |
Payable upon return of securities loaned
| 1,898,503 |
Payable for Portfolio shares redeemed
| 211,040 |
Options written, at value (premiums received $70,950)
| 118,705 |
Net payable on closed forward foreign currency exchange contracts
| 72,505 |
Unrealized depreciation on forward foreign currency exchange contracts
| 86,377 |
Unrealized depreciation on swap contracts
| 20,569 |
Accrued management fee
| 36,651 |
Other accrued expenses and payables
| 119,977 |
Total liabilities
| 5,613,137 |
Net assets, at value | $ 72,762,665 |
Net Assets Consist of |
Undistributed net investment income
| 3,179,356 |
Net unrealized appreciation (depreciation) on:
Investments | (8,902,412) |
Written options | (47,755) |
Swaps contracts | 156,406 |
Futures | (6,060) |
Foreign currency | 525,454 |
Accumulated net realized gain (loss)
| (2,959,925) |
Paid-in capital
| 80,817,601 |
Net assets, at value | $ 72,762,665 |
Class A Net Asset Value, offering and redemption price per share ($72,716,859 ÷ 7,250,530 outstanding shares of beneficial interest, $.01 par value, unlimited number of shares authorized)
| $ 10.03 |
Class B Net Asset Value, offering and redemption price per share ($45,806 ÷ 4,594 outstanding shares of beneficial interest, $.01 par value, unlimited number of shares authorized)
| $ 9.97 |
* Represents collateral on securities loaned.The accompanying notes are an integral part of the financial statements.
Statement of Operations for the year ended December 31, 2008
|
Investment Income |
Income:
Interest
| $ 5,513,843 |
Interest — Cash Management QP Trust
| 275,559 |
Securities lending income, including income from Daily Assets Fund Institutional, net of borrower rebates
| 55,140 |
Total Income
| 5,844,542 |
Expenses:
Management fee
| 578,416 |
Administration fee
| 62,261 |
Services to shareholders
| 185 |
Custodian fee
| 29,661 |
Distribution service fee (Class B)
| 7,116 |
Record keeping fees (Class B)
| 2,761 |
Legal fees
| 25,538 |
Audit and tax fees
| 68,559 |
Trustees' fees and expenses
| 18,555 |
Reports to shareholders and shareholder meeting
| 47,693 |
Other
| 43,660 |
Total expenses before expense reductions
| 884,405 |
Expense reductions
| (19,768) |
Total expenses after expense reductions
| 864,637 |
Net investment income (loss) | 4,979,905 |
Realized and Unrealized Gain (Loss) |
Net realized gain (loss) from:
Investments
| (3,639,982) |
Swap contracts
| (16,443) |
Futures
| 212,011 |
Foreign currency
| (1,528,113) |
Payments by affiliates (see Note I)
| 1,022 |
| (4,971,505) |
Change in net unrealized appreciation (depreciation) on:
Investments
| (9,102,978) |
Unfunded loan commitments
| 21 |
Swap contracts
| 160,383 |
Written options
| (47,755) |
Futures
| (144,864) |
Foreign currency
| 649,132 |
| (8,486,061) |
Net gain (loss) | (13,457,566) |
Net increase (decrease) in net assets resulting from operations | $ (8,477,661) |
The accompanying notes are an integral part of the financial statements.
Statement of Changes in Net Assets |
| Years Ended December 31, |
Increase (Decrease) in Net Assets | 2008 | 2007 |
Operations:
Net investment income
| $ 4,979,905 | $ 5,848,274 |
Net realized gain (loss)
| (4,971,505) | 2,363,743 |
Change in net unrealized appreciation (depreciation)
| (8,486,061) | (2,405,723) |
Net increase (decrease) in net assets resulting from operations
| (8,477,661) | 5,806,294 |
Distributions to shareholders from:
Net investment income:
Class A | (6,041,956) | (5,451,249) |
Class B | (489,657) | (1,430,805) |
Net realized gains:
Class A | (1,320,099) | — |
Class B | (114,923) | — |
Total distributions
| (7,966,635) | (6,882,054) |
Portfolio share transactions:
Class A Proceeds from shares sold
| 22,468,946 | 27,023,346 |
Reinvestment of distributions
| 7,362,055 | 5,451,249 |
Cost of shares redeemed
| (41,402,528) | (17,567,946) |
Net increase (decrease) in net assets from Class A share transactions
| (11,571,527) | 14,906,649 |
Class B Proceeds from shares sold
| 755,481 | 2,524,276 |
Reinvestment of distributions
| 604,580 | 1,430,805 |
Cost of shares redeemed
| (9,329,944) | (19,503,873) |
Net increase (decrease) in net assets from Class B share transactions
| (7,969,883) | (15,548,792) |
Increase (decrease) in net assets | (35,985,706) | (1,717,903) |
Net assets at beginning of period
| 108,748,371 | 110,466,274 |
Net assets at end of period (including undistributed net investment income of $3,179,356 and $6,660,644, respectively)
| $ 72,762,665 | $ 108,748,371 |
Other Information |
Class A Shares outstanding at beginning of period
| 8,561,326 | 7,267,545 |
Shares sold
| 2,033,447 | 2,337,780 |
Shares issued to shareholders in reinvestment of distributions
| 674,181 | 483,267 |
Shares redeemed
| (4,018,424) | (1,527,266) |
Net increase (decrease) in Class A shares
| (1,310,796) | 1,293,781 |
Shares outstanding at end of period
| 7,250,530 | 8,561,326 |
Class B Shares outstanding at beginning of period
| 737,068 | 2,104,567 |
Shares sold
| 66,046 | 219,518 |
Shares issued to shareholders in reinvestment of distributions
| 55,517 | 127,295 |
Shares redeemed
| (854,037) | (1,714,312) |
Net increase (decrease) in Class B shares
| (732,474) | (1,367,499) |
Shares outstanding at end of period
| 4,594 | 737,068 |
The accompanying notes are an integral part of the financial statements.
Financial Highlights
Class A Years Ended December 31, | 2008 | 2007 | 2006 | 2005 | 2004 |
Selected Per Share Data |
Net asset value, beginning of period | $ 11.70 | $ 11.80 | $ 11.50 | $ 12.25 | $ 11.82 |
Income (loss) from investment operations: Net investment incomea | .55 | .63 | .62 | .65 | .58 |
Net realized and unrealized gain (loss) | (1.38) | (.01) | .36 | (.39) | .39 |
Total from investment operations | (.83) | .62 | .98 | .26 | .97 |
Less distributions from: Net investment income | (.69) | (.72) | (.57) | (.98) | — |
Net realized gains | (.15) | — | (.11) | (.03) | (.54) |
Total distributions | (.84) | (.72) | (.68) | (1.01) | (.54) |
Net asset value, end of period | $ 10.03 | $ 11.70 | $ 11.80 | $ 11.50 | $ 12.25 |
Total Return (%)
| (7.75)b | 5.43b | 8.98 | 2.38 | 8.60 |
Ratios to Average Net Assets and Supplemental Data |
Net assets, end of period ($ millions)
| 73 | 100 | 86 | 71 | 62 |
Ratio of expenses before expense reductions (%)
| .89 | .84 | .85 | .88 | .84 |
Ratio of expenses after expense reductions (%)
| .87 | .83 | .85 | .88 | .84 |
Ratio of net investment income (loss) (%)
| 5.06 | 5.50 | 5.47 | 5.61 | 4.99 |
Portfolio turnover rate (%)
| 234 | 147 | 143 | 120 | 210 |
a Based on average shares outstanding during the period.
b Total return would have been lower had certain expenses not been reduced.
|
Class B Years Ended December 31, | 2008 | 2007 | 2006 | 2005 | 2004 |
Selected Per Share Data |
Net asset value, beginning of period | $ 11.64 | $ 11.74 | $ 11.44 | $ 12.17 | $ 11.78 |
Income (loss) from investment operations: Net investment incomea | .49 | .59 | .59 | .61 | .53 |
Net realized and unrealized gain (loss) | (1.36) | (.01) | .35 | (.38) | .40 |
Total from investment operations | (.87) | .58 | .94 | .23 | .93 |
Less distributions from: Net investment income | (.65) | (.68) | (.53) | (.93) | — |
Net realized gains | (.15) | — | (.11) | (.03) | (.54) |
Total distributions | (.80) | (.68) | (.64) | (.96) | (.54) |
Net asset value, end of period | $ 9.97 | $ 11.64 | $ 11.74 | $ 11.44 | $ 12.17 |
Total Return (%)
| (8.00)b | 5.07b | 8.75b | 1.92b | 8.27 |
Ratios to Average Net Assets and Supplemental Data |
Net assets, end of period ($ millions)
| .05 | 9 | 25 | 26 | 21 |
Ratio of expenses before expense reductions (%)
| 1.30 | 1.21 | 1.24 | 1.25 | 1.22 |
Ratio of expenses after expense reductions (%)
| 1.28 | 1.20 | 1.18 | 1.21 | 1.22 |
Ratio of net investment income (loss) (%)
| 4.65 | 5.13 | 5.14 | 5.28 | 4.61 |
Portfolio turnover rate (%)
| 234 | 147 | 143 | 120 | 210 |
a Based on average shares outstanding during the period.
b Total return would have been lower had certain expenses not been reduced.
|
Performance Summary December 31, 2008
DWS Technology VIP
All performance shown is historical, assumes reinvestment of all dividend and capital gain distributions and does not guarantee future results. Investment return and principal value fluctuate with changing market conditions so that, when redeemed, shares may be worth more or less than their original cost. Current performance may be lower or higher than the performance data quoted. Please contact your participating insurance company for the Portfolio's most recent month-end performance. Performance doesn't reflect charges and fees ("contract charges") associated with the separate account that invests in the Portfolio or any variable life insurance policy or variable annuity contract for which the Portfolio is an investment option. These charges and fees will reduce returns. While all share classes have the same underlying portfolio, their performance will differ.
The total annual Portfolio operating expense ratios, gross of any fee waivers or expense reimbursements, as stated in the fee table of the prospectus dated May 1, 2008 are 0.91% and 1.29% for Class A and Class B shares, respectively. Please see the Information About Your Portfolio's Expenses, the Financial Highlights and Notes to the Financial Statements (Note C, Related Parties) sections of this report for gross and net expense related disclosure for the period ended December 31, 2008.
Risk Considerations
This Portfolio is subject to stock market risk, meaning stocks in the Portfolio may decline in value for extended periods of time due to the activities and financial prospects of individual companies, or due to general market and economic conditions. Investments by the Portfolio in small companies present greater risk of loss than investments in larger, more established companies. Concentration of the Portfolio's investment in technology stocks may present a greater risk than investments in a more diversified portfolio. Investments by the Portfolio in emerging technology companies present greater risk than investments in more established technology companies. This Portfolio is non-diversified and can take larger positions in fewer companies, increasing its overall potential risk. Please read this Portfolio's prospectus for specific details regarding this product's investments and risk profile.
Portfolio returns shown during all periods reflect a fee waiver and/or expense reimbursement. Without this waiver/reimbursement, returns would have been lower.
Growth of an Assumed $10,000 Investment in DWS Technology VIP from 5/1/1999 to 12/31/2008 |
[] DWS Technology VIP — Class A [] Russell 1000® Growth Index [] S&P® Goldman Sachs Technology Index | The Russell 1000® Growth Index is an unmanaged index that consists of those stocks in the Russell 1000 Index with higher price-to-book ratios and higher forecasted growth values. The S&P® Goldman Sachs Technology Index is an unmanaged capitalization-weighted index based on a universe of technology-related stocks. Index returns assume reinvestment of dividends and, unlike portfolio returns, do not reflect any fees or expenses. It is not possible to invest directly into an index. |
 | |
Yearly periods ended December 31 |
|
Comparative Results |
DWS Technology VIP | 1-Year | 3-Year | 5-Year | Life of Portfolio* |
Class A | Growth of $10,000
| $5,378 | $6,194 | $6,549 | $5,833 |
Average annual total return
| -46.22% | -14.76% | -8.12% | -5.42% |
Russell 1000 Growth Index
| Growth of $10,000
| $6,156 | $7,508 | $8,401 | $6,068 |
Average annual total return
| -38.44% | -9.11% | -3.42% | -5.04% |
S&P Goldman Sachs Technology Index
| Growth of $10,000
| $5,667 | $7,221 | $7,583 | $5,120 |
Average annual total return
| -43.33% | -10.28% | -5.38% | -6.69% |
DWS Technology VIP | 1-Year | 3-Year | 5-Year | Life of Class** |
Class B | Growth of $10,000
| $5,356 | $6,124 | $6,417 | $8,935 |
Average annual total return
| -46.44% | -15.08% | -8.49% | -1.72% |
Russell 1000 Growth Index
| Growth of $10,000
| $6,156 | $7,508 | $8,401 | $9,923 |
Average annual total return
| -38.44% | -9.11% | -3.42% | -.12% |
S&P Goldman Sachs Technology Index
| Growth of $10,000
| $5,667 | $7,221 | $7,583 | $10,421 |
Average annual total return
| -43.33% | -10.28% | -5.38% | .64% |
The growth of $10,000 is cumulative.
* The Portfolio commenced operations on May 1, 1999. Index returns began on April 30, 1999.** The Portfolio commenced offering Class B shares on July 1, 2002. Index returns began on June 30, 2002.Information About Your Portfolio's Expenses
DWS Technology VIP
As an investor of the Portfolio, you incur two types of costs: ongoing expenses and transaction costs. Ongoing expenses include management fees, distribution and service (12b-1) fees and other Portfolio expenses. Examples of transaction costs include contract charges, redemption fees and account maintenance fees, which are not shown in this section. The following tables are intended to help you understand your ongoing expenses (in dollars) of investing in the Portfolio and to help you compare these expenses with the ongoing expenses of investing in other mutual funds. The example in the table is based on an investment of $1,000 invested at the beginning of the six-month period and held for the entire period (July 1, 2008 to December 31, 2008).
The tables illustrate your Portfolio's expenses in two ways:
• Actual Portfolio Return. This helps you estimate the actual dollar amount of ongoing expenses (but not transaction costs) paid on a $1,000 investment in the Portfolio using the Portfolio's actual return during the period. To estimate the expenses you paid over the period, simply divide your account value by $1,000 (for example, an $8,600 account value divided by $1,000 = 8.6), then multiply the result by the number in the "Expenses Paid per $1,000" line under the share class you hold.
• Hypothetical 5% Portfolio Return. This helps you to compare your Portfolio's ongoing expenses (but not transaction costs) with those of other mutual funds using the Portfolio's actual expense ratio and a hypothetical rate of return of 5% per year before expenses. Examples using a 5% hypothetical Portfolio return may be found in the shareholder reports of other mutual funds. The hypothetical account values and expenses may not be used to estimate the actual ending account balance or expenses you paid for the period.
Please note that the expenses shown in these tables are meant to highlight your ongoing expenses only and do not reflect any transaction costs. The "Expenses Paid per $1,000" line of the tables is useful in comparing ongoing expenses only and will not help you determine the relative total expense of owning different funds. If these transaction costs had been included, your costs would have been higher.
Expenses and Value of a $1,000 Investment for the six months ended December 31, 2008 |
Actual Portfolio Return | Class A | | Class B | |
Beginning Account Value 7/1/08
| $ 1,000.00 | | $ 1,000.00 | |
Ending Account Value 12/31/08
| $ 636.50 | | $ 634.40 | |
Expenses Paid per $1,000*
| $ 4.03 | | $ 5.42 | |
Hypothetical 5% Portfolio Return | Class A | | Class B | |
Beginning Account Value 7/1/08
| $ 1,000.00 | | $ 1,000.00 | |
Ending Account Value 12/31/08
| $ 1,020.21 | | $ 1,018.50 | |
Expenses Paid per $1,000*
| $ 4.98 | | $ 6.70 | |
* Expenses are equal to the Portfolio's annualized expense ratio for each share class, multiplied by the average account value over the period, multiplied by the number of days in the most recent six-month period, then divided by 366.Annualized Expense Ratios | Class A | | Class B | |
DWS Variable Series II — DWS Technology VIP
| .98% | | 1.32% | |
For more information, please refer to the Portfolio's prospectus.
These tables do not reflect charges and fees ("contract charges") associated with the separate account that invests in the Portfolio or any variable life insurance policy or variable annuity contract for which the Portfolio is an investment option.
Management Summary December 31, 2008
DWS Technology VIP
Technology stocks produced a negative absolute return and underperformed the broader market during 2008. Slowing economic growth led to reduced spending by both consumers and corporations, causing sharp reductions to the earnings estimates for tech companies. With this as the backdrop, the Portfolio's benchmarks, the S&P® Goldman Sachs Technology Index and the Russell 1000® Growth Index returned -43.33% and -38.44 respectively, during the annual period. Class A shares of DWS Technology VIP (unadjusted for contract charges) returned -46.22%. Key contributors to relative performance were positions in Foundry Networks* (which was bid for by Brocade Communications Systems in July), Taiwan Semiconductor Manufacturing Co. Ltd. and Visa, Inc. Notable detractors were Ciena Corp., Nvidia Corp.* and an underweight in International Business Machines Corp.1
The fund's management team changed on November 21, 2008. While many features of the previous approach remain intact, such as an emphasis on looking for investment ideas across the entire market capitalization spectrum, there is now also a thematic component to the Portfolio's strategy. Among the investment themes that we will focus on are the growing need for firms to use technology to meet their compliance and regulation requirements, server/storage/desktop virtualization, technologies that help increase network bandwidth capacity, and continued growth in e-commerce and Internet traffic.
While we remain cautious on the near-term outlook for technology stocks, we believe much of the bad news has already been factored into stock prices. As a result, we are finding compelling values among stocks with rising market share, strong product and/or service offerings, and healthy balance sheets. We will continue to focus our bottom-up research efforts on unearthing these opportunities in the year ahead.
Kelly P. Davis Clark Chang
Lead Portfolio Manager Portfolio Manager, Deutsche Investment Management Americas Inc.
The S&P Goldman Sachs Technology Index is an unmanaged, capitalization-weighted index based on a universe of technology-related stocks.
The Russell 1000 Growth Index is an unmanaged index that consists of those stocks in the Russell 1000 Index with higher price-to-book ratios and higher forecasted growth values.
Index returns assume reinvestment of dividends and, unlike portfolio returns, do not reflect any fees or expenses. It is not possible to invest directly into an index.
1 "Overweight" means the Portfolio holds a higher weighting in a given sector or security than the benchmark. "Underweight" means the Portfolio holds a lower weighting.* Not held in the Portfolio as of December 31, 2008.Portfolio management market commentary is as of December 31, 2008, and may not come to pass. This information is subject to change at any time based on market and other conditions. Past performance does not guarantee future results. Current and future portfolio holdings are subject to risk.
Portfolio Summary
DWS Technology VIP
Asset Allocation (As a % of Investment Portfolio excluding Securities Lending Collateral) | 12/31/08 | 12/31/07 |
| | |
Common Stocks | 98% | 99% |
Cash Equivalents | 2% | 1% |
| 100% | 100% |
Sector Diversification (As a % of Common Stocks) | 12/31/08 | 12/31/07 |
| | |
Information Technology: | | |
Communications Equipment | 23% | 16% |
Semiconductors & Semiconductor Equipment | 22% | 16% |
Software | 18% | 21% |
Computers & Peripherals | 18% | 24% |
Internet Software & Services | 10% | 14% |
IT Services | 6% | 5% |
Electronic Equipment & Instruments | 1% | 2% |
Industrials | 1% | 1% |
Consumer Discretionary | 1% | 1% |
| 100% | 100% |
Asset allocation and sector diversification are subject to change.
For more complete details about the Portfolio's investment portfolio, see page 275. A complete list of portfolio holdings of the portfolio is posted as of the month end on www.dws-investments.com on or about the 15th day of the following month. More frequent posting of portfolio holdings information may be made from time to time on www.dws-investments.com.
Following the Portfolio's fiscal first and third quarter-end, a complete portfolio holdings listing is filed with the SEC on Form N-Q. The form will be available on the SEC's Web site at www.sec.gov, and it also may be reviewed and copied at the SEC's Public Reference Room in Washington, D.C. Information on the operation of the SEC's Public Reference Room may be obtained by calling (800) SEC-0330.
Investment Portfolio December 31, 2008
DWS Technology VIP
|
Shares
| Value ($) |
| |
Common Stocks 98.4% |
Consumer Discretionary 1.1% |
Media |
Grupo Televisa SA (ADR) | 43,100 | 643,914 |
Financials 0.1% |
Real Estate Investment Trusts |
DuPont Fabros Technology, Inc. (REIT) (a) | 37,100 | 76,797 |
Industrials 0.6% |
Electrical Equipment |
First Solar, Inc.* (a) | 2,800 | 386,288 |
Information Technology 96.6% |
Communications Equipment 22.2% |
Ciena Corp.* (a) | 60,600 | 406,020 |
Cisco Systems, Inc.* | 185,800 | 3,028,540 |
F5 Networks, Inc.* (a) | 25,600 | 585,216 |
Harris Corp. | 12,000 | 456,600 |
Infinera Corp.* (a) | 28,500 | 255,360 |
Juniper Networks, Inc.* | 142,000 | 2,486,420 |
Nokia Oyj (ADR) | 84,600 | 1,319,760 |
Polycom, Inc.* | 84,800 | 1,145,648 |
QUALCOMM, Inc. | 97,616 | 3,497,581 |
Sonus Networks, Inc.* (a) | 256,400 | 405,112 |
| 13,586,257 |
Computers & Peripherals 18.0% |
Apple, Inc.* | 36,500 | 3,115,275 |
EMC Corp.* | 76,200 | 797,814 |
Hewlett-Packard Co. | 94,500 | 3,429,405 |
International Business Machines Corp. | 34,000 | 2,861,440 |
SanDisk Corp.* (a) | 22,700 | 217,920 |
Synaptics, Inc.* (a) | 35,450 | 587,052 |
| 11,008,906 |
Electronic Equipment, Instruments & Components 0.5% |
Hon Hai Precision Industry Co., Ltd. | 173,876 | 342,789 |
Internet Software & Services 10.3% |
eBay, Inc.* | 83,700 | 1,168,452 |
Equinix, Inc.* | 6,200 | 329,778 |
Google, Inc. "A"* | 15,600 | 4,799,340 |
| 6,297,570 |
IT Services 6.3% |
Cognizant Technology Solutions Corp. "A"* | 53,500 | 966,210 |
Fiserv, Inc.* (a) | 29,200 | 1,062,004 |
Global Payments, Inc. | 28,600 | 937,794 |
MasterCard, Inc. "A" (a) | 2,300 | 328,739 |
Visa, Inc. "A" (a) | 10,600 | 555,970 |
| 3,850,717 |
Semiconductors & Semiconductor Equipment 21.6% |
Applied Materials, Inc. | 29,900 | 302,887 |
ASML Holding NV (NY Registered Shares) (a) | 32,300 | 583,661 |
|
Shares
| Value ($) |
| |
Broadcom Corp. "A"* (a) | 66,800 | 1,133,596 |
Cymer, Inc.* (a) | 17,900 | 392,189 |
FormFactor, Inc.* (a) | 22,600 | 329,960 |
Integrated Device Technology, Inc.* | 55,700 | 312,477 |
Intel Corp. | 228,289 | 3,346,717 |
KLA-Tencor Corp. (a) | 22,200 | 483,738 |
Marvell Technology Group Ltd.* | 69,100 | 460,897 |
MediaTek, Inc. | 59,287 | 400,496 |
MEMC Electronic Materials, Inc.* | 9,100 | 129,948 |
Microchip Technology, Inc. (a) | 57,900 | 1,130,787 |
Microsemi Corp.* | 29,800 | 376,672 |
MKS Instruments, Inc.* (a) | 12,700 | 187,833 |
National Semiconductor Corp. (a) | 67,700 | 681,739 |
Netlogic Microsystems, Inc.* | 32,000 | 704,320 |
Taiwan Semiconductor Manufacturing Co., Ltd. (ADR) | 60,007 | 474,056 |
Texas Instruments, Inc. | 91,400 | 1,418,528 |
Varian Semiconductor Equipment Associates, Inc.* (a) | 20,900 | 378,708 |
| 13,229,209 |
Software 17.7% |
Activision Blizzard, Inc.* | 67,800 | 585,792 |
Adobe Systems, Inc.* | 61,900 | 1,317,851 |
Amdocs Ltd.* | 17,200 | 314,588 |
Citrix Systems, Inc.* | 24,700 | 582,179 |
Electronic Arts, Inc.* | 14,100 | 226,164 |
Informatica Corp.* | 40,400 | 554,692 |
McAfee, Inc.* | 17,700 | 611,889 |
Microsoft Corp. | 123,400 | 2,398,896 |
Nintendo Co., Ltd. | 1,300 | 499,453 |
Oracle Corp.* | 159,100 | 2,820,843 |
Salesforce.com, Inc.* (a) | 7,100 | 227,271 |
Symantec Corp.* | 31,300 | 423,176 |
VanceInfo Technologies, Inc. (ADR)* | 51,600 | 245,100 |
| 10,807,894 |
Total Common Stocks (Cost $77,464,466) | 60,230,341 |
|
Securities Lending Collateral 13.7% |
Daily Assets Fund Institutional, 1.69% (b) (c) (Cost $8,358,135) | 8,358,135 | 8,358,135 |
|
Cash Equivalents 1.7% |
Cash Management QP Trust, 1.42% (b) (Cost $1,044,313) | 1,044,313 | 1,044,313 |
| % of Net Assets | Value ($) |
| |
Total Investment Portfolio (Cost $86,866,914)+ | 113.8 | 69,632,789 |
Other Assets and Liabilities, Net | (13.8) | (8,438,502) |
Net Assets | 100.0 | 61,194,287 |
* Non-income producing security.+ The cost for federal income tax purposes was $93,123,829. At December 31, 2008, net unrealized depreciation for all securities based on tax cost was $23,491,040. This consisted of aggregate gross unrealized appreciation for all securities in which there was an excess of value over tax cost of $3,949,503 and aggregate gross unrealized depreciation for all securities in which there was an excess of tax cost over value of $27,440,543.(a) All or a portion of these securities were on loan (see Notes to Financial Statements). The value of all securities loaned at December 31, 2008 amounted to $8,327,493, which is 13.6% of net assets.(b) Affiliated fund managed by Deutsche Investment Management Americas Inc. The rate shown is the annualized seven-day yield at period end.(c) Represents collateral held in connection with securities lending. Income earned by the Portfolio is net of borrower rebates.ADR: American Depositary Receipt
REIT: Real Estate Investment Trust
Fair Value Measurements
The following is a summary of the inputs used as of December 31, 2008 in valuing the Portfolio's investments. For information on the Portfolio's policy regarding the valuation of investments and of the valuation inputs, and the aggregate levels used in the table below, please refer to the Security Valuation section of Note A in the accompanying Notes to the Financial Statements.
Valuation Inputs | Investments in Securities |
Level 1
| $ 67,345,738 |
Level 2
| 2,287,051 |
Level 3
| — |
Total | $ 69,632,789 |
The accompanying notes are an integral part of the financial statements.
Financial Statements
Statement of Assets and Liabilities as of December 31, 2008
|
Assets |
Investments:
Investments in securities, at value (cost $77,464,466) — including $8,327,493 of securities loaned | $ 60,230,341 |
Investment in Daily Assets Fund Institutional (cost $8,358,135)* | 8,358,135 |
Investment in Cash Management QP Trust (cost $1,044,313) | 1,044,313 |
Total investments, at value (cost $86,866,914)
| 69,632,789 |
Foreign currency, at value (cost $25,795)
| 28,123 |
Interest receivable
| 13,050 |
Dividends receivable
| 25,922 |
Receivable for Portfolio shares sold
| 39,110 |
Other assets
| 3,267 |
Total assets
| 69,742,261 |
Liabilities |
Payable for Portfolio shares redeemed
| 17,204 |
Payable upon return of securities loaned
| 8,358,135 |
Accrued management fee
| 33,801 |
Other accrued expenses and payables
| 138,834 |
Total liabilities
| 8,547,974 |
Net assets, at value | $ 61,194,287 |
Net Assets Consist of |
Accumulated net investment loss
| (4,837) |
Net unrealized appreciation (depreciation) on:
Investments | (17,234,125) |
Foreign currency | 2,328 |
Accumulated net realized gain (loss)
| (263,873,272) |
Paid-in capital
| 342,304,193 |
Net assets, at value | $ 61,194,287 |
Class A Net Asset Value, offering and redemption price per share ($59,556,510 ÷ 10,336,451 outstanding shares of beneficial interest, $.01 par value, unlimited number of shares authorized)
| $ 5.76 |
Class B Net Asset Value, offering and redemption price per share ($1,637,777 ÷ 290,168 outstanding shares of beneficial interest, $.01 par value, unlimited number of shares authorized)
| $ 5.64 |
* Represents collateral on securities loaned.The accompanying notes are an integral part of the financial statements.
Statement of Operations for the year ended December 31, 2008
|
Investment Income |
Income:
Dividends (net of foreign taxes withheld of $45,450)
| $ 847,965 |
Interest — Cash Management QP Trust
| 77,951 |
Securities lending income, including income from Daily Assets Fund Institutional, net of borrower rebates
| 162,024 |
Total Income
| 1,087,940 |
Expenses:
Management fee
| 762,698 |
Administration fee
| 66,748 |
Custodian and accounting fees
| 43,157 |
Distribution service fee (Class B)
| 6,303 |
Record keeping fees (Class B)
| 2,335 |
Services to shareholders
| 468 |
Professional fees
| 62,902 |
Trustees' fees and expenses
| 14,753 |
Reports to shareholders and shareholder meeting
| 112,255 |
Other
| 37,821 |
Total expenses before expense reductions
| 1,109,440 |
Expense reductions
| (6,385) |
Total expenses after expense reductions
| 1,103,055 |
Net investment income (loss) | (15,115) |
Realized and Unrealized Gain (Loss) |
Net realized gain (loss) from:
Investments (net of foreign tax of $4,535)
| (17,630,579) |
Written options
| 213,987 |
Foreign currency
| (193,319) |
| (17,609,911) |
Change in net unrealized appreciation (depreciation) on:
Investments
| (45,865,658) |
Foreign currency
| 2,337 |
| (45,863,321) |
Net gain (loss) | (63,473,232) |
Net increase (decrease) in net assets resulting from operations | $ (63,488,347) |
The accompanying notes are an integral part of the financial statements.
Statement of Changes in Net Assets |
| Years Ended December 31, |
Increase (Decrease) in Net Assets | 2008 | 2007 |
Operations:
Net investment income (loss)
| $ (15,115) | $ (274,509) |
Net realized gain (loss)
| (17,609,911) | 19,041,595 |
Net unrealized appreciation (depreciation)
| (45,863,321) | 2,725,297 |
Net increase (decrease) in net assets resulting from operations
| (63,488,347) | 21,492,383 |
Portfolio share transactions:
Class A Proceeds from shares sold
| 4,037,835 | 10,492,529 |
Cost of shares redeemed
| (35,554,956) | (42,815,094) |
Net increase (decrease) in net assets from Class A share transactions
| (31,517,121) | (32,322,565) |
Class B Proceeds from shares sold
| 405,112 | 1,326,815 |
Cost of shares redeemed
| (691,475) | (12,807,358) |
Net increase (decrease) in net assets from Class B share transactions
| (286,363) | (11,480,543) |
Increase (decrease) in net assets | (95,291,831) | (22,310,725) |
Net assets at beginning of period
| 156,486,118 | 178,796,843 |
Net assets at end of period (including accumulated net investment loss of $4,837 and $5,235, respectively)
| $ 61,194,287 | $ 156,486,118 |
Other Information |
Class A Shares outstanding at beginning of period
| 14,290,167 | 17,575,288 |
Shares sold
| 484,042 | 994,111 |
Shares redeemed
| (4,437,758) | (4,279,232) |
Net increase (decrease) in Class A shares
| (3,953,716) | (3,285,121) |
Shares outstanding at end of period
| 10,336,451 | 14,290,167 |
Class B Shares outstanding at beginning of period
| 325,361 | 1,525,054 |
Shares sold
| 46,978 | 127,903 |
Shares redeemed
| (82,171) | (1,327,596) |
Net increase (decrease) in Class B shares
| (35,193) | (1,199,693) |
Shares outstanding at end of period
| 290,168 | 325,361 |
The accompanying notes are an integral part of the financial statements.
Financial Highlights
Class A Years Ended December 31, | 2008 | 2007 | 2006 | 2005 | 2004 |
Selected Per Share Data |
Net asset value, beginning of period | $ 10.71 | $ 9.37 | $ 9.30 | $ 9.01 | $ 8.84 |
Income (loss) from investment operations: Net investment income (loss)a | (.00)* | (.02) | (.01)c | (.03) | .04 |
Net realized and unrealized gain (loss) | (4.95) | 1.36 | .08 | .36 | .13 |
Total from investment operations | (4.95) | 1.34 | .07 | .33 | .17 |
Less distributions from: Net investment income | — | — | — | (.04) | — |
Net asset value, end of period | $ 5.76 | $ 10.71 | $ 9.37 | $ 9.30 | $ 9.01 |
Total Return (%)
| (46.22)b | 14.30 | .75c | 3.74 | 1.92 |
Ratios to Average Net Assets and Supplemental Data |
Net assets, end of period ($ millions)
| 60 | 153 | 165 | 199 | 230 |
Ratio of expenses before expense reductions (%)
| 1.01 | .91 | .89 | .86 | .83 |
Ratio of expenses after expense redctions (%)
| 1.00 | .91 | .89 | .86 | .83 |
Ratio of net investment income (loss) (%)
| (.01) | (.15) | (.12)c | (.36) | .43 |
Portfolio turnover rate (%)
| 71 | 91 | 49 | 135 | 112 |
a Based on average shares outstanding during the period.
b Total return would have been lower had certain expenses not been reduced.
c Includes non-recurring income from the Advisor recorded as a result of an administrative proceeding regarding disclosure of brokerage allocation practices in connection with sales of DWS Funds. The non-recurring income resulted in an increase in net investment income of $0.017 per share and an increase in the ratio of net investment income of 0.18%. Excluding this non-recurring income, total return would have been 0.19% lower.
* Amount is less than $0.005.
|
Class B Years Ended December 31, | 2008 | 2007 | 2006 | 2005 | 2004 |
Selected Per Share Data |
Net asset value, beginning of period | $ 10.53 | $ 9.25 | $ 9.21 | $ 8.93 | $ 8.80 |
Income (loss) from investment operations: Net investment income (loss)a | (.03) | (.05) | (.04)c | (.07) | .01 |
Net realized and unrealized gain (loss) | (4.86) | 1.33 | .08 | .36 | .12 |
Total from investment operations | (4.89) | 1.28 | .04 | .29 | .13 |
Less distributions from: Net investment income | — | — | — | (.01) | — |
Net asset value, end of period | $ 5.64 | $ 10.53 | $ 9.25 | $ 9.21 | $ 8.93 |
Total Return (%)
| (46.44)b | 13.84 | .43c | 3.27 | 1.48b |
Ratios to Average Net Assets and Supplemental Data |
Net assets, end of period ($ millions)
| 2 | 3 | 14 | 16 | 16 |
Ratio of expenses before expense reductions (%)
| 1.35 | 1.29 | 1.28 | 1.26 | 1.22 |
Ratio of expenses after expense reductions (%)
| 1.35 | 1.29 | 1.28 | 1.26 | 1.21 |
Ratio of net investment income (loss) (%)
| (.35) | (.53) | (.51)c | (.76) | .05 |
Portfolio turnover rate (%)
| 71 | 91 | 49 | 135 | 112 |
a Based on average shares outstanding during the period.
b Total return would have been lower had certain expenses not been reduced.
c Includes non-recurring income from the Advisor recorded as a result of an administrative proceeding regarding disclosure of brokerage allocation practices in connection with sales of DWS Funds. The non-recurring income resulted in an increase in net investment income of $0.017 per share and an increase in the ratio of net investment income of 0.18%. Excluding this non-recurring income, total return would have been 0.19% lower.
|
Performance Summary December 31, 2008
DWS Turner Mid Cap Growth VIP
All performance shown is historical, assumes reinvestment of all dividend and capital gain distributions and does not guarantee future results. Investment return and principal value fluctuate with changing market conditions so that, when redeemed, shares may be worth more or less than their original cost. Current performance may be lower or higher than the performance data quoted. Please contact your participating insurance company for the Portfolio's most recent month-end performance. Performance doesn't reflect charges and fees ("contract charges") associated with the separate account that invests in the Portfolio or any variable life insurance policy or variable annuity contract for which the Portfolio is an investment option. These charges and fees will reduce returns. While all share classes have the same underlying portfolio, their performance will differ.
The total annual portfolio operating expense ratios, gross of any fee waivers or expense reimbursements, as stated in the fee table of the prospectus dated May 1, 2008 are 0.91% and 1.16% for Class A and Class B shares, respectively. Please see the Information About Your Portfolio's Expenses, the Financial Highlights and Notes to the Financial Statements (Note C, Related Parties) sections of this report for gross and net expense related disclosure for the period ended December 31, 2008.
Risk Considerations
The Portfolio is subject to stock market risk, meaning stocks in the Portfolio may decline in value for extended periods of time due to the activities and financial prospects of individual companies, or due to general market and economic conditions. Stocks of medium-sized companies involve greater risk than securities of larger, more established companies, as they often have limited product lines, markets or financial resources and may be subject to more-erratic and more-abrupt market movements. Please read this Portfolio's prospectus for specific details regarding this product's investments and risk profile.
Portfolio returns shown for all periods reflect a fee waiver and/or expense reimbursement. Without this waiver/reimbursement, returns would have been lower.
Growth of an Assumed $10,000 Investment in DWS Turner Mid Cap Growth VIP from 5/1/2001 to 12/31/2008 |
[] DWS Turner Mid Cap Growth VIP — Class A [] Russell Midcap® Growth Index | The Russell Midcap® Growth Index is an unmanaged index that measures the performance of those Russell Midcap companies with higher price-to-book ratios and higher forecasted growth values. Index returns assume reinvestment of dividends and, unlike portfolio returns, do not reflect any fees or expenses. It is not possible to invest directly in an index. |
 | |
Yearly periods ended December 31 |
|
Comparative Results |
DWS Turner Mid Cap Growth VIP | 1-Year | 3-Year | 5-Year | Life of Portfolio* |
Class A | Growth of $10,000
| $5,051 | $6,766 | $8,396 | $7,456 |
Average annual total return
| -49.49% | -12.21% | -3.44% | -3.76% |
Russell Midcap Growth Index
| Growth of $10,000
| $5,568 | $6,865 | $8,887 | $8,411 |
Average annual total return
| -44.32% | -11.79% | -2.33% | -2.23% |
DWS Turner Mid Cap Growth VIP | 1-Year | 3-Year | 5-Year | Life of Class** |
Class B | Growth of $10,000
| $4,946 | $6,573 | $8,090 | $10,836 |
Average annual total return
| -50.54% | -13.05% | -4.15% | 1.24% |
Russell Midcap Growth Index
| Growth of $10,000
| $5,568 | $6,865 | $8,887 | $11,466 |
Average annual total return
| -44.32% | -11.79% | -2.33% | 2.13% |
The growth of $10,000 is cumulative.
* The Portfolio commenced operations on May 1, 2001. Index returns began on April 30, 2001.** The Portfolio commenced offering Class B shares on July 1, 2002. Index returns began on June 30, 2002.Information About Your Portfolio's Expenses
DWS Turner Mid Cap Growth VIP
As an investor of the Portfolio, you incur two types of costs: ongoing expenses and transaction costs. Ongoing expenses include management fees, distribution and service (12b-1) fees and other Portfolio expenses. Examples of transaction costs include contract charges, redemption fees and account maintenance fees, which are not shown in this section. The following tables are intended to help you understand your ongoing expenses (in dollars) of investing in the Portfolio and to help you compare these expenses with the ongoing expenses of investing in other mutual funds. In the most recent six-month period, the Portfolio limited these expenses, had it not done so, expenses would have been higher. The example in the table is based on an investment of $1,000 invested at the beginning of the six-month period and held for the entire period (July 1, 2008 to December 31, 2008).
The tables illustrate your Portfolio's expenses in two ways:
• Actual Portfolio Return. This helps you estimate the actual dollar amount of ongoing expenses (but not transaction costs) paid on a $1,000 investment in the Portfolio using the Portfolio's actual return during the period. To estimate the expenses you paid over the period, simply divide your account value by $1,000 (for example, an $8,600 account value divided by $1,000 = 8.6), then multiply the result by the number in the "Expenses Paid per $1,000" line under the share class you hold.
• Hypothetical 5% Portfolio Return. This helps you to compare your Portfolio's ongoing expenses (but not transaction costs) with those of other mutual funds using the Portfolio's actual expense ratio and a hypothetical rate of return of 5% per year before expenses. Examples using a 5% hypothetical Portfolio return may be found in the shareholder reports of other mutual funds. The hypothetical account values and expenses may not be used to estimate the actual ending account balance or expenses you paid for the period.
Please note that the expenses shown in these tables are meant to highlight your ongoing expenses only and do not reflect any transaction costs. The "Expenses Paid per $1,000" line of the tables is useful in comparing ongoing expenses only and will not help you determine the relative total expense of owning different funds. If these transaction costs had been included, your costs would have been higher.
Expenses and Value of a $1,000 Investment for the six months ended December 31, 2008 |
Actual Portfolio Return | Class A | | Class B | |
Beginning Account Value 7/1/08
| $ 1,000.00 | | $ 1,000.00 | |
Ending Account Value 12/31/08
| $ 556.00 | | $ 541.70 | |
Expenses Paid per $1,000*
| $ 4.11 | | $ 4.84 | |
Hypothetical 5% Portfolio Return | Class A | | Class B | |
Beginning Account Value 7/1/08
| $ 1,000.00 | | $ 1,000.00 | |
Ending Account Value 12/31/08
| $ 1,019.86 | | $ 1,018.85 | |
Expenses Paid per $1,000*
| $ 5.33 | | $ 6.34 | |
* Expenses are equal to the Portfolio's annualized expense ratio for each share class, multiplied by the average account value over the period, multiplied by the number of days in the most recent six-month period, then divided by 366.Annualized Expense Ratios | Class A | | Class B | |
DWS Variable Series II — DWS Turner Mid Cap Growth VIP
| 1.05% | | 1.25% | |
For more information, please refer to the Portfolio's prospectus.
These tables do not reflect charges and fees ("contract charges") associated with the separate account that invests in the Portfolio or any variable life insurance policy or variable annuity contract for which the Portfolio is an investment option.
Management Summary December 31, 2008
DWS Turner Mid Cap Growth VIP
Faced with one of the most challenging markets that many have not seen in their lifetimes, DWS Turner Mid Cap Growth VIP, which emphasizes earnings growth, returned -49.49% during the period ending December 31, 2008 (Class A shares, unadjusted for contract charges). This trailed the results of the Russell Midcap® Growth Index, the Portfolio's benchmark, which returned -44.32% for the same period. The Portfolio underperformed in part due to relative weak results in the consumer discretionary, health care and technology sectors. Alternatively, the financial services sector contributed the most to results, helped in part by our general avoidance of credit-sensitive companies.
The consumer discretionary sector continued to be an area of concern, as most consumer-sensitive industries (apparel, gaming, restaurants) detracted meaningfully from relative results. Guess? Inc., the apparel retailer and wholesaler, was negatively affected by a beaten-down retail environment and was forced to lower its outlook for 2008. Casino operator Wynn Resorts Ltd. fell substantially, as its Las Vegas casino/hotel could not overcome a cautious consumer faced with numerous recessionary forces.
The health care sector was the second-largest detractor for the year, and our stock selection contributed to the Portfolio's underperformance versus the benchmark. Shares in Charles River Labs*, a drug discovery and development company, fell during the holding period, as the economy was negatively impacting its core client base: biotech and major pharmaceutical companies. United Therapeutics Corp., a biotechnology company, traded lower on the news of a failed trial for its oral version of the blood pressure drug Remodulin.
As was the case in 2007, the financial services sector again played a pivotal role in the equity markets this past year and is largely responsible for the current economic condition. From a Portfolio perspective, our stance on avoiding credit-sensitive companies continues to be the key to the relative outperformance of the financial services sector of the Portfolio. Two areas of the sector that had a positive impact on performance were insurance brokers (AON Corp.) and savings banks (Hudson City Bancorp, Inc.).
Christopher K. McHugh Tara Hedlund Jason Schrotberger
Lead Manager Portfolio Managers, Turner Investment Partners, Inc., Subadvisor to the Portfolio
The Russell Midcap Growth Index is an unmanaged index that measures the performance of those Russell Midcap companies with higher price-to-book ratios and higher forecasted growth values. Index returns assume reinvestment of dividends and, unlike portfolio returns, do not reflect any fees or expenses. It is not possible to invest directly into an index.
* Not held in the Portfolio as of December 31, 2008.Portfolio management market commentary is as of December 31, 2008, and may not come to pass. This information is subject to change at any time based on market and other conditions. Past performance does not guarantee future results. Current and future portfolio holdings are subject to risk.
Portfolio Summary
DWS Turner Mid Cap Growth VIP
Asset Allocation (As a % of Investment Portfolio excluding Securities Lending Collateral) | 12/31/08 | 12/31/07 |
| | |
Common Stocks | 100% | 100% |
Sector Diversification (As a % of Common Stocks) | 12/31/08 | 12/31/07 |
| | |
Consumer Discretionary | 22% | 11% |
Information Technology | 21% | 23% |
Industrials | 13% | 19% |
Health Care | 13% | 12% |
Financials | 10% | 9% |
Energy | 8% | 12% |
Materials | 6% | 5% |
Consumer Staples | 3% | 4% |
Telecommunication Services | 2% | 2% |
Utilities | 2% | 3% |
| 100% | 100% |
Asset allocation and sector diversification are subject to change.
For more complete details about the Portfolio's investment portfolio, see page 285. A complete list of the portfolio holdings of the portfolio is posted as of the month end on www.dws-investments.com on or about the 15th day of the following month. More frequent posting of portfolio holdings information may be made from time to time on www.dws-investments.com.
Following the Portfolio's fiscal first and third quarter-end, a complete portfolio holdings listing is filed with the SEC on Form N-Q. The form will be available on the SEC's Web site at www.sec.gov, and it also may be reviewed and copied at the SEC's Public Reference Room in Washington, D.C. Information on the operation of the SEC's Public Reference Room may be obtained by calling (800) SEC-0330.
Investment Portfolio December 31, 2008
DWS Turner Mid Cap Growth VIP
| Shares | Value ($) |
| |
Common Stocks 100.3% |
Consumer Discretionary 21.7% |
Diversified Consumer Services 2.8% |
Apollo Group, Inc. "A"* | 12,030 | 921,739 |
ITT Educational Services, Inc.* (a) | 4,610 | 437,858 |
| 1,359,597 |
Hotels Restaurants & Leisure 5.4% |
Darden Restaurants, Inc. | 13,980 | 393,956 |
WMS Industries, Inc.* (a) | 24,675 | 663,758 |
Wynn Resorts Ltd.* (a) | 16,340 | 690,528 |
Yum! Brands, Inc. | 28,160 | 887,040 |
| 2,635,282 |
Household Durables 3.0% |
Pulte Homes, Inc. (a) | 72,930 | 797,125 |
Toll Brothers, Inc.* (a) | 30,500 | 653,615 |
| 1,450,740 |
Media 0.8% |
Cablevision Systems Corp. (New York Group) "A" (a) | 22,000 | 370,480 |
Multiline Retail 2.5% |
Dollar Tree, Inc.* (a) | 7,860 | 328,548 |
Kohl's Corp.* | 25,300 | 915,860 |
| 1,244,408 |
Specialty Retail 5.9% |
GameStop Corp. "A"* | 27,850 | 603,231 |
Guess?, Inc. | 32,860 | 504,401 |
Staples, Inc. | 28,520 | 511,078 |
The Sherwin-Williams Co. (a) | 10,700 | 639,325 |
Urban Outfitters, Inc.* (a) | 39,860 | 597,103 |
| 2,855,138 |
Textiles, Apparel & Luxury Goods 1.3% |
Deckers Outdoor Corp.* (a) | 7,860 | 627,778 |
Consumer Staples 3.2% |
Beverages 0.6% |
Hansen Natural Corp.* | 9,320 | 312,500 |
Household Products 1.3% |
Church & Dwight Co., Inc. | 2,630 | 147,595 |
Clorox Co. | 8,400 | 466,704 |
| 614,299 |
Personal Products 1.3% |
Alberto-Culver Co. | 25,940 | 635,789 |
Energy 8.2% |
Energy Equipment & Services 3.0% |
Cameron International Corp.* | 26,150 | 536,075 |
Dresser-Rand Group, Inc.* | 21,650 | 373,463 |
Smith International, Inc. | 24,350 | 557,371 |
| 1,466,909 |
Oil, Gas & Consumable Fuels 5.2% |
CONSOL Energy, Inc. | 27,360 | 781,949 |
Goodrich Petroleum Corp.* (a) | 17,560 | 525,922 |
Range Resources Corp. | 16,234 | 558,287 |
Southwestern Energy Co.* | 23,140 | 670,366 |
| 2,536,524 |
| Shares | Value ($) |
| |
Financials 10.3% |
Capital Markets 4.9% |
BlackRock, Inc. (a) | 2,140 | 287,081 |
Lazard Ltd. "A" (a) | 19,020 | 565,655 |
Northern Trust Corp. | 13,550 | 706,497 |
T. Rowe Price Group, Inc. (a) | 23,500 | 832,840 |
| 2,392,073 |
Diversified Financial Services 1.2% |
IntercontinentalExchange, Inc.* | 7,050 | 581,202 |
Insurance 2.0% |
Aon Corp. | 11,950 | 545,876 |
W.R. Berkley Corp. | 14,820 | 459,420 |
| 1,005,296 |
Thrifts & Mortgage Finance 2.2% |
Hudson City Bancorp., Inc. | 39,180 | 625,313 |
People's United Financial, Inc. | 24,070 | 429,168 |
| 1,054,481 |
Health Care 12.5% |
Biotechnology 2.8% |
Alexion Pharmaceuticals, Inc.* (a) | 17,380 | 628,982 |
Myriad Genetics, Inc.* (a) | 6,170 | 408,824 |
United Therapeutics Corp.* (a) | 5,610 | 350,906 |
| 1,388,712 |
Health Care Equipment & Supplies 1.6% |
DENTSPLY International, Inc. (a) | 13,130 | 370,791 |
Intuitive Surgical, Inc.* (a) | 3,070 | 389,859 |
| 760,650 |
Health Care Providers & Services 5.4% |
Aetna, Inc. | 12,740 | 363,090 |
DaVita, Inc.* | 9,700 | 480,829 |
Express Scripts, Inc.* | 20,090 | 1,104,548 |
Henry Schein, Inc.* (a) | 9,630 | 353,325 |
Omnicare, Inc. | 11,200 | 310,912 |
| 2,612,704 |
Life Sciences Tools & Services 1.8% |
Covance, Inc.* (a) | 7,380 | 339,701 |
Illumina, Inc.* (a) | 21,400 | 557,470 |
| 897,171 |
Pharmaceuticals 0.9% |
Allergan, Inc. | 10,880 | 438,682 |
Industrials 12.9% |
Aerospace & Defense 1.1% |
Precision Castparts Corp. | 9,350 | 556,138 |
Air Freight & Logistics 1.5% |
C.H. Robinson Worldwide, Inc. | 13,110 | 721,443 |
Airlines 1.1% |
Continental Airlines, Inc. "B"* (a) | 28,510 | 514,891 |
Commercial Services & Supplies 3.4% |
Clean Harbors, Inc.* | 6,170 | 391,425 |
Covanta Holding Corp.* (a) | 22,360 | 491,025 |
Stericycle, Inc.* (a) | 14,550 | 757,764 |
| 1,640,214 |
| Shares | Value ($) |
| |
Construction & Engineering 1.6% |
Jacobs Engineering Group, Inc.* | 7,930 | 381,433 |
Quanta Services, Inc.* (a) | 20,500 | 405,900 |
| 787,333 |
Electrical Equipment 1.5% |
AMETEK, Inc. | 13,780 | 416,294 |
First Solar, Inc.* (a) | 2,270 | 313,169 |
| 729,463 |
Professional Services 2.0% |
FTI Consulting, Inc.* (a) | 7,420 | 331,526 |
Robert Half International, Inc. (a) | 30,600 | 637,092 |
| 968,618 |
Road & Rail 0.7% |
J.B. Hunt Transport Services, Inc. (a) | 13,130 | 344,925 |
Information Technology 21.2% |
Communications Equipment 4.0% |
F5 Networks, Inc.* (a) | 31,500 | 720,090 |
Juniper Networks, Inc.* | 58,070 | 1,016,806 |
Polycom, Inc.* | 15,640 | 211,296 |
| 1,948,192 |
Computers & Peripherals 0.8% |
SanDisk Corp.* (a) | 37,570 | 360,672 |
Internet Software & Services 1.0% |
Omniture, Inc.* (a) | 28,500 | 303,240 |
VistaPrint Ltd.* (a) | 10,830 | 201,546 |
| 504,786 |
Semiconductors & Semiconductor Equipment 9.3% |
Altera Corp. (a) | 42,580 | 711,512 |
Atheros Communications* (a) | 26,330 | 376,782 |
Broadcom Corp. "A"* | 55,180 | 936,405 |
Cavium Networks, Inc.* (a) | 25,400 | 266,954 |
KLA-Tencor Corp. (a) | 23,960 | 522,088 |
Lam Research Corp.* (a) | 33,290 | 708,411 |
PMC-Sierra, Inc.* (a) | 91,200 | 443,232 |
Varian Semiconductor Equipment Associates, Inc.* (a) | 31,320 | 567,519 |
| 4,532,903 |
Software 6.1% |
Activision Blizzard, Inc.* | 61,860 | 534,471 |
Adobe Systems, Inc.* | 15,810 | 336,595 |
Citrix Systems, Inc.* | 21,020 | 495,441 |
| Shares | Value ($) |
| |
Intuit, Inc.* | 18,960 | 451,058 |
McAfee, Inc.* | 33,440 | 1,156,021 |
| 2,973,586 |
Materials 5.7% |
Chemicals 2.7% |
Airgas, Inc. (a) | 11,640 | 453,844 |
Ecolab, Inc. | 15,050 | 529,007 |
Sigma-Aldrich Corp. (a) | 7,900 | 333,696 |
| 1,316,547 |
Construction Materials 0.8% |
Martin Marietta Materials, Inc. (a) | 4,020 | 390,262 |
Containers & Packaging 1.0% |
Pactiv Corp.* | 20,350 | 506,308 |
Metals & Mining 1.2% |
Cliffs Natural Resources, Inc. | 9,200 | 235,612 |
Compass Minerals International, Inc. (a) | 5,700 | 334,362 |
| 569,974 |
Telecommunication Services 2.4% |
Wireless Telecommunication Services |
American Tower Corp. "A"* | 20,190 | 591,971 |
MetroPCS Communications, Inc.* (a) | 38,040 | 564,894 |
| 1,156,865 |
Utilities 2.2% |
Electric Utilities 1.0% |
PPL Corp. | 17,020 | 522,344 |
Gas Utilities 1.2% |
Questar Corp. | 17,480 | 571,420 |
Total Common Stocks (Cost $57,490,443) | 48,857,299 |
|
Securities Lending Collateral 28.1% |
Daily Assets Fund Institutional, 1.69% (b) (c) (Cost $13,671,806) | 13,671,806 | 13,671,806 |
| % of Net Assets | Value ($) |
| |
Total Investment Portfolio (Cost $71,162,249)+ | 128.4 | 62,529,105 |
Other Assets and Liabilities, Net | (28.4) | (13,836,700) |
Net Assets | 100.0 | 48,692,405 |
* Non-income producing security.+ The cost for federal income tax purposes was $72,195,203. At December 31, 2008, net unrealized depreciation for all securities based on tax cost was $9,666,098. This consisted of aggregate gross unrealized appreciation for all securities in which there was an excess of value over tax cost of $3,245,475 and aggregate gross unrealized depreciation for all securities in which there was an excess of tax cost over value of $12,911,573.(a) All or a portion of these securities were on loan (see Notes to Financial Statements). The value of all securities loaned at December 31, 2008 amounted to $13,623,057, which is 28.0% of net assets.(b) Affiliated fund managed by Deutsche Investment Management Americas Inc. The rate shown is the annualized seven-day yield at period end.(c) Represents collateral held in connection with securities lending. Income earned by the Portfolio is net of borrower rebates.Fair Value Measurements
The following is a summary of the inputs used as of December 31, 2008 in valuing the Portfolio's investments. For information on the Portfolio's policy regarding the valuation of investments and of the valuation inputs, and the aggregate levels used in the table below, please refer to the Security Valuation section of Note A in the accompanying Notes to the Financial Statements.
Valuation Inputs | Investments in Securities |
Level 1
| $ 62,529,105 |
Level 2
| — |
Level 3
| — |
Total | $ 62,529,105 |
The accompanying notes are an integral part of the financial statements.
Financial Statements
Statement of Assets and Liabilities as of December 31, 2008
|
Assets |
Investments:
Investments in securities, at value (cost $57,490,443) — including $13,623,057 of securities loaned | $ 48,857,299 |
Investment in Daily Assets Fund Institutional (cost $13,671,806)* | 13,671,806 |
Total investments, at value (cost $71,162,249)
| 62,529,105 |
Dividends receivable
| 25,366 |
Interest receivable
| 26,967 |
Other assets
| 2,905 |
Total assets
| 62,584,343 |
Liabilities |
Payable upon return of securities loaned
| 13,671,806 |
Cash overdraft
| 47,692 |
Payable for Portfolio shares redeemed
| 8,249 |
Accrued management fee
| 32,328 |
Other accrued expenses and payables
| 131,863 |
Total liabilities
| 13,891,938 |
Net assets, at value | $ 48,692,405 |
Net Assets Consist of |
Accumulated net investment loss
| (5,550) |
Net unrealized appreciation (depreciation) on investments
| (8,633,144) |
Accumulated net realized gain (loss)
| (17,538,318) |
Paid-in capital
| 74,869,417 |
Net assets, at value | $ 48,692,405 |
Class A Net Asset Value, offering and redemption price per share ($48,686,132 ÷ 9,629,198 outstanding shares of beneficial interest, $.01 par value, unlimited number of shares authorized)
| $ 5.06 |
Class B Net Asset Value, offering and redemption price per share ($6,273 ÷ 1,306 outstanding shares of beneficial interest, $.01 par value, unlimited number of shares authorized)
| $ 4.80 |
* Represents collateral on securities loaned.The accompanying notes are an integral part of the financial statements.
Statement of Operations for the year ended December 31, 2008
|
Investment Income |
Income:
Dividends (net of foreign taxes withheld of $3,576)
| $ 540,150 |
Interest — Cash Management QP Trust
| 36,830 |
Securities lending income, including income from Daily Assets Fund Institutional, net of borrower rebates
| 277,363 |
Total Income
| 854,343 |
Expenses:
Management fee
| 737,881 |
Administration fee
| 59,597 |
Services to shareholders
| 363 |
Custodian and accounting fees
| 36,384 |
Distribution service fee (Class B)
| 3,805 |
Record keeping fees (Class B)
| 1,485 |
Professional fees
| 68,759 |
Trustees' fees and expenses
| 34,451 |
Reports to shareholders and shareholder meeting
| 64,427 |
Other
| 11,034 |
Total expenses before expense reductions
| 1,018,186 |
Expense reductions
| (22,326) |
Total expenses after expense reductions
| 995,860 |
Net investment income (loss) | (141,517) |
Realized and Unrealized Gain (Loss) |
Net realized gain (loss) from:
Investments
| (17,418,447) |
Change in net unrealized appreciation (depreciation) on investments
| (43,114,819) |
Net gain (loss) | (60,533,266) |
Net increase (decrease) in net assets resulting from operations | $ (60,674,783) |
The accompanying notes are an integral part of the financial statements.
Statement of Changes in Net Assets |
| Years Ended December 31, |
Increase (Decrease) in Net Assets | 2008 | 2007 |
Operations:
Net investment income (loss)
| $ (141,517) | $ (528,074) |
Net realized gain (loss)
| (17,418,447) | 23,736,292 |
Change in net unrealized appreciation (depreciation)
| (43,114,819) | 7,277,206 |
Net increase (decrease) in net assets resulting from operations
| (60,674,783) | 30,485,424 |
Distributions to shareholders from:
Net realized gains:
Class A | (22,224,763) | (9,828,253) |
Class B | (923,048) | (2,183,905) |
Tax return of capital:
Class A | (10,487) | — |
Class B | (436) | — |
Total distributions
| (23,158,734) | (12,012,158) |
Portfolio share transactions:
Class A Proceeds from shares sold
| 13,243,891 | 17,681,217 |
Reinvestment of distributions
| 22,235,250 | 9,828,253 |
Cost of shares redeemed
| (33,004,175) | (33,144,770) |
Net increase (decrease) in net assets from Class A share transactions
| 2,474,966 | (5,635,300) |
Class B Proceeds from shares sold
| 232,736 | 706,509 |
Reinvestment of distributions
| 923,484 | 2,183,905 |
Cost of shares redeemed
| (5,170,159) | (24,376,442) |
Net increase (decrease) in net assets from Class B share transactions
| (4,013,939) | (21,486,028) |
Increase (decrease) in net assets | (85,372,490) | (8,648,062) |
Net assets at beginning of period
| 134,064,895 | 142,712,957 |
Net assets at end of period (including accumulated net investment loss of $5,550 and $4,298, respectively)
| $ 48,692,405 | $ 134,064,895 |
Other Information |
Class A Shares outstanding at beginning of period
| 10,261,710 | 10,696,292 |
Shares sold
| 1,439,377 | 1,504,234 |
Shares issued to shareholders in reinvestment of distributions
| 2,558,716 | 950,508 |
Shares redeemed
| (4,630,605) | (2,889,324) |
Net increase (decrease) in Class A shares
| (632,512) | (434,582) |
Shares outstanding at end of period
| 9,629,198 | 10,261,710 |
Class B Shares outstanding at beginning of period
| 432,386 | 2,410,110 |
Shares sold
| 21,851 | 61,336 |
Shares issued to shareholders in reinvestment of distributions
| 109,548 | 215,587 |
Shares redeemed
| (562,479) | (2,254,647) |
Net increase (decrease) in Class B shares
| (431,080) | (1,977,724) |
Shares outstanding at end of period
| 1,306 | 432,386 |
The accompanying notes are an integral part of the financial statements.
Financial Highlights
Class A Years Ended December 31, | 2008 | 2007 | 2006 | 2005 | 2004 |
Selected Per Share Data |
Net asset value, beginning of period | $ 12.55 | $ 10.92 | $ 11.02 | $ 9.86 | $ 8.88 |
Income (loss) from investment operations: Net investment income (loss)a | (.01) | (.04) | (.01) | (.05) | (.07) |
Net realized and unrealized gain (loss) | (5.28) | 2.64 | .77 | 1.21 | 1.05 |
Total from investment operations | (5.29) | 2.60 | .76 | 1.16 | .98 |
Less distributions from:
Net realized gains | (2.20) | (.97) | (.86) | — | — |
Tax return of capital | (.00)* | — | — | — | — |
Total distributions | (2.20) | (.97) | (.86) | — | — |
Net asset value, end of period | $ 5.06 | $ 12.55 | $ 10.92 | $ 11.02 | $ 9.86 |
Total Return (%)
| (49.49)b | 25.75 | 6.52 | 11.76 | 11.04 |
Ratios to Average Net Assets and Supplemental Data |
Net assets, end of period ($ millions)
| 49 | 129 | 117 | 122 | 118 |
Ratio of expenses before expense reductions (%)
| 1.03 | .95 | .97 | 1.11 | 1.19 |
Ratio of expenses after expense reductions (%)
| 1.00 | .95 | .97 | 1.11 | 1.19 |
Ratio of net investment income (loss) (%)
| (.14) | (.36) | (.06) | (.56) | (.82) |
Portfolio turnover rate (%)
| 156 | 133 | 148 | 151 | 174 |
a Based on average shares outstanding during the period.
b Total return would have been lower had certain expenses not been reduced.
* Amount is less than $.005.
|
Class B Years Ended December 31, | 2008 | 2007 | 2006 | 2005 | 2004 |
Selected Per Share Data |
Net asset value, beginning of period | $ 12.26 | $ 10.73 | $ 10.88 | $ 9.78 | $ 8.84 |
Income (loss) from investment operations: Net investment income (loss)a | (.07) | (.08) | (.05) | (.09) | (.10) |
Net realized and unrealized gain (loss) | (5.19) | 2.58 | .76 | 1.19 | 1.04 |
Total from investment operations | (5.26) | 2.50 | .71 | 1.10 | .94 |
Less distributions from:
Net realized gains | (2.20) | (.97) | (.86) | — | — |
Tax return of capital | (.00)* | — | — | — | — |
Total distributions | (2.20) | (.97) | (.86) | — | — |
Net asset value, end of period | $ 4.80 | $ 12.26 | $ 10.73 | $ 10.88 | $ 9.78 |
Total Return (%)
| (50.54)b | 25.13 | 6.21 | 11.25b | 10.63 |
Ratios to Average Net Assets and Supplemental Data |
Net assets, end of period ($ millions)
| .01 | 5 | 26 | 27 | 23 |
Ratio of expenses before expense reductions (%)
| 1.45 | 1.34 | 1.37 | 1.51 | 1.56 |
Ratio of expenses after expense reductions (%)
| 1.42 | 1.34 | 1.37 | 1.48 | 1.56 |
Ratio of net investment income (loss) (%)
| (.55) | (.75) | (.46) | (.93) | (1.19) |
Portfolio turnover rate (%)
| 156 | 133 | 148 | 151 | 174 |
a Based on an average shares outstanding during the period.
b Total return would have been lower had certain expenses not been reduced.
* Amount is less than $.005.
|
Notes to Financial Statements
A. Significant Accounting Policies
DWS Variable Series II (the "Trust") is registered under the Investment Company Act of 1940, as amended (the "1940 Act"), as an open-end management investment company organized as a Massachusetts business trust. The Trust offers twenty-one portfolios (hereinafter referred to individually as "Portfolio" or collectively as "Portfolios"), including three portfolios that invest primarily in existing DWS Portfolios and DWS Funds ("Underlying Portfolios") and non-affiliated investment management companies (e.g., Exchange Traded Funds). Each Portfolio (except DWS Technology VIP) is classified as a diversified open-end management investment company. DWS Technology VIP is classified as a non-diversified, open-end management investment company. Each Underlying Portfolio's accounting policies and investment holdings are outlined in the Underlying Portfolio's financials statements and are available upon request.
Multiple Classes of Shares of Beneficial Interest. The Trust offers two classes of shares (Class A shares and Class B shares), except DWS Moderate Allocation VIP, DWS Growth Allocation VIP and DWS Conservative Allocation VIP, which offer Class B shares only. Effective July 31, 2008, Class B shares of DWS Janus Growth & Income VIP were liquidated. Sales of Class B shares are subject to record keeping fees up to 0.15% and Rule 12b-1 fees under the 1940 Act equal to an annual rate of 0.25%, of the average daily net assets of the Class B shares of the applicable Portfolio. Class A shares are not subject to such fees.
Investment income, realized and unrealized gains and losses, and certain portfolio-level expenses and expense reductions, if any, are borne pro rata on the basis of relative net assets by the holders of all classes of shares except that each class bears certain expenses unique to that class (including the applicable Rule 12b-1 fee and record keeping fees). Differences in class-level expenses may result in payment of different per share dividends by class. All shares have equal rights with respect to voting subject to class-specific arrangements.
The Trust's financial statements are prepared in accordance with accounting principles generally accepted in the United States of America which require the use of management estimates. Actual results could differ from those estimates. The policies described below are followed consistently by the Trust in the preparation of its financial statements.
Security Valuation. DWS Money Market VIP values all securities utilizing the amortized cost method permitted in accordance with Rule 2a-7 under the 1940 Act and certain conditions therein. Under this method, which does not take into account unrealized capital gains or losses on securities, an instrument is initially valued at its cost and thereafter assumes a constant accretion/amortization rate to maturity of any discount or premium.
Investments in securities are stated at value determined as of the close of regular trading on the New York Stock Exchange on each day the exchange is open for trading. Equity securities are valued at the most recent sale price or official closing price reported on the exchange (US or foreign) or over-the-counter market on which the security is traded most extensively. Securities for which no sales are reported are valued at the calculated mean between the most recent bid and asked quotations on the relevant market or, if a mean cannot be determined, at the most recent bid quotation.
Exchange traded funds ("ETFs") are valued at the most recent sale price or official closing price reported on the exchange on which the ETFs are traded most extensively. ETFs for which no sales are reported are valued at the calculated mean between the most recent bid and asked quotations on the relevant market or, if a mean cannot be determined, at the most recent bid quotation.
Debt securities are valued by independent pricing services approved by the Trustees of the Portfolios. If the pricing services are unable to provide valuations, the securities are valued at the most recent bid quotation or evaluated price, as applicable, obtained from one or more broker-dealers. Such services may use various pricing techniques which take into account appropriate factors such as yield, quality, coupon rate, maturity, type of issue, trading characteristics and other data, as well as broker quotes.
Money market instruments purchased with an original or remaining maturity of sixty days or less, maturing at par, are valued at amortized cost. Investments in open-end investment companies and Cash Management QP Trust are valued at their net asset value each business day.
Investments in the Underlying Portfolios are valued at the net asset value per share of each class of the Underlying Portfolios as of the close of regular trading on the New York Stock Exchange on each day the exchange is open for trading.
Securities and other assets for which market quotations are not readily available or for which the above valuation procedures are deemed not to reflect fair value are valued in a manner that is intended to reflect their fair value as determined in accordance with procedures approved by the Trustees. Certain Portfolios may use a fair valuation model to value international equity securities in order to adjust for events which may occur between the close of the foreign exchanges and the close of the New York Stock Exchange.
Each Portfolio adopted Financial Accounting Standards Board ("FASB") Statement of Financial Accounting Standards No. 157, "Fair Value Measurements" ("FAS 157"), effective at the beginning of each Portfolio's fiscal year. FAS 157 establishes a three-tier hierarchy for measuring fair value and requires additional disclosure about the classification of fair value measurements.
Various inputs are used in determining the value of each Portfolio's investments. These inputs are summarized in three broad levels. Level 1 includes quoted prices in active markets for identical securities. Level 2 includes other significant observable inputs (including quoted prices for similar securities, interest rates, prepayment speeds and credit risk). Level 3 includes significant unobservable inputs (including each Portfolio's own assumptions in determining the fair value of investments). The inputs or methodology used for valuing securities are not necessarily an indication of the risk associated with investing in those securities. Securities held by a money market fund are reflected as Level 2 because the securities are valued at amortized cost (which approximates fair value) and, accordingly, the inputs used to determine value are not quoted prices in an active market.
The aggregate value by input level, as of December 31, 2008, for each Portfolio's investments, as well as a reconciliation of Level 3 assets for which significant unobservable inputs were used in determining value, is included at the end of each Portfolio's Investment Portfolio.
New Accounting Pronouncement. In March 2008, the FASB issued Statement of Financial Accounting Standards No. 161 ("FAS 161"), "Disclosures about Derivative Instruments and Hedging Activities". FAS 161 requires enhanced disclosure about an entity's derivative and hedging activities including qualitative disclosures about the objectives and strategies for using derivatives, quantitative disclosures about fair value amounts of gains and losses on derivative instruments, and disclosures about credit-risk-related contingent features in derivative agreements. FAS 161 is effective for fiscal years and interim periods beginning after November 15, 2008. Management is currently reviewing the enhanced disclosure requirements for the adoption of FAS 161.
Foreign Currency Translations. The books and records of the Trust are maintained in US dollars. Investment securities and other assets and liabilities denominated in a foreign currency are translated into US dollars at the prevailing exchange rates at period end. Purchases and sales of investment securities, income and expenses are translated into US dollars at the prevailing exchange rates on the respective dates of the transactions.
Net realized and unrealized gains and losses on foreign currency transactions represent net gains and losses between trade and settlement dates on securities transactions, the disposition of forward foreign currency exchange contracts and foreign currencies and the difference between the amount of net investment income accrued and the US dollar amount actually received. That portion of both realized and unrealized gains and losses on investments that results from fluctuations in foreign currency exchange rates is not separately disclosed but is included with net realized and unrealized gain/appreciation and loss/depreciation on investments.
Repurchase Agreements. Each Portfolio may enter into repurchase agreements with certain banks and broker/dealers whereby each Portfolio, through its custodian or sub-custodian bank, receives delivery of the underlying securities, the amount of which at the time of purchase and each subsequent business day is required to be maintained at such a level that the value is equal to at least the principal amount of the repurchase price plus accrued interest. The custodian bank holds the collateral in a separate account until the agreement matures. If the value of the securities falls below the principal amount of the repurchase agreement plus accrued interest, the financial institution deposits additional collateral by the following business day. If the financial institution either fails to deposit the required additional collateral or fails to repurchase the securities as agreed, the Portfolio has the right to sell the securities and recover any resulting loss from the financial institution. If the financial institution enters into bankruptcy, the Portfolio's claim on the collateral may be subject to legal proceedings.
Securities Lending. Each Portfolio, except DWS Money Market VIP, DWS Moderate Allocation VIP, DWS Growth Allocation VIP and DWS Conservative Allocation VIP, may lend securities to financial institutions. The Portfolio retains beneficial ownership of the securities it has loaned and continues to receive interest and dividends paid by the issuer of securities and to participate in any changes in their market value. The Portfolio requires the borrowers of the securities to maintain collateral with the Portfolio consisting of liquid, unencumbered assets having a value at least equal to the value of the securities loaned. When the collateral falls below specified amounts, the lending agents will use their best efforts to obtain additional collateral on the next business day to meet required amounts under the security lending agreement. The Portfolio may invest the cash collateral into a joint trading account in an affiliated money market fund pursuant to Exemptive Orders issued by the SEC. The Portfolio receives compensation for lending its securities either in the form of fees or by earning interest on invested cash collateral net of borrower rebates and fees paid to a lending agent. Either the Portfolio or the borrower may terminate the loan. There may be risks of delay and costs in recovery of securities or even loss of rights in the collateral should the borrower of the securities fail financially. The Portfolio is also subject to all investment risks associated with the reinvestment of any cash collateral received, including, but not limited to, interest rate, credit and liquidity risk associated with such investments.
Interest Rate Swap Contracts. DWS Balanced VIP and DWS Strategic Income VIP may enter into interest rate swap transactions to reduce the interest rate risk inherent in the Portfolio's underlying investments. The use of interest rate swaps is a highly specialized activity that involves investment techniques and risks different from those associated with ordinary portfolio security transactions. In an interest rate swap, the Portfolio agrees to pay to the other party to the interest rate swap (which is known as the "counterparty") a fixed rate payment in exchange for the counterparty agreeing to pay to the Portfolio a variable rate payment, or the Portfolio agrees to receive from the counterparty a fixed rate payment in exchange for the counterparty agreeing to receive from the Portfolio a variable rate payment. The payment obligations are based on the notional amount of the swap. Certain risks may arise when entering into swap transactions including counterparty default, liquidity or unfavorable changes in interest rates. Payments received or made at the end of the measurement period are recorded as realized gain or loss on the Statement of Operations. The value of the swap is adjusted daily based upon a price supplied by a board approved pricing vendor and the change in value is recorded as unrealized appreciation or depreciation.
Credit Default Swap Contracts. A credit default swap is a contract between a buyer and a seller of protection against pre-defined credit events for the reference entity. DWS Balanced VIP, DWS High Income VIP and DWS Strategic Income VIP may buy or sell credit default swap contracts to seek to increase the Portfolio's income, to add leverage to the portfolio, to gain exposure to an underlying issuer's credit quality characteristics without directly investing in that issuer, or to hedge the risk of default on Portfolio securities. As a seller in the credit default swap contract, the Portfolio is required to pay the par (or other agreed-upon) value of the referenced entity to the counterparty with the occurrence of a credit event by a third party, such as a US or foreign corporate issuer, on the reference entity, which would likely result in a loss to the Portfolio. In return, the Portfolio receives from the counterparty a periodic stream of payments over the term of the contract provided that no credit event has occurred. If no credit event occurs, the Portfolio keeps the stream of payments with no payment obligations. The Portfolio may also buy credit default swap contracts in order to hedge against the risk of a credit event on debt securities, in which case the Portfolio functions as the counterparty referenced above. This involves the risk that the contract may expire worthless. It also involves counterparty risk — that the seller may fail to satisfy its payment obligations to the Portfolio with the occurrence of a credit event. When the Portfolio sells a credit default swap contract it will "cover" its commitment. This may be achieved by, among other methods, maintaining cash or liquid assets equal to the aggregate notional value of the reference entities for all outstanding credit default swap contracts sold by the Portfolio.
Credit default swap contracts are marked to market daily based upon quotations from a board approved pricing vendor and the change in value, if any, is recorded daily as unrealized gain or loss. An upfront payment made by the Portfolio is recorded as an asset on the Statement of Assets and Liabilities. An upfront payment received by the Portfolio is recorded as a liability on the Statement of Assets and Liabilities. Under the terms of the credit default swap contracts, the Portfolio receives or makes quarterly payments based on a specified interest rate on a fixed notional amount. These payments are recorded as a realized gain or loss on the Statement of Operations. Payments received or made as a result of a credit event or termination of the contract are recognized, net of a proportional amount of the upfront payment, as realized gains or losses.
The Portfolio adopted FASB Staff Position (FSP) FAS 133-1 and FIN 45-4, "Disclosures about Credit Derivatives and Certain Guarantees: An Amendment of FASB Statement No.133 and FASB Interpretation No. 45", effective November 30, 2008. The amendments to FAS 133 include required disclosure for (i) the nature and terms of the credit derivative, reasons for entering into the credit derivative, the events or circumstances that would require the seller to perform under the credit derivative, and the current status of the payment/performance risk of the credit derivative, (ii) the undiscounted maximum potential amount of future payments the seller could be required to make under the credit derivative, (iii) the fair value of the credit derivative, and (iv) the nature of any recourse provisions and assets held either as collateral or by third parties.
The amendments to FIN 45 require additional disclosure about the current status of the payment/performance risk of a guarantee. All changes to accounting policies have been made in accordance with the FSP and incorporated for the current period in this note and at the end of the Portfolio's Investment Portfolio.
Total Return Swap Contracts. Total return swaps involve commitments to pay interest in exchange for a market-linked return based on a notional amount. DWS Strategic Income VIP may enter into total return swap transactions to hedge against market and interest rate risk or to enhance returns. To the extent the total return of the reference security or index underlying the total return swap exceeds or falls short of the offsetting interest rate obligation, the Portfolio will receive a payment or make a payment to the counterparty, respectively. Certain risks may arise when entering into swap transactions including counterparty default, liquidity or unfavorable changes in the value of underlying reference security or index. Payments received or made at the end of each measurement period are recorded as realized gain or loss on the Statement of Operations. The value of the swap is adjusted daily based upon a price supplied by a board approved pricing vendor and the change in value is recorded as unrealized appreciation or depreciation.
Options. An option contract is a contract in which the writer (seller) of the option grants the buyer of the option, upon payment of a premium, the right to purchase from (call option), or sell to (put option), the writer a designated instrument at a specified price within a specified period of time. Certain options, including options on indices, will require cash settlement by the Portfolio if the option is exercised. Each Portfolio, except for DWS Money Market VIP, may enter into option contracts in order to hedge against potential adverse price movements in the value of portfolio assets; as a temporary substitute for selling selected investments; to lock in the purchase price of a security or currency which it expects to purchase in the near future; as a temporary substitute for purchasing selected investments; and to enhance potential gain.
The liability representing the Portfolio's obligation under an exchange traded written option or investment in a purchased option is valued at the last sale price or, in the absence of a sale, the mean between the closing bid and asked prices or at the most recent asked price (bid for purchased options) if no bid and asked price are available. Over-the-counter written or purchased options are valued using dealer-supplied quotations. Gain or loss is recognized when the option contract expires or is closed.
If the Portfolio writes a covered call option, the Portfolio foregoes, in exchange for the premium, the opportunity to profit during the option period from an increase in the market value of the underlying security above the exercise price. If the Portfolio writes a put option it accepts the risk of a decline in the value of the underlying security below the exercise price. Over-the-counter options have the risk of the potential inability of counterparties to meet the terms of their contracts. The Portfolio's maximum exposure to purchased options is limited to the premium initially paid. In addition, certain risks may arise upon entering into option contracts including the risk that an illiquid secondary market will limit the Portfolio's ability to close out an option contract prior to the expiration date and that a change in the value of the option contract may not correlate exactly with changes in the value of the securities or currencies hedged.
Futures Contracts. A futures contract is an agreement between a buyer or seller and an established futures exchange or its clearinghouse in which the buyer or seller agrees to take or make a delivery of a specific amount of a financial instrument at a specified price on a specific date (settlement date). Each Portfolio, except for DWS Money Market VIP, may enter into futures contracts as a hedge against anticipated interest rate, currency or equity market changes and for duration management, risk management and return enhancement purposes. DWS Balanced VIP and DWS Strategic Income VIP may also enter into futures contracts as part of each Portfolio's global tactical asset allocation strategy.
Upon entering into a futures contract, the Portfolio is required to deposit with a financial intermediary an amount ("initial margin") equal to a certain percentage of the face value indicated in the futures contract. Subsequent payments ("variation margin") are made or received by the Portfolio dependent upon the daily fluctuations in the value of the underlying security and are recorded for financial reporting purposes as unrealized gains or losses by the Portfolio. When entering into a closing transaction, the Portfolio will realize a gain or loss equal to the difference between the value of the futures contract to sell and the futures contract to buy. Futures contracts are valued at the most recent settlement price.
Certain risks may arise upon entering into futures contracts, including the risk that an illiquid secondary market will limit the Portfolio's ability to close out a futures contract prior to the settlement date and that a change in the value of a futures contract may not correlate exactly with the changes in the value of the securities or currencies hedged. When utilizing futures contracts to hedge, the Portfolio gives up the opportunity to profit from favorable price movements in the hedged positions during the term of the contract. Risk of loss may exceed amounts recognized on the Statement of Assets and Liabilities.
Forward Foreign Currency Exchange Contracts. A forward foreign currency exchange contract (forward currency contract) is a commitment to purchase or sell a foreign currency at the settlement date at a negotiated rate. Each Portfolio, except for DWS Money Market VIP, may enter into forward currency contracts in order to hedge its exposure to changes in foreign currency exchange rates on its foreign currency denominated portfolio holdings and to facilitate transactions in foreign currency denominated securities. DWS Balanced VIP and DWS Strategic Income VIP may enter into forward currency contracts as part of each Portfolio's global tactical asset allocation strategy.
Forward currency contracts are valued at the prevailing forward exchange rate of the underlying currencies and unrealized gain (loss) is recorded daily. Sales and purchases of forward currency contracts having the same settlement date and broker are offset and any gain (loss) is realized on the date of offset; otherwise, gain (loss) is realized on settlement date. Realized and unrealized gains and losses which represent the difference between the value of a forward currency contract to buy and a forward currency contract to sell are included in net realized and unrealized gain (loss) from foreign currency.
Certain risks may arise upon entering into forward currency contracts from the potential inability of counterparties to meet the terms of their contracts. Additionally, when utilizing forward currency contracts to hedge, the Portfolio gives up the opportunity to profit from favorable exchange rate movements during the term of the contract.
Loan Participations and Assignments. DWS Balanced VIP, DWS High Income VIP and DWS Strategic Income VIP may invest in Loan Participations and Assignments. Loan Participations and Assignments are portions of loans originated by banks and sold in pieces to investors. These US dollar-denominated fixed and floating rate loans ("Loans") in which the Portfolio invests, are arranged between the borrower and one or more financial institutions ("Lenders"). These Loans may take the form of Senior Loans, which are corporate obligations often issued in connection with recapitalizations, acquisitions, leveraged buy-outs and refinancings, and Sovereign Loans, which are debt instruments between a foreign sovereign entity and one or more financial institutions. The Portfolio invests in such Loans in the form of participations in Loans ("Participations") or assignments of all or a portion of Loans from third parties ("Assignments"). Participations typically result in the Portfolio having a contractual relationship only with the Lender, not with the borrower. The Portfolio has the right to receive payments of principal, interest and any fees to which it is entitled from the Lender selling the Participation and only upon receipt by the Lender of the payments from the borrower. In connection with purchasing Participations, the Portfolio generally has no right to enforce compliance by the borrower with the terms of the loan agreement relating to the Loan, or any rights of set-off against the borrower, and the Portfolio will not benefit directly from any collateral supporting the Loan in which it has purchased the Participation. As a result, the Portfolio assumes the credit risk of both the borrower and the Lender that is selling the Participation. Assignments typically result in the Portfolio having a direct contractual relationship with the borrower, and the Portfolio may enforce compliance by the borrower with the terms of the loan agreement. All Loan Participations and Assignments involve interest rate risk, liquidity risk and credit risk, including the potential default or insolvency of the borrower.
Mortgage Dollar Rolls. DWS Core Fixed Income VIP, DWS Government & Agency Securities VIP and DWS Balanced VIP may enter into mortgage dollar rolls in which the Portfolio sells to a bank or broker/dealer (the "counterparty") mortgage-backed securities for delivery in the current month and simultaneously contracts to repurchase similar, but not identical, securities on a fixed date. The counterparty receives all principal and interest payments, including prepayments, made on the security while it is the holder. The Portfolio receives compensation as consideration for entering into the commitment to repurchase. The compensation is paid in the form of a lower price for the security upon its repurchase, or alternatively, a fee. Mortgage dollar rolls may be renewed with a new sale and repurchase price and a cash settlement made at each renewal without physical delivery of the securities subject to the contract.
Certain risks may arise upon entering into mortgage dollar rolls from the potential inability of counterparties to meet the terms of their commitments. Additionally, the value of such securities may change adversely before the Portfolio is able to repurchase them. There can be no assurance that the Portfolio's use of the cash that it receives from a mortgage dollar roll will provide a return that exceeds its costs.
When-Issued/Delayed Delivery Securities. DWS Balanced VIP, DWS Core Fixed Income VIP, DWS Government & Agency Securities VIP, DWS High Income VIP and DWS Strategic Income VIP may purchase securities with delivery or payment to occur at a later date beyond the normal settlement period. At the time the Portfolios enter into a commitment to purchase a security, the transaction is recorded and the value of the security is reflected in the net asset value. The price of such security and the date when the security will be delivered and paid for are fixed at the time the transaction is negotiated. The value of the security may vary with market fluctuations. No interest accrues to the Portfolios until payment takes place. At the time the Portfolios enter into this type of transaction it is required to segregate cash or other liquid assets at least equal to the amount of the commitment.
Certain risks may arise upon entering into when-issued or delayed delivery securities from the potential inability of counterparties to meet the terms of their contracts or if the issuer does not issue the securities due to political, economic, or other factors. Additionally, losses may arise due to changes in the value of the underlying securities.
Taxes. Each Portfolio's policy is to comply with the requirements of the Internal Revenue Code, as amended, which are applicable to regulated investment companies and to distribute all of its taxable income to its shareholders.
Additionally, based on the Portfolios' understanding of the tax rules and rates related to income, gains and transactions for the foreign jurisdictions in which they invest, the Portfolios will provide for foreign taxes, and where appropriate, deferred foreign taxes.
At December 31, 2008, the following Portfolios had an approximate net tax basis capital loss carryforward which may be applied against any realized net taxable capital gains of each succeeding year until fully utilized or until the following expiration dates, whichever occurs first:
Portfolio | Capital Loss Carryforward ($) | Expiration
Date | Capital Loss Carryforward Utilized ($) | Capital Loss Carryforward Expired ($) |
DWS Balanced VIP
| 1,789,000 | 12/31/2010 | — | — |
| 1,366,000 | 12/31/2011 | — | — |
| 21,426,000 | 12/31/2016 | — | — |
DWS Blue Chip VIP
| 26,695,000 | 12/31/2016 | — | — |
DWS Core Fixed Income VIP
| 3,813,000 | 12/31/2014 | — | — |
| 50,000 | 12/31/2015 | — | — |
| 6,143,000 | 12/31/2016 | — | — |
DWS Dreman High Return Equity VIP
| 68,443,000 | 12/31/2016 | — | — |
DWS Dreman Small Mid Cap Value VIP
| 40,231,000 | 12/31/2016 | — | — |
DWS Global Thematic VIP
| 42,028,000 | 12/31/2016 | — | — |
DWS Government & Agency Securities VIP
| 930,000 | 12/31/2014 | 421,000 | — |
| 924,000 | 12/31/2015 | — | — |
DWS High Income VIP
| 22,935,000 | 12/31/2009 | — | 16,113,000 |
| 55,108,000 | 12/31/2010 | — | — |
| 13,877,000 | 12/31/2011 | — | — |
| 3,844,000 | 12/31/2014 | — | — |
| 858,000 | 12/31/2015 | — | — |
| 17,301,000 | 12/31/2016 | — | — |
DWS International Select Equity VIP
| 32,933,000 | 12/31/2016 | — | — |
DWS Janus Growth & Income VIP
| 8,636,000 | 12/31/2016 | — | — |
DWS Large Cap Value VIP
| 17,185,000 | 12/31/2016 | — | — |
DWS Mid Cap Growth VIP
| 20,154,000 | 12/31/2011 | — | — |
| 936,000 | 12/31/2016 | — | — |
DWS Small Cap Growth VIP
| 11,291,000 | 12/31/2009 | — | — |
| 71,888,000 | 12/31/2010 | — | — |
| 4,155,000 | 12/31/2011 | — | — |
| 8,113,000 | 12/31/2016 | — | — |
DWS Strategic Income VIP
| 1,611,000 | 12/31/2016 | — | — |
DWS Technology VIP
| 73,057,000 | 12/31/2009 | — | — |
| 93,499,000 | 12/31/2010 | — | — |
| 71,516,000 | 12/31/2011 | — | — |
| 13,148,000 | 12/31/2016 | — | — |
DWS Turner Mid Cap Growth VIP
| 6,753,000 | 12/31/2016 | — | — |
In addition, from November 1, 2008 through December 31, 2008, the following Portfolios incurred net realized capital losses. As permitted by tax regulations, the Portfolios intend to elect to defer these losses and treat them as arising in the fiscal year ended December 31, 2009.
Portfolio | |
DWS Balanced VIP
| $ 20,377,000 |
DWS Blue Chip VIP
| 12,172,000 |
DWS Conservative Allocation VIP
| 244,000 |
DWS Core Fixed Income VIP
| 14,342,000 |
DWS Davis Venture Value VIP
| 1,077,000 |
DWS Dreman High Return Equity VIP
| 78,628,000 |
DWS Dreman Small Mid Cap Value VIP
| 22,331,000 |
DWS Global Thematic VIP
| 12,260,000 |
DWS Government & Agency Securities VIP
| 4,625,000 |
DWS Growth Allocation VIP
| 575,000 |
DWS High Income VIP
| 6,542,000 |
DWS International Select Equity VIP
| 15,109,000 |
DWS Janus Growth & Income VIP
| 7,200,000 |
DWS Large Cap Value VIP
| 8,279,000 |
DWS Mid Cap Growth VIP
| 3,503,000 |
DWS Moderate Allocation VIP
| 265,000 |
DWS Small Cap Growth VIP
| 14,538,000 |
DWS Strategic Income VIP
| 1,428,000 |
DWS Technology VIP
| 6,328,000 |
DWS Turner Mid Cap Growth VIP
| 9,753,000 |
The Portfolios have reviewed the tax positions for the open tax years as of December 31, 2008 and have determined that no provision for income tax is required in the Portfolios' financial statements. The Portfolios' federal tax returns for the prior three fiscal years remain subject to examination by the Internal Revenue Service.
Distribution of Income and Gains. Distributions of net investment income, if any, for each Portfolio, except DWS Money Market VIP, are made annually. Net realized gains from investment transactions, in excess of available capital loss carryforwards, would be taxable to each Portfolio if not distributed and, therefore, will be distributed to shareholders at least annually. Net investment income of DWS Money Market VIP is declared as a daily dividend and is distributed to shareholders monthly. DWS Money Market VIP may take into account capital gains and losses in its daily dividend declarations. DWS Money Market VIP may also make additional distributions for tax purposes if necessary.
The timing and characterization of certain income and capital gains distributions are determined annually in accordance with federal tax regulations which may differ from accounting principles generally accepted in the United States of America. These differences primarily relate to net operating losses, investments in foreign denominated investments, investments in forward foreign currency exchange contracts, investments in futures, income received from Passive Foreign Investment Companies and Real Estate Investment Trusts and certain securities sold at a loss. As a result, net investment income (loss) and net realized gain (loss) on investment transactions for a reporting period may differ significantly from distributions during such period. Accordingly, each Portfolio may periodically make reclassifications among certain of its capital accounts without impacting the net asset value of the Portfolio.
At December 31, 2008, the Portfolios' components of distributable earnings on a tax basis were as follows:
Portfolio | Undistributed Ordinary Income ($)* | Undistributed Net Long-Term Capital Gains ($) | Capital Loss Carryforwards ($) | Unrealized Appreciation (Depreciation) on Investments ($) |
DWS Balanced VIP
| 11,623,050 | — | (24,581,000) | (51,362,547) |
DWS Blue Chip VIP
| 1,995,128 | — | (26,695,000) | (34,966,453) |
DWS Conservative Allocation VIP
| 1,035,788 | 181,442 | — | (4,269,609) |
DWS Core Fixed Income VIP
| 11,325,686 | — | (10,006,000) | (34,741,950) |
DWS Davis Venture Value VIP
| 2,441,329 | 11,752,162 | — | (6,713,748) |
DWS Dreman High Return Equity VIP
| 12,689,174 | — | (68,443,000) | (37,565,747) |
DWS Dreman Small Mid Cap Value VIP
| 4,331,470 | — | (40,231,000) | (85,237,785) |
DWS Global Thematic VIP
| 929,329 | — | (42,028,000) | (22,227,008) |
DWS Government & Agency Securities VIP
| 9,857,609 | — | (1,854,000) | 4,584,630 |
DWS Growth Allocation VIP
| 1,565,273 | 1,657,565 | — | (11,898,247) |
DWS High Income VIP
| 18,558,806 | — | (113,923,000) | (64,273,900) |
DWS International Select Equity VIP
| 5,138,636 | — | (32,933,000) | (23,858,882) |
DWS Janus Growth & Income VIP
| 1,300,772 | — | (8,636,000) | (16,250,821) |
DWS Large Cap Value VIP
| 2,810,754 | — | (17,185,000) | (22,320,016) |
DWS Mid Cap Growth VIP
| — | — | (21,090,000) | (5,617,128) |
DWS Moderate Allocation VIP
| 2,008,897 | 745,862 | — | (11,390,828) |
DWS Small Cap Growth VIP
| — | — | (95,447,000) | (25,059,121) |
DWS Strategic Income VIP
| 3,657,462 | — | (1,611,000) | (8,970,305) |
DWS Technology VIP
| — | — | (251,220,000) | (23,491,040) |
DWS Turner Mid Cap Growth VIP
| — | — | (6,753,000) | (9,666,098) |
In addition, the tax character of distributions paid by the Portfolios is summarized as follows:
| Distributions from ordinary income ($)* | Distributions from long-term capital gains ($) | Tax return of capital ($) |
| Years Ended December 31, | Years Ended December 31, | Years Ended December 31, |
Portfolio | 2008 | 2007 | 2008 | 2007 | 2008 | 2007 |
DWS Balanced VIP
| 17,874,817 | 19,822,898 | — | — | — | — |
DWS Blue Chip VIP
| 22,693,300 | 29,126,324 | 18,303,778 | 14,583,277 | — | — |
DWS Conservative Allocation VIP
| 1,973,217 | 1,232,404 | 3,209,268 | 1,555,295 | — | — |
DWS Core Fixed Income VIP
| 16,737,934 | 15,592,450 | — | — | — | — |
DWS Davis Venture Value VIP
| 7,868,190 | 2,795,861 | 31,468,257 | 5,303,652 | — | — |
DWS Dreman High Return Equity VIP
| 45,076,905 | 15,617,453 | 96,459,670 | 9,463,569 | — | — |
DWS Dreman Small Mid Cap Value VIP
| 41,897,747 | 29,285,554 | 134,320,787 | 68,746,041 | — | — |
DWS Global Thematic VIP
| 21,140,061 | 14,911,083 | 19,678,184 | 12,511,360 | — | — |
DWS Government & Agency Securities VIP
| 10,257,168 | 11,682,544 | — | — | — | — |
DWS Growth Allocation VIP
| 1,425,082 | 5,836,849 | 5,812,496 | 8,822,145 | — | — |
DWS High Income VIP
| 24,630,815 | 28,464,473 | — | — | — | — |
DWS International Select Equity VIP
| 31,101,295 | 11,746,411 | 29,324,473 | 24,138,562 | — | — |
DWS Janus Growth & Income VIP
| 1,526,587 | 1,145,877 | 11,064,755 | — | — | — |
DWS Large Cap Value VIP
| 16,375,766 | 7,889,590 | 40,280,218 | 8,775,628 | — | — |
DWS Moderate Allocation VIP
| 1,368,162 | 3,978,433 | 3,933,731 | 6,522,877 | — | — |
DWS Money Market VIP
| 10,231,661 | 17,550,147 | — | — | — | — |
DWS Strategic Income VIP
| 7,058,174 | 6,882,054 | 908,461 | — | — | — |
DWS Turner Mid Cap Growth VIP
| 5,018,188 | — | 18,129,623 | 12,012,158 | 10,923 | — |
* For tax purposes, short-term capital gain distributions are considered ordinary income distributions.Expenses. Expenses arising in connection with a specific Portfolio are allocated to that Portfolio. Trust expenses are allocated between each Portfolio in proportion to its relative net assets.
Contingencies. In the normal course of business, each Portfolio may enter into contracts with service providers that contain general indemnification clauses. The Portfolios' maximum exposure under these arrangements is unknown as this would involve future claims that may be made against the Portfolios that have not yet been made. However, based on experience, the Portfolios expect the risk of loss to be remote.
Real Estate Investment Trusts. DWS Balanced VIP and DWS Dreman Small Mid Cap Value VIP periodically recharacterize distributions received from a Real Estate Investment Trust ("REIT") investment based on information provided by the REIT into the following categories: ordinary income, long-term and short-term capital gains, and return of capital. If information is not available timely from a REIT, the recharacterization will be estimated and a recharacterization will be made in the following year when such information becomes available. Distributions received from REITs in excess of income are recorded as either a reduction of cost of investments or realized gains. The Portfolios distinguish between dividends on a tax basis and a financial reporting basis and only distributions in excess of tax basis earnings and profits are reported in the financial statements as a tax return of capital.
Other. Investment transactions are accounted for on a trade date plus one basis for daily net asset value calculations. However, for financial reporting purposes, investment transactions are reported on trade date. Interest income is recorded on the accrual basis. Dividend income is recorded on the ex-dividend date net of foreign withholding taxes. Certain dividends from foreign securities may be recorded subsequent to the ex-dividend date as soon as the Portfolio is informed of such dividends. Realized gains and losses from investment transactions are recorded on an identified cost basis. All discounts and premiums are accreted/amortized for both tax and financial reporting purposes for each Portfolio, with the exception of securities in default of principal. Distributions of income and capital gains from the Underlying Portfolios and non-affiliated investment management companies are recorded on the ex-dividend date.
B. Purchases and Sales of Securities
During the year ended December 31, 2008, purchases and sales of investment transactions (excluding short-term investments) were as follows:
Portfolio | Purchases ($) | Sales ($) |
DWS Balanced VIP
excluding US Treasury Obligations | 813,891,432 | 883,115,897 |
US Treasury Obligations | 250,216,900 | 254,136,016 |
DWS Blue Chip VIP
| 224,979,664 | 283,841,847 |
DWS Conservative Allocation VIP
| 11,133,264 | 8,709,336 |
DWS Core Fixed Income VIP
excluding US Treasury Obligations | 110,882,243 | 138,529,428 |
US Treasury Obligations | 341,692,001 | 368,373,444 |
DWS Davis Venture Value VIP
| 40,237,723 | 127,433,637 |
DWS Dreman High Return Equity VIP
| 165,789,364 | 344,342,570 |
DWS Dreman Small Mid Cap Value VIP
| 185,488,147 | 262,937,061 |
DWS Global Thematic VIP
| 271,826,694 | 292,124,323 |
DWS Government & Agency Securities VIP
excluding US Treasury Obligations | 1,274,131,660 | 1,282,924,652 |
US Treasury Obligations | 60,202,794 | 54,014,477 |
DWS Growth Allocation VIP
| 14,243,444 | 11,969,882 |
DWS High Income VIP
| 75,675,370 | 116,290,066 |
DWS International Select Equity VIP
| 231,765,481 | 270,812,787 |
DWS Janus Growth & Income VIP
excluding US Treasury Obligations | 67,764,101 | 107,157,122 |
US Treasury Obligations | 6,019,069 | — |
DWS Large Cap Value VIP
| 173,390,197 | 193,408,495 |
DWS Mid Cap Growth VIP
| 29,333,339 | 41,619,618 |
DWS Moderate Allocation VIP
| 22,445,725 | 17,792,893 |
DWS Small Cap Growth VIP
| 82,223,324 | 113,783,168 |
DWS Strategic Income VIP
excluding US Treasury Obligations | 119,878,953 | 118,622,071 |
US Treasury Obligations | 88,088,711 | 100,086,294 |
DWS Technology VIP
| 75,845,500 | 108,429,050 |
DWS Turner Mid Cap Growth VIP
| 153,306,708 | 178,375,782 |
For the year ended December 31, 2008, transactions for written options on interest rate swaps were as follows for DWS Strategic Income VIP:
| Contract Amount | Premiums |
Outstanding, beginning of period
| — | $ — |
Options written
| 12,000,000 | 70,950 |
Outstanding, end of period
| 12,000,000 | $ 70,950 |
For the year ended December 31, 2008, transactions for written options on securities were as follows for DWS Technology VIP:
| Number of Contracts | Premiums |
Outstanding, beginning of period
| — | $ — |
Options written
| 2,161 | 225,556 |
Options closed
| (557) | (66,840) |
Options expired
| (1,604) | (158,716) |
Outstanding, end of period
| — | $ — |
C. Related Parties
Management Agreement. Under the Amended and Restated Investment Management Agreement with Deutsche Investment Management Americas Inc. ("DIMA" or the "Advisor"), an indirect, wholly owned subsidiary of Deutsche Bank AG, the Advisor directs the investments of each Portfolio in accordance with its investment objectives, policies and restrictions. The Advisor determines the securities, instruments and other contracts relating to investments to be purchased, sold or entered into by each Portfolio or delegates such responsibility to each Portfolio's subadvisor.
Prior to May 1, 2008, in addition to portfolio management services, the Advisor provided certain administrative services in accordance with the Investment Management Agreement. For the period from January 1, 2008 through April 30, 2008, the fees pursuant to the Investment Management Agreement were equivalent to the annual rates shown below of each Portfolio's average daily net assets, computed and accrued daily and payable monthly:
Portfolio | Annual Management Fee Rate |
DWS Balanced VIP
$0-$250 million | .470% |
next $750 million | .445% |
over $1 billion | .410% |
DWS Blue Chip VIP
$0-$250 million | .650% |
next $750 million | .620% |
next $1.5 billion | .600% |
next $2.5 billion | .580% |
next $2.5 billion | .550% |
next $2.5 billion | .530% |
next $2.5 billion | .510% |
over $12.5 billion | .490% |
DWS Conservative Allocation VIP
$0-$500 million | .150% |
next $500 million | .140% |
next $500 million | .130% |
next $1 billion | .120% |
over $2.5 billion | .110% |
DWS Core Fixed Income VIP
$0-$250 million | .600% |
next $750 million | .570% |
next $1.5 billion | .550% |
next $2.5 billion | .530% |
next $2.5 billion | .500% |
next $2.5 billion | .480% |
next $2.5 billion | .460% |
over $12.5 billion | .440% |
DWS Davis Venture Value VIP
$0-$250 million | .950% |
next $250 million | .925% |
next $500 million | .900% |
next $1.5 billion | .875% |
over $2.5 billion | .850% |
DWS Dreman High Return Equity VIP
$0-$250 million | .750% |
next $750 million | .720% |
next $1.5 billion | .700% |
next $2.5 billion | .680% |
next $2.5 billion | .650% |
next $2.5 billion | .640% |
next $2.5 billion | .630% |
over $12.5 billion | .620% |
DWS Dreman Small Mid Cap Value VIP
$0-$250 million | .750% |
next $750 million | .720% |
next $1.5 billion | .700% |
next $2.5 billion | .680% |
next $2.5 billion | .650% |
next $2.5 billion | .640% |
next $2.5 billion | .630% |
over $12.5 billion | .620% |
DWS Global Thematic VIP
$0-$250 million | 1.000% |
next $500 million | .950% |
next $750 million | .900% |
next $1.5 billion | .850% |
over $3 billion | .800% |
DWS Government & Agency Securities VIP
$0-$250 million | .550% |
next $750 million | .530% |
next $1.5 billion | .510% |
next $2.5 billion | .500% |
next $2.5 billion | .480% |
next $2.5 billion | .460% |
next $2.5 billion | .440% |
over $12.5 billion | .420% |
DWS Growth Allocation VIP
$0-$500 million | .150% |
next $500 million | .140% |
next $500 million | .130% |
next $1 billion | .120% |
over $2.5 billion | .110% |
DWS High Income VIP
$0-$250 million | .600% |
next $750 million | .570% |
next $1.5 billion | .550% |
next $2.5 billion | .530% |
next $2.5 billion | .500% |
next $2.5 billion | .480% |
next $2.5 billion | .460% |
over $12.5 billion | .440% |
DWS International Select Equity VIP
$0-$1.5 billion | .750% |
next $1.75 billion | .735% |
next $1.75 billion | .720% |
over $5 billion | .705% |
DWS Janus Growth & Income VIP
$0-$250 million | .750% |
next $750 million | .725% |
next $1.5 billion | .700% |
over $2.5 billion | .675% |
DWS Mid Cap Growth VIP
$0-$250 million | .750% |
next $750 million | .720% |
next $1.5 billion | .700% |
next $2.5 billion | .680% |
next $2.5 billion | .650% |
next $2.5 billion | .640% |
next $2.5 billion | .630% |
over $12.5 billion | .620% |
DWS Moderate Allocation VIP
$0-$500 million | .150% |
next $500 million | .140% |
next $500 million | .130% |
next $1 billion | .120% |
over $2.5 billion | .110% |
DWS Money Market VIP
$0-$500 million | .385% |
next $500 million | .370% |
next $1.0 billion | .355% |
over $2.0 billion | .340% |
DWS Small Cap Growth VIP
$0-$250 million | .650% |
next $750 million | .625% |
over $1 billion | .600% |
DWS Strategic Income VIP
$0-$250 million | .650% |
next $750 million | .620% |
next $1.5 billion | .600% |
next $2.5 billion | .580% |
next $2.5 billion | .550% |
next $2.5 billion | .530% |
next $2.5 billion | .510% |
over $12.5 billion | .490% |
DWS Technology VIP
$0-$250 million | .750% |
next $750 million | .720% |
next $1.5 billion | .700% |
next $2.5 billion | .680% |
next $2.5 billion | .650% |
next $2.5 billion | .640% |
next $2.5 billion | .630% |
over $12.5 billion | .620% |
DWS Turner Mid Cap Growth VIP
$0-$250 million | .800% |
next $250 million | .785% |
next $500 million | .770% |
over $1 billion | .755% |
Effective May 1, 2008, under the Amended and Restated Investment Management Agreement with the Advisor, the fees are equivalent to the annual rates shown below of each Portfolio's average daily net assets, computed and accrued daily and payable monthly:
Portfolio | Annual Management Fee Rate |
DWS Balanced VIP
$0-$250 million | .370% |
next $750 million | .345% |
over $1 billion | .310% |
DWS Blue Chip VIP
$0-$250 million | .550% |
next $750 million | .520% |
next $1.5 billion | .500% |
next $2.5 billion | .480% |
next $2.5 billion | .450% |
next $2.5 billion | .430% |
next $2.5 billion | .410% |
over $12.5 billion | .390% |
DWS Conservative Allocation VIP
$0-$500 million | .065% |
next $500 million | .055% |
next $500 million | .045% |
next $1 billion | .035% |
over $2.5 billion | .025% |
DWS Core Fixed Income VIP
$0-$250 million | .500% |
next $750 million | .470% |
next $1.5 billion | .450% |
next $2.5 billion | .430% |
next $2.5 billion | .400% |
next $2.5 billion | .380% |
next $2.5 billion | .360% |
over $12.5 billion | .340% |
DWS Davis Venture Value VIP
$0-$250 million | .865% |
next $250 million | .840% |
next $500 million | .815% |
next $1.5 billion | .790% |
over $2.5 billion | .765% |
DWS Dreman High Return Equity VIP
$0-$250 million | .665% |
next $750 million | .635% |
next $1.5 billion | .615% |
next $2.5 billion | .595% |
next $2.5 billion | .565% |
next $2.5 billion | .555% |
next $2.5 billion | .545% |
over $12.5 billion | .535% |
DWS Dreman Small Mid Cap Value VIP
$0-$250 million | .650% |
next $750 million | .620% |
next $1.5 billion | .600% |
next $2.5 billion | .580% |
next $2.5 billion | .550% |
next $2.5 billion | .540% |
next $2.5 billion | .530% |
over $12.5 billion | .520% |
DWS Global Thematic VIP
$0-$250 million | .915% |
next $500 million | .865% |
next $750 million | .815% |
next $1.5 billion | .765% |
over $3 billion | .715% |
DWS Government & Agency Securities VIP
$0-$250 million | .450% |
next $750 million | .430% |
next $1.5 billion | .410% |
next $2.5 billion | .400% |
next $2.5 billion | .380% |
next $2.5 billion | .360% |
next $2.5 billion | .340% |
over $12.5 billion | .320% |
DWS Growth Allocation VIP
$0-$500 million | .065% |
next $500 million | .055% |
next $500 million | .045% |
next $1 billion | .035% |
over $2.5 billion | .025% |
DWS High Income VIP
$0-$250 million | .500% |
next $750 million | .470% |
next $1.5 billion | .450% |
next $2.5 billion | .430% |
next $2.5 billion | .400% |
next $2.5 billion | .380% |
next $2.5 billion | .360% |
over $12.5 billion | .340% |
DWS International Select Equity VIP
$0-$1.5 billion | .650% |
next $1.75 billion | .635% |
next $1.75 billion | .620% |
over $5 billion | .605% |
DWS Janus Growth & Income VIP
$0-$250 million | .665% |
next $750 million | .640% |
next $1.5 billion | .615% |
over $2.5 billion | .590% |
DWS Mid Cap Growth VIP
$0-$250 million | .665% |
next $750 million | .635% |
next $1.5 billion | .615% |
next $2.5 billion | .595% |
next $2.5 billion | .565% |
next $2.5 billion | .555% |
next $2.5 billion | .545% |
over $12.5 billion | .535% |
DWS Moderate Allocation VIP
$0-$500 million | .065% |
next $500 million | .055% |
next $500 million | .045% |
next $1 billion | .035% |
over $2.5 billion | .025% |
DWS Money Market VIP
$0-$500 million | .285% |
next $500 million | .270% |
next $1.0 billion | .255% |
over $2.0 billion | .240% |
DWS Small Cap Growth VIP
$0-$250 million | .550% |
next $750 million | .525% |
over $1 billion | .500% |
DWS Strategic Income VIP
$0-$250 million | .550% |
next $750 million | .520% |
next $1.5 billion | .500% |
next $2.5 billion | .480% |
next $2.5 billion | .450% |
next $2.5 billion | .430% |
next $2.5 billion | .410% |
over $12.5 billion | .390% |
DWS Technology VIP
$0-$250 million | .665% |
next $750 million | .635% |
next $1.5 billion | .615% |
next $2.5 billion | .595% |
next $2.5 billion | .565% |
next $2.5 billion | .555% |
next $2.5 billion | .545% |
over $12.5 billion | .535% |
DWS Turner Mid Cap Growth VIP
$0-$250 million | .715% |
next $250 million | .700% |
next $500 million | .685% |
over $1 billion | .670% |
The fee pursuant to the Investment Management Agreement is equivalent to the annual rates shown below of DWS Large Cap Value VIP's average daily net assets, accrued daily and payable monthly:
| Annual Management Fee Rate |
$0-$250 million | .650% |
next $750 million | .625% |
next $1.5 billion | .600% |
next $2.5 billion | .575% |
next $2.5 billion | .550% |
next $2.5 billion | .525% |
next $2.5 billion | .500% |
over $12.5 billion | .475% |
Aberdeen Asset Management Inc. ("AAMI") serves as subadvisor to DWS Core Fixed Income VIP and is paid by the Advisor for its services.
Dreman Value Management, L.L.C. serves as subadvisor to DWS Dreman High Return Equity VIP and DWS Dreman Small Mid Cap Value VIP and is paid by the Advisor for its services.
Janus Capital Management, LLC serves as subadvisor to DWS Janus Growth & Income VIP and is paid by the Advisor for its services.
Turner Investment Partners, Inc. serves as subadvisor to DWS Turner Mid Cap Growth VIP and is paid by the Advisor for its services.
Davis Selected Advisers, L.P., serves as subadvisor to DWS Davis Venture Value VIP and is paid by the Advisor for its services.
Deutsche Asset Management International GmbH ("DeAMi") serves as subadvisor to DWS Large Cap Value VIP and is paid by the Advisor for its services.
For the year ended December 31, 2008, the Advisor has agreed to waive 0.05% of the monthly management fee based on average daily net assets of Class B of DWS Conservative Allocation VIP, DWS Growth Allocation VIP and DWS Moderate Allocation VIP.
For the period from January 1, 2008 through April 30, 2008, the Advisor had contractually agreed to waive all or a portion of its fee and reimburse or pay certain operating expenses to the extent necessary to maintain the operating expenses of each class for the period (excluding certain expenses such as extraordinary expenses, taxes, brokerage and interest) as follows:
Portfolio | Annual Rate |
DWS Balanced VIP
Class A | .51% |
Class B | .89% |
DWS Davis Venture Value VIP
Class A | .86% |
Class B | 1.26% |
DWS Government & Agency Securities VIP
Class A | .63% |
DWS Small Cap Growth VIP
Class A | .72% |
Class B | 1.09% |
For the period from January 1, 2008 through September 30, 2008, the Advisor had contractually agreed to waive all or a portion of its fee and reimburse or pay certain operating expenses to the extent necessary to maintain the operating expenses of each class for the period (excluding certain expenses such as extraordinary expenses, taxes, brokerage and interest expense) as follows:
Portfolio | Annual Rate |
DWS Conservative Allocation VIP
Class B | .70% |
DWS Core Fixed Income VIP
Class A | .70% |
DWS Government & Agency Securities VIP
| |
Class B | 1.04% |
DWS Growth Allocation VIP
Class B | .70% |
DWS Moderate Allocation VIP
Class B | .70% |
DWS Strategic Income VIP
Class A | .83% |
Class B | 1.23% |
DWS Turner Mid Cap Growth VIP
Class A | .94% |
Class B | 1.34% |
For the period from January 1, 2008 through April 30, 2009, the Advisor has contractually agreed to waive all or a portion of its fee and reimburse or pay certain operating expenses to the extent necessary to maintain the operating expenses of each class for the period (excluding certain expenses such as extraordinary expenses, taxes, brokerage and interest expense) as follows:
Portfolio | Annual Rate |
DWS Global Thematic VIP
Class A | 1.05% |
Class B | 1.45% |
DWS Mid Cap Growth VIP
Class A | .94% |
For the period from January 1, 2008 through September 30, 2009, the Advisor has contractually agreed to waive all or a portion of its fee and reimburse or pay certain operating expenses to the extent necessary to maintain the operating expenses of the class for the period (excluding certain expenses such as extraordinary expenses, taxes, brokerage and interest expense) as follows:
Portfolio | Annual Rate |
DWS Mid Cap Growth VIP
Class B | 1.34% |
For the period from January 1, 2008 through April 30, 2010, the Advisor has contractually agreed to waive all or a portion of its fee and reimburse or pay certain operating expenses to the extent necessary to maintain the operating expenses of each class for the period (excluding certain expenses such as extraordinary expenses, taxes, brokerage and interest expenses) as follows:
Portfolio | Annual Rate |
DWS Dreman High Return Equity VIP
Class A | .78% |
Class B | 1.11% |
DWS Money Market VIP
Class A | .44% |
Class B | .79% |
For the period from April 28, 2008 through July 31, 2008, the Advisor had voluntarily agreed to waive its fee or and reimburse or pay certain operating expenses to the extent necessary to maintain the operating expenses of the class for the period (excluding certain expenses such as extraordinary expenses, taxes, brokerage and interest expense) as follows:
Portfolio | Portfolio Annual Rate |
DWS Janus Growth & Income VIP
Class B | 1.15% |
For the period from May 1, 2008 through September 30, 2008, the Advisor had contractually agreed to waive all or a portion of its fee and reimburse or pay certain operating expenses to the extent necessary to maintain the operating expenses of each class for the period (excluding certain expenses such as extraordinary expenses, taxes, brokerage and interest expense) as follows:
Portfolio | Annual Rate |
DWS Davis Venture Value VIP
Class A | .89% |
Class B | 1.29% |
DWS Government & Agency Securities VIP
| |
Class A | .64% |
For the period from May 1, 2008 through September 30, 2008, the Advisor had voluntarily agreed to waive their fees or and reimburse or pay certain operating expenses to the extent necessary to maintain the operating expenses of the class for the period (excluding certain expenses such as extraordinary expenses, taxes, brokerage and interest expense) as follows:
Portfolio | Annual Rate |
DWS Small Cap Growth VIP
Class B | 1.09% |
For the period from October 1, 2008 through September 30, 2009, the Advisor has contractually agreed to waive all or a portion of its fee and reimburse or pay certain operating expenses to the extent necessary to maintain the operating expenses of each class for the period (excluding certain expenses such as extraordinary expenses, taxes, brokerage and interest expense) as follows:
Portfolio | Annual Rate |
DWS Balanced VIP
| |
Class B | 1.22% |
DWS Blue Chip VIP
| |
Class B | 1.25% |
DWS Conservative Allocation VIP
| |
Class B | .62% |
DWS Davis Venture Value VIP
Class A | .88% |
Class B | 1.28% |
DWS Government & Agency Securities VIP
Class A | .65% |
Class B | 1.05% |
DWS Growth Allocation VIP
| |
Class B | .63% |
DWS High Income VIP
| |
Class B | 1.18% |
DWS International Select Equity VIP
| |
Class B | 1.40% |
DWS Janus Growth & Income VIP
| |
Class A | .86% |
DWS Large Cap Value VIP
| |
Class B | 1.25% |
DWS Moderate Allocation VIP
| |
Class B | .62% |
DWS Small Cap Growth VIP
| |
Class B | 1.41% |
DWS Strategic Income VIP
Class A | .82% |
Class B | 1.22% |
DWS Technology VIP
| |
Class B | 1.48% |
DWS Turner Mid Cap Growth VIP
| |
Class B | 1.34% |
Accordingly, for the year ended December 31, 2008, the total management fees charged, management fees waived and effective management fees are as follows:
Portfolio | Total Aggregated ($) | Waived ($) | Annual Effective Rate |
DWS Balanced VIP
| 1,716,044 | 48,022 | .39% |
DWS Blue Chip VIP
| 1,059,617 | — | .59% |
DWS Conservative Allocation VIP
| 15,317 | 15,317 | .00% |
DWS Core Fixed Income VIP
| 1,158,767 | — | .54% |
DWS Davis Venture Value VIP
| 2,136,001 | 377,471 | .74% |
DWS Dreman High Return Equity VIP
| 3,949,911 | — | .68% |
DWS Dreman Small Mid Cap Value VIP
| 2,646,998 | — | .68% |
DWS Global Thematic VIP
| 1,138,988 | 441,223 | .58% |
DWS Government & Agency Securities VIP
| 1,045,390 | 9,385 | .48% |
DWS Growth Allocation VIP
| 26,040 | 13,477 | .05% |
DWS High Income VIP
| 1,139,273 | — | .54% |
DWS International Select Equity VIP
| 1,244,991 | — | .69% |
DWS Janus Growth & Income VIP
| 897,800 | — | .70% |
DWS Large Cap Value VIP
| 1,214,541 | — | .65% |
DWS Mid Cap Growth VIP
| 252,379 | 51,613 | .56% |
DWS Moderate Allocation VIP
| 30,022 | 15,508 | .05% |
DWS Money Market VIP
| 1,247,502 | 74,810 | .30% |
DWS Small Cap Growth VIP
| 733,616 | 29,376 | .57% |
DWS Strategic Income VIP
| 578,416 | 12,958 | .57% |
DWS Technology VIP
| 762,698 | — | .70% |
DWS Turner Mid Cap Growth VIP
| 737,881 | 16,056 | .73% |
In addition, for the year ended December 31, 2008, the Advisor waived record keeping expenses of Class B shares of each Portfolio as follows:
Portfolio | Waived ($) |
DWS Conservative Allocation VIP
| 16,607 |
DWS Dreman High Return Equity VIP
| 2,522 |
DWS Growth Allocation VIP
| 28,321 |
DWS Large Cap Value VIP
| 94 |
DWS Moderate Allocation VIP
| 32,491 |
DWS Money Market VIP
| 129 |
DWS Small Cap Growth VIP
| 468 |
In addition, for the year ended December 31, 2008, the Advisor waived $3,955 of other expenses for DWS Conservative Allocation VIP.
Administration Fee. Pursuant to an Administrative Services Agreement, DIMA provides most administrative services to DWS Large Cap Value VIP. For all services provided under the Administrative Services Agreement, the Portfolio pays DIMA an annual fee ("Administration Fee") of 0.10% of the Portfolio's average daily net assets, computed and accrued daily and payable monthly. For the year ended December 31, 2008, DIMA received an Administration Fee of $186,852, of which $9,823 is unpaid.
Effective May 1, 2008, the Portfolios noted below entered into an Administrative Services Agreement with DIMA, pursuant to which the Advisor provides most administrative services to the Portfolios. For all services provided under the Administrative Services Agreement, the Portfolios pay DIMA an annual fee ("Administration Fee") of 0.10% of the Portfolios' average daily net assets, computed and accrued daily and payable monthly. For the period from May 1, 2008 through December 31, 2008, the Administration Fee was as follows:
Portfolio | Total Aggregated ($) | Waived ($) | Unpaid at December 31, 2008 ($) |
DWS Balanced VIP
| 267,755 | — | 25,322 |
DWS Blue Chip VIP
| 105,793 | — | 8,763 |
DWS Conservative Allocation VIP
| 10,198 | 10,198 | — |
DWS Core Fixed Income VIP
| 129,626 | — | 12,210 |
DWS Davis Venture Value VIP
| 140,451 | — | 11,062 |
DWS Dreman High Return Equity VIP
| 331,580 | — | 25,687 |
DWS Dreman Small Mid Cap Value VIP
| 244,036 | — | 19,791 |
DWS Global Thematic VIP
| 72,094 | — | 5,163 |
DWS Government & Agency Securities VIP
| 143,349 | — | 18,783 |
DWS Growth Allocation VIP
| 16,931 | — | 1,613 |
DWS High Income VIP
| 131,305 | — | 11,897 |
DWS International Select Equity VIP
| 105,669 | — | 7,530 |
DWS Janus Growth & Income VIP
| 76,972 | — | 5,967 |
DWS Mid Cap Growth VIP
| 21,460 | — | 1,508 |
DWS Moderate Allocation VIP
| 19,414 | — | 1,881 |
DWS Money Market VIP
| 263,770 | — | 35,124 |
DWS Small Cap Growth VIP
| 74,373 | — | 5,571 |
DWS Strategic Income VIP
| 62,261 | — | 6,079 |
DWS Technology VIP
| 66,748 | — | 5,183 |
DWS Turner Mid Cap Growth VIP
| 59,597 | — | 4,070 |
Service Provider Fees. DWS Investments Fund Accounting Corporation ("DIFA"), a subsidiary of the Advisor, is responsible for determining the daily net asset value per share and maintaining the portfolio and general accounting records of each Portfolio. DIFA receives no fee for its services to each Portfolio, other than the Portfolios noted below. In turn, DIFA has delegated certain fund accounting functions to a third-party service provider. Effective May 1, 2008, these fees are now paid under the Administrative Services Agreement. For the period from January 1, 2008 through April 30, 2008, DIFA received a fee for its services as follows:
Portfolio | Total Aggregated ($) |
DWS Conservative Allocation VIP
| 13,737 |
DWS Davis Venture Value VIP
| 37,943 |
DWS Dreman High Return Equity VIP
| 40,370 |
DWS Growth Allocation VIP
| 13,664 |
DWS Global Thematic VIP
| 69,550 |
DWS Janus Growth & Income VIP
| 25,585 |
DWS Mid Cap Growth VIP
| 20,790 |
DWS Moderate Allocation VIP
| 13,852 |
DWS Technology VIP
| 21,129 |
DWS Turner Mid Cap Growth VIP
| 22,504 |
DWS Investments Service Company ("DISC"), an affiliate of the Advisor, is the transfer agent, dividend-paying agent and shareholder service agent for each Portfolio. Pursuant to a sub-transfer agency agreement between DISC and DST Systems, Inc. ("DST"), DISC has delegated certain transfer agent, dividend-paying agent and shareholder service agent functions to DST. DISC compensates DST out of the shareholder servicing fee it receives from each Portfolio. For the year ended December 31, 2008, the amounts charged to each Portfolio by DISC were as follows:
Portfolio | Total Aggregated ($) | Waived ($) | Unpaid at December 31, 2008 ($) |
DWS Balanced VIP Class A
| 221 | 221 | — |
DWS Balanced VIP Class B
| 47 | — | 7 |
DWS Blue Chip VIP Class A
| 361 | — | 73 |
DWS Blue Chip VIP Class B
| 22 | — | 3 |
DWS Conservative Allocation VIP Class B
| 48 | 48 | — |
DWS Core Fixed Income VIP Class A
| 259 | — | 116 |
DWS Core Fixed Income VIP Class B
| 82 | — | 13 |
DWS Davis Venture Value VIP Class A
| 163 | 163 | — |
DWS Davis Venture Value VIP Class B
| 26 | — | 26 |
DWS Dreman High Return Equity VIP Class A
| 604 | — | 129 |
DWS Dreman High Return Equity VIP Class B
| 243 | 243 | — |
DWS Dreman Small Mid Cap Value VIP Class A
| 706 | — | 155 |
DWS Dreman Small Mid Cap Value VIP Class B
| 289 | — | 72 |
DWS Global Thematic VIP Class A
| 488 | 488 | — |
DWS Global Thematic VIP Class B
| 112 | — | 25 |
DWS Government & Agency Securities VIP Class A
| 552 | 552 | — |
DWS Government & Agency Securities VIP Class B
| 71 | — | 17 |
DWS Growth Allocation VIP Class B
| 48 | 48 | — |
DWS High Income VIP Class A
| 399 | — | 91 |
DWS High Income VIP Class B
| 33 | — | 7 |
DWS International Select Equity VIP Class A
| 152 | — | 45 |
DWS International Select Equity VIP Class B
| 23 | — | 6 |
DWS Janus Growth & Income VIP Class A
| 163 | — | 42 |
DWS Janus Growth & Income VIP Class B
| 40 | 10 | 6 |
DWS Large Cap Value VIP Class A
| 312 | — | — |
DWS Large Cap Value VIP Class B
| 60 | 60 | — |
DWS Mid Cap Growth VIP Class A
| 208 | 208 | — |
DWS Mid Cap Growth VIP Class B
| 26 | — | 7 |
DWS Moderate Allocation VIP Class B
| 48 | 48 | — |
DWS Money Market VIP Class A
| 711 | 711 | — |
DWS Money Market VIP Class B
| 52 | 52 | — |
DWS Small Cap Growth VIP Class A
| 387 | 151 | 236 |
DWS Small Cap Growth VIP Class B
| — | — | — |
DWS Strategic Income VIP Class A
| 147 | — | 147 |
DWS Strategic Income VIP Class B
| 38 | 6 | 6 |
DWS Technology VIP Class A
| 233 | — | 59 |
DWS Technology VIP Class B
| 142 | — | 37 |
DWS Turner Mid Cap Growth VIP Class A
| 93 | 93 | — |
DWS Turner Mid Cap Growth VIP Class B
| 41 | — | 6 |
Distribution Service Agreement. Under the Portfolios' Class B 12b-1 plans, DWS Investments Distributors, Inc. ("DIDI") receives a fee ("Distribution Service Fee") of 0.25% of average daily net assets of Class B shares. For the year ended December 31, 2008, the Distribution Service Fee was as follows:
Portfolio | Total Aggregated ($) | Waived ($) | Unpaid at December 31, 2008 ($) |
DWS Balanced VIP
| 5,567 | — | — |
DWS Blue Chip VIP
| 8,244 | — | 188 |
DWS Conservative Allocation VIP
| 39,976 | 39,976 | — |
DWS Core Fixed Income VIP
| 126,837 | — | 6,729 |
DWS Davis Venture Value VIP
| 17,012 | — | 454 |
DWS Dreman High Return Equity VIP
| 31,412 | — | 431 |
DWS Dreman Small Mid Cap Value VIP
| 83,016 | — | 4,823 |
DWS Global Thematic VIP
| 17,747 | — | 827 |
DWS Government & Agency Securities VIP
| 18,374 | — | 1,739 |
DWS Growth Allocation VIP
| 67,386 | 33,153 | — |
DWS High Income VIP
| 8,000 | — | 34 |
DWS International Select Equity VIP
| 11,230 | — | 20 |
DWS Janus Growth & Income VIP
| 3,511 | — | — |
DWS Large Cap Value VIP
| 6,151 | — | — |
DWS Mid Cap Growth VIP
| 1,412 | — | 4 |
DWS Moderate Allocation VIP
| 77,539 | 25,955 | — |
DWS Money Market VIP
| 10,318 | 255 | — |
DWS Small Cap Growth VIP
| 4,740 | 1 | 125 |
DWS Strategic Income VIP
| 7,116 | — | — |
DWS Technology VIP
| 6,303 | — | 329 |
DWS Turner Mid Cap Growth VIP
| 3,805 | — | 139 |
Typesetting and Filing Service Fees. Under an agreement with DIMA, DIMA is compensated for providing typesetting and certain regulatory filing services to each Portfolio. For the year ended December 31, 2008, the amount charged to each Portfolio by DIMA included in the Statement of Operations under "reports to shareholders and shareholder meeting" was as follows:
Portfolio | Amount ($) | Unpaid at December 31, 2008 ($) |
DWS Balanced VIP
| 9,085 | 2,627 |
DWS Blue Chip VIP
| 7,848 | 2,198 |
DWS Conservative Allocation VIP
| 6,654 | 1,794 |
DWS Core Fixed Income VIP
| 9,615 | 2,794 |
DWS Davis Venture Value VIP
| 7,271 | 1,707 |
DWS Dreman High Return Equity VIP
| 8,655 | 2,932 |
DWS Dreman Small Mid Cap Value VIP
| 9,568 | 2,764 |
DWS Global Thematic VIP
| 9,231 | 4,038 |
DWS Government & Agency Securities VIP
| 11,181 | 4,835 |
DWS Growth Allocation VIP
| 7,064 | 2,239 |
DWS High Income VIP
| 7,418 | 2,270 |
DWS International Select Equity VIP
| 6,038 | 1,896 |
DWS Janus Growth & Income VIP
| 4,627 | 3,720 |
DWS Large Cap Value VIP
| 13,957 | 2,999 |
DWS Mid Cap Growth VIP
| 7,548 | 2,319 |
DWS Moderate Allocation VIP
| 7,067 | 2,240 |
DWS Money Market VIP
| 10,512 | 3,096 |
DWS Small Cap Growth VIP
| 4,350 | 3,044 |
DWS Strategic Income VIP
| 2,888 | 2,578 |
DWS Technology VIP
| 7,767 | 2,253 |
DWS Turner Mid Cap Growth VIP
| 8,870 | 2,802 |
Trustees' Fees and Expenses. The Portfolios paid each Trustee not affiliated with the Advisor retainer fees plus specified amounts for various committee services and for the Board Chairperson and Vice Chairperson.
In connection with the board consolidation on April 1, 2008, of the two DWS Funds Boards of Trustees, certain Independent Board Members retired prior to their normal retirement date, and received a one-time retirement benefit. DIMA has agreed to reimburse the Portfolios for the cost of this benefit. During the period ended December 31, 2008, each Portfolio paid its allocated portion, as follows, of the retirement benefit to the non-continuing Independent Board Members, and each Portfolio was reimbursed by DIMA for this payment.
Portfolio | Amount ($) |
DWS Balanced VIP
| 24,750 |
DWS Blue Chip VIP
| 11,186 |
DWS Conservative Allocation VIP
| 862 |
DWS Core Fixed Income VIP
| 12,990 |
DWS Davis Venture Value VIP
| 14,728 |
DWS Dreman High Return Equity VIP
| 37,816 |
DWS Dreman Small Mid Cap Value VIP
| 22,361 |
DWS Global Thematic VIP
| 7,091 |
DWS Government & Agency Securities VIP
| 10,950 |
DWS Growth Allocation VIP
| 1,514 |
DWS High Income VIP
| 11,933 |
DWS International Select Equity VIP
| 11,048 |
DWS Janus Growth & Income VIP
| 7,668 |
DWS Large Cap Value VIP
| 10,691 |
DWS Mid Cap Growth VIP
| 2,216 |
DWS Moderate Allocation VIP
| 1,769 |
DWS Money Market VIP
| 19,388 |
DWS Small Cap Growth VIP
| 7,592 |
DWS Strategic Income VIP
| 5,355 |
DWS Technology VIP
| 6,311 |
DWS Turner Mid Cap Growth VIP
| 5,807 |
Cash Management QP Trust. Pursuant to an Exemptive Order issued by the SEC, each Portfolio may invest in the Cash Management QP Trust (the "QP Trust") and other affiliated funds managed by the Advisor. The QP Trust seeks to provide as high a level of current income as is consistent with the preservation of capital and the maintenance of liquidity. The QP Trust does not pay the Advisor a management fee for the affiliated funds' investments in the QP Trust.
D. Investing in High Yield Securities
Investing in high yield securities may involve greater risks and considerations not typically associated with investing in US Government bonds and other high quality fixed-income securities. These securities are non-investment grade securities, often referred to as "junk bonds." Economic downturns may disrupt the high yield market and impair the ability of issuers to repay principal and pay interest. Also, an increase in interest rates would likely have an adverse impact on the value of such obligations. Moreover, high yield securities may be less liquid due to the extent that there is no established retail secondary market and because of a decline in the value of such securities.
E. Investing in Emerging Markets
Investing in emerging markets may involve special risks and considerations not typically associated with investing in the United States of America. These risks include revaluation of currencies, high rates of inflation, repatriation restrictions on income and capital, and future adverse political, social and economic developments. Moreover, securities issued in these markets may be less liquid, subject to government ownership controls or delayed settlements and may have prices more volatile than those of comparable securities of issuers in the United States of America.
F. Fee Reductions
The Portfolios have entered into an arrangement with their custodian whereby credits realized as a result of uninvested cash balances were used to reduce a portion of the Portfolios' expenses. During the year ended December 31, 2008, the Portfolios' custodian fee was reduced under the arrangement as follows:
Portfolio | Amount ($) |
DWS Balanced VIP
| 4,543 |
DWS Blue Chip VIP
| 52 |
DWS Core Fixed Income VIP
| 890 |
DWS Davis Venture Value VIP
| 337 |
DWS Dreman High Return Equity VIP
| 794 |
DWS Dreman Small Mid Cap Value VIP
| 706 |
DWS Government & Agency Securities VIP
| 182 |
DWS High Income VIP
| 2,091 |
DWS Janus Growth & Income VIP
| 295 |
DWS Large Cap Value VIP
| 519 |
DWS Mid Cap Growth VIP
| 68 |
DWS Money Market VIP
| 654 |
DWS Small Cap Growth VIP
| 158 |
DWS Strategic Income VIP
| 1,449 |
DWS Technology VIP
| 74 |
DWS Turner Mid Cap Growth VIP
| 370 |
G. Ownership of the Portfolios
At December 31, 2008, the beneficial ownership in each Portfolio was as follows:
DWS Balanced VIP: Three Participating Insurance Companies were owners of record of 10% or more of the total outstanding Class A shares of the Portfolio, each owning 42%, 23% and 16%. One Participating Insurance Company was the owner of record of 10% or more of the total outstanding Class B shares of the Portfolio, owning 100%.
DWS Blue Chip VIP: Two Participating Insurance Companies were owners of record of 10% or more of the total outstanding Class A shares of the Portfolio, each owning 58% and 36%. One Participating Insurance Company was the owner of record of 10% or more of the total outstanding Class B shares of the Portfolio, owning 100%.
DWS Conservative Allocation VIP: One Participating Insurance Company was the owner of record of 10% or more of the total outstanding Class B shares of the Portfolio, owning 100%.
DWS Core Fixed Income VIP: Three Participating Insurance Companies were owners of record of 10% or more of the total outstanding Class A shares of the Portfolio, each owning 42%, 38% and 12%. One Participating Insurance Company was the owner of record of 10% or more of the total outstanding Class B shares of the Portfolio, owning 100%.
DWS Davis Venture Value VIP: Two Participating Insurance Companies were owners of record of 10% or more of the total outstanding Class A shares of the Portfolio, each owning 74% and 23%. One Participating Insurance Company was the owner of record of 10% or more of the total outstanding Class B shares of the Portfolio, owning 100%.
DWS Dreman High Return Equity VIP: Two Participating Insurance Companies were owners of record of 10% or more of the total outstanding Class A shares of the Portfolio, each owning 62% and 27%. Four Participating Insurance Companies were owners of record of 10% or more of the total outstanding Class B shares of the Portfolio, each owning 27%, 21%, 14% and 12%.
DWS Dreman Small Mid Cap Value VIP: Three Participating Insurance Companies were owners of record of 10% or more of the total outstanding Class A shares of the Portfolio, each owning 49%, 25% and 13%. Four Participating Insurance Companies were owners of record of 10% or more of the total outstanding Class B shares of the Portfolio, each owning 40%, 17%, 17% and 11%.
DWS Global Thematic VIP: Two Participating Insurance Companies were owners of record of 10% or more of the total outstanding Class A shares of the Portfolio, each owning 65% and 30%. One Participating Insurance Company was the owner of record of 10% or more of the total outstanding Class B shares of the Portfolio, owning 99%.
DWS Government & Agency Securities VIP: Three Participating Insurance Companies were owners of record of 10% or more of the total outstanding Class A shares of the Portfolio, each owning 43%, 37% and 14%. One Participating Insurance Company was the owner of record of 10% or more of the total outstanding Class B shares of the Portfolio, owning 97%.
DWS Growth Allocation VIP: One Participating Insurance Company was the owner of record of 10% or more of the total outstanding Class B shares of the Portfolio, owning 100%.
DWS High Income VIP: Three Participating Insurance Companies were owners of record of 10% or more of the total outstanding Class A shares of the Portfolio, each owning 34%, 30% and 29%. One Participating Insurance Company was the owner of record of 10% or more of the total outstanding Class B shares of the Portfolio, owning 100%.
DWS International Select Equity VIP: Three Participating Insurance Companies were owners of record of 10% or more of the total outstanding Class A shares of the Portfolio, each owning 49%, 26% and 25%. One Participating Insurance Company was the owner of record of 10% or more of the total outstanding Class B shares of the Portfolio, owning 100%.
DWS Janus Growth & Income VIP: Two Participating Insurance Companies were owners of record of 10% or more of the total outstanding Class A shares of the Portfolio, each owning 70% and 29%.
DWS Large Cap Value VIP: Three Participating Insurance Companies were owners of record of 10% or more of the total outstanding Class A shares of the Portfolio, each owning 42%, 29% and 17%. Two Participating Insurance Companies were owners of record of 10% or more of the total outstanding Class B shares of the Portfolio, each owning 77% and 23%.
DWS Mid Cap Growth VIP: Two Participating Insurance Companies were owners of record of 10% or more of the total outstanding Class A shares of the Portfolio, each owning 63% and 35%. One Participating Insurance Company was the owner of record of 10% or more of the total outstanding Class B shares of the Portfolio, owning 100%.
DWS Moderate Allocation VIP: One Participating Insurance Company was the owner of record of 10% or more of the total outstanding Class B shares of the Portfolio, owning 100%.
DWS Money Market VIP: Three Participating Insurance Companies were owners of record of 10% or more of the total outstanding Class A shares of the Portfolio, each owning 43%, 20% and 12%. One Participating Insurance Company was the owner of record of 10% or more of the total outstanding Class B shares of the Portfolio, owning 100%.
DWS Small Cap Growth VIP: Three Participating Insurance Companies were owners of record of 10% or more of the total outstanding Class A shares of the Portfolio, each owning 46%, 24% and 24%. One Participating Insurance Company was the owner of record of 10% or more of the total outstanding Class B shares of the Portfolio, owning 100%.
DWS Strategic Income VIP: Two Participating Insurance Companies were owners of record of 10% or more of the total outstanding Class A shares of the Portfolio, each owning 64% and 34%. One Participating Insurance Company was the owner of record of 10% or more of the outstanding Class B shares of the Portfolio, owning 100%.
DWS Technology VIP: Two Participating Insurance Companies were owners of record of 10% or more of the total outstanding Class A shares of the Portfolio, each owning 59% and 34%. One Participating Insurance Company was the owner of record of 10% or more of the outstanding Class B shares of the Portfolio, owning 92%.
DWS Turner Mid Cap Growth VIP: Two Participating Insurance Companies were owners of record of 10% or more of the total outstanding Class A shares of the Portfolio, each owning 81% and 19%. One Participating Insurance Company was the owner of record of 10% or more of the total outstanding Class B shares of the Portfolio, owning 100%.
H. Line of Credit
The Trust and other affiliated funds (the "Participants") share in a $490 million revolving credit facility provided by a syndication of banks. The Portfolios may borrow for temporary or emergency purposes, including the meeting of redemption requests that otherwise might require the untimely disposition of securities. The Participants are charged an annual commitment fee which is allocated based on net assets, among each of the Participants. Interest is calculated at the Federal Funds Rate plus 0.35 percent. The facility borrowing limit for each Portfolio as a percentage of net assets is as follows:
Portfolio | Facility Borrowing Limit |
DWS Balanced VIP
| 33% |
DWS Blue Chip VIP
| 33% |
DWS Conservative Allocation VIP
| 33% |
DWS Core Fixed Income VIP
| 33% |
DWS Davis Venture Value VIP
| 33% |
DWS Dreman High Return Equity VIP
| 33% |
DWS Dreman Small Mid Cap Value VIP
| 33% |
DWS Global Thematic VIP
| 33% |
DWS Government & Agency Securities VIP
| 33% |
DWS Growth Allocation VIP
| 33% |
DWS High Income VIP
| 33% |
DWS International Select Equity VIP
| 33% |
DWS Janus Growth & Income VIP
| 33% |
DWS Large Cap Value VIP
| 33% |
DWS Mid Cap Growth VIP
| 33% |
DWS Moderate Allocation VIP
| 33% |
DWS Money Market VIP
| 33% |
DWS Small Cap Growth VIP
| 33% |
DWS Strategic Income VIP
| 33% |
DWS Technology VIP
| 5% |
DWS Turner Mid Cap Growth VIP
| 33% |
At December 31, 2008, DWS Core Fixed Income VIP had a $250,000 outstanding loan. Interest expense incurred on the borrowing was $8,024 for the year ended December 31, 2008. The average dollar amount of the borrowings was $1,772,936, the weighted average interest rate on these borrowings was 1.49% and the Portfolio had a loan outstanding for 109 days throughout the period.
At December 31, 2008, DWS Dreman High Return Equity VIP had a $450,000 outstanding loan. Interest expense incurred on the borrowing was $15,847 for the year ended December 31, 2008. The average dollar amount of the borrowings was $1,566,583, the weighted average interest rate on these borrowings was 1.82% and the Portfolio had a loan outstanding for 199 days throughout the period.
At December 31, 2008, DWS Large Cap Value VIP had a $750,000 outstanding loan. Interest expense incurred on the borrowing was $197 for the year ended December 31, 2008. The average dollar amount of the borrowings was $520,588, the weighted average interest rate on these borrowings was 0.80% and the Portfolio had a loan outstanding for 17 days throughout the period.
I. Payments Made by Affiliates
During the year ended December 31, 2008, the Advisor fully reimbursed DWS Balanced VIP, DWS High Income VIP and DWS Strategic Income VIP $11,599, $6 and $1,022, respectively, for losses incurred on trades executed incorrectly. The Advisor also fully reimbursed DWS Moderate Allocation VIP $2,194 for a loss incurred in violation of investment restrictions. The amounts of the losses were less than 0.01% of each Portfolio's average net assets, thus having no impact on each Portfolio's total return.
In addition, during the year ended December 31, 2008, the Advisor fully reimbursed DWS International Select Equity VIP $354,782 for losses incurred on trades executed incorrectly.
J. Participation in the Treasury's Temporary Guarantee Program
The U.S. Department of the Treasury (the "Treasury") has established a Temporary Guarantee Program for Money Market Funds (the "Program"). DWS Money Market VIP is participating in the Program.
The Program is designed to protect the value of accounts in the Portfolio as of the close of business on September 19, 2008. According to the terms of the Program, any investment made by a shareholder after September 19, 2008 in excess of the amount held in the account as of the close of business on that date will not be covered by the Program. Any purchase of shares of the Portfolio for an account opened after September 19, 2008 will also not be covered under the Program. The Program guarantee will apply to the lesser of (i) the number of shares held in an account as of the close of business on September 19, 2008, or (ii) the number of shares held in the account on the date the Program guarantee is triggered. Subject to certain conditions and limitations, the Program guarantee is triggered if the Portfolio's net asset value falls below $0.995 and the Portfolio is liquidated. Guarantee payments under the Program will not exceed the amount available within the Treasury's Exchange Stabilization Fund ("ESF") on the date of payment. As of the date of this report, ESF assets are approximately $52 billion. The Treasury and the Secretary of the Treasury have the authority to use assets from the ESF for purposes other than those of the Program.
The Portfolio bears the expenses of participating in the Program. The expense is determined by the product of (i) the number of shares outstanding of each class as of September 19, 2008 valued at $1.00; and (ii) the applicable Program participation fee rate, which is based upon the market-based net asset value outstanding of each share class as of September 19, 2008. For the initial period ending December 18, 2008, the Program participation fee was equal to 0.010%. For the coverage under the Program beginning on December 19, 2008 and ending on April 30, 2009, the Program participation fee is equal to 0.015%. This expense is being amortized over the length of the participation in the Program and is included in "Other" expense on the Statement of Operations. Through December 31, 2008, the Portfolio has accrued $45,679. The Program is set to terminate on April 30, 2009, unless extended by the Treasury. The Treasury may extend the program through the close of business on September 18, 2009. If the Program is extended beyond April 30, 2009, the Portfolio would need to pay an additional fee and there can be no assurances that the Portfolio would continue to participate. This expense is borne by the Portfolio without regard to any expense limitation currently in effect for the Portfolio.
Neither the Portfolio nor Deutsche Investment Management Americas Inc., the Portfolio's investment advisor, are in any manner approved, endorsed, sponsored or authorized by the Treasury.
K. Subsequent Event
The Board of Trustees has approved the termination of AAMI as the subadvisor for DWS Core Fixed Income VIP. Effective on or about February 27, 2009, DIMA will assume all day-to-day advisory responsibilities for the Portfolio that were previously delegated to AAMI.
L. Mergers
On November 21, 2008, the Board of Trustees of the Portfolios approved, in principle, the mergers of the DWS Davis Venture Value VIP (the "Acquired Portfolio") into the DWS Large Cap Value VIP and DWS Janus Growth & Income VIP (the "Acquired Portfolio") into the DWS Capital Growth VIP.
Completion of the mergers is subject to a number of conditions, including approval by shareholders of the Acquired Portfolios at the shareholder meeting expected to be held on or about April 20, 2009.
The Board of Trustees of the Trust has also approved the combination of the Class B shares of DWS Balanced VIP, DWS International Select Equity VIP, DWS Mid Cap Growth VIP, DWS Money Market VIP, DWS Small Cap Growth VIP, DWS Strategic Income VIP and DWS Turner Mid Cap Growth VIP into the Class A shares of the same Portfolio. The combinations are scheduled to become effective on or about March 6, 2009 (effective February 3, 2009 for the DWS Money Market VIP).
Report of Independent Registered Public Accounting Firm
To the Board of Trustees and Shareholders of DWS Variable Series II:
We have audited the accompanying statements of assets and liabilities of DWS Variable Series II (the "Trust"), comprising the DWS Balanced VIP, DWS Blue Chip VIP, DWS Conservative Allocation VIP, DWS Core Fixed Income VIP, DWS Davis Venture Value VIP, DWS Dreman High Return Equity VIP, DWS Dreman Small Mid Cap Value VIP, DWS Global Thematic VIP, DWS Government & Agency Securities VIP, DWS Growth Allocation VIP, DWS High Income VIP, DWS International Select Equity VIP, DWS Janus Growth & Income VIP, DWS Large Cap Value VIP, DWS Mid Cap Growth VIP, DWS Moderate Allocation VIP, DWS Money Market VIP, DWS Small Cap Growth VIP, DWS Strategic Income VIP, DWS Technology VIP and DWS Turner Mid Cap Growth VIP, including the investment portfolios, as of December 31, 2008, and the related statements of operations for the year then ended, the statements of changes in net assets for each of the two years in the period then ended, and the financial highlights for each of the periods indicated therein. These financial statements and financial highlights are the responsibility of the Trust's management. Our responsibility is to express an opinion on these financial statements and financial highlights based on our audits.
We conducted our audits in accordance with the standards of the Public Company Accounting Oversight Board (United States). Those standards require that we plan and perform the audit to obtain reasonable assurance about whether the financial statements and financial highlights are free of material misstatement. We were not engaged to perform an audit of the Trust's internal control over financial reporting. Our audits included consideration of internal control over financial reporting as a basis for designing audit procedures that are appropriate in the circumstances, but not for the purpose of expressing an opinion on the effectiveness of the Trust's internal control over financial reporting. Accordingly, we express no such opinion. An audit also includes examining, on a test basis, evidence supporting the amounts and disclosures in the financial statements and financial highlights, assessing the accounting principles used and significant estimates made by management, and evaluating the overall financial statement presentation. Our procedures included confirmation of securities owned as of December 31, 2008, by correspondence with the custodian and brokers or by other appropriate auditing procedures where replies from brokers were not received. We believe that our audits provide a reasonable basis for our opinion.
In our opinion, the financial statements and financial highlights referred to above present fairly, in all material respects, the financial position of the aforementioned portfolios of the DWS Variable Series II at December 31, 2008, the results of their operations for the year then ended, the changes in their net assets for each of the two years in the period then ended, and the financial highlights for each of the periods indicated therein, in conformity with U.S. generally accepted accounting principles.
 Boston, Massachusetts
February 13, 2009
Tax Information (Unaudited)
The following Portfolios paid distributions from net long-term capital gains during the year ended December 31, 2008 as follows:
Portfolio | Distribution Per Share ($) | % Representing 15% Rate Gains |
DWS Blue Chip VIP
| 1.14 | 100 |
DWS Conservative Allocation VIP
| 2.05 | 100 |
DWS Davis Venture Value VIP
| 1.47 | 100 |
DWS Dreman High Return Equity VIP
| 1.77 | 100 |
DWS Dreman Small Mid Cap Value VIP
| 5.64 | 100 |
DWS Global Thematic VIP
| 1.98 | 100 |
DWS Growth Allocation VIP
| 2.32 | 100 |
DWS International Select Equity VIP
| 2.04 | 100 |
DWS Janus Growth & Income VIP
| .84 | 100 |
DWS Large Cap Value VIP
| 3.43 | 100 |
DWS Moderate Allocation VIP
| 1.30 | 100 |
DWS Strategic Income VIP
| .10 | 100 |
DWS Turner Mid Cap Growth VIP
| 1.72 | 100 |
The following Portfolios designated as capital gain dividends for their year ended December 31, 2008:
Portfolio | Capital Gain ($) | % Representing 15% Rate Gains |
DWS Davis Venture Value VIP
| 12,927,000 | 100 |
DWS Growth Allocation VIP
| 1,823,000 | 100 |
DWS Moderate Allocation VIP
| 820,000 | 100 |
For corporate shareholders, the following percentage of income dividends paid during the following Portfolios' fiscal year ended December 31, 2008 qualified for the dividends received deduction:
Portfolio | Dividends Received % |
DWS Balanced VIP
| 20 |
DWS Blue Chip VIP
| 84 |
DWS Conservative Allocation VIP
| 13 |
DWS Davis Venture Value VIP
| 89 |
DWS Dreman High Return Equity VIP
| 88 |
DWS Dreman Small Mid Cap Value VIP
| 83 |
DWS Global Thematic VIP
| 22 |
DWS Growth Allocation VIP
| 59 |
DWS Janus Growth & Income VIP
| 35 |
DWS Large Cap Value VIP
| 93 |
DWS Moderate Allocation VIP
| 100 |
DWS Global Thematic VIP paid foreign taxes of $158,191 and earned $659,182 of foreign source income during the year ended December 31, 2008. Pursuant to section 853 of the Internal Revenue Code, the Portfolio designates $0.01 per share as foreign taxes paid and $0.06 per share as income earned from foreign sources for the year ended December 31, 2008.
DWS International Select Equity VIP paid foreign taxes of $454,368 and earned $5,467,917 of foreign source income during the year ended December 31, 2008. Pursuant to Section 853 of the Internal Revenue Code, the Portfolio designates $0.03 per share as foreign taxes paid and $0.38 per share as income earned from foreign sources for the year ended December 31, 2008.
Please consult a tax advisor if you have questions about federal or state income tax laws, or on how to prepare your tax returns. If you have specific questions about your account, please call (800) 621-1048.
Proxy Voting
The Trust's policies and procedures for voting proxies for portfolio securities and information about how the Trust voted proxies related to its portfolio securities during the 12-month period ended June 30 are available on our Web site — www.dws-investments.com (click on "proxy voting"at the bottom of the page) — or on the SEC's Web site — www.sec.gov. To obtain a written copy of the Trust's policies and procedures without charge, upon request, call us toll free at (800) 621-1048.
Investment Management Agreement Approval
The Board of Trustees, including the Independent Trustees, approved the renewal of each Fund's investment management agreement (the "Investment Management Agreements") with Deutsche Investment Management Americas Inc. ("DIMA") and, for each sub-advised Fund, the sub-advisory agreement (the "Sub-Advisory Agreements," and together with the Investment Management Agreements, the "Agreements") between DIMA and the sub-advisor (the "Sub-Advisors") in September 2008.1
1 The Sub-Advisors are: Davis Selected Advisers, L.P. (DWS Davis Venture Value VIP); Dreman Value Management L.L.C. (DWS Dreman Small Mid Cap Value VIP and DWS Dreman High Return Equity VIP); Aberdeen Asset Management, Inc. (DWS Core Fixed Income VIP); Janus Capital Management LLC (DWS Janus Growth & Income VIP); Turner Investment Partners, Inc. (DWS Turner Mid Cap Growth VIP); and Deutsche Asset Management International GmbH, an affiliate of DIMA (DWS Large Cap Value VIP and DWS Balanced VIP).In terms of the process that the Board followed prior to approving the Agreements, shareholders should know that:
• At the present time, all but one of the Funds' Trustees are independent of DIMA and its affiliates.
• The Trustees meet frequently to discuss fund matters. Each year, the Trustees dedicate part or all of several meetings to contract review matters. Over the course of several months, the Board's Contract Committee, in coordination with the Board's Equity Oversight Committee and Fixed Income and Quant Oversight Committee, reviewed comprehensive materials received from DIMA, independent third parties and independent counsel. These materials included an analysis of each Fund's performance, fees and expenses, and profitability compiled by the Funds' independent fee consultant. The Board also received extensive information throughout the year regarding performance of each Fund.
• The Independent Trustees regularly meet privately with their independent counsel (and, as needed, other advisors) to discuss contract review and other matters. In addition, the Independent Trustees were also advised by the Funds' independent fee consultant in the course of their review of each Fund's contractual arrangements and considered a comprehensive report prepared by the independent fee consultant in connection with their deliberations (the "IFC Report").
• In connection with reviewing the Agreements, the Board also reviewed the terms of each Fund's Rule 12b-1 plan (as applicable), distribution agreement, administrative services agreement, transfer agency agreement and other material service agreements.
• Based on its evaluation of the information provided, the Contract Committee presented its findings and recommendations to the Independent Trustees as a group. The Independent Trustees reviewed the Contract Committee's findings and recommendations and presented their recommendations to the full Board.
In connection with the contract review process, the Contract Committee and the Board considered the factors discussed below, among others. The Board also considered that DIMA and its predecessors have managed each Fund since its inception, and the Board believes that a long-term relationship with a capable, conscientious advisor is in the best interests of each Fund. The Board considered, generally, that shareholders chose to invest or remain invested in each Fund knowing that DIMA managed the Fund, and that the Agreements were approved by the Fund's shareholders at a special meeting held in 2008. DIMA is part of Deutsche Bank, a major global banking institution that is engaged in a wide range of financial services. The Board believes that there are significant advantages to being part of a global asset management business that offers a wide range of investing expertise and resources, including hundreds of portfolio managers and analysts with research capabilities in many countries throughout the world.
While shareholders may focus primarily on fund performance and fees, the Board considers these and many other factors, including the quality and integrity of DIMA's and the Sub-Advisors' personnel and such other issues as back-office operations, fund valuations, and compliance policies and procedures.
Nature, Quality and Extent of Services. The Board considered the terms of the Agreements, including the scope of advisory services provided under the Agreements. The Board noted that, under the Agreements, DIMA and the Sub-Advisors provide portfolio management services to the Funds and that, pursuant to a separate administrative services agreement, DIMA provides administrative services to the Funds. The Board considered the experience and skills of senior management and investment personnel, the resources made available to such personnel, the ability of DIMA and the Sub-Advisors to attract and retain high-quality personnel, and the organizational depth and stability of DIMA and the Sub-Advisors. The Board reviewed each Fund's performance over short-term and long-term periods and compared those returns to various agreed-upon performance measures, including market indices and a peer universe compiled by the independent fee consultant using information supplied by Lipper Inc. ("Lipper"). The Board also noted that it has put a process into place of identifying "Focus Funds" (e.g., funds performing poorly relative to their benchmark or a peer group compiled by Lipper), and receives more frequent reporting and information from DIMA regarding such funds, along with DIMA's remedial plans to address underperformance. The Board believes this process is an effective manner of identifying and addressing underperforming funds.
On the basis of this evaluation and the ongoing review of investment results by the Board, the Board concluded that the nature, quality and extent of services provided by DIMA and the Sub-Advisors historically have been and continue to be satisfactory.
Fees and Expenses. The Board considered each Fund's investment management fee schedule, operating expenses, and total expense ratios, and comparative information provided by Lipper and the independent fee consultant regarding investment management fee rates paid to other investment advisors by similar funds (1st quartile being the most favorable and 4th quartile being the least favorable). The Board considered each Fund's management fee rate as compared to fees charged by DIMA and certain of its affiliates for comparable mutual funds and considered differences in fund and fee structures between the DWS Funds. The Board also considered how each Fund's total (net) operating expenses compared to the total (net) operating expenses of a more customized peer group selected by Lipper (based on such factors as asset size).
On the basis of the information provided, the Board concluded that management fees were reasonable and appropriate in light of the nature, quality and extent of services provided by DIMA and the Sub-Advisors.
Profitability. The Board reviewed detailed information regarding revenues received by DIMA under the Investment Management Agreements. The Board considered the estimated costs and pre-tax profits realized by DIMA from advising the DWS Funds, as well as estimates of the pre-tax profits attributable to managing each Fund in particular, except for DWS Conservative Allocation VIP, DWS Growth Allocation VIP and DWS Moderate Allocation VIP. For DWS Conservative Allocation VIP, DWS Growth Allocation VIP and DWS Moderate Allocation VIP, the Board did not receive profitability information with respect to the Funds, but did receive such information with respect to the funds in which each Fund invests. The Board also received information regarding the estimated enterprise-wide profitability of the DWS Investments organization with respect to all fund services in totality and by fund. The Board reviewed DIMA's methodology in allocating its costs to the management of each Fund. Based on the information provided, the Board concluded that the pre-tax profits realized by DIMA in connection with the management of each Fund were not unreasonable. The Board also reviewed information regarding the profitability of certain similar investment management firms. The Board noted that while information regarding the profitability of such firms is limited (and in some cases is not necessarily prepared on a comparable basis), DIMA and its affiliates' overall profitability with respect to the DWS Investments fund complex (after taking into account distribution and other services provided to the funds by DIMA and its affiliates) was lower than the overall profitability levels of many comparable firms for which such data was available. The Board also considered the estimated profitability of the Sub-Advisors based on revenues and expenses provided by the Sub-Advisors and concluded that the estimated profitability realized by each Sub-Advisor in connection with the management of its respective Fund(s) was not unreasonable.
Economies of Scale. The Board considered whether there are economies of scale with respect to the management of each Fund and whether each Fund benefits from any economies of scale. The Board noted that each Fund's management fee schedule includes fee breakpoints. The Board concluded that each Fund's fee schedule represents an appropriate sharing between the Fund and DIMA of such economies of scale as may exist in the management of the Fund at current asset levels.
Other Benefits to DIMA and the Sub-Advisors and Their Affiliates. The Board also considered the character and amount of other incidental benefits received by DIMA and the Sub-Advisors and their affiliates, including any fees received by DIMA for administrative services provided to each Fund and any fees received by an affiliate of DIMA for distribution services. The Board also considered benefits to DIMA and the Sub-Advisors related to brokerage and soft-dollar allocations, including allocating brokerage to pay for research generated by parties other than the executing broker dealers, which pertain primarily to funds investing in equity securities, along with the incidental public relations benefits to DIMA and the Sub-Advisors related to DWS Funds advertising and cross-selling opportunities among DWS Investments products and services. The Board concluded that management fees were reasonable in light of these fallout benefits.
Compliance. The Board considered the significant attention and resources dedicated by DIMA to documenting and enhancing its compliance processes in recent years. The Board noted in particular (i) the experience and seniority of DIMA's chief compliance officer; (ii) the large number of compliance personnel who report to DIMA's chief compliance officer; and (iii) the substantial commitment of resources by DIMA and its affiliates to compliance matters.
In connection with the factors described above, the Board considered factors specific to each Fund, as discussed below.
DWS Mid Cap Growth VIP
Nature, Quality and Extent of Services. Based on the information provided, the Board noted that for the one-, three- and five-year periods ended December 31, 2007, the Fund's performance (Class A shares) was in the 4th quartile, 3rd quartile and 4th quartile, respectively, of the applicable Lipper universe (the 1st quartile being the best performers and the 4th quartile being the worst performers). The Board also observed that the Fund has underperformed its benchmark in each of the one- and five-year periods ended December 31, 2007 and outperformed its benchmark in the three-year period ended December 31, 2007. The Board noted the disappointing investment performance of the Fund in recent periods and continued to discuss with senior management of DIMA the factors contributing to such underperformance and actions being taken to improve performance. The Board recognized that DIMA has made significant changes in its investment personnel and processes in recent years in an effort to improve long-term performance.
Fees and Expenses. With respect to management fees paid to other investment advisors by similar funds, the Board noted that the contractual fee rates paid by the Fund, which include the 0.10% fee paid to DIMA under the Fund's administrative services agreement, were lower than the median (1st quartile) of the applicable Lipper peer group (based on Lipper data provided as of December 31, 2007). The Board noted that the Fund's Class A shares' total (net) operating expenses were expected to be higher than the median (3rd quartile) of the applicable Lipper expense universe (based on Lipper data provided as of December 31, 2007, and analyzing Lipper expense universe Class A expenses less any applicable 12b-1 fees) ("Lipper Universe Expenses"). The Board also reviewed each other share class's total (net) operating expenses relative to the Lipper Universe Expenses. The Board also noted that the expense limitations agreed to by DIMA helped to ensure that the Fund's total (net) operating expenses would be competitive relative to the applicable Lipper universe.
DWS Blue Chip VIP
Nature, Quality and Extent of Services. Based on the information provided, the Board noted that for the one-, three- and five-year periods ended December 31, 2007, the Fund's performance (Class A shares) was in the 3rd quartile, 2nd quartile and 2nd quartile, respectively, of the applicable Lipper universe (the 1st quartile being the best performers and the 4th quartile being the worst performers). The Board also observed that the Fund has underperformed its benchmark in the one-year period ended December 31, 2007 and outperformed its benchmark in each of the three- and five-year periods ended December 31, 2007.
Fees and Expenses. With respect to management fees paid to other investment advisors by similar funds, the Board noted that the contractual fee rates paid by the Fund, which include the 0.10% fee paid to DIMA under the Fund's administrative services agreement, were lower than the median (1st quartile) of the applicable Lipper peer group (based on Lipper data provided as of December 31, 2007). The Board noted that the Fund's Class A shares' total (net) operating expenses were expected to be lower than the median (2nd quartile) of the applicable Lipper expense universe (based on Lipper data provided as of December 31, 2007, and analyzing Lipper expense universe Class A expenses less any applicable 12b-1 fees) ("Lipper Universe Expenses"). The Board also reviewed each other share class's total (net) operating expenses relative to the Lipper Universe Expenses. The Board also noted that the expense limitation agreed to by DIMA helped to ensure that the Fund's total (net) operating expenses would be competitive relative to the applicable Lipper universe.
DWS Davis Venture Value VIP
Nature, Quality and Extent of Services. Based on the information provided, the Board noted that for the one-, three- and five-year periods ended December 31, 2007, the Fund's performance (Class A shares) was in the 3rd quartile, 2nd quartile and 1st quartile, respectively, of the applicable Lipper universe (the 1st quartile being the best performers and the 4th quartile being the worst performers). The Board also observed that the Fund has outperformed its benchmark in each of the one- and three-year periods ended December 31, 2007 and underperformed it benchmark in the five-year period ended December 31, 2007.
Fees and Expenses. With respect to management fees paid to other investment advisors by similar funds, the Board noted that the contractual fee rates paid by the Fund, which include the 0.10% fee paid to DIMA under the Fund's administrative services agreement, were higher than the median (4th quartile) of the applicable Lipper peer group (based on Lipper data provided as of December 31, 2007). With respect to the sub-advisory fee paid to the Sub-Advisor, the Board noted that the fee is paid by DIMA out of its fee and not directly by the Fund. The Board noted that the Fund's Class A shares' total (net) operating expenses were expected to be higher than the median (4th quartile) of the applicable Lipper expense universe (based on Lipper data provided as of December 31, 2007, and analyzing Lipper expense universe Class A expenses less any applicable 12b-1 fees) ("Lipper Universe Expenses"). The Board also reviewed each other share class's total (net) operating expenses relative to the Lipper Universe Expenses. The Board also noted that the expense limitations agreed to by DIMA helped to ensure that the Fund's total (net) operating expenses would be competitive relative to the applicable Lipper universe.
DWS Dreman High Return Equity VIP
Nature, Quality and Extent of Services. Based on the information provided, the Board noted that for the one-, three- and five-year periods ended December 31, 2007, the Fund's performance (Class A shares) was in the 4th quartile, 4th quartile and 2nd quartile, respectively, of the applicable Lipper universe (the 1st quartile being the best performers and the 4th quartile being the worst performers). The Board also observed that the Fund has underperformed its benchmark in each of the one- and three-year periods ended December 31, 2007 and outperformed its benchmark in the five-year period ended December 31, 2007. The Board noted the disappointing investment performance of the Fund in recent periods and continued to discuss with senior management of DIMA and the Sub-Advisor the factors contributing to such underperformance and actions being taken to improve performance. The Board recognized that DIMA and the Sub-Advisor have made significant changes in investment personnel and processes in recent years in an effort to improve long-term performance.
Fees and Expenses. With respect to management fees paid to other investment advisors by similar funds, the Board noted that the contractual fee rates paid by the Fund, which include the 0.10% fee paid to DIMA under the Fund's administrative services agreement, were lower than the median (2nd quartile) of the applicable Lipper peer group (based on Lipper data provided as of December 31, 2007). With respect to the sub-advisory fee paid to the Sub-Advisor, the Board noted that the fee is paid by DIMA out of its fee and not directly by the Fund. The Board noted that the Fund's Class A shares' total (net) operating expenses were expected to be higher than the median (3rd quartile) of the applicable Lipper expense universe (based on Lipper data provided as of December 31, 2007, and analyzing Lipper expense universe Class A expenses less any applicable 12b-1 fees) ("Lipper Universe Expenses"). The Board also reviewed each other share class's total (net) operating expenses relative to the Lipper Universe Expenses. The Board also noted that the expense limitations agreed to by DIMA helped to ensure that the Fund's total (net) operating expenses would be competitive relative to the applicable Lipper universe.
DWS Dreman Small Mid Cap Value VIP
Nature, Quality and Extent of Services. Based on the information provided, the Board noted that for the one-, three- and five-year periods ended December 31, 2007, the Fund's performance (Class A shares) was in the 1st quartile of the applicable Lipper universe (the 1st quartile being the best performers and the 4th quartile being the worst performers). The Board also observed that the Fund has outperformed its benchmark in each of the one-, three- and five-year periods ended December 31, 2007.
Fees and Expenses. With respect to management fees paid to other investment advisors by similar funds, the Board noted that the contractual fee rates paid by the Fund, which include the 0.10% fee paid to DIMA under the Fund's administrative services agreement, were lower than the median (1st quartile) of the applicable Lipper peer group (based on Lipper data provided as of December 31, 2007). With respect to the sub-advisory fee paid to the Sub-Advisor, the Board noted that the fee is paid by DIMA out of its fee and not directly by the Fund. The Board noted that the Fund's Class A shares' total (net) operating expenses were expected to be lower than the median (1st quartile) of the applicable Lipper expense universe (based on Lipper data provided as of December 31, 2007, and analyzing Lipper expense universe Class A expenses less any applicable 12b-1 fees) ("Lipper Universe Expenses"). The Board also reviewed each other share class's total (net) operating expenses relative to the Lipper Universe Expenses.
DWS Global Thematic VIP
Nature, Quality and Extent of Services. Based on the information provided, the Board noted that for the one-, three- and five-year periods ended December 31, 2007, the Fund's performance (Class A shares) was in the 4th quartile, 1st quartile and 1st quartile, respectively, of the applicable Lipper universe (the 1st quartile being the best performers and the 4th quartile being the worst performers). The Board also observed that the Fund has underperformed its benchmark in the one-year period ended December 31, 2007 and outperformed its benchmark in each of the three- and five-year periods ended December 31, 2007. The Board noted the disappointing investment performance of the Fund in recent periods and continued to discuss with senior management of DIMA the factors contributing to such underperformance and actions being taken to improve performance. The Board recognized that DIMA has made significant changes in its investment personnel and processes in recent years in an effort to improve long-term performance.
Fees and Expenses. With respect to management fees paid to other investment advisors by similar funds, the Board noted that the contractual fee rates paid by the Fund, which include the 0.10% fee paid to DIMA under the Fund's administrative services agreement, were higher than the median (4th quartile) of the applicable Lipper peer group (based on Lipper data provided as of December 31, 2007). The Board noted that the Fund's Class A shares' total (net) operating expenses were expected to be higher than the median (3rd quartile) of the applicable Lipper expense universe (based on Lipper data provided as of December 31, 2007, and analyzing Lipper expense universe Class A expenses less any applicable 12b-1 fees) ("Lipper Universe Expenses"). The Board also reviewed each other share class's total (net) operating expenses relative to the Lipper Universe Expenses. The Board also noted that the expense limitations agreed to by DIMA helped to ensure that the Fund's total (net) operating expenses would be competitive relative to the applicable Lipper universe.
DWS International Select Equity VIP
Nature, Quality and Extent of Services. Based on the information provided, the Board noted that for the one-, three- and five-year periods ended December 31, 2007, the Fund's performance (Class A shares) was in the 1st quartile, 1st quartile and 2nd quartile, respectively, of the applicable Lipper universe (the 1st quartile being the best performers and the 4th quartile being the worst performers). The Board also observed that the Fund has outperformed its benchmark in each of the one- and three-year periods ended December 31, 2007 and underperformed its benchmark in the five-year period ended December 31, 2007.
Fees and Expenses. With respect to management fees paid to other investment advisors by similar funds, the Board noted that the contractual fee rates paid by the Fund, which include the 0.10% fee paid to DIMA under the Fund's administrative services agreement, were lower than the median (1st quartile) of the applicable Lipper peer group (based on Lipper data provided as of December 31, 2007). The Board noted that the Fund's Class A shares' total (net) operating expenses were expected to be equal to the median (2nd quartile) of the applicable Lipper expense universe (based on Lipper data provided as of December 31, 2007, and analyzing Lipper expense universe Class A expenses less any applicable 12b-1 fees) ("Lipper Universe Expenses"). The Board also reviewed each other share class's total (net) operating expenses relative to the Lipper Universe Expenses. The Board also noted that the expense limitation agreed to by DIMA helped to ensure that the Fund's total (net) operating expenses would be competitive relative to the applicable Lipper universe.
DWS Janus Growth & Income VIP
Nature, Quality and Extent of Services. Based on the information provided, the Board noted that for the one-, three- and five-year periods ended December 31, 2007, the Fund's performance (Class A shares) was in the 4th quartile, 3rd quartile and 3rd quartile, respectively, of the applicable Lipper universe (the 1st quartile being the best performers and the 4th quartile being the worst performers). The Board also observed that the Fund has underperformed its benchmark in the one-year period ended December 31, 2007 and outperformed its benchmark in each of the three- and five-year periods ended December 31, 2007. The Board noted the disappointing investment performance of the Fund in recent periods and continued to discuss with senior management of DIMA and the Sub-Advisor the factors contributing to such underperformance and actions being taken to improve performance. The Board recognized that DIMA and the Sub-Advisor have made significant changes in investment personnel and processes in recent years in an effort to improve long-term performance.
Fees and Expenses. With respect to management fees paid to other investment advisors by similar funds, the Board noted that the contractual fee rates paid by the Fund, which include the 0.10% fee paid to DIMA under the Fund's administrative services agreement, were higher than the median (3rd quartile) of the applicable Lipper peer group (based on Lipper data provided as of December 31, 2007). With respect to the sub-advisory fee paid to the Sub-Advisor, the Board noted that the fee is paid by DIMA out of its fee and not directly by the Fund. The Board noted that the Fund's Class A shares' total (net) operating expenses were expected to be higher than the median (3rd quartile) of the applicable Lipper expense universe (based on Lipper data provided as of December 31, 2007, and analyzing Lipper expense universe Class A expenses less any applicable 12b-1 fees). The Board also noted that the expense limitation agreed to by DIMA helped to ensure that the Fund's total (net) operating expenses would be competitive relative to the applicable Lipper universe.
DWS Large Cap Value VIP
Nature, Quality and Extent of Services. Based on the information provided, the Board noted that for the one-, three- and five-year periods ended December 31, 2007, the Fund's performance (Class A shares) was in the 1st quartile of the applicable Lipper universe (the 1st quartile being the best performers and the 4th quartile being the worst performers). The Board also observed that the Fund has outperformed its benchmark in each of the one- and three-year periods ended December 31, 2007 and underperformed its benchmark in the five-year period ended December 31, 2007.
Fees and Expenses. With respect to management fees paid to other investment advisors by similar funds, the Board noted that the contractual fee rates paid by the Fund, which include the 0.10% fee paid to DIMA under the Fund's administrative services agreement, were higher than the median (3rd quartile) of the applicable Lipper peer group (based on Lipper data provided as of December 31, 2007). With respect to the sub-advisory fee paid to the Sub-Advisor, the Board noted that the fee is paid by DIMA out of its fee and not directly by the Fund. The Board noted that the Fund's Class A shares' total (net) operating expenses were expected to be higher than the median (3rd quartile) of the applicable Lipper expense universe (based on Lipper data provided as of December 31, 2007, and analyzing Lipper expense universe Class A expenses less any applicable 12b-1 fees) ("Lipper Universe Expenses"). The Board also reviewed each other share class's total (net) operating expenses relative to the Lipper Universe Expenses. The Board also noted that the expense limitation agreed to by DIMA helped to ensure that the Fund's total (net) operating expenses would be competitive relative to the applicable Lipper universe.
DWS Small Cap Growth VIP
Nature, Quality and Extent of Services. Based on the information provided, the Board noted that for the one-, three- and five-year periods ended December 31, 2007, the Fund's performance (Class A shares) was in the 3rd quartile, 4th quartile and 4th quartile, respectively, of the applicable Lipper universe (the 1st quartile being the best performers and the 4th quartile being the worst performers). The Board also observed that the Fund has underperformed its benchmark in each of the one-, three- and five-year periods ended December 31, 2007. The Board noted the disappointing investment performance of the Fund in recent periods and continued to discuss with senior management of DIMA the factors contributing to such underperformance and actions being taken to improve performance. The Board recognized that DIMA has made significant changes in its investment personnel and processes in recent years in an effort to improve long-term performance.
Fees and Expenses. With respect to management fees paid to other investment advisors by similar funds, the Board noted that the contractual fee rates paid by the Fund, which include the 0.10% fee paid to DIMA under the Fund's administrative services agreement, were lower than the median (1st quartile) of the applicable Lipper peer group (based on Lipper data provided as of December 31, 2007). The Board noted that the Fund's Class A shares' total (net) operating expenses were expected to be lower than the median (1st quartile) of the applicable Lipper expense universe (based on Lipper data provided as of December 31, 2007, and analyzing Lipper expense universe Class A expenses less any applicable 12b-1 fees) ("Lipper Universe Expenses"). The Board also reviewed each other share class's total (net) operating expenses relative to the Lipper Universe Expenses. The Board also noted that the expense limitation agreed to by DIMA helped to ensure that the Fund's total (net) operating expenses would be competitive relative to the applicable Lipper universe.
DWS Technology VIP
Nature, Quality and Extent of Services. Based on the information provided, the Board noted that for the one-, three- and five-year periods ended December 31, 2007, the Fund's performance (Class A shares) was in the 4th quartile of the applicable Lipper universe (the 1st quartile being the best performers and the 4th quartile being the worst performers). The Board also observed that the Fund has underperformed its benchmark in each of the one-, three- and five-year periods ended December 31, 2007. The Board noted the disappointing investment performance of the Fund in recent periods and continued to discuss with senior management of DIMA the factors contributing to such underperformance and actions being taken to improve performance. The Board recognized that DIMA has made significant changes in its investment personnel and processes in recent years in an effort to improve long-term performance, including the introduction of a new portfolio management team in 2006.
Fees and Expenses. With respect to management fees paid to other investment advisors by similar funds, the Board noted that the contractual fee rates paid by the Fund, which include the 0.10% fee paid to DIMA under the Fund's administrative services agreement, were lower than the median (1st quartile) of the applicable Lipper peer group (based on Lipper data provided as of December 31, 2007). The Board noted that the Fund's Class A shares' total (net) operating expenses were expected to be lower than the median (1st quartile) of the applicable Lipper expense universe (based on Lipper data provided as of December 31, 2007, and analyzing Lipper expense universe Class A expenses less any applicable 12b-1 fees) ("Lipper Universe Expenses"). The Board also reviewed each other share class's total (net) operating expenses relative to the Lipper Universe Expenses. The Board also noted that the expense limitation agreed to by DIMA helped to ensure that the Fund's total (net) operating expenses would be competitive relative to the applicable Lipper universe.
DWS Balanced VIP
Nature, Quality and Extent of Services. Based on the information provided, the Board noted that for the one-, three- and five-year periods ended December 31, 2007, the Fund's performance (Class A shares) was in the 3rd quartile, 3rd quartile and 4th quartile, respectively, of the applicable Lipper universe (the 1st quartile being the best performers and the 4th quartile being the worst performers). The Board also observed that the Fund has underperformed its benchmark in each of the one-, three- and five-year periods ended December 31, 2007. The Board noted the disappointing investment performance of the Fund in recent periods and continued to discuss with senior management of DIMA the factors contributing to such underperformance and actions being taken to improve performance. The Board observed that the Fund had experienced improved relative performance during the first six months of 2008. The Board recognized that DIMA has made significant changes in its investment personnel and processes in the past year, including adding DeAMi as sub-advisor for a portion of the large cap value allocation of the Fund, in an effort to improve long-term performance.
Fees and Expenses. With respect to management fees paid to other investment advisors by similar funds, the Board noted that the contractual fee rates paid by the Fund, which include the 0.10% fee paid to DIMA under the Fund's administrative services agreement, were lower than the median (2nd quartile) of the applicable Lipper peer group (based on Lipper data provided as of December 31, 2007). With respect to the sub-advisory fee paid to the Sub-Advisor, the Board noted that the fee is paid by DIMA out of its fee and not directly by the Fund. The Board noted that the Fund's Class A shares' total (net) operating expenses were expected to be lower than the median (1st quartile) of the applicable Lipper expense universe (based on Lipper data provided as of December 31, 2007, and analyzing Lipper expense universe Class A expenses less any applicable 12b-1 fees) ("Lipper Universe Expenses"). The Board also reviewed each other share class's total (net) operating expenses relative to the Lipper Universe Expenses. The Board also noted that the expense limitation agreed to by DIMA helped to ensure that the Fund's total (net) operating expenses would be competitive relative to the applicable Lipper universe.
DWS Turner Mid Cap Growth VIP
Nature, Quality and Extent of Services. Based on the information provided, the Board noted that for the one-, three- and five-year periods ended December 31, 2007, the Fund's performance (Class A shares) was in the 1st quartile, 2nd quartile and 1st quartile, respectively, of the applicable Lipper universe (the 1st quartile being the best performers and the 4th quartile being the worst performers). The Board also observed that the Fund has outperformed its benchmark in each of the one-, three- and five-year periods ended December 31, 2007.
Fees and Expenses. With respect to management fees paid to other investment advisors by similar funds, the Board noted that the contractual fee rates paid by the Fund, which include the 0.10% fee paid to DIMA under the Fund's administrative services agreement, were lower than the median (2nd quartile) of the applicable Lipper peer group (based on Lipper data provided as of December 31, 2007). With respect to the sub-advisory fee paid to the Sub-Advisor, the Board noted that the fee is paid by DIMA out of its fee and not directly by the Fund. The Board noted that the Fund's Class A shares' total (net) operating expenses were expected to be higher than the median (3rd quartile) of the applicable Lipper expense universe (based on Lipper data provided as of December 31, 2007, and analyzing Lipper expense universe Class A expenses less any applicable 12b-1 fees) ("Lipper Universe Expenses"). The Board also reviewed each other share class's total (net) operating expenses relative to the Lipper Universe Expenses. The Board also noted that the expense limitation agreed to by DIMA helped to ensure that the Fund's total (net) operating expenses would be competitive relative to the applicable Lipper universe.
DWS Conservative Allocation VIP
Nature, Quality and Extent of Services. Based on the information provided, the Board noted that for the one- and three-year periods ended December 31, 2007, the Fund's performance (Class B shares) was in the 4th quartile and 2nd quartile, respectively, of the applicable Lipper universe (the 1st quartile being the best performers and the 4th quartile being the worst performers). The Board also observed that the Fund has underperformed its benchmark in each of the one- and three-year periods ended December 31, 2007. The Board noted the disappointing investment performance of the Fund in recent periods and continued to discuss with senior management of DIMA the factors contributing to such underperformance and actions being taken to improve performance. The Board recognized that DIMA has made significant changes in its investment personnel and processes in recent years in an effort to improve long-term performance.
Fees and Expenses. With respect to management fees paid to other investment advisors by similar funds, the Board noted that the contractual fee rates paid by the Fund, which include the 0.10% fee paid to DIMA under the Fund's administrative services agreement, were lower than the median (2nd quartile) of the applicable Lipper peer group (based on Lipper data provided as of December 31, 2007). The Board noted that the Fund's Class B shares' total (net) operating expenses (excluding 12b-1 fees) were expected to be higher than the median (4th quartile) of the applicable Lipper expense universe (based on Lipper data provided as of December 31, 2007, and analyzing Lipper expense universe Class B expenses less any applicable 12b-1 fees). The Board considered DIMA's representation that there were significant limitations to the usefulness of the comparative data provided by Lipper, noting that a majority of the peer funds were part of another investment company complex and that many of these funds had all their expenses subsidized by their investment manager. Based upon questions from the Independent Trustees, the independent fee consultant produced additional customized information on the peer universe. The Board also noted that the expense limitation agreed to by DIMA helped to ensure that the Fund's total (net) operating expenses would be competitive relative to the applicable Lipper universe.
DWS Moderate Allocation VIP
Nature, Quality and Extent of Services. Based on the information provided, the Board noted that for the one- and three-year periods ended December 31, 2007, the Fund's performance (Class B shares) was in the 3rd quartile and 3rd quartile, respectively, of the applicable Lipper universe (the 1st quartile being the best performers and the 4th quartile being the worst performers). The Board also observed that the Fund has underperformed its benchmark in each of the one- and three-year periods ended December 31, 2007. The Board noted the disappointing investment performance of the Fund in recent periods and continued to discuss with senior management of DIMA the factors contributing to such underperformance and actions being taken to improve performance. The Board recognized that DIMA has made significant changes in its investment personnel and processes in recent years in an effort to improve long-term performance.
Fees and Expenses. With respect to management fees paid to other investment advisors by similar funds, the Board noted that the contractual fee rates paid by the Fund, which include the 0.10% fee paid to DIMA under the Fund's administrative services agreement, were lower than the median (2nd quartile) of the applicable Lipper peer group (based on Lipper data provided as of December 31, 2007). The Board noted that the Fund's Class B shares' total (net) operating expenses (excluding 12b-1 fees) were expected to be higher than the median (3rd quartile) of the applicable Lipper expense universe (based on Lipper data provided as of December 31, 2007, and analyzing Lipper expense universe Class B expenses less any applicable 12b-1 fees). The Board considered DIMA's representation that there were significant limitations to the usefulness of the comparative data provided by Lipper, noting that a majority of the peer funds were part of another investment company complex and that many of these funds had all their expenses subsidized by their investment manager. Based upon questions from the Independent Trustees, the independent fee consultant produced additional customized information on the peer universe. The Board also noted that the expense limitation agreed to by DIMA helped to ensure that the Fund's total (net) operating expenses would be competitive relative to the applicable Lipper universe.
DWS Growth Allocation VIP
Nature, Quality and Extent of Services. Based on the information provided, the Board noted that for the one- and three-year periods ended December 31, 2007, the Fund's performance (Class B shares) was in the 3rd quartile of the applicable Lipper universe (the 1st quartile being the best performers and the 4th quartile being the worst performers). The Board also observed that the Fund has performed equal to its benchmark in the one-year period ended December 31, 2007 and underperformed its benchmark in the three-year period ended December 31, 2007. The Board noted the disappointing investment performance of the Fund in recent periods and continued to discuss with senior management of DIMA the factors contributing to such underperformance and actions being taken to improve performance. The Board observed that the Fund had experienced improved relative performance during the first six months of 2008. The Board recognized that DIMA has made significant changes in its investment personnel and processes in recent years in an effort to improve long-term performance.
Fees and Expenses. With respect to management fees paid to other investment advisors by similar funds, the Board noted that the contractual fee rates paid by the Fund, which include the 0.10% fee paid to DIMA under the Fund's administrative services agreement, were lower than the median (2nd quartile) of the applicable Lipper peer group (based on Lipper data provided as of December 31, 2007). The Board noted that the Fund's Class B shares' total (net) operating expenses (excluding 12b-1 fees) were expected to be higher than the median (3rd quartile) of the applicable Lipper expense universe (based on Lipper data provided as of December 31, 2007, and analyzing Lipper expense universe Class B expenses less any applicable 12b-1 fees). The Board considered DIMA's representation that there were significant limitations to the usefulness of the comparative data provided by Lipper, noting that a majority of the peer funds were part of another investment company complex and that many of these funds had all their expenses subsidized by their investment manager. Based upon questions from the Independent Trustees, the independent fee consultant produced additional customized information on the peer universe. The Board also noted that the expense limitation agreed to by DIMA helped to ensure that the Fund's total (net) operating expenses would be competitive relative to the applicable Lipper universe.
DWS Core Fixed Income VIP
Nature, Quality and Extent of Services. Based on the information provided, the Board noted that for the one-, three- and five-year periods ended December 31, 2007, the Fund's performance (Class A shares) was in the 4th quartile, 4th quartile and 3rd quartile, respectively, of the applicable Lipper universe (the 1st quartile being the best performers and the 4th quartile being the worst performers). The Board also observed that the Fund has underperformed its benchmark in each of the one-, three- and five-year periods ended December 31, 2007. The Board noted the disappointing investment performance of the Fund in recent periods and continued to discuss with senior management of DIMA and the Sub-Advisor the factors contributing to such underperformance and actions being taken to improve performance. The Board recognized that DIMA has made significant changes in its investment personnel and processes in recent years in an effort to improve long-term performance.
Fees and Expenses. With respect to management fees paid to other investment advisors by similar funds, the Board noted that the contractual fee rates paid by the Fund, which include the 0.10% fee paid to DIMA under the Fund's administrative services agreement, were lower than the median (2nd quartile) of the applicable Lipper peer group (based on Lipper data provided as of December 31, 2007). With respect to the sub-advisory fee paid to the Sub-Advisor, the Board noted that the fee is paid by DIMA out of its fee and not directly by the Fund. The Board noted that the Fund's Class A shares' total (net) operating expenses were expected to be higher than the median (3rd quartile) of the applicable Lipper expense universe (based on Lipper data provided as of December 31, 2007, and analyzing Lipper expense universe Class A expenses less any applicable 12b-1 fees) ("Lipper Universe Expenses"). The Board also reviewed each other share class's total (net) operating expenses relative to the Lipper Universe Expenses.
DWS Government & Agency Securities VIP
Nature, Quality and Extent of Services. Based on the information provided, the Board noted that for the one-, three- and five-year periods ended December 31, 2007, the Fund's performance (Class A shares) was in the 1st quartile of the applicable Lipper universe (the 1st quartile being the best performers and the 4th quartile being the worst performers). The Board also observed that the Fund has underperformed its benchmark in each of the one-, three- and five-year periods ended December 31, 2007.
Fees and Expenses. With respect to management fees paid to other investment advisors by similar funds, the Board noted that the contractual fee rates paid by the Fund, which include the 0.10% fee paid to DIMA under the Fund's administrative services agreement, were higher than the median (3rd quartile) of the applicable Lipper peer group (based on Lipper data provided as of December 31, 2007). The Board noted that the Fund's Class A shares' total (net) operating expenses were expected to be higher than the median (3rd quartile) of the applicable Lipper expense universe (based on Lipper data provided as of December 31, 2007, and analyzing Lipper expense universe Class A expenses less any applicable 12b-1 fees) ("Lipper Universe Expenses"). The Board also reviewed each other share class's total (net) operating expenses relative to the Lipper Universe Expenses. The Board also noted that the expense limitations agreed to by DIMA helped to ensure that the Fund's total (net) operating expenses would be competitive relative to the applicable Lipper universe.
DWS High Income VIP
Nature, Quality and Extent of Services. Based on the information provided, the Board noted that for the one-, three- and five-year periods ended December 31, 2007, the Fund's performance (Class A shares) was in the 4th quartile, 3rd quartile and 2nd quartile, respectively, of the applicable Lipper universe (the 1st quartile being the best performers and the 4th quartile being the worst performers). The Board also observed that the Fund has underperformed its benchmark in each of the one-, three- and five-year periods ended December 31, 2007. The Board noted the disappointing investment performance of the Fund in recent periods and continued to discuss with senior management of DIMA the factors contributing to such underperformance and actions being taken to improve performance. The Board observed that the Fund had experienced improved relative performance during the first six months of 2008. The Board recognized that DIMA has made significant changes in its investment personnel and processes in recent years in an effort to improve long-term performance.
Fees and Expenses. With respect to management fees paid to other investment advisors by similar funds, the Board noted that the contractual fee rates paid by the Fund, which include the 0.10% fee paid to DIMA under the Fund's administrative services agreement, were lower than the median (1st quartile) of the applicable Lipper peer group (based on Lipper data provided as of December 31, 2007). The Board noted that the Fund's Class A shares' total (net) operating expenses were expected to be lower than the median (2nd quartile) of the applicable Lipper expense universe (based on Lipper data provided as of December 31, 2007, and analyzing Lipper expense universe Class A expenses less any applicable 12b-1 fees) ("Lipper Universe Expenses"). The Board also reviewed each other share class's total (net) operating expenses relative to the Lipper Universe Expenses. The Board also noted that the expense limitation agreed to by DIMA helped to ensure that the Fund's total (net) operating expenses would be competitive relative to the applicable Lipper universe.
DWS Strategic Income VIP
Nature, Quality and Extent of Services. Based on the information provided, the Board noted that for the one-, three- and five-year periods ended December 31, 2007, the Fund's performance (Class A shares) was in the 3rd quartile, 1st quartile and 2nd quartile, respectively, of the applicable Lipper universe (the 1st quartile being the best performers and the 4th quartile being the worst performers). The Board also observed that the Fund has underperformed its benchmark in each of the one-, three- and five-year periods ended December 31, 2007.
Fees and Expenses. With respect to management fees paid to other investment advisors by similar funds, the Board noted that the contractual fee rates paid by the Fund, which include the 0.10% fee paid to DIMA under the Fund's administrative services agreement, were lower than the median (2nd quartile) of the applicable Lipper peer group (based on Lipper data provided as of December 31, 2007). The Board noted that the Fund's Class A shares' total (net) operating expenses were expected to be higher than the median (3rd quartile) of the applicable Lipper expense universe (based on Lipper data provided as of December 31, 2007, and analyzing Lipper expense universe Class A expenses less any applicable 12b-1 fees) ("Lipper Universe Expenses"). The Board also reviewed each other share class's total (net) operating expenses relative to the Lipper Universe Expenses. The Board also noted that the expense limitations agreed to by DIMA helped to ensure that the Fund's total (net) operating expenses would be competitive relative to the applicable Lipper universe.
DWS Money Market VIP
Nature, Quality and Extent of Services. Based on the information provided, the Board noted that for the one-, three- and five-year periods ended December 31, 2007, the Fund's performance (Class A shares) was in the 2nd quartile of the applicable iMoneyNet universe (the 1st quartile being the best performers and the 4th quartile being the worst performers).
Fees and Expenses. With respect to management fees paid to other investment advisors by similar funds, the Board noted that the contractual fee rates paid by the Fund, which include the 0.10% fee paid to DIMA under the Fund's administrative services agreement, were lower than the median (1st quartile) of the applicable Lipper peer group (based on Lipper data provided as of December 31, 2007). The Board noted that the Fund's Class A shares' total (net) operating expenses were expected to be lower than the median (2nd quartile) of the applicable Lipper expense universe (based on Lipper data provided as of December 31, 2007, and analyzing Lipper expense universe Class A expenses less any applicable 12b-1 fees) ("Lipper Universe Expenses"). The Board also reviewed each other share class's total (net) operating expenses relative to the Lipper Universe Expenses. The Board also noted that the expense limitations agreed to by DIMA helped to ensure that the Fund's total (net) operating expenses would be competitive relative to the applicable Lipper universe.
Based on all of the information considered and the conclusions reached, the Board (including a majority of the Independent Trustees) determined that the continuation of the Agreements is in the best interests of each Fund. In making this determination the Board did not give particular weight to any single factor identified above. The Board considered these factors over the course of numerous meetings, certain of which were in executive session with only the Independent Trustees and their counsel present. It is possible that individual Trustees may have weighed these factors differently in reaching their individual decisions to approve the continuation of the Agreements.
Summary of Management Fee Evaluation by Independent Fee Consultant
October 24, 2008
Pursuant to an Order entered into by Deutsche Investment Management Americas and affiliates (collectively, "DeAM") with the Attorney General of New York, I, Thomas H. Mack, have been appointed the Independent Fee Consultant for the DWS Funds (formerly the DWS Scudder Funds). My duties include preparing an annual written evaluation of the management fees DeAM charges the Funds, considering among other factors the management fees charged by other mutual fund companies for like services, management fees DeAM charges other clients for like services, DeAM's costs of supplying services under the management agreements and related profit margins, possible economies of scale if a Fund grows larger, and the nature and quality of DeAM's services, including fund performance. This report summarizes my evaluation for 2008, including my qualifications, the evaluation process for each of the DWS Funds, consideration of certain complex-level factors, and my conclusions. I served in substantially the same capacity in 2007.
Qualifications
For more than 35 years I have served in various professional capacities within the investment management business. I have held investment analysis and advisory positions, including securities analyst, portfolio strategist and director of investment policy with a large investment firm. I have also performed business management functions, including business development, financial management and marketing research and analysis.
Since 1991, I have been an independent consultant within the asset management industry. I have provided services to over 125 client organizations, including investment managers, mutual fund boards, product distributors and related organizations. Over the past ten years I have completed a number of assignments for mutual fund boards, specifically including assisting boards with management contract renewal.
I hold a Master of Business Administration degree, with highest honors, from Harvard University and Master of Science and Bachelor of Science (highest honors) degrees from the University of California at Berkeley. I am an independent director and audit committee financial expert for two closed-end mutual funds, serve on the board of directors of a private market research company, and have served in various leadership and financial oversight capacities with non-profit organizations.
Evaluation of Fees for each DWS Fund
My work focused primarily on evaluating, fund-by-fund, the fees charged to each of the 129 Fund portfolios in the DWS Fund family. For each Fund, I considered each of the key factors mentioned above, as well as any other relevant information. In doing so I worked closely with the Funds' Independent Directors in their annual contract renewal process, as well as in their approval of contracts for several new funds (documented separately).
In evaluating each Fund's fees, I reviewed comprehensive materials provided by or on behalf of DeAM, including expense information prepared by Lipper Analytical, comparative performance information, profitability data, manager histories, and other materials. I also accessed certain additional information from the Lipper, Strategic Insight, and Morningstar databases and drew on my industry knowledge and experience.
To facilitate evaluating this considerable body of information, I prepared for each Fund a document summarizing the key data elements in each area as well as additional analytics discussed below. This made it possible to consider each key data element in the context of the others.
In the course of contract renewal, DeAM agreed to implement a number of fee and expense adjustments requested by the Independent Directors which will favorably impact future fees and expenses, and my evaluation includes the effects of these changes.
Fees and Expenses Compared with Other Funds
The competitive fee and expense evaluation for each fund focused on two primary comparisons:
The Fund's contractual management fee (the advisory fee plus the administration fee where applicable) compared with those of a group of typically 12-15 funds in the same Lipper investment category (e.g. Large Capitalization Growth) having similar distribution arrangements and being of similar size.
The Fund's total expenses compared with a broader universe of funds from the same Lipper investment category and having similar distribution arrangements.
These two comparisons provide a view of not only the level of the fee compared with funds of similar scale but also the total expense the Fund bears for all the services it receives, in comparison with the investment choices available in the Fund's investment category and distribution channel. The principal figure-of-merit used in these comparisons was the subject Fund's percentile ranking against peers.
DeAM's Fees for Similar Services to Others
DeAM provided management fee schedules for all of its US domiciled fund and non-fund investment management accounts in any of the investment categories where there is a DWS Fund. These similar products included the other DWS Funds, non-fund pooled accounts, institutional accounts and sub-advisory accounts. Using this information, I calculated for each Fund the fee that would be charged to each similar product, at the subject Fund's asset level.
Evaluating information regarding non-fund products is difficult because there are varying levels of services required for different types of accounts, with mutual funds generally requiring considerably more regulatory and administrative types of service as well as having more frequent cash flows than other types of accounts. Also, while mutual fund fees for similar fund products can be expected to be similar, there will be some differences due to different pricing conditions in different distribution channels (e.g. retail funds versus those used in variable insurance products), differences in underlying investment processes and other factors.
Costs and Profit Margins
DeAM provided a detailed profitability analysis for each Fund. After making some adjustments so that the presentation would be more comparable to the available industry figures, I reviewed profit margins from investment management alone, from investment management plus other fund services (excluding distribution) provided to the Funds by DeAM (principally shareholder services), and DeAM profits from all sources, including distribution. A later section comments on overall profitability.
Economies of Scale
Economies of scale — an expected decline in management cost per dollar of fund assets as fund assets grow — are very rarely quantified and documented because of inherent difficulties in collecting and analyzing relevant data. However, in virtually every investment category that I reviewed, larger funds tend to have lower fees and lower total expenses than smaller funds. To see how each DWS Fund compares with this industry observation, I reviewed:
The trend in Fund assets over the last five years and the accompanying trend in total expenses. This shows if the Fund has grown and, if so, whether total expense (management fees as well as other expenses) have declined as a percent of assets.
Whether the Fund has break-points in its management fee schedule, the extent of the fee reduction built into the schedule and the asset levels where the breaks take effect, and in the case of a sub-advised Fund how the Fund's break-points compare with those of the sub-advisory fee schedule.
How the Fund's contractual fee schedule compares with trends in the industry data. To accomplish this, I constructed a chart showing how actual latest-fiscal-year contractual fees of the Fund and of other similar funds relate to average fund assets, with the subject Fund's contractual fee schedule superimposed.
Quality of Service — Performance
The quality-of-service evaluation focused on investment performance, which is the principal result of the investment management service. Each Fund's performance was reviewed over the past 1, 3, 5 and 10 years, as applicable, and compared with that of other funds in the same investment category and with a suitable market index.
In addition, I calculated and reviewed risk-adjusted returns relative to an index of similar mutual funds' returns and a suitable market index. The risk-adjusted returns analysis provides a way of determining the extent to which the Fund's return comparisons are mainly the product of investment value-added (or lack thereof) or alternatively taking considerably more or less risk than is typical in its investment category.
I also received and considered the history of portfolio manager changes for each Fund, as this provided an important context for evaluating the performance results.
Complex-Level Considerations
While this evaluation was conducted mainly at the individual fund level, there are some issues relating to the reasonableness of fees that can alternatively be considered across the whole fund complex:
I reviewed DeAM's profitability analysis for all DWS Funds, with a view toward determining if the allocation procedures used were reasonable and how profit levels compared with public data for other investment managers.
I considered whether DeAM and affiliates receive any significant ancillary or "fall-out" benefits that should be considered in interpreting the direct profitability results. These would be situations where serving as the investment manager of the Funds is beneficial to another part of the Deutsche Bank organization.
I considered how aggregated DWS Fund expenses had varied over the years, by asset class and in the context of trends in asset levels.
I reviewed the structure of the DeAM organization, trends in staffing levels, and information on compensation of investment management and other professionals compared with industry data.
Findings
Based on the process and analysis discussed above, which included reviewing a wide range of information from management and external data sources and considering among other factors the fees DeAM charges other clients, the fees charged by other fund managers, DeAM's costs and profits associated with managing the Funds, economies of scale, possible fall-out benefits, and the nature and quality of services provided, in my opinion the management fees charged the DWS Funds are reasonable.

Thomas H. Mack
Summary of Administrative Fee Evaluation by Independent Fee Consultant
September 29, 2008
Pursuant to an Order entered into by Deutsche Asset Management (DeAM) with the Attorney General of New York, I, Thomas H. Mack, have been appointed the Independent Fee Consultant for the DWS Funds and have as part of my duties evaluated the reasonableness of the proposed management fees to be charged by DeAM to the DWS Funds, taking onto account a proposal to pass through to the funds certain fund accounting-related charges in connection with new regulatory requirements. My evaluation considered the following:
• While the proposal would alter the services to be provided under the Administration Agreement, which I consider to be part of fund management under the Order, it is my opinion that the change in services is slight and that the scope of prospective services under the combination of the Advisory and Administration Agreements continues to be comparable with those typically provided to competitive funds under their management agreements.
• While the proposal would increase fund expenses, according to a pro forma analysis performed by management, the prospective effect is less than .01% for all but seven of the DeAM Funds' 438 active share classes, and in all cases the effect is less than .03% and overall expenses would remain reasonable in my opinion.
Based on the foregoing considerations, in my opinion the fees and expenses for all of the DWS Funds will remain reasonable if the Directors adopt this proposal.

Thomas H. Mack
Board Members and Officers
The following table presents certain information regarding the Board Members and Officers of the Trust as of December 31, 2008. Each Board Member's year of birth is set forth in parentheses after his or her name. Unless otherwise noted, (i) each Board Member has engaged in the principal occupation(s) noted in the table for at least the most recent five years, although not necessarily in the same capacity; and (ii) the address of each Independent Board Member is c/o Dawn-Marie Driscoll, PO Box 100176, Cape Coral, FL 33904. Except as otherwise noted below, the term of office for each Board Member is until the election and qualification of a successor, or until such Board Member sooner dies, resigns, is removed or as otherwise provided in the governing documents of the fund. Because the fund does not hold an annual meeting of shareholders, each Board Member will hold office for an indeterminate period. The Board Members may also serve in similar capacities with other funds in the fund complex. The Length of Time Served represents the year in which the Board Member joined the board of one or more DWS funds now overseen by the Board.
Independent Board Members |
Name, Year of Birth, Position with the Fund and Length of Time Served1 | Business Experience and Directorships During the Past Five Years | Number of Funds in DWS Fund Complex Overseen |
Paul K. Freeman (1950)
Chairperson since 20092
Board Member since 1993
| Consultant, World Bank/Inter-American Development Bank; Governing Council of the Independent Directors Council (governance, executive committees); formerly, Project Leader, International Institute for Applied Systems Analysis (1998-2001); Chief Executive Officer, The Eric Group, Inc. (environmental insurance) (1986-1998)
| 134 |
Dawn-Marie Driscoll (1946)
Board Member since 1987
| President, Driscoll Associates (consulting firm); Executive Fellow, Center for Business Ethics, Bentley University; formerly, Partner, Palmer & Dodge (1988-1990); Vice President of Corporate Affairs and General Counsel, Filene's (1978-1988). Directorships: Trustee of 20 open-end mutual funds managed by Sun Capital Advisers, Inc. (since 2007); Director of ICI Mutual Insurance Company (since 2007); Advisory Board, Center for Business Ethics, Bentley University; Trustee, Southwest Florida Community Foundation (charitable organization). Former Directorships: Investment Company Institute (audit, executive, nominating committees) and Independent Directors Council (governance, executive committees)
| 134 |
John W. Ballantine (1946)
Board Member since 1999
| Retired; formerly, Executive Vice President and Chief Risk Management Officer, First Chicago NBD Corporation/The First National Bank of Chicago (1996-1998); Executive Vice President and Head of International Banking (1995-1996). Directorships: Healthways, Inc. (provider of disease and care management services); Portland General Electric (utility company); Stockwell Capital Investments PLC (private equity). Former Directorships: First Oak Brook Bancshares, Inc. and Oak Brook Bank
| 134 |
Henry P. Becton, Jr. (1943)
Board Member since 1990
| Vice Chair, WGBH Educational Foundation. Directorships: Association of Public Television Stations; Becton Dickinson and Company3 (medical technology company); Belo Corporation3 (media company); Boston Museum of Science; Public Radio International; PRX, The Public Radio Exchange; The PBS Foundation. Former Directorships: American Public Television; Concord Academy; New England Aquarium; Mass. Corporation for Educational Telecommunications; Committee for Economic Development; Public Broadcasting Service
| 134 |
Keith R. Fox (1954)
Board Member since 1996
| Managing General Partner, Exeter Capital Partners (a series of private investment funds). Directorships: Progressive Holding Corporation (kitchen goods importer and distributor); Box Top Media Inc. (advertising); The Kennel Shop (retailer)
| 134 |
Kenneth C. Froewiss (1945)
Board Member since 2001
| Clinical Professor of Finance, NYU Stern School of Business (1997-present); Member, Finance Committee, Association for Asian Studies (2002-present); Director, Mitsui Sumitomo Insurance Group (US) (2004-present); prior thereto, Managing Director, J.P. Morgan (investment banking firm) (until 1996)
| 134 |
Richard J. Herring (1946)
Board Member since 1990
| Jacob Safra Professor of International Banking and Professor, Finance Department, The Wharton School, University of Pennsylvania (since July 1972); Co-Director, Wharton Financial Institutions Center (since July 2000); Director, Japan Equity Fund, Inc. (since September 2007), Thai Capital Fund, Inc. (since September 2007), Singapore Fund, Inc. (since September 2007). Formerly, Vice Dean and Director, Wharton Undergraduate Division (July 1995-June 2000); Director, Lauder Institute of International Management Studies (July 2000-June 2006)
| 134 |
William McClayton (1944)
Board Member since 2004
| Managing Director, Diamond Management & Technology Consultants, Inc. (global management consulting firm) (2001-present); Directorship: Board of Managers, YMCA of Metropolitan Chicago; formerly: Senior Partner, Arthur Andersen LLP (accounting) (1966-2001); Trustee, Ravinia Festival
| 134 |
Rebecca W. Rimel (1951)
Board Member since 1995
| President and Chief Executive Officer, The Pew Charitable Trusts (charitable organization) (1994 to present); Trustee, Thomas Jefferson Foundation (charitable organization) (1994 to present); Trustee, Executive Committee, Philadelphia Chamber of Commerce (2001-2007); Trustee, Pro Publica (2007-present) (charitable organization). Formerly, Executive Vice President, The Glenmede Trust Company (investment trust and wealth management) (1983-2004); Board Member, Investor Education (charitable organization) (2004-2005); Director, Viasys Health Care3 (January 2007-June 2007)
| 134 |
William N. Searcy, Jr. (1946)
Board Member since 1993
| Private investor since October 2003; Trustee of 20 open-end mutual funds managed by Sun Capital Advisers, Inc. (since October 1998). Formerly, Pension & Savings Trust Officer, Sprint Corporation3 (telecommunications) (November 1989-September 2003)
| 134 |
Jean Gleason Stromberg (1943)
Board Member since 1997
| Retired. Formerly, Consultant (1997-2001); Director, US Government Accountability Office (1996-1997); Partner, Fulbright & Jaworski, L.L.P. (law firm) (1978-1996). Directorships: The William and Flora Hewlett Foundation; Business Leadership Council, Wellesley College. Former Directorships: Service Source, Inc., Mutual Fund Directors Forum (2002-2004), American Bar Retirement Association (funding vehicle for retirement plans) (1987-1990 and 1994-1996)
| 134 |
Robert H. Wadsworth
(1940)
Board Member since 1999
| President, Robert H. Wadsworth & Associates, Inc. (consulting firm) (1983 to present); Director, The Phoenix Boys Choir Association
| 137 |
Interested Board Member |
Name, Year of Birth, Position with the Fund and Length of Time Served1 | Business Experience and Directorships During the Past Five Years | Number of Funds in Fund Complex Overseen |
Axel Schwarzer4 (1958)
Board Member since 2006
| Managing Director5, Deutsche Asset Management; Head of Deutsche Asset Management Americas; CEO of DWS Investments; formerly, board member of DWS Investments, Germany (1999-2005); formerly, Head of Sales and Product Management for the Retail and Private Banking Division of Deutsche Bank in Germany (1997-1999); formerly, various strategic and operational positions for Deutsche Bank Germany Retail and Private Banking Division in the field of investment funds, tax driven instruments and asset management for corporates (1989-1996)
| 134 |
Officers6 |
Name, Year of Birth, Position with the Fund and Length of Time Served7 | Principal Occupation(s) During Past 5 Years and Other Directorships Held |
Michael G. Clark8 (1965)
President, 2006-present
| Managing Director5, Deutsche Asset Management (2006-present); President of DWS family of funds; Director, ICI Mutual Insurance Company (since October 2007); formerly, Director of Fund Board Relations (2004-2006) and Director of Product Development (2000-2004), Merrill Lynch Investment Managers; Senior Vice President Operations, Merrill Lynch Asset Management (1999-2000)
|
John Millette9 (1962)
Vice President and Secretary, 1999-present
| Director5, Deutsche Asset Management
|
Paul H. Schubert8 (1963)
Chief Financial Officer, 2004-present
Treasurer, 2005-present
| Managing Director5, Deutsche Asset Management (since July 2004); formerly, Executive Director, Head of Mutual Fund Services and Treasurer for UBS Family of Funds (1998-2004); Vice President and Director of Mutual Fund Finance at UBS Global Asset Management (1994-1998)
|
Caroline Pearson9 (1962)
Assistant Secretary, 1997-present
| Managing Director5, Deutsche Asset Management
|
Rita Rubin10 (1970)
Assistant Secretary, 2009-present
| Vice President and Counsel, Deutsche Asset Management (since October 2007); formerly, Vice President, Morgan Stanley Investment Management (2004-2007); Attorney, Shearman & Sterling LLP (2004); Vice President and Associate General Counsel, UBS Global Asset Management (2001-2004)
|
Paul Antosca9 (1957)
Assistant Treasurer, 2007-present
| Director5, Deutsche Asset Management (since 2006); Vice President, The Manufacturers Life Insurance Company (U.S.A.) (1990-2006)
|
Jack Clark9 (1967)
Assistant Treasurer, 2007-present
| Director5, Deutsche Asset Management (since 2007); formerly, Vice President, State Street Corporation (2002-2007)
|
Diane Kenneally9 (1966)
Assistant Treasurer, 2007-present
| Director5, Deutsche Asset Management
|
Jason Vazquez10 (1972)
Anti-Money Laundering Compliance Officer, 2007-present
| Vice President, Deutsche Asset Management (since 2006); formerly, AML Operations Manager for Bear Stearns (2004-2006), Supervising Compliance Principal and Operations Manager for AXA Financial (1999-2004)
|
Robert Kloby10 (1962)
Chief Compliance Officer, 2006-present
| Managing Director5, Deutsche Asset Management (2004-present); formerly, Chief Compliance Officer/Chief Risk Officer, Robeco USA (2000-2004); Vice President, The Prudential Insurance Company of America (1988-2000); E.F. Hutton and Company (1984-1988)
|
J. Christopher Jackson10 (1951)
Chief Legal Officer, 2006-present
| Director5, Deutsche Asset Management (2006-present); formerly, Director, Senior Vice President, General Counsel and Assistant Secretary, Hansberger Global Investors, Inc. (1996-2006); Director, National Society of Compliance Professionals (2002-2005) (2006-2009)
|
1 The length of time served represents the year in which the Board Member joined the board of one or more DWS funds currently overseen by the Board.2 Mr. Freeman assumed the Chairperson role as of January 1, 2009. Prior to that Ms. Driscoll served as Chairperson of certain DWS funds since 2004.3 A publicly held company with securities registered pursuant to Section 12 of the Securities Exchange Act of 1934.4 The mailing address of Axel Schwarzer is c/o Deutsche Investment Management Americas Inc., 345 Park Avenue, New York, New York 10154. Mr. Schwarzer is an interested Board Member by virtue of his positions with Deutsche Asset Management. As an interested person, Mr. Schwarzer receives no compensation from the fund.5 Executive title, not a board directorship.6 As a result of their respective positions held with the Advisor, these individuals are considered "interested persons" of the Advisor within the meaning of the 1940 Act. Interested persons receive no compensation from the fund.7 The length of time served represents the year in which the officer was first elected in such capacity for one or more DWS funds.8 Address: 345 Park Avenue, New York, New York 10154.9 Address: One Beacon Street, Boston, MA 02108.10 Address: 280 Park Avenue, New York, New York 10017.The fund's Statement of Additional Information ("SAI") includes additional information about the Board Members. The SAI is available, without charge, upon request. If you would like to request a copy of the SAI, you may do so by calling the following toll-free number: (800) 621-1048.
DWS Investments is part of Deutsche Bank's Asset Management division and, within the US, represents the retail asset management activities of Deutsche Bank AG, Deutsche Bank Trust Company Americas, Deutsche Investment Management Americas Inc. and DWS Trust Company.
The views expressed in this report reflect those of the portfolio managers only through the end of the period of the report as stated on the cover. The managers' views are subject to change at any time based on market and other conditions and should not be construed as a recommendation.
This information must be preceded or accompanied by a current prospectus.
Portfolio changes should not be considered recommendations for action by individual investors.
DWS Investment Distributors, Inc.
222 South Riverside Plaza
Chicago, IL 60606
(800) 778-1482
VS2-2 (R-9042-1 2/09)
DWS VARIABLE SERIES I
PART C: OTHER INFORMATION
Item 15. Indemnification
A policy of insurance covering Deutsche Investment Management Americas Inc., the Registrant’s investment adviser (the “Adviser”), its subsidiaries, including DWS Investments Distributors, Inc., and all of the registered investment companies advised by the Adviser insures the Registrant’s trustees and officers and others against liability arising by reason of an alleged breach of duty caused by any negligent act, error or accidental omission in the scope of their duties.
Article IV, Sections 4.1-4.3 of Registrant’s declaration of trust provides as follows:
Section 4.1. No Personal Liability of Shareholders, Trustees, Etc. Generally. No Shareholder or former Shareholder shall be subject to any personal liability whatsoever to any Person in connection with Trust Property or the acts, obligations or affairs of the Trust. No Trustee, former Trustee, officer, employee or agent of the Trust shall be subject to any personal liability whatsoever to any Person, other than to the Trust or its Shareholders (as set forth in Section 4.2 below), in connection with Trust Property or the acts, obligations or affairs of the Trust; and all such Persons shall look solely to the Trust Property for satisfaction of claims of any nature arising in connection with the affairs of the Trust. The Trust shall indemnify and hold each Shareholder or former Shareholder harmless from and against all claims and liabilities to which such Shareholder may become subject solely by reason of his being or having been a Shareholder, and shall reimburse such Shareholder for all legal and other expenses reasonably incurred by him in connection with any such claim or liability. The indemnification and reimbursement required by the preceding sentence shall be made only out of the assets of the one or more Series of which the Shareholder who is entitled to indemnification or reimbursement was a Shareholder at the time the act or event occurred which gave rise to the claim against or liability of said Shareholder. The rights accruing to a Shareholder under this Section 4.1 shall not impair any other right to which such Shareholder may be lawfully entitled, nor shall anything herein contained restrict the right of the Trust to indemnify or reimburse a Shareholder in any appropriate situation even though not specifically provided herein.
Section 4.2. Non-Liability of Trustees, Etc. to Trust or Shareholders. No Trustee, former Trustee, officer or employee of the Trust shall be liable to the Trust or to any Shareholder for any action or failure to act except for his or her own bad faith, willful misfeasance, gross negligence or reckless disregard of his or her duties involved in the conduct of his office. Without limiting the foregoing, a Trustee shall not be responsible for or liable in any event for any neglect or wrongdoing of any officer, employee, investment adviser, subadviser, principal underwriter, custodian or other agent of the Trust, nor shall any Trustee be responsible or liable for the act or omission of any other Trustee, except in the case of such Trustee’s own willful misfeasance, bad faith, gross negligence or reckless disregard of the duties involved in the conduct of his office.
Section 4.3. Mandatory Indemnification. (a) Subject to the exceptions and limitations contained in paragraph (b) below:
(i) every person who is, or has been, a Trustee or officer of the Trust (for purposes of this Section, “Trustee or officer” shall include persons who serve at the Trust’s request as directors, officers or trustees of another organization in which the Trust has any interest as a shareholder, creditor or otherwise), shall be indemnified by the Trust to the fullest extent permitted by law against all liability and against all expenses reasonably incurred or paid by him in connection with any claim, action, suit or proceeding in which he becomes involved as a party or otherwise by virtue of his being or having been a Trustee or officer, and against amounts paid or incurred by him in the settlement thereof;
(ii) the words “claim,” “action,” “suit” or “proceeding” shall apply to all claims, actions, suits or proceedings (civil, criminal, administrative or other, including appeals), actual or threatened; and the words “liability” and “expenses” shall include without limitation, attorneys’ fees, costs, judgments, amounts paid in settlement, fines, penalties and other liabilities.
(b) No indemnification shall be provided hereunder to a Trustee or officer:
(i) against any liability to the Trust or the Shareholders by reason of a final adjudication by a court or other body before which a proceeding was brought that he engaged in willful misfeasance, bad faith, gross negligence or reckless disregard of the duties involved in the conduct of his office;
(ii) with respect to any matter as to which he shall have been finally adjudicated not to have acted in good faith in the reasonable belief that his action was in the best interest of the Trust; or
(iii) in the event of a settlement or other disposition not involving a final adjudication (as provided in paragraph (b)(i) or (b)(ii)) (whether by compromise payment, pursuant to a consent decree or otherwise) resulting in a payment by a Trustee or officer, unless there has been a determination that such Trustee or officer acted in good faith in the reasonable belief that his action was in the best interests of the Trust and is not liable to the Trust or its Shareholders by reason of willful misfeasance, bad faith, gross negligence or reckless disregard of the duties involved in the conduct of his office:
(A) by the court or other body approving the settlement or other disposition; or
(B) a reasonable determination, based upon a review of readily available facts (as opposed to a full trial-type inquiry), by:
(x) a vote of a majority of the Disinterested Trustees acting on the matter (provided that a majority of the Disinterested Trustees then in office act on the matter); or
(y) written opinion of legal counsel chosen by a majority of the Trustees and determined by them in their reasonable judgment to be independent.
(c) The rights of indemnification herein provided to any Trustee or officer shall be severable from those of any other Trustee or officer, shall not affect any other rights to which any Trustee or officer may now or hereafter be entitled, shall continue as to a person who has ceased to be such Trustee or officer and shall inure to the benefit of the heirs, executors, administrators and assigns of such a person. Nothing contained herein shall affect any rights to indemnification to which any Trustee or officer or any other person may be entitled by contract or otherwise under law.
(d) Expenses of preparation and presentation of a defense to any claim, action, suit or proceeding subject to a claim for indemnification described in paragraph (a) of this Section 4.3 shall be advanced by the Trust prior to final disposition thereof upon receipt of an undertaking by or on behalf of the recipient to repay such amount if it is ultimately determined that he or she is not entitled to indemnification under this Section 4.3, provided that either:
(i) such undertaking is secured by a surety bond or some other appropriate security or the Trust shall be insured against losses arising out of any such advances; or
(ii) a majority of the Disinterested Trustees acting on the matter (provided that a majority of the Disinterested Trustees act on the matter) or independent legal counsel in a written opinion shall determine, based upon a review of the readily available facts (as opposed to a full trial-type inquiry), that there is reason to believe that the recipient ultimately will be found entitled to indemnification.
As used in this Section 4.3, a “Disinterested Trustee” is one who is not (i) an Interested Person of the Trust (including anyone who has been exempted from being an Interested Person by any rule, regulation or order of the Commission), or (ii) involved in the claim, action, suit or proceeding.
In making any determination under this Section 4.3 as to whether a Trustee or officer engaged in conduct for which indemnification is not provided as described herein, or as to whether there is reason to believe that a Trustee or officer ultimately will be found entitled to indemnification, the Disinterested Trustees or independent legal counsel making the determination shall afford the Trustee or officer a rebuttable presumption that the Trustee or officer has not engaged in willful misfeasance, bad faith, gross negligence or reckless disregard of the duties involved in the conduct of the Trustee’s or officer’s office and has acted in good faith in the reasonable belief that the Trustee’s or officer’s action was in the best interest of the Trust or Series and its Shareholders. Any determination pursuant to this Section 4.3 shall not prevent the recovery from any Trustee or officer of any amount paid to such Trustee or officer in accordance with this Section as indemnification if such Trustee or officer is subsequently adjudicated by a court of competent jurisdiction not to have acted in good faith in the reasonable belief that such Trustee’s or officer’s action was in the best interests of the Trust or to have been liable to the Trust or its Shareholders by reason of willful misfeasance, bad faith, gross negligence or reckless disregard of the duties involved in the conduct of such Trustee’s or officer’s office.
On April 5, 2002, Zurich Scudder Investments, Inc. (“Scudder”), the Registrant’s investment adviser, now known as Deutsche Investment Management Americas Inc., was acquired by Deutsche Bank AG, not including certain U.K. Operations (the “Transaction”). In connection with the trustees’ evaluation of the Transaction, Deutsche Bank agreed to indemnify, defend and hold harmless Registrant and the trustees who were not “interested persons” of Scudder, Deutsche Bank or Registrant (the “Independent Trustees”) for and against any liability and claims and expenses based upon or arising from, whether in whole or in part, or directly or indirectly, any untrue statement or alleged untrue statement of a material fact made to the Independent Trustees by Deutsche Bank in connection with the Independent Trustees’ consideration of the Transaction, or any omission or alleged omission of a material fact necessary in order to make statements made, in light of the circumstances under which they were made, not misleading.
The Adviser has agreed, subject to applicable law and regulation, to indemnify and hold harmless the Registrant against any loss, damage, liability and expense, including, without limitation, the advancement and payment, as incurred, of reasonable fees and expenses of counsel (including counsel to the Registrant and counsel to the Independent Trustees) and consultants, whether retained by the Registrant or the Independent Trustees, and other customary costs and expenses incurred by the Registrant in connection with any litigation or regulatory action related to possible improper market timing or other improper trading activity or possible improper marketing and sales activity in the Registrant (“Private Litigation and Enforcement Actions”). In the event that this indemnification is unavailable to the Registrant for any reason, then the Adviser has agreed to contribute to the amount paid or payable by the Registrant as a result of any loss, damage, liability or expense in such proportion as is appropriate to reflect the relative fault of the Adviser and the Registrant with respect to the matters which resulted in such loss, damage, liability or expense, as well as any other relevant equitable considerations; provided, that if no final determination is made in such action or proceeding as to the relative fault of the Adviser and the Registrant, then the Adviser shall pay the entire amount of such loss, damage, liability or expense.
In recognition of its undertaking to indemnify the Registrant, and in light of the rebuttable presumption generally afforded to non-interested board members of an investment company that they have not engaged in disabling conduct, the Adviser has also agreed, subject to applicable law and regulation, to indemnify and hold harmless each of the Independent Trustees against any and all loss, damage, liability and expense,
including without limitation the advancement and payment as incurred of reasonable fees and expenses of counsel and consultants, and other customary costs and expenses incurred by the Independent Trustees, arising from the matters alleged in any Private Litigation and Enforcement Actions or matters arising from or similar in subject matter to the matters alleged in the Private Litigation and Enforcement Actions (collectively, “Covered Matters”), including without limitation:
1. all reasonable legal and other expenses incurred by the Independent Trustees in connection with the Private Litigation and Enforcement Actions, and any actions that may be threatened or commenced in the future by any person (including any governmental authority), arising from or similar to the matters alleged in the Private Litigation and Enforcement Actions, including without limitation expenses related to the defense of, service as a witness in, or monitoring of such proceedings or actions;
2. all liabilities and reasonable legal and other expenses incurred by any Independent Trustee in connection with any judgment resulting from, or settlement of, any such proceeding, action or matter;
3. any loss or reasonable legal and other expenses incurred by any Independent Trustee as a result of the denial of, or dispute about, any insurance claim under, or actual or purported rescission or termination of, any policy of insurance arranged by the Adviser (or by a representative of the Adviser acting as such, acting as a representative of the Registrant or of the Independent Trustees or acting otherwise) for the benefit of the Independent Trustee, to the extent that such denial, dispute or rescission is based in whole or in part upon any alleged misrepresentation made in the application for such policy or any other alleged improper conduct on the part of the Adviser, any of its corporate affiliates, or any of their directors, officers or employees;
4. any loss or reasonable legal and other expenses incurred by any Independent Trustee, whether or not such loss or expense is incurred with respect to a Covered Matter, which is otherwise covered under the terms of any specified policy of insurance, but for which the Independent Trustee is unable to obtain advancement of expenses or indemnification under that policy of insurance, due to the exhaustion of policy limits which is due in whole or in part to the Adviser or any affiliate thereof having received advancement of expenses or indemnification under that policy for or with respect to any Covered Matter; provided, that the total amount that the Adviser will be obligated to pay under this provision for all loss or expense shall not exceed the amount that the Adviser and any of its affiliates actually receive under that policy of insurance for or with respect to any and all Covered Matters; and
5. all liabilities and reasonable legal and other expenses incurred by any Independent Trustee in connection with any proceeding or action to enforce his or her rights under the agreement, unless the Adviser prevails on the merits of any such dispute in a final, nonappealable court order.
The Adviser is not required to pay costs or expenses or provide indemnification to or for any individual Independent Trustee (i) with respect to any particular proceeding or action as to which the board of Trustees of the Registrant has determined that such Independent Trustee ultimately would not be entitled to indemnification with respect thereto, or (ii) for any liability of the Independent Trustee to the Registrant or its shareholders to which such Independent Trustee would otherwise be subject by reason of willful misfeasance, bad faith, gross negligence, or reckless disregard of the Independent Trustee’s duties as a trustee of the Registrant as determined in a final adjudication in such proceeding or action. In addition, to the extent that the Adviser has paid costs or expenses under the agreement to any individual Independent Trustee with respect to a particular proceeding or action, and there is a final adjudication in such proceeding or action of the Independent Trustee’s liability to the Registrant or its shareholders by reason of willful misfeasance, bad faith, gross negligence, or reckless disregard of the Independent Trustee’s duties as a trustee of the Registrant, such Independent Trustee has undertaken to repay such costs or expenses to the Adviser.
Item 16. Exhibits
| (1) | Amended and Restated Declaration of Trust dated June 2, 2008 is incorporated by reference to the Registrant’s registration statement on Form N-14 (File No. 333-156991) filed January 28, 2009. |
| (2) | Amended and Restated By-laws dated April 1, 2008 are incorporated by reference to the Registrant’s registration statement on Form N-14 (File No. 333-156991) filed January 28, 2009. |
| (4) | Form of Agreement and Plan of Reorganization constitutes Exhibit A to Part A hereof. |
(5) | (a) | Articles V, VI, and VII and Sections 4.1 and 4.2 of the Amended and Restated Declaration of Trust included in response to Item 16(1) of this Part C. |
| | (b) | Articles 8 and 9 of the Amended and Restated Bylaws of the Registrant included in response to Item 16(2) of this Part C. |
| (6) | Amended and Restated Investment Management Agreement between the Registrant and Deutsche Investment Management Americas Inc. dated June 1, 2006 is incorporated by reference to Post-Effective Amendment No. 42 to the Registration Statement as filed on April 30, 2007. |
(7) | (a) | Underwriting Agreement between the Registrant and Scudder Investor Services, Inc., is incorporated by reference to Post-Effective Amendment No. 33 to the Registration Statement filed on April 30, 2002. |
| | (b) | Underwriting Agreement between the Registrant and Scudder Distributors, Inc. dated September 30, 2002 is incorporated by reference to Post-Effective Amendment No. 35 to the Registration Statement filed on April 30, 2003. |
(9) | (a) | Master Custodian Agreement between the Registrant and State Street Bank and Trust Company dated November 17, 2008 is incorporated by reference to the Registrant’s registration statement on Form N-14 (File No. 333-156991) filed January 28, 2009. |
| | (b) | Amended and Restated Master Custodian Agreement between the Registrant and Brown Brothers Harriman & Co. dated October 17, 2008 is incorporated by reference to the Registrant’s registration statement on Form N-14 (File No. 333-156991) filed January 28, 2009. |
(10) | (a) | Form of Amended and Restated Plan pursuant to Rule 18f-3 under the Investment Company Act of 1940 is incorporated by reference to Post-Effective Amendment No. 42 to the Registration Statement filed on April 30, 2007. |
| | (b) | Master Distribution Plan for Class B shares pursuant to Rule 12b-1, as amended September 30, 2002, is incorporated by reference to Post-Effective Amendment No. 35 to the Registration Statement filed on April 30, 2003. |
| | (c) | Master Distribution Plan for Class B shares pursuant to Rule 12b-1 dated February 9, 1996 is incorporated by reference to Post-Effective Amendment No. 23 to the Registration Statement filed on January 28, 1998. |
| (11) | Opinion of Ropes & Gray LLP, including consent, is filed herein. |
| (12) | Form of Opinion of Willkie Farr & Gallagher LLP as to tax matters, including consent, is filed herein. |
| (13) (a) | Amended and Restated Administrative Services Agreement dated October 1, 2008 is incorporated by reference to the Registrant’s registration statement on Form N-14 (File No. 333-156991) filed January 28, 2009. |
| | (b) | Form of Participation Agreement, filed herein. |
| | (c) | Letter of Indemnity to the Scudder Funds dated October 13, 2004 is incorporated by reference to Post-Effective Amendment No. 40 to the Registration Statement. |
| | (d) | Letter of Indemnity to the Scudder Funds dated October 13, 2004 is incorporated by reference to Post-Effective Amendment No. 40 to the Registration Statement. |
| | (e) | Letter of Indemnity to the Independent Trustees dated October 13, 2004 is incorporated by reference to Post-Effective Amendment No. 40 to the Registration Statement. |
| | (f) | Agency Agreement, dated May 1 2001, between the Registrant and Scudder Investments Service Company is incorporated by reference to Post-Effective Amendment No. 42 to the Registration Statement filed on April 30, 2007. |
| | (g) | Amendment No. 1, dated June 11, 2002, to the Agency Agreement dated May 1 2001 is incorporated by reference to Post-Effective Amendment No. 42 to the Registration Statement filed on April 30, 2007. |
| | (h) | Agency Agreement Fee Schedule dated October 1, 2006 is incorporated by reference to Post-Effective Amendment No. 42 to the Registration Statement filed on April 30, 2007. |
| | (i) | Form of Mutual Fund Rule 22c-2 Information Sharing Agreement between DWS Scudder Distributors, Inc. and certain financial intermediaries is incorporated by reference to the Registrant’s registration statement on Form N-14 (File No. 333-156991) filed January 28, 2009. |
| | (j) | Form of Expense Limitation Agreement between the Registrant and Deutsche Investment Management Americas Inc. is incorporated by reference to the Registrant’s registration statement on Form N-14 (File No. 333-156991) filed January 28, 2009. |
| (14) | (a) Consent of Ernst & Young LLP, Independent Registered Public Accounting Firm, filed herein. |
| | (b) | Consent of PricewaterhouseCoopers LLP, Independent Registered Public Accounting Firm, filed herein. |
| (16) | Power of Attorney is incorporated by reference to the Registrant’s registration statement on Form N-14 (File No. 333-156991) filed January 28, 2009. |
Item 17. Undertakings
(1) The undersigned Registrant agrees that prior to any public reoffering of the securities registered through the use of a prospectus which is a part of this registration statement by any person or party who is deemed to be an underwriter within the meaning of Rule 145(c) of the Securities Act of 1933, the reoffering prospectus will contain the information called for by the applicable registration form for reofferings by persons who may be deemed underwriters, in addition to the information called for by the other items of the applicable form.
(2) The undersigned Registrant agrees that every prospectus that is filed under paragraph (1) above will be filed as a part of an amendment to the Registration Statement and will not be used until the amendment is effective, and that, in determining any liability under the Securities Act of 1933, each post-effective amendment shall be deemed to be a new registration statement for the securities offered therein, and the offering of the securities at that time shall be deemed to be the initial bona fide offering of them.
SIGNATURES
As required by the Securities Act of 1933, this Registration Statement has been signed on behalf of the registrant, in the city of New York, and State of New York, on the 12th day of March 2009.
| | |
| DWS VARIABLE SERIES I |
| |
| By: | | /s/ Michael G. Clark |
| | Michael G. Clark |
| | President |
As required by the Securities Act of 1933, this Registration Statement has been signed below by the following persons in the capacities indicated on March 12, 2009.
| | |
SIGNATURE | | TITLE |
/s/ Michael G. Clark | | |
| Michael G. Clark | | President |
| |
/s/ Paul H. Schubert | | |
| Paul H. Schubert | | Chief Financial Officer and Treasurer |
| |
/s/ John W. Ballantine | | |
| John W. Ballantine* | | Trustee |
| |
/s/ Henry P. Becton, Jr. | | |
| Henry P. Becton, Jr.* | | Trustee |
| |
/s/ Dawn-Marie Driscoll | | |
| Dawn-Marie Driscoll* | | Trustee |
| |
/s/ Keith R. Fox | | |
| Keith R. Fox* | | Trustee |
| |
/s/ Paul K. Freeman | | |
| Paul K. Freeman* | | Chairperson and Trustee |
| |
/s/ Kenneth C. Froewiss | | |
| Kenneth C. Froewiss* | | Trustee |
| |
/s/ Richard J. Herring | | |
| Richard J. Herring* | | Trustee |
| |
/s/ William McClayton | | |
| William McClayton* | | Trustee |
| |
/s/ Rebecca W. Rimel | | |
| Rebecca W. Rimel* | | Trustee |
| | |
SIGNATURE | | TITLE |
/s/ William N. Searcy, Jr. | | |
| William N. Searcy, Jr.* | | Trustee |
| |
/s/ Jean Gleason Stromberg | | |
| Jean Gleason Stromberg* | | Trustee |
| |
/s/ Robert H. Wadsworth | | |
| Robert H. Wadsworth* | | Trustee |
| |
/s/ Axel Schwarzer | | |
| Axel Schwarzer* | | Trustee |
| | |
| *By: | | /s/ John Millette |
| | John Millette** |
| ** | Attorney-in-fact pursuant to the power of attorney previously filed. |
INDEX OF EXHIBITS
| | |
EXHIBIT
NUMBER | | EXHIBIT TITLE |
| 11 | | Opinion and Consent of Ropes & Gray LLP |
| |
| 12 | | Form of Tax Opinion and Consent of Willkie Farr & Gallagher LLP |
| |
| 13(b) | | Form of Participation Agreement |
| |
| 14(a) | | Consent of Ernst & Young LLP |
| |
| 14(b) | | Consent of PricewaterhouseCoopers LLP |