As Filed with the Securities and Exchange Commission on March 3, 2011
Securities Act File No. 333-171876
SECURITIES AND EXCHANGE COMMISSION
Washington, D.C. 20549
FORM N-14
REGISTRATION STATEMENT
UNDER
| | | | |
| | THE SECURITIES ACT OF 1933 | | x |
| | Pre-Effective Amendment No. 1 | | x |
| | Post-Effective Amendment No. | | ¨ |
DWS VARIABLE SERIES I
(Exact Name of Registrant as Specified in Charter)
345 Park Avenue
New York, NY 10154
(Address of Principal Executive Offices) (Zip Code)
617-295-1000
(Registrant’s Area Code and Telephone Number)
John Millette, Secretary
One Beacon Street
Boston, Massachusetts 02108
(Name and Address of Agent for Service)
With copies to:
| | |
John W. Gerstmayr, Esq. Ropes & Gray LLP Prudential Tower 800 Boylston Street Boston, Massachusetts 02199 | | David A. Sturms, Esq. Vedder Price P.C. 222 North LaSalle Street Chicago, Illinois 60601 |
Approximate date of proposed public offering: As soon as practicable after the effective date of this Registration Statement.
TITLE OF SECURITIES BEING REGISTERED: Shares of Beneficial Interest (par value $0.01 per share) of the Registrant.
No filing fee is required because an indefinite number of shares have previously been registered pursuant to Rule 24f-2 under the Investment Company Act of 1940.
The Registrant hereby amends this Registration Statement on such date or dates as may be necessary to delay its effective date until the Registrant shall file a further amendment that specifically states that this Registration Statement shall thereafter become effective in accordance with Section 8(a) of the Securities Act of 1933 or until the Registration Statement shall become effective on such date as the Commission, acting pursuant to said Section 8(a), may determine.
Questions & Answers
DWS Health Care VIP, a series of DWS Variable Series I
DWS Technology VIP, a series of DWS Variable Series II
Q&A
Q What issue am I being asked to vote on?
A You are being asked to vote on one or both of two proposals below, as applicable.
| | |
Proposal | | Shareholders Voting |
To merge DWS Health Care VIP into DWS Capital Growth VIP | | DWS Health Care VIP |
| |
To merge DWS Technology VIP into DWS Capital Growth VIP | | DWS Technology VIP |
After carefully reviewing the proposals, the Board of Trustees of DWS Variable Series I, of which DWS Health Care VIP (an “Acquired Fund”) is a series, and of DWS Variable Series II, of which DWS Technology VIP (an “Acquired Fund” and, together with DWS Health Care VIP, the “Acquired Funds”) is a series, has determined that each merger is in the best interests of the applicable Acquired Fund. The Board unanimously recommends that you vote for this proposal.
Q I am the owner of a variable life insurance policy or variable annuity contract offered by my insurance company. I am not a direct shareholder of either Acquired Fund. Why am I being asked to vote on a proposal for shareholders of an Acquired Fund?
A You have previously directed your insurance company to invest certain proceeds relating to your variable life insurance policy and/or variable annuity contract (each a “Contract”) in an Acquired Fund. Although you receive the gains, losses and income from this investment, your insurance company holds on your behalf any shares corresponding to your investment in the Acquired Fund. Thus, you are not the “shareholder” of the Acquired Fund; rather, your insurance company is the shareholder. However, you have the right to instruct your insurance company on how to vote the Acquired Fund shares corresponding to your investment through your Contract.
The attached Prospectus/Proxy Statement is used to solicit voting instructions from you and other owners of Contracts (“Contract Owners”). All persons entitled to direct the voting shares of an Acquired Fund, whether or not they are shareholders, are described as voting for purposes of the Prospectus/Proxy Statement.
Q Why has this proposal been made for my Acquired Fund?
A DWS Investments believes the proposed merger is in the best interests of each Acquired Fund for several reasons. In light of the decline of asset flows into actively managed “sector” funds such as the Acquired Funds, DWS Investments advised the Boards that the Acquired Funds have limited opportunities to attract new investments. As a result, each Acquired Fund is facing the likely prospect, over time, of declining assets and minimal opportunities to reduce costs through economies of scale. Given these considerations, and in order to provide shareholders with continuity of investment within the DWS fund family, DWS Investments believes that a merger into DWS Capital Growth VIP is the best alternative for shareholders of each Acquired Fund. Among other benefits, the mergers would result in lower management fees and lower operating expenses for shareholders of each Acquired Fund.
The Acquired Funds and DWS Capital Growth VIP have similar investment objectives and strategies, as they each seek to achieve growth of capital by investing primarily in growth-oriented U.S. equity securities. Even
though each of the funds has over 90% of its assets invested in U.S. stocks (with over 65% of those investments in large cap growth stocks), there are significant differences in the portfolios of DWS Capital Growth VIP and each Acquired Fund because each Acquired Fund concentrates its investments in a particular economic sector (health care and technology, respectively), while DWS Capital Growth VIP invests in a broad range of economic sectors. If the mergers are approved by shareholders, DWS Investments has estimated that approximately 90% and 70% of the portfolios of DWS Health Care VIP and DWS Technology VIP, respectively, will be liquidated and the proceeds will be reinvested in other securities so that upon the merger, DWS Capital Growth VIP will remain invested primarily in growth-oriented U.S. equity securities across a broad range of economic sectors. The repositioning of each Acquired Fund’s portfolio prior to the merger will involve transaction costs which will be borne by the relevant Acquired Fund.
Contract Owners may continue to instruct their insurance company on how to invest proceeds relating to their Contract, including effecting sales into or out of DWS Health Care VIP or DWS Technology VIP, as appropriate. Contract Owners should contact their insurance company for further information regarding their investment.
Q Will I have to pay taxes as a result of the merger?
A Each merger is expected to be a tax-free reorganization for federal income tax purposes and will not take place unless tax counsel provides an opinion for each merger to that effect. Before or after the mergers, you may instruct your insurance company to direct proceeds relating to your Contract out of DWS Health Care VIP or DWS Technology VIP and into other investments (such direction, a “Transfer”). A Contract Owner will not be subject to tax at the time of a Transfer. However, a Contract Owner’s insurance company may charge a fee for Transfers. If you choose to redeem or exchange your investment by surrendering your Contract or initiating a partial withdrawal before or after the merger, you may be subject to taxes and tax penalties; therefore, you may wish to consult a tax advisor before doing so.
Q Upon the merger, how will the value of my investment change?
A The aggregate value of your investment will not change as a result of the merger. However, the number of shares owned by your insurance company on your behalf will likely change as a result of the merger because your insurance company’s shares will be exchanged at the net asset value per share of either DWS Health Care VIP or DWS Technology VIP, which will probably be different from the net asset value per share of DWS Capital Growth VIP.
Q When would the merger take place?
A If approved, the merger would occur on or about May 2, 2011, or as soon as reasonably practicable after shareholder approval is obtained. Shortly after completion of the merger, shareholders whose accounts are affected by the merger (i.e., your insurance company) will receive a confirmation statement reflecting their new account number and the number of shares of DWS Capital Growth VIP they are receiving. Subsequently, you will be notified of changes to your account information by your insurance company.
Q Is either merger contingent upon approval of the other merger?
A No. Each Acquired Fund’s shareholders will vote separately on the merger of their Acquired Fund into DWS Capital Growth VIP. The merger of one Acquired Fund into DWS Capital Growth VIP is not contingent upon the approval of the other Acquired Fund’s shareholders. Each merger is separate and distinct from the other.
Q How can I vote?
A Contract Owners can vote in any one of three ways:
| | • | | Through the Internet, by going to the website listed on your voting instruction form; |
| | • | | By telephone, with a toll-free call to the number listed on your voting instruction form; or |
| | • | | By mail, by sending the enclosed voting instruction form, signed and dated, to us in the enclosed envelope. |
We encourage you to vote over the Internet or by telephone, following the instructions that appear on your voting instruction form. Whichever method you choose, please take the time to read the full text of the Prospectus/Proxy Statement before you vote.
Q Whom should I call for additional information about this Prospectus/Proxy Statement?
A Please call Computershare Fund Services, Inc., your fund’s information agent, at 866-963-6127, or your insurance company.

March , 2011
DWS HEALTH CARE VIP
DWS TECHNOLOGY VIP
A Message from the President of DWS Variable Series I and DWS Variable Series II
Dear Investor:
I am writing to ask you to instruct your insurance company as to how to vote on an important matter that affects your investment in DWS Health Care VIP (“Health Care”) and/or DWS Technology VIP (“Technology”), as applicable. You may provide your instructions by filling out and signing the enclosed voting instruction form, or by recording your instructions by telephone or through the Internet.
We are asking for your voting instructions on the following matter:
| | |
Proposal for Health Care | | To approve an Agreement and Plan of Reorganization and the transactions it contemplates, including the transfer of all of the assets of Health Care to DWS Capital Growth VIP (“Capital Growth”), in exchange for shares of Capital Growth and the assumption by Capital Growth of all the liabilities of Health Care, and the distribution of such shares, on a tax-free basis for federal income tax purposes, to the shareholders of Health Care in complete liquidation and termination of Health Care. |
| |
Proposal for Technology | | To approve an Agreement and Plan of Reorganization and the transactions it contemplates, including the transfer of all of the assets of Technology to DWS Capital Growth VIP (“Capital Growth”), in exchange for shares of Capital Growth and the assumption by Capital Growth of all the liabilities of Technology, and the distribution of such shares, on a tax-free basis for federal income tax purposes, to the shareholders of Technology in complete liquidation and termination of Technology. |
DWS Investments believes the proposed mergers are in the best interests of Health Care and Technology for several reasons. In light of the decline of asset flows into actively managed “sector” funds such as Health Care and Technology, DWS Investments believes that Health Care and Technology have limited opportunities to attract new investments. As a result, Health Care and Technology face the likely prospect, over time, of declining assets and minimal opportunities to reduce costs through economies of scale. Given these considerations, and in order to provide shareholders with continuity of investment within the DWS fund family, DWS Investments believes that a merger into Capital Growth is the best alternative for shareholders of both Health Care and Technology. Among other benefits, the mergers would result in lower management fees and lower operating expenses for shareholders of Health Care and Technology. In addition, DWS Investments believes that the mergers will benefit Contract Owners (as defined on page of the enclosed Prospectus/Proxy Statement) by transitioning their investment into a fund with a broader equity strategy that is open to broader distribution, resulting in potential for greater asset growth and future economies of scale.
In determining to approve the mergers, the Board of each of Health Care and Technology conducted a thorough review of the potential implications of each merger, and concluded that participation of Health Care
and Technology in the proposed mergers would be in the best interests of each fund and would not dilute the interests of its existing shareholders. A discussion of the factors the Boards considered is included in the enclosed Prospectus/Proxy Statement. If the proposed mergers are approved, the Board expects that the proposed changes will take effect during the second calendar quarter of 2011.
Included in this booklet is information about the upcoming shareholders’ meetings:
| | • | | A Notice of Special Meetings of Shareholders, which summarizes the issues for which you are being asked to provide voting instructions; and |
| | • | | A Prospectus/Proxy Statement, which provides detailed information on Capital Growth, the specific proposals that will be considered at the shareholders’ meetings and why the proposals are being made. |
We need your voting instructions and urge you to review the enclosed materials thoroughly. Once you’ve determined how you would like your interests to be represented, please promptly complete, sign, date and return the enclosed voting instruction form, vote by telephone or record your voting instructions on the Internet. A postage-paid envelope is enclosed for mailing, and telephone and Internet voting instructions are listed at the top of your voting instruction form. You may receive more than one voting instruction form. If so, please vote each one.
I’m sure that you, like most people, lead a busy life and are tempted to put this Prospectus/Proxy Statement aside for another day. Please don’t. Your prompt return of the enclosed voting instruction form (or your voting by telephone or through the Internet) may save the necessity and expense of further solicitations.
Your vote is important to us. We appreciate the time and consideration I am sure you will give to this important matter. If you have questions about the proposal, please call Computershare Fund Services, Inc., your fund’s information agent, at 866-963-6127 or contact your insurance company. Thank you for your continued support of DWS Investments.
|
| Sincerely yours, |
|
 |
| Michael Clark |
| President |
| DWS Variable Series I |
| DWS Variable Series II |
DWS HEALTH CARE VIP
DWS TECHNOLOGY VIP
Notice of Special Meetings of Shareholders
Please take notice that Special Meetings of Shareholders of DWS Health Care VIP, a series of DWS Variable Series I (“Health Care”) and DWS Technology VIP, a series of DWS Variable Series II (“Technology”) will be held at the offices of Deutsche Investment Management Americas Inc., 345 Park Avenue, 24th Floor, New York, NY 10154, on April 11, 2011 at 3:00 p.m., Eastern time (each a “Meeting”), to consider the following:
| | |
Proposal for Health Care | | To approve an Agreement and Plan of Reorganization and the transactions it contemplates, including the transfer of all of the assets of Health Care to DWS Capital Growth VIP (“Capital Growth”), in exchange for shares of Capital Growth and the assumption by Capital Growth of all the liabilities of Health Care, and the distribution of such shares, on a tax-free basis for federal income tax purposes, to the shareholders of Health Care in complete liquidation and termination of Health Care. |
| |
Proposal for Technology | | To approve an Agreement and Plan of Reorganization and the transactions it contemplates, including the transfer of all of the assets of Technology to DWS Capital Growth VIP (“Capital Growth”), in exchange for shares of Capital Growth and the assumption by Capital Growth of all the liabilities of Technology, and the distribution of such shares, on a tax-free basis for federal income tax purposes, to the shareholders of Technology in complete liquidation and termination of Technology. |
The appointed proxies will vote in their discretion on any other business as may properly come before a Meeting or any postponement(s) or adjournment(s) thereof. Holders of record of shares of Health Care and Technology at the close of business on February 18, 2011 are entitled to vote at the applicable Meeting and at any postponement(s) or adjournment(s) thereof.
In the event that the necessary quorum to transact business or the vote required to approve a merger is not obtained at a Meeting, the appointed proxies may propose one or more adjournments of the Meeting in accordance with applicable law to permit such further solicitation of proxies as may be deemed necessary or advisable.
|
| By order of the Trustees, |
|
 |
|
| John Millette, |
|
| Secretary |
March , 2011
IMPORTANT — We urge you to sign and date the enclosed proxy card or voting instruction form (unless you choose to record your voting instructions by touch-tone telephone or through the Internet) and return it in the enclosed addressed envelope which requires no postage and is intended for your convenience.
IMPORTANT INFORMATION
FOR OWNERS OF VARIABLE ANNUITY OR
LIFE INSURANCE CONTRACTS INVESTED IN
DWS HEALTH CARE VIP OR
DWS TECHNOLOGY VIP
This document contains a Prospectus/Proxy Statement and a voting instruction form. You can use your voting instruction form to tell your insurance company how to vote on your behalf on an important issue relating to your investment in DWS Health Care VIP or DWS Technology VIP (each an “Acquired Fund”), as applicable. If you complete and sign the voting instruction form (or tell your insurance company by telephone or through the Internet how you want it to vote), your insurance company will vote the shares corresponding to your insurance contract exactly as you indicate. If you simply sign the voting instruction form, your insurance company will vote the shares corresponding to your insurance contract in accordance with the Board’s recommendations on page . If you do not return your voting instruction form or record your voting instructions by telephone or through the Internet, your insurance company will vote the shares corresponding to your insurance contract in the same proportion as shares for which instructions have been received.
We urge you to review the Prospectus/Proxy Statement carefully, and either fill out your voting instruction form and return it by mail, or record your voting instructions by telephone or through the Internet. You may receive more than one voting instruction form. If so, please vote each one. Your prompt return of the enclosed voting information form (or your providing voting instructions by telephone or through the Internet) may save the necessity and expense of further solicitations.
We want to know how you would like your interests to be represented and welcome your comments. Please take a few minutes to read these materials and return your voting instruction form. If you have any questions, please call Computershare Fund Services, Inc., information agent for your Acquired Fund, at the special toll-free number we have set up for you, 866-963-6127, or contact your insurance company.
PROSPECTUS/PROXY STATEMENT
March , 2011
| | |
| Acquisition of the assets of: | | By and in exchange for shares of: |
| |
DWS Health Care VIP, a series of DWS Variable Series I and/or DWS Technology VIP, a series of DWS Variable Series II 345 Park Avenue New York, NY 10154 800-778-1482 | | DWS Capital Growth VIP, a series of DWS Variable Series I 345 Park Avenue New York, NY 10154 800-778-1482 |
This Prospectus/Proxy Statement is furnished in connection with two proposals: (i) the proposed merger of DWS Health Care VIP (“Health Care”) into DWS Capital Growth VIP (“Capital Growth”) and (ii) the proposed merger of DWS Technology VIP (“Technology” and, together with Health Care, the “Acquired Funds”) into Capital Growth. As a result of the proposed mergers, each Acquired Fund shareholder will receive a number of full and fractional shares of the corresponding class of Capital Growth equal in value as of the Valuation Time (as defined below on page ) to the total value of such shareholder’s Acquired Fund shares. Each Acquired Fund’s shareholders will vote separately on the merger of their Acquired Fund into Capital Growth, with each merger being separate and distinct from the other. The merger of one Acquired Fund into Capital Growth is not contingent upon the approval of the other Acquired Fund’s shareholders.
The following table identifies the fund whose shareholders are entitled to vote on each proposal:
| | | | |
| | | | | Proposal |
| | | |
| Fund | | Approval of Proposed Merger of
Health Care into Capital Growth | | Approval of Proposed Merger of
Technology into Capital Growth |
Health Care | | X | | |
Technology | �� | | | X |
Shares of the Acquired Funds are available exclusively as a funding vehicle for variable life insurance policies and variable annuity contracts (each a “Contract”) offered by the separate accounts, or sub-accounts thereof, of certain life insurance companies (“Participating Insurance Companies”). The Participating Insurance Companies own shares of the Acquired Funds as depositors for the owners of their respective Contracts (each a “Contract Owner”). Thus, individual Contract Owners are not the “shareholders” of the Acquired Funds. Rather, the Participating Insurance Companies and their separate accounts are the shareholders of record. (Depending on the context, references to “you” or “your” herein refer to the Contract Owner and/or to the Participating Insurance Company separate accounts.) To the extent required to be consistent with the interpretations of voting requirements by the staff of the Securities and Exchange Commission (“SEC”), each Participating Insurance Company will offer to Contract Owners the opportunity to instruct it as to how it should vote shares held by it and the separate accounts on the proposed mergers. This Prospectus/Proxy Statement is, therefore, furnished to Contract Owners entitled to give voting instructions with regard to the Acquired Funds. All persons entitled to direct the voting of shares of an Acquired Fund, whether or not they are shareholders, are described as voting for purposes of this Prospectus/Proxy Statement. This Prospectus/Proxy Statement, the Notice of Special Meetings of Shareholders and the proxy card or voting instruction form are first being mailed to shareholders and Contract Owners on or about March , 2011, or as soon as practicable thereafter. The Prospectus/Proxy Statement explains concisely what you should know before voting on the matter described herein or investing in Capital Growth, a diversified series of an open-end management investment company. Please read it carefully and keep it for future reference.
The securities offered by this Prospectus/Proxy Statement have not been approved or disapproved by the SEC, nor has the SEC passed upon the accuracy or adequacy of this Prospectus/Proxy Statement. Any representation to the contrary is a criminal offense.
1
The following documents have been filed with the SEC and are incorporated into this Prospectus/Proxy Statement by reference:
| | (i) | the prospectus of Capital Growth, dated May 1, 2010, as supplemented from time to time, relating to Class A shares (File No. 811-04257), a copy of which, if applicable, is included with this Prospectus/Proxy Statement; |
| | (ii) | the prospectus of Capital Growth, dated May 1, 2010, as supplemented from time to time, relating to Class B shares (File No. 811-04257), a copy of which, if applicable, is included with this Prospectus/Proxy Statement; |
| | (iii) | the prospectus of Health Care, dated May 1, 2010, as supplemented from time to time, relating to Class A shares (File No. 811-04257); |
| | (iv) | the prospectus of Health Care, dated May 1, 2010, as supplemented from time to time, relating to Class B shares (File No. 811-04257); |
| | (v) | the prospectus of Technology, dated May 1, 2010, as supplemented from time to time, relating to Class A shares (File No. 811-05002); |
| | (vi) | the prospectus of Technology, dated May 1, 2010, as supplemented from time to time, relating to Class B shares (File No. 811-05002); |
| | (vii) | the statement of additional information of Health Care, dated May 1, 2010, as revised May 10, 2010, and as supplemented from time to time, relating to Class A and Class B shares (File No. 811-04257); |
| | (viii) | the statement of additional information of Technology, dated May 1, 2010, as revised October 4, 2010, and as supplemented from time to time, relating to Class A and Class B shares (File No. 811-05002); |
| | (ix) | the statement of additional information relating to the proposed mergers, dated , 2011 (the “Merger SAI”); and |
| | (x) | the financial statements and related reports of the independent registered public accounting firm included in the Annual Report to Shareholders for the fiscal year ended December 31, 2010 for each of Health Care (File No. 811-04257) and Technology (File No. 811-05002). |
Except as noted below, no other parts of either of Health Care or Technology’s Annual Report are incorporated by reference herein.
The financial highlights for Capital Growth and for each of the Acquired Funds contained in each fund’s Annual Report for the period ended December 31, 2010, are attached to this Prospectus/Proxy Statement as Appendix C.
You may get free copies of the funds’ annual reports, semi-annual reports, prospectuses, statements of additional information and/or the Merger SAI, request other information about a fund, or make shareholder inquiries, by contacting your insurance company or by calling the corresponding fund at 1-800-728-3337.
Like shares of the Acquired Funds, shares of Capital Growth are not deposits or obligations of, or guaranteed or endorsed by, any financial institution, are not insured by the Federal Deposit Insurance Corporation, the Federal Reserve Board or any other agency, and involve risk, including the possible loss of the principal amount invested.
This document is designed to give you the information you need to vote on the proposals listed in the Notice of Special Meetings of Shareholders. Much of the information is required disclosure under rules of the SEC; some of it is technical. If there is anything you don’t understand, please contact Computershare Fund Services, Inc., information agent for the Acquired Funds, at 866-963-6127, or contact your insurance company.
2
Capital Growth, Health Care and Technology are subject to the informational requirements of the Securities Exchange Act of 1934, as amended, and in accordance therewith file reports and other information with the SEC. You may review and copy information about the funds, including prospectuses and statements of additional information, at the SEC’s public reference room at 100 F Street, N.E., Washington, D.C. You may call the SEC at 1-202-551-8090 for information about the operation of the public reference room. You may obtain copies of this information, with payment of a duplication fee, by electronic request at the following e-mail address: publicinfo@sec.gov, or by writing the Public Reference Branch, Office of Consumer Affairs and Information Services, Securities and Exchange Commission, Washington, D.C. 20549. You may also access reports and other information about the funds on the EDGAR database on the SEC’s Internet site at http://www.sec.gov.
I. SYNOPSIS
The responses to the questions that follow provide an overview of key points typically of concern to shareholders and Contract Owners considering a proposed merger between mutual funds. These responses are qualified in their entirety by the remainder of this Prospectus/Proxy Statement, which you should read carefully because it contains additional information and further details regarding the proposed mergers.
1. What is being proposed?
The Boards of Health Care and Technology are recommending that shareholders approve the transactions contemplated by the Agreements and Plans of Reorganization (as described below in Part IV and the form of which is attached hereto as Appendix B), which we refer to herein as a merger of each Acquired Fund into Capital Growth. If approved by shareholders of your Acquired Fund, all of the assets of your Acquired Fund will be transferred to Capital Growth solely in exchange for (a) the issuance and delivery to your Acquired Fund of Class A and Class B shares of Capital Growth (“Merger Shares”) with a value equal to the value of your Acquired Fund’s assets net of liabilities, and (b) the assumption by Capital Growth of all the liabilities of your Acquired Fund. Immediately following the merger, the appropriate class of Merger Shares received by your Acquired Fund will be distributed pro rata, on a tax-free basis for federal income tax purposes, to each of its shareholders of record.
2. What will happen to my investment in my Acquired Fund as a result of the merger?
Your investment in your Acquired Fund will, in effect, be exchanged for an investment in the same share class of Capital Growth with an equal aggregate net asset value as of the Valuation Time (as defined below on page ).
3. Why have the Boards of the Trusts recommended that shareholders approve the merger?
DWS Investments advised the Boards that it believes that the proposed mergers are in the best interests of Health Care and Technology for several reasons. In light of the decline of asset flows into actively managed “sector” funds such as Health Care and Technology, DWS Investments advised the Boards that Health Care and Technology have limited opportunities to attract new investments. As a result, Health Care and Technology are facing the likely prospect, over time, of declining assets and minimal opportunities to reduce costs through economies of scale. Given these considerations, and in order to provide shareholders with continuity of investment within the DWS fund family, DWS Investments believes that a merger into Capital Growth is the best alternative for shareholders of Health Care and Technology. In determining to recommend that shareholders of Health Care and Technology approve the mergers, the Boards considered, among others, the following factors:
| | • | | The mergers would help to protect shareholders of Health Care and Technology from the cost increases associated with small, declining asset bases, and provide continuity of investment within the DWS fund family, including access to DWS Investments’ U.S. equity investment expertise; |
3
| | • | | The effective advisory fees paid by the combined fund will be lower at all asset levels as compared to the advisory fees paid by Health Care and Technology; |
| | • | | The estimated total operating expense ratios of each class of shares of the combined fund are lower than the current total operating expense ratios of the corresponding classes of Health Care and Technology; |
| | • | | Similarities and differences between Health Care’s and Technology’s investment objectives, policies and restrictions relative to those of Capital Growth. The Acquired Funds and Capital Growth have similar investment objectives and strategies, as they each seek to achieve growth of capital by investing primarily in growth-oriented U.S. equity securities. Even though each of the funds has over 90% of its assets invested in U.S. stocks (with over 65% of those investments in large cap growth stocks), there are significant differences in the portfolios of Capital Growth and each Acquired Fund because each Acquired Fund concentrates its investments in a particular economic sector (health care and technology, respectively), while Capital Growth invests in a broad range of economic sectors; and |
| | • | | The commitment by Deutsche Investment Management Americas Inc. (“DIMA”), each fund’s investment advisor, to cap certain expenses to be incurred by each of Health Care and Technology in connection with the merger. More specifically, DWS Investments has agreed to bear certain types of expenses incurred by Health Care or Technology in connection with the merger to the extent such expenses exceed the expected cost savings to be realized by shareholders of the applicable fund at the time of the merger during the one-year period following the merger (See “Agreement and Plan of Reorganization” below for additional information regarding this cap). |
Based on the foregoing: (1) the Board of Health Care concluded that the merger of Health Care into Capital Growth is in the best interests of Health Care, and that the interests of the existing shareholders of Health Care will not be diluted as a result of the merger; and (2) the Board of Technology concluded that the merger of Technology into Capital Growth is in the best interests of Technology, and that the interests of the existing shareholders of Technology will not be diluted as a result of the merger. Accordingly, the Trustees unanimously recommend that shareholders of Health Care and Technology approve the Agreement (as defined on page ). For a complete discussion of the Boards’ considerations please see “Background and Boards’ Considerations Relating to the Proposed Mergers” below.
4. How do the investment goals, policies and restrictions of the funds compare?
The funds’ investment goals are similar — each fund seeks growth of capital (Health Care and Capital Growth seek long-term growth of capital, while Technology’s investment objective is growth of capital). Each fund seeks to achieve its objective mainly through investment in equity securities, primarily common stocks, though the specific focus of each fund’s investment portfolio differs. Capital Growth normally invests at least 65% of total assets in equities, mainly common stocks of US companies. Capital Growth generally focuses on established companies that are similar in size to the companies in the S&P 500® Index or the Russell 1000® Growth Index. Although Capital Growth can invest in companies of any size, the fund intends to invest primarily in companies whose market capitalizations fall within the normal range of these indexes. Capital Growth may also invest in other types of equity securities such as preferred stocks or convertible securities. Health Care, under normal circumstances, invests at least 80% of total assets, plus the amount of any borrowing for investment purposes, in common stock of companies in the health care sector. For purposes of the fund’s 80% investment policy, to be considered part of the health care sector, companies must commit at least half of their assets to, or derive at least half of the revenues or net income from, that sector. Health Care invests primarily in securities of US companies, but may invest in foreign companies as well. Health Care may invest in companies of any market capitalization. Technology, under normal circumstances, invests at least 80% of net assets, plus the amount of any borrowings for investment purposes, in common stocks of companies in the technology sector. For purposes of the fund’s 80% investment policy, the fund defines a company as being in the technology sector if it commits at least half its assets to, or derives at least half its revenues or net income from, that sector.
4
Technology may invest in companies of any size and may invest in initial public offerings. While Technology invests mainly in US stocks, it could invest up to 35% of net assets in foreign securities (including emerging markets securities). Technology’s equity investments are mainly common stocks, but may also include other types of equities such as preferred stocks or convertible securities. Please see Part II — Investment Strategies and Risk Factors, below, for a more detailed comparison of each Fund’s investment policies and restrictions.
The following two tables set forth a summary of the composition of each fund’s investment portfolio as of December 31, 2010, and DWS Investments’ estimation of the portfolio composition of Capital Growth assuming consummation of the proposed mergers.
Sector Diversification (as a % of common stocks)
| | | | | | | | | | | | |
| | | Health Care | | | Technology | | | Capital Growth | |
Information Technology | | | — | | | | 97 | % | | | 31 | % |
Consumer Discretionary | | | — | | | | 3 | % | | | 16 | % |
Industrials | | | — | | | | — | | | | 14 | % |
Energy | | | — | | | | — | | | | 12 | % |
Health Care | | | 100 | % | | | — | | | | 10 | % |
Materials | | | — | | | | — | | | | 6 | % |
Consumer Staples | | | — | | | | — | | | | 5 | % |
Financials | | | — | | | | — | | | | 5 | % |
Telecommunication Services | | | — | | | | — | | | | 1 | % |
Total | | | 100.0 | % | | | 100.0 | % | | | 100.0 | % |
| | | | | | | | | | | | |
| | | Capital Growth —
Estimated(1) (assuming
consummation of
Health Care merger) | | | Capital Growth —
Estimated(1) (assuming
consummation of
Technology merger) | | | Capital Growth —
Estimated(1) (assuming
consummation of both
mergers) | |
Information Technology | | | 31 | % | | | 31 | % | | | 31 | % |
Consumer Discretionary | | | 16 | % | | | 16 | % | | | 16 | % |
Industrials | | | 14 | % | | | 14 | % | | | 14 | % |
Energy | | | 12 | % | | | 12 | % | | | 12 | % |
Health Care | | | 10 | % | | | 10 | % | | | 10 | % |
Materials | | | 6 | % | | | 6 | % | | | 6 | % |
Consumer Staples | | | 5 | % | | | 5 | % | | | 5 | % |
Financials | | | 5 | % | | | 5 | % | | | 5 | % |
Telecommunication Services | | | 1 | % | | | 1 | % | | | 1 | % |
Total | | | 100.0 | % | | | 100.0 | % | | | 100.0 | % |
| (1) | Reflects DWS Investments’ estimation of the portfolio composition of Capital Growth subsequent to the mergers, taking into account that prior to the mergers, pursuant to each Agreement and Plan of Reorganization, a significant portion of the portfolio of each Acquired Fund will be liquidated and the proceeds will be used to acquire other securities consistent with the investment objective, policies, restrictions and strategies of Capital Growth. There can be no assurance as to the actual portfolio composition of Capital Growth subsequent to the mergers. |
5. How do the management fees and expense ratios of the two funds compare?
The following tables summarize the fees and expenses an investor may pay when investing in the funds, the expenses that each fund incurred during its fiscal year ended December 31, 2010 and the pro forma estimated expense ratios of Capital Growth assuming consummation of the mergers as of that date. The information below does not reflect charges and fees associated with separate accounts that invest in the funds and any Contract for which the funds are investment options. These charges and fees will increase expenses.
5
As shown below, the mergers are expected to result in lower management fee ratios and lower total expense ratios for shareholders of each Acquired Fund. However, there can be no assurance that the mergers will result in expense savings.
| | | | |
Shareholder Fees (paid directly from your investment) | | | None | |
| | | | |
Management Fee Schedule (expressed as a percentage of net assets) —
Capital Growth (Pre- and Post-Merger) | | | |
First $250 million | | | 0.390 | % |
Next $750 million | | | 0.365 | % |
Thereafter | | | 0.340 | % |
| | | | |
Management Fee Schedule (expressed as a percentage of net assets) —
Health Care | | | |
First $250 million | | | 0.665 | % |
Next $750 million | | | 0.640 | % |
Next $1.5 billion | | | 0.615 | % |
Next $2.5 billion | | | 0.595 | % |
Next $2.5 billion | | | 0.565 | % |
Next $2.5 billion | | | 0.555 | % |
Next $2.5 billion | | | 0.545 | % |
Thereafter | | | 0.535 | % |
| | | | |
Management Fee Schedule (expressed as a percentage of net assets) —
Technology | | | |
First $250 million | | | 0.665 | % |
Next $750 million | | | 0.635 | % |
Next $1.5 billion | | | 0.615 | % |
Next $2.5 billion | | | 0.595 | % |
Next $2.5 billion | | | 0.565 | % |
Next $2.5 billion | | | 0.555 | % |
Next $2.5 billion | | | 0.545 | % |
Thereafter | | | 0.535 | % |
A discussion regarding the basis for the Board’s approval of each fund’s advisory agreements is contained in each fund’s most recent shareholder report for the annual period ended December 31.
6
The table below describes the fees and expenses paid by each of the funds. As shown below, the mergers are expected to result in lower total expense ratios for each Acquired Fund. However, there can be no assurance that the mergers will result in lower expense ratios. The information set forth below is based on each fund’s average net assets and fees and expenses for the year ended December 31, 2010, and Capital Growth’s post-merger estimated annualized fees and expenses assuming the mergers were consummated on December 31, 2010.
Annual Fund Operating Expenses
(expenses that are deducted from fund assets)
(as a percentage of average net assets)
| | | | | | | | | | | | | | | | |
| | | Management
Fee | | | Distribution/
Service
(12b-1) Fees | | | Other
Expenses | | | Total Annual
Fund
Operating
Expenses | |
Health Care | | | | | | | | | | | | | | | | |
Class A | | | 0.67 | % | | | 0.00 | % | | | 0.23 | % | | | 0.90 | % |
Class B | | | 0.67 | % | | | 0.25 | % | | | 0.33 | % | | | 1.25 | % |
Technology | | | | | | | | | | | | | | | | |
Class A | | | 0.67 | % | | | 0.00 | % | | | 0.26 | % | | | 0.93 | % |
Class B | | | 0.67 | % | | | 0.25 | % | | | 0.37 | % | | | 1.29 | % |
Capital Growth | | | | | | | | | | | | | | | | |
Class A | | | 0.37 | % | | | 0.00 | % | | | 0.14 | % | | | 0.51 | % |
Class B | | | 0.37 | % | | | 0.25 | % | | | 0.23 | % | | | 0.85 | % |
| Capital Growth (Pro forma combined, assuming consummation of Health Care merger)(2) | | | | | | | | | | | | | | | | |
Class A | | | 0.37 | % | | | 0.00 | % | | | 0.14 | %(1) | | | 0.51 | % |
Class B | | | 0.37 | % | | | 0.25 | % | | | 0.23 | %(1) | | | 0.85 | % |
| Capital Growth (Pro forma combined, assuming consummation of Technology merger)(2) | | | | | | | | | | | | | | | | |
Class A | | | 0.37 | % | | | 0.00 | % | | | 0.14 | %(1) | | | 0.51 | % |
Class B | | | 0.37 | % | | | 0.25 | % | | | 0.23 | %(1) | | | 0.85 | % |
| Capital Growth (Pro forma combined, assuming consummation of both mergers)(2) | | | | | | | | | | | | | | | | |
Class A | | | 0.37 | % | | | 0.00 | % | | | 0.14 | %(1) | | | 0.51 | % |
Class B | | | 0.37 | % | | | 0.25 | % | | | 0.23 | %(1) | | | 0.85 | % |
| (1) | Other expenses are estimated, accounting for the effect of the mergers. |
| (2) | Pro forma expenses do not include reorganization costs related to the mergers that will be borne by each Acquired Fund prior to the merger, currently estimated to be $200,000 or 0.40% for Health Care and $225,000 or 0.31% for Technology. |
7
Examples
These examples translate the expenses shown in the preceding table into dollar amounts. By doing this, you can more easily compare the costs of investing in the funds. The examples make certain assumptions. They assume that you invest $10,000 in a fund for the time periods shown and reinvest all dividends and distributions. They also assume a 5% return on your investment each year and that a fund’s operating expenses remain the same (except as described below). The examples are hypothetical; your actual costs and returns may be higher or lower.
| | | | | | | | | | | | | | | | |
| | | 1 Year | | | 3 Years | | | 5 Years | | | 10 Years | |
Health Care | | | | | | | | | | | | | | | | |
Class A shares | | $ | 92 | | | $ | 287 | | | $ | 498 | | | $ | 1,108 | |
Class B shares | | $ | 127 | | | $ | 397 | | | $ | 686 | | | $ | 1,511 | |
Technology | | | | | | | | | | | | | | | | |
Class A shares | | $ | 95 | | | $ | 296 | | | $ | 515 | | | $ | 1,143 | |
Class B shares | | $ | 131 | | | $ | 409 | | | $ | 708 | | | $ | 1,556 | |
Capital Growth | | | | | | | | | | | | | | | | |
Class A shares | | $ | 52 | | | $ | 164 | | | $ | 285 | | | $ | 640 | |
Class B shares | | $ | 87 | | | $ | 271 | | | $ | 471 | | | $ | 1,049 | |
Capital Growth (Pro forma combined, assuming consummation of Health Care merger) | | | | | | | | | | | | | | | | |
Class A shares | | $ | 52 | | | $ | 164 | | | $ | 285 | | | $ | 640 | |
Class B shares | | $ | 87 | | | $ | 271 | | | $ | 471 | | | $ | 1,049 | |
Capital Growth (Pro forma combined, assuming consummation of Technology merger) | | | | | | | | | | | | | | | | |
Class A shares | | $ | 52 | | | $ | 164 | | | $ | 285 | | | $ | 640 | |
Class B shares | | $ | 87 | | | $ | 271 | | | $ | 471 | | | $ | 1,049 | |
Capital Growth (Pro forma combined, assuming consummation of both Health Care and Technology mergers) | | | | | | | | | | | | | | | | |
Class A shares | | $ | 52 | | | $ | 164 | | | $ | 285 | | | $ | 640 | |
Class B shares | | $ | 87 | | | $ | 271 | | | $ | 471 | | | $ | 1,049 | |
6. What are the federal income tax consequences of the proposed mergers?
Each merger is expected to be a tax-free reorganization for federal income tax purposes. Accordingly, no gain or loss is expected to be recognized by either Acquired Fund or by the separate accounts as shareholders of an Acquired Fund as a direct result of its merger. As long as the Contracts qualify as life insurance contracts under Section 7702(a) of the Internal Revenue Code of 1986, as amended, (the “Code”) or annuity contracts under Section 72 of the Code, the mergers, whether or not treated as tax-free reorganizations, will not create any tax liability for Contract Owners. For more information, please see “Information about the Proposed Mergers — Certain Federal Income Tax Consequences” below.
7. Will my dividends be affected by the mergers?
The mergers will not result in a change in dividend policy.
8. Do the procedures for purchasing, redeeming and exchanging shares of the funds differ?
No. The procedures for purchasing and redeeming shares of each fund are identical. Each fund continuously sells shares to Participating Insurance Company separate accounts, without a sales charge, at the net asset value per share next determined after a proper purchase order is placed by a Participating Insurance Company. A Participating Insurance Company offers Contract Owners units in its separate accounts which correspond to
8
shares in the fund. A Participating Insurance Company submits purchase and redemption orders to the fund based on allocation instructions for premium payments, transfer instructions and surrender or partial withdrawal requests for Contract Owners, as set forth in the prospectus for the Participating Insurance Company’s Contracts. These orders reflect the amount of premium payments to be invested, surrender and transfer requests and other matters. Redemption orders are effected at the next net asset value per share determined after a proper redemption order is placed by a Participating Insurance Company. Contract Owners should refer to their Contract prospectuses for redemption procedures and fees.
9. How will I be notified of the outcome of the merger of my Acquired Fund?
If the proposed merger of your Acquired Fund is approved by shareholders, shareholders whose accounts are affected by the merger (i.e., Participating Insurance Companies) will receive a confirmation statement reflecting their new account number, if applicable, and the number of shares of Capital Growth they have received. Subsequently, affected Contract Owners will be notified of changes to their account information by their respective Participating Insurance Companies. If the proposed merger of your Acquired Fund is not approved, this result will be noted in the next shareholder report of your fund.
10. Will the value of my investment change?
The number of shares owned by each Participating Insurance Company will most likely change. However, the total value of your investment in Capital Growth will equal the total value of your investment in your Acquired Fund at the Valuation Time (as defined below on page ). Even though the net asset value per share of each fund is likely to be different, the total value of your holdings will not change as a result of the mergers.
11. What vote is required to approve the merger?
Approval of each merger will require the affirmative vote of the shareholders of the applicable Acquired Fund entitled to vote more than fifty percent (50%) of the votes entitled to be cast on the matter at the special meeting.
The Board believes that each proposed merger is in the best interests of the applicable Acquired Fund. Accordingly, the Board recommends that shareholders vote FOR approval of the proposed mergers.
II. INVESTMENT STRATEGIES AND RISK FACTORS
What are the main investment strategies and related risks of Capital Growth, and how do they compare with those of the Acquired Funds?
Investment Objectives and Strategies. Capital Growth and Health Care seek long-term growth of capital, while Technology’s investment objective is growth of capital. All of the funds invest mainly in equity securities, primarily common stocks, though the specific focus of each fund’s investment portfolio differs. Capital Growth normally invests at least 65% of total assets in equities, mainly common stocks of US companies. The fund generally focuses on established companies that are similar in size to the companies in the S&P 500® Index (generally 500 of the largest companies in the US) or the Russell 1000® Growth Index (generally those stocks among the 1,000 largest US companies that have above-average price-to-earnings ratios). Although Capital Growth can invest in companies of any size, the fund intends to invest primarily in companies whose market capitalizations fall within the normal range of these indexes. Capital Growth may also invest in other types of equity securities such as preferred stocks or convertible securities. Health Care, under normal circumstances, invests at least 80% of total assets, plus the amount of any borrowing for investment purposes, in common stock of companies in the health care sector. For purposes of the fund’s 80% investment policy, to be considered part
9
of the health care sector, companies must commit at least half of their assets to, or derive at least half of the revenues or net income from, that sector. Examples of industries in the health care sector include pharmaceuticals, biotechnology, medical products and supplies, and health care services. Health Care invests primarily in securities of US companies, but may invest in foreign companies as well. Health Care may invest in companies of any market capitalization. Technology, under normal circumstances, invests at least 80% of net assets, plus the amount of any borrowings for investment purposes, in common stocks of companies in the technology sector. For purposes of the fund’s 80% investment policy, the fund defines a company as being in the technology sector if it commits at least half its assets to, or derives at least half its revenues or net income from, that sector. Examples of industries within the technology sector are semiconductors, software, telecom equipment, computer/hardware, IT services, the Internet and health technology. Technology may invest in companies of any size and may invest in initial public offerings. While Technology invests mainly in US stocks, it could invest up to 35% of net assets in foreign securities (including emerging markets securities). Technology’s equity investments are mainly common stocks, but may also include other types of equities such as preferred stocks or convertible securities.
Each fund may use various types of derivatives (contracts whose value is based on, for example, indices, currencies or securities) for hedging, risk management or non-hedging purposes to seek to enhance potential gains. The funds may use derivatives as a substitute for direct investment in a particular asset class or to keep cash on hand to meet shareholder redemptions or other needs. Capital Growth may use futures and options, and write covered call options. Technology may also use futures and options, including sales of covered put and call options. Each fund may lend securities (up to one third of total assets) to approved institutions.
In choosing stocks, portfolio management for Capital Growth begins by utilizing a proprietary quantitative model to rank stocks based on a number of factors including valuation and profitability. Portfolio management also applies fundamental techniques to seek to identify companies that display above-average earnings growth compared to other companies and that have strong product lines, effective management and leadership positions within core markets. The factors considered and models used by the portfolio managers may change over time. Portfolio management will normally sell a security when it believes the potential risks have increased, its price is unlikely to go higher, its fundamental factors have changed, other investments offer better opportunities or in the course of adjusting the fund’s emphasis on a given industry.
In choosing stocks, portfolio management of Health Care uses a combination of three analytical disciplines: (1) Bottom-up research — Portfolio management looks for individual companies with a history of above-average growth, strong competitive positioning, new tests or treatments, the ability to take advantage of demographic trends, attractive prices relative to potential growth, sound financial strength and effective management, among other factors; (2) Growth orientation — Portfolio management generally looks for companies that it believes have above-average potential for sustainable growth of revenue or earnings and whose market value appears reasonable in light of their business prospects; and (3) Top-down analysis — Portfolio management considers the economic outlook for various industries within the health care sector while looking for those that it believes may benefit from changes in the overall business environment. Portfolio management may favor securities from different industries and companies within the health care sector at different times. Portfolio management will normally sell a stock when it believes the stock’s price is unlikely to go higher, its fundamental factors have changed, other investments offer better opportunities, or in the course of adjusting their emphasis on a given health care industry.
In choosing securities, portfolio management of Technology also uses a combination of three analytical disciplines: (1) Bottom-up research — Portfolio management looks for individual companies with a history of above-average growth, strong competitive positioning, attractive prices relative to potential growth, innovative products and services, sound financial strength and effective management, among other factors; (2) Growth orientation — Portfolio management generally looks for companies that they believe have above-average potential for sustainable growth of revenue or earnings and whose market value appears reasonable in light of their business prospects; and (3) Top-down analysis — Portfolio management considers the economic outlooks
10
for various industries within the technology sector and looks for those that may benefit from changes in the overall business environment. In addition, portfolio management uses quantitative analytic tools to attempt to manage the price volatility of the fund as compared to appropriate benchmarks and peer groups. Portfolio management may favor securities from various industries and companies within the technology sector at different times. Portfolio management will normally sell a stock when they believe its price is unlikely to go higher, its fundamentals have changed, other investments offer better opportunities, or in adjusting their emphasis on a given technology industry.
Although major changes tend to be infrequent, each fund’s Board could change the fund’s investment objective without seeking shareholder approval. However, in the case of Health Care or Technology, the Board will provide shareholders with at least 60 days’ notice prior to making any changes to the fund’s 80% investment policy.
When in the opinion of portfolio management it is advisable to adopt a temporary defensive position because of unusual and adverse or other market conditions, up to 100% of each fund’s assets may be held in cash or invested in money market securities or other short-term investments. Short-term investments consist of (1) foreign and domestic obligations of sovereign governments and their agencies and instrumentalities, authorities and political subdivisions; (2) other short-term rated debt securities or, if unrated, determined to be of comparable quality in the opinion of portfolio management; (3) commercial paper; (4) bank obligations, including negotiable certificates of deposit, time deposits and bankers’ acceptances; and (5) repurchase agreements. Short-term investments may also include shares of money market mutual funds. This could prevent losses, but, while engaged in a temporary defensive position, the fund will not be pursuing its investment objective. However, portfolio management may choose not to use these strategies for various reasons, even in volatile market conditions.
Although DWS Investments believes that Capital Growth should provide a comparable investment opportunity for shareholders of Health Care and of Technology, there are a number of significant differences in the portfolios of each Acquired Fund and Capital Growth. Each Acquired Fund concentrates its investments in a particular economic sector (health care and technology, respectively), while Capital Growth invests in a broad range of economic sectors. DWS Investments has estimated that approximately 90% and 70% of the portfolios of Health Care and Technology, respectively, will be liquidated prior to each merger. Proceeds from the liquidation will be reinvested in other securities so that upon the merger, the combined fund will remain invested primarily in growth-oriented U.S. equity securities across a broad range of economic sectors.
For a more detailed description of the investment techniques used by Capital Growth, Health Care and Technology, please see the applicable fund’s prospectuses and statement of additional information.
Primary Risks. As with any investment, you may lose money by investing in Capital Growth. Certain risks associated with an investment in Capital Growth are summarized below. Subject to certain exceptions, the risks of an investment in Capital Growth are similar to the risks of an investment in Health Care or Technology. More detailed descriptions of the risks associated with an investment in Capital Growth can be found in the Capital Growth prospectuses and statement of additional information.
Stock market risk. When stock prices fall, you should expect the value of your investment to fall as well. Stock prices can be hurt by poor management on the part of the stock’s issuer, shrinking product demand and other business risks. These may affect single companies as well as groups of companies. In addition, movements in financial markets may adversely affect a stock’s price, regardless of how well the company performs. To the extent the fund invests in a particular capitalization or market sector, the fund’s performance may be proportionately affected by that segment’s general performance. An investment in Health Care or Technology is also subject to this risk.
Growth investing risk. As a category, growth stocks may underperform value stocks (and the stock market as a whole) over any period of time. Because the prices of growth stocks are based largely on the expectation of
11
future earnings, growth stock prices can decline rapidly and significantly in reaction to negative news about such factors as earnings, the economy, political developments, or other news. A growth company may fail to fulfill apparent promise or may be eclipsed by competitors or its products or services rendered obsolete by new technologies. Growth stocks also typically lack the dividends associated with value stocks that might otherwise cushion investors from the effects of declining stock prices. In addition, growth stocks selected for investment by portfolio management may not perform as anticipated. An investment in Health Care or Technology is also subject to this risk.
Focus risk. To the extent that the fund focuses its investments in particular industries, asset classes or sectors of the economy, any market price movements, regulatory or technological changes, or economic conditions affecting companies in those industries, asset classes or sectors will have a significant impact on the fund’s performance. For example, consumer goods companies could be hurt by a rise in unemployment or technology companies could be hurt by such factors as market saturation, price competition and rapid product obsolescence. An investment in Health Care or Technology is subject to a similar risk due to the concentration of investments in the health care or technology sectors, respectively.
Security selection risk. The securities in the fund’s portfolio may decline in value. Portfolio management could be wrong in its analysis of industries, companies, economic trends, the relative attractiveness of different securities or other matters. An investment in Health Care or Technology is also subject to this risk.
Securities lending risk. Any decline in the value of a portfolio security that occurs while the security is out on loan is borne by the fund, and will adversely affect performance. Also, there may be delays in recovery of securities loaned or even a loss of rights in the collateral should the borrower of the securities fail financially while holding the security. An investment in Health Care or Technology is also subject to this risk.
Derivatives risk. Risks associated with derivatives include the risk that the derivative is not well correlated with the security, index or currency to which it relates; the risk that derivatives may result in losses or missed opportunities; the risk that the fund will be unable to sell the derivative because of an illiquid secondary market; the risk that a counterparty is unwilling or unable to meet its obligation; and the risk that the derivative transaction could expose the fund to the effects of leverage, which could increase the fund’s exposure to the market and magnify potential losses. There is no guarantee that derivatives, to the extent employed, will have the intended effect, and their use could cause lower returns or even losses to the fund. The use of derivatives by the fund to hedge risk may reduce the opportunity for gain by offsetting the positive effect of favorable price movements. An investment in Health Care or Technology is also subject to this risk.
Foreign investment risk. To the extent the fund invests in companies based outside the US, it faces the risks inherent in foreign investing. Adverse political, economic or social developments could undermine the value of the fund’s investments or prevent the fund from realizing their full value. Financial reporting standards for companies based in foreign markets differ from those in the US. Additionally, foreign securities markets generally are smaller and less liquid than US markets. To the extent that the fund invests in non-US dollar denominated foreign securities, changes in currency exchange rates may affect the US dollar value of foreign securities or the income or gain received on these securities. Foreign governments may restrict investment by foreigners, limit withdrawal of trading profit or currency from the country, restrict currency exchange or seize foreign investments. The investments of the fund may also be subject to foreign withholding taxes. Foreign transactions and custody of assets may involve delays in payment, delivery or recovery of money or investments. An investment in Health Care or Technology is also subject to this risk, with increased risk for Technology to the extent that investments may be made in emerging markets to a greater extent than for Capital Growth or Health Care. Foreign investment risks are greater in emerging markets than in developed markets. Emerging market investments are often considered speculative. Emerging market countries typically have economic and political systems that are less developed, and can be expected to be less stable than developed markets. For example, the economies of such countries can be subject to rapid and unpredictable rates of inflation or deflation.
12
Counterparty risk. A financial institution or other counterparty with whom the fund does business (such as trading or securities lending), or that underwrites, distributes or guarantees any investments or contracts that the fund owns or is otherwise exposed to, may decline in financial health and become unable to honor its commitments. This could cause losses for the fund or could delay the return or delivery of collateral or other assets to the fund. An investment in Health Care or Technology is also subject to this risk.
Liquidity risk. In certain situations, it may be difficult or impossible to sell an investment in an orderly fashion at an acceptable price. This risk can be ongoing for any security that does not trade actively or in large volumes, for any security that trades primarily on smaller markets, and for investments that typically trade only among a limited number of large investors (such as certain types of derivatives or restricted securities). In unusual market conditions, even normally liquid securities may be affected by a degree of liquidity risk. This may affect only certain securities or an overall securities market. An investment in Health Care or Technology is also subject to this risk.
Pricing risk. If market conditions make it difficult to value some investments, the fund may value these investments using more subjective methods, such as fair value pricing. In such cases, the value determined for an investment could be different than the value realized upon such investment’s sale. As a result, you could pay more than the market value when buying fund shares or receive less than the market value when selling fund shares. An investment in Health Care or Technology is also subject to this risk.
Health Care and Technology are also subject to the following risks:
Concentration risk. Any fund that concentrates in a particular segment of the market will generally be more volatile than a fund that invests more broadly. In the case of Health Care, because the fund concentrates its investments in companies in the health care field, it may be vulnerable to setbacks in that industry. In the case of Technology, any market price movements, regulatory or technological changes, or economic conditions affecting technology companies will have a significant impact on the fund’s performance.
Small company risk. Small company stocks tend to be more volatile than large company stocks. Small companies are less widely followed by stock analysts and less information about them is available to investors. Industry-wide reversals may have a greater impact on small companies, since they lack the financial resources of larger companies. Small company stocks are typically less liquid than large company stocks.
Technology is also subject to the following risks:
Non-diversification risk. The fund is classified as non-diversified under the Investment Company Act of 1940, as amended (the “1940 Act”). This means that the fund may invest in securities of relatively few issuers. Thus, the performance of one or a small number of portfolio holdings can affect overall performance.
IPO risk. Prices of securities bought in an initial public offering (IPO) may rise and fall rapidly, often because of investor perceptions rather than economic reasons. IPOs can have more impact on the performance of a small mutual fund because the number of IPO shares the fund is able to buy may represent a significant portion of its overall portfolio compared to the portfolio of a larger fund.
Performance Information
The following information provides some indication of the risks of investing in each fund. Of course, a fund’s past performance is not an indication of future performance.
The information shown below does not reflect charges and fees associated with the separate accounts that invest in the funds or any Contract for which the funds are investment options. If it did, performance would be less than that shown. The bar charts show year-to-year changes in the performance of each fund’s Class A shares, which
13
may give some idea of risk. The table following the bar charts shows how each fund’s performance compares to that of one or more broad-based market indices (which, unlike a fund, do not have any fees or expenses). All performance figures below assume that dividends were reinvested.
Calendar Year Total Returns (%)
Capital Growth — Class A Shares

For the periods included in the bar chart:
| | |
Best Quarter: 15.13%, Q4 2001 | | Worst Quarter: -21.49%, Q4 2008 |
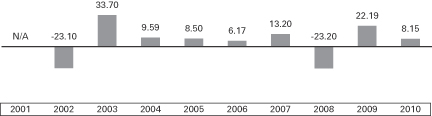
Health Care — Class A Shares
For the periods included in the bar chart:
| | |
Best Quarter: 15.08%, Q2 2003 | | Worst Quarter: -16.45%, Q4 2008 |
14
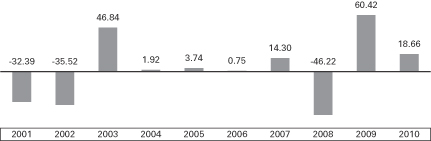
Technology — Class A Shares
For the periods included in the bar chart:
| | |
Best Quarter: 28.57%, Q4 2001 | | Worst Quarter: -33.64%, Q3 2001 |
Average Annual Total Returns
(for period ended December 31, 2010)
| | | | | | | | | | | | |
| | | Past 1 year | | | Past 5 years | | | Past 10 Years | |
Capital Growth | | | | | | | | | | | | |
Class A | | | 16.71 | % | | | 3.93 | % | | | 0.33 | % |
Class B | | | 16.33 | % | | | 3.59 | % | | | -0.01 | % |
Russell 1000 Growth Index (reflects no deductions for fees or expenses) | | | 16.71 | % | | | 3.75 | % | | | 0.02 | % |
Russell 1000® Growth Index is an unmanaged index that consists of those stocks in the Russell 1000® Index that have higher price-to-book ratios and higher forecasted growth values. Russell 1000® Index is an unmanaged price-only index of the 1,000 largest capitalized companies that are domiciled in the US and whose common stocks are traded.
| | | | | | | | | | | | |
| | | Past 1 year | | | Past 5 years | | | Since Inception | |
Health Care | | | | | | | | | | | | |
Class A (inception date 5/1/01) | | | 8.15 | % | | | 4.05 | % | | | 4.89 | % |
Standard & Poor’s 500 Index (S&P 500) (reflects no deductions for fees or expenses) | | | 15.06 | % | | | 2.29 | % | | | 2.00 | % |
S&P North American Health Care Sector Index (reflects no deductions for fees or expenses) | | | 6.08 | % | | | 2.53 | % | | | 3.12 | % |
Class B (inception date 6/30/02) | | | 7.68 | % | | | 3.68 | % | | | 7.88 | % |
Standard & Poor’s 500 Index (S&P 500) (reflects no deductions for fees or expenses) | | | 15.06 | % | | | 2.29 | % | | | 4.92 | % |
S&P North American Health Care Sector Index (reflects no deductions for fees or expenses) | | | 6.08 | % | | | 2.53 | % | | | 5.76 | % |
Standard & Poor’s 500 Index (S&P 500) is an unmanaged, capitalization-weighted index of 500 stocks. The index is designed to measure performance of the broad domestic economy through changes in the aggregate market value of 500 stocks representing all major industries.
15
S&P North American Health Care Sector Index is an unmanaged, market-capitalization-weighted index of 114 stocks designed to measure the performance of companies in the health care sector. DIMA believes this additional index represents the fund’s overall investment process. Index comparisons begin on 4/30/01.
| | | | | | | | | | | | | | | | |
| | | Past 1 year | | | Past 5 years | | | Past 10 years | | | Since
Inception | |
Technology | | | | | | | | | | | | | | | | |
Class A | | | 18.66 | % | | | 3.35 | % | | | -2.25 | % | | | — | |
Russell 1000 Growth Index (reflects no deductions for fees or expenses) | | | 16.71 | % | | | 3.75 | % | | | 0.02 | % | | | — | |
S&P North American Technology Sector Index (reflects no deductions for fees or expenses) | | | 12.65 | % | | | 5.83 | % | | | -0.86 | % | | | — | |
Class B (inception date 6/30/02) | | | 17.96 | % | | | 2.93 | %% | | | — | | | | 6.34 | % |
Russell 1000 Growth Index (reflects no deductions for fees or expenses) | | | 16.71 | % | | | 3.75 | % | | | — | | | | 5.60 | % |
S&P North American Technology Sector Index (reflects no deductions for fees or expenses) | | | 12.65 | % | | | 5.83 | % | | | — | | | | 7.94 | % |
Russell 1000® Growth Index is an unmanaged index that consists of those stocks in the Russell 1000® Index that have higher price-to-book ratios and higher forecasted growth values. Russell 1000® Index is an unmanaged price-only index of the 1,000 largest capitalized companies that are domiciled in the US and whose common stocks are traded.
S&P North American Technology Sector Index is an unmanaged, capitalization-weighted index based on a universe of technology-related stocks. DIMA believes this additional index represents the fund’s overall investment process.
Current performance may be higher or lower than the performance data quoted above. For more recent performance information, contact your insurance company.
III. OTHER INFORMATION ABOUT THE FUNDS
Investment Advisor. DIMA, with headquarters at 345 Park Avenue, New York, NY 10154, serves as each fund’s investment advisor, pursuant to an investment management agreement with the fund. Under the oversight of the Board of each fund, DIMA provides continuing investment management of the assets of each fund in accordance with the fund’s investment objective(s), policies and restrictions. DIMA also provides administrative services to each fund pursuant to an administrative services agreement. DIMA is an indirect, wholly owned subsidiary of Deutsche Bank AG. Deutsche Bank AG is a major global banking institution that is engaged in a wide range of financial services, including investment management, mutual funds, retail, private and commercial banking, investment banking and insurance. DIMA provides a full range of global investment advisory services to institutional and retail clients.
DWS Investments is part of the Asset Management division of Deutsche Bank AG and, within the US, represents the retail asset management activities of Deutsche Bank AG, Deutsche Bank Trust Company Americas, DIMA and DWS Trust Company. DWS Investments is a global asset management organization that offers a wide range of investing expertise and resources, including hundreds of portfolio managers and analysts and an office network that reaches the world’s major investment centers. This well-resourced global investment platform brings together a wide variety of experience and investment insight across industries, regions, asset classes and investing styles.
DIMA may utilize the resources of its global investment platform to provide investment management services through branch offices located outside the US. In some cases, DIMA may also utilize its branch offices
16
or affiliates located in the US or outside the US to perform certain services such as trade execution, trade matching and settlement, or various administrative, back-office or other services. To the extent services are performed outside the US, such activity may be subject to both US and foreign regulation. It is possible that the jurisdiction in which DIMA or its affiliate performs such services may impose restrictions or limitations on portfolio transactions that are different from, and in addition to, those that apply in the US.
Portfolio Managers. Each fund is managed by a team of investment professionals who collaborate to develop and implement each fund’s investment strategy. Each portfolio manager on a team has authority over all aspects of the fund’s investment portfolio, including but not limited to, purchases and sales of individual securities, portfolio construction techniques, portfolio risk assessment and the management of daily cash flows in accordance with portfolio holdings. The following individuals handle the day-to-day management of each fund’s portfolio:
Capital Growth
Owen Fitzpatrick, CFA, Lead Manager of the fund, is a Managing Director of Deutsche Asset Management (“DeAM”). He joined DeAM in 2009 after over 21 years of experience in trust and investment management, most recently as Managing Director of Deutsche Bank Private Wealth Management. Prior to joining Deutsche Bank, Mr. Fitzpatrick managed an equity income fund, trust and advisory relationships for Princeton Bank & Trust Company and served as a portfolio manager at Manufacturer’s Hanover Trust Company. He began managing the fund in 2009.
Thomas M. Hynes, Jr., CFA, Portfolio Manager of the fund, is a Director of DeAM. He joined DeAM in 1995 in DB Private Wealth Management, then served as US equity portfolio manager at Citigroup Asset Management from 2004-2007 before returning to DeAM in 2007. Mr. Hynes began managing the fund in 2009.
Brendan O’Neill, CFA, Portfolio Manager of the fund, is a Director of DeAM. He joined DeAM in 2000 and has served as an equity research analyst covering the financial services sector since 2001. Mr. O’Neill began managing the fund in 2009.
Health Care
Leefin Lai, CFA, Lead Portfolio Manager of the fund, is a Managing Director of DeAM. She joined DeAM in 2001 and previously served as an analyst for Salomon Smith Barney and PaineWebber and as Vice President/Analyst for Citigroup Global Asset Management and Scudder Kemper Investments. Ms. Lai began managing the fund in 2001.
Thomas E. Bucher, CFA, Consultant to the Advisor since 2002, is a Managing Director of DeAM. He joined DeAM in 1995 and has served as head of the global equity research team for the health care sector and portfolio manager for European equity.
Technology
Frederic L. Fayolle, CFA, Lead Portfolio Manager of the fund, is a Director of DeAM. He joined DeAM and the Technology team in July 2000 after 10 years of experience with Philips Electronics in the USA with responsibility for Philips’s CRT display industry research for North America. Mr. Fayolle began managing the fund in 2009.
Clark Chang, Portfolio Manager of the fund, is a Director of DeAM. He joined DeAM in 2007 after seven years of experience as senior analyst for technology sector for Firsthand Capital Management, Nollenberger Capital Partners and Fulcrum Global Partners. Mr. Chang began managing the fund in 2008.
17
Walter Holick, Portfolio Manager of the fund, is a Director of DeAM. He joined DeAM in 1990 as fund manager for global equities: technology, telecommunication services and media. Mr. Holick began managing the fund in 2009.
Each fund’s Statement of Additional Information provides additional information about a portfolio manager’s investments in the funds, a description of the portfolio management compensation structure and information regarding other accounts managed.
Trustees and Officers. Paul K. Freeman (Chair), John W. Ballantine, Henry P. Becton, Jr., Dawn-Marie Driscoll, Keith R. Fox, Kenneth C. Froewiss, Richard J. Herring, William McClayton, Rebecca W. Rimel, William N. Searcy, Jr., Jean Gleason Stromberg and Robert H. Wadsworth serve as Trustees of Health Care, Technology and Capital Growth. The officers of Capital Growth are the same as those of each Acquired Fund.
Independent Registered Public Accounting Firms (“Auditors”). PricewaterhouseCoopers LLP, 125 High Street, Boston, MA 02110, serves as independent registered public accounting firm for Capital Growth and Health Care. Ernst & Young LLP, 200 Clarendon Street, Boston, MA 02116, serves as independent registered public accounting firm for Technology. Each Auditor audits and reports on each relevant fund’s annual financial statements, reviews certain regulatory reports, and performs other professional accounting, auditing, tax and advisory services when engaged to do so by the relevant fund.
Charter Documents.
Each of Capital Growth and Health Care is a series of DWS Variable Series I, a Massachusetts business trust organized under the laws of Massachusetts and is governed by an Amended and Restated Declaration of Trust dated June 2, 2008 (the “Variable Series I Declaration of Trust”). Technology is a series of DWS Variable Series II, a Massachusetts business trust organized under the laws of Massachusetts and is governed by an Amended and Restated Declaration of Trust dated June 2, 2008 (the “Variable Series II Declaration of Trust”). The Variable Series I Declaration of Trust and the Variable Series II Declaration of Trust are referred to herein collectively as the “Declarations of Trust,” and each is referred to herein individually as a “Declaration of Trust.” Additional information about the Declarations of Trust is provided below.
Shares. The Trustees have the authority to create additional funds and to designate the relative rights and preferences as between classes of shares of the funds, if any. The trustees of the Trust may authorize the division of shares of the funds into different classes, which may bear different expenses. All shares issued and outstanding are fully paid and non-assessable (except as set forth below), transferable, have no pre-emptive or conversion rights (except as may be determined by the Board of Trustees) and are redeemable as described in the SAIs and the funds’ prospectuses. Each share has equal rights with each other share of the same class of the funds as to voting, dividends, exchanges, conversion features and liquidation. Shareholders are entitled to one vote for each full share held and fractional votes for fractional shares held. Shares of the funds have noncumulative voting rights with respect to the election of Trustees.
Shareholder Meetings. Capital Growth, Health Care and Technology are generally not required to hold meetings of their shareholders. Under the Declarations of Trust, however, shareholder meetings will be held in connection with the following matters to the extent and as provided in the Declarations of Trust and as required by applicable law: (a) the election or removal of Trustees if a meeting is called for such purpose; (b) the termination of the Trusts; (c) an amendment of the Declarations of Trust; and (d) such additional matters as may be required by law or as the Trustees may determine to be necessary or desirable. Shareholders also vote upon changes in fundamental policies or restrictions. The shareholders shall generally take action by the affirmative vote of the holders of a majority of the shares present in person or by proxy and entitled to vote and voting or voted at a meeting of shareholders at which a quorum is present, except as may be otherwise required by the 1940 Act or the Declarations of Trust. The Declarations of Trust provide that shareholder meeting quorum requirements shall be established in the funds’ By-laws. The By-laws of all three funds currently in effect
18
provide that the presence in person or by proxy of the holders of thirty percent (30%) of the outstanding shares entitled to vote at a meeting (or of an individual series or class if required to vote separately) shall constitute a quorum for the transaction of business at meetings of shareholders of the funds.
On any matter submitted to a vote of shareholders, all shares of the trusts entitled to vote shall, except as otherwise provided in the funds’ By-Laws, be voted in the aggregate as a single class without regard to series or classes of shares, except (a) when required by applicable law or when the Trustees shall have determined that the matter affects one or more series or classes of shares materially differently, shares shall be voted by individual series or class; and (b) when the Trustees have determined that the matter affects only the interests of one or more series or classes, only shareholders of such series or classes shall be entitled to vote thereon.
Shareholder Liability. Under Massachusetts law, shareholders of a Massachusetts business trust could, under certain circumstances, be held personally liable for obligations of a fund. The Declarations of Trust, however, disclaim shareholder liability for acts or obligations of the funds and require that notice of such disclaimer be given in each agreement, obligation, or instrument entered into or executed by the funds. Moreover, the Declarations of Trust provide for indemnification out of the property of the funds for all losses of and expenses reasonably incurred by any shareholder held personally liable for the obligations of the funds (solely by reason of being or having been a shareholder) and the applicable fund may be covered by insurance which the Trustees consider adequate to cover foreseeable claims. Thus, the risk of a shareholder incurring financial loss on account of shareholder liability is considered by the investment advisor remote and not material, since it is limited to circumstances in which a disclaimer is inoperative and the funds themselves are unable to meet their obligations.
Trustee Liability. The Declarations of Trust provide that obligations of the funds are not binding upon the Trustees individually but only upon the property of the funds and that the funds will indemnify their Trustees and officers against liabilities and expenses reasonably incurred in connection with any claim, action, suit or proceeding in which they may be involved because of their offices with the funds, except if it is determined in the manner provided in the Declarations of Trust that they have not acted in good faith in the reasonable belief that their actions were in the best interests of the funds. However, nothing in the Declarations of Trust protects or indemnifies a Trustee or officer against any liability to which he or she would otherwise be subject by reason of willful misfeasance, bad faith, gross negligence, or reckless disregard of duties involved in the conduct of his or her office.
Election and Term of Trustees. Each Trustee serves until the next meeting of shareholders, if any, called for the purpose of electing Trustees and until the election and qualification of a successor or until such Trustee sooner dies, resigns, retires, is removed or incapacitated. Any Trustee who has become incapacitated by illness or injury as determined by a majority of the other Trustees may be retired by written instrument, signed by at least a majority of the other Trustees, specifying the date upon which such removal shall become effective. Any Trustee may be removed with or without cause (i) by the vote of the shareholders holding two-thirds of the outstanding shares of the applicable Trust, or (ii) by the action of two-thirds of the remaining Trustees. The Trustees shall promptly call a meeting of the shareholders for the purpose of voting upon the question of removal of any Trustee or Trustees when requested in writing so to do by the holders of not less than ten percent (10%) of the outstanding shares, and in that connection, the Trustees will assist shareholder communications to the extent provided for in Section 16(c) under the 1940 Act.
The foregoing is only a summary of the charter documents of Capital Growth, Health Care and Technology and is not a complete description of provisions contained in those sources. Shareholders and Contract Owners should refer to the provisions of those documents and state law directly for a more thorough description.
19
IV. INFORMATION ABOUT THE PROPOSED MERGERS
General. The shareholders of Health Care and Technology are each being asked to approve a merger between their respective Acquired Fund and Capital Growth. Each proposed merger would be pursuant to an Agreement and Plan of Reorganization between the Acquired Fund and Capital Growth (each an “Agreement”), a form of which is attached to this Prospectus/Proxy Statement as Appendix B.
Each merger is structured as a transfer of all of the assets of the applicable Acquired Fund to Capital Growth in exchange for the assumption by Capital Growth of all the liabilities of the applicable Acquired Fund, and for the issuance and delivery to the applicable Acquired Fund of Merger Shares equal in aggregate value to the net value of the assets transferred to Capital Growth.
After receipt of the Merger Shares, the applicable Acquired Fund will distribute the Merger Shares to its shareholders, in proportion to their existing shareholdings, in complete liquidation of the applicable Acquired Fund, and the legal existence of the applicable Acquired Fund as a series of its respective Trust will be terminated. Each shareholder of the applicable Acquired Fund will receive a number of full and fractional Merger Shares of the same class(es) as, and equal in aggregate value as of the Valuation Time (as defined on page ) to, the aggregate value of the shareholder’s shares in the applicable Acquired Fund. Such shares will be held in an account with Capital Growth identical in all material respects to the account currently maintained by the applicable Acquired Fund. Each Participating Insurance Company will then allocate its Merger Shares on a pro-rata basis among the Contract Owners in its applicable Acquired Fund separate account (or in sub-accounts thereof). Unless a Contract Owner instructs his or her Participating Insurance Company otherwise, amounts that would have been allocated to the applicable Acquired Fund under an existing Contract will, following the merger, be allocated to Capital Growth.
Prior to the date of its merger, the applicable Acquired Fund will sell any investments that are not consistent with the current implementation of the investment objective, policies, restrictions and investment strategies of Capital Growth, and will reinvest the proceeds such that the resulting portfolio will remain invested primarily in growth-oriented U.S. equity securities across a broad range of economic sectors, consistent with the pre-merger portfolio of Capital Growth. DIMA anticipates selling approximately 90% of Health Care’s investments and 70% of Technology’s investments in anticipation of each merger. The estimated costs to reposition each Acquired Fund’s portfolio, to be borne by the applicable Acquired Fund, are estimated to be $50,000 for Health Care and $63,000 for Technology. In addition, prior to any merger, each Acquired Fund will declare a taxable distribution which, together with all previous distributions, will have the effect of distributing to shareholders all of its net investment income and realized net capital gains, if any, through the date of the merger. As of February 15, 2011, Health Care had approximately $2,311,520 in capital gains, including capital gain spillbacks from the previous year. As of February 15, 2011, Technology had approximately $328,877 in capital gains for 2011, but that amount would be offset by a capital loss carryforward from the prior year of over $105 million. Therefore, based on current estimates, there is not expected to be any capital gains distribution for Technology prior to the merger.
The Trustees of both Health Care and Technology have voted unanimously to approve each Agreement and each of the proposed mergers and to recommend that shareholders of the Acquired Funds also approve the mergers. With respect to each Acquired Fund, the actions contemplated by the Agreement and the related matters described therein will be consummated only if approved by the affirmative vote of the shareholders of the applicable Acquired Fund entitled to vote more than fifty percent (50%) of the votes entitled to be cast on the matter at the special meeting.
In the event that a proposed merger does not receive the required shareholder approval, the Acquired Fund whose merger is not approved will continue to be managed as a separate series of a trust in accordance with its current investment objectives and policies, and the Trustees may consider such alternatives as may be in the best interests of each fund.
20
Background and Boards’ Considerations Relating to the Proposed Mergers
DWS Investments proposed the mergers to the Boards in November 2010. DWS Investments advised the Boards that it believed that the proposed mergers were in the best interests of Health Care and Technology for several reasons. In light of the decline of asset flows into actively managed “sector” funds such as Health Care and Technology, DWS Investments advised the Boards that Health Care and Technology have limited opportunities to attract new investments. As a result, Health Care and Technology are facing the likely prospect, over time, of declining assets and minimal opportunities to reduce costs through economies of scale. Given these considerations, and in order to provide shareholders with continuity of investment within the DWS fund family, DWS Investments believes that a merger into Capital Growth is the best alternative for shareholders of Health Care and Technology. DWS Investments advised the Boards that the mergers of Health Care and Technology into Capital Growth would provide shareholders with the opportunity to invest in a fund that provides broad exposure to U.S. growth stocks (including the health care and technology sectors, among others) with lower management fees and a lower total operating expense ratio.
The Trustees conducted a thorough review of the potential implications of the mergers on Health Care and Technology and their respective shareholders. They were assisted in this review by their independent legal counsel. The Trustees met on several occasions to review and discuss the mergers, both among themselves and with representatives of DWS Investments.
On January 12, 2011, the Trustees of each of Health Care and Technology, including all Trustees who are not “interested persons” (as defined in the 1940 Act) (“Independent Trustees”), unanimously approved the terms of the proposed mergers. The Trustees also unanimously determined to recommend that each merger be approved by its shareholders.
In determining to recommend that the shareholders of Health Care and Technology approve the applicable merger, the Trustees considered, among other factors:
| | • | | The mergers would help to protect shareholders of Health Care and Technology from the cost increases associated with small, declining asset bases, and provide continuity of investment within the DWS fund family, including access to DWS Investments’ U.S. equity investment expertise; |
| | • | | The effective advisory fees paid by the combined fund will be lower at all asset levels as compared to the advisory fees paid by Health Care and Technology; |
| | • | | The estimated total operating expense ratios of each class of shares of the combined fund are lower than the current total operating expense ratios of the corresponding classes of Health Care and Technology; |
| | • | | Similarities and differences between Health Care’s and Technology’s investment objectives, policies and restrictions relative to those of Capital Growth. The Acquired Funds and Capital Growth have similar investment objectives and strategies, as they each seek to achieve growth of capital by investing primarily in growth-oriented U.S. equity securities. Even though each of the funds has over 90% of its assets invested in U.S. stocks (with over 65% of those investments in large cap growth stocks), there are significant differences in the portfolios of Capital Growth and each Acquired Fund because each Acquired Fund concentrates its investments in a particular economic sector (health care and technology, respectively), while Capital Growth invests in a broad range of economic sectors; |
| | • | | DIMA’s commitment to cap certain expenses to be incurred by each of Health Care and Technology in connection with the merger. More specifically, DWS Investments has agreed to bear certain types of expenses incurred by Health Care or Technology in connection with the merger to the extent such expenses exceed the expected cost savings to be realized by shareholders of the applicable Fund at the time of the merger during the one-year period following the merger (See “Agreement and Plan of Reorganization” below for additional information regarding this cap); |
21
| | • | | Various alternatives to the proposed merger (e.g., liquidation); |
| | • | | The terms and conditions of the Agreements; |
| | • | | Services available to shareholders of Capital Growth and each of Health Care and Technology are substantially similar on a class-level basis; |
| | • | | The investment performance of Capital Growth and each of Health Care and Technology; |
| | • | | Prospects for the combined fund to attract additional assets; and |
| | • | | The federal income tax consequences of the mergers. |
Based on all of the foregoing: (1) the Board of Health Care concluded that the merger of Health Care into Capital Growth is in the best interests of Health Care, and that the interests of the existing shareholders of Health Care will not be diluted as a result of the merger; and (2) the Board of Technology concluded that the merger of Technology into Capital Growth is in the best interests of Technology, and that the interests of the existing shareholders of Technology will not be diluted as a result of the merger. Accordingly, the Trustees unanimously recommend that shareholders of Health Care and Technology approve the Agreement (as defined on page ) effecting the applicable merger. The Board of Health Care, including all of the Independent Trustees, unanimously recommends that shareholders of Health Care approve the merger of Health Care into Capital Growth. In addition, the Board of Technology, including all of the Independent Trustees, unanimously recommends that shareholders of Technology approve the merger of Technology into Capital Growth.
Agreement and Plan of Reorganization. Each proposed merger will be governed by an Agreement, a form of which is attached as Appendix B. Each Agreement provides that Capital Growth will acquire all of the assets of the applicable Acquired Fund solely in exchange for the assumption by Capital Growth of all liabilities of the applicable Acquired Fund and for the issuance of Merger Shares equal in value to the value of the transferred assets net of assumed liabilities. The Merger Shares will be issued on the next business day (the “Closing Date”) following the time as of which the funds’ shares are valued for determining net asset value for the merger (the close of regular trading on The New York Stock Exchange, Inc. on such date (the “Valuation Time”)). The Valuation Time is expected to occur during the second calendar quarter of 2011. The following discussion of the Agreements is qualified in its entirety by the full text of each Agreement.
The applicable Acquired Fund will transfer all of its assets to Capital Growth, and in exchange, Capital Growth will assume all liabilities of the applicable Acquired Fund and deliver to the applicable Acquired Fund a number of full and fractional Merger Shares of each class having an aggregate net asset value equal to the value of the assets of the applicable Acquired Fund attributable to shares of the corresponding class of the applicable Acquired Fund, less the value of the liabilities of the applicable Acquired Fund assumed by Capital Growth attributable to shares of such class of the applicable Acquired Fund. Immediately following the transfer of assets on the Closing Date, the applicable Acquired Fund will distribute pro rata to its shareholders of record with respect to each class of its shares as of the Valuation Time the full and fractional Merger Shares of the same class received by the applicable Acquired Fund, with Merger Shares of each class being distributed to holders of shares of the corresponding class of the applicable Acquired Fund. As a result of the proposed mergers, each shareholder of the applicable Acquired Fund will receive a number of Merger Shares of each class equal in aggregate value at the Valuation Time to the value of the shares of the corresponding class of the applicable Acquired Fund surrendered by the shareholder. This distribution will be accomplished by the establishment of accounts on the share records of Capital Growth in the name of such shareholders of the applicable Acquired Fund, each account representing the respective number of full and fractional Merger Shares of each class due to the respective shareholder. New certificates for Merger Shares will not be issued.
The Trustees have determined that each proposed merger is in the best interests of the applicable Acquired Fund and that the interests of the applicable Acquired Fund’s shareholders will not be diluted as a result of the transactions contemplated by the Agreement.
22
The consummation of each merger is subject to the conditions set forth in the applicable Agreement. Each Agreement may be terminated and the merger abandoned (i) by mutual consent of Capital Growth and the applicable Acquired Fund, (ii) by either party if the merger shall not be consummated on or before October 11, 2011, unless such date is extended by mutual agreement of the parties or (iii) by either party if the other party shall have materially breached its obligations under the Agreement or made a material and intentional misrepresentation in or in connection with the Agreement.
If shareholders of an Acquired Fund approve its merger, Capital Growth and the applicable Acquired Fund agree to coordinate their respective portfolios from the date of shareholder approval of the Agreement up to and including the Closing Date in order that, when the assets of the applicable Acquired Fund are added to the portfolio of Capital Growth, the resulting portfolio will remain invested primarily in growth-oriented U.S. equity securities across a broad range of economic sectors, consistent with Capital Growth’s investment objective, policies, restrictions and strategies. DIMA has estimated that approximately 90% and 70% of the portfolios of Health Care and Technology, respectively, will be liquidated prior to each merger as part of this coordination.
All fees and expenses directly attributable to the merger, including legal and accounting expenses, and any other expenses incurred in connection with the consummation of each merger and related transactions contemplated by the Agreement, will be borne by the applicable Acquired Fund to the extent of the estimated total benefit to each Acquired Fund during the first year after the merger. Merger costs in excess of the estimated one-year benefit, if any, would be paid by DIMA. DIMA currently estimates that direct merger costs relating to the merger of Health Care will total approximately $200,000 and that the estimated one-year benefit to Health Care shareholders would be $234,000. For the merger of Technology, DIMA currently estimates direct merger costs of approximately $225,000 and a one-year benefit to Technology shareholders of $300,000. Transaction costs incurred in connection with the purchase and sale of securities in anticipation of the mergers will be borne by the applicable Acquired Fund.
Description of the Merger Shares. Merger Shares will be issued to separate accounts as shareholders of each Acquired Fund in accordance with the Agreement as described above. The Merger Shares will be Class A and Class B shares of Capital Growth. Each class of Merger Shares has the same characteristics as shares of the corresponding class of the applicable Acquired Fund. Merger Shares will be treated as having been purchased on the date a separate account as shareholder purchased its shares of the applicable Acquired Fund and for the price it originally paid. For more information on the characteristics of each class of Merger Shares, please see the applicable Capital Growth prospectus, a copy of which is included with this Prospectus/Proxy Statement.
Under Massachusetts law, shareholders of Capital Growth could, under certain circumstances, be held personally liable for the obligations of Capital Growth. However, Capital Growth’s Declaration of Trust disclaims shareholder liability for the acts or obligations of Capital Growth and provides for indemnification for all losses of and expenses reasonably incurred by any shareholder held liable (solely by reason of being or having been a shareholder) for the obligations of Capital Growth. The indemnification and reimbursement discussed in the preceding sentence is to be made only out of the assets of Capital Growth.
Certain Federal Income Tax Consequences. Each merger is intended to qualify for federal income tax purposes as a tax-free reorganization under section 368(a) of the Code. With respect to each merger, as a condition to each fund’s obligation to consummate the merger, each of the Acquired Fund and Capital Growth will receive a tax opinion from Willkie Farr & Gallagher LLP, substantially to the effect that, as further described below, on the basis of the existing provisions of the Code, US Treasury regulations issued thereunder, current administrative rules, pronouncements and court decisions, for federal income tax purposes:
| | • | | The acquisition by Capital Growth of all of the assets of the Acquired Fund solely in exchange for Merger Shares and the assumption by Capital Growth of all of the liabilities of the Acquired Fund, followed by the distribution by the Acquired Fund to the separate accounts as shareholders of all the Merger Shares it received in complete liquidation of the Acquired Fund, all pursuant to the Agreement, |
23
| | will constitute a reorganization within the meaning of Section 368(a) of the Code, and the Acquired Fund and Capital Growth will each be a “party to a reorganization” within the meaning of Section 368(b) of the Code. |
| | • | | Under Sections 361 and 357(a) of the Code, no gain or loss will be recognized by the Acquired Fund upon the transfer of all its assets to Capital Growth solely in exchange for Merger Shares and the assumption of all of the Acquired Fund’s liabilities by Capital Growth, or upon the distribution of the Merger Shares by the Acquired Fund to the separate accounts as shareholders in complete liquidation. |
| | • | | Under Section 354 of the Code, the separate accounts as shareholders of the Acquired Fund will not recognize gain or loss upon the receipt of Merger Shares solely in exchange for the Acquired Fund shares. |
| | • | | Under Section 358 of the Code, the aggregate tax basis of the Merger Shares received by each stockholder of each Acquired Fund in the reorganization will be the same as the aggregate tax basis of his or her Acquired Fund shares exchanged therefor. |
| | • | | Under Section 1223(1) of the Code, the holding period of a separate account for the Merger Shares will be determined by including the period for which the separate account held the Acquired Fund shares exchanged therefor, provided that the separate account held the Acquired Fund shares on the date of the reorganization as capital assets. |
| | • | | Under Section 1032 of the Code, no gain or loss will be recognized by Capital Growth upon the receipt of all the assets of the Acquired Fund solely in exchange for the Merger Shares and the assumption by Capital Growth of all the liabilities of the Acquired Fund. |
| | • | | Under Section 362(b) of the Code, Capital Growth’s tax basis in the assets received from the Acquired Fund in the reorganization will be the same as the Acquired Fund’s tax basis in those assets immediately prior to the transfer. |
| | • | | Under Section 1223(2) of the Code, Capital Growth’s holding periods in the assets received from the Acquired Fund in the reorganization will include the periods during which such assets were held by the Acquired Fund. |
| | • | | Capital Growth will succeed to and take into account the items of the Acquired Fund described in Section 381(c) of the Code, subject to the conditions and limitations specified in Sections 381, 382, 383 and 384 of the Code and the regulations thereunder. |
Willkie Farr & Gallagher LLP will express no view with respect to (1) the effect of the merger on any transferred asset as to which any unrealized gain or loss is required to be recognized under federal income tax principles (i) at the end of a taxable year or upon the termination thereof, or (ii) upon the transfer of such asset regardless of whether such a transfer would otherwise be a non-taxable transaction and (2) any other federal tax issues (except those set forth above).
Each opinion will be based on certain factual certifications made by the officers of Capital Growth and the applicable Acquired Fund and will also be based on customary assumptions. It is possible that the Internal Revenue Service or a court could disagree with Willkie Farr & Gallagher LLP’s opinion, which therefore cannot be free from doubt. Opinions of counsel are not binding upon the Internal Revenue Service or the courts.
Prior to the Closing (as defined in the Agreement), the Acquired Fund and Capital Growth will each make a distribution to its separate accounts as shareholders, which, together with all previous distributions, will have the effect of distributing to their shareholders all of its investment company taxable income (computed without regard to the deduction for dividends paid), net tax-exempt income, if any, and net realized capital gains (after reduction by any capital loss carryforwards), if any, through (a) the Closing for the distribution by each Acquired Fund and (b) the taxable year ending December 31, 2010 for the distribution by Capital Growth.
24
In addition, although it is not expected to affect Contract Owners, as a result of the mergers each fund may lose the benefit of certain tax losses that could have been used to offset or defer future gains of the combined fund.
This description of the federal income tax consequences of the mergers is made without regard to the particular facts and circumstances of any shareholder or Contract Owner. Shareholders and Contract Owners are urged to consult their own tax advisors as to the specific consequences to them of the mergers, including, without limitation, the applicability and effect of federal, state, local, non-US and other tax laws.
Capitalization. The following tables set forth the unaudited capitalization of each fund as of December 31, 2010, and of Capital Growth on a pro forma combined basis, giving effect to the proposed acquisition of assets at net asset value as of that date.(1)
| | | | | | | | | | | | | | | | |
| | | Acquiring
Capital Growth | | | Acquired
Health Care | | | Pro Forma
Adjustments(2) | | | Pro Forma
Combined | |
Net Assets($) | | | | | | | | | | | | | | | | |
Class A | | | 728,888,149 | | | | 45,390,479 | | | | (234,402 | ) | | | 774,044,226 | |
Class B | | | 12,167,911 | | | | 3,020,551 | | | | (15,598 | ) | | | 15,172,864 | |
Total Net assets | | | 741,056,060 | | | | 48,411,030 | | | | (250,000 | ) | | | 789,217,090 | |
Shares outstanding | | | | | | | | | | | | | | | | |
Class A | | | 37,210,167 | | | | 4,002,304 | | | | (1,697,246 | ) | | | 39,515,225 | |
Class B | | | 623,731 | | | | 274,245 | | | | (120,224 | ) | | | 777,752 | |
Net Asset Value per share($) | | | | | | | | | | | | | | | | |
Class A | | | 19.59 | | | | 11.34 | | | | — | | | | 19.59 | |
Class B | | | 19.51 | | | | 11.01 | | | | — | | | | 19.51 | |
| (1) | Assumes the merger had been consummated on December 31, 2010 and is for information purposes only. No assurance can be given as to how many shares of Capital Growth will be received by the shareholders of Health Care on the date the merger takes place, and the foregoing should not be relied upon to reflect the number of shares of Capital Growth that actually will be received on or after such date. |
| (2) | Pro Forma adjustments include estimated one-time merger costs of $200,000 and estimated transaction costs of $50,000 in connection with the repositioning of Health Care’s investments in anticipation of the merger, each of which will be borne by Health Care. |
| | | | | | | | | | | | | | | | |
| | | Acquiring
Capital Growth | | | Acquired
Technology | | | Pro Forma
Adjustments(2) | | | Pro Forma
Combined | |
Net Assets($) | | | | | | | | | | | | | | | | |
Class A | | | 728,888,149 | | | | 75,572,811 | | | | (287,516 | ) | | | 804,173,444 | |
Class B | | | 12,167,911 | | | | 127,257 | | | | (484 | ) | | | 12,294,684 | |
Total Net assets | | | 741,056,060 | | | | 75,700,068 | | | | (288,000 | ) | | | 816,468,128 | |
Shares outstanding | | | | | | | | | | | | | | | | |
Class A | | | 37,210,167 | | | | 6,893,997 | | | | (3,050,950 | ) | | | 41,053,214 | |
Class B | | | 623,731 | | | | 11,963 | | | | (5,465 | ) | | | 630,229 | |
Net Asset Value per share($) | | | | | | | | | | | | | | | | |
Class A | | | 19.59 | | | | 10.96 | | | | — | | | | 19.59 | |
Class B | | | 19.51 | | | | 10.64 | | | | — | | | | 19.51 | |
| (1) | Assumes the merger had been consummated on December 31, 2010 and is for information purposes only. No assurance can be given as to how many shares of Capital Growth will be received by the shareholders of Technology on the date the merger takes place, and the foregoing should not be relied upon to reflect the number of shares of Capital Growth that actually will be received on or after such date. |
| (2) | Pro Forma adjustments include estimated one-time merger costs of $225,000 and estimated transaction costs of $63,000 in connection with the repositioning of Technology’s investments in anticipation of the merger, each of which will be borne by Technology. |
25
| | | | | | | | | | | | | | | | | | | | |
| | | Acquiring
Capital Growth | | | Acquired
Health Care | | | Acquired
Technology | | | Pro Forma
Adjustments(2) | | | Pro Forma
Combined | |
Net Assets($) | | | | | | | | | | | | | | | | | | | | |
Class A | | | 728,888,149 | | | | 45,390,479 | | | | 75,572,811 | | | | (521,917 | ) | | | 849,329,522 | |
Class B | | | 12,167,911 | | | | 3,020,551 | | | | 127,257 | | | | (16,083 | ) | | | 15,299,636 | |
Total Net assets | | | 741,056,060 | | | | 48,411,030 | | | | 75,700,068 | | | | (538,000 | ) | | | 864,629,158 | |
Shares outstanding | | | | | | | | | | | | | | | | | | | | |
Class A | | | 37,210,167 | | | | 4,002,304 | | | | 6,893,997 | | | | (4,748,196 | ) | | | 43,358,272 | |
Class B | | | 623,731 | | | | 274,245 | | | | 11,963 | | | | (125,689 | ) | | | 784,250 | |
Net Asset Value per share($) | | | | | | | | | | | | | | | | | | | | |
Class A | | | 19.59 | | | | 11.34 | | | | 10.96 | | | | — | | | | 19.59 | |
Class B | | | 19.51 | | | | 11.01 | | | | 10.64 | | | | — | | | | 19.51 | |
| (1) | Assumes the merger had been consummated on December 31, 2010 and is for information purposes only. No assurance can be given as to how many shares of Capital Growth will be received by the shareholders of Health Care or of Technology on the date the merger takes place, and the foregoing should not be relied upon to reflect the number of shares of Capital Growth that actually will be received on or after such date. |
| (2) | Pro Forma adjustments include estimated one-time merger costs of $425,000, of which $200,000 will be borne by Health Care and $225,000 will be borne by Technology, and estimated transaction costs of $113,000 of which $50,000 is estimated for Health Care and $63,000 is estimated for Technology in connection with the repositioning of the Acquired Funds’ investments in anticipation of the mergers. Such transaction costs will be borne by each Acquired Fund. |
The Trustees of each Trust, all of whom are independent Trustees, unanimously recommend approval of each merger.
V. VOTING AT THE SHAREHOLDER MEETINGS AND OTHER INFORMATION
General. This Prospectus/Proxy Statement is furnished in connection with the proposed merger of each Acquired Fund into Capital Growth and the solicitation of proxies by and on behalf of the Trustees of each Acquired Fund for use at the Special Meetings of Acquired Fund Shareholders (the “Meetings”). The Meetings are to be held on April 11, 2011 at 3:00 p.m., Eastern time at the offices of DIMA, 345 Park Avenue, 24th Floor, New York, NY 10154, or at such later time as is made necessary by adjournment or postponement. The Notice of the Special Meetings of Shareholders, the Prospectus/Proxy Statement and the enclosed proxy card or form of voting instruction form are being mailed to shareholders on or about , 2011.
As of February 18, 2011 (the “Record Date”), the following number of shares were issued and outstanding for each Acquired Fund:
| | | | |
Shares | | Issued and
Outstanding | |
Health Care, Class A | | | 3,951,557.51 | |
Health Care, Class B | | | 269,720.61 | |
Technology, Class A | | | 6,857,608.11 | |
Technology, Class B | | | 11,434.17 | |
Only shareholders of record on the Record Date will be entitled to notice of and to vote at the applicable Meeting. Each share entitles the holder thereof to one vote on the applicable proposal at the Meetings and any postponement(s) or adjournment(s) thereof.
The Trustees know of no matters other than those set forth herein to be brought before the Meetings. If, however, any other matters properly come before the Meetings, it is the Trustees’ intention that proxies will be voted on such matters in accordance with the judgment of the persons named in the form of proxy.
26
Required Vote. Proxies are being solicited from shareholders of each Acquired Fund by the Trustees of each Trust for the applicable Meeting. Unless revoked, all valid proxies will be voted in accordance with the specification thereon or, in the absence of specification, FOR approval of the applicable Agreement. The transactions contemplated by each Agreement will be consummated only if approved by the affirmative vote of the shareholders of the applicable Acquired Fund entitled to vote more than fifty percent (50%) of the votes entitled to be cast on the matter at the Meeting.
Record Date, Quorum and Method of Tabulation. Shareholders of record of an Acquired Fund at the close of business on the Record Date will be entitled to vote at the Acquired Fund’s Meeting or any adjournment or postponement thereof. The holders of at least 30% of the shares entitled to vote of that Acquired Fund outstanding at the close of business on the Record Date present in person or represented by proxy will constitute a quorum for the transaction of business at a Meeting. As discussed below and set forth in the Share Ownership tables below, because shares of the Acquired Funds are held by Participating Insurance Companies, the presence at the Meeting of a small number of Participating Insurance Companies may be sufficient to constitute a quorum for the transaction of business at a Meeting. Please see “Solicitation of Proxies and Proxy Costs” below for a description of how the Participating Insurance Companies vote, based on the voting instructions received from Contract Owners.
Votes cast by proxy or in person at the Meeting will be counted by persons appointed by the applicable Acquired Fund as tellers for the Meeting. The tellers will count the total number of votes cast “for” approval of the proposal for purposes of determining whether sufficient affirmative votes have been cast. The tellers will count shares represented by proxies that reflect abstentions as shares that are present and entitled to vote on the matter for purposes of determining the presence of a quorum. Abstentions will therefore have the effect of a negative vote on a proposal. Shares attributable to amounts retained by each Participating Insurance Company will be voted in the same proportion as voting instructions received from Contract Owners. Accordingly, there are not expected to be any “broker non-votes.”
Share Ownership. As of the Record Date, the officers and Trustees of each Trust, as a group, owned less than 1% of the outstanding shares of each Acquired Fund and of Capital Growth.
To the best of the knowledge of Capital Growth, as of the Record Date, the following shareholders owned of record or beneficially 5% or more of the outstanding shares of any class of Capital Growth:
| | | | | | | | | | |
Class | | Shareholder Name and Address | | Shares | | | Percentage Owned | |
A | | MUTUAL OF AMERICA NEW YORK NY 10022-6815 | | | 11,182,122.42 | | | | 30.54 | % |
| | | |
A | | ZALICO DESTINATIONS/ FARMERS FUND ATTN INVESTMENT ACCOUNTING
GREENVILLE SC 29602-9097 | | | 8,103,309.81 | | | | 22.13 | % |
| | | |
A | | MUTUAL OF AMERICA NEW YORK NY 10022-6815 | | | 4,590,864.99 | | | | 12.54 | % |
| | | |
A | | ALLMERICA LIFE SVSII ATTN PRODUCT VALUATION TOPEKA KS 66636-1000 | | | 4,307,798.94 | | | | 11.77 | % |
| | | |
A | | ZURICH AMERICAN LIFE INS CO ATTN PRODUCT VALUATION SECURITY BENEFIT TOPEKA KS 66636-1000 | | | 3,509,999.05 | | | | 9.59 | % |
| | | |
A | | CHARTER NAT LIFE INS CO-HORIZON ATTN ACCTNG FINANCIAL CONTROL TEAM PALATINE IL 60094-4210 | | | 2,312,310.45 | | | | 6.32 | % |
| | | |
B | | METLIFE INSURANCE CO OF CT ATTN SHAREHOLDER ACCOUNTING DEPT HARTFORD CT 06199-0027 | | | 501,563.99 | | | | 81.76 | % |
| | | |
B | | SYMETRA LIFE INSURANCE CO ATTN LIFE FINANCE SEPARATE ACCOUNTS
BELLEVUE WA 98004-5130 | | | 102,695.81 | | | | 16.74 | % |
27
To the best of the knowledge of Health Care, as of the Record Date, the following shareholders owned of record or beneficially 5% or more of the outstanding shares of any class of Health Care:
| | | | | | | | | | |
Class | | Shareholder Name and Address | | Shares | | | Percentage Owned | |
A | | ZALICO DESTINATIONS/ FARMERS FUND ATTN INVESTMENT ACCOUNTING GREENVILLE SC 29602-9097 | | | 2,687,191.08 | | | | 68.00 | % |
| | | |
A | | ALLMERICA LIFE SVSII ATTN PRODUCT VALUATION TOPEKA KS 66636-1000 | | | 904,444.44 | | | | 22.89 | % |
| | | |
A | | GREAT-WEST LIFE & ANN SCH ANNUITY GREENWOOD VLG CO 80111-5002 | | | 217,045.70 | | | | 5.49 | % |
| | | |
B | | METLIFE INSURANCE CO OF CT ATTN SHAREHOLDER ACCOUNTING DEPT HARTFORD CT 06199-0027 | | | 264,298.28 | | | | 97.99 | % |
To the best of the knowledge of Technology, as of the Record Date, the following shareholders owned of record or beneficially 5% or more of the outstanding shares of any class of Technology:
| | | | | | | | | | |
Class | | Shareholder Name and Address | | Shares | | | Percentage Owned | |
A | | ZALICO DESTINATIONS FARMERS SVSII ATTN INVESTMENT ACCOUNTING GREENVILLE SC 29602-9097 | | | 3,937,977.43 | | | | 57.42 | % |
| | | |
A | | ALLMERICA LIFE SVSII ATTN PRODUCT VALUATION TOPEKA KS 66636-1000 | | | 2,498,875.79 | | | | 36.44 | % |
| | | |
B | | GE CAPITAL LIFE ASSURANCE CO OF NEW YORK RICHMOND VA 23230-1702 | | | 8,907.84 | | | | 77.91 | % |
| | | |
B | | ZURICH AMERICAN LIFE INS CO VARIABLE ANNUITY SEPARATE ACCOUNTS ATTN PRODUCT VALUATION SECURITY BENEFIT TOPEKA KS 66636-1000 | | | 1,478.31 | | | | 12.93 | % |
| | | |
B | | GE LIFE AND ANNUITY ASSURANCE CO RICHMOND VA 23230-1702 | | | 1,047.31 | | | | 9.16 | % |
Solicitation of Proxies and Proxy Costs. As discussed above, shares of the Acquired Funds are offered only to Participating Insurance Companies to fund benefits under their Contracts. Therefore, shares of the Acquired Funds are held by separate accounts, or sub-accounts thereof, of various Participating Insurance Companies. These shares are owned by the Participating Insurance Companies as depositors for their respective Contracts issued to individual Contract Owners or to a group (e.g., a defined benefit plan) in which Contract Owners participate. Contract Owners have the right to instruct the Participating Insurance Companies on how to vote the shares related to their interests through their Contracts (i.e., pass-through voting). A Participating Insurance Company must vote the shares of an Acquired Fund held in its name as directed by Contract Owners. If a Participating Insurance Company receives a signed voting instruction form that does not indicate the Contract Owner’s voting instructions, the Participating Insurance Company will vote the interest represented thereby in favor of the proposal. If a Participating Insurance Company does not receive voting instructions for all of the shares of an Acquired Fund held under the Contracts, it will vote all of the shares in the relevant separate accounts with respect to the proposal, for, against, or abstaining, in the same proportion as the shares of such Acquired Fund for which it has received instructions from Contract Owners (i.e., “echo voting”). The Acquired Funds are not aware of a minimum number of voting instructions that must be received from Contract Owners
28
before a Participating Insurance Company may employ echo voting when casting its vote at a Meeting. As a result, a small number of Contract Owners may determine the outcome of the vote. This Prospectus/Proxy Statement is used to solicit voting instructions from Contract Owners, as well as to solicit proxies from the Participating Insurance Companies and the actual shareholders of the Acquired Funds. All persons entitled to direct the voting of shares of an Acquired Fund, whether or not they are shareholders, are described as voting for purposes of this Prospectus/Proxy Statement.
In addition to soliciting proxies by mail, certain officers and representatives of the Acquired Funds, officers and employees of DIMA and certain financial services firms and their representatives, who will receive no extra compensation for their services, may solicit proxies by telephone, by telegram or personally.
All properly executed proxies received in time for the applicable Meeting will be voted as specified in the proxy or, if no specification is made, in favor of the proposal.
Computershare Fund Services, Inc. (“Computershare”) has been engaged as an information agent in connection with this Prospectus/Proxy Statement at an estimated cost of $1400 for Health Care and $2100 for Technology. No person has been engaged to assist in the solicitation of proxies.
Please see the instructions on your voting instruction form for telephone touch-tone voting and Internet voting. Shareholders will have an opportunity to review their voting instructions and make any necessary changes before submitting their voting instructions and terminating their telephone call or Internet link. Shareholders who vote through the Internet, in addition to confirming their voting instructions prior to submission, will also receive an e-mail confirming their instructions upon request.
If a shareholder of record wishes to participate in a Meeting, but does not wish to give a proxy by telephone or electronically, the shareholder of record may still submit the proxy card originally sent with the Prospectus/Proxy Statement or attend in person. Should shareholders require additional information regarding the proxy or replacement proxy card, they may contact Computershare toll-free at 866-963-6127. Any proxy given by a shareholder is revocable until voted at the applicable Meeting.
Persons holding shares as nominees will, upon request, be reimbursed for their reasonable expenses in soliciting instructions from their principals. The cost of preparing, printing and mailing the enclosed voting instruction form and Prospectus/Proxy Statement, and all other costs incurred in connection with the solicitation of proxies for the Acquired Funds, including any additional solicitation made by letter, telephone or telegraph, will be paid by the applicable Acquired Fund (subject to the cap described above).
Revocation of Proxies. Proxies, including proxies given by telephone or over the Internet, may be revoked at any time before they are voted either (i) by a written revocation received by the Secretary of the applicable Acquired Fund at One Beacon Street, Boston, MA 02108, (ii) by properly executing a later-dated proxy that is received by the applicable Acquired Fund at or prior to the applicable Meeting, or (iii) by attending the applicable Meeting and voting in person. Merely attending the applicable Meeting without voting, however, will not revoke a previously submitted proxy. Only a shareholder may execute or revoke a proxy. Contract Owners should consult their Participating Insurance Company regarding their ability to revoke voting instructions after such instructions have been provided to the Participating Insurance Company.
Adjournment and Postponement. Each Meeting may, by action of the chairman of the Meeting, be adjourned without further notice with respect to any matter to be considered at the Meeting to a designated time and place, whether or not a quorum is present with respect to such matter. Upon motion of the chairman of the Meeting, the question of adjournment may be submitted to a vote of the shareholders, and in that case, any adjournment with respect to any matter must be approved by the vote of holders of a majority of the shares present and entitled to vote with respect to the matter or matters adjourned, and without further notice. Management may postpone each Meeting of shareholders prior to the Meeting with notice to shareholders entitled to vote at or receive notice of the Meeting.
29
APPENDIX A
INSTRUCTIONS FOR SIGNING VOTING INSTRUCTION FORMS AND PROXY CARDS
The following general rules for signing voting instruction forms and proxy cards may be of assistance to you and avoid the time and expense involved in validating your vote if you fail to sign your voting instruction form or proxy card properly.
1. Individual Accounts: Sign your name exactly as it appears in the registration on the voting instruction form or proxy card.
2. Joint Accounts: Each party must sign, and the name or names of the party signing should conform exactly to the name shown in the registration on the voting instruction form or proxy card.
3. All Other Accounts: The capacity of the individual signing the voting instruction form or proxy card should be indicated unless it is reflected in the form of registration. For example:
| | |
Registration | | Valid Signatures |
Corporate Accounts | | |
(1) ABC Corp. | | ABC Corp. |
(2) ABC Corp. | | John Doe, Treasurer |
(3) ABC Corp c/o John Doe, Treasurer | | John Doe |
(4) ABC Corp. Profit Sharing Plan | | John Doe, Trustee |
Trust Accounts
| | |
(1) ABC Trust | | Jane B. Doe, Trustee |
(2) Jane B. Doe, Trustee u/t/d 12/28/78 | | Jane B. Doe |
Custodial or Estate Accounts
| | |
(1) John B. Smith, Cust. f/b/o John B. Smith, Jr. UGMA | | John B. Smith |
(2) John B. Smith | | John B. Smith, Jr., Executor |
A-1
APPENDIX B
FORM OF AGREEMENT AND PLAN OF REORGANIZATION
THIS AGREEMENT AND PLAN OF REORGANIZATION (the “Agreement”) is made as of this [ ] day of [ ], 2011, by and among DWS Variable Series I (the “Acquiring Trust”), a Massachusetts business trust, on behalf of DWS Capital Growth VIP (the “Acquiring Fund”), a separate series of the Acquiring Trust, and [ACQUIRED TRUST] (the “Acquired Trust,” and, together with the Acquiring Trust, each a “Trust” and collectively the “Trusts”), a Massachusetts business trust, on behalf of [ACQUIRED FUND] (the “Acquired Fund,” and, together with the Acquiring Fund, each a “Fund” and collectively the “Funds”), a separate series of the Acquired Trust, and Deutsche Investment Management Americas Inc. (“DIMA”), investment adviser for the Funds (for purposes of section 10.2 of the Agreement only). The principal place of business of the Acquiring Trust and the Acquired Trust is 345 Park Avenue, New York, NY 10154.
This Agreement is intended to be and is adopted as a plan of reorganization within the meaning of Section 368 of the Internal Revenue Code of 1986, as amended (the “Code”). The reorganization (the “Reorganization”) will consist of the transfer of all of the assets of the Acquired Fund to the Acquiring Fund in exchange solely for Class A and Class B voting shares of beneficial interest (par value $0.01 per share) of the Acquiring Fund (the “Acquiring Fund Shares”) and the assumption by the Acquiring Fund of all of the liabilities of the Acquired Fund, immediately followed by the distribution of the Class A Acquiring Fund Shares to the Class A shareholders of the Acquired Fund and the Class B Acquiring Fund Shares to the Class B shareholders of the Acquired Fund in complete liquidation and termination of the Acquired Fund as provided herein, all upon the terms and conditions hereinafter set forth in this Agreement.
NOW, THEREFORE, in consideration of the premises and of the covenants and agreements hereinafter set forth, the parties hereto covenant and agree as follows:
| 1. | Transfer of Assets of the Acquired Fund to the Acquiring Fund in Consideration For Acquiring Fund Shares and the Assumption of All Acquired Fund Liabilities and the Liquidation of the Acquired Fund |
1.1 Subject to the terms and conditions herein set forth and on the basis of the representations and warranties contained herein, the Acquired Fund agrees to transfer to the Acquiring Fund all of the Acquired Fund’s assets as set forth in section 1.2, and the Acquiring Fund agrees in consideration therefor (i) to deliver to the Acquired Fund that number of full and fractional Class A and Class B Acquiring Fund Shares determined by dividing the value of the Acquired Fund’s assets net of any liabilities of the Acquired Fund with respect to Class A and Class B shares of the Acquired Fund, computed in the manner and as of the time and date set forth in section 2.1, by the net asset value of one Acquiring Fund Share of the corresponding class of Class A or Class B shares, computed in the manner and as of the time and date set forth in section 2.2; and (ii) to assume all of the liabilities of the Acquired Fund, including, but not limited to, any deferred compensation payable by the Acquired Fund to the Acquired Trust’s trustees. All Acquiring Fund Shares delivered to the Acquired Fund shall be delivered at net asset value without a sales load, commission or other similar fee being imposed. Such transactions shall take place at the closing provided for in section 3.1 (the “Closing”).
1.2 The assets of the Acquired Fund to be acquired by the Acquiring Fund (the “Assets”) shall consist of all assets, including, without limitation, all cash, cash equivalents, securities, commodities and futures contracts and dividends or interest or other receivables that are owned by the Acquired Fund and any deferred or prepaid expenses shown on the unaudited statement of assets and liabilities of the Acquired Fund prepared as of the effective time of the Closing in accordance with accounting principles generally accepted in the United States of America (“GAAP”) applied consistently with those of the Acquired Fund’s most recent audited statement of assets and liabilities. The Assets shall constitute at least 90% of the fair market value of the net assets, and at least 70% of the fair market value of the gross assets, held by the Acquired Fund immediately before the Closing (excluding for these purposes assets used to pay the dividends and other distributions paid pursuant to section 5.14).
B-1
1.3 The Acquired Fund will endeavor, to the extent practicable, to discharge all of its liabilities and obligations that are accrued prior to the Closing Date as defined in section 3.1.
1.4 Immediately after the transfer of Assets provided for in section 1.1, the Acquired Fund will distribute to the Acquired Fund’s shareholders of record with respect to each class of its shares (the “Acquired Fund Shareholders”), determined as of the Valuation Time (as defined in section 2.1), on a pro rata basis, within that class, the Acquiring Fund Shares of the same class received by the Acquired Fund pursuant to section 1.1 and will completely liquidate. Such distribution and liquidation will be accomplished with respect to each class of the Acquired Fund by the transfer of the Acquiring Fund Shares then credited to the account of the Acquired Fund on the books of the Acquiring Fund to open accounts on the share records of the Acquiring Fund in the names of the Acquired Fund Shareholders. The Acquiring Fund shall have no obligation to inquire as to the validity, propriety or correctness of such records, but shall assume that such transaction is valid, proper and correct. The aggregate net asset value of Class A and Class B Acquiring Fund Shares to be so credited to Class A and Class B Acquired Fund Shareholders, as applicable, shall be equal to the aggregate net asset value of the Acquired Fund shares of the same class owned by such shareholders as of the Valuation Time. All issued and outstanding shares of the Acquired Fund will simultaneously be cancelled on the books of the Acquired Fund, although share certificates representing interests in Class A and Class B shares of the Acquired Fund, if any, will represent a number of Acquiring Fund Shares after the Closing Date as determined in accordance with section 2.3. The Acquiring Fund will not issue certificates representing Acquiring Fund Shares.
1.5 Ownership of Acquiring Fund Shares will be shown on the books of the Acquiring Fund. Shares of the Acquiring Fund will be issued in the manner described in the Acquiring Fund’s most recently effective prospectuses and statement of additional information for Class A and Class B shares.
1.6 Any reporting responsibility of the Acquired Fund including, without limitation, the responsibility for filing of regulatory reports, tax returns, or other documents with the Securities and Exchange Commission (the “Commission”), any state securities commission, and any federal, state or local tax authorities or any other relevant regulatory authority, is and shall remain the responsibility of the Acquired Fund.
1.7 All books and records of the Acquired Fund, including, without limitation, all books and records required to be maintained under the Investment Company Act of 1940, as amended (the “1940 Act”), and the rules and regulations thereunder, shall be available to the Acquiring Fund from and after the Closing Date and shall be turned over to the Acquiring Trust as soon as practicable following the Closing Date.
2.1 The value of the Assets and the liabilities of the Acquired Fund shall be computed as of the close of regular trading on The New York Stock Exchange, Inc. (the “NYSE”) on the business day immediately preceding the Closing Date (the “Valuation Time”) after the declaration and payment of any dividends and/or other distributions on that date, using the valuation procedures set forth in the Acquiring Trust’s Amended and Restated Declaration of Trust, as amended, the Acquiring Fund’s most recently effective prospectuses and statement of additional information for Class A and Class B shares and any other valuation policies or procedures applicable to the Acquiring Fund then in effect, copies of which have been delivered to the Acquired Fund.
2.2 The net asset value of a Class A or Class B Acquiring Fund Share shall be the net asset value per share computed with respect to that class as of the Valuation Time using the valuation procedures referred to in section 2.1.
2.3 The number of Class A and Class B Acquiring Fund Shares to be issued (including fractional shares, if any) in consideration for the Assets shall be determined by dividing the value of the Assets net of liabilities with respect to Class A and Class B shares of the Acquired Fund, as the case may be, determined in accordance with section 2.1 by the net asset value of an Acquiring Fund Share of the same class determined in accordance with section 2.2.
B-2
2.4 All computations of value hereunder shall be made by or under the direction of each Fund’s respective accounting agent, if applicable, in accordance with its regular practice and the requirements of the 1940 Act and shall be subject to confirmation by each Fund’s respective Independent Registered Public Accounting Firm upon the reasonable request of the other Fund.
| 3. | Closing and Closing Date |
3.1 The Closing of the transactions contemplated by this Agreement shall occur on May 2, 2011, or such later date as the parties may agree in writing (the “Closing Date”). All acts taking place at the Closing shall be deemed to take place simultaneously as of 9:00 a.m., Eastern time, on the Closing Date, unless otherwise agreed to by the parties. The Closing shall be held at the offices of counsel to the Acquiring Fund, or at such other place and time as the parties may agree.
3.2 The Acquired Fund shall deliver, or cause to be delivered, to the Acquiring Fund on the Closing Date a schedule of Assets.
3.3 State Street Bank and Trust Company (“SSB”), custodian for the Acquired Fund, shall deliver at the Closing a certificate of an authorized officer stating that (a) the Assets have been delivered in proper form to SSB, also the custodian for the Acquiring Fund, prior to or on the Closing Date and (b) all necessary taxes in connection with the delivery of the Assets, including all applicable federal and state stock transfer stamps, if any, have been paid or provision for payment has been made. The Acquired Fund’s portfolio securities represented by a certificate or other written instrument shall be presented by the custodian for the Acquired Fund to the custodian for the Acquiring Fund for examination no later than five business days preceding the Closing Date and transferred and delivered by the Acquired Fund as of the Closing Date for the account of the Acquiring Fund duly endorsed in proper form for transfer in such condition as to constitute good delivery thereof. The Acquired Fund’s portfolio securities and instruments deposited with a securities depository, as defined in Rule 17f-4 under the 1940 Act, shall be delivered as of the Closing Date by book entry in accordance with the customary practices of such depositories and the custodian for the Acquiring Fund. The cash to be transferred by the Acquired Fund shall be delivered by wire transfer of federal funds on the Closing Date.
3.4 DWS Investments Service Company (“DWS-ISC”), as transfer agent for the Acquired Fund, shall deliver at the Closing a certificate of an authorized officer stating that its records contain the names and addresses of the Acquired Fund Shareholders and the number and percentage ownership (to three decimal places) of outstanding Class A and Class B Acquired Fund shares owned by each such shareholder immediately prior to the Closing. The Acquiring Fund shall issue and deliver a confirmation evidencing the Acquiring Fund Shares to be credited on the Closing Date to the Acquired Fund or provide evidence satisfactory to the Acquired Fund that such Acquiring Fund Shares have been credited to the Acquired Fund’s account on the books of the Acquiring Fund. At the Closing, each party shall deliver to the other such bills of sale, checks, assignments, share certificates, if any, receipts or other documents as such other party or its counsel may reasonably request to effect the transactions contemplated by this Agreement.
3.5 In the event that immediately prior to the Valuation Time (a) the NYSE or another primary trading market for portfolio securities of the Acquiring Fund or the Acquired Fund shall be closed to trading or trading thereupon shall be restricted, or (b) trading or the reporting of trading on the NYSE or elsewhere shall be disrupted so that, in the judgment of the Board of Trustees of the Acquiring Trust or Board of Trustees of the Acquired Trust, as applicable (each a “Board”), accurate appraisal of the value of the net assets with respect to the Class A and Class B shares of the Acquiring Fund or the Acquired Fund is impracticable, the Closing Date shall be postponed until the first business day after the day when trading shall have been fully resumed and reporting shall have been restored.
3.6 The liabilities of the Acquired Fund to be assumed by the Acquiring Fund shall include all of the Acquired Fund’s liabilities, debts, obligations, and duties of whatever kind or nature, whether absolute, accrued,
B-3
contingent, or otherwise, whether or not arising in the ordinary course of business, whether or not determinable at the Closing Date, and whether or not specifically referred to in this Agreement including but not limited to any deferred compensation payable to the Acquired Fund’s trustees.
| 4. | Representations and Warranties |
4.1 The Acquired Trust, on behalf of the Acquired Fund, represents and warrants to the Acquiring Trust as follows:
(a) The Acquired Trust is a Massachusetts business trust duly organized and validly existing under the laws of The Commonwealth of Massachusetts with power under the Acquired Trust’s Amended and Restated Declaration of Trust, as amended, to own all of its properties and assets and to carry on its business as it is now being conducted and, subject to approval of shareholders of the Acquired Fund, to carry out the Agreement. The Acquired Fund is a separate series of the Acquired Trust duly designated in accordance with the applicable provisions of the Acquired Trust’s Amended and Restated Declaration of Trust, as amended. The Acquired Trust and Acquired Fund are qualified to do business in all jurisdictions in which they are required to be so qualified, except jurisdictions in which the failure to so qualify would not have a material adverse effect on the Acquired Trust or Acquired Fund. The Acquired Fund has all material federal, state and local authorizations necessary to own all of the properties and assets and to carry on its business as now being conducted, except authorizations which the failure to so obtain would not have a material adverse effect on the Acquired Fund;
(b) The Acquired Trust is registered with the Commission as an open-end management investment company under the 1940 Act, and such registration is in full force and effect and the Acquired Fund is in compliance in all material respects with the 1940 Act and the rules and regulations thereunder;
(c) No consent, approval, authorization, or order of any court or governmental authority is required for the consummation by the Acquired Fund of the transactions contemplated herein, except such as have been obtained under the Securities Act of 1933, as amended (the “1933 Act”), the Securities Exchange Act of 1934, as amended (the “1934 Act”), and the 1940 Act and such as may be required by state securities laws;
(d) The Acquired Trust is not, and the execution, delivery and performance of this Agreement by the Acquired Trust will not result (i) in violation of Massachusetts law or of the Acquired Trust’s Amended and Restated Declaration of Trust or By-Laws, each as amended, (ii) in a violation or breach of, or constitute a default under, any material agreement, indenture, instrument, contract, lease or other undertaking to which the Acquired Fund is a party or by which it is bound, and the execution, delivery and performance of this Agreement by the Acquired Fund will not result in the acceleration of any obligation, or the imposition of any penalty, under any agreement, indenture, instrument, contract, lease, judgment or decree to which the Acquired Fund is a party or by which it is bound, or (iii) in the creation or imposition of any lien, charge or encumbrance on any property or assets of the Acquired Fund;
(e) No material litigation or administrative proceeding or investigation of or before any court or governmental body is presently pending or to the Acquired Fund’s knowledge threatened against the Acquired Fund or any properties or assets held by it. The Acquired Fund knows of no facts which might form the basis for the institution of such proceedings which would materially and adversely affect its business and is not a party to or subject to the provisions of any order, decree or judgment of any court or governmental body which materially and adversely affects its business or its ability to consummate the transactions herein contemplated;
(f) The Statements of Assets and Liabilities, Operations, and Changes in Net Assets, the Financial Highlights, and the Investment Portfolio of the Acquired Fund at and for the fiscal year ended December 31, 2009, and, at and as of the Closing Date, the Statements of Assets and Liabilities, Operations, and Changes in Net Assets, the Financial Highlights, and the Investment Portfolio of the Acquired Fund at and for the fiscal year ended December 31, 2010, have been audited in each case by [PricewaterhouseCoopers LLP/
B-4
Ernst & Young LLP], Independent Registered Public Accounting Firm, and, with the unaudited Statements of Assets and Liabilities, Operations, and Changes in Net Assets, Financial Highlights, and Investment Portfolio of the Acquired Fund at and for the six months ended June 30, 2010, are in accordance with GAAP consistently applied, and such statements (a copy of each of which has been furnished to the Acquiring Fund, or, in the case of such statements of the Acquired Fund at and for the fiscal year ended December 31, 2010, copies of which shall be furnished to the Acquiring Fund) present fairly, in all material respects, the financial position of the Acquired Fund as of such date in accordance with GAAP and there are no known contingent liabilities of the Acquired Fund required to be reflected on a statement of assets and liabilities (including the notes thereto) in accordance with GAAP as of such date not disclosed therein;
(g) Since December 31, 2009, there has not been any material adverse change in the Acquired Fund’s financial condition, assets, liabilities or business other than changes occurring in the ordinary course of business, or any incurrence by the Acquired Fund of indebtedness maturing more than one year from the date such indebtedness was incurred except as otherwise disclosed to and accepted in writing by the Acquiring Fund. For purposes of this subsection (g), a decline in net asset value per share of the Acquired Fund due to declines in market values of securities in the Acquired Fund’s portfolio, the discharge of Acquired Fund liabilities, or the redemption of Acquired Fund shares by Acquired Fund Shareholders shall not constitute a material adverse change;
(h) At the date hereof and at the Closing Date, all federal and other tax returns and reports of the Acquired Fund required by law to have been filed by such dates (including any extensions) shall have been filed and are or will be correct in all material respects, and all federal and other taxes of the Acquired Fund (whether or not shown as due or required to be shown as due on said returns and reports) shall have been paid or provision shall have been made for the payment thereof, and, to the best of the Acquired Fund’s knowledge, no such return is currently under audit and no assessment has been asserted with respect to such returns;
(i) For each taxable year of its operation (including the taxable year ending on the Closing Date), the Acquired Fund has met the requirements of Subchapter M of the Code for qualification as a regulated investment company, has elected to be treated as such, and has been eligible to and has computed its federal income tax under Section 852 of the Code;
(j) For all taxable years and all applicable quarters of the Acquired Fund from the date of its inception, the assets of the Acquired Fund have been sufficiently diversified that each segregated asset account investing all its assets in the Acquired Fund was adequately diversified within the meaning of Section 817(h) of the Code.
(k) All issued and outstanding shares of the Acquired Fund (i) have been offered and sold in every state and the District of Columbia in compliance in all material respects with applicable registration requirements of the 1933 Act and state securities laws, (ii) are, and on the Closing Date will be, duly and validly issued and outstanding, fully paid and non-assessable (recognizing that, under Massachusetts law, Acquired Fund Shareholders, under certain circumstances, could be held personally liable for the obligations of the Acquired Fund), and not subject to preemptive or dissenter’s rights, and (iii) will be held at the time of the Closing by the persons and in the amounts set forth in the records of DWS-ISC, as provided in section 3.4. The Acquired Fund does not have outstanding any options, warrants or other rights to subscribe for or purchase any of the Acquired Fund shares, nor is there outstanding any security convertible into any Acquired Fund shares;
(l) At the Closing Date, the Acquired Fund will have good and marketable title to the Acquired Fund’s assets to be transferred to the Acquiring Fund pursuant to section 1.1 and full right, power, and authority to sell, assign, transfer and deliver such assets hereunder free of any liens or other encumbrances, except those liens or encumbrances as to which the Acquiring Fund has received notice at or prior to the Closing, and upon delivery and payment for such assets, the Acquiring Fund will acquire good and marketable title thereto, subject to no restrictions on the full transfer thereof, including such restrictions as might arise under the 1933 Act and the 1940 Act, except those restrictions as to which the Acquiring Fund has received notice and necessary documentation at or prior to the Closing;
B-5
(m) The execution, delivery and performance of this Agreement will have been duly authorized prior to the Closing Date by all necessary action on the part of the trustees of the Acquired Trust (including the determinations required by Rule 17a-8(a) under the 1940 Act), and, subject to the approval of the Acquired Fund Shareholders, this Agreement constitutes a valid and binding obligation of the Acquired Trust, on behalf of the Acquired Fund, enforceable in accordance with its terms, subject, as to enforcement, to bankruptcy, insolvency, fraudulent transfer, reorganization, moratorium and other laws relating to or affecting creditors’ rights and to general equity principles;
(n) The information to be furnished by the Acquired Fund for use in applications for orders, registration statements or proxy materials or for use in any other document filed or to be filed with any federal, state or local regulatory authority (including the Financial Industry Regulatory Authority (“FINRA”)), which may be necessary in connection with the transactions contemplated hereby, shall be accurate and complete in all material respects and shall comply in all material respects with federal securities and other laws and regulations applicable thereto;
(o) The most recently effective prospectuses and statement of additional information of the Acquired Fund conform in all material respects to the applicable requirements of the 1933 Act and the 1940 Act and the rules and regulations of the Commission thereunder and do not include any untrue statement of a material fact or omit to state any material fact required to be stated therein or necessary to make the statements therein, in light of the circumstances under which they were made, not materially misleading; and
(p) The Registration Statement referred to in section 5.7, insofar as it relates to the Acquired Fund, will, on the effective date of the Registration Statement and on the Closing Date, (i) comply in all material respects with the provisions and regulations of the 1933 Act, the 1934 Act and the 1940 Act, as applicable, and (ii) not contain any untrue statement of a material fact or omit to state a material fact required to be stated therein or necessary to make the statements therein, in light of the circumstances under which such statements are made, not materially misleading; provided, however, that the representations and warranties in this section shall not apply to statements in or omissions from the Registration Statement made in reliance upon and in conformity with information that was furnished or should have been furnished by the Acquiring Fund for use therein.
(q) The Acquired Fund shares have been duly established and designated by the Board of Trustees of the Acquired Trust.
4.2 The Acquiring Trust, on behalf of the Acquiring Fund, represents and warrants to the Acquired Fund as follows:
(a) The Acquiring Trust is a Massachusetts business trust duly organized and validly existing under the laws of The Commonwealth of Massachusetts with power under the Acquiring Trust’s Amended and Restated Declaration of Trust, as amended, to own all of its properties and assets and to carry on its business as it is now being conducted and to carry out the Agreement. The Acquiring Fund is a separate series of the Acquiring Trust duly designated in accordance with the applicable provisions of the Acquiring Trust’s Amended and Restated Declaration of Trust, as amended. The Acquiring Trust and Acquiring Fund are qualified to do business in all jurisdictions in which they are required to be so qualified, except jurisdictions in which the failure to so qualify would not have a material adverse effect on the Acquiring Trust or Acquiring Fund. The Acquiring Fund has all material federal, state and local authorizations necessary to own all of the properties and assets and to carry on its business as now being conducted, except authorizations which the failure to so obtain would not have a material adverse effect on the Acquiring Fund;
(b) The Acquiring Trust is registered with the Commission as an open-end management investment company under the 1940 Act, and such registration is in full force and effect and the Acquiring Fund is in compliance in all material respects with the 1940 Act and the rules and regulations thereunder;
B-6
(c) No consent, approval, authorization, or order of any court or governmental authority is required for the consummation by the Acquiring Fund of the transactions contemplated herein, except such as have been obtained under the 1933 Act, the 1934 Act, and the 1940 Act and such as may be required by state securities laws;
(d) The Acquiring Trust is not, and the execution, delivery and performance of this Agreement by the Acquiring Trust will not result (i) in violation of Massachusetts law or of the Acquiring Trust’s Amended and Restated Declaration of Trust or By-Laws, each as amended, (ii) in a violation or breach of, or constitute a default under, any material agreement, indenture, instrument, contract, lease or other undertaking to which the Acquiring Fund is a party or by which it is bound, and the execution, delivery and performance of this Agreement by the Acquiring Fund will not result in the acceleration of any obligation, or the imposition of any penalty, under any agreement, indenture, instrument, contract, lease, judgment or decree to which the Acquiring Fund is a party or by which it is bound, or (iii) in the creation or imposition of any lien, charge or encumbrance on any property or assets of the Acquiring Fund;
(e) No material litigation or administrative proceeding or investigation of or before any court or governmental body is presently pending or to the Acquiring Fund’s knowledge threatened against the Acquiring Fund or any properties or assets held by it. The Acquiring Fund knows of no facts which might form the basis for the institution of such proceedings which would materially and adversely affect its business and is not a party to or subject to the provisions of any order, decree or judgment of any court or governmental body which materially and adversely affects its business or its ability to consummate the transactions herein contemplated;
(f) The Statements of Assets and Liabilities, Operations, and Changes in Net Assets, the Financial Highlights, and the Investment Portfolio of the Acquiring Fund at and for the fiscal year ended December 31, 2009, and, at and as of the Closing Date, the Statements of Assets and Liabilities, Operations, and Changes in Net Assets, the Financial Highlights, and the Investment Portfolio of the Acquiring Fund at and for the fiscal year ended December 31, 2010, have been audited in each case by PricewaterhouseCoopers LLP, Independent Registered Public Accounting Firm, and, with the unaudited Statements of Assets and Liabilities, Operations, and Changes in Net Assets, Financial Highlights, and Investment Portfolio of the Acquiring Fund at and for the six months ended June 30, 2010, are in accordance with GAAP consistently applied, and such statements (a copy of each of which has been furnished to the Acquired Fund, or, in the case of such statements of the Acquiring Fund at and for the fiscal year ended December 31, 2010, copies of which shall be furnished to the Acquired Fund) present fairly, in all material respects, the financial position of the Acquiring Fund as of such date in accordance with GAAP and there are no known contingent liabilities of the Acquiring Fund required to be reflected on a statement of assets and liabilities (including the notes thereto) in accordance with GAAP as of such date not disclosed therein;
(g) Since December 31, 2009, there has not been any material adverse change in the Acquiring Fund’s financial condition, assets, liabilities or business other than changes occurring in the ordinary course of business, or any incurrence by the Acquiring Fund of indebtedness maturing more than one year from the date such indebtedness was incurred except as otherwise disclosed to and accepted in writing by the Acquired Fund. For purposes of this subsection (g), a decline in net asset value per share of the Acquiring Fund due to declines in market values of securities in the Acquiring Fund’s portfolio, the discharge of Acquiring Fund liabilities, or the redemption of Acquiring Fund shares by Acquiring Fund shareholders shall not constitute a material adverse change;
(h) At the date hereof and at the Closing Date, all federal and other tax returns and reports of the Acquiring Fund required by law to have been filed by such dates (including any extensions) shall have been filed and are or will be correct in all material respects, and all federal and other taxes of the Acquiring Fund (whether or not shown as due or required to be shown as due on said returns and reports) shall have been paid or provision shall have been made for the payment thereof, and, to the best of the Acquiring Fund’s knowledge, no such return is currently under audit and no assessment has been asserted with respect to such returns;
B-7
(i) For each taxable year of its operation, the Acquiring Fund has met the requirements of Subchapter M of the Code for qualification as a regulated investment company and has elected to be treated as such, has been eligible to and has computed its federal income tax under Section 852 of the Code, and will do so for the taxable year that includes the Closing Date;
(j) For all taxable years and all applicable quarters of the Acquiring Fund from the date of its inception, the assets of the Acquiring Fund have been sufficiently diversified that each segregated asset account investing all its assets in the Acquiring Fund was adequately diversified within the meaning of Section 817(h) of the Code.
(k) All issued and outstanding shares of the Acquiring Fund (i) have been offered and sold in every state and the District of Columbia in compliance in all material respects with applicable registration requirements of the 1933 Act and state securities laws and (ii) are, and on the Closing Date will be, duly and validly issued and outstanding, fully paid and non-assessable (recognizing that, under Massachusetts law, Acquiring Fund shareholders, under certain circumstances, could be held personally liable for the obligations of the Acquiring Fund), and not subject to preemptive or dissenter’s rights. The Acquiring Fund does not have outstanding any options, warrants or other rights to subscribe for or purchase any of the Acquiring Fund shares, nor is there outstanding any security convertible into any Acquiring Fund shares;
(l) The Acquiring Fund Shares to be issued and delivered to the Acquired Fund, for the account of the Acquired Fund Shareholders, pursuant to the terms of this Agreement, will at the Closing Date have been duly authorized and, when so issued and delivered, will be duly and validly issued and outstanding Acquiring Fund Shares, and will be fully paid and non-assessable (recognizing that, under Massachusetts law, Acquiring Fund shareholders, under certain circumstances, could be held personally liable for the obligations of the Acquiring Fund);
(m) At the Closing Date, the Acquiring Fund will have good and marketable title to the Acquiring Fund’s assets, free of any liens or other encumbrances, except those liens or encumbrances as to which the Acquired Fund has received notice at or prior to the Closing;
(n) The execution, delivery and performance of this Agreement will have been duly authorized prior to the Closing Date by all necessary action on the part of the trustees of the Acquiring Trust (including the determinations required by Rule 17a-8(a) under the 1940 Act) and this Agreement will constitute a valid and binding obligation of the Acquiring Trust, on behalf of the Acquiring Fund, enforceable in accordance with its terms, subject, as to enforcement, to bankruptcy, insolvency, fraudulent transfer, reorganization, moratorium and other laws relating to or affecting creditors’ rights and to general equity principles;
(o) The information to be furnished by the Acquiring Fund for use in applications for orders, registration statements or proxy materials or for use in any other document filed or to be filed with any federal, state or local regulatory authority (including FINRA), which may be necessary in connection with the transactions contemplated hereby, shall be accurate and complete in all material respects and shall comply in all material respects with federal securities and other laws and regulations applicable thereto;
(p) The most recently effective prospectuses and statement of additional information of the Acquiring Fund conform in all material respects to the applicable requirements of the 1933 Act and the 1940 Act and the rules and regulations of the Commission thereunder and do not include any untrue statement of a material fact or omit to state any material fact required to be stated therein or necessary to make the statements therein, in light of the circumstances under which they were made, not materially misleading;
(q) The Registration Statement referred to in section 5.7, only insofar as it relates to the Acquiring Fund, will, on the effective date of the Registration Statement and on the Closing Date, (i) comply in all material respects with the provisions and regulations of the 1933 Act, the 1934 Act, and the 1940 Act and (ii) not contain any untrue statement of a material fact or omit to state a material fact required to be stated therein or necessary to make the statements therein, in light of the circumstances under which such statements were made, not materially misleading; provided, however, that the representations and warranties
B-8
in this section shall not apply to statements in or omissions from the Registration Statement made in reliance upon and in conformity with information that was furnished or should have been furnished by the Acquired Fund for use therein;
(r) The Acquiring Fund agrees to use all reasonable efforts to obtain the approvals and authorizations required by the 1933 Act, the 1940 Act and such of the state securities laws as may be necessary in order to continue its operations after the Closing Date; and
(s) The Acquiring Fund Shares have been duly established and designated by the Board of Trustees of the Acquiring Trust.
| 5. | Covenants of the Acquiring Fund and the Acquired Fund |
5.1 The Acquiring Trust, on behalf of the Acquiring Fund, and the Acquired Trust, on behalf of the Acquired Fund, each covenants to operate its business in the ordinary course between the date hereof and the Closing Date except as otherwise provided herein, it being understood that such ordinary course of business will include the declaration and payment of customary dividends and other distributions and such changes as are contemplated by the Funds’ normal operations. No party shall take any action that would, or reasonably would be expected to, result in any of its representations and warranties set forth in this Agreement being or becoming untrue in any material respect. The Acquired Fund and Acquiring Fund covenant and agree to coordinate their respective portfolios from the date of shareholder approval of the Agreement up to and including the Closing Date, as set forth in Section 5.15, in order that at Closing, when the Assets are added to the Acquiring Fund’s portfolio, the resulting portfolio will remain invested primarily in growth-oriented U.S. equity securities across a broad range of economic sectors, consistent with the Acquiring Fund’s current investment preferences and the current implementation of the Acquiring Fund’s investment objective, policies, strategies and restrictions, as set forth in the Acquiring Fund’s prospectuses, copies of which have been delivered to the Acquired Fund.
5.2 Upon reasonable notice, the Acquiring Trust’s officers and agents shall have reasonable access to the Acquired Fund’s books and records necessary to maintain current knowledge of the Acquired Fund and to ensure that the representations and warranties made by the Acquired Fund are accurate.
5.3 The Acquired Fund covenants to call a meeting of the Acquired Fund Shareholders entitled to vote thereon to consider and act upon this Agreement and to take all other reasonable action necessary to obtain approval of the transactions contemplated herein. Such meeting shall be scheduled for no later than June 13, 2011.
5.4 The Acquired Fund covenants that the Acquiring Fund Shares to be issued hereunder are not being acquired for the purpose of making any distribution thereof other than in accordance with the terms of this Agreement.
5.5 The Acquired Fund covenants that it will assist the Acquiring Fund in obtaining such information as the Acquiring Trust, on behalf of the Acquiring Fund, reasonably requests concerning the beneficial ownership of the Acquired Fund shares.
5.6 Subject to the provisions of this Agreement, the Acquiring Trust, on behalf of the Acquiring Fund, and the Acquired Trust, on behalf of the Acquired Fund, will each take, or cause to be taken, all actions, and do or cause to be done, all things reasonably necessary, proper, and/or advisable to consummate and make effective the transactions contemplated by this Agreement.
5.7 Each Fund covenants to prepare in compliance with the 1933 Act, the 1934 Act and the 1940 Act the Registration Statement on Form N-14 (the “Registration Statement”) in connection with the meeting of the Acquired Fund Shareholders to consider approval of this Agreement and the transactions contemplated herein. The Acquiring Trust will file the Registration Statement, including a proxy statement, with the Commission. The
B-9
Acquired Fund will provide the Acquiring Fund with information reasonably necessary for the preparation of a prospectus, which will include a proxy statement, all to be included in the Registration Statement, in compliance in all material respects with the 1933 Act, the 1934 Act and the 1940 Act.
5.8 The Acquired Trust, on behalf of the Acquired Fund, covenants that it will, from time to time, as and when reasonably requested by the Acquiring Fund, execute and deliver or cause to be executed and delivered all such assignments and other instruments, and will take or cause to be taken such further action as the Acquiring Fund may reasonably deem necessary or desirable in order to vest in and confirm the Acquiring Fund’s title to and possession of all the Assets and otherwise to carry out the intent and purpose of this Agreement.
5.9 The Acquiring Trust, on behalf of the Acquiring Fund, covenants to use all reasonable efforts to obtain the approvals and authorizations required by the 1933 Act and 1940 Act, and such of the state securities laws as it deems appropriate in order to continue the Acquiring Fund’s operations after the Closing Date and to consummate the transactions contemplated herein; provided, however, that the Acquiring Trust may take such actions it reasonably deems advisable after the Closing Date as circumstances change.
5.10 The Acquiring Trust, on behalf of the Acquiring Fund, covenants that it will, from time to time, as and when reasonably requested by the Acquired Fund, execute and deliver or cause to be executed and delivered all such assignments, assumption agreements, releases, and other instruments, and will take or cause to be taken such further action, as the Acquired Fund may reasonably deem necessary or desirable in order to (i) vest and confirm to the Acquired Fund title to and possession of all Acquiring Fund Shares to be transferred to the Acquired Fund pursuant to this Agreement and (ii) assume all of the liabilities of the Acquired Fund.
5.11 As soon as reasonably practicable after the Closing, the Acquired Fund shall make a liquidating distribution to its shareholders consisting of the Acquiring Fund Shares received at the Closing in complete liquidation of the Acquired Fund and the Acquired Fund’s existence shall as soon as possible thereafter be terminated.
5.12 The Acquiring Trust, on behalf of the Acquiring Fund, and the Acquired Trust, on behalf of the Acquired Fund, shall each use its reasonable best efforts to fulfill or obtain the fulfillment of the conditions precedent to effect the transactions contemplated by this Agreement as promptly as practicable.
5.13 The intention of the parties is that the transaction will qualify as a reorganization within the meaning of Section 368(a) of the Code. Neither the Trusts, the Acquiring Fund nor the Acquired Fund shall take any action, or cause any action to be taken (including, without limitation, the filing of any tax return) that is inconsistent with such treatment or results in the failure of the transaction to qualify as a reorganization within the meaning of Section 368(a) of the Code. At or prior to the Closing Date, the Trusts, the Acquiring Fund and the Acquired Fund will take such action, or cause such action to be taken, as is reasonably necessary to enable Willkie Farr & Gallagher LLP to render the tax opinion contemplated herein in section 8.5.
5.14 At or immediately prior to the Closing, the Acquired Fund will declare and pay to its shareholders a dividend or dividends, which, together with all previous such dividends, shall have the effect of distributing to the Acquired Fund Shareholders (i) all of the excess of (x) the Acquired Fund’s interest income excludable from gross income under Section 103(a) of the Code over (y) the Acquired Fund’s deductions disallowed under Sections 265 and 171(a)(2) of the Code, (ii) all of the Acquired Fund’s investment company taxable income as defined in Code Section 852 (computed without regard to any deduction for dividends paid) and (iii) all of the Acquired Fund’s realized net capital gain (after reduction by any capital loss carryover), in each case for both the current taxable year (which will end on the Closing Date) and all preceding taxable years.
5.15 The Acquiring Trust, on behalf of the Acquiring Fund, agrees to identify in writing prior to the Closing Date any assets of the Acquired Fund that the Acquiring Fund does not wish to acquire because they are not consistent with the Acquiring Fund’s current investment preferences and the current implementation of the
B-10
investment objective, policies, restrictions or strategies of the Acquiring Fund, and the Acquired Fund agrees to dispose of such assets prior to the Closing Date. The Acquiring Trust, on behalf of the Acquiring Fund, agrees to identify in writing prior to the Closing Date any assets that it would like the Acquired Fund to purchase so that, immediately after the Closing the Acquiring Fund’s portfolio will remain invested primarily in growth-oriented U.S. equity securities across a broad range of economic sectors, consistent with the Acquiring Fund’s current implementation of its investment objective, policies, restrictions and strategies, and the Acquired Fund agrees to purchase such assets pursuant to the Acquiring Fund’s current implementation of its investment objective, policies, restrictions or strategies prior to the Closing Date. Notwithstanding the foregoing, nothing herein will require the Acquired Fund to dispose of or purchase any assets if, in the reasonable judgment of the Acquired Fund, such disposition would adversely affect the tax-free nature of the reorganization for federal income tax purposes.
5.16 Prior to the Closing, the Acquiring Fund will pay to its shareholders a dividend or dividends, which, together with all previous such dividends, shall have the effect of distributing to the Acquiring Fund shareholders (i) all of the excess of (x) the Acquiring Fund’s interest income excludable from gross income under Section 103(a) of the Code over (y) the Acquiring Fund’s deductions disallowed under Sections 265 and 171(a)(2) of the Code, (ii) all of the Acquiring Fund’s investment company taxable income as defined in Code Section 852 (computed without regard to any deduction for dividends paid) and (iii) all of the Acquiring Fund’s realized net capital gain (after reduction by any capital loss carryover), in each case for both the taxable year ending on December 31, 2010 and all preceding taxable years.
| 6. | Conditions Precedent to Obligations of the Acquired Fund |
The obligations of the Acquired Trust, on behalf of the Acquired Fund, to consummate the transactions provided for herein shall be subject, at its election, to the performance by the Acquiring Fund of all the obligations to be performed by it hereunder on or before the Closing Date, and, in addition thereto, the following further conditions:
6.1 All representations and warranties of the Acquiring Trust, on behalf of the Acquiring Fund, contained in this Agreement shall be true and correct in all material respects as of the date hereof and, except as they may be affected by the transactions contemplated by this Agreement, as of the Closing Date, with the same force and effect as if made on and as of the Closing Date; and there shall be (i) no pending or threatened litigation brought by any person (other than the Acquired Fund, its adviser or any of their affiliates) against the Acquiring Fund or its investment adviser(s), Board members or officers arising out of this Agreement and (ii) no facts known to the Acquiring Fund which the Acquiring Fund reasonably believes might result in such litigation.
6.2 The Acquiring Fund shall have delivered to the Acquired Fund on the Closing Date a certificate executed in its name by the Acquiring Trust’s President, Treasurer or a Vice President, in a form reasonably satisfactory to the Acquired Fund and dated as of the Closing Date, to the effect that the representations and warranties of the Acquiring Trust, on behalf of the Acquiring Fund, made in this Agreement are true and correct on and as of the Closing Date, except as they may be affected by the transactions contemplated by this Agreement, and as to such other matters as the Acquired Fund shall reasonably request.
6.3 The Acquired Trust, on behalf of the Acquired Fund, shall have received on the Closing Date an opinion of Ropes & Gray LLP, in a form reasonably satisfactory to the Acquired Fund, and dated as of the Closing Date, to the effect that:
(a) the Acquiring Trust is a validly existing voluntary association with transferable shares of beneficial interest under the laws of The Commonwealth of Massachusetts;
(b) the Agreement has been duly authorized, executed and delivered by the Acquiring Trust, on behalf of the Acquiring Fund, and constitutes a valid and legally binding obligation of the Acquiring Trust, on behalf of the Acquiring Fund, enforceable in accordance with its terms, subject to bankruptcy, insolvency, fraudulent transfer, reorganization, moratorium and laws of general applicability relating to or affecting creditors’ rights and to general equity principles;
B-11
(c) the execution and delivery of the Agreement by the Acquiring Trust, on behalf of the Acquiring Fund, did not, and the issuance of Acquiring Fund Shares pursuant to the Agreement will not, violate the Acquiring Trust’s Amended and Restated Declaration of Trust, or By-laws, each as amended; and
(d) to the knowledge of such counsel, and without any independent investigation, (i) the Acquiring Fund is not subject to any litigation or other proceedings that might have a materially adverse effect on the operations of the Acquiring Fund, (ii) the Acquiring Trust is registered as an investment company with the Commission and is not subject to any stop order, and (iii) all regulatory consents, authorizations, approvals or filings required to be obtained or made by the Acquiring Fund under the federal laws of the United States or the laws of The Commonwealth of Massachusetts for the issuance of Acquiring Fund Shares pursuant to the Agreement, have been obtained or made.
The delivery of such opinion is conditioned upon receipt by Ropes & Gray LLP of customary representations it shall reasonably request of each of the Acquiring Trust and the Acquired Trust and will be subject to such firm’s customary opinion qualifications, assumptions and limitations.
6.4 The Acquiring Trust, on behalf of the Acquiring Fund, shall have performed all of the covenants and complied with all of the provisions required by this Agreement to be performed or complied with by the Acquiring Fund on or before the Closing Date.
| 7. | Conditions Precedent to Obligations of the Acquiring Fund |
The obligations of the Acquiring Trust, on behalf of the Acquiring Fund, to consummate the transactions provided for herein shall be subject, at its election, to the performance by the Acquired Fund of all of the obligations to be performed by it hereunder on or before the Closing Date and, in addition thereto, the following further conditions:
7.1 All representations and warranties of the Acquired Trust, on behalf of the Acquired Fund, contained in this Agreement shall be true and correct in all material respects as of the date hereof and, except as they may be affected by the transactions contemplated by this Agreement, as of the Closing Date, with the same force and effect as if made on and as of the Closing Date; and there shall be (i) no pending or threatened litigation brought by any person (other than the Acquiring Fund, its adviser or any of their affiliates) against the Acquired Fund or its investment adviser, trustees or officers arising out of this Agreement and (ii) no facts known to the Acquired Fund which the Acquired Fund reasonably believes might result in such litigation.
7.2 The Acquired Fund shall have delivered to the Acquiring Fund a statement of the Acquired Fund’s assets and liabilities as of the Closing Date, certified by the Treasurer of the Acquired Trust.
7.3 The Acquired Fund shall have delivered to the Acquiring Fund on the Closing Date a certificate executed in its name by the Acquired Trust’s President, Treasurer or a Vice President, in a form reasonably satisfactory to the Acquiring Fund, and dated as of the Closing Date, to the effect that the representations and warranties of the Acquired Trust with respect to the Acquired Fund made in this Agreement are true and correct on and as of the Closing Date, except as they may be affected by the transactions contemplated by this Agreement, and as to such other matters as the Acquiring Fund shall reasonably request.
7.4 The Acquiring Trust, on behalf of the Acquiring Fund, shall have received on the Closing Date an opinion of [ACQUIRED TRUST COUNSEL], in a form reasonably satisfactory to the Acquiring Fund, and dated as of the Closing Date, to the effect that:
(a) the Acquired Trust is a validly existing voluntary association with transferable shares of beneficial interest under the laws of The Commonwealth of Massachusetts;
(b) the Agreement has been duly authorized, executed and delivered by the Acquired Trust, on behalf of the Acquired Fund, and constitutes a valid and legally binding obligation of the Acquired Trust, on behalf
B-12
of the Acquired Fund, enforceable in accordance with its terms, subject to bankruptcy, insolvency, fraudulent transfer, reorganization, moratorium and laws of general applicability relating to or affecting creditors’ rights and to general equity principles;
(c) the execution and delivery of the Agreement by the Acquired Trust, on behalf of the Acquired Fund, did not, and the exchange of the Acquired Fund’s assets for Acquiring Fund Shares pursuant to the Agreement will not, violate the Acquired Trust’s Amended and Restated Declaration of Trust, or By-laws, each as amended; and
(d) to the knowledge of such counsel, and without any independent investigation, (i) the Acquired Fund is not subject to any litigation or other proceedings that might have a materially adverse effect on the operations of the Acquired Fund, (ii) the Acquired Trust is registered as an investment company with the Commission and is not subject to any stop order, and (iii) all regulatory consents, authorizations, approvals or filings required to be obtained or made by the Acquired Fund under the federal laws of the United States or the laws of The Commonwealth of Massachusetts for the transfer of the Acquired Fund’s assets and liabilities for Acquiring Fund Shares pursuant to the Agreement, have been obtained or made.
The delivery of such opinion is conditioned upon receipt by [ACQUIRED TRUST COUNSEL] of customary representations it shall reasonably request of each of the Acquiring Trust and the Acquired Trust and will be subject to such firm’s customary opinion qualifications, assumptions and limitations.
7.5 The Acquired Fund, shall have performed all of the covenants and complied with all of the provisions required by this Agreement to be performed or complied with by the Acquired Fund on or before the Closing Date.
| 8. | Further Conditions Precedent to Obligations of the Acquiring Fund and the Acquired Fund |
If any of the conditions set forth below have not been met on or before the Closing Date with respect to the Acquired Fund or the Acquiring Fund, the other party to this Agreement shall, at its option, not be required to consummate the transactions contemplated by this Agreement:
8.1 This Agreement and the transactions contemplated herein shall have been approved by the requisite vote of the holders of the outstanding shares of the Acquired Fund in accordance with the provisions of the Acquired Trust’s Amended and Restated Declaration of Trust and By-Laws, as amended, applicable Massachusetts law and the 1940 Act, and certified copies of the resolutions evidencing such approval shall have been delivered to the Acquiring Fund. Notwithstanding anything herein to the contrary, neither the Acquiring Fund nor the Acquired Fund may waive the conditions set forth in this section 8.1.
8.2 On the Closing Date, no action, suit or other proceeding shall be pending or to its knowledge threatened before any court or governmental agency in which it is sought to restrain or prohibit, or obtain material damages or other relief in connection with, this Agreement or the transactions contemplated herein.
8.3 All consents of other parties and all other consents, orders and permits of federal, state and local regulatory authorities deemed necessary by the Acquiring Trust, on behalf of the Acquiring Fund, or the Acquired Trust, on behalf of the Acquired Fund, to permit consummation, in all material respects, of the transactions contemplated hereby shall have been obtained, except where failure to obtain any such consent, order or permit would not involve a risk of a material adverse effect on the assets or properties of the Acquiring Fund or the Acquired Fund, provided that either party hereto may for itself waive any of such conditions.
8.4 The Registration Statement shall have become effective under the 1933 Act and no stop orders suspending the effectiveness thereof shall have been issued and, to the best knowledge of the parties hereto, no investigation or proceeding for that purpose shall have been instituted or be pending, threatened or contemplated under the 1933 Act.
B-13
8.5 The parties shall have received an opinion of Willkie Farr & Gallagher LLP addressed to each of the Acquiring Fund and the Acquired Fund, in a form reasonably satisfactory to each such party to this Agreement, substantially to the effect that, as further described below, on the basis of the existing provisions of the Code, US Treasury regulations issued thereunder, current administrative rules, pronouncements and court decisions, for federal income tax purposes:
(a) the acquisition by the Acquiring Fund of all of the assets of the Acquired Fund solely in exchange for Acquiring Fund Shares and the assumption by the Acquiring Fund of all of the liabilities of the Acquired Fund, followed by the distribution by the Acquired Fund to its separate accounts as shareholders of all the Acquiring Fund Shares it received in complete liquidation and termination of the Acquired Fund, all pursuant to the Agreement, will constitute a reorganization within the meaning of Section 368(a) of the Code, and the Acquired Fund and the Acquiring Fund will each be a “party to a reorganization” within the meaning of Section 368(b) of the Code;
(b) under Sections 361 and 357(a) of the Code, no gain or loss will be recognized by the Acquired Fund upon the transfer of all its assets to the Acquiring Fund solely in exchange for Acquiring Fund Shares and the assumption of all the Acquired Fund’s liabilities by the Acquiring Fund, or upon the distribution of the Acquiring Fund Shares by the Acquired Fund to its separate accounts as shareholders in complete liquidation;
(c) under Section 354 of the Code, the separate accounts as shareholders of the Acquired Fund will not recognize gain or loss upon the receipt of Acquiring Fund Shares solely in exchange for Acquired Fund shares;
(d) under Section 358 of the Code, the aggregate tax basis of the Acquiring Fund Shares received by each separate account as shareholder of the Acquired Fund in connection with the reorganization will be the same as the aggregate tax basis of the Acquired Fund shares exchanged therefor;
(e) under Section 1223(1) of the Code, the holding period of a separate account as shareholder of the Acquired Fund for Acquiring Fund Shares will be determined by including the period for which the separate account held the Acquired Fund shares exchanged therefor, provided that the separate account held the Acquired Fund shares on the date of the reorganization as capital assets;
(f) under Section 1032 of the Code, no gain or loss will be recognized by the Acquiring Fund upon the receipt of all the assets of the Acquired Fund solely in exchange for Acquiring Fund Shares and the assumption by the Acquiring Fund of all the liabilities of the Acquired Fund;
(g) under Section 362(b) of the Code, the Acquiring Fund’s tax basis in the assets received from the Acquired Fund in the reorganization will be the same as the Acquired Fund’s tax basis in those assets immediately prior to the transfer;
(h) under Section 1223(2) of the Code, the Acquiring Fund’s holding periods in the assets received from the Acquired Fund will include the periods during which such assets were held by the Acquired Fund;
(i) the Acquiring Fund will succeed to and take into account the items of the Acquired Fund described in Section 381(c) of the Code, subject to the conditions and limitations specified in Sections 381, 382, 383 and 384 of the Code and the regulations thereunder.
The opinion will express no view with respect to (1) the effect of the merger on any transferred asset as to which any unrealized gain or loss is required to be recognized under federal income tax principles (i) at the end of a taxable year or upon the termination thereof, or (ii) upon the transfer of such asset regardless of whether such a transfer would otherwise be a non-taxable transaction and (2) any other federal tax issues (except those set forth above) and all state, local or foreign tax issues of any kind.
The delivery of such opinion is conditioned upon receipt by Willkie Farr & Gallagher LLP of certain factual certifications to be made by the officers of the Acquiring Trust and the Acquired Trust, upon which certifications the opinion will explicitly rely. The opinion will note and distinguish certain published precedent. Opinions of
B-14
counsel are not binding upon the Internal Revenue Service or the courts; the opinion is not a guarantee that the tax consequences of the Reorganization will be as described above. The opinion will be based on customary assumptions. There is no assurance that the Internal Revenue Service or a court would agree with the opinion, which therefore cannot be free from doubt. Notwithstanding anything herein to the contrary, neither the Acquiring Fund nor the Acquired Fund may waive the condition set forth in this section 8.5.
9.1 The Acquiring Trust, on behalf of the Acquiring Fund, agrees to indemnify and hold harmless the Acquired Fund and each of the Acquired Trust’s trustees and officers from and against any and all losses, claims, damages, liabilities or expenses (including, without limitation, the payment of reasonable legal fees and reasonable costs of investigation) to which jointly and severally, the Acquired Trust or any of its trustees or officers may become subject, insofar as any such loss, claim, damage, liability or expense (or actions with respect thereto) arises out of or is based on any breach by the Acquiring Fund of any of its representations, warranties, covenants or agreements set forth in this Agreement.
9.2 The Acquired Trust, on behalf of the Acquired Fund, agrees to indemnify and hold harmless the Acquiring Fund and each of the Acquiring Trust’s trustees and officers from and against any and all losses, claims, damages, liabilities or expenses (including, without limitation, the payment of reasonable legal fees and reasonable costs of investigation) to which jointly and severally, the Acquiring Trust or any of its trustees or officers may become subject, insofar as any such loss, claim, damage, liability or expense (or actions with respect thereto) arises out of or is based on any breach by the Acquired Fund of any of its representations, warranties, covenants or agreements set forth in this Agreement.
10.1 The Acquiring Trust, on behalf of the Acquiring Fund, and the Acquired Trust, on behalf of the Acquired Fund, each represents and warrants to the other that it has no obligations to pay any brokers or finders fees in connection with the transactions provided for herein.
10.2 Except as provided herein, the Acquired Fund will bear all the expenses associated with the Reorganization, including, but not limited to, any transaction costs payable by the Acquired Fund in connection with the sale and purchase of assets as directed by the Acquiring Trust, on behalf of the Acquiring Fund, pursuant to Section 5.15 prior to the date of the Reorganization (“Pre-Reorganization Transaction Costs). DIMA agrees to bear mailing, legal and operational expenses, other than Pre-Reorganization Transaction Costs, incurred by the Acquired Fund in connection with the Reorganization to the extent that such expenses exceed the estimated total one-year benefit of the Reorganization to the Acquired Fund, as calculated by DIMA immediately prior to the Closing. Expenses will in any event be paid by the party directly incurring such expenses if and to the extent that the payment by the other party of such expenses would result in the disqualification of the Acquired Fund or the Acquiring Fund, as the case may be, as a regulated investment company within the meaning of Section 851 of the Code.
The Acquiring Trust, on behalf of the Acquiring Fund, and the Acquired Trust, on behalf of the Acquired Fund, agree that neither party has made any representation, warranty or covenant not set forth herein and that this Agreement constitutes the entire agreement between the parties.
This Agreement may be terminated and the transactions contemplated hereby may be abandoned (i) by mutual agreement of the parties, or (ii) by either party if the Closing shall not have occurred on or before
B-15
October 11, 2011, unless such date is extended by mutual agreement of the parties, or (iii) by either party if the other party shall have materially breached its obligations under this Agreement or made a material and intentional misrepresentation herein or in connection herewith. In the event of any such termination, this Agreement shall become void and there shall be no liability hereunder on the part of any party or their respective Board members or officers, except for any such material breach or intentional misrepresentation, as to each of which all remedies at law or in equity of the party adversely affected shall survive.
This Agreement may be amended, modified or supplemented in such manner as may be mutually agreed upon in writing by any authorized officer of the Acquired Trust and any authorized officer of the Acquiring Trust; provided, however, that following the meeting of the Acquired Fund Shareholders called by the Acquired Fund pursuant to section 5.3 of this Agreement, no such amendment may have the effect of changing the provisions for determining the number of the Acquiring Fund Shares to be issued to the Acquired Fund Shareholders under this Agreement to the detriment of such shareholders without their further approval.
Any notice, report, statement or demand required or permitted by any provisions of this Agreement shall be in writing and shall be deemed duly given if delivered by hand (including by Federal Express or similar express courier) or transmitted by facsimile or three days after being mailed by prepaid registered or certified mail, return receipt requested, addressed to the Acquired Fund, 345 Park Avenue, New York, NY 10154, with a copy to [ACQUIRED TRUST COUNSEL], or to the Acquiring Fund, 345 Park Avenue, New York, NY 10154, with a copy to Ropes & Gray LLP, Prudential Tower, 800 Boylston Street, Boston, Massachusetts, 02199, Attention: John W. Gerstmayr, Esq. or to any other address that the Acquired Fund or the Acquiring Fund shall have last designated by notice to the other party.
| 15. | Headings; Counterparts; Assignment; Limitation of Liability |
15.1 The Article and section headings contained in this Agreement are for reference purposes only and shall not affect in any way the meaning or interpretation of this Agreement.
15.2 This Agreement may be executed in any number of counterparts, each of which shall be deemed an original.
15.3 This Agreement shall bind and inure to the benefit of the parties hereto and their respective successors and assigns, but no assignment or transfer hereof or of any rights or obligations hereunder shall be made by any party without the written consent of the other party. Nothing herein expressed or implied is intended or shall be construed to confer upon or give any person, firm or corporation, other than the parties hereto and the shareholders of the Acquiring Fund and the Acquired Fund and their respective successors and assigns, any rights or remedies under or by reason of this Agreement.
15.4 It is expressly agreed that the obligations of any Trust hereunder shall not be binding upon any of the trustees, shareholders, variable life insurance policy and variable annuity contract holders, nominees, officers, agents, or employees of such Trust or the Funds personally, but bind only the respective property of the Acquiring Fund or Acquired Fund, as applicable, as provided in such Trust’s Amended and Restated Declaration of Trust, as amended. Moreover, no series of the Trusts other than the Acquiring Fund or the Acquired Fund, as applicable, shall be responsible for the obligations of such Fund hereunder, and all persons shall look only to the assets of the applicable Fund to satisfy the obligations of such Fund hereunder. The execution and the delivery of this Agreement have been authorized by the Trusts’ trustees, on behalf of the Acquiring Fund and the Acquired Fund, as applicable, and this Agreement has been signed by authorized officers of the Trusts acting as such, and neither such authorization by such trustees, nor such execution and delivery by such officers, shall be deemed to
B-16
have been made by any of them individually or to impose any liability on any of them personally, but shall bind only the respective property of the applicable Fund, as provided in such Trust’s Amended and Restated Declaration of Trust, as amended.
15.5 Notwithstanding anything to the contrary contained in this Agreement, the obligations, agreements, representations and warranties with respect to each Fund shall constitute the obligations, agreements, representations and warranties of that Fund only (the “Obligated Fund”), and in no event shall any other series of the Trusts or the assets of any such series be held liable with respect to the breach or other default by the Obligated Fund of its obligations, agreements, representations and warranties as set forth herein.
15.6 This Agreement shall be governed by, and construed and enforced in accordance with, the laws of The Commonwealth of Massachusetts, without regard to its principles of conflicts of laws.
IN WITNESS WHEREOF, each of the parties hereto has caused this Agreement to be executed as of the date first written above by an authorized officer and its seal to be affixed thereto and attested by its Secretary or Assistant Secretary.
| | |
| Attest: | | DWS VARIABLE SERIES I, on behalf of DWS Capital Growth VIP |
| |
| | |
| Secretary | | By: |
| | Its: President |
| |
| Attest: | | [ACQUIRED TRUST], on behalf of [ACQUIRED FUND] |
| |
| | |
| Secretary | | By: |
| | Its: President |
| |
AGREED TO AND ACKNOWLEDGED ONLY WITH RESPECT TO SECTION 10.2 HERETO DEUTSCHE INVESTMENT MANAGEMENT AMERICAS INC. | | |
| |
| | |
By: Its: | | |
| |
| | |
By: Its: | | |
| | |
B-17
APPENDIX C
Financial Highlights of DWS Capital Growth VIP
Financial Highlights
| | | | | | | | | | | | | | | | | | | | |
Class A Years Ended December 31, | | 2010 | | | 2009 | | | 2008 | | | 2007 | | | 2006 | |
Selected Per Share Data | | | | | | | | | | | | | | | | | | | | |
Net asset value, beginning of period | | $ | 16.93 | | | $ | 13.55 | | | $ | 20.41 | | | $ | 18.24 | | | $ | 16.90 | |
Income (loss) from investment operations: | | | | | | | | | | | | | | | | | | | | |
Net investment income (loss)a | | | .14 | d | | | .14 | | | | .16 | | | | .17 | d | | | .13 | c |
Net realized and unrealized gain (loss) | | | 2.68 | | | | 3.43 | | | | (6.83 | ) | | | 2.12 | | | | 1.31 | |
Total from investment operations | | | 2.82 | | | | 3.57 | | | | (6.67 | ) | | | 2.29 | | | | 1.44 | |
Less distributions from: | | | | | | | | | | | | | | | | | | | | |
Net investment income | | | (.16 | ) | | | (.19 | ) | | | (.19 | ) | | | (.12 | ) | | | (.10 | ) |
Net asset value, end of period | | $ | 19.59 | | | $ | 16.93 | | | $ | 13.55 | | | $ | 20.41 | | | $ | 18.24 | |
Total Return (%)b | | | 16.71 | | | | 26.87 | | | | (32.98 | ) | | | 12.59 | | | | 8.53 | c |
| | | | | |
Ratios to Average Net Assets and Supplemental Data | | | | | | | | | | | | | | | | | | | | |
Net assets, end of period ($ millions) | | | 729 | | | | 715 | | | | 594 | | | | 1,058 | | | | 1,131 | |
Ratio of expenses before expense reductions (%) | | | .51 | | | | .51 | | | | .50 | | | | .53 | | | | .52 | |
Ratio of expenses after expense reductions (%) | | | .51 | | | | .49 | | | | .49 | | | | .52 | | | | .49 | |
Ratio of net investment income (loss) (%) | | | .78 | d | | | .98 | | | | .89 | | | | .86 | d | | | .73 | c |
Portfolio turnover rate (%) | | | 42 | | | | 76 | | | | 21 | | | | 30 | | | | 16 | |
| a | Based on average shares outstanding during the period. |
| b | Total return would have been lower had certain expenses not been reduced. |
| c | Includes non-recurring income from the Advisor recorded as a result of an administrative proceeding regarding disclosure of brokerage allocation practices in connection with sales of DWS Funds. The non-recurring income resulted in an increase in net investment income of $0.007 per share and an increase in the ratio of net investment income of 0.04%. Excluding this non-recurring income, total return would have been 0.03% lower. |
| d | Net investment income per share and ratio of net investment income include non-recurring dividend income amounting to $0.05 and $0.03 per share and 0.28% and 0.17% of average daily net assets for the years ended December 31, 2010 and 2007, respectively. |
C-1
| | | | | | | | | | | | | | | | | | | | |
Class B Years Ended December 31, | | 2010 | | | 2009 | | | 2008 | | | 2007 | | | 2006 | |
Selected Per Share Data | | | | | | | | | | | | | | | | | | | | |
Net asset value, beginning of period | | $ | 16.86 | | | $ | 13.49 | | | $ | 20.31 | | | $ | 18.15 | | | $ | 16.81 | |
Income (loss) from investment operations: | | | | | | | | | | | | | | | | | | | | |
Net investment income (loss)a | | | .08 | d | | | .09 | | | | .10 | | | | .09 | d | | | .06 | c |
Net realized and unrealized gain (loss) | | | 2.67 | | | | 3.43 | | | | (6.81 | ) | | | 2.12 | | | | 1.31 | |
Total from investment operations | | | 2.75 | | | | 3.52 | | | | (6.71 | ) | | | 2.21 | | | | 1.37 | |
Less distributions from: | | | | | | | | | | | | | | | | | | | | |
Net investment income | | | (.10 | ) | | | (.15 | ) | | | (.11 | ) | | | (.05 | ) | | | (.03 | ) |
Net asset value, end of period | | $ | 19.51 | | | $ | 16.86 | | | $ | 13.49 | | | $ | 20.31 | | | $ | 18.15 | |
Total Return (%)b | | | 16.33 | | | | 26.49 | | | | (33.20 | ) | | | 12.18 | | | | 8.17 | c |
| | | | | |
Ratios to Average Net Assets and Supplemental Data | | | | | | | | | | | | | | | | | | | | |
Net assets, end of period ($ millions) | | | 12 | | | | 12 | | | | 10 | | | | 19 | | | | 107 | |
Ratio of expenses before expense reductions (%) | | | .85 | | | | .85 | | | | .85 | | | | .94 | | | | .91 | |
Ratio of expenses after expense reductions (%) | | | .84 | | | | .82 | | | | .82 | | | | .90 | | | | .86 | |
Ratio of net investment income (loss) (%) | | | .45 | d | | | .65 | | | | .56 | | | | .48 | d | | | .36 | c |
Portfolio turnover rate (%) | | | 42 | | | | 76 | | | | 21 | | | | 30 | | | | 16 | |
| a | Based on average shares outstanding during the period. |
| b | Total return would have been lower had certain expenses not been reduced. |
| c | Includes non-recurring income from the Advisor recorded as a result of an administrative proceeding regarding disclosure of brokerage allocation practices in connection with sales of DWS Funds. The non-recurring income resulted in an increase in net investment income of $0.007 per share and an increase in the ratio of net investment income of 0.04%. Excluding this non-recurring income, total return would have been 0.03% lower. |
| d | Net investment income per share and ratio of net investment income include non-recurring dividend income amounting to $0.05 and $0.03 per share and $0.28% and 0.17% of average daily net assets for the years ended December 31, 2010 and 2007, respectively. |
C-2
Financial Highlights of DWS Health Care VIP
Financial Highlights
| | | | | | | | | | | | | | | | | | | | |
Class A Years Ended December 31, | | 2010 | | | 2009 | | | 2008 | | | 2007 | | | 2006 | |
Selected Per Share Data | | | | | | | | | | | | | | | | | | | | |
Net asset value, beginning of period | | $ | 11.21 | | | $ | 9.45 | | | $ | 14.68 | | | $ | 13.77 | | | $ | 13.02 | |
Income (loss) from investment operations: | | | | | | | | | | | | | | | | | | | | |
Net investment income (loss)a | | | .06 | | | | (.01 | ) | | | .09 | c | | | .03 | c | | | (.01 | )b |
Net realized and unrealized gain (loss) | | | .83 | | | | 2.02 | | | | (3.08 | ) | | | 1.75 | | | | .81 | |
Total from investment operations | | | .89 | | | | 2.01 | | | | (2.99 | ) | | | 1.78 | | | | .80 | |
Less distributions from: | | | | | | | | | | | | | | | | | | | | |
Net investment income | | | — | | | | (.13 | ) | | | (.04 | ) | | | — | | | | — | |
Net realized gains | | | (.76 | ) | | | (.12 | ) | | | (2.20 | ) | | | (.87 | ) | | | (.05 | ) |
Total distributions | | | (.76 | ) | | | (.25 | ) | | | (2.24 | ) | | | (.87 | ) | | | (.05 | ) |
Net asset value, end of period | | $ | 11.34 | | | $ | 11.21 | | | $ | 9.45 | | | $ | 14.68 | | | $ | 13.77 | |
Total Return (%) | | | 8.15 | | | | 22.19 | | | | (23.20 | ) | | | 13.20 | | | | 6.17 | b |
| | | | | |
Ratios to Average Net Assets and Supplemental Data | | | | | | | | | | | | | | | | | | | | |
Net assets, end of period ($ millions) | | | 45 | | | | 49 | | | | 60 | | | | 98 | | | | 101 | |
Ratio of expenses (%) | | | .90 | | | | .96 | | | | .92 | | | | .93 | | | | .89 | |
Ratio of net investment income (loss) (%) | | | .52 | | | | (.08 | ) | | | .79 | c | | | .19 | c | | | (.03 | )b |
Portfolio turnover rate (%) | | | 16 | | | | 31 | | | | 24 | | | | 37 | | | | 47 | |
| a | Based on average shares outstanding during the period. |
| b | Includes non-recurring income from the Advisor recorded as a result of an administrative proceeding regarding disclosure of brokerage allocation practices in connection with sales of DWS Funds. The non-recurring income resulted in an increase in net investment income of $0.003 per share and an increase in the ratio of net investment income of 0.02%. Excluding this non-recurring income, total return would have been 0.02% lower. |
| c | Net investment income per share and ratio of net investment income include non-recurring dividend income amounting to $0.03 and $0.02 per share and 0.28% and 0.13% of average daily net assets for the years ended December 31, 2008 and 2007, respectively. |
C-3
| | | | | | | | | | | | | | | | | | | | |
Class B Years Ended December 31, | | 2010 | | | 2009 | | | 2008 | | | 2007 | | | 2006 | |
Selected Per Share Data | | | | | | | | | | | | | | | | | | | | |
Net asset value, beginning of period | | $ | 10.95 | | | $ | 9.23 | | | $ | 14.40 | | | $ | 13.55 | | | $ | 12.87 | |
Income (loss) from investment operations: | | | | | | | | | | | | | | | | | | | | |
Net investment income (loss)a | | | .02 | | | | (.04 | ) | | | .05 | c | | | (.03 | )c | | | (.06 | )b |
Net realized and unrealized gain (loss) | | | .80 | | | | 1.98 | | | | (3.02 | ) | | | 1.75 | | | | .79 | |
Total from investment operations | | | .82 | | | | 1.94 | | | | (2.97 | ) | | | 1.72 | | | | .73 | |
Less distributions from: | | | | | | | | | | | | | | | | | | | | |
Net investment income | | | — | | | | (.10 | ) | | | — | | | | — | | | | — | |
Net realized gains | | | (.76 | ) | | | (.12 | ) | | | (2.20 | ) | | | (.87 | ) | | | (.05 | ) |
Total distributions | | | (.76 | ) | | | (.22 | ) | | | (2.20 | ) | | | (.87 | ) | | | (.05 | ) |
Net asset value, end of period | | $ | 11.01 | | | $ | 10.95 | | | $ | 9.23 | | | $ | 14.40 | | | $ | 13.55 | |
Total Return (%) | | | 7.68 | | | | 21.80 | | | | (23.50 | ) | | | 12.88 | | | | 5.77 | b |
| | | | | |
Ratios to Average Net Assets and Supplemental Data | | | | | | | | | | | | | | | | | | | | |
Net assets, end of period ($ millions) | | | 3 | | | | 3 | | | | 3 | | | | 5 | | | | 21 | |
Ratio of expenses (%) | | | 1.25 | | | | 1.34 | | | | 1.27 | | | | 1.34 | | | | 1.28 | |
Ratio of net investment income (loss) (%) | | | .16 | | | | (.46 | ) | | | .43 | c | | | (.22 | )c | | | (.42 | )b |
Portfolio turnover rate (%) | | | 16 | | | | 31 | | | | 24 | | | | 37 | | | | 47 | |
| a | Based on average shares outstanding during the period. |
| b | Includes non-recurring income from the Advisor recorded as a result of an administrative proceeding regarding disclosure of brokerage allocation practices in connection with sales of DWS Funds. The non-recurring income resulted in an increase in net investment income of $0.003 per share and an increase in the ratio of net investment income of 0.02%. Excluding this non-recurring income, total return would have been 0.02% lower. |
| c | Net investment income per share and ratio of net investment income include non-recurring dividend income amounting to $0.03 and $0.02 per share and 0.28% and 0.13% of average daily net assets for the year ended December 31, 2008 and 2007, respectively. |
C-4
Financial Highlights of DWS Technology VIP
Financial Highlights
| | | | | | | | | | | | | | | | | | | | |
Class A Years Ended December 31, | | 2010 | | | 2009 | | | 2008 | | | 2007 | | | 2006 | |
Selected Per Share Data | | | | | | | | | | | | | | | | | | | | |
Net asset value, beginning of period | | $ | 9.24 | | | $ | 5.76 | | | $ | 10.71 | | | $ | 9.37 | | | $ | 9.30 | |
Income (loss) from investment operations: | | | | | | | | | | | | | | | | | | | | |
Net investment income (loss)a | | | (.03 | ) | | | .01 | | | | (.00 | )* | | | (.02 | ) | | | (.01 | )c |
Net realized and unrealized gain (loss) | | | 1.75 | | | | 3.47 | | | | (4.95 | ) | | | 1.36 | | | | .08 | |
Total from investment operations | | | 1.72 | | | | 3.48 | | | | (4.95 | ) | | | 1.34 | | | | .07 | |
Less distributions from: | | | | | | | | | | | | | | | | | | | | |
Net investment income | | | (.00 | )* | | | — | | | | — | | | | — | | | | — | |
Net asset value, end of period | | $ | 10.96 | | | $ | 9.24 | | | $ | 5.76 | | | $ | 10.71 | | | $ | 9.37 | |
Total Return (%) | | | 18.66 | | | | 60.42 | | | | (46.22 | )b | | | 14.30 | | | | .75 | c |
| | | | | |
Ratios to Average Net Assets and Supplemental Data | | | | | | | | | | | | | | | | | | | | |
Net assets, end of period ($ millions) | | | 76 | | | | 78 | | | | 60 | | | | 153 | | | | 165 | |
Ratio of expenses before expense reductions (%) | | | .93 | | | | .84 | | | | 1.01 | | | | .91 | | | | .89 | |
Ratio of expenses after expense reductions (%) | | | .93 | | | | .84 | | | | 1.00 | | | | .91 | | | | .89 | |
Ratio of net investment income (loss) (%) | | | (.29 | ) | | | .08 | | | | (.01 | ) | | | (.15 | ) | | | (.12 | )c |
Portfolio turnover rate (%) | | | 23 | | | | 45 | | | | 71 | | | | 91 | | | | 49 | |
| a | Based on average shares outstanding during the period. |
| b | Total return would have been lower had certain expenses not been reduced. |
| c | Includes non-recurring income from the Advisor recorded as a result of an administrative proceeding regarding disclosure of brokerage allocation practices in connection with sales of DWS Funds. The non-recurring income resulted in an increase in net investment income of $0.017 per share and an increase in the ratio of net investment income of 0.18%. Excluding this non-recurring income, total return would have been 0.19% lower. |
| * | Amount is less than $0.005. |
C-5
| | | | | | | | | | | | | | | | | | | | |
Class B Years Ended December 31, | | 2010 | | | 2009 | | | 2008 | | | 2007 | | | 2006 | |
| | | | | |
Selected Per Share Data | | | | | | | | | | | | | | | | | | | | |
Net asset value, beginning of period | | $ | 9.02 | | | $ | 5.64 | | | $ | 10.53 | | | $ | 9.25 | | | $ | 9.21 | |
Income (loss) from investment operations: | | | | | | | | | | | | | | | | | | | | |
Net investment income (loss)a | | | (.06 | ) | | | (.02 | ) | | | (.03 | ) | | | (.05 | ) | | | (.04 | )c |
Net realized and unrealized gain (loss) | | | 1.68 | | | | 3.40 | | | | (4.86 | ) | | | 1.33 | | | | .08 | |
Total from investment operations | | | 1.62 | | | | 3.38 | | | | (4.89 | ) | | | 1.28 | | | | .04 | |
Net asset value, end of period | | $ | 10.64 | | | $ | 9.02 | | | $ | 5.64 | | | $ | 10.53 | | | $ | 9.25 | |
Total Return (%) | | | 17.96 | | | | 59.93 | | | | (46.44 | )b | | | 13.84 | | | | .43 | c |
| | | | | |
Ratios to Average Net Assets and Supplemental Data | | | | | | | | | | | | | | | | | | | | |
Net assets, end of period ($ millions) | | | .1 | | | | 3 | | | | 2 | | | | 3 | | | | 14 | |
Ratio of expenses before expense reductions (%) | | | 1.29 | | | | 1.18 | | | | 1.35 | | | | 1.29 | | | | 1.28 | |
Ratio of expenses after expense reductions (%) | | | 1.29 | | | | 1.18 | | | | 1.35 | | | | 1.29 | | | | 1.28 | |
Ratio of net investment income (loss) (%) | | | (.64 | ) | | | (.27 | ) | | | (.35 | ) | | | (.53 | ) | | | (.51 | )c |
Portfolio turnover rate (%) | | | 23 | | | | 45 | | | | 71 | | | | 91 | | | | 49 | |
| a | Based on average shares outstanding during the period. |
| b | Total return would have been lower had certain expenses not been reduced. |
| c | Includes non-recurring income from the Advisor recorded as a result of an administrative proceeding regarding disclosure of brokerage allocation practices in connection with sales of DWS Funds. The non-recurring income resulted in an increase in net investment income of $0.017 per share and an increase in the ratio of net investment income of 0.18%. Excluding this non-recurring income, total return would have been 0.19% lower. |
C-6
TABLE OF CONTENTS
HC.TECH.VIP-021811
| | | | |
| | VOTING OPTIONS: |
| | |
| |  | | VOTE ON THE INTERNET Log on to: www.proxy-direct.com Follow the on-screen instructions available 24 hours |
| | |
| |  | | VOTE BY PHONE Call 1-800-337-3503 Follow the recorded instructions available 24 hours |
| | |
| |  | | VOTE BY MAIL Vote, sign and date this Proxy Card and return in the postage-paid envelope |
| | |
| |  | | VOTE IN PERSON Attend Shareholder Meeting 345 Park Avenue, 24th Floor New York, NY 10154 on April 11, 2011 |
Please detach at perforation before mailing.
| | | | |

280 Oser Avenue Hauppauge, NY 11788-3610 | | DWS VARIABLE SERIES I DWS HEALTH CARE VIP PROXY FOR THE SPECIAL MEETING OF SHAREHOLDERS 345 Park Avenue, 24th Floor, New York, New York 10154 3:00 p.m., Eastern time, on April 11, 2011 | | PROXY CARD |
The undersigned hereby appoint(s) Caroline Pearson, John Millette and Rita Rubin, and each of them, with full power of substitution, as proxy or proxies of the undersigned to vote all shares of the Fund that the undersigned is entitled in any capacity to vote at the above-stated Special Meeting of Shareholders, and at any and all adjournments or postponements thereof (the “Special Meeting”). This proxy will be governed by and construed in accordance with the laws of Massachusetts and applicable federal securities laws. The execution of this proxy is not intended to, and does not, revoke any prior proxies or powers of attorney other than the revocation, in accordance with the laws of the Commonwealth of Massachusetts and applicable federal securities laws, of any proxy previously granted specifically in connection with the voting of the shares subject hereto.
All properly executed proxies will be voted as directed. If no instructions are indicated on a properly executed proxy, the proxy will be voted FOR the Proposal. Receipt of the Notice of Special Meeting of Shareholders and the related Prospectus/Proxy Statement is hereby acknowledged.
| | | | | | |
| VOTE VIA THE INTERNET: www.proxy-direct.com |
| VOTE VIA THE TELEPHONE: 1-800-337-3503 |
| | | | |
Note: Joint owners should EACH sign. Please sign EXACTLY as your name(s) appears on this proxy card. When signing as attorney, trustee, executor, administrator, guardian or corporate officer, please give your FULL title as such. |
| | |
| | | | | |
| | | | |
| Signature(s) (Title(s), if applicable) |
| | |
| | | | | |
Please detach at perforation before mailing.
THIS PROXY IS SOLICITED ON BEHALF OF THE BOARD OF TRUSTEES WITH RESPECT TO YOUR FUND. THE FOLLOWING MATTERS ARE PROPOSED BY YOUR FUND. THE BOARD OF TRUSTEES RECOMMENDS A VOTE FOR THE PROPOSAL.
TO VOTE, MARK A BLOCK BELOW IN BLUE OR BLACK INK. Example: ¢
| | | | | | | | | | | | | | |
| VOTE THE PROPOSAL: | | | | | | | | | | | | |
| | | FOR | | | AGAINST | | | ABSTAIN | |
| | | | |
| 1. | | To approve an Agreement and Plan of Reorganization and the transactions it contemplates, including the transfer of all of the assets of DWS Health Care VIP, a series of DWS Variable Series I (“Health Care”) to DWS Capital Growth VIP, a series of DWS Variable Series I (“Capital Growth”), in exchange for shares of Capital Growth and the assumption by Capital Growth of all the liabilities of Health Care, and the distribution of such shares, on a tax-free basis for federal income tax purposes, to the shareholders of Health Care in complete liquidation and termination of Health Care. | | | ¨ | | | | ¨ | | | | ¨ | |
UNLESS VOTING BY TELEPHONE OR INTERNET, PLEASE SIGN, DATE AND MAIL THIS PROXY CARD PROMPTLY USING THE ENCLOSED ENVELOPE.
NO POSTAGE REQUIRED.
HEI_22396_022811
| | | | |
| | VOTING OPTIONS: |
| | |
| | | | VOTE ON THE INTERNET Log on to: www.proxy-direct.com Follow the on-screen instructions available 24 hours |
| | |
| | | | VOTE BY PHONE Call 1-800-337-3503 Follow the recorded instructions available 24 hours |
| | |
| | | | VOTE BY MAIL Vote, sign and date this Proxy Card and return in the postage-paid envelope |
| | |
| | | | VOTE IN PERSON Attend Shareholder Meeting 345 Park Avenue, 24th Floor New York, NY 10154 on April 11, 2011 |
Please detach at perforation before mailing.
| | | | |
280 Oser Avenue Hauppauge, NY 11788-3610 | | DWS VARIABLE SERIES II DWS TECHNOLOGY VIP PROXY FOR THE SPECIAL MEETING OF SHAREHOLDERS 345 Park Avenue, 24th Floor, New York, New York 10154 3:00 p.m., Eastern time, on April 11, 2011 | | PROXY CARD |
The undersigned hereby appoint(s) Caroline Pearson, John Millette and Rita Rubin, and each of them, with full power of substitution, as proxy or proxies of the undersigned to vote all shares of the Fund that the undersigned is entitled in any capacity to vote at the above-stated Special Meeting of Shareholders, and at any and all adjournments or postponements thereof (the “Special Meeting”). This proxy will be governed by and construed in accordance with the laws of Massachusetts and applicable federal securities laws. The execution of this proxy is not intended to, and does not, revoke any prior proxies or powers of attorney other than the revocation, in accordance with the laws of the Commonwealth of Massachusetts and applicable federal securities laws, of any proxy previously granted specifically in connection with the voting of the shares subject hereto.
All properly executed proxies will be voted as directed. If no instructions are indicated on a properly executed proxy, the proxy will be voted FOR the Proposal. Receipt of the Notice of Special Meeting of Shareholders and the related Prospectus/Proxy Statement is hereby acknowledged.
| | | | | | |
| VOTE VIA THE INTERNET: www.proxy-direct.com |
| VOTE VIA THE TELEPHONE: 1-800-337-3503 |
| | | | | | |
Note: Joint owners should EACH sign. Please sign EXACTLY as your name(s) appears on this proxy card. When signing as attorney, trustee, executor, administrator, guardian or corporate officer, please give your FULL title as such. |
| | | | | | |
Signature(s) (Title(s), if applicable) |
Please detach at perforation before mailing.
THIS PROXY IS SOLICITED ON BEHALF OF THE BOARD OF TRUSTEES WITH RESPECT TO YOUR FUND. THE FOLLOWING MATTERS ARE PROPOSED BY YOUR FUND. THE BOARD OF TRUSTEES RECOMMENDS A VOTE FOR THE PROPOSAL.
TO VOTE, MARK A BLOCK BELOW IN BLUE OR BLACK INK. Example: ¢
| | | | | | | | | | | | | | |
| VOTE THE PROPOSAL: | | | | | | | | | | | | |
| | | FOR | | | AGAINST | | | ABSTAIN | |
| | | | |
| 1. | | To approve an Agreement and Plan of Reorganization and the transactions it contemplates, including the transfer of all of the assets of DWS Technology VIP, a series of DWS Variable Series II (“Technology”) to DWS Capital Growth VIP, a series of DWS Variable Series I (“Capital Growth”), in exchange for shares of Capital Growth and the assumption by Capital Growth of all the liabilities of Technology, and the distribution of such shares, on a tax-free basis for federal income tax purposes, to the shareholders of Technology in complete liquidation and termination of Technology. | | | ¨ | | | | ¨ | | | | ¨ | |
UNLESS VOTING BY TELEPHONE OR INTERNET, PLEASE SIGN, DATE AND MAIL THIS PROXY CARD PROMPTLY USING THE ENCLOSED ENVELOPE.
NO POSTAGE REQUIRED.
TEC_22396_022811
DWS VARIABLE SERIES I DWS VARIABLE SERIES II SUPPLEMENT TO THE CURRENTLY EFFECTIVE PROSPECTUSES AND SUMMARY PROSPECTUSES OF EACH OF THE LISTED FUNDS: |
| | | |
| | | |
DWS Health Care VIP DWS Technology VIP |
The Board of each fund noted above has approved a proposal by Deutsche Investment Management Americas Inc. (”DIMA”), the advisor of each fund, to effect the following fund reorganizations or “mergers”:
| Acquired Funds | Acquiring Fund |
DWS Variable Series I — DWS Health Care VIP DWS Variable Series II — DWS Technology VIP | DWS Variable Series I — DWS Capital Growth VIP DWS Variable Series I — DWS Capital Growth VIP |
Completion of each merger is subject to a number of conditions, including approval by shareholders of the applicable Acquired Fund at a shareholder meeting expected to be held during the month of April, 2011. Prior to the shareholder meeting, with respect to shares of the Acquired Funds owned as of the record date for the shareholder meeting, each contract owner and their insurance company will receive: (i) a proxy statement/prospectus describing in detail the proposed merger and the Board’s considerations in recommending that shareholders approve the merger; and (ii) a prospectus for the Acquiring Fund. Each such contract owner will also receive a voting instruction form and instructions on how to submit their voting instructions to their insurance company. The contract owner’s insurance company, as shareholder, will actually vote the shares corresponding to the contract owner’s investment (likely by executing a proxy card) once it receives voting instructions.
If shareholder approval is obtained, the mergers are expected to occur on or about May 1, 2011 and are expected to be tax–free reorganizations for federal income tax purposes. On the merger date, an investment in each Acquired Fund will, in effect, be exchanged for an investment with an equal aggregate net asset value in the Acquiring Fund. Therefore, as a result of the mergers, shareholders of each Acquired Fund will become shareholders of the Acquiring Fund. You can find information about the Acquiring Fund and its risks, including a prospectus and summary prospectus, online at www.dws–investments.com/vipros. You can also get this information at no cost by e–mailing a request to inquiry.info@dws.com, calling (800) 728–3337 or by contacting your insurance company.
Please Retain This Supplement for Future Reference
January 19, 2011 PROSTKR–5 |

| SUPPLEMENT TO THE CURRENTLY EFFECTIVE PROSPECTUSES: |
| | | |
| | | |
Cash Account Trust Government & Agency Securities Portfolio Money Market Portfolio Tax–Exempt Portfolio Cash Management Fund Institutional Cash Reserve Fund, Inc. Prime Series Cash Reserves Fund Institutional Daily Assets Fund Institutional DWS Alternative Asset Allocation Plus Fund DWS Balanced Fund DWS Blue Chip Fund DWS California Tax–Free Income Fund DWS Capital Growth Fund DWS Climate Change Fund DWS Communications Fund DWS Core Fixed Income Fund DWS Core Plus Income Fund DWS Disciplined Market Neutral Fund DWS Diversified International Equity Fund DWS Dreman International Value Fund DWS Dreman Mid Cap Value Fund DWS Dreman Small Cap Value Fund DWS EAFE® Equity Index Fund DWS Emerging Markets Equity Fund DWS Emerging Markets Fixed Income Fund DWS Enhanced Commodity Strategy Fund DWS Equity 500 Index Fund DWS Floating Rate Plus Fund DWS Global Bond Fund DWS Global Inflation Plus Fund DWS Global Small Cap Growth Fund DWS Global Thematic Fund DWS GNMA Fund DWS Gold & Precious Metals Fund DWS Growth & Income Fund DWS Health Care Fund DWS High Income Fund DWS High Income Plus Fund DWS Intermediate Tax/AMT Free Fund DWS International Fund DWS Large Cap Focus Growth Fund DWS Large Cap Value Fund DWS Latin America Equity Fund DWS LifeCompass 2015 Fund DWS LifeCompass 2020 Fund DWS LifeCompass 2030 Fund DWS LifeCompass 2040 Fund DWS LifeCompass Retirement Fund DWS Lifecycle Long Range Fund DWS Managed Municipal Bond Fund DWS Massachusetts Tax–Free Fund DWS Mid Cap Growth Fund DWS Money Market Prime Series DWS Money Market Series DWS New York Tax–Free Income Fund DWS RREEF Global Infrastructure Fund DWS RREEF Global Real Estate Securities Fund DWS RREEF Real Estate Securities Fund DWS S&P 500 Index Fund DWS S&P 500 Plus Fund DWS Select Alternative Allocation Fund DWS Short Duration Fund DWS Short Duration Plus Fund DWS Short–Term Municipal Bond Fund DWS Small Cap Core Fund DWS Small Cap Growth Fund DWS Strategic Government Securities Fund DWS Strategic High Yield Tax–Free Fund DWS Strategic Income Fund DWS Strategic Value Fund DWS Target 2011 Fund DWS Target 2012 Fund DWS Target 2013 Fund DWS Target 2014 Fund DWS Technology Fund DWS U.S. Bond Index Fund DWS Variable NAV Money Fund DWS World Dividend Fund Investors Cash Trust Treasury Portfolio NY Tax Free Money Fund Tax Free Money Fund Investment Tax–Exempt California Money Market Fund DWS Variable Series I: DWS Bond VIP DWS Capital Growth VIP DWS Global Opportunities VIP DWS Growth & Income VIP DWS Health Care VIP DWS International VIP DWS Variable Series II: DWS Alternative Asset Allocation Plus VIP DWS Balanced VIP DWS Blue Chip VIP DWS Core Fixed Income VIP DWS Diversified International Equity VIP DWS Dreman Small Mid Cap Value VIP DWS Global Thematic VIP DWS Government & Agency Securities VIP DWS High Income VIP DWS Large Cap Value VIP DWS Mid Cap Growth VIP DWS Money Market VIP DWS Small Cap Growth VIP DWS Strategic Income VIP DWS Strategic Value VIP DWS Technology VIP DWS Turner Mid Cap Growth VIP DWS Investments VIT Funds: DWS Equity 500 Index VIP DWS Small Cap Index VIP |
December 21, 2010 PROSTKR-14 |
The following information replaces the existing disclosure in the “Investing in the Funds–Financial Intermediary Support Payments” or the “How to Exchange or Sell Shares– Financial Intermediary Support Payments” sections of each fund’s/portfolio’s Prospectuses:
FINANCIAL INTERMEDIARY SUPPORT PAYMENTS
The Advisor, DWS Investments Distributors, Inc. (the ”Distributor”) and/or their affiliates may pay additional compensation, out of their own assets and not as an additional charge to the fund, to selected affiliated and unaffiliated brokers, dealers, participating insurance companies or other financial intermediaries (”financial advisors”) in connection with the sale and/or distribution of fund shares or the retention and/or servicing of fund investors and fund shares (“revenue sharing”). Such revenue sharing payments are in addition to any distribution or service fees payable under any Rule 12b–1 or service plan of the fund, any record keeping/sub–transfer agency/networking fees payable by the fund (generally through the Distributor or an affiliate) and/or the Distributor to certain financial advisors for performing such services and any sales charge, commissions, non–cash compensation arrangements expressly permitted under applicable rules of the Financial Industry Regulatory Authority or other concessions described in the fee table or elsewhere in this prospectus or the Statement of Additional Information as payable to all financial advisors. For example, the Advisor, the Distributor and/or their affiliates may compensate financial advisors for providing the fund with “shelf space” or access to a third party platform or fund offering list or other marketing programs, including, without limitation, inclusion of the fund on preferred or recommended sales lists, mutual fund “supermarket” platforms and other formal sales programs; granting the Distributor access to the financial advisor’s sales force; granting the Distributor access to the financial advisor’s conferences and meetings; assistance in training and educating the financial advisor’s personnel; and obtaining other forms of marketing support.
The level of revenue sharing payments made to financial advisors may be a fixed fee or based upon one or more of the following factors: gross sales, current assets and/or number of accounts of the fund attributable to the financial advisor, the particular fund or fund type or other measures as agreed to by the Advisor, the Distributor and/or their affiliates and the financial advisors or any combination thereof. The amount of these revenue sharing payments is determined at the discretion of the Advisor, the Distributor and/or their affiliates from time to time, may be substantial, and may be different for different financial advisors based on, for example, the nature of the services provided by the financial advisor.
The Advisor, the Distributor and/or their affiliates currently make revenue sharing payments from their own assets in connection with the sale and/or distribution of DWS fund shares or the retention and/or servicing of investors and DWS fund shares to financial advisors in amounts that generally range from .01% up to .26% of assets of the fund serviced and maintained by the financial advisor, .05% to .25% of sales of the fund attributable to the financial advisor, a flat fee of $4,000 up to $125,000, or any combination thereof. These amounts are subject to change at the discretion of the Advisor, the Distributor and/or their affiliates. Receipt of, or the prospect of receiving, this additional compensation may influence your financial advisor’s recommendation of the fund or of any particular share class of the fund. You should review your financial advisor’s compensation disclosure and/or talk to your financial advisor to obtain more information on how this compensation may have influenced your financial advisor’s recommendation of the fund. Additional information regarding these revenue sharing payments is included in the fund’s Statement of Additional Information, which is available to you on request at no charge (see the back cover of this prospectus for more information on how to request a copy of the Statement of Additional Information).
The Advisor, the Distributor and/or their affiliates may also make such revenue sharing payments to financial advisors under the terms discussed above in connection with the distribution of both DWS funds and non–DWS funds by financial advisors to retirement plans that obtain record keeping services from ADP, Inc. or ExpertPlan Inc. on the DWS Investments branded retirement plan platform (the “Platform”) with the level of revenue sharing payments being based upon sales of both the DWS funds and the non–DWS funds by the financial advisor on the Platform or current assets of both the DWS funds and the non–DWS funds serviced and maintained by the financial advisor on the Platform.
It is likely that broker–dealers that execute portfolio transactions for the fund will include firms that also sell shares of the DWS funds to their customers. However, the Advisor will not consider sales of DWS fund shares as a factor in the selection of broker–dealers to execute portfolio transactions for the DWS funds. Accordingly, the Advisor has implemented policies and procedures reasonably designed to prevent its traders from considering sales of DWS fund shares as a factor in the selection of broker–dealers to execute portfolio transactions for the fund. In addition, the Advisor, the Distributor and/or their affiliates will not use fund brokerage to pay for their obligation to provide additional compensation to financial advisors as described above.
Please Retain This Supplement for Future Reference
December 21, 2010 PROSTKR-14 |
| SUPPLEMENT TO THE CURRENTLY EFFECTIVE PROSPECTUSES: |
| | | |
| | | |
DWS Alternative Asset Allocation Plus Fund DWS Balanced Fund DWS Blue Chip Fund DWS California Tax–Free Income Fund DWS Capital Growth Fund DWS Climate Change Fund DWS Communications Fund DWS Core Fixed Income Fund DWS Core Plus Income Fund DWS Disciplined Market Neutral Fund DWS Diversified International Equity Fund DWS Dreman International Value Fund DWS Dreman Mid Cap Value Fund DWS Dreman Small Cap Value Fund DWS EAFE® Equity Index Fund DWS Emerging Markets Equity Fund DWS Emerging Markets Fixed Income Fund DWS Enhanced Commodity Strategy Fund DWS Equity 500 Index Fund DWS Europe Equity Fund DWS Floating Rate Plus Fund DWS Global Bond Fund DWS Global Inflation Plus Fund DWS Global Small Cap Growth Fund DWS Global Thematic Fund DWS GNMA Fund DWS Gold & Precious Metals Fund DWS Growth & Income Fund DWS Health Care Fund DWS High Income Fund DWS High Income Plus Fund DWS Intermediate Tax/AMT Free Fund | DWS International Fund DWS Large Cap Focus Growth Fund DWS Large Cap Value Fund DWS Latin America Equity Fund DWS LifeCompass 2015 Fund DWS LifeCompass 2020 Fund DWS LifeCompass 2030 Fund DWS LifeCompass 2040 Fund DWS LifeCompass Retirement Fund DWS Lifecycle Long Range Fund DWS Managed Municipal Bond Fund DWS Massachusetts Tax–Free Fund DWS Mid Cap Growth Fund DWS New York Tax–Free Income Fund DWS RREEF Global Infrastructure Fund DWS RREEF Global Real Estate Securities Fund DWS RREEF Real Estate Securities Fund DWS S&P 500 Index Fund DWS S&P 500 Plus Fund DWS Select Alternative Allocation Fund DWS Short Duration Fund DWS Short Duration Plus Fund DWS Short–Term Municipal Bond Fund DWS Small Cap Core Fund DWS Small Cap Growth Fund DWS Strategic Government Securities Fund DWS Strategic High Yield Tax–Free Fund DWS Strategic Income Fund DWS Strategic Value Fund DWS Target 2010 Fund DWS Target 2011 Fund DWS Target 2012 Fund | DWS Target 2013 Fund DWS Target 2014 Fund DWS Technology Fund DWS U.S. Bond Index Fund DWS Variable Series I: DWS Bond VIP DWS Capital Growth VIP DWS Global Opportunities VIP DWS Growth & Income VIP DWS Health Care VIP DWS International VIP DWS Variable Series II: DWS Alternative Asset Allocation Plus VIP DWS Balanced VIP DWS Blue Chip VIP DWS Core Fixed Income VIP DWS Diversified International Equity VIP DWS Dreman Small Mid Cap Value VIP DWS Global Thematic VIP DWS Government & Agency Securities VIP DWS High Income VIP DWS Large Cap Value VIP DWS Mid Cap Growth VIP DWS Money Market VIP DWS Small Cap Growth VIP DWS Strategic Income VIP DWS Strategic Value VIP DWS Technology VIP DWS Turner Mid Cap Growth VIP DWS Investments VIT Funds: DWS Equity 500 Index VIP DWS Small Cap Index VIP |
The following replaces similar information under “The Investment Advisor” subsection of the “WHO MANAGES AND OVERSEES THE FUND” section of each fund’s prospectus:
Deutsche Investment Management Americas Inc. (“DIMA” or the “Advisor”), with headquarters at 345 Park Avenue, New York, NY 10154, is the investment advisor for the fund. Under the oversight of the Board, the Advisor makes investment decisions, buys and sells securities for the fund and conducts research that leads to these purchase and sale decisions. The Advisor is an indirect, wholly owned subsidiary of Deutsche Bank AG. Deutsche Bank AG is a major global banking institution that is engaged in a wide range of financial services, including investment management, mutual funds, retail, private and commercial banking, investment banking and insurance. The Advisor provides a full range of global investment advisory services to institutional and retail clients.
DWS Investments is part of the Asset Management division of Deutsche Bank AG and, within the US, represents the retail asset management activities of Deutsche Bank AG, Deutsche Bank Trust Company Americas, DIMA and DWS Trust Company. DWS Investments is a global asset management organization that offers a wide range of investing expertise and resources, including hundreds of portfolio managers and analysts and an office network that reaches the world’s major investment centers. This well–resourced global investment platform brings together a wide variety of experience and investment insight across industries, regions, asset classes and investing styles.
The Advisor may utilize the resources of its global investment platform to provide investment management services through branch offices located outside the US In some cases, the Advisor may also utilize its branch offices or affiliates located in the US or outside the US to perform certain services such as trade execution, trade matching and settlement, or various administrative, back–office or other services. To the extent services are performed outside the US, such activity may be subject to both US and foreign regulation. It is possible that the jurisdiction in which the Advisor or its affiliate performs such services may impose restrictions or limitations on portfolio transactions that are different from, and in addition to, those that apply in the US.
Please Retain This Supplement for Future Reference
August 9, 2010
DMF-3606ST
| SUPPLEMENT TO THE CURRENTLY EFFECTIVE PROSPECTUSES: |
| | | |
| | | |
DWS Alternative Asset Allocation Plus Fund DWS Balanced Fund DWS Blue Chip Fund DWS Capital Growth Fund DWS Climate Change Fund DWS Communications Fund DWS Disciplined Long/Short Growth Fund DWS Disciplined Market Neutral Fund DWS Diversified International Equity Fund DWS Dreman International Value Fund DWS Dreman Mid Cap Value Fund DWS Dreman Small Cap Value Fund DWS EAFE® Equity Index Fund DWS Emerging Markets Equity Fund DWS Enhanced Commodity Strategy Fund DWS Equity 500 Index Fund DWS Europe Equity Fund DWS Global Small Cap Growth Fund DWS Global Thematic Fund DWS Gold & Precious Metals Fund DWS Growth & Income Fund DWS Health Care Fund DWS International Fund DWS Large Cap Focus Growth Fund DWS Large Cap Value Fund | DWS Latin America Equity Fund DWS LifeCompass 2015 Fund DWS LifeCompass 2020 Fund DWS LifeCompass 2030 Fund DWS LifeCompass 2040 Fund DWS LifeCompass Protect 2017 Fund DWS LifeCompass Retirement Fund DWS Lifecycle Long Range Fund DWS Mid Cap Growth Fund DWS RREEF Global Infrastructure Fund DWS RREEF Global Real Estate Securities Fund DWS RREEF Real Estate Securities Fund DWS S&P 500 Index Fund DWS S&P 500 Plus Fund DWS Select Alternative Allocation Fund DWS Small Cap Core Fund DWS Small Cap Growth Fund DWS Strategic Value Fund DWS Target 2010 Fund DWS Target 2011 Fund DWS Target 2012 Fund DWS Target 2013 Fund DWS Target 2014 Fund DWS Technology Fund | DWS Variable Series I: DWS Capital Growth VIP DWS Global Opportunities VIP DWS Growth & Income VIP DWS Health Care VIP DWS International VIP DWS Variable Series II: DWS Alternative Asset Allocation Plus VIP DWS Balanced VIP DWS Blue Chip VIP DWS Diversified International Equity VIP DWS Dreman Small Mid Cap Value VIP DWS Global Thematic VIP DWS Large Cap Value VIP DWS Mid Cap Growth VIP DWS Small Cap Growth VIP DWS Strategic Value VIP DWS Technology VIP DWS Turner Mid Cap Growth VIP DWS Investments VIT Funds: DWS Equity 500 Index VIP DWS Small Cap Index VIP |
The following replaces similar information under the “For More Information” subsection of the “OTHER POLICIES AND RISKS” section of each fund’s prospectus:
A complete list of each fund’s portfolio holdings as of the month-end is posted on www.dws-investments.com on or after the last day of the following month. More frequent posting of portfolio holdings information may be made from time to time on www.dws-investments.com. The posted portfolio holdings information is available by fund and generally remains accessible at least until the date on which a fund files its Form N-CSR or N-Q with the Securities and Exchange Commission for the period that includes the date as of which the posted information is current. In addition, each fund’s top ten equity holdings and other fund information is posted on www.dws-investments.com as of the calendar quarter-end on or after the 10th calendar day following quarter-end. Each fund’s Statement of Additional Information includes a description of a fund’s policies and procedures with respect to the disclosure of a fund’s portfolio holdings.
Please Retain This Supplement for Future Reference
July 23, 2010
DMF–3696
[GRAPHIC APPEARS HERE]
PROSPECTUS
MAY 1, 2010
DWS VARIABLE SERIES I
CLASS A
...............................................................................
DWS Bond VIP
DWS Growth & Income VIP
DWS Capital Growth VIP
DWS Global Opportunities VIP
DWS International VIP
DWS Health Care VIP
DWS INVESTMENTS VIT FUNDS
CLASS A
...............................................................................
DWS Equity 500 Index VIP
DWS Small Cap Index VIP
........................................................................... .
This prospectus should be read in conjunction with the variable life insurance
or variable annuity contract prospectus and plan documents for tax-qualified
plans. These shares are available and are being marketed exclusively as a
pooled funding vehicle for life insurance companies writing all types of
variable life insur ance policies and variable annuity contracts.
The Securities and Exchange Commission (SEC) does not approve or disapprove
these shares or determine whether the information in this prospectus is
truthful or complete. It is a criminal offense for anyone to inform you
otherwise.
RESHAPING INVESTING. [DWS INVESTMENTS LOGO]
Deutsche Bank Group
TABLE OF CONTENTS
DWS BOND VIP
Investment Objective........................ 1
Fees and Expenses of the Fund............... 1
Principal Investment Strategy............... 1
Main Risks.................................. 2
Past Performance............................ 3
Management.................................. 3
Purchase and Sale of Fund Shares............ 3
Tax Information............................. 3
Payments to Financial Intermediaries........ 3
DWS GROWTH & INCOME VIP
Investment Objective........................ 4
Fees and Expenses of the Fund............... 4
Principal Investment Strategy............... 4
Main Risks.................................. 4
Past Performance............................ 5
Management.................................. 5
Purchase and Sale of Fund Shares............ 6
Tax Information............................. 6
Payments to Financial Intermediaries........ 6
DWS CAPITAL GROWTH VIP
Investment Objective........................ 7
Fees and Expenses of the Fund............... 7
Principal Investment Strategy............... 7
Main Risks.................................. 8
Past Performance............................ 8
Management.................................. 9
Purchase and Sale of Fund Shares............ 9
Tax Information............................. 9
Payments to Financial Intermediaries........ 9
DWS GLOBAL OPPORTUNITIES VIP
Investment Objective........................ 10
Fees and Expenses of the Fund............... 10
Principal Investment Strategy............... 10
Main Risks.................................. 11
Past Performance............................ 12
Management.................................. 12
Purchase and Sale of Fund Shares............ 12
Tax Information............................. 12
Payments to Financial Intermediaries........ 12
DWS INTERNATIONAL VIP
Investment Objective........................ 13
Fees and Expenses of the Fund............... 13
Principal Investment Strategy............... 13
Main Risks.................................. 14
Past Performance............................ 14
Management.................................. 14
Purchase and Sale of Fund Shares............ 15
Tax Information............................. 15
Payments to Broker-Dealers and
Other Financial Intermediaries.............. 15
Payments to Financial Intermediaries........ 15
DWS HEALTH CARE VIP
Investment Objective........................ 16
Fees and Expenses of the Fund............... 16
Principal Investment Strategy............... 16
Main Risks.................................. 17
Past Performance............................ 17
Management.................................. 18
Purchase and Sale of Fund Shares............ 18
Tax Information............................. 18
Payments to Financial Intermediaries........ 18
DWS EQUITY 500 INDEX VIP
Investment Objective........................ 19
Fees and Expenses of the Fund............... 19
Principal Investment Strategy............... 19
Main Risks.................................. 20
Past Performance............................ 20
Management.................................. 21
Purchase and Sale of Fund Shares............ 21
Tax Information............................. 21
Payments to Financial Intermediaries........ 21
DWS SMALL CAP INDEX VIP
Investment Objective............................ 22
Fees and Expenses of the Fund................... 22
Principal Investment Strategy................... 22
Main Risks...................................... 23
Past Performance................................ 23
Management...................................... 24
Purchase and Sale of Fund Shares................ 24
Tax Information................................. 24
Payments to Financial Intermediaries............ 24
FUND DETAILS
Additional Information About Fund Strategies and
Risks........................................... 25
DWS Bond VIP.................................... 25
DWS Growth & Income VIP......................... 27
DWS Capital Growth VIP.......................... 28
DWS Global Opportunities VIP.................... 29
DWS International VIP........................... 31
DWS Health Care VIP............................. 33
DWS Equity 500 Index VIP........................ 34
DWS Small Cap Index VIP......................... 36
Other Policies and Risks........................ 37
Who Manages and Oversees the Funds.............. 38
Management...................................... 40
INVESTING IN THE FUNDS
Your Investment in the Funds.................... 43
Policies about transactions..................... 43
Buying and Selling Shares....................... 43
How each Fund Calculates Share Price............ 46
Distributions................................... 47
Taxes........................................... 47
FINANCIAL HIGHLIGHTS............................ 48
APPENDIX........................................ 53
Hypothetical Expense Summary.................... 53
Additional Index Information.................... 57
-------------------------------------------------------------------------------
YOUR INVESTMENT IN A FUND IS NOT A BANK DEPOSIT AND IS NOT INSURED OR GUARANTEED
BY THE FEDERAL DEPOSIT INSURANCE CORPORATION OR ANY OTHER GOVERNMENT AGENCY,
ENTITY OR PERSON.
-------------------------------------------------------------------------------
[DWS INVESTMENTS LOGO]
Deutsche Bank Group
DWS BOND VIP
INVESTMENT OBJECTIVE
The fund seeks to maximize total return consistent with preservation of capital
and prudent investment management, by investing for both current income and
capital appreciation.
FEES AND EXPENSES OF THE FUND
This table describes the fees and expenses you may pay if you buy and hold
shares of the fund. This information does not reflect fees associated with the
separate account that invests in the fund or any variable life insurance policy
or variable annuity contract for which the fund is an investment option. These
fees will increase expenses.
SHAREHOLDER FEES
(paid directly from your investment) None
-------------------------------------- -----
ANNUAL FUND OPERATING EXPENSES (expenses that you pay each year as a % of the
value of your investment)
A
----------
Management fee 0.39
------------------------------------------------ ----
Distribution/service
(12b-1) fees None
------------------------------------------------ -----
Other expenses (includes an administrative fee) 0.20
------------------------------------------------ -----
TOTAL ANNUAL FUND OPERATING EXPENSES 0.59
------------------------------------------------ -----
EXAMPLE
This Example is intended to help you compare the cost of investing in the fund
with the cost of investing in other mutual funds. The Example assumes that you
invest $10,000 in the fund for the time periods indicated and then redeem all
of your shares at the end of those periods. The Example also assumes that your
investment has a 5% return each year and that the fund's operating expenses
remain the same. Although your actual costs may be higher or lower, based on
these assumptions your costs would be:
1 YEAR 3 YEARS 5 YEARS 10 YEARS
-------- --------- --------- ---------
$60 $189 $329 $738
--- ---- ---- ----
PORTFOLIO TURNOVER
The fund pays transaction costs when it buys and sells securities (or "turns
over" its portfolio). A higher portfolio turnover may indicate higher
transaction costs. These costs are not reflected in annual fund operating
expenses or in the expense example, but are reflected in fund performance.
Portfolio turnover rate for fiscal year 2009: 284%.
PRINCIPAL INVESTMENT STRATEGY
MAIN INVESTMENTS. Under normal circumstances, the fund invests at least 80% of
net assets, plus the amount of any borrowings for investment purposes, in bonds
of any maturity. The fund invests mainly in US dollar-denominated fixed income
securities, including corporate bonds, US government and agency bonds and
mortgage- and asset-backed securities. The fund may also invest significantly
in foreign investment grade fixed income securities, non-investment grade (high
yield or junk bonds) securities of US and foreign issuers (including issuers in
countries with new or emerging securities markets), or to maintain liquidity,
in cash or money market instruments.
MANAGEMENT PROCESS. In choosing securities, portfolio management uses distinct
processes for various types of securities.
US INVESTMENT GRADE SECURITIES. Portfolio management typically uses a bottom-up
approach that subordinates sector weightings to individual bonds that portfolio
management believes may add above-market value.
FOREIGN INVESTMENT GRADE AND EMERGING MARKETS HIGH YIELD SECURITIES. Portfolio
management uses a relative value strategy to identify the most attractive
foreign markets, then searches those markets for securities that portfolio
management believes offer incremental value
2
PROSPECTUS May 1, 2010 DWS Bond VIP
over US Treasuries. With emerging market securities, portfolio management also
considers short-term factors such as market sentiment, capital flows, and new
issue programs.
HIGH YIELD SECURITIES (OTHER THAN EMERGING MARKETS). Portfolio management
typically seeks issues within attractive industry sectors and with strong
long-term fundamentals and improving credit.
Portfolio management generally sells securities (or exchanges currencies) when
they reach their target prices, when other investments appear more attractive,
or, particularly for high yield securities, when company fundamentals decline
or when portfolio management believes an unexpected development will diminish a
company's competitive position or ability to generate adequate cash flow.
The fund may trade actively. This could raise transaction costs (thus lowering
returns).
--------------------------------------------------------------------------------
DERIVATIVES. The fund may use various types of derivatives (contracts whose
value is based on, for example, indices, currencies or securities) for hedging,
risk management or non-hedging purposes to seek to enhance potential gains. The
fund may use derivatives as a substitute for direct investment in a particular
asset class or to keep cash on hand to meet shareholder redemptions or other
needs. In particular, the fund may use interest rate and currency futures,
Eurodollar futures, interest rate and currency swaps and credit default swaps.
SECURITIES LENDING. The fund may lend securities (up to one-third of total
assets) to approved institutions.
--------------------------------------------------------------------------------
MAIN RISKS
There are several risk factors that could hurt the fund's performance, cause
you to lose money or cause the fund's performance to trail that of other
investments.
INTEREST RATE RISK. When interest rates rise, prices of debt securities
generally decline. The longer the duration of the fund's debt securities, the
more sensitive it will be to interest rate changes. (As a general rule, a 1%
rise in interest rates means a 1% fall in value for every year of duration.)
PREPAYMENT AND EXTENSION RISK. When interest rates fall, issuers of high
interest debt obligations may pay off the debts earlier than expected
(prepayment risk), and the fund may have to reinvest the proceeds at lower
yields. When interest rates rise, issuers of lower interest debt obligations
may pay off the debts later than expected (extension risk), thus keeping the
fund's assets tied up in lower interest debt obligations. These events could
hurt fund performance.
CREDIT RISK. A fund purchasing debt securities faces the risk that the
creditworthiness of an issuer may decline, causing the value of the debt
securities to decline. In addition, an issuer may not be able to make timely
payments on the interest and/or principal on the debt security it has issued.
Because the issuers of high-yield debt securities or junk bonds (debt
securities rated below the fourth highest category) may be in uncertain
financial health, the prices of their debt securities can be more vulnerable to
bad economic news or even the expectation of bad news, than investment-grade
debt securities.
FOREIGN INVESTMENT RISK. To the extent the fund invests in companies based
outside the US, it faces the risks inherent in foreign investing. Adverse
political, economic or social developments could undermine the value of the
fund's investments or prevent the fund from realizing their full value.
Financial reporting standards for companies based in foreign markets differ
from those in the US. Additionally, foreign securities markets generally are
smaller and less liquid than US markets. To the extent that the fund invests in
non-US dollar denominated foreign securities, changes in currency exchange
rates may affect the US dollar value of foreign securities or the income or
gain received on these securities. Foreign investment risks are greater in
emerging markets than in developed markets. Emerging market investments are
often considered speculative.
DERIVATIVES RISK. Risks associated with derivatives include the risk that the
derivative is not well correlated with the security, index or currency to which
it relates; the risk that derivatives may result in losses or missed
opportunities; the risk that the fund will be unable to sell the derivative
because of an illiquid secondary market; the risk that a counterparty is
unwilling or unable to meet its obligation; and the risk that the derivative
transaction could expose the fund to the effects of leverage, which could
increase the fund's exposure to the market and magnify potential losses.
PRICING RISK. If market conditions make it difficult to value some investments,
the fund may value these investments using more subjective methods, such as
fair value pricing.
SECURITIES LENDING RISK. Any decline in the value of a portfolio security that
occurs while the security is out on loan is borne by the fund, and will
adversely affect performance. Also, there may be delays in recovery of
securities loaned or even a loss of rights in the collateral should the
borrower of the securities fail financially while holding the security.
SECURITY SELECTION RISK. The securities in the fund's portfolio may decline in
value. Portfolio management could be wrong in its analysis of industries,
companies, economic trends, the relative attractiveness of different securities
or other matters.
COUNTERPARTY RISK. A financial institution or other counterparty with whom the
fund does business (such as trading or securities lending), or that
underwrites, distributes or guarantees any investments or contracts that the
fund owns or is otherwise exposed to, may decline in financial health and
become unable to honor its commitments, which could lead to losses for the
fund.
3
PROSPECTUS May 1, 2010 DWS Bond VIP
LIQUIDITY RISK. In certain situations, it may be difficult or impossible to
sell an investment in an orderly fashion at an acceptable price. This may be an
ongoing risk for some investments, such as derivatives or restricted securities
that typically trade only among a limited number of investors.
PAST PERFORMANCE
How a fund's returns vary from year to year can give an idea of its risk; so
can comparing fund performance to overall market performance (as measured by an
appropriate market index). Past performance may not indicate future results.
All performance figures below assume that dividends were reinvested. For more
recent performance figures, go to www.dws-investments.com (the Web site does
not form a part of this prospectus) or call the phone number for your share
class included in this prospectus. This information doesn't reflect fees
associated with the separate account that invests in the fund or any variable
life insurance policy or variable annuity contract for which the fund is an
investment option. These fees will reduce returns.
CALENDAR YEAR TOTAL RETURNS (%) (Class A)
[BAR GRAPHIC OMITTED HERE]
[BAR GRAPHIC DATA]
10.56 5.75 7.66 5.06 5.38 2.60 4.72 4.18 -16.77 10.07
2000 2001 2002 2003 2004 2005 2006 2007 2008 2009
Best Quarter: 4.95%, Q3 2009 Worst Quarter: -11.29%, Q4 2008
Year-to-Date as of 3/31/2010: 1.99%
AVERAGE ANNUAL TOTAL RETURNS
(For periods ended 12/31/2009 expressed as a %)
1 5 10
YEAR YEARS YEARS
---------- --------- ---------
CLASS A 10.07 0.50 3.63
---------------------- ----- ---- ----
BARCLAYS CAPITAL US
AGGREGATE BOND INDEX 5.93 4.97 6.33
---------------------- ----- ---- ----
MANAGEMENT
INVESTMENT ADVISOR
Deutsche Investment Management Americas Inc.
PORTFOLIO MANAGER(S)
KENNETH R. BOWLING, CFA, MANAGING DIRECTOR. Portfolio Manager of the fund.
Joined the fund in 2008.
JAMIE GUENTHER, CFA, MANAGING DIRECTOR. Portfolio Manager of the fund. Joined
the fund in 2008.
JOHN BRENNAN, DIRECTOR. Portfolio Manager of the fund. Joined the fund in 2008.
BRUCE HARLEY, CFA, CEBS, DIRECTOR. Portfolio Manager of the fund. Joined the
fund in 2008.
J. RICHARD ROBBEN, CFA, DIRECTOR. Portfolio Manager of the fund. Joined the
fund in 2008.
DAVID VIGNOLO, CFA, VICE PRESIDENT. Portfolio Manager of the fund. Joined the
fund in 2008.
J. KEVIN HORSLEY, CFA, CPA, DIRECTOR. Portfolio Manager of the fund. Joined the
fund in 2008.
STEPHEN WILLER, CFA, VICE PRESIDENT. Portfolio Manager of the fund. Joined the
fund in 2008.
PURCHASE AND SALE OF FUND SHARES
THE FUND IS INTENDED FOR USE IN A VARIABLE INSURANCE PRODUCT. You should
contact the sponsoring insurance company for information on how to purchase and
sell shares of the fund.
TAX INFORMATION
Generally, owners of variable annuity and variable life contracts are not
subject to current federal income taxation on distributions of income or gains
with respect to such contracts. For further information concerning federal
income tax consequences for the holders of variable annuity contracts and
variable life insurance policies, such holders should consult the prospectus
used in connection with the issuance of their particular contracts or policies.
PAYMENTS TO FINANCIAL INTERMEDIARIES
If you purchase the fund through selected affiliated and unaffiliated brokers,
dealers, participating insurance companies or other financial intermediaries,
the fund and its affiliates may pay the financial intermediary for the sale of
fund shares and related services. These payments may create a conflict of
interest by influencing the financial intermediary and your salesperson to
recommend the fund over another investment. Ask your salesperson or visit your
insurance company's web site for more information.
4
PROSPECTUS May 1, 2010 DWS Bond VIP
[DWS INVESTMENTS LOGO]
Deutsche Bank Group
DWS GROWTH & INCOME VIP
INVESTMENT OBJECTIVE
The fund seeks long-term growth of capital, current income and growth of
income.
FEES AND EXPENSES OF THE FUND
This table describes the fees and expenses you may pay if you buy and hold
shares of the fund. This information does not reflect fees associated with the
separate account that invests in the fund or any variable life insurance policy
or variable annuity contract for which the fund is an investment option. These
fees will increase expenses.
SHAREHOLDER FEES
(paid directly from your investment) None
-------------------------------------- -----
ANNUAL FUND OPERATING EXPENSES (expenses that you pay each year as a % of the
value of your investment)
A
----------
Management fee 0.39
------------------------------------------------ ----
Distribution/service
(12b-1) fees None
------------------------------------------------ -----
Other expenses (includes an administrative fee) 0.24
------------------------------------------------ -----
TOTAL ANNUAL FUND OPERATING EXPENSES 0.63
------------------------------------------------ -----
EXAMPLE
This Example is intended to help you compare the cost of investing in the fund
with the cost of investing in other mutual funds. The Example assumes that you
invest $10,000 in the fund for the time periods indicated and then redeem all
of your shares at the end of those periods. The Example also assumes that your
investment has a 5% return each year and that the fund's operating expenses
remain the same. Although your actual costs may be higher or lower, based on
these assumptions your costs would be:
1 YEAR 3 YEARS 5 YEARS 10 YEARS
-------- --------- --------- ---------
$64 $202 $351 $786
--- ---- ---- ----
PORTFOLIO TURNOVER
The fund pays transaction costs when it buys and sells securities (or "turns
over" its portfolio). A higher portfolio turnover may indicate higher
transaction costs. These costs are not reflected in annual fund operating
expenses or in the expense example, but are reflected in fund performance.
Portfolio turnover rate for fiscal year 2009: 82%.
PRINCIPAL INVESTMENT STRATEGY
MAIN INVESTMENTS. The fund invests at least 65% of total assets in equities,
mainly common stocks. Although the fund can invest in companies of any size and
from any country, it invests primarily in large US companies. Portfolio
management may favor securities from different industries and companies at
different times.
MANAGEMENT PROCESS. Portfolio management uses both quantitative and fundamental
analysis to evaluate each company's stock price relative to the company's
earnings, operating trends, market outlook and other measures of performance
potential.
Portfolio management will normally sell a stock when it believes the
fundamental factors have changed, other investments offer better opportunities
or in the course of adjusting the fund's emphasis on or within a given
industry.
--------------------------------------------------------------------------------
DERIVATIVES. The fund may use various types of derivatives (contracts whose
value is based on, for example, indices, currencies or securities) for hedging,
risk management or non-hedging purposes to seek to enhance potential gains. The
fund may use derivatives as a substitute for direct investment in a particular
asset class or to keep cash on hand to meet shareholder redemptions or other
needs.
SECURITIES LENDING. The fund may lend securities (up to one-third of total
assets) to approved institutions.
--------------------------------------------------------------------------------
MAIN RISKS
There are several risk factors that could hurt the fund's performance, cause
you to lose money or cause the fund's performance to trail that of other
investments.
5
PROSPECTUS May 1, 2010 DWS Growth & Income VIP
STOCK MARKET RISK. When stock prices fall, you should expect the value of your
investment to fall as well. To the extent the fund invests in a particular
capitalization or market sector, the fund's performance may be proportionately
affected by that segment's general performance.
FOCUS RISK. To the extent that the fund focuses its investments in particular
industries, asset classes or sectors of the economy, any market price
movements, regulatory or technological changes, or economic conditions
affecting companies in those industries, asset classes or sectors will have a
significant impact on the fund's performance.
SECURITY SELECTION RISK. The securities in the fund's portfolio may decline in
value. Portfolio management could be wrong in its analysis of industries,
companies, economic trends, the relative attractiveness of different securities
or other matters.
SECURITIES LENDING RISK. Any decline in the value of a portfolio security that
occurs while the security is out on loan is borne by the fund, and will
adversely affect performance. Also, there may be delays in recovery of
securities loaned or even a loss of rights in the collateral should the
borrower of the securities fail financially while holding the security.
DERIVATIVES RISK. Risks associated with derivatives include the risk that the
derivative is not well correlated with the security, index or currency to which
it relates; the risk that derivatives may result in losses or missed
opportunities; the risk that the fund will be unable to sell the derivative
because of an illiquid secondary market; the risk that a counterparty is
unwilling or unable to meet its obligation; and the risk that the derivative
transaction could expose the fund to the effects of leverage, which could
increase the fund's exposure to the market and magnify potential losses.
FOREIGN INVESTMENT RISK. To the extent the fund invests in companies based
outside the US, it faces the risks inherent in foreign investing. Adverse
political, economic or social developments could undermine the value of the
fund's investments or prevent the fund from realizing their full value.
Financial reporting standards for companies based in foreign markets differ
from those in the US. Additionally, foreign securities markets generally are
smaller and less liquid than US markets. To the extent that the fund invests in
non-US dollar denominated foreign securities, changes in currency exchange
rates may affect the US dollar value of foreign securities or the income or
gain received on these securities.
COUNTERPARTY RISK. A financial institution or other counterparty with whom the
fund does business (such as trading or securities lending), or that
underwrites, distributes or guarantees any investments or contracts that the
fund owns or is otherwise exposed to, may decline in financial health and
become unable to honor its commitments, which could lead to losses for the
fund.
LIQUIDITY RISK. In certain situations, it may be difficult or impossible to
sell an investment in an orderly fashion at an acceptable price. This may be an
ongoing risk for some investments, such as derivatives or restricted securities
that typically trade only among a limited number of investors.
PRICING RISK. If market conditions make it difficult to value some investments,
the fund may value these investments using more subjective methods, such as
fair value pricing.
PAST PERFORMANCE
How a fund's returns vary from year to year can give an idea of its risk; so
can comparing fund performance to overall market performance (as measured by an
appropriate market index). Past performance may not indicate future results.
All performance figures below assume that dividends were reinvested. For more
recent performance figures, go to www.dws-investments.com (the Web site does
not form a part of this prospectus) or call the phone number for your share
class included in this prospectus. This information doesn't reflect fees
associated with the separate account that invests in the fund or any variable
life insurance policy or variable annuity contract for which the fund is an
investment option. These fees will reduce returns.
CALENDAR YEAR TOTAL RETURNS (%) (Class A)
[BAR GRAPHIC OMITTED HERE]
[BAR GRAPHIC DATA]
-2.10 -11.30 -23.13 26.74 10.16 6.07 13.63 1.36 -38.31 34.15
2000 2001 2002 2003 2004 2005 2006 2007 2008 2009
Best Quarter: 18.25%, Q3 2009 Worst Quarter: -21.95%, Q4 2008
Year-to-Date as of 3/31/2010: 5.81%
AVERAGE ANNUAL TOTAL RETURNS
(For periods ended 12/31/2009 expressed as a %)
1 5 10
YEAR YEARS YEARS
---------- --------- ----------
CLASS A 34.15 0.22 -0.59
-------------------------------- ----- ---- ------
RUSSELL 1000( (Reg. TM)) INDEX 28.43 0.79 -0.49
-------------------------------- ----- ---- ------
MANAGEMENT
INVESTMENT ADVISOR
Deutsche Investment Management Americas Inc.
PORTFOLIO MANAGER(S)
ROBERT WANG, MANAGING DIRECTOR. Portfolio Manager of the fund. Joined the fund
in 2007.
RUSSELL SHTERN, CFA, VICE PRESIDENT. Portfolio Manager of the fund. Joined the
fund in 2010.
6
PROSPECTUS May 1, 2010 DWS Growth & Income VIP
PURCHASE AND SALE OF FUND SHARES
THE FUND IS INTENDED FOR USE IN A VARIABLE INSURANCE PRODUCT. You should
contact the sponsoring insurance company for information on how to purchase and
sell shares of the fund.
TAX INFORMATION
Generally, owners of variable annuity and variable life contracts are not
subject to current federal income taxation on distributions of income or gains
with respect to such contracts. For further information concerning federal
income tax consequences for the holders of variable annuity contracts and
variable life insurance policies, such holders should consult the prospectus
used in connection with the issuance of their particular contracts or policies.
PAYMENTS TO FINANCIAL INTERMEDIARIES
If you purchase the fund through selected affiliated and unaffiliated brokers,
dealers, participating insurance companies or other financial intermediaries,
the fund and its affiliates may pay the financial intermediary for the sale of
fund shares and related services. These payments may create a conflict of
interest by influencing the financial intermediary and your salesperson to
recommend the fund over another investment. Ask your salesperson or visit your
insurance company's web site for more information.
7
PROSPECTUS May 1, 2010 DWS Growth & Income VIP
[DWS INVESTMENTS LOGO]
Deutsche Bank Group
DWS CAPITAL GROWTH VIP
INVESTMENT OBJECTIVE
The fund seeks to provide long-term growth of capital.
FEES AND EXPENSES OF THE FUND
This table describes the fees and expenses you may pay if you buy and hold
shares of the fund. This information does not reflect fees associated with the
separate account that invests in the fund or any variable life insurance policy
or variable annuity contract for which the fund is an investment option. These
fees will increase expenses.
SHAREHOLDER FEES
(paid directly from your investment) None
-------------------------------------- -----
ANNUAL FUND OPERATING EXPENSES (expenses that you pay each year as a % of the
value of your investment)
A
----------
Management fee 0.37
------------------------------------------------ ----
Distribution/service
(12b-1) fees None
------------------------------------------------ -----
Other expenses (includes an administrative fee) 0.14
------------------------------------------------ -----
TOTAL ANNUAL FUND OPERATING EXPENSES 0.51
------------------------------------------------ -----
EXAMPLE
This Example is intended to help you compare the cost of investing in the fund
with the cost of investing in other mutual funds. The Example assumes that you
invest $10,000 in the fund for the time periods indicated and then redeem all
of your shares at the end of those periods. The Example also assumes that your
investment has a 5% return each year and that the fund's operating expenses
remain the same. Although your actual costs may be higher or lower, based on
these assumptions your costs would be:
1 YEAR 3 YEARS 5 YEARS 10 YEARS
-------- --------- --------- ---------
$52 $164 $285 $640
--- ---- ---- ----
PORTFOLIO TURNOVER
The fund pays transaction costs when it buys and sells securities (or "turns
over" its portfolio). A higher portfolio turnover may indicate higher
transaction costs. These costs are not reflected in annual fund operating
expenses or in the expense example, but are reflected in fund performance.
Portfolio turnover rate for fiscal year 2009: 76%.
PRINCIPAL INVESTMENT STRATEGY
MAIN INVESTMENTS. The fund normally invests at least 65% of total assets in
equities, mainly common stocks of US companies. The fund generally focuses on
established companies that are similar in size to the companies in the S&P 500(
(Reg. TM)) Index (generally 500 of the largest companies in the US) or the
Russell 1000( (Reg. TM) )Growth Index (generally those stocks among the 1,000
largest US companies that have above-average price-to-earnings ratios).
Although the fund can invest in companies of any size, the fund intends to
invest primarily in companies whose market capitalizations fall within the
normal range of these indexes.
MANAGEMENT PROCESS. In choosing stocks, portfolio management begins by
utilizing a proprietary quantitative model to rank stocks based on a number of
factors including valuation and profitability. Portfolio management also
applies fundamental techniques to seek to identify companies that display
above-average earnings growth compared to other companies and that have strong
product lines, effective management and leadership positions within core
markets. The factors considered and models used by the portfolio managers may
change over time.
Portfolio management will normally sell a security when it believes the
potential risks have increased, its price is unlikely to go higher, its
fundamental factors have changed, other investments offer better opportunities
or in the course of adjusting the fund's emphasis on a given industry.
--------------------------------------------------------------------------------
DERIVATIVES. The fund may use various types of derivatives (contracts whose
value is based on, for example, indices, currencies or securities) for hedging,
risk management or non-hedging purposes to seek to enhance potential gains. The
fund may use
8
PROSPECTUS May 1, 2010 DWS Capital Growth VIP
derivatives as a substitute for direct investment in a particular asset class
or to keep cash on hand to meet shareholder redemptions or other needs. In
particular, the fund may use futures and options, and write covered call
options.
SECURITIES LENDING. The fund may lend securities (up to one-third of total
assets) to approved institutions.
--------------------------------------------------------------------------------
MAIN RISKS
There are several risk factors that could hurt the fund's performance, cause
you to lose money or cause the fund's performance to trail that of other
investments.
STOCK MARKET RISK. When stock prices fall, you should expect the value of your
investment to fall as well. To the extent the fund invests in a particular
capitalization or market sector, the fund's performance may be proportionately
affected by that segment's general performance.
GROWTH INVESTING RISK. As a category, growth stocks may underperform value
stocks (and the stock market as a whole) over any period of time. Because the
prices of growth stocks are based largely on the expectation of future
earnings, growth stock prices can decline rapidly and significantly in reaction
to negative news about such factors as earnings, the economy, political
developments, or other news.
FOCUS RISK. To the extent that the fund focuses its investments in particular
industries, asset classes or sectors of the economy, any market price
movements, regulatory or technological changes, or economic conditions
affecting companies in those industries, asset classes or sectors will have a
significant impact on the fund's performance.
SECURITY SELECTION RISK. The securities in the fund's portfolio may decline in
value. Portfolio management could be wrong in its analysis of industries,
companies, economic trends, the relative attractiveness of different securities
or other matters.
SECURITIES LENDING RISK. Any decline in the value of a portfolio security that
occurs while the security is out on loan is borne by the fund, and will
adversely affect performance. Also, there may be delays in recovery of
securities loaned or even a loss of rights in the collateral should the
borrower of the securities fail financially while holding the security.
DERIVATIVES RISK. Risks associated with derivatives include the risk that the
derivative is not well correlated with the security, index or currency to which
it relates; the risk that derivatives may result in losses or missed
opportunities; the risk that the fund will be unable to sell the derivative
because of an illiquid secondary market; the risk that a counterparty is
unwilling or unable to meet its obligation; and the risk that the derivative
transaction could expose the fund to the effects of leverage, which could
increase the fund's exposure to the market and magnify potential losses.
FOREIGN INVESTMENT RISK. To the extent the fund invests in companies based
outside the US, it faces the risks inherent in foreign investing. Adverse
political, economic or social developments could undermine the value of the
fund's investments or prevent the fund from realizing their full value.
Financial reporting standards for companies based in foreign markets differ
from those in the US. Additionally, foreign securities markets generally are
smaller and less liquid than US markets. To the extent that the fund invests in
non-US dollar denominated foreign securities, changes in currency exchange
rates may affect the US dollar value of foreign securities or the income or
gain received on these securities.
COUNTERPARTY RISK. A financial institution or other counterparty with whom the
fund does business (such as trading or securities lending), or that
underwrites, distributes or guarantees any investments or contracts that the
fund owns or is otherwise exposed to, may decline in financial health and
become unable to honor its commitments, which could lead to losses for the
fund.
LIQUIDITY RISK. In certain situations, it may be difficult or impossible to
sell an investment in an orderly fashion at an acceptable price. This may be an
ongoing risk for some investments, such as derivatives or restricted securities
that typically trade only among a limited number of investors.
PRICING RISK. If market conditions make it difficult to value some investments,
the fund may value these investments using more subjective methods, such as
fair value pricing.
PAST PERFORMANCE
How a fund's returns vary from year to year can give an idea of its risk; so
can comparing fund performance to overall market performance (as measured by an
appropriate market index). Past performance may not indicate future results.
All performance figures below assume that dividends were reinvested. For more
recent performance figures, go to www.dws-investments.com (the Web site does
not form a part of this prospectus) or call the phone number for your share
class included in this prospectus. This information doesn't reflect fees
associated with the separate account that invests in the fund or any variable
life insurance policy or variable annuity contract for which the fund is an
investment option. These fees will reduce returns.
CALENDAR YEAR TOTAL RETURNS (%) (Class A)
[BAR GRAPHIC OMITTED HERE]
[BAR GRAPHIC DATA]
-9.90 -19.36 -29.18 26.89 7.99 8.96 8.53 12.59 -32.98 26.87
2000 2001 2002 2003 2004 2005 2006 2007 2008 2009
9
PROSPECTUS May 1, 2010 DWS Capital Growth VIP
Best Quarter: 15.13%, Q4 2001 Worst Quarter: -21.49%, Q4 2008
Year-to-Date as of 3/31/2010: 5.43%
AVERAGE ANNUAL TOTAL RETURNS
(For periods ended 12/31/2009 expressed as a %)
1 5 10
YEAR YEARS YEARS
---------- --------- ----------
CLASS A 26.87 2.51 -2.23
-------------------------------- ----- ---- ------
RUSSELL 1000( (Reg. TM)) GROWTH
INDEX 37.21 1.63 -3.99
-------------------------------- ----- ---- ------
MANAGEMENT
INVESTMENT ADVISOR
Deutsche Investment Management Americas Inc.
PORTFOLIO MANAGER(S)
OWEN FITZPATRICK, CFA, MANAGING DIRECTOR. Lead Manager of the fund. Joined the
fund in 2009.
THOMAS M. HYNES, JR., CFA, DIRECTOR. Portfolio Manager of the fund. Joined the
fund in 2009.
BRENDAN O'NEILL, CFA, DIRECTOR. Portfolio Manager of the fund. Joined the fund
in 2009.
PURCHASE AND SALE OF FUND SHARES
THE FUND IS INTENDED FOR USE IN A VARIABLE INSURANCE PRODUCT. You should
contact the sponsoring insurance company for information on how to purchase and
sell shares of the fund.
TAX INFORMATION
Generally, owners of variable annuity and variable life contracts are not
subject to current federal income taxation on distributions of income or gains
with respect to such contracts. For further information concerning federal
income tax consequences for the holders of variable annuity contracts and
variable life insurance policies, such holders should consult the prospectus
used in connection with the issuance of their particular contracts or policies.
PAYMENTS TO FINANCIAL INTERMEDIARIES
If you purchase the fund through selected affiliated and unaffiliated brokers,
dealers, participating insurance companies or other financial intermediaries,
the fund and its affiliates may pay the financial intermediary for the sale of
fund shares and related services. These payments may create a conflict of
interest by influencing the financial intermediary and your salesperson to
recommend the fund over another investment. Ask your salesperson or visit your
insurance company's web site for more information.
10
PROSPECTUS May 1, 2010 DWS Capital Growth VIP
[DWS INVESTMENTS LOGO]
Deutsche Bank Group
DWS GLOBAL OPPORTUNITIES VIP
INVESTMENT OBJECTIVE
The fund seeks above-average capital appreciation over the long term.
FEES AND EXPENSES OF THE FUND
This table describes the fees and expenses you may pay if you buy and hold
shares of the fund. This information does not reflect fees associated with the
separate account that invests in the fund or any variable life insurance policy
or variable annuity contract for which the fund is an investment option. These
fees will increase expenses.
SHAREHOLDER FEES
(paid directly from your investment) None
-------------------------------------- -----
ANNUAL FUND OPERATING EXPENSES (expenses that you pay each year as a % of the
value of your investment)
A
----------
Management fee 0.89
------------------------------------------------ ----
Distribution/service
(12b-1) fees None
------------------------------------------------ -----
Other expenses (includes an administrative fee) 0.22
------------------------------------------------ -----
TOTAL ANNUAL FUND OPERATING EXPENSES 1.11
------------------------------------------------ -----
EXAMPLE
This Example is intended to help you compare the cost of investing in the fund
with the cost of investing in other mutual funds. The Example assumes that you
invest $10,000 in the fund for the time periods indicated and then redeem all
of your shares at the end of those periods. The Example also assumes that your
investment has a 5% return each year and that the fund's operating expenses
remain the same. Although your actual costs may be higher or lower, based on
these assumptions your costs would be:
1 YEAR 3 YEARS 5 YEARS 10 YEARS
-------- --------- --------- ---------
$113 $353 $612 $1,352
---- ---- ---- ------
PORTFOLIO TURNOVER
The fund pays transaction costs when it buys and sells securities (or "turns
over" its portfolio). A higher portfolio turnover may indicate higher
transaction costs. These costs are not reflected in annual fund operating
expenses or in the expense example, but are reflected in fund performance.
Portfolio turnover rate for fiscal year 2009: 53%.
PRINCIPAL INVESTMENT STRATEGY
MAIN INVESTMENTS. The fund invests at least 65% of total assets in common
stocks and other equities of small companies throughout the world (companies
with market values similar to the smallest 20% of the S&P Developed Broad
Market Index, formerly the S&P/Citigroup Broad Market Index World). As of
December 31, 2009, companies in which the fund invests typically have market
capitalizations of between $500 million and $5 billion at the time of purchase.
As part of the investment process (and low turnover strategy) the fund may own
stocks even if they are outside this market capitalization range.
The fund may invest up to 35% of total assets in common stocks and other
equities of large companies or in debt securities.
MANAGEMENT PROCESS. While the fund may invest in securities of any country,
portfolio management generally focuses on countries with developed economies
(including the US). In choosing securities, portfolio management uses a
combination of three analytical disciplines:
BOTTOM-UP RESEARCH. Portfolio management looks for individual companies with a
history of above average growth, strong competitive positioning, attractive
prices relative to potential growth, sound financial strength and effective
management, among other factors.
GROWTH ORIENTATION. Portfolio management generally looks for companies that
they believe have above-average potential for sustainable growth of revenue or
earnings and whose market value appears reasonable in light of their business
prospects.
11
PROSPECTUS May 1, 2010 DWS Global Opportunities VIP
ANALYSIS OF GLOBAL THEMES. Portfolio management considers global economic
outlooks, seeking to identify industries and companies that are likely to
benefit from social, political and economic changes.
Portfolio management will normally sell a security when it believes the price
is unlikely to go much higher, its fundamentals have deteriorated, other
investments offer better opportunities or in the course of adjusting the fund's
exposure to a given country.
--------------------------------------------------------------------------------
DERIVATIVES. The fund may use various types of derivatives (contracts whose
value is based on, for example, indices, currencies or securities) for hedging,
risk management or non-hedging purposes to seek to enhance potential gains. The
fund may also enter into forward currency exchange contracts and buy and sell
currency options to hedge against currency fluctuations. The fund may use
derivatives as a substitute for direct investment in a particular asset class
or to keep cash on hand to meet shareholder redemptions or other needs. In
particular, the fund may use futures, options and yield curve options, forward
currency exchange contracts and may buy or sell currency options.
SECURITIES LENDING. The fund may lend securities (up to one-third of total
assets) to approved institutions.
--------------------------------------------------------------------------------
MAIN RISKS
There are several risk factors that could hurt the fund's performance, cause
you to lose money or cause the fund's performance to trail that of other
investments.
STOCK MARKET RISK. When stock prices fall, you should expect the value of your
investment to fall as well. To the extent that the fund invests in a particular
geographic region or market sector, performance will be affected by that
region's general performance.
FOREIGN INVESTMENT RISK. To the extent the fund invests in companies based
outside the US, it faces the risks inherent in foreign investing. Adverse
political, economic or social developments could undermine the value of the
fund's investments or prevent the fund from realizing their full value.
Financial reporting standards for companies based in foreign markets differ
from those in the US. Additionally, foreign securities markets generally are
smaller and less liquid than US markets. To the extent that the fund invests in
non-US dollar denominated foreign securities, changes in currency exchange
rates may affect the US dollar value of foreign securities or the income or
gain received on these securities. Foreign investment risks are greater in
emerging markets than in developed markets. Emerging market investments are
often considered speculative.
SMALL COMPANY RISK. Small company stocks tend to be more volatile and less
liquid than large company stocks. Small companies are less widely followed by
stock analysts and less information about them is available to investors.
PRICING RISK. If market conditions make it difficult to value some investments,
the fund may value these investments using more subjective methods, such as
fair value pricing.
DERIVATIVES RISK. Risks associated with derivatives include the risk that the
derivative is not well correlated with the security, index or currency to which
it relates; the risk that derivatives may result in losses or missed
opportunities; the risk that the fund will be unable to sell the derivative
because of an illiquid secondary market; the risk that a counterparty is
unwilling or unable to meet its obligation; and the risk that the derivative
transaction could expose the fund to the effects of leverage, which could
increase the fund's exposure to the market and magnify potential losses.
SECURITY SELECTION RISK. The securities in the fund's portfolio may decline in
value. Portfolio management could be wrong in its analysis of industries,
companies, economic trends, the relative attractiveness of different securities
or other matters.
SECURITIES LENDING RISK. Any decline in the value of a portfolio security that
occurs while the security is out on loan is borne by the fund, and will
adversely affect performance. Also, there may be delays in recovery of
securities loaned or even a loss of rights in the collateral should the
borrower of the securities fail financially while holding the security.
COUNTERPARTY RISK. A financial institution or other counterparty with whom the
fund does business (such as trading or securities lending), or that
underwrites, distributes or guarantees any investments or contracts that the
fund owns or is otherwise exposed to, may decline in financial health and
become unable to honor its commitments, which could lead to losses for the
fund.
CREDIT RISK. A fund purchasing debt securities faces the risk that the
creditworthiness of an issuer may decline, causing the value of the debt
securities to decline. In addition, an issuer may not be able to make timely
payments on the interest and/or principal on the debt security it has issued.
Because the issuers of high-yield debt securities or junk bonds (debt
securities rated below the fourth highest category) may be in uncertain
financial health, the prices of their debt securities can be more vulnerable to
bad economic news or even the expectation of bad news, than investment-grade
debt securities.
GROWTH INVESTING RISK. As a category, growth stocks may underperform value
stocks (and the stock market as a whole) over any period of time. Because the
prices of growth stocks are based largely on the expectation of future
earnings, growth stock prices can decline rapidly and significantly in reaction
to negative news about such factors as earnings, the economy, political
developments, or other news.
12
PROSPECTUS May 1, 2010 DWS Global Opportunities VIP
INTEREST RATE RISK. When interest rates rise, prices of debt securities
generally decline. The longer the duration of the fund's debt securities, the
more sensitive it will be to interest rate changes. (As a general rule, a 1%
rise in interest rates means a 1% fall in value for every year of duration.)
PREPAYMENT AND EXTENSION RISK. When interest rates fall, issuers of high
interest debt obligations may pay off the debts earlier than expected
(prepayment risk), and the fund may have to reinvest the proceeds at lower
yields. When interest rates rise, issuers of lower interest debt obligations
may pay off the debts later than expected (extension risk), thus keeping the
fund's assets tied up in lower interest debt obligations. These events could
hurt fund performance.
LIQUIDITY RISK. In certain situations, it may be difficult or impossible to
sell an investment in an orderly fashion at an acceptable price. This may be an
ongoing risk for some investments, such as derivatives or restricted securities
that typically trade only among a limited number of investors.
PAST PERFORMANCE
How a fund's returns vary from year to year can give an idea of its risk; so
can comparing fund performance to overall market performance (as measured by an
appropriate market index). Past performance may not indicate future results.
All performance figures below assume that dividends were reinvested. For more
recent performance figures, go to www.dws-investments.com (the Web site does
not form a part of this prospectus) or call the phone number for your share
class included in this prospectus. This information doesn't reflect fees
associated with the separate account that invests in the fund or any variable
life insurance policy or variable annuity contract for which the fund is an
investment option. These fees will reduce returns.
CALENDAR YEAR TOTAL RETURNS (%) (Class A)
[BAR GRAPHIC OMITTED HERE]
[BAR GRAPHIC DATA]
-5.29 -24.59 -19.89 49.09 23.35 18.19 22.08 9.33 -49.96 48.20
2000 2001 2002 2003 2004 2005 2006 2007 2008 2009
Best Quarter: 30.33%, Q2 2009 Worst Quarter: -28.40%, Q4 2008
Year-to-Date as of 3/31/2010: 5.83%
AVERAGE ANNUAL TOTAL RETURNS
(For periods ended 12/31/2009 expressed as a %)
1 5 10
YEAR YEARS YEARS
---------- --------- ---------
CLASS A 48.20 3.19 2.10
-------------------- ----- ---- ----
S&P DEVELOPED SMALL
CAP INDEX 39.43 3.28 5.49
-------------------- ----- ---- ----
MANAGEMENT
INVESTMENT ADVISOR
Deutsche Investment Management Americas Inc.
PORTFOLIO MANAGER(S)
JOSEPH AXTELL, CFA, MANAGING DIRECTOR. Portfolio Manager of the fund. Joined
the fund in 2002.
PURCHASE AND SALE OF FUND SHARES
THE FUND IS INTENDED FOR USE IN A VARIABLE INSURANCE PRODUCT. You should
contact the sponsoring insurance company for information on how to purchase and
sell shares of the fund.
TAX INFORMATION
Generally, owners of variable annuity and variable life contracts are not
subject to current federal income taxation on distributions of income or gains
with respect to such contracts. For further information concerning federal
income tax consequences for the holders of variable annuity contracts and
variable life insurance policies, such holders should consult the prospectus
used in connection with the issuance of their particular contracts or policies.
PAYMENTS TO FINANCIAL INTERMEDIARIES
If you purchase the fund through selected affiliated and unaffiliated brokers,
dealers, participating insurance companies or other financial intermediaries,
the fund and its affiliates may pay the financial intermediary for the sale of
fund shares and related services. These payments may create a conflict of
interest by influencing the financial intermediary and your salesperson to
recommend the fund over another investment. Ask your salesperson or visit your
insurance company's web site for more information.
13
PROSPECTUS May 1, 2010 DWS Global Opportunities VIP
[DWS INVESTMENTS LOGO]
Deutsche Bank Group
DWS INTERNATIONAL VIP
INVESTMENT OBJECTIVE
The fund seeks long-term growth of capital.
FEES AND EXPENSES OF THE FUND
This table describes the fees and expenses you may pay if you buy and hold
shares of the fund. This information does not reflect fees associated with the
separate account that invests in the fund or any variable life insurance policy
or variable annuity contract for which the fund is an investment option. These
fees will increase expenses.
SHAREHOLDER FEES
(paid directly from your investment) None
-------------------------------------- -----
ANNUAL FUND OPERATING EXPENSES (expenses that you pay each year as a % of the
value of your investment)
A
----------
Management fee 0.79
---------------------------------------------------- ----
Distribution/service
(12b-1) fees None
---------------------------------------------------- -----
Other expenses (includes an administrative fee) 0.15
---------------------------------------------------- -----
Acquired funds (underlying funds) fees and expenses 0.02
---------------------------------------------------- -----
TOTAL ANNUAL FUND OPERATING EXPENSES 0.96
---------------------------------------------------- -----
EXAMPLE
This Example is intended to help you compare the cost of investing in the fund
with the cost of investing in other mutual funds. The Example assumes that you
invest $10,000 in the fund for the time periods indicated and then redeem all
of your shares at the end of those periods. The Example also assumes that your
investment has a 5% return each year and that the fund's operating expenses
remain the same. Although your actual costs may be higher or lower, based on
these assumptions your costs would be:
1 YEAR 3 YEARS 5 YEARS 10 YEARS
-------- --------- --------- ---------
$98 $306 $531 $1,178
--- ---- ---- ------
PORTFOLIO TURNOVER
The fund pays transaction costs when it buys and sells securities (or "turns
over" its portfolio). A higher portfolio turnover may indicate higher
transaction costs. These costs are not reflected in annual fund operating
expenses or in the expense example, but are reflected in fund performance.
Portfolio turnover rate for fiscal year 2009: 81%.
PRINCIPAL INVESTMENT STRATEGY
MAIN INVESTMENTS. Although the fund can invest in companies of any size and
from any country, it invests mainly in common stocks of established companies
in countries with developed economies (other than the United States).
MANAGEMENT PROCESS. In choosing securities, portfolio management uses a
combination of two analytical disciplines:
BOTTOM-UP RESEARCH. Portfolio management looks for individual companies with a
history of above-average growth, strong competitive positioning, attractive
prices relative to potential growth, sound financial strength and effective
management, among other factors.
TOP-DOWN ANALYSIS. Portfolio management considers the economic outlooks for
various sectors and industries while looking for those that may benefit from
changes in the overall business environment.
Portfolio management will normally sell a security when it believes the price
is unlikely to go much higher, its fundamentals have deteriorated, other
investments offer better opportunities or in the course of adjusting the fund's
exposure to a given country.
--------------------------------------------------------------------------------
DERIVATIVES. The fund may use various types of derivatives (contracts whose
value is based on, for example, indices, currencies or securities) for hedging,
risk management or non-hedging purposes to seek to enhance potential gains. The
fund may use derivatives as a substitute for direct investment in a particular
asset class or to keep cash on hand to meet shareholder redemptions or other
needs.
14
PROSPECTUS May 1, 2010 DWS International VIP
SECURITIES LENDING. The fund may lend securities (up to one-third of total
assets) to approved institutions.
--------------------------------------------------------------------------------
MAIN RISKS
There are several risk factors that could hurt the fund's performance, cause
you to lose money or cause the fund's performance to trail that of other
investments.
FOREIGN INVESTMENT RISK. To the extent the fund invests in companies based
outside the US, it faces the risks inherent in foreign investing. Adverse
political, economic or social developments could undermine the value of the
fund's investments or prevent the fund from realizing their full value.
Financial reporting standards for companies based in foreign markets differ
from those in the US. Additionally, foreign securities markets generally are
smaller and less liquid than US markets. To the extent that the fund invests in
non-US dollar denominated foreign securities, changes in currency exchange
rates may affect the US dollar value of foreign securities or the income or
gain received on these securities. Foreign investment risks are greater in
emerging markets than in developed markets. Emerging market investments are
often considered speculative.
STOCK MARKET RISK. When stock prices fall, you should expect the value of your
investment to fall as well. To the extent that the fund invests in a particular
geographic region or market sector, performance will be affected by that
region's general performance.
SECURITY SELECTION RISK. The securities in the fund's portfolio may decline in
value. Portfolio management could be wrong in its analysis of industries,
companies, economic trends, the relative attractiveness of different securities
or other matters.
LIQUIDITY RISK. In certain situations, it may be difficult or impossible to
sell an investment in an orderly fashion at an acceptable price. This may be an
ongoing risk for some investments, such as derivatives or restricted securities
that typically trade only among a limited number of investors.
PRICING RISK. If market conditions make it difficult to value some investments,
the fund may value these investments using more subjective methods, such as
fair value pricing.
DERIVATIVES RISK. Risks associated with derivatives include the risk that the
derivative is not well correlated with the security, index or currency to which
it relates; the risk that derivatives may result in losses or missed
opportunities; the risk that the fund will be unable to sell the derivative
because of an illiquid secondary market; the risk that a counterparty is
unwilling or unable to meet its obligation; and the risk that the derivative
transaction could expose the fund to the effects of leverage, which could
increase the fund's exposure to the market and magnify potential losses.
SECURITIES LENDING RISK. Any decline in the value of a portfolio security that
occurs while the security is out on loan is borne by the fund, and will
adversely affect performance. Also, there may be delays in recovery of
securities loaned or even a loss of rights in the collateral should the
borrower of the securities fail financially while holding the security.
COUNTERPARTY RISK. A financial institution or other counterparty with whom the
fund does business (such as trading or securities lending), or that
underwrites, distributes or guarantees any investments or contracts that the
fund owns or is otherwise exposed to, may decline in financial health and
become unable to honor its commitments, which could lead to losses for the
fund.
PAST PERFORMANCE
How a fund's returns vary from year to year can give an idea of its risk; so
can comparing fund performance to overall market performance (as measured by an
appropriate market index). Past performance may not indicate future results.
All performance figures below assume that dividends were reinvested. For more
recent performance figures, go to www.dws-investments.com (the Web site does
not form a part of this prospectus) or call the phone number for your share
class included in this prospectus. This information doesn't reflect fees
associated with the separate account that invests in the fund or any variable
life insurance policy or variable annuity contract for which the fund is an
investment option. These fees will reduce returns.
CALENDAR YEAR TOTAL RETURNS (%) (Class A)
[BAR GRAPHIC OMITTED HERE]
[BAR GRAPHIC DATA]
-21.70 -30.86 -18.37 27.75 16.53 16.17 25.91 14.59 48.21 33.52
2000 2001 2002 2003 2004 2005 2006 2007 2008 2009
Best Quarter: 23.01%, Q3 2009 Worst Quarter: -26.71%, Q3 2008
Year-to-Date as of 3/31/2010: 0.12%
AVERAGE ANNUAL TOTAL RETURNS
(For periods ended 12/31/2009 expressed as a %)
1 5 10
YEAR YEARS YEARS
---------- --------- ----------
CLASS A 33.52 2.99 -2.68
----------------------- ----- ---- ------
MSCI EAFE( (Reg. TM)) 31.78 3.54 1.17
----------------------- ----- ---- ------
MANAGEMENT
INVESTMENT ADVISOR
Deutsche Investment Management Americas Inc.
15
PROSPECTUS May 1, 2010 DWS International VIP
PORTFOLIO MANAGER(S)
NIKOLAUS POEHLMANN, CFA, DIRECTOR. Lead Portfolio Manager of the fund. Joined
the fund in 2009.
UDO ROSENDAHL, MANAGING DIRECTOR. Portfolio Manager of the fund. Joined the
fund in 2009.
MARK SCHUMANN, VICE PRESIDENT. Portfolio Manager of the fund. Joined the fund
in 2009.
ANDREAS WENDELKEN, DIRECTOR. Portfolio Manager of the fund. Joined the fund in
2009.
PURCHASE AND SALE OF FUND SHARES
THE FUND IS INTENDED FOR USE IN A VARIABLE INSURANCE PRODUCT. You should
contact the sponsoring insurance company for information on how to purchase and
sell shares of the fund.
TAX INFORMATION
Generally, owners of variable annuity and variable life contracts are not
subject to current federal income taxation on distributions of income or gains
with respect to such contracts. For further information concerning federal
income tax consequences for the holders of variable annuity contracts and
variable life insurance policies, such holders should consult the prospectus
used in connection with the issuance of their particular contracts or policies.
PAYMENTS TO BROKER-DEALERS AND
OTHER FINANCIAL INTERMEDIARIES
If you purchase the fund through a broker-dealer or other financial
intermediary (such as a bank), the fund and its affiliates may pay the
intermediary for the sale of fund shares and related services. These payments
may create a conflict of interest by influencing the broker-dealer or other
intermediary and your salesperson to recommend the fund over another
investment. Ask your salesperson or visit your financial intermediary's web
site for more information.
PAYMENTS TO FINANCIAL INTERMEDIARIES
If you purchase the fund through selected affiliated and unaffiliated brokers,
dealers, participating insurance companies or other financial intermediaries,
the fund and its affiliates may pay the financial intermediary for the sale of
fund shares and related services. These payments may create a conflict of
interest by influencing the financial intermediary and your salesperson to
recommend the fund over another investment. Ask your salesperson or visit your
insurance company's web site for more information.
16
PROSPECTUS May 1, 2010 DWS International VIP
[DWS INVESTMENTS LOGO]
Deutsche Bank Group
DWS HEALTH CARE VIP
INVESTMENT OBJECTIVE
The fund seeks long-term growth of capital.
FEES AND EXPENSES OF THE FUND
This table describes the fees and expenses you may pay if you buy and hold
shares of the fund. This information does not reflect fees associated with the
separate account that invests in the fund or any variable life insurance policy
or variable annuity contract for which the fund is an investment option. These
fees will increase expenses.
SHAREHOLDER FEES
(paid directly from your investment) None
-------------------------------------- -----
ANNUAL FUND OPERATING EXPENSES (expenses that you pay each year as a % of the
value of your investment)
A
----------
Management fee 0.67
------------------------------------------------ ----
Distribution/service
(12b-1) fees None
------------------------------------------------ -----
Other expenses (includes an administrative fee) 0.29
------------------------------------------------ -----
TOTAL ANNUAL FUND OPERATING EXPENSES 0.96
------------------------------------------------ -----
EXAMPLE
This Example is intended to help you compare the cost of investing in the fund
with the cost of investing in other mutual funds. The Example assumes that you
invest $10,000 in the fund for the time periods indicated and then redeem all
of your shares at the end of those periods. The Example also assumes that your
investment has a 5% return each year and that the fund's operating expenses
remain the same. Although your actual costs may be higher or lower, based on
these assumptions your costs would be:
1 YEAR 3 YEARS 5 YEARS 10 YEARS
-------- --------- --------- ---------
$98 $306 $531 $1,178
--- ---- ---- ------
PORTFOLIO TURNOVER
The fund pays transaction costs when it buys and sells securities (or "turns
over" its portfolio). A higher portfolio turnover may indicate higher
transaction costs. These costs are not reflected in annual fund operating
expenses or in the expense example, but are reflected in fund performance.
Portfolio turnover rate for fiscal year 2009: 31%.
PRINCIPAL INVESTMENT STRATEGY
MAIN INVESTMENTS. Under normal circumstances, the fund will invest at least 80%
of total assets, plus the amount of any borrowing for investment purposes, in
common stock of companies in the health care sector. For purposes of the fund's
80% investment policy, to be considered part of the health care sector,
companies must commit at least half of their assets to, or derive at least half
of the revenues or net income from, that sector. Examples of industries in the
health care sector include pharmaceuticals, biotechnology, medical products and
supplies, and health care services. The fund invests primarily in securities of
US companies, but may invest in foreign companies as well. The fund may invest
in companies of any market capitalization.
MANAGEMENT PROCESS. In choosing stocks, portfolio management uses a combination
of three analytical disciplines:
BOTTOM-UP RESEARCH. Portfolio management looks for individual companies with a
history of above-average growth, strong competitive positioning, new tests or
treatments, the ability to take advantage of demographic trends, attractive
prices relative to potential growth, sound financial strength and effective
management, among other factors.
GROWTH ORIENTATION. Portfolio management generally looks for companies that it
believes have above-average potential for sustainable growth of revenue or
earnings and whose market value appears reasonable in light of their business
prospects.
17
PROSPECTUS May 1, 2010 DWS Health Care VIP
TOP-DOWN ANALYSIS. Portfolio management considers the economic outlook for
various industries within the health care sector while looking for those that
it believes may benefit from changes in the overall business environment.
Portfolio management may favor securities from different industries and
companies within the health care sector at different times. Portfolio
management will normally sell a stock when it believes the stock's price is
unlikely to go higher, its fundamental factors have changed, other investments
offer better opportunities, or in the course of adjusting their emphasis on a
given health care industry.
--------------------------------------------------------------------------------
DERIVATIVES. The fund may use various types of derivatives (contracts whose
value is based on, for example, indices, currencies or securities) for hedging,
risk management or non-hedging purposes to seek to enhance potential gains. The
fund may use derivatives as a substitute for direct investment in a particular
asset class or to keep cash on hand to meet shareholder redemptions or other
needs.
SECURITIES LENDING. The fund may lend securities (up to one-third of total
assets) to approved institutions.
--------------------------------------------------------------------------------
MAIN RISKS
There are several risk factors that could hurt the fund's performance, cause
you to lose money or cause the fund's performance to trail that of other
investments.
STOCK MARKET RISK. To the extent the fund invests in a particular sector, the
fund's performance may be proportionately affected by that sector's general
performance. When stock prices fall, you should expect the value of your
investment to fall as well. The market as a whole may not favor the types of
investments the fund makes, which could affect the fund's ability to sell them
at an attractive price.
FOREIGN INVESTMENT RISK. To the extent the fund invests in companies based
outside the US, it faces the risks inherent in foreign investing. Adverse
political, economic or social developments could undermine the value of the
fund's investments or prevent the fund from realizing their full value.
Financial reporting standards for companies based in foreign markets differ
from those in the US. Additionally, foreign securities markets generally are
smaller and less liquid than US markets. To the extent that the fund invests in
non-US dollar denominated foreign securities, changes in currency exchange
rates may affect the US dollar value of foreign securities or the income or
gain received on these securities.
GROWTH INVESTING RISK. As a category, growth stocks may underperform value
stocks (and the stock market as a whole) over any period of time. Because the
prices of growth stocks are based largely on the expectation of future
earnings, growth stock prices can decline rapidly and significantly in reaction
to negative news about such factors as earnings, the economy, political
developments, or other news.
CONCENTRATION RISK. Any fund that concentrates in a particular segment of the
market will generally be more volatile than a fund that invests more broadly.
Because the fund concentrates its investments in companies in the health care
field, it may be vulnerable to setbacks in that industry.
SECURITY SELECTION RISK. The securities in the fund's portfolio may decline in
value. Portfolio management could be wrong in its analysis of industries,
companies, economic trends, the relative attractiveness of different securities
or other matters.
DERIVATIVES RISK. Risks associated with derivatives include the risk that the
derivative is not well correlated with the security, index or currency to which
it relates; the risk that derivatives may result in losses or missed
opportunities; the risk that the fund will be unable to sell the derivative
because of an illiquid secondary market; the risk that a counterparty is
unwilling or unable to meet its obligation; and the risk that the derivative
transaction could expose the fund to the effects of leverage, which could
increase the fund's exposure to the market and magnify potential losses.
SECURITIES LENDING RISK. Any decline in the value of a portfolio security that
occurs while the security is out on loan is borne by the fund, and will
adversely affect performance. Also, there may be delays in recovery of
securities loaned or even a loss of rights in the collateral should the
borrower of the securities fail financially while holding the security.
SMALL COMPANY RISK. Small company stocks tend to be more volatile and less
liquid than large company stocks. Small companies are less widely followed by
stock analysts and less information about them is available to investors.
COUNTERPARTY RISK. A financial institution or other counterparty with whom the
fund does business (such as trading or securities lending), or that
underwrites, distributes or guarantees any investments or contracts that the
fund owns or is otherwise exposed to, may decline in financial health and
become unable to honor its commitments, which could lead to losses for the
fund.
LIQUIDITY RISK. In certain situations, it may be difficult or impossible to
sell an investment in an orderly fashion at an acceptable price. This may be an
ongoing risk for some investments, such as derivatives or restricted securities
that typically trade only among a limited number of investors.
PRICING RISK. If market conditions make it difficult to value some investments,
the fund may value these investments using more subjective methods, such as
fair value pricing.
PAST PERFORMANCE
How a fund's returns vary from year to year can give an idea of its risk; so
can comparing fund performance to overall market performance (as measured by an
appropriate
18
PROSPECTUS May 1, 2010 DWS Health Care VIP
market index). Past performance may not indicate future results. All
performance figures below assume that dividends were reinvested. For more
recent performance figures, go to www.dws-investments.com (the Web site does
not form a part of this prospectus) or call the phone number for your share
class included in this prospectus. This information doesn't reflect fees
associated with the separate account that invests in the fund or any variable
life insurance policy or variable annuity contract for which the fund is an
investment option. These fees will reduce returns.
CALENDAR YEAR TOTAL RETURNS (%) (Class A)
[BAR GRAPHIC OMITTED HERE]
[BAR GRAPHIC DATA]
-23.10 33.70 9.59 8.50 6.17 13.20 -23.20 22.19
2002 2003 2004 2005 2006 2007 2008 2009
Best Quarter: 15.08%, Q2 2003 Worst Quarter: -16.45%, Q4 2008
Year-to-Date as of 3/31/2010: 5.89%
AVERAGE ANNUAL TOTAL RETURNS
(For periods ended 12/31/2009 expressed as a %)
CLASS 1 5 SINCE
INCEPTION YEAR YEARS INCEPTION
----------- ---------- --------- ----------
CLASS A 5/1/01 22.19 4.12 4.52
------------------- ------ ----- ---- ----
STANDARD & POOR'S
(S&P) 500 INDEX 26.46 0.42 0.60
------------------- ------ ----- ---- ----
S&P NORTH AMERICAN
HEALTH CARE SECTOR
INDEX 22.49 3.67 2.78
------------------- ------ ----- ---- ----
The Advisor believes the additional S&P North American Health Care Sector Index
represents the fund's overall investment process. Index comparisons begin on
4/30/01.
MANAGEMENT
INVESTMENT ADVISOR
Deutsche Investment Management Americas Inc.
PORTFOLIO MANAGER(S)
LEEFIN LAI, CFA, MANAGING DIRECTOR. Lead Portfolio Manager of the fund. Joined
the fund in 2001.
THOMAS E. BUCHER, CFA, MANAGING DIRECTOR. Deutsche Asset Management. Consultant
to the Advisor since 2002.
PURCHASE AND SALE OF FUND SHARES
THE FUND IS INTENDED FOR USE IN A VARIABLE INSURANCE PRODUCT. You should
contact the sponsoring insurance company for information on how to purchase and
sell shares of the fund.
TAX INFORMATION
Generally, owners of variable annuity and variable life contracts are not
subject to current federal income taxation on distributions of income or gains
with respect to such contracts. For further information concerning federal
income tax consequences for the holders of variable annuity contracts and
variable life insurance policies, such holders should consult the prospectus
used in connection with the issuance of their particular contracts or policies.
PAYMENTS TO FINANCIAL INTERMEDIARIES
If you purchase the fund through selected affiliated and unaffiliated brokers,
dealers, participating insurance companies or other financial intermediaries,
the fund and its affiliates may pay the financial intermediary for the sale of
fund shares and related services. These payments may create a conflict of
interest by influencing the financial intermediary and your salesperson to
recommend the fund over another investment. Ask your salesperson or visit your
insurance company's web site for more information.
19
PROSPECTUS May 1, 2010 DWS Health Care VIP
[DWS INVESTMENTS LOGO]
Deutsche Bank Group
DWS EQUITY 500 INDEX VIP
INVESTMENT OBJECTIVE
The fund seeks to replicate, as closely as possible, before the deduction of
expenses, the performance of the Standard & Poor's 500 Composite Stock Price
Index (the "S&P 500( (Reg. TM)) Index"), which emphasizes stocks of large US
companies.
FEES AND EXPENSES OF THE FUND
This table describes the fees and expenses you may pay if you buy and hold
shares of the fund. This information does not reflect fees associated with the
separate account that invests in the fund or any variable life insurance policy
or variable annuity contract for which the fund is an investment option. These
fees will increase expenses.
SHAREHOLDER FEES
(paid directly from your investment) None
-------------------------------------- -----
ANNUAL FUND OPERATING EXPENSES (expenses that you pay each year as a % of the
value of your investment)
A
----------
Management fee 0.20
------------------------------------------------ ----
Distribution/service
(12b-1) fees None
------------------------------------------------ -----
Other expenses (includes an administrative fee) 0.14
------------------------------------------------ -----
TOTAL ANNUAL FUND OPERATING EXPENSES 0.34
------------------------------------------------ -----
EXAMPLE
This Example is intended to help you compare the cost of investing in the fund
with the cost of investing in other mutual funds. The Example assumes that you
invest $10,000 in the fund for the time periods indicated and then redeem all
of your shares at the end of those periods. The Example also assumes that your
investment has a 5% return each year and that the fund's operating expenses
remain the same. Although your actual costs may be higher or lower, based on
these assumptions your costs would be:
1 YEAR 3 YEARS 5 YEARS 10 YEARS
-------- --------- --------- ---------
$35 $109 $191 $431
--- ---- ---- ----
PORTFOLIO TURNOVER
The fund pays transaction costs when it buys and sells securities (or "turns
over" its portfolio). A higher portfolio turnover may indicate higher
transaction costs. These costs are not reflected in annual fund operating
expenses or in the expense example, but are reflected in fund performance.
Portfolio turnover rate for fiscal year 2009: 8%.
PRINCIPAL INVESTMENT STRATEGY
MAIN INVESTMENTS. Under normal circumstances, the fund intends to invest at
least 80% of assets, determined at the time of purchase, in stocks of companies
included in the S&P 500( (Reg. TM)) Index and in derivative instruments, such
as futures contracts and options, that provide exposure to the stocks of
companies in the S&P 500( (Reg. TM)) Index. The fund's securities are weighted
to attempt to make the fund's total investment characteristics similar to those
of the S&P 500( (Reg. TM) )Index as a whole. Portfolio management may limit or
avoid exposure to any stock in the S&P 500( (Reg. TM)) Index if it believes the
stock is illiquid or that extraordinary conditions have cast doubt on its
merits. Conversely, portfolio management may gain exposure to a stock not
included in the S&P 500( (Reg. TM) )Index when it believes such exposure is
consistent with the fund's goal (for example, in anticipation of a stock being
added to the S&P 500( (Reg. TM) )Index). The fund may also hold short-term debt
securities and money market instruments for liquidity purposes.
The S&P 500 INDEX is a well-known stock market index that includes common
stocks of 500 companies from several industrial sectors representing a
significant portion of the market value of all stocks publicly traded in the
US. Stocks in the S&P 500 Index are weighted according to their total market
value. The fund is not sponsored, endorsed, sold or promoted by the Standard &
Poor's Division of The McGraw-Hill Companies, Inc. ("S&P").
20
PROSPECTUS May 1, 2010 DWS Equity 500 Index VIP
MANAGEMENT PROCESS. Portfolio management uses quantitative analysis techniques
to structure the fund to obtain a high correlation to the index while seeking
to keep the fund as fully invested as possible in all market environments.
Portfolio management seeks a long-term correlation between fund performance,
before expenses, and the index of 98% or better (perfect correlation being
100%). The fund uses an optimization strategy, buying the largest stocks in the
index in approximately the same proportion they represent in the index, then
investing in a statistically selected sample of the smaller securities found in
the index. This process is intended to produce a portfolio whose industry
weightings, market capitalizations and fundamental characteristics
(price-to-book ratios, price-to-earnings ratios, debt-to-asset ratios and
dividend yields) closely replicate those of the index. This approach attempts
to maximize the fund's liquidity and returns while minimizing its costs.
--------------------------------------------------------------------------------
DERIVATIVES. The fund may use various types of derivatives (contracts whose
value is based on, for example, indices, currencies or securities) for hedging,
risk management or non-hedging purposes to seek to enhance potential gains. The
fund may use derivatives as a substitute for direct investment in a particular
asset class or to keep cash on hand to meet shareholder redemptions or other
needs.
SECURITIES LENDING. The fund may lend securities (up to one-third of total
assets) to approved institutions.
--------------------------------------------------------------------------------
MAIN RISKS
There are several risk factors that could hurt the fund's performance, cause
you to lose money or cause the fund's performance to trail that of other
investments.
STOCK MARKET RISK. When stock prices fall, you should expect the value of your
investment to fall as well.
INDEXING RISK. An index fund's performance may not exactly replicate the
performance of its target index, for several reasons. Also, while the exposure
of the index to its component securities is by definition 100%, the fund's
effective exposure to index securities may be greater or lesser than 100% and
may vary overtime.
Because an index fund is designed to maintain a high level of exposure to its
target index at all times, it will not take any steps to invest defensively or
otherwise reduce the risk of loss during market downturns.
DERIVATIVES RISK. Risks associated with derivatives include the risk that the
derivative is not well correlated with the security, index or currency to which
it relates; the risk that derivatives may result in losses or missed
opportunities; the risk that the fund will be unable to sell the derivative
because of an illiquid secondary market; the risk that a counterparty is
unwilling or unable to meet its obligation; and the risk that the derivative
transaction could expose the fund to the effects of leverage, which could
increase the fund's exposure to the market and magnify potential losses.
SECURITIES LENDING RISK. Any decline in the value of a portfolio security that
occurs while the security is out on loan is borne by the fund, and will
adversely affect performance. Also, there may be delays in recovery of
securities loaned or even a loss of rights in the collateral should the
borrower of the securities fail financially while holding the security.
COUNTERPARTY RISK. A financial institution or other counterparty with whom the
fund does business (such as trading or securities lending), or that
underwrites, distributes or guarantees any investments or contracts that the
fund owns or is otherwise exposed to, may decline in financial health and
become unable to honor its commitments, which could lead to losses for the
fund.
LIQUIDITY RISK. In certain situations, it may be difficult or impossible to
sell an investment in an orderly fashion at an acceptable price. This may be an
ongoing risk for some investments, such as derivatives or restricted securities
that typically trade only among a limited number of investors.
PRICING RISK. If market conditions make it difficult to value some investments,
the fund may value these investments using more subjective methods, such as
fair value pricing.
PAST PERFORMANCE
How a fund's returns vary from year to year can give an idea of its risk; so
can comparing fund performance to overall market performance (as measured by an
appropriate market index). Past performance may not indicate future results.
All performance figures below assume that dividends were reinvested. For more
recent performance figures, go to www.dws-investments.com (the Web site does
not form a part of this prospectus) or call the phone number for your share
class included in this prospectus. This information doesn't reflect fees
associated with the separate account that invests in the fund or any variable
life insurance policy or variable annuity contract for which the fund is an
investment option. These fees will reduce returns.
CALENDAR YEAR TOTAL RETURNS (%) (Class A)
[BAR GRAPHIC OMITTED HERE]
[BAR GRAPHIC DATA]
-9.24 -12.18 -22.31 28.16 10.59 4.68 15.52 5.30 -37.15 26.32
2000 2001 2002 2003 2004 2005 2006 2007 2008 2009
Best Quarter: 15.95%, Q2 2009 Worst Quarter: -21.98%, Q4 2008
Year-to-Date as of 3/31/2010: 5.30%
21
PROSPECTUS May 1, 2010 DWS Equity 500 Index VIP
AVERAGE ANNUAL TOTAL RETURNS
(For periods ended 12/31/2009 expressed as a %)
1 5 10
YEAR YEARS YEARS
---------- --------- ----------
CLASS A 26.32 0.22 -1.19
------------------ ----- ---- ------
STANDARD & POOR'S
(S&P) 500 INDEX 26.46 0.42 -0.95
------------------ ----- ---- ------
MANAGEMENT
INVESTMENT ADVISOR
Deutsche Investment Management Americas Inc.
SUBADVISOR
Northern Trust Investments, N.A.
PORTFOLIO MANAGER(S)
BRENT REEDER. Senior Vice President of Northern Trust Investments, N.A.
Portfolio Manager of the fund. Joined the fund in 2007.
PURCHASE AND SALE OF FUND SHARES
THE FUND IS INTENDED FOR USE IN A VARIABLE INSURANCE PRODUCT. You should
contact the sponsoring insurance company for information on how to purchase and
sell shares of the fund.
TAX INFORMATION
Generally, owners of variable annuity and variable life contracts are not
subject to current federal income taxation on distributions of income or gains
with respect to such contracts. For further information concerning federal
income tax consequences for the holders of variable annuity contracts and
variable life insurance policies, such holders should consult the prospectus
used in connection with the issuance of their particular contracts or policies.
PAYMENTS TO FINANCIAL INTERMEDIARIES
If you purchase the fund through selected affiliated and unaffiliated brokers,
dealers, participating insurance companies or other financial intermediaries,
the fund and its affiliates may pay the financial intermediary for the sale of
fund shares and related services. These payments may create a conflict of
interest by influencing the financial intermediary and your salesperson to
recommend the fund over another investment. Ask your salesperson or visit your
insurance company's web site for more information.
22
PROSPECTUS May 1, 2010 DWS Equity 500 Index VIP
[DWS INVESTMENTS LOGO]
Deutsche Bank Group
DWS SMALL CAP INDEX VIP
INVESTMENT OBJECTIVE
The fund seeks to replicate, as closely as possible, before the deduction of
expenses, the performance of the Russell 2000( (Reg. TM) )Index, which
emphasizes stocks of small US companies.
FEES AND EXPENSES OF THE FUND
This table describes the fees and expenses you may pay if you buy and hold
shares of the fund. This information does not reflect fees associated with the
separate account that invests in the fund or any variable life insurance policy
or variable annuity contract for which the fund is an investment option. These
fees will increase expenses.
SHAREHOLDER FEES
(paid directly from your investment) None
-------------------------------------- -----
ANNUAL FUND OPERATING EXPENSES (expenses that you pay each year as a % of the
value of your investment)
A
----------
Management fee 0.35
------------------------------------------------------ ----
Distribution/service
(12b-1) fees None
------------------------------------------------------ -----
Other expenses (includes an administrative fee) 0.21
------------------------------------------------------ -----
TOTAL ANNUAL FUND OPERATING EXPENSES 0.56
------------------------------------------------------ -----
Less fee waiver/reimbursement 0.03
------------------------------------------------------ -----
TOTAL ANNUAL FUND OPERATING EXPENSES AFTER FEE WAIVER
AND/OR
EXPENSE REIMBURSEMENT 0.53
------------------------------------------------------ -----
The Advisor has contractually agreed through April 30, 2011 to waive and/or
reimburse fund expenses to the extent necessary to maintain the fund's total
annual operating expenses at a ratio no higher than 0.53% for Class A. The
agreement may only be terminated with the consent of the fund's Board and does
not extend to extraordinary expenses, taxes, brokerage and interest expense.
EXAMPLE
This Example is intended to help you compare the cost of investing in the fund
with the cost of investing in other mutual funds. The Example assumes that you
invest $10,000 in the fund for the time periods indicated and then redeem all
of your shares at the end of those periods. The Example also assumes that your
investment has a 5% return each year and that the fund's operating expenses
(including one year of capped expenses) remain the same. Although your actual
costs may be higher or lower, based on these assumptions your costs would be:
1 YEAR 3 YEARS 5 YEARS 10 YEARS
-------- --------- --------- ---------
$54 $176 $310 $699
--- ---- ---- ----
PORTFOLIO TURNOVER
The fund pays transaction costs when it buys and sells securities (or "turns
over" its portfolio). A higher portfolio turnover may indicate higher
transaction costs. These costs are not reflected in annual fund operating
expenses or in the expense example, but are reflected in fund performance.
Portfolio turnover rate for fiscal year 2009: 26%.
PRINCIPAL INVESTMENT STRATEGY
MAIN INVESTMENTS. Under normal circumstances, the fund invests at least 80% of
its assets, determined at the time of purchase, in stocks of companies included
in the Russell 2000 Index (Reg. TM) and in derivative instruments, such as
stock index futures contracts and options that provide exposure to the stocks
of companies in the index. The fund's securities are weighted to attempt to
make the fund's total investment characteristics similar to those of the index
as a whole. Portfolio management may limit or avoid exposure to any stock in
the index if it believes the stock is illiquid or that extraordinary conditions
have cast doubt on its merits. Conversely, portfolio management may gain
exposure to a stock not included in the index when it believes such exposure is
consistent with the fund's goal (for example, in anticipation of a stock being
added to the index). The fund may also hold short-term debt securities and
money market instruments for liquidity purposes.
The RUSSELL 2000 INDEX( (Reg. TM))( )is a well-known stock market index that
measures the performance of the 2,000 smallest companies in the Russell 3000(
(Reg. TM)) Index, which represent
23
PROSPECTUS May 1, 2010 DWS Small Cap Index VIP
approximately 8% of the market capitalization of the Russell 3000( (Reg. TM))
Index. Stocks in the Russell 2000 Index( (Reg. TM) )are weighted according to
their total market value.
MANAGEMENT PROCESS. Portfolio management uses quantitative analysis techniques
to structure the fund to obtain a high correlation to the index while seeking
to keep the fund as fully invested as possible in all market environments.
Portfolio management seeks a long-term correlation between fund performance,
before expenses, and the index of 98% or better (perfect correlation being
100%). The fund uses an optimization strategy, buying the largest stocks in the
index in approximately the same proportion they represent in the index, then
investing in a statistically selected sample of the smaller securities found in
the index. This process is intended to produce a portfolio whose industry
weightings, market capitalizations and fundamental characteristics
(price-to-book ratios, price-to-earnings ratios, debt-to-asset ratios and
dividend yields) closely replicate those of the index. This approach attempts
to maximize the fund's liquidity and returns while minimizing its costs.
--------------------------------------------------------------------------------
DERIVATIVES. The fund may use various types of derivatives (contracts whose
value is based on, for example, indices, currencies or securities) for hedging,
risk management or non-hedging purposes to seek to enhance potential gains. The
fund may use derivatives as a substitute for direct investment in a particular
asset class or to keep cash on hand to meet shareholder redemptions or other
needs.
SECURITIES LENDING. The fund may lend securities (up to one-third of total
assets) to approved institutions.
--------------------------------------------------------------------------------
MAIN RISKS
There are several risk factors that could hurt the fund's performance, cause
you to lose money or cause the fund's performance to trail that of other
investments.
STOCK MARKET RISK. When stock prices fall, you should expect the value of your
investment to fall as well.
INDEXING RISK. An index fund's performance may not exactly replicate the
performance of its target index, for several reasons. Also, while the exposure
of the index to its component securities is by definition 100%, the fund's
effective exposure to index securities may be greater or lesser than 100% and
may vary overtime.
Because an index fund is designed to maintain a high level of exposure to its
target index at all times, it will not take any steps to invest defensively or
otherwise reduce the risk of loss during market downturns.
SMALL COMPANY RISK. Small company stocks tend to be more volatile and less
liquid than large company stocks. Small companies are less widely followed by
stock analysts and less information about them is available to investors.
DERIVATIVES RISK. Risks associated with derivatives include the risk that the
derivative is not well correlated with the security, index or currency to which
it relates; the risk that derivatives may result in losses or missed
opportunities; the risk that the fund will be unable to sell the derivative
because of an illiquid secondary market; the risk that a counterparty is
unwilling or unable to meet its obligation; and the risk that the derivative
transaction could expose the fund to the effects of leverage, which could
increase the fund's exposure to the market and magnify potential losses.
SECURITIES LENDING RISK. Any decline in the value of a portfolio security that
occurs while the security is out on loan is borne by the fund, and will
adversely affect performance. Also, there may be delays in recovery of
securities loaned or even a loss of rights in the collateral should the
borrower of the securities fail financially while holding the security.
COUNTERPARTY RISK. A financial institution or other counterparty with whom the
fund does business (such as trading or securities lending), or that
underwrites, distributes or guarantees any investments or contracts that the
fund owns or is otherwise exposed to, may decline in financial health and
become unable to honor its commitments, which could lead to losses for the
fund.
LIQUIDITY RISK. In certain situations, it may be difficult or impossible to
sell an investment in an orderly fashion at an acceptable price. This may be an
ongoing risk for some investments, such as derivatives or restricted securities
that typically trade only among a limited number of investors.
PRICING RISK. If market conditions make it difficult to value some investments,
the fund may value these investments using more subjective methods, such as
fair value pricing.
PAST PERFORMANCE
How a fund's returns vary from year to year can give an idea of its risk; so
can comparing fund performance to overall market performance (as measured by an
appropriate market index). Past performance may not indicate future results.
All performance figures below assume that dividends were reinvested. For more
recent performance figures, go to www.dws-investments.com (the Web site does
not form a part of this prospectus) or call the phone number for your share
class included in this prospectus. This information doesn't reflect fees
associated with the separate account that invests in the fund or any variable
life insurance policy or variable annuity contract for which the fund is an
investment option. These fees will reduce returns.
24
PROSPECTUS May 1, 2010 DWS Small Cap Index VIP
CALENDAR YEAR TOTAL RETURNS (%) (Class A)
[BAR GRAPHIC OMITTED HERE]
[BAR GRAPHIC DATA]
-3.87 2.07 -20.58 46.42 17.76 4.26 17.49 -1.90 -34.12 26.57
2000 2001 2002 2003 2004 2005 2006 2007 2008 2009
Best Quarter: 23.16%, Q2 2003 Worst Quarter: -26.18%, Q4 2008
Year-to-Date as of 3/31/2010: 8.79%
AVERAGE ANNUAL TOTAL RETURNS
(For periods ended 12/31/2009 expressed as a %)
1 5 10
YEAR YEARS YEARS
---------- --------- ---------
CLASS A 26.57 0.04 3.02
-------------------------------- ----- ---- ----
RUSSELL 2000( (Reg. TM)) INDEX 27.17 0.51 3.51
-------------------------------- ----- ---- ----
MANAGEMENT
INVESTMENT ADVISOR
Deutsche Investment Management Americas Inc.
SUBADVISOR
Northern Trust Investments, N.A.
PORTFOLIO MANAGER(S)
BRENT REEDER. Senior Vice President of Northern Trust Investments, N.A.
Portfolio Manager of the fund. Joined the fund in 2007.
PURCHASE AND SALE OF FUND SHARES
THE FUND IS INTENDED FOR USE IN A VARIABLE INSURANCE PRODUCT. You should
contact the sponsoring insurance company for information on how to purchase and
sell shares of the fund.
TAX INFORMATION
Generally, owners of variable annuity and variable life contracts are not
subject to current federal income taxation on distributions of income or gains
with respect to such contracts. For further information concerning federal
income tax consequences for the holders of variable annuity contracts and
variable life insurance policies, such holders should consult the prospectus
used in connection with the issuance of their particular contracts or policies.
PAYMENTS TO FINANCIAL INTERMEDIARIES
If you purchase the fund through selected affiliated and unaffiliated brokers,
dealers, participating insurance companies or other financial intermediaries,
the fund and its affiliates may pay the financial intermediary for the sale of
fund shares and related services. These payments may create a conflict of
interest by influencing the financial intermediary and your salesperson to
recommend the fund over another investment. Ask your salesperson or visit your
insurance company's web site for more information.
25
PROSPECTUS May 1, 2010 DWS Small Cap Index VIP
FUND DETAILS
ADDITIONAL INFORMATION ABOUT FUND STRATEGIES AND RISKS
--------------------------------------------------------------------------------
DWS Bond VIP
PRINCIPAL INVESTMENT STRATEGY
MAIN INVESTMENTS. Under normal circumstances, the fund invests at least 80% of
net assets, plus the amount of any borrowings for investment purposes, in bonds
of any maturity. The fund invests mainly in US dollar-denominated fixed income
securities, including corporate bonds, US government and agency bonds and
mortgage- and asset-backed securities. The fund may also invest significantly
in foreign investment grade fixed income securities, non-investment grade (high
yield or junk bonds) securities of US and foreign issuers (including issuers in
countries with new or emerging securities markets), or to maintain liquidity,
in cash or money market instruments.
The fund may invest up to 25% of total assets in foreign investment grade bonds
(those in the top four grades of credit quality). The fund may also invest up
to 35% of total assets in non-investment grade securities (junk bonds) of US
and foreign issuers that are rated as low as grade B, the sixth credit grade.
Compared to investment-grade bonds, junk bonds generally pay higher yields but
have higher volatility and higher risk of default on payments. The fund may
invest up to 20% of total assets in US dollar or foreign currency denominated
bonds of issuers located in countries with new or emerging securities markets.
The fund may have exposure of up to 15% of total assets in foreign currencies.
MANAGEMENT PROCESS. In choosing securities, portfolio management uses distinct
processes for various types of securities.
US INVESTMENT GRADE SECURITIES. Portfolio management typically:
o ranks securities based on creditworthiness, cash flow and price
o determines the value of each security by examining the issuer's credit
quality, debt structure, option value and liquidity risks to identify any
inefficiencies between this value and market trading price
o uses credit analysis to determine the issuer's ability to fulfill its
contracts
o uses a bottom-up approach that subordinates sector weightings to individual
bonds that portfolio management believes may add above-market value
FOREIGN INVESTMENT GRADE AND EMERGING MARKETS HIGH YIELD SECURITIES. Portfolio
management uses a relative value strategy to identify the most attractive
foreign markets, then searches those markets for securities that portfolio
management believes offer incremental value over US Treasuries. With emerging
market securities, portfolio management also considers short-term factors such
as market sentiment, capital flows, and new issue programs.
HIGH YIELD SECURITIES (OTHER THAN EMERGING MARKETS). Portfolio management
typically:
o analyzes economic conditions for improving or undervalued sectors and
industries
o uses independent credit research and on-site management visits to evaluate
individual issuer's debt service, growth rate, and both downgrade and
upgrade potential
o assesses new issues versus secondary market opportunities
o seeks issues within attractive industry sectors and with strong long-term
fundamentals and improving credit
Portfolio management generally sells securities (or exchanges currencies) when
they reach their target prices, when other investments appear more attractive,
or, particularly for high yield securities, when company fundamentals decline
or when portfolio management believes an unexpected development will diminish a
company's competitive position or ability to generate adequate cash flow.
The fund may trade actively. This could raise transaction costs (thus lowering
returns).
--------------------------------------------------------------------------------
DERIVATIVES. The fund may use various types of derivatives (contracts whose
value is based on, for example, indices, currencies or securities) for hedging,
risk management or non-hedging purposes to seek to enhance potential gains. The
fund may use derivatives as a substitute for direct investment in a particular
asset class or to keep cash on hand to meet shareholder redemptions or other
needs. In particular, the fund may use interest rate and currency futures,
Eurodollar futures, interest rate and currency swaps and credit default swaps.
SECURITIES LENDING. The fund may lend securities (up to one-third of total
assets) to approved institutions.
--------------------------------------------------------------------------------
26
PROSPECTUS May 1, 2010 Fund Details
MAIN RISKS
There are several risk factors that could hurt the fund's performance, cause
you to lose money or cause the fund's performance to trail that of other
investments.
INTEREST RATE RISK. When interest rates rise, prices of debt securities
generally decline. The longer the duration of the fund's debt securities, the
more sensitive it will be to interest rate changes. (As a general rule, a 1%
rise in interest rates means a 1% fall in value for every year of duration.)
PREPAYMENT AND EXTENSION RISK. When interest rates fall, issuers of high
interest debt obligations may pay off the debts earlier than expected
(prepayment risk), and the fund may have to reinvest the proceeds at lower
yields. When interest rates rise, issuers of lower interest debt obligations
may pay off the debts later than expected (extension risk), thus keeping the
fund's assets tied up in lower interest debt obligations. Prepayments could
also create capital gains tax liability in some instances. Any unexpected
behavior in interest rates could increase the volatility of the fund's share
price and yield and could hurt fund performance.
CREDIT RISK. A fund purchasing debt securities faces the risk that the
creditworthiness of an issuer may decline, causing the value of the debt
securities to decline. In addition, an issuer may not be able to make timely
payments on the interest and/or principal on the debt security it has issued.
Because the issuers of high-yield debt securities or junk bonds (debt
securities rated below the fourth highest category) may be in uncertain
financial health, the prices of their debt securities can be more vulnerable to
bad economic news or even the expectation of bad news, than investment-grade
debt securities. In some cases, debt securities, particularly high-yield debt
securities, may decline in credit quality or go into default. Because the fund
may invest in securities not paying current interest or in securities already
in default, these risks may be more pronounced.
FOREIGN INVESTMENT RISK. To the extent the fund invests in companies based
outside the US, it faces the risks inherent in foreign investing. Adverse
political, economic or social developments could undermine the value of the
fund's investments or prevent the fund from realizing their full value.
Financial reporting standards for companies based in foreign markets differ
from those in the US. Additionally, foreign securities markets generally are
smaller and less liquid than US markets. To the extent that the fund invests in
non-US dollar denominated foreign securities, changes in currency exchange
rates may affect the US dollar value of foreign securities or the income or
gain received on these securities. Foreign governments may restrict investment
by foreigners, limit withdrawal of trading profit or currency from the country,
restrict currency exchange or seize foreign investments. The investments of the
fund may also be subject to foreign withholding taxes. Foreign transactions and
custody of assets may involve delays in payment, delivery or recovery of money
or investments. Foreign investment risks are greater in emerging markets than
in developed markets. Emerging market investments are often considered
speculative. Emerging market countries typically have economic and political
systems that are less developed, and can be expected to be less stable than
developed markets. For example, the economies of such countries can be subject
to rapid and unpredictable rates of inflation or deflation.
DERIVATIVES RISK. Risks associated with derivatives include the risk that the
derivative is not well correlated with the security, index or currency to which
it relates; the risk that derivatives may result in losses or missed
opportunities; the risk that the fund will be unable to sell the derivative
because of an illiquid secondary market; the risk that a counterparty is
unwilling or unable to meet its obligation; and the risk that the derivative
transaction could expose the fund to the effects of leverage, which could
increase the fund's exposure to the market and magnify potential losses. There
is no guarantee that derivatives, to the extent employed, will have the
intended effect, and their use could cause lower returns or even losses to the
fund. The use of derivatives by the fund to hedge risk may reduce the
opportunity for gain by offsetting the positive effect of favorable price
movements.
PRICING RISK. If market conditions make it difficult to value some investments,
the fund may value these investments using more subjective methods, such as
fair value pricing. In such cases, the value determined for an investment could
be different than the value realized upon such investment's sale. As a result,
you could pay more than the market value when buying fund shares or receive
less than the market value when selling fund shares.
SECURITIES LENDING RISK. Any decline in the value of a portfolio security that
occurs while the security is out on loan is borne by the fund, and will
adversely affect performance. Also, there may be delays in recovery of
securities loaned or even a loss of rights in the collateral should the
borrower of the securities fail financially while holding the security.
SECURITY SELECTION RISK. The securities in the fund's portfolio may decline in
value. Portfolio management could be wrong in its analysis of industries,
companies, economic trends, the relative attractiveness of different securities
or other matters.
COUNTERPARTY RISK. A financial institution or other counterparty with whom the
fund does business (such as trading or securities lending), or that
underwrites, distributes or guarantees any investments or contracts that the
fund owns or is otherwise exposed to, may decline in financial health and
become unable to honor its commitments. This could cause losses for the fund or
could delay the return or delivery of collateral or other assets to the fund.
27
PROSPECTUS May 1, 2010 Fund Details
LIQUIDITY RISK. In certain situations, it may be difficult or impossible to
sell an investment in an orderly fashion at an acceptable price. This risk can
be ongoing for any security that does not trade actively or in large volumes,
for any security that trades primarily on smaller markets, and for investments
that typically trade only among a limited number of large investors (such as
certain types of derivatives or restricted securities). In unusual market
conditions, even normally liquid securities may be affected by a degree of
liquidity risk. This may affect only certain securities or an overall
securities market.
--------------------------------------------------------------------------------
DWS Growth & Income VIP
PRINCIPAL INVESTMENT STRATEGY
MAIN INVESTMENTS. The fund invests at least 65% of total assets in equities,
mainly common stocks. Although the fund can invest in companies of any size and
from any country, it invests primarily in large US companies. Portfolio
management may favor securities from different industries and companies at
different times.
MANAGEMENT PROCESS. Portfolio management uses both quantitative and fundamental
analysis to evaluate each company's stock price relative to the company's
earnings, operating trends, market outlook and other measures of performance
potential.
Portfolio management will normally sell a stock when it believes the
fundamental factors have changed, other investments offer better opportunities
or in the course of adjusting the fund's emphasis on or within a given
industry.
--------------------------------------------------------------------------------
DERIVATIVES. The fund may use various types of derivatives (contracts whose
value is based on, for example, indices, currencies or securities) for hedging,
risk management or non-hedging purposes to seek to enhance potential gains. The
fund may use derivatives as a substitute for direct investment in a particular
asset class or to keep cash on hand to meet shareholder redemptions or other
needs.
SECURITIES LENDING. The fund may lend securities (up to one-third of total
assets) to approved institutions.
--------------------------------------------------------------------------------
MAIN RISKS
There are several risk factors that could hurt the fund's performance, cause
you to lose money or cause the fund's performance to trail that of other
investments.
STOCK MARKET RISK. When stock prices fall, you should expect the value of your
investment to fall as well. Stock prices can be hurt by poor management on the
part of the stock's issuer, shrinking product demand and other business risks.
These may affect single companies as well as groups of companies. In addition,
movements in financial markets may adversely affect a stock's price, regardless
of how well the company performs. To the extent the fund invests in a
particular capitalization or market sector, the fund's performance may be
proportionately affected by that segment's general performance.
FOCUS RISK. To the extent that the fund focuses its investments in particular
industries, asset classes or sectors of the economy, any market price
movements, regulatory or technological changes, or economic conditions
affecting companies in those industries, asset classes or sectors will have a
significant impact on the fund's performance. For example, consumer goods
companies could be hurt by a rise in unemployment or technology companies could
be hurt by such factors as market saturation, price competition and rapid
obsolescence.
SECURITY SELECTION RISK. The securities in the fund's portfolio may decline in
value. Portfolio management could be wrong in its analysis of industries,
companies, economic trends, the relative attractiveness of different securities
or other matters.
SECURITIES LENDING RISK. Any decline in the value of a portfolio security that
occurs while the security is out on loan is borne by the fund, and will
adversely affect performance. Also, there may be delays in recovery of
securities loaned or even a loss of rights in the collateral should the
borrower of the securities fail financially while holding the security.
DERIVATIVES RISK. Risks associated with derivatives include the risk that the
derivative is not well correlated with the security, index or currency to which
it relates; the risk that derivatives may result in losses or missed
opportunities; the risk that the fund will be unable to sell the derivative
because of an illiquid secondary market; the risk that a counterparty is
unwilling or unable to meet its obligation; and the risk that the derivative
transaction could expose the fund to the effects of leverage, which could
increase the fund's exposure to the market and magnify potential losses. There
is no guarantee that derivatives, to the extent employed, will have the
intended effect, and their use could cause lower returns or even losses to the
fund. The use of derivatives by the fund to hedge risk may reduce the
opportunity for gain by offsetting the positive effect of favorable price
movements.
FOREIGN INVESTMENT RISK. To the extent the fund invests in companies based
outside the US, it faces the risks inherent in foreign investing. Adverse
political, economic or social developments could undermine the value of the
fund's investments or prevent the fund from realizing their full value.
Financial reporting standards for companies based in foreign markets differ
from those in the US. Additionally, foreign securities markets generally are
smaller and less liquid than US markets. To the extent that the fund invests in
non-US dollar denominated foreign securities, changes in currency exchange
rates may affect the US dollar value of foreign securities or the income or
gain received on these securities. Foreign governments may restrict investment
by foreigners, limit withdrawal of trading profit or currency from the country,
restrict currency exchange or seize foreign investments. The investments of the
fund may also be subject to foreign withholding taxes.
28
PROSPECTUS May 1, 2010 Fund Details
Foreign transactions and custody of assets may involve delays in payment,
delivery or recovery of money or investments.
COUNTERPARTY RISK. A financial institution or other counterparty with whom the
fund does business (such as trading or securities lending), or that
underwrites, distributes or guarantees any investments or contracts that the
fund owns or is otherwise exposed to, may decline in financial health and
become unable to honor its commitments. This could cause losses for the fund or
could delay the return or delivery of collateral or other assets to the fund.
LIQUIDITY RISK. In certain situations, it may be difficult or impossible to
sell an investment in an orderly fashion at an acceptable price. This risk can
be ongoing for any security that does not trade actively or in large volumes,
for any security that trades primarily on smaller markets, and for investments
that typically trade only among a limited number of large investors (such as
certain types of derivatives or restricted securities). In unusual market
conditions, even normally liquid securities may be affected by a degree of
liquidity risk. This may affect only certain securities or an overall
securities market.
PRICING RISK. If market conditions make it difficult to value some investments,
the fund may value these investments using more subjective methods, such as
fair value pricing. In such cases, the value determined for an investment could
be different than the value realized upon such investment's sale. As a result,
you could pay more than the market value when buying fund shares or receive
less than the market value when selling fund shares.
--------------------------------------------------------------------------------
DWS Capital Growth VIP
PRINCIPAL INVESTMENT STRATEGY
MAIN INVESTMENTS. The fund normally invests at least 65% of total assets in
equities, mainly common stocks of US companies. The fund generally focuses on
established companies that are similar in size to the companies in the S&P 500(
(Reg. TM)) Index (generally 500 of the largest companies in the US) or the
Russell 1000( (Reg. TM) )Growth Index (generally those stocks among the 1,000
largest US companies that have above-average price-to-earnings ratios).
Although the fund can invest in companies of any size, the fund intends to
invest primarily in companies whose market capitalizations fall within the
normal range of these indexes. The fund may also invest in other types of
equity securities such as preferred stocks or convertible securities.
MANAGEMENT PROCESS. In choosing stocks, portfolio management begins by
utilizing a proprietary quantitative model to rank stocks based on a number of
factors including valuation and profitability. Portfolio management also
applies fundamental techniques to seek to identify companies that display
above-average earnings growth compared to other companies and that have strong
product lines, effective management and leadership positions within core
markets. The factors considered and models used by the portfolio managers may
change over time.
Portfolio management will normally sell a security when it believes the
potential risks have increased, its price is unlikely to go higher, its
fundamental factors have changed, other investments offer better opportunities
or in the course of adjusting the fund's emphasis on a given industry.
--------------------------------------------------------------------------------
DERIVATIVES. The fund may use various types of derivatives (contracts whose
value is based on, for example, indices, currencies or securities) for hedging,
risk management or non-hedging purposes to seek to enhance potential gains. The
fund may use derivatives as a substitute for direct investment in a particular
asset class or to keep cash on hand to meet shareholder redemptions or other
needs. In particular, the fund may use futures and options, and write covered
call options.
SECURITIES LENDING. The fund may lend securities (up to one-third of total
assets) to approved institutions.
--------------------------------------------------------------------------------
MAIN RISKS
There are several risk factors that could hurt the fund's performance, cause
you to lose money or cause the fund's performance to trail that of other
investments.
STOCK MARKET RISK. When stock prices fall, you should expect the value of your
investment to fall as well. Stock prices can be hurt by poor management on the
part of the stock's issuer, shrinking product demand and other business risks.
These may affect single companies as well as groups of companies. In addition,
movements in financial markets may adversely affect a stock's price, regardless
of how well the company performs. To the extent the fund invests in a
particular capitalization or market sector, the fund's performance may be
proportionately affected by that segment's general performance.
GROWTH INVESTING RISK. As a category, growth stocks may underperform value
stocks (and the stock market as a whole) over any period of time. Because the
prices of growth stocks are based largely on the expectation of future
earnings, growth stock prices can decline rapidly and significantly in reaction
to negative news about such factors as earnings, the economy, political
developments, or other news. A growth company may fail to fulfill apparent
promise or may be eclipsed by competitors or its products or services rendered
obsolete by new technologies. Growth stocks also typically lack the dividends
associated with value stocks that might otherwise cushion investors from the
effects of declining stock prices. In addition, growth stocks selected for
investment by portfolio management may not perform as anticipated.
FOCUS RISK. To the extent that the fund focuses its investments in particular
industries, asset classes or sectors of the economy, any market price
movements, regulatory or technological changes, or economic conditions
affecting companies in those industries, asset classes or sectors
29
PROSPECTUS May 1, 2010 Fund Details
will have a significant impact on the fund's performance. For example, consumer
goods companies could be hurt by a rise in unemployment or technology companies
could be hurt by such factors as market saturation, price competition and rapid
obsolescence.
SECURITY SELECTION RISK. The securities in the fund's portfolio may decline in
value. Portfolio management could be wrong in its analysis of industries,
companies, economic trends, the relative attractiveness of different securities
or other matters.
SECURITIES LENDING RISK. Any decline in the value of a portfolio security that
occurs while the security is out on loan is borne by the fund, and will
adversely affect performance. Also, there may be delays in recovery of
securities loaned or even a loss of rights in the collateral should the
borrower of the securities fail financially while holding the security.
DERIVATIVES RISK. Risks associated with derivatives include the risk that the
derivative is not well correlated with the security, index or currency to which
it relates; the risk that derivatives may result in losses or missed
opportunities; the risk that the fund will be unable to sell the derivative
because of an illiquid secondary market; the risk that a counterparty is
unwilling or unable to meet its obligation; and the risk that the derivative
transaction could expose the fund to the effects of leverage, which could
increase the fund's exposure to the market and magnify potential losses. There
is no guarantee that derivatives, to the extent employed, will have the
intended effect, and their use could cause lower returns or even losses to the
fund. The use of derivatives by the fund to hedge risk may reduce the
opportunity for gain by offsetting the positive effect of favorable price
movements.
FOREIGN INVESTMENT RISK. To the extent the fund invests in companies based
outside the US, it faces the risks inherent in foreign investing. Adverse
political, economic or social developments could undermine the value of the
fund's investments or prevent the fund from realizing their full value.
Financial reporting standards for companies based in foreign markets differ
from those in the US. Additionally, foreign securities markets generally are
smaller and less liquid than US markets. To the extent that the fund invests in
non-US dollar denominated foreign securities, changes in currency exchange
rates may affect the US dollar value of foreign securities or the income or
gain received on these securities. Foreign governments may restrict investment
by foreigners, limit withdrawal of trading profit or currency from the country,
restrict currency exchange or seize foreign investments. The investments of the
fund may also be subject to foreign withholding taxes. Foreign transactions and
custody of assets may involve delays in payment, delivery or recovery of money
or investments.
COUNTERPARTY RISK. A financial institution or other counterparty with whom the
fund does business (such as trading or securities lending), or that
underwrites, distributes or guarantees any investments or contracts that the
fund owns or is otherwise exposed to, may decline in financial health and
become unable to honor its commitments. This could cause losses for the fund or
could delay the return or delivery of collateral or other assets to the fund.
LIQUIDITY RISK. In certain situations, it may be difficult or impossible to
sell an investment in an orderly fashion at an acceptable price. This risk can
be ongoing for any security that does not trade actively or in large volumes,
for any security that trades primarily on smaller markets, and for investments
that typically trade only among a limited number of large investors (such as
certain types of derivatives or restricted securities). In unusual market
conditions, even normally liquid securities may be affected by a degree of
liquidity risk. This may affect only certain securities or an overall
securities market.
PRICING RISK. If market conditions make it difficult to value some investments,
the fund may value these investments using more subjective methods, such as
fair value pricing. In such cases, the value determined for an investment could
be different than the value realized upon such investment's sale. As a result,
you could pay more than the market value when buying fund shares or receive
less than the market value when selling fund shares.
--------------------------------------------------------------------------------
DWS Global Opportunities VIP
PRINCIPAL INVESTMENT STRATEGY
MAIN INVESTMENTS. The fund invests at least 65% of total assets in common
stocks and other equities of small companies throughout the world (companies
with market values similar to the smallest 20% of the S&P Developed Broad
Market Index, formerly the S&P/Citigroup Broad Market Index World). As of
December 31, 2009, companies in which the fund invests typically have market
capitalizations of between $500 million and $5 billion at the time of purchase.
As part of the investment process (and low turnover strategy) the fund may own
stocks even if they are outside this market capitalization range.
The fund may invest up to 35% of total assets in common stocks and other
equities of large companies or in debt securities, including up to 5% of the
fund's net assets may invested in junk bonds (considered to be grade BB/Ba and
below). Compared to investment-grade bonds, junk bonds may pay higher yields,
have higher volatility and a higher risk of default. Other types of equities in
which the fund may invest include preferred stocks or convertible securities.
MANAGEMENT PROCESS. While the fund may invest in securities of any country,
portfolio management generally focuses on countries with developed economies
(including the US). In choosing securities, portfolio management uses a
combination of three analytical disciplines:
30
PROSPECTUS May 1, 2010 Fund Details
BOTTOM-UP RESEARCH. Portfolio management looks for individual companies with a
history of above average growth, strong competitive positioning, attractive
prices relative to potential growth, sound financial strength and effective
management, among other factors.
GROWTH ORIENTATION. Portfolio management generally looks for companies that
they believe have above-average potential for sustainable growth of revenue or
earnings and whose market value appears reasonable in light of their business
prospects.
ANALYSIS OF GLOBAL THEMES. Portfolio management considers global economic
outlooks, seeking to identify industries and companies that are likely to
benefit from social, political and economic changes.
Portfolio management will normally sell a security when it believes the price
is unlikely to go much higher, its fundamentals have deteriorated, other
investments offer better opportunities or in the course of adjusting the fund's
exposure to a given country.
--------------------------------------------------------------------------------
DERIVATIVES. The fund may use various types of derivatives (contracts whose
value is based on, for example, indices, currencies or securities) for hedging,
risk management or non-hedging purposes to seek to enhance potential gains. The
fund may also enter into forward currency exchange contracts and buy and sell
currency options to hedge against currency fluctuations. The fund may use
derivatives as a substitute for direct investment in a particular asset class
or to keep cash on hand to meet shareholder redemptions or other needs. In
particular, the fund may use futures, options and yield curve options, forward
currency exchange contracts and may buy or sell currency options.
SECURITIES LENDING. The fund may lend securities (up to one-third of total
assets) to approved institutions.
--------------------------------------------------------------------------------
MAIN RISKS
There are several risk factors that could hurt the fund's performance, cause
you to lose money or cause the fund's performance to trail that of other
investments.
STOCK MARKET RISK. When stock prices fall, you should expect the value of your
investment to fall as well. Stock prices can be hurt by poor management on the
part of the stock's issuer, shrinking product demand and other business risks.
These may affect single companies as well as groups of companies. In addition,
movements in financial markets may adversely affect a stock's price, regardless
of how well the company performs. To the extent that the fund invests in a
particular geographic region or market sector, performance will be affected by
that region's general performance.
FOREIGN INVESTMENT RISK. To the extent the fund invests in companies based
outside the US, it faces the risks inherent in foreign investing. Adverse
political, economic or social developments could undermine the value of the
fund's investments or prevent the fund from realizing their full value.
Financial reporting standards for companies based in foreign markets differ
from those in the US. Additionally, foreign securities markets generally are
smaller and less liquid than US markets. To the extent that the fund invests in
non-US dollar denominated foreign securities, changes in currency exchange
rates may affect the US dollar value of foreign securities or the income or
gain received on these securities. Foreign governments may restrict investment
by foreigners, limit withdrawal of trading profit or currency from the country,
restrict currency exchange or seize foreign investments. The investments of the
fund may also be subject to foreign withholding taxes. Foreign transactions and
custody of assets may involve delays in payment, delivery or recovery of money
or investments. Foreign investment risks are greater in emerging markets than
in developed markets. Emerging market investments are often considered
speculative. Emerging market countries typically have economic and political
systems that are less developed, and can be expected to be less stable than
developed markets. For example, the economies of such countries can be subject
to rapid and unpredictable rates of inflation or deflation.
SMALL COMPANY RISK. Small company stocks tend to be more volatile than large
company stocks. Small companies are less widely followed by stock analysts and
less information about them is available to investors. Industry-wide reversals
may have a greater impact on small companies, since they lack the financial
resources of larger companies. Small company stocks are typically less liquid
than large company stocks.
PRICING RISK. If market conditions make it difficult to value some investments,
the fund may value these investments using more subjective methods, such as
fair value pricing. In such cases, the value determined for an investment could
be different than the value realized upon such investment's sale. As a result,
you could pay more than the market value when buying fund shares or receive
less than the market value when selling fund shares.
DERIVATIVES RISK. Risks associated with derivatives include the risk that the
derivative is not well correlated with the security, index or currency to which
it relates; the risk that derivatives may result in losses or missed
opportunities; the risk that the fund will be unable to sell the derivative
because of an illiquid secondary market; the risk that a counterparty is
unwilling or unable to meet its obligation; and the risk that the derivative
transaction could expose the fund to the effects of leverage, which could
increase the fund's exposure to the market and magnify potential losses. There
is no guarantee that derivatives, to the extent employed, will have the
intended effect, and their use could cause lower returns or even losses to the
fund. The use of derivatives by the fund to hedge risk may reduce the
opportunity for gain by offsetting the positive effect of favorable price
movements.
31
PROSPECTUS May 1, 2010 Fund Details
SECURITY SELECTION RISK. The securities in the fund's portfolio may decline in
value. Portfolio management could be wrong in its analysis of industries,
companies, economic trends, the relative attractiveness of different securities
or other matters.
SECURITIES LENDING RISK. Any decline in the value of a portfolio security that
occurs while the security is out on loan is borne by the fund, and will
adversely affect performance. Also, there may be delays in recovery of
securities loaned or even a loss of rights in the collateral should the
borrower of the securities fail financially while holding the security.
COUNTERPARTY RISK. A financial institution or other counterparty with whom the
fund does business (such as trading or securities lending), or that
underwrites, distributes or guarantees any investments or contracts that the
fund owns or is otherwise exposed to, may decline in financial health and
become unable to honor its commitments. This could cause losses for the fund or
could delay the return or delivery of collateral or other assets to the fund.
CREDIT RISK. A fund purchasing debt securities faces the risk that the
creditworthiness of an issuer may decline, causing the value of the debt
securities to decline. In addition, an issuer may not be able to make timely
payments on the interest and/or principal on the debt security it has issued.
Because the issuers of high-yield debt securities or junk bonds (debt
securities rated below the fourth highest category) may be in uncertain
financial health, the prices of their debt securities can be more vulnerable to
bad economic news or even the expectation of bad news, than investment-grade
debt securities. In some cases, debt securities, particularly high-yield debt
securities, may decline in credit quality or go into default. Because the fund
may invest in securities not paying current interest or in securities already
in default, these risks may be more pronounced.
GROWTH INVESTING RISK. As a category, growth stocks may underperform value
stocks (and the stock market as a whole) over any period of time. Because the
prices of growth stocks are based largely on the expectation of future
earnings, growth stock prices can decline rapidly and significantly in reaction
to negative news about such factors as earnings, the economy, political
developments, or other news. A growth company may fail to fulfill apparent
promise or may be eclipsed by competitors or its products or services rendered
obsolete by new technologies. Growth stocks also typically lack the dividends
associated with value stocks that might otherwise cushion investors from the
effects of declining stock prices. In addition, growth stocks selected for
investment by portfolio management may not perform as anticipated.
INTEREST RATE RISK. When interest rates rise, prices of debt securities
generally decline. The longer the duration of the fund's debt securities, the
more sensitive it will be to interest rate changes. (As a general rule, a 1%
rise in interest rates means a 1% fall in value for every year of duration.)
LIQUIDITY RISK. In certain situations, it may be difficult or impossible to
sell an investment in an orderly fashion at an acceptable price. This risk can
be ongoing for any security that does not trade actively or in large volumes,
for any security that trades primarily on smaller markets, and for investments
that typically trade only among a limited number of large investors (such as
certain types of derivatives or restricted securities). In unusual market
conditions, even normally liquid securities may be affected by a degree of
liquidity risk. This may affect only certain securities or an overall
securities market.
PREPAYMENT AND EXTENSION RISK. When interest rates fall, issuers of high
interest debt obligations may pay off the debts earlier than expected
(prepayment risk), and the fund may have to reinvest the proceeds at lower
yields. When interest rates rise, issuers of lower interest debt obligations
may pay off the debts later than expected (extension risk), thus keeping the
fund's assets tied up in lower interest debt obligations. Prepayments could
also create capital gains tax liability in some instances. Any unexpected
behavior in interest rates could increase the volatility of the fund's yield
and could hurt fund performance.
--------------------------------------------------------------------------------
DWS International VIP
PRINCIPAL INVESTMENT STRATEGY
MAIN INVESTMENTS. Although the fund can invest in companies of any size and
from any country, it invests mainly in common stocks of established companies
in countries with developed economies (other than the United States). The
fund's equity investments may also include preferred stocks, depositary
receipts and other securities with equity characteristics, such as convertible
securities and warrants.
MANAGEMENT PROCESS. In choosing securities, portfolio management uses a
combination of two analytical disciplines:
BOTTOM-UP RESEARCH. Portfolio management looks for individual companies with a
history of above-average growth, strong competitive positioning, attractive
prices relative to potential growth, sound financial strength and effective
management, among other factors.
TOP-DOWN ANALYSIS. Portfolio management considers the economic outlooks for
various sectors and industries while looking for those that may benefit from
changes in the overall business environment.
32
PROSPECTUS May 1, 2010 Fund Details
Portfolio management will normally sell a security when it believes the price
is unlikely to go much higher, its fundamentals have deteriorated, other
investments offer better opportunities or in the course of adjusting the fund's
exposure to a given country.
--------------------------------------------------------------------------------
DERIVATIVES. The fund may use various types of derivatives (contracts whose
value is based on, for example, indices, currencies or securities) for hedging,
risk management or non-hedging purposes to seek to enhance potential gains. The
fund may use derivatives as a substitute for direct investment in a particular
asset class or to keep cash on hand to meet shareholder redemptions or other
needs.
SECURITIES LENDING. The fund may lend securities (up to one-third of total
assets) to approved institutions.
--------------------------------------------------------------------------------
MAIN RISKS
There are several risk factors that could hurt the fund's performance, cause
you to lose money or cause the fund's performance to trail that of other
investments.
FOREIGN INVESTMENT RISK. To the extent the fund invests in companies based
outside the US, it faces the risks inherent in foreign investing. Adverse
political, economic or social developments could undermine the value of the
fund's investments or prevent the fund from realizing their full value.
Financial reporting standards for companies based in foreign markets differ
from those in the US. Additionally, foreign securities markets generally are
smaller and less liquid than US markets. To the extent that the fund invests in
non-US dollar denominated foreign securities, changes in currency exchange
rates may affect the US dollar value of foreign securities or the income or
gain received on these securities. Foreign governments may restrict investment
by foreigners, limit withdrawal of trading profit or currency from the country,
restrict currency exchange or seize foreign investments. The investments of the
fund may also be subject to foreign withholding taxes. Foreign transactions and
custody of assets may involve delays in payment, delivery or recovery of money
or investments. Foreign investment risks are greater in emerging markets than
in developed markets. Emerging market investments are often considered
speculative. Emerging market countries typically have economic and political
systems that are less developed, and can be expected to be less stable than
developed markets. For example, the economies of such countries can be subject
to rapid and unpredictable rates of inflation or deflation.
STOCK MARKET RISK. When stock prices fall, you should expect the value of your
investment to fall as well. Stock prices can be hurt by poor management on the
part of the stock's issuer, shrinking product demand and other business risks.
These may affect single companies as well as groups of companies. In addition,
movements in financial markets may adversely affect a stock's price, regardless
of how well the company performs. To the extent that the fund invests in a
particular geographic region or market sector, performance will be affected by
that region's general performance.
SECURITY SELECTION RISK. The securities in the fund's portfolio may decline in
value. Portfolio management could be wrong in its analysis of industries,
companies, economic trends, the relative attractiveness of different securities
or other matters.
LIQUIDITY RISK. In certain situations, it may be difficult or impossible to
sell an investment in an orderly fashion at an acceptable price. This risk can
be ongoing for any security that does not trade actively or in large volumes,
for any security that trades primarily on smaller markets, and for investments
that typically trade only among a limited number of large investors (such as
certain types of derivatives or restricted securities). In unusual market
conditions, even normally liquid securities may be affected by a degree of
liquidity risk. This may affect only certain securities or an overall
securities market.
PRICING RISK. If market conditions make it difficult to value some investments,
the fund may value these investments using more subjective methods, such as
fair value pricing. In such cases, the value determined for an investment could
be different than the value realized upon such investment's sale. As a result,
you could pay more than the market value when buying fund shares or receive
less than the market value when selling fund shares.
DERIVATIVES RISK. Risks associated with derivatives include the risk that the
derivative is not well correlated with the security, index or currency to which
it relates; the risk that derivatives may result in losses or missed
opportunities; the risk that the fund will be unable to sell the derivative
because of an illiquid secondary market; the risk that a counterparty is
unwilling or unable to meet its obligation; and the risk that the derivative
transaction could expose the fund to the effects of leverage, which could
increase the fund's exposure to the market and magnify potential losses. There
is no guarantee that derivatives, to the extent employed, will have the
intended effect, and their use could cause lower returns or even losses to the
fund. The use of derivatives by the fund to hedge risk may reduce the
opportunity for gain by offsetting the positive effect of favorable price
movements.
SECURITIES LENDING RISK. Any decline in the value of a portfolio security that
occurs while the security is out on loan is borne by the fund, and will
adversely affect performance. Also, there may be delays in recovery of
securities loaned or even a loss of rights in the collateral should the
borrower of the securities fail financially while holding the security.
COUNTERPARTY RISK. A financial institution or other counterparty with whom the
fund does business (such as trading or securities lending), or that
underwrites, distributes or guarantees any investments or contracts that the
33
PROSPECTUS May 1, 2010 Fund Details
fund owns or is otherwise exposed to, may decline in financial health and
become unable to honor its commitments. This could cause losses for the fund or
could delay the return or delivery of collateral or other assets to the fund.
--------------------------------------------------------------------------------
DWS Health Care VIP
PRINCIPAL INVESTMENT STRATEGY
MAIN INVESTMENTS. Under normal circumstances, the fund will invest at least 80%
of total assets, plus the amount of any borrowing for investment purposes, in
common stock of companies in the health care sector. For purposes of the fund's
80% investment policy, to be considered part of the health care sector,
companies must commit at least half of their assets to, or derive at least half
of the revenues or net income from, that sector. Examples of industries in the
health care sector include pharmaceuticals, biotechnology, medical products and
supplies, and health care services. The fund invests primarily in securities of
US companies, but may invest in foreign companies as well. The fund may invest
in companies of any market capitalization.
MANAGEMENT PROCESS. In choosing stocks, portfolio management uses a combination
of three analytical disciplines:
BOTTOM-UP RESEARCH. Portfolio management looks for individual companies with a
history of above-average growth, strong competitive positioning, new tests or
treatments, the ability to take advantage of demographic trends, attractive
prices relative to potential growth, sound financial strength and effective
management, among other factors.
GROWTH ORIENTATION. Portfolio management generally looks for companies that it
believes have above-average potential for sustainable growth of revenue or
earnings and whose market value appears reasonable in light of their business
prospects.
TOP-DOWN ANALYSIS. Portfolio management considers the economic outlook for
various industries within the health care sector while looking for those that
it believes may benefit from changes in the overall business environment.
Portfolio management may favor securities from different industries and
companies within the health care sector at different times. Portfolio
management will normally sell a stock when it believes the stock's price is
unlikely to go higher, its fundamental factors have changed, other investments
offer better opportunities, or in the course of adjusting their emphasis on a
given health care industry.
--------------------------------------------------------------------------------
DERIVATIVES. The fund may use various types of derivatives (contracts whose
value is based on, for example, indices, currencies or securities) for hedging,
risk management or non-hedging purposes to seek to enhance potential gains. The
fund may use derivatives as a substitute for direct investment in a particular
asset class or to keep cash on hand to meet shareholder redemptions or other
needs.
SECURITIES LENDING. The fund may lend securities (up to one-third of total
assets) to approved institutions.
--------------------------------------------------------------------------------
MAIN RISKS
There are several risk factors that could hurt the fund's performance, cause
you to lose money or cause the fund's performance to trail that of other
investments.
STOCK MARKET RISK. To the extent the fund invests in a particular sector, the
fund's performance may be proportionately affected by that sector's general
performance. When stock prices fall, you should expect the value of your
investment to fall as well. Stock prices can be hurt by poor management on the
part of the stock's issuer, shrinking product demand and other business risks.
These may affect single companies as well as groups of companies. In addition,
movements in financial markets may adversely affect a stock's price, regardless
of how well the company performs. The market as a whole may not favor the types
of investments the fund makes, which could affect the fund's ability to sell
them at an attractive price.
FOREIGN INVESTMENT RISK. To the extent the fund invests in companies based
outside the US, it faces the risks inherent in foreign investing. Adverse
political, economic or social developments could undermine the value of the
fund's investments or prevent the fund from realizing their full value.
Financial reporting standards for companies based in foreign markets differ
from those in the US. Additionally, foreign securities markets generally are
smaller and less liquid than US markets. To the extent that the fund invests in
non-US dollar denominated foreign securities, changes in currency exchange
rates may affect the US dollar value of foreign securities or the income or
gain received on these securities. Foreign governments may restrict investment
by foreigners, limit withdrawal of trading profit or currency from the country,
restrict currency exchange or seize foreign investments. The investments of the
fund may also be subject to foreign withholding taxes. Foreign transactions and
custody of assets may involve delays in payment, delivery or recovery of money
or investments.
GROWTH INVESTING RISK. As a category, growth stocks may underperform value
stocks (and the stock market as a whole) over any period of time. Because the
prices of growth stocks are based largely on the expectation of future
earnings, growth stock prices can decline rapidly and significantly in reaction
to negative news about such factors as earnings, the economy, political
developments, or other news. A growth company may fail to fulfill apparent
promise or may be eclipsed by competitors or its products or services rendered
obsolete by new technologies. Growth stocks also typically lack the dividends
associated with value stocks that might otherwise cushion investors from the
effects of declining stock prices. In addition, growth stocks selected for
investment by portfolio management may not perform as anticipated.
34
PROSPECTUS May 1, 2010 Fund Details
CONCENTRATION RISK. Any fund that concentrates in a particular segment of the
market will generally be more volatile than a fund that invests more broadly.
Because the fund concentrates its investments in companies in the health care
field, it may be vulnerable to setbacks in that industry. In particular, health
care companies can be affected by rapid product obsolescence and the
unpredictability of winning government approvals.
SECURITY SELECTION RISK. The securities in the fund's portfolio may decline in
value. Portfolio management could be wrong in its analysis of industries,
companies, economic trends, the relative attractiveness of different securities
or other matters.
DERIVATIVES RISK. Risks associated with derivatives include the risk that the
derivative is not well correlated with the security, index or currency to which
it relates; the risk that derivatives may result in losses or missed
opportunities; the risk that the fund will be unable to sell the derivative
because of an illiquid secondary market; the risk that a counterparty is
unwilling or unable to meet its obligation; and the risk that the derivative
transaction could expose the fund to the effects of leverage, which could
increase the fund's exposure to the market and magnify potential losses. There
is no guarantee that derivatives, to the extent employed, will have the
intended effect, and their use could cause lower returns or even losses to the
fund. The use of derivatives by the fund to hedge risk may reduce the
opportunity for gain by offsetting the positive effect of favorable price
movements.
SECURITIES LENDING RISK. Any decline in the value of a portfolio security that
occurs while the security is out on loan is borne by the fund, and will
adversely affect performance. Also, there may be delays in recovery of
securities loaned or even a loss of rights in the collateral should the
borrower of the securities fail financially while holding the security.
SMALL COMPANY RISK. Small company stocks tend to be more volatile than large
company stocks. Small companies are less widely followed by stock analysts and
less information about them is available to investors. Industry-wide reversals
may have a greater impact on small companies, since they lack the financial
resources of larger companies. Small company stocks are typically less liquid
than large company stocks.
COUNTERPARTY RISK. A financial institution or other counterparty with whom the
fund does business (such as trading or securities lending), or that
underwrites, distributes or guarantees any investments or contracts that the
fund owns or is otherwise exposed to, may decline in financial health and
become unable to honor its commitments. This could cause losses for the fund or
could delay the return or delivery of collateral or other assets to the fund.
LIQUIDITY RISK. In certain situations, it may be difficult or impossible to
sell an investment in an orderly fashion at an acceptable price. This risk can
be ongoing for any security that does not trade actively or in large volumes,
for any security that trades primarily on smaller markets, and for investments
that typically trade only among a limited number of large investors (such as
certain types of derivatives or restricted securities). In unusual market
conditions, even normally liquid securities may be affected by a degree of
liquidity risk. This may affect only certain securities or an overall
securities market.
PRICING RISK. If market conditions make it difficult to value some investments,
the fund may value these investments using more subjective methods, such as
fair value pricing. In such cases, the value determined for an investment could
be different than the value realized upon such investment's sale. As a result,
you could pay more than the market value when buying fund shares or receive
less than the market value when selling fund shares.
--------------------------------------------------------------------------------
DWS Equity 500 Index VIP
PRINCIPAL INVESTMENT STRATEGY
MAIN INVESTMENTS. Under normal circumstances, the fund intends to invest at
least 80% of assets, determined at the time of purchase, in stocks of companies
included in the S&P 500( (Reg. TM)) Index and in derivative instruments, such
as futures contracts and options, that provide exposure to the stocks of
companies in the S&P 500( (Reg. TM)) Index. The fund's securities are weighted
to attempt to make the fund's total investment characteristics similar to those
of the S&P 500( (Reg. TM) )Index as a whole. Portfolio management may limit or
avoid exposure to any stock in the S&P 500( (Reg. TM)) Index if it believes the
stock is illiquid or that extraordinary conditions have cast doubt on its
merits. Conversely, portfolio management may gain exposure to a stock not
included in the S&P 500( (Reg. TM) )Index when it believes such exposure is
consistent with the fund's goal (for example, in anticipation of a stock being
added to the S&P 500( (Reg. TM) )Index). The fund may also hold short-term debt
securities and money market instruments for liquidity purposes.
The S&P 500 INDEX is a well-known stock market index that includes common
stocks of 500 companies from several industrial sectors representing a
significant portion of the market value of all stocks publicly traded in the
US. Stocks in the S&P 500 Index are weighted according to their total market
value. The fund is not sponsored, endorsed, sold or promoted by the Standard &
Poor's Division of The McGraw-Hill Companies, Inc. ("S&P").
MANAGEMENT PROCESS. Portfolio management uses quantitative analysis techniques
to structure the fund to obtain a high correlation to the index while seeking
to keep the fund as fully invested as possible in all market environments.
Portfolio management seeks a long-term correlation between fund performance,
before expenses, and the index of 98% or better (perfect correlation being
35
PROSPECTUS May 1, 2010 Fund Details
100%). The fund uses an optimization strategy, buying the largest stocks in the
index in approximately the same proportion they represent in the index, then
investing in a statistically selected sample of the smaller securities found in
the index. This process is intended to produce a portfolio whose industry
weightings, market capitalizations and fundamental characteristics
(price-to-book ratios, price-to-earnings ratios, debt-to-asset ratios and
dividend yields) closely replicate those of the index. This approach attempts
to maximize the fund's liquidity and returns while minimizing its costs.
INDEX INVESTING VERSUS ACTIVE MANAGEMENT. Active management involves portfolio
management buying and selling securities based on research and analysis. Unlike
a fund that is actively managed, an index fund tries to replicate the
performance of a target index by holding either all, or a representative
sample, of the securities in the index.
INFORMATION REGARDING THE S&P 500 INDEX. The fund is not sponsored, endorsed,
sold or promoted by the Standard & Poor's Division of The McGraw-Hill
Companies, Inc. ("S&P"). S&P makes no representation or warranty, express or
implied, to the owners of the fund or any member of the public regarding the
advisability of investing in securities generally or in the fund particularly
or the ability of the S&P 500 Index to track general stock market performance.
S&P's only relationship to the fund is the licensing of certain trademarks and
trade names of S&P and of the S&P 500 Index, which is determined, composed and
calculated by S&P without regard to the fund.
S&P has no obligation to take the needs of the fund or the owners of the fund
into consideration in determining, composing or calculating the S&P 500 Index.
S&P is not responsible for and has not participated in the determination of the
timing, prices, or quantities of the fund to be issued or in the determination
or calculation of the equation by which shares of the fund are redeemable for
cash. S&P has no obligation or liability in connection with the administration,
marketing or trading of the fund.
S&P does not guarantee the accuracy and/or the completeness of the S&P 500
Index or any data included therein and S&P shall have no liability for any
errors, omissions or interruptions therein. S&P makes no warranty, express or
implied, as to results to be obtained by the fund, owners of the fund, or any
other person or entity from the use of the S&P 500 Index or any data included
therein. S&P makes no express or implied warranties, and expressly disclaims
all warranties of merchantability or fitness for a particular purpose or use
with respect to the S&P 500 Index or any data included therein. Without
limiting any of the foregoing, in no event shall S&P have any liability for any
special, punitive, indirect or consequential damages (including lost profits),
even if notified of the possibility of such damages.
--------------------------------------------------------------------------------
DERIVATIVES. The fund may use various types of derivatives (contracts whose
value is based on, for example, indices, currencies or securities) for hedging,
risk management or non-hedging purposes to seek to enhance potential gains. The
fund may use derivatives as a substitute for direct investment in a particular
asset class or to keep cash on hand to meet shareholder redemptions or other
needs.
SECURITIES LENDING. The fund may lend securities (up to one-third of total
assets) to approved institutions.
--------------------------------------------------------------------------------
MAIN RISKS
There are several risk factors that could hurt the fund's performance, cause
you to lose money or cause the fund's performance to trail that of other
investments.
STOCK MARKET RISK. When stock prices fall, you should expect the value of your
investment to fall as well. Stock prices can be hurt by poor management on the
part of the stock's issuer, shrinking product demand and other business risks.
These may affect single companies as well as groups of companies. In addition,
movements in financial markets may adversely affect a stock's price, regardless
of how well the company performs.
INDEXING RISK. An index fund's performance may not exactly replicate the
performance of its target index, for several reasons. For example, the fund
incurs fees, administrative expenses and transaction costs that the index
itself does not. The fund may use sampling techniques (investing in a
representative selection of securities included in the index rather than all
securities in the index), or the composition of its portfolio may diverge from
that of the index. Also, while the exposure of the index to its component
securities is by definition 100%, the fund's effective exposure to index
securities may be greater or lesser than 100%, and may vary over time.
Because an index fund is designed to maintain a high level of exposure to its
target index at all times, it will not take any steps to invest defensively or
otherwise reduce the risk of loss during market downturns.
DERIVATIVES RISK. Risks associated with derivatives include the risk that the
derivative is not well correlated with the security, index or currency to which
it relates; the risk that derivatives may result in losses or missed
opportunities; the risk that the fund will be unable to sell the derivative
because of an illiquid secondary market; the risk that a counterparty is
unwilling or unable to meet its obligation; and the risk that the derivative
transaction could expose the fund to the effects of leverage, which could
increase the fund's exposure to the market and magnify potential losses. There
is no guarantee that derivatives, to the extent employed, will have the
intended effect, and their use could cause lower returns or even losses to the
fund. The use of derivatives by the fund to hedge risk may reduce the
opportunity for gain by offsetting the positive effect of favorable price
movements.
36
PROSPECTUS May 1, 2010 Fund Details
SECURITIES LENDING RISK. Any decline in the value of a portfolio security that
occurs while the security is out on loan is borne by the fund, and will
adversely affect performance. Also, there may be delays in recovery of
securities loaned or even a loss of rights in the collateral should the
borrower of the securities fail financially while holding the security.
COUNTERPARTY RISK. A financial institution or other counterparty with whom the
fund does business (such as trading or securities lending), or that
underwrites, distributes or guarantees any investments or contracts that the
fund owns or is otherwise exposed to, may decline in financial health and
become unable to honor its commitments. This could cause losses for the fund or
could delay the return or delivery of collateral or other assets to the fund.
LIQUIDITY RISK. In certain situations, it may be difficult or impossible to
sell an investment in an orderly fashion at an acceptable price. This risk can
be ongoing for any security that does not trade actively or in large volumes,
for any security that trades primarily on smaller markets, and for investments
that typically trade only among a limited number of large investors (such as
certain types of derivatives or restricted securities). In unusual market
conditions, even normally liquid securities may be affected by a degree of
liquidity risk. This may affect only certain securities or an overall
securities market.
PRICING RISK. If market conditions make it difficult to value some investments,
the fund may value these investments using more subjective methods, such as
fair value pricing. In such cases, the value determined for an investment could
be different than the value realized upon such investment's sale. As a result,
you could pay more than the market value when buying fund shares or receive
less than the market value when selling fund shares.
--------------------------------------------------------------------------------
DWS Small Cap Index VIP
PRINCIPAL INVESTMENT STRATEGY
MAIN INVESTMENTS. Under normal circumstances, the fund invests at least 80% of
its assets, determined at the time of purchase, in stocks of companies included
in the Russell 2000 Index (Reg. TM) and in derivative instruments, such as
stock index futures contracts and options that provide exposure to the stocks
of companies in the index. The fund's securities are weighted to attempt to
make the fund's total investment characteristics similar to those of the index
as a whole. Portfolio management may limit or avoid exposure to any stock in
the index if it believes the stock is illiquid or that extraordinary conditions
have cast doubt on its merits. Conversely, portfolio management may gain
exposure to a stock not included in the index when it believes such exposure is
consistent with the fund's goal (for example, in anticipation of a stock being
added to the index). The fund may also hold short-term debt securities and
money market instruments for liquidity purposes.
The RUSSELL 2000 INDEX( (Reg. TM))( )is a well-known stock market index that
measures the performance of the 2,000 smallest companies in the Russell 3000(
(Reg. TM)) Index, which represent approximately 8% of the market capitalization
of the Russell 3000( (Reg. TM)) Index. Stocks in the Russell 2000 Index( (Reg.
TM) )are weighted according to their total market value.
MANAGEMENT PROCESS. Portfolio management uses quantitative analysis techniques
to structure the fund to obtain a high correlation to the index while seeking
to keep the fund as fully invested as possible in all market environments.
Portfolio management seeks a long-term correlation between fund performance,
before expenses, and the index of 98% or better (perfect correlation being
100%). The fund uses an optimization strategy, buying the largest stocks in the
index in approximately the same proportion they represent in the index, then
investing in a statistically selected sample of the smaller securities found in
the index. This process is intended to produce a portfolio whose industry
weightings, market capitalizations and fundamental characteristics
(price-to-book ratios, price-to-earnings ratios, debt-to-asset ratios and
dividend yields) closely replicate those of the index. This approach attempts
to maximize the fund's liquidity and returns while minimizing its costs.
INDEX INVESTING VERSUS ACTIVE MANAGEMENT. Active management involves portfolio
management buying and selling securities based on research and analysis. Unlike
a fund that is actively managed, an index fund tries to replicate the
performance of a target index by holding either all, or a representative
sample, of the securities in the index.
--------------------------------------------------------------------------------
DERIVATIVES. The fund may use various types of derivatives (contracts whose
value is based on, for example, indices, currencies or securities) for hedging,
risk management or non-hedging purposes to seek to enhance potential gains. The
fund may use derivatives as a substitute for direct investment in a particular
asset class or to keep cash on hand to meet shareholder redemptions or other
needs.
SECURITIES LENDING. The fund may lend securities (up to one-third of total
assets) to approved institutions.
--------------------------------------------------------------------------------
MAIN RISKS
There are several risk factors that could hurt the fund's performance, cause
you to lose money or cause the fund's performance to trail that of other
investments.
STOCK MARKET RISK. When stock prices fall, you should expect the value of your
investment to fall as well. Stock prices can be hurt by poor management on the
part of the stock's issuer, shrinking product demand and other business risks.
These may affect single companies as well as groups of companies. In addition,
movements in financial markets may adversely affect a stock's price, regardless
of how well the company performs.
37
PROSPECTUS May 1, 2010 Fund Details
INDEXING RISK. An index fund's performance may not exactly replicate the
performance of its target index, for several reasons. For example, the fund
incurs fees, administrative expenses and transaction costs that the index
itself does not. The fund may use sampling techniques (investing in a
representative selection of securities included in the index rather than all
securities in the index), or the composition of its portfolio may diverge from
that of the index. Also, while the exposure of the index to its component
securities is by definition 100%, the fund's effective exposure to index
securities may be greater or lesser than 100%, and may vary over time.
Because an index fund is designed to maintain a high level of exposure to its
target index at all times, it will not take any steps to invest defensively or
otherwise reduce the risk of loss during market downturns.
SMALL COMPANY RISK. Small company stocks tend to be more volatile than large
company stocks. Small companies are less widely followed by stock analysts and
less information about them is available to investors. Industry-wide reversals
may have a greater impact on small companies, since they lack the financial
resources of larger companies. Small company stocks are typically less liquid
than large company stocks.
DERIVATIVES RISK. Risks associated with derivatives include the risk that the
derivative is not well correlated with the security, index or currency to which
it relates; the risk that derivatives may result in losses or missed
opportunities; the risk that the fund will be unable to sell the derivative
because of an illiquid secondary market; the risk that a counterparty is
unwilling or unable to meet its obligation; and the risk that the derivative
transaction could expose the fund to the effects of leverage, which could
increase the fund's exposure to the market and magnify potential losses. There
is no guarantee that derivatives, to the extent employed, will have the
intended effect, and their use could cause lower returns or even losses to the
fund. The use of derivatives by the fund to hedge risk may reduce the
opportunity for gain by offsetting the positive effect of favorable price
movements.
SECURITIES LENDING RISK. Any decline in the value of a portfolio security that
occurs while the security is out on loan is borne by the fund, and will
adversely affect performance. Also, there may be delays in recovery of
securities loaned or even a loss of rights in the collateral should the
borrower of the securities fail financially while holding the security.
COUNTERPARTY RISK. A financial institution or other counterparty with whom the
fund does business (such as trading or securities lending), or that
underwrites, distributes or guarantees any investments or contracts that the
fund owns or is otherwise exposed to, may decline in financial health and
become unable to honor its commitments. This could cause losses for the fund or
could delay the return or delivery of collateral or other assets to the fund.
LIQUIDITY RISK. In certain situations, it may be difficult or impossible to
sell an investment in an orderly fashion at an acceptable price. This risk can
be ongoing for any security that does not trade actively or in large volumes,
for any security that trades primarily on smaller markets, and for investments
that typically trade only among a limited number of large investors (such as
certain types of derivatives or restricted securities). In unusual market
conditions, even normally liquid securities may be affected by a degree of
liquidity risk. This may affect only certain securities or an overall
securities market.
PRICING RISK. If market conditions make it difficult to value some investments,
the fund may value these investments using more subjective methods, such as
fair value pricing. In such cases, the value determined for an investment could
be different than the value realized upon such investment's sale. As a result,
you could pay more than the market value when buying fund shares or receive
less than the market value when selling fund shares.
OTHER POLICIES AND RISKS
While the previous pages describe the main points of each fund's strategy and
risks, there are a few other matters to know about:
o Although major changes tend to be infrequent, each fund's Board could change
a fund's investment objective without seeking shareholder approval.
However, the Board of DWS Bond VIP, DWS Health Care VIP, DWS Equity 500
Index VIP and DWS Small Cap Index VIP will provide shareholders with at
least 60 days notice prior to making any changes to the fund's 80%
investment policy as described herein.
o The following is applicable to all funds except DWS Equity 500 Index VIP and
DWS Small Cap Index VIP. When in the Advisor's opinion it is advisable to
adopt a temporary defensive position because of unusual and adverse or
other market conditions, up to 100% of each fund's assets may be held in
cash or invested in money market securities or other short-term
investments. Short-term investments consist of (1) foreign and domestic
obligations of sovereign governments and their agencies and
instrumentalities, authorities and political subdivisions; (2) other
short-term rated debt securities or, if unrated, determined to be of
comparable quality in the opinion of the Advisor; (3) commercial paper; (4)
bank obligations, including negotiable certificates of deposit, time
deposits and bankers' acceptances; and (5) repurchase agreements.
Short-term investments may also include shares of money market mutual
funds. This could prevent losses, but, while engaged in a temporary
defensive position, a fund will not be pursuing its investment objective.
However, portfolio management may choose not to use these strategies for
various reasons, even in volatile market conditions.
38
PROSPECTUS May 1, 2010 Fund Details
o Portfolio management measures credit quality at the time it buys securities,
using independent rating agencies or, for unrated securities, its own
judgment. All securities must meet the credit quality standards applied by
portfolio management at the time they are purchased. If a security's credit
quality changes, portfolio management will decide what to do with the
security, based on its assessment of what would most benefit a fund.
o Certain DWS fund-of-funds are permitted to invest in other DWS funds. As a
result, a fund may have large inflows or outflows of cash from time to
time. This could have adverse effects on a fund's performance if a fund
were required to sell securities or invest cash at times when it otherwise
would not do so. This activity could also accelerate the realization of
capital gains and increase a fund's transaction costs.
FOR MORE INFORMATION
This prospectus doesn't tell you about every policy or risk of investing in
each fund.
If you want more information on each fund's allowable securities and investment
practices and the characteristics and risks of each one, you may want to
request a copy of the Statement of Additional Information (the back cover tells
you how to do this).
Keep in mind that there is no assurance that a fund will achieve its investment
objective.
A complete list of each fund's portfolio holdings as of the month-end is posted
on www.dws-investments.com on or about the 15th day of the following month.
More frequent posting of portfolio holdings information may be made from time
to time on www.dws-investments.com. The posted portfolio holdings information
is available by fund and generally remains accessible at least until the date
on which a fund files its Form N-CSR or N-Q with the Securities and Exchange
Commission for the period that includes the date as of which the posted
information is current. Each fund's Statement of Additional Information
includes a description of a fund's policies and procedures with respect to the
disclosure of a fund's portfolio holdings.
WHO MANAGES AND OVERSEES THE FUNDS
THE INVESTMENT ADVISOR
Deutsche Investment Management Americas Inc. ("DIMA" or the "Advisor"), with
headquarters at 345 Park Avenue, New York, NY 10154, is the investment advisor
for each fund. Under the oversight of the Board, the Advisor, or a subadvisor,
makes investment decisions, buys and sells securities for each fund and
conducts research that leads to these purchase and sale decisions. The Advisor
provides a full range of global investment advisory services to institutional
and retail clients.
DWS Investments is part of the Asset Management division of Deutsche Bank AG
and, within the US, represents the retail asset management activities of
Deutsche Bank AG, Deutsche Bank Trust Company Americas, DIMA and DWS Trust
Company.
Deutsche Asset Management is a global asset management organization that offers
a wide range of investing expertise and resources, including hundreds of
portfolio managers and analysts and an office network that reaches the world's
major investment centers. This well-resourced global investment platform brings
together a wide variety of experience and investment insight across industries,
regions, asset classes and investing styles.
The Advisor is an indirect, wholly owned subsidiary of Deutsche Bank AG.
Deutsche Bank AG is a major global banking institution that is engaged in a
wide range of financial services, including investment management, mutual
funds, retail, private and commercial banking, investment banking and
insurance.
MANAGEMENT FEE. The Advisor receives a management fee from each fund. Below is
the management rate paid by each fund for the most recent fiscal year, as a
percentage of each fund's average daily net assets:
FUND NAME FEE PAID
----------------------------- -----------
DWS Bond VIP 0.39%
----------------------------- ----
DWS Growth & Income VIP 0.30%*
----------------------------- -----
DWS Capital Growth VIP 0.35%*
----------------------------- -----
DWS Global Opportunities VIP 0.77%*
------------------------------ -----
DWS International VIP 0.79%
------------------------------ -----
DWS Health Care VIP 0.67%
------------------------------ -----
DWS Equity 500 Index VIP 0.18%*
------------------------------ -----
DWS Small Cap Index VIP 0.29%*
------------------------------ -----
* Reflecting the effect of expense limitations and/or fee waivers then in
effect.
For DWS Global Opportunities VIP, the Advisor has contractually agreed through
September 30, 2010 to waive and/or reimburse fund expenses to the extent
necessary to maintain the fund's total annual operating expenses at 1.06% for
Class A. The agreement may only be terminated with the consent of the fund's
Board and does not extend to extraordinary expenses, taxes, brokerage and
interest expense.
For DWS Small Cap Index VIP, the Advisor has contractually agreed through
September 30, 2010 to waive and/or reimburse fund expenses to the extent
necessary to maintain the fund's total annual operating expenses at 0.53%, for
Class A. The agreement may only be terminated with the consent of the fund's
Board and does not extend to extraordinary expenses, taxes, brokerage and
interest expense.
A discussion regarding the basis for the Board renewal of each fund's
investment management agreement and, as applicable, subadvisory agreement, and
sub-subadvisory
39
PROSPECTUS May 1, 2010 Fund Details
agreement is contained in the shareholder report for the annual period ended
December 31 (see "Shareholder reports" on the back cover).
Under a separate administrative services agreement between each fund and the
Advisor, each fund pays the Advisor a fee of 0.10% for providing most of each
fund's administrative services.
FOR DWS GROWTH & INCOME VIP
On January 26, 2010, the Advisor announced its intention to transition members
of the portfolio management team for DWS Growth & Income VIP who are part of
its Quantitative Strategies Group out of the Advisor into a separate
independent investment advisory firm that is not affiliated with the Advisor,
known as QS Investors Holdings, LLC ("QS Investors"). In order for DWS Growth &
Income VIP to continue to benefit from the investment expertise offered by the
affected portfolio managers, the Advisor has recommended to the Board the
approval of a sub-advisory agreement between the Advisor and the newly created
investment advisory firm (the "Sub-Advisory Agreement"). The Sub-Advisory
Agreement is subject to Board approval. If the Board approves the Sub-Advisory
Agreement, it is expected that QS Investors will become the Subadvisor for DWS
Growth & Income VIP.
QS Investors, 880 Third Avenue, New York, NY 10022, is an investment advisor
registered under the Investment Advisers Act of 1940, as amended. Under the
oversight of the Advisor and the Board, QS Investors would provide global
expertise in research, portfolio management and quantitative analysis. QS
Investors manages assets across multiple strategies, including: Global Tactical
Asset Allocation & Active Currency (iGAP), US Active Quantitative Equity (AQE),
International and Global Equity (Diversification Based Investing/DBI) and
Multi-Asset/Strategic Asset Allocation (SAA). QS Investors would make
investment decisions, buy and sell securities for DWS Growth & Income VIP and
would conduct research that leads to these purchase and sale decisions. The
Advisor would compensate QS Investors out of the management fee it receives
from DWS Growth & Income VIP.
SUBADVISOR FOR DWS EQUITY 500 INDEX VIP AND DWS SMALL CAP INDEX VIP
Northern Trust Investments, N.A. ("NTI"), the subadvisor for DWS Equity 500
Index VIP and DWS Small Cap Index VIP, is located at 50 South LaSalle Street,
Chicago, IL 60603. NTI is a national banking association and an investment
adviser registered under the Investment Advisers Act of 1940, as amended. It
primarily manages assets for institutional and individual separately managed
accounts, investment companies and bank common and collective funds. NTI is a
subsidiary of The Northern Trust Company ("TNTC"). TNTC is an Illinois state
chartered banking organization and a member of the Federal Reserve System.
Formed in 1889, TNTC administers and manages assets for individuals, personal
trusts, defined contribution and benefit plans and other institutional and
corporate clients. TNTC is the principal subsidiary of Northern Trust
Corporation, a company that is regulated by the Board of Governors of the
Federal Reserve System as a financial holding company under the U.S. Bank
Holding Company Act of 1956, as amended. Northern Trust Corporation, through
its subsidiaries, has for more than 100 years managed the assets of
individuals, institutions and corporations. As of December 31, 2009, NTI and
its affiliates had assets under custody of $3.7 trillion, and assets under
investment management of $627.2 billion.
MULTI-MANAGER STRUCTURE. The Advisor, subject to the approval of the Board, has
ultimate responsibility to recommend the hiring, termination and replacement of
subadvisors. Each fund and the Advisor have received an order from the SEC that
allows each fund and the Advisor to utilize a multi-manager structure in
managing each fund's assets. Pursuant to the SEC order, the Advisor, with the
approval of each fund's Board, is permitted to select subadvisors that are not
affiliates of the Advisor ("non-affiliated subadvisors") to manage all or a
portion of each fund's assets without obtaining shareholder approval. The
Advisor also has the discretion to terminate any subadvisor and allocate and
reallocate each fund's assets among any non-affiliated subadvisors. The SEC
order also permits the Advisor, subject to the approval of the Board, to
materially amend an existing subadvisory agreement with a non-affiliated
subadvisor without shareholder approval. Each fund and the Advisor are subject
to the conditions imposed by the SEC order, including the condition that within
90 days of hiring of a new non-affiliated subadvisor, each fund will provide
shareholders with an information statement containing information about the new
non-affiliated subadvisor.
Each fund and the Advisor have also filed an exemptive application with the SEC
requesting an order that would extend the relief granted with respect to
non-affiliated subadvisors to certain subadvisors that are affiliates of the
Advisor ("affiliated subadvisors"). If such relief is granted by the SEC, the
Advisor, with the approval of each fund's Board, would be able to hire
non-affiliated and/or affiliated subadvisors to manage all or a portion of each
fund's assets without obtaining shareholder approval. The Advisor would also
have the discretion to terminate any subadvisor and allocate and reallocate
each fund's assets among any other subadvisors (including terminating a
non-affiliated subadvisor and replacing them with an affiliated subadvisor).
The Advisor, subject to the approval of the Board, would also be able to
materially amend an existing subadvisory agreement with any such subadvisor
without shareholder approval. There can be no assurance that such relief will
be granted by the SEC. Each fund and the Advisor will be subject to any new
conditions imposed by the SEC.
40
PROSPECTUS May 1, 2010 Fund Details
MANAGEMENT
DWS BOND VIP
KENNETH R. BOWLING, CFA, MANAGING DIRECTOR. Portfolio Manager of the fund.
Joined the fund in 2008.
o Joined Deutsche Asset Management in 2007 after 14 years of experience at
INVESCO where he was most recently director of US Fixed Income.
o Head of Institutional Fixed Income Investments, Americas: Louisville.
o BS and MEng from University of Louisville.
JAMIE GUENTHER, CFA, MANAGING DIRECTOR. Portfolio Manager of the fund. Joined
the fund in 2008.
o Joined Deutsche Asset Management in 2007 after 25 years of experience, most
recently as head of Credit Research and CDO/CSO Credit for INVESCO. Prior
to that he was head of financial institution investment research at Duff &
Phelps Investment Research. Before that he was a global security analyst
for Alexander & Alexander. He began his career in 1982 at Touche Ross
Financial Consulting.
o Head of Institutional Credit: Louisville.
o BBA from Western Michigan University.
JOHN BRENNAN, DIRECTOR. Portfolio Manager of the fund. Joined the fund in 2008.
o Joined Deutsche Asset Management and the fund in 2007 after 14 years of
experience at INVESCO and Freddie Mac. Previously, was head of Structured
Securities sector team at INVESCO and before that was senior fixed income
portfolio manager at Freddie Mac specializing in MBS, CMBS, collateralized
mortgage obligations, ARMS, mortgage derivatives, US Treasuries and agency
debt.
o Portfolio Manager for Structured Finance: Louisville.
o BS, University of Maryland; MBA William & Mary.
BRUCE HARLEY, CFA, CEBS, DIRECTOR. Portfolio Manager of the fund. Joined the
fund in 2008.
o Joined Deutsche Asset Management in March 2007 after 18 years of experience
at INVESCO where he was head of Governments and Derivatives, responsible
for positioning for US duration and term structure; Government and futures
trading.
o Portfolio and Sector Manager for Institutional Fixed Income: Louisville.
o BS in Economics from University of Louisville.
J. RICHARD ROBBEN, CFA, DIRECTOR. Portfolio Manager of the fund. Joined the
fund in 2008.
o Joined Deutsche Asset Management and the fund in 2007 after 11 years of
experience at INVESCO Institutional, most recently as senior portfolio
manager for LIBOR-related strategies and head of portfolio construction
group for North American Fixed Income.
o Portfolio Manager for Institutional Fixed Income: Louisville.
o BA, Bellarmine University.
DAVID VIGNOLO, CFA, VICE PRESIDENT. Portfolio Manager of the fund. Joined the
fund in 2008.
o Joined Deutsche Asset Management in March 2007 after 20 years of experience
that included head of corporate bond trading and portfolio manager for
INVESCO and Conning Asset Management Co., and corporate bond trader and
portfolio manager for ANB Investment Management Co.
o Portfolio and Sector Manager for Institutional Fixed Income: Louisville.
o BS from Indiana University; MBA from Case Western Reserve University.
J. KEVIN HORSLEY, CFA, CPA, DIRECTOR. Portfolio Manager of the fund. Joined the
fund in 2008.
o Joined Deutsche Asset Management in March 2007 after 13 years of experience,
of which 11 were at INVESCO as senior analyst for a variety of credit
sectors. He also has experience in the structured securities market
(asset-backed and commercial mortgage-backed securities), and in research
coverage of foreign exchange markets, corporate finance, market planning in
the telecom sector, and in public accounting.
o Credit Analyst for Institutional Fixed Income: Louisville.
o BA from Transylvania University; MBA from Owen Graduate School of
Management, Vanderbilt University.
STEPHEN WILLER, CFA, VICE PRESIDENT. Portfolio Manager of the fund. Joined the
fund in 2008.
o Joined Deutsche Asset Management in March 2007 after 13 years of experience,
11 of which were at AMVESCAP, INVESCO Institutional, where he was CDO
portfolio manager responsible for structuring, pricing and managing
corporate credit CSOs, developing CDS based trading strategies and
vehicles, and Alpha decisions for CDS index trading. He started his career
as a financial analyst at Providian Capital Management.
o Portfolio manager for Institutional Fixed Income: Louisville.
o BS in Finance/Economics from the University of Richmond.
DWS GROWTH & INCOME VIP
ROBERT WANG, MANAGING DIRECTOR. Portfolio Manager of the fund. Joined the fund
in 2007.
o Joined Deutsche Asset Management in 1995 as portfolio manager for asset
allocation after 13 years of experience of trading fixed income, foreign
exchange and derivative products at J.P. Morgan.
o Global Head of Quantitative Strategies Portfolio Management: New York.
o BS, The Wharton School, University of Pennsylvania.
RUSSELL SHTERN, CFA, VICE PRESIDENT. Portfolio Manager of the fund. Joined the
fund in 2010.
o Joined Deutsche Asset Management in 1999, previously serving as trader's
assistant supporting program, options and equity swaps trading desks.
41
PROSPECTUS May 1, 2010 Fund Details
o Portfolio manager for GrOWE and Tax Managed Equity: New York.
o BBA, Pace University.
DWS CAPITAL GROWTH VIP
OWEN FITZPATRICK, CFA, MANAGING DIRECTOR. Lead Manager of the fund. Joined the
fund in 2009.
o Joined Deutsche Asset Management in 2009.
o Prior to joining Deutsche Asset Management, he was Managing Director of
Deutsche Bank Private Wealth Management and served as head of U.S. Equity
Strategy and manager of the U.S. large cap core, value and growth
portfolios and member of the U.S. Investment Committee and head of the
Equity Strategy Group.
o Previous experience includes over 21 years of experience in trust and
investment management. Prior to joining Deutsche Bank in 1995, managed an
equity income fund, trust and advisory relationships for Princeton Bank &
Trust Company, where he was also responsible for research coverage of the
consumer cyclical sector. Previously served as a portfolio manager at
Manufacturer's Hanover Trust Company.
o BA and MBA, Fordham University.
THOMAS M. HYNES, JR., CFA, DIRECTOR. Portfolio Manager of the fund. Joined the
fund in 2009.
o Joined Deutsche Asset Management in 1995, served in DB Private Wealth
Management from 1995-2004; served as US equity portfolio manager at
Citigroup Asset Management from 2004-2007; rejoined Deutsche Asset
Management in 2007.
o Portfolio manager for US Large Cap Equity: New York.
o BS, Fordham University.
BRENDAN O'NEILL, CFA, DIRECTOR. Portfolio Manager of the fund. Joined the fund
in 2009.
o Joined Deutsche Asset Management in 2000.
o Equity Research Analyst covering the financial services sector since 2001.
o Previously served as a member of the Large Cap Core Equity team.
o BA, Queens College, CUNY; MS, Zicklin School of Business, Baruch College.
DWS GLOBAL OPPORTUNITIES VIP
JOSEPH AXTELL, CFA, MANAGING DIRECTOR. Portfolio Manager of the fund. Joined
the fund in 2002.
o Joined Deutsche Asset Management in 2001.
o Senior analyst at Merrill Lynch Investment Managers for the international
equity portion of a global balanced portfolio (1996-2001).
o Director, International Research at PCM International (1989-1996).
o Associate manager, structured debt and equity group at Prudential Capital
Corporation (1988-1989).
o Analyst at Prudential-Bache Capital Funding in London (1987-1988).
o Equity analyst in the health care sector at Prudential Equity Management
Associates (1985-1987).
o BS, Carlson School of Management, University of Minnesota.
DWS INTERNATIONAL VIP
NIKOLAUS POEHLMANN, CFA, DIRECTOR. Lead Portfolio Manager of the fund. Joined
the fund in 2009.
o Senior portfolio manager for Equities, responsible for European dividend
strategies, Italian equities and global financials strategies.
o Joined the Company in July 1998 in Loan Portfolio Management for Corporate
and Investment Bank (CIB) division.
o Managing European diversified funds since 2003, financials funds since 2001,
and Italian equity funds since 2002.
o BA from Augsburg University; Master's degree in Economics ("Diplom
Volkswirt") from University of Cologne.
UDO ROSENDAHL, MANAGING DIRECTOR. Portfolio Manager of the fund. Joined the
fund in 2009.
o Head of European Large Caps: Frankfurt.
o Joined the Company in August 1984 in the credit research department of
Deutsche Bank, Paderborn; 1986 moved to the asset management department for
high net worth clients of Deutsche Bank in Bremen and Hamburg; 1989 moved
to the asset management division in Frankfurt to manage various European
country funds; 1995 became senior fund manager; July 2002 appointed head of
Europe Large Caps.
o Bank training program Deutsche Bank AG, Paderborn.
MARK SCHUMANN, VICE PRESIDENT. Portfolio Manager of the fund. Joined the fund
in 2009.
o Joined Deutsche Asset Management in 2003.
o Portfolio Manager for European Large Cap Equity: Frankfurt.
o Masters (Lic oec) from University of St. Gallen (HSG).
ANDREAS WENDELKEN, DIRECTOR. Portfolio Manager of the fund. Joined the fund in
2009.
o Joined Deutsche Asset Management in 2001; previously has worked for 2 years
as a relationship manager for Southeastern Europe at Deutsche Bank's Global
Corporates and Institutions division.
o Portfolio manager for emerging markets equity: Frankfurt.
o Master's degree in business administration from Frankfurt School of Finance
& Management (previously HfB), Frankfurt; completed bank training program
(Bankkaufmann) at Bremer Landesbank, Bremen.
DWS HEALTH CARE VIP
LEEFIN LAI, CFA, MANAGING DIRECTOR. Lead Portfolio Manager of the fund. Joined
the fund in 2001.
o Joined Deutsche Asset Management in 2001.
o Previously served as an analyst for Salomon Smith Barney and PaineWebber and
as Vice President/Analyst for Citigroup Global Asset Management and Scudder
Kemper Investments.
42
PROSPECTUS May 1, 2010 Fund Details
o Over 16 years of investment industry experience.
o MBA, University of Illinois.
THOMAS E. BUCHER, CFA, MANAGING DIRECTOR. Deutsche Asset Management. Consultant
to the Advisor since 2002.
o Joined Deutsche Asset Management in 1995.
o Head of global equity research team forHealth Care sector and portfolio
managerfor European Equity: Frankfurt.
o Previously served as analyst for European Chemical, Oil, Steel and
Engineering sectors and analyst/portfolio manager for Eastern European
equity.
o MA, University of Tuebingen, Germany.
DWS EQUITY 500 INDEX VIP
BRENT REEDER. Senior Vice President of Northern Trust Investments, N.A.
Portfolio Manager of the fund. Joined the fund in 2007.
o Joined Northern Trust Investments, N.A. in 1993; for the past eight years,
he has managed quantitative equity portfolios.
DWS SMALL CAP INDEX VIP
BRENT REEDER. Senior Vice President of Northern Trust Investments, N.A.
Portfolio Manager of the fund. Joined the fund in 2007.
o Joined Northern Trust Investments, N.A. in 1993; for the past eight years,
he has managed quantitative equity portfolios.
Each fund's Statement of Additional Information provides additional information
about a portfolio manager's investments in each fund, a description of the
portfolio management compensation structure and information regarding other
accounts managed.
43
PROSPECTUS May 1, 2010 Fund Details
INVESTING IN THE FUNDS
YOUR INVESTMENT IN THE FUNDS
The information in this section may affect anyone who selects one or more funds
as an investment option in a variable annuity contract or variable life
insurance policy that offers one or more funds. These contracts and policies
are described in separate prospectuses issued by participating insurance
companies. Each fund assumes no responsibility for such prospectuses.
POLICIES ABOUT TRANSACTIONS
The information in this prospectus applies to Class A shares of each fund. Each
fund may offer two classes of shares(except DWS Equity 500 Index VIP, which
offers three classes of shares). Class A shares are offered at net asset value
and are not subject to 12b-1 fees.
Technically, the shareholders of DWS Variable Series I and DWS Investments VIT
Funds (which include each fund just described) are the participating insurance
companies (the "insurance companies") that offer each fund as choices for
holders of certain variable annuity contracts or variable life insurance
policies (the "contract(s)") issued or sponsored by the insurance companies.
The insurance companies may pass through voting rights to the contract owners.
Each fund does not sell shares directly to the public. Each fund sells shares
only to separate accounts of insurance companies. As a contract owner, your
premium payments are allocated to a fund by the insurance companies in
accordance with your contract. Please see the contract prospectus that
accompanies this prospectus for a detailed explanation of your contract.
Depending on context in the prospectus, the terms "you" and "yours" refer to
either a contract owner or to the insurance company that issues the contract.
References to "buying," "purchasing" or "holding" fund shares refer only to the
insurance company, not the contract owner.
Please bear in mind that there are important differences between DWS retail
funds available to any investor (a "Retail Fund") and those that are only
available through certain financial institutions, such as insurance companies.
For example, Retail Funds, unlike a fund, are not sold to insurance company
separate accounts to fund investments in variable insurance contracts. In
addition, the investment objective, policies and strategies of a fund, while
similar to those of a Retail Fund, are not identical. Retail Funds may be
smaller or larger than a fund and have different expense ratios than a fund. As
a result, the performance of a fund and a Retail Fund will differ.
Should any conflict between contract owners arise that would require that a
substantial amount of net assets be withdrawn from a fund, orderly portfolio
management could be disrupted to the potential detriment of shareholders of
that fund.
Each fund has a verification process for new insurance company accounts to help
the government fight the funding of terrorism and money laundering activities.
Federal law requires all financial institutions to obtain, verify and record
information that identifies each insurance company that opens an account. This
means that when an insurance company opens an account, a fund will ask for its
name, address and other information that will allow a fund to identify the
company. This information will be verified to ensure the identity of all
insurance companies opening an account.
For certain insurance companies, a fund might request additional information
(for instance, a fund would ask for documents such as the insurance company's
articles of incorporation) to help a fund verify the insurance company's
identity.
Each fund will not complete the purchase of any shares for an account until all
information has been provided and the application has been submitted in "good
order." Once the application is determined to be in good order, the purchase(s)
will be effected at the net asset value per share next calculated.
Each fund may reject a new account application if the insurance company doesn't
provide any required or requested identifying information, or for other
reasons.
BUYING AND SELLING SHARES
Each FUND IS OPEN FOR BUSINESS each day the New York Stock Exchange is open.
Each fund calculates its share price every business day, as of the close of
regular trading on the New York Stock Exchange (typically 4 p.m. Eastern time,
but sometimes earlier, as in the case of scheduled half-day trading or
unscheduled suspensions of trading).
44
PROSPECTUS May 1, 2010 Investing in the Funds
Each fund continuously sells shares to each insurance company separate account,
without a sales charge, at the net asset value per share next determined after
a proper purchase order is placed by the insurance company. The insurance
company offers contract owners units in its separate accounts which correspond
to shares in a fund. Each insurance company submits purchase and redemption
orders to a fund based on allocation instructions for premium payments,
transfer instructions and surrender or partial withdrawal requests for contract
owners, as set forth in the accompanying prospectus for the contracts. These
orders reflect the amount of premium payments to be invested, surrender and
transfer requests, and other matters. Redemption orders are effected at the
next net asset value per share determined after a proper redemption order is
placed by the insurance company. Contract owners should look at their contract
prospectuses for redemption procedures and fees.
IMPORTANT INFORMATION ABOUT BUYING AND SELLING SHARES
o After receiving a contract owner's order, the insurance company buys or
sells shares at the net asset value next calculated on any day each fund is
open for business.
o Unless otherwise instructed, each fund normally makes payment of the
proceeds from the sale of shares the next business day but always within
seven calendar days.
o Each fund does not issue share certificates.
o Each fund reserves the right to reject purchases of shares for any reason.
o Each fund reserves the right to withdraw or suspend the offering of shares
at any time.
o Each fund reserves the right to reject purchases of shares or to suspend or
postpone redemptions at times when the New York Stock Exchange is closed
(other than customary closings), trading is restricted or when an emergency
exists that prevents a fund from disposing of its portfolio securities or
pricing its shares.
o Each fund may refuse, cancel or rescind any purchase order; freeze any
account (meaning the insurance company will not be able to purchase shares
in its account); suspend account services; and/or involuntarily redeem the
account if we think that the account is being used for fraudulent or
illegal purposes by the insurance company; one or more of these actions
will be taken when, at the sole discretion of each fund, they are deemed to
be in each fund's best interests or when each fund is requested or
compelled to do so by governmental authority or by applicable law.
o Each fund may close and liquidate an account if a fund is unable to verify
provided information, or for other reasons; if a fund decides to close the
account, the shares will be redeemed at the net asset value per share next
calculated after we determine to close the account; the insurance company
may be subject to gain or loss on the redemption of the fund shares and may
incur tax liability.
o Each fund may pay for shares sold by "redeeming in kind," that is, by
distributing to you marketable securities (which typically will involve
brokerage costs for you to liquidate) rather than cash, but which will be
taxable to the same extent as a redemption for cash; each fund generally
won't make a redemption in kind unless your requests over a 90-day period
total more than $250,000 or 1% of the value of each fund's net assets,
whichever is less.
o A purchase order from an insurance company separate account may not be
accepted if the sale of fund shares has been suspended or if it is
determined that the purchase would be detrimental to the interests of a
fund.
MARKET TIMING POLICIES AND PROCEDURES. Short-term and excessive trading of fund
shares may present risks to each fund's long-term shareholders (as used herein,
the term "shareholders" may refer to the contract owners), including potential
dilution in the value of fund shares, interference with the efficient
management of a fund (including losses on the sale of investments), realized
gains to remaining shareholders and increased brokerage and administrative
costs. These risks may be more pronounced if a fund invests in certain
securities such as those that trade in foreign markets, are illiquid or do not
otherwise have "readily available market quotations." Certain investors may
seek to employ short-term trading strategies aimed at exploiting variations in
fund valuation that arise from the nature of the securities held by a fund
(e.g., "time zone arbitrage"). Each fund has adopted policies and procedures
that are intended to detect and deter short-term and excessive trading.
Pursuant to these policies, each fund reserves the right to reject or cancel a
purchase or exchange order for any reason without prior notice. For example, a
fund may in its discretion reject or cancel a purchase or an exchange order
even if the transaction is not subject to the specific roundtrip transaction
limitation described below if the Advisor believes that there appears to be a
pattern of short-term or excessive trading activity by a shareholder or deems
any other trading activity harmful or disruptive to a fund. Each fund, through
its Advisor and transfer agent, will measure short-term and excessive trading
by the number of roundtrip transactions within a shareholder's account during a
rolling 12-month period. A "roundtrip" transaction is defined as any
combination of purchase and redemption activity (including exchanges) of the
same fund's shares. Each fund may take other trading activity
45
PROSPECTUS May 1, 2010 Investing in the Funds
into account if a fund believes such activity is of an amount or frequency that
may be harmful to long-term shareholders or disruptive to portfolio management.
Shareholders are limited to four roundtrip transactions in the same fund over a
rolling 12-month period. Shareholders with four or more roundtrip transactions
in the same fund within a rolling 12-month period generally will be blocked
from making additional purchases of, or exchanges into, that fund. Each fund
has sole discretion whether to remove a block from a shareholder's account. The
rights of a shareholder to redeem shares of each fund are not affected by the
four roundtrip transaction limitation.
The Advisor may make exceptions to the roundtrip transaction policy for certain
types of transactions if in its opinion the transactions do not represent
short-term or excessive trading or are not abusive or harmful to each fund,
such as, but not limited to, systematic transactions, required minimum
retirement distributions, transactions initiated by each fund or administrator
and transactions by certain qualified fund-of-fund(s).
In certain circumstances, each fund may rely upon the policy of the insurance
company or other financial intermediary to deter short-term or excessive
trading if the Advisor believes that the policy of such insurance company or
other financial intermediary is reasonably designed to detect and deter
transactions that are not in the best interests of each fund. An insurance
company's or other financial intermediary's policy relating to short-term or
excessive trading may be more or less restrictive than each fund's policies,
may permit certain transactions not permitted by each fund's policies, or
prohibit transactions not subject to each fund's policies.
The Advisor may also accept undertakings from an insurance company or other
financial intermediary to enforce short-term or excessive trading policies on
behalf of each fund that provide a substantially similar level of protection
for each fund against such transactions. For example, certain insurance
companies may have contractual or legal restrictions, or operational
constraints, that prevent them from blocking an account. In such instances, the
Advisor may permit the insurance company to use alternate techniques that the
Advisor considers to be a reasonable substitute for such a block.
In addition, to the extent that each fund invests some portion of its assets in
foreign securities, each fund has adopted certain fair valuation practices
intended to protect each fund from "time zone arbitrage" with respect to its
foreign securities holdings and other trading practices that seek to exploit
variations in fund valuation that arise from the nature of the securities held
by each fund. (See "How each fund Calculates Share Price.")
There is no assurance that these policies and procedures will be effective in
limiting short-term and excessive trading in all cases. For example, the
Advisor may not be able to effectively monitor, detect or limit short-term or
excessive trading by underlying contract holders that occurs through separate
accounts maintained by insurance companies or other financial intermediaries.
The Advisor reviews trading activity at the separate account level to detect
short-term or excessive trading. If the Advisor has reason to suspect that
short-term or excessive trading is occurring at the separate account level, the
Advisor will contact the insurance company or other financial intermediary to
request underlying contract holder activity. Depending on the amount of fund
shares held in such separate account (which may represent most of each fund's
shares), short-term and/or excessive trading of fund shares could adversely
affect long-term shareholders in each fund. If short-term or excessive trading
is identified, the Advisor will take appropriate action.
Each fund's market timing policies and procedures may be modified or terminated
at any time.
HOW TO RECEIVE ACCOUNT INFORMATION
If you are a contract owner, you should contact your insurance company or the
organization that provides record keeping services for information about your
account.
Please see the contract prospectus that accompanies this prospectus for the
customer service phone number.
HOW TO SELECT SHARES
Shares in a fund are available in connection with certain variable annuity and
life insurance arrangements. Each insurance company has different provisions
about how and when their contract owners may select fund shares. Each insurance
company is responsible for communicating its contract owners' instructions to a
fund. Contract owners should contact their insurance company to effect
transactions in connection with a fund.
FINANCIAL INTERMEDIARY SUPPORT PAYMENTS
The Advisor, DWS Investments Distributors, Inc. (the "Distributor") and/or
their affiliates may pay additional compensation, out of their own assets and
not as an additional charge to each fund, to selected affiliated and
unaffiliated brokers, dealers, participating insurance companies or other
financial intermediaries ("financial advisors") in connection with the sale
and/or distribution of fund shares or the retention and/or servicing of fund
investors and fund shares ("revenue sharing"). Such revenue sharing payments
are in addition to any distribution or service fees payable under any Rule
12b-1 or service plan of each fund, any record keeping/sub-transfer agency/
networking fees payable by each fund (generally through the Distributor or an
affiliate) and/or the Distributor to certain financial advisors for performing
such services and any sales charge, commissions, non-cash compensation
arrangements expressly permitted under applicable rules
46
PROSPECTUS May 1, 2010 Investing in the Funds
of the Financial Industry Regulatory Authority or other concessions described
in the fee table or elsewhere in this prospectus or the Statement of Additional
Information as payable to all financial advisors. For example, the Advisor, the
Distributor and/or their affiliates may compensate financial advisors for
providing a fund with "shelf space" or access to a third party platform or fund
offering list or other marketing programs, including, without limitation,
inclusion of the fund on preferred or recommended sales lists, mutual fund
"supermarket" platforms and other formal sales programs; granting the
Distributor access to the financial advisor's sales force; granting the
Distributor access to the financial advisor's conferences and meetings;
assistance in training and educating the financial advisor's personnel; and
obtaining other forms of marketing support.
The level of revenue sharing payments made to financial advisors may be a fixed
fee or based upon one or more of the following factors: gross sales, current
assets and/or number of accounts of each fund attributable to the financial
advisor, the particular fund or fund type or other measures as agreed to by the
Advisor, the Distributor and/or their affiliates and the financial advisors or
any combination thereof. The amount of these revenue sharing payments is
determined at the discretion of the Advisor, the Distributor and/or their
affiliates from time to time, may be substantial, and may be different for
different financial advisors based on, for example, the nature of the services
provided by the financial advisor.
The Advisor, the Distributor and/or their affiliates currently make revenue
sharing payments from their own assets in connection with the sale and/or
distribution of DWS fund shares or the retention and/or servicing of investors
and DWS fund shares to financial advisors in amounts that generally range from
0.01% up to 0.26% of assets of each fund serviced and maintained by the
financial advisor, 0.05% to 0.25% of sales of each fund attributable to the
financial advisor, a flat fee of $4,000 up to $500,000, or any combination
thereof. These amounts are subject to change at the discretion of the Advisor,
the Distributor and/or their affiliates. Receipt of, or the prospect of
receiving, this additional compensation may influence your financial advisor's
recommendation of each fund or of any particular share class of each fund. You
should review your financial advisor's compensation disclosure and/or talk to
your financial advisor to obtain more information on how this compensation may
have influenced your financial advisor's recommendation of each fund.
Additional information regarding these revenue sharing payments is included in
each fund's Statement of Additional Information, which is available to you on
request at no charge (see the back cover of this prospectus for more
information on how to request a copy of the Statement of Additional
Information).
The Advisor, the Distributor and/or their affiliates may also make such revenue
sharing payments to financial advisors under the terms discussed above in
connection with the distribution of both DWS funds and non-DWS funds by
financial advisors to retirement plans that obtain record keeping services from
ADP, Inc. or ExpertPlan Inc. on the DWS Investments branded retirement plan
platform (the "Platform") with the level of revenue sharing payments being
based upon sales of both the DWS funds and the non-DWS funds by the financial
advisor on the Platform or current assets of both the DWS funds and the non-DWS
funds serviced and maintained by the financial advisor on the Platform.
It is likely that broker-dealers that execute portfolio transactions for each
fund will include firms that also sell shares of the DWS funds to their
customers. However, the Advisor will not consider sales of DWS fund shares as a
factor in the selection of broker-dealers to execute portfolio transactions for
the DWS funds. Accordingly, the Advisor has implemented policies and procedures
reasonably designed to prevent its traders from considering sales of DWS fund
shares as a factor in the selection of broker-dealers to execute portfolio
transactions for each fund. In addition, the Advisor, the Distributor and/or
their affiliates will not use fund brokerage to pay for their obligation to
provide additional compensation to financial advisors as described above.
HOW EACH FUND CALCULATES SHARE PRICE
To calculate net asset value per share, or NAV, each fund uses the following
equation:
TOTAL TOTAL TOTAL NUMBER OF
- / = NAV
( )
ASSETS LIABILITIES SHARES OUTSTANDING
The price at which you buy and sell shares for each fund is the NAV.
WE TYPICALLY VALUE SECURITIES USING INFORMATION FURNISHED BY AN INDEPENDENT
PRICING SERVICE OR MARKET QUOTATIONS, WHERE APPROPRIATE. However, we may use
methods approved by the Board, such as a fair valuation model, which are
intended to reflect fair value when pricing service information or market
quotations are not readily available or when a security's value or a meaningful
portion of the value of a portfolio is believed to have been materially
affected by a significant event, such as a natural disaster, an economic event
like a bankruptcy filing, or a substantial fluctuation in domestic or foreign
markets, that has occurred between the close of the exchange or market on which
the security is principally traded (for example, a foreign exchange or market)
and the close of the New York Stock Exchange. In such a case, a portfolio's
value for a security is likely to be different from the last quoted market
price or pricing service information. In addition, due to the subjective and
variable nature of fair value pricing, it is possible that the value determined
for a particular asset may be materially different from the value realized upon
such asset's sale. It is expected that the greater the percentage of portfolio
assets that is invested in non-US securities, the more extensive will be a
portfolio's use of
47
PROSPECTUS May 1, 2010 Investing in the Funds
fair value pricing. This is intended to reduce a portfolio's exposure to "time
zone arbitrage" and other harmful trading practices. (See "Market Timing
Policies and Procedures.")
To the extent that a fund invests in securities that are traded primarily in
foreign markets, the value of its holdings could change at a time when you
aren't able to buy or sell fund shares through the contract. This is because
some foreign markets are open on days and at times when each fund doesn't price
the shares.
DISTRIBUTIONS
Each fund intends to declare and distribute dividends from their net investment
income and capital gains, if any, annually. Each fund may make additional
distributions if necessary.
All distributions will be reinvested in shares of a fund unless we are informed
by an insurance company that they should be paid out in cash. The insurance
companies will be informed about the amount and character of distributions from
the relevant fund for federal income tax purposes.
TAXES
Each fund intends to qualify each year as a regulated investment company under
Subchapter M of the Internal Revenue Code of 1986, as amended (the "Code"), and
intends to meet all requirements necessary to avoid paying any federal income
or excise taxes.
Generally, owners of variable annuity and variable life contracts are not
subject to current federal income taxation on income or gains realized with
respect to such contracts. However, some distributions from such contracts,
whether made prior to or during the annuity payment period, may be taxable at
ordinary income tax rates. In addition, distributions made to an owner who is
younger than 59 1-2 may be subject to a 10% penalty tax. For further
information concerning federal income tax consequences for the holders of
variable annuity contracts and variable life insurance policies, such holders
should consult the prospectus used in connection with the issuance of their
particular contracts or policies.
In order for investors to receive the favorable federal income tax treatment
available to holders of variable annuity and variable life contracts, the
separate accounts underlying such contracts, as well as the funds in which such
accounts invest, must meet certain diversification requirements. Each fund
intends to comply with these requirements. If a fund or separate account does
not meet such requirements or fails to qualify as a regulated investment
company for any taxable year, income allocable to the contracts associated with
the separate account may be taxable currently for federal income tax purposes
to the holders of such contracts and income from prior periods with respect to
such contracts also could be taxable, most likely in the year of the failure.
Under Treasury regulations, insurance companies holding the separate accounts
may have to report to the IRS losses above a certain amount resulting from a
sale or disposition of a fund's shares.
The discussion above is generally based on the assumption that shares of a fund
will be respected as owned by insurance company separate accounts. If this is
not the case (for example, because the IRS finds an impermissible level of
"investor control" over the investment options underlying variable contracts),
the advantageous federal income tax treatment provided in respect of insurance
company separate accounts under the Code will no longer be available, and the
person or persons determined to own the fund shares will be currently taxed on
fund distributions, and on the proceeds of any redemption of fund shares, under
the Code.
Fund investments in securities of foreign issuers may be subject to withholding
and other taxes at the source, including on dividend or interest payments.
Participating insurance companies should consult their own tax advisors as to
whether such distributions are subject to federal income tax if they are
retained as part of policy reserves.
Certain of each fund's investments in certain debt obligations may cause each
fund to recognize taxable income in excess of the cash generated by such
obligation. Thus, each fund could be required at times to liquidate other
investments in order to satisfy its distribution requirements.
The preceding is a brief summary of certain of the relevant federal income tax
considerations. Because each shareholder and contract holder's tax situation is
unique, ask your tax professional about the tax consequences of your
investments, including possible federal, foreign, state or local taxes.
48
PROSPECTUS May 1, 2010 Investing in the Funds
FINANCIAL HIGHLIGHTS
The financial highlights are designed to help you understand recent financial
performance. The figures in the first part of the table are for a single share.
The total return figures represent the percentage that an investor in a fund
would have earned (or lost), assuming all dividends and distributions were
reinvested. This information has been audited by PricewaterhouseCoopers LLP,
independent registered public accounting firm, whose report, along with each
fund's financial statements, is included in each fund's annual report (see
"Shareholder reports" on the back cover). This information doesn't reflect
charges and fees associated with the separate account that invests in the fund
or any variable life insurance policy or variable annuity contract for which
the fund is an investment option. These charges and fees will reduce returns.
DWS BOND VIP - CLASS A
YEARS ENDED DECEMBER 31, 2009 2008 2007 2006 2005
------------------------------------------------ ---------- ---------- ---------- --------------- ----------
SELECTED PER SHARE DATA
-------------------------------------------------------------------------------------------------------------------
NET ASSET VALUE, BEGINNING OF PERIOD $ 5.50 $ 6.98 $ 7.03 $ 6.99 $ 7.13
------------------------------------------------ ------- -------- ------- ------- -------
Income (loss) from investment operations:
Net investment income(a) .25 .37 .35 .33 .29
------------------------------------------------ ------- -------- ------- ------- -------
Net realized and unrealized gain (loss) .26 ( 1.48) ( .06) ( .01) ( .10)
------------------------------------------------ ------- -------- ------- ------- -------
TOTAL FROM INVESTMENT OPERATIONS .51 ( 1.11) .29 .32 .19
------------------------------------------------ ------- -------- ------- ------- -------
Less distributions from:
Net investment income ( .47) ( .37) ( .34) ( .27) ( .26)
------------------------------------------------ ------- -------- ------- ------- -------
Net realized gains - - - ( .01) ( .07)
------------------------------------------------ ------- -------- ------- ------- -------
TOTAL DISTRIBUTIONS ( .47) ( .37) ( .34) ( .28) ( .33)
------------------------------------------------ ------- -------- ------- ------- -------
NET ASSET VALUE, END OF PERIOD $ 5.54 $ 5.50 $ 6.98 $ 7.03 $ 6.99
------------------------------------------------ ------- -------- ------- ------- -------
Total Return (%) 10.07 (16.77) 4.18 4.72 (b) 2.60
------------------------------------------------ ------- -------- ------- ------- -------
RATIOS TO AVERAGE NET ASSETS AND SUPPLEMENTAL DATA
-------------------------------------------------------------------------------------------------------------------
Net assets, end of period ($ millions) 159 155 229 218 209
------------------------------------------------ ------- -------- ------- ------- -------
Ratio of expenses before expense reductions (%) .59 .59 .61 .66 .68
------------------------------------------------- ------- -------- ------- ------- -------
Ratio of expenses after expense reductions (%) .59 .59 .61 .62 .68
------------------------------------------------- ------- -------- ------- ------- -------
Ratio of net investment income (%) 4.68 5.76 5.03 4.82 4.11
------------------------------------------------- ------- -------- ------- ------- -------
Portfolio turnover rate (%) 284 196 185 186 197
------------------------------------------------- ------- -------- ------- ------- -------
(a) Based on average shares outstanding during the period.
(b) Total return would have been lower had certain expenses not been
reduced.
49
PROSPECTUS May 1, 2010 Financial Highlights
DWS GROWTH & INCOME VIP - CLASS A
YEARS ENDED DECEMBER 31, 2009 2008 2007 2006 2005
------------------------------------------------ ---------- ----------- ----------- --------------- ----------
SELECTED PER SHARE DATA
------------------------------------------------------------------------------------------------------- -
NET ASSET VALUE, BEGINNING OF PERIOD $ 5.12 $ 10.81 $ 10.94 $ 9.72 $ 9.29
------------------------------------------------ ------- -------- -------- -------- -------
Income (loss) from investment operations:
Net investment income (loss)(a) .10 .10 .13 .13 (c) .10
------------------------------------------------ ------- -------- -------- -------- -------
Net realized and unrealized gain (loss) 1.61 ( 3.45) .02 1.19 .45
------------------------------------------------ ------- -------- -------- -------- -------
TOTAL FROM INVESTMENT OPERATIONS 1.71 ( 3.35) .15 1.32 .55
------------------------------------------------ ------- -------- -------- -------- -------
Less distributions from:
Net investment income ( .12) ( .18) ( .13) ( .10) ( .12)
------------------------------------------------ ------- -------- -------- -------- -------
Net realized gains - ( 2.16) ( .15) - -
------------------------------------------------ ------- -------- -------- -------- -------
TOTAL DISTRIBUTIONS ( .12) ( 2.34) ( .28) ( .10) ( .12)
------------------------------------------------ ------- -------- -------- -------- -------
NET ASSET VALUE, END OF PERIOD $ 6.71 $ 5.12 $ 10.81 $ 10.94 $ 9.72
------------------------------------------------ ------- -------- -------- -------- -------
Total Return (%)(b) 34.15 (38.31) 1.36 13.63 (c) 6.07
------------------------------------------------ ------- -------- -------- -------- -------
RATIOS TO AVERAGE NET ASSETS AND SUPPLEMENTAL DATA
---------------------------------------------------------------------------------------------------------------------
Net assets, end of period ($ millions) 101 94 196 280 294
------------------------------------------------ ------- -------- -------- -------- -------
Ratio of expenses before expense reductions (%) .63 .60 .57 .56 .57
------------------------------------------------- ------- -------- -------- -------- -------
Ratio of expenses after expense reductions (%) .54 .54 .56 .54 .54
------------------------------------------------- ------- -------- -------- -------- -------
Ratio of net investment income (loss) (%) 1.74 1.34 1.18 1.24 (c) 1.10
------------------------------------------------- ------- -------- -------- -------- -------
Portfolio turnover rate (%) 82 130 310 105 115
------------------------------------------------- ------- -------- -------- -------- -------
(a) Based on average shares outstanding during the period.
(b) Total return would have been lower had certain expenses not been
reduced.
(c) Includes non-recurring income from the Advisor recorded as a result
of an administrative proceeding regarding disclosure of brokerage
allocation practices in connection with sales of DWS Funds. The
non-recurring income resulted in an increase in net investment
income of $0.007 per share and an increase in the ratio of net
investment income of 0.07%. Excluding this non-recurring income,
total return would have been 0.06% lower.
DWS CAPITAL GROWTH VIP - CLASS A
YEARS ENDED DECEMBER 31, 2009 2008 2007 2006 2005
------------------------------------------------ ----------- ----------- ---------------- ---------------- -----------
SELECTED PER SHARE DATA
-----------------------------------------------------------------------------------------------------------------------------
NET ASSET VALUE, BEGINNING OF PERIOD $ 13.55 $ 20.41 $ 18.24 $ 16.90 $ 15.67
------------------------------------------------ -------- -------- -------- -------- --------
Income (loss) from investment operations:
Net investment income (loss)(a) .14 .16 .17 (d) .13 (c) .10
------------------------------------------------ -------- -------- -------- -------- --------
Net realized and unrealized gain (loss) 3.43 ( 6.83) 2.12 1.31 1.29
------------------------------------------------ -------- -------- -------- -------- --------
TOTAL FROM INVESTMENT OPERATIONS 3.57 ( 6.67) 2.29 1.44 1.39
------------------------------------------------ -------- -------- -------- -------- --------
Less distributions from:
Net investment income ( .19) ( .19) ( .12) ( .10) ( .16)
------------------------------------------------ -------- -------- -------- -------- --------
NET ASSET VALUE, END OF PERIOD $ 16.93 $ 13.55 $ 20.41 $ 18.24 $ 16.90
------------------------------------------------ -------- -------- -------- -------- --------
Total Return (%)(b) 26.87 (32.98) 12.59 8.53 (c) 8.96
------------------------------------------------ -------- -------- -------- -------- --------
RATIOS TO AVERAGE NET ASSETS AND SUPPLEMENTAL DATA
-----------------------------------------------------------------------------------------------------------------------------
Net assets, end of period ($ millions) 715 594 1,058 1,131 1,031
------------------------------------------------ -------- -------- -------- -------- --------
Ratio of expenses before expense reductions (%) .51 .50 .53 .52 .50
------------------------------------------------- -------- -------- -------- -------- --------
Ratio of expenses after expense reductions (%) .49 .49 .52 .49 .49
------------------------------------------------- -------- -------- -------- -------- --------
Ratio of net investment income (loss) (%) .98 .89 .86 (d) .73 (c) .61
------------------------------------------------- -------- -------- -------- -------- --------
Portfolio turnover rate (%) 76 21 30 16 17
------------------------------------------------- -------- -------- -------- -------- --------
(a) Based on average shares outstanding during the period.
(b) Total return would have been lower had certain expenses not been
reduced.
(c) Includes non-recurring income from the Advisor recorded as a result
of an administrative proceeding regarding disclosure of brokerage
allocation practices in connection with sales of DWS Funds. The
non-recurring income resulted in an increase in net investment
income of $0.007 per share and an increase in the ratio of net
investment income of 0.04%. Excluding this non-recurring income,
total return would have been 0.03% lower.
(d) Net investment income per share and ratio of net investment income
include non-recurring dividend income amounting to $0.03 per share
and 0.17% of average daily net assets, respectively.
50
PROSPECTUS May 1, 2010 Financial Highlights
DWS GLOBAL OPPORTUNITIES VIP - CLASS A
YEARS ENDED DECEMBER 31, 2009 2008 2007 2006 2005
------------------------------------------------ ---------------- ---------------- ---------------- ---------------- -----------
SELECTED PER SHARE DATA
---------------------------------------------------------------------------------------------------------------------------------
NET ASSET VALUE, BEGINNING OF PERIOD $ 7.79 $ 18.28 $ 18.15 $ 15.00 $ 12.77
------------------------------------------------ -------- --------- -------- -------- --------
Income (loss) from investment operations:
Net investment income (loss)(a) .04 .20 (d) .08 (d) .03 (c) .04
------------------------------------------------ -------- --------- -------- -------- --------
Net realized and unrealized gain (loss) 3.64 ( 8.18) 1.61 3.28 2.27
------------------------------------------------ -------- --------- -------- -------- --------
TOTAL FROM INVESTMENT OPERATIONS 3.68 ( 7.98) 1.69 3.31 2.31
------------------------------------------------ -------- --------- -------- -------- --------
Less distributions from:
Net investment income ( .15) ( .04) ( .23) ( .16) ( .08)
------------------------------------------------ -------- --------- -------- -------- --------
Net realized gains - ( 2.47) ( 1.33) - -
------------------------------------------------ -------- --------- -------- -------- --------
TOTAL DISTRIBUTIONS ( .15) ( 2.51) ( 1.56) ( .16) ( .08)
------------------------------------------------ -------- --------- -------- -------- --------
NET ASSET VALUE, END OF PERIOD $ 11.32 $ 7.79 $ 18.28 $ 18.15 $ 15.00
------------------------------------------------ -------- --------- -------- -------- --------
Total Return (%) 48.20 (b) (49.96)(b) 9.33 (b) 22.08 (c) 18.19
------------------------------------------------ -------- --------- -------- -------- --------
RATIOS TO AVERAGE NET ASSETS AND SUPPLEMENTAL DATA
---------------------------------------------------------------------------------------------------------------------------------
Net assets, end of period ($ millions) 139 117 310 331 285
------------------------------------------------ -------- --------- -------- -------- --------
Ratio of expenses before expense reductions (%) 1.11 1.11 1.14 1.12 1.17
------------------------------------------------ -------- --------- -------- -------- --------
Ratio of expenses after expense reductions (%) .99 .99 1.12 1.12 1.17
------------------------------------------------ -------- --------- -------- -------- --------
Ratio of net investment income (loss) (%) .47 1.53 (d) .45 (d) .16 (c) .32
------------------------------------------------ -------- --------- -------- -------- --------
Portfolio turnover rate (%) 53 21 19 28 30
------------------------------------------------ -------- --------- -------- -------- --------
(a) Based on average shares outstanding during the period.
(b) Total return would have been lower had certain expenses not been
reduced.
(c) Includes non-recurring income from the Advisor recorded as a result
of an administrative proceeding regarding disclosure of brokerage
allocation practices in connection with sales of DWS Funds. The
non-recurring income resulted in an increase in net investment
income of $0.002 per share and an increase in the ratio of net
investment income of 0.01%. Excluding this non-recurring income,
total return would have been 0.01% lower.
(d) Net investment income per share and the ratio of net investment
income include non-recurring dividend income amounting to $0.05 and
$0.02 per share and 0.37% and 0.09% of average daily net assets for
the years ended December 31, 2008 and 2007, respectively.
51
PROSPECTUS May 1, 2010 Financial Highlights
DWS INTERNATIONAL VIP - CLASS A
YEARS ENDED DECEMBER 31, 2009 2008 2007 2006 2005
------------------------------------------------ ---------- --------------------- ---------------- ---------------- ----------
SELECTED PER SHARE DATA
-------------------------------------------------------------------------------------------------------------------------------
NET ASSET VALUE, BEGINNING OF PERIOD $ 6.52 $ 15.01 $ 13.42 $ 10.85 $ 9.50
------------------------------------------------ ------- ---------- -------- -------- -------
Income (loss) from investment operations:
Net investment income (loss)(a) .12 .29 (c) .21 (c) .28 (c) .15
------------------------------------------------ ------- ---------- -------- -------- -------
Net realized and unrealized gain (loss) 1.93 ( 6.46) 1.73 2.51 1.36
------------------------------------------------ ------- ---------- -------- -------- -------
TOTAL FROM INVESTMENT OPERATIONS 2.05 ( 6.17) 1.94 2.79 1.51
------------------------------------------------ ------- ---------- -------- -------- -------
Less distributions from:
Net investment income ( .31) ( .17) ( .35) ( .22) ( .16)
------------------------------------------------ ------- ---------- -------- -------- -------
Net realized gains - ( 2.15) - - -
------------------------------------------------ ------- ---------- -------- -------- -------
TOTAL DISTRIBUTIONS ( .31) ( 2.32) ( .35) ( .22) ( .16)
------------------------------------------------ ------- ---------- -------- -------- -------
NET ASSET VALUE, END OF PERIOD $ 8.26 $ 6.52 $ 15.01 $ 13.42 $ 10.85
------------------------------------------------ ------- ---------- -------- -------- -------
Total Return (%) 33.52 (48.21)(b,d) 14.59 25.91 16.17
------------------------------------------------ ------- ---------- -------- -------- -------
RATIOS TO AVERAGE NET ASSETS AND SUPPLEMENTAL DATA
-------------------------------------------------------------------------------------------------------------------------------
Net assets, end of period ($ millions) 344 297 702 702 558
------------------------------------------------ ------- ---------- -------- -------- -------
Ratio of expenses before expense reductions (%) .94 1.01 .98 .98 1.02
------------------------------------------------ ------- ---------- -------- -------- -------
Ratio of expenses after expense reductions (%) .94 .97 .98 .98 1.02
------------------------------------------------ ------- ---------- -------- -------- -------
Ratio of net investment income (loss) (%) 1.69 2.74 (c) 1.48 (c) 2.32 (c) 1.59
------------------------------------------------ ------- ---------- -------- -------- -------
Portfolio turnover rate (%) 81 123 108 105 59
------------------------------------------------ ------- ---------- -------- -------- -------
(a) Based on average shares outstanding during the period.
(b) Total return would have been lower had certain expenses not been
reduced.
(c) Net investment income per share and the ratio of net investment
income include non-recurring dividend income amounting to $0.09,
$0.05 and $0.11 per share and 0.82%, 0.33% and 0.92% of average
daily net assets for the years ended December 31, 2008, 2007 and
2006, respectively.
(d) Includes a reimbursement from the Advisor to reimburse the effect of
losses incurred as the result of certain operation errors during the
period. Excluding this reimbursement, total return would have been
0.06% lower.
DWS HEALTH CARE VIP - CLASS A
YEARS ENDED DECEMBER 31, 2009 2008 2007 2006 2005
------------------------------------------ ---------- ---------------- ---------------- ---------------- -----------
SELECTED PER SHARE DATA
---------------------------------------------------------------------------------------------------------------------------
NET ASSET VALUE, BEGINNING OF PERIOD $ 9.45 $ 14.68 $ 13.77 $ 13.02 $ 12.00
------------------------------------------ ------- -------- -------- -------- --------
Income (loss) from investment operations:
Net investment income (loss)(a) ( .01) .09 (c) .03 (c) ( .01)(b) ( .02)
------------------------------------------- ------- -------- -------- -------- --------
Net realized and unrealized gain (loss) 2.02 ( 3.08) 1.75 .81 1.04
------------------------------------------- ------- -------- -------- -------- --------
TOTAL FROM INVESTMENT OPERATIONS 2.01 ( 2.99) 1.78 .80 1.02
------------------------------------------- ------- -------- -------- -------- --------
Less distributions from:
Net investment income ( .13) ( .04) - - -
------------------------------------------- ------- -------- -------- -------- --------
Net realized gains ( .12) ( 2.20) ( .87) ( .05) -
------------------------------------------- ------- -------- -------- -------- --------
TOTAL DISTRIBUTIONS ( .25) ( 2.24) ( .87) ( .05) -
------------------------------------------- ------- -------- -------- -------- --------
NET ASSET VALUE, END OF PERIOD $ 11.21 $ 9.45 $ 14.68 $ 13.77 $ 13.02
------------------------------------------- ------- -------- -------- -------- --------
Total Return (%) 22.19 (23.20) 13.20 6.17 (b) 8.50
------------------------------------------- ------- -------- -------- -------- --------
RATIOS TO AVERAGE NET ASSETS AND SUPPLEMENTAL DATA
---------------------------------------------------------------------------------------------------------------------------
Net assets, end of period ($ millions) 49 60 98 101 109
------------------------------------------- ------- -------- -------- -------- --------
Ratio of expenses (%) .96 .92 .93 .89 .88
------------------------------------------- ------- -------- -------- -------- --------
Ratio of net investment income (loss) (%) ( .08) .79 (c) .19 (c) ( .03)(b) ( .18)
------------------------------------------- ------- -------- -------- -------- --------
Portfolio turnover rate (%) 31 24 37 47 43
------------------------------------------- ------- -------- -------- -------- --------
(a) Based on average shares outstanding during the period.
(b) Includes non-recurring income from the Advisor recorded as a result
of an administrative proceeding regarding disclosure of brokerage
allocation practices in connection with sales of DWS Funds. The
non-recurring income resulted in an increase in net investment
income of $0.003 per share and an increase in the ratio of net
investment income of 0.02%. Excluding this non-recurring income,
total return would have been 0.02% lower.
(c) Net investment income per share and ratio of net investment income
include non-recurring dividend income amounting to $0.03 and $0.02
per share and 0.28% and 0.13% of average daily net assets for the
years ended December 31, 2008 and 2007, respectively.
52
PROSPECTUS May 1, 2010 Financial Highlights
DWS EQUITY 500 INDEX VIP - CLASS A
YEARS ENDED DECEMBER 31, 2009 2008
--------------------------------------------------- ---------------- -----------------
SELECTED PER SHARE DATA
---------------------------------------------------------------------------------------
NET ASSET VALUE, BEGINNING OF PERIOD $ 9.55 $ 15.53
--------------------------------------------------- --------- ----------
Income (loss) from investment operations:
Net investment income (loss)(a) .21 .27
--------------------------------------------------- --------- ----------
Net realized and unrealized gain (loss) 2.20 ( 5.93)
--------------------------------------------------- --------- ----------
TOTAL FROM INVESTMENT OPERATIONS 2.41 ( 5.66)
--------------------------------------------------- --------- ----------
Less distributions from:
Net investment income ( .28) ( .32)
--------------------------------------------------- --------- ----------
NET ASSET VALUE, END OF PERIOD $ 11.68 $ 9.55
--------------------------------------------------- --------- ----------
Total Return (%) 26.32 (b) (37.15)(b)
--------------------------------------------------- --------- ----------
RATIOS TO AVERAGE NET ASSETS AND SUPPLEMENTAL DATA
---------------------------------------------------------------------------------------
Net assets, end of period ($ millions) 678 584
--------------------------------------------------- --------- ----------
Ratio of expenses before expense reductions and/or .34 .33
--------------------------------------------------- --------- ----------
recoupments (%)
---------------------------------------------------
Ratio of expenses after expense reductions and/or .32 .28
--------------------------------------------------- --------- ----------
recoupments (%)
---------------------------------------------------
Ratio of net investment income (loss) (%) 2.10 2.07
--------------------------------------------------- --------- ----------
Portfolio turnover rate (%) 8 6
--------------------------------------------------- --------- ----------
YEARS ENDED DECEMBER 31, 2007 2006 2005
--------------------------------------------------- ---------------- ---------------- -----------
SELECTED PER SHARE DATA
--------------------------------------------------------------------------------------------------
NET ASSET VALUE, BEGINNING OF PERIOD $ 14.97 $ 13.11 $ 12.73
--------------------------------------------------- --------- --------- --------
Income (loss) from investment operations:
Net investment income (loss)(a) .27 .24 .21
--------------------------------------------------- --------- --------- --------
Net realized and unrealized gain (loss) .52 1.78 .37
--------------------------------------------------- --------- --------- --------
TOTAL FROM INVESTMENT OPERATIONS .79 2.02 .58
--------------------------------------------------- --------- --------- --------
Less distributions from:
Net investment income ( .23) ( .16) ( .20)
--------------------------------------------------- --------- --------- --------
NET ASSET VALUE, END OF PERIOD $ 15.53 $ 14.97 $ 13.11
--------------------------------------------------- --------- --------- --------
Total Return (%) 5.30 (b) 15.52 (b) 4.68
--------------------------------------------------- --------- --------- --------
RATIOS TO AVERAGE NET ASSETS AND SUPPLEMENTAL DATA
--------------------------------------------------------------------------------------------------
Net assets, end of period ($ millions) 1,046 1,412 1,102
--------------------------------------------------- --------- --------- --------
Ratio of expenses before expense reductions and/or .33 .28 .27
--------------------------------------------------- --------- --------- --------
recoupments (%)
---------------------------------------------------
Ratio of expenses after expense reductions and/or .30 .27 .27
--------------------------------------------------- --------- --------- --------
recoupments (%)
---------------------------------------------------
Ratio of net investment income (loss) (%) 1.71 1.73 1.62
--------------------------------------------------- --------- --------- --------
Portfolio turnover rate (%) 7(c) 9 15
--------------------------------------------------- --------- --------- --------
(a) Based on average shares outstanding during the period.
(b) Total return would have been lower had certain expenses not been
reduced.
(c) Excludes portfolio securities delivered as a result of processing
redemption in-kind transactions.
DWS SMALL CAP INDEX VIP - CLASS A
YEARS ENDED DECEMBER 31, 2009 2008 2007 2006 2005
------------------------------------------------ ---------- ----------- ------------- ----------- -----------
SELECTED PER SHARE DATA
--------------------------------------------------------------------------------------------------------------------
NET ASSET VALUE, BEGINNING OF PERIOD $ 8.63 $ 14.71 $ 16.12 $ 14.40 $ 14.35
------------------------------------------------ ------- -------- ------- -------- --------
Income (loss) from investment operations:
Net investment income (loss)(a) .10 .18 .17 .14 .11
------------------------------------------------ ------- -------- ------- -------- --------
Net realized and unrealized gain (loss) 1.93 ( 4.77) ( .40) 2.34 .42
------------------------------------------------ ------- -------- ------- -------- --------
TOTAL FROM INVESTMENT OPERATIONS 2.03 ( 4.59) ( .23) 2.48 .53
------------------------------------------------ ------- -------- ------- -------- --------
Less distributions from:
Net investment income ( .16) ( .20) ( .14) ( .10) ( .09)
------------------------------------------------ ------- -------- ------- -------- --------
Net realized gains ( .60) ( 1.29) ( 1.04) ( .66) ( .39)
------------------------------------------------ ------- -------- ------- -------- --------
TOTAL DISTRIBUTIONS ( .76) ( 1.49) ( 1.18) ( .76) ( .48)
------------------------------------------------ ------- -------- ------- -------- --------
NET ASSET VALUE, END OF PERIOD $ 9.90 $ 8.63 $ 14.71 $ 16.12 $ 14.40
------------------------------------------------ ------- -------- ------- -------- --------
Total Return (%)(b) 26.57 (34.12) ( 1.90) 17.49 4.26
------------------------------------------------ ------- -------- ------- -------- --------
RATIOS TO AVERAGE NET ASSETS AND SUPPLEMENTAL DATA
--------------------------------------------------------------------------------------------------------------------
Net assets, end of period ($ millions) 258 198 305 536 449
------------------------------------------------ ------- -------- ------- -------- --------
Ratio of expenses before expense reductions (%) .56 .54 .53 .47 .46
------------------------------------------------- ------- -------- ------- -------- --------
Ratio of expenses after expense reductions (%) .50 .47 .51 .45 .45
------------------------------------------------- ------- -------- ------- -------- --------
Ratio of net investment income (loss) (%) 1.19 1.51 1.09 .93 .78
------------------------------------------------- ------- -------- ------- -------- --------
Portfolio turnover rate (%) 26 25 24(c) 42 26
------------------------------------------------- ------- -------- ------- -------- --------
(a) Based on average shares outstanding during the period.
(b) Total return would have been lower had certain expenses not been
reduced.
(c) Excludes portfolio securities delivered as a result of processing
redemption in-kind transactions.
53
PROSPECTUS May 1, 2010 Financial Highlights
APPENDIX
HYPOTHETICAL EXPENSE SUMMARY
Using the annual fund operating expense ratios presented in the fee tables in
the fund prospectus, the Hypothetical Expense Summary shows the estimated fees
and expenses, in actual dollars, that would be charged on a hypothetical
investment of $10,000 in the fund held for the next 10 years and the impact of
such fees and expenses on fund returns for each year and cumulatively, assuming
a 5% return for each year. The historical rate of return for the fund may be
higher or lower than 5% and, for money market funds, is typically less than 5%.
The tables also assume that all dividends and distributions are reinvested. The
annual fund expense ratios shown are net of any contractual fee waivers or
expense reimbursements, if any, for the period of the contractual commitment.
Also, please note that if you are investing through a third party provider,
that provider may have fees and expenses separate from those of the fund that
are not reflected here. Mutual fund fees and expenses fluctuate over time and
actual expenses may be higher or lower than those shown.
The Hypothetical Expense Summary should not be used or construed as an offer to
sell, a solicitation of an offer to buy or a recommendation or endorsement of
any specific mutual fund. You should carefully review the fund's prospectus to
consider the investment objectives, risks, expenses and charges of the fund
prior to investing.
DWS BOND VIP - CLASS A
MAXIMUM INITIAL HYPOTHETICAL ASSUMED RATE
SALES CHARGE: INVESTMENT: OF RETURN:
0.00% $10,000 5%
--------------- -------------------------------- -------------------------------
CUMULATIVE CUMULATIVE HYPOTHETICAL
RETURN BEFORE RETURN AFTER YEAR-END BALANCE ANNUAL
FEES AND ANNUAL FUND FEES AND AFTER FEES AND FEES AND
YEAR EXPENSES EXPENSE RATIOS EXPENSES EXPENSES EXPENSES
------ --------------- ---------------- -------------- ------------------ -----------
1 5.00% 0.59% 4.41% $ 10,441.00 $ 60.30
--- ----- ---- ----- ----------- --------
2 10.25% 0.59% 9.01% $ 10,901.45 $ 62.96
--- ----- ---- ----- ----------- --------
3 15.76% 0.59% 13.82% $ 11,382.20 $ 65.74
--- ----- ---- ----- ----------- --------
4 21.55% 0.59% 18.84% $ 11,884.16 $ 68.64
--- ----- ---- ----- ----------- --------
5 27.63% 0.59% 24.08% $ 12,408.25 $ 71.66
--- ----- ---- ----- ----------- --------
6 34.01% 0.59% 29.55% $ 12,955.45 $ 74.82
--- ----- ---- ----- ----------- --------
7 40.71% 0.59% 35.27% $ 13,526.79 $ 78.12
--- ----- ---- ----- ----------- --------
8 47.75% 0.59% 41.23% $ 14,123.32 $ 81.57
--- ----- ---- ----- ----------- --------
9 55.13% 0.59% 47.46% $ 14,746.16 $ 85.16
--- ----- ---- ----- ----------- --------
10 62.89% 0.59% 53.96% $ 15,396.46 $ 88.92
--- ----- ---- ----- ----------- --------
TOTAL $ 737.89
--- --------
54
PROSPECTUS May 1, 2010 Appendix
DWS GROWTH & INCOME VIP - CLASS A
MAXIMUM INITIAL HYPOTHETICAL ASSUMED RATE
SALES CHARGE: INVESTMENT: OF RETURN:
0.00% $10,000 5%
--------------- -------------------------------- -------------------------------
CUMULATIVE CUMULATIVE HYPOTHETICAL
RETURN BEFORE RETURN AFTER YEAR-END BALANCE ANNUAL
FEES AND ANNUAL FUND FEES AND AFTER FEES AND FEES AND
YEAR EXPENSES EXPENSE RATIOS EXPENSES EXPENSES EXPENSES
------ --------------- ---------------- -------------- ------------------ -----------
1 5.00% 0.63% 4.37% $ 10,437.00 $ 64.38
--- ----- ---- ----- ----------- --------
2 10.25% 0.63% 8.93% $ 10,893.10 $ 67.19
--- ----- ---- ----- ----------- --------
3 15.76% 0.63% 13.69% $ 11,369.13 $ 70.13
--- ----- ---- ----- ----------- --------
4 21.55% 0.63% 18.66% $ 11,865.96 $ 73.19
--- ----- ---- ----- ----------- --------
5 27.63% 0.63% 23.84% $ 12,384.50 $ 76.39
--- ----- ---- ----- ----------- --------
6 34.01% 0.63% 29.26% $ 12,925.70 $ 79.73
--- ----- ---- ----- ----------- --------
7 40.71% 0.63% 34.91% $ 13,490.55 $ 83.21
--- ----- ---- ----- ----------- --------
8 47.75% 0.63% 40.80% $ 14,080.09 $ 86.85
--- ----- ---- ----- ----------- --------
9 55.13% 0.63% 46.95% $ 14,695.39 $ 90.64
--- ----- ---- ----- ----------- --------
10 62.89% 0.63% 53.38% $ 15,337.58 $ 94.60
--- ----- ---- ----- ----------- --------
TOTAL $ 786.31
--- --------
DWS CAPITAL GROWTH VIP - CLASS A
MAXIMUM INITIAL HYPOTHETICAL ASSUMED RATE
SALES CHARGE: INVESTMENT: OF RETURN:
0.00% $10,000 5%
--------------- -------------------------------- -------------------------------
CUMULATIVE CUMULATIVE HYPOTHETICAL
RETURN BEFORE RETURN AFTER YEAR-END BALANCE ANNUAL
FEES AND ANNUAL FUND FEES AND AFTER FEES AND FEES AND
YEAR EXPENSES EXPENSE RATIOS EXPENSES EXPENSES EXPENSES
------ --------------- ---------------- -------------- ------------------ -----------
1 5.00% 0.51% 4.49% $ 10,449.00 $ 52.14
--- ----- ---- ----- ----------- --------
2 10.25% 0.51% 9.18% $ 10,918.16 $ 54.49
--- ----- ---- ----- ----------- --------
3 15.76% 0.51% 14.08% $ 11,408.39 $ 56.93
--- ----- ---- ----- ----------- --------
4 21.55% 0.51% 19.21% $ 11,920.62 $ 59.49
--- ----- ---- ----- ----------- --------
5 27.63% 0.51% 24.56% $ 12,455.86 $ 62.16
--- ----- ---- ----- ----------- --------
6 34.01% 0.51% 30.15% $ 13,015.13 $ 64.95
--- ----- ---- ----- ----------- --------
7 40.71% 0.51% 36.00% $ 13,599.51 $ 67.87
--- ----- ---- ----- ----------- --------
8 47.75% 0.51% 42.10% $ 14,210.12 $ 70.91
--- ----- ---- ----- ----------- --------
9 55.13% 0.51% 48.48% $ 14,848.16 $ 74.10
--- ----- ---- ----- ----------- --------
10 62.89% 0.51% 55.15% $ 15,514.84 $ 77.43
--- ----- ---- ----- ----------- --------
TOTAL $ 640.47
--- --------
55
PROSPECTUS May 1, 2010 Appendix
DWS GLOBAL OPPORTUNITIES VIP - CLASS A
MAXIMUM INITIAL HYPOTHETICAL ASSUMED RATE
SALES CHARGE: INVESTMENT: OF RETURN:
0.00% $10,000 5%
--------------- -------------------------------- --------------------------------
CUMULATIVE CUMULATIVE HYPOTHETICAL
RETURN BEFORE RETURN AFTER YEAR-END BALANCE ANNUAL
FEES AND ANNUAL FUND FEES AND AFTER FEES AND FEES AND
YEAR EXPENSES EXPENSE RATIOS EXPENSES EXPENSES EXPENSES
------ --------------- ---------------- -------------- ------------------ ------------
1 5.00% 1.11% 3.89% $ 10,389.00 $ 113.16
--- ----- ---- ----- ----------- ----------
2 10.25% 1.11% 7.93% $ 10,793.13 $ 117.56
--- ----- ---- ----- ----------- ----------
3 15.76% 1.11% 12.13% $ 11,212.98 $ 122.13
--- ----- ---- ----- ----------- ----------
4 21.55% 1.11% 16.49% $ 11,649.17 $ 126.88
--- ----- ---- ----- ----------- ----------
5 27.63% 1.11% 21.02% $ 12,102.32 $ 131.82
--- ----- ---- ----- ----------- ----------
6 34.01% 1.11% 25.73% $ 12,573.10 $ 136.95
--- ----- ---- ----- ----------- ----------
7 40.71% 1.11% 30.62% $ 13,062.20 $ 142.28
--- ----- ---- ----- ----------- ----------
8 47.75% 1.11% 35.70% $ 13,570.32 $ 147.81
--- ----- ---- ----- ----------- ----------
9 55.13% 1.11% 40.98% $ 14,098.20 $ 153.56
--- ----- ---- ----- ----------- ----------
10 62.89% 1.11% 46.47% $ 14,646.62 $ 159.53
--- ----- ---- ----- ----------- ----------
TOTAL $ 1,351.68
--- ----------
DWS INTERNATIONAL VIP - CLASS A
MAXIMUM INITIAL HYPOTHETICAL ASSUMED RATE
SALES CHARGE: INVESTMENT: OF RETURN:
0.00% $10,000 5%
--------------- -------------------------------- ---------------------------------
CUMULATIVE CUMULATIVE HYPOTHETICAL
RETURN BEFORE RETURN AFTER YEAR-END BALANCE ANNUAL
FEES AND ANNUAL FUND FEES AND AFTER FEES AND FEES AND
YEAR EXPENSES EXPENSE RATIOS EXPENSES EXPENSES EXPENSES
------ --------------- ---------------- -------------- ------------------ -------------
1 5.00% 0.96% 4.04% $ 10,404.00 $ 97.94
--- ----- ---- ----- ----------- ----------
2 10.25% 0.96% 8.24% $ 10,824.32 $ 101.90
--- ----- ---- ----- ----------- ----------
3 15.76% 0.96% 12.62% $ 11,261.62 $ 106.01
--- ----- ---- ----- ----------- ----------
4 21.55% 0.96% 17.17% $ 11,716.59 $ 110.30
--- ----- ---- ----- ----------- ----------
5 27.63% 0.96% 21.90% $ 12,189.94 $ 114.75
--- ----- ---- ----- ----------- ----------
6 34.01% 0.96% 26.82% $ 12,682.42 $ 119.39
--- ----- ---- ----- ----------- ----------
7 40.71% 0.96% 31.95% $ 13,194.79 $ 124.21
--- ----- ---- ----- ----------- ----------
8 47.75% 0.96% 37.28% $ 13,727.86 $ 129.23
--- ----- ---- ----- ----------- ----------
9 55.13% 0.96% 42.82% $ 14,282.46 $ 134.45
--- ----- ---- ----- ----------- ----------
10 62.89% 0.96% 48.59% $ 14,859.47 $ 139.88
--- ----- ---- ----- ----------- ----------
TOTAL $ 1,178.06
--- ----------
56
PROSPECTUS May 1, 2010 Appendix
DWS HEALTH CARE VIP - CLASS A
MAXIMUM INITIAL HYPOTHETICAL ASSUMED RATE
SALES CHARGE: INVESTMENT: OF RETURN:
0.00% $10,000 5%
--------------- -------------------------------- ---------------------------------
CUMULATIVE CUMULATIVE HYPOTHETICAL
RETURN BEFORE RETURN AFTER YEAR-END BALANCE ANNUAL
FEES AND ANNUAL FUND FEES AND AFTER FEES AND FEES AND
YEAR EXPENSES EXPENSE RATIOS EXPENSES EXPENSES EXPENSES
------ --------------- ---------------- -------------- ------------------ -------------
1 5.00% 0.96% 4.04% $ 10,404.00 $ 97.94
--- ----- ---- ----- ----------- ----------
2 10.25% 0.96% 8.24% $ 10,824.32 $ 101.90
--- ----- ---- ----- ----------- ----------
3 15.76% 0.96% 12.62% $ 11,261.62 $ 106.01
--- ----- ---- ----- ----------- ----------
4 21.55% 0.96% 17.17% $ 11,716.59 $ 110.30
--- ----- ---- ----- ----------- ----------
5 27.63% 0.96% 21.90% $ 12,189.94 $ 114.75
--- ----- ---- ----- ----------- ----------
6 34.01% 0.96% 26.82% $ 12,682.42 $ 119.39
--- ----- ---- ----- ----------- ----------
7 40.71% 0.96% 31.95% $ 13,194.79 $ 124.21
--- ----- ---- ----- ----------- ----------
8 47.75% 0.96% 37.28% $ 13,727.86 $ 129.23
--- ----- ---- ----- ----------- ----------
9 55.13% 0.96% 42.82% $ 14,282.46 $ 134.45
--- ----- ---- ----- ----------- ----------
10 62.89% 0.96% 48.59% $ 14,859.47 $ 139.88
--- ----- ---- ----- ----------- ----------
TOTAL $ 1,178.06
--- ----------
DWS EQUITY 500 INDEX VIP - CLASS A
MAXIMUM INITIAL HYPOTHETICAL ASSUMED RATE
SALES CHARGE: INVESTMENT: OF RETURN:
0.00% $10,000 5%
--------------- -------------------------------- -------------------------------
CUMULATIVE CUMULATIVE HYPOTHETICAL
RETURN BEFORE RETURN AFTER YEAR-END BALANCE ANNUAL
FEES AND ANNUAL FUND FEES AND AFTER FEES AND FEES AND
YEAR EXPENSES EXPENSE RATIOS EXPENSES EXPENSES EXPENSES
------ --------------- ---------------- -------------- ------------------ -----------
1 5.00% 0.34% 4.66% $ 10,466.00 $ 34.79
--- ----- ---- ----- ----------- --------
2 10.25% 0.34% 9.54% $ 10,953.72 $ 36.41
--- ----- ---- ----- ----------- --------
3 15.76% 0.34% 14.64% $ 11,464.16 $ 38.11
--- ----- ---- ----- ----------- --------
4 21.55% 0.34% 19.98% $ 11,998.39 $ 39.89
--- ----- ---- ----- ----------- --------
5 27.63% 0.34% 25.58% $ 12,557.51 $ 41.75
--- ----- ---- ----- ----------- --------
6 34.01% 0.34% 31.43% $ 13,142.69 $ 43.69
--- ----- ---- ----- ----------- --------
7 40.71% 0.34% 37.55% $ 13,755.14 $ 45.73
--- ----- ---- ----- ----------- --------
8 47.75% 0.34% 43.96% $ 14,396.13 $ 47.86
--- ----- ---- ----- ----------- --------
9 55.13% 0.34% 50.67% $ 15,066.99 $ 50.09
--- ----- ---- ----- ----------- --------
10 62.89% 0.34% 57.69% $ 15,769.11 $ 52.42
--- ----- ---- ----- ----------- --------
TOTAL $ 430.74
--- --------
57
PROSPECTUS May 1, 2010 Appendix
DWS SMALL CAP INDEX VIP - CLASS A
MAXIMUM INITIAL HYPOTHETICAL ASSUMED RATE
SALES CHARGE: INVESTMENT: OF RETURN:
0.00% $10,000 5%
--------------- -------------------------------- -------------------------------
CUMULATIVE CUMULATIVE HYPOTHETICAL
RETURN BEFORE RETURN AFTER YEAR-END BALANCE ANNUAL
FEES AND ANNUAL FUND FEES AND AFTER FEES AND FEES AND
YEAR EXPENSES EXPENSE RATIOS EXPENSES EXPENSES EXPENSES
------ --------------- ---------------- -------------- ------------------ -----------
1 5.00% 0.53% 4.47% $ 10,447.00 $ 54.18
--- ----- ---- ----- ----------- --------
2 10.25% 0.56% 9.11% $ 10,910.85 $ 59.80
--- ----- ---- ----- ----------- --------
3 15.76% 0.56% 13.95% $ 11,395.29 $ 62.46
--- ----- ---- ----- ----------- --------
4 21.55% 0.56% 19.01% $ 11,901.24 $ 65.23
--- ----- ---- ----- ----------- --------
5 27.63% 0.56% 24.30% $ 12,429.65 $ 68.13
--- ----- ---- ----- ----------- --------
6 34.01% 0.56% 29.82% $ 12,981.53 $ 71.15
--- ----- ---- ----- ----------- --------
7 40.71% 0.56% 35.58% $ 13,557.91 $ 74.31
--- ----- ---- ----- ----------- --------
8 47.75% 0.56% 41.60% $ 14,159.88 $ 77.61
--- ----- ---- ----- ----------- --------
9 55.13% 0.56% 47.89% $ 14,788.58 $ 81.06
--- ----- ---- ----- ----------- --------
10 62.89% 0.56% 54.45% $ 15,445.19 $ 84.65
--- ----- ---- ----- ----------- --------
TOTAL $ 698.58
--- --------
ADDITIONAL INDEX INFORMATION
DWS BOND VIP
BARCLAYS CAPITAL US AGGREGATE BOND INDEX is an unmanaged market value-weighted
measure of Treasury issues, agency issues, corporate bond issues and mortgage
securities.
DWS GROWTH & INCOME VIP
RUSSELL 1000 (Reg. TM) INDEX is an unmanaged index that measures the
performance of the 1,000 largest companies in the Russell 3000 Index, which
represents approximately 92% of the total market capitalization of the Russell
3000 Index.
DWS CAPITAL GROWTH VIP
RUSSELL 1000 (Reg. TM) GROWTH INDEX is an unmanaged index that consists of
those stocks in the Russell 1000 (Reg. TM) Index that have higher price-to-book
ratios and higher forecasted growth values. Russell 1000 (Reg. TM) Index is an
unmanaged price-only index of the 1,000 largest capitalized companies that are
domiciled in the US and whose common stocks are traded.
DWS GLOBAL OPPORTUNITIES VIP
THE S&P DEVELOPED SMALLCAP INDEX (formerly the S&P/Citigroup Extended Market
Index - World) is an unmanaged index of small-capitalization stocks within 26
countries around the globe.
DWS INTERNATIONAL VIP
MORGAN STANLEY COUNTRY INDEX (MSCI) EUROPE, AUSTRALASIA, FAR EAST (EAFE( (Reg.
TM))) is an unmanaged index that tracks international stock performance in the
21 developed markets of Europe, Australasia and the Far East. Returns reflect
reinvestment of dividends net of withholding taxes.
DWS HEALTH CARE VIP
STANDARD & POOR'S 500 INDEX (S&P 500) is an unmanaged, capitalization-weighted
index of 500 stocks. The index is designed to measure performance of the broad
domestic economy through changes in the aggregate market value of 500 stocks
representing all major industries.
S&P NORTH AMERICAN HEALTH CARE SECTOR INDEX (NAME CHANGED FROM S&P GOLDMAN
SACHS HEALTH CARE INDEX effective March 31, 2008) is an unmanaged,
market-capitalization-weighted index of 114 stocks designed to measure the
performance of companies in the health care sector.
DWS EQUITY 500 INDEX VIP
STANDARD & POOR'S 500 INDEX (S&P 500) is an unmanaged, capitalization-weighted
index of 500 stocks. The index is designed to measure performance of the broad
domestic economy through changes in the aggregate market value of 500 stocks
representing all major industries.
DWS SMALL CAP INDEX VIP
RUSSELL 2000 (Reg. TM) INDEX is an unmanaged index that measures the
performance of the 2,000 smallest companies in the Russell 3000 Index, which
represents approximately 8% of the total market capitalization of the Russell
3000 Index.
58
PROSPECTUS May 1, 2010 Appendix
TO GET MORE INFORMATION
SHAREHOLDER REPORTS. These include commentary from a fund's management team
about recent market conditions and the effects of a fund's strategies on its
performance. They also have detailed performance figures, a list of everything
a fund owns, and its financial statements. Shareholders get these reports
automatically.
STATEMENT OF ADDITIONAL INFORMATION (SAI). This tells you more about a fund's
features and policies, including additional risk information. The SAI is
incorporated by reference into this document (meaning that it's legally part of
this prospectus).
For a free copy of any of these documents or to request other information about
a fund, contact DWS Investments at the phone number or address listed below.
SAIs and shareholder reports are also available through the DWS Investments Web
site at www.dws-investments.com. These documents and other information about
each fund are available from the EDGAR Database on the SEC's Internet site at
www.sec.gov. If you like, you may obtain copies of this information, after
paying a copying fee, by e-mailing a request to publicinfo@sec.gov or by
writing the SEC at the address listed below.
You can also review and copy these documents and other information about each
fund, including each fund's SAI, at the SEC's Public Reference Room in
Washington, D.C. Information on the operation of the SEC's Public Reference
Room may be obtained by calling (800) SEC-0330.
CONTACT INFORMATION
DWS INVESTMENTS 222 South Riverside Plaza
Chicago, IL 60606-5808
www.dws-investments.com
(800) 728-3337
SEC 100 F Street, N.E.
Washington, D.C. 20549-0102
WWW.SEC.GOV
(800) SEC-0330
DISTRIBUTOR DWS Investments Distributors, Inc.
222 South Riverside Plaza
Chicago, IL 60606-5808
(800) 621-1148
SEC FILE NUMBER DWS Variable Series I
811-04257
DWS Investments VIT Funds
811-07507
RESHAPING INVESTING. [DWS INVESTMENTS LOGO]
Deutsche Bank Group
(05/01/10) 1A-1
[GRAPHIC APPEARS HERE]
PROSPECTUS
MAY 1, 2010
DWS VARIABLE SERIES I
CLASS B
...............................................................................
DWS Growth & Income VIP
DWS Capital Growth VIP
DWS Global Opportunities VIP
DWS International VIP
DWS Health Care VIP
DWS INVESTMENTS VIT FUNDS
CLASS B
...............................................................................
DWS Equity 500 Index VIP
DWS Equity 500 Index VIP - Class B2
DWS Small Cap Index VIP
........................................................................... .
This prospectus should be read in conjunction with the variable life insurance
or variable annuity contract prospectus and plan documents for tax-qualified
plans. These shares are available and are being marketed exclusively as a
pooled funding vehicle for life insurance companies writing all types of
variable life insur ance policies and variable annuity contracts.
The Securities and Exchange Commission (SEC) does not approve or disapprove
these shares or determine whether the information in this prospectus is
truthful or complete. It is a criminal offense for anyone to inform you
otherwise.
RESHAPING INVESTING. [DWS INVESTMENTS LOGO]
Deutsche Bank Group
TABLE OF CONTENTS
DWS GROWTH & INCOME VIP
Investment Objective........................ 1
Fees and Expenses of the Fund............... 1
Principal Investment Strategy............... 1
Main Risks.................................. 1
Past Performance............................ 2
Management.................................. 2
Purchase and Sale of Fund Shares............ 3
Tax Information............................. 3
Payments to Financial Intermediaries........ 3
DWS CAPITAL GROWTH VIP
Investment Objective........................ 4
Fees and Expenses of the Fund............... 4
Principal Investment Strategy............... 4
Main Risks.................................. 5
Past Performance............................ 5
Management.................................. 6
Purchase and Sale of Fund Shares............ 6
Tax Information............................. 6
Payments to Financial Intermediaries........ 6
DWS GLOBAL OPPORTUNITIES VIP
Investment Objective........................ 7
Fees and Expenses of the Fund............... 7
Principal Investment Strategy............... 7
Main Risks.................................. 8
Past Performance............................ 9
Management.................................. 9
Purchase and Sale of Fund Shares............ 9
Tax Information............................. 9
Payments to Financial Intermediaries........ 9
DWS INTERNATIONAL VIP
Investment Objective........................ 10
Fees and Expenses of the Fund............... 10
Principal Investment Strategy............... 10
Main Risks.................................. 11
Past Performance............................ 11
Management.................................. 11
Purchase and Sale of Fund Shares............ 12
Tax Information............................. 12
Payments to Broker-Dealers and
Other Financial Intermediaries.............. 12
Payments to Financial Intermediaries........ 12
DWS HEALTH CARE VIP
Investment Objective........................ 13
Fees and Expenses of the Fund............... 13
Principal Investment Strategy............... 13
Main Risks.................................. 14
Past Performance............................ 14
Management.................................. 15
Purchase and Sale of Fund Shares............ 15
Tax Information............................. 15
Payments to Financial Intermediaries........ 15
DWS EQUITY 500 INDEX VIP
Investment Objective........................ 16
Fees and Expenses of the Fund............... 16
Principal Investment Strategy............... 16
Main Risks.................................. 17
Past Performance............................ 17
Management.................................. 18
Purchase and Sale of Fund Shares............ 18
Tax Information............................. 18
Payments to Financial Intermediaries........ 18
DWS SMALL CAP INDEX VIP
Investment Objective............................ 19
Fees and Expenses of the Fund................... 19
Principal Investment Strategy................... 19
Main Risks...................................... 20
Past Performance................................ 20
Management...................................... 21
Purchase and Sale of Fund Shares................ 21
Tax Information................................. 21
Payments to Financial Intermediaries............ 21
FUND DETAILS
Additional Information About Fund Strategies and
Risks........................................... 22
DWS Growth & Income VIP......................... 22
DWS Capital Growth VIP.......................... 23
DWS Global Opportunities VIP.................... 24
DWS International VIP........................... 26
DWS Health Care VIP............................. 28
DWS Equity 500 Index VIP........................ 29
DWS Small Cap Index VIP......................... 31
Other Policies and Risks........................ 32
Who Manages and Oversees the Funds.............. 33
Management...................................... 35
INVESTING IN THE FUNDS
Your Investment in the Funds.................... 38
Policies about transactions..................... 38
Buying and Selling Shares....................... 38
How each Fund Calculates Share Price............ 41
Distributions................................... 42
Taxes........................................... 42
Marketing and Distribution Fees................. 42
FINANCIAL HIGHLIGHTS............................ 44
APPENDIX........................................ 50
Hypothetical Expense Summary.................... 50
Additional Index Information.................... 54
YOUR INVESTMENT IN A FUND IS NOT A BANK DEPOSIT AND IS NOT INSURED OR GUARANTEED
BY THE FEDERAL DEPOSIT INSURANCE CORPORATION OR ANY OTHER GOVERNMENT AGENCY,
ENTITY OR PERSON.
-------------------------------------------------------------------------------
[DWS INVESTMENTS LOGO]
Deutsche Bank Group
DWS GROWTH & INCOME VIP
INVESTMENT OBJECTIVE
The fund seeks long-term growth of capital, current income and growth of
income.
FEES AND EXPENSES OF THE FUND
This table describes the fees and expenses you may pay if you buy and hold
shares of the fund. This information does not reflect fees associated with the
separate account that invests in the fund or any variable life insurance policy
or variable annuity contract for which the fund is an investment option. These
fees will increase expenses.
SHAREHOLDER FEES
(paid directly from your investment) None
-------------------------------------- -----
ANNUAL FUND OPERATING EXPENSES (expenses that you pay each year as a % of the
value of your investment)
B
---------
Management fee 0.39
------------------------------------------------ ----
Distribution/service
(12b-1) fees 0.25
------------------------------------------------ ----
Other expenses (includes an administrative fee) 0.25
------------------------------------------------ ----
TOTAL ANNUAL FUND OPERATING EXPENSES 0.89
------------------------------------------------ ----
EXAMPLE
This Example is intended to help you compare the cost of investing in the fund
with the cost of investing in other mutual funds. The Example assumes that you
invest $10,000 in the fund for the time periods indicated and then redeem all
of your shares at the end of those periods. The Example also assumes that your
investment has a 5% return each year and that the fund's operating expenses
remain the same. Although your actual costs may be higher or lower, based on
these assumptions your costs would be:
1 YEAR 3 YEARS 5 YEARS 10 YEARS
-------- --------- --------- ---------
$91 $284 $493 $1,096
--- ---- ---- ------
PORTFOLIO TURNOVER
The fund pays transaction costs when it buys and sells securities (or "turns
over" its portfolio). A higher portfolio turnover may indicate higher
transaction costs. These costs are not reflected in annual fund operating
expenses or in the expense example, but are reflected in fund performance.
Portfolio turnover rate for fiscal year 2009: 82%.
PRINCIPAL INVESTMENT STRATEGY
MAIN INVESTMENTS. The fund invests at least 65% of total assets in equities,
mainly common stocks. Although the fund can invest in companies of any size and
from any country, it invests primarily in large US companies. Portfolio
management may favor securities from different industries and companies at
different times.
MANAGEMENT PROCESS. Portfolio management uses both quantitative and fundamental
analysis to evaluate each company's stock price relative to the company's
earnings, operating trends, market outlook and other measures of performance
potential.
Portfolio management will normally sell a stock when it believes the
fundamental factors have changed, other investments offer better opportunities
or in the course of adjusting the fund's emphasis on or within a given
industry.
--------------------------------------------------------------------------------
DERIVATIVES. The fund may use various types of derivatives (contracts whose
value is based on, for example, indices, currencies or securities) for hedging,
risk management or non-hedging purposes to seek to enhance potential gains. The
fund may use derivatives as a substitute for direct investment in a particular
asset class or to keep cash on hand to meet shareholder redemptions or other
needs.
SECURITIES LENDING. The fund may lend securities (up to one-third of total
assets) to approved institutions.
--------------------------------------------------------------------------------
MAIN RISKS
There are several risk factors that could hurt the fund's performance, cause
you to lose money or cause the fund's performance to trail that of other
investments.
2
PROSPECTUS May 1, 2010 DWS Growth & Income VIP
STOCK MARKET RISK. When stock prices fall, you should expect the value of your
investment to fall as well. To the extent the fund invests in a particular
capitalization or market sector, the fund's performance may be proportionately
affected by that segment's general performance.
FOCUS RISK. To the extent that the fund focuses its investments in particular
industries, asset classes or sectors of the economy, any market price
movements, regulatory or technological changes, or economic conditions
affecting companies in those industries, asset classes or sectors will have a
significant impact on the fund's performance.
SECURITY SELECTION RISK. The securities in the fund's portfolio may decline in
value. Portfolio management could be wrong in its analysis of industries,
companies, economic trends, the relative attractiveness of different securities
or other matters.
SECURITIES LENDING RISK. Any decline in the value of a portfolio security that
occurs while the security is out on loan is borne by the fund, and will
adversely affect performance. Also, there may be delays in recovery of
securities loaned or even a loss of rights in the collateral should the
borrower of the securities fail financially while holding the security.
DERIVATIVES RISK. Risks associated with derivatives include the risk that the
derivative is not well correlated with the security, index or currency to which
it relates; the risk that derivatives may result in losses or missed
opportunities; the risk that the fund will be unable to sell the derivative
because of an illiquid secondary market; the risk that a counterparty is
unwilling or unable to meet its obligation; and the risk that the derivative
transaction could expose the fund to the effects of leverage, which could
increase the fund's exposure to the market and magnify potential losses.
FOREIGN INVESTMENT RISK. To the extent the fund invests in companies based
outside the US, it faces the risks inherent in foreign investing. Adverse
political, economic or social developments could undermine the value of the
fund's investments or prevent the fund from realizing their full value.
Financial reporting standards for companies based in foreign markets differ
from those in the US. Additionally, foreign securities markets generally are
smaller and less liquid than US markets. To the extent that the fund invests in
non-US dollar denominated foreign securities, changes in currency exchange
rates may affect the US dollar value of foreign securities or the income or
gain received on these securities.
COUNTERPARTY RISK. A financial institution or other counterparty with whom the
fund does business (such as trading or securities lending), or that
underwrites, distributes or guarantees any investments or contracts that the
fund owns or is otherwise exposed to, may decline in financial health and
become unable to honor its commitments, which could lead to losses for the
fund.
LIQUIDITY RISK. In certain situations, it may be difficult or impossible to
sell an investment in an orderly fashion at an acceptable price. This may be an
ongoing risk for some investments, such as derivatives or restricted securities
that typically trade only among a limited number of investors.
PRICING RISK. If market conditions make it difficult to value some investments,
the fund may value these investments using more subjective methods, such as
fair value pricing.
PAST PERFORMANCE
How a fund's returns vary from year to year can give an idea of its risk; so
can comparing fund performance to overall market performance (as measured by an
appropriate market index). Past performance may not indicate future results.
All performance figures below assume that dividends were reinvested. For more
recent performance figures, go to www.dws-investments.com (the Web site does
not form a part of this prospectus) or call the phone number for your share
class included in this prospectus. This information doesn't reflect fees
associated with the separate account that invests in the fund or any variable
life insurance policy or variable annuity contract for which the fund is an
investment option. These fees will reduce returns.
CALENDAR YEAR TOTAL RETURNS (%) (Class B)
[BAR GRAPHIC OMITTED HERE]
[BAR GRAPHIC DATA]
-2.33 -11.56 -23.40 26.55 9.78 5.73 13.28 1.00 -38.29 33.64
2000 2001 2002 2003 2004 2005 2006 2007 2008 2009
Best Quarter: 18.06%, Q3 2009 Worst Quarter: -21.71%, Q4 2008
Year-to-Date as of 3/31/2010: 5.67%
AVERAGE ANNUAL TOTAL RETURNS
(For periods ended 12/31/2009 expressed as a %)
CLASS 1 5 10
INCEPTION YEAR YEARS YEARS
----------- ------- ---------- ----------
CLASS B 5/1/97 33.64 -0.05 -0.86
-------------------------------- ------ ----- ------ ------
RUSSELL 1000( (Reg. TM)) INDEX 28.43 0.79 -0.49
-------------------------------- ------ ----- ------ ------
MANAGEMENT
INVESTMENT ADVISOR
Deutsche Investment Management Americas Inc.
PORTFOLIO MANAGER(S)
ROBERT WANG, MANAGING DIRECTOR. Portfolio Manager of the fund. Joined the fund
in 2007.
RUSSELL SHTERN, CFA, VICE PRESIDENT. Portfolio Manager of the fund. Joined the
fund in 2010.
3
PROSPECTUS May 1, 2010 DWS Growth & Income VIP
PURCHASE AND SALE OF FUND SHARES
THE FUND IS INTENDED FOR USE IN A VARIABLE INSURANCE PRODUCT. You should
contact the sponsoring insurance company for information on how to purchase and
sell shares of the fund.
TAX INFORMATION
Generally, owners of variable annuity and variable life contracts are not
subject to current federal income taxation on distributions of income or gains
with respect to such contracts. For further information concerning federal
income tax consequences for the holders of variable annuity contracts and
variable life insurance policies, such holders should consult the prospectus
used in connection with the issuance of their particular contracts or policies.
PAYMENTS TO FINANCIAL INTERMEDIARIES
If you purchase the fund through selected affiliated and unaffiliated brokers,
dealers, participating insurance companies or other financial intermediaries,
the fund and its affiliates may pay the financial intermediary for the sale of
fund shares and related services. These payments may create a conflict of
interest by influencing the financial intermediary and your salesperson to
recommend the fund over another investment. Ask your salesperson or visit your
insurance company's web site for more information.
4
PROSPECTUS May 1, 2010 DWS Growth & Income VIP
[DWS INVESTMENTS LOGO]
Deutsche Bank Group
DWS CAPITAL GROWTH VIP
INVESTMENT OBJECTIVE
The fund seeks to provide long-term growth of capital.
FEES AND EXPENSES OF THE FUND
This table describes the fees and expenses you may pay if you buy and hold
shares of the fund. This information does not reflect fees associated with the
separate account that invests in the fund or any variable life insurance policy
or variable annuity contract for which the fund is an investment option. These
fees will increase expenses.
SHAREHOLDER FEES
(paid directly from your investment) None
-------------------------------------- -----
ANNUAL FUND OPERATING EXPENSES (expenses that you pay each year as a % of the
value of your investment)
B
---------
Management fee 0.37
------------------------------------------------ ----
Distribution/service
(12b-1) fees 0.25
------------------------------------------------ ----
Other expenses (includes an administrative fee) 0.23
------------------------------------------------ ----
TOTAL ANNUAL FUND OPERATING EXPENSES 0.85
------------------------------------------------ ----
EXAMPLE
This Example is intended to help you compare the cost of investing in the fund
with the cost of investing in other mutual funds. The Example assumes that you
invest $10,000 in the fund for the time periods indicated and then redeem all
of your shares at the end of those periods. The Example also assumes that your
investment has a 5% return each year and that the fund's operating expenses
remain the same. Although your actual costs may be higher or lower, based on
these assumptions your costs would be:
1 YEAR 3 YEARS 5 YEARS 10 YEARS
-------- --------- --------- ---------
$87 $271 $471 $1,049
--- ---- ---- ------
PORTFOLIO TURNOVER
The fund pays transaction costs when it buys and sells securities (or "turns
over" its portfolio). A higher portfolio turnover may indicate higher
transaction costs. These costs are not reflected in annual fund operating
expenses or in the expense example, but are reflected in fund performance.
Portfolio turnover rate for fiscal year 2009: 76%.
PRINCIPAL INVESTMENT STRATEGY
MAIN INVESTMENTS. The fund normally invests at least 65% of total assets in
equities, mainly common stocks of US companies. The fund generally focuses on
established companies that are similar in size to the companies in the S&P 500(
(Reg. TM)) Index (generally 500 of the largest companies in the US) or the
Russell 1000( (Reg. TM) )Growth Index (generally those stocks among the 1,000
largest US companies that have above-average price-to-earnings ratios).
Although the fund can invest in companies of any size, the fund intends to
invest primarily in companies whose market capitalizations fall within the
normal range of these indexes.
MANAGEMENT PROCESS. In choosing stocks, portfolio management begins by
utilizing a proprietary quantitative model to rank stocks based on a number of
factors including valuation and profitability. Portfolio management also
applies fundamental techniques to seek to identify companies that display
above-average earnings growth compared to other companies and that have strong
product lines, effective management and leadership positions within core
markets. The factors considered and models used by the portfolio managers may
change over time.
Portfolio management will normally sell a security when it believes the
potential risks have increased, its price is unlikely to go higher, its
fundamental factors have changed, other investments offer better opportunities
or in the course of adjusting the fund's emphasis on a given industry.
--------------------------------------------------------------------------------
DERIVATIVES. The fund may use various types of derivatives (contracts whose
value is based on, for example, indices, currencies or securities) for hedging,
risk management or non-hedging purposes to seek to enhance potential gains. The
fund may use
5
PROSPECTUS May 1, 2010 DWS Capital Growth VIP
derivatives as a substitute for direct investment in a particular asset class
or to keep cash on hand to meet shareholder redemptions or other needs. In
particular, the fund may use futures and options, and write covered call
options.
SECURITIES LENDING. The fund may lend securities (up to one-third of total
assets) to approved institutions.
--------------------------------------------------------------------------------
MAIN RISKS
There are several risk factors that could hurt the fund's performance, cause
you to lose money or cause the fund's performance to trail that of other
investments.
STOCK MARKET RISK. When stock prices fall, you should expect the value of your
investment to fall as well. To the extent the fund invests in a particular
capitalization or market sector, the fund's performance may be proportionately
affected by that segment's general performance.
GROWTH INVESTING RISK. As a category, growth stocks may underperform value
stocks (and the stock market as a whole) over any period of time. Because the
prices of growth stocks are based largely on the expectation of future
earnings, growth stock prices can decline rapidly and significantly in reaction
to negative news about such factors as earnings, the economy, political
developments, or other news.
FOCUS RISK. To the extent that the fund focuses its investments in particular
industries, asset classes or sectors of the economy, any market price
movements, regulatory or technological changes, or economic conditions
affecting companies in those industries, asset classes or sectors will have a
significant impact on the fund's performance.
SECURITY SELECTION RISK. The securities in the fund's portfolio may decline in
value. Portfolio management could be wrong in its analysis of industries,
companies, economic trends, the relative attractiveness of different securities
or other matters.
SECURITIES LENDING RISK. Any decline in the value of a portfolio security that
occurs while the security is out on loan is borne by the fund, and will
adversely affect performance. Also, there may be delays in recovery of
securities loaned or even a loss of rights in the collateral should the
borrower of the securities fail financially while holding the security.
DERIVATIVES RISK. Risks associated with derivatives include the risk that the
derivative is not well correlated with the security, index or currency to which
it relates; the risk that derivatives may result in losses or missed
opportunities; the risk that the fund will be unable to sell the derivative
because of an illiquid secondary market; the risk that a counterparty is
unwilling or unable to meet its obligation; and the risk that the derivative
transaction could expose the fund to the effects of leverage, which could
increase the fund's exposure to the market and magnify potential losses.
FOREIGN INVESTMENT RISK. To the extent the fund invests in companies based
outside the US, it faces the risks inherent in foreign investing. Adverse
political, economic or social developments could undermine the value of the
fund's investments or prevent the fund from realizing their full value.
Financial reporting standards for companies based in foreign markets differ
from those in the US. Additionally, foreign securities markets generally are
smaller and less liquid than US markets. To the extent that the fund invests in
non-US dollar denominated foreign securities, changes in currency exchange
rates may affect the US dollar value of foreign securities or the income or
gain received on these securities.
COUNTERPARTY RISK. A financial institution or other counterparty with whom the
fund does business (such as trading or securities lending), or that
underwrites, distributes or guarantees any investments or contracts that the
fund owns or is otherwise exposed to, may decline in financial health and
become unable to honor its commitments, which could lead to losses for the
fund.
LIQUIDITY RISK. In certain situations, it may be difficult or impossible to
sell an investment in an orderly fashion at an acceptable price. This may be an
ongoing risk for some investments, such as derivatives or restricted securities
that typically trade only among a limited number of investors.
PRICING RISK. If market conditions make it difficult to value some investments,
the fund may value these investments using more subjective methods, such as
fair value pricing.
PAST PERFORMANCE
How a fund's returns vary from year to year can give an idea of its risk; so
can comparing fund performance to overall market performance (as measured by an
appropriate market index). Past performance may not indicate future results.
All performance figures below assume that dividends were reinvested. For more
recent performance figures, go to www.dws-investments.com (the Web site does
not form a part of this prospectus) or call the phone number for your share
class included in this prospectus. This information doesn't reflect fees
associated with the separate account that invests in the fund or any variable
life insurance policy or variable annuity contract for which the fund is an
investment option. These fees will reduce returns.
CALENDAR YEAR TOTAL RETURNS (%) (Class B)
[BAR GRAPHIC OMITTED HERE]
[BAR GRAPHIC DATA]
-10.13 -19.64 -29.37 26.51 7.56 8.51 8.17 12.18 -33.20 26.49
2000 2001 2002 2003 2004 2005 2006 2007 2008 2009
6
PROSPECTUS May 1, 2010 DWS Capital Growth VIP
Best Quarter: 15.04%, Q4 2001 Worst Quarter: -21.62%, Q4 2008
Year-to-Date as of 3/31/2010: 5.34%
AVERAGE ANNUAL TOTAL RETURNS
(For periods ended 12/31/2009 expressed as a %)
CLASS 1 5 10
INCEPTION YEAR YEARS YEARS
----------- ---------- --------- ----------
CLASS B 5/12/97 26.49 2.15 -2.55
-------------------------------- ------- ----- ---- ------
RUSSELL 1000( (Reg. TM)) GROWTH
INDEX 37.21 1.63 -3.99
-------------------------------- ------- ----- ---- ------
MANAGEMENT
INVESTMENT ADVISOR
Deutsche Investment Management Americas Inc.
PORTFOLIO MANAGER(S)
OWEN FITZPATRICK, CFA, MANAGING DIRECTOR. Lead Manager of the fund. Joined the
fund in 2009.
THOMAS M. HYNES, JR., CFA, DIRECTOR. Portfolio Manager of the fund. Joined the
fund in 2009.
BRENDAN O'NEILL, CFA, DIRECTOR. Portfolio Manager of the fund. Joined the fund
in 2009.
PURCHASE AND SALE OF FUND SHARES
THE FUND IS INTENDED FOR USE IN A VARIABLE INSURANCE PRODUCT. You should
contact the sponsoring insurance company for information on how to purchase and
sell shares of the fund.
TAX INFORMATION
Generally, owners of variable annuity and variable life contracts are not
subject to current federal income taxation on distributions of income or gains
with respect to such contracts. For further information concerning federal
income tax consequences for the holders of variable annuity contracts and
variable life insurance policies, such holders should consult the prospectus
used in connection with the issuance of their particular contracts or policies.
PAYMENTS TO FINANCIAL INTERMEDIARIES
If you purchase the fund through selected affiliated and unaffiliated brokers,
dealers, participating insurance companies or other financial intermediaries,
the fund and its affiliates may pay the financial intermediary for the sale of
fund shares and related services. These payments may create a conflict of
interest by influencing the financial intermediary and your salesperson to
recommend the fund over another investment. Ask your salesperson or visit your
insurance company's web site for more information.
7
PROSPECTUS May 1, 2010 DWS Capital Growth VIP
[DWS INVESTMENTS LOGO]
Deutsche Bank Group
DWS GLOBAL OPPORTUNITIES VIP
INVESTMENT OBJECTIVE
The fund seeks above-average capital appreciation over the long term.
FEES AND EXPENSES OF THE FUND
This table describes the fees and expenses you may pay if you buy and hold
shares of the fund. This information does not reflect fees associated with the
separate account that invests in the fund or any variable life insurance policy
or variable annuity contract for which the fund is an investment option. These
fees will increase expenses.
SHAREHOLDER FEES
(paid directly from your investment) None
-------------------------------------- -----
ANNUAL FUND OPERATING EXPENSES (expenses that you pay each year as a % of the
value of your investment)
B
---------
Management fee 0.89
------------------------------------------------ ----
Distribution/service
(12b-1) fees 0.25
------------------------------------------------ ----
Other expenses (includes an administrative fee) 0.28
------------------------------------------------ ----
TOTAL ANNUAL FUND OPERATING EXPENSES 1.42
------------------------------------------------ ----
EXAMPLE
This Example is intended to help you compare the cost of investing in the fund
with the cost of investing in other mutual funds. The Example assumes that you
invest $10,000 in the fund for the time periods indicated and then redeem all
of your shares at the end of those periods. The Example also assumes that your
investment has a 5% return each year and that the fund's operating expenses
remain the same. Although your actual costs may be higher or lower, based on
these assumptions your costs would be:
1 YEAR 3 YEARS 5 YEARS 10 YEARS
-------- --------- --------- ---------
$145 $449 $776 $1,702
---- ---- ---- ------
PORTFOLIO TURNOVER
The fund pays transaction costs when it buys and sells securities (or "turns
over" its portfolio). A higher portfolio turnover may indicate higher
transaction costs. These costs are not reflected in annual fund operating
expenses or in the expense example, but are reflected in fund performance.
Portfolio turnover rate for fiscal year 2009: 53%.
PRINCIPAL INVESTMENT STRATEGY
MAIN INVESTMENTS. The fund invests at least 65% of total assets in common
stocks and other equities of small companies throughout the world (companies
with market values similar to the smallest 20% of the S&P Developed Broad
Market Index, formerly the S&P/Citigroup Broad Market Index World). As of
December 31, 2009, companies in which the fund invests typically have market
capitalizations of between $500 million and $5 billion at the time of purchase.
As part of the investment process (and low turnover strategy) the fund may own
stocks even if they are outside this market capitalization range.
The fund may invest up to 35% of total assets in common stocks and other
equities of large companies or in debt securities.
MANAGEMENT PROCESS. While the fund may invest in securities of any country,
portfolio management generally focuses on countries with developed economies
(including the US). In choosing securities, portfolio management uses a
combination of three analytical disciplines:
BOTTOM-UP RESEARCH. Portfolio management looks for individual companies with a
history of above average growth, strong competitive positioning, attractive
prices relative to potential growth, sound financial strength and effective
management, among other factors.
GROWTH ORIENTATION. Portfolio management generally looks for companies that
they believe have above-average potential for sustainable growth of revenue or
earnings and whose market value appears reasonable in light of their business
prospects.
8
PROSPECTUS May 1, 2010 DWS Global Opportunities VIP
ANALYSIS OF GLOBAL THEMES. Portfolio management considers global economic
outlooks, seeking to identify industries and companies that are likely to
benefit from social, political and economic changes.
Portfolio management will normally sell a security when it believes the price
is unlikely to go much higher, its fundamentals have deteriorated, other
investments offer better opportunities or in the course of adjusting the fund's
exposure to a given country.
--------------------------------------------------------------------------------
DERIVATIVES. The fund may use various types of derivatives (contracts whose
value is based on, for example, indices, currencies or securities) for hedging,
risk management or non-hedging purposes to seek to enhance potential gains. The
fund may also enter into forward currency exchange contracts and buy and sell
currency options to hedge against currency fluctuations. The fund may use
derivatives as a substitute for direct investment in a particular asset class
or to keep cash on hand to meet shareholder redemptions or other needs. In
particular, the fund may use futures, options and yield curve options, forward
currency exchange contracts and may buy or sell currency options.
SECURITIES LENDING. The fund may lend securities (up to one-third of total
assets) to approved institutions.
--------------------------------------------------------------------------------
MAIN RISKS
There are several risk factors that could hurt the fund's performance, cause
you to lose money or cause the fund's performance to trail that of other
investments.
STOCK MARKET RISK. When stock prices fall, you should expect the value of your
investment to fall as well. To the extent that the fund invests in a particular
geographic region or market sector, performance will be affected by that
region's general performance.
FOREIGN INVESTMENT RISK. To the extent the fund invests in companies based
outside the US, it faces the risks inherent in foreign investing. Adverse
political, economic or social developments could undermine the value of the
fund's investments or prevent the fund from realizing their full value.
Financial reporting standards for companies based in foreign markets differ
from those in the US. Additionally, foreign securities markets generally are
smaller and less liquid than US markets. To the extent that the fund invests in
non-US dollar denominated foreign securities, changes in currency exchange
rates may affect the US dollar value of foreign securities or the income or
gain received on these securities. Foreign investment risks are greater in
emerging markets than in developed markets. Emerging market investments are
often considered speculative.
SMALL COMPANY RISK. Small company stocks tend to be more volatile and less
liquid than large company stocks. Small companies are less widely followed by
stock analysts and less information about them is available to investors.
PRICING RISK. If market conditions make it difficult to value some investments,
the fund may value these investments using more subjective methods, such as
fair value pricing.
DERIVATIVES RISK. Risks associated with derivatives include the risk that the
derivative is not well correlated with the security, index or currency to which
it relates; the risk that derivatives may result in losses or missed
opportunities; the risk that the fund will be unable to sell the derivative
because of an illiquid secondary market; the risk that a counterparty is
unwilling or unable to meet its obligation; and the risk that the derivative
transaction could expose the fund to the effects of leverage, which could
increase the fund's exposure to the market and magnify potential losses.
SECURITY SELECTION RISK. The securities in the fund's portfolio may decline in
value. Portfolio management could be wrong in its analysis of industries,
companies, economic trends, the relative attractiveness of different securities
or other matters.
SECURITIES LENDING RISK. Any decline in the value of a portfolio security that
occurs while the security is out on loan is borne by the fund, and will
adversely affect performance. Also, there may be delays in recovery of
securities loaned or even a loss of rights in the collateral should the
borrower of the securities fail financially while holding the security.
COUNTERPARTY RISK. A financial institution or other counterparty with whom the
fund does business (such as trading or securities lending), or that
underwrites, distributes or guarantees any investments or contracts that the
fund owns or is otherwise exposed to, may decline in financial health and
become unable to honor its commitments, which could lead to losses for the
fund.
CREDIT RISK. A fund purchasing debt securities faces the risk that the
creditworthiness of an issuer may decline, causing the value of the debt
securities to decline. In addition, an issuer may not be able to make timely
payments on the interest and/or principal on the debt security it has issued.
Because the issuers of high-yield debt securities or junk bonds (debt
securities rated below the fourth highest category) may be in uncertain
financial health, the prices of their debt securities can be more vulnerable to
bad economic news or even the expectation of bad news, than investment-grade
debt securities.
GROWTH INVESTING RISK. As a category, growth stocks may underperform value
stocks (and the stock market as a whole) over any period of time. Because the
prices of growth stocks are based largely on the expectation of future
earnings, growth stock prices can decline rapidly and significantly in reaction
to negative news about such factors as earnings, the economy, political
developments, or other news.
9
PROSPECTUS May 1, 2010 DWS Global Opportunities VIP
INTEREST RATE RISK. When interest rates rise, prices of debt securities
generally decline. The longer the duration of the fund's debt securities, the
more sensitive it will be to interest rate changes. (As a general rule, a 1%
rise in interest rates means a 1% fall in value for every year of duration.)
PREPAYMENT AND EXTENSION RISK. When interest rates fall, issuers of high
interest debt obligations may pay off the debts earlier than expected
(prepayment risk), and the fund may have to reinvest the proceeds at lower
yields. When interest rates rise, issuers of lower interest debt obligations
may pay off the debts later than expected (extension risk), thus keeping the
fund's assets tied up in lower interest debt obligations. These events could
hurt fund performance.
LIQUIDITY RISK. In certain situations, it may be difficult or impossible to
sell an investment in an orderly fashion at an acceptable price. This may be an
ongoing risk for some investments, such as derivatives or restricted securities
that typically trade only among a limited number of investors.
PAST PERFORMANCE
How a fund's returns vary from year to year can give an idea of its risk; so
can comparing fund performance to overall market performance (as measured by an
appropriate market index). Past performance may not indicate future results.
All performance figures below assume that dividends were reinvested. For more
recent performance figures, go to www.dws-investments.com (the Web site does
not form a part of this prospectus) or call the phone number for your share
class included in this prospectus. This information doesn't reflect fees
associated with the separate account that invests in the fund or any variable
life insurance policy or variable annuity contract for which the fund is an
investment option. These fees will reduce returns.
CALENDAR YEAR TOTAL RETURNS (%) (Class B)
[BAR GRAPHIC OMITTED HERE]
[BAR GRAPHIC DATA]
-5.42 -24.96 -20.07 48.77 23.15 18.06 21.88 8.92 -50.16 47.66
2000 2001 2002 2003 2004 2005 2006 2007 2008 2009
Best Quarter: 30.20%, Q2 2009 Worst Quarter: -28.57%, Q4 2008
Year-to-Date as of 3/31/2010: 5.85%
AVERAGE ANNUAL TOTAL RETURNS
(For periods ended 12/31/2009 expressed as a %)
CLASS 1 5 10
INCEPTION YEAR YEARS YEARS
----------- ---------- --------- ---------
CLASS B 5/2/97 47.66 2.89 1.83
---------------- ------ ----- ---- ----
S&P DEVELOPED
SMALLCAP INDEX 39.43 3.28 5.49
---------------- ------ ----- ---- ----
MANAGEMENT
INVESTMENT ADVISOR
Deutsche Investment Management Americas Inc.
PORTFOLIO MANAGER(S)
JOSEPH AXTELL, CFA, MANAGING DIRECTOR. Portfolio Manager of the fund. Joined
the fund in 2002.
PURCHASE AND SALE OF FUND SHARES
THE FUND IS INTENDED FOR USE IN A VARIABLE INSURANCE PRODUCT. You should
contact the sponsoring insurance company for information on how to purchase and
sell shares of the fund.
TAX INFORMATION
Generally, owners of variable annuity and variable life contracts are not
subject to current federal income taxation on distributions of income or gains
with respect to such contracts. For further information concerning federal
income tax consequences for the holders of variable annuity contracts and
variable life insurance policies, such holders should consult the prospectus
used in connection with the issuance of their particular contracts or policies.
PAYMENTS TO FINANCIAL INTERMEDIARIES
If you purchase the fund through selected affiliated and unaffiliated brokers,
dealers, participating insurance companies or other financial intermediaries,
the fund and its affiliates may pay the financial intermediary for the sale of
fund shares and related services. These payments may create a conflict of
interest by influencing the financial intermediary and your salesperson to
recommend the fund over another investment. Ask your salesperson or visit your
insurance company's web site for more information.
10
PROSPECTUS May 1, 2010 DWS Global Opportunities VIP
[DWS INVESTMENTS LOGO]
Deutsche Bank Group
DWS INTERNATIONAL VIP
INVESTMENT OBJECTIVE
The fund seeks long-term growth of capital.
FEES AND EXPENSES OF THE FUND
This table describes the fees and expenses you may pay if you buy and hold
shares of the fund. This information does not reflect fees associated with the
separate account that invests in the fund or any variable life insurance policy
or variable annuity contract for which the fund is an investment option. These
fees will increase expenses.
SHAREHOLDER FEES
(paid directly from your investment) None
-------------------------------------- -----
ANNUAL FUND OPERATING EXPENSES (expenses that you pay each year as a % of the
value of your investment)
B
---------
Management fee 0.79
---------------------------------------------------- ----
Distribution/service
(12b-1) fees 0.25
---------------------------------------------------- ----
Other expenses (includes an administrative fee) 0.18
---------------------------------------------------- ----
Acquired funds (underlying funds) fees and expenses 0.02
---------------------------------------------------- ----
TOTAL ANNUAL FUND OPERATING EXPENSES 1.24
---------------------------------------------------- ----
EXAMPLE
This Example is intended to help you compare the cost of investing in the fund
with the cost of investing in other mutual funds. The Example assumes that you
invest $10,000 in the fund for the time periods indicated and then redeem all
of your shares at the end of those periods. The Example also assumes that your
investment has a 5% return each year and that the fund's operating expenses
remain the same. Although your actual costs may be higher or lower, based on
these assumptions your costs would be:
1 YEAR 3 YEARS 5 YEARS 10 YEARS
-------- --------- --------- ---------
$126 $393 $681 $1,500
---- ---- ---- ------
PORTFOLIO TURNOVER
The fund pays transaction costs when it buys and sells securities (or "turns
over" its portfolio). A higher portfolio turnover may indicate higher
transaction costs. These costs are not reflected in annual fund operating
expenses or in the expense example, but are reflected in fund performance.
Portfolio turnover rate for fiscal year 2009: 81%.
PRINCIPAL INVESTMENT STRATEGY
MAIN INVESTMENTS. Although the fund can invest in companies of any size and
from any country, it invests mainly in common stocks of established companies
in countries with developed economies (other than the United States).
MANAGEMENT PROCESS. In choosing securities, portfolio management uses a
combination of two analytical disciplines:
BOTTOM-UP RESEARCH. Portfolio management looks for individual companies with a
history of above-average growth, strong competitive positioning, attractive
prices relative to potential growth, sound financial strength and effective
management, among other factors.
TOP-DOWN ANALYSIS. Portfolio management considers the economic outlooks for
various sectors and industries while looking for those that may benefit from
changes in the overall business environment.
Portfolio management will normally sell a security when it believes the price
is unlikely to go much higher, its fundamentals have deteriorated, other
investments offer better opportunities or in the course of adjusting the fund's
exposure to a given country.
--------------------------------------------------------------------------------
DERIVATIVES. The fund may use various types of derivatives (contracts whose
value is based on, for example, indices, currencies or securities) for hedging,
risk management or non-hedging purposes to seek to enhance potential gains. The
fund may use derivatives as a substitute for direct investment in a particular
asset class or to keep cash on hand to meet shareholder redemptions or other
needs.
11
PROSPECTUS May 1, 2010 DWS International VIP
SECURITIES LENDING. The fund may lend securities (up to one-third of total
assets) to approved institutions.
--------------------------------------------------------------------------------
MAIN RISKS
There are several risk factors that could hurt the fund's performance, cause
you to lose money or cause the fund's performance to trail that of other
investments.
FOREIGN INVESTMENT RISK. To the extent the fund invests in companies based
outside the US, it faces the risks inherent in foreign investing. Adverse
political, economic or social developments could undermine the value of the
fund's investments or prevent the fund from realizing their full value.
Financial reporting standards for companies based in foreign markets differ
from those in the US. Additionally, foreign securities markets generally are
smaller and less liquid than US markets. To the extent that the fund invests in
non-US dollar denominated foreign securities, changes in currency exchange
rates may affect the US dollar value of foreign securities or the income or
gain received on these securities. Foreign investment risks are greater in
emerging markets than in developed markets. Emerging market investments are
often considered speculative.
STOCK MARKET RISK. When stock prices fall, you should expect the value of your
investment to fall as well. To the extent that the fund invests in a particular
geographic region or market sector, performance will be affected by that
region's general performance.
SECURITY SELECTION RISK. The securities in the fund's portfolio may decline in
value. Portfolio management could be wrong in its analysis of industries,
companies, economic trends, the relative attractiveness of different securities
or other matters.
LIQUIDITY RISK. In certain situations, it may be difficult or impossible to
sell an investment in an orderly fashion at an acceptable price. This may be an
ongoing risk for some investments, such as derivatives or restricted securities
that typically trade only among a limited number of investors.
PRICING RISK. If market conditions make it difficult to value some investments,
the fund may value these investments using more subjective methods, such as
fair value pricing.
DERIVATIVES RISK. Risks associated with derivatives include the risk that the
derivative is not well correlated with the security, index or currency to which
it relates; the risk that derivatives may result in losses or missed
opportunities; the risk that the fund will be unable to sell the derivative
because of an illiquid secondary market; the risk that a counterparty is
unwilling or unable to meet its obligation; and the risk that the derivative
transaction could expose the fund to the effects of leverage, which could
increase the fund's exposure to the market and magnify potential losses.
SECURITIES LENDING RISK. Any decline in the value of a portfolio security that
occurs while the security is out on loan is borne by the fund, and will
adversely affect performance. Also, there may be delays in recovery of
securities loaned or even a loss of rights in the collateral should the
borrower of the securities fail financially while holding the security.
COUNTERPARTY RISK. A financial institution or other counterparty with whom the
fund does business (such as trading or securities lending), or that
underwrites, distributes or guarantees any investments or contracts that the
fund owns or is otherwise exposed to, may decline in financial health and
become unable to honor its commitments, which could lead to losses for the
fund.
PAST PERFORMANCE
How a fund's returns vary from year to year can give an idea of its risk; so
can comparing fund performance to overall market performance (as measured by an
appropriate market index). Past performance may not indicate future results.
All performance figures below assume that dividends were reinvested. For more
recent performance figures, go to www.dws-investments.com (the Web site does
not form a part of this prospectus) or call the phone number for your share
class included in this prospectus. This information doesn't reflect fees
associated with the separate account that invests in the fund or any variable
life insurance policy or variable annuity contract for which the fund is an
investment option. These fees will reduce returns.
CALENDAR YEAR TOTAL RETURNS (%) (Class B)
[BAR GRAPHIC OMITTED HERE]
[BAR GRAPHIC DATA]
-21.89 -30.81 -18.62 27.52 16.24 15.71 25.44 14.25 -48.25 32.89
2000 2001 2002 2003 2004 2005 2006 2007 2008 2009
Best Quarter: 22.97%, Q3 2009 Worst Quarter: -26.71%, Q3 2008
Year-to-Date as of 3/31/2010: 0.12%
AVERAGE ANNUAL TOTAL RETURNS
(For periods ended 12/31/2009 expressed as a %)
CLASS 1 5 10
INCEPTION YEAR YEARS YEARS
----------- ---------- --------- ----------
CLASS B 5/8/97 32.89 2.66 -2.92
----------------------------- ------ ----- ---- ------
MSCI EAFE( (Reg. TM)) INDEX 31.78 3.54 1.17
----------------------------- ------ ----- ---- ------
MANAGEMENT
INVESTMENT ADVISOR
Deutsche Investment Management Americas Inc.
12
PROSPECTUS May 1, 2010 DWS International VIP
PORTFOLIO MANAGER(S)
NIKOLAUS POEHLMANN, CFA, DIRECTOR. Lead Portfolio Manager of the fund. Joined
the fund in 2009.
UDO ROSENDAHL, MANAGING DIRECTOR. Portfolio Manager of the fund. Joined the
fund in 2009.
MARK SCHUMANN, VICE PRESIDENT. Portfolio Manager of the fund. Joined the fund
in 2009.
ANDREAS WENDELKEN, DIRECTOR. Portfolio Manager of the fund. Joined the fund in
2009.
PURCHASE AND SALE OF FUND SHARES
THE FUND IS INTENDED FOR USE IN A VARIABLE INSURANCE PRODUCT. You should
contact the sponsoring insurance company for information on how to purchase and
sell shares of the fund.
TAX INFORMATION
Generally, owners of variable annuity and variable life contracts are not
subject to current federal income taxation on distributions of income or gains
with respect to such contracts. For further information concerning federal
income tax consequences for the holders of variable annuity contracts and
variable life insurance policies, such holders should consult the prospectus
used in connection with the issuance of their particular contracts or policies.
PAYMENTS TO BROKER-DEALERS AND
OTHER FINANCIAL INTERMEDIARIES
If you purchase the fund through a broker-dealer or other financial
intermediary (such as a bank), the fund and its affiliates may pay the
intermediary for the sale of fund shares and related services. These payments
may create a conflict of interest by influencing the broker-dealer or other
intermediary and your salesperson to recommend the fund over another
investment. Ask your salesperson or visit your financial intermediary's web
site for more information.
PAYMENTS TO FINANCIAL INTERMEDIARIES
If you purchase the fund through selected affiliated and unaffiliated brokers,
dealers, participating insurance companies or other financial intermediaries,
the fund and its affiliates may pay the financial intermediary for the sale of
fund shares and related services. These payments may create a conflict of
interest by influencing the financial intermediary and your salesperson to
recommend the fund over another investment. Ask your salesperson or visit your
insurance company's web site for more information.
13
PROSPECTUS May 1, 2010 DWS International VIP
[DWS INVESTMENTS LOGO]
Deutsche Bank Group
DWS HEALTH CARE VIP
INVESTMENT OBJECTIVE
The fund seeks long-term growth of capital.
FEES AND EXPENSES OF THE FUND
This table describes the fees and expenses you may pay if you buy and hold
shares of the fund. This information does not reflect fees associated with the
separate account that invests in the fund or any variable life insurance policy
or variable annuity contract for which the fund is an investment option. These
fees will increase expenses.
SHAREHOLDER FEES
(paid directly from your investment) None
-------------------------------------- -----
ANNUAL FUND OPERATING EXPENSES (expenses that you pay each year as a % of the
value of your investment)
B
---------
Management fee 0.67
------------------------------------------------ ----
Distribution/service
(12b-1) fees 0.25
------------------------------------------------ ----
Other expenses (includes an administrative fee) 0.42
------------------------------------------------ ----
TOTAL ANNUAL FUND OPERATING EXPENSES 1.34
------------------------------------------------ ----
EXAMPLE
This Example is intended to help you compare the cost of investing in the fund
with the cost of investing in other mutual funds. The Example assumes that you
invest $10,000 in the fund for the time periods indicated and then redeem all
of your shares at the end of those periods. The Example also assumes that your
investment has a 5% return each year and that the fund's operating expenses
remain the same. Although your actual costs may be higher or lower, based on
these assumptions your costs would be:
1 YEAR 3 YEARS 5 YEARS 10 YEARS
-------- --------- --------- ---------
$136 $425 $734 $1,613
---- ---- ---- ------
PORTFOLIO TURNOVER
The fund pays transaction costs when it buys and sells securities (or "turns
over" its portfolio). A higher portfolio turnover may indicate higher
transaction costs. These costs are not reflected in annual fund operating
expenses or in the expense example, but are reflected in fund performance.
Portfolio turnover rate for fiscal year 2009: 31%.
PRINCIPAL INVESTMENT STRATEGY
MAIN INVESTMENTS. Under normal circumstances, the fund will invest at least 80%
of total assets, plus the amount of any borrowing for investment purposes, in
common stock of companies in the health care sector. For purposes of the fund's
80% investment policy, to be considered part of the health care sector,
companies must commit at least half of their assets to, or derive at least half
of the revenues or net income from, that sector. Examples of industries in the
health care sector include pharmaceuticals, biotechnology, medical products and
supplies, and health care services. The fund invests primarily in securities of
US companies, but may invest in foreign companies as well. The fund may invest
in companies of any market capitalization.
MANAGEMENT PROCESS. In choosing stocks, portfolio management uses a combination
of three analytical disciplines:
BOTTOM-UP RESEARCH. Portfolio management looks for individual companies with a
history of above-average growth, strong competitive positioning, new tests or
treatments, the ability to take advantage of demographic trends, attractive
prices relative to potential growth, sound financial strength and effective
management, among other factors.
GROWTH ORIENTATION. Portfolio management generally looks for companies that it
believes have above-average potential for sustainable growth of revenue or
earnings and whose market value appears reasonable in light of their business
prospects.
14
PROSPECTUS May 1, 2010 DWS Health Care VIP
TOP-DOWN ANALYSIS. Portfolio management considers the economic outlook for
various industries within the health care sector while looking for those that
it believes may benefit from changes in the overall business environment.
Portfolio management may favor securities from different industries and
companies within the health care sector at different times. Portfolio
management will normally sell a stock when it believes the stock's price is
unlikely to go higher, its fundamental factors have changed, other investments
offer better opportunities, or in the course of adjusting their emphasis on a
given health care industry.
--------------------------------------------------------------------------------
DERIVATIVES. The fund may use various types of derivatives (contracts whose
value is based on, for example, indices, currencies or securities) for hedging,
risk management or non-hedging purposes to seek to enhance potential gains. The
fund may use derivatives as a substitute for direct investment in a particular
asset class or to keep cash on hand to meet shareholder redemptions or other
needs.
SECURITIES LENDING. The fund may lend securities (up to one-third of total
assets) to approved institutions.
--------------------------------------------------------------------------------
MAIN RISKS
There are several risk factors that could hurt the fund's performance, cause
you to lose money or cause the fund's performance to trail that of other
investments.
STOCK MARKET RISK. To the extent the fund invests in a particular sector, the
fund's performance may be proportionately affected by that sector's general
performance. When stock prices fall, you should expect the value of your
investment to fall as well. The market as a whole may not favor the types of
investments the fund makes, which could affect the fund's ability to sell them
at an attractive price.
FOREIGN INVESTMENT RISK. To the extent the fund invests in companies based
outside the US, it faces the risks inherent in foreign investing. Adverse
political, economic or social developments could undermine the value of the
fund's investments or prevent the fund from realizing their full value.
Financial reporting standards for companies based in foreign markets differ
from those in the US. Additionally, foreign securities markets generally are
smaller and less liquid than US markets. To the extent that the fund invests in
non-US dollar denominated foreign securities, changes in currency exchange
rates may affect the US dollar value of foreign securities or the income or
gain received on these securities.
GROWTH INVESTING RISK. As a category, growth stocks may underperform value
stocks (and the stock market as a whole) over any period of time. Because the
prices of growth stocks are based largely on the expectation of future
earnings, growth stock prices can decline rapidly and significantly in reaction
to negative news about such factors as earnings, the economy, political
developments, or other news.
CONCENTRATION RISK. Any fund that concentrates in a particular segment of the
market will generally be more volatile than a fund that invests more broadly.
Because the fund concentrates its investments in companies in the health care
field, it may be vulnerable to setbacks in that industry.
SECURITY SELECTION RISK. The securities in the fund's portfolio may decline in
value. Portfolio management could be wrong in its analysis of industries,
companies, economic trends, the relative attractiveness of different securities
or other matters.
DERIVATIVES RISK. Risks associated with derivatives include the risk that the
derivative is not well correlated with the security, index or currency to which
it relates; the risk that derivatives may result in losses or missed
opportunities; the risk that the fund will be unable to sell the derivative
because of an illiquid secondary market; the risk that a counterparty is
unwilling or unable to meet its obligation; and the risk that the derivative
transaction could expose the fund to the effects of leverage, which could
increase the fund's exposure to the market and magnify potential losses.
SECURITIES LENDING RISK. Any decline in the value of a portfolio security that
occurs while the security is out on loan is borne by the fund, and will
adversely affect performance. Also, there may be delays in recovery of
securities loaned or even a loss of rights in the collateral should the
borrower of the securities fail financially while holding the security.
SMALL COMPANY RISK. Small company stocks tend to be more volatile and less
liquid than large company stocks. Small companies are less widely followed by
stock analysts and less information about them is available to investors.
COUNTERPARTY RISK. A financial institution or other counterparty with whom the
fund does business (such as trading or securities lending), or that
underwrites, distributes or guarantees any investments or contracts that the
fund owns or is otherwise exposed to, may decline in financial health and
become unable to honor its commitments, which could lead to losses for the
fund.
LIQUIDITY RISK. In certain situations, it may be difficult or impossible to
sell an investment in an orderly fashion at an acceptable price. This may be an
ongoing risk for some investments, such as derivatives or restricted securities
that typically trade only among a limited number of investors.
PRICING RISK. If market conditions make it difficult to value some investments,
the fund may value these investments using more subjective methods, such as
fair value pricing.
PAST PERFORMANCE
How a fund's returns vary from year to year can give an idea of its risk; so
can comparing fund performance to overall market performance (as measured by an
appropriate
15
PROSPECTUS May 1, 2010 DWS Health Care VIP
market index). Past performance may not indicate future results. All
performance figures below assume that dividends were reinvested. For more
recent performance figures, go to www.dws-investments.com (the Web site does
not form a part of this prospectus) or call the phone number for your share
class included in this prospectus. This information doesn't reflect fees
associated with the separate account that invests in the fund or any variable
life insurance policy or variable annuity contract for which the fund is an
investment option. These fees will reduce returns.
Performance prior to class inception is the historical performance of the
fund's original share class (Class A), adjusted to reflect the higher expenses
of Class B. Class A is offered in a different prospectus.
CALENDAR YEAR TOTAL RETURNS (%) (Class B)
[BAR GRAPHIC OMITTED HERE]
[BAR GRAPHIC DATA]
-23.21 33.21 9.17 8.06 5.77 12.88 -23.50 21.80
2002 2003 2004 2005 2006 2007 2008 2009
Best Quarter: 14.98%, Q2 2003 Worst Quarter: -16.55%, Q4 2008
Year-to-Date as of 3/31/2010: 5.75%
AVERAGE ANNUAL TOTAL RETURNS
(For periods ended 12/31/2009 expressed as a %)
CLASS 1 5 SINCE
INCEPTION YEAR YEARS INCEPTION
----------- ---------- --------- ----------
CLASS B 7/1/02 21.80 3.75 4.18
------------------- ------ ----- ---- ----
STANDARD & POOR'S
(S&P) 500 INDEX 26.46 0.42 0.60
------------------- ------ ----- ---- ----
S&P NORTH AMERICAN
HEALTH CARE SECTOR
INDEX 22.49 3.67 2.78
------------------- ------ ----- ---- ----
The Advisor believes the additional S&P North American Health Care Sector Index
represents the fund's overall investment process. Index comparisons begin on
4/30/01.
MANAGEMENT
INVESTMENT ADVISOR
Deutsche Investment Management Americas Inc.
PORTFOLIO MANAGER(S)
LEEFIN LAI, CFA, MANAGING DIRECTOR. Lead Portfolio Manager of the fund. Joined
the fund in 2001.
THOMAS E. BUCHER, CFA, MANAGING DIRECTOR. Deutsche Asset Management. Consultant
to the Advisor since 2002.
PURCHASE AND SALE OF FUND SHARES
THE FUND IS INTENDED FOR USE IN A VARIABLE INSURANCE PRODUCT. You should
contact the sponsoring insurance company for information on how to purchase and
sell shares of the fund.
TAX INFORMATION
Generally, owners of variable annuity and variable life contracts are not
subject to current federal income taxation on distributions of income or gains
with respect to such contracts. For further information concerning federal
income tax consequences for the holders of variable annuity contracts and
variable life insurance policies, such holders should consult the prospectus
used in connection with the issuance of their particular contracts or policies.
PAYMENTS TO FINANCIAL INTERMEDIARIES
If you purchase the fund through selected affiliated and unaffiliated brokers,
dealers, participating insurance companies or other financial intermediaries,
the fund and its affiliates may pay the financial intermediary for the sale of
fund shares and related services. These payments may create a conflict of
interest by influencing the financial intermediary and your salesperson to
recommend the fund over another investment. Ask your salesperson or visit your
insurance company's web site for more information.
16
PROSPECTUS May 1, 2010 DWS Health Care VIP
[DWS INVESTMENTS LOGO]
Deutsche Bank Group
DWS EQUITY 500 INDEX VIP
INVESTMENT OBJECTIVE
The fund seeks to replicate, as closely as possible, before the deduction of
expenses, the performance of the Standard & Poor's 500 Composite Stock Price
Index (the "S&P 500( (Reg. TM)) Index"), which emphasizes stocks of large US
companies.
FEES AND EXPENSES OF THE FUND
This table describes the fees and expenses you may pay if you buy and hold
shares of the fund. This information does not reflect fees associated with the
separate account that invests in the fund or any variable life insurance policy
or variable annuity contract for which the fund is an investment option. These
fees will increase expenses.
SHAREHOLDER FEES
(paid directly from your investment) None
-------------------------------------- -----
ANNUAL FUND OPERATING EXPENSES (expenses that you pay each year as a % of the
value of your investment)
B B2
--------- ---------
Management fee 0.20 0.20
------------------------------------------------ ---- ----
Distribution/service
(12b-1) fees 0.25 0.25
------------------------------------------------ ---- ----
Other expenses (includes an administrative fee) 0.14 0.29
------------------------------------------------ ---- ----
TOTAL ANNUAL FUND OPERATING EXPENSES 0.59 0.74
------------------------------------------------ ---- ----
EXAMPLE
This Example is intended to help you compare the cost of investing in the fund
with the cost of investing in other mutual funds. The Example assumes that you
invest $10,000 in the fund for the time periods indicated and then redeem all
of your shares at the end of those periods. The Example also assumes that your
investment has a 5% return each year and that the fund's operating expenses
remain the same. Although your actual costs may be higher or lower, based on
these assumptions your costs would be:
1 YEAR 3 YEARS 5 YEARS 10 YEARS
-------- --------- --------- ---------
Class B $60 $189 $329 $738
---------- --- ---- ---- ----
Class B2 $76 $237 $411 $918
---------- --- ---- ---- ----
PORTFOLIO TURNOVER
The fund pays transaction costs when it buys and sells securities (or "turns
over" its portfolio). A higher portfolio turnover may indicate higher
transaction costs. These costs are not reflected in annual fund operating
expenses or in the expense example, but are reflected in fund performance.
Portfolio turnover rate for fiscal year 2009: 8%.
PRINCIPAL INVESTMENT STRATEGY
MAIN INVESTMENTS. Under normal circumstances, the fund intends to invest at
least 80% of assets, determined at the time of purchase, in stocks of companies
included in the S&P 500( (Reg. TM)) Index and in derivative instruments, such
as futures contracts and options, that provide exposure to the stocks of
companies in the S&P 500( (Reg. TM)) Index. The fund's securities are weighted
to attempt to make the fund's total investment characteristics similar to those
of the S&P 500( (Reg. TM) )Index as a whole. Portfolio management may limit or
avoid exposure to any stock in the S&P 500( (Reg. TM)) Index if it believes the
stock is illiquid or that extraordinary conditions have cast doubt on its
merits. Conversely, portfolio management may gain exposure to a stock not
included in the S&P 500( (Reg. TM) )Index when it believes such exposure is
consistent with the fund's goal (for example, in anticipation of a stock being
added to the S&P 500( (Reg. TM) )Index). The fund may also hold short-term debt
securities and money market instruments for liquidity purposes.
The S&P 500 INDEX is a well-known stock market index that includes common
stocks of 500 companies from several industrial sectors representing a
significant portion of the market value of all stocks publicly traded in the
US. Stocks in the S&P 500 Index are weighted according to their total market
value. The fund is not sponsored, endorsed, sold or promoted by the Standard &
Poor's Division of The McGraw-Hill Companies, Inc. ("S&P").
17
PROSPECTUS May 1, 2010 DWS Equity 500 Index VIP
MANAGEMENT PROCESS. Portfolio management uses quantitative analysis techniques
to structure the fund to obtain a high correlation to the index while seeking
to keep the fund as fully invested as possible in all market environments.
Portfolio management seeks a long-term correlation between fund performance,
before expenses, and the index of 98% or better (perfect correlation being
100%). The fund uses an optimization strategy, buying the largest stocks in the
index in approximately the same proportion they represent in the index, then
investing in a statistically selected sample of the smaller securities found in
the index. This process is intended to produce a portfolio whose industry
weightings, market capitalizations and fundamental characteristics
(price-to-book ratios, price-to-earnings ratios, debt-to-asset ratios and
dividend yields) closely replicate those of the index. This approach attempts
to maximize the fund's liquidity and returns while minimizing its costs.
--------------------------------------------------------------------------------
DERIVATIVES. The fund may use various types of derivatives (contracts whose
value is based on, for example, indices, currencies or securities) for hedging,
risk management or non-hedging purposes to seek to enhance potential gains. The
fund may use derivatives as a substitute for direct investment in a particular
asset class or to keep cash on hand to meet shareholder redemptions or other
needs.
SECURITIES LENDING. The fund may lend securities (up to one-third of total
assets) to approved institutions.
--------------------------------------------------------------------------------
MAIN RISKS
There are several risk factors that could hurt the fund's performance, cause
you to lose money or cause the fund's performance to trail that of other
investments.
STOCK MARKET RISK. When stock prices fall, you should expect the value of your
investment to fall as well.
INDEXING RISK. An index fund's performance may not exactly replicate the
performance of its target index, for several reasons. Also, while the exposure
of the index to its component securities is by definition 100%, the fund's
effective exposure to index securities may be greater or lesser than 100% and
may vary overtime.
Because an index fund is designed to maintain a high level of exposure to its
target index at all times, it will not take any steps to invest defensively or
otherwise reduce the risk of loss during market downturns.
DERIVATIVES RISK. Risks associated with derivatives include the risk that the
derivative is not well correlated with the security, index or currency to which
it relates; the risk that derivatives may result in losses or missed
opportunities; the risk that the fund will be unable to sell the derivative
because of an illiquid secondary market; the risk that a counterparty is
unwilling or unable to meet its obligation; and the risk that the derivative
transaction could expose the fund to the effects of leverage, which could
increase the fund's exposure to the market and magnify potential losses.
SECURITIES LENDING RISK. Any decline in the value of a portfolio security that
occurs while the security is out on loan is borne by the fund, and will
adversely affect performance. Also, there may be delays in recovery of
securities loaned or even a loss of rights in the collateral should the
borrower of the securities fail financially while holding the security.
COUNTERPARTY RISK. A financial institution or other counterparty with whom the
fund does business (such as trading or securities lending), or that
underwrites, distributes or guarantees any investments or contracts that the
fund owns or is otherwise exposed to, may decline in financial health and
become unable to honor its commitments, which could lead to losses for the
fund.
LIQUIDITY RISK. In certain situations, it may be difficult or impossible to
sell an investment in an orderly fashion at an acceptable price. This may be an
ongoing risk for some investments, such as derivatives or restricted securities
that typically trade only among a limited number of investors.
PRICING RISK. If market conditions make it difficult to value some investments,
the fund may value these investments using more subjective methods, such as
fair value pricing.
PAST PERFORMANCE
How a fund's returns vary from year to year can give an idea of its risk; so
can comparing fund performance to overall market performance (as measured by an
appropriate market index). Past performance may not indicate future results.
All performance figures below assume that dividends were reinvested. For more
recent performance figures, go to www.dws-investments.com (the Web site does
not form a part of this prospectus) or call the phone number for your share
class included in this prospectus. This information doesn't reflect fees
associated with the separate account that invests in the fund or any variable
life insurance policy or variable annuity contract for which the fund is an
investment option. These fees will reduce returns.
Performance figures prior to class inception is the historical performance of
the fund's original share class (Class A), adjusted to reflect the higher
expenses of Class B. Class A is offered in a different prospectus.
CALENDAR YEAR TOTAL RETURNS (%) (Class B)
[BAR GRAPHIC OMITTED HERE]
[BAR GRAPHIC DATA]
-9.46 -12.40 -22.51 27.83 10.32 4.42 15.24 5.03 -37.34 26.03
2000 2001 2002 2003 2004 2005 2006 2007 2008 2009
Best Quarter: 15.79%, Q2 2009 Worst Quarter: -22.06%, Q4 2008
Year-to-Date as of 3/31/2010: 5.31%
18
PROSPECTUS May 1, 2010 DWS Equity 500 Index VIP
AVERAGE ANNUAL TOTAL RETURNS
(For periods ended 12/31/2009 expressed as a %)
CLASS 1 5 10
INCEPTION YEAR YEARS YEARS
----------- ---------- ---------- ----------
CLASS B 4/30/02 26.03 -0.04 -1.44
------------------ ------- ----- ------ ------
STANDARD & POOR'S
(S&P) 500 INDEX 26.46 0.42 -0.95
------------------ ------- ----- ------ ------
Performance prior to class inception is the historical performance of the
fund's original share class (Class A), adjusted to reflect the higher expenses
of Class B2. Class A is offered in a different prospectus.
CALENDAR YEAR TOTAL RETURNS (%) (Class B2)
[BAR GRAPHIC OMITTED HERE]
[BAR GRAPHIC DATA]
-9.57 -12.51 -22.60 27.68 10.18 4.23 15.20 4.85 -37.36 25.70
2000 2001 2002 2003 2004 2005 2006 2007 2008 2009
Best Quarter: 15.81%, Q2 2009 Worst Quarter: -22.06%, Q4 2008
Year-to-Date as of 3/31/2010: 5.31%
AVERAGE ANNUAL TOTAL RETURNS
(For periods ended 12/31/2009 expressed as a %)
CLASS 1 5 10
INCEPTION YEAR YEARS YEARS
----------- ---------- ---------- ----------
CLASS B2 9/16/05 25.79 -0.16 -1.56
------------------ ------- ----- ------ ------
STANDARD & POOR'S
(S&P) 500 INDEX 26.46 0.42 -0.95
------------------ ------- ----- ------ ------
MANAGEMENT
INVESTMENT ADVISOR
Deutsche Investment Management Americas Inc.
SUBADVISOR
Northern Trust Investments, N.A.
PORTFOLIO MANAGER(S)
BRENT REEDER. Senior Vice President of Northern Trust Investments, N.A.
Portfolio Manager of the fund. Joined the fund in 2007.
PURCHASE AND SALE OF FUND SHARES
THE FUND IS INTENDED FOR USE IN A VARIABLE INSURANCE PRODUCT. You should
contact the sponsoring insurance company for information on how to purchase and
sell shares of the fund.
TAX INFORMATION
Generally, owners of variable annuity and variable life contracts are not
subject to current federal income taxation on distributions of income or gains
with respect to such contracts. For further information concerning federal
income tax consequences for the holders of variable annuity contracts and
variable life insurance policies, such holders should consult the prospectus
used in connection with the issuance of their particular contracts or policies.
PAYMENTS TO FINANCIAL INTERMEDIARIES
If you purchase the fund through selected affiliated and unaffiliated brokers,
dealers, participating insurance companies or other financial intermediaries,
the fund and its affiliates may pay the financial intermediary for the sale of
fund shares and related services. These payments may create a conflict of
interest by influencing the financial intermediary and your salesperson to
recommend the fund over another investment. Ask your salesperson or visit your
insurance company's web site for more information.
19
PROSPECTUS May 1, 2010 DWS Equity 500 Index VIP
[DWS INVESTMENTS LOGO]
Deutsche Bank Group
DWS SMALL CAP INDEX VIP
INVESTMENT OBJECTIVE
The fund seeks to replicate, as closely as possible, before the deduction of
expenses, the performance of the Russell 2000( (Reg. TM) )Index, which
emphasizes stocks of small US companies.
FEES AND EXPENSES OF THE FUND
This table describes the fees and expenses you may pay if you buy and hold
shares of the fund. This information does not reflect fees associated with the
separate account that invests in the fund or any variable life insurance policy
or variable annuity contract for which the fund is an investment option. These
fees will increase expenses.
SHAREHOLDER FEES
(paid directly from your investment) None
-------------------------------------- -----
ANNUAL FUND OPERATING EXPENSES (expenses that you pay each year as a % of the
value of your investment)
B
---------
Management fee 0.35
------------------------------------------------ ----
Distribution/service
(12b-1) fees 0.25
------------------------------------------------ ----
Other expenses (includes an administrative fee) 0.21
------------------------------------------------ ----
TOTAL ANNUAL FUND OPERATING EXPENSES 0.81
------------------------------------------------ ----
EXAMPLE
This Example is intended to help you compare the cost of investing in the fund
with the cost of investing in other mutual funds. The Example assumes that you
invest $10,000 in the fund for the time periods indicated and then redeem all
of your shares at the end of those periods. The Example also assumes that your
investment has a 5% return each year and that the fund's operating expenses
remain the same. Although your actual costs may be higher or lower, based on
these assumptions your costs would be:
1 YEAR 3 YEARS 5 YEARS 10 YEARS
-------- --------- --------- ---------
$83 $259 $450 $1,002
--- ---- ---- ------
PORTFOLIO TURNOVER
The fund pays transaction costs when it buys and sells securities (or "turns
over" its portfolio). A higher portfolio turnover may indicate higher
transaction costs. These costs are not reflected in annual fund operating
expenses or in the expense example, but are reflected in fund performance.
Portfolio turnover rate for fiscal year 2009: 26%.
PRINCIPAL INVESTMENT STRATEGY
MAIN INVESTMENTS. Under normal circumstances, the fund invests at least 80% of
its assets, determined at the time of purchase, in stocks of companies included
in the Russell 2000 Index (Reg. TM) and in derivative instruments, such as
stock index futures contracts and options that provide exposure to the stocks
of companies in the index. The fund's securities are weighted to attempt to
make the fund's total investment characteristics similar to those of the index
as a whole. Portfolio management may limit or avoid exposure to any stock in
the index if it believes the stock is illiquid or that extraordinary conditions
have cast doubt on its merits. Conversely, portfolio management may gain
exposure to a stock not included in the index when it believes such exposure is
consistent with the fund's goal (for example, in anticipation of a stock being
added to the index). The fund may also hold short-term debt securities and
money market instruments for liquidity purposes.
The RUSSELL 2000 INDEX( (Reg. TM))( )is a well-known stock market index that
measures the performance of the 2,000 smallest companies in the Russell 3000(
(Reg. TM)) Index, which represent approximately 8% of the market capitalization
of the Russell 3000( (Reg. TM)) Index. Stocks in the Russell 2000 Index( (Reg.
TM) )are weighted according to their total market value.
MANAGEMENT PROCESS. Portfolio management uses quantitative analysis techniques
to structure the fund to obtain a high correlation to the index while seeking
to keep the fund as fully invested as possible in all market environments.
Portfolio management seeks a long-term correlation between fund performance,
before expenses, and the index of 98% or better (perfect correlation being
100%). The fund uses an optimization strategy, buying the
20
PROSPECTUS May 1, 2010 DWS Small Cap Index VIP
largest stocks in the index in approximately the same proportion they represent
in the index, then investing in a statistically selected sample of the smaller
securities found in the index. This process is intended to produce a portfolio
whose industry weightings, market capitalizations and fundamental
characteristics (price-to-book ratios, price-to-earnings ratios, debt-to-asset
ratios and dividend yields) closely replicate those of the index. This approach
attempts to maximize the fund's liquidity and returns while minimizing its
costs.
--------------------------------------------------------------------------------
DERIVATIVES. The fund may use various types of derivatives (contracts whose
value is based on, for example, indices, currencies or securities) for hedging,
risk management or non-hedging purposes to seek to enhance potential gains. The
fund may use derivatives as a substitute for direct investment in a particular
asset class or to keep cash on hand to meet shareholder redemptions or other
needs.
SECURITIES LENDING. The fund may lend securities (up to one-third of total
assets) to approved institutions.
--------------------------------------------------------------------------------
MAIN RISKS
There are several risk factors that could hurt the fund's performance, cause
you to lose money or cause the fund's performance to trail that of other
investments.
STOCK MARKET RISK. When stock prices fall, you should expect the value of your
investment to fall as well.
INDEXING RISK. An index fund's performance may not exactly replicate the
performance of its target index, for several reasons. Also, while the exposure
of the index to its component securities is by definition 100%, the fund's
effective exposure to index securities may be greater or lesser than 100% and
may vary overtime.
Because an index fund is designed to maintain a high level of exposure to its
target index at all times, it will not take any steps to invest defensively or
otherwise reduce the risk of loss during market downturns.
SMALL COMPANY RISK. Small company stocks tend to be more volatile and less
liquid than large company stocks. Small companies are less widely followed by
stock analysts and less information about them is available to investors.
DERIVATIVES RISK. Risks associated with derivatives include the risk that the
derivative is not well correlated with the security, index or currency to which
it relates; the risk that derivatives may result in losses or missed
opportunities; the risk that the fund will be unable to sell the derivative
because of an illiquid secondary market; the risk that a counterparty is
unwilling or unable to meet its obligation; and the risk that the derivative
transaction could expose the fund to the effects of leverage, which could
increase the fund's exposure to the market and magnify potential losses.
SECURITIES LENDING RISK. Any decline in the value of a portfolio security that
occurs while the security is out on loan is borne by the fund, and will
adversely affect performance. Also, there may be delays in recovery of
securities loaned or even a loss of rights in the collateral should the
borrower of the securities fail financially while holding the security.
COUNTERPARTY RISK. A financial institution or other counterparty with whom the
fund does business (such as trading or securities lending), or that
underwrites, distributes or guarantees any investments or contracts that the
fund owns or is otherwise exposed to, may decline in financial health and
become unable to honor its commitments, which could lead to losses for the
fund.
LIQUIDITY RISK. In certain situations, it may be difficult or impossible to
sell an investment in an orderly fashion at an acceptable price. This may be an
ongoing risk for some investments, such as derivatives or restricted securities
that typically trade only among a limited number of investors.
PRICING RISK. If market conditions make it difficult to value some investments,
the fund may value these investments using more subjective methods, such as
fair value pricing.
PAST PERFORMANCE
How a fund's returns vary from year to year can give an idea of its risk; so
can comparing fund performance to overall market performance (as measured by an
appropriate market index). Past performance may not indicate future results.
All performance figures below assume that dividends were reinvested. For more
recent performance figures, go to www.dws-investments.com (the Web site does
not form a part of this prospectus) or call the phone number for your share
class included in this prospectus. This information doesn't reflect fees
associated with the separate account that invests in the fund or any variable
life insurance policy or variable annuity contract for which the fund is an
investment option. These fees will reduce returns.
Performance prior to class inception is the historical performance of the
fund's original share class (Class A), adjusted to reflect the higher expenses
of Class B. Class A is offered in a different prospectus.
CALENDAR YEAR TOTAL RETURNS (%) (Class B)
[BAR GRAPHIC OMITTED HERE]
[BAR GRAPHIC DATA]
-4.11 1.82 -20.78 46.05 17.48 3.99 17.19 -2.16 -34.33 26.27
2000 2001 2002 2003 2004 2005 2006 2007 2008 2009
Best Quarter: 22.95%, Q2 2003 Worst Quarter: -26.26%, Q4 2008
Year-to-Date as of 3/31/2010: 8.70%
21
PROSPECTUS May 1, 2010 DWS Small Cap Index VIP
AVERAGE ANNUAL TOTAL RETURNS
(For periods ended 12/31/2009 expressed as a %)
CLASS 1 5 10
INCEPTION YEAR YEARS YEARS
----------- ---------- ---------- ---------
CLASS B 4/30/02 26.27 -0.22 2.75
-------------------------------- ------- ----- ------ ----
RUSSELL 2000( (Reg. TM)) INDEX 27.17 0.51 3.51
-------------------------------- ------- ----- ------ ----
MANAGEMENT
INVESTMENT ADVISOR
Deutsche Investment Management Americas Inc.
SUBADVISOR
Northern Trust Investments, N.A.
PORTFOLIO MANAGER(S)
BRENT REEDER. Senior Vice President of Northern Trust Investments, N.A.
Portfolio Manager of the fund. Joined the fund in 2007.
PURCHASE AND SALE OF FUND SHARES
THE FUND IS INTENDED FOR USE IN A VARIABLE INSURANCE PRODUCT. You should
contact the sponsoring insurance company for information on how to purchase and
sell shares of the fund.
TAX INFORMATION
Generally, owners of variable annuity and variable life contracts are not
subject to current federal income taxation on distributions of income or gains
with respect to such contracts. For further information concerning federal
income tax consequences for the holders of variable annuity contracts and
variable life insurance policies, such holders should consult the prospectus
used in connection with the issuance of their particular contracts or policies.
PAYMENTS TO FINANCIAL INTERMEDIARIES
If you purchase the fund through selected affiliated and unaffiliated brokers,
dealers, participating insurance companies or other financial intermediaries,
the fund and its affiliates may pay the financial intermediary for the sale of
fund shares and related services. These payments may create a conflict of
interest by influencing the financial intermediary and your salesperson to
recommend the fund over another investment. Ask your salesperson or visit your
insurance company's web site for more information.
22
PROSPECTUS May 1, 2010 DWS Small Cap Index VIP
FUND DETAILS
ADDITIONAL INFORMATION ABOUT FUND STRATEGIES AND RISKS
--------------------------------------------------------------------------------
DWS Growth & Income VIP
PRINCIPAL INVESTMENT STRATEGY
MAIN INVESTMENTS. The fund invests at least 65% of total assets in equities,
mainly common stocks. Although the fund can invest in companies of any size and
from any country, it invests primarily in large US companies. Portfolio
management may favor securities from different industries and companies at
different times.
MANAGEMENT PROCESS. Portfolio management uses both quantitative and fundamental
analysis to evaluate each company's stock price relative to the company's
earnings, operating trends, market outlook and other measures of performance
potential.
Portfolio management will normally sell a stock when it believes the
fundamental factors have changed, other investments offer better opportunities
or in the course of adjusting the fund's emphasis on or within a given
industry.
--------------------------------------------------------------------------------
DERIVATIVES. The fund may use various types of derivatives (contracts whose
value is based on, for example, indices, currencies or securities) for hedging,
risk management or non-hedging purposes to seek to enhance potential gains. The
fund may use derivatives as a substitute for direct investment in a particular
asset class or to keep cash on hand to meet shareholder redemptions or other
needs.
SECURITIES LENDING. The fund may lend securities (up to one-third of total
assets) to approved institutions.
--------------------------------------------------------------------------------
MAIN RISKS
There are several risk factors that could hurt the fund's performance, cause
you to lose money or cause the fund's performance to trail that of other
investments.
STOCK MARKET RISK. When stock prices fall, you should expect the value of your
investment to fall as well. Stock prices can be hurt by poor management on the
part of the stock's issuer, shrinking product demand and other business risks.
These may affect single companies as well as groups of companies. In addition,
movements in financial markets may adversely affect a stock's price, regardless
of how well the company performs. To the extent the fund invests in a
particular capitalization or market sector, the fund's performance may be
proportionately affected by that segment's general performance.
FOCUS RISK. To the extent that the fund focuses its investments in particular
industries, asset classes or sectors of the economy, any market price
movements, regulatory or technological changes, or economic conditions
affecting companies in those industries, asset classes or sectors will have a
significant impact on the fund's performance. For example, consumer goods
companies could be hurt by a rise in unemployment or technology companies could
be hurt by such factors as market saturation, price competition and rapid
obsolescence.
SECURITY SELECTION RISK. The securities in the fund's portfolio may decline in
value. Portfolio management could be wrong in its analysis of industries,
companies, economic trends, the relative attractiveness of different securities
or other matters.
SECURITIES LENDING RISK. Any decline in the value of a portfolio security that
occurs while the security is out on loan is borne by the fund, and will
adversely affect performance. Also, there may be delays in recovery of
securities loaned or even a loss of rights in the collateral should the
borrower of the securities fail financially while holding the security.
DERIVATIVES RISK. Risks associated with derivatives include the risk that the
derivative is not well correlated with the security, index or currency to which
it relates; the risk that derivatives may result in losses or missed
opportunities; the risk that the fund will be unable to sell the derivative
because of an illiquid secondary market; the risk that a counterparty is
unwilling or unable to meet its obligation; and the risk that the derivative
transaction could expose the fund to the effects of leverage, which could
increase the fund's exposure to the market and magnify potential losses. There
is no guarantee that derivatives, to the extent employed, will have the
intended effect, and their use could cause lower returns or even losses to the
fund. The use of derivatives by the fund to hedge risk may reduce the
opportunity for gain by offsetting the positive effect of favorable price
movements.
FOREIGN INVESTMENT RISK. To the extent the fund invests in companies based
outside the US, it faces the risks inherent in foreign investing. Adverse
political, economic or
23
PROSPECTUS May 1, 2010 Fund Details
social developments could undermine the value of the fund's investments or
prevent the fund from realizing their full value. Financial reporting standards
for companies based in foreign markets differ from those in the US.
Additionally, foreign securities markets generally are smaller and less liquid
than US markets. To the extent that the fund invests in non-US dollar
denominated foreign securities, changes in currency exchange rates may affect
the US dollar value of foreign securities or the income or gain received on
these securities. Foreign governments may restrict investment by foreigners,
limit withdrawal of trading profit or currency from the country, restrict
currency exchange or seize foreign investments. The investments of the fund may
also be subject to foreign withholding taxes. Foreign transactions and custody
of assets may involve delays in payment, delivery or recovery of money or
investments.
COUNTERPARTY RISK. A financial institution or other counterparty with whom the
fund does business (such as trading or securities lending), or that
underwrites, distributes or guarantees any investments or contracts that the
fund owns or is otherwise exposed to, may decline in financial health and
become unable to honor its commitments. This could cause losses for the fund or
could delay the return or delivery of collateral or other assets to the fund.
LIQUIDITY RISK. In certain situations, it may be difficult or impossible to
sell an investment in an orderly fashion at an acceptable price. This risk can
be ongoing for any security that does not trade actively or in large volumes,
for any security that trades primarily on smaller markets, and for investments
that typically trade only among a limited number of large investors (such as
certain types of derivatives or restricted securities). In unusual market
conditions, even normally liquid securities may be affected by a degree of
liquidity risk. This may affect only certain securities or an overall
securities market.
PRICING RISK. If market conditions make it difficult to value some investments,
the fund may value these investments using more subjective methods, such as
fair value pricing. In such cases, the value determined for an investment could
be different than the value realized upon such investment's sale. As a result,
you could pay more than the market value when buying fund shares or receive
less than the market value when selling fund shares.
--------------------------------------------------------------------------------
DWS Capital Growth VIP
PRINCIPAL INVESTMENT STRATEGY
MAIN INVESTMENTS. The fund normally invests at least 65% of total assets in
equities, mainly common stocks of US companies. The fund generally focuses on
established companies that are similar in size to the companies in the S&P 500(
(Reg. TM)) Index (generally 500 of the largest companies in the US) or the
Russell 1000( (Reg. TM) )Growth Index (generally those stocks among the 1,000
largest US companies that have above-average price-to-earnings ratios).
Although the fund can invest in companies of any size, the fund intends to
invest primarily in companies whose market capitalizations fall within the
normal range of these indexes. The fund may also invest in other types of
equity securities such as preferred stocks or convertible securities.
MANAGEMENT PROCESS. In choosing stocks, portfolio management begins by
utilizing a proprietary quantitative model to rank stocks based on a number of
factors including valuation and profitability. Portfolio management also
applies fundamental techniques to seek to identify companies that display
above-average earnings growth compared to other companies and that have strong
product lines, effective management and leadership positions within core
markets. The factors considered and models used by the portfolio managers may
change over time.
Portfolio management will normally sell a security when it believes the
potential risks have increased, its price is unlikely to go higher, its
fundamental factors have changed, other investments offer better opportunities
or in the course of adjusting the fund's emphasis on a given industry.
--------------------------------------------------------------------------------
DERIVATIVES. The fund may use various types of derivatives (contracts whose
value is based on, for example, indices, currencies or securities) for hedging,
risk management or non-hedging purposes to seek to enhance potential gains. The
fund may use derivatives as a substitute for direct investment in a particular
asset class or to keep cash on hand to meet shareholder redemptions or other
needs. In particular, the fund may use futures and options, and write covered
call options.
SECURITIES LENDING. The fund may lend securities (up to one-third of total
assets) to approved institutions.
--------------------------------------------------------------------------------
MAIN RISKS
There are several risk factors that could hurt the fund's performance, cause
you to lose money or cause the fund's performance to trail that of other
investments.
STOCK MARKET RISK. When stock prices fall, you should expect the value of your
investment to fall as well. Stock prices can be hurt by poor management on the
part of the stock's issuer, shrinking product demand and other business risks.
These may affect single companies as well as groups of companies. In addition,
movements in financial markets may adversely affect a stock's price, regardless
of how well the company performs. To the extent the fund invests in a
particular capitalization or market sector, the fund's performance may be
proportionately affected by that segment's general performance.
GROWTH INVESTING RISK. As a category, growth stocks may underperform value
stocks (and the stock market as a whole) over any period of time. Because the
prices of growth stocks are based largely on the expectation of future
earnings, growth stock prices can decline rapidly and significantly in reaction
to negative news about such factors as earnings, the economy, political
developments,
24
PROSPECTUS May 1, 2010 Fund Details
or other news. A growth company may fail to fulfill apparent promise or may be
eclipsed by competitors or its products or services rendered obsolete by new
technologies. Growth stocks also typically lack the dividends associated with
value stocks that might otherwise cushion investors from the effects of
declining stock prices. In addition, growth stocks selected for investment by
portfolio management may not perform as anticipated.
FOCUS RISK. To the extent that the fund focuses its investments in particular
industries, asset classes or sectors of the economy, any market price
movements, regulatory or technological changes, or economic conditions
affecting companies in those industries, asset classes or sectors will have a
significant impact on the fund's performance. For example, consumer goods
companies could be hurt by a rise in unemployment or technology companies could
be hurt by such factors as market saturation, price competition and rapid
obsolescence.
SECURITY SELECTION RISK. The securities in the fund's portfolio may decline in
value. Portfolio management could be wrong in its analysis of industries,
companies, economic trends, the relative attractiveness of different securities
or other matters.
SECURITIES LENDING RISK. Any decline in the value of a portfolio security that
occurs while the security is out on loan is borne by the fund, and will
adversely affect performance. Also, there may be delays in recovery of
securities loaned or even a loss of rights in the collateral should the
borrower of the securities fail financially while holding the security.
DERIVATIVES RISK. Risks associated with derivatives include the risk that the
derivative is not well correlated with the security, index or currency to which
it relates; the risk that derivatives may result in losses or missed
opportunities; the risk that the fund will be unable to sell the derivative
because of an illiquid secondary market; the risk that a counterparty is
unwilling or unable to meet its obligation; and the risk that the derivative
transaction could expose the fund to the effects of leverage, which could
increase the fund's exposure to the market and magnify potential losses. There
is no guarantee that derivatives, to the extent employed, will have the
intended effect, and their use could cause lower returns or even losses to the
fund. The use of derivatives by the fund to hedge risk may reduce the
opportunity for gain by offsetting the positive effect of favorable price
movements.
FOREIGN INVESTMENT RISK. To the extent the fund invests in companies based
outside the US, it faces the risks inherent in foreign investing. Adverse
political, economic or social developments could undermine the value of the
fund's investments or prevent the fund from realizing their full value.
Financial reporting standards for companies based in foreign markets differ
from those in the US. Additionally, foreign securities markets generally are
smaller and less liquid than US markets. To the extent that the fund invests in
non-US dollar denominated foreign securities, changes in currency exchange
rates may affect the US dollar value of foreign securities or the income or
gain received on these securities. Foreign governments may restrict investment
by foreigners, limit withdrawal of trading profit or currency from the country,
restrict currency exchange or seize foreign investments. The investments of the
fund may also be subject to foreign withholding taxes. Foreign transactions and
custody of assets may involve delays in payment, delivery or recovery of money
or investments.
COUNTERPARTY RISK. A financial institution or other counterparty with whom the
fund does business (such as trading or securities lending), or that
underwrites, distributes or guarantees any investments or contracts that the
fund owns or is otherwise exposed to, may decline in financial health and
become unable to honor its commitments. This could cause losses for the fund or
could delay the return or delivery of collateral or other assets to the fund.
LIQUIDITY RISK. In certain situations, it may be difficult or impossible to
sell an investment in an orderly fashion at an acceptable price. This risk can
be ongoing for any security that does not trade actively or in large volumes,
for any security that trades primarily on smaller markets, and for investments
that typically trade only among a limited number of large investors (such as
certain types of derivatives or restricted securities). In unusual market
conditions, even normally liquid securities may be affected by a degree of
liquidity risk. This may affect only certain securities or an overall
securities market.
PRICING RISK. If market conditions make it difficult to value some investments,
the fund may value these investments using more subjective methods, such as
fair value pricing. In such cases, the value determined for an investment could
be different than the value realized upon such investment's sale. As a result,
you could pay more than the market value when buying fund shares or receive
less than the market value when selling fund shares.
--------------------------------------------------------------------------------
DWS Global Opportunities VIP
PRINCIPAL INVESTMENT STRATEGY
MAIN INVESTMENTS. The fund invests at least 65% of total assets in common
stocks and other equities of small companies throughout the world (companies
with market values similar to the smallest 20% of the S&P Developed Broad
Market Index, formerly the S&P/Citigroup Broad Market Index World). As of
December 31, 2009, companies in which the fund invests typically have market
capitalizations of between $500 million and $5 billion at the time of purchase.
As part of the investment process (and low turnover strategy) the fund may own
stocks even if they are outside this market capitalization range.
The fund may invest up to 35% of total assets in common stocks and other
equities of large companies or in debt securities, including up to 5% of the
fund's net assets may invested in junk bonds (considered to be grade BB/Ba and
25
PROSPECTUS May 1, 2010 Fund Details
below). Compared to investment-grade bonds, junk bonds may pay higher yields,
have higher volatility and a higher risk of default. Other types of equities in
which the fund may invest include preferred stocks or convertible securities.
MANAGEMENT PROCESS. While the fund may invest in securities of any country,
portfolio management generally focuses on countries with developed economies
(including the US). In choosing securities, portfolio management uses a
combination of three analytical disciplines:
BOTTOM-UP RESEARCH. Portfolio management looks for individual companies with a
history of above average growth, strong competitive positioning, attractive
prices relative to potential growth, sound financial strength and effective
management, among other factors.
GROWTH ORIENTATION. Portfolio management generally looks for companies that
they believe have above-average potential for sustainable growth of revenue or
earnings and whose market value appears reasonable in light of their business
prospects.
ANALYSIS OF GLOBAL THEMES. Portfolio management considers global economic
outlooks, seeking to identify industries and companies that are likely to
benefit from social, political and economic changes.
Portfolio management will normally sell a security when it believes the price
is unlikely to go much higher, its fundamentals have deteriorated, other
investments offer better opportunities or in the course of adjusting the fund's
exposure to a given country.
--------------------------------------------------------------------------------
DERIVATIVES. The fund may use various types of derivatives (contracts whose
value is based on, for example, indices, currencies or securities) for hedging,
risk management or non-hedging purposes to seek to enhance potential gains. The
fund may also enter into forward currency exchange contracts and buy and sell
currency options to hedge against currency fluctuations. The fund may use
derivatives as a substitute for direct investment in a particular asset class
or to keep cash on hand to meet shareholder redemptions or other needs. In
particular, the fund may use futures, options and yield curve options, forward
currency exchange contracts and may buy or sell currency options.
SECURITIES LENDING. The fund may lend securities (up to one-third of total
assets) to approved institutions.
--------------------------------------------------------------------------------
MAIN RISKS
There are several risk factors that could hurt the fund's performance, cause
you to lose money or cause the fund's performance to trail that of other
investments.
STOCK MARKET RISK. When stock prices fall, you should expect the value of your
investment to fall as well. Stock prices can be hurt by poor management on the
part of the stock's issuer, shrinking product demand and other business risks.
These may affect single companies as well as groups of companies. In addition,
movements in financial markets may adversely affect a stock's price, regardless
of how well the company performs. To the extent that the fund invests in a
particular geographic region or market sector, performance will be affected by
that region's general performance.
FOREIGN INVESTMENT RISK. To the extent the fund invests in companies based
outside the US, it faces the risks inherent in foreign investing. Adverse
political, economic or social developments could undermine the value of the
fund's investments or prevent the fund from realizing their full value.
Financial reporting standards for companies based in foreign markets differ
from those in the US. Additionally, foreign securities markets generally are
smaller and less liquid than US markets. To the extent that the fund invests in
non-US dollar denominated foreign securities, changes in currency exchange
rates may affect the US dollar value of foreign securities or the income or
gain received on these securities. Foreign governments may restrict investment
by foreigners, limit withdrawal of trading profit or currency from the country,
restrict currency exchange or seize foreign investments. The investments of the
fund may also be subject to foreign withholding taxes. Foreign transactions and
custody of assets may involve delays in payment, delivery or recovery of money
or investments. Foreign investment risks are greater in emerging markets than
in developed markets. Emerging market investments are often considered
speculative. Emerging market countries typically have economic and political
systems that are less developed, and can be expected to be less stable than
developed markets. For example, the economies of such countries can be subject
to rapid and unpredictable rates of inflation or deflation.
SMALL COMPANY RISK. Small company stocks tend to be more volatile than large
company stocks. Small companies are less widely followed by stock analysts and
less information about them is available to investors. Industry-wide reversals
may have a greater impact on small companies, since they lack the financial
resources of larger companies. Small company stocks are typically less liquid
than large company stocks.
PRICING RISK. If market conditions make it difficult to value some investments,
the fund may value these investments using more subjective methods, such as
fair value pricing. In such cases, the value determined for an investment could
be different than the value realized upon such investment's sale. As a result,
you could pay more than the market value when buying fund shares or receive
less than the market value when selling fund shares.
DERIVATIVES RISK. Risks associated with derivatives include the risk that the
derivative is not well correlated with the security, index or currency to which
it relates; the risk that derivatives may result in losses or missed
opportunities; the risk that the fund will be unable to sell the derivative
because of an illiquid secondary market; the risk that a counterparty is
unwilling or unable to meet its obligation; and the risk that the derivative
transaction could expose the fund to the effects of leverage, which could
increase the fund's exposure to the market and magnify potential
26
PROSPECTUS May 1, 2010 Fund Details
losses. There is no guarantee that derivatives, to the extent employed, will
have the intended effect, and their use could cause lower returns or even
losses to the fund. The use of derivatives by the fund to hedge risk may reduce
the opportunity for gain by offsetting the positive effect of favorable price
movements.
SECURITY SELECTION RISK. The securities in the fund's portfolio may decline in
value. Portfolio management could be wrong in its analysis of industries,
companies, economic trends, the relative attractiveness of different securities
or other matters.
SECURITIES LENDING RISK. Any decline in the value of a portfolio security that
occurs while the security is out on loan is borne by the fund, and will
adversely affect performance. Also, there may be delays in recovery of
securities loaned or even a loss of rights in the collateral should the
borrower of the securities fail financially while holding the security.
COUNTERPARTY RISK. A financial institution or other counterparty with whom the
fund does business (such as trading or securities lending), or that
underwrites, distributes or guarantees any investments or contracts that the
fund owns or is otherwise exposed to, may decline in financial health and
become unable to honor its commitments. This could cause losses for the fund or
could delay the return or delivery of collateral or other assets to the fund.
CREDIT RISK. A fund purchasing debt securities faces the risk that the
creditworthiness of an issuer may decline, causing the value of the debt
securities to decline. In addition, an issuer may not be able to make timely
payments on the interest and/or principal on the debt security it has issued.
Because the issuers of high-yield debt securities or junk bonds (debt
securities rated below the fourth highest category) may be in uncertain
financial health, the prices of their debt securities can be more vulnerable to
bad economic news or even the expectation of bad news, than investment-grade
debt securities. In some cases, debt securities, particularly high-yield debt
securities, may decline in credit quality or go into default. Because the fund
may invest in securities not paying current interest or in securities already
in default, these risks may be more pronounced.
GROWTH INVESTING RISK. As a category, growth stocks may underperform value
stocks (and the stock market as a whole) over any period of time. Because the
prices of growth stocks are based largely on the expectation of future
earnings, growth stock prices can decline rapidly and significantly in reaction
to negative news about such factors as earnings, the economy, political
developments, or other news. A growth company may fail to fulfill apparent
promise or may be eclipsed by competitors or its products or services rendered
obsolete by new technologies. Growth stocks also typically lack the dividends
associated with value stocks that might otherwise cushion investors from the
effects of declining stock prices. In addition, growth stocks selected for
investment by portfolio management may not perform as anticipated.
INTEREST RATE RISK. When interest rates rise, prices of debt securities
generally decline. The longer the duration of the fund's debt securities, the
more sensitive it will be to interest rate changes. (As a general rule, a 1%
rise in interest rates means a 1% fall in value for every year of duration.)
PREPAYMENT AND EXTENSION RISK. When interest rates fall, issuers of high
interest debt obligations may pay off the debts earlier than expected
(prepayment risk), and the fund may have to reinvest the proceeds at lower
yields. When interest rates rise, issuers of lower interest debt obligations
may pay off the debts later than expected (extension risk), thus keeping the
fund's assets tied up in lower interest debt obligations. Prepayments could
also create capital gains tax liability in some instances. Any unexpected
behavior in interest rates could increase the volatility of the fund's yield
and could hurt fund performance.
LIQUIDITY RISK. In certain situations, it may be difficult or impossible to
sell an investment in an orderly fashion at an acceptable price. This risk can
be ongoing for any security that does not trade actively or in large volumes,
for any security that trades primarily on smaller markets, and for investments
that typically trade only among a limited number of large investors (such as
certain types of derivatives or restricted securities). In unusual market
conditions, even normally liquid securities may be affected by a degree of
liquidity risk. This may affect only certain securities or an overall
securities market.
--------------------------------------------------------------------------------
DWS International VIP
PRINCIPAL INVESTMENT STRATEGY
MAIN INVESTMENTS. Although the fund can invest in companies of any size and
from any country, it invests mainly in common stocks of established companies
in countries with developed economies (other than the United States). The
fund's equity investments may also include preferred stocks, depositary
receipts and other securities with equity characteristics, such as convertible
securities and warrants.
MANAGEMENT PROCESS. In choosing securities, portfolio management uses a
combination of two analytical disciplines:
BOTTOM-UP RESEARCH. Portfolio management looks for individual companies with a
history of above-average growth, strong competitive positioning, attractive
prices relative to potential growth, sound financial strength and effective
management, among other factors.
27
PROSPECTUS May 1, 2010 Fund Details
TOP-DOWN ANALYSIS. Portfolio management considers the economic outlooks for
various sectors and industries while looking for those that may benefit from
changes in the overall business environment.
Portfolio management will normally sell a security when it believes the price
is unlikely to go much higher, its fundamentals have deteriorated, other
investments offer better opportunities or in the course of adjusting the fund's
exposure to a given country.
--------------------------------------------------------------------------------
DERIVATIVES. The fund may use various types of derivatives (contracts whose
value is based on, for example, indices, currencies or securities) for hedging,
risk management or non-hedging purposes to seek to enhance potential gains. The
fund may use derivatives as a substitute for direct investment in a particular
asset class or to keep cash on hand to meet shareholder redemptions or other
needs.
SECURITIES LENDING. The fund may lend securities (up to one-third of total
assets) to approved institutions.
--------------------------------------------------------------------------------
MAIN RISKS
There are several risk factors that could hurt the fund's performance, cause
you to lose money or cause the fund's performance to trail that of other
investments.
FOREIGN INVESTMENT RISK. To the extent the fund invests in companies based
outside the US, it faces the risks inherent in foreign investing. Adverse
political, economic or social developments could undermine the value of the
fund's investments or prevent the fund from realizing their full value.
Financial reporting standards for companies based in foreign markets differ
from those in the US. Additionally, foreign securities markets generally are
smaller and less liquid than US markets. To the extent that the fund invests in
non-US dollar denominated foreign securities, changes in currency exchange
rates may affect the US dollar value of foreign securities or the income or
gain received on these securities. Foreign governments may restrict investment
by foreigners, limit withdrawal of trading profit or currency from the country,
restrict currency exchange or seize foreign investments. The investments of the
fund may also be subject to foreign withholding taxes. Foreign transactions and
custody of assets may involve delays in payment, delivery or recovery of money
or investments. Foreign investment risks are greater in emerging markets than
in developed markets. Emerging market investments are often considered
speculative. Emerging market countries typically have economic and political
systems that are less developed, and can be expected to be less stable than
developed markets. For example, the economies of such countries can be subject
to rapid and unpredictable rates of inflation or deflation.
STOCK MARKET RISK. When stock prices fall, you should expect the value of your
investment to fall as well. Stock prices can be hurt by poor management on the
part of the stock's issuer, shrinking product demand and other business risks.
These may affect single companies as well as groups of companies. In addition,
movements in financial markets may adversely affect a stock's price, regardless
of how well the company performs. To the extent that the fund invests in a
particular geographic region or market sector, performance will be affected by
that region's general performance.
SECURITY SELECTION RISK. The securities in the fund's portfolio may decline in
value. Portfolio management could be wrong in its analysis of industries,
companies, economic trends, the relative attractiveness of different securities
or other matters.
LIQUIDITY RISK. In certain situations, it may be difficult or impossible to
sell an investment in an orderly fashion at an acceptable price. This risk can
be ongoing for any security that does not trade actively or in large volumes,
for any security that trades primarily on smaller markets, and for investments
that typically trade only among a limited number of large investors (such as
certain types of derivatives or restricted securities). In unusual market
conditions, even normally liquid securities may be affected by a degree of
liquidity risk. This may affect only certain securities or an overall
securities market.
PRICING RISK. If market conditions make it difficult to value some investments,
the fund may value these investments using more subjective methods, such as
fair value pricing. In such cases, the value determined for an investment could
be different than the value realized upon such investment's sale. As a result,
you could pay more than the market value when buying fund shares or receive
less than the market value when selling fund shares.
DERIVATIVES RISK. Risks associated with derivatives include the risk that the
derivative is not well correlated with the security, index or currency to which
it relates; the risk that derivatives may result in losses or missed
opportunities; the risk that the fund will be unable to sell the derivative
because of an illiquid secondary market; the risk that a counterparty is
unwilling or unable to meet its obligation; and the risk that the derivative
transaction could expose the fund to the effects of leverage, which could
increase the fund's exposure to the market and magnify potential losses. There
is no guarantee that derivatives, to the extent employed, will have the
intended effect, and their use could cause lower returns or even losses to the
fund. The use of derivatives by the fund to hedge risk may reduce the
opportunity for gain by offsetting the positive effect of favorable price
movements.
SECURITIES LENDING RISK. Any decline in the value of a portfolio security that
occurs while the security is out on loan is borne by the fund, and will
adversely affect performance. Also, there may be delays in recovery of
securities loaned or even a loss of rights in the collateral should the
borrower of the securities fail financially while holding the security.
28
PROSPECTUS May 1, 2010 Fund Details
COUNTERPARTY RISK. A financial institution or other counterparty with whom the
fund does business (such as trading or securities lending), or that
underwrites, distributes or guarantees any investments or contracts that the
fund owns or is otherwise exposed to, may decline in financial health and
become unable to honor its commitments. This could cause losses for the fund or
could delay the return or delivery of collateral or other assets to the fund.
--------------------------------------------------------------------------------
DWS Health Care VIP
PRINCIPAL INVESTMENT STRATEGY
MAIN INVESTMENTS. Under normal circumstances, the fund will invest at least 80%
of total assets, plus the amount of any borrowing for investment purposes, in
common stock of companies in the health care sector. For purposes of the fund's
80% investment policy, to be considered part of the health care sector,
companies must commit at least half of their assets to, or derive at least half
of the revenues or net income from, that sector. Examples of industries in the
health care sector include pharmaceuticals, biotechnology, medical products and
supplies, and health care services. The fund invests primarily in securities of
US companies, but may invest in foreign companies as well. The fund may invest
in companies of any market capitalization.
MANAGEMENT PROCESS. In choosing stocks, portfolio management uses a combination
of three analytical disciplines:
BOTTOM-UP RESEARCH. Portfolio management looks for individual companies with a
history of above-average growth, strong competitive positioning, new tests or
treatments, the ability to take advantage of demographic trends, attractive
prices relative to potential growth, sound financial strength and effective
management, among other factors.
GROWTH ORIENTATION. Portfolio management generally looks for companies that it
believes have above-average potential for sustainable growth of revenue or
earnings and whose market value appears reasonable in light of their business
prospects.
TOP-DOWN ANALYSIS. Portfolio management considers the economic outlook for
various industries within the health care sector while looking for those that
it believes may benefit from changes in the overall business environment.
Portfolio management may favor securities from different industries and
companies within the health care sector at different times. Portfolio
management will normally sell a stock when it believes the stock's price is
unlikely to go higher, its fundamental factors have changed, other investments
offer better opportunities, or in the course of adjusting their emphasis on a
given health care industry.
--------------------------------------------------------------------------------
DERIVATIVES. The fund may use various types of derivatives (contracts whose
value is based on, for example, indices, currencies or securities) for hedging,
risk management or non-hedging purposes to seek to enhance potential gains. The
fund may use derivatives as a substitute for direct investment in a particular
asset class or to keep cash on hand to meet shareholder redemptions or other
needs.
SECURITIES LENDING. The fund may lend securities (up to one-third of total
assets) to approved institutions.
--------------------------------------------------------------------------------
MAIN RISKS
There are several risk factors that could hurt the fund's performance, cause
you to lose money or cause the fund's performance to trail that of other
investments.
STOCK MARKET RISK. To the extent the fund invests in a particular sector, the
fund's performance may be proportionately affected by that sector's general
performance. When stock prices fall, you should expect the value of your
investment to fall as well. Stock prices can be hurt by poor management on the
part of the stock's issuer, shrinking product demand and other business risks.
These may affect single companies as well as groups of companies. In addition,
movements in financial markets may adversely affect a stock's price, regardless
of how well the company performs. The market as a whole may not favor the types
of investments the fund makes, which could affect the fund's ability to sell
them at an attractive price.
FOREIGN INVESTMENT RISK. To the extent the fund invests in companies based
outside the US, it faces the risks inherent in foreign investing. Adverse
political, economic or social developments could undermine the value of the
fund's investments or prevent the fund from realizing their full value.
Financial reporting standards for companies based in foreign markets differ
from those in the US. Additionally, foreign securities markets generally are
smaller and less liquid than US markets. To the extent that the fund invests in
non-US dollar denominated foreign securities, changes in currency exchange
rates may affect the US dollar value of foreign securities or the income or
gain received on these securities. Foreign governments may restrict investment
by foreigners, limit withdrawal of trading profit or currency from the country,
restrict currency exchange or seize foreign investments. The investments of the
fund may also be subject to foreign withholding taxes. Foreign transactions and
custody of assets may involve delays in payment, delivery or recovery of money
or investments.
GROWTH INVESTING RISK. As a category, growth stocks may underperform value
stocks (and the stock market as a whole) over any period of time. Because the
prices of growth stocks are based largely on the expectation of future
earnings, growth stock prices can decline rapidly and significantly in reaction
to negative news about such factors as earnings, the economy, political
developments, or other news. A growth company may fail to fulfill apparent
promise or may be eclipsed by competitors or its products or services rendered
obsolete by new technologies. Growth stocks also typically lack the dividends
associated with value stocks that might otherwise cushion
29
PROSPECTUS May 1, 2010 Fund Details
investors from the effects of declining stock prices. In addition, growth
stocks selected for investment by portfolio management may not perform as
anticipated.
CONCENTRATION RISK. Any fund that concentrates in a particular segment of the
market will generally be more volatile than a fund that invests more broadly.
Because the fund concentrates its investments in companies in the health care
field, it may be vulnerable to setbacks in that industry. In particular, health
care companies can be affected by rapid product obsolescence and the
unpredictability of winning government approvals.
SECURITY SELECTION RISK. The securities in the fund's portfolio may decline in
value. Portfolio management could be wrong in its analysis of industries,
companies, economic trends, the relative attractiveness of different securities
or other matters.
DERIVATIVES RISK. Risks associated with derivatives include the risk that the
derivative is not well correlated with the security, index or currency to which
it relates; the risk that derivatives may result in losses or missed
opportunities; the risk that the fund will be unable to sell the derivative
because of an illiquid secondary market; the risk that a counterparty is
unwilling or unable to meet its obligation; and the risk that the derivative
transaction could expose the fund to the effects of leverage, which could
increase the fund's exposure to the market and magnify potential losses. There
is no guarantee that derivatives, to the extent employed, will have the
intended effect, and their use could cause lower returns or even losses to the
fund. The use of derivatives by the fund to hedge risk may reduce the
opportunity for gain by offsetting the positive effect of favorable price
movements.
SECURITIES LENDING RISK. Any decline in the value of a portfolio security that
occurs while the security is out on loan is borne by the fund, and will
adversely affect performance. Also, there may be delays in recovery of
securities loaned or even a loss of rights in the collateral should the
borrower of the securities fail financially while holding the security.
SMALL COMPANY RISK. Small company stocks tend to be more volatile than large
company stocks. Small companies are less widely followed by stock analysts and
less information about them is available to investors. Industry-wide reversals
may have a greater impact on small companies, since they lack the financial
resources of larger companies. Small company stocks are typically less liquid
than large company stocks.
COUNTERPARTY RISK. A financial institution or other counterparty with whom the
fund does business (such as trading or securities lending), or that
underwrites, distributes or guarantees any investments or contracts that the
fund owns or is otherwise exposed to, may decline in financial health and
become unable to honor its commitments. This could cause losses for the fund or
could delay the return or delivery of collateral or other assets to the fund.
LIQUIDITY RISK. In certain situations, it may be difficult or impossible to
sell an investment in an orderly fashion at an acceptable price. This risk can
be ongoing for any security that does not trade actively or in large volumes,
for any security that trades primarily on smaller markets, and for investments
that typically trade only among a limited number of large investors (such as
certain types of derivatives or restricted securities). In unusual market
conditions, even normally liquid securities may be affected by a degree of
liquidity risk. This may affect only certain securities or an overall
securities market.
PRICING RISK. If market conditions make it difficult to value some investments,
the fund may value these investments using more subjective methods, such as
fair value pricing. In such cases, the value determined for an investment could
be different than the value realized upon such investment's sale. As a result,
you could pay more than the market value when buying fund shares or receive
less than the market value when selling fund shares.
--------------------------------------------------------------------------------
DWS Equity 500 Index VIP
PRINCIPAL INVESTMENT STRATEGY
MAIN INVESTMENTS. Under normal circumstances, the fund intends to invest at
least 80% of assets, determined at the time of purchase, in stocks of companies
included in the S&P 500( (Reg. TM)) Index and in derivative instruments, such
as futures contracts and options, that provide exposure to the stocks of
companies in the S&P 500( (Reg. TM)) Index. The fund's securities are weighted
to attempt to make the fund's total investment characteristics similar to those
of the S&P 500( (Reg. TM) )Index as a whole. Portfolio management may limit or
avoid exposure to any stock in the S&P 500( (Reg. TM)) Index if it believes the
stock is illiquid or that extraordinary conditions have cast doubt on its
merits. Conversely, portfolio management may gain exposure to a stock not
included in the S&P 500( (Reg. TM) )Index when it believes such exposure is
consistent with the fund's goal (for example, in anticipation of a stock being
added to the S&P 500( (Reg. TM) )Index). The fund may also hold short-term debt
securities and money market instruments for liquidity purposes.
The S&P 500 INDEX is a well-known stock market index that includes common
stocks of 500 companies from several industrial sectors representing a
significant portion of the market value of all stocks publicly traded in the
US. Stocks in the S&P 500 Index are weighted according to their total market
value. The fund is not sponsored, endorsed, sold or promoted by the Standard &
Poor's Division of The McGraw-Hill Companies, Inc. ("S&P").
MANAGEMENT PROCESS. Portfolio management uses quantitative analysis techniques
to structure the fund to obtain a high correlation to the index while seeking
to keep the fund as fully invested as possible in all market environments.
Portfolio management seeks a long-term correlation between fund performance,
before expenses, and the index of 98% or better (perfect correlation being
30
PROSPECTUS May 1, 2010 Fund Details
100%). The fund uses an optimization strategy, buying the largest stocks in the
index in approximately the same proportion they represent in the index, then
investing in a statistically selected sample of the smaller securities found in
the index. This process is intended to produce a portfolio whose industry
weightings, market capitalizations and fundamental characteristics
(price-to-book ratios, price-to-earnings ratios, debt-to-asset ratios and
dividend yields) closely replicate those of the index. This approach attempts
to maximize the fund's liquidity and returns while minimizing its costs.
INDEX INVESTING VERSUS ACTIVE MANAGEMENT. Active management involves portfolio
management buying and selling securities based on research and analysis. Unlike
a fund that is actively managed, an index fund tries to replicate the
performance of a target index by holding either all, or a representative
sample, of the securities in the index.
INFORMATION REGARDING THE S&P 500 INDEX. The fund is not sponsored, endorsed,
sold or promoted by the Standard & Poor's Division of The McGraw-Hill
Companies, Inc. ("S&P"). S&P makes no representation or warranty, express or
implied, to the owners of the fund or any member of the public regarding the
advisability of investing in securities generally or in the fund particularly
or the ability of the S&P 500 Index to track general stock market performance.
S&P's only relationship to the fund is the licensing of certain trademarks and
trade names of S&P and of the S&P 500 Index, which is determined, composed and
calculated by S&P without regard to the fund.
S&P has no obligation to take the needs of the fund or the owners of the fund
into consideration in determining, composing or calculating the S&P 500 Index.
S&P is not responsible for and has not participated in the determination of the
timing, prices, or quantities of the fund to be issued or in the determination
or calculation of the equation by which shares of the fund are redeemable for
cash. S&P has no obligation or liability in connection with the administration,
marketing or trading of the fund.
S&P does not guarantee the accuracy and/or the completeness of the S&P 500
Index or any data included therein and S&P shall have no liability for any
errors, omissions or interruptions therein. S&P makes no warranty, express or
implied, as to results to be obtained by the fund, owners of the fund, or any
other person or entity from the use of the S&P 500 Index or any data included
therein. S&P makes no express or implied warranties, and expressly disclaims
all warranties of merchantability or fitness for a particular purpose or use
with respect to the S&P 500 Index or any data included therein. Without
limiting any of the foregoing, in no event shall S&P have any liability for any
special, punitive, indirect or consequential damages (including lost profits),
even if notified of the possibility of such damages.
--------------------------------------------------------------------------------
DERIVATIVES. The fund may use various types of derivatives (contracts whose
value is based on, for example, indices, currencies or securities) for hedging,
risk management or non-hedging purposes to seek to enhance potential gains. The
fund may use derivatives as a substitute for direct investment in a particular
asset class or to keep cash on hand to meet shareholder redemptions or other
needs.
SECURITIES LENDING. The fund may lend securities (up to one-third of total
assets) to approved institutions.
--------------------------------------------------------------------------------
MAIN RISKS
There are several risk factors that could hurt the fund's performance, cause
you to lose money or cause the fund's performance to trail that of other
investments.
STOCK MARKET RISK. When stock prices fall, you should expect the value of your
investment to fall as well. Stock prices can be hurt by poor management on the
part of the stock's issuer, shrinking product demand and other business risks.
These may affect single companies as well as groups of companies. In addition,
movements in financial markets may adversely affect a stock's price, regardless
of how well the company performs.
INDEXING RISK. An index fund's performance may not exactly replicate the
performance of its target index, for several reasons. For example, the fund
incurs fees, administrative expenses and transaction costs that the index
itself does not. The fund may use sampling techniques (investing in a
representative selection of securities included in the index rather than all
securities in the index), or the composition of its portfolio may diverge from
that of the index. Also, while the exposure of the index to its component
securities is by definition 100%, the fund's effective exposure to index
securities may be greater or lesser than 100%, and may vary over time.
Because an index fund is designed to maintain a high level of exposure to its
target index at all times, it will not take any steps to invest defensively or
otherwise reduce the risk of loss during market downturns.
DERIVATIVES RISK. Risks associated with derivatives include the risk that the
derivative is not well correlated with the security, index or currency to which
it relates; the risk that derivatives may result in losses or missed
opportunities; the risk that the fund will be unable to sell the derivative
because of an illiquid secondary market; the risk that a counterparty is
unwilling or unable to meet its obligation; and the risk that the derivative
transaction could expose the fund to the effects of leverage, which could
increase the fund's exposure to the market and magnify potential losses. There
is no guarantee that derivatives, to the extent employed, will have the
intended effect, and their use could cause lower returns or even losses to the
fund. The use of derivatives by the fund to hedge risk may reduce the
opportunity for gain by offsetting the positive effect of favorable price
movements.
31
PROSPECTUS May 1, 2010 Fund Details
SECURITIES LENDING RISK. Any decline in the value of a portfolio security that
occurs while the security is out on loan is borne by the fund, and will
adversely affect performance. Also, there may be delays in recovery of
securities loaned or even a loss of rights in the collateral should the
borrower of the securities fail financially while holding the security.
COUNTERPARTY RISK. A financial institution or other counterparty with whom the
fund does business (such as trading or securities lending), or that
underwrites, distributes or guarantees any investments or contracts that the
fund owns or is otherwise exposed to, may decline in financial health and
become unable to honor its commitments. This could cause losses for the fund or
could delay the return or delivery of collateral or other assets to the fund.
LIQUIDITY RISK. In certain situations, it may be difficult or impossible to
sell an investment in an orderly fashion at an acceptable price. This risk can
be ongoing for any security that does not trade actively or in large volumes,
for any security that trades primarily on smaller markets, and for investments
that typically trade only among a limited number of large investors (such as
certain types of derivatives or restricted securities). In unusual market
conditions, even normally liquid securities may be affected by a degree of
liquidity risk. This may affect only certain securities or an overall
securities market.
PRICING RISK. If market conditions make it difficult to value some investments,
the fund may value these investments using more subjective methods, such as
fair value pricing. In such cases, the value determined for an investment could
be different than the value realized upon such investment's sale. As a result,
you could pay more than the market value when buying fund shares or receive
less than the market value when selling fund shares.
--------------------------------------------------------------------------------
DWS Small Cap Index VIP
PRINCIPAL INVESTMENT STRATEGY
MAIN INVESTMENTS. Under normal circumstances, the fund invests at least 80% of
its assets, determined at the time of purchase, in stocks of companies included
in the Russell 2000 Index (Reg. TM) and in derivative instruments, such as
stock index futures contracts and options that provide exposure to the stocks
of companies in the index. The fund's securities are weighted to attempt to
make the fund's total investment characteristics similar to those of the index
as a whole. Portfolio management may limit or avoid exposure to any stock in
the index if it believes the stock is illiquid or that extraordinary conditions
have cast doubt on its merits. Conversely, portfolio management may gain
exposure to a stock not included in the index when it believes such exposure is
consistent with the fund's goal (for example, in anticipation of a stock being
added to the index). The fund may also hold short-term debt securities and
money market instruments for liquidity purposes.
The RUSSELL 2000 INDEX( (Reg. TM))( )is a well-known stock market index that
measures the performance of the 2,000 smallest companies in the Russell 3000(
(Reg. TM)) Index, which represent approximately 8% of the market capitalization
of the Russell 3000( (Reg. TM)) Index. Stocks in the Russell 2000 Index( (Reg.
TM) )are weighted according to their total market value.
MANAGEMENT PROCESS. Portfolio management uses quantitative analysis techniques
to structure the fund to obtain a high correlation to the index while seeking
to keep the fund as fully invested as possible in all market environments.
Portfolio management seeks a long-term correlation between fund performance,
before expenses, and the index of 98% or better (perfect correlation being
100%). The fund uses an optimization strategy, buying the largest stocks in the
index in approximately the same proportion they represent in the index, then
investing in a statistically selected sample of the smaller securities found in
the index. This process is intended to produce a portfolio whose industry
weightings, market capitalizations and fundamental characteristics
(price-to-book ratios, price-to-earnings ratios, debt-to-asset ratios and
dividend yields) closely replicate those of the index. This approach attempts
to maximize the fund's liquidity and returns while minimizing its costs.
INDEX INVESTING VERSUS ACTIVE MANAGEMENT. Active management involves portfolio
management buying and selling securities based on research and analysis. Unlike
a fund that is actively managed, an index fund tries to replicate the
performance of a target index by holding either all, or a representative
sample, of the securities in the index.
--------------------------------------------------------------------------------
DERIVATIVES. The fund may use various types of derivatives (contracts whose
value is based on, for example, indices, currencies or securities) for hedging,
risk management or non-hedging purposes to seek to enhance potential gains. The
fund may use derivatives as a substitute for direct investment in a particular
asset class or to keep cash on hand to meet shareholder redemptions or other
needs.
SECURITIES LENDING. The fund may lend securities (up to one-third of total
assets) to approved institutions.
--------------------------------------------------------------------------------
MAIN RISKS
There are several risk factors that could hurt the fund's performance, cause
you to lose money or cause the fund's performance to trail that of other
investments.
STOCK MARKET RISK. When stock prices fall, you should expect the value of your
investment to fall as well. Stock prices can be hurt by poor management on the
part of the stock's issuer, shrinking product demand and other business risks.
These may affect single companies as well as groups of companies. In addition,
movements in financial markets may adversely affect a stock's price, regardless
of how well the company performs.
32
PROSPECTUS May 1, 2010 Fund Details
INDEXING RISK. An index fund's performance may not exactly replicate the
performance of its target index, for several reasons. For example, the fund
incurs fees, administrative expenses and transaction costs that the index
itself does not. The fund may use sampling techniques (investing in a
representative selection of securities included in the index rather than all
securities in the index), or the composition of its portfolio may diverge from
that of the index. Also, while the exposure of the index to its component
securities is by definition 100%, the fund's effective exposure to index
securities may be greater or lesser than 100%, and may vary over time.
Because an index fund is designed to maintain a high level of exposure to its
target index at all times, it will not take any steps to invest defensively or
otherwise reduce the risk of loss during market downturns.
SMALL COMPANY RISK. Small company stocks tend to be more volatile than large
company stocks. Small companies are less widely followed by stock analysts and
less information about them is available to investors. Industry-wide reversals
may have a greater impact on small companies, since they lack the financial
resources of larger companies. Small company stocks are typically less liquid
than large company stocks.
DERIVATIVES RISK. Risks associated with derivatives include the risk that the
derivative is not well correlated with the security, index or currency to which
it relates; the risk that derivatives may result in losses or missed
opportunities; the risk that the fund will be unable to sell the derivative
because of an illiquid secondary market; the risk that a counterparty is
unwilling or unable to meet its obligation; and the risk that the derivative
transaction could expose the fund to the effects of leverage, which could
increase the fund's exposure to the market and magnify potential losses. There
is no guarantee that derivatives, to the extent employed, will have the
intended effect, and their use could cause lower returns or even losses to the
fund. The use of derivatives by the fund to hedge risk may reduce the
opportunity for gain by offsetting the positive effect of favorable price
movements.
SECURITIES LENDING RISK. Any decline in the value of a portfolio security that
occurs while the security is out on loan is borne by the fund, and will
adversely affect performance. Also, there may be delays in recovery of
securities loaned or even a loss of rights in the collateral should the
borrower of the securities fail financially while holding the security.
COUNTERPARTY RISK. A financial institution or other counterparty with whom the
fund does business (such as trading or securities lending), or that
underwrites, distributes or guarantees any investments or contracts that the
fund owns or is otherwise exposed to, may decline in financial health and
become unable to honor its commitments. This could cause losses for the fund or
could delay the return or delivery of collateral or other assets to the fund.
LIQUIDITY RISK. In certain situations, it may be difficult or impossible to
sell an investment in an orderly fashion at an acceptable price. This risk can
be ongoing for any security that does not trade actively or in large volumes,
for any security that trades primarily on smaller markets, and for investments
that typically trade only among a limited number of large investors (such as
certain types of derivatives or restricted securities). In unusual market
conditions, even normally liquid securities may be affected by a degree of
liquidity risk. This may affect only certain securities or an overall
securities market.
PRICING RISK. If market conditions make it difficult to value some investments,
the fund may value these investments using more subjective methods, such as
fair value pricing. In such cases, the value determined for an investment could
be different than the value realized upon such investment's sale. As a result,
you could pay more than the market value when buying fund shares or receive
less than the market value when selling fund shares.
OTHER POLICIES AND RISKS
While the previous pages describe the main points of each fund's strategy and
risks, there are a few other matters to know about:
o Although major changes tend to be infrequent, each fund's Board could change
a fund's investment objective without seeking shareholder approval.
However, the Board of DWS Health Care VIP, DWS Equity 500 Index VIP and DWS
Small Cap Index VIP will provide shareholders with at least 60 days notice
prior to making any changes to the fund's 80% investment policy as
described herein.
o The following is applicable to all funds except DWS Equity 500 Index VIP and
DWS Small Cap Index VIP. When in the Advisor's opinion it is advisable to
adopt a temporary defensive position because of unusual and adverse or
other market conditions, up to 100% of each fund's assets may be held in
cash or invested in money market securities or other short-term
investments. Short-term investments consist of (1) foreign and domestic
obligations of sovereign governments and their agencies and
instrumentalities, authorities and political subdivisions; (2) other
short-term rated debt securities or, if unrated, determined to be of
comparable quality in the opinion of the Advisor; (3) commercial paper; (4)
bank obligations, including negotiable certificates of deposit, time
deposits and bankers' acceptances; and (5) repurchase agreements.
Short-term investments may also include shares of money market mutual
funds. This could prevent losses, but, while engaged in a temporary
defensive position, a fund will not be pursuing its investment objective.
However, portfolio management may choose not to use these strategies for
various reasons, even in volatile market conditions.
33
PROSPECTUS May 1, 2010 Fund Details
o Portfolio management measures credit quality at the time it buys securities,
using independent rating agencies or, for unrated securities, its own
judgment. All securities must meet the credit quality standards applied by
portfolio management at the time they are purchased. If a security's credit
quality changes, portfolio management will decide what to do with the
security, based on its assessment of what would most benefit a fund.
o Certain DWS fund-of-funds are permitted to invest in other DWS funds. As a
result, a fund may have large inflows or outflows of cash from time to
time. This could have adverse effects on a fund's performance if a fund
were required to sell securities or invest cash at times when it otherwise
would not do so. This activity could also accelerate the realization of
capital gains and increase a fund's transaction costs.
FOR MORE INFORMATION
This prospectus doesn't tell you about every policy or risk of investing in
each fund.
If you want more information on each fund's allowable securities and investment
practices and the characteristics and risks of each one, you may want to
request a copy of the Statement of Additional Information (the back cover tells
you how to do this).
Keep in mind that there is no assurance that a fund will achieve its investment
objective.
A complete list of each fund's portfolio holdings as of the month-end is posted
on www.dws-investments.com on or about the 15th day of the following month.
More frequent posting of portfolio holdings information may be made from time
to time on www.dws-investments.com. The posted portfolio holdings information
is available by fund and generally remains accessible at least until the date
on which a fund files its Form N-CSR or N-Q with the Securities and Exchange
Commission for the period that includes the date as of which the posted
information is current. Each fund's Statement of Additional Information
includes a description of a fund's policies and procedures with respect to the
disclosure of a fund's portfolio holdings.
WHO MANAGES AND OVERSEES THE FUNDS
THE INVESTMENT ADVISOR
Deutsche Investment Management Americas Inc. ("DIMA" or the "Advisor"), with
headquarters at 345 Park Avenue, New York, NY 10154, is the investment advisor
for each fund. Under the oversight of the Board, the Advisor, or a subadvisor,
makes investment decisions, buys and sells securities for each fund and
conducts research that leads to these purchase and sale decisions. The Advisor
provides a full range of global investment advisory services to institutional
and retail clients.
DWS Investments is part of the Asset Management division of Deutsche Bank AG
and, within the US, represents the retail asset management activities of
Deutsche Bank AG, Deutsche Bank Trust Company Americas, DIMA and DWS Trust
Company.
Deutsche Asset Management is a global asset management organization that offers
a wide range of investing expertise and resources, including hundreds of
portfolio managers and analysts and an office network that reaches the world's
major investment centers. This well-resourced global investment platform brings
together a wide variety of experience and investment insight across industries,
regions, asset classes and investing styles.
The Advisor is an indirect, wholly owned subsidiary of Deutsche Bank AG.
Deutsche Bank AG is a major global banking institution that is engaged in a
wide range of financial services, including investment management, mutual
funds, retail, private and commercial banking, investment banking and
insurance.
MANAGEMENT FEE. The Advisor receives a management fee from each fund. Below is
the management rate paid by each fund for the most recent fiscal year, as a
percentage of each fund's average daily net assets:
FUND NAME FEE PAID
----------------------------- -----------
DWS Bond VIP 0.39%
----------------------------- ----
DWS Growth & Income VIP 0.30%*
----------------------------- -----
DWS Capital Growth VIP 0.35%*
----------------------------- -----
DWS Global Opportunities VIP 0.77%*
------------------------------ -----
DWS International VIP 0.79%
------------------------------ -----
DWS Health Care VIP 0.67%
------------------------------ -----
DWS Equity 500 Index VIP 0.18%*
------------------------------ -----
DWS Small Cap Index VIP 0.29%*
------------------------------ -----
* Reflecting the effect of expense limitations and/or fee waivers then in
effect.
For DWS Global Opportunities VIP, the Advisor has contractually agreed through
September 30, 2010 to waive and/or reimburse fund expenses to the extent
necessary to maintain the fund's total annual operating expenses at 1.46% for
Class B. The agreement may only be terminated with the consent of the fund's
Board and does not extend to extraordinary expenses, taxes, brokerage and
interest expense.
For DWS Small Cap Index VIP, the Advisor has contractually agreed through
September 30, 2010 to waive and/or reimburse fund expenses to the extent
necessary to maintain the fund's total annual operating expenses at 0.93% for
Class B. The agreement may only be terminated with the consent of the fund's
Board and does not extend to extraordinary expenses, taxes, brokerage and
interest expense.
A discussion regarding the basis for the Board renewal of each fund's
investment management agreement and, as applicable, subadvisory agreement, and
sub-subadvisory
34
PROSPECTUS May 1, 2010 Fund Details
agreement is contained in the shareholder report for the annual period ended
December 31 (see "Shareholder reports" on the back cover).
Under a separate administrative services agreement between each fund and the
Advisor, each fund pays the Advisor a fee of 0.10% for providing most of each
fund's administrative services.
FOR DWS GROWTH & INCOME VIP
On January 26, 2010, the Advisor announced its intention to transition members
of the portfolio management team for DWS Growth & Income VIP who are part of
its Quantitative Strategies Group out of the Advisor into a separate
independent investment advisory firm that is not affiliated with the Advisor,
known as QS Investors Holdings, LLC ("QS Investors"). In order for DWS Growth &
Income VIP to continue to benefit from the investment expertise offered by the
affected portfolio managers, the Advisor has recommended to the Board the
approval of a sub-advisory agreement between the Advisor and the newly created
investment advisory firm (the "Sub-Advisory Agreement"). The Sub-Advisory
Agreement is subject to Board approval. If the Board approves the Sub-Advisory
Agreement, it is expected that QS Investors will become the Subadvisor for DWS
Growth & Income VIP.
QS Investors, 880 Third Avenue, New York, NY 10022, is an investment advisor
registered under the Investment Advisers Act of 1940, as amended. Under the
oversight of the Advisor and the Board, QS Investors would provide global
expertise in research, portfolio management and quantitative analysis. QS
Investors manages assets across multiple strategies, including: Global Tactical
Asset Allocation & Active Currency (iGAP), US Active Quantitative Equity (AQE),
International and Global Equity (Diversification Based Investing/DBI) and
Multi-Asset/Strategic Asset Allocation (SAA). QS Investors would make
investment decisions, buy and sell securities for DWS Growth & Income VIP and
would conduct research that leads to these purchase and sale decisions. The
Advisor would compensate QS Investors out of the management fee it receives
from DWS Growth & Income VIP.
SUBADVISOR FOR DWS EQUITY 500 INDEX VIP AND DWS SMALL CAP INDEX VIP
Northern Trust Investments, N.A. ("NTI"), the subadvisor for DWS Equity 500
Index VIP and DWS Small Cap Index VIP, is located at 50 South LaSalle Street,
Chicago, IL 60603. NTI is a national banking association and an investment
adviser registered under the Investment Advisers Act of 1940, as amended. It
primarily manages assets for institutional and individual separately managed
accounts, investment companies and bank common and collective funds. NTI is a
subsidiary of The Northern Trust Company ("TNTC"). TNTC is an Illinois state
chartered banking organization and a member of the Federal Reserve System.
Formed in 1889, TNTC administers and manages assets for individuals, personal
trusts, defined contribution and benefit plans and other institutional and
corporate clients. TNTC is the principal subsidiary of Northern Trust
Corporation, a company that is regulated by the Board of Governors of the
Federal Reserve System as a financial holding company under the U.S. Bank
Holding Company Act of 1956, as amended. Northern Trust Corporation, through
its subsidiaries, has for more than 100 years managed the assets of
individuals, institutions and corporations. As of December 31, 2009, NTI and
its affiliates had assets under custody of $3.7 trillion, and assets under
investment management of $627.2 billion.
MULTI-MANAGER STRUCTURE. The Advisor, subject to the approval of the Board, has
ultimate responsibility to recommend the hiring, termination and replacement of
subadvisors. Each fund and the Advisor have received an order from the SEC that
allows each fund and the Advisor to utilize a multi-manager structure in
managing each fund's assets. Pursuant to the SEC order, the Advisor, with the
approval of each fund's Board, is permitted to select subadvisors that are not
affiliates of the Advisor ("non-affiliated subadvisors") to manage all or a
portion of each fund's assets without obtaining shareholder approval. The
Advisor also has the discretion to terminate any subadvisor and allocate and
reallocate each fund's assets among any non-affiliated subadvisors. The SEC
order also permits the Advisor, subject to the approval of the Board, to
materially amend an existing subadvisory agreement with a non-affiliated
subadvisor without shareholder approval. Each fund and the Advisor are subject
to the conditions imposed by the SEC order, including the condition that within
90 days of hiring of a new non-affiliated subadvisor, each fund will provide
shareholders with an information statement containing information about the new
non-affiliated subadvisor.
Each fund and the Advisor have also filed an exemptive application with the SEC
requesting an order that would extend the relief granted with respect to
non-affiliated subadvisors to certain subadvisors that are affiliates of the
Advisor ("affiliated subadvisors"). If such relief is granted by the SEC, the
Advisor, with the approval of each fund's Board, would be able to hire
non-affiliated and/or affiliated subadvisors to manage all or a portion of each
fund's assets without obtaining shareholder approval. The Advisor would also
have the discretion to terminate any subadvisor and allocate and reallocate
each fund's assets among any other subadvisors (including terminating a
non-affiliated subadvisor and replacing them with an affiliated subadvisor).
The Advisor, subject to the approval of the Board, would also be able to
materially amend an existing subadvisory agreement with any such subadvisor
without shareholder approval. There can be no assurance that such relief will
be granted by the SEC. Each fund and the Advisor will be subject to any new
conditions imposed by the SEC.
35
PROSPECTUS May 1, 2010 Fund Details
MANAGEMENT
DWS BOND VIP
KENNETH R. BOWLING, CFA, MANAGING DIRECTOR. Portfolio Manager of the fund.
Joined the fund in 2008.
o Joined Deutsche Asset Management in 2007 after 14 years of experience at
INVESCO where he was most recently director of US Fixed Income.
o Head of Institutional Fixed Income Investments, Americas: Louisville.
o BS and MEng from University of Louisville.
JAMIE GUENTHER, CFA, MANAGING DIRECTOR. Portfolio Manager of the fund. Joined
the fund in 2008.
o Joined Deutsche Asset Management in 2007 after 25 years of experience, most
recently as head of Credit Research and CDO/CSO Credit for INVESCO. Prior
to that he was head of financial institution investment research at Duff &
Phelps Investment Research. Before that he was a global security analyst
for Alexander & Alexander. He began his career in 1982 at Touche Ross
Financial Consulting.
o Head of Institutional Credit: Louisville.
o BBA from Western Michigan University.
JOHN BRENNAN, DIRECTOR. Portfolio Manager of the fund. Joined the fund in 2008.
o Joined Deutsche Asset Management and the fund in 2007 after 14 years of
experience at INVESCO and Freddie Mac. Previously, was head of Structured
Securities sector team at INVESCO and before that was senior fixed income
portfolio manager at Freddie Mac specializing in MBS, CMBS, collateralized
mortgage obligations, ARMS, mortgage derivatives, US Treasuries and agency
debt.
o Portfolio Manager for Structured Finance: Louisville.
o BS, University of Maryland; MBA William & Mary.
BRUCE HARLEY, CFA, CEBS, DIRECTOR. Portfolio Manager of the fund. Joined the
fund in 2008.
o Joined Deutsche Asset Management in March 2007 after 18 years of experience
at INVESCO where he was head of Governments and Derivatives, responsible
for positioning for US duration and term structure; Government and futures
trading.
o Portfolio and Sector Manager for Institutional Fixed Income: Louisville.
o BS in Economics from University of Louisville.
J. RICHARD ROBBEN, CFA, DIRECTOR. Portfolio Manager of the fund. Joined the
fund in 2008.
o Joined Deutsche Asset Management and the fund in 2007 after 11 years of
experience at INVESCO Institutional, most recently as senior portfolio
manager for LIBOR-related strategies and head of portfolio construction
group for North American Fixed Income.
o Portfolio Manager for Institutional Fixed Income: Louisville.
o BA, Bellarmine University.
DAVID VIGNOLO, CFA, VICE PRESIDENT. Portfolio Manager of the fund. Joined the
fund in 2008.
o Joined Deutsche Asset Management in March 2007 after 20 years of experience
that included head of corporate bond trading and portfolio manager for
INVESCO and Conning Asset Management Co., and corporate bond trader and
portfolio manager for ANB Investment Management Co.
o Portfolio and Sector Manager for Institutional Fixed Income: Louisville.
o BS from Indiana University; MBA from Case Western Reserve University.
J. KEVIN HORSLEY, CFA, CPA, DIRECTOR. Portfolio Manager of the fund. Joined the
fund in 2008.
o Joined Deutsche Asset Management in March 2007 after 13 years of experience,
of which 11 were at INVESCO as senior analyst for a variety of credit
sectors. He also has experience in the structured securities market
(asset-backed and commercial mortgage-backed securities), and in research
coverage of foreign exchange markets, corporate finance, market planning in
the telecom sector, and in public accounting.
o Credit Analyst for Institutional Fixed Income: Louisville.
o BA from Transylvania University; MBA from Owen Graduate School of
Management, Vanderbilt University.
STEPHEN WILLER, CFA, VICE PRESIDENT. Portfolio Manager of the fund. Joined the
fund in 2008.
o Joined Deutsche Asset Management in March 2007 after 13 years of experience,
11 of which were at AMVESCAP, INVESCO Institutional, where he was CDO
portfolio manager responsible for structuring, pricing and managing
corporate credit CSOs, developing CDS based trading strategies and
vehicles, and Alpha decisions for CDS index trading. He started his career
as a financial analyst at Providian Capital Management.
o Portfolio manager for Institutional Fixed Income: Louisville.
o BS in Finance/Economics from the University of Richmond.
DWS GROWTH & INCOME VIP
ROBERT WANG, MANAGING DIRECTOR. Portfolio Manager of the fund. Joined the fund
in 2007.
o Joined Deutsche Asset Management in 1995 as portfolio manager for asset
allocation after 13 years of experience of trading fixed income, foreign
exchange and derivative products at J.P. Morgan.
o Global Head of Quantitative Strategies Portfolio Management: New York.
o BS, The Wharton School, University of Pennsylvania.
RUSSELL SHTERN, CFA, VICE PRESIDENT. Portfolio Manager of the fund. Joined the
fund in 2010.
o Joined Deutsche Asset Management in 1999, previously serving as trader's
assistant supporting program, options and equity swaps trading desks.
36
PROSPECTUS May 1, 2010 Fund Details
o Portfolio manager for GrOWE and Tax Managed Equity: New York.
o BBA, Pace University.
DWS CAPITAL GROWTH VIP
OWEN FITZPATRICK, CFA, MANAGING DIRECTOR. Lead Manager of the fund. Joined the
fund in 2009.
o Joined Deutsche Asset Management in 2009.
o Prior to joining Deutsche Asset Management, he was Managing Director of
Deutsche Bank Private Wealth Management and served as head of U.S. Equity
Strategy and manager of the U.S. large cap core, value and growth
portfolios and member of the U.S. Investment Committee and head of the
Equity Strategy Group.
o Previous experience includes over 21 years of experience in trust and
investment management. Prior to joining Deutsche Bank in 1995, managed an
equity income fund, trust and advisory relationships for Princeton Bank &
Trust Company, where he was also responsible for research coverage of the
consumer cyclical sector. Previously served as a portfolio manager at
Manufacturer's Hanover Trust Company.
o BA and MBA, Fordham University.
THOMAS M. HYNES, JR., CFA, DIRECTOR. Portfolio Manager of the fund. Joined the
fund in 2009.
o Joined Deutsche Asset Management in 1995, served in DB Private Wealth
Management from 1995-2004; served as US equity portfolio manager at
Citigroup Asset Management from 2004-2007; rejoined Deutsche Asset
Management in 2007.
o Portfolio manager for US Large Cap Equity: New York.
o BS, Fordham University.
BRENDAN O'NEILL, CFA, DIRECTOR. Portfolio Manager of the fund. Joined the fund
in 2009.
o Joined Deutsche Asset Management in 2000.
o Equity Research Analyst covering the financial services sector since 2001.
o Previously served as a member of the Large Cap Core Equity team.
o BA, Queens College, CUNY; MS, Zicklin School of Business, Baruch College.
DWS GLOBAL OPPORTUNITIES VIP
JOSEPH AXTELL, CFA, MANAGING DIRECTOR. Portfolio Manager of the fund. Joined
the fund in 2002.
o Joined Deutsche Asset Management in 2001.
o Senior analyst at Merrill Lynch Investment Managers for the international
equity portion of a global balanced portfolio (1996-2001).
o Director, International Research at PCM International (1989-1996).
o Associate manager, structured debt and equity group at Prudential Capital
Corporation (1988-1989).
o Analyst at Prudential-Bache Capital Funding in London (1987-1988).
o Equity analyst in the health care sector at Prudential Equity Management
Associates (1985-1987).
o BS, Carlson School of Management, University of Minnesota.
DWS INTERNATIONAL VIP
NIKOLAUS POEHLMANN, CFA, DIRECTOR. Lead Portfolio Manager of the fund. Joined
the fund in 2009.
o Senior portfolio manager for Equities, responsible for European dividend
strategies, Italian equities and global financials strategies.
o Joined the Company in July 1998 in Loan Portfolio Management for Corporate
and Investment Bank (CIB) division.
o Managing European diversified funds since 2003, financials funds since 2001,
and Italian equity funds since 2002.
o BA from Augsburg University; Master's degree in Economics ("Diplom
Volkswirt") from University of Cologne.
UDO ROSENDAHL, MANAGING DIRECTOR. Portfolio Manager of the fund. Joined the
fund in 2009.
o Head of European Large Caps: Frankfurt.
o Joined the Company in August 1984 in the credit research department of
Deutsche Bank, Paderborn; 1986 moved to the asset management department for
high net worth clients of Deutsche Bank in Bremen and Hamburg; 1989 moved
to the asset management division in Frankfurt to manage various European
country funds; 1995 became senior fund manager; July 2002 appointed head of
Europe Large Caps.
o Bank training program Deutsche Bank AG, Paderborn.
MARK SCHUMANN, VICE PRESIDENT. Portfolio Manager of the fund. Joined the fund
in 2009.
o Joined Deutsche Asset Management in 2003.
o Portfolio Manager for European Large Cap Equity: Frankfurt.
o Masters (Lic oec) from University of St. Gallen (HSG).
ANDREAS WENDELKEN, DIRECTOR. Portfolio Manager of the fund. Joined the fund in
2009.
o Joined Deutsche Asset Management in 2001; previously has worked for 2 years
as a relationship manager for Southeastern Europe at Deutsche Bank's Global
Corporates and Institutions division.
o Portfolio manager for emerging markets equity: Frankfurt.
o Master's degree in business administration from Frankfurt School of Finance
& Management (previously HfB), Frankfurt; completed bank training program
(Bankkaufmann) at Bremer Landesbank, Bremen.
DWS HEALTH CARE VIP
LEEFIN LAI, CFA, MANAGING DIRECTOR. Lead Portfolio Manager of the fund. Joined
the fund in 2001.
o Joined Deutsche Asset Management in 2001.
o Previously served as an analyst for Salomon Smith Barney and PaineWebber and
as Vice President/Analyst for Citigroup Global Asset Management and Scudder
Kemper Investments.
37
PROSPECTUS May 1, 2010 Fund Details
o Over 16 years of investment industry experience.
o MBA, University of Illinois.
THOMAS E. BUCHER, CFA, MANAGING DIRECTOR. Deutsche Asset Management. Consultant
to the Advisor since 2002.
o Joined Deutsche Asset Management in 1995.
o Head of global equity research team forHealth Care sector and portfolio
managerfor European Equity: Frankfurt.
o Previously served as analyst for European Chemical, Oil, Steel and
Engineering sectors and analyst/portfolio manager for Eastern European
equity.
o MA, University of Tuebingen, Germany.
DWS EQUITY 500 INDEX VIP
BRENT REEDER. Senior Vice President of Northern Trust Investments, N.A.
Portfolio Manager of the fund. Joined the fund in 2007.
o Joined Northern Trust Investments, N.A. in 1993; for the past eight years,
he has managed quantitative equity portfolios.
DWS SMALL CAP INDEX VIP
BRENT REEDER. Senior Vice President of Northern Trust Investments, N.A.
Portfolio Manager of the fund. Joined the fund in 2007.
o Joined Northern Trust Investments, N.A. in 1993; for the past eight years,
he has managed quantitative equity portfolios.
Each fund's Statement of Additional Information provides additional information
about a portfolio manager's investments in each fund, a description of the
portfolio management compensation structure and information regarding other
accounts managed.
38
PROSPECTUS May 1, 2010 Fund Details
INVESTING IN THE FUNDS
YOUR INVESTMENT IN THE FUNDS
The information in this section may affect anyone who selects one or more funds
as an investment option in a variable annuity contract or variable life
insurance policy that offers one or more funds. These contracts and policies
are described in separate prospectuses issued by participating insurance
companies. Each fund assumes no responsibility for such prospectuses.
POLICIES ABOUT TRANSACTIONS
The information in this prospectus applies to Class B shares of each fund and
for DWS Equity 500 VIP only, Class B2 shares. Each fund may offer two classes
of shares(except DWS Equity 500 Index VIP, which offers three classes of
shares). Class B and Class B2 shares are offered at net asset value and are
subject to 12b-1 fees.
Technically, the shareholders of DWS Variable Series I and DWS Investments VIT
Funds (which include each fund just described) are the participating insurance
companies (the "insurance companies") that offer each fund as choices for
holders of certain variable annuity contracts or variable life insurance
policies (the "contract(s)") issued or sponsored by the insurance companies.
The insurance companies may pass through voting rights to the contract owners.
Each fund does not sell shares directly to the public. Each fund sells shares
only to separate accounts of insurance companies. As a contract owner, your
premium payments are allocated to a fund by the insurance companies in
accordance with your contract. Please see the contract prospectus that
accompanies this prospectus for a detailed explanation of your contract.
Depending on context in the prospectus, the terms "you" and "yours" refer to
either a contract owner or to the insurance company that issues the contract.
References to "buying," "purchasing" or "holding" fund shares refer only to the
insurance company, not the contract owner.
Please bear in mind that there are important differences between DWS retail
funds available to any investor (a "Retail Fund") and those that are only
available through certain financial institutions, such as insurance companies.
For example, Retail Funds, unlike a fund, are not sold to insurance company
separate accounts to fund investments in variable insurance contracts. In
addition, the investment objective, policies and strategies of a fund, while
similar to those of a Retail Fund, are not identical. Retail Funds may be
smaller or larger than a fund and have different expense ratios than a fund. As
a result, the performance of a fund and a Retail Fund will differ.
Should any conflict between contract owners arise that would require that a
substantial amount of net assets be withdrawn from a fund, orderly portfolio
management could be disrupted to the potential detriment of shareholders of
that fund.
Each fund has a verification process for new insurance company accounts to help
the government fight the funding of terrorism and money laundering activities.
Federal law requires all financial institutions to obtain, verify and record
information that identifies each insurance company that opens an account. This
means that when an insurance company opens an account, a fund will ask for its
name, address and other information that will allow a fund to identify the
company. This information will be verified to ensure the identity of all
insurance companies opening an account.
For certain insurance companies, a fund might request additional information
(for instance, a fund would ask for documents such as the insurance company's
articles of incorporation) to help a fund verify the insurance company's
identity.
Each fund will not complete the purchase of any shares for an account until all
information has been provided and the application has been submitted in "good
order." Once the application is determined to be in good order, the purchase(s)
will be effected at the net asset value per share next calculated.
Each fund may reject a new account application if the insurance company doesn't
provide any required or requested identifying information, or for other
reasons.
BUYING AND SELLING SHARES
Each FUND IS OPEN FOR BUSINESS each day the New York Stock Exchange is open.
Each fund calculates its share price every business day, as of the close of
regular trading on the New York Stock Exchange (typically 4 p.m. Eastern time,
but sometimes earlier, as in the case of scheduled half-day trading or
unscheduled suspensions of trading).
39
PROSPECTUS May 1, 2010 Investing in the Funds
Each fund continuously sells shares to each insurance company separate account,
without a sales charge, at the net asset value per share next determined after
a proper purchase order is placed by the insurance company. The insurance
company offers contract owners units in its separate accounts which correspond
to shares in a fund. Each insurance company submits purchase and redemption
orders to a fund based on allocation instructions for premium payments,
transfer instructions and surrender or partial withdrawal requests for contract
owners, as set forth in the accompanying prospectus for the contracts. These
orders reflect the amount of premium payments to be invested, surrender and
transfer requests, and other matters. Redemption orders are effected at the
next net asset value per share determined after a proper redemption order is
placed by the insurance company. Contract owners should look at their contract
prospectuses for redemption procedures and fees.
IMPORTANT INFORMATION ABOUT BUYING AND SELLING SHARES
o After receiving a contract owner's order, the insurance company buys or
sells shares at the net asset value next calculated on any day each fund is
open for business.
o Unless otherwise instructed, each fund normally makes payment of the
proceeds from the sale of shares the next business day but always within
seven calendar days.
o Each fund does not issue share certificates.
o Each fund reserves the right to reject purchases of shares for any reason.
o Each fund reserves the right to withdraw or suspend the offering of shares
at any time.
o Each fund reserves the right to reject purchases of shares or to suspend or
postpone redemptions at times when the New York Stock Exchange is closed
(other than customary closings), trading is restricted or when an emergency
exists that prevents a fund from disposing of its portfolio securities or
pricing its shares.
o Each fund may refuse, cancel or rescind any purchase order; freeze any
account (meaning the insurance company will not be able to purchase shares
in its account); suspend account services; and/or involuntarily redeem the
account if we think that the account is being used for fraudulent or
illegal purposes by the insurance company; one or more of these actions
will be taken when, at the sole discretion of each fund, they are deemed to
be in each fund's best interests or when each fund is requested or
compelled to do so by governmental authority or by applicable law.
o Each fund may close and liquidate an account if a fund is unable to verify
provided information, or for other reasons; if a fund decides to close the
account, the shares will be redeemed at the net asset value per share next
calculated after we determine to close the account; the insurance company
may be subject to gain or loss on the redemption of the fund shares and may
incur tax liability.
o Each fund may pay for shares sold by "redeeming in kind," that is, by
distributing to you marketable securities (which typically will involve
brokerage costs for you to liquidate) rather than cash, but which will be
taxable to the same extent as a redemption for cash; each fund generally
won't make a redemption in kind unless your requests over a 90-day period
total more than $250,000 or 1% of the value of each fund's net assets,
whichever is less.
o A purchase order from an insurance company separate account may not be
accepted if the sale of fund shares has been suspended or if it is
determined that the purchase would be detrimental to the interests of a
fund.
MARKET TIMING POLICIES AND PROCEDURES. Short-term and excessive trading of fund
shares may present risks to each fund's long-term shareholders (as used herein,
the term "shareholders" may refer to the contract owners), including potential
dilution in the value of fund shares, interference with the efficient
management of a fund (including losses on the sale of investments), realized
gains to remaining shareholders and increased brokerage and administrative
costs. These risks may be more pronounced if a fund invests in certain
securities such as those that trade in foreign markets, are illiquid or do not
otherwise have "readily available market quotations." Certain investors may
seek to employ short-term trading strategies aimed at exploiting variations in
fund valuation that arise from the nature of the securities held by a fund
(e.g., "time zone arbitrage"). Each fund has adopted policies and procedures
that are intended to detect and deter short-term and excessive trading.
Pursuant to these policies, each fund reserves the right to reject or cancel a
purchase or exchange order for any reason without prior notice. For example, a
fund may in its discretion reject or cancel a purchase or an exchange order
even if the transaction is not subject to the specific roundtrip transaction
limitation described below if the Advisor believes that there appears to be a
pattern of short-term or excessive trading activity by a shareholder or deems
any other trading activity harmful or disruptive to a fund. Each fund, through
its Advisor and transfer agent, will measure short-term and excessive trading
by the number of roundtrip transactions within a shareholder's account during a
rolling 12-month period. A "roundtrip" transaction is defined as any
combination of purchase and redemption activity (including exchanges) of the
same fund's shares. Each fund may take other trading activity
40
PROSPECTUS May 1, 2010 Investing in the Funds
into account if a fund believes such activity is of an amount or frequency that
may be harmful to long-term shareholders or disruptive to portfolio management.
Shareholders are limited to four roundtrip transactions in the same fund over a
rolling 12-month period. Shareholders with four or more roundtrip transactions
in the same fund within a rolling 12-month period generally will be blocked
from making additional purchases of, or exchanges into, that fund. Each fund
has sole discretion whether to remove a block from a shareholder's account. The
rights of a shareholder to redeem shares of each fund are not affected by the
four roundtrip transaction limitation.
The Advisor may make exceptions to the roundtrip transaction policy for certain
types of transactions if in its opinion the transactions do not represent
short-term or excessive trading or are not abusive or harmful to each fund,
such as, but not limited to, systematic transactions, required minimum
retirement distributions, transactions initiated by each fund or administrator
and transactions by certain qualified fund-of-fund(s).
In certain circumstances, each fund may rely upon the policy of the insurance
company or other financial intermediary to deter short-term or excessive
trading if the Advisor believes that the policy of such insurance company or
other financial intermediary is reasonably designed to detect and deter
transactions that are not in the best interests of each fund. An insurance
company's or other financial intermediary's policy relating to short-term or
excessive trading may be more or less restrictive than each fund's policies,
may permit certain transactions not permitted by each fund's policies, or
prohibit transactions not subject to each fund's policies.
The Advisor may also accept undertakings from an insurance company or other
financial intermediary to enforce short-term or excessive trading policies on
behalf of each fund that provide a substantially similar level of protection
for each fund against such transactions. For example, certain insurance
companies may have contractual or legal restrictions, or operational
constraints, that prevent them from blocking an account. In such instances, the
Advisor may permit the insurance company to use alternate techniques that the
Advisor considers to be a reasonable substitute for such a block.
In addition, to the extent that each fund invests some portion of its assets in
foreign securities, each fund has adopted certain fair valuation practices
intended to protect each fund from "time zone arbitrage" with respect to its
foreign securities holdings and other trading practices that seek to exploit
variations in fund valuation that arise from the nature of the securities held
by each fund. (See "How each fund Calculates Share Price.")
There is no assurance that these policies and procedures will be effective in
limiting short-term and excessive trading in all cases. For example, the
Advisor may not be able to effectively monitor, detect or limit short-term or
excessive trading by underlying contract holders that occurs through separate
accounts maintained by insurance companies or other financial intermediaries.
The Advisor reviews trading activity at the separate account level to detect
short-term or excessive trading. If the Advisor has reason to suspect that
short-term or excessive trading is occurring at the separate account level, the
Advisor will contact the insurance company or other financial intermediary to
request underlying contract holder activity. Depending on the amount of fund
shares held in such separate account (which may represent most of each fund's
shares), short-term and/or excessive trading of fund shares could adversely
affect long-term shareholders in each fund. If short-term or excessive trading
is identified, the Advisor will take appropriate action.
Each fund's market timing policies and procedures may be modified or terminated
at any time.
HOW TO RECEIVE ACCOUNT INFORMATION
If you are a contract owner, you should contact your insurance company or the
organization that provides record keeping services for information about your
account.
Please see the contract prospectus that accompanies this prospectus for the
customer service phone number.
HOW TO SELECT SHARES
Shares in a fund are available in connection with certain variable annuity and
life insurance arrangements. Each insurance company has different provisions
about how and when their contract owners may select fund shares. Each insurance
company is responsible for communicating its contract owners' instructions to a
fund. Contract owners should contact their insurance company to effect
transactions in connection with a fund.
FINANCIAL INTERMEDIARY SUPPORT PAYMENTS
The Advisor, DWS Investments Distributors, Inc. (the "Distributor") and/or
their affiliates may pay additional compensation, out of their own assets and
not as an additional charge to each fund, to selected affiliated and
unaffiliated brokers, dealers, participating insurance companies or other
financial intermediaries ("financial advisors") in connection with the sale
and/or distribution of fund shares or the retention and/or servicing of fund
investors and fund shares ("revenue sharing"). Such revenue sharing payments
are in addition to any distribution or service fees payable under any Rule
12b-1 or service plan of each fund, any record keeping/sub-transfer agency/
networking fees payable by each fund (generally through the Distributor or an
affiliate) and/or the Distributor to certain financial advisors for performing
such services and any sales charge, commissions, non-cash compensation
arrangements expressly permitted under applicable rules
41
PROSPECTUS May 1, 2010 Investing in the Funds
of the Financial Industry Regulatory Authority or other concessions described
in the fee table or elsewhere in this prospectus or the Statement of Additional
Information as payable to all financial advisors. For example, the Advisor, the
Distributor and/or their affiliates may compensate financial advisors for
providing a fund with "shelf space" or access to a third party platform or fund
offering list or other marketing programs, including, without limitation,
inclusion of the fund on preferred or recommended sales lists, mutual fund
"supermarket" platforms and other formal sales programs; granting the
Distributor access to the financial advisor's sales force; granting the
Distributor access to the financial advisor's conferences and meetings;
assistance in training and educating the financial advisor's personnel; and
obtaining other forms of marketing support.
The level of revenue sharing payments made to financial advisors may be a fixed
fee or based upon one or more of the following factors: gross sales, current
assets and/or number of accounts of each fund attributable to the financial
advisor, the particular fund or fund type or other measures as agreed to by the
Advisor, the Distributor and/or their affiliates and the financial advisors or
any combination thereof. The amount of these revenue sharing payments is
determined at the discretion of the Advisor, the Distributor and/or their
affiliates from time to time, may be substantial, and may be different for
different financial advisors based on, for example, the nature of the services
provided by the financial advisor.
The Advisor, the Distributor and/or their affiliates currently make revenue
sharing payments from their own assets in connection with the sale and/or
distribution of DWS fund shares or the retention and/or servicing of investors
and DWS fund shares to financial advisors in amounts that generally range from
0.01% up to 0.26% of assets of each fund serviced and maintained by the
financial advisor, 0.05% to 0.25% of sales of each fund attributable to the
financial advisor, a flat fee of $4,000 up to $500,000, or any combination
thereof. These amounts are subject to change at the discretion of the Advisor,
the Distributor and/or their affiliates. Receipt of, or the prospect of
receiving, this additional compensation may influence your financial advisor's
recommendation of each fund or of any particular share class of each fund. You
should review your financial advisor's compensation disclosure and/or talk to
your financial advisor to obtain more information on how this compensation may
have influenced your financial advisor's recommendation of each fund.
Additional information regarding these revenue sharing payments is included in
each fund's Statement of Additional Information, which is available to you on
request at no charge (see the back cover of this prospectus for more
information on how to request a copy of the Statement of Additional
Information).
The Advisor, the Distributor and/or their affiliates may also make such revenue
sharing payments to financial advisors under the terms discussed above in
connection with the distribution of both DWS funds and non-DWS funds by
financial advisors to retirement plans that obtain record keeping services from
ADP, Inc. or ExpertPlan Inc. on the DWS Investments branded retirement plan
platform (the "Platform") with the level of revenue sharing payments being
based upon sales of both the DWS funds and the non-DWS funds by the financial
advisor on the Platform or current assets of both the DWS funds and the non-DWS
funds serviced and maintained by the financial advisor on the Platform.
It is likely that broker-dealers that execute portfolio transactions for each
fund will include firms that also sell shares of the DWS funds to their
customers. However, the Advisor will not consider sales of DWS fund shares as a
factor in the selection of broker-dealers to execute portfolio transactions for
the DWS funds. Accordingly, the Advisor has implemented policies and procedures
reasonably designed to prevent its traders from considering sales of DWS fund
shares as a factor in the selection of broker-dealers to execute portfolio
transactions for each fund. In addition, the Advisor, the Distributor and/or
their affiliates will not use fund brokerage to pay for their obligation to
provide additional compensation to financial advisors as described above.
HOW EACH FUND CALCULATES SHARE PRICE
To calculate net asset value per share, or NAV, each fund uses the following
equation:
TOTAL TOTAL TOTAL NUMBER OF
- / = NAV
( )
ASSETS LIABILITIES SHARES OUTSTANDING
The price at which you buy and sell shares for each fund is the NAV.
WE TYPICALLY VALUE SECURITIES USING INFORMATION FURNISHED BY AN INDEPENDENT
PRICING SERVICE OR MARKET QUOTATIONS, WHERE APPROPRIATE. However, we may use
methods approved by the Board, such as a fair valuation model, which are
intended to reflect fair value when pricing service information or market
quotations are not readily available or when a security's value or a meaningful
portion of the value of a portfolio is believed to have been materially
affected by a significant event, such as a natural disaster, an economic event
like a bankruptcy filing, or a substantial fluctuation in domestic or foreign
markets, that has occurred between the close of the exchange or market on which
the security is principally traded (for example, a foreign exchange or market)
and the close of the New York Stock Exchange. In such a case, a portfolio's
value for a security is likely to be different from the last quoted market
price or pricing service information. In addition, due to the subjective and
variable nature of fair value pricing, it is possible that the value determined
for a particular asset may be materially different from the value realized upon
such asset's sale. It is expected that the greater the percentage of portfolio
assets that is invested in non-US securities, the more extensive will be a
portfolio's use of
42
PROSPECTUS May 1, 2010 Investing in the Funds
fair value pricing. This is intended to reduce a portfolio's exposure to "time
zone arbitrage" and other harmful trading practices. (See "Market Timing
Policies and Procedures.")
To the extent that a fund invests in securities that are traded primarily in
foreign markets, the value of its holdings could change at a time when you
aren't able to buy or sell fund shares through the contract. This is because
some foreign markets are open on days and at times when each fund doesn't price
the shares.
DISTRIBUTIONS
Each fund intends to declare and distribute dividends from their net investment
income and capital gains, if any, annually. Each fund may make additional
distributions if necessary.
All distributions will be reinvested in shares of a fund unless we are informed
by an insurance company that they should be paid out in cash. The insurance
companies will be informed about the amount and character of distributions from
the relevant fund for federal income tax purposes.
TAXES
Each fund intends to qualify each year as a regulated investment company under
Subchapter M of the Internal Revenue Code of 1986, as amended (the "Code"), and
intends to meet all requirements necessary to avoid paying any federal income
or excise taxes.
Generally, owners of variable annuity and variable life contracts are not
subject to current federal income taxation on income or gains realized with
respect to such contracts. However, some distributions from such contracts,
whether made prior to or during the annuity payment period, may be taxable at
ordinary income tax rates. In addition, distributions made to an owner who is
younger than 59 1-2 may be subject to a 10% penalty tax. For further
information concerning federal income tax consequences for the holders of
variable annuity contracts and variable life insurance policies, such holders
should consult the prospectus used in connection with the issuance of their
particular contracts or policies.
In order for investors to receive the favorable federal income tax treatment
available to holders of variable annuity and variable life contracts, the
separate accounts underlying such contracts, as well as the funds in which such
accounts invest, must meet certain diversification requirements. Each fund
intends to comply with these requirements. If a fund or separate account does
not meet such requirements or fails to qualify as a regulated investment
company for any taxable year, income allocable to the contracts associated with
the separate account may be taxable currently for federal income tax purposes
to the holders of such contracts and income from prior periods with respect to
such contracts also could be taxable, most likely in the year of the failure.
Under Treasury regulations, insurance companies holding the separate accounts
may have to report to the IRS losses above a certain amount resulting from a
sale or disposition of a fund's shares.
The discussion above is generally based on the assumption that shares of a fund
will be respected as owned by insurance company separate accounts. If this is
not the case (for example, because the IRS finds an impermissible level of
"investor control" over the investment options underlying variable contracts),
the advantageous federal income tax treatment provided in respect of insurance
company separate accounts under the Code will no longer be available, and the
person or persons determined to own the fund shares will be currently taxed on
fund distributions, and on the proceeds of any redemption of fund shares, under
the Code.
Fund investments in securities of foreign issuers may be subject to withholding
and other taxes at the source, including on dividend or interest payments.
Participating insurance companies should consult their own tax advisors as to
whether such distributions are subject to federal income tax if they are
retained as part of policy reserves.
Certain of each fund's investments in certain debt obligations may cause each
fund to recognize taxable income in excess of the cash generated by such
obligation. Thus, each fund could be required at times to liquidate other
investments in order to satisfy its distribution requirements.
The preceding is a brief summary of certain of the relevant federal income tax
considerations. Because each shareholder and contract holder's tax situation is
unique, ask your tax professional about the tax consequences of your
investments, including possible federal, foreign, state or local taxes.
MARKETING AND DISTRIBUTION FEES
Class B and Class B2 shares are referred to collectively as "Class B shares."
DWS Investments Distributors, Inc., a subsidiary of the Advisor, is each fund's
distributor.
DWS Variable Series I and DWS Investments VIT Funds have each adopted a 12b-1
plan for all Class B shares. Under this plan, each fund pays a fee to the
Distributor, which in turn remits fees to participating insurance companies for
various costs incurred or paid by these companies in connection with marketing
and distributing Class B shares of a fund. Depending on the participating
insurance company's corporate structure and applicable state law, the
Distributor may remit payments to the participating insurance company's
affiliated broker-dealers or another affiliated company rather than to the
participating insurance company itself.
43
PROSPECTUS May 1, 2010 Investing in the Funds
The plan provides that DWS Variable Series I and DWS Investments VIT Funds, on
behalf of each applicable fund, will pay DWS Investments Distributors, Inc., as
distributor, a fee of up to 0.25% of the average daily net assets of the fund
attributable to each applicable fund's Class B shares. Under the plan, a fund
may make quarterly payments to the Distributor for remittance to a
participating insurance company for distribution and shareholder servicing
related expenses incurred or paid by the participating insurance company. No
such payment shall be made with respect to any quarterly period in excess of an
amount determined for such period at the annual rate of 0.25% of the average
daily net assets of Class B shares of the funds attributable to that
participating insurance company's variable annuity contracts and variable life
insurance policies during that quarterly period.
Because 12b-1 fees for Class B shares are paid out of fund assets on an ongoing
basis, they will, over time, increase the cost of investment in Class B shares
and may cost more than other types of sales charges.
Examples of expenses payable under the plan include the costs of printing and
mailing materials (such as fund prospectuses, shareholder reports, fund
advertisements and sales literature), holding seminars and sales meetings,
providing customer service to policyholders and sales compensation.
44
PROSPECTUS May 1, 2010 Investing in the Funds
FINANCIAL HIGHLIGHTS
The financial highlights are designed to help you understand recent financial
performance. The figures in the first part of the table are for a single share.
The total return figures represent the percentage that an investor in a fund
would have earned (or lost), assuming all dividends and distributions were
reinvested. This information has been audited by PricewaterhouseCoopers LLP,
independent registered public accounting firm, whose report, along with each
fund's financial statements, is included in each fund's annual report (see
"Shareholder reports" on the back cover). This information doesn't reflect
charges and fees associated with the separate account that invests in the fund
or any variable life insurance policy or variable annuity contract for which
the fund is an investment option. These charges and fees will reduce returns.
DWS GROWTH & INCOME VIP - CLASS B
YEARS ENDED DECEMBER 31, 2009 2008 2007 2006 2005
------------------------------------------------ ---------- ----------- ----------- --------------- ----------
SELECTED PER SHARE DATA
---------------------------------------------------------------------------------------------------------------------
NET ASSET VALUE, BEGINNING OF PERIOD $ 5.12 $ 10.77 $ 10.90 $ 9.68 $ 9.25
------------------------------------------------ ------- -------- -------- -------- -------
Income (loss) from investment operations:
Net investment income (loss)(a) .08 .08 .09 .09 (c) .07
------------------------------------------------ ------- -------- -------- -------- -------
Net realized and unrealized gain (loss) 1.60 ( 3.42) .02 1.19 .45
------------------------------------------------ ------- -------- -------- -------- -------
TOTAL FROM INVESTMENT OPERATIONS 1.68 ( 3.34) .11 1.28 .52
------------------------------------------------ ------- -------- -------- -------- -------
Less distributions from:
Net investment income ( .10) ( .15) ( .09) ( .06) ( .09)
------------------------------------------------ ------- -------- -------- -------- -------
Net realized gains - ( 2.16) ( .15) - -
------------------------------------------------ ------- -------- -------- -------- -------
TOTAL DISTRIBUTIONS ( .10) ( 2.31) ( .24) ( .06) ( .09)
------------------------------------------------ ------- -------- -------- -------- -------
NET ASSET VALUE, END OF PERIOD $ 6.70 $ 5.12 $ 10.77 $ 10.90 $ 9.68
------------------------------------------------ ------- -------- -------- -------- -------
Total Return (%)(b) 33.64 (38.29) 1.00 13.28 (c) 5.73
------------------------------------------------ ------- -------- -------- -------- -------
RATIOS TO AVERAGE NET ASSETS AND SUPPLEMENTAL DATA
---------------------------------------------------------------------------------------------------------------------
Net assets, end of period ($ millions) 2 2 15 52 47
------------------------------------------------ ------- -------- -------- -------- -------
Ratio of expenses before expense reductions (%) .89 .82 .95 .94 .95
------------------------------------------------- ------- -------- -------- -------- -------
Ratio of expenses after expense reductions (%) .80 .77 .92 .89 .89
------------------------------------------------- ------- -------- -------- -------- -------
Ratio of net investment income (loss) (%) 1.48 1.12 .82 .89 (c) .75
------------------------------------------------- ------- -------- -------- -------- -------
Portfolio turnover rate (%) 82 130 310 105 115
------------------------------------------------- ------- -------- -------- -------- -------
(a) Based on average shares outstanding during the period.
(b) Total return would have been lower had certain expenses not been
reduced.
(c) Includes non-recurring income from the Advisor recorded as a result
of an administrative proceeding regarding disclosure of brokerage
allocation practices in connection with sales of DWS Funds. The
non-recurring income resulted in an increase in net investment
income of $0.007 per share and an increase in the ratio of net
investment income of 0.07%. Excluding this non-recurring income,
total return would have been 0.06% lower.
45
PROSPECTUS May 1, 2010 Financial Highlights
DWS CAPITAL GROWTH VIP - CLASS B
YEARS ENDED DECEMBER 31, 2009 2008 2007 2006 2005
------------------------------------------------ ----------- ----------- ---------------- ---------------- -----------
SELECTED PER SHARE DATA
-----------------------------------------------------------------------------------------------------------------------------
NET ASSET VALUE, BEGINNING OF PERIOD $ 13.49 $ 20.31 $ 18.15 $ 16.81 $ 15.59
------------------------------------------------ -------- -------- -------- -------- --------
Income (loss) from investment operations:
Net investment income (loss)(a) .09 .10 .09 (d) .06 (c) .04
------------------------------------------------ -------- -------- -------- -------- --------
Net realized and unrealized gain (loss) 3.43 ( 6.81) 2.12 1.31 1.28
------------------------------------------------ -------- -------- -------- -------- --------
TOTAL FROM INVESTMENT OPERATIONS 3.52 ( 6.71) 2.21 1.37 1.32
------------------------------------------------ -------- -------- -------- -------- --------
Less distributions from:
Net investment income ( .15) ( .11) ( .05) ( .03) ( .10)
------------------------------------------------ -------- -------- -------- -------- --------
NET ASSET VALUE, END OF PERIOD $ 16.86 $ 13.49 $ 20.31 $ 18.15 $ 16.81
------------------------------------------------ -------- -------- -------- -------- --------
Total Return (%)(b) 26.49 (33.20) 12.18 8.17 (c) 8.51
------------------------------------------------ -------- -------- -------- -------- --------
RATIOS TO AVERAGE NET ASSETS AND SUPPLEMENTAL DATA
-----------------------------------------------------------------------------------------------------------------------------
Net assets, end of period ($ millions) 12 10 19 107 73
------------------------------------------------ -------- -------- -------- -------- --------
Ratio of expenses before expense reductions (%) .85 .85 .94 .91 .89
------------------------------------------------- -------- -------- -------- -------- --------
Ratio of expenses after expense reductions (%) .82 .82 .90 .86 .86
------------------------------------------------- -------- -------- -------- -------- --------
Ratio of net investment income (loss) (%) .65 .56 .48 (d) .36 (c) .24
------------------------------------------------- -------- -------- -------- -------- --------
Portfolio turnover rate (%) 76 21 30 16 17
------------------------------------------------- -------- -------- -------- -------- --------
(a) Based on average shares outstanding during the period.
(b) Total return would have been lower had certain expenses not been
reduced.
(c) Includes non-recurring income from the Advisor recorded as a result
of an administrative proceeding regarding disclosure of brokerage
allocation practices in connection with sales of DWS Funds. The
non-recurring income resulted in an increase in net investment
income of $0.007 per share and an increase in the ratio of net
investment income of 0.04%. Excluding this non-recurring income,
total return would have been 0.03% lower.
(d) Net investment income per share and ratio of net investment income
include non-recurring dividend income amounting to $0.03 per share
and 0.17% of average daily net assets, respectively.
46
PROSPECTUS May 1, 2010 Financial Highlights
DWS GLOBAL OPPORTUNITIES VIP - CLASS B
YEARS ENDED DECEMBER 31, 2009 2008 2007 2006 2005
------------------------------------------------ ---------- ---------------- ---------------- -------------------- -----------
SELECTED PER SHARE DATA
-------------------------------------------------------------------------------------------------------------------------------
NET ASSET VALUE, BEGINNING OF PERIOD $ 7.65 $ 18.03 $ 17.93 $ 14.84 $ 12.62
------------------------------------------------ ------- -------- -------- --------- --------
Income (loss) from investment operations:
Net investment income (loss)(a) .02 .16 (e) .01 (e) ( .00)(b,d) .03
------------------------------------------------ ------- -------- -------- --------- --------
Net realized and unrealized gain (loss) 3.57 ( 8.07) 1.61 3.24 2.24
------------------------------------------------ ------- -------- -------- --------- --------
TOTAL FROM INVESTMENT OPERATIONS 3.59 ( 7.91) 1.62 3.24 2.27
------------------------------------------------ ------- -------- -------- --------- --------
Less distributions from:
Net investment income ( .13) - ( .19) ( .15) ( .05)
------------------------------------------------ ------- -------- -------- --------- --------
Net realized gains - ( 2.47) ( 1.33) - -
------------------------------------------------ ------- -------- -------- --------- --------
TOTAL DISTRIBUTIONS ( .13) ( 2.47) ( 1.52) ( .15) ( .05)
------------------------------------------------ ------- -------- -------- --------- --------
NET ASSET VALUE, END OF PERIOD $ 11.11 $ 7.65 $ 18.03 $ 17.93 $ 14.84
------------------------------------------------ ------- -------- -------- --------- --------
Total Return (%)(c) 47.66 (50.16) 8.92 21.88 (d) 18.06
------------------------------------------------ ------- -------- -------- --------- --------
RATIOS TO AVERAGE NET ASSETS AND SUPPLEMENTAL DATA
-------------------------------------------------------------------------------------------------------------------------------
Net assets, end of period ($ millions) 7 5 12 37 33
------------------------------------------------ ------- -------- -------- --------- --------
Ratio of expenses before expense reductions (%) 1.42 1.42 1.53 1.51 1.54
------------------------------------------------ ------- -------- -------- --------- --------
Ratio of expenses after expense reductions (%) 1.30 1.30 1.50 1.31 1.24
------------------------------------------------ ------- -------- -------- --------- --------
Ratio of net investment income (loss) (%) .16 1.21 (e) .07 (e) ( .03)(d) .25
------------------------------------------------ ------- -------- -------- --------- --------
Portfolio turnover rate (%) 53 21 19 28 30
------------------------------------------------ ------- -------- -------- --------- --------
(a) Based on average shares outstanding during the period.
(b) Amount is less than $.005.
(c) Total return would have been lower had certain expenses not been
reduced.
(d) Includes non-recurring income from the Advisor recorded as a result
of an administrative proceeding regarding disclosure of brokerage
allocation practices in connection with sales of DWS Funds. The
non-recurring income resulted in an increase in net investment
income of $0.002 per share and an increase in the ratio of net
investment income of 0.01%. Excluding this non-recurring income,
total return would have been 0.01% lower.
(e) Net investment income per share and the ratio of net investment
income include non-recurring dividend income amounting to $0.05 and
$0.02 per share and 0.37% and 0.09% of average daily net assets for
the years ended December 31, 2008 and 2007, respectively.
47
PROSPECTUS May 1, 2010 Financial Highlights
DWS INTERNATIONAL VIP - CLASS B
YEARS ENDED DECEMBER 31, 2009 2008
------------------------------------------------ ---------- ---------------------
SELECTED PER SHARE DATA
----------------------------------------------------------------------------------
NET ASSET VALUE, BEGINNING OF PERIOD $ 6.52 $ 14.98
------------------------------------------------ ------- -----------
Income (loss) from investment operations:
Net investment income (loss)(a) .10 .23 (c)
------------------------------------------------ ------- -----------
Net realized and unrealized gain (loss) 1.94 ( 6.43)
------------------------------------------------ ------- -----------
TOTAL FROM INVESTMENT OPERATIONS 2.04 ( 6.20)
------------------------------------------------ ------- -----------
Less distributions from:
Net investment income ( .30) ( .11)
------------------------------------------------ ------- -----------
Net realized gains - ( 2.15)
------------------------------------------------ ------- -----------
TOTAL DISTRIBUTIONS ( .30) ( 2.26)
------------------------------------------------ ------- -----------
NET ASSET VALUE, END OF PERIOD $ 8.26 $ 6.52
------------------------------------------------ ------- -----------
Total Return (%) 32.89 (48.25)(b,d)
------------------------------------------------ ------- -----------
RATIOS TO AVERAGE NET ASSETS AND SUPPLEMENTAL DATA
----------------------------------------------------------------------------------
Net assets, end of period ($ millions) .50 .40
------------------------------------------------ ------- -----------
Ratio of expenses before expense reductions (%) 1.22 1.33
------------------------------------------------ ------- -----------
Ratio of expenses after expense reductions (%) 1.22 1.28
------------------------------------------------ ------- -----------
Ratio of net investment income (loss) (%) 1.42 2.42 (c)
------------------------------------------------ ------- -----------
Portfolio turnover rate (%) 81 123
------------------------------------------------ ------- -----------
YEARS ENDED DECEMBER 31, 2007 2006 2005
------------------------------------------------ ---------------- ---------------- ----------------
SELECTED PER SHARE DATA
----------------------------------------------------------------------------------------------------
NET ASSET VALUE, BEGINNING OF PERIOD $ 13.38 $ 10.82 $ 9.48
------------------------------------------------- --------- --------- ---------
Income (loss) from investment operations:
Net investment income (loss)(a) .16 (c) .24 (c) .12
------------------------------------------------- --------- --------- ---------
Net realized and unrealized gain (loss) 1.73 2.50 1.35
------------------------------------------------- --------- --------- ---------
TOTAL FROM INVESTMENT OPERATIONS 1.89 2.74 1.47
------------------------------------------------- --------- --------- ---------
Less distributions from:
Net investment income ( .29) ( .18) ( .13)
------------------------------------------------- --------- --------- ---------
Net realized gains - - -
------------------------------------------------- --------- --------- ---------
TOTAL DISTRIBUTIONS ( .29) ( .18) ( .13)
------------------------------------------------- --------- --------- ---------
NET ASSET VALUE, END OF PERIOD $ 14.98 $ 13.38 $ 10.82
------------------------------------------------- --------- --------- ---------
Total Return (%) 14.25 (b) 25.44 (b) 15.71 (b)
------------------------------------------------- --------- --------- ---------
RATIOS TO AVERAGE NET ASSETS AND SUPPLEMENTAL DATA
----------------------------------------------------------------------------------------------------
Net assets, end of period ($ millions) 12 51 40
------------------------------------------------- --------- --------- ---------
Ratio of expenses before expense reductions (%) 1.41 1.37 1.41
------------------------------------------------- --------- --------- ---------
Ratio of expenses after expense reductions (%) 1.39 1.36 1.37
------------------------------------------------- --------- --------- ---------
Ratio of net investment income (loss) (%) 1.07 (c) 1.94 (c) 1.24
------------------------------------------------- --------- --------- ---------
Portfolio turnover rate (%) 108 105 59
------------------------------------------------- --------- --------- ---------
(a) Based on average shares outstanding during the period.
(b) Total return would have been lower had certain expenses not been
reduced.
(c) Net investment income per share and the ratio of net investment
income include non-recurring dividend income amounting to $0.09,
$0.05 and $0.11 per share and 0.82%, 0.33% and 0.92% of average
daily net assets for the years ended December 31, 2008, 2007 and
2006, respectively.
(d) Includes a reimbursement from the Advisor to reimburse the effect of
losses incurred as the result of certain operation errors during the
period. Excluding this reimbursement, total return would have been
0.06% lower.
DWS HEALTH CARE VIP - CLASS B
YEARS ENDED DECEMBER 31, 2009 2008 2007 2006 2005
------------------------------------------ ---------- ---------------- ---------------- ---------------- -----------
SELECTED PER SHARE DATA
---------------------------------------------------------------------------------------------------------------------------
NET ASSET VALUE, BEGINNING OF PERIOD $ 9.23 $ 14.40 $ 13.55 $ 12.87 $ 11.91
------------------------------------------ ------- -------- -------- -------- --------
Income (loss) from investment operations:
Net investment income (loss)(a) ( .04) .05 (c) ( .03)(c) ( .06)(b) ( .07)
------------------------------------------- ------- -------- -------- -------- --------
Net realized and unrealized gain (loss) 1.98 ( 3.02) 1.75 .79 1.03
------------------------------------------- ------- -------- -------- -------- --------
TOTAL FROM INVESTMENT OPERATIONS 1.94 ( 2.97) 1.72 .73 .96
------------------------------------------- ------- -------- -------- -------- --------
Less distributions from:
Net investment income(a) ( .10) - - - -
------------------------------------------- ------- -------- -------- -------- --------
Net realized gains ( .12) ( 2.20) ( .87) ( .05) -
------------------------------------------- ------- -------- -------- -------- --------
TOTAL DISTRIBUTIONS ( .22) ( 2.20) ( .87) ( .05) -
------------------------------------------- ------- -------- -------- -------- --------
NET ASSET VALUE, END OF PERIOD $ 10.95 $ 9.23 $ 14.40 $ 13.55 $ 12.87
------------------------------------------- ------- -------- -------- -------- --------
Total Return (%) 21.80 (23.50) 12.88 5.77 (b) 8.06
------------------------------------------- ------- -------- -------- -------- --------
RATIOS TO AVERAGE NET ASSETS AND SUPPLEMENTAL DATA
---------------------------------------------------------------------------------------------------------------------------
Net assets, end of period ($ millions) 3 3 5 21 23
------------------------------------------- ------- -------- -------- -------- --------
Ratio of expenses (%) 1.34 1.27 1.34 1.28 1.27
------------------------------------------- ------- -------- -------- -------- --------
Ratio of net investment income (loss) (%) ( .46) .43 (c) ( .22)(c) ( .42)(b) ( .57)
------------------------------------------- ------- -------- -------- -------- --------
Portfolio turnover rate (%) 31 24 37 47 43
------------------------------------------- ------- -------- -------- -------- --------
(a) Based on average shares outstanding during the period.
(b) Includes non-recurring income from the Advisor recorded as a result
of an administrative proceeding regarding disclosure of brokerage
allocation practices in connection with sales of DWS Funds. The
non-recurring income resulted in an increase in net investment
income of $0.003 per share and an increase in the ratio of net
investment income of 0.02%. Excluding this non-recurring income,
total return would have been 0.02% lower.
(c) Net investment income per share and ratio of net investment income
include non-recurring dividend income amounting to $0.03 and $0.02
per share and 0.28% and 0.13% of average daily net assets for the
year ended December 31, 2008 and 2007, respectively.
48
PROSPECTUS May 1, 2010 Financial Highlights
DWS EQUITY 500 INDEX VIP - CLASS B
YEARS ENDED DECEMBER 31, 2009 2008
--------------------------------------------------- ---------------- -----------------
SELECTED PER SHARE DATA
---------------------------------------------------------------------------------------
NET ASSET VALUE, BEGINNING OF PERIOD $ 9.54 $ 15.52
--------------------------------------------------- --------- ----------
Income (loss) from investment operations:
Net investment income (loss)(a) .18 .24
--------------------------------------------------- --------- ----------
Net realized and unrealized gain (loss) 2.22 ( 5.94)
--------------------------------------------------- --------- ----------
TOTAL FROM INVESTMENT OPERATIONS 2.40 ( 5.70)
--------------------------------------------------- --------- ----------
Less distributions from:
Net investment income ( .26) ( .28)
--------------------------------------------------- --------- ----------
NET ASSET VALUE, END OF PERIOD $ 11.68 $ 9.54
--------------------------------------------------- --------- ----------
Total Return (%) 26.03 (b) (37.34)(b)
--------------------------------------------------- --------- ----------
RATIOS TO AVERAGE NET ASSETS AND SUPPLEMENTAL DATA
---------------------------------------------------------------------------------------
Net assets, end of period ($ millions) 50 40
--------------------------------------------------- --------- ----------
Ratio of expenses before expense reductions and/or .59 .58
--------------------------------------------------- --------- ----------
recoupments (%)
---------------------------------------------------
Ratio of expenses after expense reductions and/or .57 .53
--------------------------------------------------- --------- ----------
recoupments (%)
---------------------------------------------------
Ratio of net investment income (loss) (%) 1.85 1.82
--------------------------------------------------- --------- ----------
Portfolio turnover rate (%) 8 6
--------------------------------------------------- --------- ----------
YEARS ENDED DECEMBER 31, 2007 2006 2005
--------------------------------------------------- ---------------- ---------------- -----------
SELECTED PER SHARE DATA
--------------------------------------------------------------------------------------------------
NET ASSET VALUE, BEGINNING OF PERIOD $ 14.96 $ 13.10 $ 12.72
--------------------------------------------------- --------- --------- --------
Income (loss) from investment operations:
Net investment income (loss)(a) .23 .21 .17
--------------------------------------------------- --------- --------- --------
Net realized and unrealized gain (loss) .52 1.78 .38
--------------------------------------------------- --------- --------- --------
TOTAL FROM INVESTMENT OPERATIONS .75 1.99 .55
--------------------------------------------------- --------- --------- --------
Less distributions from:
Net investment income ( .19) ( .13) ( .17)
--------------------------------------------------- --------- --------- --------
NET ASSET VALUE, END OF PERIOD $ 15.52 $ 14.96 $ 13.10
--------------------------------------------------- --------- --------- --------
Total Return (%) 5.03 (b) 15.24 (b) 4.42
--------------------------------------------------- --------- --------- --------
RATIOS TO AVERAGE NET ASSETS AND SUPPLEMENTAL DATA
--------------------------------------------------------------------------------------------------
Net assets, end of period ($ millions) 65 84 68
--------------------------------------------------- --------- --------- --------
Ratio of expenses before expense reductions and/or .58 .53 .52
--------------------------------------------------- --------- --------- --------
recoupments (%)
---------------------------------------------------
Ratio of expenses after expense reductions and/or .55 .52 .52
--------------------------------------------------- --------- --------- --------
recoupments (%)
---------------------------------------------------
Ratio of net investment income (loss) (%) 1.46 1.48 1.37
--------------------------------------------------- --------- --------- --------
Portfolio turnover rate (%) 7(c) 9 15
--------------------------------------------------- --------- --------- --------
(a) Based on average shares outstanding during the period.
(b) Total return would have been lower had certain expenses not been
reduced.
(c) Excludes portfolio securities delivered as a result of processing
redemption in-kind transactions.
DWS EQUITY 500 INDEX VIP - CLASS B2
YEARS ENDED DECEMBER 31, 2009 2008 2007 2006 2005(A)
------------------------------------------------ ---------- ----------- ------------- ----------- ------------------
SELECTED PER SHARE DATA
------------------------------------------------------------------------- - - -
NET ASSET VALUE, BEGINNING OF PERIOD $ 9.54 $ 15.51 $ 14.96 $ 13.09 $ 12.94
------------------------------------------------ ------- -------- ------- -------- ---------
Income (loss) from investment operations:
Net investment income (loss)(b) .17 .22 .21 .19 .05
------------------------------------------------ ------- -------- ------- -------- ---------
Net realized and unrealized gain (loss) 2.21 ( 5.93) .52 1.79 .10
------------------------------------------------ ------- -------- ------- -------- ---------
TOTAL FROM INVESTMENT OPERATIONS 2.38 ( 5.71) .73 1.98 .15
------------------------------------------------ ------- -------- ------- -------- ---------
Less distributions from:
Net investment income ( .25) ( .26) ( .18) ( .11) -
------------------------------------------------ ------- -------- ------- -------- ---------
NET ASSET VALUE, END OF PERIOD $ 11.67 $ 9.54 $ 15.51 $ 14.96 $ 13.09
------------------------------------------------ ------- -------- ------- -------- ---------
Total Return (%)(c) 25.79 (37.36) 4.85 15.20 1.16 (**)
------------------------------------------------ ------- -------- ------- -------- ---------
RATIOS TO AVERAGE NET ASSETS AND SUPPLEMENTAL DATA
------------------------------------------------------------------------- ------- -------- ---------
Net assets, end of period ($ millions) 21 19 48 57 59
------------------------------------------------ ------- -------- ------- -------- ---------
Ratio of expenses before expense reductions (%) .74 .72 .72 .67 .66 (*)
------------------------------------------------- ------- -------- ------- -------- ---------
Ratio of expenses after expense reductions (%) .70 .63 .65 .63 .63 (*)
------------------------------------------------- ------- -------- ------- -------- ---------
Ratio of net investment income (loss) (%) 1.72 1.72 1.36 1.37 1.34 (*)
------------------------------------------------- ------- -------- ------- -------- ---------
Portfolio turnover rate (%) 8 6 7(d) 9 15
------------------------------------------------- ------- -------- ------- -------- ---------
(a) For the period September 16, 2005 (commencement of operations) to
December 31, 2005.
(b) Based on average shares outstanding during the period.
(c) Total return would have been lower had certain expenses not been
reduced.
(d) Excludes portfolio securities delivered as a result of processing
redemption in-kind transactions.
* Annualized
** Not annualized
49
PROSPECTUS May 1, 2010 Financial Highlights
DWS SMALL CAP INDEX VIP - CLASS B
YEARS ENDED DECEMBER 31, 2009 2008 2007 2006 2005
------------------------------------------------ ---------- ----------- ------------- ----------- -----------
SELECTED PER SHARE DATA
--------------------------------------------------------------------------------------------------------------------
NET ASSET VALUE, BEGINNING OF PERIOD $ 8.62 $ 14.70 $ 16.11 $ 14.39 $ 14.34
------------------------------------------------ ------- -------- ------- -------- --------
Income (loss) from investment operations:
Net investment income (loss)(a) .08 .15 .13 .10 .07
------------------------------------------------ ------- -------- ------- -------- --------
Net realized and unrealized gain (loss) 1.93 ( 4.77) ( .40) 2.34 .43
------------------------------------------------ ------- -------- ------- -------- --------
TOTAL FROM INVESTMENT OPERATIONS 2.01 ( 4.62) ( .27) 2.44 .50
------------------------------------------------ ------- -------- ------- -------- --------
Less distributions from:
Net investment income ( .14) ( .17) ( .10) ( .06) ( .06)
------------------------------------------------ ------- -------- ------- -------- --------
Net realized gains ( .60) ( 1.29) ( 1.04) ( .66) ( .39)
------------------------------------------------ ------- -------- ------- -------- --------
TOTAL DISTRIBUTIONS ( .74) ( 1.46) ( 1.14) ( .72) ( .45)
------------------------------------------------ ------- -------- ------- -------- --------
NET ASSET VALUE, END OF PERIOD $ 9.89 $ 8.62 $ 14.70 $ 16.11 $ 14.39
------------------------------------------------ ------- -------- ------- -------- --------
Total Return (%)(b) 26.27 (34.33) ( 2.16) 17.19 3.99
------------------------------------------------ ------- -------- ------- -------- --------
RATIOS TO AVERAGE NET ASSETS AND SUPPLEMENTAL DATA
--------------------------------------------------------------------------------------------------------------------
Net assets, end of period ($ millions) 45 42 73 68 45
------------------------------------------------ ------- -------- ------- -------- --------
Ratio of expenses before expense reductions (%) .81 .79 .78 .72 .71
------------------------------------------------- ------- -------- ------- -------- --------
Ratio of expenses after expense reductions (%) .75 .72 .76 .70 .70
------------------------------------------------- ------- -------- ------- -------- --------
Ratio of net investment income (loss) (%) .93 1.26 .84 .68 .53
------------------------------------------------- ------- -------- ------- -------- --------
Portfolio turnover rate (%) 26 25 24(c) 42 26
------------------------------------------------- ------- -------- ------- -------- --------
(a) Based on average shares outstanding during the period.
(b) Total return would have been lower had certain expenses not been
reduced.
(c) Excludes portfolio securities delivered as a result of processing
redemption in-kind transactions.
50
PROSPECTUS May 1, 2010 Financial Highlights
APPENDIX
HYPOTHETICAL EXPENSE SUMMARY
Using the annual fund operating expense ratios presented in the fee tables in
the fund prospectus, the Hypothetical Expense Summary shows the estimated fees
and expenses, in actual dollars, that would be charged on a hypothetical
investment of $10,000 in the fund held for the next 10 years and the impact of
such fees and expenses on fund returns for each year and cumulatively, assuming
a 5% return for each year. The historical rate of return for the fund may be
higher or lower than 5% and, for money market funds, is typically less than 5%.
The tables also assume that all dividends and distributions are reinvested. The
annual fund expense ratios shown are net of any contractual fee waivers or
expense reimbursements, if any, for the period of the contractual commitment.
Also, please note that if you are investing through a third party provider,
that provider may have fees and expenses separate from those of the fund that
are not reflected here. Mutual fund fees and expenses fluctuate over time and
actual expenses may be higher or lower than those shown.
The Hypothetical Expense Summary should not be used or construed as an offer to
sell, a solicitation of an offer to buy or a recommendation or endorsement of
any specific mutual fund. You should carefully review the fund's prospectus to
consider the investment objectives, risks, expenses and charges of the fund
prior to investing.
DWS GROWTH & INCOME VIP - CLASS B
MAXIMUM INITIAL HYPOTHETICAL ASSUMED RATE
SALES CHARGE: INVESTMENT: OF RETURN:
0.00% $10,000 5%
--------------- -------------------------------- ---------------------------------
CUMULATIVE CUMULATIVE HYPOTHETICAL
RETURN BEFORE RETURN AFTER YEAR-END BALANCE ANNUAL
FEES AND ANNUAL FUND FEES AND AFTER FEES AND FEES AND
YEAR EXPENSES EXPENSE RATIOS EXPENSES EXPENSES EXPENSES
------ --------------- ---------------- -------------- ------------------ -------------
1 5.00% 0.89% 4.11% $ 10,411.00 $ 90.83
--- ----- ---- ----- ----------- ----------
2 10.25% 0.89% 8.39% $ 10,838.89 $ 94.56
--- ----- ---- ----- ----------- ----------
3 15.76% 0.89% 12.84% $ 11,284.37 $ 98.45
--- ----- ---- ----- ----------- ----------
4 21.55% 0.89% 17.48% $ 11,748.16 $ 102.49
--- ----- ---- ----- ----------- ----------
5 27.63% 0.89% 22.31% $ 12,231.01 $ 106.71
--- ----- ---- ----- ----------- ----------
6 34.01% 0.89% 27.34% $ 12,733.70 $ 111.09
--- ----- ---- ----- ----------- ----------
7 40.71% 0.89% 32.57% $ 13,257.06 $ 115.66
--- ----- ---- ----- ----------- ----------
8 47.75% 0.89% 38.02% $ 13,801.92 $ 120.41
--- ----- ---- ----- ----------- ----------
9 55.13% 0.89% 43.69% $ 14,369.18 $ 125.36
--- ----- ---- ----- ----------- ----------
10 62.89% 0.89% 49.60% $ 14,959.75 $ 130.51
--- ----- ---- ----- ----------- ----------
TOTAL $ 1,096.07
--- ----------
51
PROSPECTUS May 1, 2010 Appendix
DWS CAPITAL GROWTH VIP - CLASS B
MAXIMUM INITIAL HYPOTHETICAL ASSUMED RATE
SALES CHARGE: INVESTMENT: OF RETURN:
0.00% $10,000 5%
--------------- -------------------------------- ---------------------------------
CUMULATIVE CUMULATIVE HYPOTHETICAL
RETURN BEFORE RETURN AFTER YEAR-END BALANCE ANNUAL
FEES AND ANNUAL FUND FEES AND AFTER FEES AND FEES AND
YEAR EXPENSES EXPENSE RATIOS EXPENSES EXPENSES EXPENSES
------ --------------- ---------------- -------------- ------------------ -------------
1 5.00% 0.85% 4.15% $ 10,415.00 $ 86.76
--- ----- ---- ----- ----------- ----------
2 10.25% 0.85% 8.47% $ 10,847.22 $ 90.36
--- ----- ---- ----- ----------- ----------
3 15.76% 0.85% 12.97% $ 11,297.38 $ 94.11
--- ----- ---- ----- ----------- ----------
4 21.55% 0.85% 17.66% $ 11,766.22 $ 98.02
--- ----- ---- ----- ----------- ----------
5 27.63% 0.85% 22.55% $ 12,254.52 $ 102.09
--- ----- ---- ----- ----------- ----------
6 34.01% 0.85% 27.63% $ 12,763.08 $ 106.32
--- ----- ---- ----- ----------- ----------
7 40.71% 0.85% 32.93% $ 13,292.75 $ 110.74
--- ----- ---- ----- ----------- ----------
8 47.75% 0.85% 38.44% $ 13,844.40 $ 115.33
--- ----- ---- ----- ----------- ----------
9 55.13% 0.85% 44.19% $ 14,418.94 $ 120.12
--- ----- ---- ----- ----------- ----------
10 62.89% 0.85% 50.17% $ 15,017.33 $ 125.10
--- ----- ---- ----- ----------- ----------
TOTAL $ 1,048.95
--- ----------
DWS GLOBAL OPPORTUNITIES VIP - CLASS B
MAXIMUM INITIAL HYPOTHETICAL ASSUMED RATE
SALES CHARGE: INVESTMENT: OF RETURN:
0.00% $10,000 5%
--------------- -------------------------------- --------------------------------
CUMULATIVE CUMULATIVE HYPOTHETICAL
RETURN BEFORE RETURN AFTER YEAR-END BALANCE ANNUAL
FEES AND ANNUAL FUND FEES AND AFTER FEES AND FEES AND
YEAR EXPENSES EXPENSE RATIOS EXPENSES EXPENSES EXPENSES
------ --------------- ---------------- -------------- ------------------ ------------
1 5.00% 1.42% 3.58% $ 10,358.00 $ 144.54
--- ----- ---- ----- ----------- ----------
2 10.25% 1.42% 7.29% $ 10,728.82 $ 149.72
--- ----- ---- ----- ----------- ----------
3 15.76% 1.42% 11.13% $ 11,112.91 $ 155.08
--- ----- ---- ----- ----------- ----------
4 21.55% 1.42% 15.11% $ 11,510.75 $ 160.63
--- ----- ---- ----- ----------- ----------
5 27.63% 1.42% 19.23% $ 11,922.83 $ 166.38
--- ----- ---- ----- ----------- ----------
6 34.01% 1.42% 23.50% $ 12,349.67 $ 172.33
--- ----- ---- ----- ----------- ----------
7 40.71% 1.42% 27.92% $ 12,791.79 $ 178.50
--- ----- ---- ----- ----------- ----------
8 47.75% 1.42% 32.50% $ 13,249.74 $ 184.89
--- ----- ---- ----- ----------- ----------
9 55.13% 1.42% 37.24% $ 13,724.08 $ 191.51
--- ----- ---- ----- ----------- ----------
10 62.89% 1.42% 42.15% $ 14,215.40 $ 198.37
--- ----- ---- ----- ----------- ----------
TOTAL $ 1,701.95
--- ----------
52
PROSPECTUS May 1, 2010 Appendix
DWS INTERNATIONAL VIP - CLASS B
MAXIMUM INITIAL HYPOTHETICAL ASSUMED RATE
SALES CHARGE: INVESTMENT: OF RETURN:
0.00% $10,000 5%
--------------- -------------------------------- --------------------------------
CUMULATIVE CUMULATIVE HYPOTHETICAL
RETURN BEFORE RETURN AFTER YEAR-END BALANCE ANNUAL
FEES AND ANNUAL FUND FEES AND AFTER FEES AND FEES AND
YEAR EXPENSES EXPENSE RATIOS EXPENSES EXPENSES EXPENSES
------ --------------- ---------------- -------------- ------------------ ------------
1 5.00% 1.24% 3.76% $ 10,376.00 $ 126.33
--- ----- ---- ----- ----------- ----------
2 10.25% 1.24% 7.66% $ 10,766.14 $ 131.08
--- ----- ---- ----- ----------- ----------
3 15.76% 1.24% 11.71% $ 11,170.94 $ 136.01
--- ----- ---- ----- ----------- ----------
4 21.55% 1.24% 15.91% $ 11,590.97 $ 141.12
--- ----- ---- ----- ----------- ----------
5 27.63% 1.24% 20.27% $ 12,026.79 $ 146.43
--- ----- ---- ----- ----------- ----------
6 34.01% 1.24% 24.79% $ 12,479.00 $ 151.94
--- ----- ---- ----- ----------- ----------
7 40.71% 1.24% 29.48% $ 12,948.21 $ 157.65
--- ----- ---- ----- ----------- ----------
8 47.75% 1.24% 34.35% $ 13,435.06 $ 163.58
--- ----- ---- ----- ----------- ----------
9 55.13% 1.24% 39.40% $ 13,940.22 $ 169.73
--- ----- ---- ----- ----------- ----------
10 62.89% 1.24% 44.64% $ 14,464.37 $ 176.11
--- ----- ---- ----- ----------- ----------
TOTAL $ 1,499.98
--- ----------
DWS HEALTH CARE VIP - CLASS B
MAXIMUM INITIAL HYPOTHETICAL ASSUMED RATE
SALES CHARGE: INVESTMENT: OF RETURN:
0.00% $10,000 5%
--------------- -------------------------------- --------------------------------
CUMULATIVE CUMULATIVE HYPOTHETICAL
RETURN BEFORE RETURN AFTER YEAR-END BALANCE ANNUAL
FEES AND ANNUAL FUND FEES AND AFTER FEES AND FEES AND
YEAR EXPENSES EXPENSE RATIOS EXPENSES EXPENSES EXPENSES
------ --------------- ---------------- -------------- ------------------ ------------
1 5.00% 1.34% 3.66% $ 10,366.00 $ 136.45
--- ----- ---- ----- ----------- ----------
2 10.25% 1.34% 7.45% $ 10,745.40 $ 141.45
--- ----- ---- ----- ----------- ----------
3 15.76% 1.34% 11.39% $ 11,138.68 $ 146.62
--- ----- ---- ----- ----------- ----------
4 21.55% 1.34% 15.46% $ 11,546.35 $ 151.99
--- ----- ---- ----- ----------- ----------
5 27.63% 1.34% 19.69% $ 11,968.95 $ 157.55
--- ----- ---- ----- ----------- ----------
6 34.01% 1.34% 24.07% $ 12,407.01 $ 163.32
--- ----- ---- ----- ----------- ----------
7 40.71% 1.34% 28.61% $ 12,861.11 $ 169.30
--- ----- ---- ----- ----------- ----------
8 47.75% 1.34% 33.32% $ 13,331.83 $ 175.49
--- ----- ---- ----- ----------- ----------
9 55.13% 1.34% 38.20% $ 13,819.77 $ 181.92
--- ----- ---- ----- ----------- ----------
10 62.89% 1.34% 43.26% $ 14,325.57 $ 188.57
--- ----- ---- ----- ----------- ----------
TOTAL $ 1,612.66
--- ----------
53
PROSPECTUS May 1, 2010 Appendix
DWS EQUITY 500 INDEX VIP - CLASS B
MAXIMUM INITIAL HYPOTHETICAL ASSUMED RATE
SALES CHARGE: INVESTMENT: OF RETURN:
0.00% $10,000 5%
--------------- -------------------------------- -------------------------------
CUMULATIVE CUMULATIVE HYPOTHETICAL
RETURN BEFORE RETURN AFTER YEAR-END BALANCE ANNUAL
FEES AND ANNUAL FUND FEES AND AFTER FEES AND FEES AND
YEAR EXPENSES EXPENSE RATIOS EXPENSES EXPENSES EXPENSES
------ --------------- ---------------- -------------- ------------------ -----------
1 5.00% 0.59% 4.41% $ 10,441.00 $ 60.30
--- ----- ---- ----- ----------- --------
2 10.25% 0.59% 9.01% $ 10,901.45 $ 62.96
--- ----- ---- ----- ----------- --------
3 15.76% 0.59% 13.82% $ 11,382.20 $ 65.74
--- ----- ---- ----- ----------- --------
4 21.55% 0.59% 18.84% $ 11,884.16 $ 68.64
--- ----- ---- ----- ----------- --------
5 27.63% 0.59% 24.08% $ 12,408.25 $ 71.66
--- ----- ---- ----- ----------- --------
6 34.01% 0.59% 29.55% $ 12,955.45 $ 74.82
--- ----- ---- ----- ----------- --------
7 40.71% 0.59% 35.27% $ 13,526.79 $ 78.12
--- ----- ---- ----- ----------- --------
8 47.75% 0.59% 41.23% $ 14,123.32 $ 81.57
--- ----- ---- ----- ----------- --------
9 55.13% 0.59% 47.46% $ 14,746.16 $ 85.16
--- ----- ---- ----- ----------- --------
10 62.89% 0.59% 53.96% $ 15,396.46 $ 88.92
--- ----- ---- ----- ----------- --------
TOTAL $ 737.89
--- --------
DWS EQUITY 500 INDEX VIP - CLASS B2
MAXIMUM INITIAL HYPOTHETICAL ASSUMED RATE
SALES CHARGE: INVESTMENT: OF RETURN:
0.00% $10,000 5%
--------------- -------------------------------- -------------------------------
CUMULATIVE CUMULATIVE HYPOTHETICAL
RETURN BEFORE RETURN AFTER YEAR-END BALANCE ANNUAL
FEES AND ANNUAL FUND FEES AND AFTER FEES AND FEES AND
YEAR EXPENSES EXPENSE RATIOS EXPENSES EXPENSES EXPENSES
------ --------------- ---------------- -------------- ------------------ -----------
1 5.00% 0.74% 4.26% $ 10,426.00 $ 75.58
--- ----- ---- ----- ----------- --------
2 10.25% 0.74% 8.70% $ 10,870.15 $ 78.80
--- ----- ---- ----- ----------- --------
3 15.76% 0.74% 13.33% $ 11,333.22 $ 82.15
--- ----- ---- ----- ----------- --------
4 21.55% 0.74% 18.16% $ 11,816.01 $ 85.65
--- ----- ---- ----- ----------- --------
5 27.63% 0.74% 23.19% $ 12,319.37 $ 89.30
--- ----- ---- ----- ----------- --------
6 34.01% 0.74% 28.44% $ 12,844.18 $ 93.11
--- ----- ---- ----- ----------- --------
7 40.71% 0.74% 33.91% $ 13,391.34 $ 97.07
--- ----- ---- ----- ----------- --------
8 47.75% 0.74% 39.62% $ 13,961.81 $ 101.21
--- ----- ---- ----- ----------- --------
9 55.13% 0.74% 45.57% $ 14,556.58 $ 105.52
--- ----- ---- ----- ----------- --------
10 62.89% 0.74% 51.77% $ 15,176.69 $ 110.01
--- ----- ---- ----- ----------- --------
TOTAL $ 918.40
--- --------
54
PROSPECTUS May 1, 2010 Appendix
DWS SMALL CAP INDEX VIP - CLASS B
MAXIMUM INITIAL HYPOTHETICAL ASSUMED RATE
SALES CHARGE: INVESTMENT: OF RETURN:
0.00% $10,000 5%
--------------- -------------------------------- ---------------------------------
CUMULATIVE CUMULATIVE HYPOTHETICAL
RETURN BEFORE RETURN AFTER YEAR-END BALANCE ANNUAL
FEES AND ANNUAL FUND FEES AND AFTER FEES AND FEES AND
YEAR EXPENSES EXPENSE RATIOS EXPENSES EXPENSES EXPENSES
------ --------------- ---------------- -------------- ------------------ -------------
1 5.00% 0.81% 4.19% $ 10,419.00 $ 82.70
--- ----- ---- ----- ----------- ----------
2 10.25% 0.81% 8.56% $ 10,855.56 $ 86.16
--- ----- ---- ----- ----------- ----------
3 15.76% 0.81% 13.10% $ 11,310.40 $ 89.77
--- ----- ---- ----- ----------- ----------
4 21.55% 0.81% 17.84% $ 11,784.31 $ 93.53
--- ----- ---- ----- ----------- ----------
5 27.63% 0.81% 22.78% $ 12,278.07 $ 97.45
--- ----- ---- ----- ----------- ----------
6 34.01% 0.81% 27.93% $ 12,792.52 $ 101.54
--- ----- ---- ----- ----------- ----------
7 40.71% 0.81% 33.29% $ 13,328.53 $ 105.79
--- ----- ---- ----- ----------- ----------
8 47.75% 0.81% 38.87% $ 13,887.00 $ 110.22
--- ----- ---- ----- ----------- ----------
9 55.13% 0.81% 44.69% $ 14,468.86 $ 114.84
--- ----- ---- ----- ----------- ----------
10 62.89% 0.81% 50.75% $ 15,075.11 $ 119.65
--- ----- ---- ----- ----------- ----------
TOTAL $ 1,001.65
--- ----------
ADDITIONAL INDEX INFORMATION
DWS GROWTH & INCOME VIP
RUSSELL 1000 (Reg. TM) INDEX is an unmanaged index that measures the
performance of the 1,000 largest companies in the Russell 3000 Index, which
represents approximately 92% of the total market capitalization of the Russell
3000 Index.
DWS CAPITAL GROWTH VIP
RUSSELL 1000 (Reg. TM) GROWTH INDEX is an unmanaged index that consists of
those stocks in the Russell 1000 (Reg. TM) Index that have higher price-to-book
ratios and higher forecasted growth values. Russell 1000 (Reg. TM) Index is an
unmanaged price-only index of the 1,000 largest capitalized companies that are
domiciled in the US and whose common stocks are traded.
DWS GLOBAL OPPORTUNITIES VIP
THE S&P DEVELOPED SMALLCAP INDEX (formerly the S&P/Citigroup Extended Market
Index - World) is an unmanaged index of small-capitalization stocks within 26
countries around the globe.
DWS INTERNATIONAL VIP
MORGAN STANLEY COUNTRY INDEX (MSCI) EUROPE, AUSTRALASIA, FAR EAST (EAFE( (Reg.
TM))) is an unmanaged index that tracks international stock performance in the
21 developed markets of Europe, Australasia and the Far East. Returns reflect
reinvestment of dividends net of withholding taxes.
DWS HEALTH CARE VIP
STANDARD & POOR'S 500 INDEX (S&P 500) is an unmanaged, capitalization-weighted
index of 500 stocks. The index is designed to measure performance of the broad
domestic economy through changes in the aggregate market value of 500 stocks
representing all major industries.
S&P NORTH AMERICAN HEALTH CARE SECTOR INDEX (NAME CHANGED FROM S&P GOLDMAN
SACHS HEALTH CARE INDEX effective March 31, 2008) is an unmanaged,
market-capitalization-weighted index of 114 stocks designed to measure the
performance of companies in the health care sector.
DWS EQUITY 500 INDEX VIP
STANDARD & POOR'S 500 INDEX (S&P 500) is an unmanaged, capitalization-weighted
index of 500 stocks. The index is designed to measure performance of the broad
domestic economy through changes in the aggregate market value of 500 stocks
representing all major industries.
DWS SMALL CAP INDEX VIP
RUSSELL 2000 (Reg. TM) INDEX is an unmanaged index that measures the
performance of the 2,000 smallest companies in the Russell 3000 Index, which
represents approximately 8% of the total market capitalization of the Russell
3000 Index.
55
PROSPECTUS May 1, 2010 Appendix
TO GET MORE INFORMATION
SHAREHOLDER REPORTS. These include commentary from a fund's management team
about recent market conditions and the effects of a fund's strategies on its
performance. They also have detailed performance figures, a list of everything
a fund owns, and its financial statements. Shareholders get these reports
automatically.
STATEMENT OF ADDITIONAL INFORMATION (SAI). This tells you more about a fund's
features and policies, including additional risk information. The SAI is
incorporated by reference into this document (meaning that it's legally part of
this prospectus).
For a free copy of any of these documents or to request other information about
a fund, contact DWS Investments at the phone number or address listed below.
SAIs and shareholder reports are also available through the DWS Investments Web
site at www.dws-investments.com. These documents and other information about
each fund are available from the EDGAR Database on the SEC's Internet site at
www.sec.gov. If you like, you may obtain copies of this information, after
paying a copying fee, by e-mailing a request to publicinfo@sec.gov or by
writing the SEC at the address listed below.
You can also review and copy these documents and other information about each
fund, including each fund's SAI, at the SEC's Public Reference Room in
Washington, D.C. Information on the operation of the SEC's Public Reference
Room may be obtained by calling (800) SEC-0330.
CONTACT INFORMATION
DWS INVESTMENTS 222 South Riverside Plaza
Chicago, IL 60606-5808
www.dws-investments.com
(800) 728-3337
SEC 100 F Street, N.E.
Washington, D.C. 20549-0102
WWW.SEC.GOV
(800) SEC-0330
DISTRIBUTOR DWS Investments Distributors, Inc.
222 South Riverside Plaza
Chicago, IL 60606-5808
(800) 621-1148
SEC FILE NUMBER DWS Variable Series I
811-04257
DWS Investments VIT Funds
811-07507
RESHAPING INVESTING. [DWS INVESTMENTS LOGO]
Deutsche Bank Group
(05/01/10) 1B-1
[GRAPHIC APPEARS HERE]
PROSPECTUS
MAY 1, 2010
DWS VARIABLE SERIES II
CLASS A
...............................................................................
DWS Alternative Asset Allocation Plus VIP
DWS Balanced VIP
DWS Blue Chip VIP
DWS Core Fixed Income VIP
DWS Diversified International Equity VIP
DWS Dreman Small Mid Cap Value VIP
DWS Global Thematic VIP
DWS Government & Agency Securities VIP
DWS High Income VIP
DWS Large Cap Value VIP
DWS Mid Cap Growth VIP
DWS Money Market VIP
DWS Small Cap Growth VIP
DWS Strategic Income VIP
DWS Strategic Value VIP
DWS Technology VIP
DWS Turner Mid Cap Growth VIP
...............................................................................
This prospectus should be read in conjunction with the variable life insurance
or variable annuity contract prospectus and plan documents for tax-qualified
plans. These shares are available and are being marketed exclusively as a
pooled funding vehicle for life insurance companies writing all types of
variable life insur ance policies and variable annuity contracts.
The Securities and Exchange Commission (SEC) does not approve or disapprove
these shares or determine whether the information in this prospectus is
truthful or complete. It is a criminal offense for anyone to inform you
otherwise.
RESHAPING INVESTING. [DWS INVESTMENTS LOGO]
Deutsche Bank Group
TABLE OF CONTENTS
DWS ALTERNATIVE ASSET ALLOCATION
PLUS VIP
Investment Objective........................ 1
Fees and Expenses of the Fund............... 1
Principal Investment Strategy............... 1
Main Risks.................................. 2
The Fund's Performance History.............. 3
Management.................................. 3
Purchase and Sale of Fund Shares............ 4
Tax Information............................. 4
Payments to Financial Intermediaries........ 4
DWS BALANCED VIP
Investment Objective........................ 5
Fees and Expenses of the Fund............... 5
Principal Investment Strategy............... 5
Main Risks.................................. 6
Past Performance............................ 7
Management.................................. 7
Purchase and Sale of Fund Shares............ 8
Tax Information............................. 8
Payments to Financial Intermediaries........ 8
DWS BLUE CHIP VIP
Investment Objective........................ 9
Fees and Expenses of the Fund............... 9
Principal Investment Strategy............... 9
Main Risks.................................. 10
Past Performance............................ 10
Management.................................. 11
Purchase and Sale of Fund Shares............ 11
Tax Information............................. 11
Payments to Financial Intermediaries........ 11
DWS CORE FIXED INCOME VIP
Investment Objective........................ 12
Fees and Expenses of the Fund............... 12
Principal Investment Strategy............... 12
Main Risks.................................. 13
Past Performance............................ 13
Management.................................. 14
Purchase and Sale of Fund Shares............ 14
Tax Information............................. 14
Payments to Financial Intermediaries........ 14
DWS DIVERSIFIED INTERNATIONAL
EQUITY VIP
Investment Objective........................ 15
Fees and Expenses of the Fund............... 15
Principal Investment Strategy............... 15
Main Risks.................................. 16
Past Performance............................ 16
Management.................................. 17
Purchase and Sale of Fund Shares............ 17
Tax Information............................. 17
Payments to Financial Intermediaries........ 17
DWS DREMAN SMALL MID CAP VALUE
VIP
Investment Objective........................ 18
Fees and Expenses of the Fund............... 18
Principal Investment Strategy............... 18
Main Risks.................................. 19
Past Performance............................ 19
Management.................................. 20
Purchase and Sale of Fund Shares............ 20
Tax Information............................. 20
Payments to Financial Intermediaries........ 20
DWS GLOBAL THEMATIC VIP
Investment Objective........................ 21
Fees and Expenses of the Fund............... 21
Principal Investment Strategy............... 21
Main Risks.................................. 22
Past Performance............................ 22
Management.................................. 23
Purchase and Sale of Fund Shares............ 23
Tax Information............................. 23
Payments to Financial Intermediaries........ 23
DWS GOVERNMENT & AGENCY
SECURITIES VIP
Investment Objective....................... 24
Fees and Expenses of the Fund.............. 24
Principal Investment Strategy.............. 24
Main Risks................................. 25
Past Performance........................... 25
Management................................. 26
Purchase and Sale of Fund Shares........... 26
Tax Information............................ 26
Payments to Financial Intermediaries....... 26
DWS HIGH INCOME VIP
Investment Objective....................... 27
Fees and Expenses of the Fund.............. 27
Principal Investment Strategy.............. 27
Main Risks................................. 28
Past Performance........................... 28
Management................................. 29
Purchase and Sale of Fund Shares........... 29
Tax Information............................ 29
Payments to Financial Intermediaries....... 29
DWS LARGE CAP VALUE VIP
Investment Objective....................... 30
Fees and Expenses of the Fund.............. 30
Principal Investment Strategy.............. 30
Main Risks................................. 31
Past Performance........................... 31
Management................................. 32
Purchase and Sale of Fund Shares........... 32
Tax Information............................ 32
Payments to Financial Intermediaries....... 32
DWS MID CAP GROWTH VIP
Investment Objective....................... 33
Fees and Expenses of the Fund.............. 33
Principal Investment Strategy.............. 33
Main Risks................................. 34
Past Performance........................... 34
Management................................. 35
Purchase and Sale of Fund Shares........... 35
Tax Information............................ 35
Payments to Financial Intermediaries....... 35
DWS MONEY MARKET VIP
Investment Objective....................... 36
Fees and Expenses of the Fund.............. 36
Principal Investment Strategy.............. 36
Main Risks................................. 36
Past Performance........................... 37
Management................................. 38
Purchase and Sale of Fund Shares........... 38
Tax Information............................ 38
Payments to Financial Intermediaries....... 38
DWS SMALL CAP GROWTH VIP
Investment Objective....................... 39
Fees and Expenses of the Fund.............. 39
Principal Investment Strategy.............. 39
Main Risks................................. 40
Past Performance........................... 40
Management................................. 41
Purchase and Sale of Fund Shares........... 41
Tax Information............................ 41
Payments to Financial Intermediaries....... 41
DWS STRATEGIC INCOME VIP
Investment Objective....................... 42
Fees and Expenses of the Fund.............. 42
Principal Investment Strategy.............. 42
Main Risks................................. 43
Past Performance........................... 44
Management................................. 44
Purchase and Sale of Fund Shares........... 44
Tax Information............................ 44
Payments to Financial Intermediaries....... 44
DWS STRATEGIC VALUE VIP
Investment Objective....................... 45
Fees and Expenses of the Fund.............. 45
Principal Investment Strategy.............. 45
Main Risks................................. 46
Past Performance........................... 46
Management................................. 47
Purchase and Sale of Fund Shares........... 47
Tax Information............................ 47
Payments to Financial Intermediaries....... 47
DWS TECHNOLOGY VIP
Investment Objective....................... 48
Fees and Expenses of the Fund.............. 48
Principal Investment Strategy.............. 48
Main Risks................................. 49
Past Performance........................... 50
Management................................. 50
Purchase and Sale of Fund Shares........... 50
Tax Information............................ 50
Payments to Financial Intermediaries....... 50
DWS TURNER MID CAP GROWTH VIP
Investment Objective....................... 51
Fees and Expenses of the Fund.............. 51
Principal Investment Strategy.............. 51
Main Risks................................. 52
Past Performance........................... 52
Management................................. 53
Purchase and Sale of Fund Shares........... 53
Tax Information............................ 53
Payments to Financial Intermediaries....... 53
FUND DETAILS
Additional Information About Fund Strategies and
Risks.............................................. 54
DWS Alternative Asset Allocation Plus VIP.......... 54
DWS Balanced VIP................................... 58
DWS Blue Chip VIP.................................. 61
DWS Core Fixed Income VIP.......................... 62
DWS Diversified International Equity VIP........... 63
DWS Dreman Small Mid Cap Value VIP................. 65
DWS Global Thematic VIP............................ 67
DWS Government & Agency Securities VIP............. 68
DWS High Income VIP................................ 69
DWS Large Cap Value VIP............................ 71
DWS Mid Cap Growth VIP............................. 72
DWS Money Market VIP............................... 74
DWS Small Cap Growth VIP........................... 75
DWS Strategic Income VIP........................... 77
DWS Strategic Value VIP............................ 79
DWS Technology VIP................................. 80
DWS Turner Mid Cap Growth VIP...................... 82
Other Policies and Risks........................... 84
Who Manages and Oversees the Funds................. 85
Management......................................... 88
INVESTING IN THE FUNDS
Your Investment in the Funds....................... 93
Policies about transactions........................ 93
Buying and Selling Shares.......................... 94
How each Fund Calculates Share Price............... 96
Distributions...................................... 97
Taxes.............................................. 97
FINANCIAL HIGHLIGHTS............................... 99
APPENDIX........................................... 109
Hypothetical Expense Summary....................... 109
Additional Index Information....................... 117
-------------------------------------------------------------------------------
YOUR INVESTMENT IN A FUND IS NOT A BANK DEPOSIT AND IS NOT INSURED OR GUARANTEED
BY THE FEDERAL DEPOSIT INSURANCE CORPORATION OR ANY OTHER GOVERNMENT AGENCY,
ENTITY OR PERSON.
-------------------------------------------------------------------------------
[DWS INVESTMENTS LOGO]
Deutsche Bank Group
DWS ALTERNATIVE ASSET ALLOCATION PLUS VIP
INVESTMENT OBJECTIVE
The fund seeks capital appreciation.
FEES AND EXPENSES OF THE FUND
This table describes the fees and expenses you may pay if you buy and hold
shares of the fund. This information does not reflect fees associated with the
separate account that invests in the fund or any variable life insurance policy
or variable annuity contract for which the fund is an investment option. These
fees will increase expenses.
SHAREHOLDER FEES
(paid directly from your investment) None
-------------------------------------- -----
ANNUAL FUND OPERATING EXPENSES (expenses that you pay each year as a % of the
value of your investment)
A
----------
Management fee 0.23
------------------------------------------------------ ----
Distribution/service
(12b-1) fees None
------------------------------------------------------ -----
Other expenses (includes an administrative fee) 3.63
------------------------------------------------------ -----
Acquired funds (underlying funds) fees and expenses 1.23
------------------------------------------------------ -----
TOTAL ANNUAL FUND OPERATING EXPENSES 5.09
------------------------------------------------------ -----
Less fee waiver/expense reimbursement 3.65
------------------------------------------------------ -----
TOTAL ANNUAL FUND OPERATING EXPENSES AFTER FEE WAIVER
AND/OR
EXPENSE REIMBURSEMENT 1.44
------------------------------------------------------ -----
The Advisor has contractually agreed through April 30, 2011 to waive and/or
reimburse fund expenses so that the fund's total annual operating expenses will
not exceed 0.21% for Class A. The agreement may only be terminated with the
consent of the fund's Board and does not extend to extraordinary expenses,
taxes, brokerage and interest expense and acquired funds (underlying funds)
fees and expenses (estimated at 1.23%).
EXAMPLE
This Example is intended to help you compare the cost of investing in the fund
with the cost of investing in other mutual funds. The Example assumes that you
invest $10,000 in the fund for the time periods indicated and then redeem all
of your shares at the end of those periods. The Example also assumes that your
investment has a 5% return each year and that the fund's operating expenses
(including one year of capped expenses) remain the same. Although your actual
costs may be higher or lower, based on these assumptions your costs would be:
1 YEAR 3 YEARS 5 YEARS 10 YEARS
-------- --------- --------- ---------
$147 $1,200 $2,251 $4,871
--- ---- ------ ------ ------
PORTFOLIO TURNOVER
The fund pays transaction costs when it buys and sells securities (or "turns
over" its portfolio). A higher portfolio turnover may indicate higher
transaction costs. These costs are not reflected in annual fund operating
expenses or in the expense example, but are reflected in fund performance.
Portfolio turnover rate for fiscal year 2009: 155%.
PRINCIPAL INVESTMENT STRATEGY
MAIN INVESTMENTS. The fund seeks to achieve its objective by investing in
alternative (or non-traditional) asset categories and investment strategies.
Investments may be made in other DWS funds or directly in the securities and
derivative instruments in which such DWS funds could invest. The fund may also
invest in Exchange Traded Funds (ETFs) to gain a desired economic exposure to a
particular asset category that is not available through a DWS fund. The fund's
allocations among direct investments and other DWS funds may vary over time.
MANAGEMENT PROCESS. The fund allocates its assets among the following
strategies and/or asset categories: market neutral, inflation-protection,
commodities, real estate, floating rate loans, infrastructure and emerging
markets.
The fund may make allocations ranging from 0% to 30% of its assets in a
particular strategy or asset category. In addition, the fund may seek exposure
to hedge funds through warrants, swaps and similar derivative instruments.
3
PROSPECTUS May 1, 2010 DWS Alternative Asset Allocation Plus VIP
IGAP STRATEGY. In addition to the fund's main investment strategy, portfolio
management seeks to enhance returns by employing a global tactical asset
allocation overlay strategy called iGAP (integrated Global Alpha Platform),
which attempts to take advantage of mispricings within global equity, bond,
commodity and currency markets. The iGAP strategy uses derivatives (which are
contracts or other instruments whose value is based on, for example, indices,
currencies or securities), in particular exchange-traded futures contracts on
global equities, bonds and commodities, and over-the-counter forward currency
contracts. The iGAP strategy, with respect to the fund, will not be used until
assets of the fund exceed $50 million, however, the fund may have indirect
exposure to the iGAP strategy through other DWS funds.
The fund may trade actively. This could raise transaction costs (thus lowering
returns).
--------------------------------------------------------------------------------
DERIVATIVES. The fund may use various types of derivatives outside of the iGAP
strategy for hedging, risk management or non-hedging purposes to seek to
enhance potential gains. The fund may use derivatives as a substitute for
direct investment in a particular asset class or to keep cash on hand to meet
shareholder redemptions or other needs.
SECURITIES LENDING. The fund may lend securities (up to one-third of total
assets) to approved institutions.
--------------------------------------------------------------------------------
MAIN RISKS
There are several risk factors that could hurt the fund's performance, cause
you to lose money or cause the fund's performance to trail that of other
investments.
Because the fund invests in underlying funds, the risks listed here include
those of the various underlying funds as well as those of the fund itself.
Therefore, in these risk descriptions the term "the fund" may refer to the fund
itself, one or more underlying funds, or both.
ASSET ALLOCATION RISK. Portfolio management may favor one or more types of
investments or assets that underperform other investments, assets, or
securities markets as a whole. To the extent that alternative asset categories
underperform the general stock market, the fund may underperform funds that
invest mainly in stocks. Anytime portfolio management buys or sells securities
in order to adjust the fund's asset allocation this will increase portfolio
turnover and generate transaction costs.
STOCK MARKET RISK. When stock prices fall, you should expect the value of your
investment to fall as well.
UNDERLYING FUNDS RISK. Because the fund may invest in underlying funds, the
fund's performance will be directly related to the performance of the
underlying portfolios or funds. To the extent that a given underlying fund
underperforms its benchmark or its fund peer group, it may contribute to
underperformance by the fund. In addition, the fund indirectly pays a portion
of the expenses incurred by the underlying funds, which lowers performance. To
the extent that the fund's allocations favor underlying funds with higher
expenses, the overall cost of investing paid by the fund will be higher.
FOREIGN INVESTMENT RISK. To the extent the fund invests in companies based
outside the US, it faces the risks inherent in foreign investing. Adverse
political, economic or social developments could undermine the value of the
fund's investments or prevent the fund from realizing their full value.
Financial reporting standards for companies based in foreign markets differ
from those in the US. Additionally, foreign securities markets generally are
smaller and less liquid than US markets. To the extent that the fund invests in
non-US dollar denominated foreign securities, changes in currency exchange
rates may affect the US dollar value of foreign securities or the income or
gain received on these securities. Foreign investment risks are greater in
emerging markets than in developed markets. Emerging market investments are
often considered speculative.
INTEREST RATE RISK. When interest rates rise, prices of debt securities
generally decline. The longer the duration of the fund's debt securities, the
more sensitive it will be to interest rate changes. (As a general rule, a 1%
rise in interest rates means a 1% fall in value for every year of duration.)
COMMODITIES-RELATED INVESTMENTS RISK. The commodities-linked derivatives
instruments in which the fund invests are more volatile than investments in
equity and fixed income securities and may subject the fund to special risks
that do not apply to all derivatives transactions.
INFLATION-INDEXED BOND RISK. Any rise in interest rates may cause
inflation-indexed bonds to decline in price, hurting fund performance. If
interest rates rise owing to reasons other than inflation, the fund's
investment in these securities may not be fully protected from the effects of
rising interest rates.
CREDIT RISK. The fund's performance could be hurt if a securitiy declines in
credit quality or goes into default, or if an issuer does not make timely
payments of interest or principal.
SMALL COMPANY RISK. Small company stocks tend to be more volatile and less
liquid than large company stocks. Small companies are less widely followed by
stock analysts and less information about them is available to investors.
SENIOR LOANS RISK. Because Senior Loans are not rated by a rating agency,
registered with the Securities and Exchange Commission or any state securities
commission, or listed on any national securities exchange, there may be less
publicly available information about them then for registered or
exchange-listed securities. Also, because portfolio management relies mainly on
its own evaluation of the creditworthiness of borrowers, the fund is
particularly dependent on portfolio management's analytical
4
PROSPECTUS May 1, 2010 DWS Alternative Asset Allocation Plus VIP
abilities. Senior Loans involve other risks described elsewhere in this
prospectus, including conflict of interest risk, credit risk, interest rate
risk, liquidity risk, and prepayment and extension risk.
FOCUS RISK. To the extent that the fund focuses its investments in particular
industries, asset classes or sectors of the economy, any market price
movements, regulatory or technological changes, or economic conditions
affecting companies in those industries, asset classes or sectors will have a
significant impact on the fund's performance.
SHORT SALE RISK. If the fund sells a security short and subsequently has to buy
the security back at a higher price, the fund will lose money on the
transaction. Any loss will be increased by the amount of compensation, interest
or dividends and transaction costs the fund must pay to a lender of the
security. The amount the fund could lose on a short sale is theoretically
unlimited (as compared to a long position, where the maximum loss is the amount
invested).
SECURITIES LENDING RISK. Any decline in the value of a portfolio security that
occurs while the security is out on loan is borne by the fund, and will
adversely affect performance. Also, there may be delays in recovery of
securities loaned or even a loss of rights in the collateral should the
borrower of the securities fail financially while holding the security.
IGAP RISK. The success of the iGAP strategy depends, in part, on portfolio
management's ability to analyze the correlation between various global markets
and asset classes. If portfolio management's correlation analysis proves to be
incorrect, losses to the fund may be significant and may substantially exceed
the intended level of market exposure for the iGAP strategy.
DERIVATIVES RISK. Risks associated with derivatives include the risk that the
derivative is not well correlated with the security, index or currency to which
it relates; the risk that derivatives may result in losses or missed
opportunities; the risk that the fund will be unable to sell the derivative
because of an illiquid secondary market; the risk that a counterparty is
unwilling or unable to meet its obligation; and the risk that the derivative
transaction could expose the fund to the effects of leverage, which could
increase the fund's exposure to the market and magnify potential losses.
SECURITY SELECTION RISK. The securities in the fund's portfolio may decline in
value. Portfolio management could be wrong in its analysis of industries,
companies, economic trends, the relative attractiveness of different securities
or other matters.
BORROWING RISK. To the extent that the fund borrows money for investment
purposes, it creates leverage, meaning that changes in the prices of securities
it owns will have a greater effect on the share price of the fund.
CONFLICT OF INTEREST RISK. To avoid violating laws on self-dealing, the fund
may not be able to invest in Senior Loans issued or marketed by an affiliate of
the Advisor at the desired timing or price.
COUNTERPARTY RISK. A financial institution or other counterparty with whom the
fund does business (such as trading or securities lending), or that
underwrites, distributes or guarantees any investments or contracts that the
fund owns or is otherwise exposed to, may decline in financial health and
become unable to honor its commitments, which could lead to losses for the
fund.
ETF RISK. An ETF is subject to the risks of the assets in which it invests as
well as those of the investment strategy it follows. The fund incurs brokerage
costs when it buys and sells shares of and ETF and also bears its proportionate
share of the ETF's fees and expenses, which are passed through to ETF
shareholders.
LIQUIDITY RISK. In certain situations, it may be difficult or impossible to
sell an investment in an orderly fashion at an acceptable price. This may be an
ongoing risk for some investments, such as derivatives or restricted securities
that typically trade only among a limited number of investors.
PREPAYMENT AND EXTENSION RISK. When interest rates fall, issuers of high
interest debt obligations may pay off the debts earlier than expected
(prepayment risk), and the fund may have to reinvest the proceeds at lower
yields. When interest rates rise, issuers of lower interest debt obligations
may pay off the debts later than expected (extension risk), thus keeping the
fund's assets tied up in lower interest debt obligations. These events could
hurt fund performance.
PRICING RISK. If market conditions make it difficult to value some investments,
the fund may value these investments using more subjective methods, such as
fair value pricing.
TAX STATUS RISK. Income from certain commodity-linked derivatives may not
constitute "qualifying income" to the fund. If such income were not to
constitute qualifying income, the fund might be subject to tax at the fund
level.
THE FUND'S PERFORMANCE HISTORY
Since the fund commenced operations on February 2, 2009, performance
information is not available for a full calendar year.
MANAGEMENT
INVESTMENT ADVISOR
Deutsche Investment Management Americas Inc.
SUBADVISOR
RREEF America L.L.C.
SUB-SUBADVISOR
Deutsche Investments Australia Limited
5
PROSPECTUS May 1, 2010 DWS Alternative Asset Allocation Plus VIP
SUB-SUBADVISOR
RREEF Global Advisers Limited
SUB-SUBADVISOR
Deutsche Asset Management (Hong Kong) Limited
PORTFOLIO MANAGER(S)
ROBERT WANG, MANAGING DIRECTOR. Portfolio Manager of the fund. Joined the fund
in 2009.
INNA OKOUNKOVA, DIRECTOR. Portfolio Manager of the fund. Joined the fund in
2009.
THOMAS PICCIOCHI, DIRECTOR. Portfolio Manager of the fund. Joined the fund in
2009.
PURCHASE AND SALE OF FUND SHARES
THE FUND IS INTENDED FOR USE IN A VARIABLE INSURANCE PRODUCT. You should
contact the sponsoring insurance company for information on how to purchase and
sell shares of the fund.
TAX INFORMATION
Generally, owners of variable annuity and variable life contracts are not
subject to current federal income taxation on distributions of income or gains
with respect to such contracts. For further information concerning federal
income tax consequences for the holders of variable annuity contracts and
variable life insurance policies, such holders should consult the prospectus
used in connection with the issuance of their particular contracts or policies.
PAYMENTS TO FINANCIAL INTERMEDIARIES
If you purchase the fund through selected affiliated and unaffiliated brokers,
dealers, participating insurance companies or other financial intermediaries,
the fund and its affiliates may pay the financial intermediary for the sale of
fund shares and related services. These payments may create a conflict of
interest by influencing the financial intermediary and your salesperson to
recommend the fund over another investment. Ask your salesperson or visit your
insurance company's web site for more information.
6
PROSPECTUS May 1, 2010 DWS Alternative Asset Allocation Plus VIP
[DWS INVESTMENTS LOGO]
Deutsche Bank Group
DWS BALANCED VIP
INVESTMENT OBJECTIVE
The fund seeks high total return, a combination of income and capital
appreciation.
FEES AND EXPENSES OF THE FUND
This table describes the fees and expenses you may pay if you buy and hold
shares of the fund. This information does not reflect fees associated with the
separate account that invests in the fund or any variable life insurance policy
or variable annuity contract for which the fund is an investment option. These
fees will increase expenses.
SHAREHOLDER FEES
(paid directly from your investment) None
-------------------------------------- -----
ANNUAL FUND OPERATING EXPENSES (expenses that you pay each year as a % of the
value of your investment)
A
----------
Management fee 0.37
---------------------------------------------------- ----
Distribution/service
(12b-1) fees None
---------------------------------------------------- -----
Other expenses (includes an administrative fee) 0.23
---------------------------------------------------- -----
Acquired funds (underlying funds) fees and expenses 0.02
---------------------------------------------------- -----
TOTAL ANNUAL FUND OPERATING EXPENSES 0.62
---------------------------------------------------- -----
EXAMPLE
This Example is intended to help you compare the cost of investing in the fund
with the cost of investing in other mutual funds. The Example assumes that you
invest $10,000 in the fund for the time periods indicated and then redeem all
of your shares at the end of those periods. The Example also assumes that your
investment has a 5% return each year and that the fund's operating expenses
remain the same. Although your actual costs may be higher or lower, based on
these assumptions your costs would be:
1 YEAR 3 YEARS 5 YEARS 10 YEARS
-------- --------- --------- ---------
$63 $199 $346 $774
--- --- ---- ---- ----
PORTFOLIO TURNOVER
The fund pays transaction costs when it buys and sells securities (or "turns
over" its portfolio). A higher portfolio turnover may indicate higher
transaction costs. These costs are not reflected in annual fund operating
expenses or in the expense example, but are reflected in fund performance.
Portfolio turnover rate for fiscal year 2009: 207%.
PRINCIPAL INVESTMENT STRATEGY
MAIN INVESTMENTS. The fund can buy many types of securities, among them common
stocks, convertible securities, corporate bonds, government bonds,
inflation-indexed bonds, mortgage- and asset-backed securities and
exchange-traded funds (ETFs). The fund can invest in securities of any size,
investment style category, or credit quality, and from any country (including
emerging markets). The fund normally invests approximately 60% of net assets in
common stocks and other equity securities and approximately 40% of net assets
in fixed-income securities, including non-investment grade high yield bonds.
The fund invests at least 25% of net assets in fixed-income senior securities.
MANAGEMENT PROCESS. Portfolio management allocates the fund's assets among
various asset categories, such as US and foreign equity of any size and style
(including emerging market equity), and US and foreign fixed income of any
credit quality (including emerging market bonds and inflation indexed bonds).
Portfolio management periodically reviews the fund's allocations and may adjust
them based on current or anticipated market conditions or to manage risk
consistent with the fund's overall investment strategy.
Within each asset category, portfolio management uses one or more investment
strategies for selecting equity and debt securities. Each investment strategy
is managed by a team that specializes in a particular asset category, and that
may use a variety of quantitative and qualitative techniques. Some asset
categories may be represented by ETFs.
7
PROSPECTUS May 1, 2010 DWS Balanced VIP
IGAP STRATEGY. In addition to the fund's main investment strategy, portfolio
management seeks to enhance returns by employing a global tactical asset
allocation overlay strategy called iGAP (integrated Global Alpha Platform),
which attempts to take advantage of mispricings within global bond, equity and
currency markets. The iGAP strategy uses derivatives (which are contracts or
other instruments whose value is based on, for example, indices, currencies or
securities), in particular exchange-traded futures contracts on global
bonds and equity indexes, and over-the-counter forward currency contracts.
The fund may trade actively. This could raise transaction costs (thus lowering
returns).
--------------------------------------------------------------------------------
DERIVATIVES. The fund may use various types of derivatives outside of the iGAP
strategy for hedging, risk management or non-hedging purposes to seek to
enhance potential gains. The fund may use derivatives as a substitute for
direct investment in a particular asset class or to keep cash on hand to meet
shareholder redemptions or other needs. In particular, portfolio management may
use futures, options, forward currency contracts, interest rate swaps and
credit default swaps.
SECURITIES LENDING. The fund may lend securities (up to one-third of total
assets) to approved institutions.
--------------------------------------------------------------------------------
MAIN RISKS
There are several risk factors that could hurt the fund's performance, cause
you to lose money or cause the fund's performance to trail that of other
investments.
ASSET ALLOCATION RISK. Portfolio management may favor an asset category that
underperforms relative to other asset categories. Changing allocations among
asset categories may increase portfolio turnover and transaction costs. Because
the different teams that manage portions of fund assets work independently,
more than one team may simultaneously place orders to buy or sell the same
security, which may cause the fund to pay a higher price (if buying) or receive
a lower price (if selling) than it otherwise might. If one team buys a security
while another is selling the same security, the net result to the fund would be
additional transaction costs with little or no change in exposure to the
security.
STOCK MARKET RISK. When stock prices fall, you should expect the value of your
investment to fall as well.
CREDIT RISK. A fund purchasing debt securities faces the risk that the
creditworthiness of an issuer may decline, causing the value of the debt
securities to decline. In addition, an issuer may not be able to make timely
payments on the interest and/or principal on the debt security it has issued.
Because the issuers of high-yield debt securities or junk bonds (debt
securities rated below the fourth highest category) may be in uncertain
financial health, the prices of their debt securities can be more vulnerable to
bad economic news or even the expectation of bad news, than investment-grade
debt securities.
INTEREST RATE RISK. When interest rates rise, prices of debt securities
generally decline. The longer the duration of the fund's debt securities, the
more sensitive it will be to interest rate changes. (As a general rule, a 1%
rise in interest rates means a 1% fall in value for every year of duration.)
IGAP RISK. The success of the iGAP strategy depends, in part, on portfolio
management's ability to analyze the correlation between various global markets
and asset classes. If portfolio management's correlation analysis proves to be
incorrect, losses to the fund may be significant and may substantially exceed
the intended level of market exposure for the iGAP strategy.
DERIVATIVES RISK. Risks associated with derivatives include the risk that the
derivative is not well correlated with the security, index or currency to which
it relates; the risk that derivatives may result in losses or missed
opportunities; the risk that the fund will be unable to sell the derivative
because of an illiquid secondary market; the risk that a counterparty is
unwilling or unable to meet its obligation; and the risk that the derivative
transaction could expose the fund to the effects of leverage, which could
increase the fund's exposure to the market and magnify potential losses.
FOREIGN INVESTMENT RISK. To the extent the fund invests in companies based
outside the US, it faces the risks inherent in foreign investing. Adverse
political, economic or social developments could undermine the value of the
fund's investments or prevent the fund from realizing their full value.
Financial reporting standards for companies based in foreign markets differ
from those in the US. Additionally, foreign securities markets generally are
smaller and less liquid than US markets. To the extent that the fund invests in
non-US dollar denominated foreign securities, changes in currency exchange
rates may affect the US dollar value of foreign securities or the income or
gain received on these securities. Foreign investment risks are greater in
emerging markets than in developed markets. Emerging market investments are
often considered speculative.
SECURITY SELECTION RISK. The securities in the fund's portfolio may decline in
value. Portfolio management could be wrong in its analysis of industries,
companies, economic trends, the relative attractiveness of different securities
or other matters.
SECURITIES LENDING RISK. Any decline in the value of a portfolio security that
occurs while the security is out on loan is borne by the fund, and will
adversely affect performance. Also, there may be delays in recovery of
securities loaned or even a loss of rights in the collateral should the
borrower of the securities fail financially while holding the security.
8
PROSPECTUS May 1, 2010 DWS Balanced VIP
COUNTERPARTY RISK. A financial institution or other counterparty with whom the
fund does business (such as trading or securities lending), or that
underwrites, distributes or guarantees any investments or contracts that the
fund owns or is otherwise exposed to, may decline in financial health and
become unable to honor its commitments, which could lead to losses for the
fund.
ETF RISK. An ETF is subject to the risks of the assets in which it invests as
well as those of the investment strategy it follows. The fund incurs brokerage
costs when it buys and sells shares of and ETF and also bears its proportionate
share of the ETF's fees and expenses, which are passed through to ETF
shareholders.
FOCUS RISK. To the extent that the fund focuses its investments in particular
industries, asset classes or sectors of the economy, any market price
movements, regulatory or technological changes, or economic conditions
affecting companies in those industries, asset classes or sectors will have a
significant impact on the fund's performance.
INFLATION-INDEXED BOND RISK. Any rise in interest rates may cause
inflation-indexed bonds to decline in price, hurting fund performance. If
interest rates rise owing to reasons other than inflation, the fund's
investment in these securities may not be fully protected from the effects of
rising interest rates.
LIQUIDITY RISK. In certain situations, it may be difficult or impossible to
sell an investment in an orderly fashion at an acceptable price. This may be an
ongoing risk for some investments, such as derivatives or restricted securities
that typically trade only among a limited number of investors.
PREPAYMENT AND EXTENSION RISK. When interest rates fall, issuers of high
interest debt obligations may pay off the debts earlier than expected
(prepayment risk), and the fund may have to reinvest the proceeds at lower
yields. When interest rates rise, issuers of lower interest debt obligations
may pay off the debts later than expected (extension risk), thus keeping the
fund's assets tied up in lower interest debt obligations. These events could
hurt fund performance.
PRICING RISK. If market conditions make it difficult to value some investments,
the fund may value these investments using more subjective methods, such as
fair value pricing.
REGIONAL FOCUS RISK. Focusing on a single country or region involves increased
currency, political, regulatory and other risks. To the extent the fund
concentrates its investments in a particular country or region, market swings
in such a targeted country or region will be likely to have a greater effect on
fund performance than they would in a more geographically diversified equity
fund.
SMALL COMPANY RISK. Small company stocks tend to be more volatile and less
liquid than large company stocks. Small companies are less widely followed by
stock analysts and less information about them is available to investors.
PAST PERFORMANCE
How a fund's returns vary from year to year can give an idea of its risk; so
can comparing fund performance to overall market performance (as measured by an
appropriate market index). Past performance may not indicate future results.
All performance figures below assume that dividends were reinvested. For more
recent performance figures, go to www.dws-investments.com (the Web site does
not form a part of this prospectus) or call the phone number for your share
class included in this prospectus. This information doesn't reflect fees
associated with the separate account that invests in the fund or any variable
life insurance policy or variable annuity contract for which the fund is an
investment option. These fees will reduce returns.
CALENDAR YEAR TOTAL RETURNS (%) (Class A)
[BAR GRAPHIC OMITTED HERE]
[BAR GRAPHIC DATA]
-2.63 -6.09 -15.17 18.10 6.64 4.30 10.24 4.84 -27.33 23.43
2000 2001 2002 2003 2004 2005 2006 2007 2008 2009
Best Quarter: 12.93%, Q2 2009 Worst Quarter: -15.19%, Q4 2008
Year-to-Date as of 3/31/10: 3.75%
AVERAGE ANNUAL TOTAL RETURNS
(For periods ended 12/31/2009 expressed as a %)
CLASS 1 5 10
INCEPTION YEAR YEARS YEARS
----------- ---------- --------- ---------
CLASS A 4/6/82 23.43 1.57 0.55
---------------------- ------ ----- ---- -----
RUSSELL 1000 INDEX 28.43 0.79 -0.49
---------------------- ------ ----- ---- ------
BARCLAYS CAPITAL U.S.
AGGREGATE INDEX 5.93 4.97 6.33
---------------------- ------ ----- ---- ------
BLENDED INDEX 22.32 2.84 2.41
---------------------- ------ ----- ---- ------
The Advisor believes the additional Barclays Capital U.S. Aggregate Index and
the Blended Index reflect typical fund asset allocations and represent the
fund's overall investment process.
The BLENDED INDEX consists of the Russell 1000 (Reg. TM) Growth Index (20%),
Russell 1000 (Reg. TM) Value Index (20%), Russell 2000 (Reg. TM) Index (6%),
Morgan Stanley Capital International Europe, Australasia and the Far East (MSCI
EAFE (Reg. TM)) Small Cap Index (3%), MSCI EAFE (Reg. TM) Index (8%), MSCI
Emerging Markets Free Index (3%), Barclays Capital U.S. Aggregate Index (27%),
Credit Suisse High Yield Index (3%), Barclays Capital Global TIPS Index
unhedged (5%) and BofA Merrill Lynch 3-Month US Treasury Bill Index (5%).
MANAGEMENT
INVESTMENT ADVISOR
Deutsche Investment Management Americas Inc.
SUBADVISOR
Deutsche Asset Management International GmbH
9
PROSPECTUS May 1, 2010 DWS Balanced VIP
PORTFOLIO MANAGER(S)
ROBERT WANG, MANAGING DIRECTOR. Portfolio Manager of the fund. Joined the fund
in 2005.
INNA OKOUNKOVA, DIRECTOR. Portfolio Manager of the fund. Joined the fund in
2005.
THOMAS PICCIOCHI, DIRECTOR. Portfolio Manager of the fund. Joined the fund in
2007.
PURCHASE AND SALE OF FUND SHARES
THE FUND IS INTENDED FOR USE IN A VARIABLE INSURANCE PRODUCT. You should
contact the sponsoring insurance company for information on how to purchase and
sell shares of the fund.
TAX INFORMATION
Generally, owners of variable annuity and variable life contracts are not
subject to current federal income taxation on distributions of income or gains
with respect to such contracts. For further information concerning federal
income tax consequences for the holders of variable annuity contracts and
variable life insurance policies, such holders should consult the prospectus
used in connection with the issuance of their particular contracts or policies.
PAYMENTS TO FINANCIAL INTERMEDIARIES
If you purchase the fund through selected affiliated and unaffiliated brokers,
dealers, participating insurance companies or other financial intermediaries,
the fund and its affiliates may pay the financial intermediary for the sale of
fund shares and related services. These payments may create a conflict of
interest by influencing the financial intermediary and your salesperson to
recommend the fund over another investment. Ask your salesperson or visit your
insurance company's web site for more information.
10
PROSPECTUS May 1, 2010 DWS Balanced VIP
[DWS INVESTMENTS LOGO]
Deutsche Bank Group
DWS BLUE CHIP VIP
INVESTMENT OBJECTIVE
The fund seeks growth of capital and income.
FEES AND EXPENSES OF THE FUND
This table describes the fees and expenses you may pay if you buy and hold
shares of the fund. This information does not reflect fees associated with the
separate account that invests in the fund or any variable life insurance policy
or variable annuity contract for which the fund is an investment option. These
fees will increase expenses.
SHAREHOLDER FEES
(paid directly from your investment) None
-------------------------------------- -----
ANNUAL FUND OPERATING EXPENSES (expenses that you pay each year as a % of the
value of your investment)
A
----------
Management fee 0.55
------------------------------------------------ ----
Distribution/service
(12b-1) fees None
------------------------------------------------ -----
Other expenses (includes an administrative fee) 0.20
------------------------------------------------ -----
TOTAL ANNUAL FUND OPERATING EXPENSES 0.75
------------------------------------------------ -----
EXAMPLE
This Example is intended to help you compare the cost of investing in the fund
with the cost of investing in other mutual funds. The Example assumes that you
invest $10,000 in the fund for the time periods indicated and then redeem all
of your shares at the end of those periods. The Example also assumes that your
investment has a 5% return each year and that the fund's operating expenses
remain the same. Although your actual costs may be higher or lower, based on
these assumptions your costs would be:
1 YEAR 3 YEARS 5 YEARS 10 YEARS
-------- --------- --------- ---------
$77 $240 $417 $930
--- --- ---- ---- ----
PORTFOLIO TURNOVER
The fund pays transaction costs when it buys and sells securities (or "turns
over" its portfolio). A higher portfolio turnover may indicate higher
transaction costs. These costs are not reflected in annual fund operating
expenses or in the expense example, but are reflected in fund performance.
Portfolio turnover rate for fiscal year 2009: 82%.
PRINCIPAL INVESTMENT STRATEGY
MAIN INVESTMENTS. Under normal circumstances, the fund invests at least 80% of
net assets, plus the amount of any borrowings for investment purposes, in
common stocks of large US companies that are similar in size to the companies
in the S&P 500( (Reg. TM)) Index (generally the 500 largest companies in the
US) and that portfolio management considers to be "blue chip" companies. Blue
chip companies are large, well-known companies that typically have an
established earnings and dividends history, easy access to credit, solid
positions in their industry and strong management.
While the fund invests mainly in US common stocks, it could invest up to 20% of
net assets in foreign securities. The fund may also invest in other types of
equity securities such as preferred stocks or convertible securities.
MANAGEMENT PROCESS. Portfolio management looks for "blue chip" companies whose
stock price is attractive relative to potential growth. Portfolio management
uses both quantitative techniques and fundamental analysis to evaluate each
company's stock price relative to the company's earnings, operating trends,
market outlook and other measures of performance potential.
Portfolio management will normally sell a stock when they believe its
fundamental factors have changed, other investments offer better opportunities
or in the course of adjusting the fund's emphasis on or within a given
industry.
11
PROSPECTUS May 1, 2010 DWS Blue Chip VIP
--------------------------------------------------------------------------------
DERIVATIVES. The fund may use various types of derivatives (contracts whose
value is based on, for example, indices, currencies or securities) for hedging,
risk management or non-hedging purposes to seek to enhance potential gains. The
fund may use derivatives as a substitute for direct investment in a particular
asset class or to keep cash on hand to meet shareholder redemptions or other
needs.
SECURITIES LENDING. The fund may lend securities (up to one-third of total
assets) to approved institutions.
--------------------------------------------------------------------------------
MAIN RISKS
There are several risk factors that could hurt the fund's performance, cause
you to lose money or cause the fund's performance to trail that of other
investments.
STOCK MARKET RISK. When stock prices fall, you should expect the value of your
investment to fall as well. To the extent the fund invests in a particular
capitalization or market sector, the fund's performance may be proportionately
affected by that segment's general performance.
FOCUS RISK. To the extent that the fund focuses its investments in particular
industries, asset classes or sectors of the economy, any market price
movements, regulatory or technological changes, or economic conditions
affecting companies in those industries, asset classes or sectors will have a
significant impact on the fund's performance.
SECURITY SELECTION RISK. The securities in the fund's portfolio may decline in
value. Portfolio management could be wrong in its analysis of industries,
companies, economic trends, the relative attractiveness of different securities
or other matters.
SECURITIES LENDING RISK. Any decline in the value of a portfolio security that
occurs while the security is out on loan is borne by the fund, and will
adversely affect performance. Also, there may be delays in recovery of
securities loaned or even a loss of rights in the collateral should the
borrower of the securities fail financially while holding the security.
FOREIGN INVESTMENT RISK. To the extent the fund invests in companies based
outside the US, it faces the risks inherent in foreign investing. Adverse
political, economic or social developments could undermine the value of the
fund's investments or prevent the fund from realizing their full value.
Financial reporting standards for companies based in foreign markets differ
from those in the US. Additionally, foreign securities markets generally are
smaller and less liquid than US markets. To the extent that the fund invests in
non-US dollar denominated foreign securities, changes in currency exchange
rates may affect the US dollar value of foreign securities or the income or
gain received on these securities.
DERIVATIVES RISK. Risks associated with derivatives include the risk that the
derivative is not well correlated with the security, index or currency to which
it relates; the risk that derivatives may result in losses or missed
opportunities; the risk that the fund will be unable to sell the derivative
because of an illiquid secondary market; the risk that a counterparty is
unwilling or unable to meet its obligation; and the risk that the derivative
transaction could expose the fund to the effects of leverage, which could
increase the fund's exposure to the market and magnify potential losses.
COUNTERPARTY RISK. A financial institution or other counterparty with whom the
fund does business (such as trading or securities lending), or that
underwrites, distributes or guarantees any investments or contracts that the
fund owns or is otherwise exposed to, may decline in financial health and
become unable to honor its commitments, which could lead to losses for the
fund.
LIQUIDITY RISK. In certain situations, it may be difficult or impossible to
sell an investment in an orderly fashion at an acceptable price. This may be an
ongoing risk for some investments, such as derivatives or restricted securities
that typically trade only among a limited number of investors.
PRICING RISK. If market conditions make it difficult to value some investments,
the fund may value these investments using more subjective methods, such as
fair value pricing.
PAST PERFORMANCE
How a fund's returns vary from year to year can give an idea of its risk; so
can comparing fund performance to overall market performance (as measured by an
appropriate market index). Past performance may not indicate future results.
All performance figures below assume that dividends were reinvested. For more
recent performance figures, go to www.dws-investments.com (the Web site does
not form a part of this prospectus) or call the phone number for your share
class included in this prospectus. This information doesn't reflect fees
associated with the separate account that invests in the fund or any variable
life insurance policy or variable annuity contract for which the fund is an
investment option. These fees will reduce returns.
CALENDAR YEAR TOTAL RETURNS (%) (Class A)
[BAR GRAPHIC OMITTED HERE]
[BAR GRAPHIC DATA]
-7.84 -15.81 -22.11 27.25 16.04 10.06 15.65 3.50 -38.49 33.97
2000 2001 2002 2003 2004 2005 2006 2007 2008 2009
Best Quarter: 18.16%, Q3 2009 Worst Quarter: -21.79%, Q4 2008
Year-to-Date as of 3/31/10: 5.27%
12
PROSPECTUS May 1, 2010 DWS Blue Chip VIP
AVERAGE ANNUAL TOTAL RETURNS
(For periods ended 12/31/2009 expressed as a %)
CLASS 1 5 10
INCEPTION YEAR YEARS YEARS
----------- ---------- --------- ----------
CLASS A 5/1/97 33.97 1.65 -0.32
-------------------- ------ ----- ---- ------
RUSSELL 1000 INDEX 28.43 0.79 -0.49
-------------------- ------ ----- ---- ------
MANAGEMENT
INVESTMENT ADVISOR
Deutsche Investment Management Americas Inc.
PORTFOLIO MANAGER(S)
ROBERT WANG, MANAGING DIRECTOR. Portfolio Manager of the fund. Joined the fund
in 2003.
RUSSELL SHTERN, CFA, VICE PRESIDENT. Portfolio Manager of the fund. Joined the
fund in 2010.
PURCHASE AND SALE OF FUND SHARES
THE FUND IS INTENDED FOR USE IN A VARIABLE INSURANCE PRODUCT. You should
contact the sponsoring insurance company for information on how to purchase and
sell shares of the fund.
TAX INFORMATION
Generally, owners of variable annuity and variable life contracts are not
subject to current federal income taxation on distributions of income or gains
with respect to such contracts. For further information concerning federal
income tax consequences for the holders of variable annuity contracts and
variable life insurance policies, such holders should consult the prospectus
used in connection with the issuance of their particular contracts or policies.
PAYMENTS TO FINANCIAL INTERMEDIARIES
If you purchase the fund through selected affiliated and unaffiliated brokers,
dealers, participating insurance companies or other financial intermediaries,
the fund and its affiliates may pay the financial intermediary for the sale of
fund shares and related services. These payments may create a conflict of
interest by influencing the financial intermediary and your salesperson to
recommend the fund over another investment. Ask your salesperson or visit your
insurance company's web site for more information.
13
PROSPECTUS May 1, 2010 DWS Blue Chip VIP
[DWS INVESTMENTS LOGO]
Deutsche Bank Group
DWS CORE FIXED INCOME VIP
INVESTMENT OBJECTIVE
The fund seeks high current income.
FEES AND EXPENSES OF THE FUND
This table describes the fees and expenses you may pay if you buy and hold
shares of the fund. This information does not reflect fees associated with the
separate account that invests in the fund or any variable life insurance policy
or variable annuity contract for which the fund is an investment option. These
fees will increase expenses.
SHAREHOLDER FEES
(paid directly from your investment) None
-------------------------------------- -----
ANNUAL FUND OPERATING EXPENSES (expenses that you pay each year as a % of the
value of your investment)
A
----------
Management fee 0.50
------------------------------------------------ ----
Distribution/service
(12b-1) fees None
------------------------------------------------ -----
Other expenses (includes an administrative fee) 0.09
------------------------------------------------ -----
TOTAL ANNUAL FUND OPERATING EXPENSES 0.59
------------------------------------------------ -----
EXAMPLE
This Example is intended to help you compare the cost of investing in the fund
with the cost of investing in other mutual funds. The Example assumes that you
invest $10,000 in the fund for the time periods indicated and then redeem all
of your shares at the end of those periods. The Example also assumes that your
investment has a 5% return each year and that the fund's operating expenses
remain the same. Although your actual costs may be higher or lower, based on
these assumptions your costs would be:
1 YEAR 3 YEARS 5 YEARS 10 YEARS
-------- --------- --------- ---------
$60 $189 $329 $738
--- --- ---- ---- ----
PORTFOLIO TURNOVER
The fund pays transaction costs when it buys and sells securities (or "turns
over" its portfolio). A higher portfolio turnover may indicate higher
transaction costs. These costs are not reflected in annual fund operating
expenses or in the expense example, but are reflected in fund performance.
Portfolio turnover rate for fiscal year 2009: 222%.
PRINCIPAL INVESTMENT STRATEGY
MAIN INVESTMENTS. Under normal circumstances, the fund invests at least 80% of
its assets, plus the amount of any borrowings for investment purposes,
determined at the time of purchase, in fixed income securities. Fixed income
securities include those of the US Treasury, as well as US government agencies
and instrumentalities, corporate, mortgage-backed and asset-backed securities,
taxable municipal and tax-exempt municipal bonds and liquid Rule 144A
securities.
The fund invests primarily in investment-grade debt securities (securities
rated within the top four long-term credit rating categories). The fund may
invest up to 25% of total assets in US dollar-denominated securities of foreign
issuers and governments.
MANAGEMENT PROCESS. Portfolio management uses a strategy that uses a balanced
"top-down" and "bottom-up" approach in seeking to add incremental returns to
the Barclays Capital U.S. Aggregate Bond Index.
Portfolio management seeks pricing changes in a broad range of securities and
sectors, looking to exploit any inefficiencies between intrinsic value and
market trading price.
In choosing securities, portfolio management:
o assigns a relative value to each bond, based on creditworthiness, cash flow
and price
o determines an intrinsic value for each bond by examining credit, structure,
option value and liquidity risks
o uses credit analysis to determine the issuer's ability to pay interest and
repay principal on its bonds
14
PROSPECTUS May 1, 2010 DWS Core Fixed Income VIP
o focuses on identifying individual bonds that may add above-market value,
with sector weightings a secondary consideration
The fund may trade actively. This could raise transaction costs (thus lowering
returns).
--------------------------------------------------------------------------------
DERIVATIVES. The fund may use various types of derivatives (contracts whose
value is based on, for example, indices, currencies or securities) for hedging,
risk management or non-hedging purposes to seek to enhance potential gains. The
fund may use derivatives as a substitute for direct investment in a particular
asset class or to keep cash on hand to meet shareholder redemptions or other
needs. In particular, portfolio management may use futures, interest rate
swaps, credit default swaps and options.
SECURITIES LENDING. The fund may lend securities (up to one-third of total
assets) to approved institutions.
--------------------------------------------------------------------------------
MAIN RISKS
There are several risk factors that could hurt the fund's performance, cause
you to lose money or cause the fund's performance to trail that of other
investments.
INTEREST RATE RISK. When interest rates rise, prices of debt securities
generally decline. The longer the duration of the fund's debt securities, the
more sensitive it will be to interest rate changes. (As a general rule, a 1%
rise in interest rates means a 1% fall in value for every year of duration.)
CREDIT RISK. The fund's performance could be hurt if a securitiy declines in
credit quality or goes into default, or if an issuer does not make timely
payments of interest or principal.
FOREIGN INVESTMENT RISK. To the extent the fund invests in companies based
outside the US, it faces the risks inherent in foreign investing. Adverse
political, economic or social developments could undermine the value of the
fund's investments or prevent the fund from realizing their full value.
Financial reporting standards for companies based in foreign markets differ
from those in the US. Additionally, foreign securities markets generally are
smaller and less liquid than US markets. To the extent that the fund invests in
non-US dollar denominated foreign securities, changes in currency exchange
rates may affect the US dollar value of foreign securities or the income or
gain received on these securities.
DERIVATIVES RISK. Risks associated with derivatives include the risk that the
derivative is not well correlated with the security, index or currency to which
it relates; the risk that derivatives may result in losses or missed
opportunities; the risk that the fund will be unable to sell the derivative
because of an illiquid secondary market; the risk that a counterparty is
unwilling or unable to meet its obligation; and the risk that the derivative
transaction could expose the fund to the effects of leverage, which could
increase the fund's exposure to the market and magnify potential losses.
SECURITY SELECTION RISK. The securities in the fund's portfolio may decline in
value. Portfolio management could be wrong in its analysis of industries,
companies, economic trends, the relative attractiveness of different securities
or other matters.
SECURITIES LENDING RISK. Any decline in the value of a portfolio security that
occurs while the security is out on loan is borne by the fund, and will
adversely affect performance. Also, there may be delays in recovery of
securities loaned or even a loss of rights in the collateral should the
borrower of the securities fail financially while holding the security.
COUNTERPARTY RISK. A financial institution or other counterparty with whom the
fund does business (such as trading or securities lending), or that
underwrites, distributes or guarantees any investments or contracts that the
fund owns or is otherwise exposed to, may decline in financial health and
become unable to honor its commitments, which could lead to losses for the
fund.
LIQUIDITY RISK. In certain situations, it may be difficult or impossible to
sell an investment in an orderly fashion at an acceptable price. This may be an
ongoing risk for some investments, such as derivatives or restricted securities
that typically trade only among a limited number of investors.
PRICING RISK. If market conditions make it difficult to value some investments,
the fund may value these investments using more subjective methods, such as
fair value pricing.
PREPAYMENT AND EXTENSION RISK. When interest rates fall, issuers of high
interest debt obligations may pay off the debts earlier than expected
(prepayment risk), and the fund may have to reinvest the proceeds at lower
yields. When interest rates rise, issuers of lower interest debt obligations
may pay off the debts later than expected (extension risk), thus keeping the
fund's assets tied up in lower interest debt obligations. Prepayments could
also create capital gains tax liability in some instances. Any unexpected
behavior in interest rates could increase the volatility of the fund's share
price and yield and could hurt fund performance.
PAST PERFORMANCE
How a fund's returns vary from year to year can give an idea of its risk; so
can comparing fund performance to overall market performance (as measured by an
appropriate market index). Past performance may not indicate future results.
All performance figures below assume that dividends were reinvested. For more
recent performance figures, go to www.dws-investments.com (the Web site does
not form a part of this prospectus) or call the phone number for your share
class included in this prospectus. This information doesn't reflect fees
associated with the
15
PROSPECTUS May 1, 2010 DWS Core Fixed Income VIP
separate account that invests in the fund or any variable life insurance policy
or variable annuity contract for which the fund is an investment option. These
fees will reduce returns.
From December 2, 2005 through February 27, 2009, Aberdeen Asset Management Inc.
served as the fund's subadvisor and was primarily responsible for the day to
day management of the fund. Performance would have been different if the fund's
current investment strategy had been in effect.
CALENDAR YEAR TOTAL RETURNS (%) (Class A)
[BAR GRAPHIC OMITTED HERE]
[BAR GRAPHIC DATA]
9.90 5.71 8.01 5.13 4.53 2.25 4.26 4.17 -19.33 7.72
2000 2001 2002 2003 2004 2005 2006 2007 2008 2009
Best Quarter: 4.67%, Q3 2009 Worst Quarter: -12.83%, Q4 2008
Year-to-Date as of 3/31/10: 1.82%
AVERAGE ANNUAL TOTAL RETURNS
(For periods ended 12/31/2009 expressed as a %)
CLASS 1 5 10
INCEPTION YEAR YEARS YEARS
----------- --------- ---------- ---------
CLASS A 5/1/96 7.72 -0.71 2.90
---------------------- ------ ---- ------ ----
BARCLAYS CAPITAL US
AGGREGATE BOND INDEX 5.93 4.97 6.33
---------------------- ------ ---- ------ ----
MANAGEMENT
INVESTMENT ADVISOR
Deutsche Investment Management Americas Inc.
PORTFOLIO MANAGER(S)
KENNETH R. BOWLING, CFA, MANAGING DIRECTOR. Portfolio Manager of the fund.
Joined the fund in 2009.
JAMIE GUENTHER, CFA, MANAGING DIRECTOR. Portfolio Manager of the fund. Joined
the fund in 2009.
JOHN BRENNAN, DIRECTOR. Portfolio Manager of the fund. Joined the fund in 2009.
BRUCE HARLEY, CFA, CEBS, DIRECTOR. Portfolio Manager of the fund. Joined the
fund in 2009.
J. RICHARD ROBBEN, CFA, DIRECTOR. Portfolio Manager of the fund. Joined the
fund in 2009.
DAVID VIGNOLO, VICE PRESIDENT. Portfolio Manager of the fund. Joined the fund
in 2009.
J. KEVIN HORSLEY, CFA, CPA, DIRECTOR. Portfolio Manager of the fund. Joined the
fund in 2009.
STEPHEN WILLER, CFA, VICE PRESIDENT. Portfolio Manager of the fund. Joined the
fund in 2009.
PURCHASE AND SALE OF FUND SHARES
THE FUND IS INTENDED FOR USE IN A VARIABLE INSURANCE PRODUCT. You should
contact the sponsoring insurance company for information on how to purchase and
sell shares of the fund.
TAX INFORMATION
Generally, owners of variable annuity and variable life contracts are not
subject to current federal income taxation on distributions of income or gains
with respect to such contracts. For further information concerning federal
income tax consequences for the holders of variable annuity contracts and
variable life insurance policies, such holders should consult the prospectus
used in connection with the issuance of their particular contracts or policies.
PAYMENTS TO FINANCIAL INTERMEDIARIES
If you purchase the fund through selected affiliated and unaffiliated brokers,
dealers, participating insurance companies or other financial intermediaries,
the fund and its affiliates may pay the financial intermediary for the sale of
fund shares and related services. These payments may create a conflict of
interest by influencing the financial intermediary and your salesperson to
recommend the fund over another investment. Ask your salesperson or visit your
insurance company's web site for more information.
16
PROSPECTUS May 1, 2010 DWS Core Fixed Income VIP
[DWS INVESTMENTS LOGO]
Deutsche Bank Group
DWS DIVERSIFIED INTERNATIONAL EQUITY VIP
INVESTMENT OBJECTIVE
The fund seeks capital appreciation.
FEES AND EXPENSES OF THE FUND
This table describes the fees and expenses you may pay if you buy and hold
shares of the fund. This information does not reflect fees associated with the
separate account that invests in the fund or any variable life insurance policy
or variable annuity contract for which the fund is an investment option. These
fees will increase expenses.
SHAREHOLDER FEES
(paid directly from your investment) None
-------------------------------------- -----
ANNUAL FUND OPERATING EXPENSES (expenses that you pay each year as a % of the
value of your investment)
A
----------
Management fee 0.65
---------------------------------------------------- ----
Distribution/service
(12b-1) fees None
---------------------------------------------------- -----
Other expenses (includes an administrative fee) 0.29
---------------------------------------------------- -----
Acquired funds (underlying funds) fees and expenses 0.02
---------------------------------------------------- -----
TOTAL ANNUAL FUND OPERATING EXPENSES 0.96
---------------------------------------------------- -----
EXAMPLE
This Example is intended to help you compare the cost of investing in the fund
with the cost of investing in other mutual funds. The Example assumes that you
invest $10,000 in the fund for the time periods indicated and then redeem all
of your shares at the end of those periods. The Example also assumes that your
investment has a 5% return each year and that the fund's operating expenses
remain the same. Although your actual costs may be higher or lower, based on
these assumptions your costs would be:
1 YEAR 3 YEARS 5 YEARS 10 YEARS
-------- --------- --------- ---------
$98 $306 $531 $1,178
--- --- ---- ---- ------
PORTFOLIO TURNOVER
The fund pays transaction costs when it buys and sells securities (or "turns
over" its portfolio). A higher portfolio turnover may indicate higher
transaction costs. These costs are not reflected in annual fund operating
expenses or in the expense example, but are reflected in fund performance.
Portfolio turnover rate for fiscal year 2009: 139%.
PRINCIPAL INVESTMENT STRATEGY
MAIN INVESTMENTS. Under normal circumstances, the fund invests at least 80% of
its assets, determined at the time of purchase, in equity securities and other
securities with equity characteristics.
At least 50% of the fund's assets will be invested in securities that make up
the Morgan Stanley Capital International Europe, Australasia and Far East Index
(MSCI EAFE (Reg. TM) Index). In addition, the fund may invest in Canada. While
the fund invests primarily in common stocks, it may invest in other types of
equities such as preferred stocks, convertible securities, warrants and
exchange-traded funds (ETFs). The fund may also invest up to 20% of its assets
in cash equivalents, US investment-grade fixed-income securities, and US stocks
and other equities. Although the fund can invest in companies of any size and
from any country, it invests mainly in common stocks of established companies
in countries with developed economies (other than the United States).
The fund may also invest a portion of its assets (typically not more than 35%
of its net assets) in securities of companies located in emerging markets, such
as those of many countries in Latin America, the Middle East, Eastern Europe,
Asia and Africa.
MANAGEMENT PROCESS. In choosing securities, portfolio management allocates
percentages of assets to various countries and sectors. Portfolio management
periodically reviews these allocations and may adjust them based on current or
anticipated market conditions or to manage risk consistent with the fund's
investment objective.
17
PROSPECTUS May 1, 2010 DWS Diversified International Equity VIP
The fund may trade actively. This could raise transaction costs (thus lowering
returns).
--------------------------------------------------------------------------------
DERIVATIVES. The fund may use various types of derivatives for hedging, risk
management or non-hedging purposes to seek to enhance potential gains. The fund
may use derivatives as a substitute for direct investment in a particular asset
class or to keep cash on hand to meet shareholder redemptions or other needs.
In particular, portfolio management may use futures, currency options and
forward currency transactions.
SECURITIES LENDING. The fund may lend securities (up to one-third of total
assets) to approved institutions.
--------------------------------------------------------------------------------
MAIN RISKS
There are several risk factors that could hurt the fund's performance, cause
you to lose money or cause the fund's performance to trail that of other
investments.
STOCK MARKET RISK. When stock prices fall, you should expect the value of your
investment to fall as well. To the extent that the fund invests in a particular
geographic region or market sector, performance will be affected by that
region's general performance.
FOREIGN INVESTMENT RISK. To the extent the fund invests in companies based
outside the US, it faces the risks inherent in foreign investing. Adverse
political, economic or social developments could undermine the value of the
fund's investments or prevent the fund from realizing their full value.
Financial reporting standards for companies based in foreign markets differ
from those in the US. Additionally, foreign securities markets generally are
smaller and less liquid than US markets. To the extent that the fund invests in
non-US dollar denominated foreign securities, changes in currency exchange
rates may affect the US dollar value of foreign securities or the income or
gain received on these securities. Foreign investment risks are greater in
emerging markets than in developed markets. Emerging market investments are
often considered speculative.
PRICING RISK. If market conditions make it difficult to value some investments,
the fund may value these investments using more subjective methods, such as
fair value pricing.
ETF RISK. An ETF is subject to the risks of the assets in which it invests as
well as those of the investment strategy it follows. The fund incurs brokerage
costs when it buys and sells shares of and ETF and also bears its proportionate
share of the ETF's fees and expenses, which are passed through to ETF
shareholders.
SECURITY SELECTION RISK. The securities in the fund's portfolio may decline in
value. Portfolio management could be wrong in its analysis of industries,
companies, economic trends, the relative attractiveness of different securities
or other matters.
DERIVATIVES RISK. Risks associated with derivatives include the risk that the
derivative is not well correlated with the security, index or currency to which
it relates; the risk that derivatives may result in losses or missed
opportunities; the risk that the fund will be unable to sell the derivative
because of an illiquid secondary market; the risk that a counterparty is
unwilling or unable to meet its obligation; and the risk that the derivative
transaction could expose the fund to the effects of leverage, which could
increase the fund's exposure to the market and magnify potential losses.
SECURITIES LENDING RISK. Any decline in the value of a portfolio security that
occurs while the security is out on loan is borne by the fund, and will
adversely affect performance. Also, there may be delays in recovery of
securities loaned or even a loss of rights in the collateral should the
borrower of the securities fail financially while holding the security.
COUNTERPARTY RISK. A financial institution or other counterparty with whom the
fund does business (such as trading or securities lending), or that
underwrites, distributes or guarantees any investments or contracts that the
fund owns or is otherwise exposed to, may decline in financial health and
become unable to honor its commitments, which could lead to losses for the
fund.
LIQUIDITY RISK. In certain situations, it may be difficult or impossible to
sell an investment in an orderly fashion at an acceptable price. This may be an
ongoing risk for some investments, such as derivatives or restricted securities
that typically trade only among a limited number of investors.
SMALL COMPANY RISK. Small company stocks tend to be more volatile and less
liquid than large company stocks. Small companies are less widely followed by
stock analysts and less information about them is available to investors.
PAST PERFORMANCE
How a fund's returns vary from year to year can give an idea of its risk; so
can comparing fund performance to overall market performance (as measured by an
appropriate market index). Past performance may not indicate future results.
All performance figures below assume that dividends were reinvested. For more
recent performance figures, go to www.dws-investments.com (the Web site does
not form a part of this prospectus) or call the phone number for your share
class included in this prospectus. This information doesn't reflect fees
associated with the separate account that invests in the fund or any variable
life insurance policy or variable annuity contract for which the fund is an
investment option. These fees will reduce returns.
Prior to May 1, 2001, the fund was named Kemper International Portfolio and
operated with a different objective and investment strategy than the fund or
Scudder International Research Portfolio. Prior to May 1, 2002, the fund was
named Scudder International Research Portfolio and operated with a different
objective and investment strategy.
18
PROSPECTUS May 1, 2010 DWS Diversified International Equity VIP
Prior to May 1, 2009, the fund was named DWS International Select Equity VIP
and operated with a different investment strategy. Performance may have been
different if the fund's current policies had been in effect.
CALENDAR YEAR TOTAL RETURNS (%) (Class A)
[BAR GRAPHIC OMITTED HERE]
[BAR GRAPHIC DATA]
-20.49 -24.33 -13.48 29.83 18.25 14.51 25.26 16.71 -48.81 29.36
2000 2001 2002 2003 2004 2005 2006 2007 2008 2009
Best Quarter: 20.59%, Q2 2009 Worst Quarter: -27.50%, Q3 2008
Year-to-Date as of 3/31/10: 1.48%
AVERAGE ANNUAL TOTAL RETURNS
(For periods ended 12/31/2009 expressed as a %)
CLASS 1 5 10
INCEPTION YEAR YEARS YEARS
----------- ---------- --------- ----------
CLASS A 1/6/92 29.36 2.13 -1.19
----------- ------ ----- ---- ------
MSCI EAFE 31.78 3.54 1.17
----------- ------ ----- ---- ------
MANAGEMENT
INVESTMENT ADVISOR
Deutsche Investment Management Americas Inc.
PORTFOLIO MANAGER(S)
ROBERT WANG, MANAGING DIRECTOR. Portfolio Manager of the fund. Joined the fund
in 2009.
RUSSELL SHTERN, CFA, VICE PRESIDENT. Portfolio Manager of the fund. Joined the
fund in 2009.
PURCHASE AND SALE OF FUND SHARES
THE FUND IS INTENDED FOR USE IN A VARIABLE INSURANCE PRODUCT. You should
contact the sponsoring insurance company for information on how to purchase and
sell shares of the fund.
TAX INFORMATION
Generally, owners of variable annuity and variable life contracts are not
subject to current federal income taxation on distributions of income or gains
with respect to such contracts. For further information concerning federal
income tax consequences for the holders of variable annuity contracts and
variable life insurance policies, such holders should consult the prospectus
used in connection with the issuance of their particular contracts or policies.
PAYMENTS TO FINANCIAL INTERMEDIARIES
If you purchase the fund through selected affiliated and unaffiliated brokers,
dealers, participating insurance companies or other financial intermediaries,
the fund and its affiliates may pay the financial intermediary for the sale of
fund shares and related services. These payments may create a conflict of
interest by influencing the financial intermediary and your salesperson to
recommend the fund over another investment. Ask your salesperson or visit your
insurance company's web site for more information.
19
PROSPECTUS May 1, 2010 DWS Diversified International Equity VIP
[DWS INVESTMENTS LOGO]
Deutsche Bank Group
DWS DREMAN SMALL MID CAP VALUE VIP
INVESTMENT OBJECTIVE
The fund seeks long-term capital appreciation.
FEES AND EXPENSES OF THE FUND
This table describes the fees and expenses you may pay if you buy and hold
shares of the fund. This information does not reflect fees associated with the
separate account that invests in the fund or any variable life insurance policy
or variable annuity contract for which the fund is an investment option. These
fees will increase expenses.
SHAREHOLDER FEES
(paid directly from your investment) None
-------------------------------------- -----
ANNUAL FUND OPERATING EXPENSES (expenses that you pay each year as a % of the
value of your investment)
A
----------
Management fee 0.65
------------------------------------------------ ----
Distribution/service
(12b-1) fees None
------------------------------------------------ -----
Other expenses (includes an administrative fee) 0.14
------------------------------------------------ -----
TOTAL ANNUAL FUND OPERATING EXPENSES 0.79
------------------------------------------------ -----
EXAMPLE
This Example is intended to help you compare the cost of investing in the fund
with the cost of investing in other mutual funds. The Example assumes that you
invest $10,000 in the fund for the time periods indicated and then redeem all
of your shares at the end of those periods. The Example also assumes that your
investment has a 5% return each year and that the fund's operating expenses
remain the same. Although your actual costs may be higher or lower, based on
these assumptions your costs would be:
1 YEAR 3 YEARS 5 YEARS 10 YEARS
-------- --------- --------- ---------
$81 $252 $439 $978
--- --- ---- ---- ----
PORTFOLIO TURNOVER
The fund pays transaction costs when it buys and sells securities (or "turns
over" its portfolio). A higher portfolio turnover may indicate higher
transaction costs. These costs are not reflected in annual fund operating
expenses or in the expense example, but are reflected in fund performance.
Portfolio turnover rate for fiscal year 2009: 72%.
PRINCIPAL INVESTMENT STRATEGY
Under normal circumstances, the fund invests at least 80% of net assets, plus
the amount of any borrowings for investment purposes, in undervalued common
stocks of small and mid-size US companies. The fund defines small companies as
those that are similar in market value to those in the Russell 2000 (Reg. TM)
Value Index. The fund defines mid-size companies as those that are similar in
market value to those in the Russell Midcap (Reg. TM) Value Index. The fund
intends to invest primarily in companies whose market capitalizations fall
within the normal range of each Index.
While the fund invests mainly in US stocks, it could invest up to 20% of net
assets in foreign securities.
MANAGEMENT PROCESS. Portfolio management begins by screening stocks of small
and mid-size companies with below-market price-to-earnings (P/E) ratios.
Portfolio management then compares the company's stock price to such measures
as book value, cash flow and yield and analyzes individual companies to
identify those that are fundamentally sound and appear to have strong potential
for earnings and dividend growth over the Russell 2500 Value Index.
Portfolio management then assembles the fund's portfolio from among the most
attractive stocks, drawing, in addition, on an analysis of economic outlooks
for various industries.
Portfolio management will normally sell a stock when it no longer qualifies as
a small or mid-size company, when its P/E rises above that of the industry
median or the median
20
PROSPECTUS May 1, 2010 DWS Dreman Small Mid Cap Value VIP
for the Russell 2500 Value Index, its fundamentals change or other investments
offer better opportunities.
--------------------------------------------------------------------------------
DERIVATIVES. The fund may use various types of derivatives (contracts whose
value is based on, for example, indices, currencies or securities) for hedging,
risk management or non-hedging purposes to seek to enhance potential gains. The
fund may use derivatives as a substitute for direct investment in a particular
asset class or to keep cash on hand to meet shareholder redemptions or other
needs. In particular, the fund may use futures, currency options and forward
currency transactions.
SECURITIES LENDING. The fund may lend securities (up to one-third of total
assets) to approved institutions.
--------------------------------------------------------------------------------
MAIN RISKS
There are several risk factors that could hurt the fund's performance, cause
you to lose money or cause the fund's performance to trail that of other
investments.
STOCK MARKET RISK. When stock prices fall, you should expect the value of your
investment to fall as well. To the extent the fund invests in a particular
capitalization or market sector, the fund's performance may be proportionately
affected by that segment's general performance.
SECURITY SELECTION RISK. The securities in the fund's portfolio may decline in
value. Portfolio management could be wrong in its analysis of industries,
companies, economic trends, the relative attractiveness of different securities
or other matters.
VALUE INVESTING RISK. As a category, value stocks may underperform growth
stocks (and the stock market as a whole) over any period of time. In addition,
value stocks selected for investment by portfolio management may not perform as
anticipated: stocks that appear undervalued may remain undervalued
indefinitely, or may in fact be fairly valued.
SMALL COMPANY RISK. Small company stocks tend to be more volatile and less
liquid than large company stocks. Small companies are less widely followed by
stock analysts and less information about them is available to investors.
MEDIUM-SIZED COMPANY RISK. Medium-sized company stocks tend to be more volatile
than large company stocks. Medium-sized companies are less widely followed by
stock analysts and less information about them is available to investors.
FOCUS RISK. To the extent that the fund focuses its investments in particular
industries, asset classes or sectors of the economy, any market price
movements, regulatory or technological changes, or economic conditions
affecting companies in those industries, asset classes or sectors will have a
significant impact on the fund's performance.
FOREIGN INVESTMENT RISK. To the extent the fund invests in companies based
outside the US, it faces the risks inherent in foreign investing. Adverse
political, economic or social developments could undermine the value of the
fund's investments or prevent the fund from realizing their full value.
Financial reporting standards for companies based in foreign markets differ
from those in the US. Additionally, foreign securities markets generally are
smaller and less liquid than US markets. To the extent that the fund invests in
non-US dollar denominated foreign securities, changes in currency exchange
rates may affect the US dollar value of foreign securities or the income or
gain received on these securities. Foreign investment risks are greater in
emerging markets than in developed markets. Emerging market investments are
often considered speculative.
DERIVATIVES RISK. Risks associated with derivatives include the risk that the
derivative is not well correlated with the security, index or currency to which
it relates; the risk that derivatives may result in losses or missed
opportunities; the risk that the fund will be unable to sell the derivative
because of an illiquid secondary market; the risk that a counterparty is
unwilling or unable to meet its obligation; and the risk that the derivative
transaction could expose the fund to the effects of leverage, which could
increase the fund's exposure to the market and magnify potential losses.
SECURITIES LENDING RISK. Any decline in the value of a portfolio security that
occurs while the security is out on loan is borne by the fund, and will
adversely affect performance. Also, there may be delays in recovery of
securities loaned or even a loss of rights in the collateral should the
borrower of the securities fail financially while holding the security.
COUNTERPARTY RISK. A financial institution or other counterparty with whom the
fund does business (such as trading or securities lending), or that
underwrites, distributes or guarantees any investments or contracts that the
fund owns or is otherwise exposed to, may decline in financial health and
become unable to honor its commitments, which could lead to losses for the
fund.
LIQUIDITY RISK. In certain situations, it may be difficult or impossible to
sell an investment in an orderly fashion at an acceptable price. This may be an
ongoing risk for some investments, such as derivatives or restricted securities
that typically trade only among a limited number of investors.
PRICING RISK. If market conditions make it difficult to value some investments,
the fund may value these investments using more subjective methods, such as
fair value pricing.
PAST PERFORMANCE
How a fund's returns vary from year to year can give an idea of its risk; so
can comparing fund performance to overall market performance (as measured by an
appropriate market index). Past performance may not indicate future results.
All performance figures below assume that dividends were reinvested. For more
recent performance figures, go to www.dws-investments.com (the Web site
21
PROSPECTUS May 1, 2010 DWS Dreman Small Mid Cap Value VIP
does not form a part of this prospectus) or call the phone number for your
share class included in this prospectus. This information doesn't reflect fees
associated with the separate account that invests in the fund or any variable
life insurance policy or variable annuity contract for which the fund is an
investment option. These fees will reduce returns.
Prior to January 18, 2002, the fund was named Scudder Small Cap Value
Portfolio, operated with a different investment strategy and a different
advisor managed the fund. Performance would have been different if the fund's
current policies and advisory agreement had been in effect. Prior to November
3, 2006, the fund was named DWS Dreman Small Cap Value VIP and operated with a
different investment strategy. Performance would have been different if the
fund's current policies had been in effect.
CALENDAR YEAR TOTAL RETURNS (%) (Class A)
[BAR GRAPHIC OMITTED HERE]
[BAR GRAPHIC DATA]
4.05 17.63 -11.43 42.15 26.03 10.25 25.06 3.06 -33.42 29.70
2000 2001 2002 2003 2004 2005 2006 2007 2008 2009
Best Quarter: 21.84%, Q2 2003 Worst Quarter: -20.14%, Q4 2008
Year-to-Date as of 3/31/10: 7.37%
AVERAGE ANNUAL TOTAL RETURNS
(For periods ended 12/31/2009 expressed as a %)
CLASS 1 5 10
INCEPTION YEAR YEARS YEARS
----------- ---------- --------- ---------
CLASS A 5/1/96 29.70 4.18 9.08
------------------- ------ ----- ---- ----
RUSSELL 2500 VALUE
INDEX 27.68 0.84 8.18
------------------- ------ ----- ---- ----
MANAGEMENT
INVESTMENT ADVISOR
Deutsche Investment Management Americas Inc.
SUBADVISOR
Dreman Value Management, L.L.C.
PORTFOLIO MANAGER(S)
DAVID N. DREMAN. Chairman and Chief Investment Officer of Dreman Value
Management, L.L.C. and Lead Portfolio Manager of the fund. Joined the fund in
2002.
E. CLIFTON HOOVER, JR. Co-Chief Investment Officer and Managing Director of
Dreman Value Management, L.L.C. and Portfolio Manager of the fund. Joined the
fund in 2006.
MARK ROACH. Managing Director of Dreman Value Management, L.L.C. and Portfolio
Manager of the fund. Joined the fund in 2006.
PURCHASE AND SALE OF FUND SHARES
THE FUND IS INTENDED FOR USE IN A VARIABLE INSURANCE PRODUCT. You should
contact the sponsoring insurance company for information on how to purchase and
sell shares of the fund.
TAX INFORMATION
Generally, owners of variable annuity and variable life contracts are not
subject to current federal income taxation on distributions of income or gains
with respect to such contracts. For further information concerning federal
income tax consequences for the holders of variable annuity contracts and
variable life insurance policies, such holders should consult the prospectus
used in connection with the issuance of their particular contracts or policies.
PAYMENTS TO FINANCIAL INTERMEDIARIES
If you purchase the fund through selected affiliated and unaffiliated brokers,
dealers, participating insurance companies or other financial intermediaries,
the fund and its affiliates may pay the financial intermediary for the sale of
fund shares and related services. These payments may create a conflict of
interest by influencing the financial intermediary and your salesperson to
recommend the fund over another investment. Ask your salesperson or visit your
insurance company's web site for more information.
22
PROSPECTUS May 1, 2010 DWS Dreman Small Mid Cap Value VIP
[DWS INVESTMENTS LOGO]
Deutsche Bank Group
DWS GLOBAL THEMATIC VIP
INVESTMENT OBJECTIVE
The fund seeks long-term capital growth.
FEES AND EXPENSES OF THE FUND
This table describes the fees and expenses you may pay if you buy and hold
shares of the fund. This information does not reflect fees associated with the
separate account that invests in the fund or any variable life insurance policy
or variable annuity contract for which the fund is an investment option. These
fees will increase expenses.
SHAREHOLDER FEES
(paid directly from your investment) None
-------------------------------------- -----
ANNUAL FUND OPERATING EXPENSES (expenses that you pay each year as a % of the
value of your investment)
A
----------
Management fee 0.92
---------------------------------------------------- ----
Distribution/service
(12b-1) fees None
---------------------------------------------------- -----
Other expenses (includes an administrative fee) 0.46
---------------------------------------------------- -----
Acquired funds (underlying funds) fees and expenses 0.01
---------------------------------------------------- -----
TOTAL ANNUAL FUND OPERATING EXPENSES 1.39
---------------------------------------------------- -----
EXAMPLE
This Example is intended to help you compare the cost of investing in the fund
with the cost of investing in other mutual funds. The Example assumes that you
invest $10,000 in the fund for the time periods indicated and then redeem all
of your shares at the end of those periods. The Example also assumes that your
investment has a 5% return each year and that the fund's operating expenses
remain the same. Although your actual costs may be higher or lower, based on
these assumptions your costs would be:
1 YEAR 3 YEARS 5 YEARS 10 YEARS
-------- --------- --------- ---------
$142 $440 $761 $1,669
--- ---- ---- ---- ------
PORTFOLIO TURNOVER
The fund pays transaction costs when it buys and sells securities (or "turns
over" its portfolio). A higher portfolio turnover may indicate higher
transaction costs. These costs are not reflected in annual fund operating
expenses or in the expense example, but are reflected in fund performance.
Portfolio turnover rate for fiscal year 2009: 190%.
PRINCIPAL INVESTMENT STRATEGY
MAIN INVESTMENTS. Under normal circumstances, the fund invests at least 80% of
net assets, plus the amount of any borrowings for investment purposes, in
common stocks and other equities of companies throughout the world that
portfolio management considers to be "blue chip" companies. Blue chip companies
are large, well known companies that typically have an established earnings and
dividends history, easy access to credit, solid positions in their industries
and strong management.
MANAGEMENT PROCESS.
In choosing securities, portfolio management uses a combination of three
analytical disciplines:
o BOTTOM-UP RESEARCH. Portfolio management looks for individual companies with
a history of above-average growth, strong competitive positioning,
attractive prices relative to potential growth, sound financial strength
and effective management, among other factors.
o GROWTH ORIENTATION. Portfolio management generally looks for companies that
portfolio management believes have above-average potential for sustainable
growth of revenue or earnings and whose market value appears reasonable in
light of their business prospects.
o ANALYSIS OF GLOBAL THEMES. Portfolio management considers global economic
outlooks, seeking to identify industries and companies that are likely to
benefit from social, political and economic changes.
Portfolio management uses analytical tools to actively monitor the risk profile
of the portfolio as compared to comparable funds and appropriate benchmarks and
peer groups.
23
PROSPECTUS May 1, 2010 DWS Global Thematic VIP
Portfolio management will normally sell a stock when portfolio management
believes its price is unlikely to go much higher, its fundamentals have
deteriorated, other investments offer better opportunities or in the course of
adjusting the fund's exposure to a given country.
The fund may trade actively. This could raise transaction costs (thus lowering
returns).
--------------------------------------------------------------------------------
DERIVATIVES. The fund may use various types of derivatives (contracts whose
value is based on, for example, indices, currencies or securities) for hedging,
risk management or non-hedging purposes to seek to enhance potential gains. The
fund may use derivatives as a substitute for direct investment in a particular
asset class or to keep cash on hand to meet shareholder redemptions or other
needs. In particular, the fund may use futures, currency options and forward
currency transactions.
SECURITIES LENDING. The fund may lend securities (up to one-third of total
assets) to approved institutions.
--------------------------------------------------------------------------------
MAIN RISKS
There are several risk factors that could hurt the fund's performance, cause
you to lose money or cause the fund's performance to trail that of other
investments.
STOCK MARKET RISK. When stock prices fall, you should expect the value of your
investment to fall as well. To the extent that the fund invests in a particular
geographic region or market sector, performance will be affected by that
region's general performance.
FOREIGN INVESTMENT RISK. To the extent the fund invests in companies based
outside the US, it faces the risks inherent in foreign investing. Adverse
political, economic or social developments could undermine the value of the
fund's investments or prevent the fund from realizing their full value.
Financial reporting standards for companies based in foreign markets differ
from those in the US. Additionally, foreign securities markets generally are
smaller and less liquid than US markets. To the extent that the fund invests in
non-US dollar denominated foreign securities, changes in currency exchange
rates may affect the US dollar value of foreign securities or the income or
gain received on these securities. Foreign investment risks are greater in
emerging markets than in developed markets. Emerging market investments are
often considered speculative.
SECURITY SELECTION RISK. The securities in the fund's portfolio may decline in
value. Portfolio management could be wrong in its analysis of industries,
companies, economic trends, the relative attractiveness of different securities
or other matters.
LIQUIDITY RISK. In certain situations, it may be difficult or impossible to
sell an investment in an orderly fashion at an acceptable price. This may be an
ongoing risk for some investments, such as derivatives or restricted securities
that typically trade only among a limited number of investors.
PRICING RISK. If market conditions make it difficult to value some investments,
the fund may value these investments using more subjective methods, such as
fair value pricing.
DERIVATIVES RISK. Risks associated with derivatives include the risk that the
derivative is not well correlated with the security, index or currency to which
it relates; the risk that derivatives may result in losses or missed
opportunities; the risk that the fund will be unable to sell the derivative
because of an illiquid secondary market; the risk that a counterparty is
unwilling or unable to meet its obligation; and the risk that the derivative
transaction could expose the fund to the effects of leverage, which could
increase the fund's exposure to the market and magnify potential losses.
SECURITIES LENDING RISK. Any decline in the value of a portfolio security that
occurs while the security is out on loan is borne by the fund, and will
adversely affect performance. Also, there may be delays in recovery of
securities loaned or even a loss of rights in the collateral should the
borrower of the securities fail financially while holding the security.
COUNTERPARTY RISK. A financial institution or other counterparty with whom the
fund does business (such as trading or securities lending), or that
underwrites, distributes or guarantees any investments or contracts that the
fund owns or is otherwise exposed to, may decline in financial health and
become unable to honor its commitments, which could lead to losses for the
fund.
PAST PERFORMANCE
How a fund's returns vary from year to year can give an idea of its risk; so
can comparing fund performance to overall market performance (as measured by an
appropriate market index). Past performance may not indicate future results.
All performance figures below assume that dividends were reinvested. For more
recent performance figures, go to www.dws-investments.com (the Web site does
not form a part of this prospectus) or call the phone number for your share
class included in this prospectus. This information doesn't reflect fees
associated with the separate account that invests in the fund or any variable
life insurance policy or variable annuity contract for which the fund is an
investment option. These fees will reduce returns.
CALENDAR YEAR TOTAL RETURNS (%) (Class A)
[BAR GRAPHIC OMITTED HERE]
[BAR GRAPHIC DATA]
-3.36 -15.48 -15.77 29.13 14.76 22.94 30.14 6.29 -47.75 43.82
2000 2001 2002 2003 2004 2005 2006 2007 2008 2009
24
PROSPECTUS May 1, 2010 DWS Global Thematic VIP
Best Quarter: 26.58%, Q2 2009 Worst Quarter: -24.65%, Q4 2008
Year-to-Date as of 3/31/10: 3.28%
AVERAGE ANNUAL TOTAL RETURNS
(For periods ended 12/31/2009 expressed as a %)
CLASS 1 5 10
INCEPTION YEAR YEARS YEARS
----------- ---------- --------- ---------
CLASS A 5/5/98 43.82 5.03 2.68
------------------ ------ ----- ---- -----
MSCI WORLD INDEX 29.99 2.01 -0.24
------------------ ------ ----- ---- ------
MANAGEMENT
INVESTMENT ADVISOR
Deutsche Investment Management Americas Inc.
PORTFOLIO MANAGER(S)
OLIVER KRATZ, MANAGING DIRECTOR. Portfolio Manager of the fund. Joined the fund
in 2003.
PURCHASE AND SALE OF FUND SHARES
THE FUND IS INTENDED FOR USE IN A VARIABLE INSURANCE PRODUCT. You should
contact the sponsoring insurance company for information on how to purchase and
sell shares of the fund.
TAX INFORMATION
Generally, owners of variable annuity and variable life contracts are not
subject to current federal income taxation on distributions of income or gains
with respect to such contracts. For further information concerning federal
income tax consequences for the holders of variable annuity contracts and
variable life insurance policies, such holders should consult the prospectus
used in connection with the issuance of their particular contracts or policies.
PAYMENTS TO FINANCIAL INTERMEDIARIES
If you purchase the fund through selected affiliated and unaffiliated brokers,
dealers, participating insurance companies or other financial intermediaries,
the fund and its affiliates may pay the financial intermediary for the sale of
fund shares and related services. These payments may create a conflict of
interest by influencing the financial intermediary and your salesperson to
recommend the fund over another investment. Ask your salesperson or visit your
insurance company's web site for more information.
25
PROSPECTUS May 1, 2010 DWS Global Thematic VIP
[DWS INVESTMENTS LOGO]
Deutsche Bank Group
DWS GOVERNMENT & AGENCY SECURITIES VIP
INVESTMENT OBJECTIVE
The fund seeks high current income consistent with preservation of capital.
FEES AND EXPENSES OF THE FUND
This table describes the fees and expenses you may pay if you buy and hold
shares of the fund. This information does not reflect fees associated with the
separate account that invests in the fund or any variable life insurance policy
or variable annuity contract for which the fund is an investment option. These
fees will increase expenses.
SHAREHOLDER FEES
(paid directly from your investment) None
-------------------------------------- -----
ANNUAL FUND OPERATING EXPENSES (expenses that you pay each year as a % of the
value of your investment)
A
----------
Management fee 0.45
------------------------------------------------ ----
Distribution/service
(12b-1) fees None
------------------------------------------------ -----
Other expenses (includes an administrative fee) 0.13
------------------------------------------------ -----
TOTAL ANNUAL FUND OPERATING EXPENSES 0.58
------------------------------------------------ -----
EXAMPLE
This Example is intended to help you compare the cost of investing in the fund
with the cost of investing in other mutual funds. The Example assumes that you
invest $10,000 in the fund for the time periods indicated and then redeem all
of your shares at the end of those periods. The Example also assumes that your
investment has a 5% return each year and that the fund's operating expenses
remain the same. Although your actual costs may be higher or lower, based on
these assumptions your costs would be:
1 YEAR 3 YEARS 5 YEARS 10 YEARS
-------- --------- --------- ---------
$59 $186 $324 $726
--- --- ---- ---- ----
PORTFOLIO TURNOVER
The fund pays transaction costs when it buys and sells securities (or "turns
over" its portfolio). A higher portfolio turnover may indicate higher
transaction costs. These costs are not reflected in annual fund operating
expenses or in the expense example, but are reflected in fund performance.
Portfolio turnover rate for fiscal year 2009: 390%.
PRINCIPAL INVESTMENT STRATEGY
MAIN INVESTMENTS. Under normal circumstances, the fund invests at least 80% of
net assets, plus the amount of any borrowings for investment purposes, in US
government securities and repurchase agreements of US government securities. US
government-related debt instruments in which the fund may invest include: (i)
direct obligations of the US Treasury; (ii) securities such as Ginnie Maes
which are mortgage-backed securities issued and guaranteed by the Government
National Mortgage Association (GNMA) and supported by the full faith and credit
of the United States; and (iii) securities issued or guaranteed, as to their
payment of principal and interest, by US government agencies or government
sponsored entities, some of which may be supported only by the credit of the
issuer.
The fund normally invests all of its assets in securities issued or guaranteed
by the US government, its agencies or instrumentalities, except the fund may
invest up to 10% of its net assets in cash equivalents, such as money market
funds, and short-term bond funds. These securities may not be issued or
guaranteed by the US government, its agencies or instrumentalities.
MANAGEMENT PROCESS. In deciding which types of government bonds to buy and
sell, portfolio management first considers the relative attractiveness of US
Treasuries compared to other US government and agency securities and then
determines allocations. Their decisions are generally based on a number of
factors, including changes in supply and demand within the bond market.
26
PROSPECTUS May 1, 2010 DWS Government & Agency Securities VIP
In choosing individual bonds, portfolio management reviews each bond's
fundamentals, compares the yields of shorter maturity bonds to those of longer
maturity bonds and uses technical analysis to project prepayment rates and
other factors that could affect a bond's attractiveness. Portfolio management
may also adjust the duration (a measure of sensitivity to interest rate
movements) of the fund's portfolio, based upon their analysis.
The fund may trade actively. This could raise transaction costs (thus lowering
returns).
--------------------------------------------------------------------------------
DERIVATIVES. The fund may use various types of derivatives (contracts whose
value is based on, for example, indices, currencies or securities) for hedging,
risk management or non-hedging purposes to seek to enhance potential gains. The
fund may use derivatives as a substitute for direct investment in a particular
asset class or to keep cash on hand to meet shareholder redemptions or other
needs.
SECURITIES LENDING. The fund may lend securities (up to one-third of total
assets) to approved institutions.
--------------------------------------------------------------------------------
MAIN RISKS
There are several risk factors that could hurt the fund's performance, cause
you to lose money or cause the fund's performance to trail that of other
investments.
INTEREST RATE RISK. When interest rates rise, prices of debt securities
generally decline. The longer the duration of the fund's debt securities, the
more sensitive it will be to interest rate changes. (As a general rule, a 1%
rise in interest rates means a 1% fall in value for every year of duration.)
DERIVATIVES RISK. Risks associated with derivatives include the risk that the
derivative is not well correlated with the security, index or currency to which
it relates; the risk that derivatives may result in losses or missed
opportunities; the risk that the fund will be unable to sell the derivative
because of an illiquid secondary market; the risk that a counterparty is
unwilling or unable to meet its obligation; and the risk that the derivative
transaction could expose the fund to the effects of leverage, which could
increase the fund's exposure to the market and magnify potential losses.
SECURITY SELECTION RISK. The securities in the fund's portfolio may decline in
value. Portfolio management could be wrong in its analysis of industries,
companies, economic trends, the relative attractiveness of different securities
or other matters.
CREDIT RISK. The fund's performance could be hurt if a security declines in
credit quality or goes into default, or if an issuer does not make timely
payments of interest or principal.
Some securities issued by US government agencies or instrumentalities are
backed by the full faith and credit of the US government. Others are supported
only by the credit of that agency or instrumentality. For this latter group, if
there is a potential or actual loss of principal and interest of these
securities, the US government might provide financial support, but has no
obligation to do so.
SECURITIES LENDING RISK. Any decline in the value of a portfolio security that
occurs while the security is out on loan is borne by the fund, and will
adversely affect performance. Also, there may be delays in recovery of
securities loaned or even a loss of rights in the collateral should the
borrower of the securities fail financially while holding the security.
COUNTERPARTY RISK. A financial institution or other counterparty with whom the
fund does business (such as trading or securities lending), or that
underwrites, distributes or guarantees any investments or contracts that the
fund owns or is otherwise exposed to, may decline in financial health and
become unable to honor its commitments, which could lead to losses for the
fund.
LIQUIDITY RISK. In certain situations, it may be difficult or impossible to
sell an investment in an orderly fashion at an acceptable price. This may be an
ongoing risk for some investments, such as derivatives or restricted securities
that typically trade only among a limited number of investors.
PRICING RISK. If market conditions make it difficult to value some investments,
the fund may value these investments using more subjective methods, such as
fair value pricing.
PREPAYMENT AND EXTENSION RISK. When interest rates fall, issuers of high
interest debt obligations may pay off the debts earlier than expected
(prepayment risk), and the fund may have to reinvest the proceeds at lower
yields. When interest rates rise, issuers of lower interest debt obligations
may pay off the debts later than expected (extension risk), thus keeping the
fund's assets tied up in lower interest debt obligations. These events could
hurt fund performance.
PAST PERFORMANCE
How a fund's returns vary from year to year can give an idea of its risk; so
can comparing fund performance to overall market performance (as measured by an
appropriate market index). Past performance may not indicate future results.
All performance figures below assume that dividends were reinvested. For more
recent performance figures, go to www.dws-investments.com (the Web site does
not form a part of this prospectus) or call the phone number for your share
class included in this prospectus. This information doesn't reflect fees
associated with the separate account that invests in the fund or any variable
life insurance policy or variable annuity contract for which the fund is an
investment option. These fees will reduce returns.
27
PROSPECTUS May 1, 2010 DWS Government & Agency Securities VIP
CALENDAR YEAR TOTAL RETURNS (%) (Class A)
[BAR GRAPHIC OMITTED HERE]
[BAR GRAPHIC DATA]
10.93 7.48 8.05 2.26 3.75 2.57 4.16 5.95 4.93 8.08
2000 2001 2002 2003 2004 2005 2006 2007 2008 2009
Best Quarter: 4.13%, Q3 2001 Worst Quarter: -0.98%, Q2 2004
Year-to-Date as of 3/31/10: 1.56%
AVERAGE ANNUAL TOTAL RETURNS
(For periods ended 12/31/2009 expressed as a %)
CLASS 1 5 10
INCEPTION YEAR YEARS YEARS
----------- --------- --------- ---------
CLASS A 9/3/87 8.08 5.12 5.78
---------------------- ------ ---- ---- ----
BARCLAYS CAPITAL GNMA
INDEX 5.37 5.59 6.30
---------------------- ------ ---- ---- ----
MANAGEMENT
INVESTMENT ADVISOR
Deutsche Investment Management Americas Inc.
PORTFOLIO MANAGER(S)
WILLIAM CHEPOLIS, CFA, MANAGING DIRECTOR. Co-Manager of the fund. Joined the
fund in 2002.
OHN CHOE, CFA, ASSOCIATE. Portfolio Manager of the fund. Joined the fund in
2010.
PURCHASE AND SALE OF FUND SHARES
THE FUND IS INTENDED FOR USE IN A VARIABLE INSURANCE PRODUCT. You should
contact the sponsoring insurance company for information on how to purchase and
sell shares of the fund.
TAX INFORMATION
Generally, owners of variable annuity and variable life contracts are not
subject to current federal income taxation on distributions of income or gains
with respect to such contracts. For further information concerning federal
income tax consequences for the holders of variable annuity contracts and
variable life insurance policies, such holders should consult the prospectus
used in connection with the issuance of their particular contracts or policies.
PAYMENTS TO FINANCIAL INTERMEDIARIES
If you purchase the fund through selected affiliated and unaffiliated brokers,
dealers, participating insurance companies or other financial intermediaries,
the fund and its affiliates may pay the financial intermediary for the sale of
fund shares and related services. These payments may create a conflict of
interest by influencing the financial intermediary and your salesperson to
recommend the fund over another investment. Ask your salesperson or visit your
insurance company's web site for more information.
28
PROSPECTUS May 1, 2010 DWS Government & Agency Securities VIP
[DWS INVESTMENTS LOGO]
Deutsche Bank Group
DWS HIGH INCOME VIP
INVESTMENT OBJECTIVE
The fund seeks to provide a high level of current income.
FEES AND EXPENSES OF THE FUND
This table describes the fees and expenses you may pay if you buy and hold
shares of the fund. This information does not reflect fees associated with the
separate account that invests in the fund or any variable life insurance policy
or variable annuity contract for which the fund is an investment option. These
fees will increase expenses.
SHAREHOLDER FEES
(paid directly from your investment) None
-------------------------------------- -----
ANNUAL FUND OPERATING EXPENSES (expenses that you pay each year as a % of the
value of your investment)
A
----------
Management fee 0.50
------------------------------------------------ ----
Distribution/service
(12b-1) fees None
------------------------------------------------ -----
Other expenses (includes an administrative fee) 0.17
------------------------------------------------ -----
TOTAL ANNUAL FUND OPERATING EXPENSES 0.67
------------------------------------------------ -----
EXAMPLE
This Example is intended to help you compare the cost of investing in the fund
with the cost of investing in other mutual funds. The Example assumes that you
invest $10,000 in the fund for the time periods indicated and then redeem all
of your shares at the end of those periods. The Example also assumes that your
investment has a 5% return each year and that the fund's operating expenses
remain the same. Although your actual costs may be higher or lower, based on
these assumptions your costs would be:
1 YEAR 3 YEARS 5 YEARS 10 YEARS
-------- --------- --------- ---------
$68 $214 $373 $835
--- --- ---- ---- ----
PORTFOLIO TURNOVER
The fund pays transaction costs when it buys and sells securities (or "turns
over" its portfolio). A higher portfolio turnover may indicate higher
transaction costs. These costs are not reflected in annual fund operating
expenses or in the expense example, but are reflected in fund performance.
Portfolio turnover rate for fiscal year 2009: 66%.
PRINCIPAL INVESTMENT STRATEGY
MAIN INVESTMENTS. Under normal circumstances, the fund generally invests at
least 65% of net assets, plus the amount of any borrowings for investment
purposes, in junk bonds, which are those rated below the fourth highest credit
rating category (that is, grade BB/Ba and below). The fund may invest up to 50%
of total assets in bonds denominated in US dollars or foreign currencies from
foreign issuers. The fund invests in securities of varying maturities and
intends to maintain a dollar-weighted effective average portfolio maturity that
will not exceed ten years. Subject to its portfolio maturity policy, the fund
may purchase individual securities with any stated maturity.
MANAGEMENT PROCESS. Portfolio management focuses on cash flow and total return
analysis, and broad diversification among countries, sectors, industries and
individual issuers and maturities. Portfolio management uses an active process
that emphasizes relative value in a global environment, managing on a total
return basis, and using intensive research to identify stable to improving
credit situations that may provide yield compensation for the risk of investing
in junk bonds.
The investment process involves a bottom-up approach, where relative value and
fundamental analysis are used to select the best securities within each
industry, and a top-down approach to assess the overall risk and return in the
market and which considers macro trends in the economy. To select securities or
investments, portfolio management:
o analyzes economic conditions for improving or undervalued sectors and
industries;
29
PROSPECTUS May 1, 2010 DWS High Income VIP
o uses independent credit research and on-site management visits to evaluate
individual issuers' debt service, growth rate, and both downgrade and
upgrade potential;
o assesses new offerings versus secondary market opportunities; and
o seeks issuers within attractive industry sectors and with strong long-term
fundamentals and improving credits.
--------------------------------------------------------------------------------
DERIVATIVES. The fund may use various types of derivatives (contracts whose
value is based on, for example, indices, currencies or securities) for hedging,
risk management or non-hedging purposes to seek to enhance potential gains. The
fund may use derivatives as a substitute for direct investment in a particular
asset class or to keep cash on hand to meet shareholder redemptions or other
needs. In particular, portfolio management may use future contracts, currency
options, forward currency contracts and credit default swaps.
SECURITIES LENDING. The fund may lend securities (up to one-third of total
assets) to approved institutions.
--------------------------------------------------------------------------------
MAIN RISKS
There are several risk factors that could hurt the fund's performance, cause
you to lose money or cause the fund's performance to trail that of other
investments.
CREDIT RISK. A fund purchasing debt securities faces the risk that the
creditworthiness of an issuer may decline, causing the value of the debt
securities to decline. In addition, an issuer may not be able to make timely
payments on the interest and/or principal on the debt security it has issued.
Because the issuers of high-yield debt securities or junk bonds (debt
securities rated below the fourth highest category) may be in uncertain
financial health, the prices of their debt securities can be more vulnerable to
bad economic news or even the expectation of bad news, than investment-grade
debt securities.
INTEREST RATE RISK. When interest rates rise, prices of debt securities
generally decline. The longer the duration of the fund's debt securities, the
more sensitive it will be to interest rate changes. (As a general rule, a 1%
rise in interest rates means a 1% fall in value for every year of duration.)
FOREIGN INVESTMENT RISK. To the extent the fund invests in companies based
outside the US, it faces the risks inherent in foreign investing. Adverse
political, economic or social developments could undermine the value of the
fund's investments or prevent the fund from realizing their full value.
Financial reporting standards for companies based in foreign markets differ
from those in the US. Additionally, foreign securities markets generally are
smaller and less liquid than US markets. To the extent that the fund invests in
non-US dollar denominated foreign securities, changes in currency exchange
rates may affect the US dollar value of foreign securities or the income or
gain received on these securities. Foreign investment risks are greater in
emerging markets than in developed markets. Emerging market investments are
often considered speculative.
SECURITY SELECTION RISK. The securities in the fund's portfolio may decline in
value. Portfolio management could be wrong in its analysis of industries,
companies, economic trends, the relative attractiveness of different securities
or other matters.
DERIVATIVES RISK. Risks associated with derivatives include the risk that the
derivative is not well correlated with the security, index or currency to which
it relates; the risk that derivatives may result in losses or missed
opportunities; the risk that the fund will be unable to sell the derivative
because of an illiquid secondary market; the risk that a counterparty is
unwilling or unable to meet its obligation; and the risk that the derivative
transaction could expose the fund to the effects of leverage, which could
increase the fund's exposure to the market and magnify potential losses.
SECURITIES LENDING RISK. Any decline in the value of a portfolio security that
occurs while the security is out on loan is borne by the fund, and will
adversely affect performance. Also, there may be delays in recovery of
securities loaned or even a loss of rights in the collateral should the
borrower of the securities fail financially while holding the security.
COUNTERPARTY RISK. A financial institution or other counterparty with whom the
fund does business (such as trading or securities lending), or that
underwrites, distributes or guarantees any investments or contracts that the
fund owns or is otherwise exposed to, may decline in financial health and
become unable to honor its commitments, which could lead to losses for the
fund.
LIQUIDITY RISK. In certain situations, it may be difficult or impossible to
sell an investment in an orderly fashion at an acceptable price. This may be an
ongoing risk for some investments, such as derivatives or restricted securities
that typically trade only among a limited number of investors.
PRICING RISK. If market conditions make it difficult to value some investments,
the fund may value these investments using more subjective methods, such as
fair value pricing.
PREPAYMENT AND EXTENSION RISK. When interest rates fall, issuers of high
interest debt obligations may pay off the debts earlier than expected
(prepayment risk), and the fund may have to reinvest the proceeds at lower
yields. When interest rates rise, issuers of lower interest debt obligations
may pay off the debts later than expected (extension risk), thus keeping the
fund's assets tied up in lower interest debt obligations. These events could
hurt fund performance.
PAST PERFORMANCE
How a fund's returns vary from year to year can give an idea of its risk; so
can comparing fund performance to overall market performance (as measured by an
appropriate market index). Past performance may not indicate future
30
PROSPECTUS May 1, 2010 DWS High Income VIP
results. All performance figures below assume that dividends were reinvested.
For more recent performance figures, go to www.dws-investments.com (the Web
site does not form a part of this prospectus) or call the phone number for your
share class included in this prospectus. This information doesn't reflect fees
associated with the separate account that invests in the fund or any variable
life insurance policy or variable annuity contract for which the fund is an
investment option. These fees will reduce returns.
CALENDAR YEAR TOTAL RETURNS (%) (Class A)
[BAR GRAPHIC OMITTED HERE]
[BAR GRAPHIC DATA]
-8.68 2.63 -0.30 24.62 12.42 3.89 10.47 0.96 -23.94 39.99
2000 2001 2002 2003 2004 2005 2006 2007 2008 2009
Best Quarter: 14.85%, Q2 2009 Worst Quarter: -16.35%, Q4 2008
Year-to-Date as of 3/31/10: 4.27%
AVERAGE ANNUAL TOTAL RETURNS
(For periods ended 12/31/2009 expressed as a %)
CLASS 1 5 10
INCEPTION YEAR YEARS YEARS
----------- ---------- --------- ---------
CLASS A 4/6/82 39.99 4.29 4.91
------------------------- ------ ----- ---- ----
CREDIT SUISSE HIGH YIELD
INDEX 54.22 5.99 7.07
------------------------- ------ ----- ---- ----
MANAGEMENT
INVESTMENT ADVISOR
Deutsche Investment Management Americas Inc.
PORTFOLIO MANAGER(S)
GARY SULLIVAN, CFA, MANAGING DIRECTOR. Portfolio Manager of the fund. Joined
the fund in 2006.
PURCHASE AND SALE OF FUND SHARES
THE FUND IS INTENDED FOR USE IN A VARIABLE INSURANCE PRODUCT. You should
contact the sponsoring insurance company for information on how to purchase and
sell shares of the fund.
TAX INFORMATION
Generally, owners of variable annuity and variable life contracts are not
subject to current federal income taxation on distributions of income or gains
with respect to such contracts. For further information concerning federal
income tax consequences for the holders of variable annuity contracts and
variable life insurance policies, such holders should consult the prospectus
used in connection with the issuance of their particular contracts or policies.
PAYMENTS TO FINANCIAL INTERMEDIARIES
If you purchase the fund through selected affiliated and unaffiliated brokers,
dealers, participating insurance companies or other financial intermediaries,
the fund and its affiliates may pay the financial intermediary for the sale of
fund shares and related services. These payments may create a conflict of
interest by influencing the financial intermediary and your salesperson to
recommend the fund over another investment. Ask your salesperson or visit your
insurance company's web site for more information.
31
PROSPECTUS May 1, 2010 DWS High Income VIP
[DWS INVESTMENTS LOGO]
Deutsche Bank Group
DWS LARGE CAP VALUE VIP
INVESTMENT OBJECTIVE
The fund seeks to achieve a high rate of total return.
FEES AND EXPENSES OF THE FUND
This table describes the fees and expenses you may pay if you buy and hold
shares of the fund. This information does not reflect fees associated with the
separate account that invests in the fund or any variable life insurance policy
or variable annuity contract for which the fund is an investment option. These
fees will increase expenses.
SHAREHOLDER FEES
(paid directly from your investment) None
-------------------------------------- -----
ANNUAL FUND OPERATING EXPENSES (expenses that you pay each year as a % of the
value of your investment)
A
----------
Management fee 0.65
------------------------------------------------ ----
Distribution/service
(12b-1) fees None
------------------------------------------------ -----
Other expenses (includes an administrative fee) 0.11
------------------------------------------------ -----
TOTAL ANNUAL FUND OPERATING EXPENSES 0.76
------------------------------------------------ -----
EXAMPLE
This Example is intended to help you compare the cost of investing in the fund
with the cost of investing in other mutual funds. The Example assumes that you
invest $10,000 in the fund for the time periods indicated and then redeem all
of your shares at the end of those periods. The Example also assumes that your
investment has a 5% return each year and that the fund's operating expenses
remain the same. Although your actual costs may be higher or lower, based on
these assumptions your costs would be:
1 YEAR 3 YEARS 5 YEARS 10 YEARS
-------- --------- --------- ---------
$78 $243 $422 $942
--- --- ---- ---- ----
PORTFOLIO TURNOVER
The fund pays transaction costs when it buys and sells securities (or "turns
over" its portfolio). A higher portfolio turnover may indicate higher
transaction costs. These costs are not reflected in annual fund operating
expenses or in the expense example, but are reflected in fund performance.
Portfolio turnover rate for fiscal year 2009: 76%.
PRINCIPAL INVESTMENT STRATEGY
Under normal circumstances, the fund invests at least 80% of net assets, plus
the amount of any borrowings for investment purposes, in common stocks and
other equity securities of large US companies that are similar in size to the
companies in the Russell 1000 (Reg. TM) Value Index and that portfolio
management believes are undervalued. These are typically companies that have
been sound historically, but are temporarily out of favor. The fund intends to
invest primarily in companies whose market capitalizations fall within the
normal range of the Russell 1000 (Reg. TM) Value Index. Although the fund can
invest in stocks of any economic sector (which is comprised of two or more
industries), at times it may emphasize certain sectors, even investing more
than 25% of total assets in any one sector.
The fund may invest up to 20% of total assets in foreign securities.
MANAGEMENT PROCESS. Portfolio management begins by screening for stocks whose
price-to-earnings ratios are below the average for the S&P 500 Index. Portfolio
management then compares a company's stock price to its book value, cash flow
and yield, and analyzes individual companies to identify those that are
financially sound and appear to have strong potential for long-term growth.
Portfolio management assembles the fund's portfolio from among the most
attractive stocks, drawing on an analysis of economic outlooks for various
sectors and industries.
Portfolio management will normally sell a stock when it believes the stock's
price is unlikely to go higher, its fundamental factors have changed, other
investments offer
32
PROSPECTUS May 1, 2010 DWS Large Cap Value VIP
better opportunities or in the course of adjusting its emphasis on a given
industry.
--------------------------------------------------------------------------------
DERIVATIVES. The fund may use various types of derivatives (contracts whose
value is based on, for example, indices, currencies or securities) for hedging,
risk management or non-hedging purposes to seek to enhance potential gains. The
fund may use derivatives as a substitute for direct investment in a particular
asset class or to keep cash on hand to meet shareholder redemptions or other
needs. In particular, the fund may use futures, currency options and forward
currency transactions.
SECURITIES LENDING. The fund may lend securities (up to one-third of total
assets) to approved institutions.
--------------------------------------------------------------------------------
MAIN RISKS
There are several risk factors that could hurt the fund's performance, cause
you to lose money or cause the fund's performance to trail that of other
investments.
STOCK MARKET RISK. When stock prices fall, you should expect the value of your
investment to fall as well. To the extent the fund invests in a particular
capitalization or market sector, the fund's performance may be proportionately
affected by that segment's general performance.
SECURITY SELECTION RISK. The securities in the fund's portfolio may decline in
value. Portfolio management could be wrong in its analysis of industries,
companies, economic trends, the relative attractiveness of different securities
or other matters.
VALUE INVESTING RISK. As a category, value stocks may underperform growth
stocks (and the stock market as a whole) over any period of time. In addition,
value stocks selected for investment by portfolio management may not perform as
anticipated: stocks that appear undervalued may remain undervalued
indefinitely, or may in fact be fairly valued.
FOCUS RISK. To the extent that the fund focuses its investments in particular
industries, asset classes or sectors of the economy, any market price
movements, regulatory or technological changes, or economic conditions
affecting companies in those industries, asset classes or sectors will have a
significant impact on the fund's performance. For example, consumer goods
companies could be hurt by a rise in unemployment or technology companies could
be hurt by such factors as market saturation, price competition and rapid
obsolescence.
DERIVATIVES RISK. Risks associated with derivatives include the risk that the
derivative is not well correlated with the security, index or currency to which
it relates; the risk that derivatives may result in losses or missed
opportunities; the risk that the fund will be unable to sell the derivative
because of an illiquid secondary market; the risk that a counterparty is
unwilling or unable to meet its obligation; and the risk that the derivative
transaction could expose the fund to the effects of leverage, which could
increase the fund's exposure to the market and magnify potential losses.
SECURITIES LENDING RISK. Any decline in the value of a portfolio security that
occurs while the security is out on loan is borne by the fund, and will
adversely affect performance. Also, there may be delays in recovery of
securities loaned or even a loss of rights in the collateral should the
borrower of the securities fail financially while holding the security.
FOREIGN INVESTMENT RISK. To the extent the fund invests in companies based
outside the US, it faces the risks inherent in foreign investing. Adverse
political, economic or social developments could undermine the value of the
fund's investments or prevent the fund from realizing their full value.
Financial reporting standards for companies based in foreign markets differ
from those in the US. Additionally, foreign securities markets generally are
smaller and less liquid than US markets. To the extent that the fund invests in
non-US dollar denominated foreign securities, changes in currency exchange
rates may affect the US dollar value of foreign securities or the income or
gain received on these securities. Foreign investment risks are greater in
emerging markets than in developed markets. Emerging market investments are
often considered speculative.
COUNTERPARTY RISK. A financial institution or other counterparty with whom the
fund does business (such as trading or securities lending), or that
underwrites, distributes or guarantees any investments or contracts that the
fund owns or is otherwise exposed to, may decline in financial health and
become unable to honor its commitments, which could lead to losses for the
fund.
LIQUIDITY RISK. In certain situations, it may be difficult or impossible to
sell an investment in an orderly fashion at an acceptable price. This may be an
ongoing risk for some investments, such as derivatives or restricted securities
that typically trade only among a limited number of investors.
PRICING RISK. If market conditions make it difficult to value some investments,
the fund may value these investments using more subjective methods, such as
fair value pricing.
PAST PERFORMANCE
How a fund's returns vary from year to year can give an idea of its risk; so
can comparing fund performance to overall market performance (as measured by an
appropriate market index). Past performance may not indicate future results.
All performance figures below assume that dividends were reinvested. For more
recent performance figures, go to www.dws-investments.com (the Web site does
not form a part of this prospectus) or call the phone number for your share
class included in this prospectus. This information doesn't reflect fees
associated with the separate account that invests in the fund or any variable
life insurance policy or variable annuity contract for which the fund is an
investment option. These fees will reduce returns.
33
PROSPECTUS May 1, 2010 DWS Large Cap Value VIP
CALENDAR YEAR TOTAL RETURNS (%) (Class A)
[BAR GRAPHIC OMITTED HERE]
[BAR GRAPHIC DATA]
16.13 1.87 -14.98 32.60 10.07 1.97 15.41 13.15 -36.40 25.37
2000 2001 2002 2003 2004 2005 2006 2007 2008 2009
Best Quarter: 18.86%, Q2 2003 Worst Quarter: -22.50%, Q4 2008
Year-to-Date as of 3/31/10: 3.87%
AVERAGE ANNUAL TOTAL RETURNS
(For periods ended 12/31/2009 expressed as a %)
CLASS 1 5 10
INCEPTION YEAR YEARS YEARS
----------- ---------- --------- ---------
CLASS A 5/1/96 25.37 1.21 4.54
------------------- ------ ----- ----- ----
RUSSELL 1000 VALUE
INDEX 19.69 -0.25 2.47
------------------- ------ ----- ------ ----
MANAGEMENT
INVESTMENT ADVISOR
Deutsche Investment Management Americas Inc.
SUBADVISOR
Deutsche Asset Management International GmbH
PORTFOLIO MANAGER(S)
THOMAS SCHUESSLER, PHD., MANAGING DIRECTOR. Lead Portfolio Manager of the fund.
Joined the fund in 2007.
VOLKER DOSCH, MANAGING DIRECTOR. Portfolio Manager of the fund. Joined the fund
in 2009.
OLIVER PFEIL, PHD., VICE PRESIDENT. Portfolio Manager of the fund. Joined the
fund in 2009.
PURCHASE AND SALE OF FUND SHARES
THE FUND IS INTENDED FOR USE IN A VARIABLE INSURANCE PRODUCT. You should
contact the sponsoring insurance company for information on how to purchase and
sell shares of the fund.
TAX INFORMATION
Generally, owners of variable annuity and variable life contracts are not
subject to current federal income taxation on distributions of income or gains
with respect to such contracts. For further information concerning federal
income tax consequences for the holders of variable annuity contracts and
variable life insurance policies, such holders should consult the prospectus
used in connection with the issuance of their particular contracts or policies.
PAYMENTS TO FINANCIAL INTERMEDIARIES
If you purchase the fund through selected affiliated and unaffiliated brokers,
dealers, participating insurance companies or other financial intermediaries,
the fund and its affiliates may pay the financial intermediary for the sale of
fund shares and related services. These payments may create a conflict of
interest by influencing the financial intermediary and your salesperson to
recommend the fund over another investment. Ask your salesperson or visit your
insurance company's web site for more information.
34
PROSPECTUS May 1, 2010 DWS Large Cap Value VIP
[DWS INVESTMENTS LOGO]
Deutsche Bank Group
DWS MID CAP GROWTH VIP
INVESTMENT OBJECTIVE
The fund seeks long-term capital growth.
FEES AND EXPENSES OF THE FUND
This table describes the fees and expenses you may pay if you buy and hold
shares of the fund. This information does not reflect fees associated with the
separate account that invests in the fund or any variable life insurance policy
or variable annuity contract for which the fund is an investment option. These
fees will increase expenses.
SHAREHOLDER FEES
(paid directly from your investment) None
-------------------------------------- -----
ANNUAL FUND OPERATING EXPENSES (expenses that you pay each year as a % of the
value of your investment)
A
----------
Management fee 0.67
------------------------------------------------ ----
Distribution/service
(12b-1) fees None
------------------------------------------------ -----
Other expenses (includes an administrative fee) 0.50
------------------------------------------------ -----
TOTAL ANNUAL FUND OPERATING EXPENSES 1.17
------------------------------------------------ -----
EXAMPLE
This Example is intended to help you compare the cost of investing in the fund
with the cost of investing in other mutual funds. The Example assumes that you
invest $10,000 in the fund for the time periods indicated and then redeem all
of your shares at the end of those periods. The Example also assumes that your
investment has a 5% return each year and that the fund's operating expenses
remain the same. Although your actual costs may be higher or lower, based on
these assumptions your costs would be:
1 YEAR 3 YEARS 5 YEARS 10 YEARS
-------- --------- --------- ---------
$119 $372 $644 $1,420
--- ---- ---- ---- ------
PORTFOLIO TURNOVER
The fund pays transaction costs when it buys and sells securities (or "turns
over" its portfolio). A higher portfolio turnover may indicate higher
transaction costs. These costs are not reflected in annual fund operating
expenses or in the expense example, but are reflected in fund performance.
Portfolio turnover rate for fiscal year 2009: 89%.
PRINCIPAL INVESTMENT STRATEGY
MAIN INVESTMENTS. Under normal circumstances, the fund invests at least 80% of
its assets, plus the amount of any borrowings for investment purposes,
determined at the time of purchase, in companies with market caps within the
market capitalization range of the Russell Mid Cap Growth Index or securities
with equity characteristics that provide exposure to those companies. The
fund's equity investments are mainly common stocks, but may also include other
types of equity securities such as preferred stocks or convertible securities.
The fund may invest up to 20% of its assets in stocks and other securities of
companies based outside the US.
MANAGEMENT PROCESS. In choosing stocks, portfolio management focuses on
individual security selection rather than industry selection. Portfolio
management uses an active process that combines financial analysis with company
visits to evaluate management and strategies. Each portfolio manager has
specific sector responsibilities, with investment discretion over securities
within their sectors.
Company research lies at the heart of the investment process. Portfolio
management uses a "bottom-up" approach to picking securities, focusing on
undervalued stocks with fast-growing earnings and superior near-to-intermediate
term performance potential.
Portfolio management emphasizes individual selection of medium-sized stocks
across all economic sectors, early in their growth cycles and with the
potential to be the blue chips of the future. Portfolio management generally
seeks companies with a leading or dominant position in their
35
PROSPECTUS May 1, 2010 DWS Mid Cap Growth VIP
niche markets, a high rate of return on invested capital and the ability to
finance a major part of future growth from internal sources.
Portfolio management follows a disciplined selling process that is designed to
lessen risk, and will normally sell a stock when its price reaches their
expectations, there is a material change in the company's fundamentals, other
investments offer better opportunities or the market capitalization of a stock
is distorting the weighted average market capitalization of the fund.
--------------------------------------------------------------------------------
DERIVATIVES. The fund may use various types of derivatives (contracts whose
value is based on, for example, indices, currencies or securities) for hedging,
risk management or non-hedging purposes to seek to enhance potential gains. The
fund may use derivatives as a substitute for direct investment in a particular
asset class or to keep cash on hand to meet shareholder redemptions or other
needs. In particular, the fund may use futures and options, and write covered
call options.
SECURITIES LENDING. The fund may lend securities (up to one-third of total
assets) to approved institutions.
--------------------------------------------------------------------------------
MAIN RISKS
There are several risk factors that could hurt the fund's performance, cause
you to lose money or cause the fund's performance to trail that of other
investments.
STOCK MARKET RISK. When stock prices fall, you should expect the value of your
investment to fall as well.
MEDIUM-SIZED COMPANY RISK. Medium-sized company stocks tend to be more volatile
than large company stocks. Medium-sized companies are less widely followed by
stock analysts and less information about them is available to investors.
GROWTH INVESTING RISK. As a category, growth stocks may underperform value
stocks (and the stock market as a whole) over any period of time. Because the
prices of growth stocks are based largely on the expectation of future
earnings, growth stock prices can decline rapidly and significantly in reaction
to negative news about such factors as earnings, the economy, political
developments, or other news.
SECURITY SELECTION RISK. The securities in the fund's portfolio may decline in
value. Portfolio management could be wrong in its analysis of industries,
companies, economic trends, the relative attractiveness of different securities
or other matters.
FOREIGN INVESTMENT RISK. To the extent the fund invests in companies based
outside the US, it faces the risks inherent in foreign investing. Adverse
political, economic or social developments could undermine the value of the
fund's investments or prevent the fund from realizing their full value.
Financial reporting standards for companies based in foreign markets differ
from those in the US. Additionally, foreign securities markets generally are
smaller and less liquid than US markets. To the extent that the fund invests in
non-US dollar denominated foreign securities, changes in currency exchange
rates may affect the US dollar value of foreign securities or the income or
gain received on these securities. Foreign investment risks are greater in
emerging markets than in developed markets. Emerging market investments are
often considered speculative.
SECURITIES LENDING RISK. Any decline in the value of a portfolio security that
occurs while the security is out on loan is borne by the fund, and will
adversely affect performance. Also, there may be delays in recovery of
securities loaned or even a loss of rights in the collateral should the
borrower of the securities fail financially while holding the security.
DERIVATIVES RISK. Risks associated with derivatives include the risk that the
derivative is not well correlated with the security, index or currency to which
it relates; the risk that derivatives may result in losses or missed
opportunities; the risk that the fund will be unable to sell the derivative
because of an illiquid secondary market; the risk that a counterparty is
unwilling or unable to meet its obligation; and the risk that the derivative
transaction could expose the fund to the effects of leverage, which could
increase the fund's exposure to the market and magnify potential losses.
COUNTERPARTY RISK. A financial institution or other counterparty with whom the
fund does business (such as trading or securities lending), or that
underwrites, distributes or guarantees any investments or contracts that the
fund owns or is otherwise exposed to, may decline in financial health and
become unable to honor its commitments, which could lead to losses for the
fund.
LIQUIDITY RISK. In certain situations, it may be difficult or impossible to
sell an investment in an orderly fashion at an acceptable price. This may be an
ongoing risk for some investments, such as derivatives or restricted securities
that typically trade only among a limited number of investors.
PRICING RISK. If market conditions make it difficult to value some investments,
the fund may value these investments using more subjective methods, such as
fair value pricing.
PAST PERFORMANCE
How a fund's returns vary from year to year can give an idea of its risk; so
can comparing fund performance to overall market performance (as measured by an
appropriate market index). Past performance may not indicate future results.
All performance figures below assume that dividends were reinvested. For more
recent performance figures, go to www.dws-investments.com (the Web site does
not form a part of this prospectus) or call the phone number for your share
class included in this prospectus. This information doesn't reflect fees
associated with the
36
PROSPECTUS May 1, 2010 DWS Mid Cap Growth VIP
separate account that invests in the fund or any variable life insurance policy
or variable annuity contract for which the fund is an investment option. These
fees will reduce returns.
Prior to October 28, 2005, the fund was named Scudder Aggressive Growth
Portfolio and operated with a different objective and investment strategy.
Performance may have been different if the fund's current policies had been in
effect.
CALENDAR YEAR TOTAL RETURNS (%) (Class A)
[BAR GRAPHIC OMITTED HERE]
[BAR GRAPHIC DATA]
-4.96 -21.76 -30.66 33.99 4.02 15.04 10.95 8.36 -50.04 43.09
2000 2001 2002 2003 2004 2005 2006 2007 2008 2009
Best Quarter: 23.43%, Q4 2001 Worst Quarter: -32.47%, Q4 2008
Year-to-Date as of 3/31/10: 5.86%
AVERAGE ANNUAL TOTAL RETURNS
(For periods ended 12/31/2009 expressed as a %)
CLASS 1 5 10
INCEPTION YEAR YEARS YEARS
----------- ---------- ---------- ----------
CLASS A 5/3/99 43.09 -0.22 -3.36
---------------------- ------ ----- ------ ------
RUSSELL MIDCAP GROWTH
INDEX 46.29 2.40 -0.52
---------------------- ------ ----- ------ ------
MANAGEMENT
INVESTMENT ADVISOR
Deutsche Investment Management Americas Inc.
PORTFOLIO MANAGER(S)
JOSEPH AXTELL, CFA, MANAGING DIRECTOR. Portfolio Manager of the fund. Joined
the fund in 2006.
RAFAELINA M. LEE, DIRECTOR. Portfolio Manager of the fund. Joined the fund in
2008.
PURCHASE AND SALE OF FUND SHARES
THE FUND IS INTENDED FOR USE IN A VARIABLE INSURANCE PRODUCT. You should
contact the sponsoring insurance company for information on how to purchase and
sell shares of the fund.
TAX INFORMATION
Generally, owners of variable annuity and variable life contracts are not
subject to current federal income taxation on distributions of income or gains
with respect to such contracts. For further information concerning federal
income tax consequences for the holders of variable annuity contracts and
variable life insurance policies, such holders should consult the prospectus
used in connection with the issuance of their particular contracts or policies.
PAYMENTS TO FINANCIAL INTERMEDIARIES
If you purchase the fund through selected affiliated and unaffiliated brokers,
dealers, participating insurance companies or other financial intermediaries,
the fund and its affiliates may pay the financial intermediary for the sale of
fund shares and related services. These payments may create a conflict of
interest by influencing the financial intermediary and your salesperson to
recommend the fund over another investment. Ask your salesperson or visit your
insurance company's web site for more information.
37
PROSPECTUS May 1, 2010 DWS Mid Cap Growth VIP
[DWS INVESTMENTS LOGO]
Deutsche Bank Group
DWS MONEY MARKET VIP
INVESTMENT OBJECTIVE
The fund seeks maximum current income to the extent consistent with stability
of principal.
FEES AND EXPENSES OF THE FUND
This table describes the fees and expenses you may pay if you buy and hold
shares of the fund. This information does not reflect fees associated with the
separate account that invests in the fund or any variable life insurance policy
or variable annuity contract for which the fund is an investment option. These
fees will increase expenses.
SHAREHOLDER FEES
(paid directly from your investment) None
-------------------------------------- -----
ANNUAL FUND OPERATING EXPENSES (expenses that you pay each year as a % of the
value of your investment)
A
----------
Management fee 0.29
------------------------------------------------ ----
Distribution/service
(12b-1) fees None
------------------------------------------------ -----
Other expenses (includes an administrative fee) 0.14
------------------------------------------------ -----
TOTAL ANNUAL FUND OPERATING EXPENSES 0.43
------------------------------------------------ -----
EXAMPLE
This Example is intended to help you compare the cost of investing in the fund
with the cost of investing in other mutual funds. The Example assumes that you
invest $10,000 in the fund for the time periods indicated and then redeem all
of your shares at the end of those periods. The Example also assumes that your
investment has a 5% return each year and that the fund's operating expenses
remain the same. Although your actual costs may be higher or lower, based on
these assumptions your costs would be:
1 YEAR 3 YEARS 5 YEARS 10 YEARS
-------- --------- --------- ---------
$44 $138 $241 $542
--- --- ---- ---- ----
PRINCIPAL INVESTMENT STRATEGY
MAIN INVESTMENTS. The fund is managed in accordance with Rule 2a-7 under the
Investment Company Act of 1940, as amended. Fund securities are denominated in
US dollars and have remaining maturities of 397 days (about 13 months) or less
at the time of purchase. The fund may also invest in securities that have
features that have the effect of reducing their maturities to 397 days or less
at the time of purchase. The fund maintains a dollar-weighted average maturity
of 90 days or less.
Although the fund seeks to maintain a stable $1.00 share price, you could lose
money by investing in the fund. All money market instruments can change in
value when interest rates or an issuer's creditworthiness change.
The fund invests in high quality, short-term, US dollar denominated money
market instruments paying a fixed, variable or floating interest rate.
The fund will invest more than 25% of total assets in the obligations of banks
and other financial institutions that satisfy the fund's eligibility
requirements.
MANAGEMENT PROCESS. The fund pursues its objective by investing in high
quality, short-term securities, as well as repurchase agreements that are
backed by high-quality securities.
Working in consultation with portfolio management, a credit team screens
potential securities and develops a list of those that the fund may buy.
Portfolio management, looking for attractive yield and weighing considerations
such as credit quality, economic outlooks and possible interest rate movements,
then decides which securities on this list to buy. Portfolio management may
adjust the fund's exposure to interest rate risk, typically seeking to take
advantage of possible rises in interest rates and to preserve yield when
interest rates appear likely to fall.
MAIN RISKS
There are several risk factors that could reduce the yield you get from the
fund, cause the fund's performance to trail that of other investments, or cause
you to lose money.
38
PROSPECTUS May 1, 2010 DWS Money Market VIP
MONEY MARKET FUND RISK. An investment in the fund is not insured or guaranteed
by the FDIC or any other government agency. Although the fund seeks to preserve
the value of your investment at $1.00 per share, this share price isn't
guaranteed, and if it falls below $1.00 you would lose money. The Advisor is
not obligated to take any action to maintain the $1.00 share price. The share
price could fall below $1.00 as a result of the actions of one or more large
investors in the fund. The credit quality of the fund's holdings can change
rapidly in certain markets, and the default of a single holding could cause the
fund's share price to fall below $1.00, as could periods of high redemption
pressures and/or illiquid markets. The actions of a few large investors in the
fund may have a significant adverse effect on the share price of the fund.
INTEREST RATE RISK. Rising interest rates could cause the value of the fund's
investments - and therefore its share price as well - to decline. Conversely,
any decline in interest rates is likely to cause the fund's yield to decline,
and during periods of unusually low interest rates, the fund's yield may
approach zero. Over time, the total return of a money market fund may not keep
pace with inflation, which would result in a net loss of purchasing power for
long-term investors.
CREDIT RISK. The fund's performance could be hurt if a money market instrument
declines in credit quality or goes into default, or if an issuer does not make
timely payments of interest or principal. For money market instruments that
rely on third-party guarantors to support their credit quality, the same risks
may apply if the financial condition of the guarantor deteriorates or the
guarantor ceases insuring money market instruments. Because guarantors may
insure many types of debt obligations, including subprime mortgage bonds and
other high-risk bonds, their financial condition could deteriorate as a result
of events that have little or no connection to securities owned by the fund.
SECURITY SELECTION RISK. Although short-term securities are relatively stable
investments, it is possible that the securities in which the fund invests will
not perform as expected. This could cause the fund's returns to lag behind
those of similar money market mutual funds and could result in a decline in
share price.
REPURCHASE AGREEMENT RISK. If the party that sells the securities to the fund
defaults on its obligation to repurchase them at the agreed-upon time and
price, the fund could lose money.
COUNTERPARTY RISK. A financial institution or other counterparty with whom the
fund does business (such as trading or securities lending), or that
underwrites, distributes or guarantees any investments or contracts that the
fund owns or is otherwise exposed to, may decline in financial health and
become unable to honor its commitments, which could lead to losses for the
fund.
CONCENTRATION RISK. Any fund that concentrates in a particular segment of the
market will generally be more volatile than a fund that invests more broadly.
Any market price movements, regulatory or technological changes, or economic
conditions affecting banks or financial institutions will have a significant
impact on the fund's performance.
PREPAYMENT AND EXTENSION RISK. When interest rates fall, issuers of high
interest debt obligations may pay off the debts earlier than expected
(prepayment risk), and the fund may have to reinvest the proceeds at lower
yields. When interest rates rise, issuers of lower interest debt obligations
may pay off the debts later than expected (extension risk), thus keeping the
fund's assets tied up in lower interest debt obligations. These events could
hurt fund performance.
FOREIGN INVESTMENT RISK. To the extent that the fund invests in money market
instruments of foreign issuers that are denominated in US dollars, it faces
some of the risks of foreign investing, such as unfavorable political and legal
developments, limited financial information, regulatory risk and economic and
financial instability.
PAST PERFORMANCE
How a fund's returns vary from year to year can give an idea of its risk. Past
performance may not indicate future results. All performance figures below
assume that dividends were reinvested. The 7-day yield, which is often referred
to as the "current yield," is the income generated by the fund over a seven-day
period. This amount is then annualized, which means that we assume the fund
generates the same income every week for a year. For more recent performance
figures, go to www.dws-investments.com (the Web site does not form a part of
this prospectus) or call the phone number for your share class included in this
prospectus. This information doesn't reflect fees associated with the separate
account that invests in the fund or any variable life insurance policy or
variable annuity contract for which the fund is an investment option. These
fees will reduce returns.
CALENDAR YEAR TOTAL RETURNS (%) (Class A)
[BAR GRAPHIC OMITTED HERE]
[BAR GRAPHIC DATA]
6.10 3.75 1.35 0.72 0.91 2.80 4.65 5.00 2.64 0.34
2000 2001 2002 2003 2004 2005 2006 2007 2008 2009
Best Quarter: 1.56%, Q3 2000 Worst Quarter: 0.01%, Q3 2009
Year-to-Date as of 3/31/10: 0.00%
39
PROSPECTUS May 1, 2010 DWS Money Market VIP
AVERAGE ANNUAL TOTAL RETURNS
(For periods ended 12/31/2009 expressed as a %)
CLASS 1 5 10
INCEPTION YEAR YEARS YEARS
----------- --------- --------- ---------
CLASS A 4/6/82 0.34 3.07 2.81
--------- ------ ---- ---- ----
7-day yield as of December 31, 2009: 0.01%
MANAGEMENT
INVESTMENT ADVISOR
Deutsche Investment Management Americas Inc.
PURCHASE AND SALE OF FUND SHARES
THE FUND IS INTENDED FOR USE IN A VARIABLE INSURANCE PRODUCT. You should
contact the sponsoring insurance company for information on how to purchase and
sell shares of the fund.
TAX INFORMATION
Generally, owners of variable annuity and variable life contracts are not
subject to current federal income taxation on distributions of income or gains
with respect to such contracts. For further information concerning federal
income tax consequences for the holders of variable annuity contracts and
variable life insurance policies, such holders should consult the prospectus
used in connection with the issuance of their particular contracts or policies.
PAYMENTS TO FINANCIAL INTERMEDIARIES
If you purchase the fund through selected affiliated and unaffiliated brokers,
dealers, participating insurance companies or other financial intermediaries,
the fund and its affiliates may pay the financial intermediary for the sale of
fund shares and related services. These payments may create a conflict of
interest by influencing the financial intermediary and your salesperson to
recommend the fund over another investment. Ask your salesperson or visit your
insurance company's web site for more information.
40
PROSPECTUS May 1, 2010 DWS Money Market VIP
[DWS INVESTMENTS LOGO]
Deutsche Bank Group
DWS SMALL CAP GROWTH VIP
INVESTMENT OBJECTIVE
The portfolio seeks maximum appreciation of investors' capital.
FEES AND EXPENSES OF THE FUND
This table describes the fees and expenses you may pay if you buy and hold
shares of the fund. This information does not reflect fees associated with the
separate account that invests in the fund or any variable life insurance policy
or variable annuity contract for which the fund is an investment option. These
fees will increase expenses.
SHAREHOLDER FEES
(paid directly from your investment) None
-------------------------------------- -----
ANNUAL FUND OPERATING EXPENSES (expenses that you pay each year as a % of the
value of your investment)
A
----------
Management fee 0.55
------------------------------------------------ ----
Distribution/service
(12b-1) fees None
------------------------------------------------ -----
Other expenses (includes an administrative fee) 0.22
------------------------------------------------ -----
TOTAL ANNUAL FUND OPERATING EXPENSES 0.77
------------------------------------------------ -----
EXAMPLE
This Example is intended to help you compare the cost of investing in the fund
with the cost of investing in other mutual funds. The Example assumes that you
invest $10,000 in the fund for the time periods indicated and then redeem all
of your shares at the end of those periods. The Example also assumes that your
investment has a 5% return each year and that the fund's operating expenses
remain the same. Although your actual costs may be higher or lower, based on
these assumptions your costs would be:
1 YEAR 3 YEARS 5 YEARS 10 YEARS
-------- --------- --------- ---------
$79 $246 $428 $954
--- --- ---- ---- ----
PORTFOLIO TURNOVER
The fund pays transaction costs when it buys and sells securities (or "turns
over" its portfolio). A higher portfolio turnover may indicate higher
transaction costs. These costs are not reflected in annual fund operating
expenses or in the expense example, but are reflected in fund performance.
Portfolio turnover rate for fiscal year 2009: 93%.
PRINCIPAL INVESTMENT STRATEGY
MAIN INVESTMENTS. Under normal circumstances, the fund invests at least 80% of
net assets, plus the amount of any borrowings for investment purposes, in small
capitalization stocks similar in size to those comprising the Russell 2000
(Reg. TM) Growth Index. The fund intends to invest primarily in companies whose
market capitalizations fall within the normal range of the Index. The fund may
invest in initial public offerings. The fund may also invest in other types of
equity securities such as preferred stocks or convertible securities. While the
fund invests mainly in US stocks, it could invest up to 25% of total assets in
foreign securities.
MANAGEMENT PROCESS. In choosing stocks, portfolio management focuses on
individual security selection rather than industry selection. Portfolio
management uses an active process that combines financial analysis with company
visits to evaluate management and strategies. Each portfolio manager has
specific sector responsibilities, with investment discretion over securities
within their sectors.
Company research lies at the heart of the investment process. Portfolio
management uses a "bottom-up" approach to picking securities, focusing on
stocks with superior growth prospects and above average near-to-intermediate
term performance potential.
Portfolio management emphasizes individual selection of small company stocks
across all economic sectors, early in their growth cycles and with the
potential to be the blue chips of the future. Portfolio management generally
seeks companies with a leading or dominant position in their niche markets, a
high rate of return on invested capital and the ability to finance a major part
of future growth from
41
PROSPECTUS May 1, 2010 DWS Small Cap Growth VIP
internal sources. Portfolio management also looks for estimated above-average
growth in revenues and earnings and a balance sheet that can support this
growth potential with sufficient working capital and manageable levels of debt.
Portfolio management follows a disciplined selling process that is designed to
lessen risk, and will normally sell a stock when its price reaches their
expectations, there is a material change in the company's fundamentals, other
investments offer better opportunities or the market capitalization of a stock
is distorting the weighted average market capitalization of the fund.
--------------------------------------------------------------------------------
DERIVATIVES. The fund may use various types of derivatives (contracts whose
value is based on, for example, indices, currencies or securities) for hedging,
risk management or non-hedging purposes to seek to enhance potential gains. The
fund may use derivatives as a substitute for direct investment in a particular
asset class or to keep cash on hand to meet shareholder redemptions or other
needs. In particular, the fund may use futures and options, and write covered
call options.
SECURITIES LENDING. The fund may lend securities (up to one-third of total
assets) to approved institutions.
--------------------------------------------------------------------------------
MAIN RISKS
There are several risk factors that could hurt the fund's performance, cause
you to lose money or cause the fund's performance to trail that of other
investments.
STOCK MARKET RISK. When stock prices fall, you should expect the value of your
investment to fall as well.
SMALL COMPANY RISK. Small company stocks tend to be more volatile and less
liquid than large company stocks. Small companies are less widely followed by
stock analysts and less information about them is available to investors.
GROWTH INVESTING RISK. As a category, growth stocks may underperform value
stocks (and the stock market as a whole) over any period of time. Because the
prices of growth stocks are based largely on the expectation of future
earnings, growth stock prices can decline rapidly and significantly in reaction
to negative news about such factors as earnings, the economy, political
developments, or other news.
SECURITY SELECTION RISK. The securities in the fund's portfolio may decline in
value. Portfolio management could be wrong in its analysis of industries,
companies, economic trends, the relative attractiveness of different securities
or other matters.
FOREIGN INVESTMENT RISK. To the extent the fund invests in companies based
outside the US, it faces the risks inherent in foreign investing. Adverse
political, economic or social developments could undermine the value of the
fund's investments or prevent the fund from realizing their full value.
Financial reporting standards for companies based in foreign markets differ
from those in the US. Additionally, foreign securities markets generally are
smaller and less liquid than US markets. To the extent that the fund invests in
non-US dollar denominated foreign securities, changes in currency exchange
rates may affect the US dollar value of foreign securities or the income or
gain received on these securities. Foreign investment risks are greater in
emerging markets than in developed markets. Emerging market investments are
often considered speculative.
DERIVATIVES RISK. Risks associated with derivatives include the risk that the
derivative is not well correlated with the security, index or currency to which
it relates; the risk that derivatives may result in losses or missed
opportunities; the risk that the fund will be unable to sell the derivative
because of an illiquid secondary market; the risk that a counterparty is
unwilling or unable to meet its obligation; and the risk that the derivative
transaction could expose the fund to the effects of leverage, which could
increase the fund's exposure to the market and magnify potential losses.
SECURITIES LENDING RISK. Any decline in the value of a portfolio security that
occurs while the security is out on loan is borne by the fund, and will
adversely affect performance. Also, there may be delays in recovery of
securities loaned or even a loss of rights in the collateral should the
borrower of the securities fail financially while holding the security.
COUNTERPARTY RISK. A financial institution or other counterparty with whom the
fund does business (such as trading or securities lending), or that
underwrites, distributes or guarantees any investments or contracts that the
fund owns or is otherwise exposed to, may decline in financial health and
become unable to honor its commitments, which could lead to losses for the
fund.
IPO RISK. Prices of securities bought in an initial public offering (IPO) may
rise and fall rapidly, often because of investor perceptions rather than
economic reasons.
LIQUIDITY RISK. In certain situations, it may be difficult or impossible to
sell an investment in an orderly fashion at an acceptable price. This may be an
ongoing risk for some investments, such as derivatives or restricted securities
that typically trade only among a limited number of investors.
PRICING RISK. If market conditions make it difficult to value some investments,
the fund may value these investments using more subjective methods, such as
fair value pricing.
PAST PERFORMANCE
How a fund's returns vary from year to year can give an idea of its risk; so
can comparing fund performance to overall market performance (as measured by an
appropriate market index). Past performance may not indicate future results.
All performance figures below assume that dividends were reinvested. For more
recent performance figures, go to www.dws-investments.com (the Web site does
not form a part of this prospectus) or call the phone
42
PROSPECTUS May 1, 2010 DWS Small Cap Growth VIP
number for your share class included in this prospectus. This information
doesn't reflect fees associated with the separate account that invests in the
fund or any variable life insurance policy or variable annuity contract for
which the fund is an investment option. These fees will reduce returns.
CALENDAR YEAR TOTAL RETURNS (%) (Class A)
[BAR GRAPHIC OMITTED HERE]
[BAR GRAPHIC DATA]
-10.71 -28.91 -33.36 32.94 11.02 7.07 5.27 6.20 -49.50 40.60
2000 2001 2002 2003 2004 2005 2006 2007 2008 2009
Best Quarter: 25.41%, Q2 2009 Worst Quarter: -32.48%, Q4 2008
Year-to-Date as of 3/31/10: 6.45%
AVERAGE ANNUAL TOTAL RETURNS
(For periods ended 12/31/2009 expressed as a %)
CLASS 1 5 10
INCEPTION YEAR YEARS YEARS
----------- ---------- ---------- ----------
CLASS A 5/2/94 40.60 -3.20 -6.14
-------------------- ------ ----- ------ ------
RUSSELL 2000 GROWTH
INDEX 34.47 0.87 -1.37
-------------------- ------ ----- ------ ------
MANAGEMENT
INVESTMENT ADVISOR
Deutsche Investment Management Americas Inc.
PORTFOLIO MANAGER(S)
JOSEPH AXTELL, CFA, MANAGING DIRECTOR. Portfolio Manager of the fund. Joined
the fund in 2006.
RAFAELINA M. LEE, DIRECTOR. Portfolio Manager of the fund. Joined the fund in
2008.
PURCHASE AND SALE OF FUND SHARES
THE FUND IS INTENDED FOR USE IN A VARIABLE INSURANCE PRODUCT. You should
contact the sponsoring insurance company for information on how to purchase and
sell shares of the fund.
TAX INFORMATION
Generally, owners of variable annuity and variable life contracts are not
subject to current federal income taxation on distributions of income or gains
with respect to such contracts. For further information concerning federal
income tax consequences for the holders of variable annuity contracts and
variable life insurance policies, such holders should consult the prospectus
used in connection with the issuance of their particular contracts or policies.
PAYMENTS TO FINANCIAL INTERMEDIARIES
If you purchase the fund through selected affiliated and unaffiliated brokers,
dealers, participating insurance companies or other financial intermediaries,
the fund and its affiliates may pay the financial intermediary for the sale of
fund shares and related services. These payments may create a conflict of
interest by influencing the financial intermediary and your salesperson to
recommend the fund over another investment. Ask your salesperson or visit your
insurance company's web site for more information.
43
PROSPECTUS May 1, 2010 DWS Small Cap Growth VIP
[DWS INVESTMENTS LOGO]
Deutsche Bank Group
DWS STRATEGIC INCOME VIP
INVESTMENT OBJECTIVE
The fund seeks a high current return.
FEES AND EXPENSES OF THE FUND
This table describes the fees and expenses you may pay if you buy and hold
shares of the fund. This information does not reflect fees associated with the
separate account that invests in the fund or any variable life insurance policy
or variable annuity contract for which the fund is an investment option. These
fees will increase expenses.
SHAREHOLDER FEES
(paid directly from your investment) None
-------------------------------------- -----
ANNUAL FUND OPERATING EXPENSES (expenses that you pay each year as a % of the
value of your investment)
A
----------
Management fee 0.55
------------------------------------------------ ----
Distribution/service
(12b-1) fees None
------------------------------------------------ -----
Other expenses (includes an administrative fee) 0.31
------------------------------------------------ -----
TOTAL ANNUAL FUND OPERATING EXPENSES 0.86
------------------------------------------------ -----
EXAMPLE
This Example is intended to help you compare the cost of investing in the fund
with the cost of investing in other mutual funds. The Example assumes that you
invest $10,000 in the fund for the time periods indicated and then redeem all
of your shares at the end of those periods. The Example also assumes that your
investment has a 5% return each year and that the fund's operating expenses
remain the same. Although your actual costs may be higher or lower, based on
these assumptions your costs would be:
1 YEAR 3 YEARS 5 YEARS 10 YEARS
-------- --------- --------- ---------
$88 $274 $477 $1,061
--- --- ---- ---- ------
PORTFOLIO TURNOVER
The fund pays transaction costs when it buys and sells securities (or "turns
over" its portfolio). A higher portfolio turnover may indicate higher
transaction costs. These costs are not reflected in annual fund operating
expenses or in the expense example, but are reflected in fund performance.
Portfolio turnover rate for fiscal year 2009: 370%.
PRINCIPAL INVESTMENT STRATEGY
MAIN INVESTMENTS. Under normal circumstances, the fund invests mainly in bonds
issued by both US and foreign corporations and governments. The credit quality
of the fund's investments may vary; the fund may invest up to 100% of total
assets in either investment-grade bonds or in junk bonds, which are those below
the fourth highest credit rating category (that is, grade BB/Ba and below). The
fund may invest up to 50% of total assets in foreign bonds. The fund may also
invest in emerging markets securities and dividend-paying common stocks.
MANAGEMENT PROCESS. In deciding which types of securities to buy and sell,
portfolio management typically weighs a number of factors against each other,
from economic outlooks and possible interest rate movements to changes in
supply and demand within the bond market. In choosing individual bonds,
portfolio management considers how they are structured and uses independent
analysis of issuers' creditworthiness.
Portfolio management may shift the allocations of the fund's holdings, favoring
different types of securities at different times, while still maintaining
variety in terms of the companies and industries represented in the fund's
holdings.
IGAP STRATEGY. In addition to the fund's main investment strategy, portfolio
management seeks to enhance returns by employing a proprietary overlay strategy
called iGAP (integrated Global Alpha Platform), which attempts to take
advantage of mispricings within global equity, bond and currency markets. The
iGAP strategy uses derivatives (contracts whose value is based on, for example,
indices,
44
PROSPECTUS May 1, 2010 DWS Strategic Income VIP
currencies or securities), in particular exchange-traded futures contracts on
global equities and bonds and over-the-counter forward currency contracts.
The fund may trade actively. This could raise transaction costs (thus lowering
returns).
--------------------------------------------------------------------------------
DERIVATIVES. The fund also may use various types of derivatives outside of the
iGAP strategy, such as futures contracts, forward currency contracts, interest
rate swaps, total return swaps and credit default swaps. It may use these for
hedging, risk management or non-hedging purposes to seek to enhance potential
gains. The fund may use derivatives as a substitute for direct investment in a
particular asset class or to keep cash on hand to meet shareholder redemptions
or other needs. In particular, the fund may use interest rate and total rate of
return swaps, currency options, forward currency contracts and credit default
swaps.
SECURITIES LENDING. The fund may lend securities (up to one-third of total
assets) to approved institutions.
--------------------------------------------------------------------------------
MAIN RISKS
There are several risk factors that could hurt the fund's performance, cause
you to lose money or cause the fund's performance to trail that of other
investments.
INTEREST RATE RISK. When interest rates rise, prices of debt securities
generally decline. The longer the duration of the fund's debt securities, the
more sensitive it will be to interest rate changes. (As a general rule, a 1%
rise in interest rates means a 1% fall in value for every year of duration.)
CREDIT RISK. A fund purchasing debt securities faces the risk that the
creditworthiness of an issuer may decline, causing the value of the debt
securities to decline. In addition, an issuer may not be able to make timely
payments on the interest and/or principal on the debt security it has issued.
Because the issuers of high-yield debt securities or junk bonds (debt
securities rated below the fourth highest category) may be in uncertain
financial health, the prices of their debt securities can be more vulnerable to
bad economic news or even the expectation of bad news, than investment-grade
debt securities.
IGAP RISK. The success of the iGAP strategy depends, in part, on portfolio
management's ability to analyze the correlation between various global markets
and asset classes. If portfolio management's correlation analysis proves to be
incorrect, losses to the fund may be significant and may substantially exceed
the intended level of market exposure for the iGAP strategy.
DERIVATIVES RISK. Risks associated with derivatives include the risk that the
derivative is not well correlated with the security, index or currency to which
it relates; the risk that derivatives may result in losses or missed
opportunities; the risk that the fund will be unable to sell the derivative
because of an illiquid secondary market; the risk that a counterparty is
unwilling or unable to meet its obligation; and the risk that the derivative
transaction could expose the fund to the effects of leverage, which could
increase the fund's exposure to the market and magnify potential losses.
FOREIGN INVESTMENT RISK. To the extent the fund invests in companies based
outside the US, it faces the risks inherent in foreign investing. Adverse
political, economic or social developments could undermine the value of the
fund's investments or prevent the fund from realizing their full value.
Financial reporting standards for companies based in foreign markets differ
from those in the US. Additionally, foreign securities markets generally are
smaller and less liquid than US markets. To the extent that the fund invests in
non-US dollar denominated foreign securities, changes in currency exchange
rates may affect the US dollar value of foreign securities or the income or
gain received on these securities. Foreign investment risks are greater in
emerging markets than in developed markets. Emerging market investments are
often considered speculative.
SECURITY SELECTION RISK. The securities in the fund's portfolio may decline in
value. Portfolio management could be wrong in its analysis of industries,
companies, economic trends, the relative attractiveness of different securities
or other matters.
SECURITIES LENDING RISK. Any decline in the value of a portfolio security that
occurs while the security is out on loan is borne by the fund, and will
adversely affect performance. Also, there may be delays in recovery of
securities loaned or even a loss of rights in the collateral should the
borrower of the securities fail financially while holding the security.
COUNTERPARTY RISK. A financial institution or other counterparty with whom the
fund does business (such as trading or securities lending), or that
underwrites, distributes or guarantees any investments or contracts that the
fund owns or is otherwise exposed to, may decline in financial health and
become unable to honor its commitments, which could lead to losses for the
fund.
LIQUIDITY RISK. In certain situations, it may be difficult or impossible to
sell an investment in an orderly fashion at an acceptable price. This may be an
ongoing risk for some investments, such as derivatives or restricted securities
that typically trade only among a limited number of investors.
PREPAYMENT AND EXTENSION RISK. When interest rates fall, issuers of high
interest debt obligations may pay off the debts earlier than expected
(prepayment risk), and the fund may have to reinvest the proceeds at lower
yields. When interest rates rise, issuers of lower interest debt obligations
may pay off the debts later than expected (extension risk), thus keeping the
fund's assets tied up in lower interest debt obligations. These events could
hurt fund performance.
45
PROSPECTUS May 1, 2010 DWS Strategic Income VIP
PRICING RISK. If market conditions make it difficult to value some investments,
the fund may value these investments using more subjective methods, such as
fair value pricing.
PAST PERFORMANCE
How a fund's returns vary from year to year can give an idea of its risk; so
can comparing fund performance to overall market performance (as measured by an
appropriate market index). Past performance may not indicate future results.
All performance figures below assume that dividends were reinvested. For more
recent performance figures, go to www.dws-investments.com (the Web site does
not form a part of this prospectus) or call the phone number for your share
class included in this prospectus. This information doesn't reflect fees
associated with the separate account that invests in the fund or any variable
life insurance policy or variable annuity contract for which the fund is an
investment option. These fees will reduce returns.
Prior to May 1, 2000, the fund was named Kemper Global Income Portfolio and
operated with a different objective and investment strategy. Performance may
have been different if the fund's current policies were in effect.
CALENDAR YEAR TOTAL RETURNS (%) (Class A)
[BAR GRAPHIC OMITTED HERE]
[BAR GRAPHIC DATA]
2.57 5.23 11.30 7.85 8.60 2.38 8.98 5.43 -7.75 22.73
2000 2001 2002 2003 2004 2005 2006 2007 2008 2009
Best Quarter: 9.43%, Q2 2009 Worst Quarter: -5.06%, Q3 2008
Year-to-Date as of 3/31/10: 3.88%
AVERAGE ANNUAL TOTAL RETURNS
(For periods ended 12/31/2009 expressed as a %)
CLASS 1 5 10
INCEPTION YEAR YEARS YEARS
----------- ---------- --------- ---------
CLASS A 5/1/97 22.73 5.90 6.48
-------------------- ------ ----- ---- ----
BARCLAYS CAPITAL US
GOVERNMENT/CREDIT
INDEX 4.52 4.71 6.34
-------------------- ------ ----- ---- ----
BLENDED INDEX 23.66 5.86 7.28
-------------------- ------ ----- ---- ----
The Advisor believes the additional Blended Index reflects typical fund asset
allocations and represents the fund's overall investment process.
The BLENDED INDEX consists of the Credit Suisse High Yield Index (35%),
Barclays Capital US Government/Credit Index (35%), J.P. Morgan Emerging Markets
Bond Index Global Diversified (15%) and Citigroup Non US Hedged WBGI (15%).
MANAGEMENT
INVESTMENT ADVISOR
Deutsche Investment Management Americas Inc.
PORTFOLIO MANAGER(S)
GARY SULLIVAN, CFA, MANAGING DIRECTOR. Portfolio Manager of the fund. Joined
the fund in 2006.
WILLIAM CHEPOLIS, CFA, MANAGING DIRECTOR. Portfolio Manager of the fund. Joined
the fund in 2005.
ROBERT WANG, MANAGING DIRECTOR. Portfolio Manager of the fund. Joined the fund
in 2007.
THOMAS PICCIOCHI, DIRECTOR. Portfolio Manager of the fund. Joined the fund in
2007.
PURCHASE AND SALE OF FUND SHARES
THE FUND IS INTENDED FOR USE IN A VARIABLE INSURANCE PRODUCT. You should
contact the sponsoring insurance company for information on how to purchase and
sell shares of the fund.
TAX INFORMATION
Generally, owners of variable annuity and variable life contracts are not
subject to current federal income taxation on distributions of income or gains
with respect to such contracts. For further information concerning federal
income tax consequences for the holders of variable annuity contracts and
variable life insurance policies, such holders should consult the prospectus
used in connection with the issuance of their particular contracts or policies.
PAYMENTS TO FINANCIAL INTERMEDIARIES
If you purchase the fund through selected affiliated and unaffiliated brokers,
dealers, participating insurance companies or other financial intermediaries,
the fund and its affiliates may pay the financial intermediary for the sale of
fund shares and related services. These payments may create a conflict of
interest by influencing the financial intermediary and your salesperson to
recommend the fund over another investment. Ask your salesperson or visit your
insurance company's web site for more information.
46
PROSPECTUS May 1, 2010 DWS Strategic Income VIP
[DWS INVESTMENTS LOGO]
Deutsche Bank Group
DWS STRATEGIC VALUE VIP
INVESTMENT OBJECTIVE
The fund seeks to achieve a high rate of total return.
FEES AND EXPENSES OF THE FUND
This table describes the fees and expenses you may pay if you buy and hold
shares of the fund. This information does not reflect fees associated with the
separate account that invests in the fund or any variable life insurance policy
or variable annuity contract for which the fund is an investment option. These
fees will increase expenses.
SHAREHOLDER FEES
(paid directly from your investment) None
-------------------------------------- -----
ANNUAL FUND OPERATING EXPENSES (expenses that you pay each year as a % of the
value of your investment)
A
----------
Management fee 0.67
------------------------------------------------ ----
Distribution/service
(12b-1) fees None
------------------------------------------------ -----
Other expenses (includes an administrative fee) 0.13
------------------------------------------------ -----
TOTAL ANNUAL FUND OPERATING EXPENSES 0.80
------------------------------------------------ -----
EXAMPLE
This Example is intended to help you compare the cost of investing in the fund
with the cost of investing in other mutual funds. The Example assumes that you
invest $10,000 in the fund for the time periods indicated and then redeem all
of your shares at the end of those periods. The Example also assumes that your
investment has a 5% return each year and that the fund's operating expenses
remain the same. Although your actual costs may be higher or lower, based on
these assumptions your costs would be:
1 YEAR 3 YEARS 5 YEARS 10 YEARS
-------- --------- --------- ---------
$82 $255 $444 $990
--- --- ---- ---- ----
PORTFOLIO TURNOVER
The fund pays transaction costs when it buys and sells securities (or "turns
over" its portfolio). A higher portfolio turnover may indicate higher
transaction costs. These costs are not reflected in annual fund operating
expenses or in the expense example, but are reflected in fund performance.
Portfolio turnover rate for fiscal year 2009: 91%.
PRINCIPAL INVESTMENT STRATEGY
Under normal circumstances, the fund invests at least 80% of net assets, plus
the amount of any borrowings for investment purposes, in equity securities
(mainly common stocks). The fund focuses on stocks of large US companies that
are similar in size to the companies in the S&P 500 Index and that portfolio
management believes are undervalued. The fund intends to invest primarily in
companies whose market capitalizations fall within the normal range of the S&P
500 Index. Although the fund can invest in stocks of any economic sector (which
is comprised of two or more industries), at times it may emphasize one or more
sectors and may invest more than 25% of total assets in a single sector.
The fund may invest up to 20% of net assets in foreign securities, including US
dollar-denominated American Depository Receipts.
Portfolio management seeks to invest in a diversified portfolio normally
consisting of approximately 60-80 stocks.
MANAGEMENT PROCESS. Portfolio management begins by comparing a company's stock
price to its book value, cash flow, earnings and sales and analyzing individual
companies to identify those that are financially sound and appear to have
strong potential for long-term growth and income.
Portfolio management assembles the fund's portfolio from among the most
attractive stocks, drawing on an analysis of economic outlooks for various
sectors and industries.
47
PROSPECTUS May 1, 2010 DWS Strategic Value VIP
Portfolio management employs a disciplined sell strategy and will normally sell
a stock when it reaches a target price, its fundamental factors have changed or
when other investments offer better opportunities.
--------------------------------------------------------------------------------
DERIVATIVES. The fund may use various types of derivatives (contracts whose
value is based on, for example, indices, currencies or securities) for hedging,
risk management or non-hedging purposes to seek to enhance potential gains. The
fund may use derivatives as a substitute for direct investment in a particular
asset class or to keep cash on hand to meet shareholder redemptions or other
needs. In particular, the fund may use futures, currency options and forward
currency transactions.
SECURITIES LENDING. The fund may lend securities (up to one-third of total
assets) to approved institutions.
--------------------------------------------------------------------------------
MAIN RISKS
There are several risk factors that could hurt the fund's performance, cause
you to lose money or cause the fund's performance to trail that of other
investments.
STOCK MARKET RISK. When stock prices fall, you should expect the value of your
investment to fall as well. To the extent the fund invests in a particular
capitalization or market sector, the fund's performance may be proportionately
affected by that segment's general performance.
SECURITY SELECTION RISK. The securities in the fund's portfolio may decline in
value. Portfolio management could be wrong in its analysis of industries,
companies, economic trends, the relative attractiveness of different securities
or other matters.
VALUE INVESTING RISK. As a category, value stocks may underperform growth
stocks (and the stock market as a whole) over any period of time. In addition,
value stocks selected for investment by portfolio management may not perform as
anticipated: stocks that appear undervalued may remain undervalued
indefinitely, or may in fact be fairly valued.
FOCUS RISK. To the extent that the fund focuses its investments in particular
industries, asset classes or sectors of the economy, any market price
movements, regulatory or technological changes, or economic conditions
affecting companies in those industries, asset classes or sectors will have a
significant impact on the fund's performance.
DERIVATIVES RISK. Risks associated with derivatives include the risk that the
derivative is not well correlated with the security, index or currency to which
it relates; the risk that derivatives may result in losses or missed
opportunities; the risk that the fund will be unable to sell the derivative
because of an illiquid secondary market; the risk that a counterparty is
unwilling or unable to meet its obligation; and the risk that the derivative
transaction could expose the fund to the effects of leverage, which could
increase the fund's exposure to the market and magnify potential losses.
SECURITIES LENDING RISK. Any decline in the value of a portfolio security that
occurs while the security is out on loan is borne by the fund, and will
adversely affect performance. Also, there may be delays in recovery of
securities loaned or even a loss of rights in the collateral should the
borrower of the securities fail financially while holding the security.
FOREIGN INVESTMENT RISK. To the extent the fund invests in companies based
outside the US, it faces the risks inherent in foreign investing. Adverse
political, economic or social developments could undermine the value of the
fund's investments or prevent the fund from realizing their full value.
Financial reporting standards for companies based in foreign markets differ
from those in the US. Additionally, foreign securities markets generally are
smaller and less liquid than US markets. To the extent that the fund invests in
non-US dollar denominated foreign securities, changes in currency exchange
rates may affect the US dollar value of foreign securities or the income or
gain received on these securities. Foreign investment risks are greater in
emerging markets than in developed markets. Emerging market investments are
often considered speculative.
COUNTERPARTY RISK. A financial institution or other counterparty with whom the
fund does business (such as trading or securities lending), or that
underwrites, distributes or guarantees any investments or contracts that the
fund owns or is otherwise exposed to, may decline in financial health and
become unable to honor its commitments, which could lead to losses for the
fund.
LIQUIDITY RISK. In certain situations, it may be difficult or impossible to
sell an investment in an orderly fashion at an acceptable price. This may be an
ongoing risk for some investments, such as derivatives or restricted securities
that typically trade only among a limited number of investors.
PRICING RISK. If market conditions make it difficult to value some investments,
the fund may value these investments using more subjective methods, such as
fair value pricing.
PAST PERFORMANCE
How a fund's returns vary from year to year can give an idea of its risk; so
can comparing fund performance to overall market performance (as measured by an
appropriate market index). Past performance may not indicate future results.
All performance figures below assume that dividends were reinvested. For more
recent performance figures, go to www.dws-investments.com (the Web site does
not form a part of this prospectus) or call the phone number for your share
class included in this prospectus. This information doesn't reflect fees
associated with the separate account that invests in the fund or any variable
life insurance policy or variable annuity contract for which the fund is an
investment option. These fees will reduce returns.
48
PROSPECTUS May 1, 2010 DWS Strategic Value VIP
Prior to June 1, 2009, Dreman Value Management, L.L.C. served as the fund's
subadvisor and was primarily responsible for the day-to-day management of the
fund. Performance would have been different if the fund's current investment
strategy had been in effect.
CALENDAR YEAR TOTAL RETURNS (%) (Class A)
[BAR GRAPHIC OMITTED HERE]
[BAR GRAPHIC DATA]
30.52 1.69 -18.03 32.04 13.95 7.92 18.74 -1.86 -45.98 25.30
2000 2001 2002 2003 2004 2005 2006 2007 2008 2009
Best Quarter: 20.80%, Q2 2003 Worst Quarter: -23.05%, Q4 2008
Year-to-Date as of 3/31/10: 5.98%
AVERAGE ANNUAL TOTAL RETURNS
(For periods ended 12/31/2009 expressed as a %)
CLASS 1 5 10
INCEPTION YEAR YEARS YEARS
----------- ---------- ---------- ---------
CLASS A 5/4/98 25.30 -3.17 3.37
------------------ ------ ----- ------ -----
STANDARD & POOR'S
(S&P) 500 INDEX 26.46 0.42 -0.95
------------------ ------ ----- ------ ------
MANAGEMENT
INVESTMENT ADVISOR
Deutsche Investment Management Americas Inc.
PORTFOLIO MANAGER(S)
VOLKER DOSCH, MANAGING DIRECTOR. Portfolio Manager of the fund. Joined the fund
in 2009.
OLIVER PFEIL, PHD., VICE PRESIDENT. Portfolio Manager of the fund. Joined the
fund in 2009.
THOMAS SCHUESSLER, PHD., MANAGING DIRECTOR. Portfolio Manager of the fund.
Joined the fund in 2009.
PURCHASE AND SALE OF FUND SHARES
THE FUND IS INTENDED FOR USE IN A VARIABLE INSURANCE PRODUCT. You should
contact the sponsoring insurance company for information on how to purchase and
sell shares of the fund.
TAX INFORMATION
Generally, owners of variable annuity and variable life contracts are not
subject to current federal income taxation on distributions of income or gains
with respect to such contracts. For further information concerning federal
income tax consequences for the holders of variable annuity contracts and
variable life insurance policies, such holders should consult the prospectus
used in connection with the issuance of their particular contracts or policies.
PAYMENTS TO FINANCIAL INTERMEDIARIES
If you purchase the fund through selected affiliated and unaffiliated brokers,
dealers, participating insurance companies or other financial intermediaries,
the fund and its affiliates may pay the financial intermediary for the sale of
fund shares and related services. These payments may create a conflict of
interest by influencing the financial intermediary and your salesperson to
recommend the fund over another investment. Ask your salesperson or visit your
insurance company's web site for more information.
49
PROSPECTUS May 1, 2010 DWS Strategic Value VIP
[DWS INVESTMENTS LOGO]
Deutsche Bank Group
DWS TECHNOLOGY VIP
INVESTMENT OBJECTIVE
The fund seeks growth of capital.
FEES AND EXPENSES OF THE FUND
This table describes the fees and expenses you may pay if you buy and hold
shares of the fund. This information does not reflect fees associated with the
separate account that invests in the fund or any variable life insurance policy
or variable annuity contract for which the fund is an investment option. These
fees will increase expenses.
SHAREHOLDER FEES
(paid directly from your investment) None
-------------------------------------- -----
ANNUAL FUND OPERATING EXPENSES (expenses that you pay each year as a % of the
value of your investment)
A
----------
Management fee 0.67
------------------------------------------------ ----
Distribution/service
(12b-1) fees None
------------------------------------------------ -----
Other expenses (includes an administrative fee) 0.17
------------------------------------------------ -----
TOTAL ANNUAL FUND OPERATING EXPENSES 0.84
------------------------------------------------ -----
EXAMPLE
This Example is intended to help you compare the cost of investing in the fund
with the cost of investing in other mutual funds. The Example assumes that you
invest $10,000 in the fund for the time periods indicated and then redeem all
of your shares at the end of those periods. The Example also assumes that your
investment has a 5% return each year and that the fund's operating expenses
remain the same. Although your actual costs may be higher or lower, based on
these assumptions your costs would be:
1 YEAR 3 YEARS 5 YEARS 10 YEARS
-------- --------- --------- ---------
$86 $268 $466 $1,037
--- --- ---- ---- ------
PORTFOLIO TURNOVER
The fund pays transaction costs when it buys and sells securities (or "turns
over" its portfolio). A higher portfolio turnover may indicate higher
transaction costs. These costs are not reflected in annual fund operating
expenses or in the expense example, but are reflected in fund performance.
Portfolio turnover rate for fiscal year 2009: 45%.
PRINCIPAL INVESTMENT STRATEGY
MAIN INVESTMENTS. Under normal circumstances, the fund invests at least 80% of
net assets, plus the amount of any borrowings for investment purposes, in
common stocks of companies in the technology sector. For purposes of the fund's
80% investment policy, the fund defines a company as being in the technology
sector if it commits at least half its assets to, or derives at least half its
revenues or net income from, that sector. Examples of industries within the
technology sector are semiconductors, software, telecom equipment,
computer/hardware, IT services, the Internet and health technology. The fund
may invest in companies of any size and may invest in initial public offerings.
While the fund invests mainly in US stocks, it could invest up to 35% of net
assets in foreign securities (including emerging markets securities).
MANAGEMENT PROCESS. In choosing securities, portfolio management uses a
combination of three analytical disciplines:
BOTTOM-UP RESEARCH. Portfolio management looks for individual companies with a
history of above-average growth, strong competitive positioning, attractive
prices relative to potential growth, innovative products and services, sound
financial strength and effective management, among other factors.
GROWTH ORIENTATION. Portfolio management generally looks for companies that
they believe have above-average potential for sustainable growth of revenue or
earnings and whose market value appears reasonable in light of their business
prospects.
50
PROSPECTUS May 1, 2010 DWS Technology VIP
TOP-DOWN ANALYSIS. Portfolio management considers the economic outlooks for
various industries within the technology sector and looks for those that may
benefit from changes in the overall business environment.
In addition, portfolio management uses quantitative analytic tools to attempt
to manage the price volatility of the fund as compared to appropriate
benchmarks and peer groups. Portfolio management may favor securities from
various industries and companies within the technology sector at different
times.
Portfolio management will normally sell a stock when they believe its price is
unlikely to go higher, its fundamentals have changed, other investments offer
better opportunities, or in adjusting their emphasis on a given technology
industry.
--------------------------------------------------------------------------------
DERIVATIVES. The fund may use various types of derivatives for hedging, risk
management or non-hedging purposes to seek to enhance potential gains. The fund
may use derivatives as a substitute for direct investment in a particular asset
class or to keep cash on hand to meet shareholder redemptions or other needs.
In particular, portfolio management may use futures and options, including
sales of covered put and call options.
SECURITIES LENDING. The fund may lend securities (up to one-third of total
assets) to approved institutions.
--------------------------------------------------------------------------------
MAIN RISKS
There are several risk factors that could reduce the yield you get from the
fund, cause the fund's performance to trail that of other investments, or cause
you to lose money.
STOCK MARKET RISK. To the extent the fund invests in a particular sector, the
fund's performance may be proportionately affected by that sector's general
performance. When stock prices fall, you should expect the value of your
investment to fall as well. The market as a whole may not favor the types of
investments the fund makes, which could affect the fund's ability to sell them
at an attractive price.
CONCENTRATION RISK. Any fund that concentrates in a particular segment of the
market will generally be more volatile than a fund that invests more broadly.
Any market price movements, regulatory or technological changes, or economic
conditions affecting technology companies will have a significant impact on the
fund's performance.
SMALL COMPANY RISK. Small company stocks tend to be more volatile and less
liquid than large company stocks. Small companies are less widely followed by
stock analysts and less information about them is available to investors.
FOREIGN INVESTMENT RISK. To the extent the fund invests in companies based
outside the US, it faces the risks inherent in foreign investing. Adverse
political, economic or social developments could undermine the value of the
fund's investments or prevent the fund from realizing their full value.
Financial reporting standards for companies based in foreign markets differ
from those in the US. Additionally, foreign securities markets generally are
smaller and less liquid than US markets. To the extent that the fund invests in
non-US dollar denominated foreign securities, changes in currency exchange
rates may affect the US dollar value of foreign securities or the income or
gain received on these securities. Foreign investment risks are greater in
emerging markets than in developed markets. Emerging market investments are
often considered speculative.
PRICING RISK. If market conditions make it difficult to value some investments,
the fund may value these investments using more subjective methods, such as
fair value pricing.
NON-DIVERSIFICATION RISK. The fund is classified as non-diversified under the
Investment Company Act of 1940, as amended. This means that the fund may invest
in securities of relatively few issuers. Thus, the performance of one or a
small number of portfolio holdings can affect overall performance.
SECURITY SELECTION RISK. The securities in the fund's portfolio may decline in
value. Portfolio management could be wrong in its analysis of industries,
companies, economic trends, the relative attractiveness of different securities
or other matters.
DERIVATIVES RISK. Risks associated with derivatives include the risk that the
derivative is not well correlated with the security, index or currency to which
it relates; the risk that derivatives may result in losses or missed
opportunities; the risk that the fund will be unable to sell the derivative
because of an illiquid secondary market; the risk that a counterparty is
unwilling or unable to meet its obligation; and the risk that the derivative
transaction could expose the fund to the effects of leverage, which could
increase the fund's exposure to the market and magnify potential losses.
SECURITIES LENDING RISK. Any decline in the value of a portfolio security that
occurs while the security is out on loan is borne by the fund, and will
adversely affect performance. Also, there may be delays in recovery of
securities loaned or even a loss of rights in the collateral should the
borrower of the securities fail financially while holding the security.
COUNTERPARTY RISK. A financial institution or other counterparty with whom the
fund does business (such as trading or securities lending), or that
underwrites, distributes or guarantees any investments or contracts that the
fund owns or is otherwise exposed to, may decline in financial health and
become unable to honor its commitments, which could lead to losses for the
fund.
GROWTH INVESTING RISK. As a category, growth stocks may underperform value
stocks (and the stock market as a whole) over any period of time. Because the
prices of growth stocks are based largely on the expectation of future
earnings, growth stock prices can decline rapidly
51
PROSPECTUS May 1, 2010 DWS Technology VIP
and significantly in reaction to negative news about such factors as earnings,
the economy, political developments, or other news.
IPO RISK. Prices of securities bought in an initial public offering (IPO) may
rise and fall rapidly, often because of investor perceptions rather than
economic reasons.
LIQUIDITY RISK. In certain situations, it may be difficult or impossible to
sell an investment in an orderly fashion at an acceptable price. This may be an
ongoing risk for some investments, such as derivatives or restricted securities
that typically trade only among a limited number of investors.
PAST PERFORMANCE
How a fund's returns vary from year to year can give an idea of its risk; so
can comparing fund performance to overall market performance (as measured by an
appropriate market index). Past performance may not indicate future results.
All performance figures below assume that dividends were reinvested. For more
recent performance figures, go to www.dws-investments.com (the Web site does
not form a part of this prospectus) or call the phone number for your share
class included in this prospectus. This information doesn't reflect fees
associated with the separate account that invests in the fund or any variable
life insurance policy or variable annuity contract for which the fund is an
investment option. These fees will reduce returns.
CALENDAR YEAR TOTAL RETURNS (%) (Class A)
[BAR GRAPHIC OMITTED HERE]
[BAR GRAPHIC DATA]
-21.57 -32.39 -35.52 46.94 1.92 3.74 0.75 14.30 -46.22 60.42
2000 2001 2002 2003 2004 2005 2006 2007 2008 2009
Best Quarter: 28.57%, Q4 2001 Worst Quarter: -33.64%, Q3 2001
Year-to-Date as of 3/31/10: 2.49%
AVERAGE ANNUAL TOTAL RETURNS
(For periods ended 12/31/2009 expressed as a %)
CLASS 1 5 10
INCEPTION YEAR YEARS YEARS
----------- ---------- --------- ----------
CLASS A 5/3/99 60.42 0.61 -6.21
------------------------------ ------ ----- ---- ------
RUSSELL 1000 (Reg. TM) GROWTH
INDEX 37.21 1.63 -3.99
------------------------------ ------ ----- ---- ------
S&P NORTH AMERICAN
TECHNOLOGY SECTOR
INDEX 63.19 3.75 -6.59
------------------------------ ------ ----- ---- ------
The Advisor believes the additional S&P North American Technology Sector Index
represents the fund's overall investment process.
MANAGEMENT
INVESTMENT ADVISOR
Deutsche Investment Management Americas Inc.
PORTFOLIO MANAGER(S)
FREDERIC L. FAYOLLE, CFA, DIRECTOR. Lead Portfolio Manager of the fund. Joined
the fund in 2009.
CLARK CHANG, DIRECTOR. Portfolio Manager of the fund. Joined the fund in 2008.
WALTER HOLICK, DIRECTOR. Portfolio Manager of the fund. Joined the fund in
2009.
PURCHASE AND SALE OF FUND SHARES
THE FUND IS INTENDED FOR USE IN A VARIABLE INSURANCE PRODUCT. You should
contact the sponsoring insurance company for information on how to purchase and
sell shares of the fund.
TAX INFORMATION
Generally, owners of variable annuity and variable life contracts are not
subject to current federal income taxation on distributions of income or gains
with respect to such contracts. For further information concerning federal
income tax consequences for the holders of variable annuity contracts and
variable life insurance policies, such holders should consult the prospectus
used in connection with the issuance of their particular contracts or policies.
PAYMENTS TO FINANCIAL INTERMEDIARIES
If you purchase the fund through selected affiliated and unaffiliated brokers,
dealers, participating insurance companies or other financial intermediaries,
the fund and its affiliates may pay the financial intermediary for the sale of
fund shares and related services. These payments may create a conflict of
interest by influencing the financial intermediary and your salesperson to
recommend the fund over another investment. Ask your salesperson or visit your
insurance company's web site for more information.
52
PROSPECTUS May 1, 2010 DWS Technology VIP
[DWS INVESTMENTS LOGO]
Deutsche Bank Group
DWS TURNER MID CAP GROWTH VIP
INVESTMENT OBJECTIVE
The fund seeks capital appreciation.
FEES AND EXPENSES OF THE FUND
This table describes the fees and expenses you may pay if you buy and hold
shares of the fund. This information does not reflect fees associated with the
separate account that invests in the fund or any variable life insurance policy
or variable annuity contract for which the fund is an investment option. These
fees will increase expenses.
SHAREHOLDER FEES
(paid directly from your investment) None
-------------------------------------- -----
ANNUAL FUND OPERATING EXPENSES (expenses that you pay each year as a % of the
value of your investment)
A
----------
Management fee 0.72
------------------------------------------------ ----
Distribution/service
(12b-1) fees None
------------------------------------------------ -----
Other expenses (includes an administrative fee) 0.17
------------------------------------------------ -----
TOTAL ANNUAL FUND OPERATING EXPENSES 0.89
------------------------------------------------ -----
EXAMPLE
This Example is intended to help you compare the cost of investing in the fund
with the cost of investing in other mutual funds. The Example assumes that you
invest $10,000 in the fund for the time periods indicated and then redeem all
of your shares at the end of those periods. The Example also assumes that your
investment has a 5% return each year and that the fund's operating expenses
remain the same. Although your actual costs may be higher or lower, based on
these assumptions your costs would be:
1 YEAR 3 YEARS 5 YEARS 10 YEARS
-------- --------- --------- ---------
$91 $284 $493 $1,096
--- --- ---- ---- ------
PORTFOLIO TURNOVER
The fund pays transaction costs when it buys and sells securities (or "turns
over" its portfolio). A higher portfolio turnover may indicate higher
transaction costs. These costs are not reflected in annual fund operating
expenses or in the expense example, but are reflected in fund performance.
Portfolio turnover rate for fiscal year 2009: 86%.
PRINCIPAL INVESTMENT STRATEGY
MAIN INVESTMENTS. The fund pursues its objective by investing in common stocks
and other equity securities of US companies with medium market capitalizations
that portfolio management believes have strong earnings growth potential. The
fund will invest in securities of companies that are diversified across
economic sectors, and will attempt to maintain sector weightings that
approximate those of the Russell Midcap (Reg. TM) Growth Index. The fund
intends to invest primarily in companies whose market capitalizations fall
within the normal range of the Index. Fund exposure is generally limited to 5%
in any single issuer, subject to exceptions for the most heavily weighted
securities in the Index.
Under normal circumstances, at least 80% of the fund's net assets, plus the
amount of any borrowings for investment purposes, will be invested in stocks of
mid-cap companies, which are defined for this purpose as companies with market
capitalizations at the time of purchase in the range of market capitalizations
of those companies included in the Index.
MANAGEMENT PROCESS. Portfolio management generally looks for medium market
capitalization companies with strong histories of earnings growth that are
likely to continue to grow their earnings. A stock becomes a sell candidate if
there is deterioration in the company's earnings growth potential. Moreover,
positions will be trimmed to adhere to capitalization or capacity constraints,
to maintain sector neutrality or to adjust stock position size relative to the
Index.
53
PROSPECTUS May 1, 2010 DWS Turner Mid Cap Growth VIP
In focusing on companies with strong earnings growth potential, portfolio
management engages in a relatively high level of trading activity so as to
respond to changes in earnings forecasts and economic developments.
--------------------------------------------------------------------------------
DERIVATIVES. The fund may use various types of derivatives (contracts whose
value is based on, for example, indices, currencies or securities) for hedging,
risk management or non-hedging purposes to seek to enhance potential gains. The
fund may use derivatives as a substitute for direct investment in a particular
asset class or to keep cash on hand to meet shareholder redemptions or other
needs.
SECURITIES LENDING. The fund may lend securities (up to one-third of total
assets) to approved institutions.
--------------------------------------------------------------------------------
MAIN RISKS
There are several risk factors that could hurt the fund's performance, cause
you to lose money or cause the fund's performance to trail that of other
investments.
STOCK MARKET RISK. To the extent the fund invests in a particular sector, the
fund's performance may be proportionately affected by that sector's general
performance. When stock prices fall, you should expect the value of your
investment to fall as well. The market as a whole may not favor the types of
investments the fund makes, which could affect the fund's ability to sell them
at an attractive price.
MEDIUM-SIZED COMPANY RISK. Medium-sized company stocks tend to be more volatile
than large company stocks. Medium-sized companies are less widely followed by
stock analysts and less information about them is available to investors.
GROWTH INVESTING RISK. As a category, growth stocks may underperform value
stocks (and the stock market as a whole) over any period of time. Because the
prices of growth stocks are based largely on the expectation of future
earnings, growth stock prices can decline rapidly and significantly in reaction
to negative news about such factors as earnings, the economy, political
developments, or other news.
FOCUS RISK. To the extent that the fund focuses its investments in particular
industries, asset classes or sectors of the economy, any market price
movements, regulatory or technological changes, or economic conditions
affecting companies in those industries, asset classes or sectors will have a
significant impact on the fund's performance.
DERIVATIVES RISK. Risks associated with derivatives include the risk that the
derivative is not well correlated with the security, index or currency to which
it relates; the risk that derivatives may result in losses or missed
opportunities; the risk that the fund will be unable to sell the derivative
because of an illiquid secondary market; the risk that a counterparty is
unwilling or unable to meet its obligation; and the risk that the derivative
transaction could expose the fund to the effects of leverage, which could
increase the fund's exposure to the market and magnify potential losses.
SECURITIES LENDING RISK. Any decline in the value of a portfolio security that
occurs while the security is out on loan is borne by the fund, and will
adversely affect performance. Also, there may be delays in recovery of
securities loaned or even a loss of rights in the collateral should the
borrower of the securities fail financially while holding the security.
SECURITY SELECTION RISK. The securities in the fund's portfolio may decline in
value. Portfolio management could be wrong in its analysis of industries,
companies, economic trends, the relative attractiveness of different securities
or other matters.
FOREIGN INVESTMENT RISK. To the extent the fund invests in companies based
outside the US, it faces the risks inherent in foreign investing. Adverse
political, economic or social developments could undermine the value of the
fund's investments or prevent the fund from realizing their full value.
Financial reporting standards for companies based in foreign markets differ
from those in the US. Additionally, foreign securities markets generally are
smaller and less liquid than US markets. To the extent that the fund invests in
non-US dollar denominated foreign securities, changes in currency exchange
rates may affect the US dollar value of foreign securities or the income or
gain received on these securities.
COUNTERPARTY RISK. A financial institution or other counterparty with whom the
fund does business (such as trading or securities lending), or that
underwrites, distributes or guarantees any investments or contracts that the
fund owns or is otherwise exposed to, may decline in financial health and
become unable to honor its commitments, which could lead to losses for the
fund.
IPO RISK. Prices of securities bought in an initial public offering (IPO) may
rise and fall rapidly, often because of investor perceptions rather than
economic reasons.
LIQUIDITY RISK. In certain situations, it may be difficult or impossible to
sell an investment in an orderly fashion at an acceptable price. This may be an
ongoing risk for some investments, such as derivatives or restricted securities
that typically trade only among a limited number of investors.
PRICING RISK. If market conditions make it difficult to value some investments,
the fund may value these investments using more subjective methods, such as
fair value pricing.
PAST PERFORMANCE
How a fund's returns vary from year to year can give an idea of its risk; so
can comparing fund performance to overall market performance (as measured by an
appropriate market index). Past performance may not indicate future
54
PROSPECTUS May 1, 2010 DWS Turner Mid Cap Growth VIP
results. All performance figures below assume that dividends were reinvested.
For more recent performance figures, go to www.dws-investments.com (the Web
site does not form a part of this prospectus) or call the phone number for your
share class included in this prospectus. This information doesn't reflect fees
associated with the separate account that invests in the fund or any variable
life insurance policy or variable annuity contract for which the fund is an
investment option. These fees will reduce returns.
CALENDAR YEAR TOTAL RETURNS (%) (Class A)
[BAR GRAPHIC OMITTED HERE]
[BAR GRAPHIC DATA]
-32.20 48.49 11.04 11.76 6.52 25.75 -49.49 50.00
2002 2003 2004 2005 2006 2007 2008 2009
Best Quarter: 23.83%, Q3 2009 Worst Quarter: -29.53%, Q4 2008
Year-to-Date as of 3/31/10: 7.38%
AVERAGE ANNUAL TOTAL RETURNS
(For periods ended 12/31/2009 expressed as a %)
1 5 SINCE
CLASS INCEPTION YEAR YEARS INCEPTION
----------------- ---------- --------- ----------
CLASS A 5/1/01 50.00 2.55 1.30
---------------------- ------ ----- ---- ----
RUSSELL MIDCAP GROWTH
INDEX 46.29 2.40 2.42
---------------------- ------ ----- ---- ----
Index comparison began on 4/30/01.
MANAGEMENT
INVESTMENT ADVISOR
Deutsche Investment Management Americas Inc.
SUBADVISOR
Turner Investment Partners, Inc.
PORTFOLIO MANAGER(S)
CHRISTOPHER K. MCHUGH. Principal at Turner Investment Partners, Inc. and Lead
Manager of the fund. Joined the fund in 2001.
TARA HEDLUND, CFA. Principal at Turner Investment Partners, Inc. and Portfolio
Manager of the fund. Joined the fund in 2006.
JASON SCHROTBERGER, CFA. Principal at Turner Investment Partners, Inc. and
Portfolio Manager of the fund. Joined the fund in 2006.
PURCHASE AND SALE OF FUND SHARES
THE FUND IS INTENDED FOR USE IN A VARIABLE INSURANCE PRODUCT. You should
contact the sponsoring insurance company for information on how to purchase and
sell shares of the fund.
TAX INFORMATION
Generally, owners of variable annuity and variable life contracts are not
subject to current federal income taxation on distributions of income or gains
with respect to such contracts. For further information concerning federal
income tax consequences for the holders of variable annuity contracts and
variable life insurance policies, such holders should consult the prospectus
used in connection with the issuance of their particular contracts or policies.
PAYMENTS TO FINANCIAL INTERMEDIARIES
If you purchase the fund through selected affiliated and unaffiliated brokers,
dealers, participating insurance companies or other financial intermediaries,
the fund and its affiliates may pay the financial intermediary for the sale of
fund shares and related services. These payments may create a conflict of
interest by influencing the financial intermediary and your salesperson to
recommend the fund over another investment. Ask your salesperson or visit your
insurance company's web site for more information.
55
PROSPECTUS May 1, 2010 DWS Turner Mid Cap Growth VIP
FUND DETAILS
ADDITIONAL INFORMATION ABOUT FUND STRATEGIES AND RISKS
--------------------------------------------------------------------------------
DWS Alternative Asset Allocation Plus VIP
PRINCIPAL INVESTMENT STRATEGY
MAIN INVESTMENTS. The fund seeks to achieve its objective by investing in
alternative (or non-traditional) asset categories and investment strategies.
Investments may be made in other DWS funds or directly in the securities and
derivative instruments in which such DWS funds could invest. The fund may also
invest in Exchange Traded Funds (ETFs) to gain a desired economic exposure to a
particular asset category that is not available through a DWS fund. The fund's
allocations among direct investments and other DWS funds may vary over time. At
times, the entire fund may be invested in other DWS funds or directly in other
investments. The fund may also be invested in some combination thereof. To the
extent the fund directly invests in other investments rather than DWS funds,
the allocated portions of the fund will be managed by the same advisor,
subadvisor or sub-subadvisor, as applicable, as the corresponding DWS fund,
following the same general investment strategies.
MANAGEMENT PROCESS. The fund allocates its assets among the following
strategies and/or asset categories: market neutral, inflation-protection,
commodities, real estate, floating rate loans, infrastructure and emerging
markets.
The fund may make allocations ranging from 0% to 30% of its assets in a
particular strategy or asset category, including the following DWS funds or
directly in such securities and derivative instruments in which the DWS fund
can invest:
o DWS Enhanced Commodity Strategy Fund. The fund's investment objective is
total return. The fund seeks to achieve its investment objective by
investing under normal circumstances in commodity-linked derivative
instruments backed by a portfolio of fixed income instruments.
o DWS Disciplined Market Neutral Fund. The fund seeks capital appreciation
independent of stock market direction. It pursues its objective by
investing, under normal circumstances, in long and short positions of
common stock of large US companies. The managers buy, or take, long
positions in common stock that the managers believe are undervalued and
sell, or take, short positions in common stock that the managers believe
are overvalued. The fund's investment strategy is designed to maintain
approximately equal dollar amounts invested in long and short positions
under normal circumstances. By employing this market neutral strategy, the
fund seeks to limit the fund's volatility relative to movements in the
overall stock market (that is, the fund's price movements are not expected
to correlate closely with the market's price movements). The managers
attempt to achieve returns for the fund that exceed the return on an
investment in 3-month US Treasury Bills.
o DWS Emerging Markets Equity Fund. The fund seeks long-term growth of
capital. Under normal circumstances, the fund invests at least 80% of net
assets, plus the amount of any borrowings for investment purposes, in
emerging market equities (equities traded mainly in emerging markets or
issued by companies that are organized in emerging markets or have more
than half of their business there). The fund invests primarily in common
stocks. The fund considers "emerging markets" to include any country that
is defined as an emerging or developing economy by any one of the
following: The International Bank for Reconstruction and Development (i.e.,
the World Bank), the International Finance Corporation or the United
Nations or its authorities.
o DWS Emerging Markets Fixed Income Fund. The fund seeks to provide high
current income and, secondarily, long-term capital appreciation. Under
normal circumstances, the fund invests at least 80% of net assets, plus the
amount of any borrowings for investment purposes, in high yield bonds (also
known as "junk bonds") and other debt securities issued by governments and
corporations in emerging market countries (i.e., the issuer's securities
are traded mainly in an emerging market, the issuer is organized under the
laws of an emerging market country or is a company with more than half
56
PROSPECTUS May 1, 2010 Fund Details
of its business in emerging markets) or the return on which is derived
primarily from emerging markets. The fund considers "emerging markets" to
include any country that is defined as an emerging or developing economy by
any one of the following: The International Bank for Reconstruction and
Development (i.e., the World Bank), the International Finance Corporation
or the United Nations or its authorities.
o DWS Floating Rate Plus Fund. The fund seeks to provide high current income.
The fund invests, under normal market conditions, at least 80% of its total
assets in adjustable rate loans that have a senior right to payment
("Senior Loans") and other floating rate debt securities. The fund may also
borrow money in an amount up to 33 1/3% of the fund's total assets for a
range of purposes, including to create investment leverage. In an attempt
to enhance return, the fund employs the iGAP strategy.
o DWS Global Inflation Plus Fund. The fund seeks to provide maximum
inflation-adjusted return. The fund invests in inflation-indexed bonds and
other fixed income securities of varying maturities issued by the US
government, non-US governments, their agencies or instrumentalities, and US
and non-US corporations and derivatives related to each of these types of
securities. The fund may also invest (directly or indirectly) up to 30% of
its total assets in commodities-linked derivative instruments (such as
commodities-linked swaps, structured notes and futures contracts), equity
securities, and securities of Real Estate Investment Trusts (REITs). In an
attempt to enhance return, the fund also employs the iGAP strategy.
o DWS Gold & Precious Metals Fund. The fund seeks maximum return (principal
change and income). The fund invests at least 80% of net assets, plus the
amount of any borrowings for investment purposes, in common stocks and
other equities of US and foreign companies engaged in activities related to
gold, silver, platinum or other precious metals, and in gold coin and
bullion directly. These companies may be involved in activities such as
exploration, mining, fabrication, processing and distribution.
o DWS RREEF Global Infrastructure Fund. The fund seeks total return from both
capital appreciation and current income through investment in a global
portfolio of securities of infrastructure-related companies. Under normal
circumstances, the fund invests at least 80% of its net assets in the
securities of US and non-US infrastructure-related companies. The fund
considers a company to be an infrastructure-related company if at least 50%
of its non-cash assets are infrastructure assets or 50% of its gross income
or net profits are derived, directly or indirectly, from the ownership,
management, construction, operation, utilization or financing of
infrastructure assets. Under normal circumstances, the fund invests
primarily in equity securities, though the fund may also invest in
fixed-income securities without limitation.
o DWS RREEF Global Real Estate Securities Fund. The fund's investment
objective is to seek total return through a combination of current income
and long-term capital appreciation. The fund seeks to achieve this
objective by investing primarily in publicly listed real estate investment
trusts (REITs) and real estate operating companies on a global basis. Under
normal circumstances, the fund will invest at least 80% of its net assets,
plus the amount of any borrowing for investment purposes, in the equity
securities of REITs and real estate operating companies listed on
recognized stock exchanges around the world.
Portfolio management monitors the list of DWS funds in which the fund may
invest, and may periodically add or remove DWS funds from the list to obtain
exposure to new asset categories or strategies, to replace underperforming DWS
funds or to enhance returns. Based on portfolio management's assessment of
market conditions, the fund is rebalanced periodically to maintain the desired
asset allocation. The fund's asset allocation among the asset categories and
investment strategies will change over time and there should be no expectation
that current or past positions will be maintained in the future. In addition,
the fund may seek exposure to hedge funds through warrants, swaps and similar
derivative instruments.
IGAP STRATEGY. In addition to the fund's main investment strategy, portfolio
management seeks to enhance returns by employing a global tactical asset
allocation overlay strategy called iGAP (integrated Global Alpha Platform),
which attempts to take advantage of mispricings within global equity, bond,
commodity and currency markets. The iGAP strategy uses derivatives (which are
contracts or other instruments whose value is based on, for example, indices,
currencies or securities), in particular exchange-traded futures contracts on
global equities, bonds and commodities, and over-the-counter forward currency
contracts. The iGAP strategy, with respect to the fund, will not be used until
assets of the fund exceed $50 million, however, the fund may have indirect
exposure to the iGAP strategy through other DWS funds.
While the fund and the DWS funds in which it invests may use derivatives or
similar instruments and techniques to hedge existing positions, derivatives and
currency transactions, when used by the fund as part of the iGAP strategy or to
gain exposure to hedge funds, generally will be used to seek return and not for
hedging purposes. Certain DWS funds in which the fund invests may also use the
iGAP strategy.
--------------------------------------------------------------------------------
DERIVATIVES. The fund may use various types of derivatives outside of the iGAP
strategy for hedging, risk management or non-hedging purposes to seek to
enhance potential gains. The fund may use derivatives as a substitute for
direct investment in a particular asset class or to keep cash on hand to meet
shareholder redemptions or other needs. In particular, portfolio management may
use futures, options, forward currency contracts, interest rate swaps and
credit default swaps.
57
PROSPECTUS May 1, 2010 Fund Details
SECURITIES LENDING. The fund may lend securities (up to one-third of total
assets) to approved institutions.
--------------------------------------------------------------------------------
MAIN RISKS
There are several risk factors that could hurt the fund's performance, cause
you to lose money or cause the fund's performance to trail that of other
investments.
Because the fund invests in underlying funds, the risks listed here include
those of the various underlying funds as well as those of the fund itself.
Therefore, in these risk descriptions the term "the fund" may refer to the fund
itself, one or more underlying funds, or both.
ASSET ALLOCATION RISK. Portfolio management may favor one or more types of
investments or assets that underperform other investments, assets, or
securities markets as a whole. To the extent that alternative asset categories
underperform the general stock market, the fund may underperform funds that
invest mainly in stocks. Anytime portfolio management buys or sells securities
in order to adjust the fund's asset allocation this will increase portfolio
turnover and generate transaction costs.
STOCK MARKET RISK. When stock prices fall, you should expect the value of your
investment to fall as well. Stock prices can be hurt by poor management on the
part of the stock's issuer, shrinking product demand and other business risks.
These may affect single companies as well as groups of companies. In addition,
movements in financial markets may adversely affect a stock's price, regardless
of how well the company performs.
UNDERLYING FUNDS RISK. Because the fund may invest in underlying funds, the
fund's performance will be directly related to the performance of the
underlying portfolios or funds. To the extent that a given underlying fund
underperforms its benchmark or its fund peer group, it may contribute to
underperformance by the fund. In addition, the fund indirectly pays a portion
of the expenses incurred by the underlying funds, which lowers performance. To
the extent that the fund's allocations favor underlying funds with higher
expenses, the overall cost of investing paid by the fund will be higher.
FOREIGN INVESTMENT RISK. To the extent the fund invests in companies based
outside the US, it faces the risks inherent in foreign investing. Adverse
political, economic or social developments could undermine the value of the
fund's investments or prevent the fund from realizing their full value.
Financial reporting standards for companies based in foreign markets differ
from those in the US. Additionally, foreign securities markets generally are
smaller and less liquid than US markets. To the extent that the fund invests in
non-US dollar denominated foreign securities, changes in currency exchange
rates may affect the US dollar value of foreign securities or the income or
gain received on these securities. Foreign governments may restrict investment
by foreigners, limit withdrawal of trading profit or currency from the country,
restrict currency exchange or seize foreign investments. The investments of the
fund may also be subject to foreign withholding taxes. Foreign transactions and
custody of assets may involve delays in payment, delivery or recovery of money
or investments. Foreign investment risks are greater in emerging markets than
in developed markets. Emerging market investments are often considered
speculative. Emerging market countries typically have economic and political
systems that are less developed, and can be expected to be less stable than
developed markets. For example, the economies of such countries can be subject
to rapid and unpredictable rates of inflation or deflation.
INTEREST RATE RISK. When interest rates rise, prices of debt securities
generally decline. The longer the duration of the fund's debt securities, the
more sensitive it will be to interest rate changes. (As a general rule, a 1%
rise in interest rates means a 1% fall in value for every year of duration.)
COMMODITIES-RELATED INVESTMENTS RISK. The commodities-linked derivatives
instruments in which the fund invests are more volatile than investments in
equity and fixed income securities and may subject the fund to special risks
that do not apply to all derivatives transactions. The value of a
commodity-linked derivative investment generally is based upon the price
movements of a physical commodity (such as energy, minerals, or agricultural
products), a futures contract, swap or commodity index, or other economic
variables based upon changes in the value of commodities or the commodities
markets. The value of commodity-linked derivative instruments may be affected
by changes in overall market movements, commodity index volatility, changes in
interest rates, or factors affecting a particular industry or commodity, such
as drought, floods, weather, livestock disease, changes in storage costs,
embargoes, tariffs, policies of commodity cartels and international economic,
political and regulatory developments. Also, a liquid secondary market may not
exist for the types of commodity-linked derivative instruments the fund buys,
which may make it difficult for the fund to sell them at an acceptable price.
The fund's ability to gain exposure to commodity-linked investments and achieve
its investment objective may be limited by its intention to qualify as a
regulated investment company under the Internal Revenue Code.
INFLATION-INDEXED BOND RISK. Any rise in interest rates may cause
inflation-indexed bonds to decline in price, hurting fund performance. If
interest rates rise owing to reasons other than inflation, the fund's
investment in these securities may not be fully protected from the effects of
rising interest rates. The performance of any bonds that are indexed to non-US
rates of inflation may be higher or lower than those indexed to US inflation
rates. There can be no assurance that the fund's returns will match or exceed
the real rate of inflation.
58
PROSPECTUS May 1, 2010 Fund Details
CREDIT RISK. The fund's performance could be hurt if a security declines in
credit quality or goes into default, or if an issuer does not make timely
payments of interest or principal. For securities that rely on third-party
guarantors to support their credit quality, the same risks may apply if the
financial condition of the guarantor deteriorates or the guarantor ceases
insuring municipal bonds. Because guarantors may insure many types of bonds,
including subprime mortgage bonds and other high-risk bonds, their financial
condition could deteriorate as a result of events that have little or no
connection to securities owned by the fund.
SMALL COMPANY RISK. Small company stocks tend to be more volatile than large
company stocks. Small companies are less widely followed by stock analysts and
less information about them is available to investors. Industry-wide reversals
may have a greater impact on small companies, since they lack the financial
resources of larger companies. Small company stocks are typically less liquid
than large company stocks.
SENIOR LOANS RISK. Because Senior Loans are not rated by a rating agency,
registered with the Securities and Exchange Commission or any state securities
commission, or listed on any national securities exchange, there may be less
publicly available information about them then for registered or
exchange-listed securities. Also, because portfolio management relies mainly on
its own evaluation of the creditworthiness of borrowers, the fund is
particularly dependent on portfolio management's analytical abilities. Senior
Loans involve other risks described elsewhere in this prospectus, including
conflict of interest risk, credit risk, interest rate risk, liquidity risk, and
prepayment and extension risk.
FOCUS RISK. To the extent that the fund focuses its investments in particular
industries, asset classes or sectors of the economy, any market price
movements, regulatory or technological changes, or economic conditions
affecting companies in those industries, asset classes or sectors will have a
significant impact on the fund's performance. For example, the real estate
sector could be hurt by rising interest rates, falling real estate prices,
overbuilding or zoning changes, and the commodities sector could be hurt by
factors affecting a particular industry or commodity such as drought, floods,
weather or changes in storage costs.
SHORT SALE RISK. If the fund sells a security short and subsequently has to buy
the security back at a higher price, the fund will lose money on the
transaction. Any loss will be increased by the amount of compensation, interest
or dividends and transaction costs the fund must pay to a lender of the
security. The amount the fund could lose on a short sale is theoretically
unlimited (as compared to a long position, where the maximum loss is the amount
invested). The use of short sales, which has the effect of leveraging the fund,
could increase the exposure of the fund to the market, increase losses and
increase the volatility of returns.
The fund may not always be able to close out a short position at a particular
time or at an acceptable price. A lender may request that borrowed securities
be returned to it on short notice, and the fund may have to buy the borrowed
securities at an unfavorable price. If this occurs at a time that other short
sellers of the same security also want to close out their positions, it is more
likely that the fund will have to cover its short sale at an unfavorable price
and potentially reduce or eliminate any gain, or cause a loss, as a result of
the short sale.
SECURITIES LENDING RISK. Any decline in the value of a portfolio security that
occurs while the security is out on loan is borne by the fund, and will
adversely affect performance. Also, there may be delays in recovery of
securities loaned or even a loss of rights in the collateral should the
borrower of the securities fail financially while holding the security.
IGAP RISK. The success of the iGAP strategy depends, in part, on portfolio
management's ability to analyze the correlation between various global markets
and asset classes. If portfolio management's correlation analysis proves to be
incorrect, losses to the fund may be significant and may substantially exceed
the intended level of market exposure for the iGAP strategy.
DERIVATIVES RISK. Risks associated with derivatives include the risk that the
derivative is not well correlated with the security, index or currency to which
it relates; the risk that derivatives may result in losses or missed
opportunities; the risk that the fund will be unable to sell the derivative
because of an illiquid secondary market; the risk that a counterparty is
unwilling or unable to meet its obligation; and the risk that the derivative
transaction could expose the fund to the effects of leverage, which could
increase the fund's exposure to the market and magnify potential losses. There
is no guarantee that derivatives, to the extent employed, will have the
intended effect, and their use could cause lower returns or even losses to the
fund. The use of derivatives by the fund to hedge risk may reduce the
opportunity for gain by offsetting the positive effect of favorable price
movements. Derivatives whose values are tied to the value of commodities will
subject the fund directly to commodities risk and tax risk associated with
investment in commodities. See the "Commodities-related investments risk" and
"Tax status risk" sections for additional information.
SECURITY SELECTION RISK. The securities in the fund's portfolio may decline in
value. Portfolio management could be wrong in its analysis of industries,
companies, economic trends, the relative attractiveness of different securities
or other matters.
59
PROSPECTUS May 1, 2010 Fund Details
BORROWING RISK. To the extent that the fund borrows money for investment
purposes, it creates leverage, meaning that changes in the prices of securities
it owns will have a greater effect on the share price of the fund. The fund
also incurs interest expense and other costs when it borrows money; therefore,
unless returns on assets acquired with borrowed funds are greater than the
costs of borrowing, performance will be lower than it would have been without
any borrowing. When the fund borrows money it must comply with certain asset
coverage requirements, which at times may require the fund to dispose of some
of its portfolio holdings even though it may be disadvantageous to do so at
that time.
CONFLICT OF INTEREST RISK. To avoid violating laws on self-dealing, the fund
may not be able to invest in Senior Loans issued or marketed by an affiliate of
the Advisor at the desired timing or price. The fact that the Advisor has
indicated it may wish to invest in the publicly traded securities of a borrower
may mean it does not have access to material non-public information about the
borrower to which other lenders have access.
COUNTERPARTY RISK. A financial institution or other counterparty with whom the
fund does business (such as trading or securities lending), or that
underwrites, distributes or guarantees any investments or contracts that the
fund owns or is otherwise exposed to, may decline in financial health and
become unable to honor its commitments. This could cause losses for the fund or
could delay the return or delivery of collateral or other assets to the fund.
ETF RISK. Because ETFs trade on a securities exchange, their shares may trade
at a premium or discount to their net asset value. An ETF is subject to the
risks of the assets in which it invests as well as those of the investment
strategy it follows. ETFs incur fees and expenses, such as trading costs,
operating expenses, licensing fees, trustee fees and marketing expenses. With
an index ETF, these costs may contribute to the ETF not fully matching the
performance of the index it is designed to track. The fund incurs brokerage
costs when it buys and sells shares of an ETF and also bears its proportionate
share of the ETF's fees and expenses, which are passed through to ETF
shareholders.
LIQUIDITY RISK. In certain situations, it may be difficult or impossible to
sell an investment in an orderly fashion at an acceptable price. This risk can
be ongoing for any security that does not trade actively or in large volumes,
for any security that trades primarily on smaller markets, and for investments
that typically trade only among a limited number of large investors (such as
certain types of derivatives or restricted securities). In unusual market
conditions, even normally liquid securities may be affected by a degree of
liquidity risk. This may affect only certain securities or an overall
securities market.
PREPAYMENT AND EXTENSION RISK. When interest rates fall, issuers of high
interest debt obligations may pay off the debts earlier than expected
(prepayment risk), and the fund may have to reinvest the proceeds at lower
yields. When interest rates rise, issuers of lower interest debt obligations
may pay off the debts later than expected (extension risk), thus keeping the
fund's assets tied up in lower interest debt obligations. Prepayments could
also create capital gains tax liability in some instances. Any unexpected
behavior in interest rates could increase the volatility of the fund's share
price and yield and could hurt fund performance.
PRICING RISK. If market conditions make it difficult to value some investments,
the fund may value these investments using more subjective methods, such as
fair value pricing. In such cases, the value determined for an investment could
be different than the value realized upon such investment's sale. As a result,
you could pay more than the market value when buying fund shares or receive
less than the market value when selling fund shares.
TAX STATUS RISK. Income from certain commodity-linked derivatives may not
constitute "qualifying income" to the fund. If such income were not to
constitute qualifying income, the fund might be subject to tax at the fund
level. In addition, if DWS Alternative Asset Allocation Plus VIP fails to
qualify as a RIC, a separate account underlying a variable life insurance or
variable annuity contract that invests in shares of the fund will be required
to treat the fund (or if an underlying fund fails to qualify as a RIC, the
fund's investment in the underlying fund) as a single investment for purposes
of the diversification requirements of section 817(h) of the Code. If a
separate account fails to satisfy the diversification requirements of Code
section 817(h), income allocable to the contracts associated with the separate
account will be taxed currently for federal income tax purposes to the holders
of such contracts and income from prior periods with respect to such contracts
also could be taxable, most likely in the year of the failure.
--------------------------------------------------------------------------------
DWS Balanced VIP
PRINCIPAL INVESTMENT STRATEGY
MAIN INVESTMENTS. The fund can buy many types of securities, among them common
stocks, convertible securities, corporate bonds, government bonds,
inflation-indexed bonds, mortgage- and asset-backed securities and
exchange-traded funds (ETFs). The fund can invest in securities of any size,
investment style category, or credit quality, and from any country (including
emerging markets). The fund normally invests approximately 60% of net assets in
common stocks and other equity securities and approximately 40% of net assets
in fixed-income securities, including non-investment grade high yield bonds.
The fund invests at least 25% of net assets in fixed-income senior securities.
MANAGEMENT PROCESS. Portfolio management allocates the fund's assets among
various asset categories, such as US and foreign equity of any size and style
(including
60
PROSPECTUS May 1, 2010 Fund Details
emerging market equity), and US and foreign fixed income of any credit quality
(including emerging market bonds and inflation indexed bonds). Portfolio
management periodically reviews the fund's allocations and may adjust them
based on current or anticipated market conditions or to manage risk consistent
with the fund's overall investment strategy.
Within each asset category, portfolio management uses one or more investment
strategies for selecting equity and debt securities. Each investment strategy
is managed by a team that specializes in a particular asset category, and that
may use a variety of quantitative and qualitative techniques. Some asset
categories may be represented by ETFs.
IGAP STRATEGY. In addition to the fund's main investment strategy, portfolio
management seeks to enhance returns by employing a global tactical asset
allocation overlay strategy called iGAP (integrated Global Alpha Platform),
which attempts to take advantage of mispricings within global bond, equity and
currency markets. The iGAP strategy uses derivatives (which are contracts or
other instruments whose value is based on, for example, indices, currencies or
securities), in particular exchange-traded futures contracts on global
bonds and equity indexes, and over-the-counter forward currency contracts.
--------------------------------------------------------------------------------
DERIVATIVES. The fund may use various types of derivatives outside of the iGAP
strategy for hedging, risk management or non-hedging purposes to seek to
enhance potential gains. The fund may use derivatives as a substitute for
direct investment in a particular asset class or to keep cash on hand to meet
shareholder redemptions or other needs. In particular, portfolio management may
use futures, options, forward currency contracts, interest rate swaps and
credit default swaps.
SECURITIES LENDING. The fund may lend securities (up to one-third of total
assets) to approved institutions.
--------------------------------------------------------------------------------
MAIN RISKS
There are several risk factors that could hurt the fund's performance, cause
you to lose money or cause the fund's performance to trail that of other
investments.
ASSET ALLOCATION RISK. Portfolio management may favor an asset category that
underperforms relative to other asset categories. Changing allocations among
asset categories may increase portfolio turnover and transaction costs. Because
the different teams that manage portions of fund assets work independently,
more than one team may simultaneously place orders to buy or sell the same
security, which may cause the fund to pay a higher price (if buying) or receive
a lower price (if selling) than it otherwise might. If one team buys a security
while another is selling the same security, the net result to the fund would be
additional transaction costs with little or no change in exposure to the
security.
STOCK MARKET RISK. When stock prices fall, you should expect the value of your
investment to fall as well. Stock prices can be hurt by poor management on the
part of the stock's issuer, shrinking product demand and other business risks.
These may affect single companies as well as groups of companies. In addition,
movements in financial markets may adversely affect a stock's price, regardless
of how well the company performs.
CREDIT RISK. A fund purchasing debt securities faces the risk that the
creditworthiness of an issuer may decline, causing the value of the debt
securities to decline. In addition, an issuer may not be able to make timely
payments on the interest and/or principal on the debt security it has issued.
Because the issuers of high-yield debt securities or junk bonds (debt
securities rated below the fourth highest category) may be in uncertain
financial health, the prices of their debt securities can be more vulnerable to
bad economic news or even the expectation of bad news, than investment-grade
debt securities. In some cases, debt securities, particularly high-yield debt
securities, may decline in credit quality or go into default. Because the fund
may invest in securities not paying current interest or in securities already
in default, these risks may be more pronounced.
INTEREST RATE RISK. When interest rates rise, prices of debt securities
generally decline. The longer the duration of the fund's debt securities, the
more sensitive it will be to interest rate changes. (As a general rule, a 1%
rise in interest rates means a 1% fall in value for every year of duration.)
IGAP RISK. The success of the iGAP strategy depends, in part, on portfolio
management's ability to analyze the correlation between various global markets
and asset classes. If portfolio management's correlation analysis proves to be
incorrect, losses to the fund may be significant and may substantially exceed
the intended level of market exposure for the iGAP strategy.
DERIVATIVES RISK. Risks associated with derivatives include the risk that the
derivative is not well correlated with the security, index or currency to which
it relates; the risk that derivatives may result in losses or missed
opportunities; the risk that the fund will be unable to sell the derivative
because of an illiquid secondary market; the risk that a counterparty is
unwilling or unable to meet its obligation; and the risk that the derivative
transaction could expose the fund to the effects of leverage, which could
increase the fund's exposure to the market and magnify potential losses. There
is no guarantee that derivatives, to the extent employed, will have the
intended effect, and their use could cause lower returns or even losses to the
fund. The use of derivatives by the fund to hedge risk may reduce the
opportunity for gain by offsetting the positive effect of favorable price
movements.
FOREIGN INVESTMENT RISK. To the extent the fund invests in companies based
outside the US, it faces the risks inherent in foreign investing. Adverse
political, economic or
61
PROSPECTUS May 1, 2010 Fund Details
social developments could undermine the value of the fund's investments or
prevent the fund from realizing their full value. Financial reporting standards
for companies based in foreign markets differ from those in the US.
Additionally, foreign securities markets generally are smaller and less liquid
than US markets. To the extent that the fund invests in non-US dollar
denominated foreign securities, changes in currency exchange rates may affect
the US dollar value of foreign securities or the income or gain received on
these securities. Foreign governments may restrict investment by foreigners,
limit withdrawal of trading profit or currency from the country, restrict
currency exchange or seize foreign investments. The investments of the fund may
also be subject to foreign withholding taxes. Foreign transactions and custody
of assets may involve delays in payment, delivery or recovery of money or
investments. Foreign investment risks are greater in emerging markets than in
developed markets. Emerging market investments are often considered
speculative. Emerging market countries typically have economic and political
systems that are less developed, and can be expected to be less stable than
developed markets. For example, the economies of such countries can be subject
to rapid and unpredictable rates of inflation or deflation.
SECURITY SELECTION RISK. The securities in the fund's portfolio may decline in
value. Portfolio management could be wrong in its analysis of industries,
companies, economic trends, the relative attractiveness of different securities
or other matters.
SECURITIES LENDING RISK. Any decline in the value of a portfolio security that
occurs while the security is out on loan is borne by the fund, and will
adversely affect performance. Also, there may be delays in recovery of
securities loaned or even a loss of rights in the collateral should the
borrower of the securities fail financially while holding the security.
COUNTERPARTY RISK. A financial institution or other counterparty with whom the
fund does business (such as trading or securities lending), or that
underwrites, distributes or guarantees any investments or contracts that the
fund owns or is otherwise exposed to, may decline in financial health and
become unable to honor its commitments. This could cause losses for the fund or
could delay the return or delivery of collateral or other assets to the fund.
ETF RISK. Because ETFs trade on a securities exchange, their shares may trade
at a premium or discount to their net asset value. An ETF is subject to the
risks of the assets in which it invests as well as those of the investment
strategy it follows. ETFs incur fees and expenses, such as trading costs,
operating expenses, licensing fees, trustee fees and marketing expenses. With
an index ETF, these costs may contribute to the ETF not fully matching the
performance of the index it is designed to track. The fund incurs brokerage
costs when it buys and sells shares of an ETF and also bears its proportionate
share of the ETF's fees and expenses, which are passed through to ETF
shareholders.
FOCUS RISK. To the extent that the fund focuses its investments in particular
industries, asset classes or sectors of the economy, any market price
movements, regulatory or technological changes, or economic conditions
affecting companies in those industries, asset classes or sectors will have a
significant impact on the fund's performance. For example, consumer goods
companies could be hurt by a rise in unemployment or technology companies could
be hurt by such factors as market saturation, price competition and rapid
obsolescence.
INFLATION-INDEXED BOND RISK. Any rise in interest rates may cause
inflation-indexed bonds to decline in price, hurting fund performance. If
interest rates rise owing to reasons other than inflation, the fund's
investment in these securities may not be fully protected from the effects of
rising interest rates. The performance of any bonds that are indexed to non-US
rates of inflation may be higher or lower than those indexed to US inflation
rates. There can be no assurance that the fund's returns will match or exceed
the real rate of inflation.
LIQUIDITY RISK. In certain situations, it may be difficult or impossible to
sell an investment in an orderly fashion at an acceptable price. This risk can
be ongoing for any security that does not trade actively or in large volumes,
for any security that trades primarily on smaller markets, and for investments
that typically trade only among a limited number of large investors (such as
certain types of derivatives or restricted securities). In unusual market
conditions, even normally liquid securities may be affected by a degree of
liquidity risk. This may affect only certain securities or an overall
securities market.
PREPAYMENT AND EXTENSION RISK. When interest rates fall, issuers of high
interest debt obligations may pay off the debts earlier than expected
(prepayment risk), and the fund may have to reinvest the proceeds at lower
yields. When interest rates rise, issuers of lower interest debt obligations
may pay off the debts later than expected (extension risk), thus keeping the
fund's assets tied up in lower interest debt obligations. Prepayments could
also create capital gains tax liability in some instances. Any unexpected
behavior in interest rates could increase the volatility of the fund's share
price and yield and could hurt fund performance.
PRICING RISK. If market conditions make it difficult to value some investments,
the fund may value these investments using more subjective methods, such as
fair value pricing. In such cases, the value determined for an investment could
be different than the value realized upon such investment's sale. As a result,
you could pay more than the market value when buying fund shares or receive
less than the market value when selling fund shares.
62
PROSPECTUS May 1, 2010 Fund Details
REGIONAL FOCUS RISK. Focusing on a single country or region involves increased
currency, political, regulatory and other risks. To the extent the fund
concentrates its investments in a particular country or region, market swings
in such a targeted country or region will be likely to have a greater effect on
fund performance than they would in a more geographically diversified equity
fund.
SMALL COMPANY RISK. Small company stocks tend to be more volatile than large
company stocks. Small companies are less widely followed by stock analysts and
less information about them is available to investors. Industry-wide reversals
may have a greater impact on small companies, since they lack the financial
resources of larger companies. Small company stocks are typically less liquid
than large company stocks.
--------------------------------------------------------------------------------
DWS Blue Chip VIP
PRINCIPAL INVESTMENT STRATEGY
MAIN INVESTMENTS. Under normal circumstances, the fund invests at least 80% of
net assets, plus the amount of any borrowings for investment purposes, in
common stocks of large US companies that are similar in size to the companies
in the S&P 500( (Reg. TM)) Index (generally the 500 largest companies in the
US) and that portfolio management considers to be "blue chip" companies. Blue
chip companies are large, well-known companies that typically have an
established earnings and dividends history, easy access to credit, solid
positions in their industry and strong management.
While the fund invests mainly in US common stocks, it could invest up to 20% of
net assets in foreign securities. The fund may also invest in other types of
equity securities such as preferred stocks or convertible securities.
MANAGEMENT PROCESS. Portfolio management looks for "blue chip" companies whose
stock price is attractive relative to potential growth. Portfolio management
uses both quantitative techniques and fundamental analysis to evaluate each
company's stock price relative to the company's earnings, operating trends,
market outlook and other measures of performance potential.
Portfolio management will normally sell a stock when they believe its
fundamental factors have changed, other investments offer better opportunities
or in the course of adjusting the fund's emphasis on or within a given
industry.
--------------------------------------------------------------------------------
DERIVATIVES. The fund may use various types of derivatives (contracts whose
value is based on, for example, indices, currencies or securities) for hedging,
risk management or non-hedging purposes to seek to enhance potential gains. The
fund may use derivatives as a substitute for direct investment in a particular
asset class or to keep cash on hand to meet shareholder redemptions or other
needs.
SECURITIES LENDING. The fund may lend securities (up to one-third of total
assets) to approved institutions.
--------------------------------------------------------------------------------
MAIN RISKS
There are several risk factors that could hurt the fund's performance, cause
you to lose money or cause the fund's performance to trail that of other
investments.
STOCK MARKET RISK. When stock prices fall, you should expect the value of your
investment to fall as well. Stock prices can be hurt by poor management on the
part of the stock's issuer, shrinking product demand and other business risks.
These may affect single companies as well as groups of companies. In addition,
movements in financial markets may adversely affect a stock's price, regardless
of how well the company performs. To the extent the fund invests in a
particular capitalization or market sector, the fund's performance may be
proportionately affected by that segment's general performance.
FOCUS RISK. To the extent that the fund focuses its investments in particular
industries, asset classes or sectors of the economy, any market price
movements, regulatory or technological changes, or economic conditions
affecting companies in those industries, asset classes or sectors will have a
significant impact on the fund's performance. For example, consumer goods
companies could be hurt by a rise in unemployment or technology companies could
be hurt by such factors as market saturation, price competition and rapid
obsolescence.
SECURITY SELECTION RISK. The securities in the fund's portfolio may decline in
value. Portfolio management could be wrong in its analysis of industries,
companies, economic trends, the relative attractiveness of different securities
or other matters.
SECURITIES LENDING RISK. Any decline in the value of a portfolio security that
occurs while the security is out on loan is borne by the fund, and will
adversely affect performance. Also, there may be delays in recovery of
securities loaned or even a loss of rights in the collateral should the
borrower of the securities fail financially while holding the security.
FOREIGN INVESTMENT RISK. To the extent the fund invests in companies based
outside the US, it faces the risks inherent in foreign investing. Adverse
political, economic or social developments could undermine the value of the
fund's investments or prevent the fund from realizing their full value.
Financial reporting standards for companies based in foreign markets differ
from those in the US. Additionally, foreign securities markets generally are
smaller and less liquid than US markets. To the extent that the fund invests in
non-US dollar denominated foreign securities, changes in currency exchange
rates may affect the US dollar value of foreign securities or the income or
gain received on these securities. Foreign governments may restrict investment
by foreigners, limit withdrawal of trading profit or currency from the country,
restrict currency exchange or seize foreign investments. The investments of the
fund may also be subject to foreign withholding taxes.
63
PROSPECTUS May 1, 2010 Fund Details
Foreign transactions and custody of assets may involve delays in payment,
delivery or recovery of money or investments.
DERIVATIVES RISK. Risks associated with derivatives include the risk that the
derivative is not well correlated with the security, index or currency to which
it relates; the risk that derivatives may result in losses or missed
opportunities; the risk that the fund will be unable to sell the derivative
because of an illiquid secondary market; the risk that a counterparty is
unwilling or unable to meet its obligation; and the risk that the derivative
transaction could expose the fund to the effects of leverage, which could
increase the fund's exposure to the market and magnify potential losses. There
is no guarantee that derivatives, to the extent employed, will have the
intended effect, and their use could cause lower returns or even losses to the
fund. The use of derivatives by the fund to hedge risk may reduce the
opportunity for gain by offsetting the positive effect of favorable price
movements.
COUNTERPARTY RISK. A financial institution or other counterparty with whom the
fund does business (such as trading or securities lending), or that
underwrites, distributes or guarantees any investments or contracts that the
fund owns or is otherwise exposed to, may decline in financial health and
become unable to honor its commitments. This could cause losses for the fund or
could delay the return or delivery of collateral or other assets to the fund.
LIQUIDITY RISK. In certain situations, it may be difficult or impossible to
sell an investment in an orderly fashion at an acceptable price. This risk can
be ongoing for any security that does not trade actively or in large volumes,
for any security that trades primarily on smaller markets, and for investments
that typically trade only among a limited number of large investors (such as
certain types of derivatives or restricted securities). In unusual market
conditions, even normally liquid securities may be affected by a degree of
liquidity risk. This may affect only certain securities or an overall
securities market.
PRICING RISK. If market conditions make it difficult to value some investments,
the fund may value these investments using more subjective methods, such as
fair value pricing. In such cases, the value determined for an investment could
be different than the value realized upon such investment's sale. As a result,
you could pay more than the market value when buying fund shares or receive
less than the market value when selling fund shares.
--------------------------------------------------------------------------------
DWS Core Fixed Income VIP
PRINCIPAL INVESTMENT STRATEGY
MAIN INVESTMENTS. Under normal circumstances, the fund invests at least 80% of
assets, plus the amount of any borrowings for investment purposes, determined
at the time of purchase, in fixed income securities. Fixed income securities
include debt securities of the US Treasury, as well as US government agencies
and instrumentalities, corporate, mortgage-backed and asset-backed securities,
taxable municipal and tax-exempt municipal bonds and liquid Rule 144A
securities.
The fund invests primarily in investment-grade debt securities (securities
rated within the top four long-term credit rating categories). The fund may
invest up to 25% of total assets in US dollar-denominated securities of foreign
issuers and governments. The fund may hold up to 20% of total assets in cash or
money market instruments, either to maintain liquidity or in the event
portfolio management determines that securities meeting the fund's investment
objective are not readily available for purchase.
MANAGEMENT PROCESS. Portfolio management uses a strategy that uses a balanced
"top-down" and "bottom-up" approach in seeking to add incremental returns to
the Barclays Capital U.S. Aggregate Bond Index.
Portfolio management seeks pricing changes in a broad range of securities and
sectors, looking to exploit any inefficiencies between intrinsic value and
market trading price.
In choosing securities, portfolio management:
o assigns a relative value to each bond, based on creditworthiness, cash flow
and price
o determines an intrinsic value for each bond by examining credit, structure,
option value and liquidity risks
o uses credit analysis to determine the issuer's ability to pay interest and
repay principal on its bonds
o focuses on identifying individual bonds that may add above-market value,
with sector weightings a secondary consideration
--------------------------------------------------------------------------------
DERIVATIVES. The fund may use various types of derivatives (contracts whose
value is based on, for example, indices, currencies or securities) for hedging,
risk management or non-hedging purposes to seek to enhance potential gains. The
fund may use derivatives as a substitute for direct investment in a particular
asset class or to keep cash on hand to meet shareholder redemptions or other
needs. In particular, portfolio management may use futures, interest rate
swaps, credit default swaps and options.
SECURITIES LENDING. The fund may lend securities (up to one-third of total
assets) to approved institutions.
--------------------------------------------------------------------------------
MAIN RISKS
There are several risk factors that could hurt the fund's performance, cause
you to lose money or cause the fund's performance to trail that of other
investments.
INTEREST RATE RISK. When interest rates rise, prices of debt securities
generally decline. The longer the duration of the fund's debt securities, the
more sensitive it will be to interest rate changes. (As a general rule, a 1%
rise in interest rates means a 1% fall in value for every year of duration.)
CREDIT RISK. The fund's performance could be hurt if a security declines in
credit quality or goes into default, or if an issuer does not make timely
payments of interest or principal. For securities that rely on third-party
guarantors to
64
PROSPECTUS May 1, 2010 Fund Details
support their credit quality, the same risks may apply if the financial
condition of the guarantor deteriorates or the guarantor ceases insuring
municipal bonds. Because guarantors may insure many types of bonds, including
subprime mortgage bonds and other high-risk bonds, their financial condition
could deteriorate as a result of events that have little or no connection to
securities owned by the fund.
FOREIGN INVESTMENT RISK. To the extent the fund invests in companies based
outside the US, it faces the risks inherent in foreign investing. Adverse
political, economic or social developments could undermine the value of the
fund's investments or prevent the fund from realizing their full value.
Financial reporting standards for companies based in foreign markets differ
from those in the US. Additionally, foreign securities markets generally are
smaller and less liquid than US markets. To the extent that the fund invests in
non-US dollar denominated foreign securities, changes in currency exchange
rates may affect the US dollar value of foreign securities or the income or
gain received on these securities. Foreign governments may restrict investment
by foreigners, limit withdrawal of trading profit or currency from the country,
restrict currency exchange or seize foreign investments. The investments of the
fund may also be subject to foreign withholding taxes. Foreign transactions and
custody of assets may involve delays in payment, delivery or recovery of money
or investments.
DERIVATIVES RISK. Risks associated with derivatives include the risk that the
derivative is not well correlated with the security, index or currency to which
it relates; the risk that derivatives may result in losses or missed
opportunities; the risk that the fund will be unable to sell the derivative
because of an illiquid secondary market; the risk that a counterparty is
unwilling or unable to meet its obligation; and the risk that the derivative
transaction could expose the fund to the effects of leverage, which could
increase the fund's exposure to the market and magnify potential losses. There
is no guarantee that derivatives, to the extent employed, will have the
intended effect, and their use could cause lower returns or even losses to the
fund. The use of derivatives by the fund to hedge risk may reduce the
opportunity for gain by offsetting the positive effect of favorable price
movements.
SECURITY SELECTION RISK. The securities in the fund's portfolio may decline in
value. Portfolio management could be wrong in its analysis of industries,
companies, economic trends, the relative attractiveness of different securities
or other matters.
SECURITIES LENDING RISK. Any decline in the value of a portfolio security that
occurs while the security is out on loan is borne by the fund, and will
adversely affect performance. Also, there may be delays in recovery of
securities loaned or even a loss of rights in the collateral should the
borrower of the securities fail financially while holding the security.
COUNTERPARTY RISK. A financial institution or other counterparty with whom the
fund does business (such as trading or securities lending), or that
underwrites, distributes or guarantees any investments or contracts that the
fund owns or is otherwise exposed to, may decline in financial health and
become unable to honor its commitments. This could cause losses for the fund or
could delay the return or delivery of collateral or other assets to the fund.
LIQUIDITY RISK. In certain situations, it may be difficult or impossible to
sell an investment in an orderly fashion at an acceptable price. This risk can
be ongoing for any security that does not trade actively or in large volumes,
for any security that trades primarily on smaller markets, and for investments
that typically trade only among a limited number of large investors (such as
certain types of derivatives or restricted securities). In unusual market
conditions, even normally liquid securities may be affected by a degree of
liquidity risk. This may affect only certain securities or an overall
securities market.
PRICING RISK. If market conditions make it difficult to value some investments,
the fund may value these investments using more subjective methods, such as
fair value pricing. In such cases, the value determined for an investment could
be different than the value realized upon such investment's sale. As a result,
you could pay more than the market value when buying fund shares or receive
less than the market value when selling fund shares.
PREPAYMENT AND EXTENSION RISK. When interest rates fall, issuers of high
interest debt obligations may pay off the debts earlier than expected
(prepayment risk), and the fund may have to reinvest the proceeds at lower
yields. When interest rates rise, issuers of lower interest debt obligations
may pay off the debts later than expected (extension risk), thus keeping the
fund's assets tied up in lower interest debt obligations. Prepayments could
also create capital gains tax liability in some instances. Any unexpected
behavior in interest rates could increase the volatility of the fund's share
price and yield and could hurt fund performance.
--------------------------------------------------------------------------------
DWS Diversified International Equity VIP
PRINCIPAL INVESTMENT STRATEGY
MAIN INVESTMENTS. Under normal circumstances, the fund invests at least 80% of
its assets, determined at the time of purchase, in equity securities and other
securities with equity characteristics.
At least 50% of the fund's assets will be invested in securities that make up
the Morgan Stanley Capital International Europe, Australasia and Far East Index
(MSCI EAFE (Reg. TM) Index). In addition, the fund may invest in Canada. While
the fund invests primarily in common stocks, it may invest in other types of
equities such as preferred stocks, convertible securities, warrants and
exchange-traded funds (ETFs). The fund may also invest up to 20% of its assets
in
65
PROSPECTUS May 1, 2010 Fund Details
cash equivalents, US investment-grade fixed-income securities, and US stocks
and other equities. Although the fund can invest in companies of any size and
from any country, it invests mainly in common stocks of established companies
in countries with developed economies (other than the United States).
The fund may also invest a portion of its assets (typically not more than 35%
of its net assets) in securities of companies located in emerging markets, such
as those of many countries in Latin America, the Middle East, Eastern Europe,
Asia and Africa.
MANAGEMENT PROCESS. In choosing securities, portfolio management allocates
percentages of assets to various countries and sectors. Portfolio management
periodically reviews these allocations and may adjust them based on current or
anticipated market conditions or to manage risk consistent with the fund's
investment objective.
--------------------------------------------------------------------------------
DERIVATIVES. The fund may use various types of derivatives for hedging, risk
management or non-hedging purposes to seek to enhance potential gains. The fund
may use derivatives as a substitute for direct investment in a particular asset
class or to keep cash on hand to meet shareholder redemptions or other needs.
In particular, portfolio management may use futures, currency options and
forward currency transactions.
SECURITIES LENDING. The fund may lend securities (up to one-third of total
assets) to approved institutions.
--------------------------------------------------------------------------------
MAIN RISKS
There are several risk factors that could hurt the fund's performance, cause
you to lose money or cause the fund's performance to trail that of other
investments.
STOCK MARKET RISK. When stock prices fall, you should expect the value of your
investment to fall as well. Stock prices can be hurt by poor management on the
part of the stock's issuer, shrinking product demand and other business risks.
These may affect single companies as well as groups of companies. In addition,
movements in financial markets may adversely affect a stock's price, regardless
of how well the company performs. To the extent that the fund invests in a
particular geographic region or market sector, performance will be affected by
that region's general performance.
FOREIGN INVESTMENT RISK. To the extent the fund invests in companies based
outside the US, it faces the risks inherent in foreign investing. Adverse
political, economic or social developments could undermine the value of the
fund's investments or prevent the fund from realizing their full value.
Financial reporting standards for companies based in foreign markets differ
from those in the US. Additionally, foreign securities markets generally are
smaller and less liquid than US markets. To the extent that the fund invests in
non-US dollar denominated foreign securities, changes in currency exchange
rates may affect the US dollar value of foreign securities or the income or
gain received on these securities. Foreign governments may restrict investment
by foreigners, limit withdrawal of trading profit or currency from the country,
restrict currency exchange or seize foreign investments. The investments of the
fund may also be subject to foreign withholding taxes. Foreign transactions and
custody of assets may involve delays in payment, delivery or recovery of money
or investments. Foreign investment risks are greater in emerging markets than
in developed markets. Emerging market investments are often considered
speculative. Emerging market countries typically have economic and political
systems that are less developed, and can be expected to be less stable than
developed markets. For example, the economies of such countries can be subject
to rapid and unpredictable rates of inflation or deflation.
PRICING RISK. If market conditions make it difficult to value some investments,
the fund may value these investments using more subjective methods, such as
fair value pricing. In such cases, the value determined for an investment could
be different than the value realized upon such investment's sale. As a result,
you could pay more than the market value when buying fund shares or receive
less than the market value when selling fund shares.
ETF RISK. Because ETFs trade on a securities exchange, their shares may trade
at a premium or discount to their net asset value. An ETF is subject to the
risks of the assets in which it invests as well as those of the investment
strategy it follows. ETFs incur fees and expenses, such as trading costs,
operating expenses, licensing fees, trustee fees and marketing expenses. With
an index ETF, these costs may contribute to the ETF not fully matching the
performance of the index it is designed to track. The fund incurs brokerage
costs when it buys and sells shares of an ETF and also bears its proportionate
share of the ETF's fees and expenses, which are passed through to ETF
shareholders.
SECURITY SELECTION RISK. The securities in the fund's portfolio may decline in
value. Portfolio management could be wrong in its analysis of industries,
companies, economic trends, the relative attractiveness of different securities
or other matters.
DERIVATIVES RISK. Risks associated with derivatives include the risk that the
derivative is not well correlated with the security, index or currency to which
it relates; the risk that derivatives may result in losses or missed
opportunities; the risk that the fund will be unable to sell the derivative
because of an illiquid secondary market; the risk that a counterparty is
unwilling or unable to meet its obligation; and the risk that the derivative
transaction could expose the fund to the effects of leverage, which could
increase the fund's exposure to the market and magnify potential losses. There
is no guarantee that derivatives, to the extent employed, will have the
intended effect, and their use could cause lower returns or even losses to the
fund. The use of derivatives by the fund to hedge risk may reduce the
opportunity for gain by offsetting the positive effect of favorable price
movements.
66
PROSPECTUS May 1, 2010 Fund Details
SECURITIES LENDING RISK. Any decline in the value of a portfolio security that
occurs while the security is out on loan is borne by the fund, and will
adversely affect performance. Also, there may be delays in recovery of
securities loaned or even a loss of rights in the collateral should the
borrower of the securities fail financially while holding the security.
COUNTERPARTY RISK. A financial institution or other counterparty with whom the
fund does business (such as trading or securities lending), or that
underwrites, distributes or guarantees any investments or contracts that the
fund owns or is otherwise exposed to, may decline in financial health and
become unable to honor its commitments. This could cause losses for the fund or
could delay the return or delivery of collateral or other assets to the fund.
LIQUIDITY RISK. In certain situations, it may be difficult or impossible to
sell an investment in an orderly fashion at an acceptable price. This risk can
be ongoing for any security that does not trade actively or in large volumes,
for any security that trades primarily on smaller markets, and for investments
that typically trade only among a limited number of large investors (such as
certain types of derivatives or restricted securities). In unusual market
conditions, even normally liquid securities may be affected by a degree of
liquidity risk. This may affect only certain securities or an overall
securities market.
SMALL COMPANY RISK. Small company stocks tend to be more volatile than large
company stocks. Small companies are less widely followed by stock analysts and
less information about them is available to investors. Industry-wide reversals
may have a greater impact on small companies, since they lack the financial
resources of larger companies. Small company stocks are typically less liquid
than large company stocks.
--------------------------------------------------------------------------------
DWS Dreman Small Mid Cap Value VIP
PRINCIPAL INVESTMENT STRATEGY
Under normal circumstances, the fund invests at least 80% of net assets, plus
the amount of any borrowings for investment purposes, in undervalued common
stocks of small and mid-size US companies. The fund defines small companies as
those that are similar in market value to those in the Russell 2000 (Reg. TM)
Value Index. The fund defines mid-size companies as those that are similar in
market value to those in the Russell Midcap (Reg. TM) Value Index. The fund
intends to invest primarily in companies whose market capitalizations fall
within the normal range of each Index.
While the fund invests mainly in US stocks, it could invest up to 20% of net
assets in foreign securities.
The fund's equity investments are mainly common stocks, but may also include
other types of equities such as preferred or convertible stocks. The fund may
also invest in initial public offerings.
MANAGEMENT PROCESS. Portfolio management begins by screening stocks of small
and mid-size companies with below-market price-to-earnings (P/E) ratios.
Portfolio management then compares the company's stock price to such measures
as book value, cash flow and yield and analyzes individual companies to
identify those that are fundamentally sound and appear to have strong potential
for earnings and dividend growth over the Russell 2500 Value Index.
Portfolio management then assembles the fund's portfolio from among the most
attractive stocks, drawing, in addition, on an analysis of economic outlooks
for various industries.
Portfolio management will normally sell a stock when it no longer qualifies as
a small or mid-size company, when its P/E rises above that of the industry
median or the median for the Russell 2500 Value Index, its fundamentals change
or other investments offer better opportunities.
--------------------------------------------------------------------------------
DERIVATIVES. The fund may use various types of derivatives (contracts whose
value is based on, for example, indices, currencies or securities) for hedging,
risk management or non-hedging purposes to seek to enhance potential gains. The
fund may use derivatives as a substitute for direct investment in a particular
asset class or to keep cash on hand to meet shareholder redemptions or other
needs. In particular, the fund may use futures, currency options and forward
currency transactions.
SECURITIES LENDING. The fund may lend securities (up to one-third of total
assets) to approved institutions.
--------------------------------------------------------------------------------
MAIN RISKS
There are several risk factors that could hurt the fund's performance, cause
you to lose money or cause the fund's performance to trail that of other
investments.
STOCK MARKET RISK. When stock prices fall, you should expect the value of your
investment to fall as well. Stock prices can be hurt by poor management on the
part of the stock's issuer, shrinking product demand and other business risks.
These may affect single companies as well as groups of companies. In addition,
movements in financial markets may adversely affect a stock's price, regardless
of how well the company performs. To the extent the fund invests in a
particular capitalization or market sector, the fund's performance may be
proportionately affected by that segment's general performance.
SECURITY SELECTION RISK. The securities in the fund's portfolio may decline in
value. Portfolio management could be wrong in its analysis of industries,
companies, economic trends, the relative attractiveness of different securities
or other matters.
VALUE INVESTING RISK. As a category, value stocks may underperform growth
stocks (and the stock market as a whole) over any period of time. In addition,
value stocks selected for investment by portfolio management may not perform as
anticipated: stocks that appear undervalued may remain undervalued
indefinitely, or may in fact be fairly valued.
67
PROSPECTUS May 1, 2010 Fund Details
SMALL COMPANY RISK. Small company stocks tend to be more volatile than large
company stocks. Small companies are less widely followed by stock analysts and
less information about them is available to investors. Industry-wide reversals
may have a greater impact on small companies, since they lack the financial
resources of larger companies. Small company stocks are typically less liquid
than large company stocks.
MEDIUM-SIZED COMPANY RISK. Medium-sized company stocks tend to be more volatile
than large company stocks. Medium-sized companies are less widely followed by
stock analysts and less information about them is available to investors.
Industry-wide reversals may have a greater impact on medium-sized companies,
since they lack the financial resources of larger companies. Medium-sized
company stocks are typically less liquid than large company stocks.
FOCUS RISK. To the extent that the fund focuses its investments in particular
industries, asset classes or sectors of the economy, any market price
movements, regulatory or technological changes, or economic conditions
affecting companies in those industries, asset classes or sectors will have a
significant impact on the fund's performance. For example, consumer goods
companies could be hurt by a rise in unemployment or technology companies could
be hurt by such factors as market saturation, price competition and rapid
obsolescence.
FOREIGN INVESTMENT RISK. To the extent the fund invests in companies based
outside the US, it faces the risks inherent in foreign investing. Adverse
political, economic or social developments could undermine the value of the
fund's investments or prevent the fund from realizing their full value.
Financial reporting standards for companies based in foreign markets differ
from those in the US. Additionally, foreign securities markets generally are
smaller and less liquid than US markets. To the extent that the fund invests in
non-US dollar denominated foreign securities, changes in currency exchange
rates may affect the US dollar value of foreign securities or the income or
gain received on these securities. Foreign governments may restrict investment
by foreigners, limit withdrawal of trading profit or currency from the country,
restrict currency exchange or seize foreign investments. The investments of the
fund may also be subject to foreign withholding taxes. Foreign transactions and
custody of assets may involve delays in payment, delivery or recovery of money
or investments. Foreign investment risks are greater in emerging markets than
in developed markets. Emerging market investments are often considered
speculative. Emerging market countries typically have economic and political
systems that are less developed, and can be expected to be less stable than
developed markets. For example, the economies of such countries can be subject
to rapid and unpredictable rates of inflation or deflation.
DERIVATIVES RISK. Risks associated with derivatives include the risk that the
derivative is not well correlated with the security, index or currency to which
it relates; the risk that derivatives may result in losses or missed
opportunities; the risk that the fund will be unable to sell the derivative
because of an illiquid secondary market; the risk that a counterparty is
unwilling or unable to meet its obligation; and the risk that the derivative
transaction could expose the fund to the effects of leverage, which could
increase the fund's exposure to the market and magnify potential losses. There
is no guarantee that derivatives, to the extent employed, will have the
intended effect, and their use could cause lower returns or even losses to the
fund. The use of derivatives by the fund to hedge risk may reduce the
opportunity for gain by offsetting the positive effect of favorable price
movements.
SECURITIES LENDING RISK. Any decline in the value of a portfolio security that
occurs while the security is out on loan is borne by the fund, and will
adversely affect performance. Also, there may be delays in recovery of
securities loaned or even a loss of rights in the collateral should the
borrower of the securities fail financially while holding the security.
COUNTERPARTY RISK. A financial institution or other counterparty with whom the
fund does business (such as trading or securities lending), or that
underwrites, distributes or guarantees any investments or contracts that the
fund owns or is otherwise exposed to, may decline in financial health and
become unable to honor its commitments. This could cause losses for the fund or
could delay the return or delivery of collateral or other assets to the fund.
LIQUIDITY RISK. In certain situations, it may be difficult or impossible to
sell an investment in an orderly fashion at an acceptable price. This risk can
be ongoing for any security that does not trade actively or in large volumes,
for any security that trades primarily on smaller markets, and for investments
that typically trade only among a limited number of large investors (such as
certain types of derivatives or restricted securities). In unusual market
conditions, even normally liquid securities may be affected by a degree of
liquidity risk. This may affect only certain securities or an overall
securities market.
PRICING RISK. If market conditions make it difficult to value some investments,
the fund may value these investments using more subjective methods, such as
fair value pricing. In such cases, the value determined for an investment could
be different than the value realized upon such investment's sale. As a result,
you could pay more than the market value when buying fund shares or receive
less than the market value when selling fund shares.
68
PROSPECTUS May 1, 2010 Fund Details
--------------------------------------------------------------------------------
DWS Global Thematic VIP
PRINCIPAL INVESTMENT STRATEGY
MAIN INVESTMENTS. Under normal circumstances, the fund invests at least 80% of
net assets, plus the amount of any borrowings for investment purposes, in
common stocks and other equities of companies throughout the world that
portfolio management considers to be "blue chip" companies. Blue chip companies
are large, well known companies that typically have an established earnings and
dividends history, easy access to credit, solid positions in their industries
and strong management.
MANAGEMENT PROCESS.
In choosing securities, portfolio management uses a combination of three
analytical disciplines:
o BOTTOM-UP RESEARCH. Portfolio management looks for individual companies with
a history of above-average growth, strong competitive positioning,
attractive prices relative to potential growth, sound financial strength
and effective management, among other factors.
o GROWTH ORIENTATION. Portfolio management generally looks for companies that
portfolio management believes have above-average potential for sustainable
growth of revenue or earnings and whose market value appears reasonable in
light of their business prospects.
o ANALYSIS OF GLOBAL THEMES. Portfolio management considers global economic
outlooks, seeking to identify industries and companies that are likely to
benefit from social, political and economic changes.
Portfolio management uses analytical tools to actively monitor the risk profile
of the portfolio as compared to comparable funds and appropriate benchmarks and
peer groups.
Portfolio management will normally sell a stock when portfolio management
believes its price is unlikely to go much higher, its fundamentals have
deteriorated, other investments offer better opportunities or in the course of
adjusting the fund's exposure to a given country.
While most of the fund's equities are common stocks, some may be other types of
equities, such as convertible stocks or preferred stocks. The fund may also
invest up to 5% of total assets in junk bonds.
--------------------------------------------------------------------------------
DERIVATIVES. The fund may use various types of derivatives (contracts whose
value is based on, for example, indices, currencies or securities) for hedging,
risk management or non-hedging purposes to seek to enhance potential gains. The
fund may use derivatives as a substitute for direct investment in a particular
asset class or to keep cash on hand to meet shareholder redemptions or other
needs. In particular, the fund may use futures, currency options and forward
currency transactions.
SECURITIES LENDING. The fund may lend securities (up to one-third of total
assets) to approved institutions.
--------------------------------------------------------------------------------
MAIN RISKS
There are several risk factors that could hurt the fund's performance, cause
you to lose money or cause the fund's performance to trail that of other
investments.
STOCK MARKET RISK. When stock prices fall, you should expect the value of your
investment to fall as well. Stock prices can be hurt by poor management on the
part of the stock's issuer, shrinking product demand and other business risks.
These may affect single companies as well as groups of companies. In addition,
movements in financial markets may adversely affect a stock's price, regardless
of how well the company performs. To the extent that the fund invests in a
particular geographic region or market sector, performance will be affected by
that region's general performance.
FOREIGN INVESTMENT RISK. To the extent the fund invests in companies based
outside the US, it faces the risks inherent in foreign investing. Adverse
political, economic or social developments could undermine the value of the
fund's investments or prevent the fund from realizing their full value.
Financial reporting standards for companies based in foreign markets differ
from those in the US. Additionally, foreign securities markets generally are
smaller and less liquid than US markets. To the extent that the fund invests in
non-US dollar denominated foreign securities, changes in currency exchange
rates may affect the US dollar value of foreign securities or the income or
gain received on these securities. Foreign governments may restrict investment
by foreigners, limit withdrawal of trading profit or currency from the country,
restrict currency exchange or seize foreign investments. The investments of the
fund may also be subject to foreign withholding taxes. Foreign transactions and
custody of assets may involve delays in payment, delivery or recovery of money
or investments. Foreign investment risks are greater in emerging markets than
in developed markets. Emerging market investments are often considered
speculative. Emerging market countries typically have economic and political
systems that are less developed, and can be expected to be less stable than
developed markets. For example, the economies of such countries can be subject
to rapid and unpredictable rates of inflation or deflation.
SECURITY SELECTION RISK. The securities in the fund's portfolio may decline in
value. Portfolio management could be wrong in its analysis of industries,
companies, economic trends, the relative attractiveness of different securities
or other matters.
LIQUIDITY RISK. In certain situations, it may be difficult or impossible to
sell an investment in an orderly fashion at an acceptable price. This risk can
be ongoing for any security that does not trade actively or in large volumes,
for any security that trades primarily on smaller markets, and for investments
that typically trade only among a limited number of large investors (such as
certain types of derivatives or restricted securities). In unusual market
conditions, even
69
PROSPECTUS May 1, 2010 Fund Details
normally liquid securities may be affected by a degree of liquidity risk. This
may affect only certain securities or an overall securities market.
PRICING RISK. If market conditions make it difficult to value some investments,
the fund may value these investments using more subjective methods, such as
fair value pricing. In such cases, the value determined for an investment could
be different than the value realized upon such investment's sale. As a result,
you could pay more than the market value when buying fund shares or receive
less than the market value when selling fund shares.
DERIVATIVES RISK. Risks associated with derivatives include the risk that the
derivative is not well correlated with the security, index or currency to which
it relates; the risk that derivatives may result in losses or missed
opportunities; the risk that the fund will be unable to sell the derivative
because of an illiquid secondary market; the risk that a counterparty is
unwilling or unable to meet its obligation; and the risk that the derivative
transaction could expose the fund to the effects of leverage, which could
increase the fund's exposure to the market and magnify potential losses. There
is no guarantee that derivatives, to the extent employed, will have the
intended effect, and their use could cause lower returns or even losses to the
fund. The use of derivatives by the fund to hedge risk may reduce the
opportunity for gain by offsetting the positive effect of favorable price
movements.
SECURITIES LENDING RISK. Any decline in the value of a portfolio security that
occurs while the security is out on loan is borne by the fund, and will
adversely affect performance. Also, there may be delays in recovery of
securities loaned or even a loss of rights in the collateral should the
borrower of the securities fail financially while holding the security.
COUNTERPARTY RISK. A financial institution or other counterparty with whom the
fund does business (such as trading or securities lending), or that
underwrites, distributes or guarantees any investments or contracts that the
fund owns or is otherwise exposed to, may decline in financial health and
become unable to honor its commitments. This could cause losses for the fund or
could delay the return or delivery of collateral or other assets to the fund.
--------------------------------------------------------------------------------
DWS Government & Agency Securities VIP
PRINCIPAL INVESTMENT STRATEGY
MAIN INVESTMENTS. Under normal circumstances, the fund invests at least 80% of
net assets, plus the amount of any borrowings for investment purposes, in US
government securities and repurchase agreements of US government securities. US
government-related debt instruments in which the fund may invest include: (i)
direct obligations of the US Treasury; (ii) securities such as Ginnie Maes
which are mortgage-backed securities issued and guaranteed by the Government
National Mortgage Association (GNMA) and supported by the full faith and credit
of the United States; and (iii) securities issued or guaranteed, as to their
payment of principal and interest, by US government agencies or government
sponsored entities, some of which may be supported only by the credit of the
issuer.
The fund normally invests all of its assets in securities issued or guaranteed
by the US government, its agencies or instrumentalities, except the fund may
invest up to 10% of its net assets in cash equivalents, such as money market
funds, and short-term bond funds. These securities may not be issued or
guaranteed by the US government, its agencies or instrumentalities.
MANAGEMENT PROCESS. In deciding which types of government bonds to buy and
sell, portfolio management first considers the relative attractiveness of US
Treasuries compared to other US government and agency securities and then
determines allocations. Their decisions are generally based on a number of
factors, including changes in supply and demand within the bond market.
In choosing individual bonds, portfolio management reviews each bond's
fundamentals, compares the yields of shorter maturity bonds to those of longer
maturity bonds and uses technical analysis to project prepayment rates and
other factors that could affect a bond's attractiveness. Portfolio management
may also adjust the duration (a measure of sensitivity to interest rate
movements) of the fund's portfolio, based upon their analysis.
--------------------------------------------------------------------------------
DERIVATIVES. The fund may use various types of derivatives (contracts whose
value is based on, for example, indices, currencies or securities) for hedging,
risk management or non-hedging purposes to seek to enhance potential gains. The
fund may use derivatives as a substitute for direct investment in a particular
asset class or to keep cash on hand to meet shareholder redemptions or other
needs.
SECURITIES LENDING. The fund may lend securities (up to one-third of total
assets) to approved institutions.
--------------------------------------------------------------------------------
MAIN RISKS
There are several risk factors that could hurt the fund's performance, cause
you to lose money or cause the fund's performance to trail that of other
investments.
INTEREST RATE RISK. When interest rates rise, prices of debt securities
generally decline. The longer the duration of the fund's debt securities, the
more sensitive it will be to interest rate changes. (As a general rule, a 1%
rise in interest rates means a 1% fall in value for every year of duration.)
DERIVATIVES RISK. Risks associated with derivatives include the risk that the
derivative is not well correlated with the security, index or currency to which
it relates; the risk that derivatives may result in losses or missed
opportunities; the risk that the fund will be unable to sell the derivative
because of an illiquid secondary market; the risk that a counterparty is
unwilling or unable to meet its obligation; and the risk that the derivative
transaction could expose
70
PROSPECTUS May 1, 2010 Fund Details
the fund to the effects of leverage, which could increase the fund's exposure
to the market and magnify potential losses. There is no guarantee that
derivatives, to the extent employed, will have the intended effect, and their
use could cause lower returns or even losses to the fund. The use of
derivatives by the fund to hedge risk may reduce the opportunity for gain by
offsetting the positive effect of favorable price movements.
SECURITY SELECTION RISK. The securities in the fund's portfolio may decline in
value. Portfolio management could be wrong in its analysis of industries,
companies, economic trends, the relative attractiveness of different securities
or other matters.
CREDIT RISK. The fund's performance could be hurt if a security declines in
credit quality or goes into default, or if an issuer does not make timely
payments of interest or principal.
Some securities issued by US government agencies or instrumentalities are
backed by the full faith and credit of the US government. Others are supported
only by the credit of that agency or instrumentality. For this latter group, if
there is a potential or actual loss of principal and interest of these
securities, the US government might provide financial support, but has no
obligation to do so.
SECURITIES LENDING RISK. Any decline in the value of a portfolio security that
occurs while the security is out on loan is borne by the fund, and will
adversely affect performance. Also, there may be delays in recovery of
securities loaned or even a loss of rights in the collateral should the
borrower of the securities fail financially while holding the security.
COUNTERPARTY RISK. A financial institution or other counterparty with whom the
fund does business (such as trading or securities lending), or that
underwrites, distributes or guarantees any investments or contracts that the
fund owns or is otherwise exposed to, may decline in financial health and
become unable to honor its commitments. This could cause losses for the fund or
could delay the return or delivery of collateral or other assets to the fund.
LIQUIDITY RISK. In certain situations, it may be difficult or impossible to
sell an investment in an orderly fashion at an acceptable price. This risk can
be ongoing for any security that does not trade actively or in large volumes,
for any security that trades primarily on smaller markets, and for investments
that typically trade only among a limited number of large investors (such as
certain types of derivatives or restricted securities). In unusual market
conditions, even normally liquid securities may be affected by a degree of
liquidity risk. This may affect only certain securities or an overall
securities market.
PRICING RISK. If market conditions make it difficult to value some investments,
the fund may value these investments using more subjective methods, such as
fair value pricing. In such cases, the value determined for an investment could
be different than the value realized upon such investment's sale. As a result,
you could pay more than the market value when buying fund shares or receive
less than the market value when selling fund shares.
PREPAYMENT AND EXTENSION RISK. When interest rates fall, issuers of high
interest debt obligations may pay off the debts earlier than expected
(prepayment risk), and the fund may have to reinvest the proceeds at lower
yields. When interest rates rise, issuers of lower interest debt obligations
may pay off the debts later than expected (extension risk), thus keeping the
fund's assets tied up in lower interest debt obligations. Prepayments could
also create capital gains tax liability in some instances. Any unexpected
behavior in interest rates could increase the volatility of the fund's share
price and yield and could hurt fund performance.
--------------------------------------------------------------------------------
DWS High Income VIP
PRINCIPAL INVESTMENT STRATEGY
MAIN INVESTMENTS. Under normal circumstances, the fund generally invests at
least 65% of net assets, plus the amount of any borrowings for investment
purposes, in junk bonds, which are those rated below the fourth highest credit
rating category (that is, grade BB/Ba and below). The fund may invest up to 50%
of total assets in bonds denominated in US dollars or foreign currencies from
foreign issuers. The fund invests in securities of varying maturities and
intends to maintain a dollar-weighted effective average portfolio maturity that
will not exceed ten years. Subject to its portfolio maturity policy, the fund
may purchase individual securities with any stated maturity.
MANAGEMENT PROCESS. Portfolio management focuses on cash flow and total return
analysis, and broad diversification among countries, sectors, industries and
individual issuers and maturities. Portfolio management uses an active process
that emphasizes relative value in a global environment, managing on a total
return basis, and using intensive research to identify stable to improving
credit situations that may provide yield compensation for the risk of investing
in junk bonds.
The investment process involves a bottom-up approach, where relative value and
fundamental analysis are used to select the best securities within each
industry, and a top-down approach to assess the overall risk and return in the
market and which considers macro trends in the economy. To select securities or
investments, portfolio management:
o analyzes economic conditions for improving or undervalued sectors and
industries;
o uses independent credit research and on-site management visits to evaluate
individual issuers' debt service, growth rate, and both downgrade and
upgrade potential;
o assesses new offerings versus secondary market opportunities; and
71
PROSPECTUS May 1, 2010 Fund Details
o seeks issuers within attractive industry sectors and with strong long-term
fundamentals and improving credits.
--------------------------------------------------------------------------------
DERIVATIVES. The fund may use various types of derivatives (contracts whose
value is based on, for example, indices, currencies or securities) for hedging,
risk management or non-hedging purposes to seek to enhance potential gains. The
fund may use derivatives as a substitute for direct investment in a particular
asset class or to keep cash on hand to meet shareholder redemptions or other
needs. In particular, portfolio management may use future contracts, currency
options, forward currency contracts and credit default swaps.
SECURITIES LENDING. The fund may lend securities (up to one-third of total
assets) to approved institutions.
--------------------------------------------------------------------------------
MAIN RISKS
There are several risk factors that could hurt the fund's performance, cause
you to lose money or cause the fund's performance to trail that of other
investments.
CREDIT RISK. A fund purchasing debt securities faces the risk that the
creditworthiness of an issuer may decline, causing the value of the debt
securities to decline. In addition, an issuer may not be able to make timely
payments on the interest and/or principal on the debt security it has issued.
Because the issuers of high-yield debt securities or junk bonds (debt
securities rated below the fourth highest category) may be in uncertain
financial health, the prices of their debt securities can be more vulnerable to
bad economic news or even the expectation of bad news, than investment-grade
debt securities. In some cases, debt securities, particularly high-yield debt
securities, may decline in credit quality or go into default. Because the fund
may invest in securities not paying current interest or in securities already
in default, these risks may be more pronounced.
INTEREST RATE RISK. When interest rates rise, prices of debt securities
generally decline. The longer the duration of the fund's debt securities, the
more sensitive it will be to interest rate changes. (As a general rule, a 1%
rise in interest rates means a 1% fall in value for every year of duration.)
FOREIGN INVESTMENT RISK. To the extent the fund invests in companies based
outside the US, it faces the risks inherent in foreign investing. Adverse
political, economic or social developments could undermine the value of the
fund's investments or prevent the fund from realizing their full value.
Financial reporting standards for companies based in foreign markets differ
from those in the US. Additionally, foreign securities markets generally are
smaller and less liquid than US markets. To the extent that the fund invests in
non-US dollar denominated foreign securities, changes in currency exchange
rates may affect the US dollar value of foreign securities or the income or
gain received on these securities. Foreign governments may restrict investment
by foreigners, limit withdrawal of trading profit or currency from the country,
restrict currency exchange or seize foreign investments. The investments of the
fund may also be subject to foreign withholding taxes. Foreign transactions and
custody of assets may involve delays in payment, delivery or recovery of money
or investments. Foreign investment risks are greater in emerging markets than
in developed markets. Emerging market investments are often considered
speculative. Emerging market countries typically have economic and political
systems that are less developed, and can be expected to be less stable than
developed markets. For example, the economies of such countries can be subject
to rapid and unpredictable rates of inflation or deflation.
SECURITY SELECTION RISK. The securities in the fund's portfolio may decline in
value. Portfolio management could be wrong in its analysis of industries,
companies, economic trends, the relative attractiveness of different securities
or other matters.
DERIVATIVES RISK. Risks associated with derivatives include the risk that the
derivative is not well correlated with the security, index or currency to which
it relates; the risk that derivatives may result in losses or missed
opportunities; the risk that the fund will be unable to sell the derivative
because of an illiquid secondary market; the risk that a counterparty is
unwilling or unable to meet its obligation; and the risk that the derivative
transaction could expose the fund to the effects of leverage, which could
increase the fund's exposure to the market and magnify potential losses. There
is no guarantee that derivatives, to the extent employed, will have the
intended effect, and their use could cause lower returns or even losses to the
fund. The use of derivatives by the fund to hedge risk may reduce the
opportunity for gain by offsetting the positive effect of favorable price
movements.
SECURITIES LENDING RISK. Any decline in the value of a portfolio security that
occurs while the security is out on loan is borne by the fund, and will
adversely affect performance. Also, there may be delays in recovery of
securities loaned or even a loss of rights in the collateral should the
borrower of the securities fail financially while holding the security.
COUNTERPARTY RISK. A financial institution or other counterparty with whom the
fund does business (such as trading or securities lending), or that
underwrites, distributes or guarantees any investments or contracts that the
fund owns or is otherwise exposed to, may decline in financial health and
become unable to honor its commitments. This could cause losses for the fund or
could delay the return or delivery of collateral or other assets to the fund.
LIQUIDITY RISK. In certain situations, it may be difficult or impossible to
sell an investment in an orderly fashion at an acceptable price. This risk can
be ongoing for any security that does not trade actively or in large volumes,
for any security that trades primarily on smaller markets, and for investments
that typically trade only among a limited number of large investors (such as
certain types of derivatives or restricted securities). In unusual market
conditions, even
72
PROSPECTUS May 1, 2010 Fund Details
normally liquid securities may be affected by a degree of liquidity risk. This
may affect only certain securities or an overall securities market.
PRICING RISK. If market conditions make it difficult to value some investments,
the fund may value these investments using more subjective methods, such as
fair value pricing. In such cases, the value determined for an investment could
be different than the value realized upon such investment's sale. As a result,
you could pay more than the market value when buying fund shares or receive
less than the market value when selling fund shares.
PREPAYMENT AND EXTENSION RISK. When interest rates fall, issuers of high
interest debt obligations may pay off the debts earlier than expected
(prepayment risk), and the fund may have to reinvest the proceeds at lower
yields. When interest rates rise, issuers of lower interest debt obligations
may pay off the debts later than expected (extension risk), thus keeping the
fund's assets tied up in lower interest debt obligations. Prepayments could
also create capital gains tax liability in some instances. Any unexpected
behavior in interest rates could increase the volatility of the fund's share
price and yield and could hurt fund performance.
--------------------------------------------------------------------------------
DWS Large Cap Value VIP
PRINCIPAL INVESTMENT STRATEGY
Under normal circumstances, the fund invests at least 80% of net assets, plus
the amount of any borrowings for investment purposes, in common stocks and
other equity securities of large US companies that are similar in size to the
companies in the Russell 1000 (Reg. TM) Value Index and that portfolio
management believes are undervalued. These are typically companies that have
been sound historically, but are temporarily out of favor. The fund intends to
invest primarily in companies whose market capitalizations fall within the
normal range of the Russell 1000 (Reg. TM) Value Index. Although the fund can
invest in stocks of any economic sector (which is comprised of two or more
industries), at times it may emphasize certain sectors, even investing more
than 25% of total assets in any one sector.
The fund may invest up to 20% of total assets in foreign securities.
The fund's equity investments are mainly common stocks, but may also include
other types of equities such as preferred or convertible stocks.
MANAGEMENT PROCESS. Portfolio management begins by screening for stocks whose
price-to-earnings ratios are below the average for the S&P 500 Index. Portfolio
management then compares a company's stock price to its book value, cash flow
and yield, and analyzes individual companies to identify those that are
financially sound and appear to have strong potential for long-term growth.
Portfolio management assembles the fund's portfolio from among the most
attractive stocks, drawing on an analysis of economic outlooks for various
sectors and industries.
Portfolio management will normally sell a stock when it believes the stock's
price is unlikely to go higher, its fundamental factors have changed, other
investments offer better opportunities or in the course of adjusting its
emphasis on a given industry.
--------------------------------------------------------------------------------
DERIVATIVES. The fund may use various types of derivatives (contracts whose
value is based on, for example, indices, currencies or securities) for hedging,
risk management or non-hedging purposes to seek to enhance potential gains. The
fund may use derivatives as a substitute for direct investment in a particular
asset class or to keep cash on hand to meet shareholder redemptions or other
needs. In particular, the fund may use futures, currency options and forward
currency transactions.
SECURITIES LENDING. The fund may lend securities (up to one-third of total
assets) to approved institutions.
--------------------------------------------------------------------------------
MAIN RISKS
There are several risk factors that could hurt the fund's performance, cause
you to lose money or cause the fund's performance to trail that of other
investments.
STOCK MARKET RISK. When stock prices fall, you should expect the value of your
investment to fall as well. Stock prices can be hurt by poor management on the
part of the stock's issuer, shrinking product demand and other business risks.
These may affect single companies as well as groups of companies. In addition,
movements in financial markets may adversely affect a stock's price, regardless
of how well the company performs. To the extent the fund invests in a
particular capitalization or market sector, the fund's performance may be
proportionately affected by that segment's general performance.
SECURITY SELECTION RISK. The securities in the fund's portfolio may decline in
value. Portfolio management could be wrong in its analysis of industries,
companies, economic trends, the relative attractiveness of different securities
or other matters.
VALUE INVESTING RISK. As a category, value stocks may underperform growth
stocks (and the stock market as a whole) over any period of time. In addition,
value stocks selected for investment by portfolio management may not perform as
anticipated: stocks that appear undervalued may remain undervalued
indefinitely, or may in fact be fairly valued.
FOCUS RISK. To the extent that the fund focuses its investments in particular
industries, asset classes or sectors of the economy, any market price
movements, regulatory or technological changes, or economic conditions
affecting companies in those industries, asset classes or sectors will have a
significant impact on the fund's performance. For example, consumer goods
companies could be hurt by
73
PROSPECTUS May 1, 2010 Fund Details
a rise in unemployment or technology companies could be hurt by such factors as
market saturation, price competition and rapid obsolescence.
DERIVATIVES RISK. Risks associated with derivatives include the risk that the
derivative is not well correlated with the security, index or currency to which
it relates; the risk that derivatives may result in losses or missed
opportunities; the risk that the fund will be unable to sell the derivative
because of an illiquid secondary market; the risk that a counterparty is
unwilling or unable to meet its obligation; and the risk that the derivative
transaction could expose the fund to the effects of leverage, which could
increase the fund's exposure to the market and magnify potential losses. There
is no guarantee that derivatives, to the extent employed, will have the
intended effect, and their use could cause lower returns or even losses to the
fund. The use of derivatives by the fund to hedge risk may reduce the
opportunity for gain by offsetting the positive effect of favorable price
movements.
SECURITIES LENDING RISK. Any decline in the value of a portfolio security that
occurs while the security is out on loan is borne by the fund, and will
adversely affect performance. Also, there may be delays in recovery of
securities loaned or even a loss of rights in the collateral should the
borrower of the securities fail financially while holding the security.
FOREIGN INVESTMENT RISK. To the extent the fund invests in companies based
outside the US, it faces the risks inherent in foreign investing. Adverse
political, economic or social developments could undermine the value of the
fund's investments or prevent the fund from realizing their full value.
Financial reporting standards for companies based in foreign markets differ
from those in the US. Additionally, foreign securities markets generally are
smaller and less liquid than US markets. To the extent that the fund invests in
non-US dollar denominated foreign securities, changes in currency exchange
rates may affect the US dollar value of foreign securities or the income or
gain received on these securities. Foreign governments may restrict investment
by foreigners, limit withdrawal of trading profit or currency from the country,
restrict currency exchange or seize foreign investments. The investments of the
fund may also be subject to foreign withholding taxes. Foreign transactions and
custody of assets may involve delays in payment, delivery or recovery of money
or investments. Foreign investment risks are greater in emerging markets than
in developed markets. Emerging market investments are often considered
speculative. Emerging market countries typically have economic and political
systems that are less developed, and can be expected to be less stable than
developed markets. For example, the economies of such countries can be subject
to rapid and unpredictable rates of inflation or deflation.
COUNTERPARTY RISK. A financial institution or other counterparty with whom the
fund does business (such as trading or securities lending), or that
underwrites, distributes or guarantees any investments or contracts that the
fund owns or is otherwise exposed to, may decline in financial health and
become unable to honor its commitments. This could cause losses for the fund or
could delay the return or delivery of collateral or other assets to the fund.
LIQUIDITY RISK. In certain situations, it may be difficult or impossible to
sell an investment in an orderly fashion at an acceptable price. This risk can
be ongoing for any security that does not trade actively or in large volumes,
for any security that trades primarily on smaller markets, and for investments
that typically trade only among a limited number of large investors (such as
certain types of derivatives or restricted securities). In unusual market
conditions, even normally liquid securities may be affected by a degree of
liquidity risk. This may affect only certain securities or an overall
securities market.
PRICING RISK. If market conditions make it difficult to value some investments,
the fund may value these investments using more subjective methods, such as
fair value pricing. In such cases, the value determined for an investment could
be different than the value realized upon such investment's sale. As a result,
you could pay more than the market value when buying fund shares or receive
less than the market value when selling fund shares.
--------------------------------------------------------------------------------
DWS Mid Cap Growth VIP
PRINCIPAL INVESTMENT STRATEGY
MAIN INVESTMENTS. Under normal circumstances, the fund invests at least 80% of
its assets, plus the amount of any borrowings for investment purposes,
determined at the time of purchase, in companies with market caps within the
market capitalization range of the Russell Mid Cap Growth Index or securities
with equity characteristics that provide exposure to those companies. The
fund's equity investments are mainly common stocks, but may also include other
types of equity securities such as preferred stocks or convertible securities.
The fund may invest up to 20% of its assets in stocks and other securities of
companies based outside the US.
MANAGEMENT PROCESS. In choosing stocks, portfolio management focuses on
individual security selection rather than industry selection. Portfolio
management uses an active process that combines financial analysis with company
visits to evaluate management and strategies. Each portfolio manager has
specific sector responsibilities, with investment discretion over securities
within their sectors.
Company research lies at the heart of the investment process. Portfolio
management uses a "bottom-up" approach to picking securities, focusing on
undervalued stocks with fast-growing earnings and superior near-to-intermediate
term performance potential.
74
PROSPECTUS May 1, 2010 Fund Details
Portfolio management emphasizes individual selection of medium-sized stocks
across all economic sectors, early in their growth cycles and with the
potential to be the blue chips of the future. Portfolio management generally
seeks companies with a leading or dominant position in their niche markets, a
high rate of return on invested capital and the ability to finance a major part
of future growth from internal sources.
Portfolio management follows a disciplined selling process that is designed to
lessen risk, and will normally sell a stock when its price reaches their
expectations, there is a material change in the company's fundamentals, other
investments offer better opportunities or the market capitalization of a stock
is distorting the weighted average market capitalization of the fund.
--------------------------------------------------------------------------------
DERIVATIVES. The fund may use various types of derivatives (contracts whose
value is based on, for example, indices, currencies or securities) for hedging,
risk management or non-hedging purposes to seek to enhance potential gains. The
fund may use derivatives as a substitute for direct investment in a particular
asset class or to keep cash on hand to meet shareholder redemptions or other
needs. In particular, the fund may use futures and options, and write covered
call options.
SECURITIES LENDING. The fund may lend securities (up to one-third of total
assets) to approved institutions.
--------------------------------------------------------------------------------
MAIN RISKS
There are several risk factors that could hurt the fund's performance, cause
you to lose money or cause the fund's performance to trail that of other
investments.
STOCK MARKET RISK. When stock prices fall, you should expect the value of your
investment to fall as well. Stock prices can be hurt by poor management on the
part of the stock's issuer, shrinking product demand and other business risks.
These may affect single companies as well as groups of companies. In addition,
movements in financial markets may adversely affect a stock's price, regardless
of how well the company performs.
MEDIUM-SIZED COMPANY RISK. Medium-sized company stocks tend to be more volatile
than large company stocks. Medium-sized companies are less widely followed by
stock analysts and less information about them is available to investors.
Industry-wide reversals may have a greater impact on medium-sized companies,
since they lack the financial resources of larger companies. Medium-sized
company stocks are typically less liquid than large company stocks.
GROWTH INVESTING RISK. As a category, growth stocks may underperform value
stocks (and the stock market as a whole) over any period of time. Because the
prices of growth stocks are based largely on the expectation of future
earnings, growth stock prices can decline rapidly and significantly in reaction
to negative news about such factors as earnings, the economy, political
developments, or other news. A growth company may fail to fulfill apparent
promise or may be eclipsed by competitors or its products or services rendered
obsolete by new technologies. Growth stocks also typically lack the dividends
associated with value stocks that might otherwise cushion investors from the
effects of declining stock prices. In addition, growth stocks selected for
investment by portfolio management may not perform as anticipated.
SECURITY SELECTION RISK. The securities in the fund's portfolio may decline in
value. Portfolio management could be wrong in its analysis of industries,
companies, economic trends, the relative attractiveness of different securities
or other matters.
FOREIGN INVESTMENT RISK. To the extent the fund invests in companies based
outside the US, it faces the risks inherent in foreign investing. Adverse
political, economic or social developments could undermine the value of the
fund's investments or prevent the fund from realizing their full value.
Financial reporting standards for companies based in foreign markets differ
from those in the US. Additionally, foreign securities markets generally are
smaller and less liquid than US markets. To the extent that the fund invests in
non-US dollar denominated foreign securities, changes in currency exchange
rates may affect the US dollar value of foreign securities or the income or
gain received on these securities. Foreign governments may restrict investment
by foreigners, limit withdrawal of trading profit or currency from the country,
restrict currency exchange or seize foreign investments. The investments of the
fund may also be subject to foreign withholding taxes. Foreign transactions and
custody of assets may involve delays in payment, delivery or recovery of money
or investments. Foreign investment risks are greater in emerging markets than
in developed markets. Emerging market investments are often considered
speculative. Emerging market countries typically have economic and political
systems that are less developed, and can be expected to be less stable than
developed markets. For example, the economies of such countries can be subject
to rapid and unpredictable rates of inflation or deflation.
SECURITIES LENDING RISK. Any decline in the value of a portfolio security that
occurs while the security is out on loan is borne by the fund, and will
adversely affect performance. Also, there may be delays in recovery of
securities loaned or even a loss of rights in the collateral should the
borrower of the securities fail financially while holding the security.
DERIVATIVES RISK. Risks associated with derivatives include the risk that the
derivative is not well correlated with the security, index or currency to which
it relates; the risk that derivatives may result in losses or missed
opportunities; the risk that the fund will be unable to sell the derivative
because of an illiquid secondary market; the risk that a counterparty is
unwilling or unable to meet its obligation; and the risk that the derivative
transaction could expose the fund to the effects of leverage, which could
increase
75
PROSPECTUS May 1, 2010 Fund Details
the fund's exposure to the market and magnify potential losses. There is no
guarantee that derivatives, to the extent employed, will have the intended
effect, and their use could cause lower returns or even losses to the fund. The
use of derivatives by the fund to hedge risk may reduce the opportunity for
gain by offsetting the positive effect of favorable price movements.
COUNTERPARTY RISK. A financial institution or other counterparty with whom the
fund does business (such as trading or securities lending), or that
underwrites, distributes or guarantees any investments or contracts that the
fund owns or is otherwise exposed to, may decline in financial health and
become unable to honor its commitments. This could cause losses for the fund or
could delay the return or delivery of collateral or other assets to the fund.
LIQUIDITY RISK. In certain situations, it may be difficult or impossible to
sell an investment in an orderly fashion at an acceptable price. This risk can
be ongoing for any security that does not trade actively or in large volumes,
for any security that trades primarily on smaller markets, and for investments
that typically trade only among a limited number of large investors (such as
certain types of derivatives or restricted securities). In unusual market
conditions, even normally liquid securities may be affected by a degree of
liquidity risk. This may affect only certain securities or an overall
securities market.
PRICING RISK. If market conditions make it difficult to value some investments,
the fund may value these investments using more subjective methods, such as
fair value pricing. In such cases, the value determined for an investment could
be different than the value realized upon such investment's sale. As a result,
you could pay more than the market value when buying fund shares or receive
less than the market value when selling fund shares.
--------------------------------------------------------------------------------
DWS Money Market VIP
PRINCIPAL INVESTMENT STRATEGY
MAIN INVESTMENTS. The fund is managed in accordance with Rule 2a-7 under the
Investment Company Act of 1940, as amended. Fund securities are denominated in
US dollars and have remaining maturities of 397 days (about 13 months) or less
at the time of purchase. The fund may also invest in securities that have
features that have the effect of reducing their maturities to 397 days or less
at the time of purchase. The fund maintains a dollar-weighted average maturity
of 90 days or less.
Although the fund seeks to maintain a stable $1.00 share price, you could lose
money by investing in the fund. All money market instruments can change in
value when interest rates or an issuer's creditworthiness change.
The fund invests in high quality, short-term, US dollar denominated money
market instruments paying a fixed, variable or floating interest rate. These
include:
o Debt obligations issued by US and foreign banks, financial institutions,
corporations or other entities, including certificates of deposit,
euro-time deposits, commercial paper (including asset-backed commercial
paper), notes, funding agreements and US government securities. Securities
that do not satisfy the maturity restrictions for a money market fund may
be specifically structured so that they are eligible investments for money
market funds. For example, some securities have features which have the
effect of shortening the security's maturity.
o US government securities that are issued or guaranteed by the US Treasury,
or by agencies or instrumentalities of the US government.
o Repurchase agreements, which are agreements to buy securities at one price,
with a simultaneous agreement to sell back the securities at a future date
at an agreed-upon price.
o Asset-backed securities, which are generally participations in a pool of
assets whose payment is derived from the payments generated by the
underlying assets. Payments on the asset-backed security generally consist
of interest and/or principal.
The fund will invest more than 25% of total assets in the obligations of banks
and other financial institutions that satisfy the fund's eligibility
requirements.
MANAGEMENT PROCESS. The fund pursues its objective by investing in high
quality, short-term securities, as well as repurchase agreements that are
backed by high-quality securities.
The fund buys US government debt obligations, money market instruments and
other debt obligations that at the time of purchase:
o have received one of the two highest short-term ratings from two nationally
recognized statistical rating organizations (NRSROs) or one NRSRO if that
NRSRO is the only NRSRO that rates such obligations;
o are unrated, but are deemed by the Advisor to be of comparable quality to
one of the two highest short-term ratings; or
o have no short-term rating, but are rated in one of the top three highest
long-term rating categories by a NRSRO or are deemed by the Advisor to be
of comparable quality.
Working in consultation with portfolio management, a credit team screens
potential securities and develops a list of those that the fund may buy.
Portfolio management, looking for attractive yield and weighing considerations
such as credit quality, economic outlooks and possible interest rate movements,
then decides which securities on this list to buy. Portfolio management may
adjust the fund's exposure to interest rate risk, typically seeking to take
advantage of possible rises in interest rates and to preserve yield when
interest rates appear likely to fall.
76
PROSPECTUS May 1, 2010 Fund Details
MAIN RISKS
There are several risk factors that could reduce the yield you get from the
fund, cause the fund's performance to trail that of other investments, or cause
you to lose money.
MONEY MARKET FUND RISK. An investment in the fund is not insured or guaranteed
by the FDIC or any other government agency. Although the fund seeks to preserve
the value of your investment at $1.00 per share, this share price isn't
guaranteed, and if it falls below $1.00 you would lose money. The Advisor is
not obligated to take any action to maintain the $1.00 share price. The share
price could fall below $1.00 as a result of the actions of one or more large
investors in the fund. The credit quality of the fund's holdings can change
rapidly in certain markets, and the default of a single holding could cause the
fund's share price to fall below $1.00, as could periods of high redemption
pressures and/or illiquid markets. The actions of a few large investors in the
fund may have a significant adverse effect on the share price of the fund.
INTEREST RATE RISK. Rising interest rates could cause the value of the fund's
investments - and therefore its share price as well - to decline. Conversely,
any decline in interest rates is likely to cause the fund's yield to decline,
and during periods of unusually low interest rates, the fund's yield may
approach zero. Over time, the total return of a money market fund may not keep
pace with inflation, which would result in a net loss of purchasing power for
long-term investors.
CREDIT RISK. The fund's performance could be hurt if a money market instrument
declines in credit quality or goes into default, or if an issuer does not make
timely payments of interest or principal. For money market instruments that
rely on third-party guarantors to support their credit quality, the same risks
may apply if the financial condition of the guarantor deteriorates or the
guarantor ceases insuring money market instruments. Because guarantors may
insure many types of debt obligations, including subprime mortgage bonds and
other high-risk bonds, their financial condition could deteriorate as a result
of events that have little or no connection to securities owned by the fund.
Some securities issued by US government agencies or instrumentalities are
backed by the full faith and credit of the US government. Others are supported
only by the credit of that agency or instrumentality. For this latter group, if
there is a potential or actual loss of principal and interest of these
securities, the US government might provide financial support, but has no
obligation to do so.
SECURITY SELECTION RISK. Although short-term securities are relatively stable
investments, it is possible that the securities in which the fund invests will
not perform as expected. This could cause the fund's returns to lag behind
those of similar money market mutual funds and could result in a decline in
share price.
REPURCHASE AGREEMENT RISK. If the party that sells the securities to the fund
defaults on its obligation to repurchase them at the agreed-upon time and
price, the fund could lose money.
COUNTERPARTY RISK. A financial institution or other counterparty with whom the
fund does business (such as trading or securities lending), or that
underwrites, distributes or guarantees any investments or contracts that the
fund owns or is otherwise exposed to, may decline in financial health and
become unable to honor its commitments. This could cause losses for the fund or
could delay the return or delivery of collateral or other assets to the fund.
CONCENTRATION RISK. Any fund that concentrates in a particular segment of the
market will generally be more volatile than a fund that invests more broadly.
Any market price movements, regulatory or technological changes, or economic
conditions affecting banks or financial institutions will have a significant
impact on the fund's performance. In particular, banks and other financial
institutions are highly dependent on short-term interest rates and can be
adversely affected by downturns in the US and foreign economies or changes in
banking regulations.
PREPAYMENT AND EXTENSION RISK. When interest rates fall, issuers of high
interest debt obligations may pay off the debts earlier than expected
(prepayment risk), and the fund may have to reinvest the proceeds at lower
yields. When interest rates rise, issuers of lower interest debt obligations
may pay off the debts later than expected (extension risk), thus keeping the
fund's assets tied up in lower interest debt obligations. Prepayments could
also create capital gains tax liability in some instances. Any unexpected
behavior in interest rates could increase the volatility of the fund's yield
and could hurt fund performance.
FOREIGN INVESTMENT RISK. To the extent that the fund invests in money market
instruments of foreign issuers that are denominated in US dollars, it faces
some of the risks of foreign investing, such as unfavorable political and legal
developments, limited financial information, regulatory risk and economic and
financial instability.
--------------------------------------------------------------------------------
DWS Small Cap Growth VIP
PRINCIPAL INVESTMENT STRATEGY
MAIN INVESTMENTS. Under normal circumstances, the fund invests at least 80% of
net assets, plus the amount of any borrowings for investment purposes, in small
capitalization stocks similar in size to those comprising the Russell 2000
(Reg. TM) Growth Index. The fund intends to invest primarily in companies whose
market capitalizations fall within the normal range of the Index. The fund may
invest in initial public offerings. The fund may also invest in other types of
equity securities such as preferred stocks or convertible securities. While the
fund invests mainly in US stocks, it could invest up to 25% of total assets in
foreign securities.
77
PROSPECTUS May 1, 2010 Fund Details
MANAGEMENT PROCESS. In choosing stocks, portfolio management focuses on
individual security selection rather than industry selection. Portfolio
management uses an active process that combines financial analysis with company
visits to evaluate management and strategies. Each portfolio manager has
specific sector responsibilities, with investment discretion over securities
within their sectors.
Company research lies at the heart of the investment process. Portfolio
management uses a "bottom-up" approach to picking securities, focusing on
stocks with superior growth prospects and above average near-to-intermediate
term performance potential.
Portfolio management emphasizes individual selection of small company stocks
across all economic sectors, early in their growth cycles and with the
potential to be the blue chips of the future. Portfolio management generally
seeks companies with a leading or dominant position in their niche markets, a
high rate of return on invested capital and the ability to finance a major part
of future growth from internal sources. Portfolio management also looks for
estimated above-average growth in revenues and earnings and a balance sheet
that can support this growth potential with sufficient working capital and
manageable levels of debt.
Portfolio management follows a disciplined selling process that is designed to
lessen risk, and will normally sell a stock when its price reaches their
expectations, there is a material change in the company's fundamentals, other
investments offer better opportunities or the market capitalization of a stock
is distorting the weighted average market capitalization of the fund.
--------------------------------------------------------------------------------
DERIVATIVES. The fund may use various types of derivatives (contracts whose
value is based on, for example, indices, currencies or securities) for hedging,
risk management or non-hedging purposes to seek to enhance potential gains. The
fund may use derivatives as a substitute for direct investment in a particular
asset class or to keep cash on hand to meet shareholder redemptions or other
needs. In particular, the fund may use futures and options, and write covered
call options.
SECURITIES LENDING. The fund may lend securities (up to one-third of total
assets) to approved institutions.
--------------------------------------------------------------------------------
MAIN RISKS
There are several risk factors that could hurt the fund's performance, cause
you to lose money or cause the fund's performance to trail that of other
investments.
STOCK MARKET RISK. When stock prices fall, you should expect the value of your
investment to fall as well. Stock prices can be hurt by poor management on the
part of the stock's issuer, shrinking product demand and other business risks.
These may affect single companies as well as groups of companies. In addition,
movements in financial markets may adversely affect a stock's price, regardless
of how well the company performs.
SMALL COMPANY RISK. Small company stocks tend to be more volatile than large
company stocks. Small companies are less widely followed by stock analysts and
less information about them is available to investors. Industry-wide reversals
may have a greater impact on small companies, since they lack the financial
resources of larger companies. Small company stocks are typically less liquid
than large company stocks.
GROWTH INVESTING RISK. As a category, growth stocks may underperform value
stocks (and the stock market as a whole) over any period of time. Because the
prices of growth stocks are based largely on the expectation of future
earnings, growth stock prices can decline rapidly and significantly in reaction
to negative news about such factors as earnings, the economy, political
developments, or other news. A growth company may fail to fulfill apparent
promise or may be eclipsed by competitors or its products or services rendered
obsolete by new technologies. Growth stocks also typically lack the dividends
associated with value stocks that might otherwise cushion investors from the
effects of declining stock prices. In addition, growth stocks selected for
investment by portfolio management may not perform as anticipated.
SECURITY SELECTION RISK. The securities in the fund's portfolio may decline in
value. Portfolio management could be wrong in its analysis of industries,
companies, economic trends, the relative attractiveness of different securities
or other matters.
FOREIGN INVESTMENT RISK. To the extent the fund invests in companies based
outside the US, it faces the risks inherent in foreign investing. Adverse
political, economic or social developments could undermine the value of the
fund's investments or prevent the fund from realizing their full value.
Financial reporting standards for companies based in foreign markets differ
from those in the US. Additionally, foreign securities markets generally are
smaller and less liquid than US markets. To the extent that the fund invests in
non-US dollar denominated foreign securities, changes in currency exchange
rates may affect the US dollar value of foreign securities or the income or
gain received on these securities. Foreign governments may restrict investment
by foreigners, limit withdrawal of trading profit or currency from the country,
restrict currency exchange or seize foreign investments. The investments of the
fund may also be subject to foreign withholding taxes. Foreign transactions and
custody of assets may involve delays in payment, delivery or recovery of money
or investments. Foreign investment risks are greater in emerging markets than
in developed markets. Emerging market investments are often considered
speculative. Emerging market countries typically have economic and political
systems that are less developed, and can be expected to be less stable than
developed markets. For example, the economies of such countries can be subject
to rapid and unpredictable rates of inflation or deflation.
78
PROSPECTUS May 1, 2010 Fund Details
DERIVATIVES RISK. Risks associated with derivatives include the risk that the
derivative is not well correlated with the security, index or currency to which
it relates; the risk that derivatives may result in losses or missed
opportunities; the risk that the fund will be unable to sell the derivative
because of an illiquid secondary market; the risk that a counterparty is
unwilling or unable to meet its obligation; and the risk that the derivative
transaction could expose the fund to the effects of leverage, which could
increase the fund's exposure to the market and magnify potential losses. There
is no guarantee that derivatives, to the extent employed, will have the
intended effect, and their use could cause lower returns or even losses to the
fund. The use of derivatives by the fund to hedge risk may reduce the
opportunity for gain by offsetting the positive effect of favorable price
movements.
SECURITIES LENDING RISK. Any decline in the value of a portfolio security that
occurs while the security is out on loan is borne by the fund, and will
adversely affect performance. Also, there may be delays in recovery of
securities loaned or even a loss of rights in the collateral should the
borrower of the securities fail financially while holding the security.
COUNTERPARTY RISK. A financial institution or other counterparty with whom the
fund does business (such as trading or securities lending), or that
underwrites, distributes or guarantees any investments or contracts that the
fund owns or is otherwise exposed to, may decline in financial health and
become unable to honor its commitments. This could cause losses for the fund or
could delay the return or delivery of collateral or other assets to the fund.
IPO RISK. Prices of securities bought in an initial public offering (IPO) may
rise and fall rapidly, often because of investor perceptions rather than
economic reasons. IPOs can have more impact on the performance of a small
mutual fund because the number of IPO shares the fund is able to buy may
represent a significant portion of its overall portfolio compared to the
portfolio of a larger fund.
LIQUIDITY RISK. In certain situations, it may be difficult or impossible to
sell an investment in an orderly fashion at an acceptable price. This risk can
be ongoing for any security that does not trade actively or in large volumes,
for any security that trades primarily on smaller markets, and for investments
that typically trade only among a limited number of large investors (such as
certain types of derivatives or restricted securities). In unusual market
conditions, even normally liquid securities may be affected by a degree of
liquidity risk. This may affect only certain securities or an overall
securities market.
PRICING RISK. If market conditions make it difficult to value some investments,
the fund may value these investments using more subjective methods, such as
fair value pricing. In such cases, the value determined for an investment could
be different than the value realized upon such investment's sale. As a result,
you could pay more than the market value when buying fund shares or receive
less than the market value when selling fund shares.
--------------------------------------------------------------------------------
DWS Strategic Income VIP
PRINCIPAL INVESTMENT STRATEGY
MAIN INVESTMENTS. Under normal circumstances, the fund invests mainly in bonds
issued by both US and foreign corporations and governments. The credit quality
of the fund's investments may vary; the fund may invest up to 100% of total
assets in either investment-grade bonds or in junk bonds, which are those below
the fourth highest credit rating category (that is, grade BB/Ba and below). The
fund may invest up to 50% of total assets in foreign bonds. The fund may also
invest in emerging markets securities and dividend-paying common stocks.
MANAGEMENT PROCESS. In deciding which types of securities to buy and sell,
portfolio management typically weighs a number of factors against each other,
from economic outlooks and possible interest rate movements to changes in
supply and demand within the bond market. In choosing individual bonds,
portfolio management considers how they are structured and uses independent
analysis of issuers' creditworthiness.
Portfolio management may shift the allocations of the fund's holdings, favoring
different types of securities at different times, while still maintaining
variety in terms of the companies and industries represented in the fund's
holdings.
IGAP STRATEGY. In addition to the fund's main investment strategy, portfolio
management seeks to enhance returns by employing a proprietary overlay strategy
called iGAP (integrated Global Alpha Platform), which attempts to take
advantage of mispricings within global equity, bond and currency markets. The
iGAP strategy uses derivatives (contracts whose value is based on, for example,
indices, currencies or securities), in particular exchange-traded futures
contracts on global equities and bonds and over-the-counter forward currency
contracts.
The fund may invest in affiliated mutual funds. The fund may invest up to 5% of
net assets in shares of DWS Floating Rate Plus Fund, which invests primarily in
adjustable rate loans that have a senior right to payment and also uses the
iGAP strategy.
--------------------------------------------------------------------------------
DERIVATIVES. The fund also may use various types of derivatives outside of the
iGAP strategy, such as futures contracts, forward currency contracts, interest
rate swaps, total return swaps and credit default swaps. It may use these for
hedging, risk management or non-hedging purposes to seek to enhance potential
gains. The fund may use derivatives as a substitute for direct investment in a
particular asset class or to keep cash on hand to
79
PROSPECTUS May 1, 2010 Fund Details
meet shareholder redemptions or other needs. In particular, the fund may use
interest rate and total rate of return swaps, currency options, forward
currency contracts and credit default swaps.
SECURITIES LENDING. The fund may lend securities (up to one-third of total
assets) to approved institutions.
--------------------------------------------------------------------------------
MAIN RISKS
There are several risk factors that could hurt the fund's performance, cause
you to lose money or cause the fund's performance to trail that of other
investments.
INTEREST RATE RISK. When interest rates rise, prices of debt securities
generally decline. The longer the duration of the fund's debt securities, the
more sensitive it will be to interest rate changes. (As a general rule, a 1%
rise in interest rates means a 1% fall in value for every year of duration.)
CREDIT RISK. A fund purchasing debt securities faces the risk that the
creditworthiness of an issuer may decline, causing the value of the debt
securities to decline. In addition, an issuer may not be able to make timely
payments on the interest and/or principal on the debt security it has issued.
Because the issuers of high-yield debt securities or junk bonds (debt
securities rated below the fourth highest category) may be in uncertain
financial health, the prices of their debt securities can be more vulnerable to
bad economic news or even the expectation of bad news, than investment-grade
debt securities. In some cases, debt securities, particularly high-yield debt
securities, may decline in credit quality or go into default. Because the fund
may invest in securities not paying current interest or in securities already
in default, these risks may be more pronounced.
IGAP RISK. The success of the iGAP strategy depends, in part, on portfolio
management's ability to analyze the correlation between various global markets
and asset classes. If portfolio management's correlation analysis proves to be
incorrect, losses to the fund may be significant and may substantially exceed
the intended level of market exposure for the iGAP strategy.
DERIVATIVES RISK. Risks associated with derivatives include the risk that the
derivative is not well correlated with the security, index or currency to which
it relates; the risk that derivatives may result in losses or missed
opportunities; the risk that the fund will be unable to sell the derivative
because of an illiquid secondary market; the risk that a counterparty is
unwilling or unable to meet its obligation; and the risk that the derivative
transaction could expose the fund to the effects of leverage, which could
increase the fund's exposure to the market and magnify potential losses. There
is no guarantee that derivatives, to the extent employed, will have the
intended effect, and their use could cause lower returns or even losses to the
fund. The use of derivatives by the fund to hedge risk may reduce the
opportunity for gain by offsetting the positive effect of favorable price
movements.
FOREIGN INVESTMENT RISK. To the extent the fund invests in companies based
outside the US, it faces the risks inherent in foreign investing. Adverse
political, economic or social developments could undermine the value of the
fund's investments or prevent the fund from realizing their full value.
Financial reporting standards for companies based in foreign markets differ
from those in the US. Additionally, foreign securities markets generally are
smaller and less liquid than US markets. To the extent that the fund invests in
non-US dollar denominated foreign securities, changes in currency exchange
rates may affect the US dollar value of foreign securities or the income or
gain received on these securities. Foreign governments may restrict investment
by foreigners, limit withdrawal of trading profit or currency from the country,
restrict currency exchange or seize foreign investments. The investments of the
fund may also be subject to foreign withholding taxes. Foreign transactions and
custody of assets may involve delays in payment, delivery or recovery of money
or investments. Foreign investment risks are greater in emerging markets than
in developed markets. Emerging market investments are often considered
speculative. Emerging market countries typically have economic and political
systems that are less developed, and can be expected to be less stable than
developed markets. For example, the economies of such countries can be subject
to rapid and unpredictable rates of inflation or deflation.
SECURITY SELECTION RISK. The securities in the fund's portfolio may decline in
value. Portfolio management could be wrong in its analysis of industries,
companies, economic trends, the relative attractiveness of different securities
or other matters.
SECURITIES LENDING RISK. Any decline in the value of a portfolio security that
occurs while the security is out on loan is borne by the fund, and will
adversely affect performance. Also, there may be delays in recovery of
securities loaned or even a loss of rights in the collateral should the
borrower of the securities fail financially while holding the security.
COUNTERPARTY RISK. A financial institution or other counterparty with whom the
fund does business (such as trading or securities lending), or that
underwrites, distributes or guarantees any investments or contracts that the
fund owns or is otherwise exposed to, may decline in financial health and
become unable to honor its commitments. This could cause losses for the fund or
could delay the return or delivery of collateral or other assets to the fund.
LIQUIDITY RISK. In certain situations, it may be difficult or impossible to
sell an investment in an orderly fashion at an acceptable price. This risk can
be ongoing for any security that does not trade actively or in large volumes,
for any security that trades primarily on smaller markets, and for
80
PROSPECTUS May 1, 2010 Fund Details
investments that typically trade only among a limited number of large investors
(such as certain types of derivatives or restricted securities). In unusual
market conditions, even normally liquid securities may be affected by a degree
of liquidity risk. This may affect only certain securities or an overall
securities market.
PREPAYMENT AND EXTENSION RISK. When interest rates fall, issuers of high
interest debt obligations may pay off the debts earlier than expected
(prepayment risk), and the fund may have to reinvest the proceeds at lower
yields. When interest rates rise, issuers of lower interest debt obligations
may pay off the debts later than expected (extension risk), thus keeping the
fund's assets tied up in lower interest debt obligations. Prepayments could
also create capital gains tax liability in some instances. Any unexpected
behavior in interest rates could increase the volatility of the fund's share
price and yield and could hurt fund performance.
PRICING RISK. If market conditions make it difficult to value some investments,
the fund may value these investments using more subjective methods, such as
fair value pricing. In such cases, the value determined for an investment could
be different than the value realized upon such investment's sale. As a result,
you could pay more than the market value when buying fund shares or receive
less than the market value when selling fund shares.
--------------------------------------------------------------------------------
DWS Strategic Value VIP
PRINCIPAL INVESTMENT STRATEGY
Under normal circumstances, the fund invests at least 80% of net assets, plus
the amount of any borrowings for investment purposes, in equity securities
(mainly common stocks). The fund focuses on stocks of large US companies that
are similar in size to the companies in the S&P 500 Index and that portfolio
management believes are undervalued. The fund intends to invest primarily in
companies whose market capitalizations fall within the normal range of the S&P
500 Index. Although the fund can invest in stocks of any economic sector (which
is comprised of two or more industries), at times it may emphasize one or more
sectors and may invest more than 25% of total assets in a single sector.
The fund may invest up to 20% of net assets in foreign securities, including US
dollar-denominated American Depository Receipts.
The fund's equity investments are mainly common stocks, but may also include
other types of equities such as preferred or convertible stocks. Portfolio
management seeks to invest in a diversified portfolio normally consisting of
approximately 60-80 stocks.
MANAGEMENT PROCESS. Portfolio management begins by comparing a company's stock
price to its book value, cash flow, earnings and sales and analyzing individual
companies to identify those that are financially sound and appear to have
strong potential for long-term growth and income.
Portfolio management assembles the fund's portfolio from among the most
attractive stocks, drawing on an analysis of economic outlooks for various
sectors and industries.
Portfolio management employs a disciplined sell strategy and will normally sell
a stock when it reaches a target price, its fundamental factors have changed or
when other investments offer better opportunities.
--------------------------------------------------------------------------------
DERIVATIVES. The fund may use various types of derivatives (contracts whose
value is based on, for example, indices, currencies or securities) for hedging,
risk management or non-hedging purposes to seek to enhance potential gains. The
fund may use derivatives as a substitute for direct investment in a particular
asset class or to keep cash on hand to meet shareholder redemptions or other
needs. In particular, the fund may use futures, currency options and forward
currency transactions.
SECURITIES LENDING. The fund may lend securities (up to one-third of total
assets) to approved institutions.
--------------------------------------------------------------------------------
MAIN RISKS
There are several risk factors that could hurt the fund's performance, cause
you to lose money or cause the fund's performance to trail that of other
investments.
STOCK MARKET RISK. When stock prices fall, you should expect the value of your
investment to fall as well. Stock prices can be hurt by poor management on the
part of the stock's issuer, shrinking product demand and other business risks.
These may affect single companies as well as groups of companies. In addition,
movements in financial markets may adversely affect a stock's price, regardless
of how well the company performs. To the extent the fund invests in a
particular capitalization or market sector, the fund's performance may be
proportionately affected by that segment's general performance.
SECURITY SELECTION RISK. The securities in the fund's portfolio may decline in
value. Portfolio management could be wrong in its analysis of industries,
companies, economic trends, the relative attractiveness of different securities
or other matters.
VALUE INVESTING RISK. As a category, value stocks may underperform growth
stocks (and the stock market as a whole) over any period of time. In addition,
value stocks selected for investment by portfolio management may not perform as
anticipated: stocks that appear undervalued may remain undervalued
indefinitely, or may in fact be fairly valued.
FOCUS RISK. To the extent that the fund focuses its investments in particular
industries, asset classes or sectors of the economy, any market price
movements, regulatory or technological changes, or economic conditions
affecting companies in those industries, asset classes or sectors will have a
significant impact on the fund's performance. For example, consumer goods
companies could be hurt by
81
PROSPECTUS May 1, 2010 Fund Details
a rise in unemployment or technology companies could be hurt by such factors as
market saturation, price competition and rapid obsolescence.
DERIVATIVES RISK. Risks associated with derivatives include the risk that the
derivative is not well correlated with the security, index or currency to which
it relates; the risk that derivatives may result in losses or missed
opportunities; the risk that the fund will be unable to sell the derivative
because of an illiquid secondary market; the risk that a counterparty is
unwilling or unable to meet its obligation; and the risk that the derivative
transaction could expose the fund to the effects of leverage, which could
increase the fund's exposure to the market and magnify potential losses. There
is no guarantee that derivatives, to the extent employed, will have the
intended effect, and their use could cause lower returns or even losses to the
fund. The use of derivatives by the fund to hedge risk may reduce the
opportunity for gain by offsetting the positive effect of favorable price
movements.
SECURITIES LENDING RISK. Any decline in the value of a portfolio security that
occurs while the security is out on loan is borne by the fund, and will
adversely affect performance. Also, there may be delays in recovery of
securities loaned or even a loss of rights in the collateral should the
borrower of the securities fail financially while holding the security.
FOREIGN INVESTMENT RISK. To the extent the fund invests in companies based
outside the US, it faces the risks inherent in foreign investing. Adverse
political, economic or social developments could undermine the value of the
fund's investments or prevent the fund from realizing their full value.
Financial reporting standards for companies based in foreign markets differ
from those in the US. Additionally, foreign securities markets generally are
smaller and less liquid than US markets. To the extent that the fund invests in
non-US dollar denominated foreign securities, changes in currency exchange
rates may affect the US dollar value of foreign securities or the income or
gain received on these securities. Foreign governments may restrict investment
by foreigners, limit withdrawal of trading profit or currency from the country,
restrict currency exchange or seize foreign investments. The investments of the
fund may also be subject to foreign withholding taxes. Foreign transactions and
custody of assets may involve delays in payment, delivery or recovery of money
or investments. Foreign investment risks are greater in emerging markets than
in developed markets. Emerging market investments are often considered
speculative. Emerging market countries typically have economic and political
systems that are less developed, and can be expected to be less stable than
developed markets. For example, the economies of such countries can be subject
to rapid and unpredictable rates of inflation or deflation.
COUNTERPARTY RISK. A financial institution or other counterparty with whom the
fund does business (such as trading or securities lending), or that
underwrites, distributes or guarantees any investments or contracts that the
fund owns or is otherwise exposed to, may decline in financial health and
become unable to honor its commitments. This could cause losses for the fund or
could delay the return or delivery of collateral or other assets to the fund.
LIQUIDITY RISK. In certain situations, it may be difficult or impossible to
sell an investment in an orderly fashion at an acceptable price. This risk can
be ongoing for any security that does not trade actively or in large volumes,
for any security that trades primarily on smaller markets, and for investments
that typically trade only among a limited number of large investors (such as
certain types of derivatives or restricted securities). In unusual market
conditions, even normally liquid securities may be affected by a degree of
liquidity risk. This may affect only certain securities or an overall
securities market.
PRICING RISK. If market conditions make it difficult to value some investments,
the fund may value these investments using more subjective methods, such as
fair value pricing. In such cases, the value determined for an investment could
be different than the value realized upon such investment's sale. As a result,
you could pay more than the market value when buying fund shares or receive
less than the market value when selling fund shares.
--------------------------------------------------------------------------------
DWS Technology VIP
PRINCIPAL INVESTMENT STRATEGY
MAIN INVESTMENTS. Under normal circumstances, the fund invests at least 80% of
net assets, plus the amount of any borrowings for investment purposes, in
common stocks of companies in the technology sector. For purposes of the fund's
80% investment policy, the fund defines a company as being in the technology
sector if it commits at least half its assets to, or derives at least half its
revenues or net income from, that sector. Examples of industries within the
technology sector are semiconductors, software, telecom equipment,
computer/hardware, IT services, the Internet and health technology. The fund
may invest in companies of any size and may invest in initial public offerings.
While the fund invests mainly in US stocks, it could invest up to 35% of net
assets in foreign securities (including emerging markets securities).
The fund's equity investments are mainly common stocks, but may also include
other types of equities such as preferred stocks or convertible securities.
MANAGEMENT PROCESS. In choosing securities, portfolio management uses a
combination of three analytical disciplines:
82
PROSPECTUS May 1, 2010 Fund Details
BOTTOM-UP RESEARCH. Portfolio management looks for individual companies with a
history of above-average growth, strong competitive positioning, attractive
prices relative to potential growth, innovative products and services, sound
financial strength and effective management, among other factors.
GROWTH ORIENTATION. Portfolio management generally looks for companies that
they believe have above-average potential for sustainable growth of revenue or
earnings and whose market value appears reasonable in light of their business
prospects.
TOP-DOWN ANALYSIS. Portfolio management considers the economic outlooks for
various industries within the technology sector and looks for those that may
benefit from changes in the overall business environment.
In addition, portfolio management uses quantitative analytic tools to attempt
to manage the price volatility of the fund as compared to appropriate
benchmarks and peer groups. Portfolio management may favor securities from
various industries and companies within the technology sector at different
times.
Portfolio management will normally sell a stock when they believe its price is
unlikely to go higher, its fundamentals have changed, other investments offer
better opportunities, or in adjusting their emphasis on a given technology
industry.
--------------------------------------------------------------------------------
DERIVATIVES. The fund may use various types of derivatives for hedging, risk
management or non-hedging purposes to seek to enhance potential gains. The fund
may use derivatives as a substitute for direct investment in a particular asset
class or to keep cash on hand to meet shareholder redemptions or other needs.
In particular, portfolio management may use futures and options, including
sales of covered put and call options.
SECURITIES LENDING. The fund may lend securities (up to one-third of total
assets) to approved institutions.
--------------------------------------------------------------------------------
MAIN RISKS
There are several risk factors that could reduce the yield you get from the
fund, cause the fund's performance to trail that of other investments, or cause
you to lose money.
STOCK MARKET RISK. To the extent the fund invests in a particular sector, the
fund's performance may be proportionately affected by that sector's general
performance. When stock prices fall, you should expect the value of your
investment to fall as well. Stock prices can be hurt by poor management on the
part of the stock's issuer, shrinking product demand and other business risks.
These may affect single companies as well as groups of companies. In addition,
movements in financial markets may adversely affect a stock's price, regardless
of how well the company performs. The market as a whole may not favor the types
of investments the fund makes, which could affect the fund's ability to sell
them at an attractive price.
CONCENTRATION RISK - TECHNOLOGY COMPANIES. Any fund that concentrates in a
particular segment of the market will generally be more volatile than a fund
that invests more broadly. Any market price movements, regulatory or
technological changes, or economic conditions affecting technology companies
will have a significant impact on the fund's performance. In particular,
technology companies are vulnerable to market saturation and rapid product
obsolescence. Many technology companies are smaller companies that may have
limited business lines and limited financial resources, making them highly
vulnerable to business and economic risks.
SMALL COMPANY RISK. Small company stocks tend to be more volatile than large
company stocks. Small companies are less widely followed by stock analysts and
less information about them is available to investors. Industry-wide reversals
may have a greater impact on small companies, since they lack the financial
resources of larger companies. Small company stocks are typically less liquid
than large company stocks.
FOREIGN INVESTMENT RISK. To the extent the fund invests in companies based
outside the US, it faces the risks inherent in foreign investing. Adverse
political, economic or social developments could undermine the value of the
fund's investments or prevent the fund from realizing their full value.
Financial reporting standards for companies based in foreign markets differ
from those in the US. Additionally, foreign securities markets generally are
smaller and less liquid than US markets. To the extent that the fund invests in
non-US dollar denominated foreign securities, changes in currency exchange
rates may affect the US dollar value of foreign securities or the income or
gain received on these securities. Foreign governments may restrict investment
by foreigners, limit withdrawal of trading profit or currency from the country,
restrict currency exchange or seize foreign investments. The investments of the
fund may also be subject to foreign withholding taxes. Foreign transactions and
custody of assets may involve delays in payment, delivery or recovery of money
or investments. Foreign investment risks are greater in emerging markets than
in developed markets. Emerging market investments are often considered
speculative. Emerging market countries typically have economic and political
systems that are less developed, and can be expected to be less stable than
developed markets. For example, the economies of such countries can be subject
to rapid and unpredictable rates of inflation or deflation.
PRICING RISK. If market conditions make it difficult to value some investments,
the fund may value these investments using more subjective methods, such as
fair value pricing. In such cases, the value determined for an investment could
be different than the value realized upon such investment's sale. As a result,
you could pay more than the market value when buying fund shares or receive
less than the market value when selling fund shares.
83
PROSPECTUS May 1, 2010 Fund Details
NON-DIVERSIFICATION RISK. The fund is classified as non-diversified under the
Investment Company Act of 1940, as amended. This means that the fund may invest
in securities of relatively few issuers. Thus, the performance of one or a
small number of portfolio holdings can affect overall performance.
SECURITY SELECTION RISK. The securities in the fund's portfolio may decline in
value. Portfolio management could be wrong in its analysis of industries,
companies, economic trends, the relative attractiveness of different securities
or other matters.
DERIVATIVES RISK. Risks associated with derivatives include the risk that the
derivative is not well correlated with the security, index or currency to which
it relates; the risk that derivatives may result in losses or missed
opportunities; the risk that the fund will be unable to sell the derivative
because of an illiquid secondary market; the risk that a counterparty is
unwilling or unable to meet its obligation; and the risk that the derivative
transaction could expose the fund to the effects of leverage, which could
increase the fund's exposure to the market and magnify potential losses. There
is no guarantee that derivatives, to the extent employed, will have the
intended effect, and their use could cause lower returns or even losses to the
fund. The use of derivatives by the fund to hedge risk may reduce the
opportunity for gain by offsetting the positive effect of favorable price
movements.
SECURITIES LENDING RISK. Any decline in the value of a portfolio security that
occurs while the security is out on loan is borne by the fund, and will
adversely affect performance. Also, there may be delays in recovery of
securities loaned or even a loss of rights in the collateral should the
borrower of the securities fail financially while holding the security.
COUNTERPARTY RISK. A financial institution or other counterparty with whom the
fund does business (such as trading or securities lending), or that
underwrites, distributes or guarantees any investments or contracts that the
fund owns or is otherwise exposed to, may decline in financial health and
become unable to honor its commitments. This could cause losses for the fund or
could delay the return or delivery of collateral or other assets to the fund.
GROWTH INVESTING RISK. As a category, growth stocks may underperform value
stocks (and the stock market as a whole) over any period of time. Because the
prices of growth stocks are based largely on the expectation of future
earnings, growth stock prices can decline rapidly and significantly in reaction
to negative news about such factors as earnings, the economy, political
developments, or other news. A growth company may fail to fulfill apparent
promise or may be eclipsed by competitors or its products or services rendered
obsolete by new technologies. Growth stocks also typically lack the dividends
associated with value stocks that might otherwise cushion investors from the
effects of declining stock prices. In addition, growth stocks selected for
investment by portfolio management may not perform as anticipated.
IPO RISK. Prices of securities bought in an initial public offering (IPO) may
rise and fall rapidly, often because of investor perceptions rather than
economic reasons. IPOs can have more impact on the performance of a small
mutual fund because the number of IPO shares the fund is able to buy may
represent a significant portion of its overall portfolio compared to the
portfolio of a larger fund.
LIQUIDITY RISK. In certain situations, it may be difficult or impossible to
sell an investment in an orderly fashion at an acceptable price. This risk can
be ongoing for any security that does not trade actively or in large volumes,
for any security that trades primarily on smaller markets, and for investments
that typically trade only among a limited number of large investors (such as
certain types of derivatives or restricted securities). In unusual market
conditions, even normally liquid securities may be affected by a degree of
liquidity risk. This may affect only certain securities or an overall
securities market.
--------------------------------------------------------------------------------
DWS Turner Mid Cap Growth VIP
PRINCIPAL INVESTMENT STRATEGY
MAIN INVESTMENTS. The fund pursues its objective by investing in common stocks
and other equity securities of US companies with medium market capitalizations
that portfolio management believes have strong earnings growth potential. The
fund will invest in securities of companies that are diversified across
economic sectors, and will attempt to maintain sector concentrations that
approximate those of the Russell Midcap (Reg. TM) Growth Index. The fund
intends to invest primarily in companies whose market capitalizations fall
within the normal range of the Index. Fund exposure is generally limited to 5%
in any single issuer, subject to exceptions for the most heavily weighted
securities in the Index.
Under normal circumstances, at least 80% of the fund's net assets, plus the
amount of any borrowings for investment purposes, will be invested in stocks of
mid-cap companies, which are defined for this purpose as companies with market
capitalizations at the time of purchase in the range of market capitalizations
of those companies included in the Index. The fund's investments in common
stocks may include initial public offerings.
MANAGEMENT PROCESS. Portfolio management generally looks for medium market
capitalization companies with strong histories of earnings growth that are
likely to continue to grow their earnings. A stock becomes a sell candidate if
there is deterioration in the company's earnings growth potential. Moreover,
positions will be trimmed to adhere to capitalization or capacity constraints,
to maintain sector neutrality or to adjust stock position size relative to the
Index.
84
PROSPECTUS May 1, 2010 Fund Details
In focusing on companies with strong earnings growth potential, portfolio
management engages in a relatively high level of trading activity so as to
respond to changes in earnings forecasts and economic developments.
--------------------------------------------------------------------------------
DERIVATIVES. The fund may use various types of derivatives (contracts whose
value is based on, for example, indices, currencies or securities) for hedging,
risk management or non-hedging purposes to seek to enhance potential gains. The
fund may use derivatives as a substitute for direct investment in a particular
asset class or to keep cash on hand to meet shareholder redemptions or other
needs.
SECURITIES LENDING. The fund may lend securities (up to one-third of total
assets) to approved institutions.
--------------------------------------------------------------------------------
MAIN RISKS
There are several risk factors that could hurt the fund's performance, cause
you to lose money or cause the fund's performance to trail that of other
investments.
STOCK MARKET RISK. To the extent the fund invests in a particular sector, the
fund's performance may be proportionately affected by that sector's general
performance. When stock prices fall, you should expect the value of your
investment to fall as well. Stock prices can be hurt by poor management on the
part of the stock's issuer, shrinking product demand and other business risks.
These may affect single companies as well as groups of companies. In addition,
movements in financial markets may adversely affect a stock's price, regardless
of how well the company performs. The market as a whole may not favor the types
of investments the fund makes, which could affect the fund's ability to sell
them at an attractive price.
MEDIUM-SIZED COMPANY RISK. Medium-sized company stocks tend to be more volatile
than large company stocks. Medium-sized companies are less widely followed by
stock analysts and less information about them is available to investors.
Industry-wide reversals may have a greater impact on medium-sized companies,
since they lack the financial resources of larger companies. Medium-sized
company stocks are typically less liquid than large company stocks.
GROWTH INVESTING RISK. As a category, growth stocks may underperform value
stocks (and the stock market as a whole) over any period of time. Because the
prices of growth stocks are based largely on the expectation of future
earnings, growth stock prices can decline rapidly and significantly in reaction
to negative news about such factors as earnings, the economy, political
developments, or other news. A growth company may fail to fulfill apparent
promise or may be eclipsed by competitors or its products or services rendered
obsolete by new technologies. Growth stocks also typically lack the dividends
associated with value stocks that might otherwise cushion investors from the
effects of declining stock prices. In addition, growth stocks selected for
investment by portfolio management may not perform as anticipated.
FOCUS RISK. To the extent that the fund focuses its investments in particular
industries, asset classes or sectors of the economy, any market price
movements, regulatory or technological changes, or economic conditions
affecting companies in those industries, asset classes or sectors will have a
significant impact on the fund's performance. For example, consumer goods
companies could be hurt by a rise in unemployment or technology companies could
be hurt by such factors as market saturation, price competition and rapid
obsolescence.
DERIVATIVES RISK. Risks associated with derivatives include the risk that the
derivative is not well correlated with the security, index or currency to which
it relates; the risk that derivatives may result in losses or missed
opportunities; the risk that the fund will be unable to sell the derivative
because of an illiquid secondary market; the risk that a counterparty is
unwilling or unable to meet its obligation; and the risk that the derivative
transaction could expose the fund to the effects of leverage, which could
increase the fund's exposure to the market and magnify potential losses. There
is no guarantee that derivatives, to the extent employed, will have the
intended effect, and their use could cause lower returns or even losses to the
fund. The use of derivatives by the fund to hedge risk may reduce the
opportunity for gain by offsetting the positive effect of favorable price
movements.
SECURITIES LENDING RISK. Any decline in the value of a portfolio security that
occurs while the security is out on loan is borne by the fund, and will
adversely affect performance. Also, there may be delays in recovery of
securities loaned or even a loss of rights in the collateral should the
borrower of the securities fail financially while holding the security.
SECURITY SELECTION RISK. The securities in the fund's portfolio may decline in
value. Portfolio management could be wrong in its analysis of industries,
companies, economic trends, the relative attractiveness of different securities
or other matters.
FOREIGN INVESTMENT RISK. To the extent the fund invests in companies based
outside the US, it faces the risks inherent in foreign investing. Adverse
political, economic or social developments could undermine the value of the
fund's investments or prevent the fund from realizing their full value.
Financial reporting standards for companies based in foreign markets differ
from those in the US. Additionally, foreign securities markets generally are
smaller and less liquid than US markets. To the extent that the fund invests in
non-US dollar denominated foreign securities, changes in currency exchange
rates may affect the US dollar value of foreign securities or the income or
gain received on these securities. Foreign governments may restrict investment
by foreigners, limit withdrawal of trading profit or currency from the country,
restrict currency exchange or seize foreign investments. The investments of the
fund may also be subject to foreign withholding taxes.
85
PROSPECTUS May 1, 2010 Fund Details
Foreign transactions and custody of assets may involve delays in payment,
delivery or recovery of money or investments.
COUNTERPARTY RISK. A financial institution or other counterparty with whom the
fund does business (such as trading or securities lending), or that
underwrites, distributes or guarantees any investments or contracts that the
fund owns or is otherwise exposed to, may decline in financial health and
become unable to honor its commitments. This could cause losses for the fund or
could delay the return or delivery of collateral or other assets to the fund.
IPO RISK. Prices of securities bought in an initial public offering (IPO) may
rise and fall rapidly, often because of investor perceptions rather than
economic reasons. IPOs can have more impact on the performance of a small
mutual fund because the number of IPO shares the fund is able to buy may
represent a significant portion of its overall portfolio compared to the
portfolio of a larger fund.
LIQUIDITY RISK. In certain situations, it may be difficult or impossible to
sell an investment in an orderly fashion at an acceptable price. This risk can
be ongoing for any security that does not trade actively or in large volumes,
for any security that trades primarily on smaller markets, and for investments
that typically trade only among a limited number of large investors (such as
certain types of derivatives or restricted securities). In unusual market
conditions, even normally liquid securities may be affected by a degree of
liquidity risk. This may affect only certain securities or an overall
securities market.
PRICING RISK. If market conditions make it difficult to value some investments,
the fund may value these investments using more subjective methods, such as
fair value pricing. In such cases, the value determined for an investment could
be different than the value realized upon such investment's sale. As a result,
you could pay more than the market value when buying fund shares or receive
less than the market value when selling fund shares.
OTHER POLICIES AND RISKS
While the previous pages describe the main points of each fund's strategy and
risks, there are a few other matters to know about:
o Although major changes tend to be infrequent, each fund's Board could change
a fund's investment objective without seeking shareholder approval.
However, the Board of DWS Blue Chip VIP, DWS Core Fixed Income VIP, DWS
Diversified International Equity VIP, DWS Dreman Small Mid Cap Value VIP,
DWS Global Thematic VIP, DWS Government & Agency Securities VIP, DWS Large
Cap Value VIP, DWS Mid Cap Growth VIP, DWS Small Cap Growth VIP, DWS
Strategic Value VIP, DWS Technology VIP and DWS Turner Mid Cap Growth VIP
will provide shareholders with at least 60 days notice prior to making any
changes to the fund's 80% investment policy as described herein.
o The following is applicable to all funds except DWS Money Market VIP. When
in the Advisor's opinion it is advisable to adopt a temporary defensive
position because of unusual and adverse or other market conditions, up to
100% of each fund's assets may be held in cash or invested in money market
securities or other short-term investments. Short-term investments consist
of (1) foreign and domestic obligations of sovereign governments and their
agencies and instrumentalities, authorities and political subdivisions; (2)
other short-term rated debt securities or, if unrated, determined to be of
comparable quality in the opinion of the Advisor; (3) commercial paper; (4)
bank obligations, including negotiable certificates of deposit, time
deposits and bankers' acceptances; and (5) repurchase agreements.
Short-term investments may also include shares of money market mutual
funds. This could prevent losses, but, while engaged in a temporary
defensive position, a fund will not be pursuing its investment objective.
However, portfolio management may choose not to use these strategies for
various reasons, even in volatile market conditions.
o Portfolio management measures credit quality at the time it buys securities,
using independent rating agencies or, for unrated securities, its own
judgment. All securities must meet the credit quality standards applied by
portfolio management at the time they are purchased. If a security's credit
quality changes, portfolio management will decide what to do with the
security, based on its assessment of what would most benefit a fund.
o Certain DWS fund-of-funds are permitted to invest in other DWS funds. As a
result, a fund may have large inflows or outflows of cash from time to
time. This could have adverse effects on a fund's performance if a fund
were required to sell securities or invest cash at times when it otherwise
would not do so. This activity could also accelerate the realization of
capital gains and increase a fund's transaction costs.
FOR MORE INFORMATION
This prospectus doesn't tell you about every policy or risk of investing in
each fund.
If you want more information on each fund's allowable securities and investment
practices and the characteristics and risks of each one, you may want to
request a copy of the Statement of Additional Information (the back cover tells
you how to do this).
Keep in mind that there is no assurance that a fund will achieve its investment
objective.
A complete list of each fund's portfolio holdings as of the month-end is posted
on www.dws-investments.com on or about the 15th day of the following month.
More frequent posting of portfolio holdings information may be made from time
to time on www.dws-investments.com. The posted portfolio holdings information
is available by fund
86
PROSPECTUS May 1, 2010 Fund Details
and generally remains accessible at least until the date on which a fund files
its Form N-CSR or N-Q with the Securities and Exchange Commission for the
period that includes the date as of which the posted information is current.
Each fund's Statement of Additional Information includes a description of a
fund's policies and procedures with respect to the disclosure of a fund's
portfolio holdings.
WHO MANAGES AND OVERSEES THE FUNDS
THE INVESTMENT ADVISOR
Deutsche Investment Management Americas Inc. ("DIMA" or the "Advisor"), with
headquarters at 345 Park Avenue, New York, NY 10154, is the investment advisor
for each fund. Under the oversight of the Board, the Advisor, a subadvisor or a
sub-subadvisor, makes investment decisions, buys and sells securities for each
fund and conducts research that leads to these purchase and sale decisions. The
Advisor provides a full range of global investment advisory services to
institutional and retail clients.
DWS Investments is part of the Asset Management division of Deutsche Bank AG
and, within the US, represents the retail asset management activities of
Deutsche Bank AG, Deutsche Bank Trust Company Americas, DIMA and DWS Trust
Company.
Deutsche Asset Management is a global asset management organization that offers
a wide range of investing expertise and resources, including hundreds of
portfolio managers and analysts and an office network that reaches the world's
major investment centers. This well-resourced global investment platform brings
together a wide variety of experience and investment insight across industries,
regions, asset classes and investing styles.
The Advisor is an indirect, wholly owned subsidiary of Deutsche Bank AG.
Deutsche Bank AG is a major global banking institution that is engaged in a
wide range of financial services, including investment management, mutual
funds, retail, private and commercial banking, investment banking and
insurance.
For DWS Alternative Asset Allocation Plus VIP, the Advisor and its affiliates
earn fees at varying rates for providing services to the underlying DWS funds.
The Advisor may therefore have a conflict of interest in selecting the
underlying DWS funds and in determining whether to invest in an ETF, from which
it will not receive any fees. However, the Advisor is a fiduciary to the fund
and will select investments that it believes are best suited to meet the fund's
investment objective.
MANAGEMENT FEE. The Advisor receives a management fee from each fund. Below are
the management rates paid by each fund for the most recent fiscal year, as a
percentage of each fund's average daily net assets:
FUND NAME FEE PAID
------------------------------ --------------------
DWS Alternative Asset Alloca-
tion Plus VIP 0.00%(*, **)
------------------------------ --------------
DWS Balanced VIP 0.37%
------------------------------ ------
DWS Blue Chip VIP 0.55%
------------------------------ ------
DWS Core Fixed Income VIP 0.50%
------------------------------ ------
DWS Diversified International
Equity VIP 0.65%
------------------------------ ------
DWS Dreman Small Mid Cap
Value VIP 0.65%
------------------------------ ------
DWS Global Thematic VIP 0.57%(**)
------------------------------ -------
DWS Government & Agency
Securities VIP 0.45%
------------------------------ ------
DWS High Income VIP 0.50%
------------------------------ ------
DWS Large Cap Value VIP 0.65%
------------------------------ ------
DWS Mid Cap Growth VIP 0.42%(**)
------------------------------ ------
DWS Money Market VIP 0.285%
------------------------------ ------
DWS Small Cap Growth VIP 0.55%
------------------------------ ------
DWS Strategic Income VIP 0.49%(**)
------------------------------ ------
DWS Strategic Value VIP 0.62%(**)
------------------------------ ------
DWS Technology VIP 0.665%
------------------------------ ------
DWS Turner Mid Cap Growth
VIP 0.715%
------------------------------ ------
* Management fee has two components: (i) a fee on assets invested in other
DWS funds; and (ii) a fee on assets not invested in other DWS funds
("Other Assets"). The Advisor currently intends to invest substantially
all the assets of the fund in other DWS funds. However, in the future,
the fund may invest a larger portion, or all, of its assets in Other
Assets. If the fund's assets are entirely invested in Other Assets, the
management fee would be 1.20% of average daily net assets. However, in
such a situation, the Acquired Fund (Underlying Fund) Fees and Expense
are expected to decrease. The Advisor will waive 0.15% of the management
fee until the fund reaches $50 million in assets and the iGAP strategy is
implemented.
** Reflects the effect of expense limitations and/or fee waivers then in
effect.
For DWS Global Thematic VIP, the Advisor has contractually agreed through
September 30, 2010 to waive and/or reimburse fund expenses to the extent
necessary to maintain the fund's total annual operating expenses at 1.06% for
Class A. The agreement may only be terminated with the consent of the fund's
Board and does not extend to extraordinary expenses, taxes, brokerage and
interest expense.
For DWS Large Cap Value VIP, the Advisor has contractually agreed through
September 30, 2010 to waive and/or reimburse fund expenses to the extent
necessary to maintain the fund's total annual operating expenses at 0.88% for
Class A. The agreement may only be terminated with the consent of the fund's
Board and does not extend to extraordinary expenses, taxes, brokerage and
interest expense.
87
PROSPECTUS May 1, 2010 Fund Details
For DWS Mid Cap Growth VIP, the Advisor has contractually agreed through
September 30, 2010 to waive and/or reimburse fund expenses to the extent
necessary to maintain the fund's total annual operating expenses at 1.09% for
Class A. The agreement may only be terminated with the consent of the fund's
Board and does not extend to extraordinary expenses, taxes, brokerage and
interest expense.
For DWS Money Market VIP, the Advisor has contractually agreed through
September 30, 2010 to waive and/or reimburse fund expenses to the extent
necessary to maintain the fund's total annual operating expenses at 0.51% for
Class A. The agreement may only be terminated with the consent of the fund's
Board and does not extend to extraordinary expenses, taxes, brokerage and
interest expense.
For DWS Strategic Income VIP, the Advisor has contractually agreed through
September 30, 2010 to waive and/or reimburse fund expenses to the extent
necessary to maintain the fund's total annual operating expenses at 0.87% for
Class A. The agreement may only be terminated with the consent of the fund's
Board and does not extend to extraordinary expenses, taxes, brokerage and
interest expense.
For DWS Turner Mid Cap Growth VIP, the Advisor has contractually agreed through
September 30, 2010 to waive and/or reimburse fund expenses to the extent
necessary to maintain the fund's total annual operating expenses at 1.01% for
Class A. The agreement may only be terminated with the consent of the fund's
Board and does not extend to extraordinary expenses, taxes, brokerage and
interest expense.
A discussion regarding the basis for the Board renewal of each fund's
investment management agreement and, as applicable, subadvisory agreement, is
contained in the shareholder report for the annual period ended December 31
(see "Shareholder reports" on the back cover).
Under a separate administrative services agreement between each fund and the
Advisor, each fund pays the Advisor a fee of 0.10% for providing most of each
fund's administrative services.
FOR DWS ALTERNATIVE ASSET ALLOCATION PLUS VIP, DWS BALANCED VIP, DWS BLUE CHIP
VIP, DWS DIVERSIFIED INTERNATIONAL EQUITY VIP AND DWS STRATEGIC INCOME VIP
ONLY.
On January 26, 2010, the Advisor announced its intention to transition members
of the portfolio management team for DWS Alternative Asset Allocation Plus VIP,
DWS Balanced VIP, DWS Blue Chip VIP, DWS Diversified International Equity VIP
and DWS Strategic Income VIP who are part of its Quantitative Strategies Group
out of the Advisor into a separate independent investment advisory firm that is
not affiliated with the Advisor, known as QS Investors Holdings, LLC ("QS
Investors"). In order for DWS Alternative Asset Allocation Plus VIP, DWS
Balanced VIP, DWS Blue Chip VIP, DWS Diversified International Equity VIP and
DWS Strategic Income VIP to continue to benefit from the investment expertise
offered by the affected portfolio managers, the Advisor has recommended to the
Board the approval of a sub-advisory agreement between the Advisor and the
newly created investment advisory firm (the "Sub-Advisory Agreement"). The
Sub-Advisory Agreement is subject to Board approval. If the Board approves the
Sub-Advisory Agreement, it is expected that QS Investors will become the
Subadvisor for DWS Alternative Asset Allocation Plus VIP, DWS Balanced VIP, DWS
Blue Chip VIP, DWS Diversified International Equity VIP and DWS Strategic
Income VIP.
QS Investors, 880 Third Avenue, New York, NY 10022, is an investment advisor
registered under the Investment Advisers Act of 1940, as amended. Under the
oversight of the Advisor and the Board, QS Investors would provide global
expertise in research, portfolio management and quantitative analysis. QS
Investors manages assets across multiple strategies, including: Global Tactical
Asset Allocation & Active Currency (iGAP), US Active Quantitative Equity (AQE),
International and Global Equity (Diversification Based Investing/DBI) and
Multi-Asset/Strategic Asset Allocation (SAA). QS Investors would make
investment decisions, buy and sell securities for DWS Alternative Asset
Allocation Plus VIP, DWS Balanced VIP, DWS Blue Chip VIP, DWS Diversified
International Equity VIP and DWS Strategic Income VIP and would conduct
research that leads to these purchase and sale decisions. The Advisor would
compensate QS Investors out of the management fee it receives from DWS
Alternative Asset Allocation Plus VIP, DWS Balanced VIP, DWS Blue Chip VIP, DWS
Diversified International Equity VIP and DWS Strategic Income VIP.
FOR DWS GLOBAL THEMATIC VIP ONLY.
On January 26, 2010, the Advisor also announced its intention to transition
members of the portfolio management team for DWS Global Thematic VIP, who are
part of its Global Equity Team, out of the Advisor into a separate independent
investment advisory firm that is not affiliated with the Advisor, known as
Global Thematic Partners Holdings, LLC ("Global Thematic Partners"). In order
for DWS Global Thematic VIP to continue to benefit from the investment
expertise offered by the affected portfolio managers, the Advisor has
recommended to the Board the approval of a sub-advisory agreement between the
Advisor and the newly created investment advisory firm (the "Sub-Advisory
Agreement"). The Sub-Advisory Agreement is subject to Board approval. If the
Board approves the Sub-Advisory Agreement, it is expected that Global Thematic
Partners will become the Subadvisor for DWS Global Thematic VIP.
Global Thematic Partners, 681 Fifth Avenue, New York, NY 10022, is an
investment advisor registered under the Investment Advisers Act of 1940, as
amended. Under the oversight of the Advisor and the Board, Global Thematic
Partners would make investment decisions, buy and sell
88
PROSPECTUS May 1, 2010 Fund Details
securities for DWS Global Thematic VIP and would conduct research that leads to
these purchase and sale decisions. The Advisor would compensate Global Thematic
Partners out of the management fee it receives from DWS Global Thematic VIP.
SUBADVISOR AND SUB-SUBADVISORS FOR DWS ALTERNATIVE ASSET ALLOCATION PLUS VIP
RREEF America L.L.C. ("RREEF"), an investment advisor registered with the SEC,
is located at 875 N. Michigan Avenue, Chicago, Illinois 60611. RREEF is an
indirect wholly owned subsidiary of Deutsche Bank AG. RREEF has provided real
estate investment management services to institutional investors since 1975
across a diversified portfolio of industrial properties, office buildings,
residential apartments and shopping centers. RREEF has also been an investment
advisor of real estate securities since 1993.
Deutsche Investments Australia Limited ("DIAL"), is located at Level 16,
Deutsche Bank Place, Corner of Hunter and Phillip Streets, Sydney NSW 2000,
Australia. DIAL is an indirect wholly owned subsidiary of Deutsche Bank AG.
DIAL serves as both subadvisor for mutual funds and investment advisor for
certain institutional accounts.
RREEF Global Advisers Limited ("RGAL"), is located at Winchester House, 1 Great
Winchester Street, London, United Kingdom, EC2N 2DB. RGAL is an indirect wholly
owned subsidiary of Deutsche Bank AG.
Deutsche Asset Management (Hong Kong) Limited ("DeAM Hong Kong"), is located at
48/F Cheung Kong Center, 2 Queen's Road Central, Hong Kong, China. DeAM Hong
Kong is an indirect wholly owned subsidiary of Deutsche Bank AG.
The subadvisor and sub-subadvisors provide investment advisory and management
services to the portions of DWS Alternative Asset Allocation Plus VIP's
portfolio allocated to direct investments in global real estate and global
infrastructure (as described below). The subadvisor and each sub-subadvisor
makes investment decisions, buy and sells securities for the portfolio and
conducts research that leads to purchase and sale decisions. The Advisor pays a
fee to the subadvisor pursuant to an investment subadvisory agreement between
the Advisor and the subadvisor. The sub-subadvisors are paid for their sub-
subadvisory services by the subadvisor, from the subadvisor's subadvisory fee
paid by the Advisor to the subadvisor.
RREEF provides subadvisory services in connection with direct investments in
global real estate and global infrastructure securities. With respect to global
real estate and global infrastructure securities, RGAL provides sub-subadvisory
services related to European securities, DeAM Hong Kong provides
sub-subadvisory services related to Asian securities and DIAL provides sub-
subadvisory services related to Australian securities.
SUBADVISOR FOR DWS BALANCED VIP AND DWS LARGE CAP VALUE VIP
The subadvisor for DWS Balanced VIP and DWS Large Cap Value VIP is Deutsche
Asset Management International GmbH ("DeAMi"), Mainzer Landstrasse 178-190,
Frankfurt am Main, Germany. DeAMi renders investment advisory and management
services to DWS Large Cap Value VIP and to a portion of DWS Balanced VIP's
large cap value allocation. DeAMi is an investment advisor registered with the
Securities and Exchange Commission, whose assets under management are currently
comprised of institutional accounts and investment companies. DeAMi is a
subsidiary of Deutsche Bank AG. DIMA compensates DeAMi out of the management
fee it receives from the fund.
SUBADVISOR FOR DWS DREMAN SMALL MID CAP VALUE VIP
The subadvisor for DWS Dreman Small Mid Cap Value VIP is Dreman Value
Management, L.L.C. ("DVM"), 520 East Cooper Avenue, Suite 230-4, Aspen, CO
81611. DVM was founded in 1977 and currently manages over $4.7 billion in
assets, which is primarily comprised of investment companies. Pursuant to a
subadvisory agreement with DIMA, DVM performs some of the functions of the
Advisor, including making each fund's investment decisions and buying and
selling securities for each fund. DIMA compensates DVM for its services.
SUBADVISOR FOR DWS TURNER MID CAP GROWTH VIP
Turner Investment Partners, Inc., 1205 Westlakes Drive, Suite 100, Berwyn,
Pennsylvania, 19312 is the subadvisor to DWS Turner Mid Cap Growth VIP. As of
December 31, 2009, Turner Investment Partners, Inc. had approximately $17.7
billion in assets under management. DIMA pays a fee to Turner Investment
Partners, Inc. for acting as subadvisor.
MULTI-MANAGER STRUCTURE. The Advisor, subject to the approval of the Board, has
ultimate responsibility to recommend the hiring, termination and replacement of
subadvisors. Each fund and the Advisor have received an order from the SEC that
allows each fund and the Advisor to utilize a multi-manager structure in
managing each fund's assets. Pursuant to the SEC order, the Advisor, with the
approval of each fund's Board, is permitted to select subadvisors that are not
affiliates of the Advisor ("non-affiliated subadvisors") to manage all or a
portion of each fund's assets without obtaining shareholder approval. The
Advisor also has the discretion to terminate any subadvisor and allocate and
reallocate each fund's assets among any non-affiliated subadvisors. The SEC
order also permits the Advisor, subject to the approval of the Board, to
materially amend an existing subadvisory agreement with a non-affiliated
subadvisor without shareholder approval. Each fund and the Advisor are subject
to the conditions imposed by the SEC order, including the condition that within
90 days of hiring of a new non-affiliated subadvisor, each fund
89
PROSPECTUS May 1, 2010 Fund Details
will provide shareholders with an information statement containing information
about the new non-affiliated subadvisor.
Each fund and the Advisor have also filed an exemptive application with the SEC
requesting an order that would extend the relief granted with respect to
non-affiliated subadvisors to certain subadvisors that are affiliates of the
Advisor ("affiliated subadvisors"). If such relief is granted by the SEC, the
Advisor, with the approval of each fund's Board, would be able to hire
non-affiliated and/or affiliated subadvisors to manage all or a portion of each
fund's assets without obtaining shareholder approval. The Advisor would also
have the discretion to terminate any subadvisor and allocate and reallocate
each fund's assets among any other subadvisors (including terminating a
non-affiliated subadvisor and replacing them with an affiliated subadvisor).
The Advisor, subject to the approval of the Board, would also be able to
materially amend an existing subadvisory agreement with any such subadvisor
without shareholder approval. There can be no assurance that such relief will
be granted by the SEC. Each fund and the Advisor will be subject to any new
conditions imposed by the SEC.
MANAGEMENT
DWS ALTERNATIVE ASSET ALLOCATION PLUS VIP
ROBERT WANG, MANAGING DIRECTOR. Portfolio Manager of the fund. Joined the fund
in 2009.
o Joined Deutsche Asset Management in 1995 as portfolio manager for asset
allocation after 13 years of experience of trading fixed income, foreign
exchange and derivative products at J.P. Morgan.
o Global Head of Quantitative Strategies Portfolio Management: New York.
o BS, The Wharton School, University of Pennsylvania.
INNA OKOUNKOVA, DIRECTOR. Portfolio Manager of the fund. Joined the fund in
2009.
o Joined Deutsche Asset Management in 1999 as a quantitative analyst, becoming
an associate portfolio manager in 2001.
o Lead Portfolio Manager for Asset Allocation Strategies: New York.
o MS, Moscow State University; MBA, University of Chicago - Graduate School of
Business.
THOMAS PICCIOCHI, DIRECTOR. Portfolio Manager of the fund. Joined the fund in
2009.
o Joined Deutsche Asset Management in 1999, formerly serving as portfolio
manager for Absolute Return Strategies, after 13 years of experience in
various research and analysis positions at State Street Global Advisors,
FPL Energy, Barnett Bank, Trade Finance Corporation and Reserve Financial
Management.
o Senior Portfolio Manager for Quantitative Strategies: New York.
o BA and MBA, University of Miami.
DWS BALANCED VIP
ROBERT WANG, MANAGING DIRECTOR. Portfolio Manager of the fund. Joined the fund
in 2005.
o Joined Deutsche Asset Management in 1995 as portfolio manager for asset
allocation after 13 years of experience of trading fixed income, foreign
exchange and derivative products at J.P. Morgan.
o Global Head of Quantitative Strategies Portfolio Management: New York.
o BS, The Wharton School, University of Pennsylvania.
INNA OKOUNKOVA, DIRECTOR. Portfolio Manager of the fund. Joined the fund in
2005.
o Joined Deutsche Asset Management in 1999 as a quantitative analyst, becoming
an associate portfolio manager in 2001.
o Lead Portfolio Manager for Asset Allocation Strategies: New York.
o MS, Moscow State University; MBA, University of Chicago - Graduate School of
Business.
THOMAS PICCIOCHI, DIRECTOR. Portfolio Manager of the fund. Joined the fund in
2007.
o Joined Deutsche Asset Management in 1999, formerly serving as portfolio
manager for Absolute Return Strategies, after 13 years of experience in
various research and analysis positions at State Street Global Advisors,
FPL Energy, Barnett Bank, Trade Finance Corporation and Reserve Financial
Management.
o Senior Portfolio Manager for Quantitative Strategies: New York.
o BA and MBA, University of Miami.
DWS BLUE CHIP VIP
ROBERT WANG, MANAGING DIRECTOR. Portfolio Manager of the fund. Joined the fund
in 2003.
o Joined Deutsche Asset Management in 1995 as portfolio manager for asset
allocation after 13 years of experience of trading fixed income, foreign
exchange and derivative products at J.P. Morgan.
o Global Head of Quantitative Strategies Portfolio Management: New York.
o BS, The Wharton School, University of Pennsylvania.
RUSSELL SHTERN, CFA, VICE PRESIDENT. Portfolio Manager of the fund. Joined the
fund in 2010.
o Joined Deutsche Asset Management in 1999, previously serving as trader's
assistant supporting program, options and equity swaps trading desks.
o Portfolio manager for GrOWE and Tax Managed Equity: New York.
o BBA, Pace University.
DWS CORE FIXED INCOME VIP
KENNETH R. BOWLING, CFA, MANAGING DIRECTOR. Portfolio Manager of the fund.
Joined the fund in 2009.
o Joined Deutsche Asset Management in 2007 after 14 years of experience at
INVESCO where he was most recently director of US Fixed Income.
90
PROSPECTUS May 1, 2010 Fund Details
o Head of Institutional Fixed Income Investments, Americas: Louisville.
o BS and MEng from University of Louisville.
JAMIE GUENTHER, CFA, MANAGING DIRECTOR. Portfolio Manager of the fund. Joined
the fund in 2009.
o Joined Deutsche Asset Management in 2007 after 25 years of experience, most
recently as head of Credit Research and CDO/CSO Credit for INVESCO. Prior
to that he was head of financial institution investment research at Duff &
Phelps Investment Research. Before that he was a global security analyst
for Alexander & Alexander. He began his career in 1982 at Touche Ross
Financial Consulting.
o Head of Institutional Credit: Louisville.
o BBA from Western Michigan University.
JOHN BRENNAN, DIRECTOR. Portfolio Manager of the fund. Joined the fund in 2009.
o Joined Deutsche Asset Management and the fund in 2007 after 14 years of
experience at INVESCO and Freddie Mac. Previously, was head of Structured
Securities sector team at INVESCO and before that was senior fixed income
portfolio manager at Freddie Mac specializing in MBS, CMBS, collateralized
mortgage obligations, ARMS, mortgage derivatives, US Treasuries and agency
debt.
o Portfolio Manager for Structured Finance: Louisville.
o BS, University of Maryland; MBA William & Mary.
BRUCE HARLEY, CFA, CEBS, DIRECTOR. Portfolio Manager of the fund. Joined the
fund in 2009.
o Joined Deutsche Asset Management in March 2007 after 18 years of experience
at INVESCO where he was head of Governments and Derivatives, responsible
for positioning for US duration and term structure; Government and futures
trading.
o Portfolio and Sector Manager for Institutional Fixed Income: Louisville.
o BS in Economics from University of Louisville.
J. RICHARD ROBBEN, CFA, DIRECTOR. Portfolio Manager of the fund. Joined the
fund in 2009.
o Joined Deutsche Asset Management and the fund in 2007 after 11 years of
experience at INVESCO Institutional, most recently as senior portfolio
manager for LIBOR-related strategies and head of portfolio construction
group for North American Fixed Income.
o Portfolio Manager for Institutional Fixed Income: Louisville.
o BA, Bellarmine University.
DAVID VIGNOLO, VICE PRESIDENT. Portfolio Manager of the fund. Joined the fund
in 2009.
o Joined Deutsche Asset Management in March 2007 after 20 years of experience
that included head of corporate bond trading and portfolio manager for
INVESCO and Conning Asset Management Co., and corporate bond trader and
portfolio manager for ANB Investment Management Co.
o Portfolio and Sector Manager for Institutional Fixed Income: Louisville.
o BS from Indiana University; MBA from Case Western Reserve University.
J. KEVIN HORSLEY, CFA, CPA, DIRECTOR. Portfolio Manager of the fund. Joined the
fund in 2009.
o Joined Deutsche Asset Management in March 2007 after 13 years of experience,
of which 11 were at INVESCO as senior analyst for a variety of credit
sectors. He also has experience in the structured securities market
(asset-backed and commercial mortgage-backed securities), and in research
coverage of foreign exchange markets, corporate finance, market planning in
the telecom sector, and in public accounting.
o Credit Analyst for Institutional Fixed Income: Louisville.
o BA from Transylvania University; MBA from Owen Graduate School of
Management, Vanderbilt University.
STEPHEN WILLER, CFA, VICE PRESIDENT. Portfolio Manager of the fund. Joined the
fund in 2009.
o Joined Deutsche Asset Management in March 2007 after 13 years of experience,
11 of which were at AMVESCAP, INVESCO Institutional, where he was CDO
portfolio manager responsible for structuring, pricing and managing
corporate credit CSOs, developing CDS based trading strategies and
vehicles, and Alpha decisions for CDS index trading. He started his career
as a financial analyst at Providian Capital Management.
o Portfolio manager for Institutional Fixed Income: Louisville.
o BS in Finance/Economics from the University of Richmond.
DWS DIVERSIFIED INTERNATIONAL EQUITY VIP
ROBERT WANG, MANAGING DIRECTOR. Portfolio Manager of the fund. Joined the fund
in 2009.
o Joined Deutsche Asset Management in 1995 as portfolio manager for asset
allocation after 13 years of experience of trading fixed income, foreign
exchange and derivative products at J.P. Morgan.
o Global Head of Quantitative Strategies Portfolio Management: New York.
o BS, The Wharton School, University of Pennsylvania.
RUSSELL SHTERN, CFA, VICE PRESIDENT. Portfolio Manager of the fund. Joined the
fund in 2009.
o Joined Deutsche Asset Management in 1999, previously serving as trader's
assistant supporting program, options and equity swaps trading desks.
o Portfolio manager for GrOWE and Tax Managed Equity: New York.
o BBA, Pace University.
DWS DREMAN SMALL MID CAP VALUE VIP
DAVID N. DREMAN. Chairman and Chief Investment Officer of Dreman Value
Management, L.L.C. and Lead Portfolio Manager of the fund. Joined the fund in
2002.
o Began investment career in 1957.
91
PROSPECTUS May 1, 2010 Fund Details
o Founder, Dreman Value Management, L.L.C.
E. CLIFTON HOOVER, JR. Co-Chief Investment Officer and Managing Director of
Dreman Value Management, L.L.C. and Portfolio Manager of the fund. Joined the
fund in 2006.
o Joined Dreman Value Management, L.L.C. in 2006.
o Prior to joining Dreman Value Management, L.L.C., Managing Director and a
Portfolio Manager at NFJ Investment Group since 1997.
o Over 20 years of investment industry experience.
o MS, Texas Tech University.
MARK ROACH. Managing Director of Dreman Value Management, L.L.C. and Portfolio
Manager of the fund. Joined the fund in 2006.
o Joined Dreman Value Management, L.L.C. in 2006.
o Prior to that, Portfolio Manager at Vaughan Nelson Investment Management
since 2002.
o Over 14 years of investment industry experience.
o BS, Baldwin Wallace College; MBA, University of Chicago.
DWS GLOBAL THEMATIC VIP
OLIVER KRATZ, MANAGING DIRECTOR. Portfolio Manager of the fund. Joined the fund
in 2003.
o Joined Deutsche Asset Management in 1996, having since served as portfolio
manager for European Equity Fund and Global Emerging Markets analyst for
International Equity Fund, after two years of experience at Merrill Lynch,
Brown Brothers Harriman and McKinsey & Co.; authored Frontier Emerging
Markets Securities Price Behavior and Valuation; Kluwers Academic
Publishers, 1999; member of Budapest Stock Exchange Advisory Board.
o Head of Global Thematic Equity; Co-Head of Global Agribusiness; Lead
Portfolio Manager Global Thematic Strategy: New York.
o BA, Tufts University and Karlova Universidad, Prague; MALD, Ph.D, The
Fletcher School, administered jointly by Harvard University and Tufts
University.
DWS GOVERNMENT & AGENCY SECURITIES VIP
WILLIAM CHEPOLIS, CFA, MANAGING DIRECTOR. Co-Manager of the fund. Joined the
fund in 2002.
o Joined Deutsche Asset Management in 1998 after 13 years of experience as
vice president and portfolio manager for Norwest Bank where he managed the
bank's fixed income and foreign exchange portfolios.
o Portfolio Manager for Retail Fixed Income: New York.
o BIS, University of Minnesota.
OHN CHOE, CFA, ASSOCIATE. Portfolio Manager of the fund. Joined the fund in
2010.
o Portfolio Manager for Retail Fixed Income: New York.
o Joined Deutsche Asset Management in 2005.
o BSBA, Georgetown University.
DWS HIGH INCOME VIP
GARY SULLIVAN, CFA, MANAGING DIRECTOR. Portfolio Manager of the fund. Joined
the fund in 2006.
o Joined Deutsche Asset Management in 1996. Served as the head of the High
Yield group in Europe and as an Emerging Markets portfolio manager.
o Prior to that, four years at Citicorp as a research analyst and structurer
of collateralized mortgage obligations. Prior to Citicorp, served as an
officer in the US Army from 1988 to 1991.
o BS, United States Military Academy (West Point); MBA, New York University,
Stern School of Business.
DWS LARGE CAP VALUE VIP
THOMAS SCHUESSLER, PHD., MANAGING DIRECTOR. Lead Portfolio Manager of the fund.
Joined the fund in 2007.
o Joined Deutsche Asset Management in 2001 after five years at Deutsche Bank
where he managed various projects and worked in the office of the Chairman
of the Management Board.
o US and Global Fund Management: Frankfurt.
o PhD, University of Heidelberg, studies in physics and economics at
University of Heidelberg and University of Utah.
VOLKER DOSCH, MANAGING DIRECTOR. Portfolio Manager of the fund. Joined the fund
in 2009.
o Joined Deutsche Asset Management in 1989.
o Fund Manager of US and global equity funds; Head of US Equities; Deputy Head
of Fund Management International Equities; Head of Sector-Funds: Frankfurt.
o Master's degree in Economics ("Diplom-Volkswirt") from the University of
Frankfurt, Germany.
OLIVER PFEIL, PHD., VICE PRESIDENT. Portfolio Manager of the fund. Joined the
fund in 2009.
o Joined Deutsche Asset Management in 2006 after 3 years as Executive
Assistant to the Management Board of Deutsche Bank. Previously, Research
Fellow at the Swiss Institute of Banking and Finance at the University of
St. Gallen (2000-2002); Visiting Scholar in Capital Markets Research at MIT
Sloan School of Management (2002-2003). Also, serves as part-time Lecturer
in Finance at the University of St. Gallen in Switzerland.
o Portfolio manager for US and global value equity: Frankfurt.
o PhD in finance and accounting and Master's degree in Business Administration
from the University of St. Gallen; CEMS Master in International Management
from the University of St. Gallen & ESADE, Barcelona; completed bank
training program ("Bankkaufmann") at Sal. Oppenheim jr. & Cie. KGaA,
Cologne.
DWS MID CAP GROWTH VIP
JOSEPH AXTELL, CFA, MANAGING DIRECTOR. Portfolio Manager of the fund. Joined
the fund in 2006.
o Joined Deutsche Asset Management in 2001.
o Senior analyst at Merrill Lynch Investment Managers for the international
equity portion of a global balanced portfolio (1996-2001).
o Director, International Research at PCM International (1989-1996).
92
PROSPECTUS May 1, 2010 Fund Details
o Associate manager, structured debt and equity group at Prudential Capital
Corporation (1988-1989).
o Analyst at Prudential-Bache Capital Funding in London (1987-1988).
o Equity analyst in the health care sector at Prudential Equity Management
Associates (1985-1987).
o BS, Carlson School of Management, University of Minnesota.
RAFAELINA M. LEE, DIRECTOR. Portfolio Manager of the fund. Joined the fund in
2008.
o Joined Deutsche Asset Management in 1999.
o Research analyst for US Micro, Small and Mid Cap Equity: New York.
o Over 20 years of investment industry experience in US portfolio strategy,
Latin America market strategy and US equity research at JP Morgan
Securities, UBS Securities and Goldman Sachs & Co.
o BA, Columbia University; MBA, Stern School of Business, New York University.
DWS MONEY MARKET VIP
A group of investment professionals is responsible for the day-to-day
management of each fund. These investment professionals have a broad range of
experience managing money market funds.
DWS SMALL CAP GROWTH VIP
JOSEPH AXTELL, CFA, MANAGING DIRECTOR. Portfolio Manager of the fund. Joined
the fund in 2006.
o Joined Deutsche Asset Management in 2001.
o Senior analyst at Merrill Lynch Investment Managers for the international
equity portion of a global balanced portfolio (1996-2001).
o Director, International Research at PCM International (1989-1996).
o Associate manager, structured debt and equity group at Prudential Capital
Corporation (1988-1989).
o Analyst at Prudential-Bache Capital Funding in London (1987-1988).
o Equity analyst in the health care sector at Prudential Equity Management
Associates (1985-1987).
o BS, Carlson School of Management, University of Minnesota.
RAFAELINA M. LEE, DIRECTOR. Portfolio Manager of the fund. Joined the fund in
2008.
o Joined Deutsche Asset Management in 1999.
o Research analyst for US Micro, Small and Mid Cap Equity: New York.
o Over 20 years of investment industry experience in US portfolio strategy,
Latin America market strategy and US equity research at JP Morgan
Securities, UBS Securities and Goldman Sachs & Co.
o BA, Columbia University; MBA, Stern School of Business, New York University.
DWS STRATEGIC INCOME VIP
GARY SULLIVAN, CFA, MANAGING DIRECTOR. Portfolio Manager of the fund. Joined
the fund in 2006.
o Joined Deutsche Asset Management in 1996. Served as the head of the High
Yield group in Europe and as an Emerging Markets portfolio manager.
o Prior to that, four years at Citicorp as a research analyst and structurer
of collateralized mortgage obligations. Prior to Citicorp, served as an
officer in the US Army from 1988 to 1991.
o BS, United States Military Academy (West Point); MBA, New York University,
Stern School of Business.
WILLIAM CHEPOLIS, CFA, MANAGING DIRECTOR. Portfolio Manager of the fund. Joined
the fund in 2005.
o Joined Deutsche Asset Management in 1998 after 13 years of experience as
vice president and portfolio manager for Norwest Bank where he managed the
bank's fixed income and foreign exchange portfolios.
o Portfolio Manager for Retail Fixed Income: New York.
o BIS, University of Minnesota.
ROBERT WANG, MANAGING DIRECTOR. Portfolio Manager of the fund. Joined the fund
in 2007.
o Joined Deutsche Asset Management in 1995 as portfolio manager for asset
allocation after 13 years of experience of trading fixed income, foreign
exchange and derivative products at J.P. Morgan.
o Global Head of Quantitative Strategies Portfolio Management: New York.
o BS, The Wharton School, University of Pennsylvania.
THOMAS PICCIOCHI, DIRECTOR. Portfolio Manager of the fund. Joined the fund in
2007.
o Joined Deutsche Asset Management in 1999, formerly serving as portfolio
manager for Absolute Return Strategies, after 13 years of experience in
various research and analysis positions at State Street Global Advisors,
FPL Energy, Barnett Bank, Trade Finance Corporation and Reserve Financial
Management.
o Senior Portfolio Manager for Quantitative Strategies: New York.
o BA and MBA, University of Miami.
DWS STRATEGIC VALUE VIP
VOLKER DOSCH, MANAGING DIRECTOR. Portfolio Manager of the fund. Joined the fund
in 2009.
o Joined Deutsche Asset Management in 1989.
o Fund Manager of US and global equity funds; Head of US Equities; Deputy Head
of Fund Management International Equities; Head of Sector-Funds: Frankfurt.
o Master's degree in Economics ("Diplom-Volkswirt") from the University of
Frankfurt, Germany.
OLIVER PFEIL, PHD., VICE PRESIDENT. Portfolio Manager of the fund. Joined the
fund in 2009.
93
PROSPECTUS May 1, 2010 Fund Details
o Joined Deutsche Asset Management in 2006 after 3 years as Executive
Assistant to the Management Board of Deutsche Bank. Previously, Research
Fellow at the Swiss Institute of Banking and Finance at the University of
St. Gallen (2000-2002); Visiting Scholar in Capital Markets Research at MIT
Sloan School of Management (2002-2003). Also, serves as part-time Lecturer
in Finance at the University of St. Gallen in Switzerland.
o Portfolio manager for US and global value equity: Frankfurt.
o PhD in finance and accounting and Master's degree in Business Administration
from the University of St. Gallen; CEMS Master in International Management
from the University of St. Gallen & ESADE, Barcelona; completed bank
training program ("Bankkaufmann") at Sal. Oppenheim jr. & Cie. KGaA,
Cologne.
THOMAS SCHUESSLER, PHD., MANAGING DIRECTOR. Portfolio Manager of the fund.
Joined the fund in 2009.
o Joined Deutsche Asset Management in 2001 after five years at Deutsche Bank
where he managed various projects and worked in the office of the Chairman
of the Management Board.
o US and Global Fund Management: Frankfurt.
o PhD, University of Heidelberg, studies in physics and economics at
University of Heidelberg and University of Utah.
DWS TECHNOLOGY VIP
FREDERIC L. FAYOLLE, CFA, DIRECTOR. Lead Portfolio Manager of the fund. Joined
the fund in 2009.
o Joined Deutsche Asset Management and the Technology team in July 2000 after
10 years of experience with Philips Electronics in the USA with
responsibility for Philips's CRT display industry research for North
America.
o Senior fund manager covering technology and internet stocks: Frankfurt.
o MS in Engineering from University of Michigan; MS in Engineering from Ecole
Centrale Paris; MBA with finance concentration from University of Michigan
Business School.
CLARK CHANG, DIRECTOR. Portfolio Manager of the fund. Joined the fund in 2008.
o Joined Deutsche Asset Management in 2007 after seven years of experience as
senior analyst for technology sector for Firsthand Capital Management,
Nollenberger Capital Partners and Fulcrum Global Partners.
o Global Equity analyst for Technology Fund: New York.
o BS in Computer Science from University of California, Los Angeles (UCLA);
MBA with Finance concentration from Anderson School of Management, UCLA.
WALTER HOLICK, DIRECTOR. Portfolio Manager of the fund. Joined the fund in
2009.
o Joined the Company in 1990 as fund manager for global equities: technology,
telecommunication services and media.
o Head of Technology Sector Team; senior fund manager: Frankfurt.
o Master of Social Science in Money, Banking and Finance, University of
Birmingham, UK; Diplom-Kaufmann (German Master's degree in business and
economics), J.W. Goethe-Universit-t, Frankfurt.
DWS TURNER MID CAP GROWTH VIP
CHRISTOPHER K. MCHUGH. Principal at Turner Investment Partners, Inc. and Lead
Manager of the fund. Joined the fund in 2001.
o Joined Turner Investment Partners, Inc. in 1990.
o Began investment career in 1986.
TARA HEDLUND, CFA. Principal at Turner Investment Partners, Inc. and Portfolio
Manager of the fund. Joined the fund in 2006.
o Joined Turner Investment Partners, Inc. in 2000.
o Serves as a security analyst covering the technology and telecommunications
sectors.
o Over 15 years of investment industry experience.
JASON SCHROTBERGER, CFA. Principal at Turner Investment Partners, Inc. and
Portfolio Manager of the fund. Joined the fund in 2006.
o Joined Turner Investment Partners, Inc. in 2001.
o Serves as a security analyst covering the consumer sector.
o Over 16 years of investment industry experience.
Each fund's Statement of Additional Information provides additional information
about a portfolio manager's investments in each fund, a description of the
portfolio management compensation structure and information regarding other
accounts managed.
94
PROSPECTUS May 1, 2010 Fund Details
INVESTING IN THE FUNDS
YOUR INVESTMENT IN THE FUNDS
The information in this section may affect anyone who selects one or more funds
as an investment option in a variable annuity contract or variable life
insurance policy that offers one or more funds. These contracts and policies
are described in separate prospectuses issued by participating insurance
companies. Each fund assumes no responsibility for such prospectuses.
POLICIES ABOUT TRANSACTIONS
The information in this prospectus applies to Class A shares of each fund. Each
fund may offer two classes of shares. Class A shares are offered at net asset
value and are not subject to 12b-1 fees.
Technically, the shareholders of DWS Variable Series II (which include each
fund just described) are the participating insurance companies (the "insurance
companies") that offer each fund as choices for holders of certain variable
annuity contracts or variable life insurance policies (the "contract(s)")
issued or sponsored by the insurance companies. The insurance companies may
pass through voting rights to the contract owners. Each fund does not sell
shares directly to the public. Each fund sells shares only to separate accounts
of insurance companies. As a contract owner, your premium payments are
allocated to a fund by the insurance companies in accordance with your
contract. Please see the contract prospectus that accompanies this prospectus
for a detailed explanation of your contract. Depending on context in the
prospectus, the terms "you" and "yours" refer to either a contract owner or to
the insurance company that issues the contract. References to "buying,"
"purchasing" or "holding" fund shares refer only to the insurance company, not
the contract owner.
Please bear in mind that there are important differences between DWS retail
funds available to any investor (a "Retail Fund") and those that are only
available through certain financial institutions, such as insurance companies.
For example, Retail Funds, unlike a fund, are not sold to insurance company
separate accounts to fund investments in variable insurance contracts. In
addition, the investment objective, policies and strategies of a fund, while
similar to those of a Retail Fund, are not identical. Retail Funds may be
smaller or larger than a fund and have different expense ratios than a fund. As
a result, the performance of a fund and a Retail Fund will differ.
Should any conflict between contract owners arise that would require that a
substantial amount of net assets be withdrawn from a fund, orderly portfolio
management could be disrupted to the potential detriment of shareholders of
that fund.
Each fund has a verification process for new insurance company accounts to help
the government fight the funding of terrorism and money laundering activities.
Federal law requires all financial institutions to obtain, verify and record
information that identifies each insurance company that opens an account. This
means that when an insurance company opens an account, a fund will ask for its
name, address and other information that will allow a fund to identify the
company. This information will be verified to ensure the identity of all
insurance companies opening an account.
For certain insurance companies, a fund might request additional information
(for instance, a fund would ask for documents such as the insurance company's
articles of incorporation) to help a fund verify the insurance company's
identity.
Each fund will not complete the purchase of any shares for an account until all
information has been provided and the application has been submitted in "good
order." Once the application is determined to be in good order, the purchase(s)
will be effected at the net asset value per share next calculated.
Since DWS Money Market VIP will be investing in instruments that normally
require immediate payment in Federal funds (monies credited to a bank's account
with its regional Federal Reserve Bank), that fund has adopted certain
procedures for the convenience of its shareholders and to ensure that DWS Money
Market VIP receives investable funds.
Each fund may reject a new account application if the insurance company doesn't
provide any required or requested identifying information, or for other
reasons.
95
PROSPECTUS May 1, 2010 Investing in the Funds
BUYING AND SELLING SHARES
Each FUND IS OPEN FOR BUSINESS each day the New York Stock Exchange is open.
Each fund calculates its share price every business day, as of the close of
regular trading on the New York Stock Exchange (typically 4 p.m. Eastern time,
but sometimes earlier, as in the case of scheduled half-day trading or
unscheduled suspensions of trading).
Each fund continuously sells shares to each insurance company separate account,
without a sales charge, at the net asset value per share next determined after
a proper purchase order is placed by the insurance company. The insurance
company offers contract owners units in its separate accounts which correspond
to shares in a fund. Each insurance company submits purchase and redemption
orders to a fund based on allocation instructions for premium payments,
transfer instructions and surrender or partial withdrawal requests for contract
owners, as set forth in the accompanying prospectus for the contracts. These
orders reflect the amount of premium payments to be invested, surrender and
transfer requests, and other matters. Redemption orders are effected at the
next net asset value per share determined after a proper redemption order is
placed by the insurance company. Contract owners should look at their contract
prospectuses for redemption procedures and fees.
IMPORTANT INFORMATION ABOUT BUYING AND SELLING SHARES
o After receiving a contract owner's order, the insurance company buys or
sells shares at the net asset value next calculated on any day each fund is
open for business.
o Unless otherwise instructed, each fund normally makes payment of the
proceeds from the sale of shares the next business day but always within
seven calendar days.
o Each fund does not issue share certificates.
o Each fund reserves the right to reject purchases of shares for any reason.
o Each fund reserves the right to withdraw or suspend the offering of shares
at any time.
o Each fund reserves the right to reject purchases of shares or to suspend or
postpone redemptions at times when the New York Stock Exchange is closed
(other than customary closings), trading is restricted or when an emergency
exists that prevents a fund from disposing of its portfolio securities or
pricing its shares.
o Each fund may refuse, cancel or rescind any purchase order; freeze any
account (meaning the insurance company will not be able to purchase shares
in its account); suspend account services; and/or involuntarily redeem the
account if we think that the account is being used for fraudulent or
illegal purposes by the insurance company; one or more of these actions
will be taken when, at the sole discretion of each fund, they are deemed to
be in each fund's best interests or when each fund is requested or
compelled to do so by governmental authority or by applicable law.
o Each fund may close and liquidate an account if a fund is unable to verify
provided information, or for other reasons; if a fund decides to close the
account, the shares will be redeemed at the net asset value per share next
calculated after we determine to close the account; the insurance company
may be subject to gain or loss on the redemption of the fund shares and may
incur tax liability.
o Each fund may pay for shares sold by "redeeming in kind," that is, by
distributing to you marketable securities (which typically will involve
brokerage costs for you to liquidate) rather than cash, but which will be
taxable to the same extent as a redemption for cash; each fund generally
won't make a redemption in kind unless your requests over a 90-day period
total more than $250,000 or 1% of the value of each fund's net assets,
whichever is less.
o A purchase order from an insurance company separate account may not be
accepted if the sale of fund shares has been suspended or if it is
determined that the purchase would be detrimental to the interests of a
fund.
MARKET TIMING POLICIES AND PROCEDURES. Short-term and excessive trading of fund
shares may present risks to each fund's long-term shareholders (as used herein,
the term "shareholders" may refer to the contract owners), including potential
dilution in the value of fund shares, interference with the efficient
management of a fund (including losses on the sale of investments), realized
gains to remaining shareholders and increased brokerage and administrative
costs. These risks may be more pronounced if a fund invests in certain
securities such as those that trade in foreign markets, are illiquid or do not
otherwise have "readily available market quotations." Certain investors may
seek to employ short-term trading strategies aimed at exploiting variations in
fund valuation that arise from the nature of the securities held by a fund
(e.g., "time zone arbitrage"). Each fund has adopted policies and procedures
that are intended to detect and deter short-term and excessive trading.
Pursuant to these policies, each fund reserves the right to reject or cancel a
purchase or exchange order for any reason without prior notice. For example, a
fund may in its discretion reject or cancel a purchase or an exchange order
even if the transaction is not subject to the specific roundtrip transaction
limitation described below if the Advisor believes that there appears to be a
pattern of
96
PROSPECTUS May 1, 2010 Investing in the Funds
short-term or excessive trading activity by a shareholder or deems any other
trading activity harmful or disruptive to a fund. Each fund, through its
Advisor and transfer agent, will measure short-term and excessive trading by
the number of roundtrip transactions within a shareholder's account during a
rolling 12-month period. A "roundtrip" transaction is defined as any
combination of purchase and redemption activity (including exchanges) of the
same fund's shares. Each fund may take other trading activity into account if a
fund believes such activity is of an amount or frequency that may be harmful to
long-term shareholders or disruptive to portfolio management.
Shareholders are limited to four roundtrip transactions in the same fund over a
rolling 12-month period. Shareholders with four or more roundtrip transactions
in the same fund within a rolling 12-month period generally will be blocked
from making additional purchases of, or exchanges into, that fund. Each fund
has sole discretion whether to remove a block from a shareholder's account. The
rights of a shareholder to redeem shares of each fund are not affected by the
four roundtrip transaction limitation.
The Advisor may make exceptions to the roundtrip transaction policy for certain
types of transactions if in its opinion the transactions do not represent
short-term or excessive trading or are not abusive or harmful to each fund,
such as, but not limited to, systematic transactions, required minimum
retirement distributions, transactions initiated by each fund or administrator
and transactions by certain qualified fund-of-fund(s).
In certain circumstances, each fund may rely upon the policy of the insurance
company or other financial intermediary to deter short-term or excessive
trading if the Advisor believes that the policy of such insurance company or
other financial intermediary is reasonably designed to detect and deter
transactions that are not in the best interests of each fund. An insurance
company's or other financial intermediary's policy relating to short-term or
excessive trading may be more or less restrictive than each fund's policies,
may permit certain transactions not permitted by each fund's policies, or
prohibit transactions not subject to each fund's policies.
The Advisor may also accept undertakings from an insurance company or other
financial intermediary to enforce short-term or excessive trading policies on
behalf of each fund that provide a substantially similar level of protection
for each fund against such transactions. For example, certain insurance
companies may have contractual or legal restrictions, or operational
constraints, that prevent them from blocking an account. In such instances, the
Advisor may permit the insurance company to use alternate techniques that the
Advisor considers to be a reasonable substitute for such a block.
In addition, to the extent that each fund invests some portion of its assets in
foreign securities, each fund has adopted certain fair valuation practices
intended to protect each fund from "time zone arbitrage" with respect to its
foreign securities holdings and other trading practices that seek to exploit
variations in fund valuation that arise from the nature of the securities held
by each fund. (See "How each fund Calculates Share Price.")
There is no assurance that these policies and procedures will be effective in
limiting short-term and excessive trading in all cases. For example, the
Advisor may not be able to effectively monitor, detect or limit short-term or
excessive trading by underlying contract holders that occurs through separate
accounts maintained by insurance companies or other financial intermediaries.
The Advisor reviews trading activity at the separate account level to detect
short-term or excessive trading. If the Advisor has reason to suspect that
short-term or excessive trading is occurring at the separate account level, the
Advisor will contact the insurance company or other financial intermediary to
request underlying contract holder activity. Depending on the amount of fund
shares held in such separate account (which may represent most of each fund's
shares), short-term and/or excessive trading of fund shares could adversely
affect long-term shareholders in each fund. If short-term or excessive trading
is identified, the Advisor will take appropriate action.
Each fund's market timing policies and procedures may be modified or terminated
at any time.
Since DWS Money Market VIP holds short-term instruments and is intended to
provide liquidity to shareholders, the Advisor does not monitor or limit
short-term and excessive trading activity in DWS Money Market VIP and,
accordingly, the Board has not approved any policies and procedures designed to
limit this activity. However, the fund reserves the right to and may reject or
cancel a purchase or exchange order into a money market fund for any reason,
including if, in the opinion of the Advisor, there appears to be a pattern of
short-term and excessive trading by an investor in other DWS funds.
HOW TO RECEIVE ACCOUNT INFORMATION
If you are a contract owner, you should contact your insurance company or the
organization that provides record keeping services for information about your
account.
Please see the contract prospectus that accompanies this prospectus for the
customer service phone number.
HOW TO SELECT SHARES
Shares in a fund are available in connection with certain variable annuity and
life insurance arrangements. Each insurance company has different provisions
about how and when their contract owners may select fund shares. Each insurance
company is responsible for communicating its contract owners' instructions to a
fund. Contract owners should contact their insurance company to effect
transactions in connection with a fund.
97
PROSPECTUS May 1, 2010 Investing in the Funds
FINANCIAL INTERMEDIARY SUPPORT PAYMENTS
The Advisor, DWS Investments Distributors, Inc. (the "Distributor") and/or
their affiliates may pay additional compensation, out of their own assets and
not as an additional charge to each fund, to selected affiliated and
unaffiliated brokers, dealers, participating insurance companies or other
financial intermediaries ("financial advisors") in connection with the sale
and/or distribution of fund shares or the retention and/or servicing of fund
investors and fund shares ("revenue sharing"). Such revenue sharing payments
are in addition to any distribution or service fees payable under any Rule
12b-1 or service plan of each fund, any record keeping/sub-transfer agency/
networking fees payable by each fund (generally through the Distributor or an
affiliate) and/or the Distributor to certain financial advisors for performing
such services and any sales charge, commissions, non-cash compensation
arrangements expressly permitted under applicable rules of the Financial
Industry Regulatory Authority or other concessions described in the fee table
or elsewhere in this prospectus or the Statement of Additional Information as
payable to all financial advisors. For example, the Advisor, the Distributor
and/or their affiliates may compensate financial advisors for providing a fund
with "shelf space" or access to a third party platform or fund offering list or
other marketing programs, including, without limitation, inclusion of the fund
on preferred or recommended sales lists, mutual fund "supermarket" platforms
and other formal sales programs; granting the Distributor access to the
financial advisor's sales force; granting the Distributor access to the
financial advisor's conferences and meetings; assistance in training and
educating the financial advisor's personnel; and obtaining other forms of
marketing support.
The level of revenue sharing payments made to financial advisors may be a fixed
fee or based upon one or more of the following factors: gross sales, current
assets and/or number of accounts of each fund attributable to the financial
advisor, the particular fund or fund type or other measures as agreed to by the
Advisor, the Distributor and/or their affiliates and the financial advisors or
any combination thereof. The amount of these revenue sharing payments is
determined at the discretion of the Advisor, the Distributor and/or their
affiliates from time to time, may be substantial, and may be different for
different financial advisors based on, for example, the nature of the services
provided by the financial advisor.
The Advisor, the Distributor and/or their affiliates currently make revenue
sharing payments from their own assets in connection with the sale and/or
distribution of DWS fund shares or the retention and/or servicing of investors
and DWS fund shares to financial advisors in amounts that generally range from
0.01% up to 0.26% of assets of each fund serviced and maintained by the
financial advisor, 0.05% to 0.25% of sales of each fund attributable to the
financial advisor, a flat fee of $4,000 up to $500,000, or any combination
thereof. These amounts are subject to change at the discretion of the Advisor,
the Distributor and/or their affiliates. Receipt of, or the prospect of
receiving, this additional compensation may influence your financial advisor's
recommendation of each fund or of any particular share class of each fund. You
should review your financial advisor's compensation disclosure and/or talk to
your financial advisor to obtain more information on how this compensation may
have influenced your financial advisor's recommendation of each fund.
Additional information regarding these revenue sharing payments is included in
each fund's Statement of Additional Information, which is available to you on
request at no charge (see the back cover of this prospectus for more
information on how to request a copy of the Statement of Additional
Information).
The Advisor, the Distributor and/or their affiliates may also make such revenue
sharing payments to financial advisors under the terms discussed above in
connection with the distribution of both DWS funds and non-DWS funds by
financial advisors to retirement plans that obtain record keeping services from
ADP, Inc. or ExpertPlan Inc. on the DWS Investments branded retirement plan
platform (the "Platform") with the level of revenue sharing payments being
based upon sales of both the DWS funds and the non-DWS funds by the financial
advisor on the Platform or current assets of both the DWS funds and the non-DWS
funds serviced and maintained by the financial advisor on the Platform.
It is likely that broker-dealers that execute portfolio transactions for each
fund will include firms that also sell shares of the DWS funds to their
customers. However, the Advisor will not consider sales of DWS fund shares as a
factor in the selection of broker-dealers to execute portfolio transactions for
the DWS funds. Accordingly, the Advisor has implemented policies and procedures
reasonably designed to prevent its traders from considering sales of DWS fund
shares as a factor in the selection of broker-dealers to execute portfolio
transactions for each fund. In addition, the Advisor, the Distributor and/or
their affiliates will not use fund brokerage to pay for their obligation to
provide additional compensation to financial advisors as described above.
HOW EACH FUND CALCULATES SHARE PRICE
To calculate net asset value per share, or NAV, each fund uses the following
equation:
TOTAL TOTAL TOTAL NUMBER OF
- / = NAV
( )
ASSETS LIABILITIES SHARES OUTSTANDING
The price at which you buy and sell shares for each fund is the NAV.
For DWS Money Market VIP, the share price, or NAV, is normally $1.00 calculated
using amortized cost value (the method used by most money market funds).
98
PROSPECTUS May 1, 2010 Investing in the Funds
FOR THE UNDERLYING FUNDS IN WHICH A FUND INVESTS, WE USE THE NAV OF THE
UNDERLYING FUNDS. FOR OTHER SECURITIES, WE TYPICALLY VALUE SECURITIES USING
INFORMATION FURNISHED BY AN INDEPENDENT PRICING SERVICE OR MARKET QUOTATIONS,
WHERE APPROPRIATE. However, we may use methods approved by the Board, such as a
fair valuation model, which are intended to reflect fair value when pricing
service information or market quotations are not readily available or when a
security's value or a meaningful portion of the value of a fund's portfolio is
believed to have been materially affected by a significant event, such as a
natural disaster, an economic event like a bankruptcy filing, or a substantial
fluctuation in domestic or foreign markets that has occurred between the close
of the exchange or market on which the security is principally traded (for
example, a foreign exchange or market) and the close of the New York Stock
Exchange. In such a case, a fund's value for a security is likely to be
different from the last quoted market price or pricing service information. In
addition, due to the subjective and variable nature of fair value pricing, it
is possible that the value determined for a particular asset may be materially
different from the value realized upon such asset's sale. It is expected that
the greater the percentage of fund assets that is invested in non-US
securities, the more extensive will be a fund's use of fair value pricing. This
is intended to reduce a fund's exposure to "time zone arbitrage" and other
harmful trading practices. (See "Market timing policies and procedures.")
To the extent that a fund invests in securities that are traded primarily in
foreign markets, the value of its holdings could change at a time when you
aren't able to buy or sell fund shares through the contract. This is because
some foreign markets are open on days and at times when each fund doesn't price
the shares.
DISTRIBUTIONS
DWS Money Market VIP intends to declare its net investment income as a dividend
daily and distribute dividends monthly. All other funds intend to declare and
distribute dividends from their net investment income and capital gains, if
any, annually. Each fund may make additional distributions if necessary.
All distributions will be reinvested in shares of a fund unless we are informed
by an insurance company that they should be paid out in cash. The insurance
companies will be informed about the amount and character of distributions from
the relevant fund for federal income tax purposes.
TAXES
Each fund intends to qualify each year as a regulated investment company under
Subchapter M of the Internal Revenue Code of 1986, as amended (the "Code"), and
intends to meet all requirements necessary to avoid paying any federal income
or excise taxes.
Generally, owners of variable annuity and variable life contracts are not
subject to current federal income taxation on income or gains realized with
respect to such contracts. However, some distributions from such contracts,
whether made prior to or during the annuity payment period, may be taxable at
ordinary income tax rates. In addition, distributions made to an owner who is
younger than 59 1-2 may be subject to a 10% penalty tax. For further
information concerning federal income tax consequences for the holders of
variable annuity contracts and variable life insurance policies, such holders
should consult the prospectus used in connection with the issuance of their
particular contracts or policies.
In order for investors to receive the favorable federal income tax treatment
available to holders of variable annuity and variable life contracts, the
separate accounts underlying such contracts, as well as the funds in which such
accounts invest, must meet certain diversification requirements. Each fund
intends to comply with these requirements. If a fund or separate account does
not meet such requirements or fails to qualify as a regulated investment
company for any taxable year, income allocable to the contracts associated with
the separate account may be taxable currently for federal income tax purposes
to the holders of such contracts and income from prior periods with respect to
such contracts also could be taxable, most likely in the year of the failure.
Under Treasury regulations, insurance companies holding the separate accounts
may have to report to the IRS losses above a certain amount resulting from a
sale or disposition of a fund's shares.
The discussion above is generally based on the assumption that shares of a fund
will be respected as owned by insurance company separate accounts. If this is
not the case (for example, because the IRS finds an impermissible level of
"investor control" over the investment options underlying variable contracts),
the advantageous federal income tax treatment provided in respect of insurance
company separate accounts under the Code will no longer be available, and the
person or persons determined to own the fund shares will be currently taxed on
fund distributions, and on the proceeds of any redemption of fund shares, under
the Code.
Fund investments in securities of foreign issuers may be subject to withholding
and other taxes at the source, including on dividend or interest payments.
Participating insurance companies should consult their own tax advisors as to
whether such distributions are subject to federal income tax if they are
retained as part of policy reserves.
Certain of each fund's investments in certain debt obligations may cause each
fund to recognize taxable income in excess of the cash generated by such
obligation. Thus, each fund could be required at times to liquidate other
investments in order to satisfy its distribution requirements.
99
PROSPECTUS May 1, 2010 Investing in the Funds
The preceding is a brief summary of certain of the relevant federal income tax
considerations. Because each shareholder and contract holder's tax situation is
unique, ask your tax professional about the tax consequences of your
investments, including possible federal, foreign, state or local taxes.
100
PROSPECTUS May 1, 2010 Investing in the Funds
FINANCIAL HIGHLIGHTS
The financial highlights are designed to help you understand recent financial
performance. The figures in the first part of each table are for a single
share. The total return figures represent the percentage that an investor in a
fund would have earned (or lost), assuming all dividends and distributions were
reinvested. This information has been audited by Ernst & Young LLP, independent
registered public accounting firm, whose report, along with each fund's
financial statements, is included in each fund's annual report (see
"Shareholder reports" on the back cover). This information doesn't reflect
charges and fees associated with the separate account that invests in the fund
or any variable life insurance policy or variable annuity contract for which
the fund is an investment option. These charges and fees will reduce returns.
DWS ALTERNATIVE ASSET ALLOCATION PLUS VIP - CLASS A
YEAR ENDED DECEMBER 31, 2009(A)
--------------------------------------------------- -----------
SELECTED PER SHARE DATA
------------------------------------------------------------------
NET ASSET VALUE, BEGINNING OF PERIOD $ 10.00
--------------------------------------------------- -------
Income (loss) from investment operations:
Net investment income (loss)(b) .57
--------------------------------------------------- -------
Net realized and unrealized gain (loss) 2.06
--------------------------------------------------- -------
TOTAL FROM INVESTMENT OPERATIONS 2.63
--------------------------------------------------- -------
NET ASSET VALUE, END OF PERIOD $ 12.63
--------------------------------------------------- -------
Total Return (%)(c,d) 26.30**
--------------------------------------------------- -------
RATIOS TO AVERAGE NET ASSETS AND SUPPLEMENTAL DATA
------------------------------------------------------------------
Net assets, end of period ($ millions) 1
--------------------------------------------------- -------
Ratio of expenses before expense reductions (%)(e) 11.67*
---------------------------------------------------- -------
Ratio of expenses after expense reductions (%)(e) .21*
---------------------------------------------------- -------
Ratio of net investment income (%) 5.39*
---------------------------------------------------- -------
Portfolio turnover rate (%) 155**
---------------------------------------------------- -------
(a) For the period from February 2, 2009 (commencement of operations of
Class A shares) to December 31, 2009.
(b) Based on average shares outstanding during the period.
(c) Total return would have been lower had certain expenses not been
reduced.
(d) Total return would have been lower if the Advisor had not reduced
some Underlying Funds' expenses.
(e) The Portfolio invests in other Funds and indirectly bears its
proportionate share of fees and expenses incurred by the Underlying
Funds and non-affiliated funds in which the Portfolio is invested.
This ratio does not include these indirect fees and expenses.
* Annualized
** Not annualized
101
PROSPECTUS May 1, 2010 Financial Highlights
DWS BALANCED VIP - CLASS A
YEARS ENDED DECEMBER 31, 2009 2008
------------------------------------------------ ----------- -----------------
SELECTED PER SHARE DATA
------------------------------------------------------------------------------
NET ASSET VALUE, BEGINNING OF PERIOD $ 17.35 $ 24.81
------------------------------------------------ -------- ----------
Income (loss) from investment operations:
Net investment income(a) .44 .61
------------------------------------------------ -------- ----------
Net realized and unrealized gain (loss) 3.43 ( 7.20)
------------------------------------------------ -------- ----------
TOTAL FROM INVESTMENT OPERATIONS 3.87 ( 6.59)
------------------------------------------------ -------- ----------
Less distributions from:
Net investment income ( .70) ( .87)
------------------------------------------------ -------- ----------
NET ASSET VALUE, END OF PERIOD $ 20.52 $ 17.35
------------------------------------------------ -------- ----------
Total Return (%) 23.43 (27.33)(b)
------------------------------------------------ -------- ----------
RATIOS TO AVERAGE NET ASSETS AND SUPPLEMENTAL DATA
-------------------------------------------------------------------------------
Net assets, end of period ($ millions) 319 307
------------------------------------------------ -------- ----------
Ratio of expenses before expense reductions (%) .60 .64
------------------------------------------------ -------- ----------
Ratio of expenses after expense reductions (%) .60 .62
------------------------------------------------ -------- ----------
Ratio of net investment income (%) 2.40 2.83
------------------------------------------------ -------- ----------
Portfolio turnover rate (%) 207 263
------------------------------------------------ -------- ----------
YEARS ENDED DECEMBER 31, 2007 2006 2005
------------------------------------------------ ---------------- -------------------- ----------------
SELECTED PER SHARE DATA
-------------------------------------------------------------------------------------- -
NET ASSET VALUE, BEGINNING OF PERIOD $ 24.46 $ 22.75 $ 22.37
------------------------------------------------- --------- ---------- ---------
Income (loss) from investment operations:
Net investment income(a) .74 .69 (c) .59
------------------------------------------------- --------- ---------- ---------
Net realized and unrealized gain (loss) .42 1.60 .34
------------------------------------------------- --------- ---------- ---------
TOTAL FROM INVESTMENT OPERATIONS 1.16 2.29 .93
------------------------------------------------- --------- ---------- ---------
Less distributions from:
Net investment income ( .81) ( .58) ( .55)
------------------------------------------------- --------- ---------- ---------
NET ASSET VALUE, END OF PERIOD $ 24.81 $ 24.46 $ 22.75
------------------------------------------------- --------- ---------- ---------
Total Return (%) 4.84 (b) 10.24 (b,c) 4.30 (b)
------------------------------------------------- --------- ---------- ---------
RATIOS TO AVERAGE NET ASSETS AND SUPPLEMENTAL DATA
--------------------------------------------------------------------------------------------------------
Net assets, end of period ($ millions) 528 600 653
------------------------------------------------- --------- ---------- ---------
Ratio of expenses before expense reductions (%) .52 .55 .55
------------------------------------------------- --------- ---------- ---------
Ratio of expenses after expense reductions (%) .51 .51 .53
------------------------------------------------- --------- ---------- ---------
Ratio of net investment income (%) 3.00 2.99 (c) 2.66
------------------------------------------------- --------- ---------- ---------
Portfolio turnover rate (%) 199 108 122
------------------------------------------------- --------- ---------- ---------
(a) Based on average shares outstanding during the period.
(b) Total return would have been lower had certain expenses not been
reduced.
(c) Includes non-recurring income from the Advisor recorded as a result
of an administrative proceeding regarding disclosure of brokerage
allocation practices in connection with sales of DWS Funds. The
non-recurring income resulted in an increase in net investment
income of $0.024 per share and an increase in the ratio of net
investment income of 0.10%. Excluding this non-recurring income,
total return would have been 0.10% lower.
DWS BLUE CHIP VIP - CLASS A
YEARS ENDED DECEMBER 31, 2009 2008 2007 2006 2005
------------------------------------------------ ---------- ----------------- ----------- ---------------- -----------
SELECTED PER SHARE DATA
-----------------------------------------------------------------------------------------------------------------------------
NET ASSET VALUE, BEGINNING OF PERIOD $ 7.25 $ 14.65 $ 16.17 $ 14.88 $ 13.65
------------------------------------------------ ------- --------- -------- -------- --------
Income (loss) from investment operations:
Net investment income(a) .12 .12 .17 .17 (c) .14
------------------------------------------------ ------- --------- -------- -------- --------
Net realized and unrealized gain (loss) 2.27 ( 4.97) .36 2.07 1.22
------------------------------------------------ ------- --------- -------- -------- --------
TOTAL FROM INVESTMENT OPERATIONS 2.39 ( 4.85) .53 2.24 1.36
------------------------------------------------ ------- --------- -------- -------- --------
Less distributions from:
Net investment income ( .15) ( .21) ( .18) ( .14) ( .13)
------------------------------------------------ ------- --------- -------- -------- --------
Net realized gains - ( 2.34) ( 1.87) ( .81) -
------------------------------------------------ ------- --------- -------- -------- --------
TOTAL DISTRIBUTIONS ( .15) ( 2.55) ( 2.05) ( .95) ( .13)
------------------------------------------------ ------- --------- -------- -------- --------
NET ASSET VALUE, END OF PERIOD $ 9.49 $ 7.25 $ 14.65 $ 16.17 $ 14.88
------------------------------------------------ ------- --------- -------- -------- --------
Total Return (%) 33.97 (38.49)(b) 3.50 15.65 (c) 10.06
------------------------------------------------ ------- --------- -------- -------- --------
RATIOS TO AVERAGE NET ASSETS AND SUPPLEMENTAL DATA
-----------------------------------------------------------------------------------------------------------------------------
Net assets, end of period ($ millions) 111 106 242 314 294
------------------------------------------------ ------- --------- -------- -------- --------
Ratio of expenses before expense reductions (%) .75 .76 .71 .71 .70
------------------------------------------------- ------- --------- -------- -------- --------
Ratio of expenses after expense reductions (%) .75 .76 .71 .71 .70
------------------------------------------------- ------- --------- -------- -------- --------
Ratio of net investment income (%) 1.54 1.12 1.13 1.12 (c) 1.00
------------------------------------------------- ------- --------- -------- -------- --------
Portfolio turnover rate (%) 82 127 275 226 288
------------------------------------------------- ------- --------- -------- -------- --------
(a) Based on average shares outstanding during the period.
(b) Total return would have been lower had certain expenses not been
reduced.
(c) Includes non-recurring income from the Advisor recorded as a result
of an administrative proceeding regarding disclosure of brokerage
allocation practices in connection with sales of DWS Funds. The
non-recurring income resulted in an increase in net investment
income of $0.003 per share and an increase in the ratio of net
investment income of 0.02%. Excluding this non-recurring income,
total return would have been 0.02% lower.
102
PROSPECTUS May 1, 2010 Financial Highlights
From December 2, 2005 through February 27, 2009, Aberdeen Asset Management Inc.
served as the fund's subadvisor and was primarily responsible for the day to
day management of the fund. Performance would have been different if the fund's
current investment strategy had been in effect.
DWS CORE FIXED INCOME VIP - CLASS A
YEARS ENDED DECEMBER 31, 2009 2008 2007 2006 2005
------------------------------------------------ --------------- ----------------- ----------- ----------- -----------
SELECTED PER SHARE DATE
-----------------------------------------------------------------------------------------------------------------------------
NET ASSET VALUE, BEGINNING OF PERIOD $ 8.90 $ 11.82 $ 11.86 $ 11.81 $ 12.07
------------------------------------------------ ------- --------- -------- ------- --------
Income (loss) from investment operations:
Net investment income(a) .39 .57 .56 .53 .47
------------------------------------------------ ------- --------- -------- ------- --------
Net realized and unrealized gain (loss) .24 ( 2.72) ( .08) ( .05) ( .21)
------------------------------------------------ ------- --------- -------- ------- --------
TOTAL FROM INVESTMENT OPERATIONS .63 ( 2.15) .48 .48 .26
------------------------------------------------ ------- --------- -------- ------- --------
Less distributions from:
Net investment income ( .76) ( .77) ( .52) ( .43) ( .41)
------------------------------------------------ ------- --------- -------- ------- --------
Net realized gains - - - ( .00)* ( .11)
------------------------------------------------ ------- --------- -------- ------- --------
TOTAL DISTRIBUTIONS ( .76) ( .77) ( .52) ( .43) ( .52)
------------------------------------------------ ------- --------- -------- ------- --------
NET ASSET VALUE, END OF PERIOD $ 8.77 $ 8.90 $ 11.82 $ 11.86 $ 11.81
------------------------------------------------ ------- --------- -------- ------- --------
Total Return (%) 7.72 (c) (19.33)(b) 4.17 4.26 2.25
------------------------------------------------ ------- --------- -------- ------- --------
RATIOS TO AVERAGE NET ASSETS AND SUPPLEMENTAL DATA
-----------------------------------------------------------------------------------------------------------------------------
Net assets, end of period ($ millions) 94 110 186 277 252
------------------------------------------------ ------- --------- -------- ------- --------
Ratio of expenses before expense reductions (%) .59 .70 .66 .68 .67
------------------------------------------------- ------- --------- -------- ------- --------
Ratio of expenses after expense reductions (%) .59 .70 .66 .68 .67
------------------------------------------------- ------- --------- -------- ------- --------
Ratio of net investment income (%) 4.50 5.36 4.78 4.56 3.96
------------------------------------------------- ------- --------- -------- ------- --------
Portfolio turnover rate (%) 222 215 209 198 241
------------------------------------------------- ------- --------- -------- ------- --------
(a) Based on average shares outstanding during the period.
(b) Total returns would have been lower had certain expenses not been
reduced.
(c) Includes a reimbursement from the Advisor to reimburse the effect of
losses incurred as the result of certain operation errors during the
period. Excluding this reimbursement, total return would have been
0.02% lower.
* Amount is less than $.005
103
PROSPECTUS May 1, 2010 Financial Highlights
Prior to May 1, 2009, the fund was named DWS International Select Equity VIP
and operated with a different investment strategy. Performance may have been
different if the fund's current policies had been in effect.
DWS DIVERSIFIED INTERNATIONAL EQUITY VIP - CLASS A
YEARS ENDED DECEMBER 31, 2009 2008 2007 2006 2005
------------------------------------------------ ---------- --------------------- ----------- ---------------- -----------
SELECTED PER SHARE DATA
---------------------------------------------------------------------------------------------------------------------------------
NET ASSET VALUE, BEGINNING OF PERIOD $ 6.22 $ 16.76 $ 16.31 $ 13.25 $ 11.91
------------------------------------------------ ------- ---------- -------- -------- --------
Income (loss) from investment operations:
Net investment income(a) .12 .33 (d) .25 .24 (b) .20
------------------------------------------------ ------- ---------- -------- -------- --------
Net realized and unrealized gain (loss) 1.51 ( 6.67) 2.24 3.11 1.48
------------------------------------------------ ------- ---------- -------- -------- --------
TOTAL FROM INVESTMENT OPERATIONS 1.63 ( 6.34) 2.49 3.35 1.68
------------------------------------------------ ------- ---------- -------- -------- --------
Less distributions from:
Net investment income ( .40) ( .13) ( .46) ( .29) ( .34)
------------------------------------------------ ------- ---------- -------- -------- --------
Net realized gains - ( 4.07) ( 1.58) - -
------------------------------------------------ ------- ---------- -------- -------- --------
TOTAL DISTRIBUTIONS ( .40) ( 4.20) ( 2.04) ( .29) ( .34)
------------------------------------------------ ------- ---------- -------- -------- --------
NET ASSET VALUE, END OF PERIOD $ 7.45 $ 6.22 $ 16.76 $ 16.31 $ 13.25
------------------------------------------------ ------- ---------- -------- -------- --------
Total Return (%) 29.36 (48.81)(c,e) 16.71 25.56 14.51
------------------------------------------------ ------- ---------- -------- -------- --------
RATIOS TO AVERAGE NET ASSETS AND SUPPLEMENTAL DATA
---------------------------------------------------------------------------------------------------------------------------------
Net assets, end of period ($ millions) 86 91 236 223 196
------------------------------------------------ ------- ---------- -------- -------- --------
Ratio of expenses before expense reductions (%) .94 1.02 .93 .88 .87
------------------------------------------------- ------- ---------- -------- -------- --------
Ratio of expenses after expense reductions (%) .94 1.01 .93 .88 .87
------------------------------------------------- ------- ---------- -------- -------- --------
Ratio of net investment income (%) 1.89 3.04 (d) 1.53 1.65 (b) 1.59
------------------------------------------------- ------- ---------- -------- -------- --------
Portfolio turnover rate (%) 139 132 117 122 93
------------------------------------------------- ------- ---------- -------- -------- --------
(a) Based on average shares outstanding during the period.
(b) Net investment income per share and the ratio of net investment
income without non-recurring dividend income amounting to $0.20 per
share and 1.39% of average daily net assets, respectively.
(c) Total return would have been lower had certain expenses not been
reimbursed.
(d) Net investment income per share and ratio of net investment income
include non-recurring dividend income amounting to $0.16 per share
and 1.49% of average daily net assets, respectively.
(e) Includes a reimbursement from the Advisor to reimburse the effect of
losses incurred as the result of certain operation errors during the
period. Excluding this reimbursement, total return would have been
0.14% lower.
104
PROSPECTUS May 1, 2010 Financial Highlights
Prior to November 3, 2006, the fund was named DWS Dreman Small Cap Value VIP
and operated with a different investment strategy. Performance may have been
different if the fund's current policies had been in effect.
DWS DREMAN SMALL MID CAP VALUE VIP - CLASS A
YEARS ENDED DECEMBER 31, 2009 2008 2007 2006 2005
------------------------------------------------ ---------- ----------------- ----------- ----------- -----------
SELECTED PER SHARE DATA
------------------------------------------------------------------------------------------------------------------------
NET ASSET VALUE, BEGINNING OF PERIOD $ 7.93 $ 20.12 $ 22.93 $ 19.98 $ 20.05
------------------------------------------------ ------- --------- -------- -------- --------
Income (loss) from investment operations:
Net investment income (loss)(a) .16 .13 .18 .15 .19
------------------------------------------------ ------- --------- -------- -------- --------
Net realized and unrealized gain (loss) 2.11 ( 4.92) .54 4.69 1.67
------------------------------------------------ ------- --------- -------- -------- --------
TOTAL FROM INVESTMENT OPERATIONS 2.27 ( 4.79) .72 4.84 1.86
------------------------------------------------ ------- --------- -------- -------- --------
Less distributions from:
Net investment income ( .16) ( .29) ( .23) ( .18) ( .15)
------------------------------------------------ ------- --------- -------- -------- --------
Net realized gains - ( 7.11) ( 3.30) ( 1.71) ( 1.78)
------------------------------------------------ ------- --------- -------- -------- --------
TOTAL DISTRIBUTIONS ( .16) ( 7.40) ( 3.53) ( 1.89) ( 1.93)
------------------------------------------------ ------- --------- -------- -------- --------
NET ASSET VALUE, END OF PERIOD $ 10.04 $ 7.93 $ 20.12 $ 22.93 $ 19.98
------------------------------------------------ ------- --------- -------- -------- --------
Total Return (%) 29.70 (33.42)(b) 3.06 25.06 10.25
------------------------------------------------ ------- --------- -------- -------- --------
RATIOS TO AVERAGE NET ASSETS AND SUPPLEMENTAL DATA
------------------------------------------------------------------------------------------------------------------------
Net assets, end of period ($ millions) 235 223 468 562 493
------------------------------------------------ ------- --------- -------- -------- --------
Ratio of expenses before expense reductions (%) .79 .83 .78 .79 .79
------------------------------------------------- ------- --------- -------- -------- --------
Ratio of expenses after expense reductions (%) .79 .82 .78 .79 .79
------------------------------------------------- ------- --------- -------- -------- --------
Ratio of net investment income (%) 1.92 1.13 .85 .71 .96
------------------------------------------------- ------- --------- -------- -------- --------
Portfolio turnover rate (%) 72 49 110 52 61
------------------------------------------------- ------- --------- -------- -------- --------
(a) Based on average shares outstanding during the period.
(b) Total return would have been lower had certain expenses not been
reduced.
DWS GLOBAL THEMATIC VIP - CLASS A
YEARS ENDED DECEMBER 31, 2009 2008 2007 2006 2005
------------------------------------------------ ---------- ----------- ----------- ---------------- -----------
SELECTED PER SHARE DATA
-----------------------------------------------------------------------------------------------------------------------
NET ASSET VALUE, BEGINNING OF PERIOD $ 5.84 $ 15.66 $ 17.39 $ 14.44 $ 11.78
------------------------------------------------ ------- -------- -------- -------- --------
Income (loss) from investment operations:
Net investment income (loss)(a) .08 .11 .14 .15 (c) .12
------------------------------------------------ ------- -------- -------- -------- --------
Net realized and unrealized gain (loss) 2.42 ( 5.83) .88 4.02 2.58
------------------------------------------------ ------- -------- -------- -------- --------
TOTAL FROM INVESTMENT OPERATIONS 2.50 ( 5.72) 1.02 4.17 2.70
------------------------------------------------ ------- -------- -------- -------- --------
Less distributions from:
Net investment income ( .10) ( .19) ( .11) ( .09) ( .04)
------------------------------------------------ ------- -------- -------- -------- --------
Net realized gains - ( 3.91) ( 2.64) ( 1.13) -
------------------------------------------------ ------- -------- -------- -------- --------
TOTAL DISTRIBUTIONS ( .10) ( 4.10) ( 2.75) ( 1.22) ( .04)
------------------------------------------------ ------- -------- -------- -------- --------
NET ASSET VALUE, END OF PERIOD $ 8.24 $ 5.84 $ 15.66 $ 17.39 $ 14.44
------------------------------------------------ ------- -------- -------- -------- --------
Total Return (%)(b) 43.82 (47.75) 6.29 30.14 (c) 22.94
------------------------------------------------ ------- -------- -------- -------- --------
RATIOS TO AVERAGE NET ASSETS AND SUPPLEMENTAL DATA
-----------------------------------------------------------------------------------------------------------------------
Net assets, end of period ($ millions) 66 59 151 143 85
------------------------------------------------ ------- -------- -------- -------- --------
Ratio of expenses before expense reductions (%) 1.38 1.47 1.44 1.38 1.41
------------------------------------------------- ------- -------- -------- -------- --------
Ratio of expenses after expense reductions (%) 1.04 1.09 1.11 1.04 1.28
------------------------------------------------- ------- -------- -------- -------- --------
Ratio of net investment income (%) 1.23 1.09 .82 .92 (c) .98
------------------------------------------------- ------- -------- -------- -------- --------
Portfolio turnover rate (%) 190 229 191 136 95
------------------------------------------------- ------- -------- -------- -------- --------
(a) Based on average shares outstanding during the period.
(b) Total return would have been lower had certain expenses not been
reduced.
(c) Includes non-recurring income from the Advisor recorded as a result
of an administrative proceeding regarding disclosure of brokerage
allocation practices in connection with sales of DWS Funds. The
non-recurring income resulted in an increase in net investment
income of $0.004 per share and an increase in the ratio of net
investment income of 0.03%. Excluding this non-recurring income,
total return would have been 0.02% lower.
105
PROSPECTUS May 1, 2010 Financial Highlights
DWS GOVERNMENT & AGENCY SECURITIES VIP - CLASS A
YEARS ENDED DECEMBER 31, 2009 2008 2007 2006 2005
------------------------------------------------ ----------- ---------------- ---------------- ----------- -----------
SELECTED PER SHARE DATA
-----------------------------------------------------------------------------------------------------------------------------
NET ASSET VALUE, BEGINNING OF PERIOD $ 12.40 $ 12.38 $ 12.28 $ 12.26 $ 12.55
------------------------------------------------ -------- -------- -------- -------- --------
Income (loss) from investment operations:
Net investment income(a) .52 .56 .58 .55 .51
------------------------------------------------ -------- -------- -------- -------- --------
Net realized and unrealized gain (loss) .45 .04 .12 ( .06) ( .20)
------------------------------------------------ -------- -------- -------- -------- --------
TOTAL FROM INVESTMENT OPERATIONS .97 .60 .70 .49 .31
------------------------------------------------ -------- -------- -------- -------- --------
Less distributions from:
Net investment income ( .59) ( .58) ( .60) ( .47) ( .50)
------------------------------------------------ -------- -------- -------- -------- --------
Net realized gains - - - - ( .10)
------------------------------------------------ -------- -------- -------- -------- --------
TOTAL DISTRIBUTIONS ( .59) ( .58) ( .60) ( .47) ( .60)
------------------------------------------------ -------- -------- -------- -------- --------
NET ASSET VALUE, END OF PERIOD $ 12.78 $ 12.40 $ 12.38 $ 12.28 $ 12.26
------------------------------------------------ -------- -------- -------- -------- --------
Total Return (%) 8.08 4.93 (b) 5.95 (b) 4.16 2.57
------------------------------------------------ -------- -------- -------- -------- --------
RATIOS TO AVERAGE NET ASSETS AND SUPPLEMENTAL DATA
-----------------------------------------------------------------------------------------------------------------------------
Net assets, end of period ($ millions) 169 211 199 211 243
------------------------------------------------ -------- -------- -------- -------- --------
Ratio of expenses before expense reductions (%) .58 .66 .66 .67 .63
------------------------------------------------- -------- -------- -------- -------- --------
Ratio of expenses after expense reductions (%) .58 .65 .63 .67 .63
------------------------------------------------- -------- -------- -------- -------- --------
Ratio of net investment income (%) 4.16 4.58 4.77 4.56 4.17
------------------------------------------------- -------- -------- -------- -------- --------
Portfolio turnover rate (%) 390 543 465 241 191
------------------------------------------------- -------- -------- -------- -------- --------
(a) Based on average shares outstanding during the period.
(b) Total return would have been lower had certain expenses not been
reduced.
DWS HIGH INCOME VIP - CLASS A
YEARS ENDED DECEMBER 31, 2009 2008 2007 2006 2005
------------------------------------------------ ---------- ----------------- ---------- ---------- ----------
SELECTED PER SHARE DATA
---------------------------------------------------------------------------------------------------------------------
NET ASSET VALUE, BEGINNING OF PERIOD $ 5.30 $ 7.81 $ 8.38 $ 8.23 $ 8.78
------------------------------------------------ ------- --------- ------- ------- -------
Income (loss) from investment operations:
Net investment income(a) .51 .57 .63 .62 .68
------------------------------------------------ ------- --------- ------- ------- -------
Net realized and unrealized gain (loss) 1.40 ( 2.29) ( .54) .19 ( .38)
------------------------------------------------ ------- --------- ------- ------- -------
TOTAL FROM INVESTMENT OPERATIONS 1.91 ( 1.72) .09 .81 .30
------------------------------------------------ ------- --------- ------- ------- -------
Less distributions from:
Net investment income ( .66) ( .79) ( .66) ( .66) ( .85)
------------------------------------------------ ------- --------- ------- ------- -------
NET ASSET VALUE, END OF PERIOD $ 6.55 $ 5.30 $ 7.81 $ 8.38 $ 8.23
------------------------------------------------ ------- --------- ------- ------- -------
Total Return (%) 39.99 (23.94)(b) .96 10.47 3.89
------------------------------------------------ ------- --------- ------- ------- -------
RATIOS TO AVERAGE NET ASSETS AND SUPPLEMENTAL DATA
---------------------------------------------------------------------------------------------------------------------
Net assets, end of period ($ millions) 197 154 248 322 344
------------------------------------------------ ------- --------- ------- ------- -------
Ratio of expenses before expense reductions (%) .67 .80 .69 .71 .70
------------------------------------------------- ------- --------- ------- ------- -------
Ratio of expenses after expense reductions (%) .67 .79 .69 .71 .70
------------------------------------------------- ------- --------- ------- ------- -------
Ratio of net investment income (%) 8.81 8.42 7.84 7.73 8.27
------------------------------------------------- ------- --------- ------- ------- -------
Portfolio turnover rate (%) 66 38 61 93 100
------------------------------------------------- ------- --------- ------- ------- -------
(a) Based on average shares outstanding during the period.
(b) Total return would have been lower had certain expenses not been
reduced.
106
PROSPECTUS May 1, 2010 Financial Highlights
DWS LARGE CAP VALUE VIP - CLASS A
YEARS ENDED DECEMBER 31, 2009 2008
------------------------------------------------ ---------- -----------------
SELECTED PER SHARE DATA
------------------------------------------------------------------------------
NET ASSET VALUE, BEGINNING OF PERIOD $ 8.92 $ 19.21
------------------------------------------------ ------- ----------
Income (loss) from investment operations:
Net investment income (loss)(a) .21 .21
------------------------------------------------ ------- ----------
Net realized and unrealized gain (loss) 1.97 ( 5.68)
------------------------------------------------ ------- ----------
TOTAL FROM INVESTMENT OPERATIONS 2.18 ( 5.47)
------------------------------------------------ ------- ----------
Less distributions from:
Net investment income ( .24) ( .34)
------------------------------------------------ ------- ----------
Net realized gains - ( 4.48)
------------------------------------------------ ------- ----------
TOTAL DISTRIBUTIONS ( .24) ( 4.82)
------------------------------------------------ ------- ----------
NET ASSET VALUE, END OF PERIOD $ 10.86 $ 8.92
------------------------------------------------ ------- ----------
Total Return (%) 25.37 (36.40)(b)
------------------------------------------------ ------- ----------
RATIOS TO AVERAGE NET ASSETS AND SUPPLEMENTAL DATA
------------------------------------------------------------------------------
Net assets, end of period ($ millions) 214 118
------------------------------------------------ ------- ----------
Ratio of expenses before expense reductions (%) .76 .87
------------------------------------------------ ------- ----------
Ratio of expenses after expense reductions (%) .76 .86
------------------------------------------------ ------- ----------
Ratio of net investment income (loss) (%) 2.22 1.59
------------------------------------------------ ------- ----------
Portfolio turnover rate (%) 76 97
------------------------------------------------ ------- ----------
YEARS ENDED DECEMBER 31, 2007 2006 2005
------------------------------------------------ -------------------- ---------------- ----------------
SELECTED PER SHARE DATA
--------------------------------------------------------------------------------------------------------
NET ASSET VALUE, BEGINNING OF PERIOD $ 17.96 $ 15.81 $ 15.79
------------------------------------------------- ---------- --------- ---------
Income (loss) from investment operations:
Net investment income (loss)(a) .26 .29 (c) .26
------------------------------------------------- ---------- --------- ---------
Net realized and unrealized gain (loss) 1.98 2.12 .04
------------------------------------------------- ---------- --------- ---------
TOTAL FROM INVESTMENT OPERATIONS 2.24 2.41 .30
------------------------------------------------- ---------- --------- ---------
Less distributions from:
Net investment income ( .32) ( .26) ( .28)
------------------------------------------------- ---------- --------- ---------
Net realized gains ( .67) - -
------------------------------------------------- ---------- --------- ---------
TOTAL DISTRIBUTIONS ( .99) ( .26) ( .28)
------------------------------------------------- ---------- --------- ---------
NET ASSET VALUE, END OF PERIOD $ 19.21 $ 17.96 $ 15.81
------------------------------------------------- ---------- --------- ---------
Total Return (%) 13.15 (b,d) 15.41 (c) 1.97 (b)
------------------------------------------------- ---------- --------- ---------
RATIOS TO AVERAGE NET ASSETS AND SUPPLEMENTAL DATA
--------------------------------------------------------------------------------------------------------
Net assets, end of period ($ millions) 229 275 268
------------------------------------------------- ---------- --------- ---------
Ratio of expenses before expense reductions (%) .83 .83 .80
------------------------------------------------- ---------- --------- ---------
Ratio of expenses after expense reductions (%) .82 .83 .80
------------------------------------------------- ---------- --------- ---------
Ratio of net investment income (loss) (%) 1.43 1.73 (c) 1.64
------------------------------------------------- ---------- --------- ---------
Portfolio turnover rate (%) 103 76 64
------------------------------------------------- ---------- --------- ---------
(a) Based on average shares outstanding during the period.
(b) Total return would have been lower had certain expenses not been
reduced.
(c) Includes non-recurring income from the Advisor recorded as a result
of an administrative proceeding regarding disclosure of brokerage
allocation practices in connection with sales of DWS Funds. The
non-recurring income resulted in an increase in net investment
income of $0.008 per share and an increase in the ratio of net
investment income of 0.04%. Excluding this non-recurring income,
total return would have been 0.04% lower.
(d) Includes a reimbursement from the Advisor to reimburse the effect of
losses incurred as the result of certain operation errors during the
period. Excluding this reimbursement, total return would have been
0.04% lower.
Prior to October 28, 2005, the fund was named Scudder Aggressive Growth
Portfolio and operated with a different objective and investment strategy.
Performance may have been different if the fund's current policies had been in
effect.
DWS MID CAP GROWTH VIP - CLASS A
YEARS ENDED DECEMBER 31, 2009 2008 2007 2006 2005
------------------------------------------------ ---------- ----------- ----------- ---------------- ----------
SELECTED PER SHARE DATA
----------------------------------------------------------------------------------------------------------------------
NET ASSET VALUE, BEGINNING OF PERIOD $ 6.80 $ 13.61 $ 12.56 $ 11.32 $ 9.84
------------------------------------------------ ------- -------- -------- -------- -------
Income (loss) from investment operations:
Net investment income (loss)(a) ( .02) ( .02) ( .05) ( .06)(c) ( .05)
------------------------------------------------ ------- -------- -------- -------- -------
Net realized and unrealized gain (loss) 2.95 ( 6.79) 1.10 1.30 1.53
------------------------------------------------ ------- -------- -------- -------- -------
TOTAL FROM INVESTMENT OPERATIONS 2.93 ( 6.81) 1.05 1.24 1.48
------------------------------------------------ ------- -------- -------- -------- -------
NET ASSET VALUE, END OF PERIOD $ 9.73 $ 6.80 $ 13.61 $ 12.56 $ 11.32
------------------------------------------------ ------- -------- -------- -------- -------
Total Return (%)(b) 43.09 (50.04) 8.36 10.95 (c) 15.04
------------------------------------------------ ------- -------- -------- -------- -------
RATIOS TO AVERAGE NET ASSETS AND SUPPLEMENTAL DATA
----------------------------------------------------------------------------------------------------------------------
Net assets, end of period ($ millions) 22 18 51 53 57
------------------------------------------------ ------- -------- -------- -------- -------
Ratio of expenses before expense reductions (%) 1.17 1.17 1.05 1.03 1.01
------------------------------------------------- ------- -------- -------- -------- -------
Ratio of expenses after expense reductions (%) .92 1.02 .90 .93 .95
------------------------------------------------- ------- -------- -------- -------- -------
Ratio of net investment income (loss) (%) ( .21) ( .19) ( .38) ( .51)(c) ( .45)
------------------------------------------------- ------- -------- -------- -------- -------
Portfolio turnover rate (%) 89 82 68 46 104
------------------------------------------------- ------- -------- -------- -------- -------
(a) Based on average shares outstanding during the period.
(b) Total return would have been lower had certain expenses not been
reduced.
(c) Includes non-recurring income from the Advisor recorded as a result
of an administrative proceeding regarding disclosure of brokerage
allocation practices in connection with sales of DWS Funds. The
non-recurring income resulted in an increase in net investment
income of $0.003 per share and an increase in the ratio of net
investment income of 0.03%. Excluding this non-recurring income,
total return would have been 0.03% lower.
107
PROSPECTUS May 1, 2010 Financial Highlights
DWS MONEY MARKET VIP - CLASS A
YEARS ENDED DECEMBER 31, 2009 2008 2007 2006 2005
------------------------------------------------ ----------- ---------------- ---------------- ---------------- -----------
SELECTED PER SHARE DATA
----------------------------------------------------------------------------------------------------------------------------------
NET ASSET VALUE, BEGINNING OF PERIOD $ 1.000 $ 1.000 $ 1.000 $ 1.000 $ 1.000
------------------------------------------------ -------- -------- -------- -------- --------
Income from investment operations:
Net investment income .003 .026 .049 .046 .028
------------------------------------------------ -------- -------- -------- -------- --------
TOTAL FROM INVESTMENT OPERATIONS .003 .026 .049 .046 .028
------------------------------------------------ -------- -------- -------- -------- --------
Less distributions from:
Net investment income ( .003) ( .026) ( .049) ( .046) ( .028)
------------------------------------------------ -------- -------- -------- -------- --------
NET ASSET VALUE, END OF PERIOD $ 1.000 $ 1.000 $ 1.000 $ 1.000 $ 1.000
------------------------------------------------ -------- -------- -------- -------- --------
Total Return (%) .34 2.64 (a) 5.00 (a) 4.65 (a) 2.80
------------------------------------------------ -------- -------- -------- -------- --------
RATIOS TO AVERAGE NET ASSETS AND SUPPLEMENTAL DATA
----------------------------------------------------------------------------------------------------------------------------------
Net assets, end of period ($ millions) 270 398 355 294 235
------------------------------------------------ -------- -------- -------- -------- --------
Ratio of expenses before expense reductions (%) .43 .52 .46 .52 .52
------------------------------------------------- -------- -------- -------- -------- --------
Ratio of expenses after expense reductions (%) .43 .50 .45 .51 .52
------------------------------------------------- -------- -------- -------- -------- --------
Ratio of net investment income (%) .37 2.56 4.88 4.58 2.77
------------------------------------------------- -------- -------- -------- -------- --------
(a) Total return would have been lower had certain expenses not been
reduced.
DWS SMALL CAP GROWTH VIP - CLASS A
YEARS ENDED DECEMBER 31, 2009 2008
------------------------------------------------ ---------- -----------------
SELECTED PER SHARE DATA
------------------------------------------------------------------------------
NET ASSET VALUE, BEGINNING OF PERIOD $ 7.61 $ 15.07
------------------------------------------------ ------- ----------
Income (loss) from investment operations:
Net investment income (loss)(a) ( .02) ( .01)
------------------------------------------------ ------- ----------
Net realized and unrealized gain (loss) 3.11 ( 7.45)
------------------------------------------------ ------- ----------
TOTAL FROM INVESTMENT OPERATIONS 3.09 ( 7.46)
------------------------------------------------ ------- ----------
NET ASSET VALUE, END OF PERIOD $ 10.70 $ 7.61
------------------------------------------------ ------- ----------
Total Return (%) 40.60 (49.50)(b)
------------------------------------------------ ------- ----------
RATIOS TO AVERAGE NET ASSETS AND SUPPLEMENTAL DATA
------------------------------------------------------------------------------
Net assets, end of period ($ millions) 80 69
------------------------------------------------ ------- ----------
Ratio of expenses before expense reductions (%) .77 .88
------------------------------------------------ ------- ----------
Ratio of expenses after expense reductions (%) .77 .85
------------------------------------------------ ------- ----------
Ratio of net investment income (loss) (%) ( .22) ( .04)
------------------------------------------------ ------- ----------
Portfolio turnover rate (%) 93 67
------------------------------------------------ ------- ----------
YEARS ENDED DECEMBER 31, 2007 2006 2005
------------------------------------------------ ---------------- -------------------- ----------------
SELECTED PER SHARE DATA
--------------------------------------------------------------------------------------------------------
NET ASSET VALUE, BEGINNING OF PERIOD $ 14.19 $ 13.48 $ 12.59
------------------------------------------------- --------- ---------- ---------
Income (loss) from investment operations:
Net investment income (loss)(a) ( .01) ( .04)(d) ( .06)
------------------------------------------------- --------- ---------- ---------
Net realized and unrealized gain (loss) .89 .75 .95
------------------------------------------------- --------- ---------- ---------
TOTAL FROM INVESTMENT OPERATIONS .88 .71 .89
------------------------------------------------- --------- ---------- ---------
NET ASSET VALUE, END OF PERIOD $ 15.07 $ 14.19 $ 13.48
------------------------------------------------- --------- ---------- ---------
Total Return (%) 6.20 (b) 5.27 (b,d) 7.07 (c)
------------------------------------------------- --------- ---------- ---------
RATIOS TO AVERAGE NET ASSETS AND SUPPLEMENTAL DATA
--------------------------------------------------------------------------------------------------------
Net assets, end of period ($ millions) 174 208 243
------------------------------------------------- --------- ---------- ---------
Ratio of expenses before expense reductions (%) .75 .73 .72
------------------------------------------------- --------- ---------- ---------
Ratio of expenses after expense reductions (%) .72 .72 .72
------------------------------------------------- --------- ---------- ---------
Ratio of net investment income (loss) (%) ( .09) ( .32)(d) ( .47)
------------------------------------------------- --------- ---------- ---------
Portfolio turnover rate (%) 67 73 94
------------------------------------------------- --------- ---------- ---------
(a) Based on average shares outstanding during the period.
(b) Total return would have been lower had certain expenses been
reduced.
(c) In 2005, the Portfolio realized a gain of $49,496 on the disposal of
an investment not meeting the Portfolio's investment restrictions.
This violation had no negative impact on the total return.
(d) Includes non-recurring income from the Advisor recorded as a result
of an administrative proceeding regarding disclosure of brokerage
allocation practices in connection with sales of DWS Funds. The
non-recurring income resulted in an increase in net investment
income of $0.008 per share and an increase in the ratio of net
investment income of 0.06%. Excluding this non-recurring income,
total return would have been 0.06% lower.
108
PROSPECTUS May 1, 2010 Financial Highlights
DWS STRATEGIC INCOME VIP - CLASS A
YEARS ENDED DECEMBER 31, 2009 2008 2007 2006 2005
------------------------------------------------ ---------------- ---------------- ---------------- ----------- -----------
SELECTED PER SHARE DATA
----------------------------------------------------------------------------------------------------------------------------------
NET ASSET VALUE, BEGINNING OF PERIOD $ 10.03 $ 11.70 $ 11.80 $ 11.50 $ 12.25
------------------------------------------------ -------- -------- -------- -------- --------
Income (loss) from investment operations:
Net investment income(a) .63 .55 .63 .62 .65
------------------------------------------------ -------- -------- -------- -------- --------
Net realized and unrealized gain (loss) 1.50 ( 1.38) ( .01) .36 ( .39)
------------------------------------------------ -------- -------- -------- -------- --------
TOTAL FROM INVESTMENT OPERATIONS 2.13 ( .83) .62 .98 .26
------------------------------------------------ -------- -------- -------- -------- --------
Less distributions from:
Net investment income ( .55) ( .69) ( .72) ( .57) ( .98)
------------------------------------------------ -------- -------- -------- -------- --------
Net realized gains - ( .15) - ( .11) ( .03)
------------------------------------------------ -------- -------- -------- -------- --------
TOTAL DISTRIBUTIONS ( .55) ( .84) ( .72) ( .68) ( 1.01)
------------------------------------------------ -------- -------- -------- -------- --------
NET ASSET VALUE, END OF PERIOD $ 11.61 $ 10.03 $ 11.70 $ 11.80 $ 11.50
------------------------------------------------ -------- -------- -------- -------- --------
Total Return (%) 22.73 (b) ( 7.75)(b) 5.43 (b) 8.98 2.38
------------------------------------------------ -------- -------- -------- -------- --------
RATIOS TO AVERAGE NET ASSETS AND SUPPLEMENTAL DATA
----------------------------------------------------------------------------------------------------------------------------------
Net assets, end of period ($ millions) 74 73 100 86 71
------------------------------------------------ -------- -------- -------- -------- --------
Ratio of expenses before expense reductions (%) .86 .89 .84 .85 .88
------------------------------------------------- -------- -------- -------- -------- --------
Ratio of expenses after expense reductions (%) .80 .87 .83 .85 .88
------------------------------------------------- -------- -------- -------- -------- --------
Ratio of net investment income (%) 5.96 5.06 5.50 5.47 5.61
------------------------------------------------- -------- -------- -------- -------- --------
Portfolio turnover rate (%) 370 234 147 143 120
------------------------------------------------- -------- -------- -------- -------- --------
(a) Based on average shares outstanding during the period.
(b) Total return would have been lower had certain expenses not been
reduced.
Prior to June 1, 2009, Dreman Value Management, L.L.C. served as the fund's
subadvisor and was primarily responsible for the day-to-day management of the
fund. Performance would have been different if the fund's current investment
strategy had been in effect.
DWS STRATEGIC VALUE VIP - CLASS A
YEARS ENDED DECEMBER 31, 2009 2008 2007 2006 2005
------------------------------------------------ -------------- ----------------- ----------- ----------- -----------
SELECTED PER SHARE DATA
----------------------------------------------------------------------------------------------------------------------------
NET ASSET VALUE, BEGINNING OF PERIOD $ 6.21 $ 14.40 $ 15.02 $ 13.41 $ 12.65
------------------------------------------------ -------- --------- -------- -------- --------
Income (loss) from investment operations:
Net investment income (loss)(a) .12 .22 .29 .27 .24
------------------------------------------------ -------- --------- -------- -------- --------
Net realized and unrealized gain (loss) 1.31 ( 5.80) ( .56) 2.21 .75
------------------------------------------------ -------- --------- -------- -------- --------
TOTAL FROM INVESTMENT OPERATIONS 1.43 ( 5.58) ( .27) 2.48 .99
------------------------------------------------ -------- --------- -------- -------- --------
Less distributions from:
Net investment income ( .28) ( .36) ( .22) ( .28) ( .23)
------------------------------------------------ -------- --------- -------- -------- --------
Net realized gains - ( 2.25) ( .13) ( .59) -
------------------------------------------------ -------- --------- -------- -------- --------
TOTAL DISTRIBUTIONS ( .28) ( 2.61) ( .35) ( .87) ( .23)
------------------------------------------------ -------- --------- -------- -------- --------
NET ASSET VALUE, END OF PERIOD $ 7.36 $ 6.21 $ 14.40 $ 15.02 $ 13.41
------------------------------------------------ -------- --------- -------- -------- --------
Total Return (%) 25.30 (b) (45.98)(b) ( 1.86) 18.74 7.92
------------------------------------------------ -------- --------- -------- -------- --------
RATIOS TO AVERAGE NET ASSETS AND SUPPLEMENTAL DATA
----------------------------------------------------------------------------------------------------------------------------
Net assets, end of period ($ millions) 282 308 792 992 785
------------------------------------------------ -------- --------- -------- -------- --------
Ratio of expenses before expense reductions (%) .80 .81 .78 .77 .78
------------------------------------------------- -------- --------- -------- -------- --------
Ratio of expenses after expense reductions (%) .76 .80 .78 .77 .78
------------------------------------------------- -------- --------- -------- -------- --------
Ratio of net investment income (%) 1.89 2.21 1.94 1.87 1.84
------------------------------------------------- -------- --------- -------- -------- --------
Portfolio turnover rate (%) 91 28 27 20 10
------------------------------------------------- -------- --------- -------- -------- --------
(a) Based on average shares outstanding during the period.
(b) Total return would have been lower had certain expenses not been
reduced.
109
PROSPECTUS May 1, 2010 Financial Highlights
DWS TECHNOLOGY VIP - CLASS A
YEARS ENDED DECEMBER 31, 2009 2008 2007 2006 2005
------------------------------------------------ ---------- ----------------- ---------- --------------- ----------
SELECTED PER SHARE DATA
--------------------------------------------------------------------------------------------------------------------------
NET ASSET VALUE, BEGINNING OF PERIOD $ 5.76 $ 10.71 $ 9.37 $ 9.30 $ 9.01
------------------------------------------------ ------- --------- ------- ------- -------
Income (loss) from investment operations:
Net investment income (loss)(a) .01 ( .00)* ( .02) ( .01)(c) ( .03)
------------------------------------------------ ------- --------- ------- ------- -------
Net realized and unrealized gain (loss) 3.47 ( 4.95) 1.36 .08 .36
------------------------------------------------ ------- --------- ------- ------- -------
TOTAL FROM INVESTMENT OPERATIONS 3.48 ( 4.95) 1.34 .07 .33
------------------------------------------------ ------- --------- ------- ------- -------
Less distributions from:
Net investment income - - - - ( .04)
------------------------------------------------ ------- --------- ------- ------- -------
NET ASSET VALUE, END OF PERIOD $ 9.24 $ 5.76 $ 10.71 $ 9.37 $ 9.30
------------------------------------------------ ------- --------- ------- ------- -------
Total Return (%) 60.42 (46.22)(b) 14.30 .75 (c) 3.74
------------------------------------------------ ------- --------- ------- ------- -------
RATIOS TO AVERAGE NET ASSETS AND SUPPLEMENTAL DATA
--------------------------------------------------------------------------------------------------------------------------
Net assets, end of period ($ millions) 78 60 153 165 199
------------------------------------------------ ------- --------- ------- ------- -------
Ratio of expenses before expense reductions (%) .84 1.01 .91 .89 .86
------------------------------------------------- ------- --------- ------- ------- -------
Ratio of expenses after expense reductions (%) .84 1.00 .91 .89 .86
------------------------------------------------- ------- --------- ------- ------- -------
Ratio of net investment income (loss) (%) .08 ( .01) ( .15) ( .12)(c) ( .36)
------------------------------------------------- ------- --------- ------- ------- -------
Portfolio turnover rate (%) 45 71 91 49 135
------------------------------------------------- ------- --------- ------- ------- -------
(a) Based on average shares outstanding during the period.
(b) Total return would have been lower had certain expenses not been
reduced.
(c) Includes non-recurring income from the Advisor recorded as a result
of an administrative proceeding regarding disclosure of brokerage
allocation practices in connection with sales of DWS Funds. The
non-recurring income resulted in an increase in net investment
income of $0.017 per share and an increase in the ratio of net
investment income of 0.18%. Excluding this non-recurring income,
total return would have been 0.19% lower.
* Amount is less than $0.005.
DWS TURNER MID CAP GROWTH VIP - CLASS A
YEARS ENDED DECEMBER 31, 2009 2008 2007 2006 2005
------------------------------------------------ ---------- ----------------- ----------- ----------- ----------
SELECTED PER SHARE DATA
-----------------------------------------------------------------------------------------------------------------------
NET ASSET VALUE, BEGINNING OF PERIOD $ 5.06 $ 12.55 $ 10.92 $ 11.02 $ 9.86
------------------------------------------------ ------- --------- -------- -------- -------
Income (loss) from investment operations:
Net investment income (loss)(a) .00* ( .01) ( .04) ( .01) ( .05)
------------------------------------------------ ------- --------- -------- -------- -------
Net realized and unrealized gain (loss) 2.53 ( 5.28) 2.64 .77 1.21
------------------------------------------------ ------- --------- -------- -------- -------
TOTAL FROM INVESTMENT OPERATIONS 2.53 ( 5.29) 2.60 .76 1.16
------------------------------------------------ ------- --------- -------- -------- -------
Less distributions from:
Net realized gains - ( 2.20) ( .97) ( .86) -
------------------------------------------------ ------- --------- -------- -------- -------
Tax return of capital - ( .00)* - - -
------------------------------------------------ ------- --------- -------- -------- -------
TOTAL DISTRIBUTIONS - ( 2.20) ( .97) ( .86) -
------------------------------------------------ ------- --------- -------- -------- -------
NET ASSET VALUE, END OF PERIOD $ 7.59 $ 5.06 $ 12.55 $ 10.92 $ 11.02
------------------------------------------------ ------- --------- -------- -------- -------
Total Return (%) 50.00 (49.49)(b) 25.75 6.52 11.76
------------------------------------------------ ------- --------- -------- -------- -------
RATIOS TO AVERAGE NET ASSETS AND SUPPLEMENTAL DATA
-----------------------------------------------------------------------------------------------------------------------
Net assets, end of period ($ millions) 51 49 129 117 122
------------------------------------------------ ------- --------- -------- -------- -------
Ratio of expenses before expense reductions (%) .89 1.03 .95 .97 1.11
------------------------------------------------- ------- --------- -------- -------- -------
Ratio of expenses after expense reductions (%) .89 1.00 .95 .97 1.11
------------------------------------------------- ------- --------- -------- -------- -------
Ratio of net investment income (loss) (%) .02 ( .14) ( .36) ( .06) ( .56)
------------------------------------------------- ------- --------- -------- -------- -------
Portfolio turnover rate (%) 86 156 133 148 151
------------------------------------------------- ------- --------- -------- -------- -------
(a) Based on average shares outstanding during the period.
(b) Total return would have been lower had certain expenses not been
reduced.
* Amount is less than $.005.
110
PROSPECTUS May 1, 2010 Financial Highlights
APPENDIX
HYPOTHETICAL EXPENSE SUMMARY
Using the annual fund operating expense ratios presented in the fee tables in
the fund prospectus, the Hypothetical Expense Summary shows the estimated fees
and expenses, in actual dollars, that would be charged on a hypothetical
investment of $10,000 in the fund held for the next 10 years and the impact of
such fees and expenses on fund returns for each year and cumulatively, assuming
a 5% return for each year. The historical rate of return for the fund may be
higher or lower than 5% and, for money market funds, is typically less than 5%.
The tables also assume that all dividends and distributions are reinvested. The
annual fund expense ratios shown are net of any contractual fee waivers or
expense reimbursements, if any, for the period of the contractual commitment.
Also, please note that if you are investing through a third party provider,
that provider may have fees and expenses separate from those of the fund that
are not reflected here. Mutual fund fees and expenses fluctuate over time and
actual expenses may be higher or lower than those shown.
The Hypothetical Expense Summary should not be used or construed as an offer to
sell, a solicitation of an offer to buy or a recommendation or endorsement of
any specific mutual fund. You should carefully review the fund's prospectus to
consider the investment objectives, risks, expenses and charges of the fund
prior to investing.
DWS ALTERNATIVE ASSET ALLOCATION PLUS VIP - CLASS A
MAXIMUM INITIAL HYPOTHETICAL ASSUMED RATE
SALES CHARGE: INVESTMENT: OF RETURN:
0.00% $10,000 5%
--------------- -------------------------------- --------------------------------
CUMULATIVE CUMULATIVE HYPOTHETICAL
RETURN BEFORE RETURN AFTER YEAR-END BALANCE ANNUAL
FEES AND ANNUAL FUND FEES AND AFTER FEES AND FEES AND
YEAR EXPENSES EXPENSE RATIOS EXPENSES EXPENSES EXPENSES
------ --------------- ---------------- -------------- ------------------ ------------
1 5.00% 1.44% 3.56% $ 10,356.00 $ 146.56
--- ----- ---- ---- ----------- ----------
2 10.25% 5.09% 3.47% $ 10,346.68 $ 526.88
--- ----- ---- ---- ----------- ----------
3 15.76% 5.09% 3.37% $ 10,337.37 $ 526.41
--- ----- ---- ---- ----------- ----------
4 21.55% 5.09% 3.28% $ 10,328.06 $ 525.94
--- ----- ---- ---- ----------- ----------
5 27.63% 5.09% 3.19% $ 10,318.77 $ 525.46
--- ----- ---- ---- ----------- ----------
6 34.01% 5.09% 3.09% $ 10,309.48 $ 524.99
--- ----- ---- ---- ----------- ----------
7 40.71% 5.09% 3.00% $ 10,300.20 $ 524.52
--- ----- ---- ---- ----------- ----------
8 47.75% 5.09% 2.91% $ 10,290.93 $ 524.04
--- ----- ---- ---- ----------- ----------
9 55.13% 5.09% 2.82% $ 10,281.67 $ 523.57
--- ----- ---- ---- ----------- ----------
10 62.89% 5.09% 2.72% $ 10,272.42 $ 523.10
--- ----- ---- ---- ----------- ----------
TOTAL $ 4,871.47
--- ----------
111
PROSPECTUS May 1, 2010 Appendix
DWS BALANCED VIP - CLASS A
MAXIMUM INITIAL HYPOTHETICAL ASSUMED RATE
SALES CHARGE: INVESTMENT: OF RETURN:
0.00% $10,000 5%
--------------- -------------------------------- -------------------------------
CUMULATIVE CUMULATIVE HYPOTHETICAL
RETURN BEFORE RETURN AFTER YEAR-END BALANCE ANNUAL
FEES AND ANNUAL FUND FEES AND AFTER FEES AND FEES AND
YEAR EXPENSES EXPENSE RATIOS EXPENSES EXPENSES EXPENSES
------ --------------- ---------------- -------------- ------------------ -----------
1 5.00% 0.62% 4.38% $ 10,438.00 $ 63.36
--- ----- ---- ----- ----------- --------
2 10.25% 0.62% 8.95% $ 10,895.18 $ 66.13
--- ----- ---- ----- ----------- --------
3 15.76% 0.62% 13.72% $ 11,372.39 $ 69.03
--- ----- ---- ----- ----------- --------
4 21.55% 0.62% 18.71% $ 11,870.50 $ 72.05
--- ----- ---- ----- ----------- --------
5 27.63% 0.62% 23.90% $ 12,390.43 $ 75.21
--- ----- ---- ----- ----------- --------
6 34.01% 0.62% 29.33% $ 12,933.13 $ 78.50
--- ----- ---- ----- ----------- --------
7 40.71% 0.62% 35.00% $ 13,499.60 $ 81.94
--- ----- ---- ----- ----------- --------
8 47.75% 0.62% 40.91% $ 14,090.89 $ 85.53
--- ----- ---- ----- ----------- --------
9 55.13% 0.62% 47.08% $ 14,708.07 $ 89.28
--- ----- ---- ----- ----------- --------
10 62.89% 0.62% 53.52% $ 15,352.28 $ 93.19
--- ----- ---- ----- ----------- --------
TOTAL $ 774.22
--- --------
DWS BLUE CHIP VIP - CLASS A
MAXIMUM INITIAL HYPOTHETICAL ASSUMED RATE
SALES CHARGE: INVESTMENT: OF RETURN:
0.00% $10,000 5%
--------------- -------------------------------- -------------------------------
CUMULATIVE CUMULATIVE HYPOTHETICAL
RETURN BEFORE RETURN AFTER YEAR-END BALANCE ANNUAL
FEES AND ANNUAL FUND FEES AND AFTER FEES AND FEES AND
YEAR EXPENSES EXPENSE RATIOS EXPENSES EXPENSES EXPENSES
------ --------------- ---------------- -------------- ------------------ -----------
1 5.00% 0.75% 4.25% $ 10,425.00 $ 76.59
--- ----- ---- ----- ----------- --------
2 10.25% 0.75% 8.68% $ 10,868.06 $ 79.85
--- ----- ---- ----- ----------- --------
3 15.76% 0.75% 13.30% $ 11,329.96 $ 83.24
--- ----- ---- ----- ----------- --------
4 21.55% 0.75% 18.11% $ 11,811.48 $ 86.78
--- ----- ---- ----- ----------- --------
5 27.63% 0.75% 23.13% $ 12,313.47 $ 90.47
--- ----- ---- ----- ----------- --------
6 34.01% 0.75% 28.37% $ 12,836.79 $ 94.31
--- ----- ---- ----- ----------- --------
7 40.71% 0.75% 33.82% $ 13,382.35 $ 98.32
--- ----- ---- ----- ----------- --------
8 47.75% 0.75% 39.51% $ 13,951.10 $ 102.50
--- ----- ---- ----- ----------- --------
9 55.13% 0.75% 45.44% $ 14,544.02 $ 106.86
--- ----- ---- ----- ----------- --------
10 62.89% 0.75% 51.62% $ 15,162.14 $ 111.40
--- ----- ---- ----- ----------- --------
TOTAL $ 930.32
--- --------
112
PROSPECTUS May 1, 2010 Appendix
DWS CORE FIXED INCOME VIP - CLASS A
MAXIMUM INITIAL HYPOTHETICAL ASSUMED RATE
SALES CHARGE: INVESTMENT: OF RETURN:
0.00% $10,000 5%
--------------- -------------------------------- -------------------------------
CUMULATIVE CUMULATIVE HYPOTHETICAL
RETURN BEFORE RETURN AFTER YEAR-END BALANCE ANNUAL
FEES AND ANNUAL FUND FEES AND AFTER FEES AND FEES AND
YEAR EXPENSES EXPENSE RATIOS EXPENSES EXPENSES EXPENSES
------ --------------- ---------------- -------------- ------------------ -----------
1 5.00% 0.59% 4.41% $ 10,441.00 $ 60.30
--- ----- ---- ----- ----------- --------
2 10.25% 0.59% 9.01% $ 10,901.45 $ 62.96
--- ----- ---- ----- ----------- --------
3 15.76% 0.59% 13.82% $ 11,382.20 $ 65.74
--- ----- ---- ----- ----------- --------
4 21.55% 0.59% 18.84% $ 11,884.16 $ 68.64
--- ----- ---- ----- ----------- --------
5 27.63% 0.59% 24.08% $ 12,408.25 $ 71.66
--- ----- ---- ----- ----------- --------
6 34.01% 0.59% 29.55% $ 12,955.45 $ 74.82
--- ----- ---- ----- ----------- --------
7 40.71% 0.59% 35.27% $ 13,526.79 $ 78.12
--- ----- ---- ----- ----------- --------
8 47.75% 0.59% 41.23% $ 14,123.32 $ 81.57
--- ----- ---- ----- ----------- --------
9 55.13% 0.59% 47.46% $ 14,746.16 $ 85.16
--- ----- ---- ----- ----------- --------
10 62.89% 0.59% 53.96% $ 15,396.46 $ 88.92
--- ----- ---- ----- ----------- --------
TOTAL $ 737.89
--- --------
DWS DIVERSIFIED INTERNATIONAL EQUITY VIP - CLASS A
MAXIMUM INITIAL HYPOTHETICAL ASSUMED RATE
SALES CHARGE: INVESTMENT: OF RETURN:
0.00% $10,000 5%
--------------- -------------------------------- ---------------------------------
CUMULATIVE CUMULATIVE HYPOTHETICAL
RETURN BEFORE RETURN AFTER YEAR-END BALANCE ANNUAL
FEES AND ANNUAL FUND FEES AND AFTER FEES AND FEES AND
YEAR EXPENSES EXPENSE RATIOS EXPENSES EXPENSES EXPENSES
------ --------------- ---------------- -------------- ------------------ -------------
1 5.00% 0.96% 4.04% $ 10,404.00 $ 97.94
--- ----- ---- ----- ----------- ----------
2 10.25% 0.96% 8.24% $ 10,824.32 $ 101.90
--- ----- ---- ----- ----------- ----------
3 15.76% 0.96% 12.62% $ 11,261.62 $ 106.01
--- ----- ---- ----- ----------- ----------
4 21.55% 0.96% 17.17% $ 11,716.59 $ 110.30
--- ----- ---- ----- ----------- ----------
5 27.63% 0.96% 21.90% $ 12,189.94 $ 114.75
--- ----- ---- ----- ----------- ----------
6 34.01% 0.96% 26.82% $ 12,682.42 $ 119.39
--- ----- ---- ----- ----------- ----------
7 40.71% 0.96% 31.95% $ 13,194.79 $ 124.21
--- ----- ---- ----- ----------- ----------
8 47.75% 0.96% 37.28% $ 13,727.86 $ 129.23
--- ----- ---- ----- ----------- ----------
9 55.13% 0.96% 42.82% $ 14,282.46 $ 134.45
--- ----- ---- ----- ----------- ----------
10 62.89% 0.96% 48.59% $ 14,859.47 $ 139.88
--- ----- ---- ----- ----------- ----------
TOTAL $ 1,178.06
--- ----------
113
PROSPECTUS May 1, 2010 Appendix
DWS DREMAN SMALL MID CAP VALUE VIP - CLASS A
MAXIMUM INITIAL HYPOTHETICAL ASSUMED RATE
SALES CHARGE: INVESTMENT: OF RETURN:
0.00% $10,000 5%
--------------- -------------------------------- -------------------------------
CUMULATIVE CUMULATIVE HYPOTHETICAL
RETURN BEFORE RETURN AFTER YEAR-END BALANCE ANNUAL
FEES AND ANNUAL FUND FEES AND AFTER FEES AND FEES AND
YEAR EXPENSES EXPENSE RATIOS EXPENSES EXPENSES EXPENSES
------ --------------- ---------------- -------------- ------------------ -----------
1 5.00% 0.79% 4.21% $ 10,421.00 $ 80.66
--- ----- ---- ----- ----------- --------
2 10.25% 0.79% 8.60% $ 10,859.72 $ 84.06
--- ----- ---- ----- ----------- --------
3 15.76% 0.79% 13.17% $ 11,316.92 $ 87.60
--- ----- ---- ----- ----------- --------
4 21.55% 0.79% 17.93% $ 11,793.36 $ 91.29
--- ----- ---- ----- ----------- --------
5 27.63% 0.79% 22.90% $ 12,289.86 $ 95.13
--- ----- ---- ----- ----------- --------
6 34.01% 0.79% 28.07% $ 12,807.26 $ 99.13
--- ----- ---- ----- ----------- --------
7 40.71% 0.79% 33.46% $ 13,346.45 $ 103.31
--- ----- ---- ----- ----------- --------
8 47.75% 0.79% 39.08% $ 13,908.34 $ 107.66
--- ----- ---- ----- ----------- --------
9 55.13% 0.79% 44.94% $ 14,493.88 $ 112.19
--- ----- ---- ----- ----------- --------
10 62.89% 0.79% 51.04% $ 15,104.07 $ 116.91
--- ----- ---- ----- ----------- --------
TOTAL $ 977.94
--- --------
DWS GLOBAL THEMATIC VIP - CLASS A
MAXIMUM INITIAL HYPOTHETICAL ASSUMED RATE
SALES CHARGE: INVESTMENT: OF RETURN:
0.00% $10,000 5%
--------------- -------------------------------- --------------------------------
CUMULATIVE CUMULATIVE HYPOTHETICAL
RETURN BEFORE RETURN AFTER YEAR-END BALANCE ANNUAL
FEES AND ANNUAL FUND FEES AND AFTER FEES AND FEES AND
YEAR EXPENSES EXPENSE RATIOS EXPENSES EXPENSES EXPENSES
------ --------------- ---------------- -------------- ------------------ ------------
1 5.00% 1.39% 3.61% $ 10,361.00 $ 141.51
--- ----- ---- ----- ----------- ----------
2 10.25% 1.39% 7.35% $ 10,735.03 $ 146.62
--- ----- ---- ----- ----------- ----------
3 15.76% 1.39% 11.23% $ 11,122.57 $ 151.91
--- ----- ---- ----- ----------- ----------
4 21.55% 1.39% 15.24% $ 11,524.09 $ 157.39
--- ----- ---- ----- ----------- ----------
5 27.63% 1.39% 19.40% $ 11,940.11 $ 163.08
--- ----- ---- ----- ----------- ----------
6 34.01% 1.39% 23.71% $ 12,371.15 $ 168.96
--- ----- ---- ----- ----------- ----------
7 40.71% 1.39% 28.18% $ 12,817.75 $ 175.06
--- ----- ---- ----- ----------- ----------
8 47.75% 1.39% 32.80% $ 13,280.47 $ 181.38
--- ----- ---- ----- ----------- ----------
9 55.13% 1.39% 37.60% $ 13,759.89 $ 187.93
--- ----- ---- ----- ----------- ----------
10 62.89% 1.39% 42.57% $ 14,256.63 $ 194.71
--- ----- ---- ----- ----------- ----------
TOTAL $ 1,668.55
--- ----------
114
PROSPECTUS May 1, 2010 Appendix
DWS GOVERNMENT & AGENCY SECURITIES VIP - CLASS A
MAXIMUM INITIAL HYPOTHETICAL ASSUMED RATE
SALES CHARGE: INVESTMENT: OF RETURN:
0.00% $10,000 5%
--------------- -------------------------------- -------------------------------
CUMULATIVE CUMULATIVE HYPOTHETICAL
RETURN BEFORE RETURN AFTER YEAR-END BALANCE ANNUAL
FEES AND ANNUAL FUND FEES AND AFTER FEES AND FEES AND
YEAR EXPENSES EXPENSE RATIOS EXPENSES EXPENSES EXPENSES
------ --------------- ---------------- -------------- ------------------ -----------
1 5.00% 0.58% 4.42% $ 10,442.00 $ 59.28
--- ----- ---- ----- ----------- --------
2 10.25% 0.58% 9.04% $ 10,903.54 $ 61.90
--- ----- ---- ----- ----------- --------
3 15.76% 0.58% 13.85% $ 11,385.47 $ 64.64
--- ----- ---- ----- ----------- --------
4 21.55% 0.58% 18.89% $ 11,888.71 $ 67.50
--- ----- ---- ----- ----------- --------
5 27.63% 0.58% 24.14% $ 12,414.19 $ 70.48
--- ----- ---- ----- ----------- --------
6 34.01% 0.58% 29.63% $ 12,962.90 $ 73.59
--- ----- ---- ----- ----------- --------
7 40.71% 0.58% 35.36% $ 13,535.86 $ 76.85
--- ----- ---- ----- ----------- --------
8 47.75% 0.58% 41.34% $ 14,134.14 $ 80.24
--- ----- ---- ----- ----------- --------
9 55.13% 0.58% 47.59% $ 14,758.87 $ 83.79
--- ----- ---- ----- ----------- --------
10 62.89% 0.58% 54.11% $ 15,411.22 $ 87.49
--- ----- ---- ----- ----------- --------
TOTAL $ 725.76
--- --------
DWS HIGH INCOME VIP - CLASS A
MAXIMUM INITIAL HYPOTHETICAL ASSUMED RATE
SALES CHARGE: INVESTMENT: OF RETURN:
0.00% $10,000 5%
--------------- -------------------------------- -------------------------------
CUMULATIVE CUMULATIVE HYPOTHETICAL
RETURN BEFORE RETURN AFTER YEAR-END BALANCE ANNUAL
FEES AND ANNUAL FUND FEES AND AFTER FEES AND FEES AND
YEAR EXPENSES EXPENSE RATIOS EXPENSES EXPENSES EXPENSES
------ --------------- ---------------- -------------- ------------------ -----------
1 5.00% 0.67% 4.33% $ 10,433.00 $ 68.45
--- ----- ---- ----- ----------- --------
2 10.25% 0.67% 8.85% $ 10,884.75 $ 71.41
--- ----- ---- ----- ----------- --------
3 15.76% 0.67% 13.56% $ 11,356.06 $ 74.51
--- ----- ---- ----- ----------- --------
4 21.55% 0.67% 18.48% $ 11,847.78 $ 77.73
--- ----- ---- ----- ----------- --------
5 27.63% 0.67% 23.61% $ 12,360.78 $ 81.10
--- ----- ---- ----- ----------- --------
6 34.01% 0.67% 28.96% $ 12,896.01 $ 84.61
--- ----- ---- ----- ----------- --------
7 40.71% 0.67% 34.54% $ 13,454.40 $ 88.27
--- ----- ---- ----- ----------- --------
8 47.75% 0.67% 40.37% $ 14,036.98 $ 92.10
--- ----- ---- ----- ----------- --------
9 55.13% 0.67% 46.45% $ 14,644.78 $ 96.08
--- ----- ---- ----- ----------- --------
10 62.89% 0.67% 52.79% $ 15,278.90 $ 100.24
--- ----- ---- ----- ----------- --------
TOTAL $ 834.50
--- --------
115
PROSPECTUS May 1, 2010 Appendix
DWS LARGE CAP VALUE VIP - CLASS A
MAXIMUM INITIAL HYPOTHETICAL ASSUMED RATE
SALES CHARGE: INVESTMENT: OF RETURN:
0.00% $10,000 5%
--------------- -------------------------------- -------------------------------
CUMULATIVE CUMULATIVE HYPOTHETICAL
RETURN BEFORE RETURN AFTER YEAR-END BALANCE ANNUAL
FEES AND ANNUAL FUND FEES AND AFTER FEES AND FEES AND
YEAR EXPENSES EXPENSE RATIOS EXPENSES EXPENSES EXPENSES
------ --------------- ---------------- -------------- ------------------ -----------
1 5.00% 0.76% 4.24% $ 10,424.00 $ 77.61
--- ----- ---- ----- ----------- --------
2 10.25% 0.76% 8.66% $ 10,865.98 $ 80.90
--- ----- ---- ----- ----------- --------
3 15.76% 0.76% 13.27% $ 11,326.70 $ 84.33
--- ----- ---- ----- ----------- --------
4 21.55% 0.76% 18.07% $ 11,806.95 $ 87.91
--- ----- ---- ----- ----------- --------
5 27.63% 0.76% 23.08% $ 12,307.56 $ 91.64
--- ----- ---- ----- ----------- --------
6 34.01% 0.76% 28.29% $ 12,829.40 $ 95.52
--- ----- ---- ----- ----------- --------
7 40.71% 0.76% 33.73% $ 13,373.37 $ 99.57
--- ----- ---- ----- ----------- --------
8 47.75% 0.76% 39.40% $ 13,940.40 $ 103.79
--- ----- ---- ----- ----------- --------
9 55.13% 0.76% 45.31% $ 14,531.47 $ 108.19
--- ----- ---- ----- ----------- --------
10 62.89% 0.76% 51.48% $ 15,147.61 $ 112.78
--- ----- ---- ----- ----------- --------
TOTAL $ 942.24
--- --------
DWS MID CAP GROWTH VIP - CLASS A
MAXIMUM INITIAL HYPOTHETICAL ASSUMED RATE
SALES CHARGE: INVESTMENT: OF RETURN:
0.00% $10,000 5%
--------------- -------------------------------- --------------------------------
CUMULATIVE CUMULATIVE HYPOTHETICAL
RETURN BEFORE RETURN AFTER YEAR-END BALANCE ANNUAL
FEES AND ANNUAL FUND FEES AND AFTER FEES AND FEES AND
YEAR EXPENSES EXPENSE RATIOS EXPENSES EXPENSES EXPENSES
------ --------------- ---------------- -------------- ------------------ ------------
1 5.00% 1.17% 3.83% $ 10,383.00 $ 119.24
--- ----- ---- ----- ----------- ----------
2 10.25% 1.17% 7.81% $ 10,780.67 $ 123.81
--- ----- ---- ----- ----------- ----------
3 15.76% 1.17% 11.94% $ 11,193.57 $ 128.55
--- ----- ---- ----- ----------- ----------
4 21.55% 1.17% 16.22% $ 11,622.28 $ 133.47
--- ----- ---- ----- ----------- ----------
5 27.63% 1.17% 20.67% $ 12,067.42 $ 138.58
--- ----- ---- ----- ----------- ----------
6 34.01% 1.17% 25.30% $ 12,529.60 $ 143.89
--- ----- ---- ----- ----------- ----------
7 40.71% 1.17% 30.09% $ 13,009.48 $ 149.40
--- ----- ---- ----- ----------- ----------
8 47.75% 1.17% 35.08% $ 13,507.74 $ 155.13
--- ----- ---- ----- ----------- ----------
9 55.13% 1.17% 40.25% $ 14,025.09 $ 161.07
--- ----- ---- ----- ----------- ----------
10 62.89% 1.17% 45.62% $ 14,562.25 $ 167.24
--- ----- ---- ----- ----------- ----------
TOTAL $ 1,420.38
--- ----------
116
PROSPECTUS May 1, 2010 Appendix
DWS MONEY MARKET VIP - CLASS A
MAXIMUM INITIAL HYPOTHETICAL ASSUMED RATE
SALES CHARGE: INVESTMENT: OF RETURN:
0.00% $10,000 5%
--------------- -------------------------------- -------------------------------
CUMULATIVE CUMULATIVE HYPOTHETICAL
RETURN BEFORE RETURN AFTER YEAR-END BALANCE ANNUAL
FEES AND ANNUAL FUND FEES AND AFTER FEES AND FEES AND
YEAR EXPENSES EXPENSE RATIOS EXPENSES EXPENSES EXPENSES
------ --------------- ---------------- -------------- ------------------ -----------
1 5.00% 0.43% 4.57% $ 10,457.00 $ 43.98
--- ----- ---- ----- ----------- --------
2 10.25% 0.43% 9.35% $ 10,934.88 $ 45.99
--- ----- ---- ----- ----------- --------
3 15.76% 0.43% 14.35% $ 11,434.61 $ 48.09
--- ----- ---- ----- ----------- --------
4 21.55% 0.43% 19.57% $ 11,957.17 $ 50.29
--- ----- ---- ----- ----------- --------
5 27.63% 0.43% 25.04% $ 12,503.61 $ 52.59
--- ----- ---- ----- ----------- --------
6 34.01% 0.43% 30.75% $ 13,075.03 $ 54.99
--- ----- ---- ----- ----------- --------
7 40.71% 0.43% 36.73% $ 13,672.56 $ 57.51
--- ----- ---- ----- ----------- --------
8 47.75% 0.43% 42.97% $ 14,297.39 $ 60.14
--- ----- ---- ----- ----------- --------
9 55.13% 0.43% 49.51% $ 14,950.78 $ 62.88
--- ----- ---- ----- ----------- --------
10 62.89% 0.43% 56.34% $ 15,634.04 $ 65.76
--- ----- ---- ----- ----------- --------
TOTAL $ 542.22
--- --------
DWS SMALL CAP GROWTH VIP - CLASS A
MAXIMUM INITIAL HYPOTHETICAL ASSUMED RATE
SALES CHARGE: INVESTMENT: OF RETURN:
0.00% $10,000 5%
--------------- -------------------------------- -------------------------------
CUMULATIVE CUMULATIVE HYPOTHETICAL
RETURN BEFORE RETURN AFTER YEAR-END BALANCE ANNUAL
FEES AND ANNUAL FUND FEES AND AFTER FEES AND FEES AND
YEAR EXPENSES EXPENSE RATIOS EXPENSES EXPENSES EXPENSES
------ --------------- ---------------- -------------- ------------------ -----------
1 5.00% 0.77% 4.23% $ 10,423.00 $ 78.63
--- ----- ---- ----- ----------- --------
2 10.25% 0.77% 8.64% $ 10,863.89 $ 81.95
--- ----- ---- ----- ----------- --------
3 15.76% 0.77% 13.23% $ 11,323.44 $ 85.42
--- ----- ---- ----- ----------- --------
4 21.55% 0.77% 18.02% $ 11,802.42 $ 89.03
--- ----- ---- ----- ----------- --------
5 27.63% 0.77% 23.02% $ 12,301.66 $ 92.80
--- ----- ---- ----- ----------- --------
6 34.01% 0.77% 28.22% $ 12,822.02 $ 96.73
--- ----- ---- ----- ----------- --------
7 40.71% 0.77% 33.64% $ 13,364.39 $ 100.82
--- ----- ---- ----- ----------- --------
8 47.75% 0.77% 39.30% $ 13,929.70 $ 105.08
--- ----- ---- ----- ----------- --------
9 55.13% 0.77% 45.19% $ 14,518.93 $ 109.53
--- ----- ---- ----- ----------- --------
10 62.89% 0.77% 51.33% $ 15,133.08 $ 114.16
--- ----- ---- ----- ----------- --------
TOTAL $ 954.15
--- --------
117
PROSPECTUS May 1, 2010 Appendix
DWS STRATEGIC INCOME VIP - CLASS A
MAXIMUM INITIAL HYPOTHETICAL ASSUMED RATE
SALES CHARGE: INVESTMENT: OF RETURN:
0.00% $10,000 5%
--------------- -------------------------------- ---------------------------------
CUMULATIVE CUMULATIVE HYPOTHETICAL
RETURN BEFORE RETURN AFTER YEAR-END BALANCE ANNUAL
FEES AND ANNUAL FUND FEES AND AFTER FEES AND FEES AND
YEAR EXPENSES EXPENSE RATIOS EXPENSES EXPENSES EXPENSES
------ --------------- ---------------- -------------- ------------------ -------------
1 5.00% 0.86% 4.14% $ 10,414.00 $ 87.78
--- ----- ---- ----- ----------- ----------
2 10.25% 0.86% 8.45% $ 10,845.14 $ 91.41
--- ----- ---- ----- ----------- ----------
3 15.76% 0.86% 12.94% $ 11,294.13 $ 95.20
--- ----- ---- ----- ----------- ----------
4 21.55% 0.86% 17.62% $ 11,761.71 $ 99.14
--- ----- ---- ----- ----------- ----------
5 27.63% 0.86% 22.49% $ 12,248.64 $ 103.24
--- ----- ---- ----- ----------- ----------
6 34.01% 0.86% 27.56% $ 12,755.73 $ 107.52
--- ----- ---- ----- ----------- ----------
7 40.71% 0.86% 32.84% $ 13,283.82 $ 111.97
--- ----- ---- ----- ----------- ----------
8 47.75% 0.86% 38.34% $ 13,833.77 $ 116.61
--- ----- ---- ----- ----------- ----------
9 55.13% 0.86% 44.06% $ 14,406.49 $ 121.43
--- ----- ---- ----- ----------- ----------
10 62.89% 0.86% 50.03% $ 15,002.92 $ 126.46
--- ----- ---- ----- ----------- ----------
TOTAL $ 1,060.77
--- ----------
DWS STRATEGIC VALUE VIP - CLASS A
MAXIMUM INITIAL HYPOTHETICAL ASSUMED RATE
SALES CHARGE: INVESTMENT: OF RETURN:
0.00% $10,000 5%
--------------- -------------------------------- -------------------------------
CUMULATIVE CUMULATIVE HYPOTHETICAL
RETURN BEFORE RETURN AFTER YEAR-END BALANCE ANNUAL
FEES AND ANNUAL FUND FEES AND AFTER FEES AND FEES AND
YEAR EXPENSES EXPENSE RATIOS EXPENSES EXPENSES EXPENSES
------ --------------- ---------------- -------------- ------------------ -----------
1 5.00% 0.80% 4.20% $ 10,420.00 $ 81.68
--- ----- ---- ----- ----------- --------
2 10.25% 0.80% 8.58% $ 10,857.64 $ 85.11
--- ----- ---- ----- ----------- --------
3 15.76% 0.80% 13.14% $ 11,313.66 $ 88.69
--- ----- ---- ----- ----------- --------
4 21.55% 0.80% 17.89% $ 11,788.83 $ 92.41
--- ----- ---- ----- ----------- --------
5 27.63% 0.80% 22.84% $ 12,283.97 $ 96.29
--- ----- ---- ----- ----------- --------
6 34.01% 0.80% 28.00% $ 12,799.89 $ 100.34
--- ----- ---- ----- ----------- --------
7 40.71% 0.80% 33.37% $ 13,337.49 $ 104.55
--- ----- ---- ----- ----------- --------
8 47.75% 0.80% 38.98% $ 13,897.66 $ 108.94
--- ----- ---- ----- ----------- --------
9 55.13% 0.80% 44.81% $ 14,481.36 $ 113.52
--- ----- ---- ----- ----------- --------
10 62.89% 0.80% 50.90% $ 15,089.58 $ 118.28
--- ----- ---- ----- ----------- --------
TOTAL $ 989.81
--- --------
118
PROSPECTUS May 1, 2010 Appendix
DWS TECHNOLOGY VIP - CLASS A
MAXIMUM INITIAL HYPOTHETICAL ASSUMED RATE
SALES CHARGE: INVESTMENT: OF RETURN:
0.00% $10,000 5%
--------------- -------------------------------- ---------------------------------
CUMULATIVE CUMULATIVE HYPOTHETICAL
RETURN BEFORE RETURN AFTER YEAR-END BALANCE ANNUAL
FEES AND ANNUAL FUND FEES AND AFTER FEES AND FEES AND
YEAR EXPENSES EXPENSE RATIOS EXPENSES EXPENSES EXPENSES
------ --------------- ---------------- -------------- ------------------ -------------
1 5.00% 0.84% 4.16% $ 10,416.00 $ 85.75
--- ----- ---- ----- ----------- ----------
2 10.25% 0.84% 8.49% $ 10,849.31 $ 89.31
--- ----- ---- ----- ----------- ----------
3 15.76% 0.84% 13.01% $ 11,300.64 $ 93.03
--- ----- ---- ----- ----------- ----------
4 21.55% 0.84% 17.71% $ 11,770.74 $ 96.90
--- ----- ---- ----- ----------- ----------
5 27.63% 0.84% 22.60% $ 12,260.41 $ 100.93
--- ----- ---- ----- ----------- ----------
6 34.01% 0.84% 27.70% $ 12,770.44 $ 105.13
--- ----- ---- ----- ----------- ----------
7 40.71% 0.84% 33.02% $ 13,301.69 $ 109.50
--- ----- ---- ----- ----------- ----------
8 47.75% 0.84% 38.55% $ 13,855.04 $ 114.06
--- ----- ---- ----- ----------- ----------
9 55.13% 0.84% 44.31% $ 14,431.41 $ 118.80
--- ----- ---- ----- ----------- ----------
10 62.89% 0.84% 50.32% $ 15,031.76 $ 123.75
--- ----- ---- ----- ----------- ----------
TOTAL $ 1,037.16
--- ----------
DWS TURNER MID CAP GROWTH VIP - CLASS A
MAXIMUM INITIAL HYPOTHETICAL ASSUMED RATE
SALES CHARGE: INVESTMENT: OF RETURN:
0.00% $10,000 5%
--------------- -------------------------------- ---------------------------------
CUMULATIVE CUMULATIVE HYPOTHETICAL
RETURN BEFORE RETURN AFTER YEAR-END BALANCE ANNUAL
FEES AND ANNUAL FUND FEES AND AFTER FEES AND FEES AND
YEAR EXPENSES EXPENSE RATIOS EXPENSES EXPENSES EXPENSES
------ --------------- ---------------- -------------- ------------------ -------------
1 5.00% 0.89% 4.11% $ 10,411.00 $ 90.83
--- ----- ---- ----- ----------- ----------
2 10.25% 0.89% 8.39% $ 10,838.89 $ 94.56
--- ----- ---- ----- ----------- ----------
3 15.76% 0.89% 12.84% $ 11,284.37 $ 98.45
--- ----- ---- ----- ----------- ----------
4 21.55% 0.89% 17.48% $ 11,748.16 $ 102.49
--- ----- ---- ----- ----------- ----------
5 27.63% 0.89% 22.31% $ 12,231.01 $ 106.71
--- ----- ---- ----- ----------- ----------
6 34.01% 0.89% 27.34% $ 12,733.70 $ 111.09
--- ----- ---- ----- ----------- ----------
7 40.71% 0.89% 32.57% $ 13,257.06 $ 115.66
--- ----- ---- ----- ----------- ----------
8 47.75% 0.89% 38.02% $ 13,801.92 $ 120.41
--- ----- ---- ----- ----------- ----------
9 55.13% 0.89% 43.69% $ 14,369.18 $ 125.36
--- ----- ---- ----- ----------- ----------
10 62.89% 0.89% 49.60% $ 14,959.75 $ 130.51
--- ----- ---- ----- ----------- ----------
TOTAL $ 1,096.07
--- ----------
ADDITIONAL INDEX INFORMATION
DWS BALANCED VIP
RUSSELL 1000 (Reg. TM) INDEX is an unmanaged index that measures the
performance of the 1,000 largest companies in the Russell 3000 Index, which
represents approximately 92% of the total market capitalization of the Russell
3000 Index.
BARCLAYS CAPITAL US AGGREGATE BOND INDEX is an unmanaged market value-weighted
measure of Treasury issues, agency issues, corporate bond issues and mortgage
securities.
DWS BLUE CHIP VIP
RUSSELL 1000 (Reg. TM) INDEX is an unmanaged index that measures the
performance of the 1,000 largest companies in the Russell 3000 Index, which
represents approximately 92% of the total market capitalization of the Russell
3000 Index.
DWS CORE FIXED INCOME VIP
BARCLAYS CAPITAL US AGGREGATE BOND INDEX is an unmanaged market value-weighted
measure of Treasury issues, agency issues, corporate bond issues and mortgage
securities.
119
PROSPECTUS May 1, 2010 Appendix
DWS DIVERSIFIED INTERNATIONAL EQUITY VIP
MORGAN STANLEY COUNTRY INDEX (MSCI) EUROPE, AUSTRALASIA, FAR EAST (EAFE( (Reg.
TM))) is an unmanaged index that tracks international stock performance in the
21 developed markets of Europe, Australasia and the Far East. Returns reflect
reinvestment of dividends net of withholding taxes.
DWS DREMAN SMALL MID CAP VALUE VIP
RUSSELL 2500(TM) VALUE INDEX is an unmanaged index measuring the small- to
mid-cap US equity value market.
DWS GLOBAL THEMATIC VIP
MSCI WORLD INDEX is an unmanaged capitalization-weighted measure of stock
markets around the world, including North America, Europe, Australia and Asia.
Returns reflect reinvestment of dividends net of withholding taxes.
DWS GOVERNMENT & AGENCY SECURITIES VIP
BARCLAYS CAPITAL GNMA INDEX is an unmanaged market value-weighted measure of
all fixed-rate securities backed by mortgage pools of the Government National
Mortgage Association.
DWS HIGH INCOME VIP
CREDIT SUISSE HIGH YIELD INDEX is an unmanaged trader-priced portfolio,
constructed to mirror the global high-yield debt market.
DWS LARGE CAP VALUE VIP
RUSSELL 1000 (Reg. TM) VALUE INDEX is an unmanaged index that consists of those
stocks in the Russell 1000 Index with less-than-average growth orientation.
Russell 1000 (Reg. TM) Index is an unmanaged price-only index of the 1,000
largest capitalized companies that are domiciled in the US and whose common
stocks are traded.
DWS MID CAP GROWTH VIP
RUSSELL MIDCAP (Reg. TM) GROWTH INDEX is an unmanaged capitalization-weighted
index of medium and medium/small companies in the Russell 1000 (Reg. TM) Index
chosen for their growth orientation. Russell 1000 (Reg. TM) Index is an
unmanaged price-only index of the 1,000 largest capitalized companies that are
domiciled in the US and whose common stocks are traded.
DWS SMALL CAP GROWTH VIP
RUSSELL 2000 (Reg. TM) GROWTH INDEX is an unmanaged capitalization-weighted
measure of 2,000 of the smallest capitalized US companies with a
greater-than-average growth orientation and whose common stocks trade on the
NYSE, NYSE Alternext US (formerly known as "AMEX") and Nasdaq.
DWS STRATEGIC INCOME VIP
The BARCLAYS CAPITAL US GOVERNMENT/CREDIT INDEX is an unmanaged index
comprising intermediate- and long-term government and investment-grade
corporate debt securities.
DWS STRATEGIC VALUE VIP
STANDARD & POOR'S 500 INDEX (S&P 500) is an unmanaged, capitalization-weighted
index of 500 stocks. The index is designed to measure performance of the broad
domestic economy through changes in the aggregate market value of 500 stocks
representing all major industries.
DWS TECHNOLOGY VIP
RUSSELL 1000 (Reg. TM) GROWTH INDEX is an unmanaged index that consists of
those stocks in the Russell 1000 (Reg. TM) Index that have higher price-to-book
ratios and higher forecasted growth values. Russell 1000 (Reg. TM) Index is an
unmanaged price-only index of the 1,000 largest capitalized companies that are
domiciled in the US and whose common stocks are traded.
S&P NORTH AMERICAN TECHNOLOGY SECTOR INDEX is an unmanaged
capitalization-weighted index based on a universe of technology-related stocks.
DWS TURNER MID CAP GROWTH VIP
RUSSELL MIDCAP (Reg. TM) GROWTH INDEX is an unmanaged capitalization-weighted
index of medium and medium/small companies in the Russell 1000 (Reg. TM) Index
chosen for their growth orientation. Russell 1000 (Reg. TM) Index is an
unmanaged price-only index of the 1,000 largest capitalized companies that are
domiciled in the US and whose common stocks are traded.
120
PROSPECTUS May 1, 2010 Appendix
TO GET MORE INFORMATION
SHAREHOLDER REPORTS. These include commentary from a fund's management team
about recent market conditions and the effects of a fund's strategies on its
performance. They also have detailed performance figures, a list of everything
a fund owns, and its financial statements. Shareholders get these reports
automatically.
STATEMENT OF ADDITIONAL INFORMATION (SAI). This tells you more about a fund's
features and policies, including additional risk information. The SAI is
incorporated by reference into this document (meaning that it's legally part of
this prospectus).
For a free copy of any of these documents or to request other information about
a fund, contact DWS Investments at the phone number or address listed below.
SAIs and shareholder reports are also available through the DWS Investments Web
site at www.dws-investments.com. These documents and other information about
each fund are available from the EDGAR Database on the SEC's Internet site at
www.sec.gov. If you like, you may obtain copies of this information, after
paying a copying fee, by e-mailing a request to publicinfo@sec.gov or by
writing the SEC at the address listed below.
You can also review and copy these documents and other information about each
fund, including each fund's SAI, at the SEC's Public Reference Room in
Washington, D.C. Information on the operation of the SEC's Public Reference
Room may be obtained by calling (800) SEC-0330.
CONTACT INFORMATION
DWS INVESTMENTS 222 South Riverside Plaza
Chicago, IL 60606-5808
www.dws-investments.com
(800) 728-3337
SEC 100 F Street, N.E.
Washington, D.C. 20549-0102
WWW.SEC.GOV
(800) SEC-0330
DISTRIBUTOR DWS Investments Distributors, Inc.
222 South Riverside Plaza
Chicago, IL 60606-5808
(800) 621-1148
SEC FILE NUMBER DWS Variable Series II
811-05002
RESHAPING INVESTING. [DWS INVESTMENTS LOGO]
Deutsche Bank Group
(05/01/10) 2A-1
[GRAPHIC APPEARS HERE]
PROSPECTUS
MAY 1, 2010
DWS VARIABLE SERIES II
CLASS B
...............................................................................
DWS Alternative Asset Allocation Plus VIP
DWS Blue Chip VIP
DWS Dreman Small Mid Cap Value VIP
DWS Global Thematic VIP
DWS Government & Agency Securities VIP
DWS High Income VIP
DWS Large Cap Value VIP
DWS Strategic Value VIP
DWS Technology VIP
...............................................................................
This prospectus should be read in conjunction with the variable life insurance
or variable annuity contract prospectus and plan documents for tax-qualified
plans. These shares are available and are being marketed exclusively as a
pooled funding vehicle for life insurance companies writing all types of
variable life insur ance policies and variable annuity contracts.
The Securities and Exchange Commission (SEC) does not approve or disapprove
these shares or determine whether the information in this prospectus is
truthful or complete. It is a criminal offense for anyone to inform you
otherwise.
RESHAPING INVESTING. [DWS INVESTMENTS LOGO]
Deutsche Bank Group
TABLE OF CONTENTS
DWS ALTERNATIVE ASSET ALLOCATION
PLUS VIP
Investment Objective........................ 1
Fees and Expenses of the Fund............... 1
Principal Investment Strategy............... 1
Main Risks.................................. 2
The Fund's Performance History.............. 3
Management.................................. 3
Purchase and Sale of Fund Shares............ 4
Tax Information............................. 4
Payments to Financial Intermediaries........ 4
DWS BLUE CHIP VIP
Investment Objective........................ 5
Fees and Expenses of the Fund............... 5
Principal Investment Strategy............... 5
Main Risks.................................. 6
Past Performance............................ 6
Management.................................. 7
Purchase and Sale of Fund Shares............ 7
Tax Information............................. 7
Payments to Financial Intermediaries........ 7
DWS DREMAN SMALL MID CAP VALUE
VIP
Investment Objective........................ 8
Fees and Expenses of the Fund............... 8
Principal Investment Strategy............... 8
Main Risks.................................. 9
Past Performance............................ 9
Management.................................. 10
Purchase and Sale of Fund Shares............ 10
Tax Information............................. 10
Payments to Financial Intermediaries........ 10
DWS GLOBAL THEMATIC VIP
Investment Objective........................ 11
Fees and Expenses of the Fund............... 11
Principal Investment Strategy............... 11
Main Risks.................................. 12
Past Performance............................ 12
Management.................................. 13
Purchase and Sale of Fund Shares............ 13
Tax Information............................. 13
Payments to Financial Intermediaries........ 13
DWS GOVERNMENT & AGENCY
SECURITIES VIP
Investment Objective........................ 14
Fees and Expenses of the Fund............... 14
Principal Investment Strategy............... 14
Main Risks.................................. 15
Past Performance............................ 15
Management.................................. 16
Purchase and Sale of Fund Shares............ 16
Tax Information............................. 16
Payments to Financial Intermediaries........ 16
DWS HIGH INCOME VIP
Investment Objective........................ 17
Fees and Expenses of the Fund............... 17
Principal Investment Strategy............... 17
Main Risks.................................. 18
Past Performance............................ 18
Management.................................. 19
Purchase and Sale of Fund Shares............ 19
Tax Information............................. 19
Payments to Financial Intermediaries........ 19
DWS LARGE CAP VALUE VIP
Investment Objective........................ 20
Fees and Expenses of the Fund............... 20
Principal Investment Strategy............... 20
Main Risks.................................. 21
Past Performance............................ 21
Management.................................. 22
Purchase and Sale of Fund Shares............ 22
Tax Information............................. 22
Payments to Financial Intermediaries........ 22
DWS STRATEGIC VALUE VIP
Investment Objective............................... 23
Fees and Expenses of the Fund...................... 23
Principal Investment Strategy...................... 23
Main Risks......................................... 24
Past Performance................................... 24
Management......................................... 25
Purchase and Sale of Fund Shares................... 25
Tax Information.................................... 25
Payments to Financial Intermediaries............... 25
DWS TECHNOLOGY VIP
Investment Objective............................... 26
Fees and Expenses of the Fund...................... 26
Principal Investment Strategy...................... 26
Main Risks......................................... 27
Past Performance................................... 28
Management......................................... 28
Purchase and Sale of Fund Shares................... 29
Tax Information.................................... 29
Payments to Financial Intermediaries............... 29
FUND DETAILS
Additional Information About Fund Strategies and
Risks.............................................. 30
DWS Alternative Asset Allocation Plus VIP.......... 30
DWS Blue Chip VIP.................................. 34
DWS Dreman Small Mid Cap Value VIP................. 36
DWS Global Thematic VIP............................ 37
DWS Government & Agency Securities VIP............. 39
DWS High Income VIP................................ 40
DWS Large Cap Value VIP............................ 42
DWS Strategic Value VIP............................ 43
DWS Technology VIP................................. 45
Other Policies and Risks........................... 46
Who Manages and Oversees the Funds................. 47
Management......................................... 50
INVESTING IN THE FUNDS
Your Investment in the Funds....................... 53
Policies about transactions........................ 53
Buying and Selling Shares.......................... 53
How each Fund Calculates Share Price............... 56
Distributions...................................... 57
Taxes.............................................. 57
Marketing and Distribution Fees.................... 57
FINANCIAL HIGHLIGHTS............................... 59
APPENDIX........................................... 64
Hypothetical Expense Summary....................... 64
Additional Index Information....................... 68
-------------------------------------------------------------------------------
YOUR INVESTMENT IN A FUND IS NOT A BANK DEPOSIT AND IS NOT INSURED OR
GUARANTEED BY THE FEDERAL DEPOSIT INSURANCE CORPORATION OR ANY OTHER
GOVERNMENT AGENCY, ENTITY OR PERSON.
-------------------------------------------------------------------------------
[DWS INVESTMENTS LOGO]
Deutsche Bank Group
DWS ALTERNATIVE ASSET ALLOCATION PLUS VIP
INVESTMENT OBJECTIVE
The fund seeks capital appreciation.
FEES AND EXPENSES OF THE FUND
This table describes the fees and expenses you may pay if you buy and hold
shares of the fund. This information does not reflect fees associated with the
separate account that invests in the fund or any variable life insurance policy
or variable annuity contract for which the fund is an investment option. These
fees will increase expenses.
SHAREHOLDER FEES
(paid directly from your investment) None
-------------------------------------- -----
ANNUAL FUND OPERATING EXPENSES (expenses that you pay each year as a % of the
value of your investment)
B
---------
Management fee 0.23
------------------------------------------------------ ----
Distribution/service
(12b-1) fees 0.25
------------------------------------------------------ ----
Other expenses (includes an administrative fee) 3.61
------------------------------------------------------ ----
Acquired funds (underlying funds) fees and expenses 1.23
------------------------------------------------------ ----
TOTAL ANNUAL FUND OPERATING EXPENSES 5.32
------------------------------------------------------ ----
Less fee waiver/expense reimbursement 3.48
------------------------------------------------------ ----
TOTAL ANNUAL FUND OPERATING EXPENSES AFTER FEE WAIVER
AND/OR
EXPENSE REIMBURSEMENT 1.84
------------------------------------------------------ ----
The Advisor has contractually agreed through April 30, 2011 to waive and/or
reimburse fund expenses so that the fund's total annual operating expenses will
not exceed 0.61% for Class B. The agreement may only be terminated with the
consent of the fund's Board and does not extend to extraordinary expenses,
taxes, brokerage and interest expense and acquired funds (underlying funds)
fees and expenses (estimated at 1.23%).
EXAMPLE
This Example is intended to help you compare the cost of investing in the fund
with the cost of investing in other mutual funds. The Example assumes that you
invest $10,000 in the fund for the time periods indicated and then redeem all
of your shares at the end of those periods. The Example also assumes that your
investment has a 5% return each year and that the fund's operating expenses
(including one year of capped expenses) remain the same. Although your actual
costs may be higher or lower, based on these assumptions your costs would be:
1 YEAR 3 YEARS 5 YEARS 10 YEARS
-------- --------- --------- ---------
$187 $1,281 $2,368 $5,056
--- ---- ------ ------ ------
PORTFOLIO TURNOVER
The fund pays transaction costs when it buys and sells securities (or "turns
over" its portfolio). A higher portfolio turnover may indicate higher
transaction costs. These costs are not reflected in annual fund operating
expenses or in the expense example, but are reflected in fund performance.
Portfolio turnover rate for fiscal year 2009: 155%.
PRINCIPAL INVESTMENT STRATEGY
MAIN INVESTMENTS. The fund seeks to achieve its objective by investing in
alternative (or non-traditional) asset categories and investment strategies.
Investments may be made in other DWS funds or directly in the securities and
derivative instruments in which such DWS funds could invest. The fund may also
invest in Exchange Traded Funds (ETFs) to gain a desired economic exposure to a
particular asset category that is not available through a DWS fund. The fund's
allocations among direct investments and other DWS funds may vary over time.
MANAGEMENT PROCESS. The fund allocates its assets among the following
strategies and/or asset categories: market neutral, inflation-protection,
commodities, real estate, floating rate loans, infrastructure and emerging
markets.
The fund may make allocations ranging from 0% to 30% of its assets in a
particular strategy or asset category. In addition, the fund may seek exposure
to hedge funds through warrants, swaps and similar derivative instruments.
2
PROSPECTUS May 1, 2010 DWS Alternative Asset Allocation Plus VIP
IGAP STRATEGY. In addition to the fund's main investment strategy, portfolio
management seeks to enhance returns by employing a global tactical asset
allocation overlay strategy called iGAP (integrated Global Alpha Platform),
which attempts to take advantage of mispricings within global equity, bond,
commodity and currency markets. The iGAP strategy uses derivatives (which are
contracts or other instruments whose value is based on, for example, indices,
currencies or securities), in particular exchange-traded futures contracts on
global equities, bonds and commodities, and over-the-counter forward currency
contracts. The iGAP strategy, with respect to the fund, will not be used until
assets of the fund exceed $50 million, however, the fund may have indirect
exposure to the iGAP strategy through other DWS funds.
The fund may trade actively. This could raise transaction costs (thus lowering
returns).
--------------------------------------------------------------------------------
DERIVATIVES. The fund may use various types of derivatives outside of the iGAP
strategy for hedging, risk management or non-hedging purposes to seek to
enhance potential gains. The fund may use derivatives as a substitute for
direct investment in a particular asset class or to keep cash on hand to meet
shareholder redemptions or other needs.
SECURITIES LENDING. The fund may lend securities (up to one-third of total
assets) to approved institutions.
--------------------------------------------------------------------------------
MAIN RISKS
There are several risk factors that could hurt the fund's performance, cause
you to lose money or cause the fund's performance to trail that of other
investments.
Because the fund invests in underlying funds, the risks listed here include
those of the various underlying funds as well as those of the fund itself.
Therefore, in these risk descriptions the term "the fund" may refer to the fund
itself, one or more underlying funds, or both.
ASSET ALLOCATION RISK. Portfolio management may favor one or more types of
investments or assets that underperform other investments, assets, or
securities markets as a whole. To the extent that alternative asset categories
underperform the general stock market, the fund may underperform funds that
invest mainly in stocks. Anytime portfolio management buys or sells securities
in order to adjust the fund's asset allocation this will increase portfolio
turnover and generate transaction costs.
STOCK MARKET RISK. When stock prices fall, you should expect the value of your
investment to fall as well.
UNDERLYING FUNDS RISK. Because the fund may invest in underlying funds, the
fund's performance will be directly related to the performance of the
underlying portfolios or funds. To the extent that a given underlying fund
underperforms its benchmark or its fund peer group, it may contribute to
underperformance by the fund. In addition, the fund indirectly pays a portion
of the expenses incurred by the underlying funds, which lowers performance. To
the extent that the fund's allocations favor underlying funds with higher
expenses, the overall cost of investing paid by the fund will be higher.
FOREIGN INVESTMENT RISK. To the extent the fund invests in companies based
outside the US, it faces the risks inherent in foreign investing. Adverse
political, economic or social developments could undermine the value of the
fund's investments or prevent the fund from realizing their full value.
Financial reporting standards for companies based in foreign markets differ
from those in the US. Additionally, foreign securities markets generally are
smaller and less liquid than US markets. To the extent that the fund invests in
non-US dollar denominated foreign securities, changes in currency exchange
rates may affect the US dollar value of foreign securities or the income or
gain received on these securities. Foreign investment risks are greater in
emerging markets than in developed markets. Emerging market investments are
often considered speculative.
INTEREST RATE RISK. When interest rates rise, prices of debt securities
generally decline. The longer the duration of the fund's debt securities, the
more sensitive it will be to interest rate changes. (As a general rule, a 1%
rise in interest rates means a 1% fall in value for every year of duration.)
COMMODITIES-RELATED INVESTMENTS RISK. The commodities-linked derivatives
instruments in which the fund invests are more volatile than investments in
equity and fixed income securities and may subject the fund to special risks
that do not apply to all derivatives transactions.
INFLATION-INDEXED BOND RISK. Any rise in interest rates may cause
inflation-indexed bonds to decline in price, hurting fund performance. If
interest rates rise owing to reasons other than inflation, the fund's
investment in these securities may not be fully protected from the effects of
rising interest rates.
CREDIT RISK. The fund's performance could be hurt if a securitiy declines in
credit quality or goes into default, or if an issuer does not make timely
payments of interest or principal.
SMALL COMPANY RISK. Small company stocks tend to be more volatile and less
liquid than large company stocks. Small companies are less widely followed by
stock analysts and less information about them is available to investors.
SENIOR LOANS RISK. Because Senior Loans are not rated by a rating agency,
registered with the Securities and Exchange Commission or any state securities
commission, or listed on any national securities exchange, there may be less
publicly available information about them then for registered or
exchange-listed securities. Also, because portfolio management relies mainly on
its own evaluation of the creditworthiness of borrowers, the fund is
particularly dependent on portfolio management's analytical
3
PROSPECTUS May 1, 2010 DWS Alternative Asset Allocation Plus VIP
abilities. Senior Loans involve other risks described elsewhere in this
prospectus, including conflict of interest risk, credit risk, interest rate
risk, liquidity risk, and prepayment and extension risk.
FOCUS RISK. To the extent that the fund focuses its investments in particular
industries, asset classes or sectors of the economy, any market price
movements, regulatory or technological changes, or economic conditions
affecting companies in those industries, asset classes or sectors will have a
significant impact on the fund's performance.
SHORT SALE RISK. If the fund sells a security short and subsequently has to buy
the security back at a higher price, the fund will lose money on the
transaction. Any loss will be increased by the amount of compensation, interest
or dividends and transaction costs the fund must pay to a lender of the
security. The amount the fund could lose on a short sale is theoretically
unlimited (as compared to a long position, where the maximum loss is the amount
invested).
SECURITIES LENDING RISK. Any decline in the value of a portfolio security that
occurs while the security is out on loan is borne by the fund, and will
adversely affect performance. Also, there may be delays in recovery of
securities loaned or even a loss of rights in the collateral should the
borrower of the securities fail financially while holding the security.
IGAP RISK. The success of the iGAP strategy depends, in part, on portfolio
management's ability to analyze the correlation between various global markets
and asset classes. If portfolio management's correlation analysis proves to be
incorrect, losses to the fund may be significant and may substantially exceed
the intended level of market exposure for the iGAP strategy.
DERIVATIVES RISK. Risks associated with derivatives include the risk that the
derivative is not well correlated with the security, index or currency to which
it relates; the risk that derivatives may result in losses or missed
opportunities; the risk that the fund will be unable to sell the derivative
because of an illiquid secondary market; the risk that a counterparty is
unwilling or unable to meet its obligation; and the risk that the derivative
transaction could expose the fund to the effects of leverage, which could
increase the fund's exposure to the market and magnify potential losses.
SECURITY SELECTION RISK. The securities in the fund's portfolio may decline in
value. Portfolio management could be wrong in its analysis of industries,
companies, economic trends, the relative attractiveness of different securities
or other matters.
BORROWING RISK. To the extent that the fund borrows money for investment
purposes, it creates leverage, meaning that changes in the prices of securities
it owns will have a greater effect on the share price of the fund.
CONFLICT OF INTEREST RISK. To avoid violating laws on self-dealing, the fund
may not be able to invest in Senior Loans issued or marketed by an affiliate of
the Advisor at the desired timing or price.
COUNTERPARTY RISK. A financial institution or other counterparty with whom the
fund does business (such as trading or securities lending), or that
underwrites, distributes or guarantees any investments or contracts that the
fund owns or is otherwise exposed to, may decline in financial health and
become unable to honor its commitments, which could lead to losses for the
fund.
ETF RISK. An ETF is subject to the risks of the assets in which it invests as
well as those of the investment strategy it follows. The fund incurs brokerage
costs when it buys and sells shares of and ETF and also bears its proportionate
share of the ETF's fees and expenses, which are passed through to ETF
shareholders.
LIQUIDITY RISK. In certain situations, it may be difficult or impossible to
sell an investment in an orderly fashion at an acceptable price. This may be an
ongoing risk for some investments, such as derivatives or restricted securities
that typically trade only among a limited number of investors.
PREPAYMENT AND EXTENSION RISK. When interest rates fall, issuers of high
interest debt obligations may pay off the debts earlier than expected
(prepayment risk), and the fund may have to reinvest the proceeds at lower
yields. When interest rates rise, issuers of lower interest debt obligations
may pay off the debts later than expected (extension risk), thus keeping the
fund's assets tied up in lower interest debt obligations. These events could
hurt fund performance.
PRICING RISK. If market conditions make it difficult to value some investments,
the fund may value these investments using more subjective methods, such as
fair value pricing.
TAX STATUS RISK. Income from certain commodity-linked derivatives may not
constitute "qualifying income" to the fund. If such income were not to
constitute qualifying income, the fund might be subject to tax at the fund
level.
THE FUND'S PERFORMANCE HISTORY
Since the fund commenced operations on February 2, 2009, performance
information is not available for a full calendar year.
MANAGEMENT
INVESTMENT ADVISOR
Deutsche Investment Management Americas Inc.
SUBADVISOR
RREEF America L.L.C.
SUB-SUBADVISOR
Deutsche Investments Australia Limited
4
PROSPECTUS May 1, 2010 DWS Alternative Asset Allocation Plus VIP
SUB-SUBADVISOR
RREEF Global Advisers Limited
SUB-SUBADVISOR
Deutsche Asset Management (Hong Kong) Limited
PORTFOLIO MANAGER(S)
ROBERT WANG, MANAGING DIRECTOR. Portfolio Manager of the fund. Joined the fund
in 2009.
INNA OKOUNKOVA, DIRECTOR. Portfolio Manager of the fund. Joined the fund in
2009.
THOMAS PICCIOCHI, DIRECTOR. Portfolio Manager of the fund. Joined the fund in
2009.
PURCHASE AND SALE OF FUND SHARES
THE FUND IS INTENDED FOR USE IN A VARIABLE INSURANCE PRODUCT. You should
contact the sponsoring insurance company for information on how to purchase and
sell shares of the fund.
TAX INFORMATION
Generally, owners of variable annuity and variable life contracts are not
subject to current federal income taxation on distributions of income or gains
with respect to such contracts. For further information concerning federal
income tax consequences for the holders of variable annuity contracts and
variable life insurance policies, such holders should consult the prospectus
used in connection with the issuance of their particular contracts or policies.
PAYMENTS TO FINANCIAL INTERMEDIARIES
If you purchase the fund through selected affiliated and unaffiliated brokers,
dealers, participating insurance companies or other financial intermediaries,
the fund and its affiliates may pay the financial intermediary for the sale of
fund shares and related services. These payments may create a conflict of
interest by influencing the financial intermediary and your salesperson to
recommend the fund over another investment. Ask your salesperson or visit your
insurance company's web site for more information.
5
PROSPECTUS May 1, 2010 DWS Alternative Asset Allocation Plus VIP
[DWS INVESTMENTS LOGO]
Deutsche Bank Group
DWS BLUE CHIP VIP
INVESTMENT OBJECTIVE
The fund seeks growth of capital and income.
FEES AND EXPENSES OF THE FUND
This table describes the fees and expenses you may pay if you buy and hold
shares of the fund. This information does not reflect fees associated with the
separate account that invests in the fund or any variable life insurance policy
or variable annuity contract for which the fund is an investment option. These
fees will increase expenses.
SHAREHOLDER FEES
(paid directly from your investment) None
-------------------------------------- -----
ANNUAL FUND OPERATING EXPENSES (expenses that you pay each year as a % of the
value of your investment)
B
---------
Management fee 0.55
------------------------------------------------ ----
Distribution/service
(12b-1) fees 0.25
------------------------------------------------ ----
Other expenses (includes an administrative fee) 0.22
------------------------------------------------ ----
TOTAL ANNUAL FUND OPERATING EXPENSES 1.02
------------------------------------------------ ----
EXAMPLE
This Example is intended to help you compare the cost of investing in the fund
with the cost of investing in other mutual funds. The Example assumes that you
invest $10,000 in the fund for the time periods indicated and then redeem all
of your shares at the end of those periods. The Example also assumes that your
investment has a 5% return each year and that the fund's operating expenses
remain the same. Although your actual costs may be higher or lower, based on
these assumptions your costs would be:
1 YEAR 3 YEARS 5 YEARS 10 YEARS
-------- --------- --------- ---------
$104 $325 $563 $1,248
--- ---- ---- ---- ------
PORTFOLIO TURNOVER
The fund pays transaction costs when it buys and sells securities (or "turns
over" its portfolio). A higher portfolio turnover may indicate higher
transaction costs. These costs are not reflected in annual fund operating
expenses or in the expense example, but are reflected in fund performance.
Portfolio turnover rate for fiscal year 2009: 82%.
PRINCIPAL INVESTMENT STRATEGY
MAIN INVESTMENTS. Under normal circumstances, the fund invests at least 80% of
net assets, plus the amount of any borrowings for investment purposes, in
common stocks of large US companies that are similar in size to the companies
in the S&P 500( (Reg. TM)) Index (generally the 500 largest companies in the
US) and that portfolio management considers to be "blue chip" companies. Blue
chip companies are large, well-known companies that typically have an
established earnings and dividends history, easy access to credit, solid
positions in their industry and strong management.
While the fund invests mainly in US common stocks, it could invest up to 20% of
net assets in foreign securities. The fund may also invest in other types of
equity securities such as preferred stocks or convertible securities.
MANAGEMENT PROCESS. Portfolio management looks for "blue chip" companies whose
stock price is attractive relative to potential growth. Portfolio management
uses both quantitative techniques and fundamental analysis to evaluate each
company's stock price relative to the company's earnings, operating trends,
market outlook and other measures of performance potential.
Portfolio management will normally sell a stock when they believe its
fundamental factors have changed, other investments offer better opportunities
or in the course of adjusting the fund's emphasis on or within a given
industry.
6
PROSPECTUS May 1, 2010 DWS Blue Chip VIP
--------------------------------------------------------------------------------
DERIVATIVES. The fund may use various types of derivatives (contracts whose
value is based on, for example, indices, currencies or securities) for hedging,
risk management or non-hedging purposes to seek to enhance potential gains. The
fund may use derivatives as a substitute for direct investment in a particular
asset class or to keep cash on hand to meet shareholder redemptions or other
needs.
SECURITIES LENDING. The fund may lend securities (up to one-third of total
assets) to approved institutions.
--------------------------------------------------------------------------------
MAIN RISKS
There are several risk factors that could hurt the fund's performance, cause
you to lose money or cause the fund's performance to trail that of other
investments.
STOCK MARKET RISK. When stock prices fall, you should expect the value of your
investment to fall as well. To the extent the fund invests in a particular
capitalization or market sector, the fund's performance may be proportionately
affected by that segment's general performance.
FOCUS RISK. To the extent that the fund focuses its investments in particular
industries, asset classes or sectors of the economy, any market price
movements, regulatory or technological changes, or economic conditions
affecting companies in those industries, asset classes or sectors will have a
significant impact on the fund's performance.
SECURITY SELECTION RISK. The securities in the fund's portfolio may decline in
value. Portfolio management could be wrong in its analysis of industries,
companies, economic trends, the relative attractiveness of different securities
or other matters.
SECURITIES LENDING RISK. Any decline in the value of a portfolio security that
occurs while the security is out on loan is borne by the fund, and will
adversely affect performance. Also, there may be delays in recovery of
securities loaned or even a loss of rights in the collateral should the
borrower of the securities fail financially while holding the security.
FOREIGN INVESTMENT RISK. To the extent the fund invests in companies based
outside the US, it faces the risks inherent in foreign investing. Adverse
political, economic or social developments could undermine the value of the
fund's investments or prevent the fund from realizing their full value.
Financial reporting standards for companies based in foreign markets differ
from those in the US. Additionally, foreign securities markets generally are
smaller and less liquid than US markets. To the extent that the fund invests in
non-US dollar denominated foreign securities, changes in currency exchange
rates may affect the US dollar value of foreign securities or the income or
gain received on these securities.
DERIVATIVES RISK. Risks associated with derivatives include the risk that the
derivative is not well correlated with the security, index or currency to which
it relates; the risk that derivatives may result in losses or missed
opportunities; the risk that the fund will be unable to sell the derivative
because of an illiquid secondary market; the risk that a counterparty is
unwilling or unable to meet its obligation; and the risk that the derivative
transaction could expose the fund to the effects of leverage, which could
increase the fund's exposure to the market and magnify potential losses.
COUNTERPARTY RISK. A financial institution or other counterparty with whom the
fund does business (such as trading or securities lending), or that
underwrites, distributes or guarantees any investments or contracts that the
fund owns or is otherwise exposed to, may decline in financial health and
become unable to honor its commitments, which could lead to losses for the
fund.
LIQUIDITY RISK. In certain situations, it may be difficult or impossible to
sell an investment in an orderly fashion at an acceptable price. This may be an
ongoing risk for some investments, such as derivatives or restricted securities
that typically trade only among a limited number of investors.
PRICING RISK. If market conditions make it difficult to value some investments,
the fund may value these investments using more subjective methods, such as
fair value pricing.
PAST PERFORMANCE
How a fund's returns vary from year to year can give an idea of its risk; so
can comparing fund performance to overall market performance (as measured by an
appropriate market index). Past performance may not indicate future results.
All performance figures below assume that dividends were reinvested. For more
recent performance figures, go to www.dws-investments.com (the Web site does
not form a part of this prospectus) or call the phone number for your share
class included in this prospectus. This information doesn't reflect fees
associated with the separate account that invests in the fund or any variable
life insurance policy or variable annuity contract for which the fund is an
investment option. These fees will reduce returns.
The inception date for Class B was July 1, 2002. In the bar chart and table,
the performance figures for Class B before that date are based on the
historical performance of the fund's original share class (Class A), adjusted
to reflect the higher gross total annual operating expenses of Class B. Class A
is offered in a different prospectus.
CALENDAR YEAR TOTAL RETURNS (%) (Class B)
[BAR GRAPHIC OMITTED HERE]
[BAR GRAPHIC DATA]
-8.07 -16.02 -22.31 26.76 15.55 9.68 15.19 3.15 3.15 33.46
2000 2001 2002 2003 2004 2005 2006 2007 2008 2009
Best Quarter: 18.09%, Q3 2009 Worst Quarter: -21.60%, Q4 2008
Year-to-Date as of 3/31/10: 5.26%
7
PROSPECTUS May 1, 2010 DWS Blue Chip VIP
AVERAGE ANNUAL TOTAL RETURNS
(For periods ended 12/31/2009 expressed as a %)
CLASS 1 5 10
INCEPTION YEAR YEARS YEARS
----------- ---------- --------- ----------
CLASS B 7/1/02 33.46 1.36 -0.62
-------------------- ------ ----- ---- ------
RUSSELL 1000 INDEX 28.43 0.79 -0.49
-------------------- ------ ----- ---- ------
MANAGEMENT
INVESTMENT ADVISOR
Deutsche Investment Management Americas Inc.
PORTFOLIO MANAGER(S)
ROBERT WANG, MANAGING DIRECTOR. Portfolio Manager of the fund. Joined the fund
in 2003.
RUSSELL SHTERN, CFA, VICE PRESIDENT. Portfolio Manager of the fund. Joined the
fund in 2010.
PURCHASE AND SALE OF FUND SHARES
THE FUND IS INTENDED FOR USE IN A VARIABLE INSURANCE PRODUCT. You should
contact the sponsoring insurance company for information on how to purchase and
sell shares of the fund.
TAX INFORMATION
Generally, owners of variable annuity and variable life contracts are not
subject to current federal income taxation on distributions of income or gains
with respect to such contracts. For further information concerning federal
income tax consequences for the holders of variable annuity contracts and
variable life insurance policies, such holders should consult the prospectus
used in connection with the issuance of their particular contracts or policies.
PAYMENTS TO FINANCIAL INTERMEDIARIES
If you purchase the fund through selected affiliated and unaffiliated brokers,
dealers, participating insurance companies or other financial intermediaries,
the fund and its affiliates may pay the financial intermediary for the sale of
fund shares and related services. These payments may create a conflict of
interest by influencing the financial intermediary and your salesperson to
recommend the fund over another investment. Ask your salesperson or visit your
insurance company's web site for more information.
8
PROSPECTUS May 1, 2010 DWS Blue Chip VIP
[DWS INVESTMENTS LOGO]
Deutsche Bank Group
DWS DREMAN SMALL MID CAP VALUE VIP
INVESTMENT OBJECTIVE
The fund seeks long-term capital appreciation.
FEES AND EXPENSES OF THE FUND
This table describes the fees and expenses you may pay if you buy and hold
shares of the fund. This information does not reflect fees associated with the
separate account that invests in the fund or any variable life insurance policy
or variable annuity contract for which the fund is an investment option. These
fees will increase expenses.
SHAREHOLDER FEES
(paid directly from your investment) None
-------------------------------------- -----
ANNUAL FUND OPERATING EXPENSES (expenses that you pay each year as a % of the
value of your investment)
B
---------
Management fee 0.65
------------------------------------------------ ----
Distribution/service
(12b-1) fees 0.25
------------------------------------------------ ----
Other expenses (includes an administrative fee) 0.24
------------------------------------------------ ----
TOTAL ANNUAL FUND OPERATING EXPENSES 1.14
------------------------------------------------ ----
EXAMPLE
This Example is intended to help you compare the cost of investing in the fund
with the cost of investing in other mutual funds. The Example assumes that you
invest $10,000 in the fund for the time periods indicated and then redeem all
of your shares at the end of those periods. The Example also assumes that your
investment has a 5% return each year and that the fund's operating expenses
remain the same. Although your actual costs may be higher or lower, based on
these assumptions your costs would be:
1 YEAR 3 YEARS 5 YEARS 10 YEARS
-------- --------- --------- ---------
$116 $362 $628 $1,386
--- ---- ---- ---- ------
PORTFOLIO TURNOVER
The fund pays transaction costs when it buys and sells securities (or "turns
over" its portfolio). A higher portfolio turnover may indicate higher
transaction costs. These costs are not reflected in annual fund operating
expenses or in the expense example, but are reflected in fund performance.
Portfolio turnover rate for fiscal year 2009: 72%.
PRINCIPAL INVESTMENT STRATEGY
Under normal circumstances, the fund invests at least 80% of net assets, plus
the amount of any borrowings for investment purposes, in undervalued common
stocks of small and mid-size US companies. The fund defines small companies as
those that are similar in market value to those in the Russell 2000 (Reg. TM)
Value Index. The fund defines mid-size companies as those that are similar in
market value to those in the Russell Midcap (Reg. TM) Value Index. The fund
intends to invest primarily in companies whose market capitalizations fall
within the normal range of each Index.
While the fund invests mainly in US stocks, it could invest up to 20% of net
assets in foreign securities.
MANAGEMENT PROCESS. Portfolio management begins by screening stocks of small
and mid-size companies with below-market price-to-earnings (P/E) ratios.
Portfolio management then compares the company's stock price to such measures
as book value, cash flow and yield and analyzes individual companies to
identify those that are fundamentally sound and appear to have strong potential
for earnings and dividend growth over the Russell 2500 Value Index.
Portfolio management then assembles the fund's portfolio from among the most
attractive stocks, drawing, in addition, on an analysis of economic outlooks
for various industries.
Portfolio management will normally sell a stock when it no longer qualifies as
a small or mid-size company, when its P/E rises above that of the industry
median or the median
9
PROSPECTUS May 1, 2010 DWS Dreman Small Mid Cap Value VIP
for the Russell 2500 Value Index, its fundamentals change or other investments
offer better opportunities.
--------------------------------------------------------------------------------
DERIVATIVES. The fund may use various types of derivatives (contracts whose
value is based on, for example, indices, currencies or securities) for hedging,
risk management or non-hedging purposes to seek to enhance potential gains. The
fund may use derivatives as a substitute for direct investment in a particular
asset class or to keep cash on hand to meet shareholder redemptions or other
needs. In particular, the fund may use futures, currency options and forward
currency transactions.
SECURITIES LENDING. The fund may lend securities (up to one-third of total
assets) to approved institutions.
--------------------------------------------------------------------------------
MAIN RISKS
There are several risk factors that could hurt the fund's performance, cause
you to lose money or cause the fund's performance to trail that of other
investments.
STOCK MARKET RISK. When stock prices fall, you should expect the value of your
investment to fall as well. To the extent the fund invests in a particular
capitalization or market sector, the fund's performance may be proportionately
affected by that segment's general performance.
SECURITY SELECTION RISK. The securities in the fund's portfolio may decline in
value. Portfolio management could be wrong in its analysis of industries,
companies, economic trends, the relative attractiveness of different securities
or other matters.
VALUE INVESTING RISK. As a category, value stocks may underperform growth
stocks (and the stock market as a whole) over any period of time. In addition,
value stocks selected for investment by portfolio management may not perform as
anticipated: stocks that appear undervalued may remain undervalued
indefinitely, or may in fact be fairly valued.
SMALL COMPANY RISK. Small company stocks tend to be more volatile and less
liquid than large company stocks. Small companies are less widely followed by
stock analysts and less information about them is available to investors.
MEDIUM-SIZED COMPANY RISK. Medium-sized company stocks tend to be more volatile
than large company stocks. Medium-sized companies are less widely followed by
stock analysts and less information about them is available to investors.
FOCUS RISK. To the extent that the fund focuses its investments in particular
industries, asset classes or sectors of the economy, any market price
movements, regulatory or technological changes, or economic conditions
affecting companies in those industries, asset classes or sectors will have a
significant impact on the fund's performance.
FOREIGN INVESTMENT RISK. To the extent the fund invests in companies based
outside the US, it faces the risks inherent in foreign investing. Adverse
political, economic or social developments could undermine the value of the
fund's investments or prevent the fund from realizing their full value.
Financial reporting standards for companies based in foreign markets differ
from those in the US. Additionally, foreign securities markets generally are
smaller and less liquid than US markets. To the extent that the fund invests in
non-US dollar denominated foreign securities, changes in currency exchange
rates may affect the US dollar value of foreign securities or the income or
gain received on these securities. Foreign investment risks are greater in
emerging markets than in developed markets. Emerging market investments are
often considered speculative.
DERIVATIVES RISK. Risks associated with derivatives include the risk that the
derivative is not well correlated with the security, index or currency to which
it relates; the risk that derivatives may result in losses or missed
opportunities; the risk that the fund will be unable to sell the derivative
because of an illiquid secondary market; the risk that a counterparty is
unwilling or unable to meet its obligation; and the risk that the derivative
transaction could expose the fund to the effects of leverage, which could
increase the fund's exposure to the market and magnify potential losses.
SECURITIES LENDING RISK. Any decline in the value of a portfolio security that
occurs while the security is out on loan is borne by the fund, and will
adversely affect performance. Also, there may be delays in recovery of
securities loaned or even a loss of rights in the collateral should the
borrower of the securities fail financially while holding the security.
COUNTERPARTY RISK. A financial institution or other counterparty with whom the
fund does business (such as trading or securities lending), or that
underwrites, distributes or guarantees any investments or contracts that the
fund owns or is otherwise exposed to, may decline in financial health and
become unable to honor its commitments, which could lead to losses for the
fund.
LIQUIDITY RISK. In certain situations, it may be difficult or impossible to
sell an investment in an orderly fashion at an acceptable price. This may be an
ongoing risk for some investments, such as derivatives or restricted securities
that typically trade only among a limited number of investors.
PRICING RISK. If market conditions make it difficult to value some investments,
the fund may value these investments using more subjective methods, such as
fair value pricing.
PAST PERFORMANCE
How a fund's returns vary from year to year can give an idea of its risk; so
can comparing fund performance to overall market performance (as measured by an
appropriate market index). Past performance may not indicate future results.
All performance figures below assume that dividends were reinvested. For more
recent performance figures, go to www.dws-investments.com (the Web site
10
PROSPECTUS May 1, 2010 DWS Dreman Small Mid Cap Value VIP
does not form a part of this prospectus) or call the phone number for your
share class included in this prospectus. This information doesn't reflect fees
associated with the separate account that invests in the fund or any variable
life insurance policy or variable annuity contract for which the fund is an
investment option. These fees will reduce returns.
The inception date for Class B was July 1, 2002. In the bar chart and table,
the performance figures for Class B before that date are based on the
historical performance of the portfolio's original share class (Class A),
adjusted to reflect the higher gross total annual operating expenses of Class
B. Class A is offered in a different prospectus.
Prior to January 18, 2002, the fund was named Scudder Small Cap Value
Portfolio, operated with a different investment strategy and a different
advisor managed the fund. Performance would have been different if the fund's
current policies and advisory agreement had been in effect. Prior to November
3, 2006, the fund was named DWS Dreman Small Cap Value VIP and operated with a
different investment strategy. Performance would have been different if the
fund's current policies had been in effect.
CALENDAR YEAR TOTAL RETURNS (%) (Class B)
[BAR GRAPHIC OMITTED HERE]
[BAR GRAPHIC DATA]
3.79 17.37 -11.63 41.65 25.52 9.78 24.59 2.67 -33.67 29.28
2000 2001 2002 2003 2004 2005 2006 2007 2008 2009
Best Quarter: 21.63%, Q2 2003 Worst Quarter: -20.24%, Q4 2008
Year-to-Date as of 3/31/10: 7.38%
AVERAGE ANNUAL TOTAL RETURNS
(For periods ended 12/31/2009 expressed as a %)
CLASS 1 5 10
INCEPTION YEAR YEARS YEARS
----------- ---------- --------- ---------
CLASS B 7/1/02 29.28 3.78 8.71
------------------- ------ ----- ---- ----
RUSSELL 2500 VALUE
INDEX 27.68 0.84 8.18
------------------- ------ ----- ---- ----
MANAGEMENT
INVESTMENT ADVISOR
Deutsche Investment Management Americas Inc.
SUBADVISOR
Dreman Value Management, L.L.C.
PORTFOLIO MANAGER(S)
DAVID N. DREMAN. Chairman and Chief Investment Officer of Dreman Value
Management, L.L.C. and Lead Portfolio Manager of the fund. Joined the fund in
2002.
E. CLIFTON HOOVER, JR. Co-Chief Investment Officer and Managing Director of
Dreman Value Management, L.L.C. and Portfolio Manager of the fund. Joined the
fund in 2006.
MARK ROACH. Managing Director of Dreman Value Management, L.L.C. and Portfolio
Manager of the fund. Joined the fund in 2006.
PURCHASE AND SALE OF FUND SHARES
THE FUND IS INTENDED FOR USE IN A VARIABLE INSURANCE PRODUCT. You should
contact the sponsoring insurance company for information on how to purchase and
sell shares of the fund.
TAX INFORMATION
Generally, owners of variable annuity and variable life contracts are not
subject to current federal income taxation on distributions of income or gains
with respect to such contracts. For further information concerning federal
income tax consequences for the holders of variable annuity contracts and
variable life insurance policies, such holders should consult the prospectus
used in connection with the issuance of their particular contracts or policies.
PAYMENTS TO FINANCIAL INTERMEDIARIES
If you purchase the fund through selected affiliated and unaffiliated brokers,
dealers, participating insurance companies or other financial intermediaries,
the fund and its affiliates may pay the financial intermediary for the sale of
fund shares and related services. These payments may create a conflict of
interest by influencing the financial intermediary and your salesperson to
recommend the fund over another investment. Ask your salesperson or visit your
insurance company's web site for more information.
11
PROSPECTUS May 1, 2010 DWS Dreman Small Mid Cap Value VIP
[DWS INVESTMENTS LOGO]
Deutsche Bank Group
DWS GLOBAL THEMATIC VIP
INVESTMENT OBJECTIVE
The fund seeks long-term capital growth.
FEES AND EXPENSES OF THE FUND
This table describes the fees and expenses you may pay if you buy and hold
shares of the fund. This information does not reflect fees associated with the
separate account that invests in the fund or any variable life insurance policy
or variable annuity contract for which the fund is an investment option. These
fees will increase expenses.
SHAREHOLDER FEES
(paid directly from your investment) None
-------------------------------------- -----
ANNUAL FUND OPERATING EXPENSES (expenses that you pay each year as a % of the
value of your investment)
B
---------
Management fee 0.92
---------------------------------------------------- ----
Distribution/service
(12b-1) fees 0.25
---------------------------------------------------- ----
Other expenses (includes an administrative fee) 0.56
---------------------------------------------------- ----
Acquired funds (underlying funds) fees and expenses 0.01
---------------------------------------------------- ----
TOTAL ANNUAL FUND OPERATING EXPENSES 1.74
---------------------------------------------------- ----
EXAMPLE
This Example is intended to help you compare the cost of investing in the fund
with the cost of investing in other mutual funds. The Example assumes that you
invest $10,000 in the fund for the time periods indicated and then redeem all
of your shares at the end of those periods. The Example also assumes that your
investment has a 5% return each year and that the fund's operating expenses
remain the same. Although your actual costs may be higher or lower, based on
these assumptions your costs would be:
1 YEAR 3 YEARS 5 YEARS 10 YEARS
-------- --------- --------- ---------
$177 $548 $944 $2,052
--- ---- ---- ---- ------
PORTFOLIO TURNOVER
The fund pays transaction costs when it buys and sells securities (or "turns
over" its portfolio). A higher portfolio turnover may indicate higher
transaction costs. These costs are not reflected in annual fund operating
expenses or in the expense example, but are reflected in fund performance.
Portfolio turnover rate for fiscal year 2009: 190%.
PRINCIPAL INVESTMENT STRATEGY
MAIN INVESTMENTS. Under normal circumstances, the fund invests at least 80% of
net assets, plus the amount of any borrowings for investment purposes, in
common stocks and other equities of companies throughout the world that
portfolio management considers to be "blue chip" companies. Blue chip companies
are large, well known companies that typically have an established earnings and
dividends history, easy access to credit, solid positions in their industries
and strong management.
MANAGEMENT PROCESS.
In choosing securities, portfolio management uses a combination of three
analytical disciplines:
o BOTTOM-UP RESEARCH. Portfolio management looks for individual companies with
a history of above-average growth, strong competitive positioning,
attractive prices relative to potential growth, sound financial strength
and effective management, among other factors.
o GROWTH ORIENTATION. Portfolio management generally looks for companies that
portfolio management believes have above-average potential for sustainable
growth of revenue or earnings and whose market value appears reasonable in
light of their business prospects.
o ANALYSIS OF GLOBAL THEMES. Portfolio management considers global economic
outlooks, seeking to identify industries and companies that are likely to
benefit from social, political and economic changes.
Portfolio management uses analytical tools to actively monitor the risk profile
of the portfolio as compared to comparable funds and appropriate benchmarks and
peer groups.
12
PROSPECTUS May 1, 2010 DWS Global Thematic VIP
Portfolio management will normally sell a stock when portfolio management
believes its price is unlikely to go much higher, its fundamentals have
deteriorated, other investments offer better opportunities or in the course of
adjusting the fund's exposure to a given country.
The fund may trade actively. This could raise transaction costs (thus lowering
returns).
--------------------------------------------------------------------------------
DERIVATIVES. The fund may use various types of derivatives (contracts whose
value is based on, for example, indices, currencies or securities) for hedging,
risk management or non-hedging purposes to seek to enhance potential gains. The
fund may use derivatives as a substitute for direct investment in a particular
asset class or to keep cash on hand to meet shareholder redemptions or other
needs. In particular, the fund may use futures, currency options and forward
currency transactions.
SECURITIES LENDING. The fund may lend securities (up to one-third of total
assets) to approved institutions.
--------------------------------------------------------------------------------
MAIN RISKS
There are several risk factors that could hurt the fund's performance, cause
you to lose money or cause the fund's performance to trail that of other
investments.
STOCK MARKET RISK. When stock prices fall, you should expect the value of your
investment to fall as well. To the extent that the fund invests in a particular
geographic region or market sector, performance will be affected by that
region's general performance.
FOREIGN INVESTMENT RISK. To the extent the fund invests in companies based
outside the US, it faces the risks inherent in foreign investing. Adverse
political, economic or social developments could undermine the value of the
fund's investments or prevent the fund from realizing their full value.
Financial reporting standards for companies based in foreign markets differ
from those in the US. Additionally, foreign securities markets generally are
smaller and less liquid than US markets. To the extent that the fund invests in
non-US dollar denominated foreign securities, changes in currency exchange
rates may affect the US dollar value of foreign securities or the income or
gain received on these securities. Foreign investment risks are greater in
emerging markets than in developed markets. Emerging market investments are
often considered speculative.
SECURITY SELECTION RISK. The securities in the fund's portfolio may decline in
value. Portfolio management could be wrong in its analysis of industries,
companies, economic trends, the relative attractiveness of different securities
or other matters.
LIQUIDITY RISK. In certain situations, it may be difficult or impossible to
sell an investment in an orderly fashion at an acceptable price. This may be an
ongoing risk for some investments, such as derivatives or restricted securities
that typically trade only among a limited number of investors.
PRICING RISK. If market conditions make it difficult to value some investments,
the fund may value these investments using more subjective methods, such as
fair value pricing.
DERIVATIVES RISK. Risks associated with derivatives include the risk that the
derivative is not well correlated with the security, index or currency to which
it relates; the risk that derivatives may result in losses or missed
opportunities; the risk that the fund will be unable to sell the derivative
because of an illiquid secondary market; the risk that a counterparty is
unwilling or unable to meet its obligation; and the risk that the derivative
transaction could expose the fund to the effects of leverage, which could
increase the fund's exposure to the market and magnify potential losses.
SECURITIES LENDING RISK. Any decline in the value of a portfolio security that
occurs while the security is out on loan is borne by the fund, and will
adversely affect performance. Also, there may be delays in recovery of
securities loaned or even a loss of rights in the collateral should the
borrower of the securities fail financially while holding the security.
COUNTERPARTY RISK. A financial institution or other counterparty with whom the
fund does business (such as trading or securities lending), or that
underwrites, distributes or guarantees any investments or contracts that the
fund owns or is otherwise exposed to, may decline in financial health and
become unable to honor its commitments, which could lead to losses for the
fund.
PAST PERFORMANCE
How a fund's returns vary from year to year can give an idea of its risk; so
can comparing fund performance to overall market performance (as measured by an
appropriate market index). Past performance may not indicate future results.
All performance figures below assume that dividends were reinvested. For more
recent performance figures, go to www.dws-investments.com (the Web site does
not form a part of this prospectus) or call the phone number for your share
class included in this prospectus. This information doesn't reflect fees
associated with the separate account that invests in the fund or any variable
life insurance policy or variable annuity contract for which the fund is an
investment option. These fees will reduce returns.
The inception date for Class B was July 1, 2002. In the bar chart and table,
the performance figures for Class B before that date are based on the
historical performance of the fund's original share class (Class A), adjusted
to reflect the higher gross total annual operating expenses of Class B. Class A
is offered in a different prospectus.
13
PROSPECTUS May 1, 2010 DWS Global Thematic VIP
CALENDAR YEAR TOTAL RETURNS (%) (Class B)
[BAR GRAPHIC OMITTED HERE]
[BAR GRAPHIC DATA]
-3.60 -15.69 -16.10 28.96 14.33 22.50 29.65 5.84 -47.87 43.23
2000 2001 2002 2003 2004 2005 2006 2007 2008 2009
Best Quarter: 26.48%, Q2 2009 Worst Quarter: -24.71%, Q4 2008
Year-to-Date as of 3/31/10: 3.27%
AVERAGE ANNUAL TOTAL RETURNS
(For periods ended 12/31/2009 expressed as a %)
CLASS 1 5 10
INCEPTION YEAR YEARS YEARS
----------- ---------- --------- ---------
CLASS B 7/1/02 43.23 4.65 2.37
------------------ ------ ----- ---- -----
MSCI WORLD INDEX 29.99 2.01 -0.24
------------------ ------ ----- ---- ------
MANAGEMENT
INVESTMENT ADVISOR
Deutsche Investment Management Americas Inc.
PORTFOLIO MANAGER(S)
OLIVER KRATZ, MANAGING DIRECTOR. Portfolio Manager of the fund. Joined the fund
in 2003.
PURCHASE AND SALE OF FUND SHARES
THE FUND IS INTENDED FOR USE IN A VARIABLE INSURANCE PRODUCT. You should
contact the sponsoring insurance company for information on how to purchase and
sell shares of the fund.
TAX INFORMATION
Generally, owners of variable annuity and variable life contracts are not
subject to current federal income taxation on distributions of income or gains
with respect to such contracts. For further information concerning federal
income tax consequences for the holders of variable annuity contracts and
variable life insurance policies, such holders should consult the prospectus
used in connection with the issuance of their particular contracts or policies.
PAYMENTS TO FINANCIAL INTERMEDIARIES
If you purchase the fund through selected affiliated and unaffiliated brokers,
dealers, participating insurance companies or other financial intermediaries,
the fund and its affiliates may pay the financial intermediary for the sale of
fund shares and related services. These payments may create a conflict of
interest by influencing the financial intermediary and your salesperson to
recommend the fund over another investment. Ask your salesperson or visit your
insurance company's web site for more information.
14
PROSPECTUS May 1, 2010 DWS Global Thematic VIP
[DWS INVESTMENTS LOGO]
Deutsche Bank Group
DWS GOVERNMENT & AGENCY SECURITIES VIP
INVESTMENT OBJECTIVE
The fund seeks high current income consistent with preservation of capital.
FEES AND EXPENSES OF THE FUND
This table describes the fees and expenses you may pay if you buy and hold
shares of the fund. This information does not reflect fees associated with the
separate account that invests in the fund or any variable life insurance policy
or variable annuity contract for which the fund is an investment option. These
fees will increase expenses.
SHAREHOLDER FEES
(paid directly from your investment) None
-------------------------------------- -----
ANNUAL FUND OPERATING EXPENSES (expenses that you pay each year as a % of the
value of your investment)
B
---------
Management fee 0.45
------------------------------------------------ ----
Distribution/service
(12b-1) fees 0.25
------------------------------------------------ ----
Other expenses (includes an administrative fee) 0.22
------------------------------------------------ ----
TOTAL ANNUAL FUND OPERATING EXPENSES 0.92
------------------------------------------------ ----
EXAMPLE
This Example is intended to help you compare the cost of investing in the fund
with the cost of investing in other mutual funds. The Example assumes that you
invest $10,000 in the fund for the time periods indicated and then redeem all
of your shares at the end of those periods. The Example also assumes that your
investment has a 5% return each year and that the fund's operating expenses
remain the same. Although your actual costs may be higher or lower, based on
these assumptions your costs would be:
1 YEAR 3 YEARS 5 YEARS 10 YEARS
-------- --------- --------- ---------
$94 $293 $509 $1,131
--- --- ---- ---- ------
PORTFOLIO TURNOVER
The fund pays transaction costs when it buys and sells securities (or "turns
over" its portfolio). A higher portfolio turnover may indicate higher
transaction costs. These costs are not reflected in annual fund operating
expenses or in the expense example, but are reflected in fund performance.
Portfolio turnover rate for fiscal year 2009: 390%.
PRINCIPAL INVESTMENT STRATEGY
MAIN INVESTMENTS. Under normal circumstances, the fund invests at least 80% of
net assets, plus the amount of any borrowings for investment purposes, in US
government securities and repurchase agreements of US government securities. US
government-related debt instruments in which the fund may invest include: (i)
direct obligations of the US Treasury; (ii) securities such as Ginnie Maes
which are mortgage-backed securities issued and guaranteed by the Government
National Mortgage Association (GNMA) and supported by the full faith and credit
of the United States; and (iii) securities issued or guaranteed, as to their
payment of principal and interest, by US government agencies or government
sponsored entities, some of which may be supported only by the credit of the
issuer.
The fund normally invests all of its assets in securities issued or guaranteed
by the US government, its agencies or instrumentalities, except the fund may
invest up to 10% of its net assets in cash equivalents, such as money market
funds, and short-term bond funds. These securities may not be issued or
guaranteed by the US government, its agencies or instrumentalities.
MANAGEMENT PROCESS. In deciding which types of government bonds to buy and
sell, portfolio management first considers the relative attractiveness of US
Treasuries compared to other US government and agency securities and then
determines allocations. Their decisions are generally based on a number of
factors, including changes in supply and demand within the bond market.
15
PROSPECTUS May 1, 2010 DWS Government & Agency Securities VIP
In choosing individual bonds, portfolio management reviews each bond's
fundamentals, compares the yields of shorter maturity bonds to those of longer
maturity bonds and uses technical analysis to project prepayment rates and
other factors that could affect a bond's attractiveness. Portfolio management
may also adjust the duration (a measure of sensitivity to interest rate
movements) of the fund's portfolio, based upon their analysis.
The fund may trade actively. This could raise transaction costs (thus lowering
returns).
--------------------------------------------------------------------------------
DERIVATIVES. The fund may use various types of derivatives (contracts whose
value is based on, for example, indices, currencies or securities) for hedging,
risk management or non-hedging purposes to seek to enhance potential gains. The
fund may use derivatives as a substitute for direct investment in a particular
asset class or to keep cash on hand to meet shareholder redemptions or other
needs.
SECURITIES LENDING. The fund may lend securities (up to one-third of total
assets) to approved institutions.
--------------------------------------------------------------------------------
MAIN RISKS
There are several risk factors that could hurt the fund's performance, cause
you to lose money or cause the fund's performance to trail that of other
investments.
INTEREST RATE RISK. When interest rates rise, prices of debt securities
generally decline. The longer the duration of the fund's debt securities, the
more sensitive it will be to interest rate changes. (As a general rule, a 1%
rise in interest rates means a 1% fall in value for every year of duration.)
DERIVATIVES RISK. Risks associated with derivatives include the risk that the
derivative is not well correlated with the security, index or currency to which
it relates; the risk that derivatives may result in losses or missed
opportunities; the risk that the fund will be unable to sell the derivative
because of an illiquid secondary market; the risk that a counterparty is
unwilling or unable to meet its obligation; and the risk that the derivative
transaction could expose the fund to the effects of leverage, which could
increase the fund's exposure to the market and magnify potential losses.
SECURITY SELECTION RISK. The securities in the fund's portfolio may decline in
value. Portfolio management could be wrong in its analysis of industries,
companies, economic trends, the relative attractiveness of different securities
or other matters.
CREDIT RISK. The fund's performance could be hurt if a security declines in
credit quality or goes into default, or if an issuer does not make timely
payments of interest or principal.
Some securities issued by US government agencies or instrumentalities are
backed by the full faith and credit of the US government. Others are supported
only by the credit of that agency or instrumentality. For this latter group, if
there is a potential or actual loss of principal and interest of these
securities, the US government might provide financial support, but has no
obligation to do so.
SECURITIES LENDING RISK. Any decline in the value of a portfolio security that
occurs while the security is out on loan is borne by the fund, and will
adversely affect performance. Also, there may be delays in recovery of
securities loaned or even a loss of rights in the collateral should the
borrower of the securities fail financially while holding the security.
COUNTERPARTY RISK. A financial institution or other counterparty with whom the
fund does business (such as trading or securities lending), or that
underwrites, distributes or guarantees any investments or contracts that the
fund owns or is otherwise exposed to, may decline in financial health and
become unable to honor its commitments, which could lead to losses for the
fund.
LIQUIDITY RISK. In certain situations, it may be difficult or impossible to
sell an investment in an orderly fashion at an acceptable price. This may be an
ongoing risk for some investments, such as derivatives or restricted securities
that typically trade only among a limited number of investors.
PRICING RISK. If market conditions make it difficult to value some investments,
the fund may value these investments using more subjective methods, such as
fair value pricing.
PREPAYMENT AND EXTENSION RISK. When interest rates fall, issuers of high
interest debt obligations may pay off the debts earlier than expected
(prepayment risk), and the fund may have to reinvest the proceeds at lower
yields. When interest rates rise, issuers of lower interest debt obligations
may pay off the debts later than expected (extension risk), thus keeping the
fund's assets tied up in lower interest debt obligations. These events could
hurt fund performance.
PAST PERFORMANCE
How a fund's returns vary from year to year can give an idea of its risk; so
can comparing fund performance to overall market performance (as measured by an
appropriate market index). Past performance may not indicate future results.
All performance figures below assume that dividends were reinvested. For more
recent performance figures, go to www.dws-investments.com (the Web site does
not form a part of this prospectus) or call the phone number for your share
class included in this prospectus. This information doesn't reflect fees
associated with the separate account that invests in the fund or any variable
life insurance policy or variable annuity contract for which the fund is an
investment option. These fees will reduce returns.
The inception date for Class B was July 1, 2002. In the bar chart and table,
the performance figures for Class B before that date are based on the
historical performance of the
16
PROSPECTUS May 1, 2010 DWS Government & Agency Securities VIP
fund's original share class (Class A), adjusted to reflect the higher gross
total annual operating expenses of Class B. Class A is offered in a different
prospectus.
CALENDAR YEAR TOTAL RETURNS (%) (Class B)
[BAR GRAPHIC OMITTED HERE]
[BAR GRAPHIC DATA]
10.65 7.22 7.81 1.83 3.36 2.24 3.74 5.43 4.60 7.70
2000 2001 2002 2003 2004 2005 2006 2007 2008 2009
Best Quarter: 4.07%, Q3 2001 Worst Quarter: -1.06%, Q2 2004
Year-to-Date as of 3/31/10: 1.49%
AVERAGE ANNUAL TOTAL RETURNS
(For periods ended 12/31/2009 expressed as a %)
CLASS 1 5 10
INCEPTION YEAR YEARS YEARS
----------- --------- --------- ---------
CLASS B 7/1/02 7.70 4.73 5.42
---------------------- ------ ---- ---- ----
BARCLAYS CAPITAL GNMA
INDEX 5.37 5.59 6.30
---------------------- ------ ---- ---- ----
MANAGEMENT
INVESTMENT ADVISOR
Deutsche Investment Management Americas Inc.
PORTFOLIO MANAGER(S)
WILLIAM CHEPOLIS, CFA, MANAGING DIRECTOR. Co-Manager of the fund. Joined the
fund in 2002.
OHN CHOE, CFA, ASSOCIATE. Portfolio Manager of the fund. Joined the fund in
2010.
PURCHASE AND SALE OF FUND SHARES
THE FUND IS INTENDED FOR USE IN A VARIABLE INSURANCE PRODUCT. You should
contact the sponsoring insurance company for information on how to purchase and
sell shares of the fund.
TAX INFORMATION
Generally, owners of variable annuity and variable life contracts are not
subject to current federal income taxation on distributions of income or gains
with respect to such contracts. For further information concerning federal
income tax consequences for the holders of variable annuity contracts and
variable life insurance policies, such holders should consult the prospectus
used in connection with the issuance of their particular contracts or policies.
PAYMENTS TO FINANCIAL INTERMEDIARIES
If you purchase the fund through selected affiliated and unaffiliated brokers,
dealers, participating insurance companies or other financial intermediaries,
the fund and its affiliates may pay the financial intermediary for the sale of
fund shares and related services. These payments may create a conflict of
interest by influencing the financial intermediary and your salesperson to
recommend the fund over another investment. Ask your salesperson or visit your
insurance company's web site for more information.
17
PROSPECTUS May 1, 2010 DWS Government & Agency Securities VIP
[DWS INVESTMENTS LOGO]
Deutsche Bank Group
DWS HIGH INCOME VIP
INVESTMENT OBJECTIVE
The fund seeks to provide a high level of current income.
FEES AND EXPENSES OF THE FUND
This table describes the fees and expenses you may pay if you buy and hold
shares of the fund. This information does not reflect fees associated with the
separate account that invests in the fund or any variable life insurance policy
or variable annuity contract for which the fund is an investment option. These
fees will increase expenses.
SHAREHOLDER FEES
(paid directly from your investment) None
-------------------------------------- -----
ANNUAL FUND OPERATING EXPENSES (expenses that you pay each year as a % of the
value of your investment)
B
---------
Management fee 0.50
------------------------------------------------ ----
Distribution/service
(12b-1) fees 0.25
------------------------------------------------ ----
Other expenses (includes an administrative fee) 0.19
------------------------------------------------ ----
TOTAL ANNUAL FUND OPERATING EXPENSES 0.94
------------------------------------------------ ----
EXAMPLE
This Example is intended to help you compare the cost of investing in the fund
with the cost of investing in other mutual funds. The Example assumes that you
invest $10,000 in the fund for the time periods indicated and then redeem all
of your shares at the end of those periods. The Example also assumes that your
investment has a 5% return each year and that the fund's operating expenses
remain the same. Although your actual costs may be higher or lower, based on
these assumptions your costs would be:
1 YEAR 3 YEARS 5 YEARS 10 YEARS
-------- --------- --------- ---------
$96 $300 $520 $1,155
--- --- ---- ---- ------
PORTFOLIO TURNOVER
The fund pays transaction costs when it buys and sells securities (or "turns
over" its portfolio). A higher portfolio turnover may indicate higher
transaction costs. These costs are not reflected in annual fund operating
expenses or in the expense example, but are reflected in fund performance.
Portfolio turnover rate for fiscal year 2009: 66%.
PRINCIPAL INVESTMENT STRATEGY
MAIN INVESTMENTS. Under normal circumstances, the fund generally invests at
least 65% of net assets, plus the amount of any borrowings for investment
purposes, in junk bonds, which are those rated below the fourth highest credit
rating category (that is, grade BB/Ba and below). The fund may invest up to 50%
of total assets in bonds denominated in US dollars or foreign currencies from
foreign issuers. The fund invests in securities of varying maturities and
intends to maintain a dollar-weighted effective average portfolio maturity that
will not exceed ten years. Subject to its portfolio maturity policy, the fund
may purchase individual securities with any stated maturity.
MANAGEMENT PROCESS. Portfolio management focuses on cash flow and total return
analysis, and broad diversification among countries, sectors, industries and
individual issuers and maturities. Portfolio management uses an active process
that emphasizes relative value in a global environment, managing on a total
return basis, and using intensive research to identify stable to improving
credit situations that may provide yield compensation for the risk of investing
in junk bonds.
The investment process involves a bottom-up approach, where relative value and
fundamental analysis are used to select the best securities within each
industry, and a top-down approach to assess the overall risk and return in the
market and which considers macro trends in the economy. To select securities or
investments, portfolio management:
o analyzes economic conditions for improving or undervalued sectors and
industries;
18
PROSPECTUS May 1, 2010 DWS High Income VIP
o uses independent credit research and on-site management visits to evaluate
individual issuers' debt service, growth rate, and both downgrade and
upgrade potential;
o assesses new offerings versus secondary market opportunities; and
o seeks issuers within attractive industry sectors and with strong long-term
fundamentals and improving credits.
--------------------------------------------------------------------------------
DERIVATIVES. The fund may use various types of derivatives (contracts whose
value is based on, for example, indices, currencies or securities) for hedging,
risk management or non-hedging purposes to seek to enhance potential gains. The
fund may use derivatives as a substitute for direct investment in a particular
asset class or to keep cash on hand to meet shareholder redemptions or other
needs. In particular, portfolio management may use future contracts, currency
options, forward currency contracts and credit default swaps.
SECURITIES LENDING. The fund may lend securities (up to one-third of total
assets) to approved institutions.
--------------------------------------------------------------------------------
MAIN RISKS
There are several risk factors that could hurt the fund's performance, cause
you to lose money or cause the fund's performance to trail that of other
investments.
CREDIT RISK. A fund purchasing debt securities faces the risk that the
creditworthiness of an issuer may decline, causing the value of the debt
securities to decline. In addition, an issuer may not be able to make timely
payments on the interest and/or principal on the debt security it has issued.
Because the issuers of high-yield debt securities or junk bonds (debt
securities rated below the fourth highest category) may be in uncertain
financial health, the prices of their debt securities can be more vulnerable to
bad economic news or even the expectation of bad news, than investment-grade
debt securities.
INTEREST RATE RISK. When interest rates rise, prices of debt securities
generally decline. The longer the duration of the fund's debt securities, the
more sensitive it will be to interest rate changes. (As a general rule, a 1%
rise in interest rates means a 1% fall in value for every year of duration.)
FOREIGN INVESTMENT RISK. To the extent the fund invests in companies based
outside the US, it faces the risks inherent in foreign investing. Adverse
political, economic or social developments could undermine the value of the
fund's investments or prevent the fund from realizing their full value.
Financial reporting standards for companies based in foreign markets differ
from those in the US. Additionally, foreign securities markets generally are
smaller and less liquid than US markets. To the extent that the fund invests in
non-US dollar denominated foreign securities, changes in currency exchange
rates may affect the US dollar value of foreign securities or the income or
gain received on these securities. Foreign investment risks are greater in
emerging markets than in developed markets. Emerging market investments are
often considered speculative.
SECURITY SELECTION RISK. The securities in the fund's portfolio may decline in
value. Portfolio management could be wrong in its analysis of industries,
companies, economic trends, the relative attractiveness of different securities
or other matters.
DERIVATIVES RISK. Risks associated with derivatives include the risk that the
derivative is not well correlated with the security, index or currency to which
it relates; the risk that derivatives may result in losses or missed
opportunities; the risk that the fund will be unable to sell the derivative
because of an illiquid secondary market; the risk that a counterparty is
unwilling or unable to meet its obligation; and the risk that the derivative
transaction could expose the fund to the effects of leverage, which could
increase the fund's exposure to the market and magnify potential losses.
SECURITIES LENDING RISK. Any decline in the value of a portfolio security that
occurs while the security is out on loan is borne by the fund, and will
adversely affect performance. Also, there may be delays in recovery of
securities loaned or even a loss of rights in the collateral should the
borrower of the securities fail financially while holding the security.
COUNTERPARTY RISK. A financial institution or other counterparty with whom the
fund does business (such as trading or securities lending), or that
underwrites, distributes or guarantees any investments or contracts that the
fund owns or is otherwise exposed to, may decline in financial health and
become unable to honor its commitments, which could lead to losses for the
fund.
LIQUIDITY RISK. In certain situations, it may be difficult or impossible to
sell an investment in an orderly fashion at an acceptable price. This may be an
ongoing risk for some investments, such as derivatives or restricted securities
that typically trade only among a limited number of investors.
PRICING RISK. If market conditions make it difficult to value some investments,
the fund may value these investments using more subjective methods, such as
fair value pricing.
PREPAYMENT AND EXTENSION RISK. When interest rates fall, issuers of high
interest debt obligations may pay off the debts earlier than expected
(prepayment risk), and the fund may have to reinvest the proceeds at lower
yields. When interest rates rise, issuers of lower interest debt obligations
may pay off the debts later than expected (extension risk), thus keeping the
fund's assets tied up in lower interest debt obligations. These events could
hurt fund performance.
PAST PERFORMANCE
How a fund's returns vary from year to year can give an idea of its risk; so
can comparing fund performance to overall market performance (as measured by an
appropriate market index). Past performance may not indicate future
19
PROSPECTUS May 1, 2010 DWS High Income VIP
results. All performance figures below assume that dividends were reinvested.
For more recent performance figures, go to www.dws-investments.com (the Web
site does not form a part of this prospectus) or call the phone number for your
share class included in this prospectus. This information doesn't reflect fees
associated with the separate account that invests in the fund or any variable
life insurance policy or variable annuity contract for which the fund is an
investment option. These fees will reduce returns.
The inception date for Class B was July 1, 2002. In the bar chart and table,
the performance figures for Class B before that date are based on the
historical performance of the fund's original share class (Class A), adjusted
to reflect the higher gross total annual operating expenses of Class B. Class A
is offered in a different prospectus.
CALENDAR YEAR TOTAL RETURNS (%) (Class B)
[BAR GRAPHIC OMITTED HERE]
[BAR GRAPHIC DATA]
-8.91 2.37 -0.58 24.14 12.08 3.41 10.11 0.54 -23.13 39.64
2000 2001 2002 2003 2004 2005 2006 2007 2008 2009
Best Quarter: 14.75%, Q2 2009 Worst Quarter: -16.33%, Q4 2008
Year-to-Date as of 3/31/10: 4.10%
AVERAGE ANNUAL TOTAL RETURNS
(For periods ended 12/31/2009 expressed as a %)
CLASS 1 5 10
INCEPTION YEAR YEARS YEARS
----------- ---------- --------- ---------
CLASS B 7/1/02 39.64 3.94 4.58
------------------------- ------ ----- ---- ----
CREDIT SUISSE HIGH YIELD
INDEX 54.22 5.99 7.07
------------------------- ------ ----- ---- ----
MANAGEMENT
INVESTMENT ADVISOR
Deutsche Investment Management Americas Inc.
PORTFOLIO MANAGER(S)
GARY SULLIVAN, CFA, MANAGING DIRECTOR. Portfolio Manager of the fund. Joined
the fund in 2006.
PURCHASE AND SALE OF FUND SHARES
THE FUND IS INTENDED FOR USE IN A VARIABLE INSURANCE PRODUCT. You should
contact the sponsoring insurance company for information on how to purchase and
sell shares of the fund.
TAX INFORMATION
Generally, owners of variable annuity and variable life contracts are not
subject to current federal income taxation on distributions of income or gains
with respect to such contracts. For further information concerning federal
income tax consequences for the holders of variable annuity contracts and
variable life insurance policies, such holders should consult the prospectus
used in connection with the issuance of their particular contracts or policies.
PAYMENTS TO FINANCIAL INTERMEDIARIES
If you purchase the fund through selected affiliated and unaffiliated brokers,
dealers, participating insurance companies or other financial intermediaries,
the fund and its affiliates may pay the financial intermediary for the sale of
fund shares and related services. These payments may create a conflict of
interest by influencing the financial intermediary and your salesperson to
recommend the fund over another investment. Ask your salesperson or visit your
insurance company's web site for more information.
20
PROSPECTUS May 1, 2010 DWS High Income VIP
[DWS INVESTMENTS LOGO]
Deutsche Bank Group
DWS LARGE CAP VALUE VIP
INVESTMENT OBJECTIVE
The fund seeks to achieve a high rate of total return.
FEES AND EXPENSES OF THE FUND
This table describes the fees and expenses you may pay if you buy and hold
shares of the fund. This information does not reflect fees associated with the
separate account that invests in the fund or any variable life insurance policy
or variable annuity contract for which the fund is an investment option. These
fees will increase expenses.
SHAREHOLDER FEES
(paid directly from your investment) None
-------------------------------------- -----
ANNUAL FUND OPERATING EXPENSES (expenses that you pay each year as a % of the
value of your investment)
B
---------
Management fee 0.65
------------------------------------------------ ----
Distribution/service
(12b-1) fees 0.25
------------------------------------------------ ----
Other expenses (includes an administrative fee) 0.16
------------------------------------------------ ----
TOTAL ANNUAL FUND OPERATING EXPENSES 1.06
------------------------------------------------ ----
EXAMPLE
This Example is intended to help you compare the cost of investing in the fund
with the cost of investing in other mutual funds. The Example assumes that you
invest $10,000 in the fund for the time periods indicated and then redeem all
of your shares at the end of those periods. The Example also assumes that your
investment has a 5% return each year and that the fund's operating expenses
remain the same. Although your actual costs may be higher or lower, based on
these assumptions your costs would be:
1 YEAR 3 YEARS 5 YEARS 10 YEARS
-------- --------- --------- ---------
$108 $337 $585 $1,294
--- ---- ---- ---- ------
PORTFOLIO TURNOVER
The fund pays transaction costs when it buys and sells securities (or "turns
over" its portfolio). A higher portfolio turnover may indicate higher
transaction costs. These costs are not reflected in annual fund operating
expenses or in the expense example, but are reflected in fund performance.
Portfolio turnover rate for fiscal year 2009: 76%.
PRINCIPAL INVESTMENT STRATEGY
Under normal circumstances, the fund invests at least 80% of net assets, plus
the amount of any borrowings for investment purposes, in common stocks and
other equity securities of large US companies that are similar in size to the
companies in the Russell 1000 (Reg. TM) Value Index and that portfolio
management believes are undervalued. These are typically companies that have
been sound historically, but are temporarily out of favor. The fund intends to
invest primarily in companies whose market capitalizations fall within the
normal range of the Russell 1000 (Reg. TM) Value Index. Although the fund can
invest in stocks of any economic sector (which is comprised of two or more
industries), at times it may emphasize certain sectors, even investing more
than 25% of total assets in any one sector.
The fund may invest up to 20% of total assets in foreign securities.
MANAGEMENT PROCESS. Portfolio management begins by screening for stocks whose
price-to-earnings ratios are below the average for the S&P 500 Index. Portfolio
management then compares a company's stock price to its book value, cash flow
and yield, and analyzes individual companies to identify those that are
financially sound and appear to have strong potential for long-term growth.
Portfolio management assembles the fund's portfolio from among the most
attractive stocks, drawing on an analysis of economic outlooks for various
sectors and industries.
Portfolio management will normally sell a stock when it believes the stock's
price is unlikely to go higher, its fundamental factors have changed, other
investments offer
21
PROSPECTUS May 1, 2010 DWS Large Cap Value VIP
better opportunities or in the course of adjusting its emphasis on a given
industry.
--------------------------------------------------------------------------------
DERIVATIVES. The fund may use various types of derivatives (contracts whose
value is based on, for example, indices, currencies or securities) for hedging,
risk management or non-hedging purposes to seek to enhance potential gains. The
fund may use derivatives as a substitute for direct investment in a particular
asset class or to keep cash on hand to meet shareholder redemptions or other
needs. In particular, the fund may use futures, currency options and forward
currency transactions.
SECURITIES LENDING. The fund may lend securities (up to one-third of total
assets) to approved institutions.
--------------------------------------------------------------------------------
MAIN RISKS
There are several risk factors that could hurt the fund's performance, cause
you to lose money or cause the fund's performance to trail that of other
investments.
STOCK MARKET RISK. When stock prices fall, you should expect the value of your
investment to fall as well. To the extent the fund invests in a particular
capitalization or market sector, the fund's performance may be proportionately
affected by that segment's general performance.
SECURITY SELECTION RISK. The securities in the fund's portfolio may decline in
value. Portfolio management could be wrong in its analysis of industries,
companies, economic trends, the relative attractiveness of different securities
or other matters.
VALUE INVESTING RISK. As a category, value stocks may underperform growth
stocks (and the stock market as a whole) over any period of time. In addition,
value stocks selected for investment by portfolio management may not perform as
anticipated: stocks that appear undervalued may remain undervalued
indefinitely, or may in fact be fairly valued.
FOCUS RISK. To the extent that the fund focuses its investments in particular
industries, asset classes or sectors of the economy, any market price
movements, regulatory or technological changes, or economic conditions
affecting companies in those industries, asset classes or sectors will have a
significant impact on the fund's performance. For example, consumer goods
companies could be hurt by a rise in unemployment or technology companies could
be hurt by such factors as market saturation, price competition and rapid
obsolescence.
DERIVATIVES RISK. Risks associated with derivatives include the risk that the
derivative is not well correlated with the security, index or currency to which
it relates; the risk that derivatives may result in losses or missed
opportunities; the risk that the fund will be unable to sell the derivative
because of an illiquid secondary market; the risk that a counterparty is
unwilling or unable to meet its obligation; and the risk that the derivative
transaction could expose the fund to the effects of leverage, which could
increase the fund's exposure to the market and magnify potential losses.
SECURITIES LENDING RISK. Any decline in the value of a portfolio security that
occurs while the security is out on loan is borne by the fund, and will
adversely affect performance. Also, there may be delays in recovery of
securities loaned or even a loss of rights in the collateral should the
borrower of the securities fail financially while holding the security.
FOREIGN INVESTMENT RISK. To the extent the fund invests in companies based
outside the US, it faces the risks inherent in foreign investing. Adverse
political, economic or social developments could undermine the value of the
fund's investments or prevent the fund from realizing their full value.
Financial reporting standards for companies based in foreign markets differ
from those in the US. Additionally, foreign securities markets generally are
smaller and less liquid than US markets. To the extent that the fund invests in
non-US dollar denominated foreign securities, changes in currency exchange
rates may affect the US dollar value of foreign securities or the income or
gain received on these securities. Foreign investment risks are greater in
emerging markets than in developed markets. Emerging market investments are
often considered speculative.
COUNTERPARTY RISK. A financial institution or other counterparty with whom the
fund does business (such as trading or securities lending), or that
underwrites, distributes or guarantees any investments or contracts that the
fund owns or is otherwise exposed to, may decline in financial health and
become unable to honor its commitments, which could lead to losses for the
fund.
LIQUIDITY RISK. In certain situations, it may be difficult or impossible to
sell an investment in an orderly fashion at an acceptable price. This may be an
ongoing risk for some investments, such as derivatives or restricted securities
that typically trade only among a limited number of investors.
PRICING RISK. If market conditions make it difficult to value some investments,
the fund may value these investments using more subjective methods, such as
fair value pricing.
PAST PERFORMANCE
How a fund's returns vary from year to year can give an idea of its risk; so
can comparing fund performance to overall market performance (as measured by an
appropriate market index). Past performance may not indicate future results.
All performance figures below assume that dividends were reinvested. For more
recent performance figures, go to www.dws-investments.com (the Web site does
not form a part of this prospectus) or call the phone number for your share
class included in this prospectus. This information doesn't reflect fees
associated with the separate account that invests in the fund or any variable
life insurance policy or variable annuity contract for which the fund is an
investment option. These fees will reduce returns.
22
PROSPECTUS May 1, 2010 DWS Large Cap Value VIP
The inception date for Class B was July 1, 2002. In the bar chart and table,
the performance figures for Class B before that date are based on the
historical performance of the fund's original share class (Class A), adjusted
to reflect the higher gross total annual operating expenses of Class B. Class A
is offered in a different prospectus.
CALENDAR YEAR TOTAL RETURNS (%) (Class B)
[BAR GRAPHIC OMITTED HERE]
[BAR GRAPHIC DATA]
15.84 1.61 -15.18 32.19 9.65 1.58 14.96 12.77 -36.64 24.86
2000 2001 2002 2003 2004 2005 2006 2007 2008 2009
Best Quarter: 18.75%, Q2 2003 Worst Quarter: -22.50%, Q4 2008
Year-to-Date as of 3/31/10: 3.87%
AVERAGE ANNUAL TOTAL RETURNS
(For periods ended 12/31/2009 expressed as a %)
CLASS 1 5 10
INCEPTION YEAR YEARS YEARS
----------- ---------- --------- ---------
CLASS B 7/1/02 24.86 0.82 4.19
------------------- ------ ----- ----- ----
RUSSELL 1000 VALUE
INDEX 19.69 -0.25 2.47
------------------- ------ ----- ------ ----
MANAGEMENT
INVESTMENT ADVISOR
Deutsche Investment Management Americas Inc.
SUBADVISOR
Deutsche Asset Management International GmbH
PORTFOLIO MANAGER(S)
THOMAS SCHUESSLER, PHD., MANAGING DIRECTOR. Lead Portfolio Manager of the fund.
Joined the fund in 2007.
VOLKER DOSCH, MANAGING DIRECTOR. Portfolio Manager of the fund. Joined the fund
in 2009.
OLIVER PFEIL, PHD., VICE PRESIDENT. Portfolio Manager of the fund. Joined the
fund in 2009.
PURCHASE AND SALE OF FUND SHARES
THE FUND IS INTENDED FOR USE IN A VARIABLE INSURANCE PRODUCT. You should
contact the sponsoring insurance company for information on how to purchase and
sell shares of the fund.
TAX INFORMATION
Generally, owners of variable annuity and variable life contracts are not
subject to current federal income taxation on distributions of income or gains
with respect to such contracts. For further information concerning federal
income tax consequences for the holders of variable annuity contracts and
variable life insurance policies, such holders should consult the prospectus
used in connection with the issuance of their particular contracts or policies.
PAYMENTS TO FINANCIAL INTERMEDIARIES
If you purchase the fund through selected affiliated and unaffiliated brokers,
dealers, participating insurance companies or other financial intermediaries,
the fund and its affiliates may pay the financial intermediary for the sale of
fund shares and related services. These payments may create a conflict of
interest by influencing the financial intermediary and your salesperson to
recommend the fund over another investment. Ask your salesperson or visit your
insurance company's web site for more information.
23
PROSPECTUS May 1, 2010 DWS Large Cap Value VIP
[DWS INVESTMENTS LOGO]
Deutsche Bank Group
DWS STRATEGIC VALUE VIP
INVESTMENT OBJECTIVE
The fund seeks to achieve a high rate of total return.
FEES AND EXPENSES OF THE FUND
This table describes the fees and expenses you may pay if you buy and hold
shares of the fund. This information does not reflect fees associated with the
separate account that invests in the fund or any variable life insurance policy
or variable annuity contract for which the fund is an investment option. These
fees will increase expenses.
SHAREHOLDER FEES
(paid directly from your investment) None
-------------------------------------- -----
ANNUAL FUND OPERATING EXPENSES (expenses that you pay each year as a % of the
value of your investment)
B
---------
Management fee 0.67
------------------------------------------------ ----
Distribution/service
(12b-1) fees 0.25
------------------------------------------------ ----
Other expenses (includes an administrative fee) 0.19
------------------------------------------------ ----
TOTAL ANNUAL FUND OPERATING EXPENSES 1.11
------------------------------------------------ ----
EXAMPLE
This Example is intended to help you compare the cost of investing in the fund
with the cost of investing in other mutual funds. The Example assumes that you
invest $10,000 in the fund for the time periods indicated and then redeem all
of your shares at the end of those periods. The Example also assumes that your
investment has a 5% return each year and that the fund's operating expenses
remain the same. Although your actual costs may be higher or lower, based on
these assumptions your costs would be:
1 YEAR 3 YEARS 5 YEARS 10 YEARS
-------- --------- --------- ---------
$113 $353 $612 $1,352
--- ---- ---- ---- ------
PORTFOLIO TURNOVER
The fund pays transaction costs when it buys and sells securities (or "turns
over" its portfolio). A higher portfolio turnover may indicate higher
transaction costs. These costs are not reflected in annual fund operating
expenses or in the expense example, but are reflected in fund performance.
Portfolio turnover rate for fiscal year 2009: 91%.
PRINCIPAL INVESTMENT STRATEGY
Under normal circumstances, the fund invests at least 80% of net assets, plus
the amount of any borrowings for investment purposes, in equity securities
(mainly common stocks). The fund focuses on stocks of large US companies that
are similar in size to the companies in the S&P 500 Index and that portfolio
management believes are undervalued. The fund intends to invest primarily in
companies whose market capitalizations fall within the normal range of the S&P
500 Index. Although the fund can invest in stocks of any economic sector (which
is comprised of two or more industries), at times it may emphasize one or more
sectors and may invest more than 25% of total assets in a single sector.
The fund may invest up to 20% of net assets in foreign securities, including US
dollar-denominated American Depository Receipts.
Portfolio management seeks to invest in a diversified portfolio normally
consisting of approximately 60-80 stocks.
MANAGEMENT PROCESS. Portfolio management begins by comparing a company's stock
price to its book value, cash flow, earnings and sales and analyzing individual
companies to identify those that are financially sound and appear to have
strong potential for long-term growth and income.
Portfolio management assembles the fund's portfolio from among the most
attractive stocks, drawing on an analysis of economic outlooks for various
sectors and industries.
24
PROSPECTUS May 1, 2010 DWS Strategic Value VIP
Portfolio management employs a disciplined sell strategy and will normally sell
a stock when it reaches a target price, its fundamental factors have changed or
when other investments offer better opportunities.
--------------------------------------------------------------------------------
DERIVATIVES. The fund may use various types of derivatives (contracts whose
value is based on, for example, indices, currencies or securities) for hedging,
risk management or non-hedging purposes to seek to enhance potential gains. The
fund may use derivatives as a substitute for direct investment in a particular
asset class or to keep cash on hand to meet shareholder redemptions or other
needs. In particular, the fund may use futures, currency options and forward
currency transactions.
SECURITIES LENDING. The fund may lend securities (up to one-third of total
assets) to approved institutions.
--------------------------------------------------------------------------------
MAIN RISKS
There are several risk factors that could hurt the fund's performance, cause
you to lose money or cause the fund's performance to trail that of other
investments.
STOCK MARKET RISK. When stock prices fall, you should expect the value of your
investment to fall as well. To the extent the fund invests in a particular
capitalization or market sector, the fund's performance may be proportionately
affected by that segment's general performance.
SECURITY SELECTION RISK. The securities in the fund's portfolio may decline in
value. Portfolio management could be wrong in its analysis of industries,
companies, economic trends, the relative attractiveness of different securities
or other matters.
VALUE INVESTING RISK. As a category, value stocks may underperform growth
stocks (and the stock market as a whole) over any period of time. In addition,
value stocks selected for investment by portfolio management may not perform as
anticipated: stocks that appear undervalued may remain undervalued
indefinitely, or may in fact be fairly valued.
FOCUS RISK. To the extent that the fund focuses its investments in particular
industries, asset classes or sectors of the economy, any market price
movements, regulatory or technological changes, or economic conditions
affecting companies in those industries, asset classes or sectors will have a
significant impact on the fund's performance.
DERIVATIVES RISK. Risks associated with derivatives include the risk that the
derivative is not well correlated with the security, index or currency to which
it relates; the risk that derivatives may result in losses or missed
opportunities; the risk that the fund will be unable to sell the derivative
because of an illiquid secondary market; the risk that a counterparty is
unwilling or unable to meet its obligation; and the risk that the derivative
transaction could expose the fund to the effects of leverage, which could
increase the fund's exposure to the market and magnify potential losses.
SECURITIES LENDING RISK. Any decline in the value of a portfolio security that
occurs while the security is out on loan is borne by the fund, and will
adversely affect performance. Also, there may be delays in recovery of
securities loaned or even a loss of rights in the collateral should the
borrower of the securities fail financially while holding the security.
FOREIGN INVESTMENT RISK. To the extent the fund invests in companies based
outside the US, it faces the risks inherent in foreign investing. Adverse
political, economic or social developments could undermine the value of the
fund's investments or prevent the fund from realizing their full value.
Financial reporting standards for companies based in foreign markets differ
from those in the US. Additionally, foreign securities markets generally are
smaller and less liquid than US markets. To the extent that the fund invests in
non-US dollar denominated foreign securities, changes in currency exchange
rates may affect the US dollar value of foreign securities or the income or
gain received on these securities. Foreign investment risks are greater in
emerging markets than in developed markets. Emerging market investments are
often considered speculative.
COUNTERPARTY RISK. A financial institution or other counterparty with whom the
fund does business (such as trading or securities lending), or that
underwrites, distributes or guarantees any investments or contracts that the
fund owns or is otherwise exposed to, may decline in financial health and
become unable to honor its commitments, which could lead to losses for the
fund.
LIQUIDITY RISK. In certain situations, it may be difficult or impossible to
sell an investment in an orderly fashion at an acceptable price. This may be an
ongoing risk for some investments, such as derivatives or restricted securities
that typically trade only among a limited number of investors.
PRICING RISK. If market conditions make it difficult to value some investments,
the fund may value these investments using more subjective methods, such as
fair value pricing.
PAST PERFORMANCE
How a fund's returns vary from year to year can give an idea of its risk; so
can comparing fund performance to overall market performance (as measured by an
appropriate market index). Past performance may not indicate future results.
All performance figures below assume that dividends were reinvested. For more
recent performance figures, go to www.dws-investments.com (the Web site does
not form a part of this prospectus) or call the phone number for your share
class included in this prospectus. This information doesn't reflect fees
associated with the separate account that invests in the fund or any variable
life insurance policy or variable annuity contract for which the fund is an
investment option. These fees will reduce returns.
25
PROSPECTUS May 1, 2010 DWS Strategic Value VIP
The inception date for Class B was July 1, 2002. In the bar chart and table,
the performance figures for Class B before that date are based on the
historical performance of the fund's original share class (Class A), adjusted
to reflect the higher gross total annual operating expenses of Class B. Class A
is offered in a different prospectus.
Prior to June 1, 2009, Dreman Value Management, L.L.C. served as the fund's
subadvisor and was primarily responsible for the day-to-day management of the
fund. Performance would have been different if the fund's current investment
strategy had been in effect.
CALENDAR YEAR TOTAL RETURNS (%) (Class B)
[BAR GRAPHIC OMITTED HERE]
[BAR GRAPHIC DATA]
30.19 1.44 -18.25 31.60 13.53 7.51 18.21 -2.19 -46.16 24.94
2000 2001 2002 2003 2004 2005 2006 2007 2008 2009
Best Quarter: 20.65%, Q2 2003 Worst Quarter: -23.11%, Q4 2008
Year-to-Date as of 3/31/10: 5.83%
AVERAGE ANNUAL TOTAL RETURNS
(For periods ended 12/31/2009 expressed as a %)
CLASS 1 5 10
INCEPTION YEAR YEARS YEARS
----------- ---------- ---------- ---------
CLASS B 7/1/02 24.94 -3.51 3.04
------------------ ------ ----- ------ -----
STANDARD & POOR'S
(S&P) 500 INDEX 26.46 0.42 -0.95
------------------ ------ ----- ------ ------
MANAGEMENT
INVESTMENT ADVISOR
Deutsche Investment Management Americas Inc.
PORTFOLIO MANAGER(S)
VOLKER DOSCH, MANAGING DIRECTOR. Portfolio Manager of the fund. Joined the fund
in 2009.
OLIVER PFEIL, PHD., VICE PRESIDENT. Portfolio Manager of the fund. Joined the
fund in 2009.
THOMAS SCHUESSLER, PHD., MANAGING DIRECTOR. Portfolio Manager of the fund.
Joined the fund in 2009.
PURCHASE AND SALE OF FUND SHARES
THE FUND IS INTENDED FOR USE IN A VARIABLE INSURANCE PRODUCT. You should
contact the sponsoring insurance company for information on how to purchase and
sell shares of the fund.
TAX INFORMATION
Generally, owners of variable annuity and variable life contracts are not
subject to current federal income taxation on distributions of income or gains
with respect to such contracts. For further information concerning federal
income tax consequences for the holders of variable annuity contracts and
variable life insurance policies, such holders should consult the prospectus
used in connection with the issuance of their particular contracts or policies.
PAYMENTS TO FINANCIAL INTERMEDIARIES
If you purchase the fund through selected affiliated and unaffiliated brokers,
dealers, participating insurance companies or other financial intermediaries,
the fund and its affiliates may pay the financial intermediary for the sale of
fund shares and related services. These payments may create a conflict of
interest by influencing the financial intermediary and your salesperson to
recommend the fund over another investment. Ask your salesperson or visit your
insurance company's web site for more information.
26
PROSPECTUS May 1, 2010 DWS Strategic Value VIP
[DWS INVESTMENTS LOGO]
Deutsche Bank Group
DWS TECHNOLOGY VIP
INVESTMENT OBJECTIVE
The fund seeks growth of capital.
FEES AND EXPENSES OF THE FUND
This table describes the fees and expenses you may pay if you buy and hold
shares of the fund. This information does not reflect fees associated with the
separate account that invests in the fund or any variable life insurance policy
or variable annuity contract for which the fund is an investment option. These
fees will increase expenses.
SHAREHOLDER FEES
(paid directly from your investment) None
-------------------------------------- -----
ANNUAL FUND OPERATING EXPENSES (expenses that you pay each year as a % of the
value of your investment)
B
---------
Management fee 0.67
------------------------------------------------ ----
Distribution/service
(12b-1) fees 0.25
------------------------------------------------ ----
Other expenses (includes an administrative fee) 0.26
------------------------------------------------ ----
TOTAL ANNUAL FUND OPERATING EXPENSES 1.18
------------------------------------------------ ----
EXAMPLE
This Example is intended to help you compare the cost of investing in the fund
with the cost of investing in other mutual funds. The Example assumes that you
invest $10,000 in the fund for the time periods indicated and then redeem all
of your shares at the end of those periods. The Example also assumes that your
investment has a 5% return each year and that the fund's operating expenses
remain the same. Although your actual costs may be higher or lower, based on
these assumptions your costs would be:
1 YEAR 3 YEARS 5 YEARS 10 YEARS
-------- --------- --------- ---------
$120 $375 $649 $1,432
--- ---- ---- ---- ------
PORTFOLIO TURNOVER
The fund pays transaction costs when it buys and sells securities (or "turns
over" its portfolio). A higher portfolio turnover may indicate higher
transaction costs. These costs are not reflected in annual fund operating
expenses or in the expense example, but are reflected in fund performance.
Portfolio turnover rate for fiscal year 2009: 45%.
PRINCIPAL INVESTMENT STRATEGY
MAIN INVESTMENTS. Under normal circumstances, the fund invests at least 80% of
net assets, plus the amount of any borrowings for investment purposes, in
common stocks of companies in the technology sector. For purposes of the fund's
80% investment policy, the fund defines a company as being in the technology
sector if it commits at least half its assets to, or derives at least half its
revenues or net income from, that sector. Examples of industries within the
technology sector are semiconductors, software, telecom equipment,
computer/hardware, IT services, the Internet and health technology. The fund
may invest in companies of any size and may invest in initial public offerings.
While the fund invests mainly in US stocks, it could invest up to 35% of net
assets in foreign securities (including emerging markets securities).
MANAGEMENT PROCESS. In choosing securities, portfolio management uses a
combination of three analytical disciplines:
BOTTOM-UP RESEARCH. Portfolio management looks for individual companies with a
history of above-average growth, strong competitive positioning, attractive
prices relative to potential growth, innovative products and services, sound
financial strength and effective management, among other factors.
GROWTH ORIENTATION. Portfolio management generally looks for companies that
they believe have above-average potential for sustainable growth of revenue or
earnings and whose market value appears reasonable in light of their business
prospects.
27
PROSPECTUS May 1, 2010 DWS Technology VIP
TOP-DOWN ANALYSIS. Portfolio management considers the economic outlooks for
various industries within the technology sector and looks for those that may
benefit from changes in the overall business environment.
In addition, portfolio management uses quantitative analytic tools to attempt
to manage the price volatility of the fund as compared to appropriate
benchmarks and peer groups. Portfolio management may favor securities from
various industries and companies within the technology sector at different
times.
Portfolio management will normally sell a stock when they believe its price is
unlikely to go higher, its fundamentals have changed, other investments offer
better opportunities, or in adjusting their emphasis on a given technology
industry.
--------------------------------------------------------------------------------
DERIVATIVES. The fund may use various types of derivatives for hedging, risk
management or non-hedging purposes to seek to enhance potential gains. The fund
may use derivatives as a substitute for direct investment in a particular asset
class or to keep cash on hand to meet shareholder redemptions or other needs.
In particular, portfolio management may use futures and options, including
sales of covered put and call options.
SECURITIES LENDING. The fund may lend securities (up to one-third of total
assets) to approved institutions.
--------------------------------------------------------------------------------
MAIN RISKS
There are several risk factors that could reduce the yield you get from the
fund, cause the fund's performance to trail that of other investments, or cause
you to lose money.
STOCK MARKET RISK. To the extent the fund invests in a particular sector, the
fund's performance may be proportionately affected by that sector's general
performance. When stock prices fall, you should expect the value of your
investment to fall as well. The market as a whole may not favor the types of
investments the fund makes, which could affect the fund's ability to sell them
at an attractive price.
CONCENTRATION RISK. Any fund that concentrates in a particular segment of the
market will generally be more volatile than a fund that invests more broadly.
Any market price movements, regulatory or technological changes, or economic
conditions affecting technology companies will have a significant impact on the
fund's performance.
SMALL COMPANY RISK. Small company stocks tend to be more volatile and less
liquid than large company stocks. Small companies are less widely followed by
stock analysts and less information about them is available to investors.
FOREIGN INVESTMENT RISK. To the extent the fund invests in companies based
outside the US, it faces the risks inherent in foreign investing. Adverse
political, economic or social developments could undermine the value of the
fund's investments or prevent the fund from realizing their full value.
Financial reporting standards for companies based in foreign markets differ
from those in the US. Additionally, foreign securities markets generally are
smaller and less liquid than US markets. To the extent that the fund invests in
non-US dollar denominated foreign securities, changes in currency exchange
rates may affect the US dollar value of foreign securities or the income or
gain received on these securities. Foreign investment risks are greater in
emerging markets than in developed markets. Emerging market investments are
often considered speculative.
PRICING RISK. If market conditions make it difficult to value some investments,
the fund may value these investments using more subjective methods, such as
fair value pricing.
28
PROSPECTUS May 1, 2010 DWS Technology VIP
NON-DIVERSIFICATION RISK. The fund is classified as non-diversified under the
Investment Company Act of 1940, as amended. This means that the fund may invest
in securities of relatively few issuers. Thus, the performance of one or a
small number of portfolio holdings can affect overall performance.
SECURITY SELECTION RISK. The securities in the fund's portfolio may decline in
value. Portfolio management could be wrong in its analysis of industries,
companies, economic trends, the relative attractiveness of different securities
or other matters.
DERIVATIVES RISK. Risks associated with derivatives include the risk that the
derivative is not well correlated with the security, index or currency to which
it relates; the risk that derivatives may result in losses or missed
opportunities; the risk that the fund will be unable to sell the derivative
because of an illiquid secondary market; the risk that a counterparty is
unwilling or unable to meet its obligation; and the risk that the derivative
transaction could expose the fund to the effects of leverage, which could
increase the fund's exposure to the market and magnify potential losses.
SECURITIES LENDING RISK. Any decline in the value of a portfolio security that
occurs while the security is out on loan is borne by the fund, and will
adversely affect performance. Also, there may be delays in recovery of
securities loaned or even a loss of rights in the collateral should the
borrower of the securities fail financially while holding the security.
COUNTERPARTY RISK. A financial institution or other counterparty with whom the
fund does business (such as trading or securities lending), or that
underwrites, distributes or guarantees any investments or contracts that the
fund owns or is otherwise exposed to, may decline in financial health and
become unable to honor its commitments, which could lead to losses for the
fund.
GROWTH INVESTING RISK. As a category, growth stocks may underperform value
stocks (and the stock market as a whole) over any period of time. Because the
prices of growth stocks are based largely on the expectation of future
earnings, growth stock prices can decline rapidly and significantly in reaction
to negative news about such factors as earnings, the economy, political
developments, or other news.
IPO RISK. Prices of securities bought in an initial public offering (IPO) may
rise and fall rapidly, often because of investor perceptions rather than
economic reasons.
LIQUIDITY RISK. In certain situations, it may be difficult or impossible to
sell an investment in an orderly fashion at an acceptable price. This may be an
ongoing risk for some investments, such as derivatives or restricted securities
that typically trade only among a limited number of investors.
PAST PERFORMANCE
How a fund's returns vary from year to year can give an idea of its risk; so
can comparing fund performance to overall market performance (as measured by an
appropriate market index). Past performance may not indicate future results.
All performance figures below assume that dividends were reinvested. For more
recent performance figures, go to www.dws-investments.com (the Web site does
not form a part of this prospectus) or call the phone number for your share
class included in this prospectus. This information doesn't reflect fees
associated with the separate account that invests in the fund or any variable
life insurance policy or variable annuity contract for which the fund is an
investment option. These fees will reduce returns.
The inception date for Class B was July 1, 2002. In the bar chart and table,
the performance figures for Class B before that date are based on the
historical performance of the fund's original share class (Class A), adjusted
to reflect the higher gross total annual operating expenses of Class B. Class A
is offered in a different prospectus.
CALENDAR YEAR TOTAL RETURNS (%) (Class B)
[BAR GRAPHIC OMITTED HERE]
[BAR GRAPHIC DATA]
-21.77 -32.56 -35.72 46.42 1.48 3.27 0.43 13.84 -46.44 59.93
2000 2001 2002 2003 2004 2005 2006 2007 2008 2009
Best Quarter: 28.49%, Q4 2001 Worst Quarter: -33.68%, Q3 2001
Year-to-Date as of 3/31/10: 2.33%
AVERAGE ANNUAL TOTAL RETURNS
(For periods ended 12/31/2009 expressed as a %)
CLASS 1 5 10
INCEPTION YEAR YEARS YEARS
----------- ---------- --------- ----------
CLASS B 7/1/02 59.93 0.23 -6.53
------------------------------ ------ ----- ---- ------
RUSSELL 1000 (Reg. TM) GROWTH
INDEX 37.21 1.63 -3.99
------------------------------ ------ ----- ---- ------
S&P NORTH AMERICAN
TECHNOLOGY SECTOR
INDEX 63.19 3.75 -6.59
------------------------------ ------ ----- ---- ------
The Advisor believes the additional S&P North American Technology Sector Index
represents the fund's overall investment process.
MANAGEMENT
INVESTMENT ADVISOR
Deutsche Investment Management Americas Inc.
PORTFOLIO MANAGER(S)
FREDERIC L. FAYOLLE, CFA, DIRECTOR. Lead Portfolio Manager of the fund. Joined
the fund in 2009.
29
PROSPECTUS May 1, 2010 DWS Technology VIP
CLARK CHANG, DIRECTOR. Portfolio Manager of the fund. Joined the fund in 2008.
WALTER HOLICK, DIRECTOR. Portfolio Manager of the fund. Joined the fund in
2009.
PURCHASE AND SALE OF FUND SHARES
THE FUND IS INTENDED FOR USE IN A VARIABLE INSURANCE PRODUCT. You should
contact the sponsoring insurance company for information on how to purchase and
sell shares of the fund.
TAX INFORMATION
Generally, owners of variable annuity and variable life contracts are not
subject to current federal income taxation on distributions of income or gains
with respect to such contracts. For further information concerning federal
income tax consequences for the holders of variable annuity contracts and
variable life insurance policies, such holders should consult the prospectus
used in connection with the issuance of their particular contracts or policies.
PAYMENTS TO FINANCIAL INTERMEDIARIES
If you purchase the fund through selected affiliated and unaffiliated brokers,
dealers, participating insurance companies or other financial intermediaries,
the fund and its affiliates may pay the financial intermediary for the sale of
fund shares and related services. These payments may create a conflict of
interest by influencing the financial intermediary and your salesperson to
recommend the fund over another investment. Ask your salesperson or visit your
insurance company's web site for more information.
30
PROSPECTUS May 1, 2010 DWS Technology VIP
FUND DETAILS
ADDITIONAL INFORMATION ABOUT FUND STRATEGIES AND RISKS
--------------------------------------------------------------------------------
DWS Alternative Asset Allocation Plus VIP
PRINCIPAL INVESTMENT STRATEGY
MAIN INVESTMENTS. The fund seeks to achieve its objective by investing in
alternative (or non-traditional) asset categories and investment strategies.
Investments may be made in other DWS funds or directly in the securities and
derivative instruments in which such DWS funds could invest. The fund may also
invest in Exchange Traded Funds (ETFs) to gain a desired economic exposure to a
particular asset category that is not available through a DWS fund. The fund's
allocations among direct investments and other DWS funds may vary over time. At
times, the entire fund may be invested in other DWS funds or directly in other
investments. The fund may also be invested in some combination thereof. To the
extent the fund directly invests in other investments rather than DWS funds,
the allocated portions of the fund will be managed by the same advisor,
subadvisor or sub-subadvisor, as applicable, as the corresponding DWS fund,
following the same general investment strategies.
MANAGEMENT PROCESS. The fund allocates its assets among the following
strategies and/or asset categories: market neutral, inflation-protection,
commodities, real estate, floating rate loans, infrastructure and emerging
markets.
The fund may make allocations ranging from 0% to 30% of its assets in a
particular strategy or asset category, including the following DWS funds or
directly in such securities and derivative instruments in which the DWS fund
can invest:
o DWS Enhanced Commodity Strategy Fund. The fund's investment objective is
total return. The fund seeks to achieve its investment objective by
investing under normal circumstances in commodity-linked derivative
instruments backed by a portfolio of fixed income instruments.
o DWS Disciplined Market Neutral Fund. The fund seeks capital appreciation
independent of stock market direction. It pursues its objective by
investing, under normal circumstances, in long and short positions of
common stock of large US companies. The managers buy, or take, long
positions in common stock that the managers believe are undervalued and
sell, or take, short positions in common stock that the managers believe
are overvalued. The fund's investment strategy is designed to maintain
approximately equal dollar amounts invested in long and short positions
under normal circumstances. By employing this market neutral strategy, the
fund seeks to limit the fund's volatility relative to movements in the
overall stock market (that is, the fund's price movements are not expected
to correlate closely with the market's price movements). The managers
attempt to achieve returns for the fund that exceed the return on an
investment in 3-month US Treasury Bills.
o DWS Emerging Markets Equity Fund. The fund seeks long-term growth of
capital. Under normal circumstances, the fund invests at least 80% of net
assets, plus the amount of any borrowings for investment purposes, in
emerging market equities (equities traded mainly in emerging markets or
issued by companies that are organized in emerging markets or have more
than half of their business there). The fund invests primarily in common
stocks. The fund considers "emerging markets" to include any country that
is defined as an emerging or developing economy by any one of the
following: The International Bank for Reconstruction and Development (i.e.,
the World Bank), the International Finance Corporation or the United
Nations or its authorities.
o DWS Emerging Markets Fixed Income Fund. The fund seeks to provide high
current income and, secondarily, long-term capital appreciation. Under
normal circumstances, the fund invests at least 80% of net assets, plus the
amount of any borrowings for investment purposes, in high yield bonds (also
known as "junk bonds") and other debt securities issued by governments and
corporations in emerging market countries (i.e., the issuer's securities
are traded mainly in an emerging market, the issuer is organized under the
laws of an emerging market country or is a company with more than half
31
PROSPECTUS May 1, 2010 Fund Details
of its business in emerging markets) or the return on which is derived
primarily from emerging markets. The fund considers "emerging markets" to
include any country that is defined as an emerging or developing economy by
any one of the following: The International Bank for Reconstruction and
Development (i.e., the World Bank), the International Finance Corporation
or the United Nations or its authorities.
o DWS Floating Rate Plus Fund. The fund seeks to provide high current income.
The fund invests, under normal market conditions, at least 80% of its total
assets in adjustable rate loans that have a senior right to payment
("Senior Loans") and other floating rate debt securities. The fund may also
borrow money in an amount up to 33 1/3% of the fund's total assets for a
range of purposes, including to create investment leverage. In an attempt
to enhance return, the fund employs the iGAP strategy.
o DWS Global Inflation Plus Fund. The fund seeks to provide maximum
inflation-adjusted return. The fund invests in inflation-indexed bonds and
other fixed income securities of varying maturities issued by the US
government, non-US governments, their agencies or instrumentalities, and US
and non-US corporations and derivatives related to each of these types of
securities. The fund may also invest (directly or indirectly) up to 30% of
its total assets in commodities-linked derivative instruments (such as
commodities-linked swaps, structured notes and futures contracts), equity
securities, and securities of Real Estate Investment Trusts (REITs). In an
attempt to enhance return, the fund also employs the iGAP strategy.
o DWS Gold & Precious Metals Fund. The fund seeks maximum return (principal
change and income). The fund invests at least 80% of net assets, plus the
amount of any borrowings for investment purposes, in common stocks and
other equities of US and foreign companies engaged in activities related to
gold, silver, platinum or other precious metals, and in gold coin and
bullion directly. These companies may be involved in activities such as
exploration, mining, fabrication, processing and distribution.
o DWS RREEF Global Infrastructure Fund. The fund seeks total return from both
capital appreciation and current income through investment in a global
portfolio of securities of infrastructure-related companies. Under normal
circumstances, the fund invests at least 80% of its net assets in the
securities of US and non-US infrastructure-related companies. The fund
considers a company to be an infrastructure-related company if at least 50%
of its non-cash assets are infrastructure assets or 50% of its gross income
or net profits are derived, directly or indirectly, from the ownership,
management, construction, operation, utilization or financing of
infrastructure assets. Under normal circumstances, the fund invests
primarily in equity securities, though the fund may also invest in
fixed-income securities without limitation.
o DWS RREEF Global Real Estate Securities Fund. The fund's investment
objective is to seek total return through a combination of current income
and long-term capital appreciation. The fund seeks to achieve this
objective by investing primarily in publicly listed real estate investment
trusts (REITs) and real estate operating companies on a global basis. Under
normal circumstances, the fund will invest at least 80% of its net assets,
plus the amount of any borrowing for investment purposes, in the equity
securities of REITs and real estate operating companies listed on
recognized stock exchanges around the world.
Portfolio management monitors the list of DWS funds in which the fund may
invest, and may periodically add or remove DWS funds from the list to obtain
exposure to new asset categories or strategies, to replace underperforming DWS
funds or to enhance returns. Based on portfolio management's assessment of
market conditions, the fund is rebalanced periodically to maintain the desired
asset allocation. The fund's asset allocation among the asset categories and
investment strategies will change over time and there should be no expectation
that current or past positions will be maintained in the future. In addition,
the fund may seek exposure to hedge funds through warrants, swaps and similar
derivative instruments.
IGAP STRATEGY. In addition to the fund's main investment strategy, portfolio
management seeks to enhance returns by employing a global tactical asset
allocation overlay strategy called iGAP (integrated Global Alpha Platform),
which attempts to take advantage of mispricings within global equity, bond,
commodity and currency markets. The iGAP strategy uses derivatives (which are
contracts or other instruments whose value is based on, for example, indices,
currencies or securities), in particular exchange-traded futures contracts on
global equities, bonds and commodities, and over-the-counter forward currency
contracts. The iGAP strategy, with respect to the fund, will not be used until
assets of the fund exceed $50 million, however, the fund may have indirect
exposure to the iGAP strategy through other DWS funds.
While the fund and the DWS funds in which it invests may use derivatives or
similar instruments and techniques to hedge existing positions, derivatives and
currency transactions, when used by the fund as part of the iGAP strategy or to
gain exposure to hedge funds, generally will be used to seek return and not for
hedging purposes. Certain DWS funds in which the fund invests may also use the
iGAP strategy.
--------------------------------------------------------------------------------
DERIVATIVES. The fund may use various types of derivatives outside of the iGAP
strategy for hedging, risk management or non-hedging purposes to seek to
enhance potential gains. The fund may use derivatives as a substitute for
direct investment in a particular asset class or to keep cash on hand to meet
shareholder redemptions or other needs. In particular, portfolio management may
use futures, options, forward currency contracts, interest rate swaps and
credit default swaps.
32
PROSPECTUS May 1, 2010 Fund Details
SECURITIES LENDING. The fund may lend securities (up to one-third of total
assets) to approved institutions.
--------------------------------------------------------------------------------
MAIN RISKS
There are several risk factors that could hurt the fund's performance, cause
you to lose money or cause the fund's performance to trail that of other
investments.
Because the fund invests in underlying funds, the risks listed here include
those of the various underlying funds as well as those of the fund itself.
Therefore, in these risk descriptions the term "the fund" may refer to the fund
itself, one or more underlying funds, or both.
ASSET ALLOCATION RISK. Portfolio management may favor one or more types of
investments or assets that underperform other investments, assets, or
securities markets as a whole. To the extent that alternative asset categories
underperform the general stock market, the fund may underperform funds that
invest mainly in stocks. Anytime portfolio management buys or sells securities
in order to adjust the fund's asset allocation this will increase portfolio
turnover and generate transaction costs.
STOCK MARKET RISK. When stock prices fall, you should expect the value of your
investment to fall as well. Stock prices can be hurt by poor management on the
part of the stock's issuer, shrinking product demand and other business risks.
These may affect single companies as well as groups of companies. In addition,
movements in financial markets may adversely affect a stock's price, regardless
of how well the company performs.
UNDERLYING FUNDS RISK. Because the fund may invest in underlying funds, the
fund's performance will be directly related to the performance of the
underlying portfolios or funds. To the extent that a given underlying fund
underperforms its benchmark or its fund peer group, it may contribute to
underperformance by the fund. In addition, the fund indirectly pays a portion
of the expenses incurred by the underlying funds, which lowers performance. To
the extent that the fund's allocations favor underlying funds with higher
expenses, the overall cost of investing paid by the fund will be higher.
FOREIGN INVESTMENT RISK. To the extent the fund invests in companies based
outside the US, it faces the risks inherent in foreign investing. Adverse
political, economic or social developments could undermine the value of the
fund's investments or prevent the fund from realizing their full value.
Financial reporting standards for companies based in foreign markets differ
from those in the US. Additionally, foreign securities markets generally are
smaller and less liquid than US markets. To the extent that the fund invests in
non-US dollar denominated foreign securities, changes in currency exchange
rates may affect the US dollar value of foreign securities or the income or
gain received on these securities. Foreign governments may restrict investment
by foreigners, limit withdrawal of trading profit or currency from the country,
restrict currency exchange or seize foreign investments. The investments of the
fund may also be subject to foreign withholding taxes. Foreign transactions and
custody of assets may involve delays in payment, delivery or recovery of money
or investments. Foreign investment risks are greater in emerging markets than
in developed markets. Emerging market investments are often considered
speculative. Emerging market countries typically have economic and political
systems that are less developed, and can be expected to be less stable than
developed markets. For example, the economies of such countries can be subject
to rapid and unpredictable rates of inflation or deflation.
INTEREST RATE RISK. When interest rates rise, prices of debt securities
generally decline. The longer the duration of the fund's debt securities, the
more sensitive it will be to interest rate changes. (As a general rule, a 1%
rise in interest rates means a 1% fall in value for every year of duration.)
COMMODITIES-RELATED INVESTMENTS RISK. The commodities-linked derivatives
instruments in which the fund invests are more volatile than investments in
equity and fixed income securities and may subject the fund to special risks
that do not apply to all derivatives transactions. The value of a
commodity-linked derivative investment generally is based upon the price
movements of a physical commodity (such as energy, minerals, or agricultural
products), a futures contract, swap or commodity index, or other economic
variables based upon changes in the value of commodities or the commodities
markets. The value of commodity-linked derivative instruments may be affected
by changes in overall market movements, commodity index volatility, changes in
interest rates, or factors affecting a particular industry or commodity, such
as drought, floods, weather, livestock disease, changes in storage costs,
embargoes, tariffs, policies of commodity cartels and international economic,
political and regulatory developments. Also, a liquid secondary market may not
exist for the types of commodity-linked derivative instruments the fund buys,
which may make it difficult for the fund to sell them at an acceptable price.
The fund's ability to gain exposure to commodity-linked investments and achieve
its investment objective may be limited by its intention to qualify as a
regulated investment company under the Internal Revenue Code.
INFLATION-INDEXED BOND RISK. Any rise in interest rates may cause
inflation-indexed bonds to decline in price, hurting fund performance. If
interest rates rise owing to reasons other than inflation, the fund's
investment in these securities may not be fully protected from the effects of
rising interest rates. The performance of any bonds that are indexed to non-US
rates of inflation may be higher or lower than those indexed to US inflation
rates. There can be no assurance that the fund's returns will match or exceed
the real rate of inflation.
33
PROSPECTUS May 1, 2010 Fund Details
CREDIT RISK. The fund's performance could be hurt if a security declines in
credit quality or goes into default, or if an issuer does not make timely
payments of interest or principal. For securities that rely on third-party
guarantors to support their credit quality, the same risks may apply if the
financial condition of the guarantor deteriorates or the guarantor ceases
insuring municipal bonds. Because guarantors may insure many types of bonds,
including subprime mortgage bonds and other high-risk bonds, their financial
condition could deteriorate as a result of events that have little or no
connection to securities owned by the fund.
SMALL COMPANY RISK. Small company stocks tend to be more volatile than large
company stocks. Small companies are less widely followed by stock analysts and
less information about them is available to investors. Industry-wide reversals
may have a greater impact on small companies, since they lack the financial
resources of larger companies. Small company stocks are typically less liquid
than large company stocks.
SENIOR LOANS RISK. Because Senior Loans are not rated by a rating agency,
registered with the Securities and Exchange Commission or any state securities
commission, or listed on any national securities exchange, there may be less
publicly available information about them then for registered or
exchange-listed securities. Also, because portfolio management relies mainly on
its own evaluation of the creditworthiness of borrowers, the fund is
particularly dependent on portfolio management's analytical abilities. Senior
Loans involve other risks described elsewhere in this prospectus, including
conflict of interest risk, credit risk, interest rate risk, liquidity risk, and
prepayment and extension risk.
FOCUS RISK. To the extent that the fund focuses its investments in particular
industries, asset classes or sectors of the economy, any market price
movements, regulatory or technological changes, or economic conditions
affecting companies in those industries, asset classes or sectors will have a
significant impact on the fund's performance. For example, the real estate
sector could be hurt by rising interest rates, falling real estate prices,
overbuilding or zoning changes, and the commodities sector could be hurt by
factors affecting a particular industry or commodity such as drought, floods,
weather or changes in storage costs.
SHORT SALE RISK. If the fund sells a security short and subsequently has to buy
the security back at a higher price, the fund will lose money on the
transaction. Any loss will be increased by the amount of compensation, interest
or dividends and transaction costs the fund must pay to a lender of the
security. The amount the fund could lose on a short sale is theoretically
unlimited (as compared to a long position, where the maximum loss is the amount
invested). The use of short sales, which has the effect of leveraging the fund,
could increase the exposure of the fund to the market, increase losses and
increase the volatility of returns.
The fund may not always be able to close out a short position at a particular
time or at an acceptable price. A lender may request that borrowed securities
be returned to it on short notice, and the fund may have to buy the borrowed
securities at an unfavorable price. If this occurs at a time that other short
sellers of the same security also want to close out their positions, it is more
likely that the fund will have to cover its short sale at an unfavorable price
and potentially reduce or eliminate any gain, or cause a loss, as a result of
the short sale.
SECURITIES LENDING RISK. Any decline in the value of a portfolio security that
occurs while the security is out on loan is borne by the fund, and will
adversely affect performance. Also, there may be delays in recovery of
securities loaned or even a loss of rights in the collateral should the
borrower of the securities fail financially while holding the security.
IGAP RISK. The success of the iGAP strategy depends, in part, on portfolio
management's ability to analyze the correlation between various global markets
and asset classes. If portfolio management's correlation analysis proves to be
incorrect, losses to the fund may be significant and may substantially exceed
the intended level of market exposure for the iGAP strategy.
DERIVATIVES RISK. Risks associated with derivatives include the risk that the
derivative is not well correlated with the security, index or currency to which
it relates; the risk that derivatives may result in losses or missed
opportunities; the risk that the fund will be unable to sell the derivative
because of an illiquid secondary market; the risk that a counterparty is
unwilling or unable to meet its obligation; and the risk that the derivative
transaction could expose the fund to the effects of leverage, which could
increase the fund's exposure to the market and magnify potential losses. There
is no guarantee that derivatives, to the extent employed, will have the
intended effect, and their use could cause lower returns or even losses to the
fund. The use of derivatives by the fund to hedge risk may reduce the
opportunity for gain by offsetting the positive effect of favorable price
movements. Derivatives whose values are tied to the value of commodities will
subject the fund directly to commodities risk and tax risk associated with
investment in commodities. See the "Commodities-related investments risk" and
"Tax status risk" sections for additional information.
SECURITY SELECTION RISK. The securities in the fund's portfolio may decline in
value. Portfolio management could be wrong in its analysis of industries,
companies, economic trends, the relative attractiveness of different securities
or other matters.
34
PROSPECTUS May 1, 2010 Fund Details
BORROWING RISK. To the extent that the fund borrows money for investment
purposes, it creates leverage, meaning that changes in the prices of securities
it owns will have a greater effect on the share price of the fund. The fund
also incurs interest expense and other costs when it borrows money; therefore,
unless returns on assets acquired with borrowed funds are greater than the
costs of borrowing, performance will be lower than it would have been without
any borrowing. When the fund borrows money it must comply with certain asset
coverage requirements, which at times may require the fund to dispose of some
of its portfolio holdings even though it may be disadvantageous to do so at
that time.
CONFLICT OF INTEREST RISK. To avoid violating laws on self-dealing, the fund
may not be able to invest in Senior Loans issued or marketed by an affiliate of
the Advisor at the desired timing or price. The fact that the Advisor has
indicated it may wish to invest in the publicly traded securities of a borrower
may mean it does not have access to material non-public information about the
borrower to which other lenders have access.
COUNTERPARTY RISK. A financial institution or other counterparty with whom the
fund does business (such as trading or securities lending), or that
underwrites, distributes or guarantees any investments or contracts that the
fund owns or is otherwise exposed to, may decline in financial health and
become unable to honor its commitments. This could cause losses for the fund or
could delay the return or delivery of collateral or other assets to the fund.
ETF RISK. Because ETFs trade on a securities exchange, their shares may trade
at a premium or discount to their net asset value. An ETF is subject to the
risks of the assets in which it invests as well as those of the investment
strategy it follows. ETFs incur fees and expenses, such as trading costs,
operating expenses, licensing fees, trustee fees and marketing expenses. With
an index ETF, these costs may contribute to the ETF not fully matching the
performance of the index it is designed to track. The fund incurs brokerage
costs when it buys and sells shares of an ETF and also bears its proportionate
share of the ETF's fees and expenses, which are passed through to ETF
shareholders.
LIQUIDITY RISK. In certain situations, it may be difficult or impossible to
sell an investment in an orderly fashion at an acceptable price. This risk can
be ongoing for any security that does not trade actively or in large volumes,
for any security that trades primarily on smaller markets, and for investments
that typically trade only among a limited number of large investors (such as
certain types of derivatives or restricted securities). In unusual market
conditions, even normally liquid securities may be affected by a degree of
liquidity risk. This may affect only certain securities or an overall
securities market.
PREPAYMENT AND EXTENSION RISK. When interest rates fall, issuers of high
interest debt obligations may pay off the debts earlier than expected
(prepayment risk), and the fund may have to reinvest the proceeds at lower
yields. When interest rates rise, issuers of lower interest debt obligations
may pay off the debts later than expected (extension risk), thus keeping the
fund's assets tied up in lower interest debt obligations. Prepayments could
also create capital gains tax liability in some instances. Any unexpected
behavior in interest rates could increase the volatility of the fund's share
price and yield and could hurt fund performance.
PRICING RISK. If market conditions make it difficult to value some investments,
the fund may value these investments using more subjective methods, such as
fair value pricing. In such cases, the value determined for an investment could
be different than the value realized upon such investment's sale. As a result,
you could pay more than the market value when buying fund shares or receive
less than the market value when selling fund shares.
TAX STATUS RISK. Income from certain commodity-linked derivatives may not
constitute "qualifying income" to the fund. If such income were not to
constitute qualifying income, the fund might be subject to tax at the fund
level. In addition, if DWS Alternative Asset Allocation Plus VIP fails to
qualify as a RIC, a separate account underlying a variable life insurance or
variable annuity contract that invests in shares of the fund will be required
to treat the fund (or if an underlying fund fails to qualify as a RIC, the
fund's investment in the underlying fund) as a single investment for purposes
of the diversification requirements of section 817(h) of the Code. If a
separate account fails to satisfy the diversification requirements of Code
section 817(h), income allocable to the contracts associated with the separate
account will be taxed currently for federal income tax purposes to the holders
of such contracts and income from prior periods with respect to such contracts
also could be taxable, most likely in the year of the failure.
--------------------------------------------------------------------------------
DWS Blue Chip VIP
PRINCIPAL INVESTMENT STRATEGY
MAIN INVESTMENTS. Under normal circumstances, the fund invests at least 80% of
net assets, plus the amount of any borrowings for investment purposes, in
common stocks of large US companies that are similar in size to the companies
in the S&P 500( (Reg. TM)) Index (generally the 500 largest companies in the
US) and that portfolio management considers to be "blue chip" companies. Blue
chip companies are large, well-known companies that typically have an
established earnings and dividends history, easy access to credit, solid
positions in their industry and strong management.
While the fund invests mainly in US common stocks, it could invest up to 20% of
net assets in foreign securities. The fund may also invest in other types of
equity securities such as preferred stocks or convertible securities.
35
PROSPECTUS May 1, 2010 Fund Details
MANAGEMENT PROCESS. Portfolio management looks for "blue chip" companies whose
stock price is attractive relative to potential growth. Portfolio management
uses both quantitative techniques and fundamental analysis to evaluate each
company's stock price relative to the company's earnings, operating trends,
market outlook and other measures of performance potential.
Portfolio management will normally sell a stock when they believe its
fundamental factors have changed, other investments offer better opportunities
or in the course of adjusting the fund's emphasis on or within a given
industry.
--------------------------------------------------------------------------------
DERIVATIVES. The fund may use various types of derivatives (contracts whose
value is based on, for example, indices, currencies or securities) for hedging,
risk management or non-hedging purposes to seek to enhance potential gains. The
fund may use derivatives as a substitute for direct investment in a particular
asset class or to keep cash on hand to meet shareholder redemptions or other
needs.
SECURITIES LENDING. The fund may lend securities (up to one-third of total
assets) to approved institutions.
--------------------------------------------------------------------------------
MAIN RISKS
There are several risk factors that could hurt the fund's performance, cause
you to lose money or cause the fund's performance to trail that of other
investments.
STOCK MARKET RISK. When stock prices fall, you should expect the value of your
investment to fall as well. Stock prices can be hurt by poor management on the
part of the stock's issuer, shrinking product demand and other business risks.
These may affect single companies as well as groups of companies. In addition,
movements in financial markets may adversely affect a stock's price, regardless
of how well the company performs. To the extent the fund invests in a
particular capitalization or market sector, the fund's performance may be
proportionately affected by that segment's general performance.
FOCUS RISK. To the extent that the fund focuses its investments in particular
industries, asset classes or sectors of the economy, any market price
movements, regulatory or technological changes, or economic conditions
affecting companies in those industries, asset classes or sectors will have a
significant impact on the fund's performance. For example, consumer goods
companies could be hurt by a rise in unemployment or technology companies could
be hurt by such factors as market saturation, price competition and rapid
obsolescence.
SECURITY SELECTION RISK. The securities in the fund's portfolio may decline in
value. Portfolio management could be wrong in its analysis of industries,
companies, economic trends, the relative attractiveness of different securities
or other matters.
SECURITIES LENDING RISK. Any decline in the value of a portfolio security that
occurs while the security is out on loan is borne by the fund, and will
adversely affect performance. Also, there may be delays in recovery of
securities loaned or even a loss of rights in the collateral should the
borrower of the securities fail financially while holding the security.
FOREIGN INVESTMENT RISK. To the extent the fund invests in companies based
outside the US, it faces the risks inherent in foreign investing. Adverse
political, economic or social developments could undermine the value of the
fund's investments or prevent the fund from realizing their full value.
Financial reporting standards for companies based in foreign markets differ
from those in the US. Additionally, foreign securities markets generally are
smaller and less liquid than US markets. To the extent that the fund invests in
non-US dollar denominated foreign securities, changes in currency exchange
rates may affect the US dollar value of foreign securities or the income or
gain received on these securities. Foreign governments may restrict investment
by foreigners, limit withdrawal of trading profit or currency from the country,
restrict currency exchange or seize foreign investments. The investments of the
fund may also be subject to foreign withholding taxes. Foreign transactions and
custody of assets may involve delays in payment, delivery or recovery of money
or investments.
DERIVATIVES RISK. Risks associated with derivatives include the risk that the
derivative is not well correlated with the security, index or currency to which
it relates; the risk that derivatives may result in losses or missed
opportunities; the risk that the fund will be unable to sell the derivative
because of an illiquid secondary market; the risk that a counterparty is
unwilling or unable to meet its obligation; and the risk that the derivative
transaction could expose the fund to the effects of leverage, which could
increase the fund's exposure to the market and magnify potential losses. There
is no guarantee that derivatives, to the extent employed, will have the
intended effect, and their use could cause lower returns or even losses to the
fund. The use of derivatives by the fund to hedge risk may reduce the
opportunity for gain by offsetting the positive effect of favorable price
movements.
COUNTERPARTY RISK. A financial institution or other counterparty with whom the
fund does business (such as trading or securities lending), or that
underwrites, distributes or guarantees any investments or contracts that the
fund owns or is otherwise exposed to, may decline in financial health and
become unable to honor its commitments. This could cause losses for the fund or
could delay the return or delivery of collateral or other assets to the fund.
LIQUIDITY RISK. In certain situations, it may be difficult or impossible to
sell an investment in an orderly fashion at an acceptable price. This risk can
be ongoing for any security that does not trade actively or in large volumes,
for any security that trades primarily on smaller markets, and for investments
that typically trade only among a limited number of large investors (such as
certain types of derivatives or restricted securities). In unusual market
conditions, even
36
PROSPECTUS May 1, 2010 Fund Details
normally liquid securities may be affected by a degree of liquidity risk. This
may affect only certain securities or an overall securities market.
PRICING RISK. If market conditions make it difficult to value some investments,
the fund may value these investments using more subjective methods, such as
fair value pricing. In such cases, the value determined for an investment could
be different than the value realized upon such investment's sale. As a result,
you could pay more than the market value when buying fund shares or receive
less than the market value when selling fund shares.
--------------------------------------------------------------------------------
DWS Dreman Small Mid Cap Value VIP
PRINCIPAL INVESTMENT STRATEGY
Under normal circumstances, the fund invests at least 80% of net assets, plus
the amount of any borrowings for investment purposes, in undervalued common
stocks of small and mid-size US companies. The fund defines small companies as
those that are similar in market value to those in the Russell 2000 (Reg. TM)
Value Index. The fund defines mid-size companies as those that are similar in
market value to those in the Russell Midcap (Reg. TM) Value Index. The fund
intends to invest primarily in companies whose market capitalizations fall
within the normal range of each Index.
While the fund invests mainly in US stocks, it could invest up to 20% of net
assets in foreign securities.
The fund's equity investments are mainly common stocks, but may also include
other types of equities such as preferred or convertible stocks. The fund may
also invest in initial public offerings.
MANAGEMENT PROCESS. Portfolio management begins by screening stocks of small
and mid-size companies with below-market price-to-earnings (P/E) ratios.
Portfolio management then compares the company's stock price to such measures
as book value, cash flow and yield and analyzes individual companies to
identify those that are fundamentally sound and appear to have strong potential
for earnings and dividend growth over the Russell 2500 Value Index.
Portfolio management then assembles the fund's portfolio from among the most
attractive stocks, drawing, in addition, on an analysis of economic outlooks
for various industries.
Portfolio management will normally sell a stock when it no longer qualifies as
a small or mid-size company, when its P/E rises above that of the industry
median or the median for the Russell 2500 Value Index, its fundamentals change
or other investments offer better opportunities.
--------------------------------------------------------------------------------
DERIVATIVES. The fund may use various types of derivatives (contracts whose
value is based on, for example, indices, currencies or securities) for hedging,
risk management or non-hedging purposes to seek to enhance potential gains. The
fund may use derivatives as a substitute for direct investment in a particular
asset class or to keep cash on hand to meet shareholder redemptions or other
needs. In particular, the fund may use futures, currency options and forward
currency transactions.
SECURITIES LENDING. The fund may lend securities (up to one-third of total
assets) to approved institutions.
--------------------------------------------------------------------------------
MAIN RISKS
There are several risk factors that could hurt the fund's performance, cause
you to lose money or cause the fund's performance to trail that of other
investments.
STOCK MARKET RISK. When stock prices fall, you should expect the value of your
investment to fall as well. Stock prices can be hurt by poor management on the
part of the stock's issuer, shrinking product demand and other business risks.
These may affect single companies as well as groups of companies. In addition,
movements in financial markets may adversely affect a stock's price, regardless
of how well the company performs. To the extent the fund invests in a
particular capitalization or market sector, the fund's performance may be
proportionately affected by that segment's general performance.
SECURITY SELECTION RISK. The securities in the fund's portfolio may decline in
value. Portfolio management could be wrong in its analysis of industries,
companies, economic trends, the relative attractiveness of different securities
or other matters.
VALUE INVESTING RISK. As a category, value stocks may underperform growth
stocks (and the stock market as a whole) over any period of time. In addition,
value stocks selected for investment by portfolio management may not perform as
anticipated: stocks that appear undervalued may remain undervalued
indefinitely, or may in fact be fairly valued.
SMALL COMPANY RISK. Small company stocks tend to be more volatile than large
company stocks. Small companies are less widely followed by stock analysts and
less information about them is available to investors. Industry-wide reversals
may have a greater impact on small companies, since they lack the financial
resources of larger companies. Small company stocks are typically less liquid
than large company stocks.
MEDIUM-SIZED COMPANY RISK. Medium-sized company stocks tend to be more volatile
than large company stocks. Medium-sized companies are less widely followed by
stock analysts and less information about them is available to investors.
Industry-wide reversals may have a greater impact on medium-sized companies,
since they lack the financial resources of larger companies. Medium-sized
company stocks are typically less liquid than large company stocks.
FOCUS RISK. To the extent that the fund focuses its investments in particular
industries, asset classes or sectors of the economy, any market price
movements, regulatory or technological changes, or economic conditions
affecting companies in those industries, asset classes or sectors
37
PROSPECTUS May 1, 2010 Fund Details
will have a significant impact on the fund's performance. For example, consumer
goods companies could be hurt by a rise in unemployment or technology companies
could be hurt by such factors as market saturation, price competition and rapid
obsolescence.
FOREIGN INVESTMENT RISK. To the extent the fund invests in companies based
outside the US, it faces the risks inherent in foreign investing. Adverse
political, economic or social developments could undermine the value of the
fund's investments or prevent the fund from realizing their full value.
Financial reporting standards for companies based in foreign markets differ
from those in the US. Additionally, foreign securities markets generally are
smaller and less liquid than US markets. To the extent that the fund invests in
non-US dollar denominated foreign securities, changes in currency exchange
rates may affect the US dollar value of foreign securities or the income or
gain received on these securities. Foreign governments may restrict investment
by foreigners, limit withdrawal of trading profit or currency from the country,
restrict currency exchange or seize foreign investments. The investments of the
fund may also be subject to foreign withholding taxes. Foreign transactions and
custody of assets may involve delays in payment, delivery or recovery of money
or investments. Foreign investment risks are greater in emerging markets than
in developed markets. Emerging market investments are often considered
speculative. Emerging market countries typically have economic and political
systems that are less developed, and can be expected to be less stable than
developed markets. For example, the economies of such countries can be subject
to rapid and unpredictable rates of inflation or deflation.
DERIVATIVES RISK. Risks associated with derivatives include the risk that the
derivative is not well correlated with the security, index or currency to which
it relates; the risk that derivatives may result in losses or missed
opportunities; the risk that the fund will be unable to sell the derivative
because of an illiquid secondary market; the risk that a counterparty is
unwilling or unable to meet its obligation; and the risk that the derivative
transaction could expose the fund to the effects of leverage, which could
increase the fund's exposure to the market and magnify potential losses. There
is no guarantee that derivatives, to the extent employed, will have the
intended effect, and their use could cause lower returns or even losses to the
fund. The use of derivatives by the fund to hedge risk may reduce the
opportunity for gain by offsetting the positive effect of favorable price
movements.
SECURITIES LENDING RISK. Any decline in the value of a portfolio security that
occurs while the security is out on loan is borne by the fund, and will
adversely affect performance. Also, there may be delays in recovery of
securities loaned or even a loss of rights in the collateral should the
borrower of the securities fail financially while holding the security.
COUNTERPARTY RISK. A financial institution or other counterparty with whom the
fund does business (such as trading or securities lending), or that
underwrites, distributes or guarantees any investments or contracts that the
fund owns or is otherwise exposed to, may decline in financial health and
become unable to honor its commitments. This could cause losses for the fund or
could delay the return or delivery of collateral or other assets to the fund.
LIQUIDITY RISK. In certain situations, it may be difficult or impossible to
sell an investment in an orderly fashion at an acceptable price. This risk can
be ongoing for any security that does not trade actively or in large volumes,
for any security that trades primarily on smaller markets, and for investments
that typically trade only among a limited number of large investors (such as
certain types of derivatives or restricted securities). In unusual market
conditions, even normally liquid securities may be affected by a degree of
liquidity risk. This may affect only certain securities or an overall
securities market.
PRICING RISK. If market conditions make it difficult to value some investments,
the fund may value these investments using more subjective methods, such as
fair value pricing. In such cases, the value determined for an investment could
be different than the value realized upon such investment's sale. As a result,
you could pay more than the market value when buying fund shares or receive
less than the market value when selling fund shares.
--------------------------------------------------------------------------------
DWS Global Thematic VIP
PRINCIPAL INVESTMENT STRATEGY
MAIN INVESTMENTS. Under normal circumstances, the fund invests at least 80% of
net assets, plus the amount of any borrowings for investment purposes, in
common stocks and other equities of companies throughout the world that
portfolio management considers to be "blue chip" companies. Blue chip companies
are large, well known companies that typically have an established earnings and
dividends history, easy access to credit, solid positions in their industries
and strong management.
MANAGEMENT PROCESS.
In choosing securities, portfolio management uses a combination of three
analytical disciplines:
o BOTTOM-UP RESEARCH. Portfolio management looks for individual companies with
a history of above-average growth, strong competitive positioning,
attractive prices relative to potential growth, sound financial strength
and effective management, among other factors.
o GROWTH ORIENTATION. Portfolio management generally looks for companies that
portfolio management believes have above-average potential for sustainable
growth of revenue or earnings and whose market value appears reasonable in
light of their business prospects.
38
PROSPECTUS May 1, 2010 Fund Details
o ANALYSIS OF GLOBAL THEMES. Portfolio management considers global economic
outlooks, seeking to identify industries and companies that are likely to
benefit from social, political and economic changes.
Portfolio management uses analytical tools to actively monitor the risk profile
of the portfolio as compared to comparable funds and appropriate benchmarks and
peer groups.
Portfolio management will normally sell a stock when portfolio management
believes its price is unlikely to go much higher, its fundamentals have
deteriorated, other investments offer better opportunities or in the course of
adjusting the fund's exposure to a given country.
While most of the fund's equities are common stocks, some may be other types of
equities, such as convertible stocks or preferred stocks. The fund may also
invest up to 5% of total assets in junk bonds.
--------------------------------------------------------------------------------
DERIVATIVES. The fund may use various types of derivatives (contracts whose
value is based on, for example, indices, currencies or securities) for hedging,
risk management or non-hedging purposes to seek to enhance potential gains. The
fund may use derivatives as a substitute for direct investment in a particular
asset class or to keep cash on hand to meet shareholder redemptions or other
needs. In particular, the fund may use futures, currency options and forward
currency transactions.
SECURITIES LENDING. The fund may lend securities (up to one-third of total
assets) to approved institutions.
--------------------------------------------------------------------------------
MAIN RISKS
There are several risk factors that could hurt the fund's performance, cause
you to lose money or cause the fund's performance to trail that of other
investments.
STOCK MARKET RISK. When stock prices fall, you should expect the value of your
investment to fall as well. Stock prices can be hurt by poor management on the
part of the stock's issuer, shrinking product demand and other business risks.
These may affect single companies as well as groups of companies. In addition,
movements in financial markets may adversely affect a stock's price, regardless
of how well the company performs. To the extent that the fund invests in a
particular geographic region or market sector, performance will be affected by
that region's general performance.
FOREIGN INVESTMENT RISK. To the extent the fund invests in companies based
outside the US, it faces the risks inherent in foreign investing. Adverse
political, economic or social developments could undermine the value of the
fund's investments or prevent the fund from realizing their full value.
Financial reporting standards for companies based in foreign markets differ
from those in the US. Additionally, foreign securities markets generally are
smaller and less liquid than US markets. To the extent that the fund invests in
non-US dollar denominated foreign securities, changes in currency exchange
rates may affect the US dollar value of foreign securities or the income or
gain received on these securities. Foreign governments may restrict investment
by foreigners, limit withdrawal of trading profit or currency from the country,
restrict currency exchange or seize foreign investments. The investments of the
fund may also be subject to foreign withholding taxes. Foreign transactions and
custody of assets may involve delays in payment, delivery or recovery of money
or investments. Foreign investment risks are greater in emerging markets than
in developed markets. Emerging market investments are often considered
speculative. Emerging market countries typically have economic and political
systems that are less developed, and can be expected to be less stable than
developed markets. For example, the economies of such countries can be subject
to rapid and unpredictable rates of inflation or deflation.
SECURITY SELECTION RISK. The securities in the fund's portfolio may decline in
value. Portfolio management could be wrong in its analysis of industries,
companies, economic trends, the relative attractiveness of different securities
or other matters.
LIQUIDITY RISK. In certain situations, it may be difficult or impossible to
sell an investment in an orderly fashion at an acceptable price. This risk can
be ongoing for any security that does not trade actively or in large volumes,
for any security that trades primarily on smaller markets, and for investments
that typically trade only among a limited number of large investors (such as
certain types of derivatives or restricted securities). In unusual market
conditions, even normally liquid securities may be affected by a degree of
liquidity risk. This may affect only certain securities or an overall
securities market.
PRICING RISK. If market conditions make it difficult to value some investments,
the fund may value these investments using more subjective methods, such as
fair value pricing. In such cases, the value determined for an investment could
be different than the value realized upon such investment's sale. As a result,
you could pay more than the market value when buying fund shares or receive
less than the market value when selling fund shares.
DERIVATIVES RISK. Risks associated with derivatives include the risk that the
derivative is not well correlated with the security, index or currency to which
it relates; the risk that derivatives may result in losses or missed
opportunities; the risk that the fund will be unable to sell the derivative
because of an illiquid secondary market; the risk that a counterparty is
unwilling or unable to meet its obligation; and the risk that the derivative
transaction could expose the fund to the effects of leverage, which could
increase the fund's exposure to the market and magnify potential losses. There
is no guarantee that derivatives, to the extent employed, will have the
intended effect, and their use could cause lower returns or even losses to the
fund. The use of derivatives by the fund to hedge risk may reduce the
opportunity for gain by offsetting the positive effect of favorable price
movements.
39
PROSPECTUS May 1, 2010 Fund Details
SECURITIES LENDING RISK. Any decline in the value of a portfolio security that
occurs while the security is out on loan is borne by the fund, and will
adversely affect performance. Also, there may be delays in recovery of
securities loaned or even a loss of rights in the collateral should the
borrower of the securities fail financially while holding the security.
COUNTERPARTY RISK. A financial institution or other counterparty with whom the
fund does business (such as trading or securities lending), or that
underwrites, distributes or guarantees any investments or contracts that the
fund owns or is otherwise exposed to, may decline in financial health and
become unable to honor its commitments. This could cause losses for the fund or
could delay the return or delivery of collateral or other assets to the fund.
--------------------------------------------------------------------------------
DWS Government & Agency Securities VIP
PRINCIPAL INVESTMENT STRATEGY
MAIN INVESTMENTS. Under normal circumstances, the fund invests at least 80% of
net assets, plus the amount of any borrowings for investment purposes, in US
government securities and repurchase agreements of US government securities. US
government-related debt instruments in which the fund may invest include: (i)
direct obligations of the US Treasury; (ii) securities such as Ginnie Maes
which are mortgage-backed securities issued and guaranteed by the Government
National Mortgage Association (GNMA) and supported by the full faith and credit
of the United States; and (iii) securities issued or guaranteed, as to their
payment of principal and interest, by US government agencies or government
sponsored entities, some of which may be supported only by the credit of the
issuer.
The fund normally invests all of its assets in securities issued or guaranteed
by the US government, its agencies or instrumentalities, except the fund may
invest up to 10% of its net assets in cash equivalents, such as money market
funds, and short-term bond funds. These securities may not be issued or
guaranteed by the US government, its agencies or instrumentalities.
MANAGEMENT PROCESS. In deciding which types of government bonds to buy and
sell, portfolio management first considers the relative attractiveness of US
Treasuries compared to other US government and agency securities and then
determines allocations. Their decisions are generally based on a number of
factors, including changes in supply and demand within the bond market.
In choosing individual bonds, portfolio management reviews each bond's
fundamentals, compares the yields of shorter maturity bonds to those of longer
maturity bonds and uses technical analysis to project prepayment rates and
other factors that could affect a bond's attractiveness. Portfolio management
may also adjust the duration (a measure of sensitivity to interest rate
movements) of the fund's portfolio, based upon their analysis.
--------------------------------------------------------------------------------
DERIVATIVES. The fund may use various types of derivatives (contracts whose
value is based on, for example, indices, currencies or securities) for hedging,
risk management or non-hedging purposes to seek to enhance potential gains. The
fund may use derivatives as a substitute for direct investment in a particular
asset class or to keep cash on hand to meet shareholder redemptions or other
needs.
SECURITIES LENDING. The fund may lend securities (up to one-third of total
assets) to approved institutions.
--------------------------------------------------------------------------------
MAIN RISKS
There are several risk factors that could hurt the fund's performance, cause
you to lose money or cause the fund's performance to trail that of other
investments.
INTEREST RATE RISK. When interest rates rise, prices of debt securities
generally decline. The longer the duration of the fund's debt securities, the
more sensitive it will be to interest rate changes. (As a general rule, a 1%
rise in interest rates means a 1% fall in value for every year of duration.)
DERIVATIVES RISK. Risks associated with derivatives include the risk that the
derivative is not well correlated with the security, index or currency to which
it relates; the risk that derivatives may result in losses or missed
opportunities; the risk that the fund will be unable to sell the derivative
because of an illiquid secondary market; the risk that a counterparty is
unwilling or unable to meet its obligation; and the risk that the derivative
transaction could expose the fund to the effects of leverage, which could
increase the fund's exposure to the market and magnify potential losses. There
is no guarantee that derivatives, to the extent employed, will have the
intended effect, and their use could cause lower returns or even losses to the
fund. The use of derivatives by the fund to hedge risk may reduce the
opportunity for gain by offsetting the positive effect of favorable price
movements.
SECURITY SELECTION RISK. The securities in the fund's portfolio may decline in
value. Portfolio management could be wrong in its analysis of industries,
companies, economic trends, the relative attractiveness of different securities
or other matters.
CREDIT RISK. The fund's performance could be hurt if a security declines in
credit quality or goes into default, or if an issuer does not make timely
payments of interest or principal.
Some securities issued by US government agencies or instrumentalities are
backed by the full faith and credit of the US government. Others are supported
only by the credit of that agency or instrumentality. For this latter group, if
there is a potential or actual loss of principal and interest of these
securities, the US government might provide financial support, but has no
obligation to do so.
40
PROSPECTUS May 1, 2010 Fund Details
SECURITIES LENDING RISK. Any decline in the value of a portfolio security that
occurs while the security is out on loan is borne by the fund, and will
adversely affect performance. Also, there may be delays in recovery of
securities loaned or even a loss of rights in the collateral should the
borrower of the securities fail financially while holding the security.
COUNTERPARTY RISK. A financial institution or other counterparty with whom the
fund does business (such as trading or securities lending), or that
underwrites, distributes or guarantees any investments or contracts that the
fund owns or is otherwise exposed to, may decline in financial health and
become unable to honor its commitments. This could cause losses for the fund or
could delay the return or delivery of collateral or other assets to the fund.
LIQUIDITY RISK. In certain situations, it may be difficult or impossible to
sell an investment in an orderly fashion at an acceptable price. This risk can
be ongoing for any security that does not trade actively or in large volumes,
for any security that trades primarily on smaller markets, and for investments
that typically trade only among a limited number of large investors (such as
certain types of derivatives or restricted securities). In unusual market
conditions, even normally liquid securities may be affected by a degree of
liquidity risk. This may affect only certain securities or an overall
securities market.
PRICING RISK. If market conditions make it difficult to value some investments,
the fund may value these investments using more subjective methods, such as
fair value pricing. In such cases, the value determined for an investment could
be different than the value realized upon such investment's sale. As a result,
you could pay more than the market value when buying fund shares or receive
less than the market value when selling fund shares.
PREPAYMENT AND EXTENSION RISK. When interest rates fall, issuers of high
interest debt obligations may pay off the debts earlier than expected
(prepayment risk), and the fund may have to reinvest the proceeds at lower
yields. When interest rates rise, issuers of lower interest debt obligations
may pay off the debts later than expected (extension risk), thus keeping the
fund's assets tied up in lower interest debt obligations. Prepayments could
also create capital gains tax liability in some instances. Any unexpected
behavior in interest rates could increase the volatility of the fund's share
price and yield and could hurt fund performance.
--------------------------------------------------------------------------------
DWS High Income VIP
PRINCIPAL INVESTMENT STRATEGY
MAIN INVESTMENTS. Under normal circumstances, the fund generally invests at
least 65% of net assets, plus the amount of any borrowings for investment
purposes, in junk bonds, which are those rated below the fourth highest credit
rating category (that is, grade BB/Ba and below). The fund may invest up to 50%
of total assets in bonds denominated in US dollars or foreign currencies from
foreign issuers. The fund invests in securities of varying maturities and
intends to maintain a dollar-weighted effective average portfolio maturity that
will not exceed ten years. Subject to its portfolio maturity policy, the fund
may purchase individual securities with any stated maturity.
MANAGEMENT PROCESS. Portfolio management focuses on cash flow and total return
analysis, and broad diversification among countries, sectors, industries and
individual issuers and maturities. Portfolio management uses an active process
that emphasizes relative value in a global environment, managing on a total
return basis, and using intensive research to identify stable to improving
credit situations that may provide yield compensation for the risk of investing
in junk bonds.
The investment process involves a bottom-up approach, where relative value and
fundamental analysis are used to select the best securities within each
industry, and a top-down approach to assess the overall risk and return in the
market and which considers macro trends in the economy. To select securities or
investments, portfolio management:
o analyzes economic conditions for improving or undervalued sectors and
industries;
o uses independent credit research and on-site management visits to evaluate
individual issuers' debt service, growth rate, and both downgrade and
upgrade potential;
o assesses new offerings versus secondary market opportunities; and
o seeks issuers within attractive industry sectors and with strong long-term
fundamentals and improving credits.
--------------------------------------------------------------------------------
DERIVATIVES. The fund may use various types of derivatives (contracts whose
value is based on, for example, indices, currencies or securities) for hedging,
risk management or non-hedging purposes to seek to enhance potential gains. The
fund may use derivatives as a substitute for direct investment in a particular
asset class or to keep cash on hand to meet shareholder redemptions or other
needs. In particular, portfolio management may use future contracts, currency
options, forward currency contracts and credit default swaps.
SECURITIES LENDING. The fund may lend securities (up to one-third of total
assets) to approved institutions.
--------------------------------------------------------------------------------
MAIN RISKS
There are several risk factors that could hurt the fund's performance, cause
you to lose money or cause the fund's performance to trail that of other
investments.
CREDIT RISK. A fund purchasing debt securities faces the risk that the
creditworthiness of an issuer may decline, causing the value of the debt
securities to decline. In addition, an issuer may not be able to make timely
payments on the interest and/or principal on the debt security it has issued.
Because the issuers of high-yield debt securities or junk bonds (debt
securities rated below the fourth highest category) may be in uncertain
financial health, the prices of their debt securities can be more vulnerable to
41
PROSPECTUS May 1, 2010 Fund Details
bad economic news or even the expectation of bad news, than investment-grade
debt securities. In some cases, debt securities, particularly high-yield debt
securities, may decline in credit quality or go into default. Because the fund
may invest in securities not paying current interest or in securities already
in default, these risks may be more pronounced.
INTEREST RATE RISK. When interest rates rise, prices of debt securities
generally decline. The longer the duration of the fund's debt securities, the
more sensitive it will be to interest rate changes. (As a general rule, a 1%
rise in interest rates means a 1% fall in value for every year of duration.)
FOREIGN INVESTMENT RISK. To the extent the fund invests in companies based
outside the US, it faces the risks inherent in foreign investing. Adverse
political, economic or social developments could undermine the value of the
fund's investments or prevent the fund from realizing their full value.
Financial reporting standards for companies based in foreign markets differ
from those in the US. Additionally, foreign securities markets generally are
smaller and less liquid than US markets. To the extent that the fund invests in
non-US dollar denominated foreign securities, changes in currency exchange
rates may affect the US dollar value of foreign securities or the income or
gain received on these securities. Foreign governments may restrict investment
by foreigners, limit withdrawal of trading profit or currency from the country,
restrict currency exchange or seize foreign investments. The investments of the
fund may also be subject to foreign withholding taxes. Foreign transactions and
custody of assets may involve delays in payment, delivery or recovery of money
or investments. Foreign investment risks are greater in emerging markets than
in developed markets. Emerging market investments are often considered
speculative. Emerging market countries typically have economic and political
systems that are less developed, and can be expected to be less stable than
developed markets. For example, the economies of such countries can be subject
to rapid and unpredictable rates of inflation or deflation.
SECURITY SELECTION RISK. The securities in the fund's portfolio may decline in
value. Portfolio management could be wrong in its analysis of industries,
companies, economic trends, the relative attractiveness of different securities
or other matters.
DERIVATIVES RISK. Risks associated with derivatives include the risk that the
derivative is not well correlated with the security, index or currency to which
it relates; the risk that derivatives may result in losses or missed
opportunities; the risk that the fund will be unable to sell the derivative
because of an illiquid secondary market; the risk that a counterparty is
unwilling or unable to meet its obligation; and the risk that the derivative
transaction could expose the fund to the effects of leverage, which could
increase the fund's exposure to the market and magnify potential losses. There
is no guarantee that derivatives, to the extent employed, will have the
intended effect, and their use could cause lower returns or even losses to the
fund. The use of derivatives by the fund to hedge risk may reduce the
opportunity for gain by offsetting the positive effect of favorable price
movements.
SECURITIES LENDING RISK. Any decline in the value of a portfolio security that
occurs while the security is out on loan is borne by the fund, and will
adversely affect performance. Also, there may be delays in recovery of
securities loaned or even a loss of rights in the collateral should the
borrower of the securities fail financially while holding the security.
COUNTERPARTY RISK. A financial institution or other counterparty with whom the
fund does business (such as trading or securities lending), or that
underwrites, distributes or guarantees any investments or contracts that the
fund owns or is otherwise exposed to, may decline in financial health and
become unable to honor its commitments. This could cause losses for the fund or
could delay the return or delivery of collateral or other assets to the fund.
LIQUIDITY RISK. In certain situations, it may be difficult or impossible to
sell an investment in an orderly fashion at an acceptable price. This risk can
be ongoing for any security that does not trade actively or in large volumes,
for any security that trades primarily on smaller markets, and for investments
that typically trade only among a limited number of large investors (such as
certain types of derivatives or restricted securities). In unusual market
conditions, even normally liquid securities may be affected by a degree of
liquidity risk. This may affect only certain securities or an overall
securities market.
PRICING RISK. If market conditions make it difficult to value some investments,
the fund may value these investments using more subjective methods, such as
fair value pricing. In such cases, the value determined for an investment could
be different than the value realized upon such investment's sale. As a result,
you could pay more than the market value when buying fund shares or receive
less than the market value when selling fund shares.
PREPAYMENT AND EXTENSION RISK. When interest rates fall, issuers of high
interest debt obligations may pay off the debts earlier than expected
(prepayment risk), and the fund may have to reinvest the proceeds at lower
yields. When interest rates rise, issuers of lower interest debt obligations
may pay off the debts later than expected (extension risk), thus keeping the
fund's assets tied up in lower interest debt obligations. Prepayments could
also create capital gains tax liability in some instances. Any unexpected
behavior in interest rates could increase the volatility of the fund's share
price and yield and could hurt fund performance.
42
PROSPECTUS May 1, 2010 Fund Details
--------------------------------------------------------------------------------
DWS Large Cap Value VIP
PRINCIPAL INVESTMENT STRATEGY
Under normal circumstances, the fund invests at least 80% of net assets, plus
the amount of any borrowings for investment purposes, in common stocks and
other equity securities of large US companies that are similar in size to the
companies in the Russell 1000 (Reg. TM) Value Index and that portfolio
management believes are undervalued. These are typically companies that have
been sound historically, but are temporarily out of favor. The fund intends to
invest primarily in companies whose market capitalizations fall within the
normal range of the Russell 1000 (Reg. TM) Value Index. Although the fund can
invest in stocks of any economic sector (which is comprised of two or more
industries), at times it may emphasize certain sectors, even investing more
than 25% of total assets in any one sector.
The fund may invest up to 20% of total assets in foreign securities.
The fund's equity investments are mainly common stocks, but may also include
other types of equities such as preferred or convertible stocks.
MANAGEMENT PROCESS. Portfolio management begins by screening for stocks whose
price-to-earnings ratios are below the average for the S&P 500 Index. Portfolio
management then compares a company's stock price to its book value, cash flow
and yield, and analyzes individual companies to identify those that are
financially sound and appear to have strong potential for long-term growth.
Portfolio management assembles the fund's portfolio from among the most
attractive stocks, drawing on an analysis of economic outlooks for various
sectors and industries.
Portfolio management will normally sell a stock when it believes the stock's
price is unlikely to go higher, its fundamental factors have changed, other
investments offer better opportunities or in the course of adjusting its
emphasis on a given industry.
--------------------------------------------------------------------------------
DERIVATIVES. The fund may use various types of derivatives (contracts whose
value is based on, for example, indices, currencies or securities) for hedging,
risk management or non-hedging purposes to seek to enhance potential gains. The
fund may use derivatives as a substitute for direct investment in a particular
asset class or to keep cash on hand to meet shareholder redemptions or other
needs. In particular, the fund may use futures, currency options and forward
currency transactions.
SECURITIES LENDING. The fund may lend securities (up to one-third of total
assets) to approved institutions.
--------------------------------------------------------------------------------
MAIN RISKS
There are several risk factors that could hurt the fund's performance, cause
you to lose money or cause the fund's performance to trail that of other
investments.
STOCK MARKET RISK. When stock prices fall, you should expect the value of your
investment to fall as well. Stock prices can be hurt by poor management on the
part of the stock's issuer, shrinking product demand and other business risks.
These may affect single companies as well as groups of companies. In addition,
movements in financial markets may adversely affect a stock's price, regardless
of how well the company performs. To the extent the fund invests in a
particular capitalization or market sector, the fund's performance may be
proportionately affected by that segment's general performance.
SECURITY SELECTION RISK. The securities in the fund's portfolio may decline in
value. Portfolio management could be wrong in its analysis of industries,
companies, economic trends, the relative attractiveness of different securities
or other matters.
VALUE INVESTING RISK. As a category, value stocks may underperform growth
stocks (and the stock market as a whole) over any period of time. In addition,
value stocks selected for investment by portfolio management may not perform as
anticipated: stocks that appear undervalued may remain undervalued
indefinitely, or may in fact be fairly valued.
FOCUS RISK. To the extent that the fund focuses its investments in particular
industries, asset classes or sectors of the economy, any market price
movements, regulatory or technological changes, or economic conditions
affecting companies in those industries, asset classes or sectors will have a
significant impact on the fund's performance. For example, consumer goods
companies could be hurt by a rise in unemployment or technology companies could
be hurt by such factors as market saturation, price competition and rapid
obsolescence.
DERIVATIVES RISK. Risks associated with derivatives include the risk that the
derivative is not well correlated with the security, index or currency to which
it relates; the risk that derivatives may result in losses or missed
opportunities; the risk that the fund will be unable to sell the derivative
because of an illiquid secondary market; the risk that a counterparty is
unwilling or unable to meet its obligation; and the risk that the derivative
transaction could expose the fund to the effects of leverage, which could
increase the fund's exposure to the market and magnify potential losses. There
is no guarantee that derivatives, to the extent employed, will have the
intended effect, and their use could cause lower returns or even losses to the
fund. The use of derivatives by the fund to hedge risk may reduce the
opportunity for gain by offsetting the positive effect of favorable price
movements.
SECURITIES LENDING RISK. Any decline in the value of a portfolio security that
occurs while the security is out on loan is borne by the fund, and will
adversely affect performance. Also, there may be delays in recovery of
securities loaned or even a loss of rights in the collateral should the
borrower of the securities fail financially while holding the security.
43
PROSPECTUS May 1, 2010 Fund Details
FOREIGN INVESTMENT RISK. To the extent the fund invests in companies based
outside the US, it faces the risks inherent in foreign investing. Adverse
political, economic or social developments could undermine the value of the
fund's investments or prevent the fund from realizing their full value.
Financial reporting standards for companies based in foreign markets differ
from those in the US. Additionally, foreign securities markets generally are
smaller and less liquid than US markets. To the extent that the fund invests in
non-US dollar denominated foreign securities, changes in currency exchange
rates may affect the US dollar value of foreign securities or the income or
gain received on these securities. Foreign governments may restrict investment
by foreigners, limit withdrawal of trading profit or currency from the country,
restrict currency exchange or seize foreign investments. The investments of the
fund may also be subject to foreign withholding taxes. Foreign transactions and
custody of assets may involve delays in payment, delivery or recovery of money
or investments. Foreign investment risks are greater in emerging markets than
in developed markets. Emerging market investments are often considered
speculative. Emerging market countries typically have economic and political
systems that are less developed, and can be expected to be less stable than
developed markets. For example, the economies of such countries can be subject
to rapid and unpredictable rates of inflation or deflation.
COUNTERPARTY RISK. A financial institution or other counterparty with whom the
fund does business (such as trading or securities lending), or that
underwrites, distributes or guarantees any investments or contracts that the
fund owns or is otherwise exposed to, may decline in financial health and
become unable to honor its commitments. This could cause losses for the fund or
could delay the return or delivery of collateral or other assets to the fund.
LIQUIDITY RISK. In certain situations, it may be difficult or impossible to
sell an investment in an orderly fashion at an acceptable price. This risk can
be ongoing for any security that does not trade actively or in large volumes,
for any security that trades primarily on smaller markets, and for investments
that typically trade only among a limited number of large investors (such as
certain types of derivatives or restricted securities). In unusual market
conditions, even normally liquid securities may be affected by a degree of
liquidity risk. This may affect only certain securities or an overall
securities market.
PRICING RISK. If market conditions make it difficult to value some investments,
the fund may value these investments using more subjective methods, such as
fair value pricing. In such cases, the value determined for an investment could
be different than the value realized upon such investment's sale. As a result,
you could pay more than the market value when buying fund shares or receive
less than the market value when selling fund shares.
--------------------------------------------------------------------------------
DWS Strategic Value VIP
PRINCIPAL INVESTMENT STRATEGY
Under normal circumstances, the fund invests at least 80% of net assets, plus
the amount of any borrowings for investment purposes, in equity securities
(mainly common stocks). The fund focuses on stocks of large US companies that
are similar in size to the companies in the S&P 500 Index and that portfolio
management believes are undervalued. The fund intends to invest primarily in
companies whose market capitalizations fall within the normal range of the S&P
500 Index. Although the fund can invest in stocks of any economic sector (which
is comprised of two or more industries), at times it may emphasize one or more
sectors and may invest more than 25% of total assets in a single sector.
The fund may invest up to 20% of net assets in foreign securities, including US
dollar-denominated American Depository Receipts.
The fund's equity investments are mainly common stocks, but may also include
other types of equities such as preferred or convertible stocks. Portfolio
management seeks to invest in a diversified portfolio normally consisting of
approximately 60-80 stocks.
MANAGEMENT PROCESS. Portfolio management begins by comparing a company's stock
price to its book value, cash flow, earnings and sales and analyzing individual
companies to identify those that are financially sound and appear to have
strong potential for long-term growth and income.
Portfolio management assembles the fund's portfolio from among the most
attractive stocks, drawing on an analysis of economic outlooks for various
sectors and industries.
Portfolio management employs a disciplined sell strategy and will normally sell
a stock when it reaches a target price, its fundamental factors have changed or
when other investments offer better opportunities.
--------------------------------------------------------------------------------
DERIVATIVES. The fund may use various types of derivatives (contracts whose
value is based on, for example, indices, currencies or securities) for hedging,
risk management or non-hedging purposes to seek to enhance potential gains. The
fund may use derivatives as a substitute for direct investment in a particular
asset class or to keep cash on hand to meet shareholder redemptions or other
needs. In particular, the fund may use futures, currency options and forward
currency transactions.
SECURITIES LENDING. The fund may lend securities (up to one-third of total
assets) to approved institutions.
--------------------------------------------------------------------------------
MAIN RISKS
There are several risk factors that could hurt the fund's performance, cause
you to lose money or cause the fund's performance to trail that of other
investments.
44
PROSPECTUS May 1, 2010 Fund Details
STOCK MARKET RISK. When stock prices fall, you should expect the value of your
investment to fall as well. Stock prices can be hurt by poor management on the
part of the stock's issuer, shrinking product demand and other business risks.
These may affect single companies as well as groups of companies. In addition,
movements in financial markets may adversely affect a stock's price, regardless
of how well the company performs. To the extent the fund invests in a
particular capitalization or market sector, the fund's performance may be
proportionately affected by that segment's general performance.
SECURITY SELECTION RISK. The securities in the fund's portfolio may decline in
value. Portfolio management could be wrong in its analysis of industries,
companies, economic trends, the relative attractiveness of different securities
or other matters.
VALUE INVESTING RISK. As a category, value stocks may underperform growth
stocks (and the stock market as a whole) over any period of time. In addition,
value stocks selected for investment by portfolio management may not perform as
anticipated: stocks that appear undervalued may remain undervalued
indefinitely, or may in fact be fairly valued.
FOCUS RISK. To the extent that the fund focuses its investments in particular
industries, asset classes or sectors of the economy, any market price
movements, regulatory or technological changes, or economic conditions
affecting companies in those industries, asset classes or sectors will have a
significant impact on the fund's performance. For example, consumer goods
companies could be hurt by a rise in unemployment or technology companies could
be hurt by such factors as market saturation, price competition and rapid
obsolescence.
DERIVATIVES RISK. Risks associated with derivatives include the risk that the
derivative is not well correlated with the security, index or currency to which
it relates; the risk that derivatives may result in losses or missed
opportunities; the risk that the fund will be unable to sell the derivative
because of an illiquid secondary market; the risk that a counterparty is
unwilling or unable to meet its obligation; and the risk that the derivative
transaction could expose the fund to the effects of leverage, which could
increase the fund's exposure to the market and magnify potential losses. There
is no guarantee that derivatives, to the extent employed, will have the
intended effect, and their use could cause lower returns or even losses to the
fund. The use of derivatives by the fund to hedge risk may reduce the
opportunity for gain by offsetting the positive effect of favorable price
movements.
SECURITIES LENDING RISK. Any decline in the value of a portfolio security that
occurs while the security is out on loan is borne by the fund, and will
adversely affect performance. Also, there may be delays in recovery of
securities loaned or even a loss of rights in the collateral should the
borrower of the securities fail financially while holding the security.
FOREIGN INVESTMENT RISK. To the extent the fund invests in companies based
outside the US, it faces the risks inherent in foreign investing. Adverse
political, economic or social developments could undermine the value of the
fund's investments or prevent the fund from realizing their full value.
Financial reporting standards for companies based in foreign markets differ
from those in the US. Additionally, foreign securities markets generally are
smaller and less liquid than US markets. To the extent that the fund invests in
non-US dollar denominated foreign securities, changes in currency exchange
rates may affect the US dollar value of foreign securities or the income or
gain received on these securities. Foreign governments may restrict investment
by foreigners, limit withdrawal of trading profit or currency from the country,
restrict currency exchange or seize foreign investments. The investments of the
fund may also be subject to foreign withholding taxes. Foreign transactions and
custody of assets may involve delays in payment, delivery or recovery of money
or investments. Foreign investment risks are greater in emerging markets than
in developed markets. Emerging market investments are often considered
speculative. Emerging market countries typically have economic and political
systems that are less developed, and can be expected to be less stable than
developed markets. For example, the economies of such countries can be subject
to rapid and unpredictable rates of inflation or deflation.
COUNTERPARTY RISK. A financial institution or other counterparty with whom the
fund does business (such as trading or securities lending), or that
underwrites, distributes or guarantees any investments or contracts that the
fund owns or is otherwise exposed to, may decline in financial health and
become unable to honor its commitments. This could cause losses for the fund or
could delay the return or delivery of collateral or other assets to the fund.
LIQUIDITY RISK. In certain situations, it may be difficult or impossible to
sell an investment in an orderly fashion at an acceptable price. This risk can
be ongoing for any security that does not trade actively or in large volumes,
for any security that trades primarily on smaller markets, and for investments
that typically trade only among a limited number of large investors (such as
certain types of derivatives or restricted securities). In unusual market
conditions, even normally liquid securities may be affected by a degree of
liquidity risk. This may affect only certain securities or an overall
securities market.
PRICING RISK. If market conditions make it difficult to value some investments,
the fund may value these investments using more subjective methods, such as
fair value pricing. In such cases, the value determined for an investment could
be different than the value realized upon such investment's sale. As a result,
you could pay more than the market value when buying fund shares or receive
less than the market value when selling fund shares.
45
PROSPECTUS May 1, 2010 Fund Details
--------------------------------------------------------------------------------
DWS Technology VIP
PRINCIPAL INVESTMENT STRATEGY
MAIN INVESTMENTS. Under normal circumstances, the fund invests at least 80% of
net assets, plus the amount of any borrowings for investment purposes, in
common stocks of companies in the technology sector. For purposes of the fund's
80% investment policy, the fund defines a company as being in the technology
sector if it commits at least half its assets to, or derives at least half its
revenues or net income from, that sector. Examples of industries within the
technology sector are semiconductors, software, telecom equipment,
computer/hardware, IT services, the Internet and health technology. The fund
may invest in companies of any size and may invest in initial public offerings.
While the fund invests mainly in US stocks, it could invest up to 35% of net
assets in foreign securities (including emerging markets securities).
The fund's equity investments are mainly common stocks, but may also include
other types of equities such as preferred stocks or convertible securities.
MANAGEMENT PROCESS. In choosing securities, portfolio management uses a
combination of three analytical disciplines:
BOTTOM-UP RESEARCH. Portfolio management looks for individual companies with a
history of above-average growth, strong competitive positioning, attractive
prices relative to potential growth, innovative products and services, sound
financial strength and effective management, among other factors.
GROWTH ORIENTATION. Portfolio management generally looks for companies that
they believe have above-average potential for sustainable growth of revenue or
earnings and whose market value appears reasonable in light of their business
prospects.
TOP-DOWN ANALYSIS. Portfolio management considers the economic outlooks for
various industries within the technology sector and looks for those that may
benefit from changes in the overall business environment.
In addition, portfolio management uses quantitative analytic tools to attempt
to manage the price volatility of the fund as compared to appropriate
benchmarks and peer groups. Portfolio management may favor securities from
various industries and companies within the technology sector at different
times.
Portfolio management will normally sell a stock when they believe its price is
unlikely to go higher, its fundamentals have changed, other investments offer
better opportunities, or in adjusting their emphasis on a given technology
industry.
--------------------------------------------------------------------------------
DERIVATIVES. The fund may use various types of derivatives for hedging, risk
management or non-hedging purposes to seek to enhance potential gains. The fund
may use derivatives as a substitute for direct investment in a particular asset
class or to keep cash on hand to meet shareholder redemptions or other needs.
In particular, portfolio management may use futures and options, including
sales of covered put and call options.
SECURITIES LENDING. The fund may lend securities (up to one-third of total
assets) to approved institutions.
--------------------------------------------------------------------------------
MAIN RISKS
There are several risk factors that could reduce the yield you get from the
fund, cause the fund's performance to trail that of other investments, or cause
you to lose money.
STOCK MARKET RISK. To the extent the fund invests in a particular sector, the
fund's performance may be proportionately affected by that sector's general
performance. When stock prices fall, you should expect the value of your
investment to fall as well. Stock prices can be hurt by poor management on the
part of the stock's issuer, shrinking product demand and other business risks.
These may affect single companies as well as groups of companies. In addition,
movements in financial markets may adversely affect a stock's price, regardless
of how well the company performs. The market as a whole may not favor the types
of investments the fund makes, which could affect the fund's ability to sell
them at an attractive price.
CONCENTRATION RISK - TECHNOLOGY COMPANIES. Any fund that concentrates in a
particular segment of the market will generally be more volatile than a fund
that invests more broadly. Any market price movements, regulatory or
technological changes, or economic conditions affecting technology companies
will have a significant impact on the fund's performance. In particular,
technology companies are vulnerable to market saturation and rapid product
obsolescence. Many technology companies are smaller companies that may have
limited business lines and limited financial resources, making them highly
vulnerable to business and economic risks.
SMALL COMPANY RISK. Small company stocks tend to be more volatile than large
company stocks. Small companies are less widely followed by stock analysts and
less information about them is available to investors. Industry-wide reversals
may have a greater impact on small companies, since they lack the financial
resources of larger companies. Small company stocks are typically less liquid
than large company stocks.
FOREIGN INVESTMENT RISK. To the extent the fund invests in companies based
outside the US, it faces the risks inherent in foreign investing. Adverse
political, economic or social developments could undermine the value of the
fund's investments or prevent the fund from realizing their full value.
Financial reporting standards for companies based in foreign markets differ
from those in the US. Additionally, foreign securities markets generally are
smaller
46
PROSPECTUS May 1, 2010 Fund Details
and less liquid than US markets. To the extent that the fund invests in non-US
dollar denominated foreign securities, changes in currency exchange rates may
affect the US dollar value of foreign securities or the income or gain received
on these securities. Foreign governments may restrict investment by foreigners,
limit withdrawal of trading profit or currency from the country, restrict
currency exchange or seize foreign investments. The investments of the fund may
also be subject to foreign withholding taxes. Foreign transactions and custody
of assets may involve delays in payment, delivery or recovery of money or
investments. Foreign investment risks are greater in emerging markets than in
developed markets. Emerging market investments are often considered
speculative. Emerging market countries typically have economic and political
systems that are less developed, and can be expected to be less stable than
developed markets. For example, the economies of such countries can be subject
to rapid and unpredictable rates of inflation or deflation.
PRICING RISK. If market conditions make it difficult to value some investments,
the fund may value these investments using more subjective methods, such as
fair value pricing. In such cases, the value determined for an investment could
be different than the value realized upon such investment's sale. As a result,
you could pay more than the market value when buying fund shares or receive
less than the market value when selling fund shares.
NON-DIVERSIFICATION RISK. The fund is classified as non-diversified under the
Investment Company Act of 1940, as amended. This means that the fund may invest
in securities of relatively few issuers. Thus, the performance of one or a
small number of portfolio holdings can affect overall performance.
SECURITY SELECTION RISK. The securities in the fund's portfolio may decline in
value. Portfolio management could be wrong in its analysis of industries,
companies, economic trends, the relative attractiveness of different securities
or other matters.
DERIVATIVES RISK. Risks associated with derivatives include the risk that the
derivative is not well correlated with the security, index or currency to which
it relates; the risk that derivatives may result in losses or missed
opportunities; the risk that the fund will be unable to sell the derivative
because of an illiquid secondary market; the risk that a counterparty is
unwilling or unable to meet its obligation; and the risk that the derivative
transaction could expose the fund to the effects of leverage, which could
increase the fund's exposure to the market and magnify potential losses. There
is no guarantee that derivatives, to the extent employed, will have the
intended effect, and their use could cause lower returns or even losses to the
fund. The use of derivatives by the fund to hedge risk may reduce the
opportunity for gain by offsetting the positive effect of favorable price
movements.
SECURITIES LENDING RISK. Any decline in the value of a portfolio security that
occurs while the security is out on loan is borne by the fund, and will
adversely affect performance. Also, there may be delays in recovery of
securities loaned or even a loss of rights in the collateral should the
borrower of the securities fail financially while holding the security.
COUNTERPARTY RISK. A financial institution or other counterparty with whom the
fund does business (such as trading or securities lending), or that
underwrites, distributes or guarantees any investments or contracts that the
fund owns or is otherwise exposed to, may decline in financial health and
become unable to honor its commitments. This could cause losses for the fund or
could delay the return or delivery of collateral or other assets to the fund.
GROWTH INVESTING RISK. As a category, growth stocks may underperform value
stocks (and the stock market as a whole) over any period of time. Because the
prices of growth stocks are based largely on the expectation of future
earnings, growth stock prices can decline rapidly and significantly in reaction
to negative news about such factors as earnings, the economy, political
developments, or other news. A growth company may fail to fulfill apparent
promise or may be eclipsed by competitors or its products or services rendered
obsolete by new technologies. Growth stocks also typically lack the dividends
associated with value stocks that might otherwise cushion investors from the
effects of declining stock prices. In addition, growth stocks selected for
investment by portfolio management may not perform as anticipated.
IPO RISK. Prices of securities bought in an initial public offering (IPO) may
rise and fall rapidly, often because of investor perceptions rather than
economic reasons. IPOs can have more impact on the performance of a small
mutual fund because the number of IPO shares the fund is able to buy may
represent a significant portion of its overall portfolio compared to the
portfolio of a larger fund.
LIQUIDITY RISK. In certain situations, it may be difficult or impossible to
sell an investment in an orderly fashion at an acceptable price. This risk can
be ongoing for any security that does not trade actively or in large volumes,
for any security that trades primarily on smaller markets, and for investments
that typically trade only among a limited number of large investors (such as
certain types of derivatives or restricted securities). In unusual market
conditions, even normally liquid securities may be affected by a degree of
liquidity risk. This may affect only certain securities or an overall
securities market.
OTHER POLICIES AND RISKS
While the previous pages describe the main points of each fund's strategy and
risks, there are a few other matters to know about:
47
PROSPECTUS May 1, 2010 Fund Details
o Although major changes tend to be infrequent, each fund's Board could change
a fund's investment objective without seeking shareholder approval.
However, the Board of DWS Blue Chip VIP, DWS Dreman Small Mid Cap Value
VIP, DWS Global Thematic VIP, DWS Government & Agency Securities VIP, DWS
Large Cap Value VIP, DWS Strategic Value VIP and DWS Technology VIP will
provide shareholders with at least 60 days notice prior to making any
changes to the fund's 80% investment policy as described herein.
o When in the Advisor's opinion it is advisable to adopt a temporary defensive
position because of unusual and adverse or other market conditions, up to
100% of each fund's assets may be held in cash or invested in money market
securities or other short-term investments. Short-term investments consist
of (1) foreign and domestic obligations of sovereign governments and their
agencies and instrumentalities, authorities and political subdivisions; (2)
other short-term rated debt securities or, if unrated, determined to be of
comparable quality in the opinion of the Advisor; (3) commercial paper; (4)
bank obligations, including negotiable certificates of deposit, time
deposits and bankers' acceptances; and (5) repurchase agreements.
Short-term investments may also include shares of money market mutual
funds. This could prevent losses, but, while engaged in a temporary
defensive position, a fund will not be pursuing its investment objective.
However, portfolio management may choose not to use these strategies for
various reasons, even in volatile market conditions.
o Portfolio management measures credit quality at the time it buys securities,
using independent rating agencies or, for unrated securities, its own
judgment. All securities must meet the credit quality standards applied by
portfolio management at the time they are purchased. If a security's credit
quality changes, portfolio management will decide what to do with the
security, based on its assessment of what would most benefit a fund.
o Certain DWS fund-of-funds are permitted to invest in other DWS funds. As a
result, a fund may have large inflows or outflows of cash from time to
time. This could have adverse effects on a fund's performance if a fund
were required to sell securities or invest cash at times when it otherwise
would not do so. This activity could also accelerate the realization of
capital gains and increase a fund's transaction costs.
FOR MORE INFORMATION
This prospectus doesn't tell you about every policy or risk of investing in
each fund.
If you want more information on each fund's allowable securities and investment
practices and the characteristics and risks of each one, you may want to
request a copy of the Statement of Additional Information (the back cover tells
you how to do this).
Keep in mind that there is no assurance that a fund will achieve its investment
objective.
A complete list of each fund's portfolio holdings as of the month-end is posted
on www.dws-investments.com on or about the 15th day of the following month.
More frequent posting of portfolio holdings information may be made from time
to time on www.dws-investments.com. The posted portfolio holdings information
is available by fund and generally remains accessible at least until the date
on which a fund files its Form N-CSR or N-Q with the Securities and Exchange
Commission for the period that includes the date as of which the posted
information is current. Each fund's Statement of Additional Information
includes a description of a fund's policies and procedures with respect to the
disclosure of a fund's portfolio holdings.
WHO MANAGES AND OVERSEES THE FUNDS
THE INVESTMENT ADVISOR
Deutsche Investment Management Americas Inc. ("DIMA" or the "Advisor"), with
headquarters at 345 Park Avenue, New York, NY 10154, is the investment advisor
for each fund. Under the oversight of the Board, the Advisor, a subadvisor or a
sub-subadvisor, makes investment decisions, buys and sells securities for each
fund and conducts research that leads to these purchase and sale decisions. The
Advisor provides a full range of global investment advisory services to
institutional and retail clients.
DWS Investments is part of the Asset Management division of Deutsche Bank AG
and, within the US, represents the retail asset management activities of
Deutsche Bank AG, Deutsche Bank Trust Company Americas, DIMA and DWS Trust
Company.
Deutsche Asset Management is a global asset management organization that offers
a wide range of investing expertise and resources, including hundreds of
portfolio managers and analysts and an office network that reaches the world's
major investment centers. This well-resourced global investment platform brings
together a wide variety of experience and investment insight across industries,
regions, asset classes and investing styles.
The Advisor is an indirect, wholly owned subsidiary of Deutsche Bank AG.
Deutsche Bank AG is a major global banking institution that is engaged in a
wide range of financial services, including investment management, mutual
funds, retail, private and commercial banking, investment banking and
insurance.
For DWS Alternative Asset Allocation Plus VIP, the Advisor and its affiliates
earn fees at varying rates for providing services to the underlying DWS funds.
The Advisor may therefore have a conflict of interest in selecting the
underlying DWS funds and in determining whether to invest in an ETF, from which
it will not receive any fees. However,
48
PROSPECTUS May 1, 2010 Fund Details
the Advisor is a fiduciary to the fund and will select investments that it
believes are best suited to meet the fund's investment objective.
MANAGEMENT FEE. The Advisor receives a management fee from each fund. Below are
the management rates paid by each fund for the most recent fiscal year, as a
percentage of each fund's average daily net assets:
FUND NAME FEE PAID
------------------------------ --------------------
DWS Alternative Asset Alloca-
tion Plus VIP 0.00%(*, **)
------------------------------ --------------
DWS Blue Chip VIP 0.55%
------------------------------ ------
DWS Dreman Small Mid Cap
Value VIP 0.65%
------------------------------ ------
DWS Global Thematic VIP 0.57%(**)
------------------------------ ------
DWS Government & Agency
Securities VIP 0.45%
------------------------------ ------
DWS High Income VIP 0.50%
------------------------------ ------
DWS Large Cap Value VIP 0.65%
------------------------------ ------
DWS Strategic Value VIP 0.62%(**)
------------------------------ ------
DWS Technology VIP 0.665%
------------------------------ ------
* Management fee has two components: (i) a fee on assets invested in other
DWS funds; and (ii) a fee on assets not invested in other DWS funds
("Other Assets"). The Advisor currently intends to invest substantially
all the assets of the fund in other DWS funds. However, in the future,
the fund may invest a larger portion, or all, of its assets in Other
Assets. If the fund's assets are entirely invested in Other Assets, the
management fee would be 1.20% of average daily net assets. However, in
such a situation, the Acquired Fund (Underlying Fund) Fees and Expense
are expected to decrease. The Advisor will waive 0.15% of the management
fee until the fund reaches $50 million in assets and the iGAP strategy is
implemented.
** Reflects the effect of expense limitations and/or fee waivers then in
effect.
For DWS Global Thematic VIP, the Advisor has contractually agreed through
September 30, 2010 to waive and/or reimburse fund expenses to the extent
necessary to maintain the fund's total annual operating expenses at 1.46% for
Class B. The agreement may only be terminated with the consent of the fund's
Board and does not extend to extraordinary expenses, taxes, brokerage and
interest expense.
For DWS High Income VIP, the Advisor has contractually agreed through September
30, 2010 to waive and/or reimburse fund expenses to the extent necessary to
maintain the fund's total annual operating expenses at 1.25% for Class B. The
agreement may only be terminated with the consent of the fund's Board and does
not extend to extraordinary expenses, taxes, brokerage and interest expense.
For DWS Large Cap Value VIP, the Advisor has contractually agreed through
September 30, 2010 to waive and/or reimburse fund expenses to the extent
necessary to maintain the fund's total annual operating expenses at 1.28% for
Class B. The agreement may only be terminated with the consent of the fund's
Board and does not extend to extraordinary expenses, taxes, brokerage and
interest expense.
A discussion regarding the basis for the Board renewal of each fund's
investment management agreement and, as applicable, subadvisory agreement, is
contained in the shareholder report for the annual period ended December 31
(see "Shareholder reports" on the back cover).
Under a separate administrative services agreement between each fund and the
Advisor, each fund pays the Advisor a fee of 0.10% for providing most of each
fund's administrative services.
FOR DWS ALTERNATIVE ASSET ALLOCATION PLUS VIP AND DWS BLUE CHIP VIP ONLY.
On January 26, 2010, the Advisor announced its intention to transition members
of the portfolio management team for DWS Alternative Asset Allocation Plus VIP
and DWS Blue Chip VIP who are part of its Quantitative Strategies Group out of
the Advisor into a separate independent investment advisory firm that is not
affiliated with the Advisor, known as QS Investors Holdings, LLC ("QS
Investors"). In order for DWS Alternative Asset Allocation Plus VIP and DWS
Blue Chip VIP to continue to benefit from the investment expertise offered by
the affected portfolio managers, the Advisor has recommended to the Board the
approval of a sub-advisory agreement between the Advisor and the newly created
investment advisory firm (the "Sub-Advisory Agreement"). The Sub-Advisory
Agreement is subject to Board approval. If the Board approves the Sub-Advisory
Agreement, it is expected that QS Investors will become the Subadvisor for DWS
Alternative Asset Allocation Plus VIP and DWS Blue Chip VIP.
QS Investors, 880 Third Avenue, New York, NY 10022, is an investment advisor
registered under the Investment Advisers Act of 1940, as amended. Under the
oversight of the Advisor and the Board, QS Investors would provide global
expertise in research, portfolio management and quantitative analysis. QS
Investors manages assets across multiple strategies, including: Global Tactical
Asset Allocation & Active Currency (iGAP), US Active Quantitative Equity (AQE),
International and Global Equity (Diversification Based Investing/DBI) and
Multi-Asset/Strategic Asset Allocation (SAA). QS Investors would make
investment decisions, buy and sell securities for DWS Alternative Asset
Allocation Plus VIP and DWS Blue Chip VIP and would conduct research that leads
to these purchase and sale decisions. The Advisor would compensate QS Investors
out of the management fee it receives from DWS Alternative Asset Allocation
Plus VIP and DWS Blue Chip VIP.
FOR DWS GLOBAL THEMATIC VIP ONLY.
On January 26, 2010, the Advisor also announced its intention to transition
members of the portfolio management team for DWS Global Thematic VIP, who are
part of its Global Equity Team, out of the Advisor into a separate independent
investment advisory firm that is not affiliated with the Advisor, known as
Global Thematic Partners Holdings, LLC ("Global Thematic Partners"). In order
for DWS
49
PROSPECTUS May 1, 2010 Fund Details
Global Thematic VIP to continue to benefit from the investment expertise
offered by the affected portfolio managers, the Advisor has recommended to the
Board the approval of a sub-advisory agreement between the Advisor and the
newly created investment advisory firm (the "Sub-Advisory Agreement"). The
Sub-Advisory Agreement is subject to Board approval. If the Board approves the
Sub-Advisory Agreement, it is expected that Global Thematic Partners will
become the Subadvisor for DWS Global Thematic VIP.
Global Thematic Partners, 681 Fifth Avenue, New York, NY 10022, is an
investment advisor registered under the Investment Advisers Act of 1940, as
amended. Under the oversight of the Advisor and the Board, Global Thematic
Partners would make investment decisions, buy and sell securities for DWS
Global Thematic VIP and would conduct research that leads to these purchase and
sale decisions. The Advisor would compensate Global Thematic Partners out of
the management fee it receives from DWS Global Thematic VIP.
SUBADVISOR AND SUB-SUBADVISORS FOR DWS ALTERNATIVE ASSET ALLOCATION PLUS VIP
RREEF America L.L.C. ("RREEF"), an investment advisor registered with the SEC,
is located at 875 N. Michigan Avenue, Chicago, Illinois 60611. RREEF is an
indirect wholly owned subsidiary of Deutsche Bank AG. RREEF has provided real
estate investment management services to institutional investors since 1975
across a diversified portfolio of industrial properties, office buildings,
residential apartments and shopping centers. RREEF has also been an investment
advisor of real estate securities since 1993.
Deutsche Investments Australia Limited ("DIAL"), is located at Level 16,
Deutsche Bank Place, Corner of Hunter and Phillip Streets, Sydney NSW 2000,
Australia. DIAL is an indirect wholly owned subsidiary of Deutsche Bank AG.
DIAL serves as both subadvisor for mutual funds and investment advisor for
certain institutional accounts.
RREEF Global Advisers Limited ("RGAL"), is located at Winchester House, 1 Great
Winchester Street, London, United Kingdom, EC2N 2DB. RGAL is an indirect wholly
owned subsidiary of Deutsche Bank AG.
Deutsche Asset Management (Hong Kong) Limited ("DeAM Hong Kong"), is located at
48/F Cheung Kong Center, 2 Queen's Road Central, Hong Kong, China. DeAM Hong
Kong is an indirect wholly owned subsidiary of Deutsche Bank AG.
The subadvisor and sub-subadvisors provide investment advisory and management
services to the portions of DWS Alternative Asset Allocation Plus VIP's
portfolio allocated to direct investments in global real estate and global
infrastructure (as described below). The subadvisor and each sub-subadvisor
makes investment decisions, buy and sells securities for the portfolio and
conducts research that leads to purchase and sale decisions. The Advisor pays a
fee to the subadvisor pursuant to an investment subadvisory agreement between
the Advisor and the subadvisor. The sub-subadvisors are paid for their sub-
subadvisory services by the subadvisor, from the subadvisor's subadvisory fee
paid by the Advisor to the subadvisor.
RREEF provides subadvisory services in connection with direct investments in
global real estate and global infrastructure securities. With respect to global
real estate and global infrastructure securities, RGAL provides sub-subadvisory
services related to European securities, DeAM Hong Kong provides
sub-subadvisory services related to Asian securities and DIAL provides sub-
subadvisory services related to Australian securities.
SUBADVISOR FOR DWS LARGE CAP VALUE VIP
The subadvisor for DWS Large Cap Value VIP is Deutsche Asset Management
International GmbH ("DeAMi"), Mainzer Landstrasse 178-190, Frankfurt am Main,
Germany. DeAMi renders investment advisory and management services to DWS Large
Cap Value VIP and to a portion of DWS Balanced VIP's large cap value
allocation. DeAMi is an investment advisor registered with the Securities and
Exchange Commission, whose assets under management are currently comprised of
institutional accounts and investment companies. DeAMi is a subsidiary of
Deutsche Bank AG. DIMA compensates DeAMi out of the management fee it receives
from the fund.
SUBADVISOR FOR DWS DREMAN SMALL MID CAP VALUE VIP
The subadvisor for DWS Dreman Small Mid Cap Value VIP is Dreman Value
Management, L.L.C. ("DVM"), 520 East Cooper Avenue, Suite 230-4, Aspen, CO
81611. DVM was founded in 1977 and currently manages over $4.7 billion in
assets, which is primarily comprised of investment companies. Pursuant to a
subadvisory agreement with DIMA, DVM performs some of the functions of the
Advisor, including making each fund's investment decisions and buying and
selling securities for each fund. DIMA compensates DVM for its services.
MULTI-MANAGER STRUCTURE. The Advisor, subject to the approval of the Board, has
ultimate responsibility to recommend the hiring, termination and replacement of
subadvisors. Each fund and the Advisor have received an order from the SEC that
allows each fund and the Advisor to utilize a multi-manager structure in
managing each fund's assets. Pursuant to the SEC order, the Advisor, with the
approval of each fund's Board, is permitted to select subadvisors that are not
affiliates of the Advisor ("non-affiliated subadvisors") to manage all or a
portion of each fund's assets without obtaining shareholder approval. The
Advisor also has the discretion to terminate any subadvisor and allocate and
reallocate each fund's assets among any non-affiliated subadvisors. The SEC
order also permits the Advisor, subject to the approval of the Board, to
materially amend an existing subadvisory agreement with a non-affiliated
subadvisor without shareholder approval. Each
50
PROSPECTUS May 1, 2010 Fund Details
fund and the Advisor are subject to the conditions imposed by the SEC order,
including the condition that within 90 days of hiring of a new non-affiliated
subadvisor, each fund will provide shareholders with an information statement
containing information about the new non-affiliated subadvisor.
Each fund and the Advisor have also filed an exemptive application with the SEC
requesting an order that would extend the relief granted with respect to
non-affiliated subadvisors to certain subadvisors that are affiliates of the
Advisor ("affiliated subadvisors"). If such relief is granted by the SEC, the
Advisor, with the approval of each fund's Board, would be able to hire
non-affiliated and/or affiliated subadvisors to manage all or a portion of each
fund's assets without obtaining shareholder approval. The Advisor would also
have the discretion to terminate any subadvisor and allocate and reallocate
each fund's assets among any other subadvisors (including terminating a
non-affiliated subadvisor and replacing them with an affiliated subadvisor).
The Advisor, subject to the approval of the Board, would also be able to
materially amend an existing subadvisory agreement with any such subadvisor
without shareholder approval. There can be no assurance that such relief will
be granted by the SEC. Each fund and the Advisor will be subject to any new
conditions imposed by the SEC.
MANAGEMENT
DWS ALTERNATIVE ASSET ALLOCATION PLUS VIP
ROBERT WANG, MANAGING DIRECTOR. Portfolio Manager of the fund. Joined the fund
in 2009.
o Joined Deutsche Asset Management in 1995 as portfolio manager for asset
allocation after 13 years of experience of trading fixed income, foreign
exchange and derivative products at J.P. Morgan.
o Global Head of Quantitative Strategies Portfolio Management: New York.
o BS, The Wharton School, University of Pennsylvania.
INNA OKOUNKOVA, DIRECTOR. Portfolio Manager of the fund. Joined the fund in
2009.
o Joined Deutsche Asset Management in 1999 as a quantitative analyst, becoming
an associate portfolio manager in 2001.
o Lead Portfolio Manager for Asset Allocation Strategies: New York.
o MS, Moscow State University; MBA, University of Chicago - Graduate School of
Business.
THOMAS PICCIOCHI, DIRECTOR. Portfolio Manager of the fund. Joined the fund in
2009.
o Joined Deutsche Asset Management in 1999, formerly serving as portfolio
manager for Absolute Return Strategies, after 13 years of experience in
various research and analysis positions at State Street Global Advisors,
FPL Energy, Barnett Bank, Trade Finance Corporation and Reserve Financial
Management.
o Senior Portfolio Manager for Quantitative Strategies: New York.
o BA and MBA, University of Miami.
DWS BLUE CHIP VIP
ROBERT WANG, MANAGING DIRECTOR. Portfolio Manager of the fund. Joined the fund
in 2003.
o Joined Deutsche Asset Management in 1995 as portfolio manager for asset
allocation after 13 years of experience of trading fixed income, foreign
exchange and derivative products at J.P. Morgan.
o Global Head of Quantitative Strategies Portfolio Management: New York.
o BS, The Wharton School, University of Pennsylvania.
RUSSELL SHTERN, CFA, VICE PRESIDENT. Portfolio Manager of the fund. Joined the
fund in 2010.
o Joined Deutsche Asset Management in 1999, previously serving as trader's
assistant supporting program, options and equity swaps trading desks.
o Portfolio manager for GrOWE and Tax Managed Equity: New York.
o BBA, Pace University.
DWS DREMAN SMALL MID CAP VALUE VIP
DAVID N. DREMAN. Chairman and Chief Investment Officer of Dreman Value
Management, L.L.C. and Lead Portfolio Manager of the fund. Joined the fund in
2002.
o Began investment career in 1957.
o Founder, Dreman Value Management, L.L.C.
E. CLIFTON HOOVER, JR. Co-Chief Investment Officer and Managing Director of
Dreman Value Management, L.L.C. and Portfolio Manager of the fund. Joined the
fund in 2006.
o Joined Dreman Value Management, L.L.C. in 2006.
o Prior to joining Dreman Value Management, L.L.C., Managing Director and a
Portfolio Manager at NFJ Investment Group since 1997.
o Over 20 years of investment industry experience.
o MS, Texas Tech University.
MARK ROACH. Managing Director of Dreman Value Management, L.L.C. and Portfolio
Manager of the fund. Joined the fund in 2006.
o Joined Dreman Value Management, L.L.C. in 2006.
o Prior to that, Portfolio Manager at Vaughan Nelson Investment Management
since 2002.
o Over 14 years of investment industry experience.
o BS, Baldwin Wallace College; MBA, University of Chicago.
DWS GLOBAL THEMATIC VIP
OLIVER KRATZ, MANAGING DIRECTOR. Portfolio Manager of the fund. Joined the fund
in 2003.
51
PROSPECTUS May 1, 2010 Fund Details
o Joined Deutsche Asset Management in 1996, having since served as portfolio
manager for European Equity Fund and Global Emerging Markets analyst for
International Equity Fund, after two years of experience at Merrill Lynch,
Brown Brothers Harriman and McKinsey & Co.; authored Frontier Emerging
Markets Securities Price Behavior and Valuation; Kluwers Academic
Publishers, 1999; member of Budapest Stock Exchange Advisory Board.
o Head of Global Thematic Equity; Co-Head of Global Agribusiness; Lead
Portfolio Manager Global Thematic Strategy: New York.
o BA, Tufts University and Karlova Universidad, Prague; MALD, Ph.D, The
Fletcher School, administered jointly by Harvard University and Tufts
University.
DWS GOVERNMENT & AGENCY SECURITIES VIP
WILLIAM CHEPOLIS, CFA, MANAGING DIRECTOR. Co-Manager of the fund. Joined the
fund in 2002.
o Joined Deutsche Asset Management in 1998 after 13 years of experience as
vice president and portfolio manager for Norwest Bank where he managed the
bank's fixed income and foreign exchange portfolios.
o Portfolio Manager for Retail Fixed Income: New York.
o BIS, University of Minnesota.
OHN CHOE, CFA, ASSOCIATE. Portfolio Manager of the fund. Joined the fund in
2010.
o Portfolio Manager for Retail Fixed Income: New York.
o Joined Deutsche Asset Management in 2005.
o BSBA, Georgetown University.
DWS HIGH INCOME VIP
GARY SULLIVAN, CFA, MANAGING DIRECTOR. Portfolio Manager of the fund. Joined
the fund in 2006.
o Joined Deutsche Asset Management in 1996. Served as the head of the High
Yield group in Europe and as an Emerging Markets portfolio manager.
o Prior to that, four years at Citicorp as a research analyst and structurer
of collateralized mortgage obligations. Prior to Citicorp, served as an
officer in the US Army from 1988 to 1991.
o BS, United States Military Academy (West Point); MBA, New York University,
Stern School of Business.
DWS LARGE CAP VALUE VIP
THOMAS SCHUESSLER, PHD., MANAGING DIRECTOR. Lead Portfolio Manager of the fund.
Joined the fund in 2007.
o Joined Deutsche Asset Management in 2001 after five years at Deutsche Bank
where he managed various projects and worked in the office of the Chairman
of the Management Board.
o US and Global Fund Management: Frankfurt.
o PhD, University of Heidelberg, studies in physics and economics at
University of Heidelberg and University of Utah.
VOLKER DOSCH, MANAGING DIRECTOR. Portfolio Manager of the fund. Joined the fund
in 2009.
o Joined Deutsche Asset Management in 1989.
o Fund Manager of US and global equity funds; Head of US Equities; Deputy Head
of Fund Management International Equities; Head of Sector-Funds: Frankfurt.
o Master's degree in Economics ("Diplom-Volkswirt") from the University of
Frankfurt, Germany.
OLIVER PFEIL, PHD., VICE PRESIDENT. Portfolio Manager of the fund. Joined the
fund in 2009.
o Joined Deutsche Asset Management in 2006 after 3 years as Executive
Assistant to the Management Board of Deutsche Bank. Previously, Research
Fellow at the Swiss Institute of Banking and Finance at the University of
St. Gallen (2000-2002); Visiting Scholar in Capital Markets Research at MIT
Sloan School of Management (2002-2003). Also, serves as part-time Lecturer
in Finance at the University of St. Gallen in Switzerland.
o Portfolio manager for US and global value equity: Frankfurt.
o PhD in finance and accounting and Master's degree in Business Administration
from the University of St. Gallen; CEMS Master in International Management
from the University of St. Gallen & ESADE, Barcelona; completed bank
training program ("Bankkaufmann") at Sal. Oppenheim jr. & Cie. KGaA,
Cologne.
DWS STRATEGIC VALUE VIP
VOLKER DOSCH, MANAGING DIRECTOR. Portfolio Manager of the fund. Joined the fund
in 2009.
o Joined Deutsche Asset Management in 1989.
o Fund Manager of US and global equity funds; Head of US Equities; Deputy Head
of Fund Management International Equities; Head of Sector-Funds: Frankfurt.
o Master's degree in Economics ("Diplom-Volkswirt") from the University of
Frankfurt, Germany.
OLIVER PFEIL, PHD., VICE PRESIDENT. Portfolio Manager of the fund. Joined the
fund in 2009.
o Joined Deutsche Asset Management in 2006 after 3 years as Executive
Assistant to the Management Board of Deutsche Bank. Previously, Research
Fellow at the Swiss Institute of Banking and Finance at the University of
St. Gallen (2000-2002); Visiting Scholar in Capital Markets Research at MIT
Sloan School of Management (2002-2003). Also, serves as part-time Lecturer
in Finance at the University of St. Gallen in Switzerland.
o Portfolio manager for US and global value equity: Frankfurt.
o PhD in finance and accounting and Master's degree in Business Administration
from the University of St. Gallen; CEMS Master in International Management
from the University of St. Gallen & ESADE, Barcelona; completed bank
training program ("Bankkaufmann") at Sal. Oppenheim jr. & Cie. KGaA,
Cologne.
THOMAS SCHUESSLER, PHD., MANAGING DIRECTOR. Portfolio Manager of the fund.
Joined the fund in 2009.
52
PROSPECTUS May 1, 2010 Fund Details
o Joined Deutsche Asset Management in 2001 after five years at Deutsche Bank
where he managed various projects and worked in the office of the Chairman
of the Management Board.
o US and Global Fund Management: Frankfurt.
o PhD, University of Heidelberg, studies in physics and economics at
University of Heidelberg and University of Utah.
DWS TECHNOLOGY VIP
FREDERIC L. FAYOLLE, CFA, DIRECTOR. Lead Portfolio Manager of the fund. Joined
the fund in 2009.
o Joined Deutsche Asset Management and the Technology team in July 2000 after
10 years of experience with Philips Electronics in the USA with
responsibility for Philips's CRT display industry research for North
America.
o Senior fund manager covering technology and internet stocks: Frankfurt.
o MS in Engineering from University of Michigan; MS in Engineering from Ecole
Centrale Paris; MBA with finance concentration from University of Michigan
Business School.
CLARK CHANG, DIRECTOR. Portfolio Manager of the fund. Joined the fund in 2008.
o Joined Deutsche Asset Management in 2007 after seven years of experience as
senior analyst for technology sector for Firsthand Capital Management,
Nollenberger Capital Partners and Fulcrum Global Partners.
o Global Equity analyst for Technology Fund: New York.
o BS in Computer Science from University of California, Los Angeles (UCLA);
MBA with Finance concentration from Anderson School of Management, UCLA.
WALTER HOLICK, DIRECTOR. Portfolio Manager of the fund. Joined the fund in
2009.
o Joined the Company in 1990 as fund manager for global equities: technology,
telecommunication services and media.
o Head of Technology Sector Team; senior fund manager: Frankfurt.
o Master of Social Science in Money, Banking and Finance, University of
Birmingham, UK; Diplom-Kaufmann (German Master's degree in business and
economics), J.W. Goethe-Universit-t, Frankfurt.
Each fund's Statement of Additional Information provides additional information
about a portfolio manager's investments in each fund, a description of the
portfolio management compensation structure and information regarding other
accounts managed.
53
PROSPECTUS May 1, 2010 Fund Details
INVESTING IN THE FUNDS
YOUR INVESTMENT IN THE FUNDS
The information in this section may affect anyone who selects one or more funds
as an investment option in a variable annuity contract or variable life
insurance policy that offers one or more funds. These contracts and policies
are described in separate prospectuses issued by participating insurance
companies. Each fund assumes no responsibility for such prospectuses.
POLICIES ABOUT TRANSACTIONS
The information in this prospectus applies to Class B shares of each fund. Each
fund may offer two classes of shares. Class B shares are offered at net asset
value and are subject to 12b-1 fees.
Technically, the shareholders of DWS Variable Series II (which include each
fund just described) are the participating insurance companies (the "insurance
companies") that offer each fund as choices for holders of certain variable
annuity contracts or variable life insurance policies (the "contract(s)")
issued or sponsored by the insurance companies. The insurance companies may
pass through voting rights to the contract owners. Each fund does not sell
shares directly to the public. Each fund sells shares only to separate accounts
of insurance companies. As a contract owner, your premium payments are
allocated to a fund by the insurance companies in accordance with your
contract. Please see the contract prospectus that accompanies this prospectus
for a detailed explanation of your contract. Depending on context in the
prospectus, the terms "you" and "yours" refer to either a contract owner or to
the insurance company that issues the contract. References to "buying,"
"purchasing" or "holding" fund shares refer only to the insurance company, not
the contract owner.
Please bear in mind that there are important differences between DWS retail
funds available to any investor (a "Retail Fund") and those that are only
available through certain financial institutions, such as insurance companies.
For example, Retail Funds, unlike a fund, are not sold to insurance company
separate accounts to fund investments in variable insurance contracts. In
addition, the investment objective, policies and strategies of a fund, while
similar to those of a Retail Fund, are not identical. Retail Funds may be
smaller or larger than a fund and have different expense ratios than a fund. As
a result, the performance of a fund and a Retail Fund will differ.
Should any conflict between contract owners arise that would require that a
substantial amount of net assets be withdrawn from a fund, orderly portfolio
management could be disrupted to the potential detriment of shareholders of
that fund.
Each fund has a verification process for new insurance company accounts to help
the government fight the funding of terrorism and money laundering activities.
Federal law requires all financial institutions to obtain, verify and record
information that identifies each insurance company that opens an account. This
means that when an insurance company opens an account, a fund will ask for its
name, address and other information that will allow a fund to identify the
company. This information will be verified to ensure the identity of all
insurance companies opening an account.
For certain insurance companies, a fund might request additional information
(for instance, a fund would ask for documents such as the insurance company's
articles of incorporation) to help a fund verify the insurance company's
identity.
Each fund will not complete the purchase of any shares for an account until all
information has been provided and the application has been submitted in "good
order." Once the application is determined to be in good order, the purchase(s)
will be effected at the net asset value per share next calculated.
Each fund may reject a new account application if the insurance company doesn't
provide any required or requested identifying information, or for other
reasons.
BUYING AND SELLING SHARES
Each FUND IS OPEN FOR BUSINESS each day the New York Stock Exchange is open.
Each fund calculates its share price every business day, as of the close of
regular trading on the New York Stock Exchange (typically 4 p.m. Eastern time,
but sometimes earlier, as in the case of scheduled half-day trading or
unscheduled suspensions of trading).
54
PROSPECTUS May 1, 2010 Investing in the Funds
Each fund continuously sells shares to each insurance company separate account,
without a sales charge, at the net asset value per share next determined after
a proper purchase order is placed by the insurance company. The insurance
company offers contract owners units in its separate accounts which correspond
to shares in a fund. Each insurance company submits purchase and redemption
orders to a fund based on allocation instructions for premium payments,
transfer instructions and surrender or partial withdrawal requests for contract
owners, as set forth in the accompanying prospectus for the contracts. These
orders reflect the amount of premium payments to be invested, surrender and
transfer requests, and other matters. Redemption orders are effected at the
next net asset value per share determined after a proper redemption order is
placed by the insurance company. Contract owners should look at their contract
prospectuses for redemption procedures and fees.
IMPORTANT INFORMATION ABOUT BUYING AND SELLING SHARES
o After receiving a contract owner's order, the insurance company buys or
sells shares at the net asset value next calculated on any day each fund is
open for business.
o Unless otherwise instructed, each fund normally makes payment of the
proceeds from the sale of shares the next business day but always within
seven calendar days.
o Each fund does not issue share certificates.
o Each fund reserves the right to reject purchases of shares for any reason.
o Each fund reserves the right to withdraw or suspend the offering of shares
at any time.
o Each fund reserves the right to reject purchases of shares or to suspend or
postpone redemptions at times when the New York Stock Exchange is closed
(other than customary closings), trading is restricted or when an emergency
exists that prevents a fund from disposing of its portfolio securities or
pricing its shares.
o Each fund may refuse, cancel or rescind any purchase order; freeze any
account (meaning the insurance company will not be able to purchase shares
in its account); suspend account services; and/or involuntarily redeem the
account if we think that the account is being used for fraudulent or
illegal purposes by the insurance company; one or more of these actions
will be taken when, at the sole discretion of each fund, they are deemed to
be in each fund's best interests or when each fund is requested or
compelled to do so by governmental authority or by applicable law.
o Each fund may close and liquidate an account if a fund is unable to verify
provided information, or for other reasons; if a fund decides to close the
account, the shares will be redeemed at the net asset value per share next
calculated after we determine to close the account; the insurance company
may be subject to gain or loss on the redemption of the fund shares and may
incur tax liability.
o Each fund may pay for shares sold by "redeeming in kind," that is, by
distributing to you marketable securities (which typically will involve
brokerage costs for you to liquidate) rather than cash, but which will be
taxable to the same extent as a redemption for cash; each fund generally
won't make a redemption in kind unless your requests over a 90-day period
total more than $250,000 or 1% of the value of each fund's net assets,
whichever is less.
o A purchase order from an insurance company separate account may not be
accepted if the sale of fund shares has been suspended or if it is
determined that the purchase would be detrimental to the interests of a
fund.
MARKET TIMING POLICIES AND PROCEDURES. Short-term and excessive trading of fund
shares may present risks to each fund's long-term shareholders (as used herein,
the term "shareholders" may refer to the contract owners), including potential
dilution in the value of fund shares, interference with the efficient
management of a fund (including losses on the sale of investments), realized
gains to remaining shareholders and increased brokerage and administrative
costs. These risks may be more pronounced if a fund invests in certain
securities such as those that trade in foreign markets, are illiquid or do not
otherwise have "readily available market quotations." Certain investors may
seek to employ short-term trading strategies aimed at exploiting variations in
fund valuation that arise from the nature of the securities held by a fund
(e.g., "time zone arbitrage"). Each fund has adopted policies and procedures
that are intended to detect and deter short-term and excessive trading.
Pursuant to these policies, each fund reserves the right to reject or cancel a
purchase or exchange order for any reason without prior notice. For example, a
fund may in its discretion reject or cancel a purchase or an exchange order
even if the transaction is not subject to the specific roundtrip transaction
limitation described below if the Advisor believes that there appears to be a
pattern of short-term or excessive trading activity by a shareholder or deems
any other trading activity harmful or disruptive to a fund. Each fund, through
its Advisor and transfer agent, will measure short-term and excessive trading
by the number of roundtrip transactions within a shareholder's account during a
rolling 12-month period. A "roundtrip" transaction is defined as any
combination of purchase and redemption activity (including exchanges) of the
same fund's shares. Each fund may take other trading activity
55
PROSPECTUS May 1, 2010 Investing in the Funds
into account if a fund believes such activity is of an amount or frequency that
may be harmful to long-term shareholders or disruptive to portfolio management.
Shareholders are limited to four roundtrip transactions in the same fund over a
rolling 12-month period. Shareholders with four or more roundtrip transactions
in the same fund within a rolling 12-month period generally will be blocked
from making additional purchases of, or exchanges into, that fund. Each fund
has sole discretion whether to remove a block from a shareholder's account. The
rights of a shareholder to redeem shares of each fund are not affected by the
four roundtrip transaction limitation.
The Advisor may make exceptions to the roundtrip transaction policy for certain
types of transactions if in its opinion the transactions do not represent
short-term or excessive trading or are not abusive or harmful to each fund,
such as, but not limited to, systematic transactions, required minimum
retirement distributions, transactions initiated by each fund or administrator
and transactions by certain qualified fund-of-fund(s).
In certain circumstances, each fund may rely upon the policy of the insurance
company or other financial intermediary to deter short-term or excessive
trading if the Advisor believes that the policy of such insurance company or
other financial intermediary is reasonably designed to detect and deter
transactions that are not in the best interests of each fund. An insurance
company's or other financial intermediary's policy relating to short-term or
excessive trading may be more or less restrictive than each fund's policies,
may permit certain transactions not permitted by each fund's policies, or
prohibit transactions not subject to each fund's policies.
The Advisor may also accept undertakings from an insurance company or other
financial intermediary to enforce short-term or excessive trading policies on
behalf of each fund that provide a substantially similar level of protection
for each fund against such transactions. For example, certain insurance
companies may have contractual or legal restrictions, or operational
constraints, that prevent them from blocking an account. In such instances, the
Advisor may permit the insurance company to use alternate techniques that the
Advisor considers to be a reasonable substitute for such a block.
In addition, to the extent that each fund invests some portion of its assets in
foreign securities, each fund has adopted certain fair valuation practices
intended to protect each fund from "time zone arbitrage" with respect to its
foreign securities holdings and other trading practices that seek to exploit
variations in fund valuation that arise from the nature of the securities held
by each fund. (See "How each fund Calculates Share Price.")
There is no assurance that these policies and procedures will be effective in
limiting short-term and excessive trading in all cases. For example, the
Advisor may not be able to effectively monitor, detect or limit short-term or
excessive trading by underlying contract holders that occurs through separate
accounts maintained by insurance companies or other financial intermediaries.
The Advisor reviews trading activity at the separate account level to detect
short-term or excessive trading. If the Advisor has reason to suspect that
short-term or excessive trading is occurring at the separate account level, the
Advisor will contact the insurance company or other financial intermediary to
request underlying contract holder activity. Depending on the amount of fund
shares held in such separate account (which may represent most of each fund's
shares), short-term and/or excessive trading of fund shares could adversely
affect long-term shareholders in each fund. If short-term or excessive trading
is identified, the Advisor will take appropriate action.
Each fund's market timing policies and procedures may be modified or terminated
at any time.
HOW TO RECEIVE ACCOUNT INFORMATION
If you are a contract owner, you should contact your insurance company or the
organization that provides record keeping services for information about your
account.
Please see the contract prospectus that accompanies this prospectus for the
customer service phone number.
HOW TO SELECT SHARES
Shares in a fund are available in connection with certain variable annuity and
life insurance arrangements. Each insurance company has different provisions
about how and when their contract owners may select fund shares. Each insurance
company is responsible for communicating its contract owners' instructions to a
fund. Contract owners should contact their insurance company to effect
transactions in connection with a fund.
FINANCIAL INTERMEDIARY SUPPORT PAYMENTS
The Advisor, DWS Investments Distributors, Inc. (the "Distributor") and/or
their affiliates may pay additional compensation, out of their own assets and
not as an additional charge to each fund, to selected affiliated and
unaffiliated brokers, dealers, participating insurance companies or other
financial intermediaries ("financial advisors") in connection with the sale
and/or distribution of fund shares or the retention and/or servicing of fund
investors and fund shares ("revenue sharing"). Such revenue sharing payments
are in addition to any distribution or service fees payable under any Rule
12b-1 or service plan of each fund, any record keeping/sub-transfer agency/
networking fees payable by each fund (generally through the Distributor or an
affiliate) and/or the Distributor to certain financial advisors for performing
such services and any sales charge, commissions, non-cash compensation
arrangements expressly permitted under applicable rules
56
PROSPECTUS May 1, 2010 Investing in the Funds
of the Financial Industry Regulatory Authority or other concessions described
in the fee table or elsewhere in this prospectus or the Statement of Additional
Information as payable to all financial advisors. For example, the Advisor, the
Distributor and/or their affiliates may compensate financial advisors for
providing a fund with "shelf space" or access to a third party platform or fund
offering list or other marketing programs, including, without limitation,
inclusion of the fund on preferred or recommended sales lists, mutual fund
"supermarket" platforms and other formal sales programs; granting the
Distributor access to the financial advisor's sales force; granting the
Distributor access to the financial advisor's conferences and meetings;
assistance in training and educating the financial advisor's personnel; and
obtaining other forms of marketing support.
The level of revenue sharing payments made to financial advisors may be a fixed
fee or based upon one or more of the following factors: gross sales, current
assets and/or number of accounts of each fund attributable to the financial
advisor, the particular fund or fund type or other measures as agreed to by the
Advisor, the Distributor and/or their affiliates and the financial advisors or
any combination thereof. The amount of these revenue sharing payments is
determined at the discretion of the Advisor, the Distributor and/or their
affiliates from time to time, may be substantial, and may be different for
different financial advisors based on, for example, the nature of the services
provided by the financial advisor.
The Advisor, the Distributor and/or their affiliates currently make revenue
sharing payments from their own assets in connection with the sale and/or
distribution of DWS fund shares or the retention and/or servicing of investors
and DWS fund shares to financial advisors in amounts that generally range from
0.01% up to 0.26% of assets of each fund serviced and maintained by the
financial advisor, 0.05% to 0.25% of sales of each fund attributable to the
financial advisor, a flat fee of $4,000 up to $500,000, or any combination
thereof. These amounts are subject to change at the discretion of the Advisor,
the Distributor and/or their affiliates. Receipt of, or the prospect of
receiving, this additional compensation may influence your financial advisor's
recommendation of each fund or of any particular share class of each fund. You
should review your financial advisor's compensation disclosure and/or talk to
your financial advisor to obtain more information on how this compensation may
have influenced your financial advisor's recommendation of each fund.
Additional information regarding these revenue sharing payments is included in
each fund's Statement of Additional Information, which is available to you on
request at no charge (see the back cover of this prospectus for more
information on how to request a copy of the Statement of Additional
Information).
The Advisor, the Distributor and/or their affiliates may also make such revenue
sharing payments to financial advisors under the terms discussed above in
connection with the distribution of both DWS funds and non-DWS funds by
financial advisors to retirement plans that obtain record keeping services from
ADP, Inc. or ExpertPlan Inc. on the DWS Investments branded retirement plan
platform (the "Platform") with the level of revenue sharing payments being
based upon sales of both the DWS funds and the non-DWS funds by the financial
advisor on the Platform or current assets of both the DWS funds and the non-DWS
funds serviced and maintained by the financial advisor on the Platform.
It is likely that broker-dealers that execute portfolio transactions for each
fund will include firms that also sell shares of the DWS funds to their
customers. However, the Advisor will not consider sales of DWS fund shares as a
factor in the selection of broker-dealers to execute portfolio transactions for
the DWS funds. Accordingly, the Advisor has implemented policies and procedures
reasonably designed to prevent its traders from considering sales of DWS fund
shares as a factor in the selection of broker-dealers to execute portfolio
transactions for each fund. In addition, the Advisor, the Distributor and/or
their affiliates will not use fund brokerage to pay for their obligation to
provide additional compensation to financial advisors as described above.
HOW EACH FUND CALCULATES SHARE PRICE
To calculate net asset value per share, or NAV, each fund uses the following
equation:
TOTAL TOTAL TOTAL NUMBER OF
- / = NAV
( )
ASSETS LIABILITIES SHARES OUTSTANDING
The price at which you buy and sell shares for each fund is the NAV.
FOR THE UNDERLYING FUNDS IN WHICH A FUND INVESTS, WE USE THE NAV OF THE
UNDERLYING FUNDS. FOR OTHER SECURITIES, WE TYPICALLY VALUE SECURITIES USING
INFORMATION FURNISHED BY AN INDEPENDENT PRICING SERVICE OR MARKET QUOTATIONS,
WHERE APPROPRIATE. However, we may use methods approved by the Board, such as a
fair valuation model, which are intended to reflect fair value when pricing
service information or market quotations are not readily available or when a
security's value or a meaningful portion of the value of a fund's portfolio is
believed to have been materially affected by a significant event, such as a
natural disaster, an economic event like a bankruptcy filing, or a substantial
fluctuation in domestic or foreign markets that has occurred between the close
of the exchange or market on which the security is principally traded (for
example, a foreign exchange or market) and the close of the New York Stock
Exchange. In such a case, a fund's value for a security is likely to be
different from the last quoted market price or pricing service information. In
addition, due to the subjective and variable nature of fair value pricing, it
is possible that the value determined for a particular asset may be materially
different from the value realized upon such asset's sale. It is expected that
the
57
PROSPECTUS May 1, 2010 Investing in the Funds
greater the percentage of fund assets that is invested in non-US securities,
the more extensive will be a fund's use of fair value pricing. This is intended
to reduce a fund's exposure to "time zone arbitrage" and other harmful trading
practices. (See "Market timing policies and procedures.")
To the extent that a fund invests in securities that are traded primarily in
foreign markets, the value of its holdings could change at a time when you
aren't able to buy or sell fund shares through the contract. This is because
some foreign markets are open on days and at times when each fund doesn't price
the shares.
DISTRIBUTIONS
Each fund intends to declare and distribute dividends from their net investment
income and capital gains, if any, annually. Each fund may make additional
distributions if necessary.
All distributions will be reinvested in shares of a fund unless we are informed
by an insurance company that they should be paid out in cash. The insurance
companies will be informed about the amount and character of distributions from
the relevant fund for federal income tax purposes.
TAXES
Each fund intends to qualify each year as a regulated investment company under
Subchapter M of the Internal Revenue Code of 1986, as amended (the "Code"), and
intends to meet all requirements necessary to avoid paying any federal income
or excise taxes.
Generally, owners of variable annuity and variable life contracts are not
subject to current federal income taxation on income or gains realized with
respect to such contracts. However, some distributions from such contracts,
whether made prior to or during the annuity payment period, may be taxable at
ordinary income tax rates. In addition, distributions made to an owner who is
younger than 59 1-2 may be subject to a 10% penalty tax. For further
information concerning federal income tax consequences for the holders of
variable annuity contracts and variable life insurance policies, such holders
should consult the prospectus used in connection with the issuance of their
particular contracts or policies.
In order for investors to receive the favorable federal income tax treatment
available to holders of variable annuity and variable life contracts, the
separate accounts underlying such contracts, as well as the funds in which such
accounts invest, must meet certain diversification requirements. Each fund
intends to comply with these requirements. If a fund or separate account does
not meet such requirements or fails to qualify as a regulated investment
company for any taxable year, income allocable to the contracts associated with
the separate account may be taxable currently for federal income tax purposes
to the holders of such contracts and income from prior periods with respect to
such contracts also could be taxable, most likely in the year of the failure.
Under Treasury regulations, insurance companies holding the separate accounts
may have to report to the IRS losses above a certain amount resulting from a
sale or disposition of a fund's shares.
The discussion above is generally based on the assumption that shares of a fund
will be respected as owned by insurance company separate accounts. If this is
not the case (for example, because the IRS finds an impermissible level of
"investor control" over the investment options underlying variable contracts),
the advantageous federal income tax treatment provided in respect of insurance
company separate accounts under the Code will no longer be available, and the
person or persons determined to own the fund shares will be currently taxed on
fund distributions, and on the proceeds of any redemption of fund shares, under
the Code.
Fund investments in securities of foreign issuers may be subject to withholding
and other taxes at the source, including on dividend or interest payments.
Participating insurance companies should consult their own tax advisors as to
whether such distributions are subject to federal income tax if they are
retained as part of policy reserves.
Certain of each fund's investments in certain debt obligations may cause each
fund to recognize taxable income in excess of the cash generated by such
obligation. Thus, each fund could be required at times to liquidate other
investments in order to satisfy its distribution requirements.
The preceding is a brief summary of certain of the relevant federal income tax
considerations. Because each shareholder and contract holder's tax situation is
unique, ask your tax professional about the tax consequences of your
investments, including possible federal, foreign, state or local taxes.
MARKETING AND DISTRIBUTION FEES
DWS Variable Series II has adopted a 12b-1 plan for each fund's Class B shares.
Under the plan, DWS Variable Series II may make quarterly payments to the
distributor for distribution and shareholder servicing related expenses
incurred or paid by the distributor or a participating insurance company. No
such payment shall be made with respect to any quarterly period in excess of an
amount determined for such period at the annual rate of 0.25% of the average
daily net assets of Class B shares during that quarterly period. Depending on
the participating insurance company's corporate structure and applicable state
law, the distributor may remit payments to the participating insurance
company's affiliated broker-dealers or other affiliated company rather than to
the participating insurance company itself.
58
PROSPECTUS May 1, 2010 Investing in the Funds
Because 12b-1 fees for Class B shares are paid out of fund assets on an ongoing
basis, they will, over time, increase the cost of investment in Class B shares
and may cost more than other types of sales charges.
Examples of expenses payable under the plan include the costs of printing and
mailing materials (such as fund prospectuses, shareholder reports, fund
advertisements and sales literature), holding seminars and sales meetings,
providing customer service to policyholders and sales compensation.
59
PROSPECTUS May 1, 2010 Investing in the Funds
FINANCIAL HIGHLIGHTS
The financial highlights are designed to help you understand recent financial
performance. The figures in the first part of each table are for a single
share. The total return figures represent the percentage that an investor in a
fund would have earned (or lost), assuming all dividends and distributions were
reinvested. This information has been audited by Ernst & Young LLP, independent
registered public accounting firm, whose report, along with each fund's
financial statements, is included in each fund's annual report (see
"Shareholder reports" on the back cover). This information doesn't reflect
charges and fees associated with the separate account that invests in the fund
or any variable life insurance policy or variable annuity contract for which
the fund is an investment option. These charges and fees will reduce returns.
DWS ALTERNATIVE ASSET ALLOCATION PLUS VIP - CLASS B
YEAR ENDED DECEMBER 31, 2009(A)
--------------------------------------------------- -----------
SELECTED PER SHARE DATA
------------------------------------------------------------------
NET ASSET VALUE, BEGINNING OF PERIOD $ 10.87
--------------------------------------------------- -------
Income (loss) from investment operations:
Net investment income (loss)(b) .35
--------------------------------------------------- -------
Net realized and unrealized gain (loss) 1.39
--------------------------------------------------- -------
TOTAL FROM INVESTMENT OPERATIONS 1.74
--------------------------------------------------- -------
NET ASSET VALUE, END OF PERIOD $ 12.61
--------------------------------------------------- -------
Total Return (%)(c,d) 16.01**
--------------------------------------------------- -------
RATIOS TO AVERAGE NET ASSETS AND SUPPLEMENTAL DATA
------------------------------------------------------------------
Net assets, end of period ($ millions) 3
--------------------------------------------------- -------
Ratio of expenses before expense reductions (%)(e) 5.37*
---------------------------------------------------- -------
Ratio of expenses after expense reductions (%)(e) .61*
---------------------------------------------------- -------
Ratio of net investment income (%) 4.66*
---------------------------------------------------- -------
Portfolio turnover rate (%) 155**
---------------------------------------------------- -------
(a) For the period from May 18, 2009 (commencement of operations of
Class B shares) to December 31, 2009.
(b) Based on average shares outstanding during the period.
(c) Total return would have been lower had certain expenses not been
reduced.
(d) Total return would have been lower if the Advisor had not reduced
some Underlying Funds' expenses.
(e) The Portfolio invests in other Funds and indirectly bears its
proportionate share of fees and expenses incurred by the Underlying
Funds and non-affiliated funds in which the Portfolio is invested.
This ratio does not include these indirect fees and expenses.
* Annualized
** Not annualized
60
PROSPECTUS May 1, 2010 Financial Highlights
DWS BLUE CHIP VIP - CLASS B
YEARS ENDED DECEMBER 31, 2009 2008 2007 2006 2005
------------------------------------------------ ---------- ----------------- ----------- ---------------- -----------
SELECTED PER SHARE DATA
-----------------------------------------------------------------------------------------------------------------------------
NET ASSET VALUE, BEGINNING OF PERIOD $ 7.26 $ 14.61 $ 16.12 $ 14.83 $ 13.60
------------------------------------------------ ------- --------- -------- -------- --------
Income (loss) from investment operations:
Net investment income(a) .10 .04 .11 .11 (c) .09
------------------------------------------------ ------- --------- -------- -------- --------
Net realized and unrealized gain (loss) 2.27 ( 4.89) .36 2.07 1.22
------------------------------------------------ ------- --------- -------- -------- --------
TOTAL FROM INVESTMENT OPERATIONS 2.37 ( 4.85) .47 2.18 1.31
------------------------------------------------ ------- --------- -------- -------- --------
Less distributions from:
Net investment income ( .12) ( .16) ( .11) ( .08) ( .08)
------------------------------------------------ ------- --------- -------- -------- --------
Net realized gains - ( 2.34) ( 1.87) ( .81) -
------------------------------------------------ ------- --------- -------- -------- --------
TOTAL DISTRIBUTIONS ( .12) ( 2.50) ( 1.98) ( .89) ( .08)
------------------------------------------------ ------- --------- -------- -------- --------
NET ASSET VALUE, END OF PERIOD $ 9.51 $ 7.26 $ 14.61 $ 16.12 $ 14.83
------------------------------------------------ ------- --------- -------- -------- --------
Total Return (%) 33.46 (38.48)(b) 3.15 15.19 (c) 9.68
------------------------------------------------ ------- --------- -------- -------- --------
RATIOS TO AVERAGE NET ASSETS AND SUPPLEMENTAL DATA
-----------------------------------------------------------------------------------------------------------------------------
Net assets, end of period ($ millions) .16 .13 11 46 44
------------------------------------------------ ------- --------- -------- -------- --------
Ratio of expenses before expense reductions (%) 1.02 1.22 1.09 1.09 1.09
------------------------------------------------- ------- --------- -------- -------- --------
Ratio of expenses after expense reductions (%) 1.02 1.21 1.09 1.09 1.09
------------------------------------------------- ------- --------- -------- -------- --------
Ratio of net investment income (%) 1.27 .67 .75 .74 (c) .61
------------------------------------------------- ------- --------- -------- -------- --------
Portfolio turnover rate (%) 82 127 275 226 288
------------------------------------------------- ------- --------- -------- -------- --------
(a) Based on average shares outstanding during the period.
(b) Total return would have been lower had certain expenses not been
reduced.
(c) Includes non-recurring income from the Advisor recorded as a result
of an administrative proceeding regarding disclosure of brokerage
allocation practices in connection with sales of DWS Funds. The
non-recurring income resulted in an increase in net investment
income of $0.003 per share and an increase in the ratio of net
investment income of 0.02%. Excluding this non-recurring income,
total return would have been 0.02% lower.
Prior to November 3, 2006, the fund was named DWS Dreman Small Cap Value VIP
and operated with a different investment strategy. Performance may have been
different if the fund's current policies had been in effect.
DWS DREMAN SMALL MID CAP VALUE VIP - CLASS B
YEARS ENDED DECEMBER 31, 2009 2008 2007 2006 2005
------------------------------------------------ ---------- ----------------- ----------- ----------- -----------
SELECTED PER SHARE DATA
------------------------------------------------------------------------------------------------------------------------
NET ASSET VALUE, BEGINNING OF PERIOD $ 7.92 $ 20.08 $ 22.88 $ 19.93 $ 20.01
------------------------------------------------ ------- --------- -------- -------- --------
Income (loss) from investment operations:
Net investment income (loss)(a) .13 .09 .10 .07 .11
------------------------------------------------ ------- --------- -------- -------- --------
Net realized and unrealized gain (loss) 2.12 ( 4.92) .54 4.67 1.66
------------------------------------------------ ------- --------- -------- -------- --------
TOTAL FROM INVESTMENT OPERATIONS 2.25 ( 4.83) .64 4.74 1.77
------------------------------------------------ ------- --------- -------- -------- --------
Less distributions from:
Net investment income ( .14) ( .22) ( .14) ( .08) ( .07)
------------------------------------------------ ------- --------- -------- -------- --------
Net realized gains - ( 7.11) ( 3.30) ( 1.71) ( 1.78)
------------------------------------------------ ------- --------- -------- -------- --------
TOTAL DISTRIBUTIONS ( .14) ( 7.33) ( 3.44) ( 1.79) ( 1.85)
------------------------------------------------ ------- --------- -------- -------- --------
NET ASSET VALUE, END OF PERIOD $ 10.03 $ 7.92 $ 20.08 $ 22.88 $ 19.93
------------------------------------------------ ------- --------- -------- -------- --------
Total Return (%) 29.28 (33.67)(b) 2.67 24.59 9.78
------------------------------------------------ ------- --------- -------- -------- --------
RATIOS TO AVERAGE NET ASSETS AND SUPPLEMENTAL DATA
------------------------------------------------------------------------------------------------------------------------
Net assets, end of period ($ millions) 23 24 34 90 83
------------------------------------------------ ------- --------- -------- -------- --------
Ratio of expenses before expense reductions (%) 1.14 1.18 1.16 1.17 1.19
------------------------------------------------- ------- --------- -------- -------- --------
Ratio of expenses after expense reductions (%) 1.14 1.17 1.16 1.17 1.19
------------------------------------------------- ------- --------- -------- -------- --------
Ratio of net investment income (%) 1.57 .78 .47 .33 .56
------------------------------------------------- ------- --------- -------- -------- --------
Portfolio turnover rate (%) 72 49 110 52 61
------------------------------------------------- ------- --------- -------- -------- --------
(a) Based on average shares outstanding during the period.
(b) Total return would have been lower had certain expenses not been
reduced.
61
PROSPECTUS May 1, 2010 Financial Highlights
DWS GLOBAL THEMATIC VIP - CLASS B
YEARS ENDED DECEMBER 31, 2009 2008 2007 2006 2005
------------------------------------------------ ---------- ----------- ----------- ---------------- -----------
SELECTED PER SHARE DATA
-----------------------------------------------------------------------------------------------------------------------
NET ASSET VALUE, BEGINNING OF PERIOD $ 5.85 $ 15.66 $ 17.38 $ 14.43 $ 11.78
------------------------------------------------ ------- -------- -------- -------- --------
Income (loss) from investment operations:
Net investment income (loss)(a) .06 .07 .07 .09 (c) .07
------------------------------------------------ ------- -------- -------- -------- --------
Net realized and unrealized gain (loss) 2.42 ( 5.83) .90 4.02 2.58
------------------------------------------------ ------- -------- -------- -------- --------
TOTAL FROM INVESTMENT OPERATIONS 2.48 ( 5.76) .97 4.11 2.65
------------------------------------------------ ------- -------- -------- -------- --------
Less distributions from:
Net investment income ( .08) ( .14) ( .05) ( .03) -
------------------------------------------------ ------- -------- -------- -------- --------
Net realized gains - ( 3.91) ( 2.64) ( 1.13) -
------------------------------------------------ ------- -------- -------- -------- --------
TOTAL DISTRIBUTIONS ( .08) ( 4.05) ( 2.69) ( 1.16) -
------------------------------------------------ ------- -------- -------- -------- --------
NET ASSET VALUE, END OF PERIOD $ 8.25 $ 5.85 $ 15.66 $ 17.38 $ 14.43
------------------------------------------------ ------- -------- -------- -------- --------
Total Return (%)(b) 43.23 (47.87) 5.84 29.65 (c) 22.50
------------------------------------------------ ------- -------- -------- -------- --------
RATIOS TO AVERAGE NET ASSETS AND SUPPLEMENTAL DATA
-----------------------------------------------------------------------------------------------------------------------
Net assets, end of period ($ millions) 5 4 10 25 20
------------------------------------------------ ------- -------- -------- -------- --------
Ratio of expenses before expense reductions (%) 1.73 1.82 1.81 1.76 1.79
------------------------------------------------- ------- -------- -------- -------- --------
Ratio of expenses after expense reductions (%) 1.39 1.45 1.47 1.43 1.65
------------------------------------------------- ------- -------- -------- -------- --------
Ratio of net investment income (%) .88 .73 .46 .53 (c) .61
------------------------------------------------- ------- -------- -------- -------- --------
Portfolio turnover rate (%) 190 229 191 136 95
------------------------------------------------- ------- -------- -------- -------- --------
(a) Based on average shares outstanding during the period.
(b) Total return would have been lower had certain expenses not been
reduced.
(c) Includes non-recurring income from the Advisor recorded as a result
of an administrative proceeding regarding disclosure of brokerage
allocation practices in connection with sales of DWS Funds. The
non-recurring income resulted in an increase in net investment
income of $0.004 per share and an increase in the ratio of net
investment income of 0.03%. Excluding this non-recurring income,
total return would have been 0.02% lower.
DWS GOVERNMENT & AGENCY SECURITIES VIP - CLASS B
YEARS ENDED DECEMBER 31, 2009 2008 2007 2006 2005
------------------------------------------------ ----------- ---------------- ---------------- ----------- -----------
SELECTED PER SHARE DATA
-----------------------------------------------------------------------------------------------------------------------------
NET ASSET VALUE, BEGINNING OF PERIOD $ 12.37 $ 12.35 $ 12.25 $ 12.23 $ 12.52
------------------------------------------------ -------- -------- -------- -------- --------
Income (loss) from investment operations:
Net investment income(a) .48 .52 .53 .50 .47
------------------------------------------------ -------- -------- -------- -------- --------
Net realized and unrealized gain (loss) .45 .03 .12 ( .06) ( .21)
------------------------------------------------ -------- -------- -------- -------- --------
TOTAL FROM INVESTMENT OPERATIONS .93 .55 .65 .44 .26
------------------------------------------------ -------- -------- -------- -------- --------
Less distributions from:
Net investment income ( .55) ( .53) ( .55) ( .42) ( .45)
------------------------------------------------ -------- -------- -------- -------- --------
Net realized gains - - - - ( .10)
------------------------------------------------ -------- -------- -------- -------- --------
TOTAL DISTRIBUTIONS ( .55) ( .53) ( .55) ( .42) ( .55)
------------------------------------------------ -------- -------- -------- -------- --------
NET ASSET VALUE, END OF PERIOD $ 12.75 $ 12.37 $ 12.35 $ 12.25 $ 12.23
------------------------------------------------ -------- -------- -------- -------- --------
Total Return (%) 7.70 4.60 (b) 5.43 (b) 3.74 2.24
------------------------------------------------ -------- -------- -------- -------- --------
RATIOS TO AVERAGE NET ASSETS AND SUPPLEMENTAL DATA
-----------------------------------------------------------------------------------------------------------------------------
Net assets, end of period ($ millions) 7 8 5 33 47
------------------------------------------------ -------- -------- -------- -------- --------
Ratio of expenses before expense reductions (%) .92 1.00 1.04 1.07 1.02
------------------------------------------------- -------- -------- -------- -------- --------
Ratio of expenses after expense reductions (%) .92 1.00 1.01 1.07 1.02
------------------------------------------------- -------- -------- -------- -------- --------
Ratio of net investment income (%) 3.81 4.24 4.39 4.16 3.78
------------------------------------------------- -------- -------- -------- -------- --------
Portfolio turnover rate (%) 390 543 465 241 191
------------------------------------------------- -------- -------- -------- -------- --------
(a) Based on average shares outstanding during the period.
(b) Total return would have been lower had certain expenses not been
reduced.
62
PROSPECTUS May 1, 2010 Financial Highlights
DWS HIGH INCOME VIP - CLASS B
YEARS ENDED DECEMBER 31, 2009 2008 2007 2006 2005
------------------------------------------------ ---------- ----------------- ---------- ---------- ----------
SELECTED PER SHARE DATA
---------------------------------------------------------------------------------------------------------------------
NET ASSET VALUE, BEGINNING OF PERIOD $ 5.31 $ 7.81 $ 8.38 $ 8.22 $ 8.77
------------------------------------------------ ------- --------- ------- ------- -------
Income (loss) from investment operations:
Net investment income(a) .49 .53 .60 .59 .65
------------------------------------------------ ------- --------- ------- ------- -------
Net realized and unrealized gain (loss) 1.42 ( 2.27) ( .54) .20 ( .39)
------------------------------------------------ ------- --------- ------- ------- -------
TOTAL FROM INVESTMENT OPERATIONS 1.91 ( 1.74) .06 .79 .26
------------------------------------------------ ------- --------- ------- ------- -------
Less distributions from:
Net investment income ( .64) ( .76) ( .63) ( .63) ( .81)
------------------------------------------------ ------- --------- ------- ------- -------
NET ASSET VALUE, END OF PERIOD $ 6.58 $ 5.31 $ 7.81 $ 8.38 $ 8.22
------------------------------------------------ ------- --------- ------- ------- -------
Total Return (%) 39.64 (24.13)(b) .54 10.11 3.41
------------------------------------------------ ------- --------- ------- ------- -------
RATIOS TO AVERAGE NET ASSETS AND SUPPLEMENTAL DATA
---------------------------------------------------------------------------------------------------------------------
Net assets, end of period ($ millions) .2 .1 10 53 56
------------------------------------------------ ------- --------- ------- ------- -------
Ratio of expenses before expense reductions (%) .94 1.25 1.08 1.10 1.10
------------------------------------------------- ------- --------- ------- ------- -------
Ratio of expenses after expense reductions (%) .94 1.23 1.08 1.10 1.10
------------------------------------------------- ------- --------- ------- ------- -------
Ratio of net investment income (%) 8.54 7.98 7.45 7.34 7.87
------------------------------------------------- ------- --------- ------- ------- -------
Portfolio turnover rate (%) 66 38 61 93 100
------------------------------------------------- ------- --------- ------- ------- -------
(a) Based on average shares outstanding during the period.
(b) Total return would have been lower had certain expenses not been
reduced.
DWS LARGE CAP VALUE VIP - CLASS B
YEARS ENDED DECEMBER 31, 2009 2008
------------------------------------------------ ---------- -----------------
SELECTED PER SHARE DATA
-----------------------------------------------------------------------------
NET ASSET VALUE, BEGINNING OF PERIOD $ 8.92 $ 19.20
------------------------------------------------ ------- ----------
Income (loss) from investment operations:
Net investment income (loss)(a) .19 .12
------------------------------------------------ ------- ----------
Net realized and unrealized gain (loss) 1.96 ( 5.64)
------------------------------------------------ ------- ----------
TOTAL FROM INVESTMENT OPERATIONS 2.15 ( 5.52)
------------------------------------------------ ------- ----------
Less distributions from:
Net investment income ( .21) ( .28)
------------------------------------------------ ------- ----------
Net realized gains - ( 4.48)
------------------------------------------------ ------- ----------
TOTAL DISTRIBUTIONS ( .21) ( 4.76)
------------------------------------------------ ------- ----------
NET ASSET VALUE, END OF PERIOD $ 10.86 $ 8.92
------------------------------------------------ ------- ----------
Total Return (%) 24.86 (36.64)(b)
------------------------------------------------ ------- ----------
RATIOS TO AVERAGE NET ASSETS AND SUPPLEMENTAL DATA
------------------------------------------------------------------------------
Net assets, end of period ($ millions) 1 .29
------------------------------------------------ ------- ----------
Ratio of expenses before expense reductions (%) 1.06 1.28
------------------------------------------------ ------- ----------
Ratio of expenses after expense reductions (%) 1.06 1.26
------------------------------------------------ ------- ----------
Ratio of net investment income (loss) (%) 1.92 1.20
------------------------------------------------ ------- ----------
Portfolio turnover rate (%) 76 97
------------------------------------------------ ------- ----------
YEARS ENDED DECEMBER 31, 2007 2006 2005
------------------------------------------------ -------------------- ---------------- ----------------
SELECTED PER SHARE DATA
-------------------------------------------------------------------------------------- -
NET ASSET VALUE, BEGINNING OF PERIOD $ 17.94 $ 15.79 $ 15.77
------------------------------------------------- ---------- --------- ---------
Income (loss) from investment operations:
Net investment income (loss)(a) .19 .23 (c) .19
------------------------------------------------- ---------- --------- ---------
Net realized and unrealized gain (loss) 1.99 2.11 .05
------------------------------------------------- ---------- --------- ---------
TOTAL FROM INVESTMENT OPERATIONS 2.18 2.34 .24
------------------------------------------------- ---------- --------- ---------
Less distributions from:
Net investment income ( .25) ( .19) ( .22)
------------------------------------------------- ---------- --------- ---------
Net realized gains ( .67) - -
------------------------------------------------- ---------- --------- ---------
TOTAL DISTRIBUTIONS ( .92) ( .19) ( .22)
------------------------------------------------- ---------- --------- ---------
NET ASSET VALUE, END OF PERIOD $ 19.20 $ 17.94 $ 15.79
------------------------------------------------- ---------- --------- ---------
Total Return (%) 12.77 (b,d) 14.96 (c) 1.58 (b)
------------------------------------------------- ---------- --------- ---------
RATIOS TO AVERAGE NET ASSETS AND SUPPLEMENTAL DATA
--------------------------------------------------------------------------------------------------------
Net assets, end of period ($ millions) 8 40 40
------------------------------------------------- ---------- --------- ---------
Ratio of expenses before expense reductions (%) 1.21 1.21 1.21
------------------------------------------------- ---------- --------- ---------
Ratio of expenses after expense reductions (%) 1.20 1.21 1.20
------------------------------------------------- ---------- --------- ---------
Ratio of net investment income (loss) (%) 1.06 1.35 (c) 1.24
------------------------------------------------- ---------- --------- ---------
Portfolio turnover rate (%) 103 76 64
------------------------------------------------- ---------- --------- ---------
(a) Based on average shares outstanding during the period.
(b) Total return would have been lower had certain expenses not been
reduced.
(c) Includes non-recurring income from the Advisor recorded as a result
of an administrative proceeding regarding disclosure of brokerage
allocation practices in connection with sales of DWS Funds. The
non-recurring income resulted in an increase in net investment
income of $0.008 per share and an increase in the ratio of net
investment income of 0.04%. Excluding this non-recurring income,
total return would have been 0.04% lower.
(d) Includes a reimbursement from the Advisor to reimburse the effect of
losses incurred as the result of certain operation errors during the
period. Excluding this reimbursement, total return would have been
0.04% lower.
63
PROSPECTUS May 1, 2010 Financial Highlights
Prior to June 1, 2009, Dreman Value Management, L.L.C. served as the fund's
subadvisor and was primarily responsible for the day-to-day management of the
fund. Performance would have been different if the fund's current investment
strategy had been in effect.
DWS STRATEGIC VALUE VIP - CLASS B
YEARS ENDED DECEMBER 31, 2009 2008 2007 2006 2005
----------------------------------------------- -------------- ----------------- ---------------- ---------------- -----------
SELECTED PER SHARE DATA
-------------------------------------------------------------------------------------------------------------------------------
NET ASSET VALUE, BEGINNING OF PERIOD $ 6.22 $ 14.41 $ 15.02 $ 13.39 $ 12.63
----------------------------------------------- -------- --------- -------- -------- --------
Income (loss) from investment operations:
Net investment income (loss)(a) .10 .16 .24 .22 .19
----------------------------------------------- -------- --------- -------- -------- --------
Net realized and unrealized gain (loss) 1.32 ( 5.79) ( .56) 2.19 .75
----------------------------------------------- -------- --------- -------- -------- --------
TOTAL FROM INVESTMENT OPERATIONS 1.42 ( 5.63) ( .32) 2.41 .94
----------------------------------------------- -------- --------- -------- -------- --------
Less distributions from:
Net investment income ( .26) ( .31) ( .16) ( .19) ( .18)
----------------------------------------------- -------- --------- -------- -------- --------
Net realized gains - ( 2.25) ( .13) ( .59) -
----------------------------------------------- -------- --------- -------- -------- --------
TOTAL DISTRIBUTIONS ( .26) ( 2.56) ( .29) ( .78) ( .18)
----------------------------------------------- -------- --------- -------- -------- --------
NET ASSET VALUE, END OF PERIOD $ 7.38 $ 6.22 $ 14.41 $ 15.02 $ 13.39
----------------------------------------------- -------- --------- -------- -------- --------
Total Return (%) 24.94 (b) (46.16)(b) ( 2.19)(b) 18.21 (b) 7.51
----------------------------------------------- -------- --------- -------- -------- --------
RATIOS TO AVERAGE NET ASSETS AND SUPPLEMENTAL DATA
-------------------------------------------------------------------------------------------------------------------------------
Net assets, end of period ($ millions) 2 2 37 191 135
----------------------------------------------- -------- --------- -------- -------- --------
Ratio of expenses before expense reduction (%) 1.11 1.21 1.15 1.16 1.17
----------------------------------------------- -------- --------- -------- -------- --------
Ratio of expenses after expense reduction (%) 1.08 1.17 1.13 1.16 1.17
----------------------------------------------- -------- --------- -------- -------- --------
Ratio of net investment income (%) 1.57 1.84 1.59 1.48 1.45
----------------------------------------------- -------- --------- -------- -------- --------
Portfolio turnover rate (%) 91 28 27 20 10
----------------------------------------------- -------- --------- -------- -------- --------
(a) Based on average shares outstanding during the period.
(b) Total return would have been lower had certain expenses not been
reduced.
DWS TECHNOLOGY VIP - CLASS B
YEARS ENDED DECEMBER 31, 2009 2008 2007 2006 2005
------------------------------------------ ---------- ----------------- ---------- --------------- ----------
SELECTED PER SHARE DATA
--------------------------------------------------------------------------------------------------------------------
NET ASSET VALUE, BEGINNING OF PERIOD $ 5.64 $ 10.53 $ 9.25 $ 9.21 $ 8.93
------------------------------------------ ------- --------- ------- ------- -------
Income (loss) from investment operations:
Net investment income (loss)(a) ( .02) ( .03) ( .05) ( .04)(c) ( .07)
------------------------------------------- ------- --------- ------- ------- -------
Net realized and unrealized gain (loss) 3.40 ( 4.86) 1.33 .08 .36
------------------------------------------- ------- --------- ------- ------- -------
TOTAL FROM INVESTMENT OPERATIONS 3.38 ( 4.89) 1.28 .04 .29
------------------------------------------- ------- --------- ------- ------- -------
Less distributions from:
Net investment income - - - - ( .01)
------------------------------------------- ------- --------- ------- ------- -------
NET ASSET VALUE, END OF PERIOD $ 9.02 $ 5.64 $ 10.53 $ 9.25 $ 9.21
------------------------------------------- ------- --------- ------- ------- -------
Total Return (%) 59.93 (46.44)(b) 13.84 .43 (c) 3.27
------------------------------------------- ------- --------- ------- ------- -------
RATIOS TO AVERAGE NET ASSETS AND SUPPLEMENTAL DATA
--------------------------------------------------------------------------------------------------------------------
Net assets, end of period ($ millions) 3 2 3 14 16
------------------------------------------- ------- --------- ------- ------- -------
Ratio of expenses (%) 1.18 1.35 1.29 1.28 1.26
------------------------------------------- ------- --------- ------- ------- -------
Ratio of net investment income (loss) (%) ( .27) ( .35) ( .53) ( .51)(c) ( .76)
------------------------------------------- ------- --------- ------- ------- -------
Portfolio turnover rate (%) 45 71 91 49 135
------------------------------------------- ------- --------- ------- ------- -------
(a) Based on average shares outstanding during the period.
(b) Total return would have been lower had certain expenses not been
reduced.
(c) Includes non-recurring income from the Advisor recorded as a result
of an administrative proceeding regarding disclosure of brokerage
allocation practices in connection with sales of DWS Funds. The
non-recurring income resulted in an increase in net investment
income of $0.017 per share and an increase in the ratio of net
investment income of 0.18%. Excluding this non-recurring income,
total return would have been 0.19% lower.
64
PROSPECTUS May 1, 2010 Financial Highlights
APPENDIX
HYPOTHETICAL EXPENSE SUMMARY
Using the annual fund operating expense ratios presented in the fee tables in
the fund prospectus, the Hypothetical Expense Summary shows the estimated fees
and expenses, in actual dollars, that would be charged on a hypothetical
investment of $10,000 in the fund held for the next 10 years and the impact of
such fees and expenses on fund returns for each year and cumulatively, assuming
a 5% return for each year. The historical rate of return for the fund may be
higher or lower than 5% and, for money market funds, is typically less than 5%.
The tables also assume that all dividends and distributions are reinvested. The
annual fund expense ratios shown are net of any contractual fee waivers or
expense reimbursements, if any, for the period of the contractual commitment.
Also, please note that if you are investing through a third party provider,
that provider may have fees and expenses separate from those of the fund that
are not reflected here. Mutual fund fees and expenses fluctuate over time and
actual expenses may be higher or lower than those shown.
The Hypothetical Expense Summary should not be used or construed as an offer to
sell, a solicitation of an offer to buy or a recommendation or endorsement of
any specific mutual fund. You should carefully review the fund's prospectus to
consider the investment objectives, risks, expenses and charges of the fund
prior to investing.
DWS ALTERNATIVE ASSET ALLOCATION PLUS VIP - CLASS B
MAXIMUM INITIAL HYPOTHETICAL ASSUMED RATE
SALES CHARGE: INVESTMENT: OF RETURN:
0.00% $10,000 5%
--------------- -------------------------------- --------------------------------
CUMULATIVE CUMULATIVE HYPOTHETICAL
RETURN BEFORE RETURN AFTER YEAR-END BALANCE ANNUAL
FEES AND ANNUAL FUND FEES AND AFTER FEES AND FEES AND
YEAR EXPENSES EXPENSE RATIOS EXPENSES EXPENSES EXPENSES
------ --------------- ---------------- -------------- ------------------ ------------
1 5.00% 1.84% 3.16% $ 10,316.00 $ 186.91
--- ----- ---- ---- ----------- ----------
2 10.25% 5.32% 2.83% $ 10,282.99 $ 547.93
--- ----- ---- ---- ----------- ----------
3 15.76% 5.32% 2.50% $ 10,250.08 $ 546.18
--- ----- ---- ---- ----------- ----------
4 21.55% 5.32% 2.17% $ 10,217.28 $ 544.43
--- ----- ---- ---- ----------- ----------
5 27.63% 5.32% 1.85% $ 10,184.59 $ 542.69
--- ----- ---- ---- ----------- ----------
6 34.01% 5.32% 1.52% $ 10,152.00 $ 540.95
--- ----- ---- ---- ----------- ----------
7 40.71% 5.32% 1.20% $ 10,119.51 $ 539.22
--- ----- ---- ---- ----------- ----------
8 47.75% 5.32% 0.87% $ 10,087.13 $ 537.50
--- ----- ---- ---- ----------- ----------
9 55.13% 5.32% 0.55% $ 10,054.85 $ 535.78
--- ----- ---- ---- ----------- ----------
10 62.89% 5.32% 0.23% $ 10,022.67 $ 534.06
--- ----- ---- ---- ----------- ----------
TOTAL $ 5,055.65
--- ----------
65
PROSPECTUS May 1, 2010 Appendix
DWS BLUE CHIP VIP - CLASS B
MAXIMUM INITIAL HYPOTHETICAL ASSUMED RATE
SALES CHARGE: INVESTMENT: OF RETURN:
0.00% $10,000 5%
--------------- -------------------------------- --------------------------------
CUMULATIVE CUMULATIVE HYPOTHETICAL
RETURN BEFORE RETURN AFTER YEAR-END BALANCE ANNUAL
FEES AND ANNUAL FUND FEES AND AFTER FEES AND FEES AND
YEAR EXPENSES EXPENSE RATIOS EXPENSES EXPENSES EXPENSES
------ --------------- ---------------- -------------- ------------------ ------------
1 5.00% 1.02% 3.98% $ 10,398.00 $ 104.03
--- ----- ---- ----- ----------- ----------
2 10.25% 1.02% 8.12% $ 10,811.84 $ 108.17
--- ----- ---- ----- ----------- ----------
3 15.76% 1.02% 12.42% $ 11,242.15 $ 112.48
--- ----- ---- ----- ----------- ----------
4 21.55% 1.02% 16.90% $ 11,689.59 $ 116.95
--- ----- ---- ----- ----------- ----------
5 27.63% 1.09% 21.55% $ 12,154.83 $ 121.61
--- ----- ---- ----- ----------- ----------
6 34.01% 1.02% 26.39% $ 12,638.60 $ 126.45
--- ----- ---- ----- ----------- ----------
7 40.71% 1.02% 31.42% $ 13,141.61 $ 131.48
--- ----- ---- ----- ----------- ----------
8 47.75% 1.02% 36.65% $ 13,664.65 $ 136.71
--- ----- ---- ----- ----------- ----------
9 55.13% 1.02% 42.09% $ 14,208.50 $ 142.15
--- ----- ---- ----- ----------- ----------
10 62.89% 1.02% 47.74% $ 14,774.00 $ 147.81
--- ----- ---- ----- ----------- ----------
TOTAL $ 1,247.84
--- ----------
DWS DREMAN SMALL MID CAP VALUE VIP - CLASS B
MAXIMUM INITIAL HYPOTHETICAL ASSUMED RATE
SALES CHARGE: INVESTMENT: OF RETURN:
0.00% $10,000 5%
--------------- -------------------------------- --------------------------------
CUMULATIVE CUMULATIVE HYPOTHETICAL
RETURN BEFORE RETURN AFTER YEAR-END BALANCE ANNUAL
FEES AND ANNUAL FUND FEES AND AFTER FEES AND FEES AND
YEAR EXPENSES EXPENSE RATIOS EXPENSES EXPENSES EXPENSES
------ --------------- ---------------- -------------- ------------------ ------------
1 5.00% 1.14% 3.86% $ 10,386.00 $ 116.20
--- ----- ---- ----- ----------- ----------
2 10.25% 1.14% 7.87% $ 10,786.90 $ 120.69
--- ----- ---- ----- ----------- ----------
3 15.76% 1.14% 12.03% $ 11,203.27 $ 125.34
--- ----- ---- ----- ----------- ----------
4 21.55% 1.14% 16.36% $ 11,635.72 $ 130.18
--- ----- ---- ----- ----------- ----------
5 27.63% 1.14% 20.85% $ 12,084.86 $ 135.21
--- ----- ---- ----- ----------- ----------
6 34.01% 1.14% 25.51% $ 12,551.33 $ 140.43
--- ----- ---- ----- ----------- ----------
7 40.71% 1.14% 30.36% $ 13,035.82 $ 145.85
--- ----- ---- ----- ----------- ----------
8 47.75% 1.14% 35.39% $ 13,539.00 $ 151.48
--- ----- ---- ----- ----------- ----------
9 55.13% 1.14% 40.62% $ 14,061.60 $ 157.32
--- ----- ---- ----- ----------- ----------
10 62.89% 1.14% 46.04% $ 14,604.38 $ 163.40
--- ----- ---- ----- ----------- ----------
TOTAL $ 1,386.10
--- ----------
66
PROSPECTUS May 1, 2010 Appendix
DWS GLOBAL THEMATIC VIP - CLASS B
MAXIMUM INITIAL HYPOTHETICAL ASSUMED RATE
SALES CHARGE: INVESTMENT: OF RETURN:
0.00% $10,000 5%
--------------- -------------------------------- --------------------------------
CUMULATIVE CUMULATIVE HYPOTHETICAL
RETURN BEFORE RETURN AFTER YEAR-END BALANCE ANNUAL
FEES AND ANNUAL FUND FEES AND AFTER FEES AND FEES AND
YEAR EXPENSES EXPENSE RATIOS EXPENSES EXPENSES EXPENSES
------ --------------- ---------------- -------------- ------------------ ------------
1 5.00% 1.74% 3.26% $ 10,326.00 $ 176.84
--- ----- ---- ----- ----------- ----------
2 10.25% 1.74% 6.63% $ 10,662.63 $ 182.60
--- ----- ---- ----- ----------- ----------
3 15.76% 1.74% 10.10% $ 11,010.23 $ 188.55
--- ----- ---- ----- ----------- ----------
4 21.55% 1.74% 13.69% $ 11,369.16 $ 194.70
--- ----- ---- ----- ----------- ----------
5 27.63% 1.74% 17.40% $ 11,739.80 $ 201.05
--- ----- ---- ----- ----------- ----------
6 34.01% 1.74% 21.23% $ 12,122.51 $ 207.60
--- ----- ---- ----- ----------- ----------
7 40.71% 1.74% 25.18% $ 12,517.71 $ 214.37
--- ----- ---- ----- ----------- ----------
8 47.75% 1.74% 29.26% $ 12,925.79 $ 221.36
--- ----- ---- ----- ----------- ----------
9 55.13% 1.74% 33.47% $ 13,347.17 $ 228.57
--- ----- ---- ----- ----------- ----------
10 62.89% 1.74% 37.82% $ 13,782.28 $ 236.03
--- ----- ---- ----- ----------- ----------
TOTAL $ 2,051.67
--- ----------
DWS GOVERNMENT & AGENCY SECURITIES VIP - CLASS B
MAXIMUM INITIAL HYPOTHETICAL ASSUMED RATE
SALES CHARGE: INVESTMENT: OF RETURN:
0.00% $10,000 5%
--------------- -------------------------------- ---------------------------------
CUMULATIVE CUMULATIVE HYPOTHETICAL
RETURN BEFORE RETURN AFTER YEAR-END BALANCE ANNUAL
FEES AND ANNUAL FUND FEES AND AFTER FEES AND FEES AND
YEAR EXPENSES EXPENSE RATIOS EXPENSES EXPENSES EXPENSES
------ --------------- ---------------- -------------- ------------------ -------------
1 5.00% 0.92% 4.08% $ 10,408.00 $ 93.88
--- ----- ---- ----- ----------- ----------
2 10.25% 0.92% 8.33% $ 10,832.65 $ 97.71
--- ----- ---- ----- ----------- ----------
3 15.76% 0.92% 12.75% $ 11,274.62 $ 101.69
--- ----- ---- ----- ----------- ----------
4 21.55% 0.92% 17.35% $ 11,734.62 $ 105.84
--- ----- ---- ----- ----------- ----------
5 27.63% 0.92% 22.13% $ 12,213.40 $ 110.16
--- ----- ---- ----- ----------- ----------
6 34.01% 0.92% 27.12% $ 12,711.70 $ 114.66
--- ----- ---- ----- ----------- ----------
7 40.71% 0.92% 32.30% $ 13,230.34 $ 119.33
--- ----- ---- ----- ----------- ----------
8 47.75% 0.92% 37.70% $ 13,770.14 $ 124.20
--- ----- ---- ----- ----------- ----------
9 55.13% 0.92% 43.32% $ 14,331.96 $ 129.27
--- ----- ---- ----- ----------- ----------
10 62.89% 0.92% 49.17% $ 14,916.70 $ 134.54
--- ----- ---- ----- ----------- ----------
TOTAL $ 1,131.28
--- ----------
67
PROSPECTUS May 1, 2010 Appendix
DWS HIGH INCOME VIP - CLASS B
MAXIMUM INITIAL HYPOTHETICAL ASSUMED RATE
SALES CHARGE: INVESTMENT: OF RETURN:
0.00% $10,000 5%
--------------- -------------------------------- ---------------------------------
CUMULATIVE CUMULATIVE HYPOTHETICAL
RETURN BEFORE RETURN AFTER YEAR-END BALANCE ANNUAL
FEES AND ANNUAL FUND FEES AND AFTER FEES AND FEES AND
YEAR EXPENSES EXPENSE RATIOS EXPENSES EXPENSES EXPENSES
------ --------------- ---------------- -------------- ------------------ -------------
1 5.00% 0.94% 4.06% $ 10,406.00 $ 95.91
--- ----- ---- ----- ----------- ----------
2 10.25% 0.94% 8.28% $ 10,828.48 $ 99.80
--- ----- ---- ----- ----------- ----------
3 15.76% 0.94% 12.68% $ 11,268.12 $ 103.85
--- ----- ---- ----- ----------- ----------
4 21.55% 0.94% 17.26% $ 11,725.61 $ 108.07
--- ----- ---- ----- ----------- ----------
5 27.63% 0.94% 22.02% $ 12,201.67 $ 112.46
--- ----- ---- ----- ----------- ----------
6 34.01% 0.94% 26.97% $ 12,697.05 $ 117.02
--- ----- ---- ----- ----------- ----------
7 40.71% 0.94% 32.13% $ 13,212.55 $ 121.78
--- ----- ---- ----- ----------- ----------
8 47.75% 0.94% 37.49% $ 13,748.98 $ 126.72
--- ----- ---- ----- ----------- ----------
9 55.13% 0.94% 43.07% $ 14,307.19 $ 131.86
--- ----- ---- ----- ----------- ----------
10 62.89% 0.94% 48.88% $ 14,888.06 $ 137.22
--- ----- ---- ----- ----------- ----------
TOTAL $ 1,154.69
--- ----------
DWS LARGE CAP VALUE VIP - CLASS B
MAXIMUM INITIAL HYPOTHETICAL ASSUMED RATE
SALES CHARGE: INVESTMENT: OF RETURN:
0.00% $10,000 5%
--------------- -------------------------------- --------------------------------
CUMULATIVE CUMULATIVE HYPOTHETICAL
RETURN BEFORE RETURN AFTER YEAR-END BALANCE ANNUAL
FEES AND ANNUAL FUND FEES AND AFTER FEES AND FEES AND
YEAR EXPENSES EXPENSE RATIOS EXPENSES EXPENSES EXPENSES
------ --------------- ---------------- -------------- ------------------ ------------
1 5.00% 1.06% 3.94% $ 10,394.00 $ 108.09
--- ----- ---- ----- ----------- ----------
2 10.25% 1.06% 8.04% $ 10,803.52 $ 112.35
--- ----- ---- ----- ----------- ----------
3 15.76% 1.06% 12.29% $ 11,229.18 $ 116.77
--- ----- ---- ----- ----------- ----------
4 21.55% 1.06% 16.72% $ 11,671.61 $ 121.37
--- ----- ---- ----- ----------- ----------
5 27.63% 1.06% 21.31% $ 12,131.47 $ 126.16
--- ----- ---- ----- ----------- ----------
6 34.01% 1.06% 26.09% $ 12,609.45 $ 131.13
--- ----- ---- ----- ----------- ----------
7 40.71% 1.06% 31.06% $ 13,106.27 $ 136.29
--- ----- ---- ----- ----------- ----------
8 47.75% 1.06% 36.23% $ 13,622.65 $ 141.66
--- ----- ---- ----- ----------- ----------
9 55.13% 1.06% 41.59% $ 14,159.39 $ 147.24
--- ----- ---- ----- ----------- ----------
10 62.89% 1.06% 47.17% $ 14,717.27 $ 153.05
--- ----- ---- ----- ----------- ----------
TOTAL $ 1,294.11
--- ----------
68
PROSPECTUS May 1, 2010 Appendix
DWS STRATEGIC VALUE VIP - CLASS B
MAXIMUM INITIAL HYPOTHETICAL ASSUMED RATE
SALES CHARGE: INVESTMENT: OF RETURN:
0.00% $10,000 5%
--------------- -------------------------------- --------------------------------
CUMULATIVE CUMULATIVE HYPOTHETICAL
RETURN BEFORE RETURN AFTER YEAR-END BALANCE ANNUAL
FEES AND ANNUAL FUND FEES AND AFTER FEES AND FEES AND
YEAR EXPENSES EXPENSE RATIOS EXPENSES EXPENSES EXPENSES
------ --------------- ---------------- -------------- ------------------ ------------
1 5.00% 1.11% 3.89% $ 10,389.00 $ 113.16
--- ----- ---- ----- ----------- ----------
2 10.25% 1.11% 7.93% $ 10,793.13 $ 117.56
--- ----- ---- ----- ----------- ----------
3 15.76% 1.11% 12.13% $ 11,212.98 $ 122.13
--- ----- ---- ----- ----------- ----------
4 21.55% 1.11% 16.49% $ 11,649.17 $ 126.88
--- ----- ---- ----- ----------- ----------
5 27.63% 1.11% 21.02% $ 12,102.32 $ 131.82
--- ----- ---- ----- ----------- ----------
6 34.01% 1.11% 25.73% $ 12,573.10 $ 136.95
--- ----- ---- ----- ----------- ----------
7 40.71% 1.11% 30.62% $ 13,062.20 $ 142.28
--- ----- ---- ----- ----------- ----------
8 47.75% 1.11% 35.70% $ 13,570.32 $ 147.81
--- ----- ---- ----- ----------- ----------
9 55.13% 1.11% 40.98% $ 14,098.20 $ 153.56
--- ----- ---- ----- ----------- ----------
10 62.89% 1.11% 46.47% $ 14,646.62 $ 159.53
--- ----- ---- ----- ----------- ----------
TOTAL $ 1,351.68
--- ----------
DWS TECHNOLOGY VIP - CLASS B
MAXIMUM INITIAL HYPOTHETICAL ASSUMED RATE
SALES CHARGE: INVESTMENT: OF RETURN:
0.00% $10,000 5%
--------------- -------------------------------- --------------------------------
CUMULATIVE CUMULATIVE HYPOTHETICAL
RETURN BEFORE RETURN AFTER YEAR-END BALANCE ANNUAL
FEES AND ANNUAL FUND FEES AND AFTER FEES AND FEES AND
YEAR EXPENSES EXPENSE RATIOS EXPENSES EXPENSES EXPENSES
------ --------------- ---------------- -------------- ------------------ ------------
1 5.00% 1.18% 3.82% $ 10,382.00 $ 120.25
--- ----- ---- ----- ----------- ----------
2 10.25% 1.18% 7.79% $ 10,778.59 $ 124.85
--- ----- ---- ----- ----------- ----------
3 15.76% 1.18% 11.90% $ 11,190.33 $ 129.62
--- ----- ---- ----- ----------- ----------
4 21.55% 1.18% 16.18% $ 11,617.81 $ 134.57
--- ----- ---- ----- ----------- ----------
5 27.63% 1.18% 20.62% $ 12,061.61 $ 139.71
--- ----- ---- ----- ----------- ----------
6 34.01% 1.18% 25.22% $ 12,522.36 $ 145.05
--- ----- ---- ----- ----------- ----------
7 40.71% 1.18% 30.01% $ 13,000.71 $ 150.59
--- ----- ---- ----- ----------- ----------
8 47.75% 1.18% 34.97% $ 13,497.34 $ 156.34
--- ----- ---- ----- ----------- ----------
9 55.13% 1.18% 40.13% $ 14,012.94 $ 162.31
--- ----- ---- ----- ----------- ----------
10 62.89% 1.18% 45.48% $ 14,548.23 $ 168.51
--- ----- ---- ----- ----------- ----------
TOTAL $ 1,431.80
--- ----------
ADDITIONAL INDEX INFORMATION
DWS BLUE CHIP VIP
RUSSELL 1000 (Reg. TM) INDEX is an unmanaged index that measures the
performance of the 1,000 largest companies in the Russell 3000 Index, which
represents approximately 92% of the total market capitalization of the Russell
3000 Index.
DWS DREMAN SMALL MID CAP VALUE VIP
RUSSELL 2500(TM) VALUE INDEX is an unmanaged index measuring the small- to
mid-cap US equity value market.
DWS GLOBAL THEMATIC VIP
MSCI WORLD INDEX is an unmanaged capitalization-weighted measure of stock
markets around the world, including North America, Europe, Australia and Asia.
Returns reflect reinvestment of dividends net of withholding taxes.
DWS GOVERNMENT & AGENCY SECURITIES VIP
BARCLAYS CAPITAL GNMA INDEX is an unmanaged market value-weighted measure of
all fixed-rate securities backed by mortgage pools of the Government National
Mortgage Association.
69
PROSPECTUS May 1, 2010 Appendix
DWS HIGH INCOME VIP
CREDIT SUISSE HIGH YIELD INDEX is an unmanaged trader-priced portfolio,
constructed to mirror the global high-yield debt market.
DWS LARGE CAP VALUE VIP
RUSSELL 1000 (Reg. TM) VALUE INDEX is an unmanaged index that consists of those
stocks in the Russell 1000 Index with less-than-average growth orientation.
Russell 1000 (Reg. TM) Index is an unmanaged price-only index of the 1,000
largest capitalized companies that are domiciled in the US and whose common
stocks are traded.
DWS STRATEGIC VALUE VIP
STANDARD & POOR'S 500 INDEX (S&P 500) is an unmanaged, capitalization-weighted
index of 500 stocks. The index is designed to measure performance of the broad
domestic economy through changes in the aggregate market value of 500 stocks
representing all major industries.
DWS TECHNOLOGY VIP
RUSSELL 1000 (Reg. TM) GROWTH INDEX is an unmanaged index that consists of
those stocks in the Russell 1000 (Reg. TM) Index that have higher price-to-book
ratios and higher forecasted growth values. Russell 1000 (Reg. TM) Index is an
unmanaged price-only index of the 1,000 largest capitalized companies that are
domiciled in the US and whose common stocks are traded.
S&P NORTH AMERICAN TECHNOLOGY SECTOR INDEX is an unmanaged
capitalization-weighted index based on a universe of technology-related stocks.
70
PROSPECTUS May 1, 2010 Appendix
TO GET MORE INFORMATION
SHAREHOLDER REPORTS. These include commentary from a fund's management team
about recent market conditions and the effects of a fund's strategies on its
performance. They also have detailed performance figures, a list of everything
a fund owns, and its financial statements. Shareholders get these reports
automatically.
STATEMENT OF ADDITIONAL INFORMATION (SAI). This tells you more about a fund's
features and policies, including additional risk information. The SAI is
incorporated by reference into this document (meaning that it's legally part of
this prospectus).
For a free copy of any of these documents or to request other information about
a fund, contact DWS Investments at the phone number or address listed below.
SAIs and shareholder reports are also available through the DWS Investments Web
site at www.dws-investments.com. These documents and other information about
each fund are available from the EDGAR Database on the SEC's Internet site at
www.sec.gov. If you like, you may obtain copies of this information, after
paying a copying fee, by e-mailing a request to publicinfo@sec.gov or by
writing the SEC at the address listed below.
You can also review and copy these documents and other information about each
fund, including each fund's SAI, at the SEC's Public Reference Room in
Washington, D.C. Information on the operation of the SEC's Public Reference
Room may be obtained by calling (800) SEC-0330.
CONTACT INFORMATION
DWS INVESTMENTS 222 South Riverside Plaza
Chicago, IL 60606-5808
www.dws-investments.com
(800) 728-3337
SEC 100 F Street, N.E.
Washington, D.C. 20549-0102
WWW.SEC.GOV
(800) SEC-0330
DISTRIBUTOR DWS Investments Distributors, Inc.
222 South Riverside Plaza
Chicago, IL 60606-5808
(800) 621-1148
SEC FILE NUMBER DWS Variable Series II
811-05002
RESHAPING INVESTING. [DWS INVESTMENTS LOGO]
Deutsche Bank Group
(05/01/10) 2B-1
SUPPLEMENT TO THE CURRENTLY EFFECTIVE STATEMENTS OF ADDITIONAL INFORMATION OF EACH OF THE LISTED FUNDS: |
| | | |
| | | |
Cash Account Trust
| | Government & Agency Securities Portfolio |
Cash Management Fund Institutional
Cash Reserve Fund, Inc.
Prime Series
Cash Reserves Fund Institutional
Daily Assets Fund Institutional
DWS Alternative Asset Allocation Plus Fund
DWS Balanced Fund
DWS Blue Chip Fund
DWS California Tax–Free Income Fund
DWS Capital Growth Fund
DWS Climate Change Fund
DWS Communications Fund
DWS Core Fixed Income Fund
DWS Core Plus Income Fund
DWS Disciplined Market Neutral Fund
DWS Diversified International Equity Fund
DWS Dreman International Value Fund
DWS Dreman Mid Cap Value Fund
DWS Dreman Small Cap Value Fund
DWS EAFE® Equity Index Fund
DWS Emerging Markets Equity Fund
DWS Emerging Markets Fixed Income Fund
DWS Enhanced Commodity Strategy Fund
DWS Equity 500 Index Fund
DWS Floating Rate Plus Fund
DWS Global Bond Fund
DWS Global Inflation Plus Fund
DWS Global Small Cap Growth Fund
DWS Global Thematic Fund
DWS GNMA Fund
DWS Gold & Precious Metals Fund
DWS Growth & Income Fund
DWS Health Care Fund
DWS High Income Fund
DWS High Income Plus Fund
DWS Intermediate Tax/AMT Free Fund
DWS International Fund
DWS Large Cap Focus Growth Fund
DWS Large Cap Value Fund
DWS Latin America Equity Fund
DWS LifeCompass 2015 Fund
DWS LifeCompass 2020 Fund
DWS LifeCompass 2030 Fund
DWS LifeCompass 2040 Fund
DWS LifeCompass Retirement Fund
DWS Lifecycle Long Range Fund
DWS Managed Municipal Bond Fund
DWS Massachusetts Tax-Free Fund
DWS Mid Cap Growth Fund
DWS Money Market Prime Series
DWS Money Market Series
DWS New York Tax-Free Income Fund
DWS RREEF Global Infrastructure Fund
| | DWS RREEF Global Real Estate Securities Fund |
DWS RREEF Real Estate Securities Fund
DWS S&P 500 Index Fund
DWS S&P 500 Plus Fund
DWS Select Alternative Allocation Fund
DWS Short Duration Fund
DWS Short Duration Plus Fund
DWS Short-Term Municipal Bond Fund
DWS Small Cap Core Fund
DWS Small Cap Growth Fund
DWS Strategic Government Securities Fund
DWS Strategic High Yield Tax-Free Fund
DWS Strategic Income Fund
DWS Strategic Value Fund
DWS Target 2011 Fund
DWS Target 2012 Fund
DWS Target 2013 Fund
DWS Target 2014 Fund
DWS Technology Fund
DWS U.S. Bond Index Fund
DWS Variable NAV Money Fund
DWS World Dividend Fund
Investors Cash Trust
Treasury Portfolio
NY Tax Free Money Fund
Tax Free Money Fund Investment
Tax-Exempt California Money Market Fund
DWS Variable Series I:
DWS Bond VIP
DWS Capital Growth VIP
DWS Global Opportunities VIP
DWS Growth & Income VIP
DWS Health Care VIP
DWS International VIP
DWS Variable Series II:
DWS Alternative Asset Allocation Plus VIP
DWS Balanced VIP
DWS Blue Chip VIP
DWS Core Fixed Income VIP
DWS Diversified International Equity VIP
DWS Dreman Small Mid Cap Value VIP
DWS Global Thematic VIP
DWS Government & Agency Securities VIP
DWS High Income VIP
DWS Large Cap Value VIP
DWS Mid Cap Growth VIP
DWS Money Market VIP
DWS Small Cap Growth VIP
DWS Strategic Income VIP
DWS Strategic Value VIP
DWS Technology VIP
DWS Turner Mid Cap Growth VIP
DWS Investments VIT Funds:
DWS Equity 500 Index VIP
DWS Small Cap Index VIP
The following information replaces similar disclosure under “Financial Intermediary Support Payments” section of each Fund’s/Portfolio’s Statement of Additional Information:
Revenue Sharing
In light of recent regulatory developments, the Advisor, the Distributor and their affiliates have undertaken to furnish certain additional information below regarding the level of payments made by them to selected affiliated and unaffiliated brokers, dealers, participating insurance companies or other financial intermediaries (“financial advisors”) in connection with the sale and/or distribution of Fund shares or the retention and/or servicing of investors and Fund shares (“revenue sharing”).
The Advisor, the Distributor and/or their affiliates may pay additional compensation, out of their own assets and not as an additional charge to each Fund, to financial advisors in connection with the sale and/or distribution of Fund shares or the retention and/or servicing of Fund investors and Fund shares. Such revenue sharing payments are in addition to any distribution or service fees payable under any Rule 12b-1 or service plan of any fund, any record keeping/sub-transfer agency/networking fees payable by each Fund (generally through the Distributor or an affiliate) and/or the Distributor to certain financial advisors for performing such services and any sales charges, commissions, non-cash compensation arrangements expressly permitted under applicable rules of FINRA or other concessions described in the fee table or elsewhere in the Prospectuses or the SAI as payable to all financial advisors. For example, the Advisor, the Distributor and/or their affiliates may compensate financial advisors for providing each Fund with “shelf space” or access
to a third party platform or fund offering list, or other marketing programs including, without limitation, inclusion of each Fund on preferred or recommended sales lists, mutual fund “supermarket” platforms and other formal sales programs; granting the Distributor access to the financial advisor’s sales force; granting the Distributor access to the financial advisor’s conferences and meetings; assistance in training and educating the financial advisor’s personnel; and, obtaining other forms of marketing support. The level of revenue sharing payments made to financial advisors may be a fixed fee or based upon one or more of the following factors: gross sales, current assets and/or number of accounts of each Fund attributable to the financial advisor, the particular fund or fund type or other measures as agreed to by the Advisor, the Distributor and/or their affiliates and the financial advisors or any combination thereof. The amount of these payments is determined at the discretion of the Advisor, the Distributor and/or their affiliates from time to time, may be substantial, and may be different for different financial advisors based on, for example, the nature of the services provided by the financial advisor.
The Advisor, the Distributor and/or their affiliates currently make revenue sharing payments from their own assets in connection with the sale and/or distribution of DWS fund shares, or the retention and/or servicing of investors, to financial advisors in amounts that generally range from 0.01% up to 0.26% of assets of the Fund serviced and maintained by the financial advisor, 0.05% to 0.25% of sales of the Fund attributable to the financial advisor, a flat fee of $4,000 up to $125,000, or any combination thereof. These amounts are annual figures typically paid on a quarterly basis and are subject to change at the discretion of the Advisor, the Distributor and/or their affiliates. Receipt of, or the prospect of receiving, this additional compensation, may influence your financial advisor’s recommendation of this Fund or of any particular share class of the Fund. You should review your financial advisor’s compensation disclosure and/or talk to your financial advisor to obtain more information on how this compensation may have influenced your financial advisor’s recommendation of this Fund.
The Advisor, the Distributor and/or their affiliates may also make such revenue sharing payments to financial advisors under the terms discussed above in connection with the distribution of both DWS funds and non-DWS funds by financial advisors to retirement plans that obtain record keeping services from ADP, Inc. or ExpertPlan Inc. on the DWS Investments branded retirement plan platform (the “Platform") with the level of revenue sharing payments being based upon sales of both the DWS funds and the non-DWS funds by the financial advisor on the Platform or current assets of both the DWS funds and the non-DWS funds serviced and maintained by the financial advisor on the Platform.
As of the date hereof, each fund has been advised that the Advisor, the Distributor and their affiliates expect that the firms listed in Part II —Appendix II-E will receive revenue sharing payments at different points during the coming year as described above.
Please Retain This Supplement for Future Reference
December 21, 2010
SUPPLEMENT TO THE CURRENTLY EFFECTIVE STATEMENTS OF ADDITIONAL INFORMATION OF EACH OF THE LISTED FUNDS: |
| | | |
| | | |
Cash Account Trust Government & Agency Securities Portfolio Money Market Portfolio Tax-Exempt Portfolio Cash Management Fund Cash Reserve Fund, Inc. Prime Series Cash Reserves Fund Institutional DWS Alternative Asset Allocation Plus Fund DWS Balanced Fund DWS Blue Chip Fund DWS Capital Growth Fund DWS Communications Fund DWS Core Fixed Income Fund DWS Core Plus Income Fund DWS Diversified International Equity Fund DWS Dreman Mid Cap Value Fund DWS Dreman Small Cap Value Fund DWS EAFE® Equity Index Fund DWS Emerging Markets Equity Fund DWS Emerging Markets Fixed Income Fund DWS Enhanced Commodity Strategy Fund DWS Equity 500 Index Fund DWS Europe Equity Fund DWS GNMA Fund DWS Global Bond Fund DWS Global Inflation Plus Fund DWS Global Small Cap Growth Fund DWS Gold & Precious Metals Fund DWS Growth & Income Fund DWS High Income Fund DWS High Income Plus Fund DWS Large Cap Value Fund DWS Latin America Equity Fund DWS Lifecycle Long Range Fund | DWS Massachusetts Tax Free Fund DWS Mid Cap Growth Fund DWS Money Market Series DWS RREEF Global Infrastructure Fund DWS RREEF Global Real Estate Securities Fund DWS RREEF Real Estate Securities Fund DWS S&P 500 Index Fund DWS S&P 500 Plus Fund DWS Short Duration Fund DWS Short Duration Plus Fund DWS Short-Term Municipal Bond Fund DWS Small Cap Core Fund DWS Small Cap Growth Fund DWS Strategic Government Securities Fund DWS Strategic Income Fund DWS Strategic Value Fund DWS Technology Fund DWS U.S. Bond Index Fund NY Tax Free Money Fund Tax-Exempt California Money Market Fund Tax Free Money Fund Investment DWS Variable Series I: DWS Bond VIP DWS Capital Growth VIP DWS Global Opportunities VIP DWS Growth & Income VIP DWS Health Care VIP DWS International VIP | DWS Variable Series II: DWS Alternative Asset Allocation Plus VIP DWS Balanced VIP DWS Blue Chip VIP DWS Core Fixed Income VIP DWS Diversified International Equity VIP DWS Dreman Small Mid Cap Value VIP DWS Global Thematic VIP DWS Government & Agency Securities VIP DWS High Income VIP DWS Large Cap Value VIP DWS Mid Cap Growth VIP DWS Money Market VIP DWS Small Cap Growth VIP DWS Strategic Income VIP DWS Strategic Value VIP DWS Technology VIP DWS Turner Mid Cap Growth VIP DWS Investments VIT Funds: DWS Equity 500 Index VIP DWS Small Cap Index VIP Investors Cash Trust Treasury Portfolio |
The following disclosure is added to the “Terms of the Investment Management Agreements” sub-section of the “MANAGEMENT OF THE FUNDS” section of each Fund’s Statement of Additional Information Part II:
DIMA may enter into arrangements with affiliates and third party service providers to perform various administrative, back-office and other services. Such service providers may be located in the US or in non-US jurisdictions. The costs and expenses of such arrangements are borne by DIMA, not by a fund.
Please Retain This Supplement for Future Reference
August 6, 2010
STATEMENT OF ADDITIONAL INFORMATION
DWS VARIABLE SERIES I
DWS CAPITAL GROWTH VIP
CLASS A, CLASS B
345 Park Avenue
New York, NY 10154
This Statement of Additional Information (the “Merger SAI”) contains material that may be of interest to investors but that is not included in the Prospectus/Proxy Statement dated [ ], 2011 (the “Prospectus/Proxy Statement”) for the Special Meetings of Shareholders of DWS Health Care VIP, a series of DWS Variable Series I (“Health Care”) and DWS Technology VIP, a series of DWS Variable Series II (“Technology”) (each an “Acquired Fund”), to be held on April 11, 2011. This Merger SAI is not a prospectus and is authorized for distribution only when it accompanies or follows delivery of the Prospectus/Proxy Statement, into which this Merger SAI is hereby incorporated by reference. This Merger SAI should be read in conjunction with the Prospectus/Proxy Statement. Copies of the Prospectus/Proxy Statement may be obtained at no charge by contacting DWS Investments Distributors, Inc., 222 South Riverside Plaza, Chicago, Illinois 60606, 1-800-728-3337, or from your insurance company and are available along with other materials on the Securities and Exchange Commission’s Internet website (http://www.sec.gov). Unless otherwise indicated, capitalized terms used herein and not otherwise defined have the same meanings as are given to them in the Prospectus/Proxy Statement.
Further information about Class A and Class B shares of DWS Capital Growth VIP, a series of DWS Variable Series I (“Capital Growth”) is contained in the Class A Prospectus for Capital Growth, and the Class B Prospectus for Capital Growth, respectively, each dated May 1, 2010, as may be supplemented from time to time. Additionally, further information about Class A and Class B shares of Capital Growth is contained in the Statement of Additional Information of Capital Growth, dated May 1, 2010, as revised May 10, 2010, and as may be supplemented from time to time, relating to Class A and Class B shares, which is incorporated by reference herein. Copies of the Prospectuses and Statement of Additional Information may be obtained at no charge by contacting your fund at 1-800-728-3337, or from your insurance company and are available along with other materials on the Securities and Exchange Commission’s Internet website (http://www.sec.gov). The audited financial statements and related Independent Registered Public Accounting Firm’s reports for Capital Growth, Health Care and Technology contained in each fund’s Annual Report to Shareholders for the fiscal year ended December 31, 2010 are incorporated herein by reference. No other parts of each fund’s Annual Report to Shareholders are incorporated by reference herein.
The unaudited narrative description of the pro forma effects of the merger, attached hereto, is intended to present the financial condition and related results of operations of Capital Growth as if the mergers had been consummated on January 1, 2010.
The date of this Merger SAI is [ ], 2011.
1
NARRATIVE DESCRIPTION OF THE PRO FORMA EFFECTS OF THE MERGER
The unaudited pro forma information set forth below for the twelve months ended December 31, 2010 is intended to present ratios and supplemental data as if the mergers of DWS Technology VIP and DWS Health Care VIP (“Acquired Funds”) into DWS Capital Growth VIP had occurred as of the beginning of the period (unless otherwise noted). The merger of one Acquired Fund into DWS Capital Growth VIP is not contingent upon the approval of the other Acquired Fund’s shareholders. As such, the information below is presented for proposed merger of the Acquired Funds into DWS Capital Growth VIP and each Acquired Fund into DWS Capital Growth VIP.
Basis of Combination
On January 12, 2011, the Board of Trustees of DWS Technology VIP and DWS Health Care VIP approved, for each of the Acquired Funds, an Agreement and Plan of Reorganization (each a “Plan of Reorganization”) whereby, subject to the approval of each Acquired Fund’s shareholders, all of the assets of DWS Technology VIP and DWS Health Care VIP will be transferred to DWS Capital Growth VIP solely in exchange for the issuance and delivery to DWS Technology VIP and DWS Health Care VIP of shares of Class A and Class B shares of DWS Capital Growth VIP with an aggregate value equal to the value of DWS Technology VIP’s and DWS Health Care VIP’s assets net of liabilities (“Merger Shares”), and for the assumption by DWS Capital Growth VIP of all the liabilities of DWS Technology VIP and DWS Health Care VIP. The merger of one Acquired Fund into DWS Capital Growth VIP is not contingent upon the approval of the other Acquired Fund’s shareholders. Each merger is separate and distinct from each other. All Merger Shares delivered to DWS Technology VIP and DWS Health Care VIP, respectfully, will be exchanged for an investment in the same class of DWS Capital Growth VIP at net asset value. Immediately following the transfer, the appropriate class of the Merger Shares received by DWS Technology VIP and DWS Health Care VIP will be distributed pro rata, on a tax-free basis for federal income tax purposes, to its shareholders of record. Shares of DWS Technology VIP and DWS Health Care VIP will, in effect, be exchanged on a federal income tax-free basis for the same class of shares of DWS Capital Growth VIP at net asset value.
Under the terms of each Plan of Reorganization, the combination will be accounted for by the method of accounting for tax-free mergers of investment companies. Following the acquisition, DWS Capital Growth VIP will be the accounting survivor. In accordance with accounting principles generally accepted in the United States of America, the historical cost of investment securities will be carried forward to the surviving fund and the results of operations for pre-combination periods will not be restated. The merger costs are currently estimated to be $425,000, of which $225,000 will be borne by DWS Technology VIP and $200,000 will be borne by DWS Health Care VIP. The pro forma information provided herein should be read in conjunction with the financial statements of DWS Capital Growth VIP, DWS Technology VIP and DWS Health Care VIP included in the annual report of each Fund, in each case dated December 31, 2010. The unaudited pro forma information set forth below reflects adjustments made to expenses for contractual rates, duplicate services and other services that would not have occurred if the Reorganization took place on January 1, 2010. This pro forma information has been derived from the books and records of each Fund utilized in calculating daily net asset value for each Fund and has been prepared in accordance with accounting principles generally accepted in the United States of America which require the use of management estimates. Actual results could differ from those estimates.
On a pro forma basis, for the one-year period ended December 31, 2010, the proposed reorganization of DWS Technology VIP and DWS Health Care VIP into DWS Capital Growth VIP would have resulted in the following relative increases (decreases) to expenses actually charged to DWS Capital Growth VIP during that period:
| | | | |
Management Fee | | ($ | 366,585 | ) |
Audit fee | | ($ | 64,563 | ) |
Custody fee | | ($ | 37,107 | ) |
Reports to shareholders | | ($ | 24,118 | ) |
The merger of DWS Technology VIP into DWS Capital Growth VIP is not contingent upon the approval of the merger of DWS Health Care VIP. On a pro forma basis, for the one-year period ended December 31, 2010, the proposed reorganization of DWS Technology VIP into DWS Capital Growth VIP would have resulted in the following relative increases (decreases) to expenses actually charged to DWS Capital Growth during that period:
| | | | |
Management Fee | | ($ | 218,460 | ) |
Audit fee | | ($ | 42,230 | ) |
Custody fee | | ($ | 27,811 | ) |
Reports to shareholders | | ($ | 30,650 | ) |
The merger of DWS Health Care VIP into DWS Capital Growth VIP is not contingent upon the approval of the merger of DWS Technology VIP. On a pro forma basis, for the one-year period ended December 31, 2010, the proposed reorganization of DWS Health Care VIP into DWS Capital Growth VIP would have resulted in the following relative increases (decreases) to expenses actually charged to DWS Capital Growth VIP during that period:
| | | | |
Management Fee | | ($ | 148,125 | ) |
Audit fee | | ($ | 23,484 | ) |
Custody fee | | ($ | 27,777 | ) |
Reports to shareholders | | ($ | 2,128 | ) |
Pursuant to the Investment Management Agreement, DWS Capital Growth VIP pays a monthly management fee to Deutsche Investment Management Americas Inc. (“DIMA”) based on DWS Capital Growth VIP’s average daily net assets, computed and accrued daily and payable monthly, at the following annual rates:
First $250 million of the DWS Capital Growth VIP’s average daily net assets ..390%
Next $750 million of such net assets .365%
Over $1 billion of such net assets .340%
Pursuant to the Investment Management Agreement, DWS Technology VIP pays a monthly management fee to DIMA based on DWS Technology VIP’s average daily net assets, computed and accrued daily and payable monthly, at the following annual rates:
First $250 million of the DWS Technology VIP’s average daily net assets .665%
Next $750 million of such net assets .635%
Next $1.5 billion of such net assets .615%
Next $2.5 billion of such net assets .595%
Next $2.5 billion of such net assets ..565%
Next $2.5 billion of such net assets .555%
Next $2.5 billion of such net assets .545%
Over $12.5 billion of such net assets .535%
Pursuant to the Investment Management Agreement, DWS Health Care VIP pays a monthly management fee to DIMA based on DWS Health Care VIP’s average daily net assets, computed and accrued daily and payable monthly, at the following annual rates:
First $250 million of the DWS Health Care VIP’s average daily net assets .665%
Next $750 million of such net assets .640%
Next $1.5 billion of such net assets .615%
Next $2.5 billion of such net assets .595%
Next $2.5 billion of such net assets .565%
Next $2.5 billion of such net assets .555%
Next $2.5 billion of such net assets ..545%
Over $12.5 billion of such net assets .535%
Pursuant to an Administrative Services Agreement, DIMA provides most administrative services to DWS Capital Growth VIP, DWS Technology VIP and DWS Health Care VIP. For all services provided under the Administrative Services Agreement, each fund pays DIMA an annual fee (“Administration Fee”) of 0.10% of the fund’s average daily net assets, computed and accrued daily and payable monthly.
DWS Investments Service Company (“DISC”), an affiliate of DIMA, is the transfer agent and dividend-disbursing agent for DWS Capital Growth VIP, DWS Technology VIP and DWS Health Care VIP.
As of December 31, 2010, the net assets of DWS Capital Growth VIP were $741,056,060, the net assets of DWS Technology VIP were $75,700,068 and the net assets of DWS Health Care VIP were $48,411,030. The net assets of the combined fund as of December 31, 2010 would have been $864,742,158, after accounting for a reduction of $425,000 due to the estimated reorganization costs of which $225,000 will be borne by DWS Technology VIP and $200,000 will be borne by DWS Health Care VIP.
The net assets of the combined fund for the merger of only DWS Capital Growth VIP and DWS Technology VIP as of December 31, 2010 would have been $816,531,128, after accounting for a reduction of $225,000 due to the estimated reorganization costs which will be borne by DWS Technology VIP.
The net assets of the combined fund for the merger of only DWS Capital Growth VIP and DWS Health Care VIP as of December 31, 2010 would have been $789,267,090, after accounting for a reduction of $200,000 due to the estimated reorganization costs which will be borne by DWS Health Care VIP.
No significant accounting policies will change as the result of the proposed reorganization.
DIMA anticipates selling approximately 70% of DWS Technology VIP’s investments and approximately 90% of DWS Health Care VIP’s investments prior to the merger and the proceeds reinvested in other securities so that at the time of the merger, each Acquired Fund’s portfolio will conform more closely to DWS Capital Growth VIP’s current implementation of its investment objective, policies, restrictions and strategies. The estimated transaction costs in connection with repositioning of the DWS Technology VIP’s and DWS Health Care VIP’s investments are $63,000 and $50,000, respectively.
Federal Income Taxes
At December 31, 2010, DWS Capital Growth VIP had a net tax basis capital loss carryforward of approximately $163,203,000, which may be applied against any realized net taxable capital gains of each succeeding year until fully utilized or until December 31, 2011 ($69,353,000), December 31, 2012 ($28,616,000), December 31, 2015 ($6,163,000), December 31, 2016 ($20,912,000) and December 31, 2017 ($38,159,000), the respective expiration dates, whichever occurs first and which may be subject to certain limitations under Sections 382-384 of the Internal Revenue Code.
At December 31, 2010, DWS Health Care VIP had no capital loss carryforwards.
At December 31, 2010, DWS Technology VIP had a net tax basis capital loss carryforward of approximately $105,417,000, which may be applied against any realized net taxable capital gains of each succeeding year until fully utilized or until December 31, 2011($71,516,000), December 31, 2016 ($13,148,000) and December 31, 2017 ($20,753,000), the respective expiration dates, whichever occurs first.
It is each Fund’s policy to comply with the requirements of the Internal Revenue Code, as amended, which are applicable to regulated investment companies, and to distribute all of their taxable income to shareholders. After the acquisition, DWS Capital Growth VIP intends to continue to qualify as a regulated investment company.
STATEMENT OF ADDITIONAL INFORMATION
MAY 1, 2010 AS REVISED MAY 10, 2010
DWS VARIABLE SERIES I
DWS INVESTMENTS VIT FUNDS
CLASS A, CLASS B AND CLASS B2 SHARES
ONE BEACON STREET, BOSTON, MASSACHUSETTS 02108
This combined Statement of Additional Information ("SAI") is not a prospectus
and should be read in conjunction with the applicable combined prospectus for
DWS Variable Series I and DWS Investments VIT Funds, dated May 1, 2010 as
supplemented from time to time, a copy of which may be obtained without charge
by calling (800) 728-3337. This SAI is incorporated by reference into the
prospectus.
Portions of the Annual Report to Shareholders of each fund are incorporated
herein by reference, as specified herein, and are hereby deemed to be part of
this SAI. Reports to Shareholders may also be obtained without charge by
calling (800) 728-3337.
This SAI is divided into two Parts - Part I and Part II. Part I contains
information that is specific to each fund, while Part II contains information
that generally applies to each of the funds in the DWS funds.
DWS Variable Series I offers a choice of 6 funds and DWS Investments VIT Funds
offers 2 funds to holders of certain variable life insurance and variable
annuity contracts offered by participating insurance companies ("Participating
Insurance Companies").
Except as noted below, each fund offers Class A and Class B shares. The funds
are:
DWS VARIABLE SERIES I DWS INVESTMENTS VIT FUNDS
------------------------------ -----------------------------------------------
DWS BOND VIP (CLASS A ONLY) DWS EQUITY 500 INDEX VIP (CLASSES A, B AND B2)
DWS GROWTH & INCOME VIP DWS SMALL CAP INDEX VIP
DWS CAPITAL GROWTH VIP
DWS GLOBAL OPPORTUNITIES VIP
DWS INTERNATIONAL VIP
DWS HEALTH CARE VIP
[DWS INVESTMENTS LOGO]
Deutsche Bank Group
STATEMENT OF ADDITIONAL INFORMATION (SAI) - PART I
PAGE
Part I................................................................................... I-1
Definitions............................................................................ I-1
Fund Organization...................................................................... I-1
Management of Each Fund................................................................ I-3
Distribution Plan Payments............................................................. I-4
Portfolio Transactions and Brokerage Commissions....................................... I-4
Investments............................................................................ I-4
Investment Restrictions................................................................ I-4
Taxes.................................................................................. I-7
Independent Registered Public Accounting Firm, Reports to Shareholders and Financial
Statements............................................................................. I-7
Additional Information................................................................. I-7
Part I: Appendix I-A - Board Member Share Ownership and Control........................ I-8
Part I: Appendix I-B - Board Committees and Meetings................................... I-15
Part I: Appendix I-C - Board Member Compensation....................................... I-19
Part I: Appendix I-D - Portfolio Management............................................ I-21
Part I: Appendix I-E - Affiliated Service Provider Compensation........................ I-30
Part I: Appendix I-F - Distribution Plan Payments...................................... I-36
Part I: Appendix I-G - Portfolio Transactions and Brokerage Commissions................ I-37
Part I: Appendix I-H - Investment Practices and Techniques............................. I-45
Part I: Appendix I-I - Additional Information.......................................... I-49
Part II.................................................................................. II-1
PART I
DEFINITIONS
"1934 Act" - the Securities Exchange Act of 1934, as amended
"1940 Act" - the Investment Company Act of 1940, as amended
"Code" - the Internal Revenue Code of 1986, as amended
"DeAM" - Deutsche Asset Management
"DIMA" or "Advisor" or "Administrator" - Deutsche Investment Management
Americas Inc., 345 Park Avenue, New York, New York 10154
"Subadvisor" - Northern Trust Investments, N.A., 50 South LaSalle Street,
Chicago, IL 60603 for DWS Equity 500 Index VIP and DWS Small Cap Index VIP
"DIDI" or "Distributor" - DWS Investments Distributors, Inc., 222 South
Riverside Plaza, Chicago, Illinois 60606
"DISC" or "Transfer Agent" - DWS Investments Service Company, 210 W. 10th
Street, Kansas City, Missouri 64105-1614
"DIFA" - DWS Investments Fund Accounting Corporation, One Beacon Street,
Boston, Massachusetts 02108 (formerly Scudder Fund Accounting Corporation)
"DWS funds" - The US registered investment companies advised by DIMA
"Board Members" - Members of the Board of Trustees of a Trust
"Board" - Board of Trustees of a Trust
"Independent Board Members"- Board Members who are not interested persons (as
defined in the 1940 Act)
"fund" or "series" - DWS Bond VIP, DWS Growth & Income VIP, DWS Capital Growth
VIP, DWS Global Opportunities VIP, DWS International VIP, DWS Health Care VIP,
DWS Equity 500 Index VIP and/or DWS Small Cap Index VIP as the context may
require
"Custodian" - For all funds (other than DWS Global Opportunities VIP and DWS
International VIP): State Street Bank and Trust Company, Lafayette Corporate
Center, 2 Avenue De Lafayette, Boston, MA 02111; for DWS Global Opportunities
VIP and DWS International VIP: JPMorgan Chase, N.A, 1 Chase Manhattan Plaza,
New York, NY 10005-1401
"Fund Legal Counsel" - For series of DWS Variable Series I: Ropes & Gray LLP,
One International Place, Boston, MA 02110. For series of DWS Investments VIT
Funds: Vedder Price P.C., 222 North LaSalle Street, Chicago, IL 60601
"Trustee/Director Legal Counsel" - Ropes & Gray LLP, One International Place,
Boston, MA 02110-2624
"Trust" - DWS Variable Series I or DWS Investments VIT Funds, as applicable
(each a "Trust," together the "Trusts")
"NRSRO"- A nationally recognized statistical rating organization
"S&P" - Standards & Poor's Ratings Group, an NRSRO
"Moody's" - Moody's Investors Service, Inc., an NRSRO
"Fitch" - Fitch Investors Service, Inc., an NRSRO
FUND ORGANIZATION
DWS Bond VIP, DWS Growth & Income VIP, DWS Capital Growth VIP, DWS Global
Opportunities VIP, DWS International VIP and DWS Health Care VIP are each a
series of DWS Variable Series I, a Massachusetts business trust established
under an Amended and Restated Agreement and Declaration of Trust dated October
24, 1997, as amended from time to time. On February 6, 2006, Scudder Variable
Series I was renamed DWS Variable Series I. On February 6, 2006, Bond Portfolio
was renamed DWS Bond VIP, Growth & Income Portfolio was renamed DWS Growth &
Income VIP, Capital Growth Portfolio was renamed DWS Capital Growth VIP, Global
Discovery Portfolio was renamed DWS Global Opportunities VIP, International
Portfolio was renamed DWS International VIP and Health Sciences Portfolio was
renamed DWS Health Care VIP.
DWS Equity 500 Index VIP and DWS Small Cap Index VIP are series of DWS
Investments VIT Funds, a registered open-end management investment company
organized as a Massachusetts business trust under the
I-1
laws of Massachusetts on January 18, 1996. On February 6, 2006, Scudder
Investments VIT Funds was renamed DWS Investments VIT Funds. On September 19,
2005, Scudder VIT Equity 500 Index Fund acquired the assets of SVS Index 500
Portfolio. On February 6, 2006, Scudder VIT Equity 500 Index Fund was renamed
DWS Equity 500 Index VIP and Scudder VIT Small Cap Index Fund was renamed DWS
Small Cap Index VIP.
Each Trust is governed by an Amended and Restated Declaration of Trust dated
October 24, 1997 for DWS Variable Series I and January 18, 1996 for DWS
Investments VIT Funds, as may be further amended from time to time (the
"Declaration of Trust"). The Declaration of Trust was last approved by
shareholders in 2006 for DWS Variable Series I and DWS Investments VIT Funds.
The Board has the authority to divide the shares of each Trust into multiple
funds by establishing and designating two or more series of each Trust. The
Board also has the authority to establish and designate two or more classes of
shares of each Trust, or of any series thereof, with variations in the relative
rights and preferences between the classes as determined by the Board; provided
that all shares of a class shall be identical with each other and with the
shares of each other class of the same series except for such variations
between the classes, including bearing different expenses, as may be authorized
by the Board and not prohibited by the 1940 Act and the rules and regulations
thereunder. All shares issued and outstanding are transferable, have no
pre-emptive or conversion rights (except as may be determined by the Board) and
are redeemable as described in the SAI and in the prospectus. Each share has
equal rights with each other share of the same class of the fund as to voting,
dividends, exchanges, conversion features and liquidation. Shareholders are
entitled to one vote for each full share held and fractional votes for
fractional shares held.
A fund generally is not required to hold meetings of its shareholders. Under
the Declaration of Trust, shareholders only have the power to vote in
connection with the following matters and only to the extent and as provided in
the Declaration of Trust and as required by applicable law: (a) the election,
re-election or removal of one or more Trustees if a meeting of shareholders is
called by or at the direction of the Board for such purpose(s), provided that
the Board shall promptly call a meeting of shareholders for the purpose of
voting upon the question of removal of one or more Trustees as a result of a
request in writing by the holders of not less than ten percent of the
outstanding shares of the Trust; (b) the termination of the Trust or a fund if,
in either case, the Board submits the matter to a vote of shareholders; (c) any
amendment of the Declaration of Trust that (i) would affect the rights of
shareholders to vote under the Declaration of Trust, (ii) requires shareholder
approval under applicable law or (iii) the Board submits to a vote of
shareholders; and (d) such additional matters as may be required by law or as
the Board may determine to be necessary or desirable. Shareholders also vote
upon changes in fundamental policies or restrictions.
The Declaration of Trust provides that shareholder meeting quorum requirements
shall be established in the By-laws. The By-laws of each Trust currently
provide that the presence in person or by proxy of the holders of thirty
percent of the shares entitled to vote at a meeting shall constitute a quorum
for the transaction of business at meetings of shareholders of each Trust (or
of an individual series or class if required to vote separately).
On any matter submitted to a vote of shareholders, all shares of each Trust
entitled to vote shall, except as otherwise provided in the By-laws, be voted
in the aggregate as a single class without regard to series or classes of
shares, except (a) when required by applicable law or when the Board has
determined that the matter affects one or more series or classes of shares
materially differently, shares shall be voted by individual series or class;
and (b) when the Board has determined that the matter affects only the
interests of one or more series or classes, only shareholders of such series or
classes shall be entitled to vote thereon.
The Declaration of Trust provides that the Board may, in its discretion,
establish minimum investment amounts for shareholder accounts, impose fees on
accounts that do not exceed a minimum investment amount and involuntarily
redeem shares in any such account in payment of such fees. The Board, in its
sole discretion, also may cause each Trust to redeem all of the shares of the
Trust or one or more series or classes held by any shareholder for any reason,
to the extent permissible by the 1940 Act, including (a) if the shareholder
owns shares having an aggregate net asset value of less than a specified
minimum amount, (b) if a particular shareholder's ownership of shares would
disqualify a series from being a regulated investment company, (c) upon a
shareholder's failure to provide sufficient identification to permit the Trust
to verify the shareholder's identity, (d) upon a shareholder's failure to pay
for shares or meet or maintain the qualifications for ownership of a particular
class or series of shares, (e) if the Board determines (or pursuant to policies
established by the Board it is determined) that share ownership by a particular
shareholder
I-2
is not in the best interests of remaining shareholders, (f) when a fund is
requested or compelled to do so by governmental authority or applicable law and
(g) upon a shareholder's failure to comply with a request for information with
respect to the direct or indirect ownership of shares or other securities of
the Trust. The Declaration of Trust also authorizes the Board to terminate a
fund or any class without shareholder approval, and each Trust may suspend the
right of shareholders to require each Trust to redeem shares to the extent
permissible under the 1940 Act.
The Declaration of Trust provides that, except as otherwise required by
applicable law, the Board may authorize the Trust or any series or class
thereof to merge, reorganize or consolidate with any corporation, association,
trust or series thereof (including another series or class of the Trust) or
other entity (in each case, the "Surviving Entity") or the Board may sell,
lease or exchange all or substantially all of the Trust property (or all or
substantially all of the Trust property allocated or belonging to a particular
series or class) including its good will to any Surviving Entity, upon such
terms and conditions and for such consideration as authorized by the Board.
Such transactions may be effected through share-for-share exchanges, transfers
or sales of assets, in-kind redemptions and purchases, exchange offers or any
other method approved by the Board. The Board shall provide notice to affected
shareholders of each such transaction. The authority of the Board with respect
to the merger, reorganization or consolidation of any class of the Trust is in
addition to the authority of the Board to combine two or more classes of a
series into a single class.
Upon the termination of each Trust or any series or class, after paying or
adequately providing for the payment of all liabilities which may include the
establishment of a liquidating trust or similar vehicle, and upon receipt of
such releases, indemnities and refunding agreements as they deem necessary for
their protection, the Board may distribute the remaining Trust property or
property of the series or class, in cash or in kind or partly each, to the
shareholders of the Trust or the series or class involved, ratably according to
the number of shares of the Trust or such series or class held by the several
shareholders of the Trust or such series or class on the date of termination,
except to the extent otherwise required or permitted by the preferences and
special or relative rights and privileges of any classes of shares of a series
involved, provided that any distribution to the shareholders of a particular
class of shares shall be made to such shareholders pro rata in proportion to
the number of shares of such class held by each of them. The composition of any
such distribution (e.g., cash, securities or other assets) shall be determined
by the Trust in its sole discretion, and may be different among shareholders
(including differences among shareholders in the same series or class).
Under Massachusetts law, shareholders of a Massachusetts business trust could,
under certain circumstances, be held personally liable for obligations of a
fund. The Declaration of Trust, however, disclaims shareholder liability for
acts or obligations of the fund and requires that notice of such disclaimer be
given in each agreement, obligation, or instrument entered into or executed by
a fund or a fund's trustees. Moreover, the Declaration of Trust provides for
indemnification out of fund property for all losses and expenses of any
shareholder held personally liable for the obligations of the fund and the fund
may be covered by insurance which the Board considers adequate to cover
foreseeable tort claims. Thus, the risk of a shareholder incurring financial
loss on account of shareholder liability is limited to circumstances in which a
disclaimer is inoperative and a fund itself is unable to meet its obligations.
MANAGEMENT OF EACH FUND
BOARD MEMBERS AND OFFICERS' IDENTIFICATION AND BACKGROUND
The identification and background of the Board Members and officers are set
forth in PART II - APPENDIX II-A.
BOARD COMMITTEES AND COMPENSATION
Compensation paid to the Independent Board Members, for certain specified
periods, as well as information regarding the committees of the Board, is set
forth in PART I - APPENDIX I-B and PART I - APPENDIX I-C.
BOARD MEMBER SHARE OWNERSHIP AND CONTROL PERSONS
Information concerning the ownership of fund shares by Board Members and
officers, as a group, as well as the dollar range value of each Board Member's
share ownership in each fund and, on an aggregate basis, in all DWS funds
overseen, by investors who control the fund, if any, and by investors who own
5% or more of any class of fund shares, if any, is set forth in PART I -
APPENDIX I-A.
I-3
PORTFOLIO MANAGEMENT
Information regarding each fund's portfolio manager(s), including other
accounts managed, compensation, ownership of fund shares and possible conflicts
of interest, is set forth in PART I - APPENDIX I-D and PART II - APPENDIX II-B.
This section does not apply to money market funds.
AFFILIATED SERVICE PROVIDER COMPENSATION
Compensation paid by each fund to its affiliated service providers for various
services including investment management, administrative, transfer agency, and,
for certain funds, fund accounting services, is set forth in PART I - APPENDIX
I-E. For information regarding payments made to DIDI, see PART I - APPENDIX
I-E. Fee rates for services of the above referenced affiliated service
providers are included in PART II - APPENDIX II-C.
DISTRIBUTION PLAN PAYMENTS
DISTRIBUTION PLAN PAYMENTS
Payments made by each fund for the most recent fiscal year under each fund's
Rule 12b-1 Plans are set forth in PART I - APPENDIX I-F. This information is
not applicable to a fund/class that does not incur expenses paid in connection
with Rule 12b-1 Plans.
PORTFOLIO TRANSACTIONS AND BROKERAGE COMMISSIONS
PORTFOLIO TURNOVER
The portfolio turnover rates for the two most recent fiscal year are set forth
in PART I - APPENDIX I-G. This section does not apply to money market funds or
to a new fund that has not completed a fiscal reporting period.
BROKERAGE COMMISSIONS
Total brokerage commissions paid by each fund for the three most recent fiscal
years are set forth in PART I - APPENDIX I-G.
Each fund's policy with respect to portfolio transactions and brokerage is set
forth under "Portfolio Transactions" in Part II of this SAI.
INVESTMENTS
GENERAL INVESTMENT PRACTICES AND TECHNIQUES
PART I - APPENDIX I-H includes a list of the investment practices and
techniques which each fund may employ in pursuing its investment objective.
PART II - APPENDIX II-G includes a description of these investment practices
and techniques as well as the associated risks.
INVESTMENT RESTRICTIONS
Unless otherwise stated, the policies below apply to each fund.
Except as otherwise indicated, each fund's investment objective and policies
are not fundamental and may be changed without a vote of shareholders. There
can be no assurance that each fund's investment objective will be met.
Any investment restrictions herein which involve a maximum percentage of
securities or assets shall not be considered to be violated unless an excess
over the percentage occurs immediately after and is caused by an acquisition or
encumbrance of securities or assets of, or borrowings by, a fund.
Each fund has elected to be classified as a diversified series of an open-end
management investment company. A diversified fund may not, with respect to 75%
of total assets, invest more than 5% of total assets in the securities of a
single issuer (other than cash and cash items, US government securities or
securities of other investment companies) or invest in more than 10% of the
outstanding voting securities of such issuer.
Unless specified to the contrary, the following fundamental policies may not be
changed without the approval of a majority of the outstanding voting securities
of a fund which, under the 1940 Act and the rules thereunder and as used in
this SAI, means the lesser of (1) 67% or more of the voting securities present
at such meeting, if the holders of more than 50% of the outstanding voting
securities of a fund are present or represented by proxy, or (2) more than 50%
of the outstanding voting securities of a fund.
As a matter of fundamental policy, a fund may not do any of the following:
(1) borrow money, except as permitted under the 1940 Act, and as interpreted
or modified by regulatory authority having jurisdiction, from time to
time.
I-4
(2) issue senior securities, except as permitted under the 1940 Act, and as
interpreted or modified by regulatory authority having jurisdiction,
from time to time.
(3) purchase or sell commodities, except as permitted by the 1940 Act, and
as interpreted or modified by the regulatory authority having
jurisdiction, from time to time.
(4) engage in the business of underwriting securities issued by others,
except to the extent that the fund may be deemed to be an underwriter in
connection with the disposition of portfolio securities.
(5) purchase or sell real estate, which term does not include securities of
companies which deal in real estate or mortgages or investments secured
by real estate or interests therein, except that the fund reserves
freedom of action to hold and to sell real estate acquired as a result
of the fund's ownership of securities.
(6) make loans except as permitted under the 1940 Act, and as interpreted or
modified by regulatory authority having jurisdiction, from time to time.
(7) (for all funds except DWS Health Care VIP) concentrate its investments
in a particular industry, as that term is used in the 1940 Act, and as
interpreted or modified by regulatory authority having jurisdiction,
from time to time.
OTHER INVESTMENT POLICIES. The Board has adopted certain non-fundamental
policies and restrictions which are observed in the conduct of a fund's
affairs. They differ from fundamental investment policies in that they may be
changed or amended by action of the Board without requiring prior notice to, or
approval of, the shareholders.
As a matter of non-fundamental policy:
(1) the fund may not purchase illiquid securities, including time deposits
and repurchase agreements maturing in more than seven days, if, as a
result, more than 15% of the fund's net assets would be invested in such
securities.
(2) (for DWS Equity 500 Index VIP and DWS Small Cap Index VIP only) any
commercial paper issued by a foreign entity corporation and purchased by
the fund must be US dollar denominated and must not be subject to
foreign withholding tax at the time of purchase.
(3) (for DWS Equity 500 Index VIP and DWS Small Cap Index VIP only) at the
time the fund invests in commercial paper, bank obligations or
repurchase agreements, the issuer or the issuer's parent must have
outstanding debt rated AA or higher by S&P or Aa or higher by Moody's;
outstanding commercial paper or bank obligations rated A-1 by S&P or
Prime-1 by Moody's or, if no such ratings are available, the instrument
must be deemed to be of comparable quality in the opinion of the
Advisor.
(4) (for DWS Equity 500 Index VIP and DWS Small Cap Index VIP only)
commercial paper when purchased by the fund must be rated in the highest
short-term rating category by any two NRSROs (or one NRSRO if that NRSRO
is the only such NRSRO which rates such security) or, if not so rated,
must be believed by the Advisor to be of comparable quality.
(5) (for DWS Bond VIP only) the fund may invest in all types of direct debt
investments, but among these investments the fund currently intends to
invest primarily in direct loans and trade claims.
(6) (for DWS Bond VIP only) the fund may not invest more than 25% of its
total assets in bonds from foreign issuers.
(7) (for DWS Bond VIP only) the fund may not invest more than 25% of its
assets in non-US dollar denominated foreign debt securities.
(8) (for DWS Growth & Income VIP and DWS Capital Growth VIP only) the fund
may not invest more than 25% of its assets in non-US dollar denominated
equity securities of foreign issuers.
(9) (for DWS Bond VIP only) the fund has no current intention of purchasing
tax-exempt municipal obligations that would amount to greater than 5% of
the fund's total assets.
(10) (for all funds except DWS Equity 500 Index VIP and DWS Small Cap Index
VIP) if a participation interest in which the fund invests is unrated,
or has been given a rating below that which is permissible for purchase
by the fund, the participation interest will be backed by an irrevocable
letter of credit or guarantee of a bank, or the payment obligation
otherwise will be collateralized by US Government securities, or, in the
case of unrated participation
I-5
interests, determined by the Advisor to be of comparable quality to
those instruments in which the fund may invest.
(11) (for all funds except DWS Equity 500 Index VIP and DWS Small Cap Index
VIP) the fund will enter into reverse repurchase agreements only when
the Advisor or Subadvisor believes that the interest income to be earned
from the investment or proceeds of the transaction will be greater than
the interest expense of the transaction.
(12) (for DWS Equity 500 Index VIP and DWS Small Cap Index VIP only) the fund
will not enter into when-issued commitments exceeding in the aggregate
15% of the market value of the fund's total assets, less liabilities
other than the obligations created by when-issued commitments.
(13) (for all funds except DWS Equity 500 Index VIP and DWS Small Cap Index
VIP) the fund may not purchase options, unless the aggregate premiums
paid on all such options held by the fund at any time do not exceed 20%
of its total assets; or sell put options, if as a result, the aggregate
value of the obligations underlying such put options would exceed 50% of
its total assets.
(14) (for all funds except DWS Equity 500 Index VIP and DWS Small Cap Index
VIP) the fund may not purchase warrants if as a result, such securities,
taken at the lower of cost or market value would represent more than 5%
of the value of the fund's total assets (for this purpose, warrants
acquired in units or attached to securities will be deemed to have no
value).
(15) (for DWS Capital Growth VIP and DWS International VIP only) the fund may
write covered call and put options on no more than 5% of assets, the
value of aggregate premiums paid for all put and call options will not
exceed 20% of assets.
(16) (for DWS Small Cap Index VIP only) the fund may invest up to 5% of its
total assets in warrants listed on the NYSE or ASE (2% of its total
assets in warrants not listed on the NYSE or ASE).
(17) (for all funds except DWS Equity 500 Index VIP and DWS Small Cap Index
VIP) the fund may not acquire securities of registered open-end
investment companies or registered unit investment trusts in reliance on
Sections 12(d)(1)(F) or 12(d)(1)(G) of the 1940 Act.
(18) the fund may not acquire securities of other investment companies,
except as permitted by the 1940 Act and the rules, regulations and any
applicable exemptive order issued thereunder.
(19) (for all funds except DWS Equity 500 Index VIP and DWS Small Cap Index
VIP) the Board has the discretion to retain the current distribution
arrangement for the fund while investing in a master fund in a
master-feeder structure (this policy would permit the Board, without
shareholder approval to convert the fund to a master-feeder structure).
(20) (for all funds except DWS Equity 500 Index VIP and DWS Small Cap Index
VIP) the fund will not sell put options if, as a result, more than 50%
of the fund's total assets would be required to be segregated to cover
its potential obligations under such put options other than those with
respect to futures and options thereon.
(21) (for all funds except DWS Equity 500 Index VIP and DWS Small Cap Index
VIP) the fund generally will not enter into a transaction to hedge
currency exposure to an extent greater, after netting all transactions
intended wholly or partially to offset other transactions, than the
aggregate market value (at the time of entering into the transaction) of
the securities held in its portfolio that are denominated or generally
quoted in or currently convertible into such currency, other than with
respect to proxy hedging or cross hedging.
(22) (for all funds except DWS Equity 500 Index VIP and DWS Small Cap Index
VIP) the fund will not sell interest rate caps or floors where it does
not own securities or other instruments providing the income stream the
fund may be obligated to pay.
(23) (for DWS Bond VIP only) the fund will limit its currency exposure to 15%
of its total assets measured by the market value of non-U.S. dollar
holdings netted with the market value of currency forward contracts.
(24) (for DWS Bond VIP only) will only sell credit protection with respect to
securities in which it would be authorized to invest directly.
(25) (for all funds except DWS Bond VIP, DWS Equity 500 Index VIP and DWS
Small Cap Index VIP) no more than 5% of total assets may be invested in
credit default swaps for purposes of buying credit
I-6
protection on individual securities if the fund does not own the
underlying security or securities at the time of investment.
For purposes of non-fundamental policy (1), and for so long as it remains a
position of the SEC, fixed time deposits maturing in more than seven days that
cannot be traded on a secondary market and participation interests in loans
will be treated as illiquid. Restricted securities (including commercial paper
issued pursuant to Section 4(2) of the Securities Act of 1933) that the Board
has determined to be readily marketable will not be deemed to be illiquid for
purposes of non-fundamental policy (1).
TAXES
Important information concerning the tax consequences of an investment in each
fund is contained in PART II - APPENDIX II-H.
INDEPENDENT REGISTERED PUBLIC ACCOUNTING FIRM, REPORTS TO SHAREHOLDERS AND
FINANCIAL STATEMENTS
The financial highlights of each fund included in the prospectus and the
financial statements incorporated by reference into this SAI have been so
included or incorporated by reference in reliance on the report of
PricewaterhouseCoopers LLP, 125 High Street, Boston, MA 02110.
PricewaterhouseCoopers LLP is an independent registered public accounting firm.
The report is given on the authority of said firm as experts in auditing and
accounting. The accounting firm audits the financial statements of each fund
and provides other audit, tax and related services. Shareholders will receive
annual audited financial statements and semi-annual unaudited financial
statements.
The financial statements, together with the report of the Independent
Registered Public Accounting Firm, Financial Highlights and notes to financial
statements in the Annual Report to the Shareholders of each fund, dated
December 31, 2009 (SEC File No. DWS Variable Series I 811-04257 and DWS
Investments VIT Funds 811-07507), are incorporated herein by reference and are
hereby deemed to be a part of this combined SAI.
ADDITIONAL INFORMATION
For information on CUSIP numbers and fund fiscal year end information, see PART
I - APPENDIX I-I.
I-7
PART I: APPENDIX I-A - BOARD MEMBER SHARE OWNERSHIP AND CONTROL
BOARD MEMBER SHARE OWNERSHIP IN EACH FUND
The following tables show the dollar range of equity securities beneficially
owned by each Board Member in each fund and in DWS funds as of December 31,
2009.
DOLLAR RANGE OF BENEFICIAL OWNERSHIP/(1)/
BOARD MEMBER DWS VARIABLE SERIES I DWS INVESTMENTS VIT FUNDS
INDEPENDENT BOARD MEMBER:
John W. Ballantine None None
Henry P. Becton, Jr. None None
Dawn-Marie Driscoll None None
Keith R. Fox None None
Paul K. Freeman None None
Kenneth C. Froewiss None None
Richard J. Herring None None
William McClayton None None
Rebecca W. Rimel None None
William N. Searcy, Jr. None None
Jean Gleason Stromberg None None
Robert Wadsworth None None
AGGREGATE DOLLAR RANGE OF BENEFICIAL OWNERSHIP/(1)/
FUNDS OVERSEEN BY
BOARD MEMBER IN THE
BOARD MEMBER DWS FUND COMPLEX
INDEPENDENT BOARD MEMBER:
John W. Ballantine Over $100,000
Henry P. Becton, Jr. Over $100,000
Dawn-Marie Driscoll Over $100,000
Keith R. Fox Over $100,000
Paul K. Freeman Over $100,000
Kenneth C. Froewiss Over $100,000
Richard J. Herring Over $100,000
William McClayton Over $100,000
Rebecca W. Rimel Over $100,000
William N. Searcy, Jr. Over $100,000
Jean Gleason Stromberg Over $100,000
Robert Wadsworth Over $100,000
INTERESTED BOARD MEMBER:
Ingo Gefeke/(2)/ None
(1) Securities beneficially owned as defined under the 1934 Act include
direct and/or indirect ownership of securities where the Board Member's
economic interest is tied to the securities, employment ownership and
securities when the Board Member can exert voting power and when the
Board Member has authority to sell the securities. The dollar ranges are:
None, $1 - $10,000, $10,001 - $50,000, $50,001 - $100,000, over $100,000.
I-8
(2) Mr. Gefeke is a board member of the following trusts and corporations:
Cash Account Trust, DWS Balanced Fund, DWS Blue Chip Fund, DWS Equity
Trust, DWS High Income Series, DWS Money Funds, DWS State Tax-Free Income
Series, DWS Strategic Government Securities Fund, DWS Strategic Income
Fund, DWS Target Fund, DWS Technology Fund, DWS Value Series, Inc., DWS
Variable Series II, Investors Cash Trust, Tax-Exempt California Money
Market Fund, DWS Dreman Value Income Edge Fund, Inc., DWS Global High
Income Fund, Inc., DWS High Income Trust, DWS Multi-Market Income Trust,
DWS Municipal Income Trust, DWS RREEF World Real Estate & Tactical
Strategies Fund, Inc., DWS Strategic Income Trust, and DWS Strategic
Municipal Income Trust.
OWNERSHIP IN SECURITIES OF THE ADVISOR AND RELATED COMPANIES
As reported to each fund, the information in the table below reflects ownership
by the Independent Board Members and their immediate family members of certain
securities as of December 31, 2009. An immediate family member can be a spouse,
children residing in the same household including step and adoptive children
and any dependents. The securities represent ownership in the Advisor or
Distributor and any persons (other than a registered investment company)
directly or indirectly controlling, controlled by, or under common control with
the Advisor or Distributor (including Deutsche Bank AG).
OWNER AND VALUE OF PERCENT OF
INDEPENDENT RELATIONSHIP TO TITLE OF SECURITIES ON AN CLASS ON AN
BOARD MEMBER BOARD MEMBER COMPANY CLASS AGGREGATE BASIS AGGREGATE BASIS
John W. Ballantine None
Henry P. Becton, Jr. None
Dawn-Marie Driscoll None
Keith R. Fox None
Paul K. Freeman None
Kenneth C. Froewiss None
Richard J. Herring None
William McClayton None
Rebecca W. Rimel None
William N. Searcy, Jr. None
Jean Gleason Stromberg None
Robert H. Wadsworth None
As of April 7, 2010, all Board Members and officers owned, as a group, less
than 1% of the outstanding shares of a fund.
25% OR GREATER OWNERSHIP
No investor owns 25% or more of a fund's shares as of April 7, 2010, and
therefore there is no presumed control of a fund, except as noted below.
Shareholders who beneficially own 25% or more of a fund's shares may have a
significant impact on any shareholder vote of the fund.
5% OR GREATER OWNERSHIP OF SHARE CLASSES
The following table identifies those investors who own 5% or more of a fund
share class as of April 7, 2010. All holdings are of record, unless otherwise
indicated.
DWS BOND VIP
NAME AND ADDRESS OF INVESTOR SHARES CLASS PERCENTAGE
MUTUAL OF AMERICA 10,428,357.14 A 36.89%
NEW YORK NY 10022-6815
I-9
NAME AND ADDRESS OF INVESTOR SHARES CLASS PERCENTAGE
MUTUAL OF AMERICA SEP 6,783,581.18 A 24.00%
ACCT 2
NEW YORK NY 10022-6815
ZURICH DESTINATIONS/ 2,679,382.76 A 9.48%
FARMERS FUND
C/O KILICO
ATTN INVESTMENT
ACCOUNTING LL-2W
GREENVILLE SC 29602-9097
KEMPER INVESTORS LIFE 1,778,690.80 A 6.29%
ATTN PRODUCT VALUATION
SECURITY BENEFIT
TOPEKA KS 66636-1000
DWS GROWTH & INCOME VIP
NAME AND ADDRESS OF INVESTOR SHARES CLASS PERCENTAGE
ALLMERICA LIFE SVSII 5,063,462.25 A 35.17%
ATTN PRODUCT VALUATION
TOPEKA KS 66636-1000
ZURICH DESTINATIONS/ FARMERS FUND 3,732,930.25 A 25.93%
C/O KILICO
ATTN INVESTMENT ACCOUNTING LL-2W
GREENVILLE SC 29602-9097
CHARTER NAT LIFE INS CO-HORIZON 2,136,381.90 A 14.84%
ATTN ACCTNG FINANCIAL CONTROL TEAM
PALATINE IL 60094-4210
KEMPER INVESTORS LIFE 875,219.66 A 6.08%
ATTN PRODUCT VALUATION
SECURITY BENEFIT
TOPEKA KS 66636-1000
UNITED OF OMAHA 254,992.65 B 86.24%
ATTN PRODUCT VALUATION
SECURITY BENEFIT
TOPEKA KS 66636-1000
KEMPER INVESTORS LIFE 17,936.78 B 6.07%
ATTN PRODUCT VALUATION
SECURITY BENEFIT
TOPEKA KS 66606-2541
KEMPER INVESTORS LIFE INS CO 15,937.71 B 5.39%
VARIABLE ANNUITY SEPARATE ACCOUNTS
ATTN PRODUCT VALUATION
SECURITY BENEFIT
TOPEKA KS 66636-1000
I-10
DWS CAPITAL GROWTH VIP
NAME AND ADDRESS OF INVESTOR SHARES CLASS PERCENTAGE
MUTUAL OF AMERICA SEP ACCT 2 11,865,761.74 A 29.09%
NEW YORK NY 10022-6815
ZURICH DESTINATIONS/ FARMERS FUND 9,386,829.39 A 23.01%
C/O KILICO
ATTN INVESTMENT ACCOUNTING LL-2W
GREENVILLE SC 29602-9097
ALLMERICA LIFE SVSII 5,153,280.04 A 12.63%
ATTN PRODUCT VALUATION
TOPEKA KS 66636-1000
MUTUAL OF AMERICA 5,089,689.36 A 12.48%
NEW YORK NY 10022-6815
KEMPER INVESTORS LIFE 3,872,331.41 A 9.49%
ATTN PRODUCT VALUATION
SECURITY BENEFIT
TOPEKA KS 66636-1000
CHARTER NAT LIFE INS CO-HORIZON 2,582,038.55 A 6.33%
ATTN ACCTNG FINANCIAL CONTROL TEAM
PALATINE IL 60094-4210
METLIFE INSURANCE CO OF CT 592,161.18 B 83.79%
ATTN SHAREHOLDER ACCOUNTING DEPT
HARTFORD CT 06199-0027
SYMETRA LIFE INSURANCE CO 104,674.38 B 14.81%
ATTN LIFE FINANCE
SEPARATE ACCOUNTS
BELLEVUE WA 98004-5130
DWS GLOBAL OPPORTUNITIES VIP
NAME AND ADDRESS OF INVESTOR SHARES CLASS PERCENTAGE
ZURICH DESTINATIONS/ FARMERS FUND 5,624,361.79 A 46.98%
C/O KILICO
ATTN INVESTMENT ACCOUNTING LL-2W
GREENVILLE SC 29602-9097
ALLMERICA LIFE SVSII 2,387,450.78 A 19.94%
ATTN PRODUCT VALUATION
TOPEKA KS 66636-1000
CHARTER NAT LIFE INS CO-HORIZON 1,438,495.78 A 12.02%
ATTN ACCTNG FINANCIAL CONTROL TEAM
PALATINE IL 60094-4210
LINCOLN BENEFIT LIFE ANNUTIY-270 642,067.50 A 5.36%
ATTN ACCTNG FINANCIAL CONTROL TEAM
ATTN PRODUCT VALUATION
SECURITY BENEFIT
TOPEKA KS 66636-1000
METLIFE INSURANCE CO OF CT 359,781.51 B 65.22%
ATTN SHAREHOLDER ACCOUNTING DEPT
HARTFORD CT 06199-0027
I-11
NAME AND ADDRESS OF INVESTOR SHARES CLASS PERCENTAGE
UNITED OF OMAHA 182,490.65 B 33.08%
ATTN PRODUCT VALUATION
SECURITY BENEFIT
TOPEKA KS 66636-1000
DWS INTERNATIONAL VIP
NAME AND ADDRESS OF INVESTOR SHARES CLASS PERCENTAGE
MUTUAL OF AMERICA SEP ACCT 2 12,923,795.36 A 32.02%
NEW YORK NY 10022-6815
ZURICH DESTINATIONS/ FARMERS FUND 5,211,871.32 A 12.91%
C/O KILICO
ATTN INVESTMENT ACCOUNTING LL-2W
GREENVILLE SC 29602-9097
MUTUAL OF AMERICA 3,051,641.98 A 7.56%
NEW YORK NY 10022-6815
CHARTER NAT LIFE INS CO-HORIZON 2,903,624.77 A 7.19%
ATTN ACCTNG FINANCIAL CONTROL TEAM
PALATINE IL 60094-4210
METLIFE INV USA SEP ACCT A 2,706,545.63 A 6.71%
BOSTON MA 02116-3706
UNION CENTRAL ESP INTERNATIONAL 2,402,355.39 A 5.95%
LINCOLN NE 68510-2234
ALLMERICA LIFE SVSII 2,328,028.63 A 5.77%
ATTN PRODUCT VALUATION
TOPEKA KS 66636-1000
KEMPER INVESTORS LIFE 27,681.85 B 49.69%
ATTN PRODUCT VALUATION
SECURITY BENEFIT
TOPEKA KS 66606-2541
UNITED OF OMAHA 9,710.84 B 17.43%
OMAHA NE 68175-0001
KEMPER INVESTORS LIFE INS CO 9,227.53 B 16.56%
VARIABLE ANNUITY SEPARATE ACCOUNTS
ATTN PRODUCT VALUATION
SECURITY BENEFIT
TOPEKA KS 66636-1000
SYMETRA LIFE INSURANCE CO 9,086.99 B 16.31%
ATTN LIFE FINANCE
SEPARATE ACCOUNTS
BELLEVUE WA 98004-5130
I-12
DWS HEALTH CARE VIP
NAME AND ADDRESS OF INVESTOR SHARES CLASS PERCENTAGE
ZURICH DESTINATIONS/ FARMERS FUND 2,960,529.13 A 68.61%
C/O KILICO
ATTN INVESTMENT ACCOUNTING LL-2W
GREENVILLE SC 29602-9097
ALLMERICA LIFE SVSII 971,634.59 A 22.52%
ATTN PRODUCT VALUATION
TOPEKA KS 66636-1000
GREAT-WEST LIFE & ANN SCH ANNUITY 229,534.21 A 5.32%
GREENWOOD VLG CO 80111-5002
METLIFE INSURANCE CO OF CT 265,831.32 B 98.63%
ATTN SHAREHOLDER ACCOUNTING DEPT
HARTFORD CT 06199-0027
DWS EQUITY 500 INDEX VIP
NAME AND ADDRESS OF INVESTOR SHARES CLASS PERCENTAGE
LINCOLN NATIONAL LIFE INSURANCE 33,709,651.15 A 59.85%
VARIABLE LIFE ACCOUNT M
FORT WAYNE IN 46802-3506
ZURICH DESTINATIONS/ FARMERS FUND 6,237,121.25 A 11.07%
C/O KILICO
ATTN INVESTMENT ACCOUNTING LL-2W
GREENVILLE SC 29602-9097
PHOENIX HOME LIFE INSURANCE CO 4,610,048.34 A 8.19%
ATTN MAUREEN CAMPIONE
E GREENBUSH NY 12061-4134
ALLMERICA LIFE SVSII 3,505,323.79 A 6.22%
ATTN PRODUCT VALUATION
TOPEKA KS 66636-1000
PHOENIX LIFE INSURANCE CO 2,930,596.25 A 5.20%
ATTN MAUREEN CAMPIONE
E GREENBUSH NY 12061-4134
LINCOLN NATIONAL LIFE INSURANCE 3,621,756.21 B 85.79%
VARIABLE LIFE ACCOUNT M
FORT WAYNE IN 46802-3506
LINCOLN LIFE & ANNUITY CO OF NY 278,646.46 B 6.60%
SEPARATE ACCOUNT M1
FORT WAYNE IN 46802-3506
LINCOLN BENEFIT LIFE 230,571.12 B 5.46%
VARIABLE ACCOUNT
PALATINE IL 60094-4210
THE MANUFACTURES LIFE INS CO (USA) 1,689,329.59 B2 99.91%
BOSTON MA 02116-3787
I-13
DWS SMALL CAP INDEX VIP
NAME AND ADDRESS OF INVESTOR SHARES CLASS PERCENTAGE
LINCOLN NATIONAL LIFE INSURANCE 13,644,867.93 A 54.31%
VARIABLE LIFE ACCOUNT M
FORT WAYNE IN 46802-3506
NYLIAC 2,615,166.93 A 10.41%
ATTN ASHESH UPADHYAY
PARSIPPANY NJ 07054-1007
PRUBENEFIT LAUREATE 1,441,207.39 A 5.74%
LIVINGSTON NJ 07039-2729
LINCOLN NATIONAL LIFE INSURANCE 2,143,978.38 B 46.58%
VARIABLE LIFE ACCOUNT M
FORT WAYNE IN 46802-3506
LINCOLN LIFE INSURANCE CO 1,263,832.74 B 27.46%
JPF SEPARATE ACCOUNT A
ATTN JENNIFER KROUSE MS2H17
FORT WAYNE IN 46802-3518
SUN LIFE ASSURANCE CO OF CANADA US 337,327.20 B 7.33%
ATTN VUL ACCOUNTING CNTRL SC4319
WELLESLEY HLS MA 02481
I-14
PART I: APPENDIX I-B - BOARD COMMITTEES AND MEETINGS
INFORMATION CONCERNING COMMITTEES AND MEETINGS OF THE BOARD
The Board oversees the operation of the DWS funds and meets periodically to
oversee fund activities, and to review fund performance and contractual
arrangements with fund service providers. The Board met 10 times during the
most recently completed calendar year. Each Board Member attended at least 75%
of the meetings of the Board and meetings of the Board Committees on which such
Board Member served.
BOARD LEADERSHIP STRUCTURE
A fund's Board is responsible for the general oversight of the fund's affairs
and for assuring that the fund is managed in the best interests of its
shareholders. The Board regularly reviews the fund's investment performance as
well as the quality of other services provided to the fund and its shareholders
by DIMA and its affiliates, including administration and shareholder servicing.
At least annually, the Board reviews and evaluates the fees and operating
expenses paid by the fund for these services and negotiates changes that it
deems appropriate. In carrying out these responsibilities, the Board is
assisted by the fund's auditors, independent counsel and other experts as
appropriate, selected by and responsible to the Board.
Currently, all or in some cases all but one of a fund's Board Members are
Independent Board Members, meaning that they are not considered "interested
persons" (as defined in the 1940 Act) of the fund or its investment adviser.
These Independent Board Members must vote separately to approve all financial
arrangements and other agreements with a fund's investment adviser and other
affiliated parties. The role of the Independent Board Members has been
characterized as that of a "watchdog" charged with oversight to protect
shareholders' interests against overreaching and abuse by those who are in a
position to control or influence a fund. A fund's Independent Board Members
meet regularly as a group in executive session without representatives of the
investment adviser present. An Independent Board Member currently serves as
chairman of the Board.
Taking into account the number, the diversity and the complexity of the funds
overseen by the Board Members and the aggregate amount of assets under
management in the DWS funds, the Board has determined that the efficient
conduct of its affairs makes it desirable to delegate responsibility for
certain specific matters to committees of the Board. These committees, which
are described in more detail below, review and evaluate matters specified in
their charters and make recommendations to the Board as they deem appropriate.
Each committee may utilize the resources of a fund's counsel and auditors as
well as other experts. The committees meet as often as necessary, either in
conjunction with regular meetings of the Board or otherwise. The membership and
chair of each committee are appointed by the Board upon recommendation of the
Nominating and Governance Committee. The membership and chair of each committee
consists exclusively of Independent Board Members.
The Board has determined that this committee structure also allows the Board to
focus more effectively on the oversight of risk as part of its broader
oversight of the fund's affairs. While risk management is the primary
responsibility of a fund's investment adviser, the Board regularly receives
reports regarding investment risks and compliance risks. The Board's committee
structure allows separate committees to focus on different aspects of these
risks and their potential impact on some or all of the DWS funds and to discuss
with the fund's investment adviser and administrator how it monitors and
controls such risks.
I-15
BOARD COMMITTEES. The Board has established the following standing committees:
Audit Committee, Nominating and Governance Committee, Contract Committee,
Equity Oversight Committee, Fixed-Income and Quant Oversight Committee, and
Operations Committee.
NUMBER OF
MEETINGS IN LAST
NAME OF COMMITTEE CALENDAR YEAR FUNCTIONS CURRENT MEMBERS
AUDIT COMMITTEE 10 Assists the Board in fulfilling its responsibility William McClayton (Chair),
for oversight of (1) the integrity of the financial Kenneth C. Froewiss (Vice
statements, (2) the fund's accounting and Chair), Henry P. Becton, Jr.,
financial reporting policies and procedures, (3) Keith R. Fox, Richard J.
the fund's compliance with legal and regulatory Herring and William N.
requirements related to accounting and Searcy, Jr.
financial reporting and (4) the qualifications,
independence and performance of the
independent registered public accounting firm
for the fund. It also approves and recommends
to the Board the appointment, retention or
termination of the independent registered
public accounting firm for the fund, reviews the
scope of audit and internal controls, considers
and reports to the Board on matters relating to
the fund's accounting and financial reporting
practices, and performs such other tasks as
the full Board deems necessary or appropriate.
The Audit Committee receives annual
representations from the independent
registered public accounting firm as to its
independence.
I-16
NUMBER OF
MEETINGS IN LAST
NAME OF COMMITTEE CALENDAR YEAR FUNCTIONS CURRENT MEMBERS
NOMINATING AND 7 Recommends individuals for membership on Henry P. Becton, Jr. (Chair),
GOVERNANCE the Board, nominates officers, Board and Rebecca W. Rimel (Vice
COMMITTEE committee chairs, vice chairs and committee Chair), Paul K. Freeman and
members, and oversees the operations of the William McClayton
Board. The Nominating and Governance
Committee has not established specific,
minimum qualifications that must be met by an
individual to be considered by the Nominating
and Governance Committee for nomination as
a Board Member. The Nominating and
Governance Committee may take into account
a wide variety of factors in considering Board
Member candidates, including, but not limited
to: (i) availability and commitment of a
candidate to attend meetings and perform his
or her responsibilities to the Board, (ii) relevant
industry and related experience, (iii)
educational background, (iv) financial expertise,
(v) an assessment of the candidate's ability,
judgment and expertise, and (vi) the current
composition of the Board. The Committee
generally believes the the Board benefits from
diversity of background, experience and views
among its members, and considers this as a
factor in evaluating the composition of the
Board, but has not adopted any specific policy
in this regard. The Nominating and Governance
Committee reviews recommendations by
shareholders for candidates for Board positions
on the same basis as candidates
recommended by other sources. Shareholders
may recommend candidates for Board
positions by forwarding their correspondence
by US mail or courier service to Paul K.
Freeman, Independent Chairman, DWS Funds,
P.O. Box 101833, Denver, CO 80250-1833.
CONTRACT 7 Reviews at least annually, (a) the fund's Robert H. Wadsworth
COMMITTEE financial arrangements with DIMA and its (Chair), Keith R. Fox (Vice
affiliates, and (b) the fund's expense ratios. Chair), John W. Ballantine,
Dawn-Marie Driscoll and
William N. Searcy, Jr.
EQUITY OVERSIGHT 7 Reviews the investment operations of those John W. Ballantine (Chair),
COMMITTEE funds that primarily invest in equity securities William McClayton (Vice
(except for those funds managed by a Chair), Henry P. Becton, Jr.,
quantitative investment team). Keith R. Fox, Richard J.
Herring and Rebecca W.
Rimel
FIXED INCOME AND 7 Reviews the investment operations of those William N. Searcy, Jr.
QUANT OVERSIGHT funds that primarily invest in fixed-income (Chair), Jean Gleason
COMMITTEE securities or are managed by a quantitative Stromberg (Vice Chair),
investment team. Dawn-Marie Driscoll,
Kenneth C. Froewiss and
Robert H. Wadsworth
I-17
NUMBER OF
MEETINGS IN LAST
NAME OF COMMITTEE CALENDAR YEAR FUNCTIONS CURRENT MEMBERS
OPERATIONS 6 Reviews the administrative operations and Dawn-Marie Driscoll (Chair),
COMMITTEE general compliance matters of the fund. John W. Ballantine ( Vice
Reviews administrative matters related to the Chair), Rebecca W. Rimel,
operations of the fund, policies and procedures Jean Gleason Stromberg
relating to portfolio transactions, custody and Robert H. Wadsworth
arrangements, fidelity bond and insurance
arrangements, valuation of fund assets and
securities and such other tasks as the full
Board deems necessary or appropriate.
Oversees the valuation of the fund's securities
and other assets and determines, as needed,
the fair value of fund securities or other assets
under certain circumstances as described in
the fund's Valuation Procedures.
VALUATION SUB- 0 Appointed by the Operations Committee, the John W. Ballantine, Robert
COMMITTEE Valuation Sub-Committee may make H. Wadsworth, Dawn-Marie
determinations of fair value required when the Driscoll (Alternate), Rebecca
Operations Committee is not in session. W. Rimel (Alternate), and
Jean Gleason Stromberg
(Alternate)
AD HOC COMMITTEES. In addition to the standing committees described above, from
time to time the Board may also form ad hoc committees to consider specific
issues.
I-18
PART I: APPENDIX I-C - BOARD MEMBER COMPENSATION
Each Independent Board Member receives compensation from each fund for his or
her services, which includes retainer fees and specified amounts for various
committee services and for the Board Chairperson. No additional compensation is
paid to any Independent Board Member for travel time to meetings, attendance at
directors' educational seminars or conferences, service on industry or
association committees, participation as speakers at directors' conferences or
service on special fund industry director task forces or subcommittees.
Independent Board Members do not receive any employee benefits such as pension
or retirement benefits or health insurance from a fund or any fund in the DWS
fund complex.
Board Members who are officers, directors, employees or stockholders of
Deutsche Asset Management or its affiliates receive no direct compensation from
the fund, although they are compensated as employees of Deutsche Asset
Management, or its affiliates, and as a result may be deemed to participate in
fees paid by a fund. The following tables show, for each Independent Board
Member, compensation from each fund during its most recently completed fiscal
year, and aggregate compensation from all of the funds in the DWS fund complex
during calendar year 2009.
AGGREGATE COMPENSATION FROM EACH FUND
DWS GROWTH & DWS CAPITAL DWS GLOBAL
DWS BOND VIP INCOME VIP GROWTH VIP OPPORTUNITIES VIP
INDEPENDENT BOARD MEMBER:
John W. Ballantine $480 $360 $1,479 $424
Henry P. Becton, Jr. $480 $360 $1,479 $424
Dawn-Marie Driscoll $480 $360 $1,479 $424
Keith R. Fox $459 $348 $1,395 $408
Paul K. Freeman $561 $410 $1,821 $491
Kenneth C. Froewiss $459 $348 $1,395 $408
Richard J. Herring $480 $360 $1,479 $424
William McClayton $493 $368 $1,535 $435
Rebecca W. Rimel $459 $348 $1,395 $408
William N. Searcy, Jr. $480 $360 $1,479 $424
Jean Gleason Stromberg $459 $348 $1,395 $408
Robert Wadsworth $493 $368 $1,535 $435
I-19
AGGREGATE COMPENSATION FROM EACH FUND
DWS HEALTH DWS EQUITY 500 DWS SMALL CAP
DWS INTERNATIONAL VIP CARE VIP INDEX VIP INDEX VIP
INDEPENDENT BOARD MEMBER:
John W. Ballantine $780 $286 $1,535 $674
Henry P. Becton, Jr. $780 $286 $1,535 $674
Dawn-Marie Driscoll $780 $286 $1,535 $674
Keith R. Fox $740 $278 $1,447 $642
Paul K. Freeman $940 $316 $1,891 $807
Kenneth C. Froewiss $740 $278 $1,447 $642
Richard J. Herring $780 $286 $1,535 $674
William McClayton $806 $291 $1,593 $696
Rebecca W. Rimel $740 $278 $1,447 $642
William N. Searcy, Jr. $780 $286 $1,535 $674
Jean Gleason Stromberg $740 $278 $1,447 $642
Robert Wadsworth $806 $291 $1,593 $696
TOTAL COMPENSATION FROM DWS FUND COMPLEX
TOTAL COMPENSATION
FROM EACH FUND AND
BOARD MEMBER DWS FUND COMPLEX/(1)/
INDEPENDENT BOARD MEMBER:
John W. Ballantine $255,000
Henry P. Becton, Jr. $255,000
Dawn-Marie Driscoll $255,000
Keith R. Fox $240,000
Paul K. Freeman/(2)/ $315,829
Kenneth C. Froewiss $240,000
Richard J. Herring $255,000
William McClayton $265,000
Rebecca W. Rimel $240,000
William N. Searcy, Jr. $255,000
Jean Gleason Stromberg $240,000
Robert Wadsworth $298,000
(1) The DWS Fund Complex was composed of 129 funds as of December 31, 2009.
(2) Includes $75,829 in annual retainer fees received by Dr. Freeman as
Chairperson of DWS funds.
I-20
PART I: APPENDIX I-D - PORTFOLIO MANAGEMENT
FUND OWNERSHIP OF PORTFOLIO MANAGERS
The following table shows the dollar range of shares owned beneficially and of
record by the portfolio management team for each fund as well as in all DWS
Funds as a group (i.e., those funds advised by Deutsche Asset Management or its
affiliates), including investments by their immediate family members sharing
the same household and amounts invested through retirement and deferred
compensation plans. This information is provided as of each fund's most recent
fiscal year end.
DWS BOND VIP
DOLLAR RANGE OF DOLLAR RANGE OF ALL DWS
NAME OF PORTFOLIO MANAGER FUND SHARES OWNED FUND SHARES OWNED
Kenneth R. Bowling $ 0 $10,001 - $50,000
Jamie Guenther $ 0 $10,001 - $50,000
John Brennan $ 0/(1)/ $50,001 - $100,000
Bruce Harley $ 0 $10,001 - $50,000
J. Richard Robben $ 0 $50,001 - $100,000
David Vignolo $ 0 $100,001 - $500,000
J. Kevin Horsley $ 0 $50,001 - $100,000
Stephen Willer $ 0 $50,001 - $100,000
DWS GROWTH & INCOME VIP
DOLLAR RANGE OF DOLLAR RANGE OF ALL DWS
NAME OF PORTFOLIO MANAGER FUND SHARES OWNED FUND SHARES OWNED
Robert Wang $ 0/(2)/ $100,001 - $500,000
Russell Shtern $ 0 $50,001 - $100,000
DWS CAPITAL GROWTH VIP
DOLLAR RANGE OF DOLLAR RANGE OF ALL DWS
NAME OF PORTFOLIO MANAGER FUND SHARES OWNED FUND SHARES OWNED
Owen Fitzpatrick $ 0/(3)/ $100,001 - $500,000
Brendan O'Neill $ 0/(4)/ $50,001 - $100,000
Thomas M. Hynes, Jr. $ 0/(5)/ $100,001 - $500,000
DWS GLOBAL OPPORTUNITIES VIP
DOLLAR RANGE OF DOLLAR RANGE OF ALL DWS
NAME OF PORTFOLIO MANAGER FUND SHARES OWNED FUND SHARES OWNED
Joseph Axtell $ 0/(6)/ $100,001 - 500,000
I-21
DWS INTERNATIONAL VIP
DOLLAR RANGE OF DOLLAR RANGE OF ALL DWS
NAME OF PORTFOLIO MANAGER FUND SHARES OWNED FUND SHARES OWNED
Nikolaus Poehlmann $0 $0
Udo Rosendahl $0 $0
Mark Schumann $0 $0
Andreas Wendelken $0 $0
DWS HEALTH CARE VIP
DOLLAR RANGE OF DOLLAR RANGE OF ALL DWS
NAME OF PORTFOLIO MANAGER FUND SHARES OWNED FUND SHARES OWNED
Leefin Lai $ 0/(7)/ $100,001 - $500,000
DWS EQUITY 500 INDEX VIP
DOLLAR RANGE OF
NAME OF PORTFOLIO MANAGER FUND SHARES OWNED
Brent Reeder $0
DWS SMALL CAP INDEX VIP
DOLLAR RANGE OF
NAME OF PORTFOLIO MANAGER FUND SHARES OWNED
Brent Reeder $0
/(1)/ Although the Portfolio Manager does not have an investment in this
variable annuity fund, the Portfolio Manager does hold $10,001 - $50,000 in DWS
Core Plus Income Fund, the retail mutual fund that has the same investment
strategy.
/(2)/ Although the Portfolio Manager does not have an investment in this
variable annuity fund, the Portfolio Manager does hold $1 - $10,000 in DWS
Growth & Income Fund, the retail mutual fund that has the same investment
strategy.
/(3)/ Although the Portfolio Manager does not have an investment in this
variable annuity fund, the Portfolio Manager does hold $10,001 - $50,000 in DWS
Capital Growth Fund, the retail mutual fund that has the same investment
strategy.
/(4)/ Although the Portfolio Manager does not have an investment in this
variable annuity fund, the Portfolio Manager does hold $1 - $10,000 in DWS
Capital Growth Fund, the retail mutual fund that has the same investment
strategy.
/(5)/ Although the Portfolio Manager does not have an investment in this
variable annuity fund, the Portfolio Manager does hold $10,001 - $50,000 in DWS
Capital Growth Fund, the retail mutual fund that has the same investment
strategy.
/(6)/ Although the Portfolio Manager does not have an investment in this
variable annuity fund, the Portfolio Manager does hold $100,001 - $500,000 in
DWS Global Small Cap Growth Fund, the retail mutual fund that has the same
investment strategy.
/(7)/ Although the Portfolio Manager does not have an investment in this
variable annuity fund, the Portfolio Manager does hold $10,001 - $50,000 in DWS
International Fund, the retail mutual fund that has the same investment
strategy.
I-22
Because DWS International VIP's portfolio managers are not resident in the US,
they generally do not invest in US registered investment companies, such as a
fund, on account of US tax and other regulatory limitations applicable to
foreign investors.
CONFLICTS OF INTEREST
In addition to managing the assets of each fund, a portfolio manager may have
responsibility for managing other client accounts of the Advisor or its
affiliates. The tables below show, per portfolio manager, the number and asset
size of (1) SEC registered investment companies (or series thereof) other than
each fund, (2) pooled investment vehicles that are not registered investment
companies and (3) other accounts (e.g., accounts managed for individuals or
organizations) managed by a portfolio manager. Total assets attributed to a
portfolio manager in the tables below include total assets of each account
managed, although a portfolio manager may only manage a portion of such
account's assets. The tables also show the number of performance based fee
accounts, as well as the total assets of the accounts for which the advisory
fee is based on the performance of the account. This information is provided as
of each fund's most recent fiscal year end.
DWS BOND VIP
OTHER SEC REGISTERED INVESTMENT COMPANIES MANAGED:
NUMBER OF TOTAL ASSETS OF NUMBER OF INVESTMENT
REGISTERED REGISTERED COMPANY ACCOUNTS TOTAL ASSETS OF
NAME OF INVESTMENT INVESTMENT WITH PERFORMANCE- PERFORMANCE-BASED
PORTFOLIO MANAGER COMPANIES COMPANIES BASED FEE FEE ACCOUNTS
Kenneth R. Bowling 6 $1,908,625,336 0 $0
Jamie Guenther 6 $1,591,277,045 0 $0
John Brennan 7 $1,909,845,935 0 $0
Bruce Harley 6 $1,591,277,045 0 $0
J. Richard Robben 7 $1,909,845,935 0 $0
David Vignolo 6 $1,591,277,045 0 $0
J. Kevin Horsley 6 $1,591,277,045 0 $0
Stephen Willer 6 $1,591,277,045 0 $0
DWS GROWTH & INCOME VIP
OTHER SEC REGISTERED INVESTMENT COMPANIES MANAGED:
NUMBER OF TOTAL ASSETS OF NUMBER OF INVESTMENT
REGISTERED REGISTERED COMPANY ACCOUNTS TOTAL ASSETS OF
NAME OF INVESTMENT INVESTMENT WITH PERFORMANCE- PERFORMANCE-BASED
PORTFOLIO MANAGER COMPANIES COMPANIES BASED FEE FEE ACCOUNTS
Robert Wang 39 $15,319,607,541 0 $0
Russell Shtern 3 $ 757,657,889 0 $0
I-23
DWS CAPITAL GROWTH VIP
OTHER SEC REGISTERED INVESTMENT COMPANIES MANAGED:
NUMBER OF TOTAL ASSETS OF NUMBER OF INVESTMENT
REGISTERED REGISTERED COMPANY ACCOUNTS TOTAL ASSETS OF
NAME OF INVESTMENT INVESTMENT WITH PERFORMANCE- PERFORMANCE-BASED
PORTFOLIO MANAGER COMPANIES COMPANIES BASED FEE FEE ACCOUNTS
Owen Fitzpatrick 3 $2,526,058,559 0 $0
Brendan O'Neill 2 $1,983,152,356 0 $0
Thomas M. Hynes, Jr. 1 $1,770,319,728 0 $0
DWS GLOBAL OPPORTUNITIES VIP
OTHER SEC REGISTERED INVESTMENT COMPANIES MANAGED:
NUMBER OF TOTAL ASSETS OF NUMBER OF INVESTMENT
REGISTERED REGISTERED COMPANY ACCOUNTS TOTAL ASSETS OF
NAME OF INVESTMENT INVESTMENT WITH PERFORMANCE- PERFORMANCE-BASED
PORTFOLIO MANAGER COMPANIES COMPANIES BASED FEE FEE ACCOUNTS
Joseph Axtell 5 $989,991,191 0 $0
DWS INTERNATIONAL VIP
OTHER SEC REGISTERED INVESTMENT COMPANIES MANAGED:
NUMBER OF TOTAL ASSETS OF NUMBER OF INVESTMENT
REGISTERED REGISTERED COMPANY ACCOUNTS TOTAL ASSETS OF
NAME OF INVESTMENT INVESTMENT WITH PERFORMANCE- PERFORMANCE-BASED
PORTFOLIO MANAGER COMPANIES COMPANIES BASED FEE FEE ACCOUNTS
Nikolaus Poehlmann 4 $1,577,334,357 0 $0
Udo Rosendahl 4 $1,577,334,357 0 $0
Mark Schumann 4 $2,198,712,495 0 $0
Andreas Wendelken 3 $1,319,520,290 0 $0
DWS HEALTH CARE VIP
OTHER SEC REGISTERED INVESTMENT COMPANIES MANAGED:
NUMBER OF TOTAL ASSETS OF NUMBER OF INVESTMENT
REGISTERED REGISTERED COMPANY ACCOUNTS TOTAL ASSETS OF
NAME OF INVESTMENT INVESTMENT WITH PERFORMANCE- PERFORMANCE-BASED
PORTFOLIO MANAGER COMPANIES COMPANIES BASED FEE FEE ACCOUNTS
Leefin Lai 1 $180,477,382 0 $0
I-24
DWS EQUITY 500 INDEX VIP
OTHER SEC REGISTERED INVESTMENT COMPANIES MANAGED:
NUMBER OF TOTAL ASSETS OF NUMBER OF INVESTMENT
REGISTERED REGISTERED COMPANY ACCOUNTS TOTAL ASSETS OF
NAME OF INVESTMENT INVESTMENT WITH PERFORMANCE- PERFORMANCE-BASED
PORTFOLIO MANAGER COMPANIES COMPANIES BASED FEE FEE ACCOUNTS
Brent Reeder 22 $11,762,161,662 0 $0
DWS SMALL CAP INDEX VIP
OTHER SEC REGISTERED INVESTMENT COMPANIES MANAGED:
NUMBER OF TOTAL ASSETS OF NUMBER OF INVESTMENT
REGISTERED REGISTERED COMPANY ACCOUNTS TOTAL ASSETS OF
NAME OF INVESTMENT INVESTMENT WITH PERFORMANCE- PERFORMANCE-BASED
PORTFOLIO MANAGER COMPANIES COMPANIES BASED FEE FEE ACCOUNTS
Brent Reeder 22 $12,212,061,141 0 $0
DWS BOND VIP
OTHER POOLED INVESTMENT VEHICLES MANAGED:
NUMBER OF POOLED
NUMBER OF INVESTMENT VEHICLE TOTAL ASSETS OF
POOLED TOTAL ASSETS OF ACCOUNTS WITH PERFORMANCE-
NAME OF INVESTMENT POOLED INVESTMENT PERFORMANCE- BASED FEE
PORTFOLIO MANAGER VEHICLES VEHICLES BASED FEE ACCOUNTS
Kenneth R. Bowling 0 $0 0 $0
Jamie Guenther 0 $0 0 $0
John Brennan 0 $0 0 $0
Bruce Harley 0 $0 0 $0
J. Richard Robben 0 $0 0 $0
David Vignolo 0 $0 0 $0
J. Kevin Horsley 0 $0 0 $0
Stephen Willer 0 $0 0 $0
DWS GROWTH & INCOME VIP
OTHER POOLED INVESTMENT VEHICLES MANAGED:
NUMBER OF POOLED
NUMBER OF INVESTMENT VEHICLE TOTAL ASSETS OF
POOLED TOTAL ASSETS OF ACCOUNTS WITH PERFORMANCE-
NAME OF INVESTMENT POOLED INVESTMENT PERFORMANCE- BASED FEE
PORTFOLIO MANAGER VEHICLES VEHICLES BASED FEE ACCOUNTS
Robert Wang 33 $1,606,231,663 0 $0
Russell Shtern 3 $ 694,098,530 0 $0
I-25
DWS CAPITAL GROWTH VIP
OTHER POOLED INVESTMENT VEHICLES MANAGED:
NUMBER OF POOLED
NUMBER OF INVESTMENT VEHICLE TOTAL ASSETS OF
POOLED TOTAL ASSETS OF ACCOUNTS WITH PERFORMANCE-
NAME OF INVESTMENT POOLED INVESTMENT PERFORMANCE- BASED FEE
PORTFOLIO MANAGER VEHICLES VEHICLES BASED FEE ACCOUNTS
Owen Fitzpatrick 2 $634,800 0 $0
Brendan O'Neill 0 $ 0 0 $0
Thomas M. Hynes, Jr. 2 $634,800 0 $0
DWS GLOBAL OPPORTUNITIES VIP
OTHER POOLED INVESTMENT VEHICLES MANAGED:
NUMBER OF POOLED
NUMBER OF INVESTMENT VEHICLE TOTAL ASSETS OF
POOLED TOTAL ASSETS OF ACCOUNTS WITH PERFORMANCE-
NAME OF INVESTMENT POOLED INVESTMENT PERFORMANCE- BASED FEE
PORTFOLIO MANAGER VEHICLES VEHICLES BASED FEE ACCOUNTS
Joseph Axtell 0 $0 0 $0
DWS INTERNATIONAL VIP
OTHER POOLED INVESTMENT VEHICLES MANAGED:
NUMBER OF POOLED
NUMBER OF INVESTMENT VEHICLE TOTAL ASSETS OF
POOLED TOTAL ASSETS OF ACCOUNTS WITH PERFORMANCE-
NAME OF INVESTMENT POOLED INVESTMENT PERFORMANCE- BASED FEE
PORTFOLIO MANAGER VEHICLES VEHICLES BASED FEE ACCOUNTS
Nikolaus Poehlmann 8 $1,621,735,746 1 $408,986,330
Udo Rosendahl 3 $1,954,067,227 0 $ 0
Mark Schumann 1 $ 196,110,632 0 $ 0
Andreas Wendelken 4 $ 749,319,586 0 $ 0
DWS HEALTH CARE VIP
OTHER POOLED INVESTMENT VEHICLES MANAGED:
NUMBER OF POOLED
NUMBER OF INVESTMENT VEHICLE TOTAL ASSETS OF
POOLED TOTAL ASSETS OF ACCOUNTS WITH PERFORMANCE-
NAME OF INVESTMENT POOLED INVESTMENT PERFORMANCE- BASED FEE
PORTFOLIO MANAGER VEHICLES VEHICLES BASED FEE ACCOUNTS
Leefin Lai 0 $0 0 $0
I-26
DWS EQUITY 500 INDEX VIP
OTHER POOLED INVESTMENT VEHICLES MANAGED:
NUMBER OF POOLED
NUMBER OF INVESTMENT VEHICLE TOTAL ASSETS OF
POOLED TOTAL ASSETS OF ACCOUNTS WITH PERFORMANCE-
NAME OF INVESTMENT POOLED INVESTMENT PERFORMANCE- BASED FEE
PORTFOLIO MANAGER VEHICLES VEHICLES BASED FEE ACCOUNTS
Brent Reeder 38 $61,485,454,929 0 $0
DWS SMALL CAP INDEX VIP
OTHER POOLED INVESTMENT VEHICLES MANAGED:
NUMBER OF POOLED
NUMBER OF INVESTMENT VEHICLE TOTAL ASSETS OF
POOLED TOTAL ASSETS OF ACCOUNTS WITH PERFORMANCE-
NAME OF INVESTMENT POOLED INVESTMENT PERFORMANCE- BASED FEE
PORTFOLIO MANAGER VEHICLES VEHICLES BASED FEE ACCOUNTS
Brent Reeder 38 $61,485,454,929 0 $0
DWS BOND VIP
OTHER ACCOUNTS MANAGED:
NUMBER OF OTHER TOTAL ASSETS OF
TOTAL ASSETS ACCOUNTS WITH PERFORMANCE-
NAME OF NUMBER OF OF OTHER PERFORMANCE- BASED FEE
PORTFOLIO MANAGER OTHER ACCOUNTS ACCOUNTS BASED FEE ACCOUNTS
Kenneth R. Bowling 5 $ 484,913,584 0 $0
Jamie Guenther 1 $ 83,299,819 0 $0
John Brennan 1 $ 83,299,819 0 $0
Bruce Harley 1 $1,591,277,045 0 $0
J. Richard Robben 4 $ 339,367,508 0 $0
David Vignolo 4 $ 431,300,522 0 $0
J. Kevin Horsley 1 $ 83,299,819 0 $0
Stephen Willer 1 $ 83,299,819 0 $0
DWS GROWTH & INCOME VIP
OTHER ACCOUNTS MANAGED:
NUMBER OF OTHER TOTAL ASSETS OF
TOTAL ASSETS ACCOUNTS WITH PERFORMANCE-
NAME OF NUMBER OF OF OTHER PERFORMANCE- BASED FEE
PORTFOLIO MANAGER OTHER ACCOUNTS ACCOUNTS BASED FEE ACCOUNTS
Robert Wang 34 $6,432,005,203 3 $37,280,448
Russell Shtern 21 $5,170,969,622 0 $ 0
I-27
DWS CAPITAL GROWTH VIP
OTHER ACCOUNTS MANAGED:
NUMBER OF OTHER TOTAL ASSETS OF
TOTAL ASSETS ACCOUNTS WITH PERFORMANCE-
NAME OF NUMBER OF OF OTHER PERFORMANCE- BASED FEE
PORTFOLIO MANAGER OTHER ACCOUNTS ACCOUNTS BASED FEE ACCOUNTS
Owen Fitzpatrick 357 $1,703,725,286 0 $0
Brendan O'Neill 6 $ 341,725,287 0 $0
Thomas M. Hynes, Jr. 6 $ 341,725,287 0 $0
DWS GLOBAL OPPORTUNITIES VIP
OTHER ACCOUNTS MANAGED:
NUMBER OF OTHER TOTAL ASSETS OF
TOTAL ASSETS ACCOUNTS WITH PERFORMANCE-
NAME OF NUMBER OF OF OTHER PERFORMANCE- BASED FEE
PORTFOLIO MANAGER OTHER ACCOUNTS ACCOUNTS BASED FEE ACCOUNTS
Joseph Axtell 3 $219,451,380 0 $0
DWS INTERNATIONAL VIP
OTHER ACCOUNTS MANAGED:
NUMBER OF OTHER TOTAL ASSETS OF
TOTAL ASSETS ACCOUNTS WITH PERFORMANCE-
NAME OF NUMBER OF OF OTHER PERFORMANCE- BASED FEE
PORTFOLIO MANAGER OTHER ACCOUNTS ACCOUNTS BASED FEE ACCOUNTS
Nikolaus Poehlmann 0 $0 0 $0
Udo Rosendahl 0 $0 0 $0
Mark Schumann 0 $0 0 $0
Andreas Wendelken 0 $0 0 $0
DWS HEALTH CARE VIP
OTHER ACCOUNTS MANAGED:
NUMBER OF OTHER TOTAL ASSETS OF
TOTAL ASSETS ACCOUNTS WITH PERFORMANCE-
NAME OF NUMBER OF OF OTHER PERFORMANCE- BASED FEE
PORTFOLIO MANAGER OTHER ACCOUNTS ACCOUNTS BASED FEE ACCOUNTS
Leefin Lai 0 $0 0 $0
I-28
DWS EQUITY 500 INDEX VIP
OTHER ACCOUNTS MANAGED:
NUMBER OF OTHER TOTAL ASSETS OF
TOTAL ASSETS ACCOUNTS WITH PERFORMANCE-
NAME OF NUMBER OF OF OTHER PERFORMANCE- BASED FEE
PORTFOLIO MANAGER OTHER ACCOUNTS ACCOUNTS BASED FEE ACCOUNTS
Brent Reeder 40 $18,186,077,272 0 $0
DWS SMALL CAP INDEX VIP
OTHER ACCOUNTS MANAGED:
NUMBER OF OTHER TOTAL ASSETS OF
TOTAL ASSETS ACCOUNTS WITH PERFORMANCE-
NAME OF NUMBER OF OF OTHER PERFORMANCE- BASED FEE
PORTFOLIO MANAGER OTHER ACCOUNTS ACCOUNTS BASED FEE ACCOUNTS
Brent Reeder 40 $18,186,077,272 0 $0
In addition to the accounts above, an investment professional may manage
accounts in a personal capacity that may include holdings that are similar to,
or the same as, those of each fund. The Advisor has in place a Code of Ethics
that is designed to address conflicts of interest and that, among other things,
imposes restrictions on the ability of portfolio managers and other "access
persons" to invest in securities that may be recommended or traded in each fund
and other client accounts.
I-29
PART I: APPENDIX I-E - AFFILIATED SERVICE PROVIDER COMPENSATION
DWS BOND VIP
GROSS AMOUNT AMOUNT WAIVED GROSS AMOUNT PAID TO AMOUNT WAIVED BY
PAID TO DIMA BY DIMA FOR DIMA FOR GENERAL DIMA FOR GENERAL
FOR ADVISORY ADVISORY ADMINISTRATIVE ADMINISTRATIVE
FISCAL YEAR ENDED SERVICES SERVICES SERVICES SERVICES
2009 $590,867 $0 $151,504 $0
2008 $782,296 $0 $200,589 $0
2007 $873,517 $0 $223,979 $0
GROSS AMOUNT PAID TO AMOUNT WAIVED BY
DISC FOR TRANSFER DISC FOR TRANSFER
FISCAL YEAR ENDED AGENCY SERVICES AGENCY SERVICES
2009 $711 $0
2008 $760 $0
2007 $898 $0
DWS GROWTH & INCOME VIP
GROSS AMOUNT AMOUNT WAIVED GROSS AMOUNT PAID TO AMOUNT WAIVED BY
PAID TO DIMA BY DIMA FOR DIMA FOR GENERAL DIMA FOR GENERAL
FOR ADVISORY ADVISORY ADMINISTRATIVE ADMINISTRATIVE
FISCAL YEAR ENDED SERVICES SERVICES SERVICES SERVICES
2009 $ 362,304 $83,784 $ 92,899 $0
2008 $ 592,051 $83,657 $151,808 $0
2007 $1,103,548 $28,536 $285,358 $0
GROSS AMOUNT PAID TO AMOUNT WAIVED BY
DISC FOR TRANSFER DISC FOR TRANSFER
FISCAL YEAR ENDED AGENCY SERVICES AGENCY SERVICES
2009 $709 $611
2008 $743 $241
2007 $940 $208
DWS CAPITAL GROWTH VIP
GROSS AMOUNT AMOUNT WAIVED GROSS AMOUNT PAID TO AMOUNT WAIVED BY
PAID TO DIMA BY DIMA FOR DIMA FOR GENERAL DIMA FOR GENERAL
FOR ADVISORY ADVISORY ADMINISTRATIVE ADMINISTRATIVE
FISCAL YEAR ENDED SERVICES SERVICES SERVICES SERVICES
2009 $2,425,388 $153,029 $ 647,367 $0
2008 $3,273,016 $111,183 $ 879,862 $0
2007 $4,224,782 $118,582 $1,150,671 $0
I-30
GROSS AMOUNT PAID TO AMOUNT WAIVED BY
DISC FOR TRANSFER DISC FOR TRANSFER
FISCAL YEAR ENDED AGENCY SERVICES AGENCY SERVICES
2009 $1,199 $1,199
2008 $ 980 $ 980
2007 $ 951 $ 951
DWS GLOBAL OPPORTUNITIES VIP
GROSS AMOUNT AMOUNT WAIVED GROSS AMOUNT PAID TO AMOUNT WAIVED BY
PAID TO DIMA BY DIMA FOR DIMA FOR GENERAL DIMA FOR GENERAL
FOR ADVISORY ADVISORY ADMINISTRATIVE ADMINISTRATIVE
FISCAL YEAR ENDED SERVICES SERVICES SERVICES SERVICES
2009 $1,126,004 $154,222 $126,517 $0
2008 $2,040,460 $281,092 $229,265 $0
2007 $3,148,776 $ 85,694 $353,795 $0
GROSS AMOUNT PAID TO AMOUNT WAIVED BY
DISC FOR TRANSFER DISC FOR TRANSFER
FISCAL YEAR ENDED AGENCY SERVICES AGENCY SERVICES
2009 $721 $601
2008 $660 $501
2007 $901 $667
DWS INTERNATIONAL VIP
GROSS AMOUNT AMOUNT WAIVED GROSS AMOUNT PAID TO AMOUNT WAIVED BY
PAID TO DIMA BY DIMA FOR DIMA FOR GENERAL DIMA FOR GENERAL
FOR ADVISORY ADVISORY ADMINISTRATIVE ADMINISTRATIVE
FISCAL YEAR ENDED SERVICES SERVICES SERVICES SERVICES
2009 $2,382,840 $ 0 $301,625 $0
2008 $3,994,718 $211,855 $519,230 $0
2007 $5,588,748 $ 0 $756,054 $0
GROSS AMOUNT PAID TO AMOUNT WAIVED BY
DISC FOR TRANSFER DISC FOR TRANSFER
FISCAL YEAR ENDED AGENCY SERVICES AGENCY SERVICES
2009 $1,034 $ 0
2008 $ 850 $805
2007 $1,493 $320
DWS HEALTH CARE VIP
GROSS AMOUNT AMOUNT WAIVED GROSS AMOUNT PAID TO AMOUNT WAIVED BY
PAID TO DIMA BY DIMA FOR DIMA FOR GENERAL DIMA FOR GENERAL
FOR ADVISORY ADVISORY ADMINISTRATIVE ADMINISTRATIVE
FISCAL YEAR ENDED SERVICES SERVICES SERVICES SERVICES
2009 $353,859 $0 $ 53,212 $0
2008 $600,311 $0 $ 90,272 $0
2007 $745,355 $0 $112,083 $0
I-31
GROSS AMOUNT PAID TO AMOUNT WAIVED BY
DISC FOR TRANSFER DISC FOR TRANSFER
FISCAL YEAR ENDED AGENCY SERVICES AGENCY SERVICES
2009 $317 $0
2008 $353 $0
2007 $503 $0
DWS EQUITY 500 INDEX VIP
GROSS AMOUNT AMOUNT WAIVED GROSS AMOUNT PAID TO AMOUNT WAIVED BY
PAID TO DIMA BY DIMA FOR DIMA FOR GENERAL DIMA FOR GENERAL
FOR ADVISORY ADVISORY ADMINISTRATIVE ADMINISTRATIVE
FISCAL YEAR ENDED SERVICES SERVICES SERVICES SERVICES
2009 $1,195,641 $130,936 $ 663,289 $0
2008 $1,415,847 $417,317 $ 919,349 $0
2007 $2,150,720 $491,063 $1,366,734 $0
GROSS AMOUNT PAID TO AMOUNT WAIVED BY
DISC FOR TRANSFER DISC FOR TRANSFER
FISCAL YEAR ENDED AGENCY SERVICES AGENCY SERVICES
2009 $ 891 $ 769
2008 $ 957 $ 949
2007 $1,250 $1,250
DWS SMALL CAP INDEX VIP
GROSS AMOUNT AMOUNT WAIVED GROSS AMOUNT PAID TO AMOUNT WAIVED BY
PAID TO DIMA BY DIMA FOR DIMA FOR GENERAL DIMA FOR GENERAL
FOR ADVISORY ADVISORY ADMINISTRATIVE ADMINISTRATIVE
FISCAL YEAR ENDED SERVICES SERVICES SERVICES SERVICES
2009 $ 759,193 $141,788 $257,423 $0
2008 $ 917,016 $203,672 $320,197 $0
2007 $1,617,603 $106,628 $492,638 $0
GROSS AMOUNT PAID TO AMOUNT WAIVED BY
DISC FOR TRANSFER DISC FOR TRANSFER
FISCAL YEAR ENDED AGENCY SERVICES AGENCY SERVICES
2009 $1,662 $1,305
2008 $1,781 $1,401
2007 $1,783 $1,385
The following waivers were in effect for the funds for the last three fiscal
years:
For the period from May 1, 2009 through September 30, 2009, the Advisor had
contractually agreed to waive its fees and/or reimburse certain operating
expenses of DWS Equity 500 Index VIP to the extent necessary to maintain
operating expenses (excluding certain expenses such as extraordinary expenses,
taxes, brokerage and interest) of each class as follows: Class A 0.37%, Class B
0.62% Class B2 0.77%.
I-32
For the period from May 1, 2009 through September 30, 2009, the Advisor had
contractually agreed to waive its fees and/or reimburse certain operating
expenses of Class A shares of DWS Small Cap Index VIP to the extent necessary
to maintain the operating expenses (excluding certain expenses such as
extraordinary expenses, taxes, brokerage and interest) at 0.51%.
For the period from January 1, 2009 through September 30, 2009, the Advisor,
the underwriter and accounting agent contractually agreed to waive a portion of
their fee to the extent necessary to maintain the operating expenses of each
class (excluding certain expenses such as extraordinary expenses, taxes,
brokerage and interest) as follows: DWS Global Opportunities VIP Class A 0.95%,
DWS Global Opportunities VIP Class B 1.35%, DWS Health Care VIP Class B 1.49%.
For the period from January 1, 2009 through April 30, 2010, the Advisor, the
underwriter and accounting agent contractually agreed to waive a portion of
their fee to the extent necessary to maintain the operating expenses of each
class (excluding certain expenses such as extraordinary expenses, taxes,
brokerage and interest) as follows: DWS Growth & Income VIP Class A 0.54%, DWS
Growth & Income VIP Class B 0.87%, DWS Capital Growth VIP Class A 0.49%, DWS
Capital Growth VIP Class B 0.82%, DWS International VIP Class A 0.96% and DWS
International VIP Class B 1.29%.
For the period from January 1, 2009 through April 27, 2010, the Advisor had
contractually agreed to waive 0.01% of the management fee for DWS Growth &
Income VIP.
For the period from January 1, 2009 through April 30, 2009, the Advisor had
contractually agreed to waive its fees and/or reimburse certain operating
expenses of the DWS Equity 500 Index VIP to the extent necessary to maintain
operating expenses (excluding certain expenses such as extraordinary expenses,
taxes, brokerage and interest) of each class as follows: Class A 0.28%, Class B
0.53% and Class B2 0.63%.
For the period from January 1, 2009 through April 30, 2009, the Advisor had
contractually agreed to waive its fees and/or reimburse certain operating
expenses of Class A shares of DWS Small Cap Index VIP to the extent necessary
to maintain the operating expenses (excluding certain expenses such as
extraordinary expenses, taxes, brokerage and interest) at 0.47%.
For the period from October 1, 2009 through September 30, 2010, the Advisor has
contractually agreed to waive its fees and/or reimburse certain operating
expenses of DWS Small Cap Index VIP to the extent necessary to maintain
operating expenses (excluding certain expenses such as extraordinary expenses,
taxes, brokerage and interest) of each class as follows: Class A 0.53% and
Class B 0.93%.
For the period from January 1, 2008 through April 30, 2008, the Advisor, the
underwriter and accounting agent contractually agreed to waive a portion of
their fee to the extent necessary to maintain the operating expenses (excluding
certain expenses such as extraordinary expenses, taxes, brokerage and interest)
as follows:
DWS Bond VIP Class B 1.03%,
For the period from January 1, 2008 through September 30, 2008, the Advisor,
the underwriter and accounting agent contractually agreed to waive a portion of
their fee to the extent necessary to maintain the operating expenses of each
class (excluding certain expenses such as extraordinary expenses, taxes,
brokerage and interest) as follows: DWS Bond VIP Class A 0.63%, DWS Global
Opportunities VIP Class A 0.99%, DWS Global Opportunities VIP Class B 1.39%.
For the period from October 1, 2008 through September 30, 2009, the Advisor,
the underwriter and accounting agent contractually agreed to waive a portion of
their fee to the extent necessary to maintain the operating expenses of each
class (excluding certain expenses such as extraordinary expenses, taxes,
brokerage and interest) as follows: DWS Global Opportunities VIP Class A 0.95%,
DWS Global Opportunities VIP Class B 1.35%, DWS Health Care VIP Class B 1.49.
I-33
For the period from January 1, 2008 through April 30, 2010, the Advisor, the
underwriter and accounting agent contractually agreed to waive a portion of
their fee to the extent necessary to maintain the operating expenses of each
class (excluding certain expenses such as extraordinary expenses, taxes,
brokerage and interest) as follows: DWS Capital Growth VIP Class A 0.49%, DWS
Capital Growth VIP Class B 0.82%, DWS Growth & Income VIP Class A 0.54%, DWS
Growth & Income VIP Class B 0.87%, DWS International VIP Class A 0.96%, DWS
International VIP Class B 1.29%
For the period from January 1, 2008 through April 27, 2010, the Advisor has
contractually agreed to waive 0.01% of the management fee for DWS Growth &
Income VIP.
For the period from January 1, 2008 through April 30, 2009, the Advisor
contractually agreed to waive all or a portion of its management fee and
reimburse or pay certain operating expenses of DWS Equity 500 Index VIP to the
extent necessary to maintain operating expenses of each class (excluding
certain expenses such as extraordinary expenses, taxes, brokerage and interest)
as follows: Class A 0.28%, Class B 0.53% and Class B2 0.63%.
For the period from January 1, 2008 through April 30, 2009, the Advisor has
contractually agreed to waive all or a portion of its management fee and pay
certain operating expenses of DWS Small Cap Index VIP (excluding certain
expenses such as extraordinary expenses, taxes, brokerage and interest) to the
extent necessary to maintain the operating expenses of 0.47% for Class A.
The Advisor, the underwriter and accounting agent contractually agreed to waive
a portion of their fee to the extent necessary to maintain the operating
expenses of each class for the period from January 1, 2007 through September
30, 2007 (excluding certain expenses such as extraordinary expenses, taxes,
brokerage, interest, proxy and organizational and offering costs) as follows:
DWS Bond VIP Class A 0.60%, DWS Bond VIP Class B 1.00% and DWS Global
Opportunities VIP Class B 1.52%.
The Advisor, the underwriter and accounting agent contractually agreed to waive
a portion of their fee to the extent necessary to maintain the operating
expenses of each class for the period from October 1, 2007 through April 30,
2008 (excluding certain expenses such as extraordinary expenses, taxes,
brokerage and interest expenses) as follows: DWS Bond VIP Class B 1.03%.
The Advisor, the underwriter and accounting agent contractually agreed to waive
a portion of their fee to the extent necessary to maintain the operating
expenses of each class for the period from October 1, 2007 through September
30, 2008 (excluding certain expenses such as extraordinary expenses, taxes,
brokerage, interest and organizational and offering costs) as follows: DWS Bond
VIP Class A 0.63%, DWS Global Opportunities VIP Class A 0.99%, DWS Global
Opportunities VIP Class B 1.39%
The Advisor, the underwriter and accounting agent contractually agreed to waive
a portion of their fee to the extent necessary to maintain the operating
expenses of each class for the period from January 1, 2007 through April 30,
2010 (excluding certain expenses such as extraordinary expenses, taxes,
brokerage and interest and organizational and offering costs) as follows: DWS
Growth & Income VIP Class A 0.54%, DWS Growth & Income VIP Class B 0.87%
The Advisor, the underwriter and accounting agent contractually agreed to waive
a portion of their fee to the extent necessary to maintain the operating
expenses of each class for the period from January 1, 2007 through April 30,
2010 (excluding certain expenses such as extraordinary expenses, taxes,
brokerage and interest expenses) as follows: DWS Capital Growth VIP Class A
0.49% and DWS International VIP Class A 0.96%.
The Advisor, the underwriter and accounting agent contractually agreed to waive
a portion of their fee to the extent necessary to maintain the operating
expenses of each class for the period from January 1, 2007 through May 6, 2007
(excluding certain expenses such as extraordinary expenses, taxes, brokerage,
interest and organizational and offering costs) as follows: DWS Capital Growth
VIP Class B 0.86% and DWS International VIP Class B 1.34%
I-34
For the period from May 7, 2007 through April 30, 2010, the Advisor, the
underwriter and accounting agent contractually agreed to waive a portion of
their fee to the extent necessary to maintain the operating expenses of each
class (excluding certain expenses such as extraordinary expenses, taxes,
brokerage and interest expenses) as follows: DWS Capital Growth VIP Class B
0.82% DWS International VIP Class B 1.29%
For the period from January 1, 2007 through April 27, 2010, the Advisor has
contractually agreed to waive 0.01% of the management fee for DWS Growth &
Income VIP.
For the period from January 1, 2007 through April 30, 2009, the Advisor
contractually agreed to waive all or a portion of its management fee and
reimburse or pay certain operating expenses of DWS Equity 500 Index VIP to the
extent necessary to maintain operating expenses of each class (excluding
certain expenses such as extraordinary expenses, taxes, brokerage, interest,
proxy and organizational and offering costs) as follows: Class A 0.28% Class B
0.53%
For the period from January 1, 2007 through September 30, 2007, the Advisor has
contractually agreed to waive all or a portion of its management fee and pay
certain operating expenses of DWS Small Cap Index VIP (excluding certain
expenses such as extraordinary expenses, taxes, brokerage, interest, proxy and
organizational and offering expenses) to the extent necessary to maintain the
operating expenses of 0.48% for Class A.
For the period from October 1, 2007 through September 30, 2008, the Advisor has
contractually agreed to waive all or a portion of its management fee and pay
certain operating expenses of DWS Small Cap Index VIP (excluding certain
expenses such as extraordinary expenses, taxes, brokerage, interest, proxy and
organizational and offering expenses) to the extent necessary to maintain the
operating expenses of 0.47% for Class A.
The following waivers are currently in effect for the funds:
For the period from October 1, 2009 through September 30, 2010, the Advisor,
the underwriter and accounting agent contractually agreed to waive a portion of
their fee to the extent necessary to maintain the operating expenses of each
class (excluding certain expenses such as extraordinary expenses, taxes,
brokerage and interest) as follows: DWS Global Opportunities VIP Class A 1.06%
and DWS Global Opportunities VIP Class B 1.46%.For DWS Global Opportunities
VIP, the Advisor has contractually agreed through September 30, 2010 to waive
and/or reimburse fund expenses to the extent necessary to maintain the fund's
total annual operating expenses at 1.06% and 1.46%, respectively, for Class A
and Class B. The agreement may only be terminated with the consent of the
fund's Board and does not extend to extraordinary expenses, taxes, brokerage
and interest expense.
For DWS Small Cap Index VIP, the Advisor has contractually agreed through April
30, 2011 and September 30, 2010, respectively, to waive and/or reimburse fund
expenses to the extent necessary to maintain the fund's total annual operating
expenses at 0.53% and 0.93%, for Class A and Class B. The agreement may only be
terminated with the consent of the fund's Board and does not extend to
extraordinary expenses, taxes, brokerage and interest expense.
I-35
PART I: APPENDIX I-F - DISTRIBUTION PLAN PAYMENTS
Expenses of each fund paid in connection with the Rule 12b-1 Plans for each
class of shares that has adopted a Rule 12b-1 Plan are set forth below for the
most recent calendar year.
12B-1 COMPENSATION TO UNDERWRITER AND FIRMS:
12B-1 DISTRIBUTION
FEES
DWS Growth & Income VIP Class B $ 4,623
DWS Capital Growth VIP Class B $ 27,575
DWS Global Opportunities VIP Class B $ 13,933
DWS International VIP Class B $ 1,028
DWS Health Care VIP Class B $ 7,929
DWS Equity 500 Index VIP Class B $106,411
DWS Equity 500 Index VIP Class B2 $ 46,074
DWS Small Cap Index VIP Class B $102,962
I-36
PART I: APPENDIX I-G - PORTFOLIO TRANSACTIONS AND BROKERAGE COMMISSIONS
PORTFOLIO TURNOVER RATES
FUND 2009 2008
DWS Bond VIP 284% 196%
DWS Growth & Income VIP 82% 130%
DWS Capital Growth VIP 76% 21%
DWS Global Opportunities VIP 53% 21%
DWS International VIP 81% 123%
DWS Health Care VIP 31% 24%
DWS Equity 500 Index VIP 8% 6%
DWS Small Cap Index VIP 26% 25%
BROKERAGE COMMISSIONS
FISCAL BROKERAGE COMMISSIONS
YEAR PAID BY FUND
DWS Bond VIP 2009 $ 0
2008 $ 2,495
2007 $ 0
DWS Growth & Income VIP 2009 $ 71,523
2008 $ 109,754
2007 $ 446,993
DWS Capital Growth VIP 2009 $ 947,628
2008 $ 355,816
2007 $ 653,613
DWS Global Opportunities VIP 2009 $ 274,948
2008 $ 243,844
2007 $ 241,604
DWS International VIP 2009 $ 897,874
2008 $2,385,444
2007 $2,492,858
DWS Health Care VIP 2009 $ 55,135
2008 $ 53,717
2007 $ 92,122
DWS Equity 500 Index VIP 2009 $ 54,102
2008 $ 68,342
2007 $ 255,123
DWS Small Cap Index VIP 2009 $ 42,298
2008 $ 35,964
2007 $ 86,618
I-37
BROKERAGE COMMISSIONS PAID TO AFFILIATED BROKERS
AGGREGATE % OF THE
BROKERAGE AGGREGATE
COMMISSIONS DOLLAR
NAME OF PAID BY FUND % OF THE TOTAL VALUE OF ALL
FISCAL AFFILIATED TO AFFILIATED BROKERAGE PORTFOLIO
YEAR BROKER AFFILIATION BROKERS COMMISSIONS TRANSACTIONS
DWS Bond VIP 2009 None - None - -
2008 None - None - -
2007 None - None - -
DWS Growth & Income VIP 2009 None - None - -
2008 None - None - -
2007 None - None - -
DWS Capital Growth VIP 2009 None - None - -
2008 None - None - -
2007 None - None - -
DWS Global Opportunities VIP 2009 None - None - -
2008 None - None - -
2007 None - None - -
DWS International VIP 2009 None - None - -
2008 None - None - -
2007 None - None - -
DWS Health Care VIP 2009 None - None - -
2008 None - None - -
2007 None - None - -
DWS Equity 500 Index VIP 2009 None - None - -
2008 None - None - -
2007 None - None - -
DWS Small Cap Index VIP 2009 None - None - -
2008 None - None - -
2007 None - None - -
Each fund is required to identify any securities of its "regular brokers or
dealers" (as such term is defined in the 1940 Act) that each fund held as of
the end of its most recent fiscal year.
Listed below are the regular broker dealers of each fund whose securities each
fund acquired during the past fiscal year. Also listed is the dollar value of
such securities held by each fund as of the end of the most recent fiscal year
end.
DWS BOND VIP
NAME OF REGULAR BROKER OR DEALER OR PARENT
(ISSUER) SECURITIES OF REGULAR BROKER DEALERS
American Express Co. $1,088,000
Bank of America Corp $4,632,000
Barclays Bank Plc $ 594,000
Capital One Bank USA Na $ 473,000
Citigroup Inc. $3,952,000
I-38
NAME OF REGULAR BROKER OR DEALER OR PARENT
(ISSUER) ECURITIES OF REGULAR BROKER DEALERS
Commonwealth Bank of Austrailia $ 372,000
Discover Bank $ 761,000
Ford Motor Credit Co., LLC $1,541,000
General Electric Capital Corp. $4,695,000
The Goldman Sachs & Co., Inc. $1,168,000
Gazprombank $ 282,000
JP Morgan Chase & Co. $4,129,000
Merrill Lynch Mortgage Trust $ 567,000
MetLife, Inc $ 446,000
Morgan Stanley $1,041,000
PNC Bank Na $ 212,000
Principal Financial Group, Inc. $ 662,000
Prudential Financial, Inc. $ 399,000
Regions Bank $3,113,000
Royal Bank of Scotland PLC. $ 836,000
Russian Agricultural Bank $ 109,000
Wachovia Corp. $2,523,000
Westpac Banking Corp. $ 752,000
DWS GROWTH & INCOME VIP
NAME OF REGULAR BROKER OR DEALER OR PARENT
(ISSUER) SECURITIES OF REGULAR BROKER DEALERS
Ace Ltd. $1,270,000
Allied World Assurance Co. Holdings Ltd. $ 143,000
Arch Capital Group Ltd. $ 157,000
Bank of New York Mellon Corp $ 705,000
Bank of America Corp. $ 976,000
Citigroup Inc. $ 549,000
Comerica, Inc. $ 103,000
Discover Financial Services $ 947,000
Everest RE Group Ltd. $ 120,000
HSBC Holdings Plc $ 154,000
Huntington Bancshares, Inc. $ 97,000
JPMorgan Chase & Co $1,800,000
Keycorp $ 70,000
Marshall & Ilsley Corp. $ 328,000
Popular, Inc. $ 59,000
Regions Financial Corp. $ 431,000
The Travelers Companies, Inc. $ 304,000
UBS AG $ 113,000
I-39
DWS CAPITAL GROWTH VIP
NAME OF REGULAR BROKER OR DEALER OR PARENT
(ISSUER) SECURITIES OF REGULAR BROKER DEALERS
JPMorgan Chase & Co $5,134,000
DWS GLOBAL OPPORTUNITIES VIP
NAME OF REGULAR BROKER OR DEALER OR PARENT
(ISSUER) SECURITIES OF REGULAR BROKER DEALERS
ICAP Plc $ 516,000
Hellenic Exchanges SA $ 659,000
Alpha Bank AE $1,110,000
FBD Holdings Plc $ 235,000
Jefferies Group, Inc. $1,308,000
K Wah International Holdings Ltd $ 792,000
Midland Holding Ltd $2,008,000
Sumitomo Realty & Development Co. Ltd $ 900,000
Wing Hang Bank Ltd. $1,535,000
Immoeast AG $ 489,000
Dah Sing Banking Group Ltd. $ 324,000
Anglo Irish Bank Corp. Plc $ 0
Lazard Ltd. $1,075,000
Partners Group Holding AG $1,297,000
Ashmore Group Plc $1,441,000
PT AKR Corporindo Tbk $ 762,000
DWS INTERNATIONAL VIP
NAME OF REGULAR BROKER OR DEALER OR PARENT
(ISSUER) SECURITIES OF REGULAR BROKER DEALERS
HSBC Holdings Plc $5,834,000
Lloyds Banking Group Plc $7,625,000
UniCredit SpA $3,634,000
Banco Santander SA $8,566,000
China Life Insurance Co Ltd $7,691,000
AXA SA $3,905,000
ING Groep NV $7,818,000
Credit Suisse Group AG $5,237,000
Fortis $2,284,000
BNP Paribas $6,123,000
Immoeast AG $4,292,000
UBS AG $2,752,000
Sberbank $8,959,000
I-40
DWS EQUITY 500 INDEX VIP
NAME OF REGULAR BROKER OR DEALER OR PARENT
(ISSUER) SECURITIES OF REGULAR BROKER DEALERS
American International Group, Inc. $ 311,000
Bank of New York Mellon Corp. $ 2,476,000
Bank of America Corp. $11,054,000
BB&T Corp. $ 1,277,000
Comerica, Inc. $ 343,000
Legg Mason, Inc. $ 353,000
E*Trade Financial Corp. $ 197,000
Northern Trust Corp. $ 1,017,000
Invesco Ltd $ 730,000
Citigroup, Inc. $ 4,760,000
State Street Corp. $ 1,577,000
The Goldman Sachs Group, Inc. $ 6,405,000
Morgan Stanley $ 2,962,000
First Horizon National Corp $ 205,000
Keycorp $ 347,000
M&T Bank Corp. $ 424,000
Marshall & Ilsley Corp $ 211,000
Huntington Bancshares, Inc. $ 178,000
PNC Financial Services Group, Inc. $ 1,797,000
Regions Financial Corp. $ 450,000
Suntrust Banks, Inc. $ 737,000
US Bancorp $ 3,169,000
Zions Bancorp. $ 116,000
Discover Financial Services $ 577,000
CME Group, Inc. $ 1,667,000
JPMorgan Chase & Co. $12,131,000
NYSE Euronext $ 501,000
TheTraveler's Companies, Inc. $ 2,028,000
XL Capital Ltd $ 478,000
Fifth Third Bancorp. $ 559,000
Hudson City Bancorp., Inc. $ 465,000
People's United Financial, Inc $ 445,000
Charles Schwab & Co., Inc. $ 1,311,000
DWS SMALL CAP INDEX VIP
NAME OF REGULAR BROKER OR DEALER OR PARENT
(ISSUER) SECURITIES OF REGULAR BROKER DEALERS
Abington Bancorp, Inc $ 48,000
Allied Capital Corp $191,000
Alliance Financial Corp. $ 35,000
American Capital Ltd. $227,000
I-41
NAME OF REGULAR BROKER OR DEALER OR PARENT
(ISSUER) SECURITIES OF REGULAR BROKER DEALERS
American National Bankshares,Inc $ 41,000
Amerisafe, Inc $113,000
Ameris Bancorp $ 30,000
Ames National Corp. $ 45,000
Arrow Financial Corp. $ 75,000
Astoria FINL Corp $325,000
BGC Partners Inc. $ 76,000
Bancfirst Corp. $ 85,000
Bancorp Rhode Island, Inc $ 27,000
The Bancorp., Inc. $ 50,000
Bank of Kentucky Financial Cor $ 17,000
Bank of Marin Bancorp $ 53,000
Bank of Mutual Corp. $109,000
Bank of the Ozarks, Inc. $105,000
BankFinancial Corp. $ 69,000
Banner Corp. $ 15,000
Bar Harbor Bankshares. $ 24,000
Beneficial Mutual Bancorp, Inc. $107,000
Berkshire Hills Bancorp, Inc $ 94,000
BlackRock Kelso Capital Corp $ 32,000
Boston Private Financial Holdings, Inc $129,000
Bridge Bancorp, Inc $ 48,000
Broadpoint Gleacher Securities, Inc $ 68,000
Brookline Bancorp, Inc $196,000
Brooklyn Federal Bancorp, Inc $ 6,000
Bryn Mawr Bank Corp. $ 33,000
CNB Financial Corp. $ 44,000
CVB Financial Corp. $220,000
Camden National Corp $ 82,000
Capital City Bank Group, Inc $ 54,000
Cardinal Financial Corp $ 87,000
Cass Information Systems, Inc $ 83,000
Cathay General Bancorp. $148,000
Center Bancorp, Inc $ 30,000
Centerstate Banks, Inc $ 62,000
Central Pacific Financial Corp. $ 13,000
Century Bancorp, Inc $ 23,000
Chemical Financial Corp $167,000
Cheviot Financial Corp $ 5,000
Chicopee Bancorp, Inc $ 24,000
Citizens & Northern Corp. $ 27,000
Citi Trends, Inc $135,000
I-42
NAME OF REGULAR BROKER OR DEALER OR PARENT
(ISSUER) SECURITIES OF REGULAR BROKER DEALERS
Citizen's Republic Bancorp., Inc. $ 88,000
Citizens Holdings Co. $ 31,000
Citizens, Inc $ 74,000
City Holdings Co. $171,000
Clifton Savings Bancorp, Inc. $ 28,000
CoBiz Financial, Inc. $ 27,000
Columbia Banking System, Inc. $149,000
Community Bank System, Inc. $209,000
Community Trust Bancorp, Inc $124,000
Banco Latinoamericano de Exportaciones $128,000
Danvers Bancorp, Inc $108,000
American Safety Insurance holdings Ltd $ 46,000
Argo Group International Holding $272,000
Diamond Hill Investment Group $ 45,000
Dime Community Bancshares $105,000
Duff & Phelps Corp. $103,000
ESB Financial Corp $ 38,000
Eagle Bancorp, Inc. $ 57,000
E*Trade Financial Corp $858,000
East West Bancorp, Inc $455,000
Eastern Insurance Holdings, Inc $ 21,000
Max Capital Group Ltd $335,000
Employers Holdings, Inc. $209,000
Enterprise Bancorp, Inc $ 16,000
Enterprise Financial Services Corp $ 28,000
Montpelier Re Holdings Ltd $485,000
Platinum Underwriters Holdings Ltd $654,000
ESSA Bancorp, Inc $ 56,000
Evercore Partners Inc. $137,000
FBR Capital Market, inc. $ 39,000
FNB Corp. $259,000
Farmers Capital Bank Corp. $ 21,000
Fifth Street Finance Corp. $101,000
Financial Institutions, Inc $ 40,000
First Bancorp, Inc $ 42,000
First Banco-Puerto Rico $ 64,000
First BanCorp-North Carolina $ 67,000
First Busey Corp $ 60,000
First California Financial Group, Inc $ 4,000
First Commonwealth Financial Corp. $106,000
First Community Bancshares, Inc $ 42,000
First Difiance Financial Corp. $ 29,000
I-43
NAME OF REGULAR BROKER OR DEALER OR PARENT
(ISSUER) SECURITIES OF REGULAR BROKER DEALERS
First Financial Bancorp $246,000
First Financial Bankshares, Inc $354,000
First Financial Corp-Indiana $120,000
First Financial Service Corp $ 10,000
First Financial Northwest, Inc $ 42,000
First Financial Holdings, Inc $ 70,000
First of long Island Corp $ 43,000
First Merchants Corp $ 41,000
Artio Global Investors, Inc $224,000
Cape Bancorp, Inc $ 25,000
CompuCredit Holdings Corp $ 20,000
TRANSACTIONS FOR RESEARCH SERVICES
For the most recent fiscal year, each fund allocated the following amount of
transactions, and related commissions, to broker-dealer firms that have been
deemed by the Advisor to provide research services. The provision of research
services was not necessarily a factor in the placement of business with such
firms.
COMMISSIONS PAID
AMOUNT OF TRANSACTIONS ON TRANSACTIONS
FUND WITH RESEARCH FIRMS WITH RESEARCH FIRMS
DWS Bond VIP $ 0 $ 0
DWS Growth & Income VIP $ 0 $ 0
DWS Capital Growth VIP $797,222,364 $ 710,908/(1)/
DWS Global Opportunities VIP $107,814,581 $ 186,302/(1)/
DWS International VIP $221,730,768 $ 424,553/(1)/
DWS Health Care VIP $ 35,040,704 $ 41,063/(1)/
DWS Equity 500 Index VIP $ 0 $ 0
DWS Small Cap Index VIP $ 0 $ 0
(1) The fund has commission sharing arrangements (CSA) in place with some
broker-dealers pursuant to which a specified percentage of the total
commissions paid on qualifiying trades are contributed to a CSA pool. The
Advisor may utilize the related commissions in the CSA pool to pay for market
data, third-party research and research from certain other broker-dealers with
whom the Advisor either does not trade or does not trade at significant levels.
I-44
PART I: APPENDIX I-H - INVESTMENT PRACTICES AND TECHNIQUES
Below is a list of headings related to investment policies and techniques which
are further described in Appendix II-G.
DWS BOND VIP
Asset Segregation
Asset-Backed Securities
Bank and Savings and Loan Obligations
Borrowing
Brady Bonds
Cash Management Vehicles
Commercial Paper
Convertible Securities
Derivatives
Direct Debt Instruments
Dollar Roll Transactions
Eurodollar Obligations
Fixed Income Securities
Foreign Currencies
Foreign Investment(s)
High Yield Fixed Income Securities - Junk Bonds
Illiquid Securities
Impact of Large Redemptions and Purchases of Fund Shares
Indexed Securities
Interfund Borrowing and Lending Program
Investment Company Securities
Investment-Grade Bonds
IPO Risk
Lending of Portfolio Securities
Micro-Cap Companies
Mortgage-Backed Securities
Municipal Securities
Obligations of Banks and Other Financial Institutions
Participation Interests
Privatized Enterprises
Real Estate Investment Trusts (REITs)
Repurchase Agreements
Reverse Repurchase Agreements
Securities as a Result of Exchanges or Workouts
Short-Term Securities
Small Companies
Sovereign Debt
Trust Preferred Securities
US Government Securities
Warrants
When-Issued and Delayed Delivery Securities
Zero Coupon Securities and Deferred Interest Bonds
DWS GROWTH & INCOME VIP
Asset Segregation
Asset-Backed Securities
Bank and Savings and Loan Obligations
Borrowing
Brady Bonds
Cash Management Vehicles
Commercial Paper
Common Stocks
Convertible Securities
Derivatives
Direct Debt Instruments
Dollar Roll Transactions
Eurodollar Obligations
Fixed Income Securities
Foreign Currencies
Foreign Investment(s)
Illiquid Securities
Impact of Large Redemptions and Purchases of Fund Shares
Interfund Borrowing and Lending Program
Investment Company Securities
Investment-Grade Bonds
IPO Risk
Lending of Portfolio Securities
Micro-Cap Companies
Mortgage-Backed Securities
Municipal Securities
Obligations of Banks and Other Financial Institutions
Participation Interests
Privatized Enterprises
Repurchase Agreements
Real Estate Investment Trusts (REITs)
Reverse Repurchase Agreements
Short-Term Securities
Small Companies
Sovereign Debt
US Government Securities
Warrants
I-45
When-Issued and Delayed Delivery Securities Zero Coupon Securities and Deferred
Interest Bonds
DWS CAPITAL GROWTH VIP
Asset Segregation
Asset-Backed Securities
Bank and Savings and Loan Obligations
Borrowing
Brady Bonds
Cash Management Vehicles
Commercial Paper
Common Stocks
Convertible Securities
Derivatives
Direct Debt Instruments
Dollar Roll Transactions
Eurodollar Obligations
Fixed Income Securities
Foreign Currencies
Foreign Investment(s)
High Yield Fixed Income Securities - Junk Bonds
Illiquid Securities
Impact of Large Redemptions and Purchases of Fund Shares
Interfund Borrowing and Lending Program
Investment Company Securities
Investment-Grade Bonds
IPO Risk
Lending of Portfolio Securities
Micro-Cap Companies
Mortgage-Backed Securities
Municipal Securities
Obligations of Banks and Other Financial Institutions
Participation Interests
Privatized Enterprises
Repurchase Agreements
Reverse Repurchase Agreements
Short-Term Securities
Small Companies
Sovereign Debt
US Government Securities
Warrants
When-Issued and Delayed Delivery Securities
Zero Coupon Securities and Deferred Interest Bonds
DWS GLOBAL OPPORTUNITIES VIP
Asset Segregation
Asset-Backed Securities
Bank and Savings and Loan Obligations
Borrowing
Brady Bonds
Cash Management Vehicles
Commercial Paper
Common Stocks
Convertible Securities
Depository Receipts
Derivatives
Direct Debt Instruments
Dollar Roll Transactions
Eurodollar Obligations
Fixed Income Securities
Foreign Currencies
Foreign Investment(s)
High Yield Fixed Income Securities - Junk Bonds
Illiquid Securities
Impact of Large Redemptions and Purchases of Fund Shares
Interfund Borrowing and Lending Program
Investment Company Securities
Investment-Grade Bonds
IPO Risk
Lending of Portfolio Securities
Micro-Cap Companies
Mortgage-Backed Securities
Municipal Securities
Obligations of Banks and Other Financial Institutions
Participation Interests
Privatized Enterprises
Real Estate Investment Trusts (REITs)
Repurchase Agreements
Reverse Repurchase Agreements
Short-Term Securities
Small Companies
Sovereign Debt
US Government Securities
Warrants
When-Issued and Delayed Delivery Securities
Zero Coupon Securities and Deferred Interest Bonds
I-46
DWS INTERNATIONAL VIP
Asset Segregation
Asset-Backed Securities
Bank and Savings and Loan Obligations
Borrowing
Brady Bonds
Cash Management Vehicles
Commercial Paper
Common Stocks
Convertible Securities
Depository Receipts
Derivatives
Direct Debt Instruments
Dollar Roll Transactions
Eurodollar Obligations
Fixed Income Securities
Foreign Currencies
Foreign Investment(s)
Illiquid Securities
Impact of Large Redemptions and Purchases of Fund Shares
Interfund Borrowing and Lending Program
Investment Company Securities
Investment-Grade Bonds
IPO Risk
Lending of Portfolio Securities
Micro-Cap Companies
Mortgage-Backed Securities
Municipal Securities
Obligations of Banks and Other Financial Institutions
Participation Interests
Privatized Enterprises
Repurchase Agreements
Reverse Repurchase Agreements
Short-Term Securities
Small Companies
Sovereign Debt
US Government Securities
Warrants
When-Issued and Delayed Delivery Securities
Zero Coupon Securities and Deferred Interest Bonds
DWS HEALTH CARE VIP
Asset Segregation
Asset-Backed Securities
Asset-Indexed Securities
Bank and Savings and Loan Obligations
Borrowing
Brady Bonds
Cash Management Vehicles
Commercial Paper
Common Stocks
Convertible Securities
Depository Receipts
Derivatives
Direct Debt Instruments
Dollar Roll Transactions
Eurodollar Obligations
Fixed Income Securities
Foreign Currencies
Foreign Investment(s)
Illiquid Securities
Impact of Large Redemptions and Purchases of Fund Shares
Interfund Borrowing and Lending Program
Investment Company Securities
Investment-Grade Bonds
IPO Risk
Lending of Portfolio Securities
Micro-Cap Companies
Mortgage-Backed Securities
Municipal Securities
Obligations of Banks and Other Financial Institutions
Participation Interests
Privatized Enterprises
Real Estate Investment Trusts (REITs)
Repurchase Agreements
Reverse Repurchase Agreements
Short Sales Against the Box
Short-Term Securities
Small Companies
Sovereign Debt
US Government Securities
Warrants
When-Issued and Delayed Delivery Securities
Zero Coupon Securities and Deferred Interest Bonds
I-47
DWS EQUITY 500 INDEX VIP
Asset Segregation
Borrowing
Cash Management Vehicles
Commercial Paper
Common Stocks
Convertible Securities
Depository Receipts
Derivatives
Fixed Income Securities
Foreign Investment(s)
Illiquid Securities
Impact of Large Redemptions and Purchases of Fund Shares
Interfund Borrowing and Lending Program
Investment Company Securities
Lending of Portfolio Securities
Mortgage-Backed Securities
Obligations of Banks and Other Financial Institutions
Preferred Stock
Repurchase Agreements
Reverse Repurchase Agreements
Short-Term Securities
US Government Securities
When-Issued and Delayed Delivery Securities
DWS SMALL CAP INDEX VIP
Asset Segregation
Borrowing
Cash Management Vehicles
Commercial Paper
Common Stocks
Convertible Securities
Depository Receipts
Derivatives
Fixed Income Securities
Foreign Investment(s)
Illiquid Securities
Impact of Large Redemptions and Purchases of Fund Shares
Interfund Borrowing and Lending Program
Investment Company Securities
Lending of Portfolio Securities
Mortgage-Backed Securities
Obligations of Banks and Other Financial Institutions
Preferred Stock
Repurchase Agreements
Reverse Repurchase Agreements
Short-Term Securities
US Government Securities
Warrants
When-Issued and Delayed Delivery Securities
I-48
PART I: APPENDIX I-I - ADDITIONAL INFORMATION
FUND CLASS CUSIP NUMBER
DWS Bond VIP Class A 23338G109
Fiscal Year End: 12/31
DWS Growth & Income VIP Class A 23338G703
Fiscal Year End: 12/31 Class B 23338G802
DWS Capital Growth VIP Class A 23338G307
Fiscal Year End: 12/31 Class B 23338G406
DWS Global Opportunities VIP Class A 23338G505
Fiscal Year End: 12/31 Class B 23338G604
DWS International VIP Class A 23338G869
Fiscal Year End: 12/31 Class B 23338G851
DWS Health Care VIP Class A 23338G885
Fiscal Year End: 12/31 Class B 23338G877
DWS Equity 500 Index VIP Class A 23339F100
Fiscal Year End: 12/31 Class B 23339F209
Class B2 23339F308
DWS Small Cap Index VIP Class A 23339F407
Fiscal Year End: 12/31 Class B 23339F506
I-49
STATEMENT OF ADDITIONAL INFORMATION (SAI) - PART II
PAGE
Part II................................................................................... II-1
Management of the Funds................................................................. II-1
Board Members.......................................................................... II-6
Purchase and Redemption of Shares....................................................... II-10
Purchases.............................................................................. II-11
Redemptions............................................................................ II-16
Distribution and Service Agreements and Plans........................................... II-24
Investments............................................................................. II-30
General Investment Practices and Techniques............................................ II-30
Portfolio Transactions.................................................................. II-31
Portfolio Holdings Information.......................................................... II-33
Net Asset Value......................................................................... II-34
Proxy Voting Guidelines................................................................. II-37
Miscellaneous........................................................................... II-38
Ratings Of Investments.................................................................. II-38
Part II: Appendix II-A - Board Members and Officers..................................... II-44
Part II: Appendix II-B - Portfolio Management Compensation.............................. II-49
Part II: Appendix II-C - Fee Rates of Service Providers................................. II-55
Part II: Appendix II-D - Financial Services Firms' Compensation......................... II-68
Part II: Appendix II-E - Firms With Which Deutsche Asset Management Has Revenue Sharing II-72
Arrangements
Part II: Appendix II-F - Class A Sales Charge Schedule.................................. II-75
Part II: Appendix II-G - Investment Practices and Techniques............................ II-77
Part II: Appendix II-H - Taxes.......................................................... II-126
Part II: Appendix II-I - Proxy Voting Guidelines........................................ II-142
PART II
Part II of this SAI includes policies, investment techniques and information
that apply to the DWS funds. Unless otherwise noted, the use of the term "fund"
applies to all funds in the DWS funds complex.
MANAGEMENT OF THE FUNDS
INVESTMENT ADVISOR. DIMA, with headquarters at 345 Park Avenue, New York, New
York, is the investment advisor for each fund. Under the oversight of the
Board, DIMA on behalf of a fund makes the investment decisions, buys and sells
securities and conducts research that leads to these purchase and sale
decisions. DIMA manages the fund's daily investment and business affairs
subject to the policies established by the Board. DIMA and its predecessors
have more than 80 years of experience managing mutual funds.
DIMA is an indirect, wholly-owned subsidiary of Deutsche Bank AG, a
multi-national financial services company with limited liability organized
under the laws of the Federal Republic of Germany. As a result, DIMA, which is
part of DeAM, is affiliated with a variety of entities that provide, and/or
engage in commercial banking, insurance, brokerage, investment banking,
financial advisory, broker-dealer activities (including sales and trading),
hedge funds, real estate and private equity investing, in addition to the
provision of investment management services to institutional and individual
investors. DWS Investments is part of the Asset Management division of Deutsche
Bank AG and, within the US, represents the retail asset management activities
of Deutsche Bank AG, Deutsche Bank Trust Company Americas, DIMA and DWS Trust
Company.
DIMA provides investment advisory services to many individuals and
institutions, including insurance companies, corporations, and financial and
banking organizations, as well as providing investment advice to open- and
closed-end registered investment companies.
DeAM is the marketing name in the US for the asset management activities of
Deutsche Bank AG, DIMA, Deutsche Bank Trust Company Americas and DWS Trust
Company. DeAM is a global asset management organization that offers a wide
range of investing expertise and resources, including hundreds of portfolio
managers and analysts and an office network that reaches the world's major
investment centers. This well-resourced global investment platform brings
together a wide variety of experience and investment insight, across
industries, regions, asset classes and investing styles.
In some instances, the investments for a fund may be managed by the same
individuals who manage one or more other mutual funds advised by DIMA that have
similar names, objectives and investment styles. A fund may differ from these
other mutual funds in size, cash flow patterns, distribution arrangements,
expenses and tax matters. Accordingly, the holdings and performance of a fund
may be expected to vary from those of other mutual funds.
Certain investments may be appropriate for a fund and also for other clients
advised by DIMA. Investment decisions for a fund and other clients are made
with a view to achieving their respective investment objectives and after
consideration of such factors as their current holdings, availability of cash
for investment and the size of their investments generally. Frequently, a
particular security may be bought or sold for only one client or in different
amounts and at different times for more than one but less than all clients.
Likewise, a particular security may be bought for one or more clients when one
or more other clients are selling the security. In addition, purchases or sales
of the same security may be made for two or more clients on the same day. In
such event, such transactions will be allocated among the clients in a manner
believed by DIMA to be equitable to each. In some cases, this procedure could
have an adverse effect on the price or amount of the securities purchased or
sold by a fund. Purchase and sale orders for a fund may be combined with those
of other clients of DIMA in the interest of achieving the most favorable net
results to a fund.
DIMA, its parent or its subsidiaries, or affiliates may have deposit, loan and
other commercial banking relationships with the issuers of obligations which
may be purchased on behalf of a fund, including outstanding loans to such
issuers which could be repaid in whole or in part with the proceeds of
securities so purchased. Such affiliates deal, trade and invest for their own
accounts in such obligations and are among the leading dealers of various types
of such obligations. DIMA has informed a fund that, in making its investment
decisions, it does not obtain or use material inside information in its
possession or in the possession of any of its affiliates. In making investment
recommendations for a fund, DIMA will not inquire or take into consideration
whether an
II-1
issuer of securities proposed for purchase or sale by a fund is a customer of
DIMA, its parent or its subsidiaries or affiliates. Also, in dealing with its
customers, the Advisor, its parent, subsidiaries, and affiliates will not
inquire or take into consideration whether securities of such customers are
held by any fund managed by DIMA or any such affiliate.
Officers and employees of the Advisor from time to time may have transactions
with various banks, including a fund's custodian bank. It is the Advisor's
opinion that the terms and conditions of those transactions which have occurred
were not influenced by existing or potential custodial or other fund
relationships.
From time to time, DIMA, Deutsche Bank AG or their affiliates may at their sole
discretion invest their own assets in shares of a fund for such purposes it
deems appropriate, including investments designed to assist in the management
of a fund. Any such investment may be hedged by DIMA, Deutsche Bank AG or their
affiliates and, in that event, the return on such investment, net of the effect
of the hedge, would be expected to differ from the return of a fund. DIMA,
Deutsche Bank AG or their affiliates have no obligation to make any investment
in a fund and the amount of any such investment may or may not be significant
in comparison to the level of assets of a fund. In the event that such an
investment is made, except as otherwise required under the 1940 Act, DIMA,
Deutsche Bank AG or their affiliates would be permitted to redeem the
investment at such time that they deem appropriate.
CONSULTANTS. DWS Health Care Fund and DWS Health Care VIP: Thomas E. Bucher,
CFA provides consulting services to DIMA in connection with the investment
management services it provides to the fund. Mr. Bucher is employed by Deutsche
Asset Management International GmbH, Mainzer Landstrasse 178-190, 60325
Frankfurt am Main, Germany. Deutsche Asset Management International GmbH is an
investment advisor registered with the U.S. Securities and Exchange Commission.
Deutsche Asset Management International GmbH is an affiliate of DIMA and a
subsidiary of Deutsche Bank AG.
TERMS OF THE INVESTMENT MANAGEMENT AGREEMENTS. Pursuant to the Investment
Management Agreements, DIMA provides continuing investment management of the
assets of a fund. In addition to the investment management of the assets of a
fund, the Advisor determines the investments to be made for each fund,
including what portion of its assets remain uninvested in cash or cash
equivalents, and with whom the orders for investments are placed, consistent
with a fund's policies as stated in its prospectus and SAI, or as adopted by a
fund's Board. DIMA will also monitor, to the extent not monitored by a fund's
administrator or other agent, a fund's compliance with its investment and tax
guidelines and other compliance policies.
DIMA provides assistance to a fund's Board in valuing the securities and other
instruments held by a fund, to the extent reasonably required by valuation
policies and procedures that may be adopted by a fund.
Pursuant to the Investment Management Agreement, (unless otherwise provided in
the agreement or as determined by a fund's Board and to the extent permitted by
applicable law), DIMA pays the compensation and expenses of all the Board
members, officers, and executive employees of a fund, including a fund's share
of payroll taxes, who are affiliated persons of DIMA.
The Investment Management Agreement provides that a fund, except as noted
below, is generally responsible for expenses that include, but are not limited
to: fees payable to the Advisor; outside legal, accounting or auditing
expenses, including with respect to expenses related to negotiation,
acquisition or distribution of portfolio investments; maintenance of books and
records that are maintained by a fund, a fund's custodian, or other agents of a
fund; taxes and governmental fees; fees and expenses of a fund's accounting
agent, custodian, sub-custodians, depositories, transfer agents, dividend
reimbursing agents and registrars; payment for portfolio pricing or valuation
services to pricing agents, accountants, bankers and other specialists, if any;
brokerage commissions or other costs of acquiring or disposing of any portfolio
securities or other instruments of a fund; and litigation expenses and other
extraordinary expenses not incurred in the ordinary course of a fund's
business.
DWS S&P 500 Plus Fund pays DIMA a single fee (Unitary Fee) under the Investment
Management Agreement and Unitary Fee Agreement (UFA) that covers not only
DIMA's investment management services, but also all of the fund's day-to-day
expenses in the ordinary course of business, except as noted below. DIMA is
responsible under the UFA for the payment of all of the fund's day-to-day
operating expenses other than distribution fees and expenses (i.e., sales
charges and 12b-1 fees), brokerage and other portfolio trading expenses and
taxes, as well as extraordinary expenses, as determined by the Board. DIMA will
pay, among other expenses, the fees of the fund's custodian, administrator,
transfer agent and other service providers to the fund.
II-2
For Money Market Portfolio, DWS Dreman Mid Cap Value Fund, DWS Dreman Small Cap
Value Fund, and DWS Strategic Value Fund, the Investment Management Agreement
also provides that DIMA shall render administrative services (not otherwise
provided by third parties) necessary for a fund's operation as an open-end
investment company including, but not limited to, preparing reports and notices
to the Board and shareholders; supervising, negotiating contractual
arrangements with, and monitoring various third-party service providers to the
Registrant (such as the Registrant's transfer agent, pricing agents, custodian,
accountants and others); preparing and making filings with the SEC and other
regulatory agencies; assisting in the preparation and filing of the
Registrant's federal, state and local tax returns; preparing and filing the
Registrant's federal excise tax returns; assisting with investor and public
relations matters; monitoring the valuation of securities and the calculation
of net asset value; monitoring the registration of shares of the Registrant
under applicable federal and state securities laws; maintaining the
Registrant's books and records to the extent not otherwise maintained by a
third party; assisting in establishing accounting policies of the Registrant;
assisting in the resolution of accounting and legal issues; establishing and
monitoring the Registrant's operating budget; processing the payment of the
Registrant's bills; assisting the Registrant in, and otherwise arranging for,
the payment of distributions and dividends; and otherwise assisting the
Registrant in the conduct of its business, subject to the direction and control
of the Board.
On behalf of Money Market Portfolio, DWS Dreman Mid Cap Value Fund, DWS Dreman
Small Cap Value Fund, and DWS Strategic Value Fund, DIMA may enter into
arrangements with affiliates and third party service providers to perform
various administrative, back-office and other services relating to client
accounts. Such service providers may be located in the US or in non-US
jurisdictions. Pursuant to a sub-administration agreement between DIMA and
State Street Bank & Trust Company (SSB), DIMA has delegated certain
administrative functions for each of these funds to SSB under the Investment
Management Agreement. The costs and expenses of such delegation are borne by
DIMA, not by a fund.
The Investment Management Agreement allows DIMA to delegate any of its duties
under the Investment Management Agreement to a sub-advisor, subject to a
majority vote of the Board, including a majority of the Board who are not
interested persons of a fund, and, if required by applicable law, subject to a
majority vote of a fund's shareholders.
The Investment Management Agreement provides that DIMA shall not be liable for
any error of judgment or mistake of law or for any loss suffered by a fund in
connection with matters to which the agreement relates, except a loss resulting
from willful malfeasance, bad faith or gross negligence on the part of DIMA in
the performance of its duties or from reckless disregard by DIMA of its
obligations and duties under the agreement. The Investment Management Agreement
may be terminated at any time, without payment of penalty, by either party or
by vote of a majority of the outstanding voting securities of a fund on 60
days' written notice.
The Investment Management Agreement continues in effect from year to year only
if its continuance is approved annually by the vote of a majority of the Board
Members who are not parties to such agreement or interested persons of any such
party, cast in person at a meeting called for the purpose of voting on such
approval, and either by a vote of the Board or of a majority of the outstanding
voting securities of a fund.
Under the Investment Management Agreement, a fund, except as otherwise noted,
pays DIMA a management fee calculated daily based on the prior day's net assets
and then aggregated for a particular month. For Money Market Portfolio, a
series of Cash Account Trust, DWS Dreman Mid Cap Value Fund, DWS Dreman Small
Cap Value Fund, and DWS Strategic Value Fund, the management fee paid to DIMA
is calculated and payable monthly based on the average daily net assets for the
particular month. The annual management fee rate for each fund, except for DWS
S&P 500 Plus Fund, is set forth in PART II - APPENDIX II-C.
Under the Investment Management Agreement between DWS S&P 500 Plus Fund and
DIMA, a fund pays DIMA a Unitary Fee calculated daily and payable monthly equal
to a base fee rate that beginning January 1, 2010 will be adjusted based upon
the performance of a fund relative to a benchmark as further described in PART
II - APPENDIX II-C.
The management fee or Unitary Fee is payable monthly, provided that a fund will
make such interim payments as may be requested by DIMA not to exceed 75% of the
amount of the fee then accrued on the books of a fund and unpaid.
Under a separate agreement between Deutsche Bank AG and the funds, Deutsche
Bank AG has granted a license to the funds to utilize the trademark "DWS."
II-3
SUB-ADVISORS (APPLICABLE ONLY TO THOSE FUNDS THAT HAVE SUB-ADVISORY
ARRANGEMENTS AS DESCRIBED IN PART I). Each Sub-Advisor serves as a sub-advisor
to a fund pursuant to the terms of a sub-advisor agreement between it and DIMA
(Sub-Advisory Agreement).
Deutsche Asset Management International GmbH (DeAMi), Mainzer Landstrasse
178-190, 60325 Frankfurt am Main, Germany, serves as a Sub-Advisor of all or a
portion of the assets of certain funds. DeAMi is an investment advisor
registered with the SEC and is an affiliate of DIMA and a subsidiary of
Deutsche Bank AG.
Dreman Value Management, L.L.C. (Dreman), 520 East Cooper Avenue Suite 230-4,
Aspen, Colorado 81611, serves as a Sub-Advisor of all the assets of certain
funds. Dreman was formed in April 1977 and is an investment advisor registered
with the SEC. DVM is controlled by David Dreman.
Northern Trust Investments, N.A. (NTI), 50 South LaSalle Street, Chicago, IL
60603, serves as a Sub-Advisor of all the assets of certain funds. NTI is a
national banking association and an investment advisor registered under the
1940 Act. NTI is a subsidiary of The Northern Trust Company (TNTC). TNTC is an
Illinois state chartered banking organization and a member of the Federal
Reserve System. Formed in 1889, TNTC administers and manages assets for
individuals, personal trusts, defined contribution and benefit plans and other
institutional and corporate clients. TNTC is the principal subsidiary of
Northern Trust Corporation, a company that is regulated by the Board of
Governors of the Federal Reserve System as a financial holding company under
the U.S. Bank Holding Company Act of 1956, as amended.
RREEF America L.L.C. (RREEF), 875 North Michigan Avenue, 41st Floor, Chicago,
Illinois 60611, serves as a Sub-Advisor of all or a portion of the assets of
certain funds. RREEF is an investment advisor registered with the SEC. RREEF is
an affiliate of DIMA and a subsidiary of Deutsche Bank AG. RREEF has provided
real estate investment management services to institutional investors since
1975 and has been an investment advisor of real estate securities since 1993.
Aberdeen Asset Management Inc. (AAMI), 1735 Market Street, Philadelphia, PA
19103, serves as a Sub-Advisor of a portion of the assets for DWS Lifecycle
Long Range Fund. AAMI is an investment advisor registered with the SEC. AAMI is
a direct wholly owned subsidiary of Aberdeen Asset Management PLC, the parent
company of an asset management group formed in 1983. AAMI provides a full range
of international investment advisory services to institutional and retail
clients.
Turner Investment Partners, Inc. (Turner), 1205 Westlakes Drive, Suite 100,
Berwyn, PA 19312, serves as a Sub-Advisor to DWS Turner Mid Cap VIP. Turner is
an investment advisor registered with the SEC and is controlled by Robert E.
Turner and Mark D. Turner.
TERMS OF THE SUB-ADVISORY AGREEMENTS. Pursuant to the terms of the applicable
Sub-Advisory Agreement, a Sub-Advisor makes the investment decisions, buys and
sells securities, and conducts the research that leads to these purchase and
sale decisions for a fund. A Sub-Advisor is also responsible for selecting
brokers and dealers to execute portfolio transactions and for negotiating
brokerage commissions and dealer charges on behalf of a fund. Under the terms
of the Sub-Advisory Agreement, a Sub-Advisor manages the investment and
reinvestment of a fund's assets and provides such investment advice, research
and assistance as DIMA may, from time to time, reasonably request.
Each Sub-Advisory Agreement provides that the Sub-Advisor will not be liable
for any error of judgment or mistake of law or for any loss suffered by a fund
in connection with matters to which the Sub-Advisory Agreement relates, except
a loss resulting from willful misconduct, bad faith or gross negligence on the
part of the Sub-Advisor in the performance of its duties or from reckless
disregard by the Sub-Advisor of its obligations and duties under the
Sub-Advisory Agreement.
A Sub-Advisory Agreement continues from year to year only as long as such
continuance is specifically approved at least annually (a) by a majority of the
Board Members who are not parties to such agreement or interested persons of
any such party, and (b) by the shareholders or the Board of the Registrant. A
Sub-Advisory Agreement may be terminated at any time upon 60 days' written
notice by DIMA or by the Board of the Registrant or by majority vote of the
outstanding shares of a fund, and will terminate automatically upon assignment
or upon termination of a fund's Investment Management Agreement.
Under the Sub-Advisory Agreements between DIMA and the Sub-Advisors, DIMA, not
the fund, pays each Sub-Advisor a sub-advisory fee based on the percentage of
the assets overseen by the Sub-Advisor or based on a percentage of the fee
received by DIMA from a fund.
II-4
The Sub-Advisor fee is paid directly by DIMA at specific rates negotiated
between DIMA and the Sub-Advisor. No fund is responsible for paying the
Sub-Advisor.
SUB-SUBADVISORS (APPLICABLE ONLY TO THOSE FUNDS THAT HAVE SUB-SUBADVISORY
ARRANGEMENTS AS DESCRIBED IN PART I). Each Sub-Subadvisor serves as a
sub-subadvisor with respect to a fund pursuant to the terms of a sub-subadvisor
agreement between it and the Sub-Advisor (Sub-Subadvisory Agreement).
RREEF Global Advisors Limited (RGAL), 1 Great Winchester Street, London, United
Kingdom, EC2N 2DB, serve as Sub-Subadvisor to a fund. RGAL is an investment
advisor registered with the SEC. In addition, RGAL is an affiliate of DIMA and
indirect, wholly owned subsidiaries of Deutsche Bank AG.
Deutsche Asset Management (Hong Kong) Limited (DeAM Hong Kong), 48/F Cheung
Kong Center, 2 Queen's Road Central, Hong Kong, China, serve as Sub-Subadvisors
to a fund. DeAM Hong Kong is an investment advisor registered with the SEC. In
addition, DeAM Hong Kong is an affiliate of DIMA and indirect, wholly owned
subsidiaries of Deutsche Bank AG.
Deutsche Investments Australia Limited (DIAL), Level 16, 126 Phillip Street,
Sydney NSW 200, Australia, serve as Sub-Subadvisors to a fund. DIAL is an
investment advisor registered with the SEC. In addition, DIAL is an affiliate
of DIMA and indirect, wholly owned subsidiaries of Deutsche Bank AG.
TERMS OF THE SUB-SUBADVISORY AGREEMENT. Pursuant to the terms of the applicable
Sub-Subadvisory Agreement and under the oversight of the Board, DIMA and the
Sub-Advisor, the Sub-Subadvisors provide investment management services with
respect to a fund's assets related to specific foreign markets and provides
such investment advice, research and assistance as the Sub-Advisor may, from
time to time, reasonably request. The Sub-Advisor allocates, and reallocates as
it deems appropriate, each of a fund's assets among the Sub-Subadvisors. A
Sub-Subadvisor is also responsible for selecting brokers and dealers to execute
portfolio transactions and for negotiating brokerage commissions and dealer
charges on behalf of a fund. Under the terms of the Sub-Subadvisory Agreement,
a Sub-Subadvisor manages the investment and reinvestment of a portion of a
fund's assets.
Each Sub-Subadvisory Agreement provides that the Sub-Subadvisor shall not be
subject to any liability for any act or omission in the course of providing
investment management services to a fund, except a loss resulting from willful
misconduct, bad faith or gross negligence on the part of the Sub-Subadvisor in
the performance of its duties or from reckless disregard by the Sub-Subadvisor
of its obligations and duties under the Sub-Subadvisory Agreement.
A Sub-Subadvisory Agreement continues from year to year only as long as such
continuance is specifically approved at least annually (a) by a majority of the
Board Members who are not parties to such agreement or interested persons of
any such party, and (b) by the shareholders or the Board of the
Trust/Corporation. A Sub-Subadvisory Agreement may be terminated at any time
upon 60 days' written notice by the Board of the Trust/Corporation or by
majority vote of the outstanding shares of a fund, and will terminate
automatically upon assignment or upon termination of a fund's Sub-Advisory
Agreement.
Under the Sub-Subadvisory Agreements, the Sub-Advisor, not a fund, pays each
Sub-Subadvisor a sub-subadvisory fee based on the percentage of the assets
overseen by the Sub-Subadvisor from the fee received by the Sub-Advisor from
DIMA. The Sub-Subadvisor fee is paid directly by the Sub-Advisor at specific
rates negotiated between the Sub-Advisor and the Sub-Subadvisor. No fund is
responsible for paying the Sub-Subadvisor.
AGREEMENT TO INDEMNIFY INDEPENDENT BOARD MEMBERS FOR CERTAIN EXPENSES. In
connection with litigation or regulatory action related to possible improper
market timing or other improper trading activity or possible improper marketing
and sales activity in certain DWS funds (Affected Funds), DIMA has agreed to
indemnify and hold harmless the Affected Funds (Fund Indemnification Agreement)
against any and all loss, damage, liability and expense, arising from market
timing or marketing and sales matters alleged in any enforcement actions
brought by governmental authorities involving or potentially affecting the
Affected Funds or DIMA (Enforcement Actions) or that are the basis for private
actions brought by shareholders of the Affected Funds against the Affected
Funds, their directors and officers, DIMA and/or certain other parties (Private
Litigation), or any proceedings or actions that may be threatened or commenced
in the future by any person (including governmental authorities), arising from
or similar to the matters alleged in the Enforcement Actions or Private
Litigation. In recognition of its undertaking to indemnify the Affected Funds
and in light of the rebuttable presumption generally afforded to independent
directors/trustees of investment companies that they have not engaged in
disabling
II-5
conduct, DIMA has also agreed, subject to applicable law and regulation, to
indemnify certain (or, with respect to certain Affected Funds, all) of the
Independent Board Members of the Affected Funds, against certain liabilities
the Independent Board Members may incur from the matters alleged in any
Enforcement Actions or Private Litigation or arising from or similar to the
matters alleged in the Enforcement Actions or Private Litigation, and advance
expenses that may be incurred by the Independent Board Members in connection
with any Enforcement Actions or Private Litigation. DIMA is not, however,
required to provide indemnification and advancement of expenses: (1) with
respect to any proceeding or action which the Affected Funds' Board determines
that the Independent Board Members ultimately would not be entitled to
indemnification or (2) for any liability of the Independent Board Members or
their shareholders to which the Independent Board Member would otherwise be
subject by reason of willful misfeasance, bad faith, gross negligence or
reckless disregard of the Independent Board Member's duties as a director or
trustee of the Affected Funds as determined in a final adjudication in such
action or proceeding. The estimated amount of any expenses that may be advanced
to the Independent Board Members or indemnity that may be payable under the
indemnity agreements is currently unknown. These agreements by DIMA will
survive the termination of the Investment Management Agreements between DIMA
and the Affected Funds.
BOARD MEMBERS
BOARD MEMBERS AND OFFICERS' IDENTIFICATION AND BACKGROUND. The identification
and background of the Board Members and Officers of the Registrant are set
forth in PART II - APPENDIX II-A.
BOARD COMMITTEES AND COMPENSATION. Information regarding the Committees of the
Board, as well as compensation paid to the Independent Board Members and to
Board Members who are not officers of the Registrant, for certain specified
periods, is set forth in PART I - APPENDIX I-B AND PART I - APPENDIX II-C.
ADMINISTRATOR, FUND ACCOUNTING AGENT, TRANSFER AGENT AND SHAREHOLDER SERVICE
AGENT, AND CUSTODIAN
ADMINISTRATOR. For all funds except Money Market Portfolio, DWS Dreman Mid Cap
Value Fund, DWS Dreman Small Cap Value Fund, and DWS Strategic Value Fund. DIMA
serves as a fund's administrator pursuant to an Administrative Services
Agreement.
For its services under the Administrative Services Agreement, the Administrator
receives a fee at the rate set forth in PART II - APPENDIX II-C. For all funds
except Money Market Portfolio, DWS Dreman Mid Cap Value Fund, DWS Dreman Small
Cap Value Fund and DWS Strategic Value Fund, the Administrator will pay
Accounting Agency fees out of the Administrative Services fee.
Under the Administrative Services Agreement, the Administrator is obligated on
a continuous basis to provide such administrative services as the Board of a
fund reasonably deems necessary for the proper administration of a fund. The
Administrator provides a fund with personnel; arranges for the preparation and
filing of a fund's tax returns; prepares and submits reports and meeting
materials to the Board and the shareholders; prepares and files updates to a
fund's prospectus and statement of additional information as well as other
reports required to be filed by the SEC; maintains a fund's records; provides a
fund with office space, equipment and services; supervises, negotiates the
contracts of and monitors the performance of third parties contractors;
oversees the tabulation of proxies; monitors the valuation of portfolio
securities and monitors compliance with Board-approved valuation procedures;
assists in establishing the accounting and tax policies of a fund; assists in
the resolution of accounting issues that may arise with respect to a fund;
establishes and monitors a fund's operating expense budgets; reviews and
processes a fund's bills; assists in determining the amount of dividends and
distributions available to be paid by a fund, prepares and arranges dividend
notifications and provides information to agents to effect payments thereof;
provides to the Board periodic and special reports; provides assistance with
investor and public relations matters; and monitors the registration of shares
under applicable federal and state law. The Administrator also performs certain
fund accounting services under the Administrative Services Agreement.
The Administrative Services Agreement provides that the Administrator will not
be liable under the Administrative Services Agreement except for willful
misfeasance, bad faith or negligence in the performance of its duties or from
the reckless disregard by it of its duties and obligations thereunder. Pursuant
to an agreement between the Administrator and SSB, the Administrator has
delegated certain administrative functions to SSB. The costs and expenses of
such delegation are borne by the Administrator, not by a fund.
II-6
Pursuant to the Advisor's procedures, approved by the Board, proof of claim
forms are routinely filed on behalf of a fund by a third party service
provider, with certain limited exceptions. The Board receives periodic reports
regarding the implementation of these procedures.
FUND ACCOUNTING AGENT. For Money Market Portfolio, DWS Dreman Mid Cap Value
Fund, DWS Dreman Small Cap Value Fund, and DWS Strategic Value Fund, DIFA, One
Beacon Street, Boston, Massachusetts 02108, a subsidiary of DIMA, is
responsible for determining net asset value per share and maintaining the
portfolio and general accounting records for a fund pursuant to a Fund
Accounting Agreement. For its services under a Fund Accounting Agreement, DIFA
receives a fee at the rate set forth in PART II - APPENDIX II-C.
Pursuant to an agreement between DIFA and SSB, DIFA has delegated certain fund
accounting functions to SSB under the Fund Accounting Agreement. The costs and
expenses of such delegation are borne by DIFA, not by a fund.
TRANSFER AGENT AND SHAREHOLDER SERVICE AGENT. DISC, 210 W. 10th Street, Kansas
City, Missouri 64105-1614, an affiliate of the Advisor, is each fund's transfer
agent, dividend-paying agent and shareholder service agent pursuant to the
Transfer Agency and Services Agreement. Pursuant to a sub-transfer agency
agreement between DISC and DST Systems, Inc. (DST), DISC has delegated certain
transfer agent, dividend paying agent and shareholder servicing agent functions
to DST. The costs and expenses of such delegation are borne by DISC, not by a
fund. For its services under the Transfer Agency and Services Agreement, DISC
receives a fee at the rate set forth in PART II - APPENDIX II-C. Each fund, or
the Advisor (including any affiliate of the Advisor), or both, may pay
unaffiliated third parties for providing recordkeeping and other administrative
services with respect to accounts of participants in retirement plans or other
beneficial owners of shares whose interests are generally held in an omnibus
account.
CUSTODIAN. Under its custody agreement with a fund, the Custodian (i) maintains
separate accounts in the name of a fund, (ii) holds and transfers portfolio
securities on account of a fund, (iii) accepts receipts and makes disbursements
of money on behalf of a fund, and (iv) collects and receives all income and
other payments and distributions on account of a fund's portfolio securities.
The Custodian has entered into agreements with foreign subcustodians approved
by the Board pursuant to Rule 17f-5 under the 1940 Act.
In some instances, the Custodian may use Deutsche Bank AG or its affiliates, as
subcustodian (DB Subcustodian) in certain countries. To the extent a fund holds
any securities in the countries in which the Custodian uses a DB Subcustodian
as a subcustodian, those securities will be held by DB Subcustodian as part of
a larger omnibus account in the name of the Custodian (Omnibus Account). For
its services, DB Subcustodian receives (1) an annual fee based on a percentage
of the average daily net assets of the Omnibus Account and (2) transaction
charges with respect to transactions that occur within the Omnibus Account. To
the extent that a DB Subcustodian receives any brokerage commissions for any
transactions, such transactions and amount of brokerage commissions paid by the
fund are set forth in PART I - APPENDIX I-H.
The Custodian's fee may be reduced by certain earnings credits in favor of a
fund.
FUND LEGAL COUNSEL. Provides legal services to the funds.
BOARD LEGAL COUNSEL. Serves as legal counsel to the Independent Board Members.
PRINCIPAL UNDERWRITER AND DISTRIBUTION AGREEMENT. Pursuant to a distribution
agreement (Distribution Agreement) with a fund, DIDI, 222 South Riverside
Plaza, Chicago, Illinois 60606, an affiliate of the Advisor, is the principal
underwriter and distributor for each class of shares of a fund and acts as
agent of a fund in the continuous offering of its shares. The Distribution
Agreement remains in effect for a class from year to year only if its
continuance is approved for the class at least annually by a vote of the Board,
including the Board Members who are not parties to the Distribution Agreement
or interested persons of any such party.
The Distribution Agreement automatically terminates in the event of its
assignment and may be terminated for a class at any time without penalty by a
fund or by DIDI upon 60 days' notice. Termination by a fund with respect to a
class may be by vote of (i) a majority of the Board Members who are not
interested persons of a fund and who have no direct or indirect financial
interest in the Distribution Agreement or any related agreement, or (ii) a
"majority of the outstanding voting securities" of the class of a fund, as
defined under the 1940 Act. All material amendments must be approved by the
Board in the manner described above with respect to the continuation of the
Distribution Agreement. The provisions
II-7
concerning continuation, amendment and termination of a Distribution Agreement
are on a series by series and class by class basis.
Under the Distribution Agreement, DIDI uses reasonable efforts to sell shares
of a fund and and may appoint various financial services firms to sell shares
of a fund. DIDI bears all of its expenses of providing services pursuant to the
Distribution Agreement, including the payment of any commissions, concessions,
and distribution fees to financial services firms. A fund pays the cost of the
registration of its shares for sale under the federal securities laws and the
registration or qualification of its shares for sale under the securities laws
of the various states. A fund also pays the cost for the prospectus and
shareholder reports to be typeset and printed for existing shareholders, and
DIDI, as principal underwriter, pays for the printing and distribution of
copies thereof used in connection with the offering of shares to prospective
investors. DIDI also pays for supplementary sales literature and advertising
costs. DIDI receives any sales charge upon the purchase of shares of a class
with an initial sales charge and pays commissions, concessions and distribution
fees to firms for the sale of a fund's shares. DIDI also receives any
contingent deferred sales charges paid with respect to the redemption of any
shares having such a charge. DIDI receives no compensation from a fund as
principal underwriter and distributor except with respect to certain fund
classes in amounts authorized by a Rule 12b-1 Plan adopted for a class by a
fund (see Distribution and Service Agreements and Plans).
SHAREHOLDER AND ADMINISTRATIVE SERVICES. Shareholder and administrative
services are provided to certain fund classes under a shareholder services
agreement (Services Agreement) with DIDI. The Services Agreement continues in
effect for each class from year to year so long as such continuance is approved
for the class at least annually by a vote of the Board, including the Board
Members who are not interested persons of a fund and who have no direct or
indirect financial interest in the Services Agreement or in any related
agreement. The Services Agreement automatically terminates in the event of its
assignment and may be terminated for a class at any time without penalty by a
fund or by DIDI upon 60 days' notice. Termination by a fund with respect to a
class may be by a vote of (i) the majority of the Board Members who are not
interested persons of a fund and who have no direct or indirect financial
interest in the Services Agreement or in any related agreement, or (ii) a
"majority of the outstanding voting securities" of the class of such fund, as
defined under the 1940 Act. The Services Agreement may not be amended for a
class to increase materially the fee to be paid by a fund without approval of a
majority of the outstanding voting securities of such class of a fund, and all
material amendments must in any event be approved by the Board in the manner
described above with respect to the continuation of the Services Agreement.
Under the Services Agreement, DIDI provides, and may appoint various financial
services firms to provide, information and services to investors in certain
classes of a fund. Firms appointed by DIDI provide such office space and
equipment, telephone facilities and personnel as is necessary or beneficial for
providing information and services to shareholders in the applicable classes of
a fund. Such services and assistance may include, but are not limited to,
establishing and maintaining accounts and records, processing purchase and
redemption transactions, answering routine inquiries regarding a fund,
providing assistance to clients in changing dividend and investment options,
account designations and addresses and such other administrative services as
may be agreed upon from time to time and permitted by applicable statute, rule
or regulation.
DIDI bears all of its expenses of providing those services pursuant to the
Services Agreement, including the payment of any service fees to financial
services firms appointed by DIDI to provide such services and DIDI receives
compensation from a fund for its services under the Services Agreement in
amounts authorized by a Rule 12b-1 Plan adopted for a class by a fund (see
Distribution and Service Agreements and Plans).
DIDI may itself provide some of the above distribution and shareholder and
administrative services and may retain any portion of the fees received under
the Distribution Agreement and/or the Services Agreement not paid to financial
services firms to compensate itself for such distribution and shareholder and
administrative functions performed for a fund. Firms to which DIDI may pay
commissions, concessions, and distribution fees or service fees or other
compensation may include affiliates of DIDI.
REGULATORY MATTERS AND LEGAL PROCEEDINGS. On December 21, 2006, Deutsche Asset
Management (DeAM) settled proceedings with the Securities and Exchange
Commission (SEC) and the New York Attorney General on behalf of Deutsche Asset
Management, Inc. (DAMI) and DIMA, the investment advisors to many of the DWS
Investments funds, regarding allegations of improper trading of fund shares at
DeAM and at the legacy Scudder and Kemper organizations prior to their
acquisition by DeAM in April 2002. These regulators alleged
II-8
that although the prospectuses for certain funds in the regulators' view
indicated that the funds did not permit market timing, DAMI and DIMA breached
their fiduciary duty to those funds in that their efforts to limit trading
activity in the funds were not effective at certain times. The regulators also
alleged that DAMI and DIMA breached their fiduciary duty to certain funds by
entering into certain market timing arrangements with investors. These trading
arrangements originated in businesses that existed prior to the currently
constituted DeAM organization, which came together as a result of various
mergers of the legacy Scudder, Kemper and Deutsche fund groups, and all of the
arrangements were terminated prior to the start of the regulatory
investigations that began in the summer of 2003. No current DeAM employee
approved these trading arrangements. Under the terms of the settlements, DAMI
and DIMA neither admitted nor denied any wrongdoing.
The terms of the SEC settlement, which identified improper trading in the
legacy Deutsche and Kemper mutual funds only, provide for payment of
disgorgement in the amount of $17.2 million. The terms of the settlement with
the New York Attorney General provide for payment of disgorgement in the amount
of $102.3 million, which is inclusive of the amount payable under the SEC
settlement, plus a civil penalty in the amount of $20 million. The total amount
payable by DeAM, approximately $122.3 million, will be distributed to
shareholders of the affected funds in accordance with a distribution plan to be
developed by a distribution consultant. The funds' investment advisors do not
believe these amounts will have a material adverse financial impact on them or
materially affect their ability to perform under their investment management
agreements with the DWS funds. The above-described amounts are not material to
Deutsche Bank, and have already been reserved.
Among the terms of the settled orders, DeAM is subject to certain undertakings
regarding the conduct of its business in the future, including formation of a
Code of Ethics Oversight Committee to oversee all matters relating to issues
arising under the advisors' Code of Ethics; establishment of an Internal
Compliance Controls Committee having overall compliance oversight
responsibility of the advisors; engagement of an Independent Compliance
Consultant to conduct a comprehensive review of the advisors' supervisory
compliance and other policies and procedures designed to prevent and detect
breaches of fiduciary duty, breaches of the Code of Ethics and federal
securities law violations by the advisors and their employees; and commencing
in 2008, the advisors shall undergo a compliance review by an independent third
party.
In addition, DeAM is subject to certain further undertakings relating to the
governance of the mutual funds, including that at least 75% of the members of
the Boards of Trustees/Directors overseeing the DWS funds continue to be
independent of DeAM; the Chairmen of the DWS funds' Boards of Trustees continue
to be independent of DeAM; DeAM maintain existing management fee reductions for
certain funds for a period of five years and not increase management fees for
these certain funds during this period; the funds retain a senior officer (or
independent consultants, as applicable) responsible for assisting in the review
of fee arrangements and monitoring compliance by the funds and the investment
advisors with securities laws, fiduciary duties, codes of ethics and other
compliance policies, the expense of which shall be borne by DeAM; and periodic
account statements, fund prospectuses and the mutual funds' web site contain
additional disclosure and/or tools that assist investors in understanding the
fees and costs associated with an investment in the funds and the impact of
fees and expenses on fund returns.
DeAM has also settled proceedings with the Illinois Secretary of State
regarding market timing matters. The terms of the Illinois settlement provide
for investor education contributions totaling approximately $4 million and a
payment in the amount of $2 million to the Securities Audit and Enforcement
Fund.
On September 28, 2006, the SEC and the National Association of Securities
Dealers (NASD) (now known as the Financial Industry Regulatory Authority, or
FINRA) announced final agreements in which Deutsche Investment Management
Americas Inc. (DIMA), Deutsche Asset Management, Inc. (DAMI) and DWS Scudder
Distributors, Inc. (now known as DWS Investments Distributors, Inc. ("DIDI"))
settled administrative proceedings regarding disclosure of brokerage allocation
practices in connection with sales of the DWS funds' (now known as the DWS
Investments Funds) shares during 2001-2003. The agreements with the SEC and
NASD are reflected in orders which state, among other things, that DIMA and
DAMI failed to disclose potential conflicts of interest to the funds' Boards
and to shareholders relating to DIDI's use of certain funds' brokerage
commissions to reduce revenue sharing costs to broker dealer firms with whom it
had arrangements to market and distribute DWS fund shares. These directed
brokerage practices were discontinued in October 2003.
Under the terms of the settlements, in which DIMA, DAMI and DIDI neither
admitted nor denied any of the regulators' findings, DIMA, DAMI and DIDI agreed
to pay
II-9
disgorgement, prejudgment interest and civil penalties in the total amount of
$19.3 million. The portion of the settlements distributed to the funds was
approximately $17.8 million and was paid to the funds as prescribed by the
settlement orders based upon the amount of brokerage commissions from each fund
used to satisfy revenue sharing agreements with broker dealers who sold fund
shares.
As part of the settlements, DIMA, DAMI and DIDI also agreed to implement
certain measures and undertakings relating to revenue sharing payments
including making additional disclosures in the funds' prospectuses or
Statements of Additional Information, adopting or modifying relevant policies
and procedures and providing regular reporting to the fund Boards.
Additional information announced by DeAM regarding the terms of the settlements
is available at www.dws investments.com/regulatory_settlements.
The matters alleged in the regulatory settlements described above also serve as
the general basis of a number of private class action lawsuits involving the
DWS funds. These lawsuits name as defendants various persons, including certain
DWS funds, the funds' investment advisors and their affiliates, and certain
individuals, including in some cases fund Trustees/ Directors, officers, and
other parties. Each DWS fund's investment advisor has agreed to indemnify the
applicable DWS funds in connection with these lawsuits, or other lawsuits or
regulatory actions that may be filed making similar allegations.
Based on currently available information, the funds' investment advisors
believe the likelihood that the pending lawsuits will have a material adverse
financial impact on a DWS fund is remote and such actions are not likely to
materially affect their ability to perform under their investment management
agreements with the DWS funds.
CODES OF ETHICS. Each fund, the Advisor, a fund's principal underwriter and, if
applicable, a fund's sub-advisor (and sub-subadvisor) have each adopted codes
of ethics under Rule 17j-1 under the 1940 Act. Board Members, officers of a
Registrant and employees of the Advisor and principal underwriter are permitted
to make personal securities transactions, including transactions in securities
that may be purchased or held by a fund, subject to requirements and
restrictions set forth in the applicable Code of Ethics. The Advisor's Code of
Ethics contains provisions and requirements designed to identify and address
certain conflicts of interest between personal investment activities and the
interests of a fund. Among other things, the Advisor's Code of Ethics prohibits
certain types of transactions absent prior approval, imposes time periods
during which personal transactions may not be made in certain securities, and
requires the submission of duplicate broker confirmations and quarterly
reporting of securities transactions. Additional restrictions apply to
portfolio managers, traders, research analysts and others involved in the
investment advisory process. Exceptions to these and other provisions of the
Advisor's or sub-advisors Codes of Ethics may be granted in particular
circumstances after review by appropriate personnel.
PURCHASE AND REDEMPTION OF SHARES
GENERAL INFORMATION. Policies and procedures affecting transactions in a fund's
shares can be changed at any time without notice, subject to applicable law.
Transactions may be contingent upon proper completion of application forms and
other documents by shareholders and their receipt by a fund's agents.
Transaction delays in processing (and changing account features) due to
circumstances within or beyond the control of a fund and its agents may occur.
Shareholders (or their financial service firms) are responsible for all losses
and fees resulting from bad checks, cancelled orders or the failure to
consummate transactions effected pursuant to instructions reasonably believed
to be genuine.
The Board and DIDI each may suspend (in whole or in part) or terminate the
offering of shares of a fund at any time for any reason and may limit the
amount of purchases by, and refuse to sell to, any person. During the period of
such suspension, the Board or DIDI potentially may permit certain persons (for
example, persons who are already shareholders the fund) to continue to purchase
additional shares of a fund and to have dividends reinvested.
Orders will be confirmed at a price based on the net asset value of a fund next
determined after receipt in good order by DIDI of the order accompanied by
payment in the case of a purchase order. Except as described below, orders
received by certain dealers or other financial services firms prior to the
close of a fund's business day will be confirmed at a price based on the net
asset value determined on that day (trade date).
USE OF FINANCIAL SERVICES FIRMS. Dealers and other financial services firms
provide varying arrangements for their clients to purchase and redeem a fund's
shares, including different minimum investments, and may assess transaction or
other fees. In addition, certain privileges
II-10
with respect to the purchase and redemption of shares or the reinvestment of
dividends may not be available through such firms. Firms may arrange with their
clients for other investment or administrative services. Such firms may
independently establish and charge additional amounts to their clients for such
services. Firms also may hold a fund's shares in nominee or street name as
agent for and on behalf of their customers. In such instances, the Shareholder
Service Agent will have no information with respect to or control over the
accounts of specific shareholders. Such shareholders may obtain access to their
accounts and information about their accounts only from their firm. Certain of
these firms may receive compensation from a fund through the Shareholder
Service Agent for record-keeping and other expenses relating to these nominee
accounts. Some firms may participate in a program allowing them access to their
clients' accounts for servicing including, without limitation, transfers of
registration and dividend payee changes; and may perform functions such as
generation of confirmation statements and disbursement of cash dividends. Such
firms, including affiliates of DIDI, may receive compensation from a fund
through the Shareholder Service Agent for these services.
A fund has authorized one or more financial service institutions, including
certain members of the Financial Industry Regulatory Authority (FINRA) other
than DIDI (financial institutions), to accept purchase and redemption orders
for a fund's shares. Such financial institutions may also designate other
parties, including plan administrator intermediaries, to accept purchase and
redemption orders on a fund's behalf. Orders for purchases or redemptions will
be deemed to have been received by a fund when such financial institutions or,
if applicable, their authorized designees accept the orders. Subject to the
terms of the contract between a fund and the financial institution, ordinarily
orders will be priced at a fund's net asset value next computed after
acceptance by such financial institution or its authorized designees. Further,
if purchases or redemptions of a fund's shares are arranged and settlement is
made at an investor's election through any other authorized financial
institution, that financial institution may, at its discretion, charge a fee
for that service.
TAX-SHELTERED RETIREMENT PLANS. The Shareholder Service Agent and DIDI provide
retirement plan services and documents and can establish investor accounts in
any of the following types of retirement plans:
o Traditional, Roth and Education IRAs. This includes Savings Incentive
Match Plan for Employees of Small Employers (SIMPLE), Simplified Employee
Pension Plan (SEP) IRA accounts and prototype documents.
o 403(b)(7) Custodial Accounts. This type of plan is available to employees
of most non-profit organizations.
o Prototype money purchase pension and profit-sharing plans may be adopted
by employers.
Materials describing these plans as well as model defined benefit plans, target
benefit plans, 457 plans, 401(k) plans, simple 401(k) plans and materials for
establishing them are available from the Shareholder Service Agent upon
request. DIDI may pay commissions to dealers and other financial services firms
in connection with shares sold to retirement plans. For further information
about such compensation, see Compensation Schedules #1 and #2 as set forth in
PART II - APPENDIX II-D. Additional fees and transaction policies and
procedures may apply to such plans. Investors should consult their own tax
advisors before establishing a retirement plan.
PURCHASES
A fund may offer only certain of the classes of shares referred to in the
subsections below. Thus, the information provided below in regard to the
purchase of certain classes of shares is only applicable to funds offering such
classes of shares.
PURCHASE OF CLASS A SHARES. The public offering price of Class A shares is the
net asset value plus a sales charge based on investment amount, as set forth in
the relevant prospectus and the "DWS Sales Charge and Dealer Commission
Schedule" set forth in PART II - APPENDIX II-F.
CLASS A SHARES REDUCED SALES CHARGES
QUANTITY DISCOUNTS. An investor or the investor's dealer or other financial
services firm must notify the Shareholder Service Agent or DIDI whenever a
quantity discount or reduced sales charge is applicable to a purchase. In order
to qualify for a lower sales charge, all orders from an organized group will
have to be placed through a single dealer or other firm and identified as
originating from a qualifying purchaser.
COMBINED PURCHASES. A fund's Class A shares may be purchased at the rate
applicable to the sales charge discount bracket attained by combining same day
investments in Class A shares of any DWS funds that bear a sales charge.
II-11
CUMULATIVE DISCOUNT. Class A shares of a fund may also be purchased at the rate
applicable to the discount bracket attained by adding to the cost of shares
being purchased, the value of all Class A shares of DWS funds that bear a sales
charge (computed at the maximum offering price at the time of the purchase for
which the discount is applicable) already owned by the investor or his or her
immediate family member (including the investor's spouse or life partner and
children or stepchildren age 21 or younger).
LETTER OF INTENT. The reduced sales charges for Class A shares, as shown in the
relevant prospectus and the "DWS Sales Charge and Dealer Commission Schedule"
set forth in PART II - APPENDIX II-F, also apply to the aggregate amount of
purchases of Class A shares of DWS funds that bear a sales charge made by any
purchaser within a 24-month period under a written Letter of Intent (Letter)
provided to DIDI. The Letter, which imposes no obligation to purchase or sell
additional Class A shares, provides for a price adjustment depending upon the
actual amount purchased within such period. The Letter provides that the first
purchase following execution of the Letter must be at least 5% of the amount of
the intended purchase, and that 5% of the amount of the intended purchase
normally will be held in escrow in the form of shares pending completion of the
intended purchase. If the total investments under the Letter are less than the
intended amount and thereby qualify only for a higher sales charge than
actually paid, the appropriate number of escrowed shares are redeemed and the
proceeds used toward satisfaction of the obligation to pay the increased sales
charge. The Letter for an employer-sponsored employee benefit plan maintained
on the subaccount record keeping system available through ADP, Inc. (or
ExpertPlan for Flex Plans) under an alliance between ADP, Inc. (or ExpertPlan
for Flex Plans) and DIDI and its affiliates may have special provisions
regarding payment of any increased sales charge resulting from a failure to
complete the intended purchase under the Letter. A shareholder may include the
value (at the maximum offering price, which is determined by adding the maximum
applicable sales load charged to the net asset value) of all Class A shares of
such DWS funds held of record as of the initial purchase date under the Letter
as an "accumulation credit" toward the completion of the Letter, but no price
adjustment will be made on such shares.
RETIREMENT PLANS ON FLEX SYSTEM. For purposes of the Combined Purchases,
Cumulative Discount and Letter of Intent features described above,
employer-sponsored employee benefit plans using the Flex subaccount record
keeping system available through ExpertPlan under an alliance with DIDI and its
affiliates may include: (a) Money Market funds as "DWS funds," (b) all classes
of shares of any DWS fund and (c) the value of any other plan investments, such
as guaranteed investment contracts and employer stock, maintained on such
subaccount record keeping system.
CLASS A NAV SALES. Class A shares may be sold at net asset value without a
sales charge to:
(1) a current or former director or trustee of Deutsche or DWS mutual funds;
(2) an employee (including the employee's spouse or life partner and
children or stepchildren age 21 or younger) of Deutsche Bank AG or its
affiliates or of a subadvisor to any fund in the DWS family of funds or
of a broker-dealer authorized to sell shares of a fund or service agents
of a fund;
(3) certain professionals who assist in the promotion of DWS funds pursuant
to personal services contracts with DIDI, for themselves or immediate
members of their families;
(4) any trust, pension, profit-sharing or other benefit plan for only such
persons listed under the preceding paragraphs (a) and (b);
(5) persons who purchase such shares through bank trust departments that
process such trades through an automated, integrated mutual fund
clearing program provided by a third party clearing firm;
(6) selected employees (including their spouses or life partners and
children or stepchildren age 21 or younger) of banks and other financial
services firms that provide administrative services related to order
placement and payment to facilitate transactions in shares of a fund for
their clients pursuant to an agreement with DIDI or one of its
affiliates. Only those employees of such banks and other firms who as
part of their usual duties provide services related to transactions in
fund shares qualify;
(7) unit investment trusts sponsored by Ranson & Associates, Inc. and
unitholders of unit investment trusts sponsored by Ranson & Associates,
Inc. or its predecessors through reinvestment programs described in the
prospectuses of such trusts that have such programs;
(8) through certain investment advisors registered under the Investment
Advisers Act of 1940 and other
II-12
financial services firms acting solely as agent for their clients, that
adhere to certain standards established by DIDI, including a requirement
that such shares be sold for the benefit of their clients participating
in an investment advisory program or agency commission program under
which such clients pay a fee to the investment advisor or other firm for
portfolio management or agency brokerage services. Such shares are sold
for investment purposes and on the condition that they will not be
resold except through redemption or repurchase by a fund;
(9) employer-sponsored employee benefit plans using the Flex subaccount
recordkeeping system (Flex Plans) made available through ExpertPlan
under an alliance with DIDI and its affiliates, established prior to
October 1, 2003, provided that the Flex Plan is a participant-directed
plan that has not less than 200 eligible employees;
(10) investors investing $1 million or more ($250,000 or more for DWS
Alternative Asset Allocation Plus Fund, DWS California Tax-Free Income
Fund, DWS Disciplined Market Neutral Fund, DWS Floating Rate Plus Fund,
DWS Global Thematic Fund, DWS GNMA Fund, DWS Intermediate Tax/AMT Free
Fund, DWS Large Cap Value Fund, DWS Managed Municipal Bond Fund, DWS
Massachusetts Tax-Free Fund, DWS New York Tax-Free Income Fund, DWS
Short-Term Municipal Bond Fund, DWS Short Duration Plus Fund, DWS
Strategic High Yield Tax-Free Fund, DWS Select Alternative Allocation
Fund, DWS Strategic Government Securities Fund and DWS Strategic Income
Fund), either as a lump sum or through the Combined Purchases, Letter of
Intent and Cumulative Discount features referred to above (collectively,
the Large Order NAV Purchase Privilege). The Large Order NAV Purchase
Privilege is not available if another net asset value purchase privilege
is available;
(11) defined contribution investment only plans with a minimum of $1 million
in plan assets regardless of the amount allocated to the DWS funds;
In addition, Class A shares may be sold at net asset value without a sales
charge in connection with:
(12) the acquisition of assets or merger or consolidation with another
investment company, and under other circumstances deemed appropriate by
DIDI and consistent with regulatory requirements;
(13) a direct "roll over" of a distribution from a Flex Plan or from
participants in employer sponsored employee benefit plans maintained on
the OmniPlus subaccount record keeping system made available through
ExpertPlan under an alliance between ExpertPlan and DIDI and its
affiliates into a DWS Investments IRA;
(14) reinvestment of fund dividends and distributions; and
(15) exchanging an investment in Class A shares of another fund in the DWS
family of funds for an investment in a fund.
Class A shares also may be purchased at net asset value without a sales charge
in any amount by members of the plaintiff class in the proceeding known as
Howard and Audrey Tabankin, et al. v. Kemper Short-Term Global Income Fund, et
al., Case No. 93 C 5231 (N.D. IL). This privilege is generally non-transferable
and continues for the lifetime of individual class members and has expired for
non-individual class members. To make a purchase at net asset value under this
privilege, the investor must, at the time of purchase, submit a written request
that the purchase be processed at net asset value pursuant to this privilege
specifically identifying the purchaser as a member of the "Tabankin Class."
Shares purchased under this privilege will be maintained in a separate account
that includes only shares purchased under this privilege. For more details
concerning this privilege, class members should refer to the Notice of (i)
Proposed Settlement with Defendants; and (ii) Hearing to Determine Fairness of
Proposed Settlement, dated August 31, 1995, issued in connection with the
aforementioned court proceeding. For sales of fund shares at net asset value
pursuant to this privilege, DIDI may in its discretion pay dealers and other
financial services firms a concession, payable quarterly, at an annual rate of
up to 0.25% of net assets attributable to such shares maintained and serviced
by the firm. A firm becomes eligible for the concession based upon assets in
accounts attributable to shares purchased under this privilege in the month
after the month of purchase and the concession continues until terminated by
DIDI. The privilege of purchasing Class A shares of a fund at net asset value
under this privilege is not available if another net asset value purchase
privilege also applies.
PURCHASE OF CLASS B SHARES. Class B shares of a fund are offered at net asset
value. No initial sales charge is imposed, which allows the full amount of the
investor's purchase payment to be invested in Class B shares for
II-13
his or her account. Class B shares are subject to a contingent deferred sales
charge of 4.00% that declines over time (for shares sold within six years of
purchase) and Rule 12b-1 fees, as described in the relevant prospectus (see DWS
Sales Charge and Dealer Commission Schedule set forth in PART II - APPENDIX
II-F, and the discussion of Rule 12b-1 Plans under Distribution and Service
Agreements and Plans below). Class B shares automatically convert to Class A
shares after six years.
As described in the prospectus, effective March 1, 2010, Class B shares will be
closed to new purchases, except for exchanges and the reinvestment of dividends
or other distributions.
PURCHASE OF CLASS C SHARES. Class C shares of a fund are offered at net asset
value. No initial sales charge is imposed, which allows the full amount of the
investor's purchase payment to be invested in Class C shares for his or her
account. Class C shares are subject to a contingent deferred sales charge of
1.00% (for shares sold within one year of purchase) and Rule 12b-1 fees, as
described in the relevant prospectus (see DWS Sales Charge and Dealer
Commission Schedule set forth in PART II - APPENDIX II-F, and the discussion of
Rule 12b-1 Plans under Distribution and Service Agreements and Plans below).
PURCHASE OF CLASS R SHARES. Class R shares of a fund are offered at net asset
value. No initial sales charge is imposed, which allows the full amount of the
investor's purchase payment to be invested in Class R shares for his or her
account. Class R shares are subject to Rule 12b-1 fees, as described in the
relevant prospectus (see DWS Sales Charge and Dealer Commission Schedule set
forth in PART II - APPENDIX II-H, and the discussion of Rule 12b-1 Plans under
Distribution and Service Agreements and Plans below).
The Shareholder Service Agent monitors transactions in Class R shares to help
to ensure that investors purchasing Class R shares meet the eligibility
requirements described in the prospectus. If the Shareholder Service Agent is
unable to verify that an investor meets the eligibility requirements for Class
R, either following receipt of a completed application form within time frames
established by a fund or as part of its ongoing monitoring, the Shareholder
Service Agent may take corrective action up to and including canceling the
purchase order or redeeming the account.
PURCHASE OF INSTITUTIONAL CLASS SHARES. Institutional Class shares of a fund
are offered at net asset value without a sales charge to certain eligible
investors as described in the section entitled "Buying and Selling Shares" in a
fund's prospectus.
Investors may invest in Institutional Class shares by setting up an account
directly with the Shareholder Service Agent or through an authorized service
agent. Investors who establish shareholder accounts directly with the
Shareholder Service Agent should submit purchase and redemption orders as
described in the relevant prospectus.
PURCHASE OF CLASS S. Class S shares are generally only available to new
investors through fee-based programs of investment dealers that have special
agreements with a fund's distributor, through certain group retirement plans
and through certain registered investment advisors. These dealers and advisors
typically charge ongoing fees for services they provide.
MULTI-CLASS SUITABILITY FOR CLASSES A, B AND C. DIDI has established the
following procedures regarding the purchase of Class A, Class B and Class C
shares. Orders to purchase Class B shares of $100,000 or more and orders to
purchase Class C shares of $500,000 or more (certain funds have a $250,000
maximum for Class C purchases, see the applicable fund's prospectus) will be
declined with the exception of orders received from financial representatives
acting for clients whose shares are held in an omnibus account and
employer-sponsored employee benefit plans using the subaccount record keeping
system (System) maintained for DWS Investments-branded plans on record keeping
systems made available through ExpertPlan under an alliance between ExpertPlan
and DIDI and its affiliates (DWS Investments Flex Plans). The foregoing Class C
order limit of $500,000 or more is $250,000 or more for the certain funds, see
the relevant prospectus for additional information.
The following provisions apply to DWS Investments Flex Plans.
(1) Class B Share DWS Investments Flex Plans. Class B shares have not been
sold to DWS Investments Flex Plans that were established on the System
after October 1, 2003. Orders to purchase Class B shares for a DWS
Investments Flex Plan established on the System prior to October 1, 2003
that has regularly been purchasing Class B shares will be invested
instead in Class A shares at net asset value when the combined
subaccount value in DWS
II-14
funds or other eligible assets held by the plan is $100,000 or more.
This provision will be imposed for the first purchase after eligible
plan assets reach the $100,000 threshold. A later decline in assets
below the $100,000 threshold will not affect the plan's ability to
continue to purchase Class A shares at net asset value.
(2) Class C Share DWS Investments Flex Plans. Orders to purchase Class C
shares for a DWS Investments Flex Plan, regardless of when such plan was
established on the System, will be invested instead in Class A shares at
net asset value when the combined subaccount value in DWS funds or other
eligible assets held by the plan is $1,000,000 or more. This provision
will be imposed for the first purchase after eligible plan assets reach
the $1,000,000 threshold. A later decline in assets below the $1,000,000
threshold will not affect the plan's ability to continue to purchase
Class A shares at net asset value.
The procedures described above do not reflect in any way the suitability of a
particular class of shares for a particular investor and should not be relied
upon as such. A suitability determination must be made by investors with the
assistance of their financial representative.
PURCHASE PRIVILEGES FOR DWS AFFILIATED INDIVIDUALS. Current or former Board
members of the DWS funds, employees, their spouses or life partners and
children or step-children age 21 or younger, of Deutsche Bank AG or its
affiliates or a sub-adviser to any DWS fund or a broker-dealer authorized to
sell shares of a fund are generally eligible to purchase shares in the class of
a fund with the lowest expense ratio, usually the Institutional Class shares.
If a fund does not offer Institutional Class shares, these individuals are
eligible to buy Class A shares at NAV. Each fund also reserves the right to
waive the minimum account balance requirement for employee and director
accounts. Fees generally charged to IRA accounts will be charged to accounts of
employees and directors.
MONEY MARKET FUNDS. Shares of a fund are sold at net asset value (normally,
$1.00) directly from a fund or through selected financial services firms, such
as broker-dealers and banks. Each fund seeks to have its investment portfolio
as fully invested as possible at all times in order to achieve maximum income.
Since each fund will be investing in instruments that normally require
immediate payment in Federal Funds (monies credited to a bank's account with
its regional Federal Reserve Bank), as described in the applicable prospectus,
each fund has adopted procedures for the convenience of its shareholders and to
ensure that each fund receives investable funds.
VARIABLE INSURANCE FUNDS. Shares of DWS Variable Series I, DWS Variable Series
II and DWS Investments VIT Fund are continuously offered to separate accounts
of participating insurance companies at the net asset value per share next
determined after a proper purchase request has been received by the insurance
company. The insurance companies offer to variable annuity and variable life
insurance contract owners units in its separate accounts which directly
correspond to shares in a fund. Each insurance company submits purchase and
redemption orders to a fund based on allocation instructions for premium
payments, transfer instructions and surrender or partial withdrawal requests
which are furnished to the insurance company by such contract owners. Contract
owners can send such instructions and requests to the insurance companies in
accordance with procedures set forth in the prospectus for the applicable
variable insurance product offered by the insurance company.
PURCHASES IN-KIND. This section is applicable only to the following funds: DWS
High Income Plus Fund, DWS Mid Cap Growth Fund, DWS Small Cap Growth Fund, DWS
Equity 500 Index VIP and DWS Small Cap Index VIP. A fund may, at its own
option, accept securities in payment for shares. The securities delivered in
payment for shares are valued by the method described under "Net Asset Value"
as of the day a fund receives the securities. This is a taxable transaction to
the shareholder. Securities may be accepted in payment for shares only if they
are, in the judgment of the Advisor, appropriate investments for a fund. In
addition, securities accepted in payment for shares must: (i) meet the
investment objective and policies of the acquiring fund; (ii) be acquired by
the applicable fund for investment and not for resale; (iii) be liquid
securities which are not restricted as to transfer either by law or liquidity
of market; and (iv) if stock, have a value which is readily ascertainable as
evidenced by a listing on a stock exchange, over-the-counter market or by
readily available market quotations from a dealer in such securities. The
shareholder will be charged the costs associated with receiving or delivering
the securities. These costs include security movement costs and taxes and
registration costs. A fund reserves the right to accept or reject at its own
option any and all securities offered in payment for its shares.
II-15
REDEMPTIONS
A fund may offer only certain of the classes of shares referred to in the
subsections below. Thus, the information provided below in regard to the
redemption of certain classes of shares is only applicable to funds offering
such classes of shares.
A request for repurchase (confirmed redemption) may be communicated by a
shareholder through a financial services firm to DIDI, which firms must
promptly submit orders to be effective.
Redemption requests must be unconditional. Redemption requests (and a stock
power for certificated shares) must be duly endorsed by the account holder. As
specified in the relevant prospectus, signatures may need to be guaranteed by a
commercial bank, trust company, savings and loan association, federal savings
bank, member firm of a national securities exchange or other financial
institution permitted by SEC rule. Additional documentation may be required,
particularly from institutional and fiduciary account holders, such as
corporations, custodians (e.g., under the Uniform Transfers to Minors Act),
executors, administrators, trustees or guardians.
WIRES. The ability to send wires is limited by the business hours and holidays
of the firms involved. A fund is not responsible for the efficiency of the
federal wire system or the account holder's financial services firm or bank.
The account holder is responsible for any charges imposed by the account
holder's firm or bank. To change the designated account to receive wire
redemption proceeds, send a written request to the Shareholder Service Agent
with signatures guaranteed as described above or contact the firm through which
fund shares were purchased.
CONTINGENT DEFERRED SALES CHARGE (CDSC). The following example will illustrate
the operation of the CDSC for Class A (when applicable), Class B and Class C
shares, to the extent applicable. Assume that an investor makes a single
purchase of $10,000 of a fund's Class B shares and that 16 months later the
value of the shares has grown by $1,000 through reinvested dividends and by an
additional $1,000 of share appreciation to a total of $12,000. If the investor
were then to redeem the entire $12,000 in share value, the CDSC would be
payable only with respect to $10,000 because neither the $1,000 of reinvested
dividends nor the $1,000 of share appreciation is subject to the charge. The
charge would be at the rate of 3.00% ($300) because the redemption was in the
second year after the purchase was made.
The rate of the CDSC is determined by the length of the period of ownership.
Investments are tracked on a monthly basis. The period of ownership for this
purpose begins the first day of the month in which the order for the investment
is received. For example, an investment made in March of the year of investment
will be eligible for the second year's charge if redeemed on or after the first
day of March of the following year. In the event no specific order is requested
when redeeming shares subject to a CDSC, the redemption will be made first from
shares representing reinvested dividends and then from the earliest purchase of
shares. DIDI receives any CDSC directly. The CDSC will not be imposed upon
redemption of reinvested dividends or share appreciation.
The Class A CDSC for shares purchased through the Large Order NAV Purchase
Privilege will be waived in the event of:
(1) redemptions by a participant-directed qualified retirement plan
described in Code Section 401(a), a participant-directed non-qualified
deferred compensation plan described in Code Section 457 or a
participant-directed qualified retirement plan described in Code Section
403(b)(7) which is not sponsored by a K-12 school district;
(2) redemptions by employer-sponsored employee benefit plans using the
subaccount record keeping system made available through ADP, Inc. (or
ExpertPlan for Flex Plans) under an alliance between ADP, Inc. (or
ExpertPlan for Flex Plans) and DIDI and its affiliates;
(3) redemption of shares of a shareholder (including a registered joint
owner) who has died;
(4) redemption of shares of a shareholder (including a registered joint
owner) who after purchase of the shares being redeemed becomes totally
disabled (as evidenced by a determination by the federal Social Security
Administration);
(5) redemptions under a fund's Automatic Withdrawal Plan at a maximum of 12%
per year of the net asset value of the account;
(6) redemptions of shares whose dealer of record at the time of the
investment notifies DIDI that the dealer waives the discretionary
commission applicable to such Large Order NAV Purchase; and
II-16
(7) redemptions for certain loan advances, hardship provisions or returns of
excess contributions from retirement plans.
The Class B CDSC will be waived for the circumstances set forth in items (3),
(4), (5) and (7) above for Class A shares. In addition, this CDSC will be
waived:
(a) for redemptions made pursuant to any IRA systematic withdrawal based
on the shareholder's life expectancy including, but not limited to,
substantially equal periodic payments described in Code Section
72(t)(2)(A)(iv) prior to age 59 1/2;
(b) for redemptions to satisfy required minimum distributions after age
70 1/2 from an IRA account (with the maximum amount subject to this
waiver being based only upon the shareholder's DWS Investments IRA
accounts); and
(c) in connection with the following redemptions of shares held by
employer-sponsored employee benefit plans maintained on the
subaccount record keeping system made available by ADP, Inc. under
an alliance between ADP, Inc. and DIDI and its affiliates: (1) to
satisfy participant loan advances (note that loan repayments
constitute new purchases for purposes of the CDSC and the conversion
privilege), (2) in connection with retirement distributions (limited
at any one time to 12% of the total value of plan assets invested in
a fund), (3) in connection with distributions qualifying under the
hardship provisions of the Internal Revenue Code, (4) representing
returns of excess contributions to such plans and (5) in connection
with direct "roll over" distributions from a Flex Plan into a DWS
Investments IRA under the Class A net asset value purchase
privilege.
The Class C CDSC will be waived for the circumstances set forth in items (2),
(3), (4), (5) and (7) above for Class A shares and for the circumstances set
forth in items (a) and (b) above for Class B shares. In addition, this CDSC
will be waived for:
(i) redemption of shares by an employer-sponsored employee benefit plan
that offers funds in addition to DWS funds and whose dealer of record
has waived the advance of the first year administrative service and
distribution fees applicable to such shares and agrees to receive such
fees quarterly; and
(ii) redemption of shares purchased through a dealer-sponsored asset
allocation program maintained on an omnibus record-keeping system
provided the dealer of record had waived the advance of the first year
administrative services and distribution fees applicable to such shares
and has agreed to receive such fees quarterly.
REDEMPTIONS IN-KIND. A fund reserves the right to honor any request for
redemption or repurchase by making payment in whole or in part in readily
marketable securities. These securities will be chosen by a fund and valued as
they are for purposes of computing a fund's net asset value. A shareholder may
incur transaction expenses in converting these securities to cash. Please see
the prospectus for any requirements that may be applicable to certain funds to
provide cash up to certain amounts. For the following funds, this right may
only be exercised upon the consent of the shareholder: Money Market Portfolio
and Government & Agency Securities Portfolio, each a series of Cash Account
Trust; Cash Reserves Fund Institutional, a series of DWS Institutional Funds;
DWS Money Market Series, a series of DWS Money Market Trust; and Treasury
Portfolio, a series of Investors Cash Trust.
CHECKWRITING FOR CLASS A, B AND C SHARES (applicable to DWS Short Duration Plus
Fund, DWS Intermediate Tax/AMT Free Fund and DWS Massachusetts Tax-Free Fund
only). The Checkwriting Privilege is not offered to new investors. The
Checkwriting Privilege is available for shareholders of DWS Intermediate
Tax/AMT Free Fund and DWS Short Term Bond Fund (which was acquired by DWS Short
Duration Plus Fund) who previously elected this privilege prior to August 19,
2002, and to shareholders of DWS Massachusetts Tax-Free Fund who were
shareholders of the Scudder Massachusetts Limited Term Tax Free Fund prior to
July 31, 2000. Checks may be used to pay any person, provided that each check
is for at least $100 and not more than $5 million. By using the checks, the
shareholder will receive daily dividend credit on his or her shares until the
check has cleared the banking system. Investors who purchased shares by check
may write checks against those shares only after they have been on a fund's
book for 10 calendar days. Shareholders who use this service may also use other
redemption procedures. No shareholder may write checks against certificated
shares. A fund pays the bank charges for this service. However, each fund will
review the cost of operation periodically and reserve the right to determine if
direct charges to the persons who avail themselves of this service would be
appropriate. Each fund, State Street
II-17
Bank and Trust Company and the Transfer Agent reserve the right at any time to
suspend or terminate the Checkwriting procedure.
MONEY MARKET FUNDS ONLY
The following sections relate to Money Market Funds (except DWS Cash Investment
Trust Class A, B and C Shares of DWS Money Market Prime Series.
REDEMPTION BY CHECK/ACH DEBIT DISCLOSURE. A fund will accept Automated Clearing
House (ACH) debit entries for accounts that have elected the checkwriting
redemption privilege (see Redemptions by Draft below). Please consult the
prospectus for the availability of the checkwriting privilege for a specific
fund. An example of an ACH debit is a transaction in which you have given your
insurance company, mortgage company, credit card company, utility company,
health club, etc., the right to withdraw your monthly payment from your fund
account or the right to convert your mailed check into an ACH debit. Sometimes,
you may give a merchant from whom you wish to purchase goods the right to
convert your check to an ACH debit. You may also authorize a third party to
initiate an individual payment in a specific amount from your account by
providing your account information and authorization to such third party via
the Internet or telephone. You authorize a fund upon receipt of an ACH debit
entry referencing your account number, to redeem fund shares in your account to
pay the entry to the third party originating the debit. A fund will make the
payment on the basis of the account number that you provide to your merchant
and will not compare this account number with the name on the account. A fund,
the Shareholder Service Agent or any other person or system handling the
transaction are not required to determine if there is a discrepancy between the
name and the account number shown on the transfer instructions.
The payment of any ACH debit entry will be subject to sufficient funds being
available in the designated account; a fund will not be able to honor an ACH
debit entry if sufficient funds are not available. ACH debit entry transactions
to your fund account should not be initiated or authorized by you in amounts
exceeding the amount of Shares of a fund then in the account and available for
redemption. A fund may refuse to honor ACH debit entry transactions whenever
the right of redemption has been suspended or postponed, or whenever the
account is otherwise impaired. Your fund account statement will show any ACH
debit entries in your account; you will not receive any other separate notice.
(Merchants are permitted to convert your checks into ACH debits only with your
prior consent.)
You may authorize payment of a specific amount to be made from your account
directly by a fund to third parties on a continuing periodic basis. To arrange
for this service, you should contact the person or company you will be paying.
Any preauthorized transfers will be subject to sufficient funds being available
in the designated account. A preauthorized transfer will continue to be made
from the account in the same amount and frequency as initially established
until you terminate the preauthorized transfer instructions with the person or
company whom you have been paying. If regular preauthorized payments may vary
in amount, the person or company you are going to pay should tell you ten (10)
days before each payment will be made and how much the payment will be. If you
have told a fund in advance to make regular payments out of your account, you
may stop any of these payments by writing or calling the Shareholder Service
Agent at the address and telephone number listed in the next paragraph in time
for the Shareholder Service Agent to receive your request three (3) business
days or more before the payment is scheduled to be made. If you call, a fund
may also require that you put your request in writing so that a fund will
receive it within 14 days after you call. If you order a fund to stop one of
these payments three (3) business days or more before the transfer is scheduled
and a fund does not do so, a fund will be liable for your loss or damages but
not in an amount exceeding the amount of the payment. A stop payment order will
stop only the designated periodic payment. If you wish to terminate the
periodic preauthorized transfers, you should do so with the person or company
to whom you have been making payments.
IN CASE OF ERRORS OR QUESTIONS ABOUT YOUR ACH DEBIT ENTRY TRANSACTIONS please
telephone (800-621-1048 but for Class S shares use 800-728-3337 and for
Institutional class shares use 800-730-1313) or write (DWS Investments Service
Company, P.O. Box 219151, Kansas City, MO 64121-9151) the Shareholder Service
Agent as soon as possible if you think your statement is wrong or shows an
improper transfer or if you need more information about a transfer listed on
the statement. Our business days are Monday through Friday except holidays. The
Shareholder Service Agent must hear from you no later than 60 days after a fund
sent you the first fund account statement on which the problem or error
appeared. If you do not notify the Shareholder Service Agent within sixty (60)
days after a fund sends you the account statement, you may not get back any
money you have lost, and you may not get back any additional money you lose
after the sixty (60) days if a fund or the
II-18
Shareholder Service Agent could have stopped someone from taking that money if
you had notified the Shareholder Service Agent in time.
Tell us your name and account number, describe the error or the transfer you
are unsure about, and explain why you believe it is an error or why you need
more information. Tell us the dollar amount of the suspected error. If you tell
the Shareholder Service Agent orally, the Shareholder Service Agent may require
that you send your complaint or questions in writing within ten (10) business
days. The Shareholder Service Agent will determine whether an error occurred
within ten (10) business days after it hears from you and will correct any
error promptly. If the Shareholder Service Agent needs more time, however, it
may take up to 45 days (90 days for certain types of transactions) to
investigate your complaint or question. If the Shareholder Service Agent
decides to do this, your account will be credited with escrowed fund shares
within ten (10) business days for the amount you think is in error so that you
will have the use of the money during the time it takes the Shareholder Service
Agent to complete its investigation. If the Shareholder Service Agent asks you
to put your complaint or questions in writing and the Shareholder Service Agent
does not receive it within ten (10) business days, your account may not be
credited. The Shareholder Service Agent will tell you the results within three
(3) business days after completing its investigation. If the Shareholder
Service Agent determines that there was no error, the Shareholder Service Agent
will send you a written explanation. You may ask for copies of documents that
were used by the Shareholder Service Agent in the investigation.
In the event a fund or the Shareholder Service Agent does not complete a
transfer from your account on time or in the correct amount according to a
fund's agreement with you, a fund may be liable for your losses or damages. A
fund will not be liable to you if (i) there are not sufficient funds available
in your account, (ii) circumstances beyond our control (such as fire or flood
or malfunction of equipment) prevent the transfer, (iii) you or another
shareholder have supplied a merchant with incorrect account information, or
(iv) a merchant has incorrectly formulated an ACH debit entry. In any case, a
fund's liability shall not exceed the amount of the transfer in question.
A fund or the Shareholder Service Agent will disclose information to third
parties about your account or the transfers you make: (1) where it is necessary
for completing the transfers, (2) in order to verify the existence or condition
of your account for a third party such as a credit bureau or a merchant, (3) in
order to comply with government agencies or court orders or (4) if you have
given a fund written permission.
The acceptance and processing of ACH debit entry transactions is established
solely for your convenience and a fund reserves the right to suspend, terminate
or modify your ability to redeem fund shares by ACH debit entry transactions at
any time. ACH debit entry transactions are governed by the rules of the
National Automated Clearing House Association (NACHA) Operating Rules and any
local ACH operating rules then in effect, as well as Regulation E of the
Federal Reserve Board.
REDEMPTIONS BY DRAFT. Upon request, shareholders of certain Money Market Funds
will be provided with drafts to be drawn on a fund (Redemption Checks). Please
consult the prospectus for the availability of the checkwriting redemption
privilege for a specific Money Market Fund. These Redemption Checks may be made
payable to the order of any person for not more than $5 million. When a
Redemption Check is presented for payment, a sufficient number of full and
fractional shares in the shareholder's account will be redeemed as of the next
determined net asset value to cover the amount of the Redemption Check. This
will enable the shareholder to continue earning dividends until a fund receives
the Redemption Check. A shareholder wishing to use this method of redemption
must complete and file an Account Application which is available from a fund or
firms through which shares were purchased. Redemption Checks should not be used
to close an account since the account normally includes accrued but unpaid
dividends. A fund reserves the right to terminate or modify this privilege at
any time. This privilege may not be available through some firms that
distribute shares of a fund. In addition, firms may impose minimum balance
requirements in order to offer this feature. Firms may also impose fees to
investors for this privilege or establish variations of minimum check amounts.
Unless more than one signature is required pursuant to the Account Application,
only one signature will be required on Redemption Checks. Any change in the
signature authorization must be made by written notice to the Shareholder
Service Agent. Shares purchased by check or through certain ACH transactions
may not be redeemed by Redemption Check until the shares have been on a fund's
books for at least 10 days. Shareholders may not use this procedure to redeem
shares held in certificate form. A fund reserves the right to terminate or
modify this privilege at any time.
II-19
A fund may refuse to honor Redemption Checks whenever the right of redemption
has been suspended or postponed, or whenever the account is otherwise impaired.
A $10 service fee will be charged when a Redemption Check is presented to
redeem fund shares in excess of the value of a fund account or in an amount
less than the minimum Redemption Check amount specified in the prospectus; when
a Redemption Check is presented that would require redemption of shares that
were purchased by check or certain ACH transactions within 10 days; or when
"stop payment" of a Redemption Check is requested.
SPECIAL REDEMPTION FEATURES. Certain firms that offer Shares of the Money
Market Funds also provide special redemption features through charge or debit
cards and checks that redeem fund shares. Various firms have different charges
for their services. Shareholders should obtain information from their firm with
respect to any special redemption features, applicable charges, minimum balance
requirements and special rules of the cash management program being offered.
EXCHANGES
A fund may offer only certain of the classes of shares referred to in the
subsections below. Thus, the information provided below in regard to the
exchange of certain classes of shares is only applicable to funds offering such
classes of shares.
GENERAL. Shareholders may request a taxable exchange of their shares for shares
of the corresponding class of other DWS funds without imposition of a sales
charge, subject to the provisions below. If you exchange shares that have a
CDSC, the CDSC is not imposed on the exchange; however, the later redemption of
the acquired shares would be subject to the CDSC schedule of the acquired fund
(which, for Class A shares only, may differ from the schedule for a fund you
are exchanging out of), based on original cost and purchase date of the shares
you exchanged out of.
Shareholders who exchange their shares out of a DWS money market fund into
Class A shares of certain other DWS funds will generally be subject to the
applicable sales charge (not including shares acquired by dividend reinvestment
or by exchange from Class A shares of another DWS fund).
Certain DWS funds may not be available to shareholders on an exchange. To learn
more about which DWS funds may be available on exchange, please contact your
financial services firm or visit our Web site at: www.dws-investments.com or
call 800-621-1048 (for Class S shares use 800-728-3337 and for Institutional
class shares use 800-730-1313).
Shareholders must obtain prospectus(es) of the DWS fund they are exchanging
into from dealers, other firms or DIDI.
MULTI-CLASS CONVERSIONS. For purposes of conversion to Class A shares, shares
purchased through the reinvestment of dividends and other distributions paid
with respect to Class B shares in a shareholder's fund account will be
converted to Class A shares on a pro rata basis.
EXCHANGES INVOLVING INSTITUTIONAL SHARES. The following persons may, subject to
certain limitations, exchange the DWS Money Market Fund shares of DWS Money
Market Prime Series, for shares of the institutional class of other DWS funds,
and may exchange shares of the institutional class of other DWS funds for DWS
Money Market Fund shares: (1) a current or former director or trustee of the
Deutsche or DWS mutual funds; and (2) an employee, the employee's spouse or
life partner and children or stepchildren age 21 or younger of Deutsche Bank or
its affiliates or a subadvisor to any fund in the DWS family of funds or a
broker-dealer authorized to sell shares of a fund.
CLASS A TO CLASS S IN THE SAME FUND EXCHANGE PRIVILEGE: Investors who have
invested in Class A shares through a comprehensive or "wrap" fee program, or
other fee-based program sponsored by a broker-dealer, bank or registered
investment adviser may become eligible to invest in Class S shares. Subject to
the discretion of DWS Investments Distributors, Inc., such shareholders may
exchange their Class A shares for Class S shares of equal aggregate value of
the same fund. No sales charge or other charges will apply to any such
exchanges. Investors should contact their selling and/or servicing agents to
learn more about the details of this exchange feature.
COMPENSATION OF FINANCIAL INTERMEDIARIES
INCENTIVE PLAN FOR DWS INVESTMENTS DISTRIBUTORS PERSONNEL. DIDI has adopted an
Incentive Plan (Plan) covering wholesalers that are regional vice presidents
(DWS Investments Wholesalers). Generally, DWS Investments Wholesalers market
shares of the DWS funds to financial advisors, who in turn may recommend that
investors purchase shares of a DWS fund. The Plan is an incentive program that
combines a monthly incentive component with an annual outperformance award
II-20
potential, based on achieving certain sales and other performance metrics.
Under the Plan, DWS Investments Wholesalers will receive a monetary monthly
incentive based on the amount of sales generated from their marketing of the
funds, and that incentive will differ depending on the product tier of a fund.
Each fund is assigned to one of four product tiers - Tier I: cornerstone or
capital market compass funds; Tier II: core or baseline funds; Tier III:
non-core funds; and Tier IV: index or passive funds - taking into
consideration, among other things, the following criteria, where applicable:
o a fund's consistency with DWS Investments' branding and long-term
strategy
o a fund's competitive performance
o a fund's Morningstar rating
o The length of time a fund's Portfolio Managers have managed a
fund/Strategy
o Market size for the fund tier
o a fund's size, including sales and redemptions of a fund's shares
This information and other factors are presented to a senior management
committee comprised of representatives from various groups within DWS
Investments, who review on a regular basis the funds assigned to each product
tier described above, and may make changes to those assignments periodically.
No one factor, whether positive or negative, determines a fund's placement in a
given product tier; all these factors together are considered, and the
designation of funds in a particular tier represents management's judgment
based on the above criteria. In addition, management may consider a fund's
profile over the course of several review periods before making a change to its
tier assignment. These tier assignments will be posted quarterly to the DWS
funds' Web site at www.dws-investments.com/EN/ wholesaler-compensation.jsp,
approximately one month after the end of each quarter. DWS Investments
Wholesalers receive the highest compensation for Tier I funds, successively
less for Tier II (within which there are two payout sub-tiers) and Tier III
funds, and the lowest for Tier IV funds. The level of compensation among these
product tiers may differ significantly.
In the normal course of business, DWS Investments will from time to time
introduce new funds into the DWS family of funds. As a general rule, new funds
will be assigned to the product tier that is most appropriate to the type of
fund at the time of its launch based on the criteria described above. As
described above, the fund tier assignments are reviewed periodically and are
subject to change.
The prospect of receiving, or the receipt of, additional compensation by a DWS
Investments Wholesaler under the Plan may provide an incentive to favor
marketing funds in higher payout tiers over funds in lower payout tiers. The
Plan, however, will not change the price that investors pay for shares of a
fund. The DWS Investments Compliance Department monitors DWS Investments
Wholesaler sales and other activity in an effort to detect unusual activity in
the context of the compensation structure under the Plan. However, investors
may wish to take the Plan and the product tier of the fund into account when
considering purchasing a fund or evaluating any recommendations relating to
fund shares.
FINANCIAL SERVICES FIRMS' COMPENSATION. DIDI may pay compensation to financial
intermediaries in connection with the sale of fund shares as described in PART
II - APPENDIX II-D. In addition, financial intermediaries may receive
compensation for post-sale administrative services from DIDI or directly from a
fund as described in PART II - APPENDIX II-D.
COMPENSATION FOR RECORDKEEPING SERVICES. Certain financial institutions,
including affiliates of DIDI, may receive compensation from a fund for
recordkeeping and other expenses relating to nominee accounts or for providing
certain services to their client accounts. Generally, payments by a fund to
financial institutions for providing such services are not expected to exceed
0.25% of shareholder assets for which such services are provided. Normally,
compensation for these financial institutions is paid by the Transfer Agent,
which is in turn reimbursed by the applicable fund. To the extent that record
keeping compensation in excess of the amount reimbursed by a fund is owed to a
financial institution, the Transfer Agent, Distributor or Advisor may pay
compensation from their own resources (see Financial Intermediary Support
Payments below).
COMPENSATION FOR RECORDKEEPING SERVICES: VARIABLE INSURANCE FUNDS. Technically,
the shareholders of DWS Variable Series I, DWS Variable Series II and DWS
Investments VIT Funds are the participating insurance companies that offer
shares of the funds as investment options for holders of certain variable
annuity contracts and variable life insurance policies. Effectively, ownership
of fund shares is passed through to insurance company contract and policy
holders. The holders of the shares of a fund
II-21
on the records of a fund are the insurance companies and no information
concerning fund holdings of specific contract and policy holders is maintained
by a fund. The insurance companies place orders for the purchase and redemption
of fund shares with a fund reflecting the investment of premiums paid,
surrender and transfer requests and other matters on a net basis; they maintain
all records of the transactions and holdings of fund shares and distributions
thereon for individual contract and policy holders; and they prepare and mail
to contract and policy holders confirmations and periodic account statements
reflecting such transactions and holdings.
A fund may compensate certain insurance companies for record keeping and other
administrative services performed with regard to holdings of Class B shares as
an expense of the Class B shares up to 0.15%. These fees are included within
the "Other Expenses" category in the fee table for each portfolio in the Class
B Shares Prospectus (see How Much Investors Pay in the applicable fund's
prospectus). In addition, the Advisor may, from time to time, pay from its own
resources certain insurance companies for record keeping and other
administrative services related to Class A and Class B shares of the Portfolios
held by such insurance companies on behalf of their contract and policy holders
(see Financial Intermediary Support Payments below).
FINANCIAL INTERMEDIARY SUPPORT PAYMENTS. In light of recent regulatory
developments, the Advisor, the Distributor and their affiliates have undertaken
to furnish certain additional information below regarding the level of payments
made by them to selected affiliated and unaffiliated brokers, dealers,
participating insurance companies or other financial intermediaries (financial
advisors) in connection with the sale and/or distribution of fund shares or the
retention and/or servicing of investors and fund shares (revenue sharing).
The Advisor, the Distributor and/or their affiliates may pay additional
compensation, out of their own assets and not as an additional charge to each
fund, to financial advisors in connection with the sale and/or distribution of
fund shares or the retention and/or servicing of fund investors and fund
shares. Such revenue sharing payments are in addition to any distribution or
service fees payable under any Rule 12b-1 or service plan of any fund, any
record keeping/sub-transfer agency/networking fees payable by each fund
(generally through the Distributor or an affiliate) and/or the Distributor to
certain financial advisors for performing such services and any sales charges,
commissions, non-cash compensation arrangements expressly permitted under
applicable rules of FINRA or other concessions described in the fee table or
elsewhere in the prospectuses or the SAI as payable to all financial advisors.
For example, the Advisor, the Distributor and/or their affiliates may
compensate financial advisors for providing each fund with "shelf space" or
access to a third party platform or fund offering list, or other marketing
programs including, without limitation, inclusion of each fund on preferred or
recommended sales lists, mutual fund "supermarket" platforms and other formal
sales programs; granting the Distributor access to the financial advisor's
sales force; granting the Distributor access to the financial advisor's
conferences and meetings; assistance in training and educating the financial
advisor's personnel; and, obtaining other forms of marketing support. The level
of revenue sharing payments made to financial advisors may be a fixed fee or
based upon one or more of the following factors: gross sales, current assets
and/or number of accounts of each fund attributable to the financial advisor,
the particular fund or fund type or other measures as agreed to by the Advisor,
the Distributor and/or their affiliates and the financial advisors or any
combination thereof. The amount of these payments is determined at the
discretion of the Advisor, the Distributor and/or their affiliates from time to
time, may be substantial, and may be different for different financial advisors
based on, for example, the nature of the services provided by the financial
advisor.
The Advisor, the Distributor and/or their affiliates currently make revenue
sharing payments from their own assets in connection with the sale and/or
distribution of DWS fund shares, or the retention and/or servicing of
investors, to financial advisors in amounts that generally range from 0.01% up
to 0.26% of assets of a fund serviced and maintained by the financial advisor,
0.05% to 0.25% of sales of a fund attributable to the financial advisor, a flat
fee of $4,000 up to $500,000, or any combination thereof. These amounts are
annual figures typically paid on a quarterly basis and are subject to change at
the discretion of the Advisor, the Distributor and/or their affiliates. Receipt
of, or the prospect of receiving, this additional compensation, may influence
your financial advisor's recommendation of a fund or of any particular share
class of a fund. You should review your financial advisor's compensation
disclosure and/or talk to your financial advisor to obtain more information on
how this compensation may have influenced your financial advisor's
recommendation of a fund.
The Advisor, the Distributor and/or their affiliates may also make such revenue
sharing payments to financial advisors under the terms discussed above in
connection with the distribution of both DWS funds and non-DWS funds by
financial advisors to retirement plans that obtain
II-22
record keeping services from ADP, Inc. or ExpertPlan, Inc. on the DWS
Investments branded retirement plan platform (the "Platform") with the level of
revenue sharing payments being based upon sales of both the DWS funds and the
non-DWS funds by the financial advisor on the Platform or current assets of
both the DWS funds and the non-DWS funds serviced and maintained by the
financial advisor on the Platform.
As of the date hereof, each fund has been advised that the Advisor, the
Distributor and their affiliates expect that the firms listed in PART II -
APPENDIX II-E will receive revenue sharing payments at different points during
the coming year as described above.
The Advisor, the Distributor or their affiliates may enter into additional
revenue sharing arrangements or change or discontinue existing arrangements
with financial advisors at any time without notice.
The prospect of receiving, or the receipt of additional compensation or
promotional incentives described above by financial advisors may provide such
financial advisors and/or their salespersons with an incentive to favor sales
of shares of the DWS funds or a particular DWS fund over sales of shares of
mutual funds (or non-mutual fund investments) with respect to which the
financial advisor does not receive additional compensation or promotional
incentives, or receives lower levels of additional compensation or promotional
incentives. Similarly, financial advisors may receive different compensation or
incentives that may influence their recommendation of any particular share
class of a fund or of other funds. These payment arrangements, however, will
not change the price that an investor pays for fund shares or the amount that a
fund receives to invest on behalf of an investor and will not increase fund
expenses. You may wish to take such payment arrangements into account when
considering and evaluating any recommendations relating to fund shares and you
should discuss this matter with your financial advisor and review your
financial advisor's disclosures.
It is likely that broker-dealers that execute portfolio transactions for a fund
will include firms that also sell shares of the DWS funds to their customers.
However, the Advisor will not consider sales of DWS fund shares as a factor in
the selection of broker-dealers to execute portfolio transactions for the DWS
funds. Accordingly, the Advisor has implemented policies and procedures
reasonably designed to prevent its traders from considering sales of DWS fund
shares as a factor in the selection of broker-dealers to execute portfolio
transactions for a fund. In addition, the Advisor, the Distributor and/or their
affiliates will not use fund brokerage to pay for their obligation to provide
additional compensation to financial advisors as described above.
DIVIDENDS (FOR ALL FUNDS EXCEPT MONEY FUNDS). A fund, other than a money fund,
intends to distribute, at least annually: (i) substantially all of its
investment company taxable income (computed without regard to the
dividends-paid deduction), which includes any excess of net realized short-term
capital gains over net realized long-term capital losses and net tax-exempt
income, if any; and (ii) the entire excess of net realized long-term capital
gains over net realized short-term capital losses. However, if a fund
determines that it is in the interest of its shareholders, a fund may decide to
retain all or part of its net realized long-term capital gains for
reinvestment, after paying the related federal taxes. In such a case,
shareholders will generally be treated for federal income tax purposes as
having received their share of such gains, but will then be able to claim a
credit against their federal income tax liability for the federal income tax a
fund pays on such gain. If a fund does not distribute the amount of ordinary
income and/or capital gain required to be distributed by an excise tax
provision of the Code, a fund may be subject to that excise tax on the
undistributed amounts. In certain circumstances, a fund may determine that it
is in the interest of shareholders to distribute less than the required amount.
A fund has a schedule for paying out any earnings to shareholders (see
Understanding Distributions and Taxes in each fund's prospectus).
Additional distributions may also be made in November or December (or treated
as made on December 31) if necessary to avoid an excise tax imposed under the
Code. Both types of distributions will be made in shares of a fund and
confirmations will be mailed to each shareholder unless a shareholder has
elected to receive cash, in which case a check will be sent.
Any dividends or capital gains distributions declared in October, November or
December with a record date in such a month and paid during the following
January will be treated by shareholders for federal income tax purposes as if
received on December 31 of the calendar year declared.
Dividends paid by a fund with respect to each class of its shares will be
calculated in the same manner, at the same time and on the same day.
II-23
The level of income dividends per share (as a percentage of net asset value)
will be lower for Class B and C shares than for other share classes primarily
as a result of the distribution services fee applicable to Class B and C
shares. Distributions of capital gains, if any, will be paid in the same amount
for each class.
Income dividends and capital gain dividends (see Taxation of US Shareholders -
Dividends and Distributions), if any, of a fund will be credited to shareholder
accounts in full and fractional shares of the same class of that fund at net
asset value on the reinvestment date, unless shareholders indicate to the
Shareholder Service Agent, in writing, that they wish to receive them in cash
or in shares of other DWS funds as provided in the fund's prospectus.
Shareholders must maintain the required minimum account balance in the fund
distributing the dividends in order to use this privilege of investing
dividends of a fund in shares of another DWS fund. A fund will reinvest
dividend checks (and future dividends) in shares of that same fund and class if
checks are returned as undeliverable. Dividends and other distributions of a
fund in the aggregate amount of $10 or less are automatically reinvested in
shares of that fund and class unless the shareholder requests in writing that a
check be issued for that particular distribution.
If a shareholder has elected to reinvest any dividends and/or other
distributions, such distributions will be made in shares of that fund and
confirmations will be mailed to each shareholder. If a shareholder has chosen
to receive cash, a check will be sent. Distributions of investment company
taxable income and net realized capital gains are generally taxable, whether
made in shares or cash.
Each distribution is accompanied by a brief explanation of the form and
character of the distribution. The characterization of distributions on such
correspondence may differ from the characterization for federal income tax
purposes. Early each year, a fund issues to each shareholder a statement of the
federal income tax status of all distributions in the prior calendar year.
A fund may at any time vary its foregoing distribution practices and,
therefore, reserves the right from time to time to either distribute or retain
for reinvestment such of its net investment income and its net short-term and
net long-term capital gains as its Board determines appropriate under the
then-current circumstances. In particular, and without limiting the foregoing,
a fund may make additional distributions of net investment income or capital
gain net income in order to satisfy the minimum distribution requirements
contained in the Code.
DIVIDENDS (MONEY FUNDS). Dividends are declared daily and paid monthly.
Shareholders will receive dividends in additional shares unless they elect to
receive cash, as provided in a fund's prospectus. Dividends will be reinvested
monthly in shares of a fund at net asset value on the last business day of the
month. A fund will pay shareholders that redeem their entire accounts all
unpaid dividends at the time of the redemption not later than the next dividend
payment date.
Each money fund calculates its dividends based on its daily net investment
income. For this purpose, the net investment income of a money fund generally
consists of (a) accrued interest income plus or minus amortized discount or
premium, (b) plus or minus all short-term realized gains and losses on
investments and (c) minus accrued expenses allocated to the applicable fund.
Expenses of each money fund are accrued each day. Dividends are reinvested
monthly and shareholders will receive monthly confirmations of dividends and of
purchase and redemption transactions except that confirmations of dividend
reinvestment for Individual Retirement Accounts and other fiduciary accounts
for which SSB acts as trustee will be sent quarterly.
Distributions of a fund's pro rata share of a fund's net realized long-term
capital gains in excess of net realized short-term capital losses, if any, and
any undistributed net realized short-term capital gains in excess of net
realized long-term capital losses are normally declared and paid annually at
the end of the fiscal year in which they were earned to the extent they are not
offset by any capital loss carryforwards.
If the shareholder elects to receive dividends or distributions in cash, checks
will be mailed monthly, within five business days of the reinvestment date, to
the shareholder or any person designated by the shareholder. A fund reinvests
dividend checks (and future dividends) in shares of a fund if checks are
returned as undeliverable. Dividends and other distributions in the aggregate
amount of $10 or less are automatically reinvested in shares of a fund unless
the shareholder requests that such policy not be applied to the shareholder's
account.
Dividends and distributions are treated the same for federal income tax
purposes, whether made in shares or cash.
DISTRIBUTION AND SERVICE AGREEMENTS AND PLANS
I. RETAIL FUNDS
II-24
A fund may offer only certain of the classes of shares referred to in the
subsections below. Thus, the information provided below in regard to certain
classes of shares is only applicable to funds offering such classes of shares.
RULE 12B-1 PLANS. Certain funds, as described in the applicable prospectuses,
have adopted plans pursuant to Rule 12b-1 under the 1940 Act (each a Rule 12b-1
Plan) on behalf of their Class A, B, C and R shares, as applicable, that
authorize payments out of class assets for distribution and/or shareholder and
administrative services as described in more detail below. Because Rule 12b-1
fees are paid out of class assets on an ongoing basis, they will, over time,
increase the cost of an investment and may cost more than other types of sales
charges.
Rule 12b-1 Plans provide alternative methods for paying sales charges and
provide compensation to DIDI or intermediaries for post-sale servicing, which
may help funds grow or maintain asset levels to provide operational
efficiencies and economies of scale. Each Rule 12b-1 Plan is approved and
reviewed separately for each applicable class in accordance with Rule 12b-1
under the 1940 Act, which regulates the manner in which an investment company
may, directly or indirectly, bear the expenses of distributing its shares. A
Rule 12b-1 Plan may not be amended to increase the fee to be paid by a fund
with respect to a class without approval by a majority of the outstanding
voting securities of such class.
If a Rule 12b-1 Plan is terminated in accordance with its terms, the obligation
of the applicable class to make payments to DIDI pursuant to the Rule 12b-1
Plan will cease and a fund will not be required to make any payments not
previously accrued past the termination date. Thus, there is no legal
obligation for a class to pay any expenses incurred by DIDI other than fees
previously accrued and payable under a Rule 12b-1 Plan, if for any reason the
Rule 12b-1 Plan is terminated in accordance with its terms. Because the Rule
12b-1 Plans are compensation plans, future fees under a Rule 12b-1 Plan may or
may not be sufficient to cover DIDI for its expenses incurred. On the other
hand, under certain circumstances, DIDI might collect in the aggregate over
certain periods more in fees under the applicable Rule 12b-1 Plan than it has
expended over that same period in providing distribution services for a fund.
For example, if Class B shares of a fund were to appreciate (resulting in
greater asset base against which Rule 12b-1 fees are charged) and sales of a
fund's Class B shares were to decline (resulting in lower expenditures by DIDI
under the Rule 12b-1 Plan), fees payable could exceed expenditures. Similarly,
fees paid to DIDI could exceed DIDI's expenditures over certain periods shorter
than the life of the Rule 12b-1 Plan simply due to the timing of expenses
incurred by DIDI that is not matched to the timing of revenues received (e.g.,
a sales commission may be paid by DIDI related to an investment in Class B
shares in year 1, while the Rule 12b-1 fee to DIDI related to that investment
may accrue during year 1 through year 6 prior to conversion of the Class B
shares investment to Class A shares). Under these or other circumstances where
DIDI's expenses are less than the Rule 12b-1 fees, DIDI will retain its full
fees and make a profit.
CLASS B, CLASS C AND CLASS R SHARES
FEES FOR DISTRIBUTION SERVICES. For its services under the Distribution
Agreement, DIDI receives a fee from a fund under its Rule 12b-1 Plan, payable
monthly, at the annual rate of 0.75% of average daily net assets of a fund
attributable to its Class B shares. This fee is accrued daily as an expense of
Class B shares. Under the Distribution Agreement, DIDI also receives any
contingent deferred sales charges paid with respect to Class B shares. DIDI
currently compensates firms for sales of Class B shares at a commission rate of
3.75%.
For its services under the Distribution Agreement, DIDI receives a fee from a
fund under its Rule 12b-1 Plan, payable monthly, at the annual rate of 0.75% of
average daily net assets of a fund attributable to Class C shares. This fee is
accrued daily as an expense of Class C shares. DIDI currently advances to firms
the first year distribution fee at a rate of 0.75% of the purchase price of
Class C shares. DIDI does not advance the first year distribution fee to firms
for sales of Class C shares to employer-sponsored employee benefit plans using
the OmniPlus subaccount record keeping system made available through ADP, Inc.
under an alliance between ADP, Inc. and DIDI and its affiliates. For periods
after the first year, DIDI currently pays firms for sales of Class C shares a
distribution fee, payable quarterly, at an annual rate of 0.75% of net assets
attributable to Class C shares maintained and serviced by the firm. This fee
continues until terminated by DIDI or the applicable fund. Under the
Distribution Agreement, DIDI also receives any contingent deferred sales
charges paid with respect to Class C shares.
For its services under the Distribution Agreement, DIDI receives a fee from a
fund under its Rule 12b-1 Plan, payable monthly, at the annual rate of 0.25% of
average daily net assets of a fund attributable to Class R shares. This fee is
accrued daily as an expense of Class R shares. DIDI currently pays firms for
sales of Class R shares a distribution fee, payable quarterly, at an annual
rate of
II-25
0.25% of net assets attributable to Class R shares maintained and serviced by
the firm. This fee continues until terminated by DIDI or the applicable fund.
CLASS A, CLASS B, CLASS C AND CLASS R SHARES
FEES FOR SHAREHOLDER SERVICES. For its services under the Services Agreement,
DIDI receives a shareholder services fee from a fund under a Rule 12b-1 Plan,
payable monthly, at an annual rate of up to 0.25% of the average daily net
assets of Class A, B, C and R shares of a fund, as applicable.
With respect to Class A and Class R Shares of a fund, DIDI pays each firm a
service fee, payable quarterly, at an annual rate of up to 0.25% of the net
assets in fund accounts that it maintains and services attributable to Class A
and Class R Shares of a fund, generally commencing with the month after
investment. With respect to Class B and Class C Shares of a fund, DIDI
currently advances to firms the first-year service fee at a rate of up to 0.25%
of the purchase price of such shares. DIDI does not advance the first year
service fee to firms for sales of Class C shares to employer-sponsored employee
benefit plans using the OmniPlus subaccount record keeping system made
available through ADP, Inc. under an alliance between ADP, Inc. and DIDI and
its affiliates. For periods after the first year, DIDI currently intends to pay
firms a service fee at a rate of up to 0.25% (calculated monthly and paid
quarterly) of the net assets attributable to Class B and Class C shares of a
fund maintained and serviced by the firm.
Firms to which service fees may be paid include affiliates of DIDI. In addition
DIDI may, from time to time, pay certain firms from it own resources additional
amounts for ongoing administrative services and assistance provided to their
customers and clients who are shareholders of a fund.
DIDI also may provide some of the above services and may retain any portion of
the fee under the Services Agreement not paid to firms to compensate itself for
shareholder or administrative functions performed for a fund. Currently, the
shareholder services fee payable to DIDI is payable at an annual rate of up to
0.25% of net assets based upon fund assets in accounts for which a firm
provides administrative services and at the annual rate of 0.15% of net assets
based upon fund assets in accounts for which there is no firm of record (other
than DIDI) listed on a fund's records. The effective shareholder services fee
rate to be charged against all assets of each fund while this procedure is in
effect will depend upon the proportion of fund assets that is held in accounts
for which a firm of record provides shareholder services. The Board of each
fund, in its discretion, may approve basing the fee to DIDI at the annual rate
of 0.25% on all fund assets in the future.
II. MONEY MARKET FUNDS (EXCEPT DWS CASH INVESTMENT TRUST CLASS A, B AND C
SHARES, WHICH ARE ADDRESSED UNDER RETAIL FUNDS ABOVE)
RULE 12B-1 PLANS. Certain Money Market Funds have adopted for certain classes
of shares a plan pursuant to Rule 12b-1 under the 1940 Act (each a Rule 12b-1
Plan) that provides for fees payable as an expense of the class that are used
by DIDI to pay for distribution services for those classes. Additionally, in
accordance with the Rule 12b-1 Plan for certain classes, shareholder and
administrative services are provided to the applicable fund for the benefit of
the relevant classes under a fund's Services Agreement with DIDI. With respect
to certain classes, shareholder and administrative services may be provided
outside of a Rule 12b-1 Plan either by DIDI pursuant to the Services Agreement
or by financial services firms under a Shareholder Services Plan. Because Rule
12b-1 fees are paid out of fund assets on an ongoing basis, they will, over
time, increase the cost of an investment and may cost more than other types of
sales charges.
The Rule 12b-1 Plans provide alternative methods for paying for distribution
services and provide compensation to DIDI or financial services firms for
post-sales servicing, which may help funds grow or maintain asset levels to
provide operational efficiencies and economies of scale. Each Rule 12b-1 Plan
is approved and reviewed separately for each such class in accordance with Rule
12b-1 under the 1940 Act, which regulates the manner in which an investment
company may, directly or indirectly, bear the expenses of distributing its
shares. A Rule 12b-1 Plan may not be amended to increase the fee to be paid by
a fund with respect to a class without approval by a majority of the
outstanding voting securities of such class of a fund.
If a Rule 12b-1 Plan is terminated in accordance with its terms, the obligation
of the applicable fund to make payments to DIDI pursuant to the Rule 12b-1 Plan
will cease and a fund will not be required to make any payments not previously
accrued past the termination date. Thus, there is no legal obligation for a
fund to pay any expenses incurred by DIDI other than fees previously accrued
and payable under a Rule 12b-1 Plan, if for any reason the Rule 12b-1 Plan is
terminated in accordance with its terms. Because the Rule 12b-1 Plans are
compensation plans, future fees under a Rule 12b-1 Plan
II-26
may or may not be sufficient to cover DIDI for its expenses incurred. On the
other hand, under certain circumstances, DIDI might collect in the aggregate
over certain periods more in fees under the applicable Rule 12b-1 Plan than it
has expended over that same period.
DISTRIBUTION AND SHAREHOLDER SERVICES
Service Shares - Cash Account Trust. The Distribution Agreement authorizes the
fund to pay DIDI, as an expense of the Service Shares classes of the Money
Market Portfolio, the Government & Agency Securities Portfolio and the
Tax-Exempt Portfolio of Cash Account Trust, a distribution services fee,
payable monthly, at an annual rate of 0.60% of average daily net assets of the
Service Shares of the applicable fund. This fee is paid pursuant to a Rule
12b-1 Plan. DIDI normally pays firms a fee for distribution and administrative
services, payable monthly, at a maximum annual rate of up to 0.60% of average
daily net assets of Service Shares held in accounts that they maintain and
service.
Premier Shares - Tax-Exempt California Money Market Fund. The Distribution
Agreement authorizes the fund to pay DIDI, as an expense of the Premier Shares
class of the Tax-Exempt California Money Market Fund, a distribution services
fee, payable monthly, at an annual rate of 0.33% of average daily net assets of
the Premier Shares of the fund. This fee is paid pursuant to a Rule 12b-1 Plan.
DIDI normally pays firms a fee for distribution and administrative services,
payable monthly, at a maximum annual rate of up to 0.33% of average daily net
assets of Premier Shares held in accounts that they maintain and service.
Tax-Exempt New York Money Market Fund - NY Tax Free Money Fund. The
Distribution Agreement authorizes the fund to pay DIDI, as an expense of
Tax-Exempt New York Money Market Fund shares, a class of NY Tax Free Money
fund, a series of DWS Advisor funds, a distribution services fee, payable
monthly, at an annual rate of 0.50% of average daily net assets of the
Tax-Exempt New York Money Market Fund shares of the fund. This fee is paid
pursuant to a Rule 12b-1 Plan. DIDI normally pays firms a fee for distribution
and administrative services, payable monthly, at a maximum annual rate of up to
0.50% of average daily net assets of Tax-Exempt New York Money Market Fund
shares held in accounts that they maintain and service.
Premium Reserve Money Market Shares - Cash Account Trust. The Services
Agreement authorizes the fund to pay DIDI, as an expense of the Premium Reserve
Money Market Shares class of the Money Market Portfolio of Cash Account Trust,
an administrative service fee, payable monthly, at an annual rate of 0.25% of
average daily net assets of the Premium Reserve Money Market Shares of the
fund. A portion of this administrative service fee (0.10% of the 0.25% fee) is
paid pursuant to a Rule 12b-1 Plan. The Premium Money Market Reserve Shares pay
the full amount authorized by the Plan as part of its 0.25% administrative
service rate. DIDI normally pays firms a fee for administrative services,
payable monthly, at a maximum annual rate of up to 0.25% of average daily net
assets of Premium Reserve Money Market Shares held in accounts that they
maintain and service.
Institutional Money Market Shares-Cash Account Trust. The Services Agreement
authorizes the fund to pay DIDI, as an expense of the Institutional Money
Market Shares class of the Money Market Portfolio of Cash Account Trust, an
administrative service fee, payable monthly, at an annual rate of 0.15% of
average daily net assets of the Institutional Money Market Shares of the fund.
A portion of this administrative service fee (0.075% of the 0.15% fee) is paid
pursuant to a Rule 12b-1 Plan. Currently, the fee is limited to 0.02% but may
be increased to the full 0.15% level by the Board. Currently, one-half of the
0.02% administrative service fee rate that is being paid by the Institutional
Money Market Shares is paid pursuant to the Rule 12b-1 Plan. DIDI normally pays
firms a fee for administrative services, payable monthly, at a maximum annual
rate of up to 0.15% (currently, limited to 0.02%) of average daily net assets
of Institutional Money Market Shares held in accounts that they maintain and
service.
Premier Money Market Shares - Cash Account Trust and Investors Cash Trust. The
Distribution Agreement authorizes a fund to pay DIDI, as an expense of the
Premier Money Market Shares classes of the Money Market Portfolio, the
Government & Agency Securities Portfolio and the Tax-Exempt Portfolio of Cash
Account Trust and of the Treasury Portfolio of Investors Cash Trust, a
distribution services fee, payable monthly, at an annual rate of 0.25% of
average daily net assets of the Premier Money Market Shares of the applicable
fund. This fee is paid pursuant to a Rule 12b-1 Plan. DIDI normally pays firms
a fee for distribution services, payable monthly, at a maximum annual rate of
up to 0.25% of average daily net assets of Premier Money Market Shares held in
accounts that they maintain and service. The Services Agreement authorizes a
fund to pay DIDI, as an expense of the Premier Money Market Shares of the
aforementioned funds, an administrative service fee, payable monthly, at an
annual rate of 0.25% of average daily net
II-27
assets of the Premier Money Market Shares of the applicable fund. This
administrative service fee is not paid pursuant to a Rule 12b-1 Plan. DIDI
normally pays firms a fee for administrative services, payable monthly, at a
maximum annual rate of up to 0.25% of average daily net assets of Premier Money
Market Shares held in accounts that they maintain and service.
Davidson Cash Equivalent Shares - Cash Account Trust. The Distribution
Agreement authorizes a fund to pay DIDI, as an expense of the Davidson Cash
Equivalent Shares and the Davidson Cash Equivalent Plus Shares classes of the
Money Market Portfolio, the Government & Agency Securities Portfolio and the
Tax-Exempt Portfolio of Cash Account Trust, a distribution services fee,
payable monthly, at an annual rate of 0.30% in the case of the Davidson Cash
Equivalent Shares and 0.25% in the case of the Davidson Cash Equivalent Plus
Shares of average daily net assets of the applicable class of a fund. This fee
is paid pursuant to a Rule 12b-1 Plan. DIDI normally pays the sole
sub-distributor for the classes, D.A. Davidson & Co., a fee for distribution
services, payable monthly, at a maximum annual rate of up to 0.30% of average
daily net assets of those accounts in the Davidson Cash Equivalent Shares that
it maintains and services and 0.25% of average daily net assets in the case of
those accounts in the Davidson Cash Equivalent Plus Shares that it maintains
and services. The Services Agreement authorizes a fund to pay DIDI, as an
expense of the aforementioned classes, an administrative service fee, payable
monthly, at an annual rate of 0.25% in the case of the Davidson Cash Equivalent
Shares and 0.25% (currently limited to 0.20%) in the case of the Davidson Cash
Equivalent Plus Shares of average daily net assets of those shares of a fund.
This administrative service fee is not paid pursuant to a Rule 12b-1 Plan. DIDI
normally pays the sole sub-distributor a fee for administrative services,
payable monthly, at a maximum annual rate of up to 0.25% of average daily net
assets of those accounts in the Davidson Cash Equivalent Shares that it
maintains and services and 0.20% of average daily net assets in the case of
those accounts in the Davidson Cash Equivalent Plus Shares that it maintains
and services. The Davidson Cash Equivalent Plus Shares class is limited to the
Money Market Portfolio and the Government & Agency Securities Portfolio.
Capital Assets Funds - Cash Account Trust. The Distribution Agreement
authorizes a fund to pay DIDI, as an expense of the Capital Assets Funds Shares
and the Capital Assets Funds Preferred Shares classes of the Money Market
Portfolio, the Government & Agency Securities Portfolio and the Tax-Exempt
Portfolio of Cash Account Trust, a distribution services fee, payable monthly,
at an annual rate of 0.33% in the case of the Capital Assets Funds Shares and
0.20% in the case of the Capital Assets Funds Preferred Shares of average daily
net assets of the applicable class of a fund. This fee is paid pursuant to a
Rule 12b-1 Plan. DIDI normally pays the sole sub-distributor for the classes,
RIDGE Clearing and Outsourcing Services, Inc., a fee for distribution services,
payable monthly, at a maximum annual rate of up to 0.33% of average daily net
assets of those accounts in the Capital Assets Funds Shares that it maintains
and services and 0.20% of average daily net assets in the case of those
accounts in the Capital Assets Funds Preferred Shares that it maintains and
services. The Services Agreement authorizes a fund to pay DIDI, as an expense
of the aforementioned classes, an administrative service fee, payable monthly,
at an annual rate of 0.25% in the case of the Capital Assets Funds Shares and
0.10% in the case of the Capital Assets Funds Preferred Shares of average daily
net assets of the applicable class of a fund. This administrative service fee
is not paid pursuant to a Rule 12b-1 Plan. DIDI normally pays the sole
sub-distributor a fee for administrative services, payable monthly, at a
maximum annual rate of up to 0.25% of average daily net assets of those
accounts in the Capital Assets Funds Shares that it maintains and services and
0.10% of average daily net assets in the case of those accounts in the Capital
Assets Funds Preferred Shares that it maintains and services. The Capital
Assets Funds Preferred Shares class is limited to the Money Market Portfolio.
Managed Shares - Cash Account Trust. The Services Agreement currently
authorizes a fund to pay DIDI, as an expense of the Government Cash Managed
Shares class of the Government & Agency Securities Portfolio of Cash Account
Trust and the Tax-Exempt Cash Managed Shares class of the Tax-Exempt Portfolio
of Cash Account Trust, an administrative service fee, payable monthly, at an
annual rate of 0.15% of average daily net assets of the Managed Shares of a
fund. This fee is paid pursuant to a Rule 12b-1 Plan. The Rule 12b-1 Plan
authorizes the payment of up to 0.25% of average daily net assets of those
shares of a fund and, at the discretion of the Board, the administrative
service fee may be increased from the current level to a maximum of 0.25% of
average daily net assets. DIDI normally pays firms a fee for administrative
services, payable monthly, at a maximum annual rate of up to 0.15% of average
daily net assets of Managed Shares held in accounts that they maintain and
service.
Institutional Shares - Investors Cash Trust. The Services Agreement authorizes
the fund to pay DIDI, as an expense of the Institutional Shares class of the
Treasury Portfolio of Investors Cash Trust, an administrative service fee,
II-28
payable monthly, at an annual rate of 0.05% of average daily net assets of the
Institutional Shares of the fund, which may be increased to 0.10% in the
discretion of the Board. This fee is not paid pursuant to a Rule 12b-1 Plan.
DIDI normally pays firms a fee for administrative services, payable monthly, at
a maximum annual rate of up to 0.05% of average daily net assets of
Institutional Shares held in accounts that they maintain and service.
Tax-Free Investment Class - Cash Account Trust and Investment Class - Investors
Cash Trust. The Distribution Agreement authorizes a fund to pay DIDI, as an
expense of the Tax-Free Investment Class of the Tax-Exempt Portfolio of Cash
Account Trust and the Investment Class of the Treasury Portfolio of Investors
Cash Trust (collectively, Investment Class), a distribution services fee,
payable monthly, at an annual rate of 0.25% of average daily net assets of the
Investment Class shares of the applicable fund. This fee is paid pursuant to a
Rule 12b-1 Plan. DIDI normally pays firms a fee for distribution services,
payable monthly, at a maximum annual rate of up to 0.25% of average daily net
assets of shares of the Investment Class held in accounts that they maintain
and service. The Services Agreement authorizes a fund to pay DIDI, as an
expense of the Investment Class of the aforementioned funds, an administrative
service fee, payable monthly, at an annual rate of 0.07% of average daily net
assets of the Investment Class shares of the applicable fund. This
administrative service fee is not paid pursuant to Rule 12b-1 Plan. DIDI
normally pays firms a fee for administrative services, payable monthly, at a
maximum annual rate of up to 0.07% of average daily net assets of shares of the
Investment Class held in accounts that they maintain and service.
Cash Reserve Prime Shares - Cash Reserve Fund, Inc. The Distribution Agreement
authorizes the fund to pay DIDI, as an expense of the Cash Reserve Prime Shares
class of the Prime Series of Cash Reserve Fund Inc., a distribution services
fee, payable monthly, at an annual rate of 0.25% of average daily net assets of
the Cash Reserve Prime Shares of the fund. This fee is paid pursuant to a Rule
12b-1 Plan. DIDI normally pays firms a fee for distribution services, payable
monthly, at a maximum annual rate of up to 0.25% of average daily net assets of
shares of the Cash Reserve Prime Shares held in accounts that they maintain and
service. The Distribution Agreement also authorizes the fund to pay DIDI, as an
expense of the Cash Reserve Prime Shares, an administrative service fee,
payable monthly, at an annual rate of 0.07% of average daily net assets of the
Cash Reserve Prime Shares of the fund. This administrative service fee is not
paid pursuant to a Rule 12b-1 Plan. DIDI normally pays firms a fee for
administrative services, payable monthly, at a maximum annual rate of up to
0.07% of average daily net assets of shares of the Cash Reserve Prime Shares
held in accounts that they maintain and service.
Shareholder Services Plan for Cash Management Fund - Institutional and Cash
Reserves Fund - Institutional, each a series of DWS Institutional Funds, and NY
Tax Free Money Fund Investment Class and Tax-Free Money Fund Investment Premier
Shares, each a series and class of DWS Advisor Funds. Each fund has adopted for
the classes specified (Class) a shareholder service plan (Plan). Under the
Plan, which is not a Rule 12b-1 Plan, a fund may pay financial services firms a
service fee at an annual rate of up to 0.25 of 1% of the average daily net
assets of shares of the Class held in accounts that the firm maintains and
services. The service fee is accrued daily as an expense of the Class. A fund
together with DIDI may enter into agreements with firms pursuant to which the
firms provide personal service and/or maintenance of shareholder accounts
including, but not limited to, establishing and maintaining shareholder
accounts and records, distributing monthly statements, processing purchase and
redemption transactions, automatic investment in fund shares of client account
cash balances, answering routine client inquiries regarding a fund, assistance
to clients in changing dividend options, account designations and addresses,
aggregating trades of all the firm's clients, providing account information to
clients in client sensitive formats and such other services as a fund may
reasonably request. Service fees are not payable for advertising, promotion or
other distribution services.
The Plan continues in effect from year to year so long as its continuance is
approved at least annually by the vote of a majority of (a) the Board, and (b)
the Board Members who are not "interested persons" of a fund and who have no
direct or indirect financial interest in the operation of the Plan, or any
related agreements. The Plan may be terminated with respect to the Class at any
time by vote of the Board, including a vote by the Board Members who are not
"interested persons" of a fund and who have no direct or indirect financial
interest in the operation of the Plan, or any related agreements. The Plan may
not be amended to increase materially the amount of service fees provided for
in the Plan unless the amendment is approved in the manner provided for annual
continuance of the Plan discussed above. If the Plan is terminated or not
renewed, a fund will not be obligated to make any payments of service fees that
accrued after the termination date.
II-29
III. DWS VARIABLE SERIES I AND DWS VARIABLE SERIES II
RULE 12B-1 PLAN. Each fund of DWS Variable Series I and DWS Variable Series II
that has authorized the issuance of Class B shares has adopted a distribution
plan under Rule 12b-1 (Plan) that provides for fees payable as an expense of
the Class B shares. Under the Plan, a fund may make quarterly payments as
reimbursement to DIDI for distribution and shareholder servicing related
expenses incurred or paid by the Distributor or a participating insurance
company. No such payment shall be made with respect to any quarterly period in
excess of an amount determined for such period at the annual rate of 0.25% of
the average daily net assets of Class B shares during that quarterly period.
The fee is payable by a fund, on behalf of Class B shares, of up to 0.25% of
the average daily net assets attributable to Class B shares of the fund.
Because 12b-1 fees are paid out of fund assets on an ongoing basis, they will,
over time, increase the cost of investment and may cost more than other types
of sales charges. The Plan and any Rule 12b-1 related agreement that is entered
into by a fund or the Distributor in connection with the Plan will continue in
effect for a period of more than one year only so long as continuance is
specifically approved at least annually by a vote of a majority of the Board,
and of a majority of the Board Members who are not interested persons (as
defined in the 1940 Act) of a fund, cast in person at a meeting called for the
purpose of voting on the Plan, or the Rule 12b-1 related agreement, as
applicable. In addition, the Plan and any Rule 12b-1 related agreement may be
terminated as to Class B shares of a fund at any time, without penalty, by vote
of a majority of the outstanding Class B shares of that fund or by vote of a
majority of the Board Members who are not interested persons of a fund and who
have no direct or indirect financial interest in the operation of the Plan or
any Rule 12b-1 related agreement. The Plan provides that it may not be amended
to increase materially the amount that may be spent for distribution of Class B
shares of a fund without the approval of Class B shareholders of that fund.
IV. DWS INVESTMENTS VIT FUNDS
RULE 12B-1 PLAN. DWS Equity 500 Index VIP and DWS Small Cap Index VIP of DWS
Investments VIT Funds have each adopted a distribution plan under Rule 12b-1
(Plan) that provides for fees payable as an expense of the Class B shares and,
in the case of the DWS Equity 500 Index VIP, the Class B-2 shares. Under the
Plan, a fund may make payments to DIDI for remittance directly or indirectly to
a participating dealer, shareholder service agent, life insurance company or
other applicable party a fee in an amount not to exceed the annual rate of
0.25% of the average daily net assets of the Class B shares or Class B-2
shares, as applicable, under a participation agreement, service agreement,
sub-distribution agreement or other similar agreement which provides for Class
B shares or Class B-2 shares. DIDI is authorized pursuant to the Plan to pay
for anything reasonably designed to enhance sales or retention of shareholders
and for the provision of services to shareholders of the Class B shares or
Class B-2 shares. Because 12b-1 fees are paid out of fund assets on an ongoing
basis, they will, over time, increase the cost of investment in Class B or
Class B-2 shares, and may cost more than other types of sales charges. The Plan
and any Rule 12b-1 related agreement that is entered into by a fund or the
Distributor in connection with the Plan will continue in effect for a period of
more than one year only so long as continuance is specifically approved at
least annually by a vote of a majority of the Board, and of a majority of the
Board Members who are not interested persons (as defined in the 1940 Act) of a
fund, cast in person at a meeting called for the purpose of voting on the Plan,
or the Rule 12b-1 related agreement, as applicable. In addition, the Plan and
any Rule 12b-1 related agreement may be terminated as to Class B shares or
Class B-2 shares of a fund at any time, without penalty, by vote of a majority
of the outstanding Class B shares or Class B-2 shares, as applicable, of that
fund or by vote of a majority of the Board Members who are not interested
persons of a fund and who have no direct or indirect financial interest in the
operation of the Plan or any Rule 12b-1 related agreement. The Plan provides
that it may not be amended to increase materially the amount that may be spent
for distribution of Class B shares or Class B-2 shares of a fund without the
approval of the shareholders of such class.
INVESTMENTS
GENERAL INVESTMENT PRACTICES AND TECHNIQUES
PART II - APPENDIX II-G includes a description of the investment practices and
techniques which a fund may employ in pursuing its investment objective, as
well as the associated risks. Descriptions in this SAI of a particular
investment practice or technique in which a fund may engage are meant to
describe the spectrum of investments that the Advisor (and/or sub-advisor or
sub-subadvisor, if applicable) in its discretion might, but is not required to,
use in managing a fund. The Advisor (and/or sub-advisor or sub-subadvisor, if
applicable) may in its discretion at any time employ such practice, technique
or instrument for one or more funds but not for all funds advised by it.
Furthermore, it is possible that certain types of financial instruments or
investment
II-30
techniques described herein may not be available, permissible, economically
feasible or effective for their intended purposes in all markets. Certain
practices, techniques or instruments may not be principal activities of the
fund, but, to the extent employed, could from time to time have a material
impact on a fund's performance.
IT IS POSSIBLE THAT CERTAIN INVESTMENT PRACTICES AND TECHNIQUES MAY NOT BE
PERMISSIBLE FOR A FUND BASED ON ITS INVESTMENT RESTRICTIONS, AS DESCRIBED
HEREIN, AND IN A FUND'S PROSPECTUS.
PORTFOLIO TRANSACTIONS
The Advisor is generally responsible for placing orders for the purchase and
sale of portfolio securities, including the allocation of brokerage. With
respect to those funds for which a sub-investment advisor manages a fund's
investments, references in this section to the "Advisor" should be read to mean
the Subadvisor, except as noted below.
The policy of the Advisor in placing orders for the purchase and sale of
securities for a fund is to seek best execution, taking into account such
factors, among others, as price; commission (where applicable); the
broker-dealer's ability to ensure that securities will be delivered on
settlement date; the willingness of the broker-dealer to commit its capital and
purchase a thinly traded security for its own inventory; whether the
broker-dealer specializes in block orders or large program trades; the
broker-dealer's knowledge of the market and the security; the broker-dealer's
ability to maintain confidentiality; the broker-dealer's ability to provide
access to new issues; the broker-dealer's ability to provide support when
placing a difficult trade; the financial condition of the broker-dealer; and
whether the broker-dealer has the infrastructure and operational capabilities
to execute and settle the trade. The Advisor seeks to evaluate the overall
reasonableness of brokerage commissions with commissions charged on comparable
transactions and compares the brokerage commissions (if any) paid by the funds
to reported commissions paid by others. The Advisor routinely reviews
commission rates, execution and settlement services performed and makes
internal and external comparisons.
Commission rates on transactions in equity securities on US securities
exchanges are subject to negotiation. Commission rates on transactions in
equity securities on foreign securities exchanges are generally fixed.
Purchases and sales of fixed-income securities and certain over-the-counter
securities are effected on a net basis, without the payment of brokerage
commissions. Transactions in fixed income and certain over-the-counter
securities are generally placed by the Advisor with the principal market makers
for these securities unless the Advisor reasonably believes more favorable
results are available elsewhere. Transactions with dealers serving as market
makers reflect the spread between the bid and asked prices. Purchases of
underwritten issues will include an underwriting fee paid to the underwriter.
Money market instruments are normally purchased in principal transactions
directly from the issuer or from an underwriter or market maker.
It is likely that the broker-dealers selected based on the considerations
described in this section will include firms that also sell shares of the funds
to their customers. However, the Advisor does not consider sales of shares of
the funds as a factor in the selection of broker-dealers to execute portfolio
transactions for the funds and, accordingly, has implemented policies and
procedures reasonably designed to prevent its traders from considering sales of
shares of the funds as a factor in the selection of broker-dealers to execute
portfolio transactions for the funds.
The Advisor is permitted by Section 28(e) of the Securities Exchange Act of
1934, as amended (1934 Act), when placing portfolio transactions for a fund, to
cause a fund to pay brokerage commissions in excess of that which another
broker-dealer might charge for executing the same transaction in order to
obtain research and brokerage services if the Advisor determines that such
commissions are reasonable in relation to the overall services provided. The
Advisor may from time to time, in reliance on Section 28(e) of the 1934 Act,
execute portfolio transactions with broker-dealers that provide research and
brokerage services to the Advisor. Consistent with the Advisor's policy
regarding best execution, where more than one broker is believed to be capable
of providing best execution for a particular trade, the Advisor may take into
consideration the receipt of research and brokerage services in selecting the
broker-dealer to execute the trade. Although certain research and brokerage
services from broker-dealers may be useful to a fund and to the Advisor, it is
the opinion of the Advisor that such information only supplements its own
research effort since the information must still be analyzed, weighed and
reviewed by the Advisor's staff. To the extent that research and brokerage
services of value are received by the Advisor, the Advisor may avoid expenses
that it might otherwise incur. Research and brokerage services received from a
broker-dealer may be useful to the Advisor and its affiliates in providing
investment management services to all or some of its clients, which includes a
II-31
fund. Services received from broker-dealers that executed securities
transactions for a fund will not necessarily be used by the Advisor
specifically to service that fund.
Research and brokerage services provided by broker-dealers may include, but are
not limited to, information on the economy, industries, groups of securities,
individual companies, statistical information, accounting and tax law
interpretations, political developments, legal developments affecting portfolio
securities, technical market action, pricing and appraisal services, credit
analysis, risk measurement analysis, performance analysis and measurement and
analysis of corporate responsibility issues. Research and brokerage services
are typically received in the form of written or electronic reports, access to
specialized financial publications, telephone contacts and personal meetings
with security analysts, but may also be provided in the form of access to
various computer software and meetings arranged with corporate and industry
representatives.
The Advisor may also select broker-dealers and obtain from them research and
brokerage services that are used in connection with executing trades provided
that such services are consistent with interpretations under Section 28(e) of
the 1934 Act. Typically, these services take the form of computer software
and/or electronic communication services used by the Advisor to facilitate
trading activity with those broker-dealers.
Research and brokerage services may include products obtained from third
parties if the Advisor determines that such product or service constitutes
brokerage and research as defined in Section 28(e) and interpretations
thereunder. Provided a Subadvisor is acting in accordance with any instructions
and directions of the Advisor or the Board, the Subadvisor is authorized to pay
to a broker or dealer who provides third party brokerage and research services
a commission for executing a portfolio transaction for a fund in excess of what
another broker or dealer may charge, if the Subadvisor determines in good faith
that such commission was reasonable in relation to the value of the third party
brokerage and research services provided by such broker or dealer.
The Advisor may use brokerage commissions to obtain certain brokerage products
or services that have a mixed use (i.e., it also serves a function that does
not relate to the investment decision-making process). In those circumstances,
the Advisor will make a good faith judgment to evaluate the various benefits
and uses to which it intends to put the mixed use product or service and will
pay for that portion of the mixed use product or service that it reasonably
believes does not constitute research and brokerage services with its own
resources.
The Advisor will monitor regulatory developments and market practice in the use
of client commissions to obtain research and brokerage services and may adjust
its portfolio transactions policies in response thereto.
Investment decisions for a fund and for other investment accounts managed by
the Advisor are made independently of each other in light of differing
conditions. However, the same investment decision may be made for two or more
of such accounts. In such cases, simultaneous transactions are inevitable. To
the extent permitted by law, the Advisor may aggregate the securities to be
sold or purchased for a fund with those to be sold or purchased for other
accounts in executing transactions. Purchases or sales are then averaged as to
price and commission and allocated as to amount in a manner deemed equitable to
each account. While in some cases this practice could have a detrimental effect
on the price paid or received by, or on the size of the position obtained or
disposed of for, a fund, in other cases it is believed that the ability to
engage in volume transactions will be beneficial to a fund.
The Advisor and its affiliates and each fund's management team manage other
mutual funds and separate accounts, some of which use short sales of securities
as a part of its investment strategy. The simultaneous management of long and
short portfolios creates potential conflicts of interest including the risk
that short sale activity could adversely affect the market value of the long
positions (and vice versa), the risk arising from sequential orders in long and
short positions, and the risks associated with receiving opposing orders at the
same time. The Advisor has adopted procedures that it believes are reasonably
designed to mitigate these potential conflicts of interest. Incorporated in the
procedures are specific guidelines developed to ensure fair and equitable
treatment for all clients. The Advisor and the investment team have established
monitoring procedures and a protocol for supervisory reviews, as well as
compliance oversight to ensure that potential conflicts of interest relating to
this type of activity are properly addressed.
Deutsche Bank AG or one of its affiliates (or in the case of a Subadvisor, the
Subadvisor or one of its affiliates) may act as a broker for the funds and
receive brokerage commissions or other transaction-related compensation from
the funds in the purchase and sale of securities, options or futures contracts
when, in the judgment of
II-32
the Advisor, and in accordance with procedures approved by the Board, the
affiliated broker will be able to obtain a price and execution at least as
favorable as those obtained from other qualified brokers and if, in the
transaction, the affiliated broker charges the funds a rate consistent with
that charged to comparable unaffiliated customers in similar transactions.
PORTFOLIO TURNOVER. Portfolio turnover rate is defined by the SEC as the ratio
of the lesser of sales or purchases to the monthly average value of such
securities owned during the year, excluding all securities whose remaining
maturities at the time of acquisition were one year or less.
Higher levels of activity by a fund result in higher transaction costs and may
also result in taxes on realized capital gains to be borne by a fund's
shareholders. Purchases and sales are made whenever necessary, in the Advisor's
discretion, to meet a fund's objective.
PORTFOLIO HOLDINGS INFORMATION
In addition to the public disclosure of fund portfolio holdings through
required Securities and Exchange Commission (SEC) quarterly filings, each fund
may make its portfolio holdings information publicly available on the DWS
funds' Web site as described in a fund's prospectus. Each fund does not
disseminate non-public information about portfolio holdings except in
accordance with policies and procedures adopted by a fund.
Each fund's procedures permit non-public portfolio holdings information to be
shared with Deutsche Asset Management and its affiliates (DeAM), subadvisors,
if any, custodians, independent registered public accounting firms, attorneys,
officers and trustees/directors and each of their respective affiliates and
advisers who require access to this information to fulfill their duties to the
fund and are subject to the duties of confidentiality, including the duty not
to trade on non-public information, imposed by law or contract, or by a fund's
procedures. This non-public information may also be disclosed, subject to the
requirements described below, to certain third parties, such as securities
lending agents, financial printers, proxy voting firms, mutual fund analysts
and rating and tracking agencies, or to shareholders in connection with in-kind
redemptions (Authorized Third Parties).
Prior to any disclosure of a fund's non-public portfolio holdings information
to Authorized Third Parties, a person authorized by the Board must make a good
faith determination in light of the facts then known that a fund has a
legitimate business purpose for providing the information, that the disclosure
is in the best interest of a fund, and that the recipient assents or otherwise
has a duty to keep the information confidential and to not trade based on the
information received while the information remains non-public. No compensation
is received by a fund or DeAM for disclosing non-public holdings information.
Periodic reports regarding these procedures will be provided to the Board.
Portfolio holdings information distributed by the trading desks of DeAM or a
subadvisor for the purpose of facilitating efficient trading of such securities
and receipt of relevant research is not subject to the foregoing requirements.
Non-public portfolio holding information does not include portfolio
characteristics (other than holdings or subsets of holdings) about a fund and
information derived therefrom, including, but not limited to, how the fund's
investments are divided among various sectors, industries, countries, value and
growth stocks, bonds, small, mid and large cap stocks, currencies and cash,
types of bonds, bond maturities, duration, bond coupons and bond credit quality
ratings, alpha, beta, tracking error, default rate, portfolio turnover, and
risk and style characteristics so long as the identity of the fund's holdings
could not be derived from such information.
Registered investment companies that are subadvised by DeAM may be subject to
different portfolio holdings disclosure policies, and neither DeAM nor the
Board exercise control over such policies. In addition, separate account
clients of DeAM have access to their portfolio holdings and are not subject to
a fund's portfolio holdings disclosure policy. The portfolio holdings of some
of the funds subadvised by DeAM and some of the separate accounts managed by
DeAM may substantially overlap with the portfolio holdings of a fund.
DeAM also manages certain unregistered commingled trusts and creates model
portfolios, the portfolio holdings of which may substantially overlap with the
portfolio holdings of a fund. To the extent that investors in these commingled
trusts or recipients of model portfolio holdings information may receive
portfolio holdings information of their trust or of a model portfolio on a
different basis from that on which fund portfolio holdings information is made
public, DeAM has implemented procedures reasonably designed to encourage such
investors and recipients to keep such information confidential, and to prevent
those investors from trading on the basis of non-public holdings information.
II-33
There is no assurance that a fund's policies and procedures with respect to the
disclosure of portfolio holdings information will protect the fund from the
potential misuse of portfolio holdings information by those in possession of
that information.
NET ASSET VALUE
APPLICABLE TO FUNDS OTHER THAN MONEY MARKET FUNDS. The net asset value per
share of a fund is normally computed as of the close of regular trading on the
New York Stock Exchange (Exchange) on each day the Exchange is open for trading
(Value Time). The Exchange is scheduled to be closed on the following holidays:
New Year's Day (except 2011), Dr. Martin Luther King, Jr. Day, Presidents' Day,
Good Friday, Memorial Day, Independence Day, Labor Day, Thanksgiving and
Christmas, and on the preceding Friday or subsequent Monday when one of these
holidays falls on a Saturday or Sunday, respectively. Net asset value per share
is determined separately for each class of shares by dividing the value of the
total assets of the fund attributable to the shares of that class, less all
liabilities attributable to that class, by the total number of shares of that
class outstanding. The per share net asset value may be lower for certain
classes of the fund because of higher expenses borne by these classes.
An equity security is valued at its most recent sale price on the security's
primary exchange or over-the-counter (OTC) market as of the Value Time. Lacking
any sales, the security is valued at the calculated mean between the most
recent bid quotation and the most recent asked quotation (Calculated Mean) on
such exchange or OTC market as of the Value Time. If it is not possible to
determine the Calculated Mean, the security is valued at the most recent bid
quotation on such exchange or OTC market as of the Value Time. In the case of
certain foreign exchanges or OTC markets, the closing price reported by the
foreign exchange or OTC market (which may sometimes be referred to by the
exchange or one or more pricing agents as the "official close" or the "official
closing price" or other similar term) will be considered the most recent sale
price.
Debt securities are valued as follows. Money market instruments purchased with
an original or remaining maturity of 60 days or less, maturing at par, are
valued at amortized cost. Other money market instruments are valued based on
information obtained from an approved pricing agent or, if such information is
not readily available, by using matrix pricing techniques (formula driven
calculations based primarily on current market yields). Bank loans are valued
at prices supplied by an approved pricing agent (which are intended to reflect
the mean between the bid and asked prices), if available, and otherwise at the
mean of the most recent bid and asked quotations or evaluated prices, as
applicable, based on quotations or evaluated prices obtained from one or more
broker-dealers. Privately placed debt securities, other than Rule 144A debt
securities, initially are valued at cost and thereafter based on all relevant
factors, including type of security, size of holding and restrictions on
disposition. Municipal debt securities are valued at prices supplied by an
approved pricing agent (which are intended to reflect the mean between the bid
and asked prices), if available, and otherwise at the mean of the most recent
bid and asked quotations or evaluated prices obtained from a broker-dealer.
Other debt securities are valued at prices supplied by an approved pricing
agent, if available, and otherwise at the most recent bid quotation or
evaluated price, as applicable, obtained from one or more broker-dealers. If it
is not possible to value a particular debt security pursuant to the above
methods, the security is valued on the basis of factors including (but not
limited to) maturity, coupon, creditworthiness, currency denomination, and the
movement of the market in which the security is normally traded.
An exchange-traded option contract on securities, currencies and other
financial instruments is valued at its most recent sale price on the relevant
exchange. Lacking any sales, the option contract is valued at the Calculated
Mean. If it is not possible to determine the Calculated Mean, the option
contract is valued at the most recent bid quotation in the case of a purchased
option contract or the most recent asked quotation in the case of a written
option contract, in each case as of the Value Time. An option contract on
securities, currencies and other financial instruments traded in the OTC market
is valued as of the Value Time at the evaluated price provided by the
broker-dealer with which it was traded. Futures contracts (and options thereon)
are valued at the most recent settlement price, if available, on the exchange
on which they are traded most extensively. With the exception of stock index
futures contracts which trade on the Chicago Mercantile Exchange, closing
settlement times are prior to the close of trading on the Exchange. For stock
index futures contracts which trade on the Chicago Mercantile Exchange, closing
settlement prices are normally available at approximately 4:20 pm Eastern time.
If no settlement price is available, the last traded price on such exchange
will be used.
II-34
If market quotations for a fund asset are not readily available or if the
Advisor believes that the value of a fund asset as determined in accordance
with Board-approved procedures is unreliable, the value of the fund asset is
taken to be an amount which, in the opinion of a fund's Pricing Committee (or,
in some cases, the Board's Valuation Committee), represents fair market value.
The value of other holdings is determined in a manner which is intended to
fairly reflect the fair market value of the asset on the valuation date, based
on valuation procedures adopted by the Board and overseen primarily by a fund's
Pricing Committee.
The following paragraph applies to: DWS Life Compass Retirement Fund, DWS Life
Compass 2015 Fund, DWS Life Compass 2020 Fund, DWS Life Compass 2030 Fund, DWS
Life Compass 2040 Fund, DWS Alternative Asset Allocation Plus Fund, DWS Select
Alternative Asset Allocation Fund and DWS Alternative Asset Allocation Plus
VIP. The net asset value of each Underlying DWS Fund is determined based upon
the nature of the securities as set forth in the prospectus and statement of
additional information of such Underlying DWS Fund. Shares of each Underlying
DWS Fund in which the fund may invest are valued at the net asset value per
share of each Underlying DWS Fund as of the close of regular trading on the
Exchange on each day the Exchange is open for trading. The net asset value per
share of the Underlying DWS Funds will be calculated and reported to the fund
by each Underlying DWS Fund's accounting agent.
The following additional paragraphs apply to: DWS Equity 500 Index Fund and DWS
S&P 500 Index Fund (feeder funds). Each feeder fund pursues its investment
objective by investing substantially all of its assets in a master portfolio -
the DWS Equity 500 Index Portfolio (Portfolio), which has the same investment
objective and is subject to the same investment risks as the feeder fund.
Net asset value per share of a feeder fund is determined as of the Value Time
separately for each class of shares by dividing the value of the total assets
of the feeder fund (i.e., the value of the feeder fund's investment in the
Portfolio and any other assets) attributable to the shares of that class, less
all liabilities attributable to that class, by the total number of shares of
that class outstanding.
As of the Value Time, the Portfolio determines its net value (i.e., the value
of the Portfolio's portfolio instruments and any other assets less all
liabilities) using the valuation procedures for securities and other assets
described above.
Each investor in the Portfolio, including a feeder fund, may add to or reduce
its investment in the Portfolio on each day that net asset value of the feeder
fund and the Portfolio are computed as described above. At the close of a Value
Time, the value of each investor's beneficial interest in the Portfolio will be
determined by multiplying the net value of the Portfolio, determined as
provided above, by the percentage, effective for that day, which represents
that investor's share of the aggregate beneficial interests in the Portfolio.
Any additions or withdrawals, which are to be effected as of the Value Time on
that day, will then be effected. The percentage of the aggregate beneficial
interests in the Portfolio held by each investor in the Portfolio, including a
feeder fund, will then be recomputed as the percentage equal to the fraction
(i) the numerator of which is the value of the investor's investment in the
Portfolio as of the Value Time on such day plus or minus, as the case may be,
the amount of net additions to or withdrawals from such investor's investment
in the Portfolio effected as of the Value Time on such day, and (ii) the
denominator of which is the aggregate net value of the Portfolio, determined as
provided above, as of the Value Time on such day plus or minus, as the case may
be, the amount of net additions to or withdrawals from the aggregate
investments in the Portfolio by all investors, including the feeder fund, in
the Portfolio. The percentage so determined for a feeder fund will then be
applied to determine the value of the feeder fund's interest in the Portfolio
as of the Value Time on the following day that net asset value is determined.
Applicable to money market funds other than DWS Money Market Series, Cash
Management Fund-Institutional, Cash Reserves Fund-Institutional and Prime
Series. The net asset value (NAV) per share of a fund is calculated on each day
(Valuation Day) on which the fund is open for business as of the time described
in the fund's prospectus. A fund is open for business each day the New York
Stock Exchange (Exchange) is open for trading, and the fund may, but is not
required to, accept certain types of purchase and redemption orders (not
including exchanges) on days that the Exchange is not open or beyond an early
Exchange closing time, as described in the fund's prospectus. The Exchange is
scheduled to be closed on the following holidays: New Year's Day, Dr. Martin
Luther King, Jr. Day, Presidents' Day, Good Friday, Memorial Day, Independence
Day, Labor Day, Thanksgiving and Christmas, and on the preceding Friday or
subsequent Monday when one of these holidays falls on a Saturday or Sunday,
respectively. Net asset value per share is determined separately for each class
of shares by dividing the value of the total assets of the fund attributable to
the shares of that class, less all liabilities attributable to that
II-35
class, by the total number of shares of that class outstanding. Although there
is no guarantee, a fund's NAV per share will normally be $1.00.
A fund values its portfolio instruments at amortized cost, which does not take
into account unrealized capital gains or losses. This involves initially
valuing an instrument at its cost and thereafter assuming a constant
amortization to maturity of any discount or premium, regardless of the impact
of fluctuating interest rates on the market value of the instrument. While this
method provides certainty in valuation, it may result in periods during which
value, as determined by amortized cost, is higher or lower than the price the
fund would receive if it sold the instrument.
The Board has established procedures reasonably designed to stabilize a fund's
NAV per share at $1.00. Under the procedures, the Advisor will monitor and
notify the Board of circumstances where a fund's NAV per share calculated by
using market valuations may deviate from the $1.00 per share calculated using
amortized cost. If there were any deviation that the Board believed would
result in a material dilution or unfair result for investors or existing
shareholders, the Board would promptly consider what action, if any, should be
initiated. Such actions could include selling assets prior to maturity to
realize capital gains or losses; shortening the average maturity of a fund's
portfolio; adjusting the level of dividends; redeeming shares in kind; or
valuing assets based on market valuations. For example, if a fund's net asset
value per share (computed using market values) declined, or was expected to
decline, below $1.00 (computed using amortized cost), the fund might
temporarily reduce or suspend dividend payments in an effort to maintain the
net asset value at $1.00 per share. As a result of such reduction or suspension
of dividends or other action by the Board, an investor would receive less
income during a given period than if such a reduction or suspension had not
taken place. Such action could result in investors receiving no dividend for
the period during which they hold their shares and receiving, upon redemption,
a price per share lower than that which they paid. On the other hand, if a
fund's net asset value per share (computed using market values) were to
increase, or were anticipated to increase above $1.00 (computed using amortized
cost), a fund might supplement dividends in an effort to maintain the net asset
value at $1.00 per share.
Market valuations are obtained by using actual quotations provided by market
makers, estimates of market value, or values obtained from yield data relating
to classes of money market instruments published by reputable sources at the
mean between the bid and asked prices for the instruments. In accordance with
procedures approved by the Board, in the event market quotations are not
readily available for certain portfolio assets the fair value of such portfolio
assets will be determined in good faith by a fund's Pricing Committee (or, in
some cases, the Board's Valuation Committee) based upon input from the Advisor
or other third parties.
Applicable to the following money market funds (each, a fund): DWS Money Market
Series, Cash Management Fund-Institutional, Cash Reserves Fund-Institutional
and Prime Series. Each of these funds pursues its investment objective by
investing substantially all of its assets in a master portfolio - the Cash
Management Portfolio (Portfolio), which has the same investment objective and
is subject to the same investment risks as a fund. The net asset value (NAV)
per share of a fund is calculated on each day (Valuation Day) on which a fund
is open for business as of the time described in a fund's prospectus. The fund
is open for business each day the New York Stock Exchange (Exchange) is open
for trading, and the fund may, but is not required to, accept certain types of
purchase and redemption orders (not including exchanges) on days that the
Exchange is not open or beyond an early Exchange closing time, as described in
a fund's prospectus. The Exchange is scheduled to be closed on the following
holidays: New Year's Day, Dr. Martin Luther King, Jr. Day, Presidents' Day,
Good Friday, Memorial Day, Independence Day, Labor Day, Thanksgiving and
Christmas, and on the preceding Friday or subsequent Monday when one of these
holidays falls on a Saturday or Sunday, respectively. Net asset value per share
is determined separately for each class of shares by dividing the value of the
total assets of the fund (i.e., the value of a fund's investment in the
Portfolio and any other assets) attributable to the shares of that class, less
all liabilities attributable to that class, by the total number of shares of
that class outstanding. Although there is no guarantee, a fund's NAV per share
will normally be $1.00.
On each Valuation Day, the Portfolio determines its net value (i.e., the value
of the Portfolio's portfolio instruments and any other assets less all
liabilities). The Portfolio values its portfolio instruments at amortized cost,
which does not take into account unrealized capital gains or losses. This
involves initially valuing an instrument at its cost and thereafter assuming a
constant amortization to maturity of any discount or premium, regardless of the
impact of fluctuating interest rates on the market value of the instrument.
While this method provides certainty in valuation, it may result in periods
during which value,
II-36
as determined by amortized cost, is higher or lower than the price the
Portfolio would receive if it sold the instrument.
Each investor in the Portfolio, including a fund, may add to or reduce its
investment in the Portfolio on each Valuation Day. At the close of each such
Valuation Day, the value of each investor's beneficial interest in the
Portfolio will be determined by multiplying the net value of the Portfolio, as
determined by amortized cost, by the percentage, effective for that day, which
represents that investor's share of the aggregate beneficial interests in the
Portfolio. Any additions or withdrawals, which are to be effected as of the
close of business on that day, will then be effected. The percentage of the
aggregate beneficial interests in the Portfolio held by each investor in the
Portfolio, including a fund will then be recomputed as the percentage equal to
the fraction (i) the numerator of which is the value of the investor's
investment in the Portfolio as of the close of business on such day plus or
minus, as the case may be, the amount of net additions to or withdrawals from
such investor's investment in the Portfolio effected as of the close of
business on such day, and (ii) the denominator of which is the aggregate net
value of the Portfolio, as determined by amortized cost, as of the close of
business on such day plus or minus, as the case may be, the amount of net
additions to or withdrawals from the aggregate investments in the Portfolio by
all investors, including a fund, in the Portfolio. The percentage so determined
for a fund will then be applied to determine the value of a fund's interest in
the Portfolio as of the close of the following Valuation Day.
The Board has established procedures reasonably designed to stabilize a fund's
NAV per share at $1.00. Under the procedures, the Advisor will monitor and
notify the Board of circumstances where a fund's NAV per share calculated based
on valuing the fund's investment in the Portfolio and the fund's other assets
using market valuations may deviate from the $1.00 per share calculated based
on valuing a fund's investment in the Portfolio and a fund's other assets using
amortized cost. If there were any deviation that the Board believed would
result in a material dilution or unfair result for investors or existing
shareholders, the Board would promptly consider what action, if any, should be
initiated. Such actions could include selling assets prior to maturity to
realize capital gains or losses; shortening average maturity of the investment
portfolio; adjusting the level of dividends; redeeming shares in kind; or
valuing assets based on market valuations. For example, if a fund's net asset
value per share (computed using market values) declined, or was expected to
decline, below $1.00 (computed using amortized cost), the fund might
temporarily reduce or suspend dividend payments in an effort to maintain the
net asset value at $1.00 per share. As a result of such reduction or suspension
of dividends or other action by the Board, an investor would receive less
income during a given period than if such a reduction or suspension had not
taken place. Such action could result in investors receiving no dividend for
the period during which they hold their shares and receiving, upon redemption,
a price per share lower than that which they paid. On the other hand, if a
fund's net asset value per share (computed using market values) were to
increase, or were anticipated to increase above $1.00 (computed using amortized
cost), a fund might supplement dividends in an effort to maintain the net asset
value at $1.00 per share. Because a fund invests substantially all of its
assets in the Portfolio, certain of these actions could be implemented at the
Portfolio level at the discretion of its Board.
Market valuations are obtained by using actual quotations provided by market
makers, estimates of market value, or values obtained from yield data relating
to classes of money market instruments published by reputable sources at the
mean between the bid and asked prices for the instruments. In accordance with
procedures approved by the Board, in the event market quotations are not
readily available for certain portfolio assets the fair value of such portfolio
assets will be determined in good faith by the Portfolio's Pricing Committee
(or, in some cases, the Board's Valuation Committee) based upon input from the
Advisor or other third parties.
PROXY VOTING GUIDELINES
Each fund has delegated proxy voting responsibilities to the Advisor, subject
to the Board's general oversight. A fund has delegated proxy voting to the
Advisor with the direction that proxies should be voted consistent with the
fund's best economic interests. The Advisor has adopted its own Proxy Voting
Policies and Procedures (Policies), and Proxy Voting Guidelines (Guidelines)
for this purpose. The Policies address, among other things, conflicts of
interest that may arise between the interests of a fund, and the interests of
the Advisor and its affiliates, including a fund's principal underwriter. The
Policies are included in PART II - APPENDIX II-I.
You may obtain information about how a fund voted proxies related to its
portfolio securities during the 12-month period ended June 30 by visiting the
Securities and Exchange Commission's Web site at www.sec.gov or by visiting our
Web site at: www.dws-investments.com (click on "proxy voting" at the bottom of
the page).
II-37
MISCELLANEOUS
A fund's prospectuses and this SAI omit certain information contained in the
Registration Statement which a fund has filed with the SEC under the Securities
Act of 1933 and reference is hereby made to the Registration Statement for
further information with respect to a fund and the securities offered hereby.
This Registration Statement and its amendments are available for inspection by
the public at the SEC in Washington, D.C.
RATINGS OF INVESTMENTS
BONDS AND COMMERCIAL PAPER RATINGS
Set forth below are descriptions of ratings which represent opinions as to the
quality of the securities. It should be emphasized, however, that ratings are
relative and subjective and are not absolute standards of quality.
MOODY'S INVESTORS SERVICE, INC.'S LONG-TERM RATINGS
AAA: Bonds which are rated Aaa are judged to be of the best quality. They carry
the smallest degree of investment risk and are generally referred to as
"gilt-edged." Interest payments are protected by a large or by an exceptionally
stable margin and principal is secure. While the various protective elements
are likely to change, such changes as can be visualized are most unlikely to
impair the fundamentally strong position of such issues.
AA: Bonds which are rated Aa are judged to be of high quality by all standards.
Together with the Aaa group they comprise what are generally known as high
grade bonds. They are rated lower than the best bonds because margins of
protection may not be as large as in Aaa securities or fluctuations of
protective elements may be of greater amplitude or there may be other elements
present which make the long-term risk appear somewhat larger than in Aaa
securities.
A: Bonds which are rated A possess many favorable investment attributes and are
to be considered as upper-medium-grade obligations. Factors giving security to
principal and interest are considered adequate, but elements may be present
which suggest a susceptibility to impairment sometime in the future.
BAA: Bonds which are rated Baa are considered as medium-grade obligations,
(i.e., they are neither highly protected nor poorly secured). Interest payments
and principal security appear adequate for the present, but certain protective
elements may be lacking or may be characteristically unreliable over any great
length of time. Such bonds lack outstanding investment characteristics and in
fact have speculative characteristics as well.
BA: Bonds which are rated Ba are judged to have speculative elements; their
future cannot be considered as well assured. Often the protection of interest
and principal payments may be very moderate and thereby not well safe-guarded
during both good and bad times over the future. Uncertainty of position
characterizes bonds in this class.
B: Bonds which are rated B generally lack characteristics of the desirable
investment. Assurance of interest and principal payments or of maintenance of
other terms of the contract over any long period of time may be small.
CAA: Bonds which are rated Caa are of poor standing. Such issues may be in
default or there may be present elements of danger with respect to principal or
interest.
CA: Bonds which are rated Ca represent obligations which are speculative in a
high degree. Such issues are often in default or have other marked
shortcomings.
C: Bonds which are rated C are the lowest rated class of bonds, and issues so
rated can be regarded as having extremely poor prospects of ever attaining any
real investment standing.
CON.: Bonds for which the security depends upon the completion of some act or
the fulfillment of some condition are rated conditionally.
NOTE: Moody's applies numerical modifiers 1, 2 and 3 to each generic rating
classification from Aa through Caa. The modifier 1 indicates that the
obligation ranks in the higher end of its generic rating category; the modifier
2 indicates a mid-range ranking; and the modifier 3 indicates a ranking in the
lower end of its generic rating category.
MOODY'S INVESTORS SERVICE, INC.'S PREFERRED STOCK RATINGS
Because of the fundamental differences between preferred stocks and bonds,
Moody's employs a variation of our familiar bond rating symbols in the quality
ranking of preferred stock.
These symbols, presented below, are designed to avoid comparison with bond
quality in absolute terms. It should always be borne in mind that preferred
stock occupies
II-38
a junior position to bonds within a particular capital structure and that these
securities are rated within the universe of preferred stocks.
AAA: An issue rated aaa is considered to be a top-quality preferred stock. This
rating indicates good asset protection and the least risk of dividend
impairment within the universe of preferred stocks.
AA: An issue rated aa is considered a high-grade preferred stock. This rating
indicates that there is a reasonable assurance the earnings and asset
protection will remain relatively well maintained in the foreseeable future.
A: An issue rated a is considered to be an upper-medium-grade preferred stock.
While risks are judged to be somewhat greater than in the aaa and aa
classifications, earnings and asset protection are, nevertheless, expected to
be maintained at adequate levels.
BAA: An issue rated baa is considered to be a medium-grade preferred stock,
neither highly protected nor poorly secured. Earnings and asset protection
appear adequate at present, but may be questionable over any great length of
time.
BA: An issue rated ba is considered to have speculative elements. Its future
cannot be considered well assured. Earnings and asset protection may be very
moderate and not well safeguarded during adverse periods. Uncertainty of
position characterizes preferred stocks in this class.
B: An issue rated b generally lacks the characteristics of a desirable
investment. Assurance of dividend payments and maintenance of other terms of
the issue over any long period of time may be small.
CAA: An issue rated caa is likely to be in arrears on dividend payments. This
rating designation does not purport to indicate the future status of payments.
CA: An issue rated ca is speculative in a high degree and is likely to be in
arrears on dividends with little likelihood of eventual payments.
C: This is the lowest-rated class of preferred or preference stock. Issues so
rated can thus be regarded as having extremely poor prospects of ever attaining
any real investment standing.
NOTE: As in the case of bond ratings, Moody's applies to preferred stock
ratings the numerical modifiers 1, 2, and 3 in rating classifications aa
through b. The modifier 1 indicates that the security ranks in the higher end
of its generic rating category; the modifier 2 indicates a mid-range ranking;
and the modifier 3 indicates that the issue ranks in the lower end of its
generic rating category.
MOODY'S INVESTORS SERVICE, INC.'S SHORT-TERM RATINGS
Moody's short-term debt ratings are opinions of the ability of issuers to repay
punctually senior debt obligations. These obligations have an original maturity
not exceeding one year, unless explicitly noted.
PRIME-1 OR P-1: (or supporting institutions) have a superior ability for
repayment of senior short-term debt obligations. Prime-1 or P-1 repayment
ability will often be evidenced by many of the following characteristics:
o Leading market positions in well established industries.
o High rates of return on funds employed.
o Conservative capitalization structure with moderate reliance on debt and
ample asset protection.
o Broad margins in earnings coverage of fixed financial charges and high
internal cash generation.
o Well established access to a range of financial markets and assured
sources of alternate liquidity.
PRIME-2 OR P-2: (or supporting institutions) have a strong ability for
repayment of short term debt obligations. This will normally be evidenced by
many of the characteristics cited above but to a lesser degree. Earnings trends
and coverage ratios, while sound, may be more subject to variation.
Capitalization characteristics, while still appropriate, may be more affected
by external conditions. Ample alternate liquidity is maintained.
PRIME-3 OR P-3: (or supporting institutions) have an acceptable ability for
repayment of senior short-term obligations. The effect of industry
characteristics and market compositions may be more pronounced. Variability in
earnings and profitability may result in changes in the level of debt
protection measurements and may require relatively high financial leverage.
Adequate alternate liquidity is maintained.
NOT PRIME: Do not fall within any of the Prime rating categories.
II-39
MOODY'S INVESTORS SERVICE, INC.'S MUNICIPAL SHORT-TERM RATINGS
There are four rating categories for state and municipal short-term obligations
that define an investment grade situation: MIG 1, MIG 2, MIG 3, and MIG 4 (or
VMIG 1, VMIG 2, VMIG 3, and VMIG 4 in the case of an issue having a variable
rate demand feature).
MIG 1 OR VMIG 1: Judged to be of the best quality.
MIG 2 OR VMIG 2: Judged to be of the high quality, with margins or protection
ample although not as large as in the preceding group.
MIG 3 OR VMIG 3: Judged to be of favorable quality, with all security elements
accounted for but lacking the strength of the preceding grades. Liquidity and
cash flow protection may be narrow and market access for refinancing is likely
to be less well established.
MIG4 OR VMIG 4: Judged to be of adequate quality.
SG: Denotes speculative quality.
STANDARD & POOR'S RATINGS SERVICES LONG-TERM RATINGS
INVESTMENT GRADE
AAA: Debt rated AAA has the highest rating assigned by S&P to a debt
obligation. Capacity to meet its financial commitment on the debt is extremely
strong.
AA: Debt rated AA has a very strong capacity to meet its financial commitment
and differs from the higher rated issues only in small degree.
A: Debt rated A has a strong capacity to meet its financial commitment,
although it is somewhat more susceptible to the adverse effects of changes in
circumstances and economic conditions than debt in higher-rated categories.
BBB: Debt rated BBB has an adequate capacity to meet its financial commitment.
Whereas it normally exhibits adequate protection parameters, adverse economic
conditions or changing circumstances are more likely to lead to a weakened
capacity to meet its financial commitment.
SPECULATIVE GRADE
Debt rated BB, B, CCC, CC, and C has significant speculative characteristics
with respect to meeting its financial commitment. BB indicates the least degree
of speculation and C the highest. While such debt will likely have some quality
and protective characteristics, these may be outweighed by large uncertainties
or major exposures to adverse conditions.
BB: Debt rated BB has less vulnerability to nonpayment than other speculative
issues. However, it faces major ongoing uncertainties or exposure to adverse
business, financial, or economic conditions which could lead to inadequate
capacity to meet its financial commitment.
B: Debt rated B has a greater vulnerability to default but currently has the
capacity to meet its financial commitment. Adverse business, financial, or
economic conditions will likely impair capacity or willingness to meet its
financial commitment.
CCC: Debt rated CCC is currently vulnerability to default, and is dependent
upon favorable business, financial, and economic conditions to meet its
financial commitment. In the event of adverse business, financial, or economic
conditions, it is not likely to have the capacity to meet its financial
commitment.
CC: Debt rated CC is currently high vulnerability to default.
C: Debt rated C is currently highly vulnerable to nonpayment, obligations that
have payment arrearages allowed by the terms of the documents, or obligations
of an issuer that is the subject of a bankruptcy petition or similar action
which have not experienced a payment default. Among others, the C rating may be
assigned to subordinated debt, preferred stock or other obligations on which
cash payments have been suspended in accordance with the instrument's terms.
D: Debt rated D is in payment default. The D rating category is used when
payments are not made on the date due even if the applicable grace period has
not expired, unless Standard & Poor's believes that such payments will be made
during such grace period. The D rating also will be used upon the filing of a
bankruptcy petition if debt service payments are jeopardized.
PLUS (+) OR MINUS (-): The ratings from AA to CCC may be modified by the
addition of a plus or minus sign to show relative standing within the major
rating categories.
R: Debt rated "R" is under regulatory supervision owing to its financial
condition. During the pendency of the regulatory supervision, the regulators
may have the power to favor one class of obligations over others or pay some
obligations and not others.
II-40
NR: Debt may lack a S&P rating because no rating has been requested, because
there is insufficient information on which to base a rating, or because S&P
does not rate a particular type of obligation as a matter of policy.
STANDARD & POOR'S RATINGS SERVICES SHORT-TERM RATINGS
A-1: This highest category indicates a strong capacity to meet its financial
commitment. Those obligors determined to possess extremely strong safety
characteristics are denoted with a plus (+) sign designation.
A-2: Capacity to meet its financial commitment is satisfactory. However, its
ability to meet its financial commitment is somewhat more susceptible to
adverse effects of changes in circumstances and economic conditions.
A-3: Issues carrying this designation have adequate protection parameters.
However, adverse economic conditions or changing circumstances are more likely
to lead to a weakened capacity to meet its financial commitment.
B: Obligations are regarded as having significant speculative characteristics.
Ratings of `B-1', `B-2' and `B-3' may be assigned to indicate finer
distinctions within the `B' category. The obligor currently has the capacity to
meet its financial commitment on the obligation; however, it faces major
ongoing uncertainties which could lead to the obligor's inadequate capacity to
meet its financial commitment on the obligation.
B-1: Obligations are regarded as having significant speculative
characteristics, but the obligor has a relatively stronger capacity to meet its
financial commitments over the short-term compared to other speculative-grade
obligors.
B-2: An obligation is regarded as having significant speculative
characteristics, and the obligor has an average speculative-grade capacity to
meet its financial commitments over the short-term compared to other
speculative-grade obligors.
B-3: An obligation is regarded as having significant speculative
characteristics, and the obligor has a relatively weaker capacity to meet its
financial commitments over the short-term compared to other speculative-grade
obligors.
C: An obligation is currently vulnerable to nonpayment and is dependent upon
favorable business, financial, and economic conditions for the obligor to meet
its financial commitment on the obligation.
D: An obligation rated `D' is in payment default. The `D' rating category is
used when payments on an obligation are not made on the date due even if the
applicable grace period has not expired, unless S&P believes that such payments
will be made during such grace period. The `D' rating also will be used upon
the filing of a bankruptcy petition or the taking of a similar action if
payments on an obligation are jeopardized.
STANDARD & POOR'S RATINGS SERVICES MUNICIPAL SHORT-TERM RATINGS
SP-1: Reflects a very strong or strong capacity to pay principal and interest.
Notes issued with "overwhelming safety characteristics" will be rated "SP-1+".
SP-2: Reflects a satisfactory capacity to pay principal and interest.
SP-3: Reflects a speculative capacity to pay principal and interest.
DUAL RATINGS
S&P assigns "dual" ratings to all debt issues that have a put option or demand
feature as part of their structure. The first rating addresses the likelihood
of repayment of principal and interest as due, and the second rating addresses
only the demand feature. The long-term rating symbols are used for bonds to
denote the long-term maturity and the short-term rating symbols for the put
option (for example, `AAA/A-1+'). With U.S. municipal short-term demand debt,
S&P note rating symbols are used with the short-term issue credit rating
symbols (for example, `SP-1+/A-1+').
FITCH INVESTORS SERVICE, INC. LONG-TERM RATINGS
INVESTMENT GRADE
AAA: Bonds considered to be investment grade and of the highest credit quality.
The obligor has an exceptionally strong ability to pay interest and repay
principal, which is unlikely to be affected by reasonably foreseeable events.
AA: Bonds considered to be investment grade and of very high credit quality.
The obligor's ability to pay interest and repay principal is very strong,
although not quite as
II-41
strong as bonds rated AAA. Bonds rated in the AAA and AA categories are not
significantly vulnerable to foreseeable events.
A: Bonds considered to be investment grade and of high credit quality. The
obligor's ability to pay interest and repay principal is considered to be
strong, but may be more vulnerable to adverse changes in economic conditions
and circumstances than bonds with higher ratings.
BBB: Bonds considered to be investment grade and of good credit quality. The
obligor's ability to pay interest and repay principal is considered to be
adequate. Adverse changes in economic conditions and circumstances, however,
are more likely to have adverse impact on these bonds, and therefore, impair
timely payment. The likelihood that the ratings of these bonds will fall below
investment grade is higher than for bonds with higher ratings.
SPECULATIVE
BB: Bonds are considered speculative. The obligor's ability to pay interest and
repay principal may be affected over time by adverse economic changes. However,
business or financial alternatives may be available which could assist the
obligor in satisfying its debt service requirements.
B: Bonds are considered highly speculative. While bonds in this class are
currently meeting debt service requirements, the probability of continued
timely payment of principal and interest reflects the obligor's limited margin
of safety and the need for reasonable business and economic activity throughout
the life of the issue.
CCC, CC, C: High default risk. Default is a real possibility. Capacity for
meeting financial commitments is solely reliant upon sustained, favorable
business or economic developments. A "CC" rating indicates that default of some
kind appears probable. "C" ratings signal imminent default.
DDD, DD, AND D: Bonds are in default of interest and/or principal payments.
Such bonds are extremely speculative and should be valued on the basis of their
ultimate recovery value in liquidation or reorganization of the obligor. DDD
represents the highest potential for recovery on these bonds, and D represents
the lowest potential for recovery.
PLUS (+) OR MINUS (-): The ratings from AA to CC may be appended by the
addition of a plus or minus sign to denote the relative status within the
rating category.
CONDITIONAL: A conditional rating is premised on the successful completion of a
project or the occurrence of a specific event.
NR: Indicates that Fitch Rating does not publicly rate the specific issue.
FITCH INVESTORS SERVICE, INC. SHORT-TERM RATINGS
F1: Highest credit quality. Indicates the Best capacity for timely payment of
financial commitments; may have an added "+" to denote any exceptionally strong
credit feature.
F2: Good Credit Quality. Issues assigned this rating have a satisfactory
capacity for timely payment, but the margin of safety is not as great as the
F-1+ and F-1 categories.
F3: Fair Credit Quality. Issues assigned this rating have characteristics
suggesting that the capacity for timely payment is adequate; however, near-term
adverse changes could cause these securities to be rated below investment
grade.
B: Speculative. Minimal capacity for timely payment of financial commitments,
plus vulnerability to near-term adverse changes in financial and economic
conditions.
C: High default risk. Default is a real possibility. Capacity for meeting
financial commitments is solely reliant upon a sustained, favorable business
and economic environment.
D: Default. Denotes actual or imminent payment default.
FITCH INVESTORS SERVICE, INC. MUNICIPAL SHORT-TERM RATINGS
The highest ratings for state and municipal short-term obligations are "F-1+,"
"F-1," and "F-2."
STANDARD & POOR'S DIVIDEND RANKINGS FOR COMMON STOCKS
The investment process involves assessment of various factors - such as product
and industry position, corporate resources and financial policy - with results
that make some common stocks more highly esteemed than others. In this
assessment, Standard & Poor believes that earnings and dividend performance is
the end result of the interplay of these factors and that, over the long run,
the record of this performance has a considerable bearing on relative quality.
The rankings, however, do not pretend to reflect all of the factors, tangible
or intangible, that bear on stock quality.
II-42
Relative quality of bonds or other debt, that is, degrees of protection for
principal and interest, called creditworthiness, cannot be applied to common
stocks, and therefore rankings are not to be confused with bond quality ratings
which are arrived at by a necessarily different approach.
Growth and stability of earnings and dividends are deemed key elements in
establishing Standard & Poor's earnings and dividend rankings for common
stocks, which are designed to capsulize the nature of this record in a single
symbol. It should be noted, however, that the process also takes into
consideration certain adjustments and modifications deemed desirable in
establishing such rankings.
The point of departure in arriving at these rankings is a computerized scoring
system based on per-share earnings and dividend records of the most recent ten
years - a period deemed long enough to measure significant time segments of
secular growth, to capture indications of basic change in trend as they
develop, and to encompass the full peak-to-peak range of the business cycle.
Basic scores are computed for earnings and dividends, then adjusted as
indicated by a set of predetermined modifiers for growth, stability within
long-term trend, and cyclicality. Adjusted scores for earnings and dividends
are then combined to yield a final score.
Further, the ranking system makes allowance for the fact that, in general,
corporate size imparts certain recognized advantages from an investment
standpoint. Conversely, minimum size limits (in terms of corporate sales
volume) are set for the various rankings, but the system provides for making
exceptions where the score reflects an outstanding earnings-dividend record.
The final score for each stock is measured against a scoring matrix determined
by analysis of the scores of a large and representative sample of stocks. The
range of scores in the array of this sample has been aligned with the following
ladder of rankings:
A+ Highest B+ Average C Lowest
A High B Below Average D In Reorganization
A- Above Average B- Lower
NR signifies no ranking because of insufficient data or because the stock is
not amenable to the ranking process.
The positions as determined above may be modified in some instances by special
considerations, such as natural disasters, massive strikes, and non-recurring
accounting adjustments. A ranking is not a forecast of future market price
performance, but is basically an appraisal of past performance of earnings and
dividends, and relative current standing. These rankings must not be used as
market recommendations; a high-score stock may at times be so overpriced as to
justify its sale, while a low-score stock may be attractively priced for
purchase. Rankings based upon earnings and dividend records are no substitute
for complete analysis. They cannot take into account potential effects of
management changes, internal company policies not yet fully reflected in the
earnings and dividend record, public relations standing, recent competitive
shifts, and a host of other factors that may be relevant to investment status
and decision.
II-43
PART II: APPENDIX II-A - BOARD MEMBERS AND OFFICERS
IDENTIFICATION AND BACKGROUND
The following table presents certain information regarding the Board Members of
the Trust/Corporation. Each Board Member's year of birth is set forth in
parentheses after his or her name. Unless otherwise noted, (i) each Board
Member has engaged in the principal occupation(s) noted in the table for at
least the most recent five years, although not necessarily in the same
capacity, and (ii) the address of each Board Member that is not an "interested
person" (as defined in the 1940 Act) of the Trust/Corporation or the Advisor
(each, an "Independent Board Member") is c/o Paul K. Freeman, Independent
Chairman, DWS Funds, PO Box 101833, Denver, CO 80250-1833. The term of office
for each Board Member is until the election and qualification of a successor,
or until such Board Member sooner dies, resigns, is removed or as otherwise
provided in the governing documents of the Trust/Corporation. Because the fund
does not hold an annual meeting of shareholders, each Board Member will hold
office for an indeterminate period.
INDEPENDENT BOARD MEMBERS
NUMBER OF
NAME, YEAR OF BIRTH, POSITION FUNDS IN DWS
WITH THE TRUST/CORPORATION BUSINESS EXPERIENCE AND FUND COMPLEX
AND LENGTH OF TIME SERVED/(1)/ DIRECTORSHIPS DURING THE PAST 5 YEARS OVERSEEN
Paul K. Freeman (1950) Consultant, World Bank/Inter-American Development Bank; Governing 126
Chairperson since 2009, and Council of the Independent Directors Council (governance, education
Board Member since 1993 committees); formerly: Project Leader, International Institute for Applied
Systems Analysis (1998-2001); Chief Executive Officer, The Eric Group,
Inc. (environmental insurance) (1986-1998)
John W. Ballantine (1946) Retired; formerly: Executive Vice President and Chief Risk Management 126
Board Member since 1999 Officer, First Chicago NBD Corporation/The First National Bank of
Chicago (1996-1998); Executive Vice President and Head of International
Banking (1995-1996); Directorships: Healthways Inc. (provider of
disease and care management services); Portland General Electric
(utility company); Stockwell Capital Investments PLC (private equity);
former Directorships: First Oak Brook Bancshares, Inc. and Oak Brook
Bank; Prisma Energy International
Henry P. Becton, Jr. (1943) Vice Chair and former President, WGBH Educational Foundation; 126
Board Member since 1990 Directorships: Association of Public Television Stations; Lead Director,
Becton Dickinson and Company/(2)/ (medical technology company); Lead
Director, Belo Corporation/(2)/ (media company); Public Radio
International; Public Radio Exchange (PRX); The PBS Foundation; former
Directorships: Boston Museum of Science; American Public Television;
Concord Academy; New England Aquarium; Mass. Corporation for
Educational Telecommunications; Committee for Economic
Development; Public Broadcasting Service
Dawn-Marie Driscoll (1946) President, Driscoll Associates (consulting firm); Executive Fellow, 126
Board Member since 1987 Center for Business Ethics, Bentley University; formerly: Partner,
Palmer & Dodge (1988-1990); Vice President of Corporate Affairs and
General Counsel, Filene's (1978-1988); Directorships: Trustee of 20
open-end mutual funds managed by Sun Capital Advisers, Inc. (since
2007); Director of ICI Mutual Insurance Company (since 2007); Advisory
Board, Center for Business Ethics, Bentley University; Trustee,
Southwest Florida Community Foundation (charitable organization);
former Directorships: Investment Company Institute (audit, executive,
nominating committees) and Independent Directors Council
(governance, executive committees)
Keith R. Fox (1954) Managing General Partner, Exeter Capital Partners (a series of private 126
Board Member since 1996 investment funds); Directorships: Progressive Holding Corporation
(kitchen goods importer and distributor); Box Top Media Inc.
(advertising); The Kennel Shop (retailer); former Chairman, National
Association of Small Business Investment Companies
II-44
NUMBER OF
NAME, YEAR OF BIRTH, POSITION FUNDS IN DWS
WITH THE TRUST/CORPORATION BUSINESS EXPERIENCE AND FUND COMPLEX
AND LENGTH OF TIME SERVED/(1)/ DIRECTORSHIPS DURING THE PAST 5 YEARS OVERSEEN
Kenneth C. Froewiss Adjunct Professor of Finance, NYU Stern School of Business 126
(1945) Board Member since (September 2009 - present; Clinical Professor from 1997-September
2001 2009); Member, Finance Committee, Association for Asian Studies
(2002-present); Director, Mitsui Sumitomo Insurance Group (US) (2004-
present); prior thereto, Managing Director, J.P. Morgan (investment
banking firm) (until 1996)
Richard J. Herring Jacob Safra Professor of International Banking and Professor, Finance 126
(1946) Board Member since Department, The Wharton School, University of Pennsylvania (since July
1990 1972); Co-Director, Wharton Financial Institutions Center (since July
2000); Director, Japan Equity Fund, Inc. (since September 2007), Thai
Capital Fund, Inc. (since September 2007), Singapore Fund, Inc. (since
September 2007); formerly: Vice Dean and Director, Wharton
Undergraduate Division (July 1995-June 2000); Director, Lauder Institute
of International Management Studies (July 2000-June 2006)
William McClayton Private equity investor (since October 2009); previously: Managing 126
(1944) Board Member since Director, Diamond Management & Technology Consultants, Inc. (global
2004 consulting firm) (2001-2009); Directorship: Board of Managers, YMCA of
Metropolitan Chicago; formerly: Senior Partner, Arthur Andersen LLP
(accounting) (1966-2001); Trustee, Ravinia Festival
Rebecca W. Rimel (1951) President and Chief Executive Officer, The Pew Charitable Trusts 126
Board Member since 1995 (charitable organization) (1994 to present); Trustee, Thomas Jefferson
Foundation (charitable organization) (1994 to present); Trustee,
Executive Committee, Philadelphia Chamber of Commerce (2001 to
2007); Trustee, Pro Publica (2007-present) (charitable organization);
Director, CardioNet, Inc./(2)/ (2009-present) (health care); formerly:
Executive Vice President, The Glenmede Trust Company (investment
trust and wealth management) (1983 to 2004); Board Member, Investor
Education (charitable organization) (2004-2005); Director, Viasys Health
Care/(2)/ (January 2007-June 2007)
William N. Searcy, Jr. (1946) Private investor since October 2003; Trustee of 20 open-end mutual 126
Board Member since 1993 funds managed by Sun Capital Advisers, Inc. (since October 1998);
formerly: Pension & Savings Trust Officer, Sprint Corporation/(2)/
(telecommunications) (November 1989-September 2003)
Jean Gleason Stromberg Retired; formerly: Consultant (1997-2001); Director, Financial Markets 126
(1943) Board Member since US Government Accountability Office (1996-1997); Partner, Fulbright &
1997 Jaworski, L.L.P. (law firm) (1978-1996); Directorships: The William and
Flora Hewlett Foundation; Business Leadership Council, Wellesley
College; former Directorships: Service Source, Inc., Mutual Fund
Directors Forum (2002-2004), American Bar Retirement Association
(funding vehicle for retirement plans) (1987-1990 and 1994-1996)
Robert H. Wadsworth (1940) President, Robert H. Wadsworth & Associates, Inc. (consulting firm) 129
Board Member since 1999 (1983 to present); Director, The Phoenix Boys Choir Association
II-45
INTERESTED BOARD MEMBER AND OFFICER/(5)/
NAME, YEAR OF BIRTH,
POSITION WITH THE TRUST/ NUMBER OF
CORPORATION FUNDS IN DWS
AND LENGTH OF TIME BUSINESS EXPERIENCE AND FUND COMPLEX
SERVED/(1)(6)/ DIRECTORSHIPS DURING THE PAST 5 YEARS OVERSEEN
Ingo Gefeke/(3)/ (1967) Managing Director/(4)/, Deutsche Asset Management; Global Head of 58
Board Member since 2010 Distribution and Product Management, DWS Global Head of Trading and
Executive Vice President since Securities Lending. Member of the Board of Directors of DWS
2010 Investment GmbH Frankfurt (since July 2009) and DWS Holding &
Service GmbH Frankfurt (since January 2010); formerly: Global Chief
Administrative Officer Deutsche Asset Management (2004-2009);
Global Chief Operating Officer, Global Transaction Banking, Deutsche
Bank AG, New York (2001-2004); Chief Operating Officer, Global Banking
Division Americas, Deutsche Bank AG, New York (1999-2001); Central
Management, Global Banking Services, Deutsche Bank AG, Frankfurt
(1998-1999); Relationship Management, Deutsche Bank AG, Tokyo,
Japan (1997-1998)
OFFICERS/(5)/
NAME, YEAR OF BIRTH, POSITION
WITH THE TRUST/CORPORATION BUSINESS EXPERIENCE AND
AND LENGTH OF TIME SERVED/(6)/ DIRECTORSHIPS DURING THE PAST 5 YEARS
Michael G. Clark/(7)/ (1965) Managing Director/(4)/, Deutsche Asset Management (2006-present); President of DWS
President, 2006-present family of funds; Director, ICI Mutual Insurance Company (since October 2007);
formerly: Director of Fund Board Relations (2004-2006) and Director of Product
Development (2000-2004), Merrill Lynch Investment Managers; Senior Vice President
Operations, Merrill Lynch Asset Management (1999-2000)
John Millette/(8)/ (1962) Director/(4)/, Deutsche Asset Management
Vice President and Secretary,
1999-present
Paul H. Schubert/(7)/ (1963) Managing Director/(4)/, Deutsche Asset Management (since July 2004); formerly:
Chief Financial Officer, 2004- Executive Director, Head of Mutual Fund Services and Treasurer for UBS Family of
present Treasurer, 2005- Funds (1998-2004); Vice President and Director of Mutual Fund Finance at UBS Global
present Asset Management (1994-1998)
Caroline Pearson/(8)/ (1962) Managing Director/(4)/, Deutsche Asset Management
Assistant Secretary, 1997-
present Chief Legal Officer,
April 2010-present
Rita Rubin/(9)/ (1970) Vice President and Counsel, Deutsche Asset Management (since October 2007);
Assistant Secretary, 2009- formerly, Vice President, Morgan Stanley Investment Management (2004-2007);
present Attorney, Shearman & Sterling LLP (2004); Director and Associate General Counsel,
UBS Global Asset Management (US) Inc. (2001-2004)
Paul Antosca/(8) /(1957) Director/(4)/, Deutsche Asset Management (since 2006); formerly: Vice President, The
Assistant Treasurer, 2007- Manufacturers Life Insurance Company (U.S.A.) (1990-2006)
present
Jack Clark /(8)/ (1967) Director/(4)/, Deutsche Asset Management (since 2007); formerly: Vice President, State
Assistant Treasurer,2007- Street Corporation (2002-2007)
present
Diane Kenneally/(8)/ (1966) Director/(4)/, Deutsche Asset Management
Assistant Treasurer,2007-
present
John Caruso/(10)/ (1965) Managing Director/(4)/, Deutsche Asset Management
Anti-Money Laundering
Compliance Officer, 2010-
present
II-46
NAME, YEAR OF BIRTH, POSITION
WITH THE TRUST/CORPORATION BUSINESS EXPERIENCE AND
AND LENGTH OF TIME SERVED/(6)/ DIRECTORSHIPS DURING THE PAST 5 YEARS
Robert Kloby/(9)/ (1962) Managing Director/(4)/, Deutsche Asset Management
Chief Compliance Officer,
2006-present
/(1)/ The length of time served represents the year in which the Board Member
joined the board of one or more DWS funds currently overseen by the
Board.
/(2)/ A publicly held company with securities registered pursuant to Section
12 of the Securities Exchange Act of 1934.
/(3)/ The mailing address of Mr. Gefeke is 345 Park Avenue, New York, New
York 10154. Mr. Gefeke is an interested Board Member by virtue of his
positions with Deutsche Asset Management. As an interested person, Mr.
Gefeke receives no compensation from the fund. Mr. Gefeke is a board
member of the following trusts and corporations: Cash Account Trust,
DWS Balanced Fund, DWS Blue Chip Fund, DWS Equity Trust, DWS High
Income Series, DWS Money Funds, DWS State Tax-Free Income Series, DWS
Strategic Government Securities Fund, DWS Strategic Income Fund, DWS
Target Fund, DWS Technology Fund, DWS Value Series, Inc., DWS Variable
Series II, Investors Cash Trust, Tax-Exempt California Money Market
Fund, DWS Dreman Value Income Edge Fund, Inc., DWS Global High Income
Fund, Inc., DWS High Income Trust, DWS Multi-Market Income Trust, DWS
Municipal Income Trust, DWS RREEF World Real Estate & Tactical
Strategies Fund, Inc., DWS Strategic Income Trust, and DWS Strategic
Municipal Income Trust.
/(4)/ Executive title, not a board directorship.
/(5)/ As a result of their respective positions held with the Advisor, these
individuals are considered "interested persons" of the Advisor within
the meaning of the 1940 Act. Interested persons receive no compensation
from the fund.
/(6)/ The length of time served represents the year in which the officer was
first elected in such capacity for one or more DWS funds.
/(7)/ Address: 345 Park Avenue, New York, New York 10154.
/(8)/ Address: One Beacon Street, Boston, Massachusetts 02108.
/(9)/ Address: 280 Park Avenue, New York, New York 10017.
/(10)/ Address: 60 Wall Street, New York, New York 10005.
Certain officers hold similar positions for other investment companies for
which DIMA or an affiliate serves as the Advisor.
OFFICER'S ROLE WITH PRINCIPAL UNDERWRITER: DWS INVESTMENTS DISTRIBUTORS, INC.
Paul H. Schubert: Vice President
Caroline Pearson: Secretary
John Caruso: AML Compliance Officer
BOARD MEMBER QUALIFICATIONS
The Nominating and Governance Committee is responsible for recommending
proposed nominees for election to the full Board for its approval. In
recommending the election of the current Board Members, the Committee generally
considered the educational, business and professional experience of each Board
Member in determining his or her qualifications to serve as a Board Member,
including the Board Member's record of service as a director or trustee of
public and private organizations. In the case of most Board Members, this
included their many years of previous service as a trustee of certain of the
DWS funds. This previous service has provided these Board Members with a
valuable understanding of the history of the DWS funds and the DIMA
organization and has also served to demonstrate their high level of diligence
and commitment to the interests of fund shareholders and their ability to work
effectively and collegially with other members of the Board. The Committee also
considered, among other factors, the particular attributes described below with
respect to the various individual Board Members:
John W. Ballantine - Mr. Ballantine's experience in banking, financial risk
management and investments acquired in the course of his service as a senior
executive of various US and foreign banks.
Henry P. Becton, Jr. - Mr. Becton's professional training and experience as an
attorney, his experience as the chief executive officer of a major public media
company and his experience as lead director of two NYSE companies, including
his service at various times as the chair of the audit, compensation and
nominating committees of one or both of such boards.
II-47
Dawn-Marie Driscoll - Ms. Dricoll's professional training and experience as an
attorney, her expertise as a consultant, professor and author on the subject of
business ethics, her service as a member of the executive committee of the
Independent Directors Council of the Investment Company Institute and her
experience as a director of an insurance company serving the mutual fund
industry.
Keith R. Fox - Mr. Fox's experience as the chairman and a director of various
private operating companies and investment partnerships and his experience as a
director and audit committee member of several public companies.
Paul K. Freeman - Dr. Freeman's professional training and experience as an
attorney and an economist, his experience as the founder and chief executive
officer of an insurance company, his experience as a senior executive and
consultant for various companies focusing on matters relating to risk
management and his service on the Independent Directors Council of the
Investment Company Institute.
Kenneth C. Froewiss - Dr. Froewiss' professional training and experience as an
economist, his experience in finance acquired in various professional positions
with governmental and private banking organizations and his experience as a
professor of finance at a leading business school.
Ingo Gefeke - Mr. Gefeke's experience as a senior executive in various parts of
Deutsche Bank's investment management business and his current service as the
chief executive officer of DWS Investments.
Richard J. Herring - Mr. Herring's experience as a professor of finance at a
leading business school and his service as an advisor to various professional
and governmental organizations.
William McClayton - Mr. McClayton's professional training and experience in
public accounting, including his service as a senior partner of a major public
accounting firm focusing on financial markets companies and his service as a
senior executive of a public management consulting firm.
Rebecca W. Rimel - Ms. Rimel's experience on a broad range of public policy
issues acquired during her service as the executive director of a major
foundation and her experience as a director of several public companies.
William N. Searcy - Mr. Searcy's experience as an investment officer for
various major public company retirement plans, which included evaluation of
unaffiliated investment advisers and supervision of various administrative and
accounting functions.
Jean Gleason Stromberg - Ms. Stromberg's professional training and experience
as an attorney specializing in federal securities law, her service in a senior
position with the Securities and Exchange Commission and her experience as a
director and audit committee member of several major non-profit organizations.
Robert H. Wadsworth - Mr. Wadsworth's experience as an owner and chief
executive officer of various businesses serving the mutual fund industry,
including a registered broker-dealer and a registered transfer agent, and his
service as a senior executive officer of several mutual funds.
II-48
PART II: APPENDIX II-B - PORTFOLIO MANAGEMENT COMPENSATION
FOR FUNDS ADVISED BY DEUTSCHE INVESTMENT MANAGEMENT AMERICAS INC. OR ITS
AFFILIATES
Each fund is managed by a team of investment professionals who each play an
important role in a fund's management process. Team members work together to
develop investment strategies and select securities for a fund. This team works
for the Advisor or its affiliates and is supported by a large staff of
economists, research analysts, traders and other investment specialists. The
Advisor or its affiliates believe(s) its team approach benefits investors by
bringing together many disciplines and leveraging its extensive resources. Team
members with primary responsibility for management of a fund, as well as team
members who have other ongoing management responsibilities for a fund, are
identified in each fund's prospectus, as of the date of a fund's prospectus.
Composition of the team may change over time, and shareholders and investors
will be notified of changes affecting individuals with primary fund management
responsibility.
COMPENSATION OF PORTFOLIO MANAGERS
Portfolio managers are paid on a Total Compensation basis, which includes: (i)
fixed pay (base salary), which is linked to job function, responsibilities and
internal and external peer comparison, and (ii) variable pay, which is linked
to investment performance, individual contributions to the team, and the
overall financial results of both Deutsche Asset Management and Deutsche Bank
AG.
Variable pay can be delivered via a short-term and/or long-term vehicle, namely
cash, restricted equity awards, and/or restricted incentive awards. Variable
pay comprises a greater proportion of total compensation as a portfolio
manager's seniority and total compensation level increase. The proportion of
variable pay delivered via a long-term incentive award, which is subject to
clawback, will increase significantly as the amount of variable pay increases.
All variable pay delivered via long-term incentive award is subject to
clawback.
To evaluate its investment professionals, Deutsche Asset Management reviews
investment performance for all accounts managed in relation to both account
peer group and benchmark related data (i.e., appropriate Morningstar and Lipper
peer group universes and/or benchmark index(es) with respect to each account).
The ultimate goal of this process is to evaluate the degree to which investment
professionals deliver investment performance that meets or exceeds their
clients' risk and return objectives. When determining Total Compensation,
Deutsche Asset Management considers a number of quantitative and qualitative
factors:
o Quantitative measures (e.g. one-, three- and five-year pre-tax returns
versus the benchmark and appropriate peer group, taking risk targets into
account) are utilized to measure performance.
o Qualitative measures (e.g. adherence to, as well as contributions to, the
enhancement of the investment process) are included in the performance
review.
o Other factors (e.g. teamwork, adherence to compliance rules, risk management
and 'living the values" of Deutsche Asset Management) are included as part
of a discretionary component of the review process, giving management the
ability to consider additional markers of performance on a subjective
basis.
CONFLICTS
Real, potential or apparent conflicts of interest may arise when a portfolio
manager has day-to-day portfolio management responsibilities with respect to
more than one fund or account, including the following:
II-49
o Certain investments may be appropriate for a fund and also for other clients
advised by the Advisor, including other client accounts managed by a fund's
portfolio management team. Investment decisions for a fund and other
clients are made with a view to achieving their respective investment
objectives and after consideration of such factors as their current
holdings, availability of cash for investment and the size of their
investments generally. A particular security may be bought or sold for only
one client or in different amounts and at different times for more than one
but less than all clients. Likewise, because clients of the Advisor may
have differing investment strategies, a particular security may be bought
for one or more clients when one or more other clients are selling the
security.The investment results achieved for a fund may differ from the
results achieved for other clients of the Advisor. In addition, purchases
or sales of the same security may be made for two or more clients on the
same day. In such event, such transactions will be allocated among the
clients in a manner believed by the Advisor to be most equitable to each
client, generally utilizing a pro rata allocation methodology. In some
cases, the allocation procedure could potentially have an adverse effect or
positive effect on the price or amount of the securities purchased or sold
by a fund. Purchase and sale orders for a fund may be combined with those
of other clients of the Advisor in the interest of achieving the most
favorable net results to a fund and the other clients.
o To the extent that a portfolio manager has responsibilities for managing
multiple client accounts, a portfolio manager will need to divide time and
attention among relevant accounts. The Advisor attempts to minimize these
conflicts by aligning its portfolio management teams by investment strategy
and by employing similar investment models across multiple client accounts.
o In some cases, an apparent conflict may arise where the Advisor has an
incentive, such as a performance-based fee, in managing one account and not
with respect to other accounts it manages. The Advisor will not determine
allocations based on whether it receives a performance-based fee from the
client. Additionally, the Advisor has in place supervisory oversight
processes to periodically monitor performance deviations for accounts with
like strategies.
o The Advisor and its affiliates and the investment team of a fund may manage
other mutual funds and separate accounts on a long only or a long-short
basis. The simultaneous management of long and short portfolios creates
potential conflicts of interest including the risk that short sale activity
could adversely affect the market value of the long positions(and vice
versa), the risk arising from sequential orders in long and short
positions, and the risks associated with receiving opposing orders at the
same time. The Advisor has adopted procedures that it believes are
reasonably designed to mitigate these and other potential conflicts of
interest. Included in these procedures are specific guidelines developed to
provide fair and equitable treatment for all clients whose accounts are
managed by each fund's portfolio management team. The Advisor and the
portfolio management team have established monitoring procedures, a
protocol for supervisory reviews, as well as compliance oversight to ensure
that potential conflicts of interest relating to this type of activity are
properly addressed.
The Advisor is owned by Deutsche Bank AG, a multi-national financial services
company. Therefore, the Advisor is affiliated with a variety of entities that
provide, and/or engage in commercial banking, insurance, brokerage, investment
banking, financial advisory, broker-dealer activities (including sales and
trading), hedge funds, real estate and private equity investing, in addition to
the provision of investment management services to institutional and individual
investors. Since Deutsche Bank AG, its affiliates, directors, officers and
employees (the "Firm") are engaged in businesses and have interests in addition
to managing asset management accounts, such wide ranging activities involve
real, potential or apparent conflicts of interest. These interests and
activities include potential advisory, transactional and financial activities
and other interests in securities and companies that may be directly or
indirectly purchased or sold by the Firm for its clients' advisory accounts.
The Advisor may take investment positions in securities in which other clients
or related persons within the Firm have different investment positions. There
may be instances in which the Advisor is purchasing or selling for its client
accounts, or pursuing an outcome in the context of a workout or restructuring
with respect to, securities in which the Firm is undertaking the same or
differing strategy in other businesses or other client accounts. These are
considerations of which advisory clients should be aware and which may cause
conflicts that could be to the disadvantage of the Advisor's advisory clients,
including the Fund. The Advisor has instituted business and compliance
policies, procedures and disclosures that are designed to identify, monitor and
mitigate conflicts of interest and, as appropriate, to report them to a fund's
Board.
II-50
FOR FUND ADVISED BY ABERDEEN (AAMI)
COMPENSATION
AAMI's remuneration policy (Policy) is designed to reflect the importance of
recruiting, retaining and motivating senior executives and portfolio managers
of the caliber necessary to maintain and improve AAMI's position in the asset
management industry. The Policy seeks to reward performance in a manner which
aligns the interests of clients, shareholders and executives. The elements of
the Policy as it relates to the Portfolio's portfolio managers are as follows:
BASIC SALARY. The salaries of all employees are reviewed annually and are
determined by reference to external market research. AAMI's Policy is to pay
salaries which, when taken together with other benefits, will provide a
remuneration package that is reasonable and competitive in the asset management
industry. AAMI participates in compensation surveys which provide salary
comparisons for a range of employees across AAMI. AAMI also considers
information included in other publicly available research and survey results.
Staff performance is reviewed formally once a year with mid-term reviews. The
review process looks at all of the ways in which an individual has contributed
to the organization, and specifically, in the case of portfolio managers, to
the investment team.
ANNUAL BONUS. The Policy is to recognize corporate and individual achievements
each year through an appropriate annual bonus plan. The aggregate amount of a
cash bonus available in any year is dependent on AAMI's overall performance and
profitability. Consideration will also be given to the levels of bonuses paid
in the marketplace. Individual awards, payable to all members of staff, are
determined by a rigorous assessment of achievement against defined objectives,
and are reviewed and approved by AAMI's Remuneration Committee.
Portfolio managers' bonuses are based on a combination of the investment team's
overall performance, the individual's performance and the overall performance
of AAMI. In calculating a portfolio manager's bonus, AAMI takes into
consideration the performance of funds managed by the team as well as more
subjective issues that benefit AAMI. Portfolio manager performance on
investment matters is judged over all funds to which the fund manager
contributes. Performance is measured against appropriate market indices as well
as peer universes over various time periods.
DEFERRED BONUS. A deferred bonus plan exists and is designed to encourage the
retention of certain key employees identified as critical to AAMI's achievement
of its long-term goals. Deferred bonuses may be in the form of deferred equity
in Aberdeen PLC.
Retention and incentives for former Deutsche Asset Management employees. In
addition to the Policy, appropriate retention and incentive arrangements have
been put into place for certain employees of the former Deutsche Asset
Management businesses, including in some cases participation in the Long Term
Incentive Plan. The costs of these arrangements are being borne by both
Deutsche Asset Management and AAMI.
CONFLICTS
In addition, an investment professional may manage accounts in a personal
capacity that may include holdings that are similar to, or the same as, those
of a fund. AAMI have in place a Code of Ethics that is designed to address
conflicts of interest and that, among other things, imposes restrictions on the
ability of portfolio managers and other "access persons" to invest in
securities that may be recommended or traded in a fund and other client
accounts.
Real, potential or apparent conflicts of interest may arise when a portfolio
manager has day-to-day portfolio management responsibilities with respect to
more than one fund or account, including the following:
II-51
o Certain investments may be appropriate for a fund and also for other clients
advised by AAMI, including other client accounts managed by a fund's
portfolio management team. Investment decisions for a fund and other
clients are made with a view to achieving their respective investment
objectives and after consideration of such factors as their current
holdings, availability of cash for investment and the size of their
investments generally. A particular security may be bought or sold for only
one client or in different amounts and at different times for more than one
but less than all clients. Likewise, because clients of AAMI may have
differing investment strategies, a particular security may be bought for
one or more clients when one or more other clients are selling the
security. The investment results achieved for a fund may differ from the
results achieved for other clients of AAMI. In addition, purchases or sales
of the same security may be made for two or more clients on the same day.
In such event, such transactions will be allocated among the clients in a
manner believed by AAMI to be most equitable to each client, generally
utilizing a pro rata allocation methodology. In some cases, the allocation
procedure could potentially have an adverse effect or positive effect on
the price or amount of the securities purchased or sold by a fund. Purchase
and sale orders for a fund may be combined with those of other clients of
AAMI in the interest of achieving the most favorable net results to a fund
and the other clients.
o To the extent that a portfolio manager has responsibilities for managing
multiple client accounts, a portfolio manager will need to divide time and
attention among relevant accounts. The Advisor attempts to minimize these
conflicts by aligning its portfolio management teams by investment strategy
and by employing similar investment models across multiple client accounts.
o In some cases, an apparent conflict may arise where AAMI have an incentive,
such as a performance based fee, in managing one account and not with
respect to other accounts it manages. The Advisor will not determine
allocations based on whether it receives a performance-based fee from the
client. Additionally, AAMI have in place supervisory oversight processes to
periodically monitor performance deviations for accounts with like
strategies.
FOR FUNDS ADVISED BY DREMAN
COMPENSATION
Each fund has been advised that the subadvisor has implemented a highly
competitive compensation plan which seeks to attract and retain exceptional
investment professionals who have demonstrated that they can consistently
outperform their respective fund's benchmark. The compensation plan is
comprised of both a fixed component and a variable component. The variable
component is determined by assessing the investment professional's performance
measured utilizing both quantitative and qualitative factors.
The sub-advisor's investment professionals are each paid a fixed base salary
that is determined based on their job function and responsibilities. The base
salary is deemed to be competitive with the marketplace and specifically with
salaries in the financial services industry by utilizing various salary surveys
compiled for the financial services industry, specifically, investment advisory
firms. The variable component of the subadvisor's compensation plan which takes
the form of a cash bonus combined with either, employee retention bonus units
payable over time or outright stock grants is discretionary and is designed to
reward and retain investment professionals including portfolio managers and
research analysts for their contributions to a fund's performance relative to
its benchmark. Additionally, employees are eligible for a profit sharing plan.
Investment professionals may receive equity in the form of units or fractional
units of membership interest in the subadvisor or they may receive employee
retention bonus units which enable them to participate in the growth of the
firm. Investment professionals also participate in the subadvisor's profit
sharing, defined contribution plan that allows the subadvisor to contribute up
to twenty percent of an employee's total compensation, subject to various
regulatory limitations, to each employee's profit sharing account. The
subadvisor's profit sharing plan is a qualified plan which benefits employees
of the firm including both portfolio managers and research analysts.
Contributions to the sub-advisor's profit sharing plan vest over a specified
term. Finally all employees of the subadvisor including investment
professionals receive additional fringe benefits in the form of subsidized
medical, dental, group-term, and life insurance coverage.
II-52
The basis for determining the variable component of an investment
professional's total compensation is determined through a subjective process
which evaluates an investment professional performance against several
quantitative and qualitative factors including the following:
Quantitative factors:
(i) Relative ranking of a fund's performance against its peers in the
one, three and five year pre-tax investment performance categories.
A fund's performance is evaluated against peers in its fund category
and performance is ranked from one to four on a declining scale
depending on the quartile in which the portfolio manager's absolute
performance falls. The portfolio manager is rewarded on a graduated
scale for outperforming relative to his peers.
(ii) Relative performance of a fund's performance against the
pre-determined indices for the product strategy against which the
fund's performance is measured. The portfolio manager is rewarded on
a graduated scale for outperforming relative to the fund's benchmark
index.
(iii) Performance of a fund is measured through attribution analysis
models which analyzes the portfolio manager's contribution from both
an asset allocation or sector allocation perspective and security
selection perspective. This factor evaluates how the investment
professional performs in linking performance with the client's
investment objective including investment parameters and risk and
return objectives. This factor may include some qualitative
characteristics.
Qualitative factors:
(i) Ability to work well with other members of the investment
professional team and mentor junior members;
(ii) Contributions to the organizational overall success with new product
strategies; and
(iii) Other factors such as contributing to the team in a leadership role
and by being responsive to requests for assistance.
CONFLICTS
The sub-advisor manages clients' accounts using a contrarian value investment
strategy. For both its large capitalization and small capitalization strategies
the subadvisor utilizes a model portfolio and rebalances client's accounts
whenever changes are made to the model portfolio. In addition the sub-advisor
aggregates its trades and allocates the trades to all clients' accounts in an
equitable manner. The sub-advisor strongly believes aggregating its orders
protect all clients from being disadvantaged by price or time execution. The
model portfolio approach and the trade aggregation policy of the subadvisor
seek to eliminate conflicts of interest that could arise when a portfolio
manager has day-to-day portfolio management responsibilities with respect to
more than one fund or account. The subadvisor does not receive any
performance-based fees from any of its accounts with the exception of hedge
funds that are managed by an affiliated firm. The hedge funds are treated like
all other client account and trades done for the fund are generally aggregated
with trades done for its other client accounts.
The sub-advisor's investment professionals are compensated in the same manner
for all client accounts irrespective of the type of account.
FOR FUNDS ADVISED BY NORTHERN TRUST (NTI)
COMPENSATION
As of March 31, 2008 the compensation for the index portfolio managers is based
on the competitive marketplace and consists of a fixed base salary plus a
variable annual cash incentive award. In addition, non-cash incentives, such as
stock options or restricted stock of Northern Trust Corporation, may be awarded
from time to time. The annual incentive award is discretionary and is based on
a quantitative and qualitative evaluation of each portfolio manager's
investment performance and contribution to his or her respective team plus the
financial performance of the investment
II-53
business unit and Northern Trust Corporation as a whole. The annual incentive
award is not based on performance of the portfolio/funds or the amount of
assets held in a fund. Moreover, no material differences exist between the
compensation structure for mutual fund accounts and other types of accounts.
CONFLICTS
NTI's portfolio managers are often responsible for managing one or more funds,
as well as other accounts, including separate accounts and other pooled
investment vehicles. A portfolio manager may manage a separate account or other
pooled investment vehicle that may have a materially higher or lower fee
arrangement. The side-by-side management of these accounts may raise potential
conflicts of interest relating to cross trading, the allocation of investment
opportunities and the aggregation and allocation of trades. In addition, while
portfolio managers generally only manage accounts with similar investment
strategies, it is possible that due to varying investment restrictions among
accounts that certain investments are made for some accounts and not others or
conflicting investment positions are taken among accounts. The portfolio
managers have a fiduciary responsibility to manage all client accounts in a
fair and equitable manner. NTI seeks to provide best execution of all
securities transactions and aggregate and then allocate securities to client
accounts in a fair and timely manner. To this end, NTI has developed policies
and procedures designed to mitigate and manage the potential conflicts of
interest that may arise from side-by-side management. In addition, NTI has
adopted policies limiting the circumstances under which cross-trades may be
affected. NTI conducts periodic reviews of trades for consistency with these
policies.
FOR FUND ADVISED BY TURNER
COMPENSATION
Turner's investment professionals receive a base salary commensurate with their
level of experience. Turner's goal is to maintain competitive base salaries
through review of industry standards, market conditions, and salary surveys.
Bonus compensation, which is a multiple of base salary, is based on the
performance of each individual's sector and portfolio assignments relative to
appropriate market benchmarks. In addition, each employee is eligible for
equity awards. Turner believes this compensation provides incentive to attract
and retain highly qualified people.
The objective performance criteria noted above accounts for 90% of the bonus
calculation. The remaining 10% is based upon subjective, "good will" factors
including teamwork, interpersonal relations, the individual's contribution to
overall success of the firm, media and client relations, presentation skills,
and professional development. Portfolio managers/analysts are reviewed on an
annual basis. The Chief Investment Officer, Robert E. Turner, CFA, is
responsible for setting base salaries, bonus targets, and making all subjective
judgments related to an investment professionals' compensation.
CONFLICTS
As is typical for many money managers, potential conflicts of interest may
arise related to Turner's management of accounts including the Portfolio where
not all accounts are able to participate in a desired Initial Public Offering
(IPO), or other limited opportunity, relating to use of soft dollars and other
brokerage practices, related to the voting of proxies, employee personal
securities trading, and relating to a variety of other circumstances. In all
cases, however, Turner believes it has written policies and procedures in place
reasonably designed to prevent violations of the federal securities laws and to
prevent material conflicts of interest from arising. Please also see Turner's
Form ADV, Part II for a description of some of its policies and procedures in
this regard.
II-54
PART II: APPENDIX II-C - FEE RATES OF SERVICE PROVIDERS
FEES PAYABLE TO DIMA FOR INVESTMENT MANAGEMENT SERVICES.
The management fee for each fund is accrued daily and paid monthly, at the
annual percentage rate of daily net assets indicated below:
FUND NAME MANAGEMENT FEE RATE
Tax-Free Income Funds
DWS California Tax-Free Income Fund First $250 million 0.450%
Next $750 million 0.420%
Next $1.5 billion 0.400%
Next $2.5 billion 0.380%
Next $2.5 billion 0.350%
Next $2.5 billion 0.330%
Next $2.5 billion 0.310%
Thereafter 0.300%
DWS Strategic High Yield Tax-Free Fund First $300 million 0.565%
Next $200 million 0.515%
Next $500 million 0.490%
Thereafter 0.470%
DWS Intermediate Tax/AMT Free Fund 0.315%
DWS Managed Municipal Bond Fund First $250 million 0.365%
Next $750 million 0.345%
Next $1.5 billion 0.325%
Next $2.5 billion 0.315%
Next $2.5 billion 0.295%
Next $2.5 billion 0.275%
Next $2.5 billion 0.255%
Thereafter 0.235%
DWS Massachusetts Tax Free Fund First $250 million 0.450%
Next $750 million 0.420%
Next $1.5 billion 0.400%
Next $2.5 billion 0.380%
Next $2.5 billion 0.350%
Next $2.5 billion 0.330%
Next $2.5 billion 0.310%
Thereafter 0.300%
DWS New York Tax-Free Income Fund First $250 million 0.450%
Next $750 million 0.420%
Next $1.5 billion 0.400%
Next $2.5 billion 0.380%
Next $2.5 billion 0.350%
Next $2.5 billion 0.330%
Next $2.5 billion 0.310%
Thereafter 0.300%
DWS Short-Term Municipal Bond Fund First $500 million 0.400%
Next $500 million 0.385%
Next $1.0 billion 0.370%
Thereafter 0.355%
II-55
FUND NAME MANAGEMENT FEE RATE
Taxable Income Funds
DWS Core Fixed Income Fund First $1.5 billion 0.400%
Next $1.75 billion 0.385%
Next $1.75 billion 0.370%
Thereafter 0.355%
DWS Core Plus Income Fund First $250 million 0.465%
Next $750 million 0.435%
Next $1.5 billion 0.415%
Next $2.5 billion 0.395%
Next $2.5 billion 0.365%
Next $2.5 billion 0.345%
Next $2.5 billion 0.325%
Thereafter 0.315%
DWS Floating Rate Plus Fund First $1 billion 0.650%
Next $1.5 billion 0.635%
Next $2.5 billion 0.610%
Next $2.5 billion 0.585%
Next $2.5 billion 0.560%
Thereafter 0.550%
DWS GNMA Fund First $5.0 billion 0.315%
Next $1.0 billion 0.300%
Thereafter 0.285%
DWS High Income Fund First $250 million 0.480%
Next $750 million 0.450%
Next $1.5 billion 0.430%
Next $2.5 billion 0.410%
Next $2.5 billion 0.380%
Next $2.5 billion 0.360%
Next $2.5 billion 0.340%
Thereafter 0.320%
DWS High Income Plus Fund First $1.0 billion 0.500%
Next $1.5 billion 0.490%
Next $2.5 billion 0.480%
Next $5.0 billion 0.470%
Thereafter 0.460%
DWS Global Inflation Plus Fund First $1.5 billion 0.400%
Next $500 million 0.375%
Next $1.0 billion 0.360%
Next $1.0 billion 0.345%
Next $1.0 billion 0.330%
Next $1.0 billion 0.315%
Thereafter 0.300%
DWS Short Duration Fund First $500 million 0.400%
Next $500 million 0.385%
Next $1.0 billion 0.370%
Thereafter 0.355%
II-56
FUND NAME MANAGEMENT FEE RATE
DWS Short Duration Plus Fund First $1.5 billion 0.365%
Next $500 million 0.340%
Next $1.0 billion 0.315%
Next $1.0 billion 0.300%
Next $1.0 billion 0.285%
Next $1.0 billion 0.270%
Thereafter 0.255%
DWS Strategic Income Fund First $250 million 0.480%
Next $750 million 0.450%
Next $1.5 billion 0.430%
Next $2.5 billion 0.410%
Next $2.5 billion 0.380%
Next $2.5 billion 0.360%
Next $2.5 billion 0.340%
Thereafter 0.320%
DWS Strategic Government Securities First $250 million 0.350%
Fund Next $750 million 0.330%
Next $1.5 billion 0.310%
Next $2.5 billion 0.300%
Next $2.5 billion 0.280%
Next $2.5 billion 0.260%
Next $2.5 billion 0.240%
Thereafter 0.220%
Multi-Category/Asset Allocation Funds
DWS Alternative Asset Allocation Plus 0.200%/(1)/
Fund
DWS Balanced Fund First $1.5 billion 0.370%
Next $500 million 0.345%
Next $1.5 billion 0.310%
Next $2.0 billion 0.300%
Next $2.0 billion 0.290%
Next $2.5 billion 0.280%
Next $2.5 billion 0.270%
Thereafter 0.260%
DWS LifeCompass Protect 2017 Fund 0.600%/(2)/
DWS LifeCompass Retirement Fund 0.000%/(1)/
DWS LifeCompass 2015 Fund 0.000%/(1)/
DWS LifeCompass 2020 Fund 0.000%/(1)/
DWS LifeCompass 2030 Fund 0.000%/(1)/
DWS LifeCompass 2040 Fund 0.000%/(1)/
DWS Lifecycle Long Range Fund First $250 million 0.600%
Next $750 million 0.575%
Thereafter 0.550%
DWS Select Alternative Allocation 0.00%/(1)/
Fund
DWS Target 2010 Fund 0.400%
DWS Target 2011 Fund 0.400%
II-57
FUND NAME MANAGEMENT FEE RATE
DWS Target 2012 Fund 0.400%
DWS Target 2013 Fund 0.400%
DWS Target 2014 Fund 0.400%
Value Funds
DWS Enhanced Commodity Strategy First $500 million 0.950%
Fund Next $500 million 0.900%
Thereafter 0.850%
DWS Disciplined Market Neutral Fund First $1.0 billion 1.250%
Next $1.0 billion 1.200%
Next $1.0 billion 1.150%
Thereafter 1.100%
DWS Dreman Mid Cap Value Fund First $250 million 0.750%
Next $250 million 0.720%
Next $2.0 billion 0.700%
Next $1.5 billion 0.680%
Thereafter 0.660%/(3)/
DWS Dreman Small Cap Value Fund First $250 million 0.750%
Next $750 million 0.720%
Next $1.5 billion 0.700%
Next $2.5 billion 0.680%
Next $2.5 billion 0.650%
Next $2.5 billion 0.640%
Next $2.5 billion 0.630%
Thereafter 0.620%/(3)/
DWS Growth & Income Fund First $250 million 0.365%
Next $750 million 0.360%
Next $1.5 billion 0.355%
Next $5.0 billion 0.345%
Next $5.0 billion 0.335%
Next $5.0 billion 0.325%
Thereafter 0.300%
DWS Large Cap Value Fund First $1.5 billion 0.425%
Next $500 million 0.400%
Next $1 billion 0.375%
Next $1 billion 0.350%
Next $1 billion 0.325%
Thereafter 0.300
DWS RREEF Real Estate Securities First $100 million 0.565%
Fund Next $100 million 0.465%
Next $100 million 0.415%
Thereafter 0.365%
DWS Small Cap Core Fund First $500 million 0.665%
Next $500 million 0.615%
Thereafter 0.565%
II-58
FUND NAME MANAGEMENT FEE RATE
DWS Strategic Value Fund First $250 million 0.750%
Next $750 million 0.720%
Next $1.5 billion 0.700%
Next $2.5 billion 0.680%
Next $2.5 billion 0.650%
Next $2.5 billion 0.640%
Next $2.5 billion 0.630%
Thereafter 0.620%/(3)/
Index-Related Funds
DWS EAFE Equity Index Fund 0.250%
DWS Equity 500 Index Fund 0.000%/(4)/
DWS Equity 500 Index Portfolio 0.050%
DWS S&P 500 Index Fund 0.000%/(4)/
DWS U.S. Bond Index Fund 0.150%
Growth Funds
DWS Blue Chip Fund First $250 million 0.480%
Next $750 million 0.450%
Next $1.5 billion 0.430%
Next $2.5 billion 0.410%
Next $2.5 billion 0.380%
Next $2.5 billion 0.360%
Next $2.5 billion 0.340%
Thereafter 0.320%
DWS Capital Growth Fund First $250 million 0.495%
Next $750 million 0.465%
Next $1.5 billion 0.445%
Next $2.5 billion 0.425%
Next $2.5 billion 0.395%
Next $2.5 billion 0.375%
Next $2.5 billion 0.355%
Thereafter 0.335%
DWS Communications Fund First $100 million 1.000%
Next $100 million 0.900%
Next $100 million 0.850%
Next $200 million 0.800%
Next $500 million 0.730%
Next $500 million 0.680%
Thereafter 0.650%
DWS Disciplined Long/Short Growth First $1.0 billion 1.00%
Fund Next $1.0 billion 0.950%
Next $1.0 billion 0.900%
Thereafter 0.850%
DWS Gold & Precious Metals Fund First $500 million 0.835%
Thereafter 0.785%
DWS Health Care Fund First $500 million 0.765%
Thereafter 0.715%
II-59
FUND NAME MANAGEMENT FEE RATE
DWS Large Company Growth Fund First $1.5 billion 0.615%
Next $500 million 0.565%
Thereafter 0.515%
DWS Mid Cap Growth Fund First $500 million 0.650%
Next $1 billion 0.600%
Next $2.5 billion 0.550%
Next $2.5 billion 0.540%
Next $2.5 billion 0.530%
Next $2.5 billion 0.520%
Thereafter 0.510%
DWS Small Cap Growth Fund 0.650%
DWS Technology Fund First $250 million 0.480%
Next $750 million 0.450%
Next $1.5 billion 0.430%
Next $2.5 billion 0.410%
Next $2.5 billion 0.380%
Next $2.5 billion 0.360%
Next $2.5 billion 0.340%
Thereafter 0.320%
Global Income Funds
DWS Emerging Markets Fixed Income 0.590%
Fund
DWS Global Bond Fund 0.410%
Global Growth Funds
DWS Climate Change Fund 1.000%
DWS Emerging Markets Equity Fund First $250 million 1.015%
Next $500 million 0.990%
Thereafter 0.965%
DWS Europe Equity Fund First $250 million 0.665%
Next $750 million 0.635%
Next $1.5 billion 0.615%
Next $2.5 billion 0.595%
Next $2.5 billion 0.565%
Next $2.5 billion 0.555%
Next $2.5 billion 0.545%
Thereafter 0.535%
DWS Global Small Cap Growth Fund First $500 million 0.915%
Next $500 million 0.865%
Thereafter 0.815%
DWS Global Thematic Fund First $500 million 0.915%
Next $500 million 0.865%
Next $500 million 0.815%
Next $500 million 0.765%
Thereafter 0.715%
II-60
FUND NAME MANAGEMENT FEE RATE
DWS International Fund First $2.5 billion 0.565%
Next $2.5 billion 0.545%
Next $5 billion 0.525%
Next $5 billion 0.515%
Thereafter 0.465%
DWS Diversified International Equity First $1.5 billion 0.700%
Fund Next $1.75 billion 0.685%
Next $1.75 billion 0.670%
Thereafter 0.655%
DWS International Value Opportunities First $500 million 0.800%
Fund Next $500 million 0.780%
Next $1.0 billion 0.760%
Thereafter 0.740%
DWS Latin America Equity Fund First $400 million 1.165%
Thereafter 1.065%
DWS RREEF Global Real Estate First $500 million 1.000%
Securities Fund Next $500 million 0.985%
Next $1 billion 0.960%
Thereafter 0.945%
DWS RREEF Global Infrastructure 0.900%
Fund
Insurance/Annuity Funds
DWS Bond VIP First $250 million 0.390%
Next $750 million 0.365%
Thereafter 0.340%
DWS Capital Growth VIP First $250 million 0.390%
Next $750 million 0.365%
Thereafter 0.340%
DWS Global Opportunities VIP First $500 million 0.890%
Next $500 million 0.875%
Next $1.0 billion 0.860%
0.845% thereafter
DWS Growth & Income VIP First $250 million 0.390%
Next $750 million 0.365%
Thereafter 0.340%
DWS Health Care VIP First $250 million 0.665%
Next $750 million 0.640%
Next $1.5 billion 0.615%
Next $2.5 billion 0.595%
Next $2.5 billion 0.565%
Next $2.5 billion 0.555%
Next $2.5 billion 0.545%
Thereafter 0.535%
DWS International VIP First $500 million 0.790%
Thereafter 0.640%
DWS Equity 500 Index VIP First $1 billion 0.200%
Next $1 billion 0.175%
Thereafter 0.150%
II-61
FUND NAME MANAGEMENT FEE RATE
DWS Small Cap Index VIP 0.350%
DWS Alternative Asset Allocation Plus 0.200%/(5)/
VIP
DWS Balanced VIP First $250 million 0.370%
Next $750 million 0.345%
Thereafter 0.310%
DWS Blue Chip VIP First $250 million 0.550%
Next $750 million 0.520%
Next $1.5 billion 0.500%
Next $2.5 billion 0.480%
Next $2.5 billion 0.450%
Next $2.5 billion 0.430%
Next $2.5 billion 0.410%
Thereafter 0.390%
DWS Conservative Allocation VIP First $500 million 0.065%
Next $500 million 0.055%
Next $500 million 0.045%
Next $1.0 billion 0.035%
Thereafter 0.025%/(1)/
DWS Core Fixed Income VIP First $250 million 0.500%
Next $750 million 0.470%
Next $1.5 billion 0.450%
Next $2.5 billion 0.430%
Next $2.5 billion 0.400%
Next $2.5 billion 0.380%
Next $2.5 billion 0.360%
Thereafter 0.340%
DWS Diversified International Equity First $1.5 billion 0.650%
VIP Next $1.75 billion 0.635%
Next $1.75 billion 0.620%
Thereafter 0.605%
DWS Dreman Small Mid Cap Value VIP First $250 million 0.650%
Next $750 million 0.620%
Next $1.5 billion 0.600%
Next $2.5 billion 0.580%
Next $2.5 billion 0.550%
Next $2.5 billion 0.540%
Next $2.5 billion 0.530%
Thereafter 0.520%
DWS Global Thematic VIP First $250 million 0.915%
Next $500 million 0.865%
Next $750 million 0.815%
Next $1.5 billion 0.765%
Thereafter 0.715%
II-62
FUND NAME MANAGEMENT FEE RATE
DWS Government & Agency Securities First $250 million 0.450%
VIP Next $750 million 0.430%
Next $1.5 billion 0.410%
Next $2.5 billion 0.400%
Next $2.5 billion 0.380%
Next $2.5 billion 0.360%
Next $2.5 billion 0.340%
Thereafter 0.320%
DWS Growth Allocation VIP First $500 million 0.065%
Next $500 million 0.055%
Next $500 million 0.045%
Next $1.0 billion 0.035%
Thereafter 0.025%/(1)/
DWS High Income VIP First $250 million 0.500%
Next $750 million 0.470%
Next $1.5 billion 0.450%
Next $2.5 billion 0.430%
Next $2.5 billion 0.400%
Next $2.5 billion 0.380%
Next $2.5 billion 0.360%
Thereafter 0.340%
DWS Large Cap Value VIP First $250 million 0.650%
Next $750 million 0.625%
Next $1.5 billion 0.600%
Next $2.5 billion 0.575%
Next $2.5 billion 0.550%
Next $2.5 billion 0.525%
Next $2.5 billion 0.500%
Thereafter 0.475%
DWS Mid Cap Growth VIP First $250 million 0.665%
Next $750 million 0.635%
Next $1.5 billion 0.615%
Next $2.5 billion 0.595%
Next $2.5 billion 0.565%
Next $2.5 billion 0.555%
Next $2.5 billion 0.545%
Thereafter 0.535%
DWS Moderate Allocation VIP First $500 million 0.065%
Next $500 million 0.055%
Next $500 million 0.045%
Next $1.0 billion 0.035%
Thereafter 0.025%/(1)/
DWS Money Market VIP First $500 million 0.285%
Next $500 million 0.270%
Next $1.0 billion 0.255%
Thereafter 0.240%
DWS Small Cap Growth VIP First $250 million 0.550%
Next $750 million 0.525%
Thereafter 0.500%
II-63
FUND NAME MANAGEMENT FEE RATE
DWS Strategic Income VIP First $250 million 0.550%
Next $750 million 0.520%
Next $1.5 billion 0.500%
Next $2.5 billion 0.480%
Next $2.5 billion 0.450%
Next $2.5 billion 0.430%
Next $2.5 billion 0.410%
Thereafter 0.390%
DWS Strategic Value VIP First $250 million 0.665%
Next $750 million 0.635%
Next $1.5 billion 0.615%
Next $2.5 billion 0.595%
Next $2.5 billion 0.565%
Next $2.5 billion 0.555%
Next $2.5 billion 0.545%
Thereafter 0.535%
DWS Technology VIP First $250 million 0.665%
Next $750 million 0.635%
Next $1.5 billion 0.615%
Next $2.5 billion 0.595%
Next $2.5 billion 0.565%
Next $2.5 billion 0.555%
Next $2.5 billion 0.545%
Thereafter 0.535%
DWS Turner Mid Cap Growth VIP First $250 million 0.715%
Next $250 million 0.700%
Next $500 million 0.685%
Thereafter 0.670%
Money Market Funds
Cash Account Trust - Government & First $500 million 0.120%
Agency Securities Portfolio Next $500 million 0.100%
Next $1.0 billion 0.075%
Next $1.0 billion 0.060%
Thereafter 0.050%/(6)/
Cash Account Trust - Money Market First $500 million 0.220%
Portfolio Next $500 million 0.200%
Next $1.0 billion 0.175%
Next $2.0 billion 0.160%
Thereafter 0.150%/(3)(6)/
Cash Account Trust - Tax- Exempt First $500 million 0.120%
Portfolio Next $500 million 0.100%
Next $1.0 billion 0.075%
Next $1.0 billion 0.060%
Thereafter 0.050%/(6)/
Cash Management Fund Institutional 0.00%/(7)/
Cash Management Portfolio First $3 billion 0.150%
Next $4.5 billion 0.1325%
Thereafter 0.120%
II-64
FUND NAME MANAGEMENT FEE RATE
Cash Reserve Fund, Inc. - Prime 0.00%/(7)/
Series
Cash Reserves Fund Institutional 0.00%/(7)/
Central Cash Management Fund 0.00%
DWS Money Market Series 0.000%/(7)/
DWS Money Market Prime Series First $215 million 0.400%
Next $335 million 0.275%
Next $250 million 0.200%
Next $800 million 0.150%
Next $800 million 0.140%
Next $800 million 0.130%
Thereafter 0.120%
Investors Cash Trust - Treasury 0.050%
Portfolio
NY Tax Free Money Fund 0.120%
Tax-Exempt California Money Market First $500 million 0.120%
Fund Next $500 million 0.100%
Next $1.0 billion 0.075%
Next $1.0 billion 0.060%
Thereafter 0.050%
Tax Free Money Fund Investment 0.150%
Daily Assets Fund Institutional 0.100%
(1) Shareholders of a fund also indirectly bear their pro rata share of the
operating expenses, including the management fee paid to DIMA, of the
underlying DWS Funds in which a fund invests.
(2) In the event that the fund's assets are completely and irreversibly
allocated to its fixed income component, the management fee rate will
decrease to 0.300%
(3) The fund's management fee rate includes administrative services provided
by DIMA which are necessary for the Fund's operation as an open-end
investment company.
(4) The fund invests substantially all its assets in DWS Equity 500 Index
Portfolio (Master Fund). DIMA receives a management fee from the Master
Fund. In the event that the fund withdraws its investment in the Master
Fund, DIMA would become responsible for directly managing the assets of
the fund. In such event, the fund would pay DIMA a management fee at an
annual rate of 0.05% or 0.15% of the daily net assets of DWS Equity 500
Index Fund or DWS S&P 500 Index Fund, respectively.
(5) The fund currently invests substantially all its assets in other DWS
Funds. As a result, shareholders of the fund also indirectly bear their
pro rata share of the operating expenses, including the management fee
paid to DIMA, of the underlying DWS Funds in which the fund invests. In
the future, the fund may invest some or all of its assets in other
securities that are not considered DWS Funds (Other Assets). If the
fund's assets were invested in Other Assets, the management fee paid to
DIMA would equal the sum of (a) 0.200% of the daily assets invested in
DWS Funds and (b) 1.200% of the daily assets invested in Other Assets.
(6) The fund's management fee is computed based on the combined average daily
net assets of the Government & Agency Securities Portfolio, Money Market
Portfolio and Tax-Exempt Portfolio, each a series of Cash Account Trust,
and allocated among each fund based upon relative net assets. DIMA has
agreed to reduce its management fee for Government & Agency Securities
Portfolio such that after the allocation of the fee to each series of
Cash Account Trust, the amount payable by Government & Agency Securities
Portfolio will be limited to 0.05% of its average daily net assets.
II-65
(7) The fund invests substantially all its assets in Cash Management
Portfolio (the Master Fund). DIMA receives a management fee from the
Master Fund. In the event that the fund withdraws its investment in the
Master Fund, DIMA would become responsible for directly managing the
assets of the fund. In such event, the fund would pay DIMA a management
fee directly and for DWS Money Market Series the management fee rate
would be as follows: (a) first $1.5 billion 0.165%; (b) next $1.75
billion 0.150%; (c) next $1.75 billion 0.135%; and (d) thereafter 0.120%.
UNITARY FEE. For DWS S&P 500 Plus Fund only, for the period between January 1,
2009 and December 31, 2009, the fund will pay to DIMA a Unitary Fee, calculated
each day and payable monthly, equal to an annual rate of 0.50% of the fund's
average daily net assets.
Beginning on January 1, 2010, the Unitary Fee will continue to be calculated
daily and paid monthly, but will equal an annual rate of 0.50% (Base Fee),
adjusted as described below, of the fund's average daily net assets for the
previous 365-day period (Performance Period). The Base Fee will be adjusted to
as high as 1.00% or as low as zero, depending on how the fund's investment
performance (based on the total return of Class S shares, which do not bear
Rule 12b-1 fees) for the Performance Period compares with a benchmark equal to
the sum of the investment record of the S&P 500 Index plus 0.50% (Performance
Benchmark) over the Performance Period. If the fund's investment performance
equals the Performance Benchmark, then DIMA will earn the Base Fee of 0.50%. If
the fund's investment performance falls below the Performance Benchmark, then
the Unitary Fee will decrease by the difference between them, but not below
zero. If the fund's investment performance exceeds the Performance Benchmark,
then the Unitary Fee will increase by the difference between them, but not
above 1.00%. In effect, the Unitary Fee after January 1, 2010 will equal the
amount by which the investment performance of the Class S shares of the fund
exceeds the performance of the S&P 500 Index over a given Performance Period,
subject to a cap of 1.00% and a floor of zero. The chart below provides
examples of the Unitary Fee that the fund would pay to DIMA assuming various
returns on Class S shares:
INVESTMENT PERFORMANCE DURING
PERFORMANCE PERIOD UNITARY FEE
Exceeds the S&P 500 Index by 1.00% or more 1.00%
Exceeds the S&P 500 Index by 0.75% 0.75%
Exceeds the S&P 500 Index by 0.50% 0.50%
Exceeds the S&P 500 Index by 0.25% 0.25%
Equals or is less than the S&P 500 Index 0.00%
Therefore, if the fund's Class S investment performance is at or below the S&P
500 Index, the shareholders of the fund will neither pay the Unitary Fee nor
bear the fund's day-to-day operating expenses (with the exceptions noted above,
such as Rule 12b-1 fees). To the extent Class A, Class B, Class C and Class R
shares of the fund have higher expenses than Class S shares, using Class S
shares as the measuring class for purposes of calculating the performance
adjustment to the Unitary Fee could result in Class A, Class B, Class C and
Class R shares bearing a larger positive performance adjustment and a smaller
negative performance adjustment than would be the case if each such class's own
performance were considered.
FEE PAYABLE TO DIMA FOR ADMINISTRATIVE SERVICES. Money Market Portfolio, DWS
Dreman Mid Cap Value Fund, DWS Dreman Small Cap Value Fund and DWS Strategic
Value Fund, do not pay DIMA a separate administrative services fee. Each fund,
except those noted below, pays DIMA an administrative services fee, computed
daily and paid monthly, of 0.100% of a fund's average daily net assets. DWS
Equity 500 Index Portfolio and Cash Management Portfolio each pay DIMA an
administrative services, computed daily and paid monthly, of 0.030% of a fund's
average daily net assets.
FEES PAYABLE TO DIFA FOR FUND ACCOUNTING SERVICES. Currently, DIFA receives no
fee for its services to Money Market Portfolio, a series Cash Account Trust,
DWS Dreman Small Cap Value Fund, and DWS Strategic Value Fund; however, subject
to Board approval, DIFA may seek payment from a fund for fund accounting
services in the future.
DIFA receives an annual fee from DWS Dreman Mid Cap Value Fund for fund
accounting services equal to 0.015% of its average daily net assets.
II-66
FEE PAYABLE TO DISC FOR TRANSFER AGENCY AND SHAREHOLDER SERVICES. DISC receives
an annual service fee for each account of a fund, based on the type of account.
For open retail accounts, the fee is a flat fee ranging from $20.99 to $24.09
per account, for open wholesale money funds the fee is $35.55 per account,
while for certain retirement accounts serviced on the recordkeeping system of
ExpertPlan, Inc., the fee is a flat fee up to $3.91 per account (as of February
2009, indexed to inflation) plus an asset based fee of up to 0.25% of average
net assets. 1/12th of the annual service charge for each account is charged and
payable to DISC each month. A fee is charged for any account which at any time
during the month had a share balance in a fund. Smaller fees are also charged
for closed accounts for which information must be retained on DISC's system for
up to 18 months after closing for tax reporting purposes.
Certain out-of-pocket expenses incurred by DISC, including expenses of printing
and mailing routine fund disclosure documents, costs of record retention and
transaction processing costs are reimbursed by a fund or are paid directly by a
fund. Certain additional out-of-pocket expenses, including costs of computer
hardware and software, third party record-keeping fees in excess of 0.25%, and
processing of proxy statements, may only be reimbursed by a fund with the prior
approval of the Board.
II-67
PART II: APPENDIX II-D - FINANCIAL SERVICES FIRMS' COMPENSATION
GENERAL. DIDI may pay compensation to financial intermediaries in connection
with the sale of fund shares as described below. In addition, financial
intermediaries may receive compensation for post-sale administrative services
from DIDI or directly from a fund as described below.
In addition to the discounts or commissions described herein and in the
prospectus, DIDI, the Advisor or its affiliates may pay or allow additional
discounts, commissions or promotional incentives, in the form of cash, to firms
that sell shares of a fund. In some instances, such amounts may be offered only
to certain firms that sell or are expected to sell during specified time
periods certain minimum amounts of shares of a fund, or other funds
underwritten by DIDI (see Financial Intermediary Support Payments under Part
II: Purchase and Redemption of Shares).
Banks and other financial services firms may provide administrative services
related to order placement and payment to facilitate transactions in shares of
a fund for their clients, and DIDI may pay them a transaction fee up to the
level of the discount or commission allowable or payable to dealers.
RETAIL FUNDS: CLASS A, B, C AND R
CLASS A SHARES: The fund receives the entire net asset value of all its Class A
shares sold. DIDI, as principal underwriter, retains the sales charge on sales
of Class A shares from which it allows discounts from the applicable public
offering price to investment dealers, which discounts are uniform for all
dealers in the United States and its territories. The normal discount is set
forth in the sales charge tables set forth in APPENDIX II-F. Upon notice to all
dealers, DIDI may re-allow to dealers up to the full applicable Class A sales
charge during periods and for transactions specified in such notice and such
re-allowances may be based upon attainment of minimum sales levels. During
periods when 90% or more of the sales charge is re-allowed, such dealers may be
deemed to be underwriters as that term is defined in the 1933 Act.
DIDI may at its discretion compensate investment dealers or other financial
services firms in connection with the sale of Class A shares of a fund in
accordance with the Large Order NAV Purchase Privilege and one of the
compensation schedules up to the following amounts:
COMPENSATION SCHEDULE #1: COMPENSATION SCHEDULE #2:
RETAIL SALES AND DWS INVESTMENTS FLEX PLAN/(1)/ DWS INVESTMENTS RETIREMENT PLAN/(2)/
AS A PERCENTAGE OF AS A PERCENTAGE OF
AMOUNT OF SHARES SOLD NET ASSET VALUE AMOUNT OF SHARES SOLD NET ASSET VALUE
$250,000 to $2,999,999 0.75%/(3)/
$250,000 to $49,999,999 0.50%/(4)/ Over $3 million 0.00%-0.50%
$1 million to $2,999,999 0.75%/(5)/, 0.85%/(6)/ - -
1.00%/(7)/
$3 million to $49,999,999 0.50%/(8)/ Over $3 million 0.00%-0.50%
$50 million and greater 0.25%/(8)/ - -
/(1)/ For purposes of determining the appropriate commission percentage to be
applied to a particular sale under the foregoing schedule, DIDI will
consider the cumulative amount invested by the purchaser in a fund and
other funds including purchases pursuant to the "Combined Purchases,"
"Letter of Intent" and "Cumulative Discount" features referred to below.
/(2)/ Compensation Schedules 2 applies to employer sponsored employee benefit
plans using the OmniPlus subaccount record keeping system made available
through ADP, Inc. under an alliance with DIDI and its affiliates.
/(3)/ Applicable to the following funds: DWS Alternative Asset Allocation Fund,
DWS Disciplined Market Neutral Fund, DWS Global Thematic Fund, DWS Large
Cap Value Fund and DWS Select Alternative Asset Allocation Fund.
/(4)/ Applicable to the following funds: DWS California Tax-Free Income Fund,
DWS Floating Rate Plus Fund, DWS GNMA Fund, DWS Intermediate Tax/AMT Free
Fund, DWS Managed Municipal Bond Fund, DWS Massachusetts
II-68
Tax-Free Income Fund, DWS New York Tax-Free Income Fund, DWS Short Duration
Plus Fund, DWS Short-Term Municipal Bond Fund, DWS Strategic Government
Securities Fund, DWS Strategic High Yield Tax-Free Fund and DWS Strategic
Income Fund.
/(5)/ Applicable to DWS Short Duration Fund.
/(6)/ Applicable to income funds except those noted in footnotes (4) and (5),
and DWS U.S. Bond Index Fund.
/(7)/ Applicable to all equity funds except those in footnote (3).
/(8)/ Applicable to all income and equity funds except DWS U.S. Bond Index
Fund.
As indicated under "Purchases" under Part II "Purchase and Redemption of
Shares," Class A shares may be sold at net asset value without a sales charge
to certain professionals who assist in the promotion of DWS mutual funds
pursuant to personal services contracts with DIDI, for themselves or members of
their families. DIDI in its discretion may compensate financial services firms
for sales of Class A shares under this privilege at a commission rate of 0.50%
of the amount of Class A shares purchased.
COMPENSATION FOR CLASS B AND CLASS C SHARES. DIDI compensates firms for sales
of Class B shares at the time of sale at a commission rate of up to 3.75% of
the amount of Class B shares purchased. DIDI is compensated by a fund for
services as distributor and principal underwriter for Class B shares. DIDI
currently pays firms for sales of Class C shares a distribution fee, payable
quarterly, at an annual rate of 0.75% of net assets attributable to Class C
shares maintained and serviced by the firm. Except as provided below, for sales
of Class C shares, DIDI advances to firms the first year distribution fee at a
rate of 0.75% of the purchase price of such shares, and, for periods after the
first year. For sales of Class C shares to employer sponsored employee benefit
plans using the OmniPlus subaccount record keeping system made available
through ADP, Inc. under an alliance with DIDI and its affiliates, DIDI does not
advance the first year distribution fee and for periods after the date of sale,
DIDI currently pays firms a distribution fee, payable quarterly, at an annual
rate of 0.75% based on net assets as of the last business day of the month
attributable to Class C shares maintained and serviced by the firm. DIDI is
compensated by a fund for services as distributor and principal underwriter for
Class C shares.
COMPENSATION FOR CLASS R SHARES. For sales of Class R shares, DIDI currently
pays firms a distribution fee, payable quarterly, at an annual rate of 0.25%
based on net assets attributable to Class R shares maintained and serviced by
the firm.
SERVICE FEES FOR CLASS A, B, C AND R SHARES: With respect to Class A and Class
R Shares of a fund, DIDI pays each firm a service fee, payable quarterly, at an
annual rate of up to 0.25% of the net assets in fund accounts that it maintains
and services attributable to Class A and Class R Shares of a fund, commencing
with the month after investment. With respect to Class B and Class C Shares of
a fund, DIDI currently advances to firms the first-year service fee at a rate
of up to 0.25% of the purchase price of such shares. DIDI does not advance the
first year service fee to firms for sales of Class C shares to
employer-sponsored employee benefit plans using the OmniPlus subaccount record
keeping system made available through ADP, Inc. under an alliance with DIDI and
its affiliates. For periods after the first year, DIDI currently intends to pay
firms a service fee at a rate of up to 0.25% (calculated monthly and paid
quarterly) of the net assets attributable to Class B and Class C shares of a
fund maintained and serviced by the firm (see Retail Funds: Class A, B, C and R
under Part II: Distribution and Service Agreements and Plans).
RETAIL FUNDS: INSTITUTIONAL AND CLASS S SHARES
COMPENSATION FOR INSTITUTIONAL AND CLASS S SHARES. There are no sales charges
for Institutional and Class S shares of the fund.
MONEY MARKET FUNDS (EXCEPT DWS CASH INVESTMENT TRUST CLASS A, B AND C SHARES)
II-69
DWS MONEY MARKET FUND: For DWS Money Market Fund, a series of DWS Money Market
Prime Series, DIDI may in its discretion pay compensation, in amounts not to
exceed 0.50% of net asset value, to firms in connection with the sales of fund
shares to employee benefit plans in excess of $3 million using the OmniPlus
subaccount record keeping system maintained by ADP, Inc. for DWS Retirement
Plans under an alliance with DIDI and its affiliates.
SERVICE SHARES-CASH ACCOUNT TRUST: For the Service Shares classes of the Money
Market Portfolio, the Government & Agency Securities Portfolio and the
Tax-Exempt Portfolio of Cash Account Trust, DIDI normally pays firms a fee for
distribution and administrative services, payable monthly, at a maximum annual
rate of up to 0.60% of average daily net assets of Service Shares held in
accounts that they maintain and service.
PREMIER SHARES-TAX-EXEMPT CALIFORNIA MONEY MARKET FUND: For the Premier Shares
class of the Tax-Exempt California Money Market Fund, DIDI normally pays firms
a fee for distribution and administrative services, payable monthly, at a
maximum annual rate of up to 0.33% of average daily net assets of Premier
Shares held in accounts that they maintain and service.
TAX-EXEMPT NEW YORK MONEY MARKET FUND: For Tax-Exempt New York Money Market
Fund shares, a class of NY Tax Free Money Fund, a series of DWS Advisor Funds,
DIDI normally pays firms a fee for distribution and administrative services,
payable monthly, at a maximum annual rate of up to 0.50% of average daily net
assets of Tax-Exempt New York Money Market Fund shares held in accounts that
they maintain and service.
PREMIUM RESERVE MONEY MARKET SHARES-CASH ACCOUNT TRUST: For the Premium Reserve
Money Market Shares class of the Money Market Portfolio of Cash Account Trust,
DIDI normally pays firms a fee for administrative services, payable monthly, at
a maximum annual rate of up to 0.25% of average daily net assets of Premium
Reserve Money Market Shares held in accounts that they maintain and service.
INSTITUTIONAL MONEY MARKET SHARES-CASH ACCOUNT TRUST: For the Institutional
Money Market Shares class of the Money Market Portfolio of Cash Account Trust,
DIDI normally pays firms a fee for administrative services, payable monthly, at
a maximum annual rate of up to 0.15% (currently, limited to 0.02%) of average
daily net assets of Institutional Money Market Shares held in accounts that
they maintain and service.
PREMIER MONEY MARKET SHARES-CASH ACCOUNT TRUST AND INVESTORS CASH TRUST: For
the Premier Money Market Shares classes of the Money Market Portfolio, the
Government & Agency Securities Portfolio and the Tax-Exempt Portfolio of Cash
Account Trust and of the Treasury Portfolio of Investors Cash Trust, DIDI
normally pays firms a fee for distribution services, payable monthly, at a
maximum annual rate of up to 0.25% of average daily net assets of Premier Money
Market Shares held in accounts that they maintain and service and DIDI normally
pays firms a fee for administrative services, payable monthly, at a maximum
annual rate of up to 0.25% of average daily net assets of Premier Money Market
Shares held in accounts that they maintain and service.
DAVIDSON CASH EQUIVALENT SHARES-CASH ACCOUNT TRUST: For the Davidson Cash
Equivalent Shares and the Davidson Cash Equivalent Plus Shares classes of the
Money Market Portfolio, the Government & Agency Securities Portfolio and the
Tax-Exempt Portfolio of Cash Account Trust, DIDI normally pays the sole
sub-distributor for the classes, D.A. Davidson & Co., a fee for distribution
services, payable monthly, at a maximum annual rate of up to 0.30% of average
daily net assets of those accounts in the Davidson Cash Equivalent Shares that
it maintains and services and 0.25% of average daily net assets in the case of
those accounts in the Davidson Cash Equivalent Plus Shares that it maintains
and services and DIDI normally pays the sole sub-distributor a fee for
administrative services, payable monthly, at a maximum annual rate of up to
0.25% of average daily net assets of those accounts in the Davidson Cash
Equivalent Shares that it maintains and services and 0.20% of average daily net
assets in the case of those accounts in the Davidson Cash Equivalent Plus
Shares that it maintains and services. The Davidson Cash Equivalent Plus Shares
class is limited to the Money Market Portfolio and the Government & Agency
Securities Portfolio.
CAPITAL ASSETS FUNDS-CASH ACCOUNT TRUST: For the Capital Assets Funds Shares
and the Capital Assets Funds Preferred Shares classes of the Money Market
Portfolio, the Government & Agency Securities Portfolio and the Tax-Exempt
Portfolio of Cash Account Trust, DIDI normally pays the sole sub-distributor
for the classes, RIDGE Clearing and Outsourcing Services, Inc., a fee for
distribution services, payable monthly, at a maximum annual rate of up to 0.33%
of average
II-70
daily net assets of those accounts in the Capital Assets Funds Shares that it
maintains and services and 0.20% of average daily net assets in the case of
those accounts in the Capital Assets Funds Preferred Shares that it maintains
and services and DIDI normally pays the sole sub-distributor a fee for
administrative services, payable monthly, at a maximum annual rate of up to
0.25% of average daily net assets of those accounts in the Capital Assets Funds
Shares that it maintains and services and 0.10% of average daily net assets in
the case of those accounts in the Capital Assets Funds Preferred Shares that it
maintains and services. The Capital Assets Funds Preferred Shares class is
limited to the Money Market Portfolio.
MANAGED SHARES-CASH ACCOUNT TRUST: For the Government Cash Managed Shares class
of the Government & Agency Securities Portfolio of Cash Account Trust and the
Tax-Exempt Cash Managed Shares class of the Tax-Exempt Portfolio of Cash
Account Trust, DIDI normally pays firms a fee for administrative services,
payable monthly, at a maximum annual rate of up to 0.15% of average daily net
assets of Managed Shares held in accounts that they maintain and service.
INSTITUTIONAL SHARES-INVESTORS CASH TRUST: For the Institutional Shares class
of the Treasury Portfolio of Investors Cash Trust, DIDI normally pays firms a
fee for administrative services, payable monthly, at a maximum annual rate of
up to 0.05% of average daily net assets of Institutional Shares held in
accounts that they maintain and service.
TAX-FREE INVESTMENT CLASS-CASH ACCOUNT TRUST AND INVESTMENT CLASS-INVESTORS
CASH TRUST: For the Tax-Free Investment Class of the Tax-Exempt Portfolio of
Cash Account Trust and the Investment Class of the Treasury Portfolio of
Investors Cash Trust (collectively, "Investment Class"), DIDI normally pays
firms a fee for distribution services, payable monthly, at a maximum annual
rate of up to 0.25% of average daily net assets of shares of the Investment
Class held in accounts that they maintain and service and DIDI normally pays
firms a fee for administrative services, payable monthly, at a maximum annual
rate of up to 0.07% of average daily net assets of shares of the Investment
Class held in accounts that they maintain and service.
CASH RESERVE PRIME SHARES-PRIME SERIES: For the Cash Reserve Prime Shares class
of the Prime Series of Cash Reserve Fund Inc., DIDI normally pays firms a fee
for distribution services, payable monthly, at a maximum annual rate of up to
0.25% of average daily net assets of shares of the Cash Reserve Prime Shares
held in accounts that they maintain and service and DIDI normally pays firms a
fee for administrative services, payable monthly, at a maximum annual rate of
up to 0.07% of average daily net assets of shares of the Cash Reserve Prime
Shares held in accounts that they maintain and service.
SHAREHOLDER SERVICES PLAN FOR CASH MANAGEMENT FUND - INSTITUTIONAL, CASH
RESERVES FUND - INSTITUTIONAL, NY TAX FREE MONEY FUND INVESTMENT CLASS AND
TAX-FREE MONEY FUND INVESTMENT PREMIER SHARES: Cash Management Fund -
Institutional and Cash Reserves Fund - Institutional, each a series of DWS
Institutional Funds, and NY Tax Free Money Fund Investment Class and Tax-Free
Money Fund Investment Premier Shares, each a series and class of DWS Adviser
Funds, pursuant to a shareholder service plan, may pay financial services firms
a service fee at an annual rate of up to 0.25 of 1% of the average daily net
assets of shares of the applicable fund and class held in accounts that the
firm maintains and services.
DWS VARIABLE SERIES I, DWS VARIABLE SERIES II AND DWS INVESTMENTS VIT FUNDS:
For each fund of DWS Variable Series I, DWS Variable Series II and DWS
Investments VIT Funds that has authorized the issuance of Class B shares
(including Class B-2 shares of DWS Equity 500 Index VIP), each fund has adopted
a distribution plan under Rule 12b-1 (Plan) that provides for fees for
distribution and shareholder servicing activities payable through DIDI to
participating insurance companies as an expense of the Class B shares or Class
B-2 shares in an amount of up to 0.25% of the average daily net assets of Class
B shares or Class B-2 shares held by the insurance company.
II-71
PART II: APPENDIX II-E - FIRMS WITH WHICH DEUTSCHE ASSET MANAGEMENT HAS REVENUE
SHARING ARRANGEMENTS
CHANNEL: BROKER-DEALERS AND FINANCIAL ADVISORS
AIG Advisors Group
Ameriprise
Capital Analyst, Incorporated
Cetera Financial Group
Commonwealth Equity Services, LLP (dba Commonwealth Financial Network)
Deutsche Bank Group
Ensemble Financial Services
First Allied Securities
HD Vest Investment Securities, Inc.
ING Advisors Network
John Hancock Distributors LLC
LPL Financial
Meridien Financial Group
Merrill Lynch, Pierce, Fenner & Smith Inc.
Morgan Stanley Smith Barney (formerly Citigroup Global Markets, Inc.)
Morgan Stanley Smith Barney (formerly Morgan Stanley & Co.)
Oppenheimer & Co., Inc.
PlanMember Services
Prime Capital Inc.
Raymond James & Associates
Raymond James Financial Services
RBC Wealth Management
Securities America, Inc.
UBS Financial Services
Wells Fargo Advisors, LLC
Wells Fargo Investments, LLC
CHANNEL: CASH PRODUCT PLATFORM
Allegheny Investments LTD
Bank of America
Bank of New York (Hare & Co.)
Barclays Capital Inc.
BMO Capital Markets
Brown Brothers Harriman
Brown Investment Advisory & Trust Company
Cadaret Grant & Co.
Chicago Mercantile Exchange
Citibank, N.A.
D.A. Davidson & Company
Deutsche Bank Group
Fiduciary Trust Co. - International
First Southwest Company
J.P. Morgan Clearing Corp.
Legent Clearing LLC
Lincoln Investment Planning
LPL Financial
Mesirow Financial, Inc.
Penson Financial Services
Pershing Choice Platform
II-72
ProFunds Distributors, Inc.
Ridge Clearing & Outsourcing Solutions
Romano Brothers and Company
SAMCO Capital Markets
Smith Moore & Company
State Street Global Markets
Sungard Institutional Brokerage Inc.
Treasury Curve LLC
Union Bank, NA
US Bancorp
William Blair & Company
CHANNEL: THIRD PARTY INSURANCE PLATFORMS
Allstate Life Insurance Company of New York
Ameritas Life Insurance Group
Annuity Investors Life Insurance Company
Columbus Life Insurance Company
Commonwealth Annuity and Life Insurance Company
Companion Life Insurance Company
Connecticut General Life Insurance Company
EquiTrust Life Insurance Company
Farm Bureau Life Insurance Company
Farmers New World Life Insurance Company
Fidelity Security Life Insurance Company
First Allmerica Financial Life Insurance Company
First Great West Life and Annuity Company
Genworth Life Insurance Company of New York
Genworth Life and Annuity Insurance Company
Great West Life and Annuity Insurance Company
Hartford Life Insurance Company
Integrity Life Insurance Company
John Hancock Life Insurance companies
Kemper Investors Life Insurance Company
Lincoln Benefit Life Insurance Company
Lincoln Life & Annuity Company of New York
Lincoln National Life Insurance Company
Massachusetts Mutual Life Insurance Group
MetLife Group
Minnesota Life Insurance Company
National Life Insurance Company
National Integrity Life Insurance Company
Nationwide Group
New York Life Insurance and Annuity Corporation
Phoenix Life Insurance Company
Protective Life Insurance
Prudential Insurance Company of America
Sun Life Group
Symetra Life Insurance Company
Transamerica Life Insurance Company
Union Central Life Insurance Company
United of Omaha Life Insurance Company
United Investors Life Insurance Company
Western Southern Life Assurance Company
II-73
Any additions, modifications or deletions to the financial advisors identified
above that have occurred since the date hereof are not reflected.
II-74
PART II: APPENDIX II-F - CLASS A SALES CHARGE SCHEDULE
CLASS A PURCHASES. The public offering price of Class A shares for purchasers
choosing the initial sales charge alternative is the net asset value plus a
sales charge, as set forth below.
INTERNATIONAL/GLOBAL FUNDS: Climate Change, Emerging Markets Equity, Europe
Equity, Global Small Cap Growth, Latin America Equity, International,
Diversified International Equity, International Value Opportunities, RREEF
Global Infrastructure, RREEF Global Real Estate; GROWTH FUNDS: Blue Chip,
Capital Growth, Communications, Gold & Precious Metals, Health Care, Large
Company Growth, Mid Cap Growth, Small Cap Growth, Technology; VALUE FUNDS:
Enhanced Commodity Strategy, Disciplined Long/Short Value, Strategic Value,
Dreman Mid Cap Value, Dreman Small Cap Value, Growth & Income, RREEF Real
Estate Securities, Small Cap Core, Small Cap Value; MULTICATEGORY/ASSET
ALLOCATION FUNDS: Balanced, LifeCompass Retirement, LifeCompass 2015,
LifeCompass 2020, LifeCompass 2030, LifeCompass 2040, LifeCompass Protect 2017,
Lifecycle Long Range; INDEX-RELATED FUNDS: S&P 500 Plus:
SALES CHARGE
AS A PERCENTAGE AS A PERCENTAGE OF ALLOWED TO DEALERS AS A
AMOUNT OF PURCHASE OF OFFERING PRICE* NET ASSET VALUE** PERCENTAGE OF OFFERING PRICE
Less than $50,000 5.75% 6.10% 5.20%
$50,000 but less than $100,000 4.50% 4.71% 4.00%
$100,000 but less than $250,000 3.50% 3.63% 3.00%
$250,000 but less than $500,000 2.60% 2.67% 2.25%
$500,000 but less than $1 million 2.00% 2.04% 1.75%
$1 million and over .00*** .00*** .00****
INTERNATIONAL/GLOBAL FUNDS: Global Thematic; VALUE FUNDS: Disciplined Market
Neutral and Large Cap Value; MULTICATEGORY/
ASSET ALLOCATION FUNDS: Alternative Asset Allocation Plus and Select
Alternative Asset Allocation:
SALES CHARGE
AS A PERCENTAGE AS A PERCENTAGE OF ALLOWED TO DEALERS AS A
AMOUNT OF PURCHASE OF OFFERING PRICE* NET ASSET VALUE** PERCENTAGE OF OFFERING PRICE
Less than $50,000 5.75% 6.10% 5.20%
$50,000 but less than $100,000 4.50% 4.71% 4.00%
$100,000 but less than $250,000 3.50% 3.63% 3.00%
$250,000 and over .00*** .00*** .00****
INTERNATIONAL/GLOBAL FUNDS: Emerging Markets Fixed Income Fund, Global Bond;
INCOME FUNDS: Core Fixed Income, High Income, High Income Plus, Core Plus
Income; INDEX RELATED FUNDS: S&P 500 Index:
SALES CHARGE
AS A PERCENTAGE AS A PERCENTAGE OF ALLOWED TO DEALERS AS A
AMOUNT OF PURCHASE OF OFFERING PRICE* NET ASSET VALUE** PERCENTAGE OF OFFERING PRICE
Less than $100,000 4.50% 4.71% 4.00%
$100,000 but less than $250,000 3.50% 3.63% 3.00%
$250,000 but less than $500,000 2.60% 2.67% 2.25%
$500,000 but less than $1 million 2.00% 2.04% 1.75%
$1 million and over 0.00*** 0.00*** 0.00****
II-75
INCOME FUNDS: Global Inflation Plus, Short Duration and US Bond Index
SALES CHARGE
AS A PERCENTAGE AS A PERCENTAGE OF ALLOWED TO DEALERS AS A
AMOUNT OF PURCHASE OF OFFERING PRICE* NET ASSET VALUE** PERCENTAGE OF OFFERING PRICE
Less than $100,000 2.75% 2.83% 2.25%
$100,000 but less than $250,000 2.50% 2.56% 2.00%
$250,000 but less than $500,000 2.00% 2.04% 1.75%
$500,000 but less than $1 million 1.50% 1.52% 1.25%
$1 million and over 0.00*** 0.00*** 0.00****
TAX-FREE INCOME FUNDS: California Tax Free Income, New York Tax Free Income,
Massachusetts Tax Free Income, Strategic High Yield Tax-Free, Managed Municipal
Bond and Intermediate Tax/AMT Free. INCOME FUNDS: Floating Rate Plus, GNMA,
Short Duration Plus, Strategic Income and Strategic Government Securities.
SALES CHARGE
AS A PERCENTAGE AS A PERCENTAGE OF ALLOWED TO DEALERS AS A
AMOUNT OF PURCHASE OF OFFERING PRICE* NET ASSET VALUE** PERCENTAGE OF OFFERING PRICE
Less than $100,000 2.75% 2.83% 2.25%
$100,000 but less than $250,000 2.50% 2.56% 2.00%
$250,000 and over 0.00*** 0.00*** 0.00***
MULTICATEGORY ASSET ALLOCATION FUNDS: Target 2010, Target 2011, Target 2012,
Target 2013, Target 2014. These funds do not have a share class but are similar
in structure to Class A shares.
SALES CHARGE
AS A PERCENTAGE AS A PERCENTAGE OF ALLOWED TO DEALERS AS A
AMOUNT OF PURCHASE OF OFFERING PRICE NET ASSET VALUE PERCENTAGE OF OFFERING PRICE
Less than $100,000 5.00% 5.26% 4.50%
$100,000 but less than $250,000 4.00% 4.17% 3.60%
$250,000 but less than $500,000 3.00% 3.09% 2.70%
$500,000 but less than $1 million 2.00% 2.04% 1.80%
$1 million and over 0.00 0.00 0.00
TAX FREE INCOME FUNDS: Short Term Municipal Bond
SALES CHARGE
AS A PERCENTAGE AS A PERCENTAGE OF ALLOWED TO DEALERS AS A
AMOUNT OF PURCHASE OF OFFERING PRICE* NET ASSET VALUE** PERCENTAGE OF OFFERING PRICE
Less than $100,000 2.00% 2.04% 1.50%
$100,000 but less than $250,000 1.75% 1.78% 1.25%
$250,000 and over 0.00*** 0.00*** 0.00****
* The offering price includes the sales charge.
** Rounded to the nearest one-hundredth percent.
*** Redemption of shares may be subject to a contingent deferred sales
charge.
**** Commission is payable by DIDI.
II-76
PART II: APPENDIX II-G - INVESTMENT PRACTICES AND TECHNIQUES
ADJUSTABLE RATE SECURITIES. The interest rates paid on the adjustable rate
securities in which a fund invests generally are readjusted at periodic
intervals, usually by reference to a predetermined interest rate index.
Adjustable rate securities include US Government securities and securities of
other issuers. Some adjustable rate securities are backed by pools of mortgage
loans. There are three main categories of interest rate indices: those based on
US Treasury securities, those derived from a calculated measure such as a cost
of funds index and those based on a moving average of mortgage rates. Commonly
used indices include the one-year, three-year and five-year constant maturity
Treasury rates, the three-month Treasury bill rate, the 180-day Treasury bill
rate, rates on longer-term Treasury securities, the 11th District Federal Home
Loan Bank Cost of Funds, the National Median Cost of Funds, the one-month,
three-month, six-month or one-year London Interbank Offered Rate (LIBOR), the
prime rate of a specific bank or commercial paper rates. As with fixed-rates
securities, changes in market interest rates and changes in the issuer's
creditworthiness may affect the value of adjustable rate securities.
Some indices, such as the one-year constant maturity Treasury rate, closely
mirror changes in market interest rate levels. Others, such as the 11th
District Home Loan Bank Cost of Funds index (Cost of Funds Index), tend to lag
behind changes in market rate levels and tend to be somewhat less volatile. To
the extent that the Cost of Funds index may reflect interest changes on a more
delayed basis than other indices, in a period of rising interest rates, any
increase may produce a higher yield later than would be produced by such other
indices, and in a period of declining interest rates, the Cost of Funds index
may remain higher for a longer period of time than other market interest rates,
which may result in a higher level of principal prepayments on adjustable rate
securities which adjust in accordance with the Cost of Funds index than
adjustable rate securities which adjust in accordance with other indices. In
addition, dislocations in the member institutions of the 11th District Federal
Home Loan Bank in recent years have caused and may continue to cause the Cost
of Funds index to change for reasons unrelated to changes in general interest
rate levels. Furthermore, any movement in the Cost of Funds index as compared
to other indices based upon specific interest rates may be affected by changes
in the method used to calculate the Cost of Funds index.
If prepayments of principal are made on the securities during periods of rising
interest rates, a fund generally will be able to reinvest such amounts in
securities with a higher current rate of return. However, a fund will not
benefit from increases in interest rates to the extent that interest rates rise
to the point where they cause the current coupon of adjustable rate securities
held as investments by a fund to exceed the maximum allowable annual or
lifetime reset limits (cap rates) for a particular adjustable rate security.
Also, a fund's net asset value could vary to the extent that current yields on
adjustable rate securities are different than market yields during interim
periods between coupon reset dates.
During periods of declining interest rates, the coupon rates may readjust
downward, resulting in lower yields to a fund. Further, because of this
feature, the value of adjustable rate securities is unlikely to rise during
periods of declining interest rates to the same extent as fixed-rate
instruments. Interest rate declines may result in accelerated prepayment of
adjustable rate securities, and the proceeds from such prepayments must be
reinvested at lower prevailing interest rates.
ADVANCE REFUNDED BONDS. A fund may purchase municipal securities that are
subsequently refunded by the issuance and delivery of a new issue of bonds
prior to the date on which the outstanding issue of bonds can be redeemed or
paid. The proceeds from the new issue of bonds are typically placed in an
escrow fund consisting of US Government obligations that are used to pay the
interest, principal and call premium on the issue being refunded. A fund may
also purchase municipal securities that have been refunded prior to purchase.
ASSET-BACKED SECURITIES. A fund may invest in securities generally referred to
as asset-backed securities. Asset-backed securities are securities that
directly or indirectly represent interests in, or are secured by and payable
from, an underlying pool of assets such as (but not limited to) first lien
mortgages, motor vehicle installment sale contracts, other installment sale
contracts, home equity loans, leases of various types of real and personal
property, and receivables from revolving credit (i.e., credit card) agreements
and trade receivables. Such assets are securitized through the use of trusts
and special purpose corporations. Asset-backed securities may provide periodic
payments that consist of interest and/or principal payments. Consequently, the
life of an asset-backed security varies with the prepayment and loss experience
II-77
of the underlying assets. Payments of principal and interest may be dependent
upon the cash flow generated by the underlying assets backing the securities
and, in certain cases, may be supported by some form of credit enhancement (for
more information, see Credit Enhancement). The degree of credit enhancement
provided for each issue is generally based on historical information respecting
the level of credit risk associated with the underlying assets. Delinquency or
loss in excess of that anticipated or failure of the credit enhancement could
adversely affect the return on an investment in such a security. The value of
the securities also may change because of changes in interest rates or changes
in the market's perception of the creditworthiness of the servicing agent for
the loan pool, the originator of the loans or the financial institution
providing the credit enhancement. Additionally, since the deterioration of
worldwide economic and liquidity conditions that became acute in 2008,
asset-backed securities have been subject to greater liquidity risk.
Asset-backed securities are ultimately dependent upon payment of loans and
receivables by individuals, businesses and other borrowers, and a fund
generally has no recourse against the entity that originated the loans.
Because asset-backed securities may not have the benefit of a security interest
in the underlying assets, asset-backed securities present certain additional
risks that are not present with mortgage-backed securities. For example, credit
card receivables are generally unsecured, and the debtors are entitled to the
protection of a number of state and federal consumer credit laws, many of which
give such debtors the right to avoid payment of certain amounts owed on the
credit cards, thereby reducing the balance due. Furthermore, most issuers of
automobile receivables permit the servicer to retain possession of the
underlying obligations. If the servicer were to sell these obligations to
another party, there is a risk that the purchaser would acquire an interest
superior to that of the holders of the related automobile receivables. In
addition, because of the large number of vehicles involved in a typical
issuance and technical requirements under state laws, the trustee for the
holders of the automobile receivables may not have a proper security interest
in all of the obligations backing such receivables. Therefore, there is the
possibility that recoveries on repossessed collateral may not, in some cases,
be available to support payments on these securities.
The yield characteristics of the asset-backed securities in which a fund may
invest differ from those of traditional debt securities. Among the major
differences are that interest and principal payments are made more frequently
on asset-backed securities (usually monthly) and that principal may be prepaid
at any time because the underlying assets generally may be prepaid at any time.
As a result, if a fund purchases these securities at a premium, a prepayment
rate that is faster than expected will reduce their yield, while a prepayment
rate that is slower than expected will have the opposite effect of increasing
yield. Conversely, if a fund purchases these securities at a discount, faster
than expected prepayments will increase, while slower than expected prepayments
will reduce, the yield on these securities. Because prepayment of principal
generally occurs during a period of declining interest rates, a fund may
generally have to reinvest the proceeds of such prepayments at lower interest
rates. Therefore, asset-backed securities may have less potential for capital
appreciation in periods of falling interest rates than other income-bearing
securities of comparable maturity.
Other Asset-Backed Securities. The securitization techniques used to develop
mortgage-backed securities are now being applied to a broad range of assets.
Through the use of trusts and special purpose corporations, various types of
assets, including automobile loans, computer leases and credit card
receivables, are being securitized in pass-through structures similar to
mortgage pass-through structures or in a structure similar to the CMO
structure. In general, the collateral supporting these securities is of shorter
maturity than mortgage loans and is less likely to experience substantial
prepayments with interest rate fluctuations.
Several types of asset-backed securities have already been offered to
investors, including Certificates of Automobile Receivables/SM/ (CARS/SM/).
CARS/SM/ represent undivided fractional interests in a trust whose assets
consist of a pool of motor vehicle retail installment sales contracts and
security interests in the vehicles securing the contracts. Payments of
principal and interest on CARS/SM/ are passed through monthly to certificate
holders, and are guaranteed up to certain amounts and for a certain time period
by a letter of credit issued by a financial institution unaffiliated with the
trustee or originator of the trust. An investor's return on CARS/SM/ may be
affected by early prepayment of principal on the underlying vehicle sales
contracts. If the letter of credit is exhausted, the trust may be prevented
from realizing the full amount due on a sales contract because of state law
requirements and restrictions relating to foreclosure sales of vehicles and the
obtaining of deficiency judgments following such sales or because of
depreciation, damage or loss of a vehicle, the application of federal and state
bankruptcy and insolvency laws, or other factors. As a result, certificate
holders may experience delays in payments or losses if the letter of credit is
exhausted.
II-78
A fund may also invest in residual interests in asset-backed securities. In the
case of asset-backed securities issued in a pass-through structure, the cash
flow generated by the underlying assets is applied to make required payments on
the securities and to pay related administrative expenses. The residual in an
asset-backed security pass-through structure represents the interest in any
excess cash flow remaining after making the foregoing payments. The amount of
residual cash flow resulting from a particular issue of asset-backed securities
will depend on, among other things, the characteristics of the underlying
assets, the coupon rates on the securities, prevailing interest rates, the
amount of administrative expenses and the actual prepayment experience on the
underlying assets. Asset-backed security residuals not registered under the
Securities Act may be subject to certain restrictions on transferability. In
addition, there may be no liquid market for such securities.
The availability of asset-backed securities may be affected by legislative or
regulatory developments. It is possible that such developments may require a
fund to dispose of any then-existing holdings of such securities.
ASSET-INDEXED SECURITIES. A fund may purchase asset-indexed securities which
are debt securities usually issued by companies in precious metals related
businesses such as mining, the principal amount, redemption terms, or interest
rates of which are related to the market price of a specified precious metal.
Market prices of asset-indexed securities will relate primarily to changes in
the market prices of the precious metals to which the securities are indexed
rather than to changes in market rates of interest. However, there may not be a
perfect correlation between the price movements of the asset-indexed securities
and the underlying precious metals. Asset-indexed securities typically bear
interest or pay dividends at below market rates (and in certain cases at
nominal rates). The purchase of asset-indexed securities also exposes a fund to
the credit risk of the issuer of the asset-indexed securities.
ASSET SEGREGATION. Certain investment transactions expose a fund to an
obligation to make future payments to third parties. Examples of these types of
transactions, include, but are not limited to, reverse repurchase agreements,
short sales, dollar rolls, when-issued, delayed-delivery or forward commitment
transactions and certain derivatives such as swaps, futures, forwards, and
options. To the extent that a fund engages in such transactions, a fund will
(to the extent required by applicable law) either (1) segregate cash or liquid
assets in the prescribed amount or (2) otherwise "cover" its future obligations
under the transaction, such as by holding an offsetting investment. If a fund
segregates sufficient cash or other liquid assets or otherwise "covers" its
obligations under such transactions, a fund will not consider the transactions
to be borrowings for purposes of its investment restrictions or "senior
securities" under the 1940 Act, and therefore, such transactions will not be
subject to the 300% asset coverage requirement under the 1940 Act otherwise
applicable to borrowings by a fund.
In some cases (e.g., with respect to futures and forwards that are
contractually required to "cash-settle"), a fund will segregate cash or other
liquid assets with respect to the amount of the daily net (marked-to-market)
obligation arising from the transaction, rather than the notional amount of the
underlying contract. By segregating assets in an amount equal to the net
obligation rather than the notional amount, a fund will have the ability to
employ leverage to a greater extent than if it set aside cash or other liquid
assets equal to the notional amount of the contract, which may increase the
risk associated with such transactions.
A fund may utilize methods of segregating assets or otherwise "covering"
transactions that are currently or in the future permitted under the 1940 Act,
the rules and regulations thereunder, or orders issued by the Securities and
Exchange Commission (SEC) thereunder. For these purposes, interpretations and
guidance provided by the SEC staff may be taken into account when deemed
appropriate by a fund.
Assets used as segregation or "cover" cannot be sold while the position in the
corresponding transaction is open, unless they are replaced with other
appropriate assets. As a result, the commitment of a large portion of a fund's
assets for segregation and "cover" purposes could impede portfolio management
or a fund's ability to meet redemption requests or other current obligations.
Segregating assets or otherwise "covering" for these purposes does not
necessarily limit the percentage of the assets of a fund that may be at risk
with respect to certain derivative transactions.
II-79
AUCTION RATE SECURITIES. Auction rate securities in which certain municipal
funds may invest consist of auction rate municipal securities and auction rate
preferred securities issued by closed-end investment companies that invest
primarily in municipal securities. Provided that the auction mechanism is
successful, auction rate securities usually normally permit the holder to sell
the securities in an auction at par value at specified intervals. The dividend
is reset by a "Dutch" auction in which bids are made by broker-dealers and
other institutions for a certain amount of securities at a specified minimum
yield. The dividend rate set by the auction is the lowest interest or dividend
rate that covers all securities offered for sale. While this process is
designed to permit auction rate securities to be traded at par value, there is
the risk that an auction will fail due to insufficient demand for the
securities. If an auction fails, the dividend rate of the securities rate
adjusts to a maximum rate, specified in the issuer's offering documents and, in
the case of closed-end funds, relevant charter documents. Security holders that
submit sell orders in a failed auction may not be able to sell any or all of
the shares for which they have submitted sell orders. Security holders may sell
their shares at the next scheduled auction, subject to the same risk that the
subsequent auction will not attract sufficient demand for a successful auction
to occur. Broker-dealers may also try to facilitate secondary trading in the
auction rate securities, although such secondary trading may be limited and may
only be available for shareholders willing to sell at a discount. Since
February 2008, many municipal issuers and closed-end funds have experienced,
and continue to experience, failed auctions of their auction rate securities.
Repeated auction failures have significantly affected the liquidity of auction
rate securities, shareholders of such securities have generally continued to
receive dividends at the above-mentioned maximum rate. There is no assurance
that auctions will resume or that any market will develop for auction rate
securities. Valuations of such securities is highly speculative, however,
dividends on auction rate preferred securities issued by a closed-end fund may
be designated as exempt from federal income tax to the extent they are
attributable to tax-exempt interest income earned by a fund on the securities
in its portfolio and distributed to holders of the preferred securities,
provided that the preferred securities are treated as equity securities for
federal income tax purposes, and the closed-end fund complies with certain
requirements under the Code. A fund's investments in auction rate preferred
securities of closed-end funds are subject to limitations on investments in
other US registered investment companies, which limitations are prescribed by
the 1940 Act.
BANK LOANS. Bank loans are typically senior debt obligations of borrowers
(issuers) and, as such, are considered to hold a senior position in the capital
structure of the borrower. These may include loans that hold the most senior
position, that hold an equal ranking with other senior debt, or loans that are,
in the judgment of the Advisor, in the category of senior debt of the borrower.
This capital structure position generally gives the holders of these loans a
priority claim on some or all of the borrower's assets in the event of a
default. In most cases, these loans are either partially or fully
collateralized by the assets of a corporation, partnership, limited liability
company or other business entity, or by cash flow that the Advisor believes at
the time of acquisition is sufficient to service the loan. These loans are
often issued in connection with recapitalizations, acquisitions, leveraged
buy-outs and refinancings. Moody's and S&P may rate bank loans higher than high
yield bonds of the same issuer to reflect their more senior position. A fund
may invest in both fixed- and floating-rate loans.
Bank loans may include restrictive covenants which must be maintained by the
borrower. Such covenants, in addition to the timely payment of interest and
principal, may include mandatory prepayment provisions arising from free cash
flow, restrictions on dividend payments and usually state that a borrower must
maintain specific minimum financial ratios as well as establishing limits on
total debt. A breach of covenant, which is not waived by the agent, is normally
an event of acceleration, i.e., the agent has the right to call the outstanding
bank loan. In addition, loan covenants may include mandatory prepayment
provisions stemming from free cash flow. Free cash flow is cash that is in
excess of capital expenditures plus debt service requirements of principal and
interest. The free cash flow shall be applied to prepay the bank loan in an
order of maturity described in the loan documents.
When a fund has an interest in certain types of bank loans, a fund may have an
obligation to make additional loans upon demand by the borrower. These
commitments may have the effect of requiring a fund to increase its investment
in a borrower at a time when it would not otherwise have done so. A fund
intends to reserve against such contingent obligations by segregating
sufficient assets in high quality short-term liquid investments or borrowing to
cover such obligations.
II-80
Under a bank loan, the borrower generally must pledge as collateral assets
which may include one or more of the following: cash; accounts receivable;
inventory; property, plant and equipment; common and preferred stock in its
subsidiaries; trademarks, copyrights, patent rights; and franchise value. A
fund may also receive guarantees as a form of collateral. In some instances, a
bank loan may be secured only by stock in a borrower or its affiliates. A fund
may also invest in bank loans not secured by any collateral. The market value
of the assets serving as collateral (if any) will, at the time of investment,
in the opinion of the Advisor, equal or exceed the principal amount of the bank
loan. The valuations of these assets may be performed by an independent
appraisal. If the agent becomes aware that the value of the collateral has
declined, the agent may take action as it deems necessary for the protection of
its own interests and the interests of the other lenders, including, for
example, giving the borrower an opportunity to provide additional collateral or
accelerating the loan. There is no assurance, however, that the borrower would
provide additional collateral or that the liquidation of the existing
collateral would satisfy the borrower's obligation in the event of nonpayment
of scheduled interest or principal, or that such collateral could be readily
liquidated.
In a typical interest in a bank loan, the agent administers the loan and has
the right to monitor the collateral. The agent is also required to segregate
the principal and interest payments received from the borrower and to hold
these payments for the benefit of the lenders. A fund normally looks to the
agent to collect and distribute principal of and interest on a bank loan.
Furthermore, a fund looks to the agent to use normal credit remedies, such as
to foreclose on collateral; monitor credit loan covenants; and notify the
lenders of any adverse changes in the borrower's financial condition or
declarations of insolvency. In the event of a default by the borrower, it is
possible, though unlikely, that a fund could receive a portion of the
borrower's collateral. If a fund receives collateral other than cash, such
collateral will be liquidated and the cash received from such liquidation will
be available for investment as part of a fund's portfolio. At times a fund may
also negotiate with the agent regarding the agent's exercise of credit remedies
under a bank loan. The agent is compensated for these services by the borrower
as is set forth in the loan agreement. Such compensation may take the form of a
fee or other amount paid upon the making of the bank loan and/or an ongoing fee
or other amount.
The loan agreement in connection with bank loans sets forth the standard of
care to be exercised by the agents on behalf of the lenders and usually
provides for the termination of the agent's agency status in the event that it
fails to act properly, becomes insolvent, enters FDIC receivership, or if not
FDIC insured, enters into bankruptcy or if the agent resigns. In the event an
agent is unable to perform its obligations as agent, another lender would
generally serve in that capacity.
Loan agreements frequently require the borrower to make full or partial
prepayment of a loan when the borrower engages in asset sales or a securities
issuance. Prepayments on bank loans may also be made by the borrower at its
election. The rate of such prepayments may be affected by, among other things,
general business and economic conditions, as well as the financial status of
the borrower. Prepayment would cause the actual duration of a bank loan to be
shorter than its stated maturity. This should, however, allow a fund to
reinvest in a new loan and recognize as income any unamortized loan fees. This
may result in a new facility fee payable to a fund. Because interest rates paid
on bank loans periodically fluctuate with the market, it is expected that the
prepayment and a subsequent purchase of a new bank loan by a fund will not have
a material adverse impact on the yield of the portfolio. A fund generally holds
bank loans to maturity unless it has become necessary to adjust a fund's
portfolio in accordance with the Advisor's view of current or expected economic
or specific industry or borrower conditions.
A fund may be required to pay and may receive various fees and commissions in
the process of purchasing, selling and holding bank loans. The fee may include
any, or a combination of, the following elements: arrangement fees, non-use
fees, facility fees, letter of credit fees and ticking fees. Arrangement fees
are paid at the commencement of a loan as compensation for the initiation of
the transaction. A non-use fee is paid based upon the amount committed but not
used under the loan. Facility fees are on-going annual fees paid in connection
with a loan. Letter of credit fees are paid if a loan involves a letter of
credit. Ticking fees are paid from the initial commitment indication until loan
closing. The amount of fees is negotiated at the time of transaction.
If legislation or state or federal regulators impose additional requirements or
restrictions on the ability of financial institutions to make loans that are
considered highly leveraged transactions, the availability of bank loans for
investment by a fund may be adversely affected. In addition, such requirements
or restrictions could reduce or eliminate sources of financing for certain
borrowers. This would increase the risk of default. If legislation or federal
or state regulators
II-81
require financial institutions to dispose of bank loans that are considered
highly leveraged transactions or subject such bank loans to increased
regulatory scrutiny, financial institutions may determine to sell such bank
loans. Such sales by affected financial institutions may not be at desirable
prices, in the opinion of the Advisor. If a fund attempts to sell a bank loan
at a time when a financial institution is engaging in such a sale, the price a
fund could get for the bank loan may be adversely affected.
Affiliates of the Advisor may participate in the primary and secondary market
for bank loans. Because of limitations imposed by applicable law, the presence
of the Advisor's affiliates in the bank loan market may restrict a fund's
ability to acquire some bank loans, or affect the timing or price of such
acquisition. The Advisor does not believe that this will materially affect a
fund's ability to achieve its investment objective. Also, because the Advisor
may wish to invest in the publicly traded securities of a borrrower, it may not
have access to material non-public information regarding the borrower to which
other lenders have access.
Loan Participations and Assignments. A fund's investments in bank loans are
expected in most instances to be in the form of participations in bank loans
(Participations) and assignments of portions of bank loans (Assignments) from
third parties. Large loans to corporations or governments may be shared or
syndicated among several lenders, usually banks. A fund may participate in such
syndicates, or can buy part of a loan, becoming a direct lender. Large loans to
corporations or governments may be shared or syndicated among several lenders,
usually banks. A fund may participate in such syndicates, or can buy part of a
loan, becoming a direct lender.
When a fund buys an Assignment, it is essentially becoming a party to the bank
agreement. The vast majority of all trades are Assignments and would therefore
generally represent the preponderance of bank loans held by a fund. When a fund
is a purchaser of an Assignment, it typically succeeds to all the rights and
obligations under the loan agreement of the assigning lender and becomes a
lender under the loan agreement with the same rights and obligations as the
assigning lender. Because Assignments are arranged through private negotiations
between potential assignees and potential assignors, however, the rights and
obligations acquired by a fund as the purchaser of an Assignment may differ
from, and may be more limited than, those held by the assigning lender.
In certain cases, a fund may buy bank loans on a participation basis, if for
example, a fund did not want to become party to the bank agreement. With
respect to any given bank loan, the rights of a fund when it acquires a
Participation may be more limited than the rights of the original lenders or of
investors who acquire an Assignment. Participations typically will result in a
fund having a contractual relationship only with the lender and not with the
borrower. A fund will have the right to receive payments of principal, interest
and any fees to which it is entitled only from the lender selling the
Participation and only upon receipt by the lender of the payments from the
borrower. In connection with purchasing Participations, a fund generally will
have no right to enforce compliance by the borrower with the terms of the loan
agreement relating to the bank loan, nor any rights of set-off against the
borrower, and a fund may not directly benefit from any collateral supporting
the bank loan in which it has purchased the Participation. As a result, a fund
will assume the credit risk of both the borrower and the lender that is selling
the Participation. In the event of the insolvency of the lender selling a
Participation, a fund may be treated as a general creditor of the lender and
may not benefit from any set-off between the lender and the borrower.
In the case of loan Participations where a bank or other lending institution
serves as financial intermediary between a fund and the borrower, if the
Participation does not shift to a fund the direct debtor-creditor relationship
with the borrower, SEC interpretations require a fund, in some circumstances,
to treat both the lending bank or other lending institution and the borrower as
issuers for purposes of a fund's investment policies. Treating a financial
intermediary as an issuer of indebtedness may restrict a fund's ability to
invest in indebtedness related to a single financial intermediary, or a group
of intermediaries engaged in the same industry, even if the underlying
borrowers represent many different companies and industries.
A fund may pay a fee or forego a portion of interest payments to the lender
selling a Participation or Assignment under the terms of such Participation or
Assignment. In the case of loans administered by a bank or other financial
institution that acts as agent for all holders, if assets held by the agent for
the benefit of a purchaser are determined to be subject to the claims of the
agent's general creditors, the purchaser might incur certain costs and delays
in realizing payment on the loan or loan Participation and could suffer a loss
of principal or interest.
II-82
Participations and Assignments involve credit risk, interest rate risk, and
liquidity risk, as well as the potential liability associated with being a
lender. If a fund purchases a Participation, it may only be able to enforce its
rights through the participating lender, and may assume the credit risk of both
the lender and the borrower. Investments in loans through direct Assignment of
a financial institution's interests with respect to a loan may involve
additional risks. For example, if a loan is foreclosed, a fund could benefit
from becoming part owner of any collateral, however, a fund would bear the
costs and liabilities associated with owning and disposing of the collateral.
A fund may have difficulty disposing of Assignments and Participations. Because
no liquid market for these obligations typically exists, a fund anticipates
that these obligations could be sold only to a limited number of institutional
investors. The lack of a liquid secondary market will have an adverse effect on
a fund's ability to dispose of particular Assignments or Participations when
necessary to meet a fund's liquidity needs or in response to a specific
economic event, such as a deterioration in the creditworthiness of the
borrower. The lack of a liquid secondary market for Assignments and
Participations may also make it more difficult for a fund to assign a value to
those securities for purposes of valuing a fund's portfolio and calculating its
net asset value.
BANK AND SAVINGS AND LOAN OBLIGATIONS. These obligations include negotiable
certificates of deposit, bankers' acceptances, deposit notes, fixed time
deposits or other short-term bank obligations. Certificates of deposit are
negotiable certificates evidencing the obligations of a bank to repay funds
deposited with it for a specified period of time. a fund may invest in
certificates of deposit of large domestic banks and their foreign branches,
large US regulated subsidiaries of large foreign banks (i.e., banks which at
the time of their most recent annual financial statements show total assets in
excess of $1 billion), and of smaller banks, in certain instances. Although a
fund recognizes that the size of a bank is important, this fact alone is not
necessarily indicative of its creditworthiness.
Banker's acceptances are credit instruments evidencing the obligations of a
bank to pay a draft drawn on it by a customer. These instruments reflect the
obligation both of the bank and of the drawer to pay the face amount of the
instrument upon maturity.
Time deposits are non-negotiable deposits maintained in a banking institution
for a specified period of time at a stated interest rate. Time deposits that
may be held by a fund will not benefit from insurance from the Bank Insurance
Fund or the Savings Association Insurance Fund administered by the Federal
Deposit Insurance Corporation. Fixed time deposits may be withdrawn on demand
by the investor, but may be subject to early withdrawal penalties that vary
with market conditions and the remaining maturity of the obligation. Fixed time
deposits, which are subject to withdrawal penalties, maturing in more than
seven calendar days are subject to a fund's limitation on investments in
illiquid securities.
For purposes of a fund's investment policies with respect to bank obligations,
the assets of a bank will be deemed to include the assets of its domestic and
foreign branches. Obligations of foreign branches of US banks and foreign banks
may be general obligations of the parent bank in addition to the issuing bank
or may be limited by the terms of a specific obligation and by government
regulation. A fund may invest in obligations of foreign banks or foreign
branches of US banks, which include banks located in the United Kingdom, Grand
Cayman Island, Nassau, Japan and Canada.
Investments in obligations of foreign banks may entail risks that are different
in some respects from those of investments in obligations of US domestic banks
because of differences in political, regulatory and economic systems and
conditions. These risks include the possibility that these obligations may be
less marketable than comparable obligations of United States banks, and the
selection of these obligations may be more difficult because there may be less
publicly available information concerning foreign banks. Other risks include
future political and economic developments, currency blockage, the possible
imposition of withholding taxes on interest payments, possible seizure or
nationalization of foreign deposits, difficulty or inability to pursue legal
remedies and obtain or enforce judgments in foreign courts, possible
establishment of exchange controls or the adoption of other foreign
governmental restrictions that might affect adversely the payment of principal
and interest on bank obligations. Foreign branches of US banks and foreign
banks may also be subject to less stringent reserve requirements and to
different accounting, auditing, reporting and record keeping standards than
those applicable to domestic branches of US banks.
II-83
BORROWING. Under the 1940 Act, a fund is required to maintain continuous asset
coverage of 300% with respect to permitted borrowings and to sell (within three
days) sufficient portfolio holdings to restore such coverage if it should
decline to less than 300% due to market fluctuations or otherwise, even if such
liquidation of a fund's holdings may be disadvantageous from an investment
standpoint.
BRADY BONDS. Brady Bonds are securities created through the exchange of
existing commercial bank loans to public and private entities in certain
emerging markets for new bonds in connection with debt restructurings under a
debt restructuring plan introduced by former US Secretary of the Treasury,
Nicholas F. Brady (Brady Plan). Brady Bonds may be collateralized or
uncollateralized and are issued in various currencies (but primarily the
dollar). Dollar-denominated, collateralized Brady Bonds, which may be
fixed-rate bonds or floating-rate bonds, are generally collateralized in full
as to principal by US Treasury zero coupon bonds having the same maturity as
the Brady Bonds. Interest payments on these Brady Bonds generally are
collateralized by cash or securities in an amount that, in the case of fixed
rate bonds, is equal to at least one year of rolling interest payments or, in
the case of floating rate bonds, initially is equal to at least one year's
rolling interest payments based on the applicable interest rate at that time
and is adjusted at regular intervals thereafter. Brady Bonds are often viewed
as having three or four valuation components: the collateralized repayment of
principal at final maturity; the collateralized interest payments; the
uncollateralized interest payments; and any uncollateralized repayment of
principal at maturity (these uncollateralized amounts constitute the residual
risk). In light of the residual risk of Brady Bonds and the history of defaults
of countries issuing Brady Bonds, with respect to commercial bank loans by
public and private entities, investments in Brady Bonds may be viewed as
speculative.
CASH MANAGEMENT VEHICLES. A fund may have cash balances that have not been
invested in portfolio securities (Uninvested Cash). Uninvested Cash may result
from a variety of sources, including dividends or interest received from
portfolio securities, unsettled securities transactions, reserves held for
investment strategy purposes, assets to cover a fund's open futures and other
derivatives positions, scheduled maturity of investments, liquidation of
investment securities to meet anticipated redemptions and dividend payments,
and new cash received from investors. Uninvested Cash may be invested directly
in money market instruments or other short-term debt obligations. A fund may
use Uninvested Cash to purchase shares of affiliated money market funds for
which the Advisor may act as investment advisor now or in the future that are
registered under the 1940 Act or that operate in accordance with Rule 2a-7
under the 1940 Act but are excluded from the definition of "investment company"
under Section 3(c)(1) or 3(c)(7) of the 1940 Act. Investments in such cash
management vehicles may exceed the limits of Section 12(d)(1)(A) of the 1940
Act.
COMMERCIAL PAPER. A fund may invest in commercial paper issued by major
corporations under the Securities Act in reliance on the exemption from
registration afforded by Section 3(a)(3) thereof. Such commercial paper may be
issued only to finance current transactions and must mature in nine months or
less. Trading of such commercial paper is conducted primarily by institutional
investors through investment dealers, and individual investor participation in
the commercial paper market is very limited. A fund also may invest in
commercial paper issued in reliance on the so-called "private placement"
exemption from registration afforded by Section 4(2) of the 1933 Act (Section
4(2) paper). Section 4(2) paper is restricted as to disposition under the
federal securities laws, and generally is sold to institutional investors such
as a fund who agree that they are purchasing the paper for investment and not
with a view to public distribution. Any resale by the purchaser must be in an
exempt transaction. Section 4(2) paper normally is resold to other
institutional investors like a fund through or with the assistance of the
issuer or investment dealers who make a market in Section 4(2) paper, thus
providing liquidity.
COMMON STOCK. Common stock is issued by companies to raise cash for business
purposes and represents a proportionate interest in the issuing companies.
Therefore, a fund may participate in the success or failure of any company in
which it holds stock. The market values of common stock can fluctuate
significantly, reflecting the business performance of the issuing company,
investor perception and general economic or financial market movements. Despite
the risk of price volatility, however, common stocks have historically offered
a greater potential for long-term gain on investment, compared to other classes
of financial assets, such as bonds or cash equivalents, although there can be
no assurance that this will be true in the future.
II-84
CONVERTIBLE SECURITIES. A fund may invest in convertible securities; that is,
bonds, notes, debentures, preferred stocks and other securities that are
convertible (by the holder or by the issuer) into common stock. Investments in
convertible securities can provide an opportunity for capital appreciation
and/or income through interest and dividend payments by virtue of their
conversion or exchange features.
The convertible securities in which a fund may invest include fixed-income or
zero coupon debt securities, which may be converted or exchanged at a stated or
determinable exchange ratio into underlying shares of common stock. The
exchange ratio for any particular convertible security may be adjusted from
time to time due to stock splits, dividends, spin-offs, other corporate
distributions or scheduled changes in the exchange ratio. A convertible
security may be called for redemption or conversion by the issuer after a
particular date and under certain circumstances (including a specified price)
established upon issue. If a convertible security held by a fund is called for
redemption or conversion, a fund could be required to tender it for redemption,
convert it into the underlying common stock, or sell it to a third party, which
may have an adverse effect on a fund's ability to achieve its investment
objectives. Convertible securities and convertible preferred stocks, until
converted, have general characteristics similar to both debt and equity
securities. Although to a lesser extent than with debt securities generally,
the market values of convertible securities tend to decline as interest rates
increase and, conversely, tend to increase as interest rates decline. In
addition, because of the conversion or exchange feature, the market values of
convertible securities typically change as the market values of the underlying
common stocks change, and, therefore, also tend to follow movements in the
general market for equity securities. A unique feature of convertible
securities is that, as the market price of the underlying common stock
declines, convertible securities tend to trade increasingly on a yield basis,
and so may not experience market value declines to the same extent as the
underlying common stock. When the market price of the underlying common stock
increases, the prices of the convertible securities tend to rise as a
reflection of the value of the underlying common stock, although typically not
as much as the underlying common stock. While no securities investments are
without risk, investments in convertible securities generally entail less risk
than investments in common stock of the same issuer.
As debt securities, convertible securities are investments that provide for a
stream of income (or in the case of zero coupon securities, accretion of
income) with generally higher yields than common stocks. Convertible securities
generally offer lower yields than non-convertible securities of similar quality
because of their conversion or exchange features.
Of course, like all debt securities, there can be no assurance of income or
principal payments because the issuers of the convertible securities may
default on their obligations.
Convertible securities are generally subordinated to other similar but
non-convertible securities of the same issuer, although convertible bonds, as
corporate debt obligations, enjoy seniority in right of payment to all equity
securities, and convertible preferred stock is senior to common stock, of the
same issuer. However, because of the subordination feature, convertible bonds
and convertible preferred stock typically have lower ratings than similar
non-convertible securities. Convertible securities may be issued as fixed
income obligations that pay current income or as zero coupon notes and bonds,
including Liquid Yield Option Notes (LYONs).
CREDIT ENHANCEMENT. Mortgage-backed securities and asset-backed securities are
often backed by a pool of assets representing the obligations of a number of
different parties. To lessen the effect of failure by obligors on underlying
assets to make payments, such securities may contain elements of credit
enhancement. Such credit enhancement falls into two categories: (1) liquidity
protection and (2) protection against losses resulting from ultimate default by
an obligor on the underlying assets. Liquidity protection refers to the
provision of advances, generally by the entity administering the pool of
assets, to ensure that the pass-through of payments due on the underlying pool
occurs in a timely fashion. Protection against losses resulting from ultimate
default enhances the likelihood of ultimate payment of the obligations on at
least a portion of the assets in the pool. Such protection may be provided
through guarantees, insurance policies or letters of credit obtained by the
issuer or sponsor from third parties; through various means of structuring the
transaction; or through a combination of such approaches. A fund may pay any
additional fees for such credit enhancement, although the existence of credit
enhancement may increase the price of a security.
II-85
The ratings of mortgage-backed securities and asset-backed securities for which
third-party credit enhancement provides liquidity protection or protection
against losses from default are generally dependent upon the continued
creditworthiness of the provider of the credit enhancement. The ratings of such
securities could be subject to reduction in the event of deterioration in the
creditworthiness of the credit enhancement provider even in cases where the
delinquency and loss experience on the underlying pool of assets is better than
expected.
Examples of credit enhancement arising out of the structure of the transaction
include "senior-subordinated securities" (multiple class securities with one or
more classes subordinate to other classes as to the payment of principal
thereof and interest thereon, with the result that defaults on the underlying
assets are borne first by the holders of the subordinated class), creation of
"reserve funds" (where cash or investments, sometimes funded from a portion of
the payments on the underlying assets, are held in reserve against future
losses) and "over-collateralization" (where the scheduled payments on, or the
principal amount of, the underlying assets exceed those required to make
payment of the securities and pay any servicing or other fees). The degree of
credit enhancement provided for each issue is generally based on historical
information with respect to the level of credit risk associated with the
underlying assets. Delinquency or loss in excess of that which is anticipated
could adversely affect the return on an investment in such a security.
Certain of a fund's other investments may be credit-enhanced by a guaranty,
letter of credit, or insurance from a third party. Any bankruptcy,
receivership, default, or change in the credit quality of the third party
providing the credit enhancement may adversely affect the quality and
marketability of the underlying security and could cause losses to a fund and
affect a fund's share price.
CUSTODIAL RECEIPTS. Custodial receipts are interests in separately traded
interest and principal component parts of US Government securities that are
issued by banks or brokerage firms and are created by depositing US Government
securities into a special account at a custodian bank. The custodian holds the
interest and principal payments for the benefit of the registered owners of the
certificates or receipts. The custodian arranges for the issuance of the
certificates or receipts evidencing ownership and maintains the register.
Receipts that are interests in the principal component are usually sold at a
deep discount because the buyer receives only the right to receive a future
fixed payment on the security and does not receive any rights to periodic
interest (cash) payments. In the case of Treasury Investment Growth Receipts
(TIGRs) and Certificates of Accrual on Treasury Securities (CATS), the IRS has
reached this conclusion for the purpose of applying the tax diversification
requirements applicable to regulated investment companies such as a fund. TIGRs
and CATS are not considered US Government securities by the staff of the SEC.
Further, the IRS conclusion noted above is contained only in a general counsel
memorandum, which is an internal document of no precedential value or binding
effect, and a private letter ruling, which also may not be relied upon by a
fund. The Advisor is not aware of any binding legislative, judicial or
administrative authority on this issue.
Custodial receipts include Treasury Receipts (TRs), TIGRs and CATS. TIGRs and
CATS are interests in private proprietary accounts while TRs and STRIPS (see US
Government Securities) are interests in accounts sponsored by the US Treasury.
Receipts are sold as zero coupon securities; for more information (see Zero
Coupon Securities).
DEPOSITARY RECEIPTS. A fund may invest in sponsored or unsponsored American
Depositary Receipts (ADRs), European Depositary Receipts (EDRs), Global
Depositary Receipts (GDRs), International Depositary Receipts (IDRs) and other
types of Depositary Receipts (which, together with ADRs, EDRs, GDRs and IDRs
are hereinafter referred to as Depositary Receipts). Depositary Receipts
provide indirect investment in securities of foreign issuers. Prices of
unsponsored Depositary Receipts may be more volatile than if they were
sponsored by the issuer of the underlying securities. Depositary Receipts may
not necessarily be denominated in the same currency as the underlying
securities into which they may be converted. In addition, the issuers of
unsponsored Depositary Receipts are not obligated to disclose material
information regarding the underlying securities or their issuer in the United
States and, therefore, there may not be a correlation between such information
and the market value of the Depositary Receipts. ADRs are Depositary Receipts
that are bought and sold in the United States and are typically issued by a US
bank or trust company which evidence ownership of underlying securities by a
foreign corporation. GDRs, IDRs and other types of Depositary Receipts are
typically issued by foreign banks or trust companies, although they may also be
issued by United States banks or trust companies, and evidence ownership of
underlying securities issued by either a foreign or a United States
corporation. Generally, Depositary Receipts in registered form are designed for
use in the United States securities markets and Depositary Receipts in bearer
form are designed for use in securities markets outside the United States.
II-86
Depositary Receipts, including those denominated in US dollars will be subject
to foreign currency exchange rate risk. However, by investing in US
dollar-denominated ADRs rather than directly in foreign issuers' stock, a fund
avoids currency risks during the settlement period. In general, there is a
large, liquid market in the United States for most ADRs. However, certain
Depositary Receipts may not be listed on an exchange and therefore may be
illiquid securities.
DERIVATIVES. A fund may use instruments referred to as derivatives
(derivatives). Derivatives are financial instruments the value of which is
derived from another security, a commodity (such as gold or oil), a currency or
an index (a measure of value or rates, such as the S&P 500 Index or the prime
lending rate). Derivatives often allow a fund to increase or decrease the level
of risk to which a fund is exposed more quickly and efficiently than direct
investments in the underlying asset or instruments.
A fund may, to the extent consistent with its investment objective and
policies, purchase and sell (write) exchange-listed and over-the-counter (OTC)
put and call options on securities, equity and fixed-income indices and other
instruments, purchase and sell futures contracts and options thereon, enter
into various transactions such as swaps, caps, floors, and collars, and may
enter into currency forward contracts, currency futures contracts, currency
swaps or options on currencies, or various other currency transactions. In
addition, a fund may invest in structured notes. The types of derivatives
identified above are not intended to be exhaustive and a fund may use types of
derivatives and/or employ derivatives strategies not otherwise described in
this Statement of Additional Information or a fund's prospectuses.
OTC derivatives are purchased from or sold to securities dealers, financial
institutions or other parties (Counterparties) pursuant to an agreement with
the Counterparty. As a result, a significant risk of OTC derivatives is
counterparty risk. The Advisor monitors the creditworthiness of OTC derivative
counterparties and periodically reports to the Board with respect to the
creditworthiness of OTC derivative counterparties.
A fund may use derivatives (subject to certain limits imposed by a fund's
investment objective and policies (see Investment Restrictions) and the 1940
Act, or by the requirements for a fund to qualify as a regulated investment
company for tax purposes (see Taxes) (i) to seek to achieve returns, (ii) to
attempt to protect against possible changes in the market value of securities
held in or to be purchased for a fund's portfolio resulting from securities
markets or currency exchange rate fluctuations, (iii) to protect a fund's
unrealized gains in the value of its portfolio securities, (iv) to facilitate
the sale of such securities for investment purposes, (v) to manage the
effective maturity or duration of a fund's portfolio, (vi) to establish a
position in the derivatives markets as a substitute for purchasing or selling
particular securities, (vii) for funds that invest in foreign securities, to
increase exposure to a foreign currency or to shift exposure to foreign
currency fluctuations from one currency to another (not necessarily the US
dollar), or (viii) for any other purposes permitted by law.
A fund may decide not to employ any of the strategies described below, and no
assurance can be given that any strategy used will succeed. If the Advisor
incorrectly forecasts interest rates, market values or other economic factors
in using a derivatives strategy for a fund, a fund might have been in a better
position if it had not entered into the transaction at all. Also, suitable
derivatives may not be available in all circumstances. The use of these
strategies involves certain special risks, including a possible imperfect
correlation, or even no correlation, between price movements of derivatives and
price movements of related investments. While some strategies involving
derivatives can reduce risk of loss, they can also reduce the opportunity for
gain or even result in losses by offsetting favorable price movements in
related investments or otherwise, due to the possible inability of a fund to
purchase or sell a portfolio security at a time that otherwise would be
favorable or the possible need to sell a portfolio security at a
disadvantageous time because a fund is required to maintain asset coverage or
offsetting positions in connection with transactions in derivatives (refer to
Asset Segregation for more information relating to asset segregation and cover
requirements for derivatives instruments), and the possible inability of a fund
to close out or liquidate its derivatives positions.
General Characteristics of Options. A put option gives the purchaser of the
option, upon payment of a premium, the right to sell, and the writer the
obligation to buy, the underlying security, commodity, index, currency or other
instrument at the exercise price. For instance, a fund's purchase of a put
option on a security might be designed to protect its holdings in the
underlying instrument (or, in some cases, a similar instrument) against a
substantial decline in the market value by giving a fund the right to sell such
instrument at the option exercise price. A call option, upon payment of a
premium, gives the purchaser of the option the right to buy, and the seller the
obligation to sell, the underlying
II-87
instrument at the exercise price. A fund's purchase of a call option on a
security, commodity, index, currency or other instrument might be intended to
protect a fund against an increase in the price of the underlying instrument
that it intends to purchase in the future by fixing the price at which it may
purchase such instrument. If a fund sells or "writes" a call option, the
premium that it receives may partially offset, to the extent of the option
premium, a decrease in the value of the underlying securities or instruments in
its portfolio or may increase a fund's income. The sale of put options can also
provide income and might be used to protect a fund against an increase in the
price of the underlying instrument or provide, in the opinion of portfolio
management, an acceptable entry point with regard to the underlying instrument.
A fund may write call options only if they are "covered." A written call option
is covered if a fund owns the security or instrument underlying the call or has
an absolute right to acquire that security or instrument without additional
cash consideration (or if additional cash consideration is required, liquid
assets in the amount of a fund's obligation are segregated according to the
procedures and policies adopted by the Board). For a call option on an index,
the option is covered if a fund segregates liquid assets equal to the contract
value to the extent required by SEC guidelines. A call option is also covered
if a fund holds a call on the same security, index or instrument as the written
call option where the exercise price of the purchased call (long position) is
(i) equal to or less than the exercise price of the call written, or (ii)
greater than the exercise price of the call written provided that liquid assets
equal to the difference between the exercise prices are segregated to the
extent required by SEC guidelines (see Asset Segregation). Exchange listed
options are issued and cleared by a regulated intermediary such as the Options
Clearing Corporation (OCC). The OCC ensures that the obligations of each option
it clears are fulfilled. The discussion below uses the OCC as an example, but
is also applicable to other financial intermediaries. OCC issued and exchange
listed options generally settle by physical delivery of the underlying security
or currency, or cash delivery for the net amount, if any, by which the option
is "in-the-money" (i.e., where the value of the underlying instrument exceeds,
in the case of a call option, or is less than, in the case of a put option, the
exercise price of the option) at the time the option is exercised. Frequently,
rather than taking or making delivery of the underlying instrument through the
process of exercising the option, listed options are closed by entering into
offsetting purchase or sale transactions that do not result in ownership of the
new option.
As noted above, OTC options are purchased from or sold to Counterparties
through direct bilateral agreement with the Counterparty. In contrast to
exchange listed options, which generally have standardized terms and
performance mechanics, all the terms of an OTC option, including such terms as
method of settlement, term, exercise price, premium, guarantees and security,
are set by negotiation of the parties. Unless the parties provide for it, there
is no central clearing or guaranty function in an OTC option. As a result, if
the Counterparty fails to make or take delivery of the security, currency or
other instrument underlying an OTC option it has entered into with a fund or
fails to make a cash settlement payment due in accordance with the terms of
that option, a fund will lose any premium it paid for the option as well as any
anticipated benefit of the transaction.
There are several risks associated with transactions in options. Options on
particular securities or instruments may be more volatile than a direct
investment in the underlying security or instrument. Additionally, there are
significant differences between the securities and options markets that could
result in an imperfect correlation between these markets, causing a given
options transaction not to achieve its objective. Disruptions in the markets
for the securities underlying options purchased or sold by a fund could result
in losses on the options. If trading is interrupted in an underlying security,
the trading of options on that security is normally halted as well. As a
result, a fund as purchaser or writer of an option will be unable to close out
its positions until options trading resumes, and it may be faced with losses if
trading in the security reopens at a substantially different price. In
addition, the OCC or other options markets may impose exercise restrictions. If
a prohibition on exercise is imposed at a time when trading in the option has
also been halted, a fund as purchaser or writer of an option will be locked
into its position until one of the two restrictions has been lifted. If a
prohibition on exercise remains in effect until an option owned by a fund has
expired, a fund could lose the entire value of its option.
During the option period, the covered call writer has, in return for the
premium on the option, given up the opportunity to profit from a price increase
in the underlying security or instrument above the exercise price, but as long
as its obligations as a writer continues, has retained the risk of loss should
the price of the underlying security or instrument decline. The writer of an
option has no control over the time when it may be required to fulfill its
obligations as a writer of the option. In writing put options, there is a risk
that a fund may be required to buy the underlying security
II-88
or instrument at a disadvantageous price if the put option is exercised against
a fund. If a put or call option purchased by a fund is not sold when it has
remaining value, and if the market price of the underlying security or
instrument remains, in the case of a put, equal to or greater than the exercise
price, or in the case of a call, less than or equal to the exercise price, a
fund will lose the premium that it paid for the option. Also, where a put or
call option is purchased as a hedge against price movements in the underlying
security or instrument, the price of the put or call option may move more or
less than the price of the underlying security or instrument.
A fund's ability to close out its position as a purchaser or seller of an OTC
option or exchange listed put or call option is dependent, in part, upon the
liquidity of the option market. Among the possible reasons for the absence of a
liquid option market on an exchange are: (i) insufficient trading interest in
certain options; (ii) restrictions on transactions imposed by an exchange;
(iii) trading halts, suspensions or other restrictions imposed with respect to
particular classes or series of options or underlying securities including
reaching daily price limits; (iv) interruption of the normal operations of the
OCC or an exchange; (v) inadequacy of the facilities of an exchange or OCC to
handle current trading volume; or (vi) a decision by one or more exchanges to
discontinue the trading of options (or a particular class or series of
options), in which event the relevant market for that option on that exchange
would cease to exist, although outstanding options on that exchange would
generally continue to be exercisable in accordance with their terms.
Special risks are presented by internationally traded options. Because of the
differences in trading hours between the US and various foreign countries, and
because different holidays are observed in different countries, foreign options
markets may be open for trading during hours or on days when US markets are
closed. As a result, option premiums may not reflect the current prices of the
underlying interests in the US.
General Characteristics of Futures Contracts and Options on Futures Contracts.
A futures contract is an agreement between two parties to buy or sell a
financial instrument or commodity for a set price on a future date. Futures are
generally bought and sold on the commodities exchanges where they are listed
with payment of initial and variation margin as described below. A futures
contract generally obligates the purchaser to take delivery from the seller the
specific type of financial instrument or commodity underlying the contract at a
specific future time for a set price. The purchase of a futures contract
enables a fund, during the term of the contract, to lock in the price at which
it may purchase a security, currency or commodity and protect against a rise in
prices pending the purchase of portfolio securities. A futures contract
generally obligates the seller to deliver to the buyer the specific type of
financial instrument underlying the contract at a specific future time for a
set price. The sale of a futures contract enables a fund to lock in a price at
which it may sell a security, currency or commodity and protect against
declines in the value of portfolio securities. Options on futures contracts are
similar to options on securities except that an option on a futures contract
gives the purchaser the right in return for the premium paid to assume a
position in a futures contract and obligates the seller to deliver such
position.
Although most futures contracts call for actual delivery or acceptance of the
underlying financial instrument or commodity, the contracts are usually closed
out before the settlement date without making, or taking, actual delivery.
Futures contracts on financial indices, currency exchange instruments and
certain other instruments provide for the delivery of an amount of cash equal
to a specified dollar amount times the difference between the underlying
instruments value (i.e., the index) at the open or close of the last trading
day of the contract and futures contract price. A futures contract sale is
closed out by effecting a futures contract purchase for the same aggregate
amount of the specific type of underlying financial instrument and the same
delivery date. If the sale price exceeds the offsetting purchase price, the
seller would be paid the difference and would realize a gain. If the offsetting
purchase price exceeds the sale price, the seller would pay the difference and
would realize a loss. Similarly, a futures contract purchase is closed out by
effecting a futures contract sale for the same aggregate amount of the specific
type of underlying financial instrument or commodity and the same delivery
date. If the offsetting sale price exceeds the purchase price, the purchaser
would realize a gain, whereas if the purchase price exceeds the offsetting sale
price, the purchaser would realize a loss. There can be no assurance that a
fund will be able to enter into a closing transaction.
When a purchase or sale of a futures contract is made, a fund is required to
deposit with the financial intermediary as security for its obligations under
the contract an "initial margin" consisting of cash, US Government Securities
or other liquid assets typically ranging from approximately less than 1% to 15%
of the contract amount. The initial margin is set by the exchange on which the
contract is traded and may, from time to time, be modified. In addition,
brokers
II-89
may establish margin deposit requirements in excess of those required by the
exchange. The margin deposits made are marked to market daily and a fund may be
required to make subsequent deposits of cash, US Government securities or other
liquid assets, called "variation margin" or "maintenance margin," which
reflects the price fluctuations of the futures contract. The purchase of an
option on a futures contract involves payment of a premium for the option
without any further obligation on the part of a fund. The sale of an option on
a futures contract involves receipt of a premium for the option and the
obligation to deliver (by physical or cash settlement) the underlying futures
contract. If a fund exercises an option on a futures contract it will be
obligated to post initial margin (and potential subsequent variation margin)
for the resulting futures position just as it would for any position.
Pursuant to a claim filed with the Commodity Futures Trading Commission (CFTC)
on behalf of a fund, neither the registrant nor a fund is deemed to be a
"commodity pool operator" under the Commodity Exchange Act. Therefore, a fund
is not subject to registration and regulation under the Commodity Exchange Act.
The Advisor is not deemed to be a "commodity pool operator" with respect to its
services as Advisor.
There are several risks associated with futures contracts and options on
futures contracts. The prices of financial instruments or commodities subject
to futures contracts (and thereby the futures contract prices) may correlate
imperfectly with the behavior of the cash price of a fund's securities or other
assets (and the currencies in which they are denominated). Also, prices of
futures contracts may not move in tandem with the changes in prevailing
interest rates, market movements and/or currency exchange rates against which a
fund seeks a hedge. Additionally, there is no assurance that a liquid secondary
market will exist for futures contracts and related options in which a fund may
invest. In the event a liquid market does not exist, it may not be possible to
close out a futures position and, in the event of adverse price movements, a
fund would continue to be required to make daily payments of variation margin.
The absence of a liquid market in futures contracts might cause a fund to make
or take delivery of the instruments or commodities underlying futures contracts
at a time when it may be disadvantageous to do so. The inability to close out
positions and futures positions could also have an adverse impact on a fund's
ability to effectively hedge its positions.
The risk of loss in trading futures contracts in some strategies can be
substantial, due both to the relatively low margin deposits required, and the
extremely high degree of leverage involved in futures pricing. As a result, a
relatively small price movement in a futures contract may result in immediate
and substantial loss (as well as gain) to the investor. Thus, a purchase or
sale of a futures contract may result in losses in excess of the amount
invested in the contract.
Futures contracts and options thereon which are purchased or sold on non-US
commodities exchanges may have greater price volatility than their US
counterparts. Furthermore, non-US commodities exchanges may be less regulated
and under less governmental scrutiny than US exchanges. Brokerage commissions,
clearing costs and other transaction costs may be higher on non-US exchanges.
In the event of the bankruptcy of a broker through which a fund engages in
transactions in futures or options thereon, a fund could experience delays
and/or losses in liquidating open positions purchased or sold through the
broker and/or incur a loss on all or part of its margin deposits with the
broker.
Currency Transactions. Currency transactions include forward currency
contracts, exchange listed currency futures, exchange listed and OTC options on
currencies, and currency swaps. A forward currency contract involves a
privately negotiated obligation to purchase or sell (with delivery generally
required) a specific currency at a future date, which may be any fixed number
of days from the date of the contract agreed upon by the parties, at a price
set at the time of the contract. Forward contracts are generally traded in an
interbank market directly between currency traders (usually large commercial
banks) and their customers. The parties to a forward contract may agree to
offset or terminate the contract before its maturity, or may hold the contract
to maturity and complete the contemplated currency exchange. A currency swap is
an agreement to exchange cash flows based on the notional difference among two
or more currencies and operates similarly to an interest rate swap, which is
described below.
"Transaction hedging" is entering into a currency transaction with respect to
specific assets or liabilities of a fund, which will generally arise in
connection with the purchase or sale of its portfolio securities or the receipt
of income therefrom. Entering into a forward contract for the purchase or sale
of an amount of foreign currency involved in an underlying security transaction
may "lock in" the US dollar price of the security. Forward contracts may also
be used
II-90
in anticipation of future purchases and sales of securities, even if specific
securities have not yet been selected. "Position hedging" is entering into a
currency transaction with respect to portfolio security positions denominated
or generally quoted in that currency. Position hedging may protect against a
decline in the value of existing investments denominated in the foreign
currency. While such a transaction would generally offset both positive and
negative currency fluctuations, such currency transactions would not offset
changes in security values caused by other factors.
A fund may also "cross-hedge" currencies by entering into transactions to
purchase or sell one or more currencies that are expected to decline in value
relative to other currencies to which a fund has or to which a fund expects to
have portfolio exposure. This type of investment technique will generally
reduce or eliminate exposure to the currency that is sold, and increase the
exposure to the currency that is purchased. As a result, a fund will assume the
risk of fluctuations in the value of the currency purchased at the same time
that it is protected against losses from a decline in the hedged currency.
To reduce the effect of currency fluctuations on the value of existing or
anticipated holdings of portfolio securities, a fund may also engage in "proxy
hedging." Proxy hedging is often used when the currency to which a fund is
exposed is difficult to hedge or to hedge against the dollar. Proxy hedging
entails entering into a commitment or option to sell a currency whose changes
in value are generally considered to be correlated to a currency or currencies
in which some or all of a fund's securities are or are expected to be
denominated. Proxy hedges may result in losses if the currency used to hedge
does not perform similarly to the currency in which the hedged securities are
denominated.
Currency hedging involves some of the same risks and considerations as other
transactions with similar instruments. Currency transactions can result in
losses to a fund if the currency being hedged fluctuates in value to a degree
or in a direction that is not anticipated. Further, there is the risk that the
perceived correlation between various currencies may not be present or may not
be present during the particular time that a fund is engaging in proxy hedging.
Currency transactions are subject to risks different from those of other
portfolio transactions. Because currency control is of great importance to the
issuing governments and influences economic planning and policy, purchases and
sales of currency and related instruments can be negatively affected by
government exchange controls, blockages, and manipulations or exchange
restrictions imposed by governments. These can result in losses to a fund if it
is unable to deliver or receive currency or funds in settlement of obligations
and could also cause hedges it has entered into to be rendered useless,
resulting in full currency exposure as well as incurring transaction costs.
Currency exchange rates, bid/ask spreads and liquidity may fluctuate based on
factors that may, or may not be, related to that country's economy.
Swap Agreements and Options on Swap Agreements. A fund may engage in swap
transactions, including, but not limited to, swap agreements on interest rates,
currencies, indices, credit and event linked swaps, total return and other
swaps and related caps, floors and collars. Swap agreements are two party
contracts ranging from a few weeks to more than one year. In a standard swap
transaction, two parties agree to exchange the returns (or differentials in
rates of return) earned or realized on a predetermined financial instrument or
instruments, which may be adjusted for an interest factor. The gross return to
be exchanged or "swapped" between the parties is generally calculated with
respect to a "notional amount" which is generally equal to the return on or
increase in value of a particular dollar amount invested at a particular
interest rate in such financial instrument or instruments.
"Interest rate swaps" involve the exchange by a fund with another party of
their respective commitments to pay or receive interest, e.g., an exchange of
floating rate payments for fixed rate payments with respect to a notional
amount of principal. A "currency swap" is an agreement to exchange cash flows
on a notional amount of two or more currencies based on the relative value
differential among them and an index swap is an agreement to swap cash flows on
a notional amount based on changes in the values of the reference indices. The
purchase of a cap entitles the purchaser to receive payments on a notional
principal amount from the party selling such cap to the extent that a specified
index exceeds a predetermined interest rate or amount. The purchase of a floor
entitles the purchaser to receive payments on a notional principal amount from
the party selling such floor to the extent that a specified index falls below a
predetermined interest rate or amount. A collar is a combination of a cap and a
floor that preserves a certain return within a predetermined range of interest
rates or values.
II-91
A "credit default swap" is a contract between a buyer and a seller of
protection against a pre-defined credit event. The buyer of protection pays the
seller a fixed regular fee provided that no event of default on an underlying
reference obligation has occurred. If an event of default occurs, the seller
must pay the buyer the full notional value, or "par value," of the reference
obligation in exchange for the reference obligation. Credit default swaps are
used as a means of "buying" credit protection, i.e., attempting to mitigate the
risk of default or credit quality deterioration in some portion of a fund's
holdings, or "selling" credit protection, i.e., attempting to gain exposure to
an underlying issuer's credit quality characteristics without directly
investing in that issuer. When a fund is a seller of credit protection, it
effectively adds leverage to its portfolio because, in addition, to its net
assets, a fund would be subject to investment exposure on the notional amount
of the swap. A fund will only sell credit protection with respect to securities
in which it would be authorized to invest directly.
If a fund is a buyer of a credit default swap and no event of default occurs, a
fund will lose its investment and recover nothing. However, if a fund is a
buyer and an event of default occurs, a fund will receive the full notional
value of the reference obligation that may have little or no value. As a
seller, a fund receives a fixed rate of income through the term of the contract
(typically between six months and three years), provided that there is no
default event. If an event of default occurs, the seller must pay the buyer the
full notional value of the reference obligation.
Credit default swaps involve greater risks than if a fund had invested in the
reference obligation directly. In addition to the risks applicable to
derivatives generally, credit default swaps involve special risks because they
are difficult to value, are highly susceptible to liquidity and credit risk,
and generally pay a return to the party that has paid the premium only in the
event of an actual default by the issuers of the underlying obligation (as
opposed to a credit downgrade or other indication of financial difficulty).
A fund may use credit default swaps to gain exposure to particular issuers or
particular markets through investments in portfolios of credit default swaps,
such as Dow Jones CDX.NA.HY certificates. By investing in certificates
representing interests in a basket of credit default swaps, a fund is taking
credit risk with respect to an entity or group of entities and providing credit
protection to the swap counterparties.
"Total return" swaps are contracts in which one party agrees to make periodic
payments to another party based on the change in market value of the assets
underlying the contract, which may include a specific security, basket of
securities or securities indices during the specified period, in return for
periodic payments based on a fixed or variable interest rate or the total
return of other underlying assets. Total return swap agreements may be used to
obtain exposure to a security or market without owning or taking physical
custody of such security or investing directly in such market. Total return
swaps may add leverage to a fund because, in addition to its net assets, a fund
would be subject to investment exposure on the notional amount of the swap.
Swaps typically involve a small investment of cash relative to the magnitude of
risks assumed. As a result, swaps can be highly volatile and may have a
considerable impact on a fund's performance. Depending on how they are used,
swaps may increase or decrease the overall volatility of a fund's investments
and its share price and yield. A fund will usually enter into swaps on a net
basis, i.e., the two payment streams are netted out in a cash settlement on the
payment date or dates specified in the instrument, with a fund receiving or
paying, as the case may be, only the net amount of the two payments.
A fund bears the risk of loss of the amount expected to be received under a
swap in the event of the default or bankruptcy of a Counterparty. In addition,
if the Counterparty's creditworthiness declines, the value of a swap will
likely decline, potentially resulting in losses for a fund. A fund may also
suffer losses if it is unable to terminate outstanding swaps (either by
assignment or other disposition) or reduce its exposure through offsetting
transactions (i.e., by entering into an offsetting swap with the same party or
similarly creditworthy party).
II-92
A fund may also enter into swap options. A swap option is a contract that gives
a counterparty the right (but not the obligation) in return for payment of a
premium, to enter into a new swap agreement or to shorten, extend, cancel or
otherwise modify an existing swap agreement, at some future time on specified
terms. Depending on the terms, a fund will generally incur greater risk when it
writes a swap option than when it purchases a swap option. When a fund
purchases a swap option, it risks losing the amount of the premium it has paid
should it decide to let the option expire.
Structured Notes. Structured notes are derivative debt securities, the interest
rate or principal of which is determined by reference to changes in value of a
specific security or securities, reference rate, or index. A participation
note, which is a form of structured note, is designed to give exposure to local
shares in foreign markets. Indexed securities, similar to structured notes, are
typically, but not always, debt securities whose value at maturity or coupon
rate is determined by reference to other securities. The performance of a
structured note or indexed security is based upon the performance of the
underlying instrument.
The terms of a structured note may provide that, in certain circumstances, no
principal is due on maturity and, therefore, may result in loss of investment.
Structured notes may be indexed positively or negatively to the performance of
the underlying instrument such that the appreciation or deprecation of the
underlying instrument will have a similar effect to the value of the structured
note at maturity at the time of any coupon payment. In addition, changes in the
interest rate and value of the principal at maturity may be fixed at a specific
multiple of the change in value of the underlying instrument, making the value
of the structured note more volatile than the underlying instrument. In
addition, structured notes may be less liquid and more difficult to price
accurately than less complex securities or traditional debt securities.
Commodity-Linked Derivatives. A fund may invest in instruments with principal
and/or coupon payments linked to the value of commodities, commodity futures
contracts, or the performance of commodity indices such as "commodity-linked"
or "index-linked" notes. These instruments are sometimes referred to as
"structured notes" because the terms of the instrument may be structured by the
issuer of the note and the purchaser of the note, such as a fund.
The values of commodity-linked notes will rise and fall in response to changes
in the underlying commodity or related index or investment. These notes expose
a fund economically to movements in commodity prices, but a particular note has
many features of a debt obligation. These notes also are subject to credit and
interest rate risks that in general affect the value of debt securities.
Therefore, at the maturity of the note, a fund may receive more or less
principal than it originally invested. A fund might receive interest payments
on the note that are more or less than the stated coupon interest rate
payments.
Commodity-linked notes may involve leverage, meaning that the value of the
instrument will be calculated as a multiple of the upward or downward price
movement of the underlying commodity future or index. The prices of
commodity-linked instruments may move in different directions than investments
in traditional equity and debt securities in periods of rising inflation. Of
course, there can be no guarantee that a fund's commodity-linked investments
would not be correlated with traditional financial assets under any particular
market conditions.
Commodity-linked notes may be issued by US and foreign banks, brokerage firms,
insurance companies and other corporations. These notes, in addition to
fluctuating in response to changes in the underlying commodity assets, will be
subject to credit and interest rate risks that typically affect debt
securities.
Commodity-linked notes may be wholly principal protected, partially principal
protected or offer no principal protection. With a wholly principal protected
instrument, a fund will receive at maturity the greater of the par value of the
note or the increase in value of the underlying index. Partially protected
instruments may suffer some loss of principal up to a specified limit if the
underlying index declines in value during the term of the instrument. For
instruments without principal protection, there is a risk that the instrument
could lose all of its value if the index declines sufficiently. The Advisor's
decision on whether and to what extent to use principal protection depends in
part on the cost of the protection. In addition, the ability of a fund to take
advantage of any protection feature depends on the creditworthiness of the
issuer of the instrument.
II-93
Commodity-linked notes are generally hybrid instruments which are excluded from
regulation under the CEA and the rules thereunder. Additionally, from time to
time a fund may invest in other hybrid instruments that do not qualify for
exemption from regulation under the CEA.
Combined Transactions. A fund may enter into multiple transactions, including
multiple options transactions, multiple futures transactions, multiple currency
transactions (including forward currency contracts) and multiple interest rate
transactions and any combination of futures, options, currency and interest
rate transactions (component transactions), instead of a single derivative, as
part of a single or combined strategy when, in the opinion of the Advisor, it
is in the best interests of a fund to do so. A combined transaction will
usually contain elements of risk that are present in each of its component
transactions. Although combined transactions are normally entered into based on
the Advisor's judgment that the combined strategies will reduce risk or
otherwise more effectively achieve the desired portfolio management goal, it is
possible that the combination will instead increase such risks or hinder
achievement of the portfolio management objective.
DIRECT DEBT INSTRUMENTS. Direct debt instruments are interests in amounts owed
by a corporate, governmental or other borrower to lenders (direct loans), to
suppliers of goods or services (trade claims or other receivables) or to other
parties. When a fund participates in a direct loan it will be lending money
directly to an issuer. Direct loans generally do not have an underwriter or
agent bank, but instead, are negotiated between a company's management team and
a lender or group of lenders. Direct loans typically offer better security and
structural terms than other types of high yield securities. Direct debt
obligations are often the most senior obligations in an issuer's capital
structure or are well-collateralized so that overall risk is lessened. Trade
claims are unsecured rights of payment arising from obligations other than
borrowed funds. Trade claims include vendor claims and other receivables that
are adequately documented and available for purchase from high-yield
broker-dealers. Trade claims typically sell at a discount. In addition to the
risks otherwise associated with low-quality obligations, trade claims have
other risks, including the possibility that the amount of the claim may be
disputed by the obligor. Trade claims normally would be considered illiquid and
pricing can be volatile. Direct debt instruments involve a risk of loss in case
of default or insolvency of the borrower. A fund will rely primarily upon the
creditworthiness of the borrower and/or the collateral for payment of interest
and repayment of principal. The value of a fund's investments may be adversely
affected if scheduled interest or principal payments are not made. Because most
direct loans will be secured, there will be a smaller risk of loss with direct
loans than with an investment in unsecured high yield bonds or trade claims.
Investment in the indebtedness of borrowers whose creditworthiness is poor
involves substantially greater risks and may be highly speculative. Borrowers
that are in bankruptcy or restructuring may never pay off their indebtedness or
may pay only a small fraction of the amount owed. Investments in direct debt
instruments also involve interest rate risk and liquidity risk. However,
interest rate risk is lessened by the generally short-term nature of direct
debt instruments and their interest rate structure, which typically floats. To
the extent the direct debt instruments in which a fund invests are considered
illiquid, the lack of a liquid secondary market (1) will have an adverse impact
on the value of such instruments, (2) will have an adverse impact on a fund's
ability to dispose of them when necessary to meet a fund's liquidity needs or
in response to a specific economic event, such as a decline in creditworthiness
of the issuer, and (3) may make it more difficult for a fund to assign a value
to these instruments for purposes of valuing a fund's portfolio and calculating
its net asset value. In order to lessen liquidity risk, a fund anticipates
investing primarily in direct debt instruments that are quoted and traded in
the high yield market. Trade claims may also present a tax risk to a fund.
DOLLAR ROLL TRANSACTIONS. Dollar roll transactions consist of the sale by a
fund to a bank or broker-dealer (counterparty) of mortgage-backed securities
together with a commitment to purchase from the counterparty similar, but not
identical, securities at a future date, at the same price. The counterparty
receives all principal and interest payments, including prepayments, made on
the security while it is the holder. A fund receives a fee from the
counterparty as consideration for entering into the commitment to purchase.
Dollar rolls may be renewed over a period of several months with a different
purchase and repurchase price fixed and a cash settlement made at each renewal
without physical delivery of securities. Moreover, the transaction may be
preceded by a firm commitment agreement pursuant to which a fund agrees to buy
a security on a future date.
A dollar roll involves costs to a fund. For example, while a fund receives a
fee as consideration for agreeing to repurchase the security, a fund forgoes
the right to receive all principal and interest payments while the counterparty
holds the security. These payments to the counterparty may exceed the fee
received by a fund, in which case the use of this
II-94
technique will result in a lower return than would have been realized without
the use of dollar rolls. Further, although a fund can estimate the amount of
expected principal prepayment over the term of the dollar roll, a variation in
the actual amount of prepayment could increase or decrease the cost of the
dollar roll. A "covered roll" is a specific type of dollar roll for which there
is an offsetting cash position or a cash equivalent security position which
matures on or before the forward settlement date of the dollar roll
transaction. A fund may enter into both covered and uncovered rolls.
The entry into dollar rolls involves potential risks of loss that are different
from those related to the securities underlying the transactions. A fund will
be exposed to counterparty risk. For example, if the counterparty becomes
insolvent, a fund's right to purchase from the counterparty might be
restricted. Additionally, the value of such securities may change adversely
before a fund is able to purchase them. Similarly, a fund may be required to
purchase securities in connection with a dollar roll at a higher price than may
otherwise be available on the open market. Since, as noted above, the
counterparty is required to deliver a similar, but not identical security to a
fund, the security that a fund is required to buy under the dollar roll may be
worth less than the identical security. Finally, there can be no assurance that
a fund's use of the cash that it receives from a dollar roll will provide a
return that exceeds transaction costs associated with the dollar roll.
EURODOLLAR OBLIGATIONS. Eurodollar bank obligations are US dollar-denominated
certificates of deposit and time deposits issued outside the US capital markets
by foreign branches of US banks and US branches of foreign banks. Eurodollar
obligations are subject to the same risks that pertain to domestic issues,
notably credit risk, market risk and liquidity risk. Additionally, Eurodollar
obligations are subject to certain sovereign risks. One such risk is the
possibility that a sovereign country might prevent capital, in the form of
dollars, from flowing across its borders. Other risks include: adverse
political and economic developments; the extent and quality of government
regulation of financial markets and institutions; the imposition of foreign
withholding taxes, and the expropriation or nationalization of foreign issues.
FIXED INCOME SECURITIES. Fixed income securities, including corporate debt
obligations, generally expose a fund to the following types of risk: (1)
interest rate risk (the potential for fluctuations in bond prices due to
changing interest rates); (2) income risk (the potential for a decline in a
fund's income due to falling market interest rates); (3) credit risk (the
possibility that a bond issuer will fail to make timely payments of either
interest or principal to a fund); (4) prepayment risk or call risk (the
likelihood that, during periods of falling interest rates, securities with high
stated interest rates will be prepaid, or "called" prior to maturity, requiring
a fund to invest the proceeds at generally lower interest rates); and (5)
extension risk (the likelihood that as interest rates increase, slower than
expected principal payments may extend the average life of fixed income
securities, which will have the effect of locking in a below-market interest
rate, increasing the security's duration and reducing the value of the
security).
In periods of declining interest rates, the yield (income from a fixed income
security held by a fund over a stated period of time) of a fixed income
security may tend to be higher than prevailing market rates, and in periods of
rising interest rates, the yield of a fixed income security may tend to be
lower than prevailing market rates. In addition, when interest rates are
falling, the inflow of net new money to a fund will likely be invested in
portfolio instruments producing lower yields than the balance of a fund's
portfolio, thereby reducing the yield of a fund. In periods of rising interest
rates, the opposite can be true. The net asset value of a fund can generally be
expected to change as general levels of interest rates fluctuate. The value of
fixed income securities in a fund's portfolio generally varies inversely with
changes in interest rates. Prices of fixed income securities with longer
effective maturities are more sensitive to interest rate changes than those
with shorter effective maturities.
Corporate debt obligations generally offer less current yield than securities
of lower quality, but lower-quality securities generally have less liquidity,
greater credit and market risk, and as a result, more price volatility.
FOREIGN CURRENCIES. Because investments in foreign securities usually will
involve currencies of foreign countries, and because a fund may hold foreign
currencies and forward contracts, futures contracts and options on foreign
currencies and foreign currency futures contracts, the value of the assets of a
fund as measured in US dollars may be affected favorably or unfavorably by
changes in foreign currency exchange rates and exchange control regulations,
and a fund
II-95
may incur costs and experience conversion difficulties and uncertainties in
connection with conversions between various currencies. Fluctuations in
exchange rates may also affect the earning power and asset value of the foreign
entity issuing the security.
The strength or weakness of the US dollar against these currencies is
responsible for part of a fund's investment performance. If the dollar falls in
value relative to the Japanese yen, for example, the dollar value of a Japanese
stock held in the portfolio will rise even though the price of the stock
remains unchanged. Conversely, if the dollar rises in value relative to the
yen, the dollar value of the Japanese stock will fall. Many foreign currencies
have experienced significant devaluation relative to the dollar.
Although a fund values its assets daily in terms of US dollars, it may not
convert its holdings of foreign currencies into US dollars on a daily basis.
Investors should be aware of the costs of currency conversion. Although foreign
exchange dealers do not charge a fee for conversion, they realize a profit
based on the difference (the spread) between the prices at which they are
buying and selling various currencies. Thus, a dealer may offer to sell a
foreign currency to a fund at one rate, while offering a lesser rate of
exchange should a fund desire to resell that currency to the dealer. A fund
will conduct its foreign currency exchange transactions either on a spot (i.e.,
cash) basis at the spot rate prevailing in the foreign currency exchange
market, or through entering into options or forward or futures contracts to
purchase or sell foreign currencies.
FOREIGN INVESTMENT. Foreign securities are normally denominated and traded in
foreign currencies. As a result, the value of a fund's foreign investments and
the value of its shares may be affected favorably or unfavorably by changes in
currency exchange rates relative to the US dollar. There may be less
information publicly available about a foreign issuer than about a US issuer,
and foreign issuers may not be subject to accounting, auditing and financial
reporting standards and practices comparable to those in the US. The securities
of some foreign issuers are less liquid and at times more volatile than
securities of comparable US issuers. Foreign brokerage commissions and other
fees are also generally higher than in the US. Foreign settlement procedures
and trade regulations may involve certain risks (such as delay in payment or
delivery of securities or in the recovery of a fund's assets held abroad) and
expenses not present in the settlement of investments in US markets. Payment
for securities without delivery may be required in certain foreign markets.
In addition, foreign securities may be subject to the risk of nationalization
or expropriation of assets, imposition of currency exchange controls or
restrictions on the repatriation of foreign currency, confiscatory taxation,
political or financial instability and diplomatic developments which could
affect the value of a fund's investments in certain foreign countries.
Governments of many countries have exercised and continue to exercise
substantial influence over many aspects of the private sector through the
ownership or control of many companies, including some of the largest in these
countries. As a result, government actions in the future could have a
significant effect on economic conditions which may adversely affect prices of
certain portfolio securities. There is also generally less government
supervision and regulation of stock exchanges, brokers, and listed companies
than in the US. Dividends or interest on, or proceeds from the sale of, foreign
securities may be subject to foreign withholding taxes, and special US tax
considerations may apply (see Taxes). Moreover, foreign economies may differ
favorably or unfavorably from the US economy in such respects as growth of
gross national product, rate of inflation, capital reinvestment, resource
self-sufficiency and balance of payments position.
Legal remedies available to investors in certain foreign countries may be more
limited than those available with respect to investments in the US or in other
foreign countries. The laws of some foreign countries may limit a fund's
ability to invest in securities of certain issuers organized under the laws of
those foreign countries.
Many foreign countries are heavily dependent upon exports, particularly to
developed countries, and, accordingly, have been and may continue to be
adversely affected by trade barriers, managed adjustments in relative currency
values, and other protectionist measures imposed or negotiated by the US and
other countries with which they trade. These economies also have been and may
continue to be negatively impacted by economic conditions in the US and other
trading partners, which can lower the demand for goods produced in those
countries.
II-96
The risks described above, including the risks of nationalization or
expropriation of assets, typically are increased in connection with investments
in "emerging markets." For example, political and economic structures in these
countries may be in their infancy and developing rapidly, and such countries
may lack the social, political and economic stability characteristic of more
developed countries (including amplified risk of war and terrorism). Certain of
these countries have in the past failed to recognize private property rights
and have at times nationalized and expropriated the assets of private
companies. Investments in emerging markets may be considered speculative.
The currencies of certain emerging market countries have experienced
devaluations relative to the US dollar, and future devaluations may adversely
affect the value of assets denominated in such currencies. In addition,
currency hedging techniques may be unavailable in certain emerging market
countries. Many emerging market countries have experienced substantial, and in
some periods extremely high, rates of inflation or deflation for many years,
and future inflation may adversely affect the economies and securities markets
of such countries.
In addition, unanticipated political or social developments may affect the
value of investments in emerging markets and the availability of additional
investments in these markets. Any change in the leadership or politics of
emerging market countries, or the countries that exercise a significant
influence over those countries, may halt the expansion of or reverse the
liberalization of foreign investment policies now occurring and adversely
affect existing investment opportunities. The small size, limited trading
volume and relative inexperience of the securities markets in these countries
may make investments in securities traded in emerging markets illiquid and more
volatile than investments in securities traded in more developed countries. For
example, limited market size may cause prices to be unduly influenced by
traders who control large positions. In addition, a fund may be required to
establish special custodial or other arrangements before making investments in
securities traded in emerging markets. There may be little financial or
accounting information available with respect to issuers of emerging market
securities, and it may be difficult as a result to assess the value of
prospects of an investment in such securities.
The risk also exists that an emergency situation may arise in one or more
emerging markets as a result of which trading of securities may cease or may be
substantially curtailed and prices for a fund's securities in such markets may
not be readily available. A fund may suspend redemption of its shares for any
period during which an emergency exists.
Certain of the foregoing risks may also apply to some extent to securities of
US issuers that are denominated in foreign currencies or that are traded in
foreign markets, or securities of US issuers having significant foreign
operations.
Supranational Entities. Supranational entities are international organizations
designated or supported by governmental entities to promote economic
reconstruction or development and international banking institutions and
related government agencies. Examples include the International Bank for
Reconstruction and Development (the World Bank), The Asian Development Bank and
the InterAmerican Development Bank. Obligations of supranational entities are
backed by the guarantee of one or more foreign governmental parties which
sponsor the entity.
FUNDING AGREEMENTS. Funding agreements are contracts issued by insurance
companies that provide investors the right to receive a variable rate of
interest and the full return of principal at maturity. Funding agreements also
include a put option that allows a fund to terminate the agreement at a
specified time prior to maturity. Funding agreements generally offer a higher
yield than other variable securities with similar credit ratings. The primary
risk of a funding agreement is the credit quality of the insurance company that
issues it.
GOLD OR PRECIOUS METALS. Gold and other precious metals held by or on behalf of
a fund may be held on either an allocated or an unallocated basis inside or
outside the US. Placing gold or precious metals in an allocated custody account
gives a fund a direct interest in specified gold bars or precious metals,
whereas an unallocated deposit does not and instead gives a fund a right only
to compel the counterparty to deliver a specific amount of gold or precious
metals, as applicable. Consequently, a fund could experience a loss if the
counterparty to an unallocated depository arrangement becomes bankrupt or fails
to deliver the gold or precious metals as requested. An allocated gold or
precious metals custody account also involves the risk that the gold or
precious metals will be stolen or damaged while in
II-97
transit. Both allocated and unallocated arrangements require a fund as seller
to deliver, either by book entry or physically, the gold or precious metals
sold in advance of the receipt of payment. These custody risks would apply to a
wholly-owned subsidiary of a fund to the extent the subsidiary holds gold or
precious metals.
In addition, in order to qualify for the special tax treatment accorded
regulated investment companies and their shareholders, a fund must, among other
things, derive at least 90% of its income from certain specified sources
(qualifying income). Capital gains from the sale of gold or other precious
metals will not constitute qualifying income. As a result, a fund may not be
able to sell or otherwise dispose of all or a portion of its gold or precious
metal holdings without realizing significant adverse tax consequences,
including the failure to qualify as a regulated investment company under
Subchapter M of the Code. Rather than incur those tax consequences, a fund may
choose to hold some amount of gold or precious metal that it would otherwise
sell.
HEDGE FUNDS. A fund may seek exposure to alternative asset classes or
strategies through investment in hedge funds. A fund may substitute derivative
instruments, including warrants and swaps, whose values are tied to the value
of underlying hedge funds in lieu of a direct investment in hedge funds. A
derivative instrument whose value is tied to one or more hedge funds or hedge
fund indices will be subject to the market and other risks associated with the
underlying assets held by the hedge fund. Hedge funds are not subject to the
provisions of the 1940 Act or the reporting requirements of the Securities
Exchange Act of 1934, as amended, and their advisors may not be subject to the
Investment Advisers Act of 1940, as amended. Investments in hedge funds are
illiquid and may be less transparent than an investment in a registered mutual
fund. There are no market quotes for securities of hedge funds and hedge funds
generally value their interests no more frequently than monthly or quarterly,
in some cases. An investment in a derivative instrument based on a hedge fund
may be subject to some or all of the structural risks associated with a direct
investment in a hedge fund.
HIGH YIELD FIXED INCOME SECURITIES - JUNK BONDS. A fund may purchase debt
securities which are rated below investment-grade (junk bonds), that is, rated
Ba and below by Moody's or BB and below by S&P and unrated securities judged to
be of equivalent quality as determined by the Advisor. These securities usually
entail greater risk (including the possibility of default or bankruptcy of the
issuers of such securities), generally involve greater volatility of price and
risk to principal and income, and may be less liquid, than securities in the
higher rating categories. The lower the ratings of such debt securities, the
more their risks render them like equity securities. Securities rated D may be
in default with respect to payment of principal or interest. Investments in
high yield securities are described as "speculative" by ratings agencies.
Securities ranked in the lowest investment grade category may also be
considered speculative by certain ratings agencies. See the Appendix to this
SAI for a more complete description of the ratings assigned by ratings
organizations and their respective characteristics.
Issuers of such high yielding securities often are highly leveraged and may not
have available to them more traditional methods of financing. Therefore, the
risk associated with acquiring the securities of such issuers generally is
greater than is the case with higher rated securities. For example, during an
economic downturn or a sustained period of rising interest rates, highly
leveraged issuers of high yield securities may experience financial stress.
During such periods, such issuers may not have sufficient revenues to meet
their interest payment obligations. The issuer's ability to service its debt
obligations may also be adversely affected by specific corporate developments,
or the issuer's inability to meet specific projected business forecasts, or the
unavailability of additional financing. The risk of loss from default by the
issuer is significantly greater for the holders of high yield securities
because such securities are generally unsecured and are often subordinated to
other creditors of the issuer. Prices and yields of high yield securities will
fluctuate over time and, during periods of economic uncertainty, volatility of
high yield securities may adversely affect a fund's net asset value. In
addition, investments in high yield zero coupon or pay-in-kind bonds, rather
than income-bearing high yield securities, may be more speculative and may be
subject to greater fluctuations in value due to changes in interest rates.
A fund may have difficulty disposing of certain high yield securities because
they may have a thin trading market. Because not all dealers maintain markets
in all high yield securities, a fund anticipates that such securities could be
sold only to a limited number of dealers or institutional investors. The lack
of a liquid secondary market may have an adverse effect on the market price and
a fund's ability to dispose of particular issues and may also make it more
difficult for a fund to obtain accurate market quotations for purposes of
valuing a fund's assets. Market quotations
II-98
generally are available on many high yield issues only from a limited number of
dealers and may not necessarily represent firm bids of such dealers or prices
for actual sales. Adverse publicity and investor perceptions may decrease the
values and liquidity of high yield securities. These securities may also
involve special registration responsibilities, liabilities and costs, and
liquidity and valuation difficulties. Even though such securities do not pay
current interest in cash, a fund nonetheless is required to accrue interest
income on these investments and to distribute the interest income on a current
basis. Thus, a fund could be required at times to liquidate other investments
in order to satisfy its distribution requirements.
Credit quality in the high-yield securities market can change suddenly and
unexpectedly, and even recently issued credit ratings may not fully reflect the
actual risks posed by a particular high-yield security.
Prices for below investment-grade securities may be affected by legislative and
regulatory developments. Also, Congress has from time to time considered
legislation which would restrict or eliminate the corporate tax deduction for
interest payments on these securities and regulate corporate restructurings.
Such legislation may significantly depress the prices of outstanding securities
of this type.
IGAP OVERLAY STRATEGY. In addition to a fund's main investment strategy, the
Advisor seeks to enhance returns by employing a global tactical asset
allocation (GTAA) overlay strategy. The GTAA strategy, which the Advisor calls
iGAP (integrated Global Alpha Platform), is a total return strategy designed to
add value by benefiting from mispricings within global bond (and in some cases,
equity) and currency markets. The iGAP strategy combines diverse macro
investment views from various investment teams within Deutsche Asset
Management. Since a single investment approach rarely works in all market
conditions, the teams are chosen to diversify investment approaches thereby
enhancing the expected return for a given level of risk. The collective views
are then used to determine iGAP's positions using a disciplined, risk managed
process. The result is a collection of long and short investment positions
within global bonds (and in some cases, equities) and currencies (and in some
cases, commodities) designed to generate excess returns that have little
correlation to major markets. The bond and currency positions are then
implemented by the iGAP portfolio managers using futures and forward contracts.
The iGAP portfolio managers consider factors such as liquidity, cost, margin
requirement and credit quality when selecting the appropriate derivative
instrument.
The success of the iGAP strategy depends, in part, on the Advisor's ability to
analyze the correlation between various global markets and asset classes. If
the Advisor's correlation analysis proves to be incorrect, losses to a fund may
be significant and may substantially exceed the intended level of market
exposure for the iGAP strategy.
ILLIQUID SECURITIES. Historically, illiquid securities have included securities
subject to contractual or legal restrictions on resale because they have not
been registered under the 1933 Act, securities which are otherwise not readily
marketable and repurchase agreements having a maturity of longer than seven
days. Securities which have not been registered under the 1933 Act are referred
to as private placements or restricted securities and are purchased directly
from the issuer or in the secondary market. Non-publicly traded securities
(including Rule 144A Securities) may involve a high degree of business and
financial risk and may result in substantial losses. These securities may be
less liquid than publicly traded securities, and it may take longer to
liquidate these positions than would be the case for publicly traded
securities. Companies whose securities are not publicly traded may not be
subject to the disclosure and other investor protection requirements applicable
to companies whose securities are publicly traded. Certain securities may be
deemed to be illiquid as a result of the Advisor's receipt from time to time of
material, non-public information about an issuer, which may limit the Advisor's
ability to trade such securities for the account of any of its clients,
including a fund. In some instances, these trading restrictions could continue
in effect for a substantial period of time. Limitations on resale may have an
adverse effect on the marketability of portfolio securities and a mutual fund
might be unable to dispose of restricted or other illiquid securities promptly
or at reasonable prices and might thereby experience difficulty satisfying
redemptions within seven days. An investment in illiquid securities is subject
to the risk that should a fund desire to sell any of these securities when a
ready buyer is not available at a price that is deemed to be representative of
their value, the value of a fund's net assets could be adversely affected.
Mutual funds do not typically hold a significant amount of these restricted or
other illiquid securities because of the potential for delays on resale and
uncertainty in valuation. A mutual fund might also have to register such
restricted securities in order to dispose of them, resulting in additional
expense and delay. A fund selling its securities in a registered
II-99
offering may be deemed to be an "underwriter" for purposes of Section 11 of the
1933 Act. In such event, a fund may be liable to purchasers of the securities
under Section 11 if the registration statement prepared by the issuer, or the
prospectus forming a part of it, is materially inaccurate or misleading,
although a fund may have a due diligence defense. Adverse market conditions
could impede such a public offering of securities.
A large institutional market has developed for certain securities that are not
registered under the 1933 Act, including repurchase agreements, commercial
paper, non-US securities, municipal securities and corporate bonds and notes.
Institutional investors depend on an efficient institutional market in which
the unregistered security can be readily resold or on an issuer's ability to
honor a demand for repayment. The fact that there are contractual or legal
restrictions on resale of such investments to the general public or to certain
institutions may not be indicative of their liquidity.
The SEC has adopted Rule 144A, which allows a broader institutional trading
market for securities otherwise subject to restriction on their resale to the
general public. Rule 144A establishes a "safe harbor" from the registration
requirements of the 1933 Act for resales of certain securities to qualified
institutional buyers.
An investment in Rule 144A Securities will be considered illiquid and therefore
subject to a fund's limit on the purchase of illiquid securities unless a
fund's Board or its delegates determines that the Rule 144A Securities are
liquid. In reaching liquidity decisions, a fund's Board and its delegates may
consider, inter alia, the following factors: (i) the unregistered nature of the
security; (ii) the frequency of trades and quotes for the security; (iii) the
number of dealers wishing to purchase or sell the security and the number of
other potential purchasers; (iv) dealer undertakings to make a market in the
security; and (v) the nature of the security and the nature of the marketplace
trades (e.g., the time needed to dispose of the security, the method of
soliciting offers and the mechanics of the transfer).
Investing in Rule 144A Securities could have the effect of increasing the level
of illiquidity in a fund to the extent that qualified institutional buyers are
unavailable or uninterested in purchasing such securities from a fund. A fund's
Board has adopted guidelines and delegated to the Advisor the daily function of
determining and monitoring the liquidity of Rule 144A Securities, although a
fund's Board will retain ultimate responsibility for any liquidity
determinations.
IMPACT OF LARGE REDEMPTIONS AND PURCHASES OF FUND SHARES. From time to time,
shareholders of a fund (which may include affiliated and/or non-affiliated
registered investment companies that invest in a fund) may make relatively
large redemptions or purchases of fund shares. These transactions may cause a
fund to have to sell securities or invest additional cash, as the case may be.
While it is impossible to predict the overall impact of these transactions over
time, there could be adverse effects on a fund's performance to the extent that
a fund may be required to sell securities or invest cash at times when it would
not otherwise do so. These transactions could also accelerate the realization
of taxable income if sales of securities resulted in capital gains or other
income and could also increase transaction costs, which may impact a fund's
expense ratio and adversely affect a fund's performance.
INDEXED SECURITIES. A fund may invest in indexed securities, the value of which
is linked to currencies, interest rates, commodities, indices or other
financial indicators (reference instruments). Most indexed securities have
maturities of three years or less.
Indexed securities differ from other types of debt securities in which a fund
may invest in several respects. First, the interest rate or, unlike other debt
securities, the principal amount payable at maturity of an indexed security may
vary based on changes in one or more specified reference instruments, such as
an interest rate compared with a fixed interest rate or the currency exchange
rates between two currencies (neither of which need be the currency in which
the instrument is denominated). The reference instrument need not be related to
the terms of the indexed security. For example, the principal amount of a US
dollar denominated indexed security may vary based on the exchange rate of two
foreign currencies. An indexed security may be positively or negatively
indexed; that is, its value may increase or decrease if the value of the
reference instrument increases. Further, the change in the principal amount
payable or the interest rate of an indexed security may be a multiple of the
percentage change (positive or negative) in the value of the underlying
reference instrument(s).
II-100
Investment in indexed securities involves certain risks. In addition to the
credit risk of the security's issuer and the normal risks of price changes in
response to changes in interest rates, the principal amount of indexed
securities may decrease as a result of changes in the value of reference
instruments. Further, in the case of certain indexed securities in which the
interest rate is linked to a reference instrument, the interest rate may be
reduced to zero, and any further declines in the value of the security may then
reduce the principal amount payable on maturity. Also, indexed securities may
be more volatile than the reference instruments underlying the indexed
securities. Finally, a fund's investments in certain indexed securities may
generate taxable income in excess of the interest paid on the securities to a
fund, which may cause a fund to sell investments to obtain cash to make income
distributions (including at a time when it may not be advantageous to do so).
INDUSTRIAL DEVELOPMENT AND POLLUTION CONTROL BONDS. Industrial Development and
Pollution Control Bonds (which are types of private activity bonds), although
nominally issued by municipal authorities, are generally not secured by the
taxing power of the municipality, but are secured by the revenues of the
authority derived from payments by the industrial user. Consequently, the
credit quality of these securities depends upon the ability of the user of the
facilities financed by the bonds and any guarantor to meet its financial
obligations. Under federal tax legislation, certain types of Industrial
Development Bonds and Pollution Control Bonds may no longer be issued on a
tax-exempt basis, although previously issued bonds of these types and certain
refundings of such bonds are not affected.
INFLATION-INDEXED BONDS. A fund may purchase inflation-indexed securities
issued by the US Treasury, US government agencies and instrumentalities other
than the US Treasury, and entities other than the US Treasury or US government
agencies and instrumentalities.
Inflation-indexed bonds are fixed income securities or other instruments whose
principal value is periodically adjusted according to the rate of inflation.
Two structures are common. The US Treasury and some other issuers use a
structure that accrues inflation on either a current or lagged basis into the
principal value of the bond. Most other issuers pay out the Consumer Price
Index accruals as part of a semi-annual coupon.
Inflation-indexed securities issued by the US Treasury have maturities of
approximately five, ten or twenty years, although it is possible that
securities with other maturities will be issued in the future. The US Treasury
securities pay interest on a semi-annual basis, equal to a fixed percentage of
the inflation-adjusted principal amount. For example, if a fund purchased an
inflation-indexed bond with a par value of $1,000 and a 3% real rate of return
coupon (payable 1.5% semi-annually), and the rate of inflation over the first
six months was 1%, the mid-year par value of the bond would be $1,010 and the
first semi-annual interest payment would be $15.15 ($1,010 times 1.5%). If the
rate of inflation during the second half of the year resulted in the whole
year's inflation equaling 3%, the end of year par value of the bond would be
$1,030 and the second semi-annual interest payment would be $15.45 ($1,030
times 1.5%).
If the periodic adjustment rate measuring inflation falls, the principal value
of inflation-indexed bonds will be adjusted downward, and, consequently, the
interest payable on these securities (calculated with respect to a smaller
principal amount) will be reduced. Repayment of the original bond principal on
maturity (as adjusted for inflation) is guaranteed in the case of US Treasury
inflation-indexed bonds, even during a period of deflation, although the
inflation-adjusted principal received could be less than the inflation-adjusted
principal that had accrued to the bond at the time of purchase. However, the
current market value of the bonds is not guaranteed and will fluctuate. A fund
may also invest in other inflation related bonds that may or may not provide a
similar guarantee. If a guarantee of principal is not provided, the adjusted
principal value of the bond repaid at maturity may be less than the original
principal. In addition, if a fund purchases inflation-indexed bonds offered by
foreign issuers, the rate of inflation measured by the foreign inflation index
may not be correlated to the rate of inflation in the US.
The value of inflation-indexed bonds is expected to change in response to
changes in real interest rates. Real interest rates, in turn, are tied to the
relationship between nominal interest rates and the rate of inflation.
Therefore, if the rate of inflation rises at a faster rate than nominal
interest rates, real interest rates might decline, leading to an increase in
value of inflation-indexed bonds. In contrast, if nominal interest rates
increased at a faster rate than inflation, real interest rates might rise,
leading to a decrease in value of inflation-indexed bonds. There can be no
assurance, however, that the value of inflation-indexed bonds will be directly
correlated to changes in interest rates. In the event of sustained
II-101
deflation, it is possible that the amount of semiannual interest payments, the
inflation-adjusted principal of the security and the value of the stripped
components, will decrease. If any of these possibilities are realized, a fund's
net asset value could be negatively affected.
While these securities are expected to provide protection from long-term
inflationary trends, short-term increases in inflation may lead to a decline in
value. If interest rates rise due to reasons other than inflation (for example,
due to changes in currency exchange rates), investors in these securities may
not be protected to the extent that the increase is not reflected in the bond's
inflation measure.
The periodic adjustment of US inflation-indexed bonds is generally linked to
the Consumer Price Index for Urban Consumers (CPI-U), which is calculated
monthly by the US Bureau of Labor Statistics. The CPI-U is a measurement of
changes in the cost of living, made up of components such as housing, food,
transportation and energy. Inflation-indexed bonds issued by a foreign
government are generally adjusted to reflect a comparable inflation index
calculated by the applicable government. There can be no assurance that the
CPI-U or any foreign inflation index will accurately measure the real rate of
inflation in the prices of goods and services. Moreover, there can be no
assurance that the rate of inflation in a foreign country will be correlated to
the rate of inflation in the US. Finally, income distributions of a fund are
likely to fluctuate more than those of a conventional bond fund.
The taxation of inflation-indexed US Treasury securities is similar to the
taxation of conventional bonds. Both interest payments and the difference
between original principal and the inflation-adjusted principal will be treated
as interest income subject to taxation. Interest payments are taxable when
received or accrued. The inflation adjustment to the principal is subject to
tax in the year the adjustment is made, not at maturity of the security when
the cash from the repayment of principal is received. If an upward adjustment
has been made (which typically should happen), investors in non-tax-deferred
accounts will pay taxes on this amount currently. Decreases in the indexed
principal can be deducted only from current or previous interest payments
reported as income.
Inflation-indexed US Treasury securities therefore have a potential cash flow
mismatch to an investor, because investors must pay taxes on the
inflation-adjusted principal before the repayment of principal is received. It
is possible that, particularly for high income tax bracket investors,
inflation-indexed US Treasury securities would not generate enough income in a
given year to cover the tax liability they could create. This is similar to the
current tax treatment for zero-coupon bonds and other discount securities. If
inflation-indexed US Treasury securities are sold prior to maturity, capital
losses or gains are realized in the same manner as traditional bonds.
Inflation-indexed securities are designed to offer a return linked to
inflation, thereby protecting future purchasing power of the money invested in
them. However, inflation-indexed securities provide this protected return only
if held to maturity. In addition, inflation-indexed securities may not trade at
par value. Real interest rates (the market rate of interest less the
anticipated rate of inflation) change over time as a result of many factors,
such as what investors are demanding as a true value for money. When real rates
do change, inflation-indexed securities prices will be more sensitive to these
changes than conventional bonds, because these securities were sold originally
based upon a real interest rate that is no longer prevailing. Should market
expectations for real interest rates rise, the price of inflation-indexed
securities held by a fund may fall, resulting in a decrease in the share price
of a fund.
INTERFUND BORROWING AND LENDING PROGRAM. The DWS funds have received exemptive
relief from the SEC, which permits the funds to participate in an interfund
lending program. The interfund lending program allows the participating funds
to borrow money from and loan money to each other for temporary or emergency
purposes. The program is subject to a number of conditions designed to ensure
fair and equitable treatment of all participating funds, including the
following: (1) no fund may borrow money through the program unless it receives
a more favorable interest rate than a rate approximating the lowest interest
rate at which bank loans would be available to any of the participating funds
under a loan agreement; and (2) no fund may lend money through the program
unless it receives a more favorable return than that available from an
investment in repurchase agreements and, to the extent applicable, money market
cash sweep arrangements. In addition, a fund may participate in the program
only if and to the extent that such participation is consistent with a fund's
investment objectives and policies (for instance, money market funds would
normally participate only as lenders and tax exempt funds only as borrowers).
Interfund loans and borrowings have a maximum duration
II-102
of seven days. Loans may be called on one day's notice. A fund may have to
borrow from a bank at a higher interest rate if an interfund loan is called or
not renewed. Any delay in repayment to a lending fund could result in a lost
investment opportunity or additional costs. The program is subject to the
oversight and periodic review of the Board.
INVERSE FLOATERS. A fund may invest in inverse floaters. Inverse floaters are
debt instruments with a floating rate of interest that bears an inverse
relationship to changes in short-term market interest rates. Investments in
this type of security involve special risks as compared to investments in, for
example, a fixed rate municipal security. The debt instrument in which a fund
invests may be a tender option bond trust (the trust), which can be established
by a fund, a financial institution or a broker, consisting of underlying
municipal obligations with intermediate to long maturities and a fixed interest
rate. Other investors in the trust usually consist of money market fund
investors receiving weekly floating interest rate payments who have put options
with the financial institutions. A fund may enter into shortfall and
forbearance agreements by which a fund agrees to reimburse the trust, in
certain circumstances, for the difference between the liquidation value of the
fixed rate municipal security held by the trust and the liquidation value of
the floating rate notes. A fund could lose money and its NAV could decline as a
result of investments in inverse floaters if movements in interest rates are
incorrectly anticipated. Moreover, the markets for inverse floaters may be less
developed and may have less liquidity than the markets for more traditional
municipal securities, especially during periods of instability in the credit
markets. An inverse floater may exhibit greater price volatility than a
fixed-rate obligation of similar credit quality. When a fund holds inverse
floating rate securities, an increase in market interest rates will adversely
affect the income received from such securities and the net asset value of a
fund's shares. A fund's investments in inverse floaters will not be considered
borrowing within the meaning of the 1940 Act or for purposes of a fund's
investment restrictions on borrowing.
INVESTMENT COMPANY SECURITIES. A fund may acquire securities of other
investment companies to the extent that such investments are consistent with
its investment objective and the limitations of the 1940 Act. A fund will
indirectly bear its proportionate share of any management fees and other
expenses paid by such other investment companies.
For example, a fund may invest in investment companies which seek to track the
composition and performance of specific indexes or a specific portion of an
index. These index-based investment companies hold substantially all of their
assets in securities representing their specific index. Accordingly, the main
risk of investing in index-based investments is the same as investing in a
portfolio of equity securities comprising the index. The market prices of
index-based investments that are traded on an exchange will fluctuate in
accordance with both changes in the market value of their underlying portfolio
securities and due to supply and demand for the instruments on the exchanges on
which they are traded (which may result in their trading at a discount or
premium to their NAVs). Index-based investments may not replicate exactly the
performance of their specified index because of transaction costs and because
of the temporary unavailability of certain component securities of the index.
Examples of index-based investments include:
SPDRs (Reg. TM): SPDRs, an acronym for "Standard & Poor's Depositary Receipts,"
---------------
are based on the S&P 500 Composite Stock Price Index. They are issued by the
SPDR Trust, a unit investment trust that holds shares of substantially all the
companies in the S&P 500 in substantially the same weighting and seeks to
closely track the price performance and dividend yield of the Index.
MidCap SPDRs (Reg. TM): MidCap SPDRs are based on the S&P MidCap 400 Index.
----------------------
They are issued by the MidCap SPDR Trust, a unit investment trust that holds a
portfolio of securities consisting of substantially all of the common stocks in
the S&P MidCap 400 Index in substantially the same weighting and seeks to
closely track the price performance and dividend yield of the Index.
Select Sector SPDRs (Reg. TM): Select Sector SPDRs are based on a particular
-----------------------------
sector or group of industries that are represented by a specified Select Sector
Index within the Standard & Poor's Composite Stock Price Index. They are issued
by The Select Sector SPDR Trust, an open-end management investment company with
nine portfolios that each seeks to closely track the price performance and
dividend yield of a particular Select Sector Index.
II-103
DIAMONDS/SM/: DIAMONDS are based on the Dow Jones Industrial Average/SM/. They
--------
are issued by the DIAMONDS Trust, a unit investment trust that holds a
portfolio of all the component common stocks of the Dow Jones Industrial
Average and seeks to closely track the price performance and dividend yield of
the Dow.
INVESTMENT-GRADE BONDS. A fund may purchase "investment-grade" bonds, which are
those rated Aaa, Aa, A or Baa by Moody's or AAA, AA, A or BBB by S&P or, if
unrated, judged to be of equivalent quality as determined by the Advisor.
Moody's considers bonds it rates Baa to have speculative elements as well as
investment-grade characteristics. To the extent that a fund invests in
higher-grade securities, a fund will not be able to avail itself of
opportunities for higher income which may be available at lower grades.
IPO RISK. Securities issued through an initial public offering (IPO) can
experience an immediate drop in value if the demand for the securities does not
continue to support the offering price. Information about the issuers of IPO
securities is also difficult to acquire since they are new to the market and
may not have lengthy operating histories. A fund may engage in short-term
trading in connection with its IPO investments, which could produce higher
trading costs and adverse tax consequences.
LENDING OF PORTFOLIO SECURITIES. To generate additional income, a fund may lend
a percentage of its investment securities to approved institutional borrowers
who need to borrow securities in order to complete certain transactions, such
as covering short sales, avoiding failures to deliver securities or completing
arbitrage operations, in exchange for collateral in the form of cash or US
government securities. By lending its investment securities, a fund attempts to
increase its net investment income through the receipt of interest on the loan.
Any gain or loss in the market price of the securities loaned that might occur
during the term of the loan would belong to a fund. A fund may lend its
investment securities so long as the terms, structure and the aggregate amount
of such loans are not inconsistent with the 1940 Act or the rules and
regulations or interpretations of the SEC thereunder, which currently require
that (a) the borrower pledge and maintain with a fund collateral consisting of
liquid, unencumbered assets having a value at all times not less than 100% of
the value of the securities loaned, (b) the borrower add to such collateral
whenever the price of the securities loaned rises or the value of non-cash
collateral declines (i.e., the borrower "marks to the market" on a daily
basis), (c) the loan be made subject to termination by a fund at any time, and
(d) a fund receives a reasonable return on the loan (consisting of the return
achieved on investment of the cash collateral, less the rebate owed to
borrowers, plus distributions on the loaned securities and any increase in
their market value).
A fund may pay reasonable fees in connection with loaned securities, pursuant
to written contracts, including fees paid to a fund's custodian and fees paid
to a securities lending agent. Voting rights may pass with the loaned
securities, but if an event occurs that the Advisor determines to be a material
event affecting an investment on loan, the loan must be called and the
securities voted. Pursuant to an exemptive order granted by the SEC, cash
collateral received by a fund may be invested in a money market fund managed by
the Advisor (or one of its affiliates).
A fund is subject to all investment risks associated with the reinvestment of
any cash collateral received, including, but not limited to, interest rate,
credit and liquidity risk associated with such investments. To the extent the
value or return of a fund's investments of the cash collateral declines below
the amount owed to a borrower, a fund may incur losses that exceed the amount
it earned on lending the security. If the borrower defaults on its obligation
to return securities lent because of insolvency or other reasons, a fund could
experience delays and costs in recovering the securities lent or gaining access
to collateral. If a fund is not able to recover securities lent, a fund may
sell the collateral and purchase a replacement investment in the market,
incurring the risk that the value of the replacement security is greater than
the value of the collateral. However, loans will be made only to borrowers
selected by a fund's delegate after a commercially reasonable review of
relevant facts and circumstances, including the creditworthiness of the
borrower.
MAINTENANCE OF $1.00 NET ASSET VALUE, CREDIT QUALITY AND PORTFOLIO MATURITY
(FOR MONEY MARKET FUNDS ONLY). A fund effects purchases and redemptions at its
net asset value per share. In fulfillment of its responsibilities under Rule
2a-7 of the 1940 Act, the Board has approved policies reasonably designed,
taking into account current market conditions and a fund's investment
objective, to stabilize a fund's net asset value per share, and the Board will
periodically review the Advisor's operations under such policies at regularly
scheduled Board meetings. In addition to imposing limitations on the quality
and maturity of portfolio instruments held by a fund as described in the
prospectus, those
II-104
policies include a weekly monitoring by the Advisor of unrealized gains and
losses in a fund and, when necessary, in an effort to avoid a material
deviation of a fund's net asset value per share determined by reference to
market valuations from a fund's $1.00 price per share, taking corrective
action, such as adjusting the maturity of a fund, or, if possible, realizing
gains or losses to offset in part unrealized losses or gains. The result of
those policies may be that the yield on shares of a fund will be lower than
would be the case if the policies were not in effect. Such policies also
provide for certain action to be taken with respect to portfolio securities
which experience a downgrade in rating or suffer a default. There is no
assurance that a fund's net asset value per share will be maintained at $1.00.
MICRO-CAP COMPANIES. Micro-capitalization company stocks have customarily
involved more investment risk than large company stocks. There can be no
assurance that this will continue to be true in the future.
Micro-capitalization companies may have limited product lines, markets or
financial resources; may lack management depth or experience; and may be more
vulnerable to adverse general market or economic developments than large
companies. The prices of micro-capitalization company securities are often more
volatile than prices associated with large company issues, and can display
abrupt or erratic movements at times, due to limited trading volumes and less
publicly available information.
Also, because micro-capitalization companies normally have fewer shares
outstanding and these shares trade less frequently than large companies, it may
be more difficult for a fund to buy and sell significant amounts of such shares
without an unfavorable impact on prevailing market prices.
Some of the companies in which a fund may invest may distribute, sell or
produce products which have recently been brought to market and may be
dependent on key personnel. The securities of micro-capitalization companies
are often traded over-the-counter and may not be traded in the volumes typical
on a national securities exchange. Consequently, in order to sell this type of
holding, a fund may need to discount the securities from recent prices or
dispose of the securities over a long period of time.
MINING AND EXPLORATION RISKS. The business of mining by its nature involves
significant risks and hazards, including environmental hazards, industrial
accidents, labor disputes, discharge of toxic chemicals, fire, drought,
flooding and natural acts. The occurrence of any of these hazards can delay
production, increase production costs and result in liability to the operator
of the mines. A mining operation may become subject to liability for pollution
or other hazards against which it has not insured or cannot insure, including
those in respect of past mining activities for which it was not responsible.
Exploration for gold and other precious metals is speculative in nature,
involves many risks and frequently is unsuccessful. There can be no assurance
that any mineralisation discovered will result in an increase in the proven and
probable reserves of a mining operation. If reserves are developed, it can take
a number of years from the initial phases of drilling and identification of
mineralisation until production is possible, during which time the economic
feasibility of production may change. Substantial expenditures are required to
establish ore reserves properties and to construct mining and processing
facilities. As a result of these uncertainties, no assurance can be given that
the exploration programs undertaken by a particular mining operation will
actually result in any new commercial mining.
MORTGAGE-BACKED SECURITIES. Mortgage-backed securities represent direct or
indirect participations in or obligations collateralized by and payable from
mortgage loans secured by real property, which may include subprime mortgages.
A fund may invest in mortgage-backed securities issued or guaranteed by (i) US
Government agencies or instrumentalities such as the Government National
Mortgage Association (GNMA) (also known as Ginnie Mae), the Federal National
Mortgage Association (FNMA) (also known as Fannie Mae) and the Federal Home
Loan Mortgage Corporation (FHLMC) (also known as Freddie Mac) or (ii) other
issuers, including private companies.
GNMA is a government-owned corporation that is an agency of the US Department
of Housing and Urban Development. It guarantees, with the full faith and credit
of the United States, full and timely payment of all monthly principal and
interest on its mortgage-backed securities. Until recently, FNMA and FHLMC were
government-sponsored corporations owned entirely by private stockholders. Both
issue mortgage-related securities that contain guarantees as to timely payment
of interest and principal but that are not backed by the full faith and credit
of the US government. The value of the companies' securities fell sharply in
2008 due to concerns that the firms did not have sufficient capital to offset
losses. In mid-2008, the US Treasury was authorized to increase the size of
home loans that FNMA and FHLMC could
II-105
purchase in certain residential areas and, until 2009, to lend FNMA and FHLMC
emergency funds and to purchase the companies' stock. In September 2008, the US
Treasury announced that FNMA and FHLMC had been placed in conservatorship by
the Federal Housing Finance Agency (FHFA), a newly created independent
regulator created under the Federal Housing Finance Regulatory Reform Act of
2008 (Reform Act). In addition to placing the companies in conservatorship, the
US Treasury announced three additional steps that it intended to take with
respect to FNMA and FHLMC. First, the US Treasury has entered into preferred
stock purchase agreements ("PSPAs") under which, if the FHFA determines that
FNMA's or FHLMC's liabilities have exceeded its assets under generally accepted
accounting principles, the US Treasury will contribute cash capital to the
company in an amount equal to the difference between liabilities and assets.
The PSPAs are designed to provide protection to the senior and subordinated
debt and the mortgage-backed securities issued by FNMA and FHLMC. Second, the
US Treasury established a new secured lending credit facility that is available
to FNMA and FHLMC until December 2009. Third, the US Treasury initiated a
temporary program to purchase FNMA and FHLMC mortgage-backed securities, which
is expected to continue until December 2009. No assurance can be given that the
US Treasury initiatives discussed above with respect to the debt and
mortgage-backed securities issued by FNMA and FHLMC will be successful.
FHFA, as conservator or receiver for FNMA and FHLMC, has the power to repudiate
any contract entered into by FNMA or FHLMC prior to FHFA's appointment as
conservator or receiver, as applicable, if FHFA determines, in its sole
discretion, that performance of the contract is burdensome and that repudiation
of the contract promotes the orderly administration of FNMA's or FHLMC's
affairs. The Reform Act requires FHFA to exercise its right to repudiate any
contract within a reasonable period of time after its appointment as
conservator or receiver. FHFA, in its capacity as conservator, has indicated
that it has no intention to repudiate the guaranty obligations of FNMA or FHLMC
because FHFA views repudiation as incompatible with the goals of the
conservatorship. However, in the event that FHFA, as conservator or if it is
later appointed as receiver for FNMA or FHLMC, were to repudiate any such
guaranty obligation, the conservatorship or receivership estate, as applicable,
would be liable for actual direct compensatory damages in accordance with the
provisions of the Reform Act. Any such liability could be satisfied only to the
extent of FNMA's or FHLMC's assets available therefor.
In the event of repudiation, the payments of interest to holders of FNMA or
FHLMC mortgage-backed securities would be reduced if payments on the mortgage
loans represented in the mortgage loan groups related to such mortgage-backed
securities are not made by the borrowers or advanced by the servicer. Any
actual direct compensatory damages for repudiating these guaranty obligations
may not be sufficient to offset any shortfalls experienced by such
mortgage-backed security holders. Further, in its capacity as conservator or
receiver, FHFA has the right to transfer or sell any asset or liability of FNMA
or FHLMC without any approval, assignment or consent. Although FHFA has stated
that it has no present intention to do so, if FHFA, as conservator or receiver,
were to transfer any such guaranty obligation to another party, holders of FNMA
or FHLMC mortgage-backed securities would have to rely on that party for
satisfaction of the guaranty obligation and would be exposed to the credit risk
of that party.
In addition, certain rights provided to holders of mortgage-backed securities
issued by FNMA and FHLMC under the operative documents related to such
securities may not be enforced against FHFA, or enforcement of such rights may
be delayed, during the conservatorship or any future receivership. The
operative documents for FNMA and FHLMC mortgage-backed securities may provide
(or with respect to securities issued prior to the date of the appointment of
the conservator may have provided) that upon the occurrence of an event of
default on the part of FNMA or FHLMC, in its capacity as guarantor, which
includes the appointment of a conservator or receiver, holders of such
mortgage-backed securities have the right to replace FNMA or FHLMC as trustee
if the requisite percentage of mortgage-backed securities holders consent. The
Reform Act prevents mortgage-backed security holders from enforcing such rights
if the event of default arises solely because a conservator or receiver has
been appointed. The Reform Act also provides that no person may exercise any
right or power to terminate, accelerate or declare an event of default under
certain contracts to which FNMA or FHLMC is a party, or obtain possession of or
exercise control over any property of FNMA or FHLMC, or affect any contractual
rights of FNMA or FHLMC, without the approval of FHFA, as conservator or
receiver, for a period of 45 or 90 days following the appointment of FHFA as
conservator or receiver, respectively.
The market value and yield of these mortgage-backed securities can vary due to
market interest rate fluctuations and early prepayments of underlying
mortgages. These securities represent ownership in a pool of federally insured
mortgage loans with a maximum maturity of 30 years. A decline in interest rates
may lead to a faster rate of repayment of the
II-106
underlying mortgages, and may expose a fund to a lower rate of return upon
reinvestment. To the extent that such mortgage-backed securities are held by a
fund, the prepayment right will tend to limit to some degree the increase in
net asset value of a fund because the value of the mortgage-backed securities
held by a fund may not appreciate as rapidly as the price of non-callable debt
securities. Mortgage-backed securities are subject to the risk of prepayment
and the risk that the underlying loans will not be repaid. Because principal
may be prepaid at any time, mortgage-backed securities may involve
significantly greater price and yield volatility than traditional debt
securities. At times, a fund may invest in securities that pay higher than
market interest rates by paying a premium above the securities' par value.
Prepayments of these securities may cause losses on securities purchased at a
premium. Unscheduled payments, which are made at par value, will cause a fund
to experience a loss equal to any unamortized premium.
When interest rates rise, mortgage prepayment rates tend to decline, thus
lengthening the life of a mortgage-related security and increasing the price
volatility of that security, affecting the price volatility of a fund's shares.
The negative effect of interest rate increases on the market-value of mortgage
backed securities is usually more pronounced than it is for other types of
fixed-income securities potentially increasing the volatility of a fund.
Interests in pools of mortgage-backed securities differ from other forms of
debt securities, which normally provide for periodic payment of interest in
fixed amounts with principal payments at maturity or specified call dates.
Instead, these securities provide a monthly payment which consists of both
interest and principal payments. In effect, these payments are a "pass-through"
of the monthly payments made by the individual borrowers on their mortgage
loans, net of any fees paid to the issuer or guarantor of such securities.
Additional payments are caused by repayments of principal resulting from the
sale of the underlying property, refinancing or foreclosure, net of fees or
costs which may be incurred. Some mortgage-related securities (such as
securities issued by GNMA) are described as "modified pass-through." These
securities entitle the holder to receive all interest and principal payments
owed on the mortgage pool, net of certain fees, at the scheduled payment dates
regardless of whether or not the mortgagor actually makes the payment.
Commercial banks, savings and loan institutions, private mortgage insurance
companies, mortgage bankers and other secondary market issuers also create
pass-through pools of conventional mortgage loans. Such issuers may, in
addition, be the originators and/or servicers of the underlying mortgage loans
as well as the guarantors of the mortgage-related securities. Pools created by
such non-governmental issuers generally offer a higher rate of interest than
government and government-related pools because there are no direct or indirect
government or agency guarantees of payments. However, timely payment of
interest and principal of these pools may be supported by various forms of
insurance or guarantees, including individual loan, title, pool and hazard
insurance and letters of credit. The insurance and guarantees are issued by
governmental entities, private insurers and the mortgage poolers. Such
insurance and guarantees and the creditworthiness of the issuers thereof will
be considered in determining whether a mortgage-related security meets a fund's
investment quality standards. There can be no assurance that the private
insurers or guarantors can meet their obligations under the insurance policies
or guarantee arrangements. A fund may buy mortgage-related securities without
insurance or guarantees. Although the market for such securities is becoming
increasingly liquid, securities issued by certain private organizations may not
be readily marketable.
Due to prepayments of the underlying mortgage instruments, mortgage-backed
securities do not have a known actual maturity. In the absence of a known
maturity, market participants generally refer to an estimated average life. An
average life estimate is a function of an assumption regarding anticipated
prepayment patterns. The assumption is based upon current interest rates,
current conditions in the relevant housing markets and other factors. The
assumption is necessarily subjective, and thus different market participants
could produce somewhat different average life estimates with regard to the same
security. There can be no assurance that the average estimated life of
portfolio securities will be the actual average life of such securities.
Fannie Mae Certificates. Fannie Mae is a federally chartered corporation
organized and existing under the Federal National Mortgage Association Charter
Act of 1938. The obligations of Fannie Mae are obligations solely of Fannie Mae
and are not backed by the full faith and credit of the US government.
II-107
Each Fannie Mae Certificate will represent a pro rata interest in one or more
pools of FHA Loans, VA Loans or conventional mortgage loans (i.e., mortgage
loans that are not insured or guaranteed by any governmental agency) of the
following types: (1) fixed-rate level payment mortgage loans; (2) fixed-rate
growing equity mortgage loans; (3) fixed-rate graduated payment mortgage loans;
(4) variable rate mortgage loans; (5) other adjustable rate mortgage loans; and
(6) fixed-rate and adjustable mortgage loans secured by multifamily projects.
Freddie Mac Certificates. Freddie Mac is a federally chartered corporation of
the United States created pursuant to the Emergency Home Finance Act of 1970,
as amended (FHLMC Act). The obligations of Freddie Mac are obligations solely
of Freddie Mac and are not backed by the full faith and credit of the US
government.
Freddie Mac Certificates represent a pro rata interest in a group of
conventional mortgage loans (Freddie Mac Certificate group) purchased by
Freddie Mac. The mortgage loans underlying the Freddie Mac Certificates will
consist of fixed-rate or adjustable rate mortgage loans with original terms to
maturity of between ten and thirty years, substantially all of which are
secured by first liens on one- to four-family residential properties or
multifamily projects. Each mortgage loan must meet the applicable standards set
forth in the FHLMC Act. A Freddie Mac Certificate group may include whole
loans, participating interests in whole loans and undivided interests in whole
loans and participations comprising another Freddie Mac Certificate group.
Ginnie Mae Certificates. The National Housing Act of 1934, as amended (Housing
Act), authorizes Ginnie Mae to guarantee the timely payment of the principal of
and interest on certificates that are based on and backed by a pool of mortgage
loans insured by the Federal Housing Administration under the Housing Act, or
Title V of the Housing Act of 1949 (FHA Loans), or guaranteed by the Department
of Veterans Affairs under the Servicemen's Readjustment Act of 1944, as amended
(VA Loans), or by pools of other eligible mortgage loans. The Housing Act
provides that the full faith and credit of the US government is pledged to the
payment of all amounts that may be required to be paid under any Ginnie Mae
guaranty. In order to meet its obligations under such guaranty, Ginnie Mae is
authorized to borrow from the US Treasury with no limitations as to amount.
The Ginnie Mae Certificates in which a fund invests will represent a pro rata
interest in one or more pools of the following types of mortgage loans: (1)
fixed-rate level payment mortgage loans; (2) fixed-rate graduated payment
mortgage loans; (3) fixed-rate growing equity mortgage loans; (4) fixed-rate
mortgage loans secured by manufactured (mobile) homes; (5) mortgage loans on
multifamily residential properties under construction; (6) mortgage loans on
completed multifamily projects; (7) fixed-rate mortgage loans as to which
escrowed funds are used to reduce the borrower's monthly payments during the
early years of the mortgage loans ("buy down" mortgage loans); (8) mortgage
loans that provide for adjustments in payments based on periodic changes in
interest rates or in other payment terms of the mortgage loans; and (9)
mortgage backed serial notes.
Multiple Class Mortgage-Backed Securities. A fund may invest in multiple class
mortgage-backed securities including collateralized mortgage obligations (CMOs)
and real estate mortgage investment conduits (REMIC Certificates). These
securities may be issued by US government agencies and instrumentalities such
as Fannie Mae or Freddie Mac or by trusts formed by private originators of, or
investors in, mortgage loans, including savings and loan associations, mortgage
bankers, commercial banks, insurance companies, investment banks and special
purpose subsidiaries of the foregoing. In general, CMOs are debt obligations of
a legal entity that are collateralized by a pool of mortgage loans or
mortgage-backed securities the payments on which are used to make payments on
the CMOs or multiple class mortgage-backed securities. REMIC Certificates
represent beneficial ownership interests in a REMIC trust, generally consisting
of mortgage loans or Fannie Mae, Freddie Mac or Ginnie Mae guaranteed
mortgage-backed securities. To the extent that a CMO or REMIC Certificate is
collateralized by Ginnie Mae guaranteed mortgage-backed securities, holders of
the CMO or REMIC Certfiicate receive all interest and principal payments owed
on the mortgage pool, net of certain fees, regardless of whether the mortgagor
actually makes the payments, as a result of the GNMA guaranty, which is backed
by the full faith and credit of the US government. The obligations of Fannie
Mae or Freddie Mac under their respective guaranty of the REMIC Certificates
are obligations solely of Fannie Mae or Freddie Mac, respectively.
II-108
Fannie Mae REMIC Certificates are issued and guaranteed as to timely
distribution of principal and interest by Fannie Mae. These certificates are
obligations solely of Fannie Mae and are not backed by the full faith and
credit of the US government. In addition, Fannie Mae will be obligated to
distribute the principal balance of each class of REMIC Certificates in full,
whether or not sufficient funds are otherwise available.
Freddie Mac guarantees the timely payment of interest on Freddie Mac REMIC
Certificates and also guarantees the payment of principal as payments are
required to be made on the underlying mortgage participation certificates
(PCs). These certificates are obligations solely of Freddie Mac and are not
backed by the full faith and credit of the US government. PCs represent
undivided interests in specified level payment residential mortgages or
participations therein purchased by Freddie Mac and placed in a PC pool. With
respect to principal payments on PCs, Freddie Mac generally guarantees ultimate
collection of all principal of the related mortgage loans without offset or
deduction. Freddie Mac also guarantees timely payment of principal of certain
PCs.
CMOs and REMIC Certificates are issued in multiple classes. Each class of CMOs
or REMIC Certificates, often referred to as a "tranche," is issued at a
specific adjustable or fixed interest rate and must be fully retired no later
than its final distribution date. Principal prepayments on the underlying
mortgage loans or the mortgage-backed securities underlying the CMOs or REMIC
Certificates may cause some or all of the classes of CMOs or REMIC Certificates
to be retired substantially earlier than their final distribution dates.
Generally, interest is paid or accrues on all classes of CMOs or REMIC
Certificates on a monthly basis.
The principal of and interest on the mortgage-backed securities may be
allocated among the several tranches in various ways. In certain structures
(known as sequential pay CMOs or REMIC Certificates), payments of principal,
including any principal prepayments, on the mortgage-backed securities
generally are applied to the classes of CMOs or REMIC Certificates in the order
of their respective final distribution dates. Thus, no payment of principal
will be made on any class of sequential pay CMOs or REMIC Certificates until
all other classes having an earlier final distribution date have been paid in
full. Additional structures of CMOs and REMIC Certificates include, among
others, "parallel pay" CMOs and REMIC Certificates. Parallel pay CMOs or REMIC
Certificates are those which are structured to apply principal payments and
prepayments of the mortgage-backed securities to two or more classes
concurrently on a proportionate or disproportionate basis. These simultaneous
payments are taken into account in calculating the final distribution date of
each class.
A wide variety of REMIC Certificates may be issued in parallel pay or
sequential pay structures. These securities include accrual certificates (Z
Bonds), which only accrue interest at a specified rate until all other
certificates having an earlier final distribution date have been retired and
are converted thereafter to an interest-paying security, and planned
amortization class (PAC) certificates, which are parallel pay REMIC
Certificates that generally require that specified amounts of principal be
applied on each payment date to one or more classes of REMIC Certificates (PAC
Certificates), even though all other principal payments and prepayments of the
mortgage-backed securities are then required to be applied to one or more other
classes of the PAC Certificates. The scheduled principal payments for the PAC
Certificates generally have the highest priority on each payment date after
interest due has been paid to all classes entitled to receive interest
currently. Shortfalls, if any, are added to the amount payable on the next
payment date. The PAC Certificate payment schedule is taken into account in
calculating the final distribution date of each class of PAC. In order to
create PAC tranches, one or more tranches generally must be created that absorb
most of the volatility in the underlying mortgage-backed securities. These
tranches tend to have market prices and yields that are much more volatile than
other PAC classes.
The prices of certain CMOs and REMIC Certificates, depending on their structure
and the rate of prepayments, may be volatile. Some CMOs may also not be as
liquid as other securities. In addition, the value of a CMO or REMIC
Certifiate, including those collateralized by mortgage-backed securities issued
or guaranteed by US government agencies or instrumentalities, may be affected
by other factors, such as the availablility of information concerning the pool
and its structure, the creditworthiness of the servicing agent for the pool,
the originator of the underlying assets, or the entities providing credit
enhancement. The value of these securities also can depend on the ability of
their servicers to service the underlying collateral and is, therefore, subject
to risks associated with servicers' performance, including mishandling of
documentation. A fund is permitted to invest in other types of mortgage-backed
securities that may be available in the future to the extent consistent with
its investment policies and objective.
II-109
Impact of Sub-Prime Mortgage Market. A fund may invest in mortgage-backed,
asset-backed and other fixed-income securities whose value and liquidity may be
adversely affected by the critical downturn in the sub-prime mortgage lending
market in the US. Sub-prime loans, which have higher interest rates, are made
to borrowers with low credit ratings or other factors that increase the risk of
default. Concerns about widespread defaults on sub-prime loans have also
created heightened volatility and turmoil in the general credit markets. As a
result, a fund's investments in certain fixed-income securities may decline in
value, their market value may be more difficult to determine, and a fund may
have more difficulty disposing of them.
MUNICIPAL LEASES, CERTIFICATES OF PARTICIPATION AND OTHER PARTICIPATION
INTERESTS. A municipal lease is an obligation in the form of a lease or
installment purchase contract that is issued by a state or local government to
acquire equipment and facilities. Income from such obligations is generally
exempt from state and local taxes in the state of issuance (as well as regular
Federal income tax). Municipal leases frequently involve special risks not
normally associated with general obligation or revenue bonds, such as
non-payment and the risk of bankruptcy of the issuer. Leases and installment
purchase or conditional sale contracts (which normally provide for title to the
leased asset to pass eventually to the governmental issuer) have evolved as a
means for governmental issuers to acquire property and equipment without
meeting the constitutional and statutory requirements for the issuance of debt.
The debt issuance limitations are deemed to be inapplicable because of the
inclusion in many leases or contracts of "non-appropriation" clauses that
relieve the governmental issuer of any obligation to make future payments under
the lease or contract unless money is appropriated for such purpose by the
appropriate legislative body on a yearly or other periodic basis. Thus, a
fund's investment in municipal leases will be subject to the special risk that
the governmental issuer may not appropriate funds for lease payments.
In addition, such leases or contracts may be subject to the temporary abatement
of payments in the event the issuer is prevented from maintaining occupancy of
the leased premises or utilizing the leased equipment. Although the obligations
may be secured by the leased equipment or facilities, the disposition of the
property in the event of non-appropriation or foreclosure might prove
difficult, time consuming and costly, and result in an unsatisfactory or
delayed recoupment of a fund's original investment.
Certificates of participation represent undivided interests in municipal
leases, installment purchase contracts or other instruments. The certificates
are typically issued by a trust or other entity that has received an assignment
of the payments to be made by the state or political subdivision under such
leases or installment purchase contracts.
Certain municipal lease obligations and certificates of participation may be
deemed illiquid for the purpose of a fund's limitations on investments in
illiquid securities. Other municipal lease obligations and certificates of
participation acquired by a fund may be determined by the Advisor, pursuant to
guidelines adopted by the Board, to be liquid securities for the purpose of a
fund's limitation on investments in illiquid securities. In determining the
liquidity of municipal lease obligations and certificates of participation, the
Advisor will consider a variety of factors including: (1) dealer undertakings
to make a market in the security; (2) the number of dealers willing to purchase
or sell the obligation and the number of other potential buyers; (3) the
frequency of trades or quotes for the obligation; and (4) the nature of the
security and market for the security (i.e., the time needed to dispose of the
security, the method of soliciting offers, and the mechanics of the transfer.)
In addition, the Advisor will consider factors unique to particular lease
obligations and certificates of participation affecting the marketability
thereof. These include the general creditworthiness of the issuer, the
importance to the issuer of the property covered by the lease and the
likelihood that the marketability of the obligation will be maintained
throughout the time the obligation is held by a fund.
A fund may purchase participations in municipal securities held by a commercial
bank or other financial institution, provided the participation interest is
fully insured. Such participations provide a fund with the right to a pro rata
undivided interest in the underlying municipal securities. In addition, such
participations generally provide a fund with the right to demand payment, on
not more than seven days notice, of all or any part of a fund's participation
interest in the underlying municipal security, plus accrued interest.
Each participation is backed by an irrevocable letter of credit or guarantee of
the selling bank that the Advisor has determined meets the prescribed quality
standards of a fund. Therefore, either the credit of the issuer of the
municipal obligation or the selling bank, or both, will meet the quality
standards of the particular fund. A fund has the right to
II-110
sell the participation back to the bank after seven days' notice for the full
principal amount of a fund's interest in the municipal obligation plus accrued
interest, but only (i) as required to provide liquidity to a fund, (ii) to
maintain a high quality investment portfolio or (iii) upon a default under the
terms of the municipal obligation. The selling bank will receive a fee from a
fund in connection with the arrangement.
Participation interests in municipal securities are subject to the same general
risks as participation interests in bank loans, as described in the Bank Loans
section above. Such risks include credit risk, interest rate risk, and
liquidity risk, as well as the potential liability associated with being a
lender. If a fund purchases a participation, it may only be able to enforce its
rights through the participating lender, and may assume the credit risk of both
the lender and the borrower.
MUNICIPAL SECURITIES. Municipal obligations are issued by or on behalf of
states, territories and possessions of the United States and their political
subdivisions, agencies and instrumentalities and the District of Columbia to
obtain funds for various public purposes. The interest on these obligations is
generally exempt from regular federal income tax in the hands of most
investors. The two principal classifications of municipal obligations are
"notes" and "bonds."
Municipal notes are generally used to provide for short-term capital needs.
Municipal notes include: Tax Anticipation Notes, Revenue Anticipation Notes,
Bond Anticipation Notes, and Construction Loan Notes. Tax Anticipation Notes
are sold to finance working capital needs of municipalities. They are generally
payable from specific tax revenues expected to be received at a future date,
such as income, sales, property, use and business taxes. Revenue Anticipation
Notes are issued in expectation of receipt of other types of revenue, such as
federal revenues available under federal revenue sharing programs. Bond
Anticipation Notes are sold to provide interim financing until long-term bond
financing can be arranged. In most cases, the long-term bonds provide the funds
needed for the repayment of the notes. Construction Loan Notes are sold to
provide construction financing. After the projects are successfully completed
and accepted, many projects receive permanent financing through the Federal
Housing Administration under Fannie Mae (Federal National Mortgage Association)
or Ginnie Mae (Government National Mortgage Association). These notes are
secured by mortgage notes insured by the Federal Housing Authority; however,
the proceeds from the insurance may be less than the economic equivalent of the
payment of principal and interest on the mortgage note if there has been a
default. The obligations of an issuer of municipal notes are generally secured
by the anticipated revenues from taxes, grants or bond financing. An investment
in such instruments, however, presents a risk that the anticipated revenues
will not be received or that such revenues will be insufficient to satisfy the
issuer's payment obligations under the notes or that refinancing will be
otherwise unavailable. There are, of course, a number of other types of notes
issued for different purposes and secured differently from those described
above.
Municipal bonds, which meet longer-term capital needs and generally have
maturities of more than one year when issued, have two principal
classifications: "general obligation" bonds and "revenue" bonds. Issuers of
general obligation bonds include states, counties, cities, towns and regional
districts. The proceeds of these obligations are used to fund a wide range of
public projects including the construction or improvement of schools, highways
and roads, water and sewer systems and a variety of other public purposes. The
basic security behind general obligation bonds is the issuer's pledge of its
full faith, credit, and taxing power for the payment of principal and interest.
The taxes that can be levied for the payment of debt service may be limited or
unlimited as to rate, amount or special assessments.
The principal security for a revenue bond is generally the net revenues derived
from a particular facility or group of facilities or, in some cases, from the
proceeds of a special excise or other specific revenue source. Revenue bonds
have been issued to fund a wide variety of capital projects including:
electric, gas, water and sewer systems; highways, bridges and tunnels; port and
airport facilities; colleges and universities; and hospitals. Although the
principal security behind these bonds varies widely, many provide additional
security in the form of a debt service reserve fund whose monies may also be
used to make principal and interest payments on the issuer's obligations.
Housing finance authorities have a wide range of security including partially
or fully-insured, rent-subsidized or collateralized mortgages, and the net
revenues from housing or other public projects. In addition to a debt service
reserve fund, some authorities provide further security in the form of a
state's ability (without obligation) to make up deficiencies in the debt
reserve fund. Lease rental bonds issued by a state or local authority for
capital projects are secured by annual lease rental payments from the state or
locality to the authority sufficient to cover debt service on the authority's
obligations.
II-111
Some issues of municipal bonds are payable from United States Treasury bonds
and notes or agency obligations held in escrow by a trustee, frequently a
commercial bank. The interest and principal on these US Government securities
are sufficient to pay all interest and principal requirements of the municipal
securities when due. Some escrowed Treasury securities are used to retire
municipal bonds at their earliest call date, while others are used to retire
municipal bonds at their maturity.
Securities purchased for a fund may include variable/floating rate instruments,
variable mode instruments, put bonds, and other obligations which have a
specified maturity date but also are payable before maturity after notice by
the holder (demand obligations). Demand obligations are considered for a fund's
purposes to mature at the demand date.
In addition, there are a variety of hybrid and special types of municipal
obligations as well as numerous differences in the security of municipal
obligations both within and between the two principal classifications (i.e.,
notes and bonds) discussed above.
An entire issue of municipal securities may be purchased by one or a small
number of institutional investors such as a fund. Thus, such an issue may not
be said to be publicly offered. Unlike the equity securities of operating
companies or mutual funds which must be registered under the 1933 Act prior to
offer and sale unless an exemption from such registration is available,
municipal securities, whether publicly or privately offered, may nevertheless
be readily marketable. A secondary market exists for municipal securities which
have been publicly offered as well as securities which have not been publicly
offered initially but which may nevertheless be readily marketable. Municipal
securities purchased for a fund are subject to the limitations on holdings of
securities which are not readily marketable based on whether it may be sold in
a reasonable time consistent with the customs of the municipal markets (usually
seven days) at a desirable price (or interest rate). A fund believes that the
quality standards applicable to its investments enhance marketability. In
addition, stand-by commitments, participation interests and demand obligations
also enhance marketability.
Provisions of the federal bankruptcy statutes relating to the adjustment of
debts of political subdivisions and authorities of states of the US provide
that, in certain circumstances, such subdivisions or authorities may be
authorized to initiate bankruptcy proceedings without prior notice to or
consent of creditors, which proceedings could result in material and adverse
modification or alteration of the rights of holders of obligations issued by
such subdivisions or authorities.
Litigation challenging the validity under state constitutions of present
systems of financing public education has been initiated or adjudicated in a
number of states, and legislation has been introduced to effect changes in
public school finances in some states. In other instances there has been
litigation challenging the issuance of pollution control revenue bonds or the
validity of their issuance under state or federal law which litigation could
ultimately affect the validity of those municipal securities or the tax-free
nature of the interest thereon.
In some cases, municipalities may issue bonds relying on proceeds from
litigation settlements. These bonds may be further secured by debt service
reserve funds established at the time the bonds were issued. Bonds that are
supported in whole or in part by expected litigation proceeds are subject to
the risk that part or all of the expected proceeds may not be received. For
example, a damage award could be overturned or reduced by a court, or the terms
of a settlement or damage award may allow for reduced or discontinued payments
if certain conditions are met. As a result, bonds that rely on proceeds from
litigation settlements are subject to an increased risk of nonpayment or
default.
Insured Municipal Securities. A fund may purchase municipal securities that are
insured under policies issued by certain insurance companies. Insured municipal
securities typically receive a higher credit rating which means that the issuer
of the securities pays a lower interest rate. In purchasing such insured
securities, the Advisor gives consideration both to the insurer and to the
credit quality of the underlying issuer. The insurance reduces the credit risk
for a particular municipal security by supplementing the creditworthiness of
the underlying bond and provides additional security for payment of the
principal and interest of a municipal security. Certain of the insurance
companies that provide insurance for municipal securities provide insurance for
other types of securities, including some involving subprime mortgages. The
value of subprime mortgage securities has declined recently and some may
default, increasing a bond insurer's risk of having to make payments to holders
of subprime mortgage securities. Because of this risk, the ratings of some
II-112
insurance companies have been, or may be, downgraded and it is possible that an
insurance company may become insolvent. If an insurance company's rating is
downgraded or the company becomes insolvent, the prices of municipal securities
insured by the insurance company may decline.
Letters of Credit. Municipal obligations, including certificates of
participation, commercial paper and other short-term obligations may be backed
by an irrevocable letter of credit of a bank which assumes the obligation for
payment of principal and interest in the event of default by the issuer.
Pre-Refunded Municipal Securities. Pre-refunded municipal securities are
subject to interest rate risk, market risk and limited liquidity. The principal
of and interest on municipal securities that have been pre-refunded are no
longer paid from the original revenue source for the securities. Instead, after
pre-refunding of the principal of and interest on these securities are
typically paid from an escrow fund consisting of obligations issued or
guaranteed by the US Government. The assets in the escrow fund are derived from
the proceeds of refunding bonds issued by the same issuer as the pre-refunded
municipal securities. Issuers of municipal securities use this advance
refunding technique to obtain more favorable terms with respect to securities
that are not yet subject to call or redemption by the issuer. For example,
advance refunding enables an issuer to refinance debt at lower market interest
rates, restructure debt to improve cash flow or eliminate restrictive covenants
in the indenture or other governing instrument for the pre-refunded municipal
securities. However, except for a change in the revenue source from which
principal and interest payments are made, the pre-refunded municipal securities
remain outstanding on their original terms until they mature or are redeemed by
the issuer. Pre-refunded municipal securities are usually purchased at a price
which represents a premium over their face value.
MUNICIPAL TRUST RECEIPTS. Municipal trust receipts (MTRs) are sometimes called
municipal asset-backed securities, floating rate trust certificates, or
municipal securities trust receipts. MTRs are typically structured by a bank,
broker-dealer or other financial institution by depositing municipal securities
into a trust or partnership, coupled with a conditional right to sell, or put,
the holder's interest in the underlying securities at par plus accrued interest
to a financial institution. MTRs may be issued as fixed or variable rate
instruments. These trusts are organized so that the purchaser of the MTR would
be considered to be investing for federal income tax purposes in the underlying
municipal securities. This structure is intended to allow the federal income
tax exempt status of interest generated by the underlying asset to pass through
to the purchaser. A fund's investments in MTRs are subject to similar risks as
other investments in municipal debt obligations, including interest rate risk,
credit risk, prepayment risk and security selection risk. Additionally,
investments in MTRs raise certain tax issues that may not be presented by
direct investments in municipal bonds. There is some risk that certain legal
issues could be resolved in a manner that could adversely impact the
performance of a fund. The Advisor expects that it would invest in MTRs for
which a legal opinion has been given to the effect that the income from an MTR
is tax-exempt for federal income tax purposes to the same extent as the
underlying bond(s), although it is possible that the IRS will take a different
position and there is a risk that the interest paid on such MTRs would be
deemed taxable.
OBLIGATIONS OF BANKS AND OTHER FINANCIAL INSTITUTIONS. A fund may invest in US
dollar-denominated fixed rate or variable rate obligations of US or foreign
financial institutions, including banks. Obligations of domestic and foreign
financial institutions in which a fund may invest include (but are not limited
to) certificates of deposit, bankers' acceptances, bank time deposits,
commercial paper, and other US dollar-denominated instruments issued or
supported by the credit of US or foreign financial institutions, including
banks.
Obligations of foreign branches of US banks and foreign banks may be general
obligations of the parent bank in addition to the issuing bank or may be
limited by the terms of a specific obligation and by government regulation. a
fund may invest in US dollar-denominated obligations of foreign banks or
foreign branches of US banks, which include banks located in the United
Kingdom, Grand Cayman Island, Nassau, Japan and Canada.
Investments in these obligations may entail risks that are different from those
of investments in obligations of US domestic banks because of differences in
political, regulatory and economic systems and conditions. These risks include
future political and economic developments, currency blockage, the possible
imposition of withholding taxes on interest payments, possible seizure or
nationalization of foreign deposits, difficulty or inability of pursuing legal
remedies and obtaining judgments in foreign courts, possible establishment of
exchange controls, or the adoption of other foreign
II-113
governmental restrictions that might affect adversely the payment of principal
and interest on bank obligations, and potentially limited liquidity. Foreign
branches of US banks and foreign banks may also be subject to less stringent
reserve requirements and to different accounting, auditing, reporting and
record keeping standards than those applicable to domestic branches of US banks
and may have limited information availability.
PARTICIPATION INTERESTS. A fund may purchase from financial institutions
participation interests in securities in which a fund may invest. A
participation interest gives a fund an undivided interest in the security in
the proportion that a fund's participation interest bears to the principal
amount of the security. These instruments may have fixed, floating or variable
interest rates. If the participation interest is unrated, or has been given a
rating below that which is permissible for purchase by a fund, the
participation interest will be backed by an irrevocable letter of credit or
guarantee of a bank, or the payment obligation otherwise will be collateralized
by US Government securities, or, in the case of unrated participation interest,
determined by the Advisor to be of comparable quality to those instruments in
which a fund may invest. For certain participation interests, a fund will have
the right to demand payment, on not more than seven days' notice, for all or
any part of a fund's participation interests in the security, plus accrued
interest. As to these instruments, a fund generally intends to exercise its
right to demand payment only upon a default under the terms of the security.
PREFERRED STOCK. Preferred stock is an equity security, but possesses certain
attributes of debt securities. Holders of preferred stock normally have the
right to receive dividends at a fixed rate when and as declared by the issuer's
board of directors, but do not otherwise participate in amounts available for
distribution by the issuing corporation. Dividends on preferred stock may be
cumulative, and, in such cases, all cumulative dividends usually must be paid
prior to dividend payments to common stockholders. Preferred stock has a
preference (i.e., ranks higher) in liquidation (and generally dividends) over
common stock, but is subordinated (i.e., ranks lower) in liquidation to fixed
income securities. Because of this preference, preferred stocks generally
entail less risk than common stocks. As a general rule, the market value of
preferred stocks with fixed dividend rates and no conversion rights moves
inversely with interest rates and perceived credit risk, with the price
determined by the dividend rate. Some preferred stocks are convertible into
other securities (e.g., common stock) at a fixed price and ratio or upon the
occurrence of certain events. The market price of convertible preferred stocks
generally reflects an element of conversion value. Because many preferred
stocks lack a fixed maturity date, these securities generally fluctuate
substantially in value when interest rates change; such fluctuations often
exceed those of long-term bonds of the same issuer. Some preferred stocks pay
an adjustable dividend that may be based on an index, formula, auction
procedure or other dividend rate reset mechanism. In the absence of credit
deterioration, adjustable rate preferred stocks tend to have more stable market
values than fixed rate preferred stocks.
All preferred stocks are also subject to the same types of credit risks as
corporate bonds. In addition, because preferred stock is subordinate to debt
securities and other obligations of an issuer, deterioration in the credit
rating of the issuer will cause greater changes in the value of a preferred
stock than in a more senior debt security with similar yield characteristics.
Preferred stocks may be rated by the Standard & Poor's Division of the
McGraw-Hill Companies (S&P) and Moody's Investors Service, Inc. (Moody's)
although there is no minimum rating which a preferred stock must have to be an
eligible investment for a fund.
PRIVATE ACTIVITY BONDS. Certain types of municipal securities, generally
referred to as industrial development bonds (and referred to under current tax
law as private activity bonds), are issued by or on behalf of public
authorities to obtain funds for privately-operated housing facilities, airport,
mass transit or port facilities, sewage disposal, solid waste disposal or
hazardous waste treatment or disposal facilities and certain local facilities
for water supply, gas or electricity. Other types of industrial development
bonds, the proceeds of which are used for the construction, equipment, repair
or improvement of privately operated industrial or commercial facilities, may
constitute municipal securities, although the current federal tax laws place
substantial limitations on the size of such issues. The interest from certain
private activity bonds owned by a fund (including a fund's distributions
attributable to such interest) may be a preference item for purposes of the
alternative minimum tax. The credit quality of such bonds depends upon the
ability of the user of the facilities financed by the bonds and any guarantor
to meet its financial obligations.
PRIVATIZED ENTERPRISES. A fund may invest in foreign securities which may
include securities issued by enterprises that have undergone or are currently
undergoing privatization. The governments of certain foreign countries have, to
varying degrees, embarked on privatization programs contemplating the sale of
all or part of their interests in state
II-114
enterprises. A fund's investments in the securities of privatized enterprises
may include privately negotiated investments in a government or state-owned or
controlled company or enterprise that has not yet conducted an initial equity
offering, investments in the initial offering of equity securities of a state
enterprise or former state enterprise and investments in the securities of a
state enterprise following its initial equity offering.
In certain jurisdictions, the ability of foreign entities, such as a fund, to
participate in privatizations may be limited by local law, or the price or
terms on which a fund may be able to participate may be less advantageous than
for local investors. Moreover, there can be no assurance that governments that
have embarked on privatization programs will continue to divest their ownership
of state enterprises, that proposed privatizations will be successful or that
governments will not re-nationalize enterprises that have been privatized.
In the case of the enterprises in which a fund may invest, large blocks of the
stock of those enterprises may be held by a small group of stockholders, even
after the initial equity offerings by those enterprises. The sale of some
portion or all of those blocks could have an adverse effect on the price of the
stock of any such enterprise.
Prior to making an initial equity offering, most state enterprises or former
state enterprises go through an internal reorganization of management. Such
reorganizations are made in an attempt to better enable these enterprises to
compete in the private sector. However, certain reorganizations could result in
a management team that does not function as well as an enterprise's prior
management and may have a negative effect on such enterprise. In addition, the
privatization of an enterprise by its government may occur over a number of
years, with the government continuing to hold a controlling position in the
enterprise even after the initial equity offering for the enterprise.
Prior to privatization, most of the state enterprises in which a fund may
invest enjoy the protection of and receive preferential treatment from the
respective sovereigns that own or control them. After making an initial equity
offering, these enterprises may no longer have such protection or receive such
preferential treatment and may become subject to market competition from which
they were previously protected. Some of these enterprises may not be able to
operate effectively in a competitive market and may suffer losses or experience
bankruptcy due to such competition.
PUT BONDS. A fund may invest in "put" bonds (including securities with variable
interest rates) that may be sold back to the issuer of the security at face
value at the option of the holder prior to their stated maturity. The option to
"put" the bond back to the issuer before the stated final maturity can cushion
the price decline of the bond in a rising interest rate environment. However,
the premium paid, if any, for an option to put will have the effect of reducing
the yield otherwise payable on the underlying security.
REAL ESTATE INVESTMENT TRUSTS (REITS). A REIT invests primarily in
income-producing real estate or makes loans to persons involved in the real
estate industry. REITs are sometimes informally categorized into equity REITs,
mortgage REITs and hybrid REITs. Equity REITs buy real estate and pay investors
income from the rents received from the real estate owned by the REIT and from
any profits on the sale of its properties. Mortgage REITs lend money to
building developers and other real estate companies and pay investors income
from the interest paid on those loans. Hybrid REITs engage in both owning real
estate and making loans. Investment in REITs may subject a fund to risks
associated with the direct ownership of real estate, such as decreases in real
estate values, delays in completion of construction, overbuilding, increased
competition and other risks related to local or general economic conditions,
increases in operating costs and property taxes, changes in zoning laws,
casualty or condemnation losses, possible environmental liabilities, regulatory
limitations on rent and fluctuations in rental income. Equity REITs generally
experience these risks directly through fee or leasehold interests, whereas
mortgage REITs generally experience these risks indirectly through mortgage
interests, unless the mortgage REIT forecloses on the underlying real estate.
Changes in interest rates may also affect the value of a fund's investment in
REITs. For instance, during periods of declining interest rates, certain
mortgage REITs may hold mortgages that the mortgagors elect to prepay, which
prepayment may diminish the yield on securities issued by those REITs.
Certain REITs have relatively small market capitalizations, which may tend to
increase the volatility of the market price of their securities. Furthermore,
REITs are dependent upon specialized management skills, have limited
diversification and are, therefore, subject to risks inherent in operating and
financing a limited number of projects. REITs are also subject to heavy cash
flow dependency, defaults by borrowers or lessees and the possibility of
failing to qualify for
II-115
tax-free pass-through of income under the Code, and to maintain exemption from
the registration requirements of the 1940 Act. By investing in REITs indirectly
through a fund, a shareholder will bear not only his or her proportionate share
of the expenses of a fund, but also, indirectly, similar expenses of the REITs.
In addition, REITs depend generally on their ability to generate cash flow to
make distributions to shareholders.
REPURCHASE AGREEMENTS. A fund may invest in repurchase agreements pursuant to
its investment guidelines. In a repurchase agreement, a fund acquires ownership
of a security (Obligation) and simultaneously commits to resell that security
to the seller, typically a bank or broker/dealer, at a specified time and
price.
A repurchase agreement provides a means for a fund to earn income on funds for
periods as short as overnight. The repurchase price may be higher than the
purchase price, the difference being income to a fund, or the purchase and
repurchase prices may be the same, with interest at a stated rate due to a fund
together with the repurchase price upon repurchase. In either case, the income
to a fund is unrelated to the interest rate on the Obligation itself.
Obligations will be held by the custodian or in the Federal Reserve Book Entry
System.
It is not clear whether a court would consider the Obligation purchased by a
fund subject to a repurchase agreement as being owned by a fund or as being
collateral for a loan by a fund to the seller. In the event of the commencement
of bankruptcy or insolvency proceedings with respect to the seller of the
Obligation before repurchase of the Obligation under a repurchase agreement, a
fund may encounter delay and incur costs before being able to sell the
security. Delays may involve loss of interest or decline in price of the
Obligation. If the court characterizes the transaction as a loan and a fund has
not perfected a security interest in the Obligation, a fund may be required to
return the Obligation to the seller's estate and be treated as an unsecured
creditor of the seller. As an unsecured creditor, a fund would be at risk of
losing some or all of the principal and income involved in the transaction. As
with any unsecured debt obligation purchased for a fund, the Advisor seeks to
reduce the risk of loss through repurchase agreements by analyzing the
creditworthiness of the obligor, in this case the seller of the Obligation.
Apart from the risk of bankruptcy or insolvency proceedings, there is also the
risk that the seller may fail to repurchase the Obligation, in which case a
fund may incur a loss if the proceeds to a fund of the sale to a third party
are less than the repurchase price. However, if the market value (including
interest) of the Obligation subject to the repurchase agreement becomes less
than the repurchase price (including interest), a fund will direct the seller
of the Obligation to deliver additional securities so that the market value
(including interest) of all securities subject to the repurchase agreement will
equal or exceed the repurchase price.
REVERSE REPURCHASE AGREEMENTS. A fund may enter into "reverse repurchase
agreements," which are repurchase agreements in which a fund, as the seller of
the securities, agrees to repurchase such securities at an agreed time and
price. Under a reverse repurchase agreement, a fund continues to receive any
principal and interest payments on the underlying security during the term of
the agreement. A fund segregates assets in an amount at least equal to its
obligation under outstanding reverse repurchase agreements. Such transactions
may increase fluctuations in the market value of fund assets and its yield.
SECURITIES AS A RESULT OF EXCHANGES OR WORKOUTS. Consistent with a fund's
investment objectives, policies and restrictions, a fund may hold various
instruments received in an exchange or workout of a distressed security (i.e.,
a low-rated debt security that is in default or at risk of becoming in
default). Such instruments may include, but are not limited to, equity
securities, warrants, rights, participation interests in sales of assets and
contingent-interest obligations.
SECURITIES WITH PUT RIGHTS. The right of a fund to exercise a put is
unconditional and unqualified. A put is not transferable by a fund, although a
fund may sell the underlying securities to a third party at any time. If
necessary and advisable, a fund may pay for certain puts either separately in
cash or by paying a higher price for portfolio securities that are acquired
subject to such a put (thus reducing the yield to maturity otherwise available
for the same securities).
The ability of a fund to exercise a put will depend on the ability of a
counterparty to pay for the underlying securities at the time the put is
exercised. In the event that a counterparty should default on its obligation to
repurchase an underlying security, a fund might be unable to recover all or a
portion of any loss sustained from having to sell the security elsewhere.
II-116
The acquisition of a put will not affect the valuation by a fund of the
underlying security. The actual put will be valued at zero in determining net
asset value of a fund. Where a fund pays directly or indirectly for a put, its
cost will be reflected in realized gain or loss when the put is exercised or
expires. If the value of the underlying security increases, the potential for
unrealized or realized gain is reduced by the cost of the put.
SHORT SALES. When a fund takes a long position, it purchases a stock outright.
When a fund takes a short position, it sells at the current market price a
stock it does not own but has borrowed in anticipation that the market price of
the stock will decline. To complete, or close out, the short sale transaction,
a fund buys the same stock in the market and returns it to the lender. The
price at such time may be more or less than the price at which the security was
sold by a fund. Until the security is replaced, a fund is required to pay the
lender amounts equal to any dividends or interest, which accrue during the
period of the loan. To borrow the security, a fund may also be required to pay
a premium, which would increase the cost of the security sold. The proceeds of
the short sale will be retained by the broker, to the extent necessary to meet
the margin requirements, until the short position is closed out. A fund makes
money when the market price of the borrowed stock goes down and a fund is able
to replace it for less than it earned by selling it short. Alternatively if the
price of the stock goes up after the short sale and before the short position
is closed, a fund will lose money because it will have to pay more to replace
the borrowed stock than it received when it sold the stock short.
A fund may not always be able to close out a short position at a particular
time or at an acceptable price. A lender may request that the borrowed
securities be returned to it on short notice, and a fund may have to buy the
borrowed securities at an unfavorable price. If this occurs at a time that
other short sellers of the same security also want to close out their
positions, a "short squeeze" can occur. A short squeeze occurs when demand is
greater than supply for the stock sold short. A short squeeze makes it more
likely that a fund will have to cover its short sale at an unfavorable price.
If that happens, a fund will lose some or all of the potential profit from, or
even incur a loss as a result of, the short sale.
Until a fund closes its short position or replaces the borrowed security, a
fund will designate liquid assets it owns (other than the short sales proceeds)
as segregated assets to the books of the broker and/or its custodian in an
amount equal to its obligation to purchase the securities sold short, as
required by the 1940 Act. The amount segregated in this manner will be
increased or decreased each business day equal to the change in market value of
a fund's obligation to purchase the security sold short. If the lending broker
requires a fund to deposit additional collateral (in addition to the short
sales proceeds that the broker holds during the period of the short sale),
which may be as much as 50% of the value of the securities sold short, the
amount of the additional collateral may be deducted in determining the amount
of cash or liquid assets a fund is required to segregate to cover the short
sale obligation pursuant to the 1940 Act. The amount segregated must be
unencumbered by any other obligation or claim than the obligation that is being
covered. A fund believes that short sale obligations that are covered, either
by an offsetting asset or right (acquiring the security sold short or having an
option to purchase the security sold short at exercise price that covers the
obligation), or by a fund's segregated asset procedures (or a combination
thereof), are not senior securities under the 1940 Act and are not subject to a
fund's borrowing restrictions. This requirement to segregate assets limits a
fund's leveraging of its investments and the related risk of losses from
leveraging. A fund also is required to pay the lender of the security any
dividends or interest that accrues on a borrowed security during the period of
the loan. Depending on the arrangements made with the broker or custodian, a
fund may or may not receive any payments (including interest) on collateral it
has deposited with the broker.
Short sales involve the risk that a fund will incur a loss by subsequently
buying a security at a higher price than the price at which a fund previously
sold the security short. Any loss will be increased by the amount of
compensation, interest or dividends, and transaction costs a fund must pay to a
lender of the security. In addition, because a fund's loss on a short sale
stems from increases in the value of the security sold short, the extent of
such loss, like the price of the security sold short, is theoretically
unlimited. By contrast, a fund's loss on a long position arises from decreases
in the value of the security held by a fund and therefore is limited by the
fact that a security's value cannot drop below zero.
The use of short sales, in effect, leverages a fund's portfolio, which could
increase a fund's exposure to the market, magnify losses and increase the
volatility of returns.
II-117
Although a fund's share price may increase if the securities in its long
portfolio increase in value more than the securities underlying its short
positions, a fund's share price may decrease if the securities underlying its
short positions increase in value more than the securities in its long
portfolio.
In addition, a fund's short selling strategies may limit its ability to fully
benefit from increases in the equity markets. Also, there is the risk that the
counterparty to a short sale may fail to honor its contractual terms, causing a
loss to a fund. The SEC and other (including non-U.S.) regulatory authorities
have imposed, and may in the future impose, restrictions on short selling,
either on a temporary or permanent basis, which may include placing limitations
on specific companies and/or industries with respect to which a fund may enter
into short positions. Any such restrictions may hinder a fund in, or prevent it
from, fully implementing its investment strategies, and may negatively affect
performance.
SHORT SALES AGAINST THE BOX. A fund may make short sales of common stocks if,
at all times when a short position is open, a fund owns the stock or owns
preferred stocks or debt securities convertible or exchangeable, without
payment of further consideration, into the shares of common stock sold short.
Short sales of this kind are referred to as short sales "against the box." The
broker/dealer that executes a short sale generally invests cash proceeds of the
sale until they are paid to a fund. Arrangements may be made with the
broker/dealer to obtain a portion of the interest earned by the broker on the
investment of short sale proceeds. A fund will segregate the common stock or
convertible or exchangeable preferred stock or debt securities in a special
account with the custodian. Uncertainty regarding the tax effects of short
sales of appreciated investments may limit the extent to which a fund may enter
into short sales against the box. A fund will incur transaction costs in
connection with short sales against the box.
SHORT-TERM SECURITIES. In order to meet anticipated redemptions, to hold
pending the purchase of additional securities for a fund's portfolio, or, in
some cases, for temporary defensive purposes, a fund may invest a portion (up
to 100%) of its assets in money market and other short-term securities. When a
fund is invested for temporary defensive purposes, it may not achieve or pursue
its investment objective.
Examples of short-term securities include:
o Securities issued or guaranteed by the US government and its agencies and
instrumentalities;
o Commercial paper;
o Certificates of deposit and euro dollar certificates of deposit;
o Bankers' acceptances;
o Short-term notes, bonds, debentures or other debt instruments; and
o Repurchase agreements.
SMALL COMPANIES. The Advisor believes that many small companies often may have
sales and earnings growth rates that exceed those of larger companies, and that
such growth rates may, in turn, be reflected in more rapid share price
appreciation over time. Investing in smaller company stocks, however, involves
greater risk than is customarily associated with investing in larger, more
established companies. For example, smaller companies can have limited product
lines, markets, or financial and managerial resources. Smaller companies may
also be dependent on one or a few key persons, and may be more susceptible to
losses and risks of bankruptcy. Also, the securities of smaller companies may
be thinly traded (and therefore have to be sold at a discount from current
market prices or sold in small lots over an extended period of time or their
stock values may fluctuate more sharply than other securities). Transaction
costs in smaller company stocks may be higher than those of larger companies.
SOVEREIGN DEBT. Investments in sovereign debt can involve a high degree of
risk. The governmental entity that controls the repayment of sovereign debt may
not be able or willing to repay the principal and/or interest when due in
accordance with the terms of such debt. A governmental entity's willingness or
ability to repay principal and interest due in a timely manner may be affected
by, among other factors, its cash flow situation, the extent of its foreign
reserves,
II-118
the availability of sufficient foreign exchange on the date a payment is due,
the relative size of the debt service burden to the economy as a whole, the
governmental entity's policy toward the International Monetary Fund, and the
political constraints to which a governmental entity may be subject.
Governmental entities may also be dependent on expected disbursements from
foreign governments, multilateral agencies and others abroad to reduce
principal and interest arrearages on their debt. The commitment on the part of
these governments, agencies and others to make such disbursements may be
conditioned on a governmental entity's implementation of economic reforms
and/or economic performance and the timely service of such debtor's
obligations. Failure to implement such reforms, achieve such levels of economic
performance or repay principal or interest when due may result in the
cancellation of such third parties' commitments to lend funds to the
governmental entity, which may further impair such debtor's ability or
willingness to service its debts in a timely manner. Consequently, governmental
entities may default on their sovereign debt. Holders of sovereign debt may be
requested to participate in the rescheduling of such debt and to extend further
loans to governmental entities. There is no reliable bankruptcy proceeding by
which sovereign debt on which governmental entities have defaulted may be
collected in whole or in part.
SPECIAL INFORMATION CONCERNING MASTER-FEEDER FUND STRUCTURE. Unlike other
open-end management investment companies (mutual funds) which directly acquire
and manage their own portfolio securities, a fund seeks to achieve its
investment objective by investing substantially all of its assets in a master
portfolio (Portfolio), a separate registered investment company with the same
investment objective as a fund. Therefore, an investor's interest in the
Portfolio's securities is indirect. In addition to selling a beneficial
interest to a fund, the Portfolio may sell beneficial interests to other mutual
funds, investment vehicles or institutional investors. Such investors will
invest in the Portfolio on the same terms and conditions and will pay a
proportionate share of the Portfolio's expenses. However, the other investors
investing in the Portfolio are not required to sell their shares at the same
public offering price as a fund due to variations in sales commissions and
other operating expenses. Therefore, investors in a fund should be aware that
these differences may result in differences in returns experienced by investors
in the different funds that invest in the Portfolio. Such differences in
returns are also present in other mutual fund structures.
Smaller funds investing in the Portfolio may be materially affected by the
actions of larger funds investing in the Portfolio. For example, if a large
fund withdraws from the Portfolio, the remaining funds may experience higher
pro rata operating expenses, thereby producing lower returns (however, this
possibility exists as well for traditionally structured funds which have large
institutional investors). Also, the Portfolio may be required to sell
investments at a price or time not advantageous to the Portfolio in order to
meet such a redemption. Additionally, the Portfolio may become less diverse,
resulting in increased portfolio risk. Also, funds with a greater pro rata
ownership in the Portfolio could have effective voting control of the
operations of the Portfolio. Except as permitted by the SEC, whenever a fund is
requested to vote on matters pertaining to the Portfolio, a fund will hold a
meeting of shareholders of a fund and will cast all of its votes in the same
proportion as the votes of a fund's shareholders.
Certain changes in the Portfolio's investment objectives, policies or
restrictions may require a fund to withdraw its interest in the Portfolio. Any
such withdrawal could result in a distribution "in kind" of portfolio
securities (as opposed to a cash distribution from the Portfolio). If
securities are distributed, a fund could incur brokerage, tax or other charges
in converting the securities to cash. In addition, the distribution in kind may
result in a less diversified portfolio of investments or adversely affect the
liquidity of a fund. Notwithstanding the above, there are other means for
meeting redemption requests, such as borrowing.
A fund may withdraw its investment from the Portfolio at any time, if the Board
determines that it is in the best interests of the shareholders of a fund to do
so. Upon any such withdrawal, the Board would consider what action might be
taken, including the investment of all the assets of a fund in another pooled
investment entity having the same investment objective as a fund or the
retaining of an investment advisor to manage a fund's assets in accordance with
the investment policies described herein with respect to the Portfolio.
STAND-BY COMMITMENTS. A stand-by commitment is a right acquired by a fund, when
it purchases a municipal obligation from a broker, dealer or other financial
institution (seller), to sell up to the same principal amount of such
securities back to the seller, at a fund's option, at a specified price.
Stand-by commitments are also known as "puts." The exercise by a fund of a
stand-by commitment is subject to the ability of the other party to fulfill its
contractual commitment.
II-119
Stand-by commitments acquired by a fund may have the following features: (1)
they will be in writing and will be physically held by a fund's custodian; (2)
a fund's right to exercise them will be unconditional and unqualified; (3) they
will be entered into only with sellers which in the Advisor's opinion present a
minimal risk of default; (4) although stand-by commitments will not be
transferable, municipal obligations purchased subject to such commitments may
be sold to a third party at any time, even though the commitment is
outstanding; and (5) their exercise price will be (i) a fund's acquisition cost
(excluding any accrued interest which a fund paid on their acquisition), less
any amortized market premium or plus any amortized original issue discount
during the period a fund owned the securities, plus (ii) all interest accrued
on the securities since the last interest payment date.
A fund expects that stand-by commitments generally will be available without
the payment of any direct or indirect consideration. However, if necessary or
advisable, a fund will pay for stand-by commitments, either separately in cash
or by paying a higher price for portfolio securities which are acquired subject
to the commitments.
It is difficult to evaluate the likelihood of use or the potential benefit of a
stand-by commitment. Therefore, it is expected that the Advisor will determine
that stand-by commitments ordinarily have a "fair value" of zero, regardless of
whether any direct or indirect consideration was paid. However, if the market
price of the security subject to the stand-by commitment is less than the
exercise price of the stand-by commitment, such security will ordinarily be
valued at such exercise price. Where a fund has paid for a stand-by commitment,
its cost will be reflected as unrealized depreciation for the period during
which the commitment is held.
The IRS has issued a favorable revenue ruling to the effect that, under
specified circumstances, a regulated investment company will be the owner of
tax-exempt municipal obligations acquired subject to a put option. The IRS has
also issued private letter rulings to certain taxpayers (which do not serve as
precedent for other taxpayers) to the effect that tax-exempt interest received
by a regulated investment company with respect to such obligations will be
tax-exempt in the hands of the company and may be distributed to its
shareholders as exempt-interest dividends. The IRS has subsequently announced
that it will not ordinarily issue advance ruling letters as to the identity of
the true owner of property in cases involving the sale of securities or
participation interests therein if the purchaser has the right to cause the
security, or the participation interest therein, to be purchased by either the
seller or a third party. A fund intends to take the position that it owns any
municipal obligations acquired subject to a stand-by commitment and that
tax-exempt interest earned with respect to such municipal obligations will be
tax-exempt in its hands. There is no assurance that the IRS will agree with
such position in any particular case.
SUBSIDIARY COMPANIES. A fund may gain exposure to the commodity markets in part
by investing a portion of a fund's assets in a wholly-owned subsidiary
(Subsidiary). Investments in a Subsidiary are expected to provide exposure to
the commodity markets within the limitations of Subchapter M of the Internal
Revenue Code and recent IRS revenue rulings (see Taxes in Appendix II-J of this
SAI). A fund's Subsidiaries are companies organized under the laws of the
Cayman Islands, and are overseen by their own board of directors.
Among other investments, the Subsidiaries are expected to invest in
commodity-linked derivative instruments, such as swaps and futures. The
Subsidiaries will also invest in fixed income instruments, cash, cash
equivalents and affiliated money market funds. In monitoring compliance with
its investment restrictions, a fund will consider the assets of its Subsidiary
to be assets of the fund. A Subsidiary must, however, comply with the asset
segregation requirements (described elsewhere in this SAI) with respect its
investments in commodity-linked derivatives.
To the extent that a fund invests in its Subsidiary, a fund may be subject to
the risks associated with those derivative instruments and other securities,
which are discussed elsewhere in a fund's prospectuses and this SAI. While the
Subsidiaries may be considered similar to investment companies, they are not
registered under the 1940 Act and are not subject to all of the investor
protections of the 1940 Act and other US regulations. Changes in the laws of
the US or the Cayman Islands could result in the inability of a fund or a
Subsidiary to operate as intended, and could negatively affect a fund and its
shareholders.
In order to qualify for the special tax treatment accorded regulated investment
companies and their shareholders, a fund must, among other things, satisfy
several diversification requirements, including the requirement that not more
than 25% of the value of the fund's total assets may be invested in the
securities (other than those of the US government
II-120
or other regulated investment companies) of any one issuer or of two or more
issuers which the fund controls and which are engaged in the same, similar or
related trades or businesses. Therefore, so long as a fund is subject to this
limit, the fund may not invest any more than 25% of the value of its assets in
a Subsidiary. Absent this diversification requirement, a fund would be
permitted to invest more than 25% of the value of its assets in a Subsidiary.
TAX-EXEMPT COMMERCIAL PAPER. Issues of tax-exempt commercial paper typically
represent short-term, unsecured, negotiable promissory notes. These obligations
are issued by state and local governments and their agencies to finance working
capital needs of municipalities or to provide interim construction financing
and are paid from general revenues of municipalities or are refinanced with
long-term debt. In most cases, tax-exempt commercial paper is backed by letters
of credit, lending agreements, note repurchase agreements or other credit
facility agreements offered by banks or other institutions.
TAX-EXEMPT CUSTODIAL RECEIPTS. Tax-exempt custodial receipts (Receipts)
evidence ownership in an underlying bond that is deposited with a custodian for
safekeeping. Holders of the Receipts receive all payments of principal and
interest when paid on the bonds. Receipts can be purchased in an offering or
from a counterparty (typically an investment bank). To the extent that any
Receipt is illiquid, it is subject to a fund's limit on illiquid securities.
TAX-EXEMPT PASS-THROUGH SECURITIES. Tax exempt pass-through certificates
represent an interest in a pool or group of fixed-rate long-term debt
obligations issued by or on behalf of primarily not-for-profit institutions,
the interest on which is exempt from federal income taxation, including
alternative minimum taxation. Such fixed-rate long-term debt obligations may be
private activity bonds issued by states, municipalities or public authorities
to provide funds, usually through a loan or lease arrangement, to a non-profit
corporation for the purpose of financing or refinancing the construction or
improvement of a facility to be used by the non-profit corporation.
Distributions on tax exempt pass-through certificates may be adversely affected
by defaults in or prepayment of the underlying debt obligations. Certain tax
exempt pass-through certificates are issued in several classes with different
levels of yields and credit protection. A fund may invest in lower classes of
tax exempt pass-through certificates that have less credit protection. Tax
exempt pass-through certificates have limited liquidity and certain transfer
restrictions may apply. There currently is no trading market for tax exempt
pass-through certificates and there can be no assurance that such a market will
develop.
TO BE ANNOUNCED (TBA) PURCHASE COMMITMENTS. A fund may enter into TBA purchase
commitments to purchase securities for a fixed price at a future dates. TBA
purchase commitments may be considered securities in themselves, and involve a
risk of loss if the value of the security to be purchased declines prior to
settlement date. Unsettled TBA purchase commitments are valued at the current
market value of the underlying securities.
THIRD PARTY PUTS. A fund may purchase long-term fixed rate bonds that have been
coupled with an option granted by a third party financial institution allowing
a fund at specified intervals to tender (put) the bonds to the institution and
receive the face value thereof (plus accrued interest). These third party puts
are available in several different forms, may be represented by custodial
receipts or trust certificates and may be combined with other features such as
interest rate swaps. A fund receives a short-term rate of interest (which is
periodically reset), and the interest rate differential between that rate and
the fixed rate on the bond is retained by the financial institution. The
financial institution granting the option does not provide credit enhancement,
and in the event that there is a default in the payment of principal or
interest, or downgrading of a bond to below investment grade, or a loss of the
bond's tax-exempt status, the put option will terminate automatically. As a
result, a fund would be subject to the risks associated with holding such a
long-term bond and the weighted average maturity of that fund's portfolio would
be adversely affected.
These bonds coupled with puts may present the same tax issues as are associated
with Stand-By Commitments. As with any Stand-By Commitments acquired by a fund,
a fund intends to take the position that it is the owner of any municipal
obligation acquired subject to a third-party put, and that tax-exempt interest
earned with respect to such municipal obligations will be tax-exempt in its
hands. There is no assurance that the IRS will agree with such position in any
particular case. Additionally, the federal income tax treatment of certain
other aspects of these investments, including the treatment of tender fees and
swap payments, in relation to various regulated investment company tax
provisions is unclear. However, the Advisor seeks to manage a fund's portfolio
in a manner designed to minimize any adverse impact from these investments.
II-121
TRUST PREFERRED SECURITIES. A fund may invest in Trust Preferred Securities,
which are hybrid instruments issued by a special purpose trust (Special Trust),
the entire equity interest of which is owned by a single issuer. The proceeds
of the issuance to a fund of Trust Preferred Securities are typically used to
purchase a junior subordinated debenture, and distributions from the Special
Trust are funded by the payments of principal and interest on the subordinated
debenture.
If payments on the underlying junior subordinated debentures held by the
Special Trust are deferred by the debenture issuer, the debentures would be
treated as original issue discount (OID) obligations for the remainder of their
term. As a result, holders of Trust Preferred Securities, such as a fund, would
be required to accrue daily for federal income tax purposes their share of the
stated interest and the de minimis OID on the debentures (regardless of whether
a fund receives any cash distributions from the Special Trust), and the value
of Trust Preferred Securities would likely be negatively affected. Interest
payments on the underlying junior subordinated debentures typically may only be
deferred if dividends are suspended on both common and preferred stock of the
issuer. The underlying junior subordinated debentures generally rank slightly
higher in terms of payment priority than both common and preferred securities
of the issuer, but rank below other subordinated debentures and debt
securities. Trust Preferred Securities may be subject to mandatory prepayment
under certain circumstances. The market values of Trust Preferred Securities
may be more volatile than those of conventional debt securities. Trust
Preferred Securities may be issued in reliance on Rule 144A under the 1933 Act,
and, unless and until registered, are restricted securities. There can be no
assurance as to the liquidity of Trust Preferred Securities and the ability of
holders of Trust Preferred Securities, such as a fund, to sell their holdings.
US GOVERNMENT SECURITIES. A fund may invest in obligations issued or guaranteed
as to both principal and interest by the US Government, its agencies,
instrumentalities or sponsored enterprises which include (a) direct obligations
of the US Treasury, and (b) securities issued or guaranteed by US Government
agencies.
Examples of direct obligations of the US Treasury are Treasury bills, notes,
bonds and other debt securities issued by the US Treasury. These instruments
are backed by the "full faith and credit" of the United States. They differ
primarily in interest rates, the length of maturities and the dates of
issuance. Treasury bills have original maturities of one year or less. Treasury
notes have original maturities of one to ten years and Treasury bonds generally
have original maturities of greater than ten years.
Some agency securities are backed by the full faith and credit of the United
States (such as Maritime Administration Title XI Ship Financing Bonds and
Agency for International Development Housing Guarantee Program Bonds) and
others are backed only by the rights of the issuer to borrow from the US
Treasury (such as Federal Home Loan Bank Bonds and Federal National Mortgage
Association Bonds), while still others, such as the securities of the Federal
Farm Credit Bank, are supported only by the credit of the issuer. With respect
to securities supported only by the credit of the issuing agency or by an
additional line of credit with the US Treasury, there is no guarantee that the
US Government will provide support to such agencies and such securities may
involve risk of loss of principal and interest.
US Government securities may include "zero coupon" securities that have been
stripped by the US Government of their unmatured interest coupons and
collateralized obligations issued or guaranteed by a US Government agency or
instrumentality. Because interest on zero coupon securities is not distributed
on a current basis but is, in effect, compounded, zero coupon securities tend
to be subject to greater risk than interest-paying securities of similar
maturities.
Interest rates on US Government securities may be fixed or variable. Interest
rates on variable rate obligations are adjusted at regular intervals, at least
annually, according to a formula reflecting then current specified standard
rates, such as 91-day US Treasury bill rates. These adjustments generally tend
to reduce fluctuations in the market value of the securities.
The government guarantee of the US Government securities in a fund's portfolio
does not guarantee the net asset value of the shares of a fund. There are
market risks inherent in all investments in securities and the value of an
investment in a fund will fluctuate over time. Normally, the value of
investments in US Government securities varies inversely with changes in
interest rates. For example, as interest rates rise the value of investments in
US Government securities will tend to decline, and as interest rates fall the
value of a fund's investments in US Government securities
II-122
will tend to increase. In addition, the potential for appreciation in the event
of a decline in interest rates may be limited or negated by increased principal
prepayments with respect to certain mortgage-backed securities, such as GNMA
Certificates. Prepayments of high interest rate mortgage-backed securities
during times of declining interest rates will tend to lower the return of a
fund and may even result in losses to a fund if some securities were acquired
at a premium. Moreover, during periods of rising interest rates, prepayments of
mortgage-backed securities may decline, resulting in the extension of a fund's
average portfolio maturity. As a result, a fund's portfolio may experience
greater volatility during periods of rising interest rates than under normal
market conditions.
VARIABLE AND FLOATING RATE INSTRUMENTS. Debt instruments purchased by a fund
may be structured to have variable or floating interest rates. The interest
rate on variable and floating rate securities may be reset daily, weekly or on
some other reset period and may have a floor or ceiling on interest rate
changes. The interest rate of variable rate securities ordinarily is determined
by reference to or is a percentage of an objective standard such as a bank's
prime rate, the 90-day US Treasury Bill rate, or the rate of return on
commercial paper or bank certificates of deposit. Generally, the changes in the
interest rate on variable rate securities reduce the fluctuation in the market
value of such securities. Accordingly, as interest rates decrease or increase,
the potential for capital appreciation or depreciation is less than for
fixed-rate obligations. A fund may purchase variable rate securities on which
stated minimum or maximum rates, or maximum rates set by state law, limit the
degree to which interest on such instruments may fluctuate; to the extent it
does, increases or decreases in value of such instruments may be somewhat
greater than would be the case without such limits. Because the adjustment of
interest rates on the variable rate securities is made in relation to movements
of the applicable rate adjustment index, the instruments are not comparable to
long-term fixed interest rate securities. Accordingly, interest rates on the
variable rate securities may be higher or lower than current market rates for
fixed rate obligations of comparable quality with similar final maturities. A
money market fund determines the maturity of variable rate securities in
accordance with Rule 2a-7, which allows a fund to consider certain of such
instruments as having maturities shorter than the maturity date on the face of
the instrument.
The Advisor will consider the earning power, cash flows and other liquidity
ratios of the issuers and guarantors of such instruments and, if the instrument
is subject to a demand feature (described below), will continuously monitor the
issuer's financial ability to meet payment on demand. Where necessary to ensure
that a variable or floating rate instrument is equivalent to the quality
standards applicable to a fund's fixed income investments, the issuer's
obligation to pay the principal of the instrument will be backed by an
unconditional bank letter or line of credit, guarantee or commitment to lend.
Any bank providing such a bank letter, line of credit, guarantee or loan
commitment will meet a fund's investment quality standards relating to
investments in bank obligations. The Advisor will also monitor the
creditworthiness of issuers of such instruments to determine whether a fund
should continue to hold the investments.
The absence of an active secondary market for certain variable and floating
rate notes could make it difficult to dispose of the instruments, and a fund
could suffer a loss if the issuer defaults or during periods in which a fund is
not entitled to exercise its demand rights. When a reliable trading market for
the variable and floating rate instruments held by a fund does not exist and a
fund may not demand payment of the principal amount of such instruments within
seven days, the instruments will be subject to a fund's limitation on
investments in illiquid securities.
Variable Rate Demand Securities. A fund may purchase variable rate demand
securities, which are variable rate securities that permit a fund to demand
payment of the unpaid principal balance plus accrued interest upon a specified
number of days' notice to the issuer or its agent. The demand feature may be
backed by a bank letter of credit or guarantee issued with respect to such
instrument. A bank that issues a repurchase commitment may receive a fee from a
fund for this arrangement. The issuer of a variable rate demand security may
have a corresponding right to prepay in its discretion the outstanding
principal of the instrument plus accrued interest upon notice comparable to
that required for the holder to demand payment.
Variable Rate Master Demand Notes. A fund may purchase variable rate master
demand notes, which are unsecured instruments that permit the indebtedness
thereunder to vary and provide for periodic adjustments in the interest rate.
Because variable rate master demand notes are direct lending arrangements
between a fund and the issuer, they are not ordinarily traded. Although no
active secondary market may exist for these notes, a fund will purchase only
those notes under which it may demand and receive payment of principal and
accrued interest daily or may resell the note at any time to a third party.
These notes are not typically rated by credit rating agencies.
II-123
WARRANTS. The holder of a warrant has the right, until the warrant expires, to
purchase a given number of shares of a particular issuer at a specified price.
Such investments can provide a greater potential for profit or loss than an
equivalent investment in the underlying security. Prices of warrants do not
necessarily move, however, in tandem with the prices of the underlying
securities and are, therefore, considered speculative investments. Warrants pay
no dividends and confer no rights other than a purchase option. Thus, if a
warrant held by a fund were not exercised by the date of its expiration, a fund
would lose the entire purchase price of the warrant.
WHEN-ISSUED AND DELAYED-DELIVERY SECURITIES. A fund may purchase securities on
a when-issued or delayed-delivery basis. Delivery of and payment for these
securities can take place a month or more after the date of the purchase
commitment. The payment obligation and the interest rate that will be received
on when-issued and delayed-delivery securities are fixed at the time the buyer
enters into the commitment. Due to fluctuations in the value of securities
purchased or sold on a when-issued or delayed-delivery basis, the yields
obtained on such securities may be higher or lower than the yields available in
the market on the dates when the investments are actually delivered to the
buyers. When-issued securities may include securities purchased on a "when, as
and if issued" basis, under which the issuance of the security depends on the
occurrence of a subsequent event, such as approval of a merger, corporate
reorganization or debt restructuring. The value of such securities is subject
to market fluctuation during this period and no interest or income, as
applicable, accrues to a fund until settlement takes place.
At the time a fund makes the commitment to purchase securities on a when-issued
or delayed delivery basis, it will record the transaction, reflect the value
each day of such securities in determining its net asset value and, if
applicable, calculate the maturity for the purposes of average maturity from
that date. At the time of settlement a when-issued security may be valued at
less than the purchase price. To facilitate such acquisitions, a fund
identifies on its books cash or liquid assets in an amount at least equal to
such commitments. It may be expected that a fund's net assets will fluctuate to
a greater degree when it sets aside portfolio securities to cover such purchase
commitments than when it sets aside cash. On delivery dates for such
transactions, a fund will meet its obligations from maturities or sales of the
segregated securities and/or from cash flow. If a fund chooses to dispose of
the right to acquire a when-issued security prior to its acquisition, it could,
as with the disposition of any other portfolio obligation, incur a gain or loss
due to market fluctuation. When a fund engages in when-issued or
delayed-delivery transactions, it relies on the other party to consummate the
trade and is, therefore, exposed to counterparty risk. Failure of the seller to
do so may result in a fund's incurring a loss or missing an opportunity to
obtain a price considered to be advantageous.
YANKEE BONDS. Yankee Bonds are US dollar-denominated bonds sold in the US by
non-US issuers. As compared with bonds issued in the US, such bond issues
normally pay interest but are less actively traded. Investing in the securities
of foreign companies involves more risks than investing in securities of US
companies. Their value is subject to economic and political developments in the
countries where the companies operate and to changes in foreign currency
values. Values may also be affected by foreign tax laws, changes in foreign
economic or monetary policies, exchange control regulations and regulations
involving prohibitions on the repatriation of foreign currencies. In many
foreign countries, there is less publicly available information about foreign
issuers, and there is less government regulation and supervision of foreign
stock exchanges, brokers and listed companies. Also in many foreign countries,
companies are not subject to uniform accounting, auditing, and financial
reporting standards comparable to those applicable to domestic issuers.
Security trading practices and custody arrangements abroad may offer less
protection to a fund's investments and there may be difficulty in enforcing
legal rights outside the United States. Settlement of transactions in some
foreign markets may be delayed or may be less frequent than in the United
States which could affect the liquidity of a fund's portfolio. Additionally, in
some foreign countries, there is the possibility of expropriation or
confiscatory taxation, limitations on the removal of securities, property, or
other fund assets, political or social instability or diplomatic developments
which could affect investments in foreign securities. In addition, the relative
performance of various countries' fixed income markets historically has
reflected wide variations relating to the unique characteristics of each
country's economy. Year-to-year fluctuations in certain markets have been
significant, and negative returns have been experienced in various markets from
time to time.
YIELDS AND RATINGS. The yields on certain obligations in which a fund may
invest (such as commercial paper and bank obligations), are dependent on a
variety of factors, including general market conditions, conditions in the
particular market for the obligation, the financial condition of the issuer,
the size of the offering, the maturity of the obligation and the ratings of the
issue. The ratings of Moody's Investors Service (Moody's), the Standard &
Poor's (S&P) Division
II-124
of The McGraw-Hill Companies and Fitch Ratings, Inc. (Fitch) represent their
opinions as to the quality of the securities that they undertake to rate.
Ratings, however, are general and are not absolute standards of quality or
value. Consequently, obligations with the same rating, maturity and interest
rate may have different market prices. See Appendix A for a description of the
ratings provided by certain recognized rating organizations.
ZERO COUPON SECURITIES AND DEFERRED INTEREST BONDS. A fund may invest in zero
coupon securities that are "stripped" US Treasury notes and bonds and in
deferred interest bonds. Zero coupon securities are the separate income or
principal components of a debt instrument. Zero coupon and deferred interest
bonds are debt obligations which are issued at a significant discount from face
value. The original discount approximates the total amount of interest the
bonds will accrue and compound over the period until maturity or the first
interest accrual date at a rate of interest reflecting the market rate of the
security at the time of issuance. Zero coupon securities are redeemed at face
value at their maturity date without interim cash payments of interest or
principal. The amount of this discount is accrued over the life of the
security, and the accrual constitutes the income earned on the security for
both accounting and federal income tax purposes. Because of these features, the
market prices of zero coupon securities are generally more volatile than the
market prices of securities that have similar maturity but that pay interest
periodically.
While zero coupon bonds do not require the periodic payment of interest,
deferred interest bonds generally provide for a period of delay before the
regular payment of interest begins. Although this period of delay is different
for each deferred interest bond, a typical period is approximately one-third of
the bond's term to maturity. Such investments benefit the issuer by mitigating
its initial need for cash to meet debt service, but some also provide a higher
rate of return to attract investors who are willing to defer receipt of such
cash.
A fund will accrue income on such investments for tax and accounting purposes,
as required, which will generally be prior to the receipt of the corresponding
cash payments. Because a fund is required to distribute to shareholders
substantially all of its net investment income, including such accrued income,
to avoid federal income and excise taxes, a fund may be required to liquidate
other portfolio securities to satisfy a fund's distribution obligations
(including at a time when it may not be advantageous to do so). Under many
market conditions, investments in zero coupon, step-coupon and pay-in-kind
securities may be illiquid, making it difficult for a fund to dispose of them
or to determine their current value.
II-125
PART II: APPENDIX II-H - TAXES
TAXES
The following is intended to be a general summary of certain federal income tax
consequences of investing in a fund. It is not intended as a complete
discussion of all such consequences, nor does it purport to deal with all
categories of investors, some of which may be subject to special tax rules.
Current and prospective investors are therefore advised to consult with their
tax advisors before making an investment in a fund. This summary is based on
the laws in effect on the date of this SAI and on existing judicial and
administrative interpretations thereof, all of which are subject to change,
possibly with retroactive effect.
Feeder Funds. Certain funds (Feeder Funds) invest all or substantially all of
their assets in either the DWS Equity 500 Index Portfolio or the Cash
Management Portfolio (each, a Master Portfolio), which are partnerships for US
income tax purposes. For a discussion of the US federal income tax treatment of
a Master Portfolio, please see the registration statement for that Master
Portfolio. The amount and character of a Feeder Fund's income, gains, losses,
deductions and other tax items will generally be determined at the Master
Portfolio level and the Feeder Fund will be allocated, and is required to take
into account, its share of its Master Portfolio's income, gains, losses and
other tax items. Consequently, references herein to a fund's income, gains,
losses and other tax items, as well as its activities, investment and holdings,
as applied to a Feeder Fund, generally include the tax items, activities,
investments and holdings realized, recognized, conducted or held, as
applicable, either by the Feeder Fund directly or through its Master Portfolio.
See "Investments in the Master Portfolios" for more information.
TAXATION OF A FUND AND ITS INVESTMENTS
QUALIFICATION AS A REGULATED INVESTMENT COMPANY. A fund has elected (or in the
case of a new fund, intends to elect) to be treated, and intends to qualify
each year, as a regulated investment company under Subchapter M of the Code. If
a fund qualifies for treatment as a regulated investment company that is
accorded special tax treatment, such fund will not be subject to federal income
tax on income distributed in a timely manner to its shareholders in the form of
dividends (including Capital Gain Dividends, as defined below). In order to
qualify for the special tax treatment accorded regulated investment companies
and their shareholders under the Code, a fund must, among other things:
(a) derive at least 90% of its gross income from (i) dividends, interest,
payments with respect to certain securities loans, gains from the sale or other
disposition of stock, securities or foreign currencies, or other income
(including but not limited to gains from options, futures, or forward
contracts) derived with respect to its business of investing in such stock,
securities, or currencies and (ii) net income derived from interests in
"qualified publicly traded partnerships" (as defined below);
(b) diversify its holdings so that, at the end of each quarter of its taxable
year, (i) at least 50% of the market value of its total assets are represented
by cash and cash items, US Government securities, securities of other regulated
investment companies, and other securities limited in respect of any one issuer
to a value not greater than 5% of the value of a fund's total assets and not
more than 10% of the outstanding voting securities of such issuer, and (ii) not
more than 25% of the value of its assets are invested (x) in the securities
(other than those of the US Government or other regulated investment companies)
of any one issuer or of two or more issuers which the fund controls and which
are engaged in the same, similar, or related trades or businesses, or (y) in
the securities of one or more qualified publicly traded partnerships (as
defined below); and
(c) distribute with respect to each taxable year at least 90% of the sum of its
investment company taxable income (as that term is defined in the Code without
regard to the deduction for dividends paid; investment company taxable income
generally consists of taxable ordinary income and the excess, if any, of net
short-term capital gains over net long-term capital losses) and net tax-exempt
interest income, if any, for such year.
In general, for purposes of the 90% gross income requirement described in
paragraph (a) above, income derived from a partnership will be treated as
qualifying income only to the extent such income is attributable to items of
income of the partnership which would be qualifying income if realized directly
by a fund. However, 100% of net income
II-126
derived from an interest in a "qualified publicly traded partnership"
(generally, a partnership (x) the interests in which are traded on an
established securities market or readily tradable on a secondary market or the
substantial equivalent thereof, and (y) that derives less than 90% of its
income from the qualifying income described in paragraph (a)(i) above) will be
treated as qualifying income. In general, "qualified publicly traded
partnerships" in which a fund will invest will be treated as partnerships for
federal income tax purposes because they meet the passive income requirement
under Code section 7704(c)(2).
For purposes of the diversification test in paragraph (b) above, the term
"outstanding voting securities of such issuer" will include the equity
securities of a qualified publicly traded partnership. It is possible that
certain partnerships in which a fund may invest could be qualified publicly
traded partnerships and, therefore, the extent to which a fund may invest in
such partnerships, including master limited partnerships, is limited by its
intention to qualify as a regulated investment company under the Code. In
addition, although the passive loss rules of the Code do not generally apply to
regulated investment companies, such rules do apply to a regulated investment
company with respect to items attributable to an interest in a qualified
publicly traded partnership. Fund investments in partnerships, including in
qualified publicly traded partnerships, may result in a fund being subject to
state, local or foreign income, franchise or withholding taxes.
Pursuant to current Internal Revenue Service (IRS) guidance, a Feeder Fund
investing in a Master Portfolio will be treated as holding directly the
underlying assets of the Master Portfolio for purposes of the diversification
test in (b) above.
In addition, for purposes of the diversification test in paragraph (b) above,
the identification of the issuer (or, in some cases, issuers) of a particular
fund investment can depend on the terms and conditions of that investment. In
some cases, identification of the issuer (or issuers) is uncertain under
current law, and an adverse determination or future guidance by the IRS with
respect to issuer identification for a particular type of investment may
adversely affect a fund's ability to meet the diversification test in paragraph
(b) above.
FAILURE TO QUALIFY AS A REGULATED INVESTMENT COMPANY. If for any taxable year a
fund were to fail to qualify for the special federal income tax treatment
accorded regulated investment companies, all of its taxable income would be
subject to federal income tax at regular corporate rates (without any deduction
for distributions to its shareholders), and all distributions from earnings and
profits, including any distributions of net tax-exempt income and net long-term
capital gains, would be taxable to shareholders as ordinary income. Some
portions of such distributions, however, could be eligible (i) to be treated as
qualified dividend income in the case of shareholders taxed as individuals and
other noncorporate shareholders and (ii) for the dividends-received deduction
in the case of corporate shareholders. In addition, a fund could be required to
recognize unrealized gains, pay substantial taxes and interest and make
substantial distributions before requalifying as a regulated investment company
that is accorded special federal income tax treatment.
A fund is subject to a 4% nondeductible excise tax on amounts that have been
retained rather than distributed, as required, under a prescribed formula. The
formula requires payment to shareholders during a calendar year of
distributions representing at least 98% of a fund's taxable ordinary income for
the calendar year and at least 98% of the excess of its capital gains over
capital losses realized during the one-year period ending October 31 of such
year (or the last day of a fund's taxable year if a fund's taxable year ends in
November or December and a fund makes an election to use such later date), as
well as amounts that were neither distributed by nor taxed to a fund during the
prior calendar year. For this purpose, a fund will be treated as having
distributed any ordinary income or capital gain net income on which it has been
subject to corporate income tax in the taxable year ending within the calendar
year. Although a fund's distribution policies should enable it to avoid this
excise tax liability, a fund may retain (and be subject to income or excise tax
on) a portion of its capital gain or other income if it appears to be in the
interest of such fund.
SPECIAL TAX PROVISIONS THAT APPLY TO CERTAIN INVESTMENTS. Certain of a fund's
investment practices are subject to special and complex federal income tax
provisions, including rules relating to short sales, constructive sales,
"straddle" and "wash sale" transactions and section 1256 contracts (as defined
below), that may, among other things, (i) disallow, suspend or otherwise limit
the allowance of certain losses or deductions, (ii) convert lower taxed
long-term capital gains into higher taxed short-term capital gains or ordinary
income, (iii) convert an ordinary loss or a deduction into a
II-127
capital loss, (iv) cause a fund to recognize income or gain without a
corresponding receipt of cash and/or (v) adversely alter the characterization
of certain fund investments. Moreover, the straddle rules and short sale rules
may require the capitalization of certain related expenses of a fund.
Certain debt obligations. A fund's investment in debt obligations that are
issued with original issue discount (OID) or acquired with market discount or
acquisition discount will be subject to special federal income tax rules. If a
fund holds the foregoing kinds of securities, it may be required to pay out as
an income distribution each year an amount which is greater than the total
amount of cash interest a fund actually received. Such distributions may be
made from the cash assets of a fund or by liquidation of portfolio securities
that it might otherwise have continued to hold. A fund may realize gains or
losses from such liquidations. In the event a fund realizes net capital gains
from such transactions, its shareholders may receive larger distributions than
they would have received in the absence of such transactions. These investments
may also affect the character of income recognized by a fund.
Investments in debt obligations that are at risk of or in default present
special tax issues for a fund. Federal income tax rules are not entirely clear
about issues such as whether and, if so, to what extent a fund should recognize
market discount on such a debt obligation, when a fund may cease to accrue
interest, original issue discount or market discount, when and to what extent
deductions may be taken for bad debts or worthless securities, how payments
received on obligations in default should be allocated between principal and
income and whether exchanges of debt obligations in a workout context are
taxable. These and other issues will be addressed by a fund, when, as and if it
invests in such securities, in order to seek to ensure that it distributes
sufficient income to preserve its status as a regulated investment company and
does not become subject to US federal income or excise tax.
Derivatives. A fund's transactions in foreign currencies, derivative
instruments (e.g. forward contracts, swap agreements, options and futures
contracts (including options and futures contracts on foreign currencies)), as
well other hedging, short sale or similar transactions, may be subject to
special provisions of the Code (including provisions relating to "hedging
transactions" and "straddles") that, among other things, may affect the
character of gains and losses realized by a fund (i.e., may affect whether
gains or losses are ordinary or capital), accelerate recognition of income to a
fund and defer fund losses. These rules could therefore affect the character,
amount and timing of distributions to shareholders. These provisions may also
(i) require a fund to mark to market annually certain types of the positions in
its portfolio (i.e., treat them as if they were closed out at the end of each
year), or (ii) cause a fund to recognize income without receiving cash with
which to pay dividends or make distributions in amounts necessary to satisfy
the distribution requirements described above in order to avoid certain income
and excise taxes. A fund may be required to liquidate other investments
(including when it is not advantageous to do so) to meet its distribution
requirements, which may also accelerate the recognition of gain by the fund. A
fund will monitor its transactions, make the appropriate tax elections and make
the appropriate entries in its books and records when it acquires any foreign
currency, forward contract, option, futures contract or hedged investment in
order to mitigate the effect of these rules and prevent disqualification of a
fund as a regulated investment company.
In general, option premiums received by a fund are not immediately included in
the income of a fund. Instead, the premiums are recognized when the option
contract expires, the option is exercised by the holder, or a fund transfers or
otherwise terminates the option (e.g., through a closing transaction). If a
call option written by a fund is exercised and a fund sells or delivers the
underlying stock, a fund generally will recognize capital gain or loss equal to
(a) the sum of the strike price and the option premium received by a fund minus
(b) a fund's basis in the stock. Such gain or loss generally will be short-term
or long-term depending upon the holding period of the underlying stock. If
securities are purchased by a fund pursuant to the exercise of a put option
written by it, a fund generally will subtract the premium received from its
cost basis in the securities purchased. The gain or loss with respect to any
termination of a fund's obligation under an option other than through the
exercise of the option and related sale or delivery of the underlying stock
generally will be short-term gain or loss depending on whether the premium
income received by a fund is greater or less than the amount paid by a fund (if
any) in terminating the transaction. Thus, for example, if an option written by
a fund expires unexercised, a fund generally will recognize short-term gain
equal to the premium received.
Certain covered call writing activities of a fund may trigger the US federal
income tax straddle rules of Section 1092 of the Code, requiring that losses be
deferred and holding periods be tolled on offsetting positions in options and
stocks deemed to constitute substantially similar or related property. Options
on single stocks that are not "deep in
II-128
the money" may give rise to qualified covered calls, which generally are not
subject to the straddle rules; the holding period on stock underlying qualified
covered calls that are "in the money" although not "deep in the money" will be
suspended during the period that such calls are outstanding. Thus, the straddle
rules and the rules governing qualified covered calls could cause gains that
would otherwise constitute long-term capital gains to be treated as short-term
capital gains, and distributions that would otherwise constitute "qualified
dividend income" (as discussed below) or qualify for the dividends-received
deduction (as discussed below) to fail to satisfy the holding period
requirements and therefore to be taxed at ordinary income tax rates or to fail
to qualify for the 70% dividends-received deduction, as the case may be.
A fund's investment in so called "section 1256 contracts," which include
certain futures contracts as well as listed non-equity options written or
purchased by a fund on US exchanges (including options on futures contracts,
equity indices and debt securities), are subject to special federal income tax
rules. All section 1256 contracts held by a fund at the end of its taxable year
are required to be marked to their market value, and any unrealized gain or
loss on those positions will be included in a fund's income as if each position
had been sold for its fair market value at the end of the taxable year. The
resulting gain or loss will be combined with any gain or loss realized by a
fund from positions in section 1256 contracts closed during the taxable year.
Provided such positions were held as capital assets and were neither part of a
"hedging transaction" nor part of a "straddle," 60% of the resulting net gain
or loss will be treated as long-term capital gain or loss, and 40% of such net
gain or loss will be treated as short-term capital gain or loss (although
certain foreign currency gains and losses from such contracts may be treated as
ordinary in character), regardless of the period of time the positions were
actually held by a fund.
As a result of entering into swap contracts, a fund may make or receive
periodic net payments. A fund may also make or receive a payment when a swap is
terminated prior to maturity through an assignment of the swap or other closing
transaction. Periodic net payments will generally constitute ordinary income or
deductions, while termination of a swap will generally result in capital gain
or loss (which will be a long-term capital gain or loss if a fund has been a
party to the swap for more than one year). With respect to certain types of
swaps, a fund may be required to currently recognize income or loss with
respect to future payments on such swaps or may elect under certain
circumstances to mark such swaps to market annually for federal income tax
purposes as ordinary income or loss. The federal income tax treatment of many
types of credit default swaps is uncertain under current law.
In general, gain or loss on a short sale is recognized when a fund closes the
sale by delivering the borrowed property to the lender, not when the borrowed
property is sold. Gain or loss from a short sale is generally treated as
capital gain or loss to the extent that the property used to close the short
sale constitutes a capital asset in a fund's hands. Except with respect to
certain situations where the property used by a fund to close a short sale has
a long-term holding period on the date of the short sale, special rules would
generally treat the gains on short sales as short-term capital gains. These
rules may also terminate the running of the holding period of "substantially
identical property" held by a fund. Moreover, a loss on a short sale will be
treated as a long-term capital loss if, on the date of the short sale,
"substantially identical property" has been held by a fund for more than a
year. In general, a fund will not be permitted to deduct payments made to
reimburse the lender of securities for dividends paid on borrowed stock if the
short sale is closed on or before the 45th day after the short sale is entered
into.
Because the rules described above and other federal income tax rules applicable
to these types of transactions are in some cases uncertain under current law,
an adverse determination or future guidance by the IRS with respect to these
rules (which determination or guidance could be retroactive) may affect whether
a fund has made sufficient distributions, and otherwise satisfied the relevant
requirements, to maintain its qualification as a regulated investment company
and avoid a fund-level tax. A fund intends to limit its activities in options,
futures contracts, forward contracts, short sales, swaps and related
transactions to the extent necessary to meet the requirements for qualification
and treatment as a regulated investment company under the Code.
REITs. A fund's investments in equity securities of real estate investment
trusts (REITs) may result in a fund's receipt of cash in excess of the REIT's
earnings; if a fund distributes these amounts, the distributions could
constitute a return of capital to fund shareholders for federal income tax
purposes. In addition, such investments in REIT equity securities also may
require a fund to accrue and distribute income not yet received. To generate
sufficient cash to make the
II-129
requisite distributions, a fund may be required to sell securities in its
portfolio (including when it is not advantageous to do so) that it otherwise
would have continued to hold. Dividends received by a fund from a REIT will not
qualify for the corporate dividends-received deduction and generally will not
constitute qualified dividend income.
Under a notice issued by the IRS in October 2006 and Treasury regulations that
have yet to be issued but may apply retroactively, a portion of a fund's income
from a REIT (or other pass-through entity) that is attributable to the REIT's
residual interest in a real estate mortgage investment conduit (REMIC) or an
equity interest in a taxable mortgage pool (TMP) (referred to in the Code as an
"excess inclusion") will be subject to federal income tax in all events. This
notice also provides, and the regulations are expected to provide, that excess
inclusion income of a regulated investment company will be allocated to
shareholders of the regulated investment company in proportion to the dividends
received by such shareholders, with the same consequences as if the
shareholders held the related REMIC or TMP interest directly (see Taxation of
US Shareholders - Dividends and distributions - Additional considerations for a
summary of certain federal income tax consequences to shareholders of
distributions designated as excess inclusion income).
Standby commitments. A fund may purchase municipal securities together with the
right to resell the securities to the seller at an agreed upon price or yield
within a specified period prior to the maturity date of the securities. Such a
right to resell is commonly known as a "put" and is also referred to as a
"standby commitment." A fund may pay for a standby commitment either in cash or
in the form of a higher price for the securities which are acquired subject to
the standby commitment, thus increasing the cost of securities and reducing the
yield otherwise available. Additionally, a fund may purchase beneficial
interests in municipal securities held by trusts, custodial arrangements or
partnerships and/or combined with third-party puts or other types of features
such as interest rate swaps; those investments may require a fund to pay
"tender fees" or other fees for the various features provided. The IRS has
issued a revenue ruling to the effect that, under specified circumstances, a
regulated investment company will be the owner of tax-exempt municipal
obligations acquired subject to a put option. The IRS has also issued private
letter rulings to certain taxpayers (which do not serve as precedent for other
taxpayers) to the effect that tax-exempt interest received by a regulated
investment company with respect to such obligations will be tax-exempt in the
hands of the company and may be distributed to its shareholders as
exempt-interest dividends. The IRS has subsequently announced that it will not
ordinarily issue advance ruling letters as to the identity of the true owner of
property in cases involving the sale of securities or participation interests
therein if the purchaser has the right to cause the security, or the
participation interest therein, to be purchased by either the seller or a third
party. A fund, where relevant, intends to take the position that it is the
owner of any municipal obligations acquired subject to a standby commitment or
other third party put and that tax-exempt interest earned with respect to such
municipal obligations will be tax-exempt in its hands. There is no assurance
that the IRS will agree with such position in any particular case. If a fund is
not viewed as the owner of such municipal obligations, it will not be permitted
to treat the exempt interest paid on such obligations as belonging to it. This
may affect the fund's eligibility to pay exempt-interest dividends to its
shareholders. Additionally, the federal income tax treatment of certain other
aspects of these investments, including the treatment of tender fees paid by a
fund, in relation to various regulated investment company tax provisions is
unclear. However, the Advisor intends to manage a fund's portfolio in a manner
designed to minimize any adverse impact from the tax rules applicable to these
investments.
As described herein, in certain circumstances a fund may be required to
recognize taxable income or gain even though no corresponding amounts of cash
are received concurrently. A fund may therefore be required to obtain cash to
satisfy its distribution requirements by selling securities at times when it
might not otherwise be desirable to do so or by borrowing the necessary cash,
thereby incurring interest expense. In certain situations, a fund will, for a
taxable year, defer all or a portion of its capital losses and currency losses
realized after October 31 until the next taxable year in computing its
investment company taxable income and net capital gain, which will defer the
recognition of such realized losses. Such deferrals and other rules regarding
gains and losses realized after October 31 may affect the federal income tax
character of shareholder distributions.
Foreign investments. Income (including, in some cases, capital gains) from
investments in foreign stocks or securities may be subject to foreign taxes,
including withholding and other taxes imposed by foreign jurisdictions. Tax
conventions between certain countries and the US may reduce or eliminate such
taxes. It is not possible to determine a fund's effective rate of foreign tax
in advance since the amount of a fund's assets to be invested in various
countries is not known. Payment of such taxes will reduce a fund's yield on
those investments.
II-130
If a fund is liable for foreign taxes and if more than 50% of the value of a
fund's total assets at the close of its taxable year consists of stocks or
securities of foreign corporations (including foreign governments), a fund may
make an election pursuant to which certain foreign taxes paid by a fund would
be treated as having been paid directly by shareholders of a fund. Pursuant to
such election, shareholders may be able to claim a credit or deduction on their
federal income tax returns for their pro rata portions of qualified taxes paid
by a fund to foreign countries in respect of foreign securities that such fund
has held for at least the minimum period specified in the Code. In such a case,
shareholders will include in gross income from foreign sources their pro rata
shares of such taxes paid by a fund. Each shareholder of a fund will be
notified after the close of a fund's taxable year whether the foreign taxes
paid by a fund will "pass through" for that year and, if so, such notification
will designate the shareholder's portion of (i) the foreign taxes paid by a
fund and (ii) a fund's foreign source income.
A shareholder's ability to claim an offsetting foreign tax credit or deduction
in respect of foreign taxes paid by a fund is subject to certain limitations
imposed by the Code, which may result in the shareholder not receiving a full
credit or deduction (if any) for the amount of such taxes. Shareholders who do
not itemize on their US federal income tax returns may claim a credit (but not
a deduction) for such foreign taxes. The amount of foreign taxes that a
shareholder may claim as a credit in any year will generally be subject to a
separate limitation for "passive income" which includes, among other types of
income, dividends, interest and certain foreign currency gains. Because capital
gains realized by a fund on the sale of foreign securities will be treated as
US source income, the available credit of foreign taxes paid with respect to
such gains may be restricted by this limitation.
If a fund does not satisfy the requirements for passing through to its
shareholders their proportionate shares of any foreign taxes paid by a fund,
shareholders generally will not be entitled to claim a credit or deduction with
respect to foreign taxes incurred by a fund but will not be required to include
such taxes in their gross incomes.
A fund's transactions in foreign currencies, foreign-currency-denominated debt
obligations and certain foreign currency options, futures contracts and forward
contracts (and similar instruments) may give rise to ordinary income or loss to
the extent such income or loss results from fluctuations in the value of the
foreign currency concerned. Under section 988 of the Code, gains or losses
attributable to fluctuations in exchange rates between the time a fund accrues
income or receivables or expenses or other liabilities denominated in a foreign
currency and the time a fund actually collects such income or pays such
liabilities are generally treated as ordinary income or ordinary loss. In
general, gains (and losses) realized on debt instruments will be treated as
section 988 gain (or loss) to the extent attributable to changes in exchange
rates between the US dollar and the currencies in which the instruments are
denominated. Similarly, gains or losses on foreign currency, foreign currency
forward contracts and certain foreign currency options or futures contracts, to
the extent attributable to fluctuations in exchange rates between the
acquisition and disposition dates, are also treated as ordinary income or loss
unless a fund elects otherwise. Such ordinary income treatment may accelerate
fund distributions to shareholders and increase the distributions taxed to
shareholders as ordinary income. Any net ordinary losses so created cannot be
carried forward by a fund to offset income or gains earned in subsequent
taxable years.
Investment in passive foreign investment companies (PFICs). If a fund purchases
shares in certain foreign investment entities, called "passive foreign
investment companies" (PFICs), it may be subject to US federal income tax on a
portion of any "excess distribution" or gain from the disposition of such
shares, which tax cannot be eliminated by making distributions to fund
shareholders. Such excess distributions and gains will be considered ordinary
income. Additional charges in the nature of interest may be imposed on a fund
in respect of deferred taxes arising from such distributions or gains.
However, a fund may elect to avoid the imposition of that tax. For example, a
fund may in certain cases elect to treat the PFIC as a "qualified electing
fund" under the Code (i.e., make a "QEF election"), in which case a fund would
be required to include in income each year its share of the ordinary earnings
and net capital gains of the qualified electing fund, even if such amounts were
not distributed to a fund. In order to make this election, a fund would be
required to obtain certain annual information from the PFICs in which it
invests, which may be difficult or not possible to obtain.
II-131
Alternatively, a fund may make a mark-to-market election that will result in a
fund being treated as if it had sold (and, solely for purposes of this
mark-to-market election, repurchased) its PFIC stock at the end of such fund's
taxable year. In such case, a fund would report any such gains as ordinary
income and would deduct any such losses as ordinary losses to the extent of
previously recognized gains. The QEF and mark-to-market elections must be made
separately for each PFIC owned by a fund and, once made, would be effective for
all subsequent taxable years, unless revoked with the consent of the IRS. By
making the election, a fund could potentially ameliorate the adverse federal
income tax consequences with respect to its ownership of shares in a PFIC, but
in any particular year may be required to recognize income in excess of the
distributions it receives from PFICs and its proceeds from dispositions of PFIC
stock. A fund may have to distribute this "phantom" income and gain to satisfy
the 90% distribution requirement and/or to avoid imposition of the 4% excise
tax. Making either of these elections therefore may require a fund to liquidate
other investments (including when it is not advantageous to do so) to meet its
distribution requirement, which also may accelerate the recognition of gain and
affect a fund's total return. A fund will make the appropriate tax elections,
if possible, and take any additional steps that are necessary to mitigate the
effect of these rules. Dividends paid by PFICs will not be eligible to be
treated as "qualified dividend income."
Investments in the Master Portfolios. Special tax considerations apply to a
Feeder Fund investing in a Master Portfolio. As noted above, each Master
Portfolio is treated as a partnership for US federal income tax purposes. For
US federal income tax purposes, a Feeder Fund generally will be allocated its
distributive share (as determined in accordance with the governing instruments
of the applicable Master Portfolio, as well as with the Code, the Treasury
regulations thereunder, and other applicable authority) of the income, gains,
losses, deductions, credits, and other tax items of its Master Portfolio so as
to reflect the Feeder Fund's interests in the Master Portfolio. A Master
Portfolio may modify its partner allocations to comply with applicable tax
regulations, including, without limitation, the income tax regulations under
Sections 704, 734, 743, 754, and 755 of the Code. It also may make special
allocations of specific tax items, including gross income, gain, deduction, or
loss. These modified or special allocations could result in a Feeder Fund, as a
partner, receiving more or less items of income, gain, deduction, or loss
(and/or income, gain, deduction, or loss of a different character) than it
would in the absence of such modified or special allocations. A Feeder Fund
will be required to include in its income its share of its Master Portfolio's
tax items, including gross income, gain, deduction, or loss, for any taxable
year regardless of whether or not the Master Portfolio distributes any cash to
the Feeder Fund in such year. A
Master Portfolio is are not required, and generally does not expect, to make
distributions (other than distributions in redemption of Master Portfolio
interests) to investors each year. Accordingly, the income recognized by a
Feeder Fund in respect of its investment in a Master Portfolio could exceed
amounts distributed (if any) by the Master Portfolio to the Feeder Fund in a
particular taxable year, and thus the Feeder Fund could be required to redeem a
portion of its interests in the Master Portfolio in order to obtain sufficient
cash to satisfy its annual distribution requirements (described above) and to
otherwise avoid fund-level US federal income and excise taxes.
A Feeder Fund's receipt of a non-liquidating cash distribution from a Master
Portfolio generally will result in recognized gain (but not loss) only to the
extent that the amount of the distribution exceeds the Feeder Fund's adjusted
basis in shares of the Master Portfolio before the distribution. A Feeder Fund
that receives a liquidating cash distribution from a Master Portfolio generally
will recognize capital gain to the extent of the difference between the
proceeds received by the Feeder Fund and the Feeder Fund's adjusted tax basis
in shares of such Master Portfolio; however, the Feeder Fund generally will
recognize ordinary income, rather than capital gain, to the extent that the
Feeder Fund's allocable share of "unrealized receivables" (including any
accrued but untaxed market discount) and substantially appreciated inventory,
if any, exceeds the Feeder Fund's share of the basis in those unrealized
receivables and substantially appreciated inventory. Any capital loss realized
on a liquidating cash distribution may be recognized by a Feeder Fund only if
it redeems all of its Master Portfolio interests for cash. A Feeder Fund
generally will not recognize gain or loss on an in-kind distribution of
property from a Master Portfolio, including on an in-kind redemption of Master
Portfolio interests. However, certain exceptions to this general rule may
apply.
TAXATION OF US SHAREHOLDERS
II-132
DIVIDENDS AND DISTRIBUTIONS. A fund intends to distribute substantially all of
its net investment company taxable income (computed without regard to the
dividends-paid deduction) and net capital gain (that is, the excess of net
realized long-term capital gains over net realized short-term capital losses),
if any, to shareholders each year. Unless a shareholder instructs the
Trust/Corporation to pay such dividends and distributions in cash, they will be
automatically reinvested in additional shares of a fund.
Dividends and other distributions by a fund are generally treated under the
Code as received by the shareholders at the time the dividend or distribution
is made, whether you receive them in cash or reinvest them in additional
shares. However, any dividend or distribution declared by a fund in October,
November or December of any calendar year and payable to shareholders of record
on a specified date in such a month shall be deemed to have been received by
each shareholder on December 31 of such calendar year and to have been paid by
a fund not later than such December 31, provided such dividend is actually paid
by a fund during January of the following calendar year. Dividends and
distributions received by a retirement plan qualifying for tax-exempt treatment
under the Code will not be subject to US federal income tax.
If a fund retains for investment an amount equal to all or a portion of its net
capital gain, it will be subject to federal income tax at the fund level at
regular corporate rates on the amount retained. In that event, a fund may
designate such retained amount as undistributed capital gains in a notice to
its shareholders who (i) will be required to include in income for US federal
income tax purposes, as long-term capital gains, their proportionate shares of
the undistributed amount, and (ii) will be entitled to credit their
proportionate shares of the federal income tax paid by a fund on the
undistributed amount against their US federal income tax liabilities, if any,
and to claim refunds to the extent their credits exceed their liabilities. The
tax basis of shares owned by a fund shareholder, for US federal income tax
purposes, will be increased by an amount equal to the difference between the
amount of undistributed capital gains included in the shareholder's gross
income and the federal income tax deemed paid by the shareholder under clause
(ii) of the preceding sentence. Organizations or persons not subject to federal
income tax on such capital gains will be entitled to a refund of their pro rata
share of such taxes paid by a fund upon filing appropriate returns or claims
for refund with the IRS.
For federal income tax purposes, distributions of investment income are
generally taxable to shareholders as ordinary income. Taxes on distributions of
capital gains are determined by how long a fund owned (or is deemed to have
owned) the investments that generated them, rather than how long a shareholder
has owned his or her shares. In general, the fund will recognize long-term
capital gain or loss on assets it has owned (or is deemed to have owned) for
more than one year, and short-term capital gain or loss on investments it has
owned (or is deemed to have owned) for one year or less. Distributions of net
capital gains that are properly designated by a fund as capital gain dividends
(Capital Gain Dividends) will be taxable as long-term capital gains.
Distributions from capital gains are generally made after applying any
available capital loss carryovers. Long-term capital gain rates applicable to
individuals and other noncorporate investors have been temporarily reduced to
15% - with a 0% rate applying to taxpayers in the 10% and 15% rate brackets -
for taxable years beginning before January 1, 2011. It is currently unclear
whether Congress will extend this provision for taxable years beginning on or
after January 1, 2011. However, a portion of the proceeds from the disposition
of certain real property assets held by a fund for more than one year may
produce "unrecaptured section 1250 gain." Any unrecaptured section 1250 gain
received by a fund will be taxable to shareholders at a 25% rate. Except as
discussed below, all other dividends of a fund (including dividends from
short-term capital gains) from current and accumulated earnings and profits are
generally subject to federal income tax as ordinary income.
Qualified dividend income. For taxable years beginning before January 1, 2011,
dividends designated by a fund as derived from "qualified dividend income" will
be taxed to individuals and other noncorporate shareholders at the federal
income tax rates generally applicable to long-term capital gains, provided
certain holding period and other requirements are met at both the shareholder
and fund levels. Dividends subject to these special rules are not actually
treated as capital gains, however, and thus are not included in the computation
of an individual's net capital gain and generally cannot be used to offset by
capital losses. It is currently unclear whether Congress will extend this
provision for taxable years beginning on or after January 1, 2011.
II-133
If 95% or more of a fund's gross income (excluding net long-term capital gain
over net short-term capital loss) in a taxable year is attributable to
qualified dividend income received by a fund, 100% of the dividends paid by a
fund (other than distributions designated by a fund as Capital Gain Dividends)
to individuals and other noncorporate shareholders during such taxable year
will be eligible to be treated as qualified dividend income. If less than 95%
of a fund's gross income is attributable to qualified dividend income, then
only the portion of the fund's dividends that is attributable to qualified
dividend income and designated as such by the fund will be eligible to be
treated as qualified dividend income.
For these purposes, qualified dividend income generally means income from
dividends received by a fund from US corporations and certain foreign
corporations. Dividend income received by a fund and distributed to a fund
shareholder may not be treated as qualified dividend income by the shareholder
unless a fund satisfies certain holding period and other requirements with
respect to the stock in its portfolio generating such dividend income and the
shareholder meets certain holding period and other requirements with respect to
a fund's shares. A dividend will not be treated as qualified dividend income
(at either a fund or shareholder level) (1) if the dividend is received with
respect to any share of stock held for fewer than 61 days during the 121-day
period beginning on the date which is 60 days before the date on which such
share becomes ex-dividend with respect to such dividend (or, in the case of
certain preferred stock, 91 days during the 181-day period beginning 90 days
before such date), (2) to the extent that the recipient is under an obligation
(whether pursuant to a short sale or otherwise) to make related payments with
respect to positions in substantially similar or related property, (3) if the
recipient elects to have the dividend income treated as investment income for
purposes of the limitation on deductibility of investment interest, or (4) if
the dividend is received from a foreign corporation that is (a) not eligible
for the benefits of a comprehensive income tax treaty with the United States
(with the exception of dividends paid on stock of such a foreign corporation
readily tradable on an established securities market in the United States) or
(b) treated as a passive foreign investment company. For purposes of
determining the holding period for stock on which a dividend is received, such
holding period is reduced for any period the recipient has an option to sell,
is under a contractual obligation to sell or has made (and not closed) a short
sale of substantially identical stock or securities, and in certain other
circumstances.
Qualified dividend income does not include any dividends received from
tax-exempt corporations or interest from fixed income securities. Also,
dividends received by a fund from a REIT or another regulated investment
company are generally qualified dividend income only to the extent the dividend
distributions are made out of qualified dividend income received by such REIT
or other regulated investment company. In the case of securities lending
transactions, payments in lieu of dividends are not qualified dividend income.
Dividends-received deduction. If dividends from domestic corporations comprise
a portion of a fund's gross income, a portion of the income distributions of a
fund may be eligible for the 70% dividends-received deduction generally
available to corporations to the extent of the amount of eligible dividends
received by a fund from domestic corporations for the taxable year. A dividend
received by a fund will not be treated as a dividend eligible for the
dividends-received deduction (i) if it has been received with respect to any
share of stock that the fund has held for less than 46 days (91 days in the
case of certain preferred stock) during the 91-day period beginning on the date
which is 45 days before the date on which such share becomes ex-dividend with
respect to such dividend (during the 181-day period beginning 90 days before
such date in the case of certain preferred stock) or (ii) to the extent that
the fund is under an obligation (pursuant to a short sale or otherwise) to make
related payments with respect to positions in substantially similar or related
property. Moreover, the dividends -received deduction may otherwise be
disallowed or reduced (i) if a corporate shareholder fails to satisfy the
foregoing requirements with respect to its shares of a fund or (ii) by
application of various provisions of the Code (for instance, the
dividends-received deduction is reduced in the case of a dividend received on
debt-financed portfolio stock (generally, stock acquired with borrowed funds)).
For purposes of determining the holding period for stock on which a dividend is
received, such holding period is reduced for any period the recipient has an
option to sell, is under a contractual obligation to sell or has made (and not
closed) a short sale of substantially identical stock or securities, and in
certain other circumstances.
Distributions from REITs do not qualify for the deduction for dividends
received. Shareholders will be informed of the portion of dividends which so
qualify.
II-134
Capital gains. In determining its Capital Gain Dividend (as defined above), a
regulated investment company generally must treat any net capital loss or any
net long-term capital loss incurred after October 31 as if it had been incurred
in the succeeding year. In addition, in determining its taxable income, a
regulated investment company is permitted to elect to treat all or part of any
net capital loss, any net long-term capital loss or any foreign currency loss
incurred after October 31 as if it had been incurred in the succeeding year.
Capital gains distributions may be reduced if a fund has capital loss
carryforwards available. Capital losses in excess of capital gains ("net
capital losses") are not permitted to be deducted against a fund's net
investment income. A fund may carry net capital losses forward for eight years
and use them to offset capital gains realized during this period; any net
capital losses remaining at the conclusion of the eighth taxable year
succeeding the taxable year in which such net capital losses arose will expire
unused. All net capital losses carried forward are treated as short-term
capital losses, and will offset any short-term capital gains before offsetting
any long-term capital gains. A fund's ability to use net capital losses to
offset gains may be limited as a result of certain (i) acquisitive
reorganizations and (ii) shifts in the ownership of a fund by a shareholder
owning or treated as owning 5% or more of the stock of such fund. Any capital
loss carryforwards and any post-October loss deferrals to which a fund is
entitled are disclosed in a fund's annual reports to shareholders.
Additional considerations. Certain of a fund's investments in derivative
instruments and foreign currency-denominated instruments, and any of a fund's
transactions in foreign currencies and hedging activities, are likely to
produce a difference between its book income and the sum of its taxable income
and net tax-exempt income. If there are differences between a fund's book
income and the sum of its taxable income and net tax-exempt income, a fund may
be required to distribute amounts in excess of its book income or a portion of
fund distributions may be treated as a return of capital to shareholders. If a
fund's book income exceeds the sum of its taxable income (including realized
capital gains) and net tax-exempt income, the distribution of such excess
generally will be treated as (i) a dividend to the extent of a fund's remaining
earnings and profits, (ii) thereafter, as a return of capital to the extent of
the recipient's basis in its shares, and (iii) thereafter, as gain from the
sale or exchange of a capital asset. If a fund's book income is less than the
sum of its taxable income and net tax-exempt income, a fund could be required
to make distributions exceeding its book income to qualify for treatment as a
regulated investment company.
Distributions to shareholders designated as excess inclusion income (see
Special tax provisions that apply to certain investments - REITs) (i) may
constitute "unrelated business taxable income" (UBTI) for those shareholders
who would otherwise be exempt from federal income tax, such as individual
retirement accounts, 401(k) accounts, Keogh plans, pension plans and certain
charitable entities, thereby potentially requiring such an entity that is
allocated excess inclusion income, and otherwise might not be required to file
a federal income tax return, to file a tax return and pay tax on such income,
(ii) cannot be offset by net operating losses (subject to a limited exception
for certain thrift institutions), (iii) will not be eligible for reduced US
withholding tax rates for non-US shareholders (including non-US shareholders
eligible for the benefits of a US income tax treaty), and (iv) may cause a fund
to be subject to tax if certain "disqualified organizations," as defined in the
Code, are fund shareholders.
All distributions by a fund result in a reduction in the net asset value of a
fund's shares. Should a distribution reduce the net asset value below a
shareholder's cost basis, such distribution would nevertheless be taxable to
the shareholder as ordinary income, qualified dividend income or capital gain
as described above, even though, from an investment standpoint, it may
constitute a partial return of capital. In particular, investors should be
careful to consider the tax implications of buying shares just prior to a
distribution. The price of shares purchased at that time includes the amount of
the forthcoming distribution. Those purchasing fund shares just prior to a
distribution will receive a partial return of capital upon the distribution,
which nevertheless may be taxable to them for federal income tax purposes.
After the end of each calendar year, a fund will inform shareholders of the
federal income tax status of dividends and distributions paid (or treated as
paid) during such calendar year.
Exempt-interest dividends. Any dividends paid by a fund that are properly
designated as exempt-interest dividends will not be subject to regular federal
income tax. A fund will be qualified to pay exempt-interest dividends to its
shareholders only if, at the end of each quarter of a fund's taxable year, at
least 50% of the total value of a fund's assets consists of obligations of a
state or political subdivision thereof the interest on which is exempt from
federal income tax under
II-135
Code section 103(a). Distributions that a fund properly designates as
exempt-interest dividends are treated as interest excludable from shareholders'
gross income for federal income tax purposes but may result in liability for
federal alternative minimum tax purposes and for state and local tax purposes,
both for individual and corporate shareholders. For example, if a fund invests
in "private activity bonds," certain shareholders may be subject to alternative
minimum tax on the part of a fund's distributions derived from interest on such
bonds.
Interest on indebtedness incurred directly or indirectly to purchase or carry
shares of a fund will not be deductible to the extent it is deemed related to
exempt-interest dividends paid by a fund. The portion of interest that is not
deductible is equal to the total interest paid or accrued on the indebtedness,
multiplied by the percentage of a fund's total distributions (not including
Capital Gain Dividends) paid to the shareholder that are exempt-interest
dividends. Under rules used by the IRS to determine when borrowed funds are
considered incurred for the purpose of purchasing or carrying particular
assets, the purchase of shares may be considered to have been made with
borrowed funds even though such funds are not directly traceable to the
purchase of shares. In addition, the Code may require a shareholder that
receives exempt-interest dividends to treat as taxable income a portion of
certain otherwise, non-taxable social security and railroad retirement benefit
payments. A portion of any exempt-interest dividend paid by a fund that
represents income derived from certain revenue or private activity bonds held
by a fund may not retain its tax-exempt status in the hands of a shareholder
who is a "substantial user" of a facility financed by such bonds, or a "related
person" thereof. Moreover, some or all of the exempt-interest dividends
distributed by a fund may be a specific preference item, or a component of an
adjustment item, for purposes of the federal individual and corporate
alternative minimum taxes. The receipt of dividends and distributions from a
fund may affect a foreign corporate shareholder's federal "branch profits" tax
liability and the federal "excess net passive income" tax liability of a
shareholder that is a Subchapter S corporation. Shareholders should consult
their own tax advisors as to whether they are (i) "substantial users" with
respect to a facility or "related" to such users within the meaning of the Code
or (ii) subject to a federal alternative minimum tax, the federal "branch
profits" tax or the federal "excess net passive income" tax.
Shareholders that are required to file tax returns are required to report
tax-exempt interest income, including exempt-interest dividends, on their
federal income tax returns. A fund will inform shareholders of the federal
income tax status of its distributions after the end of each calendar year,
including the amounts, if any, that qualify as exempt-interest dividends and
any portions of such amounts that constitute tax preference items under the
federal alternative minimum tax. Shareholders who have not held shares of a
fund for a full taxable year may have designated as tax-exempt or as a tax
preference item a percentage of their distributions which is different from the
percentage of a fund's income that was tax-exempt or comprising tax preference
items during the period of their investment in a fund. Shareholders should
consult their tax advisors for more information.
TRANSACTIONS IN FUND SHARES. Upon the sale or exchange of his or her shares, a
shareholder generally will realize a taxable gain or loss equal to the
difference between the amount realized and his or her basis in the shares. A
redemption of shares by a fund generally will be treated as a sale for this
purpose. Such gain or loss will be treated as capital gain or loss if the
shares are capital assets in the shareholder's hands, and will be long-term
capital gain or loss if the shares are held for more than one year and
short-term capital gain or loss if the shares are held for one year or less.
Any loss realized on a sale or exchange will be disallowed to the extent the
shares disposed of are replaced, including replacement through the reinvesting
of dividends and capital gains distributions in a fund, within a 61-day period
beginning 30 days before and ending 30 days after the disposition of the
shares. In such a case, the basis of the shares acquired will be increased to
reflect the disallowed loss.
Any loss realized by a shareholder on the sale of fund shares held by the
shareholder for six months or less will be disallowed to the extent of any
exempt-interest dividends received by the shareholder with respect to such
shares and, to the extent not disallowed, will be treated for US federal income
tax purposes as a long-term capital loss to the extent of any distributions or
deemed distributions of long-term capital gains received by the shareholder
with respect to such shares. A shareholder's ability to utilize capital losses
may be limited under the Code. If a shareholder incurs a sales charge in
acquiring shares of a fund, disposes of those shares within 90 days and then
acquires shares in a mutual fund for which the otherwise applicable sales
charge is reduced by reason of a reinvestment right (e.g., an exchange
privilege), the original sales charge will not be taken into account in
computing gain or loss on the original shares to the extent the subsequent
sales charge is reduced. Instead, the disregarded portion of the original sales
II-136
charge will be added to the tax basis of the newly acquired shares.
Furthermore, the same rule also applies to a disposition of the newly acquired
shares made within 90 days of the second acquisition. This provision prevents a
shareholder from immediately deducting the sales charge by shifting his or her
investment within a family of mutual funds.
The sale or other disposition of shares of a fund by a retirement plan
qualifying for tax-exempt treatment under the Code will not be subject to US
federal income tax. Because the federal income tax treatment of a sale or
exchange of fund shares depends on your purchase price and your personal tax
position, you should keep your regular account statements to use in determining
your federal income tax liability.
TAX-EXEMPT SHAREHOLDERS. Under current law, a fund generally serves to "block"
(that is, prevent the attribution to shareholders of) UBTI from being realized
by tax-exempt shareholders. Notwithstanding this "blocking" effect, a
tax-exempt shareholder could recognize UBTI by virtue of its investment in a
fund if shares in a fund constitute debt-financed property in the hands of the
tax-exempt shareholder within the meaning of Code Section 514(b).
Furthermore, a tax-exempt shareholder may recognize UBTI if a fund recognizes
"excess inclusion income" derived from direct or indirect investments in REMIC
residual interests or TMPs if the amount of such income recognized by a fund
exceeds a fund's investment company taxable income (after taking into account
deductions for dividends paid by a fund). Any investment in residual interests
of a Collateralized Mortgage Obligation (CMO) that has elected to be treated as
a REMIC likewise can create complex tax problems, especially if a fund has
state or local governments or other tax-exempt organizations as shareholders.
In addition, special tax consequences apply to charitable remainder trusts
(CRTs) that invest in regulated investment companies that invest directly or
indirectly in residual interests in REMICs or equity interests in TMPs. Under
legislation enacted in December 2006, if a CRT (defined in section 664 of the
Code) realizes any UBTI for a taxable year, it must pay an excise tax annually
of an amount equal to such UBTI. Under IRS guidance issued in October 2006, a
CRT will not recognize UBTI as a result of investing in a fund that recognizes
"excess inclusion income." Rather, if at any time during any taxable year a CRT
(or one of certain other tax-exempt shareholders, such as the United States, a
state or political subdivision, or an agency or instrumentality thereof, and
certain energy cooperatives) is a record holder of a share in a fund that
recognizes "excess inclusion income," then a fund will be subject to a tax on
that portion of its "excess inclusion income" for the taxable year that is
allocable to such shareholders at the highest federal corporate income tax
rate. The extent to which this IRS guidance remains applicable in light of the
December 2006 legislation is unclear. To the extent permitted under the 1940
Act and the Code, a fund may elect to specially allocate any such tax to the
applicable CRT, or other shareholder, and thus reduce such shareholder's
distributions for the year by the amount of the tax that relates to such
shareholder's interest in a fund. CRTs and other tax-exempt investors are urged
to consult their tax advisors concerning the consequences of investing in a
fund.
BACKUP WITHHOLDING AND OTHER TAX CONSIDERATIONS. A fund may be required to
withhold US federal income tax on distributions (including exempt-interest
dividends) and redemption proceeds payable to shareholders who fail to provide
a fund with their correct taxpayer identification number or to make required
certifications, who have underreported dividend or interest income, or who have
been notified (or when a fund is notified) by the IRS that they are subject to
backup withholding. The backup withholding tax rate is 28% for amounts paid
through 2010. This rate will expire and the backup withholding rate will be 31%
for amounts paid after December 31, 2010, unless Congress enacts tax
legislation providing otherwise. Corporate shareholders and certain other
shareholders specified in the Code generally are exempt from such backup
withholding. Backup withholding is not an additional tax. Any amounts withheld
may be credited against the shareholder's US federal income tax liability.
Special tax rules apply to investments through defined contribution plans and
other tax-qualified plans. Shareholders should consult their tax advisors to
determine the suitability of shares of a fund as an investment through such
plans and the precise effect of an investment on their particular tax
situation.
II-137
A fund's shareholders may be subject to state and local taxes on distributions
received from a fund and on redemptions of a fund's shares. Rules of state and
local taxation of dividend and capital gains distributions from regulated
investment companies often differ from rules for federal income taxation
described above. You are urged to consult your tax advisor as to the
consequences of these and other state and local tax rules affecting an
investment in a fund.
If a shareholder recognizes a loss with respect to a fund's shares of $2
million or more for an individual shareholder or $10 million or more for a
corporate shareholder, the shareholder must file with the IRS a disclosure
statement on Form 8886. Direct shareholders of portfolio securities are in many
cases excepted from this reporting requirement, but under current guidance
shareholders of a regulated investment company are not excepted. The fact that
a loss is reportable under these regulations does not affect the legal
determination of whether the taxpayer's treatment of the loss is proper.
Shareholders should consult their tax advisors to determine the applicability
of these regulations in light of their individual circumstances.
TAXATION OF NON-US SHAREHOLDERS. In general, dividends other than Capital Gain
Dividends and exempt-interest dividends paid by a fund to a shareholder that is
not a "US person" within the meaning of the Code (non-US shareholder) are
subject to withholding of US federal income tax at a rate of 30% (or lower
applicable treaty rate) even if they are funded by income or gains (such as
portfolio interest, short-term capital gains, or foreign-source dividend and
interest income) that, if paid to a non-US shareholder directly, would not be
subject to withholding. Distributions properly designated as Capital Gain
Dividends and exempt-interest dividends generally are not subject to
withholding of federal income tax.
Effective for taxable years of a fund beginning before January 1, 2010 (and for
taxable years beginning before January 1, 2011, if pending legislation
discussed below is enacted), however, a fund is not required to withhold any
amounts (i) with respect to distributions from US-source interest income of
types similar to those not subject to US federal income tax if earned directly
by an individual non-US shareholder, to the extent such distributions are
properly designated by a fund (interest-related dividends), and (ii) with
respect to distributions of net short-term capital gains in excess of net
long-term capital losses, to the extent such distributions are properly
designated by the fund (short-term capital gain dividends). The exception to
withholding for interest-related dividends does not apply to distributions to a
non-US shareholder (A) that has not provided a satisfactory statement that the
beneficial owner is not a US person, (B) to the extent that the dividend is
attributable to certain interest on an obligation if the non-US shareholder is
the issuer or is a 10% shareholder of the issuer, (C) that is within certain
foreign countries that have inadequate information exchange with the United
States, or (D) to the extent the dividend is attributable to interest paid by a
person that is a related person of the non-US shareholder and the non-US
shareholder is a controlled foreign corporation. The exception to withholding
for short-term capital gain dividends does not apply to (A) distributions to an
individual non-US shareholder who is present in the United States for a period
or periods aggregating 183 days or more during the year of the distribution and
(B) distributions subject to special rules regarding the disposition of US real
property interests (USRPIs) as defined below. Depending on the circumstances, a
fund may make designations of interest-related and/or short-term capital gain
dividends with respect to all, some or none of its potentially eligible
dividends and/or treat such dividends, in whole or in part, as ineligible for
these exemptions from withholding. A fund does not currently intend to make
designations of interest-related dividends. Pending legislation proposes to
extend the exemption from withholding for interest-related dividends and
short-term capital gain dividends for one additional year, i.e., for dividends
with respect to taxable years beginning on or after Janauary 1, 2010 but before
January 1, 2011. As of the date of this Statement of Additional Information, it
is unclear whether such legistlation will be enacted and, if enacted, what the
terms of the extension will be.
A non-US shareholder is not, in general, subject to US federal income tax on
gains (and is not allowed a deduction for losses) realized on the sale of
shares of a fund or on Capital Gain Dividends or exempt-interest dividends
unless (i) such gain or dividend is effectively connected with the conduct by
the non-US shareholder of a trade or business within the United States, (ii) in
the case of a non-US shareholder that is an individual, the shareholder is
present in the United States for a period or periods aggregating 183 days or
more during the year of the sale or the receipt of the Capital Gain Dividend
and certain other conditions are met, or (iii) the shares constitute USRPIs or
the Capital Gain Dividends are attributable to gains from the sale or exchange
of USRPIs in accordance with the rules set forth
II-138
below. If a non-US shareholder is eligible for the benefits of a tax treaty,
any effectively connected income or gain will generally be subject to US
federal income tax on a net basis only if it is also attributable to a
permanent establishment maintained by the non-US shareholder in the United
States.
In order to qualify for any exemption from withholding tax or a reduced rate of
withholding tax under an applicable income tax treaty, a non-US shareholder
will need to comply with applicable certification requirements relating to its
non-US status (including, in general, furnishing an IRS Form W-8BEN or
substitute form). In the case of shares held through an intermediary, the
intermediary may withhold tax even if a fund designates a dividend as an
interest-related dividend or short-term capital gain dividend. Non-US
shareholders should contact their intermediaries with respect to the
application of these rules to their accounts.
The withholding tax does not apply to dividends paid to a non-US shareholder
who provides a Form W-8ECI, certifying that the dividends are effectively
connected with the non-US shareholder's conduct of a trade or business within
the United States. Instead, the effectively connected dividends will be subject
to regular US income tax as if the non-US shareholder were a US shareholder. A
non-US corporation receiving effectively connected dividends may also be
subject to additional "branch profits tax" imposed at a rate of 30% (or a lower
treaty rate). A non-US shareholder who fails to provide an IRS Form W-8BEN or
other applicable form may be subject to backup withholding at the appropriate
rate.
In general, except as noted in this subsection, United States federal
withholding tax will not apply to any gain or income realized by a non-US
shareholder in respect of any distributions of net long-term capital gains over
net short-term capital losses, exempt-interest dividends, or upon the sale or
other disposition of shares of a fund.
Special rules apply to distributions to certain foreign persons from a fund if
a fund is either a "US real property holding corporation" (USRPHC) or would be
a USRPHC but for the operation of the exceptions to the definition thereof
described below. Additionally, special rules apply to the sale of shares in a
fund if a fund is a USRPHC. Very generally, a USRPHC is a corporation that
holds US real property interests (USRPIs) the fair market value of which equals
or exceeds 50% of the sum of the fair market values of the corporation's USRPIs
plus interests in real property located outside the United States and other
assets. USRPIs are defined as any interest in US real property or any interest
(other than a creditor) in a USRPHC or former USRPHC. If a fund holds (directly
or indirectly) significant interests in REITs, it may be a USRPHC. The special
rules discussed in the next paragraph also apply to distributions from a fund
if it would be a USRPHC absent exclusions from USRPI treatment for interests in
domestically controlled REITs or regulated investment companies and
not-greater-than-5% interests in publicly traded classes of stock in REITs or
regulated investment companies.
If a fund is a USRPHC or would be a USRPHC but for the exceptions from the
definition of USRPI (described above), distributions by a fund that are
attributable to (a) gains realized on the disposition of USRPIs by a fund and
(b) distributions received by a fund from a lower-tier regulated investment
company or REIT that a fund is required to treat as USRPI gain in its hands
will retain their character as gains realized from USRPIs in the hands of the
foreign persons. (However, absent the enaction of pending legislation described
below, on or after January 10, 2010, this "look-through" treatment for
distributions by a fund to foreign persons applies only to such distributions
that, in turn, are attributable to distributions received by a fund from a
lower-tier REIT and are required to be treated as USRPI gain in a fund's
hands.) If the foreign shareholder holds (or has held at any time during the
prior year) more than a 5% interest in a class of stock of a fund, such
distributions received by the shareholder with respect to such class of stock
will be treated as gains "effectively connected" with the conduct of a "US
trade or business," and subject to tax at graduated rates. Moreover, such
shareholders will be required to file a US income tax return for the year in
which the gain was recognized and a fund will be required to withhold 35% of
the amount of such distribution. In the case of all other foreign persons
(i.e., those whose interest in a fund did not exceed 5% at any time during the
prior year), the USRPI distribution will be treated as ordinary income
(regardless of any designation by a fund that such distribution is qualified
short-term capital gain (in the event that certain pending legislation is
enacted, as described above (or net capital gain) and a fund must withhold 30%
(or a lower applicable treaty rate) of the amount of the distribution paid to
such foreign persons. Pending legislation proposes to extend the "look-through"
provisions applicable before January 1, 2010 described above for one additional
year, i.e., for the distributions made on or after January 1, 2010 but before
January 1, 2011. However, as of the date of this
II-139
Statement of Additional Information, it is unclear whether such legislation
will be enacted and, if enacted, what the terms of the extension will be.
Foreign persons are also subject to "wash sale" rules to prevent the avoidance
of the tax-filing and payment obligations discussed above through the sale and
repurchase of fund shares.
In addition, if a fund is a USRPHC or former USRPHC, a fund may be required to
withhold US tax upon a redemption of shares by a greater-than-5% shareholder
that is a foreign person, and that shareholder would be required to file a US
income tax return for the year of the disposition of the USRPI and pay any
additional tax due on the gain. Prior to January 1, 2010, no withholding was
generally required with respect to amounts paid in redemption of shares of a
fund if a fund was a domestically controlled qualified investment entity, or,
in certain other limited cases, if a fund (whether or not domestically
controlled) held substantial investments in regulated investment companies that
were domestically controlled qualified investment entities. Pending legislation
proposes to extend the exemption from withholding for one additional year,
i.e., for redemptions made on or after January 1, 2010 but before January 1,
2011. However, as of the date of this Statement of Additional Information, it
is unclear whether such legislation will be enacted and, if enacted, what the
terms of the extension will be. Unless and until the legislation is enacted,
beginning on January 1, 2010, such withholding is required, without regard to
whether a fund or any regulated investment company in which it invests is
domestically controlled.
Shares of a fund held by a non-US shareholder at death will be considered
situated within the United States and will be subject to the US estate tax.
The tax consequences to a foreign shareholder entitled to claim the benefits of
an applicable tax treaty may be different from those described herein. Foreign
shareholders should consult their own tax advisors with respect to the
particular tax consequences to them of an investment in a fund, including the
applicability of foreign taxes.
Variable annuity funds. Certain special tax considerations apply to the
variable annuity funds (DWS Variable Series I, DWS Variable Series II and DWS
Investments VIT Funds). These funds intend to comply with the separate
diversification requirements imposed by Section 817(h) of the Code and the
regulations thereunder on certain insurance company separate accounts. These
requirements limit the percentage of total assets used to fund variable
contracts that an insurance company separate account may invest in any single
investment. Because Section 817(h) and those regulations treat the assets of a
regulated investment company owned exclusively by insurance company separate
accounts and certain other permitted investors as assets of the separate
accounts investing in that regulated investment company, these regulations are
imposed on the assets of the variable annuity funds in addition to the
diversification requirements imposed on the funds by the 1940 Act and
Subchapter M of the Code. Specifically, the regulations provide that, except as
permitted by the "safe harbor" described below (and, in general, during a one
year start-up period), as of the end of each calendar quarter or within 30 days
thereafter no more than 55% of the total assets of a separate account may be
represented by any one investment, no more than 70% by any two investments, no
more than 80% by any three investments, and no more than 90% by any four
investments. For this purpose, all securities of the same issuer are generally
considered a single investment, and each U.S. Government agency and
instrumentality is considered a separate issuer. Section 817(h) provides, as a
safe harbor, that a separate account will be treated as being adequately
diversified if the diversification requirements under Subchapter M are
satisfied and no more than 55% of the value of the account's total assets is
attributable to cash and cash items (including receivables), U.S. Government
securities and securities of other regulated investment companies.
Failure by a variable annuity fund to qualify as a regulated investment company
or to satisfy the Section 817(h) requirements by failing to comply with the
"55%-70%-80%-90%" diversification test or the safe harbor described above could
cause the variable contracts to lose their favorable tax status and require a
contract holder to include in ordinary income any income accrued under the
contracts for the current and all prior taxable years. Under certain
circumstances described in the applicable Treasury regulations, inadvertent
failure to satisfy the Section 817(h) diversification requirements may be
corrected, but such a correction could require a payment to the IRS with
respect to the period or periods during which the investments of the account
did not meet the diversification requirements. The amount of any such payment
could be based on the tax contract holders would have incurred if they were
treated as receiving the income on the contract for the period during which the
diversification requirements were not satisfied. Any such failure could also
result in adverse tax consequences for the insurance company issuing the
contracts.
II-140
The 4% excise tax described above does not apply to any regulated investment
company whose sole shareholders are tax-exempt pension trusts and separate
accounts of life insurance companies funding variable contracts. In determining
whether tax-exempt pension trusts or separate accounts of life insurance
companies are the sole shareholders of a regulated investment company for
purposes of this exception to the excise tax, shares attributable to an
investment in the regulated investment company (not exceeding $250,000) made in
connection with the organization of the regulated investment company are not
taken into account.
The IRS has indicated that too great a degree of investor control over the
investment options underlying variable contracts may result in the loss of
tax-deferred treatment for such contracts. The Treasury Department has issued
rulings addressing the circumstances in which a variable contract owner's
control of the investments of the separate account may cause the contract
owner, rather than the insurance company, to be treated as the owner of the
assets held by the separate account, and is likely to issue additional rulings
in the future. If the contract owner is considered the owner of the securities
underlying the separate account, income and gains produced by those securities
would be included currently in the contract owner's gross income.
In determining whether an impermissible level of investor control is present,
one factor the IRS considers when a separate account invests in one or more
regulated investment companies is whether a regulated investment company's
investment strategies are sufficiently broad to prevent a contract holder from
being deemed to be making particular investment decisions through its
investment in the separate account. Current IRS guidance indicates that typical
regulated investment company investment strategies, even those with a specific
sector or geographical focus, are generally considered sufficiently broad to
prevent a contract holder from being deemed to be making particular investment
decisions through its investment in a separate account. For example, the IRS
has issued a favorable ruling concerning a separate account offering
sub-accounts (each funded through a single regulated investment company) with
the following investment strategies: money market, bonds, large company stock,
international stock, small company stock, mortgage-backed securities, health
care industry, emerging markets, telecommunications, financial services, South
American stock, energy, and Asian markets. Each variable annuity fund has an
investment objective and strategies that are not materially narrower than the
investment strategies described in this IRS ruling.
The above discussion addresses only one of several factors that the IRS
considers in determining whether a contract holder has an impermissible level
of investor control over a separate account. Contract holders should consult
with their insurance companies, their tax advisers, as well as the prospectus
relating to their particular contract for more information concerning this
investor control issue.
If an insurance company holding a significant interest (including through
separate accounts) in a fund redeems only a small portion of such interest, the
insurance company could be treated for federal income tax purposes as receiving
a dividend in the full amount of the redemption proceeds delivered to the
shareholder in exchange for the shares.
In the event that additional rules, regulations or other guidance are issued by
the IRS or the Treasury Department concerning this issue, such guidance could
affect the treatment of a variable annuity fund as described above, including
retroactively. In addition, there can be no assurance that a variable annuity
fund will be able to continue to operate as currently described, or that a
variable annuity fund will not have to change its investment objective or
investment policies in order to prevent, on a prospective basis, any such rules
and regulations from causing variable contract owners to be considered the
owners of the shares of the variable annuity fund.
THE FOREGOING IS ONLY A SUMMARY OF CERTAIN MATERIAL US FEDERAL INCOME TAX
CONSEQUENCES AFFECTING A FUND AND ITS SHAREHOLDERS. CURRENT AND PROSPECTIVE
SHAREHOLDERS ARE ADVISED TO CONSULT THEIR OWN TAX ADVISORS WITH RESPECT TO THE
PARTICULAR TAX CONSEQUENCES TO THEM OF AN INVESTMENT IN A FUND.
II-141
PART II: APPENDIX II-I - PROXY VOTING GUIDELINES
I. INTRODUCTION
Deutsche Asset Management ("AM") has adopted and implemented the following
policies and procedures, which it believes are reasonably designed to ensure
that proxies are voted in the best economic interest of clients, in accordance
with its fiduciary duties and local regulation. These Proxy Voting Policies,
Procedures and Guidelines shall apply to all accounts managed by US domiciled
advisers and to all US client accounts managed by non US regional offices. Non
US regional offices are required to maintain procedures and to vote proxies as
may be required by law on behalf of their non US clients. In addition, AM's
proxy policies reflect the fiduciary standards and responsibilities for ERISA
accounts.
The attached guidelines represent a set of global recommendations that were
determined by the Global Proxy Voting Sub-Committee ("the GPVSC"). These
guidelines were developed to provide AM with a comprehensive list of
recommendations that represent how AM will generally vote proxies for its
clients. The recommendations derived from the application of these guidelines
are not intended to influence the various AM legal entities either directly or
indirectly by parent or affiliated companies. In addition, the organizational
structures and documents of the various AM legal entities allows, where
necessary or appropriate, the execution by individual AM subsidiaries of the
proxy voting rights independently of any DB parent or affiliated company. This
applies in particular to non U.S. fund management companies. The individuals
that make proxy voting decisions are also free to act independently, subject to
the normal and customary supervision by the management/boards of these AM legal
entities.
II. AM'S PROXY VOTING RESPONSIBILITIES
Proxy votes are the property of AM's advisory clients./1/ As such, AM's
authority and responsibility to vote such proxies depend upon its contractual
relationships with its clients. AM has delegated responsibility for effecting
its advisory clients' proxy votes to Institutional Shareholder Services
("ISS"), an independent third-party proxy voting specialist. ISS votes AM's
advisory clients' proxies in accordance with AM's proxy guidelines or AM's
specific instructions. Where a client has given specific instructions as to how
a proxy should be voted, AM will notify ISS to carry out those instructions.
Where no specific instruction exists, AM will follow the procedures in voting
the proxies set forth in this document. Certain Taft-Hartley clients may direct
AM to have ISS vote their proxies in accordance with Taft Hartley voting
Guidelines.
---------
/1/ For purposes of these Policies and Procedures, "clients" refers to persons
or entities: for which AM serves as investment adviser or sub-adviser; for
which AM votes proxies; and that have an economic or beneficial ownership
interest in the portfolio securities of issuers soliciting such proxies.
Clients may in certain instances contract with their custodial agent and notify
AM that they wish to engage in securities lending transactions. In such cases,
it is the responsibility of the custodian to deduct the number of shares that
are on loan so that they do not get voted twice.
III. POLICIES
1. PROXY VOTING ACTIVITIES ARE CONDUCTED IN THE BEST ECONOMIC INTEREST OF
CLIENTS
AM has adopted the following policies and procedures to ensure that proxies are
voted in accordance with the best economic interest of its clients, as
determined by AM in good faith after appropriate review.
2. THE GLOBAL PROXY VOTING SUB-COMMITTEE
The Global Proxy Voting Sub-Committee (the "GPVSC") is an internal working
group established by the applicable AM's Investment Risk Oversight Committee
pursuant to a written charter. The GPVSC is responsible for overseeing AM's
proxy voting activities, including:
II-142
(i) adopting, monitoring and updating guidelines, attached as Exhibit A
(the "Guidelines"), that provide how AM will generally vote proxies
pertaining to a comprehensive list of common proxy voting matters;
(ii) voting proxies where (A) the issues are not covered by specific
client instruction or the Guidelines; (B) the Guidelines specify
that the issues are to be determined on a case-by-case basis; or (C)
where an exception to the Guidelines may be in the best economic
interest of AM's clients; and
(iii) monitoring the Proxy Vendor Oversight's proxy voting activities (see
below).AM's Proxy Vendor Oversight, a function of AM's Operations
Group, is responsible for coordinating with ISS to administer AM's
proxy voting process and for voting proxies in accordance with any
specific client instructions or, if there are none, the Guidelines,
and overseeing ISS' proxy responsibilities in this regard.
3. AVAILABILITY OF PROXY VOTING POLICIES AND PROCEDURES AND PROXY VOTING
RECORD
Copies of these Policies and Procedures, as they may be updated from time to
time, are made available to clients as required by law and otherwise at AM's
discretion. Clients may also obtain information on how their proxies were voted
by AM as required by law and otherwise at AM's discretion; however, AM must not
selectively disclose its investment company clients' proxy voting records. The
Proxy Vendor Oversight will make proxy voting reports available to advisory
clients upon request. The investment companies' proxy voting records will be
disclosed to shareholders by means of publicly-available annual filings of each
company's proxy voting record for 12-month periods ended June 30 (see
"Recordkeeping" below), if so required by relevant law.
IV. PROCEDURES
The key aspects of AM's proxy voting process are as follows:
1. THE GPVSC'S PROXY VOTING GUIDELINES
The Guidelines set forth the GPVSC's standard voting positions on a
comprehensive list of common proxy voting matters. The GPVSC has developed, and
continues to update the Guidelines based on consideration of current corporate
governance principles, industry standards, client feedback, and the impact of
the matter on issuers and the value of the investments.
The GPVSC will review the Guidelines as necessary to support the best economic
interests of AM's clients and, in any event, at least annually. The GPVSC will
make changes to the Guidelines, whether as a result of the annual review or
otherwise, taking solely into account the best economic interests of clients.
Before changing the Guidelines, the GPVSC will thoroughly review and evaluate
the proposed change and the reasons therefore, and the GPVSC Chair will ask
GPVSC members whether anyone outside of the AM organization (but within
Deutsche Bank and its affiliates) or any entity that identifies itself as a AM
advisory client has requested or attempted to influence the proposed change and
whether any member has a conflict of interest with respect to the proposed
change. If any such matter is reported to the GPVSC Chair, the Chair will
promptly notify the Conflicts of Interest Management Sub-Committee (see below)
and will defer the approval, if possible. Lastly, the GPVSC will fully document
its rationale for approving any change to the Guidelines.
The Guidelines may reflect a voting position that differs from the actual
practices of the public company(ies) within the Deutsche Bank organization or
of the investment companies for which AM or an affiliate serves as investment
adviser or sponsor. Investment companies, particularly closed-end investment
companies, are different from traditional operating companies. These
differences may call for differences in voting positions on the same matter.
Further, the manner in which AM votes investment company proxies may differ
from proposals for which a AM-advised or sponsored investment company solicits
proxies from its shareholders. As reflected in the Guidelines, proxies
solicited by closed-end (and open-end) investment companies are generally voted
in accordance with the pre-determined guidelines of ISS. See Section IV.3.B.
II-143
Funds ("Underlying Funds") in which Topiary Fund Management Fund of Funds
(each, a "Fund") invest, may from time to time seek to revise their investment
terms (i.e. liquidity, fees, etc.) or investment structure. In such event, the
Underlying Funds may require approval/consent from its investors to effect the
relevant changes. Topiary Fund Management has adopted Proxy Voting Procedures
which outline the process for these approvals.
2. SPECIFIC PROXY VOTING DECISIONS MADE BY THE GPVSC
The Proxy Vendor Oversight will refer to the GPVSC all proxy proposals (i) that
are not covered by specific client instructions or the Guidelines; or (ii)
that, according to the Guidelines, should be evaluated and voted on a
case-by-case basis.
Additionally, if, the Proxy Vendor Oversight, the GPVSC Chair or any member of
the GPVSC, a portfolio manager, a research analyst or a sub-adviser believes
that voting a particular proxy in accordance with the Guidelines may not be in
the best economic interests of clients, that individual may bring the matter to
the attention of the GPVSC Chair and/or the Proxy Vendor Oversight./2/
---------
/2/ The Proxy Vendor Oversight generally monitors upcoming proxy solicitations
for heightened attention from the press or the industry and for novel or
unusual proposals or circumstances, which may prompt the Proxy Vendor
Oversight to bring the solicitation to the attention of the GPVSC Chair. AM
portfolio managers, AM research analysts and sub-advisers also may bring a
particular proxy vote to the attention of the GPVSC Chair, as a result of
their ongoing monitoring of portfolio securities held by advisory clients
and/or their review of the periodic proxy voting record reports that the
GPVSC Chair distributes to AM portfolio managers and AM research analysts.
If the Proxy Vendor Oversight refers a proxy proposal to the GPVSC or the GPVSC
determines that voting a particular proxy in accordance with the Guidelines is
not in the best economic interests of clients, the GPVSC will evaluate and vote
the proxy, subject to the procedures below regarding conflicts.
The GPVSC endeavors to hold meetings to decide how to vote particular proxies
sufficiently before the voting deadline so that the procedures below regarding
conflicts can be completed before the GPVSC's voting determination.
3. CERTAIN PROXY VOTES MAY NOT BE CAST
In some cases, the GPVSC may determine that it is in the best economic
interests of its clients not to vote certain proxies. If the conditions below
are met with regard to a proxy proposal, AM will abstain from voting:
o Neither the Guidelines nor specific client instructions cover an issue;
o ISS does not make a recommendation on the issue;
o The GPVSC cannot convene on the proxy proposal at issue to make a
determination as to what would be in the client's best interest. (This
could happen, for example, if the Conflicts of Interest Management
Sub-committee found that there was a material conflict or if despite all
best efforts being made, the GPVSC quorum requirement could not be met).
In addition, it is AM's policy not to vote proxies of issuers subject to laws
of those jurisdictions that impose restrictions upon selling shares after
proxies are voted, in order to preserve liquidity. In other cases, it may not
be possible to vote certain proxies, despite good faith efforts to do so. For
example, some jurisdictions do not provide adequate notice to shareholders so
that proxies may be voted on a timely basis. Voting rights on securities that
have been loaned to third-parties transfer to those third-parties, with loan
termination often being the only way to attempt to vote proxies on the loaned
securities. Lastly, the GPVSC may determine that the costs to the client(s)
associated with voting a particular proxy or group of proxies outweighs the
economic benefits expected from voting the proxy or group of proxies.
The Proxy Vendor Oversight will coordinate with the GPVSC Chair regarding any
specific proxies and any categories of proxies that will not or cannot be
voted. The reasons for not voting any proxy shall be documented.
II-144
4. CONFLICT OF INTEREST PROCEDURES
A. PROCEDURES TO ADDRESS CONFLICTS OF INTEREST AND IMPROPER INFLUENCE
Overriding Principle. In the limited circumstances where the GPVSC votes
proxies,/3/ the GPVSC will vote those proxies in accordance with what it, in
good faith, determines to be the best economic interests of AM's clients./4/
---------
/3/ As mentioned above, the GPVSC votes proxies (i) where neither a specific
client instruction nor a Guideline directs how the proxy should be voted,
(ii) where the Guidelines specify that an issue is to be determined on a
case by case basis or (iii) where voting in accordance with the Guidelines
may not be in the best economic interests of clients.
/4/ The Proxy Vendor Oversight, who serves as the non-voting secretary of the
GPVSC, may receive routine calls from proxy solicitors and other parties
interested in a particular proxy vote. Any contact that attempts to exert
improper pressure or influence shall be reported to the Conflicts of
Interest Management Sub-Committee.
Independence of the GPVSC. As a matter of Compliance policy, the GPVSC and the
Proxy Vendor Oversight are structured to be independent from other parts of
Deutsche Bank. Members of the GPVSC and the employee responsible for Proxy
Vendor Oversight are employees of AM. As such, they may not be subject to the
supervision or control of any employees of Deutsche Bank Corporate and
Investment Banking division ("CIB"). Their compensation cannot be based upon
their contribution to any business activity outside of AM without prior
approval of Legal and Compliance. They can have no contact with employees of
Deutsche Bank outside of the Private Client and Asset Management division
("PCAM") regarding specific clients, business matters or initiatives without
the prior approval of Legal and Compliance. They furthermore may not discuss
proxy votes with any person outside of AM (and within AM only on a need to know
basis).
Conflict Review Procedures. There will be a committee (the "Conflicts of
Interest Management Sub-Committee") established within AM that will monitor for
potential material conflicts of interest in connection with proxy proposals
that are to be evaluated by the GPVSC. Promptly upon a determination that a
vote shall be presented to the GPVSC, the GPVSC Chair shall notify the
Conflicts of Interest Management Sub-Committee. The Conflicts of Interest
Management Sub-Committee shall promptly collect and review any information
deemed reasonably appropriate to evaluate, in its reasonable judgment, if AM or
any person participating in the proxy voting process has, or has the appearance
of, a material conflict of interest. For the purposes of this policy, a
conflict of interest shall be considered "material" to the extent that a
reasonable person could expect the conflict to influence, or appear to
influence, the GPVSC's decision on the particular vote at issue. GPVSC should
provide the Conflicts of Interest Management Sub-Committee a reasonable amount
of time (no less than 24 hours) to perform all necessary and appropriate
reviews. To the extent that a conflicts review can not be sufficiently
completed by the Conflicts of Interest Management Sub-Committee the proxies
will be voted in accordance with the standard guidelines.
The information considered by the Conflicts of Interest Management
Sub-Committee may include without limitation information regarding (i) AM
client relationships; (ii) any relevant personal conflict known by the
Conflicts of Interest Management Sub-Committee or brought to the attention of
that sub-committee; (iii) and any communications with members of the GPVSC (or
anyone participating or providing information to the GPVSC) and any person
outside of the AM organization (but within Deutsche Bank and its affiliates) or
any entity that identifies itself as a AM advisory client regarding the vote at
issue. In the context of any determination, the Conflicts of Interest
Management Sub-Committee may consult with, and shall be entitled to rely upon,
all applicable outside experts, including legal counsel.
Upon completion of the investigation, the Conflicts of Interest Management
Sub-Committee will document its findings and conclusions. If the Conflicts of
Interest Management Sub-Committee determines that (i) AM has a material
conflict of interest that would prevent it from deciding how to vote the
proxies concerned without further client consent or (ii) certain individuals
should be recused from participating in the proxy vote at issue, the Conflicts
of Interest Management Sub-Committee will so inform the GPVSC chair.
II-145
If notified that AM has a material conflict of interest as described above, the
GPVSC chair will obtain instructions as to how the proxies should be voted
either from (i) if time permits, the effected clients, or (ii) in accordance
with the standard guidelines. If notified that certain individuals should be
recused from the proxy vote at issue, the GPVSC Chair shall do so in accordance
with the procedures set forth below.
Note: Any AM employee who becomes aware of a potential, material conflict of
interest in respect of any proxy vote to be made on behalf of clients shall
notify Compliance. Compliance shall call a meeting of the conflict review
committee to evaluate such conflict and determine a recommended course of
action.
Procedures to be followed by the GPVSC. At the beginning of any discussion
regarding how to vote any proxy, the GPVSC Chair (or his or her delegate) will
inquire as to whether any GPVSC member (whether voting or ex officio) or any
person participating in the proxy voting process has a personal conflict of
interest or has actual knowledge of an actual or apparent conflict that has not
been reported to the Conflicts of Interest Management Sub-Committee.
The GPVSC Chair also will inquire of these same parties whether they have
actual knowledge regarding whether any director, officer or employee outside of
the AM organization (but within Deutsche Bank and its affiliates) or any entity
that identifies itself as a AM advisory client, has: (i) requested that AM, the
Proxy Vendor Oversight (or any member thereof) or a GPVSC member vote a
particular proxy in a certain manner; (ii) attempted to influence AM, the Proxy
Vendor Oversight (or any member thereof), a GPVSC member or any other person in
connection with proxy voting activities; or (iii) otherwise communicated with a
GPVSC member or any other person participating or providing information to the
GPVSC regarding the particular proxy vote at issue, and which incident has not
yet been reported to the Conflicts of Interest Management Sub- Committee.
If any such incidents are reported to the GPVSC Chair, the Chair will promptly
notify the Conflicts of Interest Management Sub-Committee and, if possible,
will delay the vote until the Conflicts of Interest Management Sub-Committee
can complete the conflicts report. If a delay is not possible, the Conflicts of
Interest Management Sub-Committee will instruct the GPVSC whether anyone should
be recused from the proxy voting process, or whether AM should vote the proxy
in accordance with the standard guidelines, seek instructions as to how to vote
the proxy at issue from ISS or, if time permits, the effected clients. These
inquiries and discussions will be properly reflected in the GPVSC's minutes.
Duty to Report. Any AM employee, including any GPVSC member (whether voting or
ex officio), that is aware of any actual or apparent conflict of interest
relevant to, or any attempt by any person outside of the AM organization (but
within Deutsche Bank and its affiliates) or any entity that identifies itself
as a AM advisory client to influence, how AM votes its proxies has a duty to
disclose the existence of the situation to the GPVSC Chair (or his or her
designee) and the details of the matter to the Conflicts of Interest Management
Sub-Committee. In the case of any person participating in the deliberations on
a specific vote, such disclosure should be made before engaging in any
activities or participating in any discussion pertaining to that vote.
Recusal of Members. The GPVSC will recuse from participating in a specific
proxy vote any GPVSC members (whether voting or ex officio) and/or any other
person who (i) are personally involved in a material conflict of interest; or
(ii) who, as determined by the Conflicts of Interest Management Sub-Committee,
have actual knowledge of a circumstance or fact that could effect their
independent judgment, in respect of such vote. The GPVSC will also exclude from
consideration the views of any person (whether requested or volunteered) if the
GPVSC or any member thereof knows, or if the Conflicts of Interest Management
Sub-Committee has determined, that such other person has a material conflict of
interest with respect to the particular proxy, or has attempted to influence
the vote in any manner prohibited by these policies.
If, after excluding all relevant GPVSC voting members pursuant to the paragraph
above, there are three or more GPVSC voting members remaining, those remaining
GPVSC members will determine how to vote the proxy in accordance with these
Policies and Procedures. If there are fewer than three GPVSC voting members
remaining, the GPVSC Chair will vote the proxy in accordance with the standard
guidelines, will obtain instructions as to how to have the proxy voted from, if
time permits, the effected clients and otherwise from ISS.
II-146
B. INVESTMENT COMPANIES AND AFFILIATED PUBLIC COMPANIES
Investment Companies. As reflected in the Guidelines, all proxies solicited by
open-end and closed-end investment companies are voted in accordance with the
pre-determined guidelines of ISS, unless the investment company client directs
AM to vote differently on a specific proxy or specific categories of proxies.
However, regarding investment companies for which AM or an affiliate serves as
investment adviser or principal underwriter, such proxies are voted in the same
proportion as the vote of all other shareholders (i.e., "mirror" or "echo"
voting). Master fund proxies solicited from feeder funds are voted in
accordance with applicable provisions of Section 12 of the Investment Company
Act of 1940.
Subject to participation agreements with certain Exchange Traded Funds ("ETF")
issuers that have received exemptive orders from the U.S. Securities and
Exchange Commission allowing investing DWS funds to exceed the limits set forth
in Section 12(d)(1)(A) and (B) of the Investment Company Act of 1940, DeAM will
echo vote proxies for ETFs in which Deutsche Bank holds more than 25% of
outstanding voting shares globally when required to do so by participation
agreements and SEC orders.
Affiliated Public Companies. For proxies solicited by non-investment company
issuers of or within the Deutsche Bank organization, e.g., Deutsche bank
itself, these proxies will be voted in the same proportion as the vote of other
shareholders (i.e., "mirror" or "echo" voting).
Note: With respect to the QP Trust (not registered under the Investment Company
Act of 1940), the Fund is not required to engage in echo voting and the
investment adviser will use these Guidelines, and may determine, with respect
to the QP Trust, to vote contrary to the positions in the Guidelines,
consistent with the Fund's best interest.
C. OTHER PROCEDURES THAT LIMIT CONFLICTS OF INTEREST
AM and other entities in the Deutsche Bank organization have adopted a number
of policies, procedures and internal controls that are designed to avoid
various conflicts of interest, including those that may arise in connection
with proxy voting, including:
o Deutsche Bank Americas Restricted Activities Policy. This policy provides
for, among other things, independence of AM employees from CIB, and
information barriers between AM and other affiliates. Specifically, no AM
employee may be subject to the supervision or control of any employee of
CIB. No AM employee shall have his or her compensation based upon his or
her contribution to any business activity within the Bank outside of the
business of AM, without the prior approval of Legal or Compliance. Further,
no employee of CIB shall have any input into the compensation of a AM
employee without the prior approval of Legal or Compliance. Under the
information barriers section of this policy, as a general rule, AM
employees who are associated with the investment process should have no
contact with employees of Deutsche Bank or its affiliates, outside of PCAM,
regarding specific clients, business matters, or initiatives. Further,
under no circumstances should proxy votes be discussed with any Deutsche
Bank employee outside of AM (and should only be discussed on a need-to-know
basis within AM).
Other relevant internal policies include the Deutsche Bank Americas Code of
Professional Conduct, the Deutsche Asset Management Information Sharing
Procedures, the Deutsche Asset Management Code of Ethics, the Sarbanes-Oxley
Senior Officer Code of Ethics, and the Deutsche Bank Group Code of Conduct. The
GPVSC expects that these policies, procedures and internal controls will
greatly reduce the chance that the GPVSC (or, its members) would be involved
in, aware of or influenced by, an actual or apparent conflict of interest.
V. RECORDKEEPING
At a minimum, the following types of records must be properly maintained and
readily accessible in order to evidence compliance with this policy.
o AM will maintain a record of each vote cast by AM that includes among other
things, company name, meeting date, proposals presented, vote cast and
shares voted.
II-147
o The Proxy Vendor Oversight maintains records for each of the proxy ballots
it votes. Specifically, the records include, but are not limited to:
- The proxy statement (and any additional solicitation materials) and
relevant portions of annual statements.
- Any additional information considered in the voting process that may be
obtained from an issuing company, its agents or proxy research firms.
- Analyst worksheets created for stock option plan and share increase
analyses.
- Proxy Edge print-screen of actual vote election.
o AM will retain these Policies and Procedures and the Guidelines; will
maintain records of client requests for proxy voting information; and will
retain any documents the Proxy Vendor Oversight or the GPVSC prepared that
were material to making a voting decision or that memorialized the basis
for a proxy voting decision.
o The GPVSC also will create and maintain appropriate records documenting its
compliance with these Policies and Procedures, including records of its
deliberations and decisions regarding conflicts of interest and their
resolution.
o With respect to AM's investment company clients, ISS will create and
maintain records of each company's proxy voting record for 12-month periods
ended June 30. AM will compile the following information for each matter
relating to a portfolio security considered at any shareholder meeting held
during the period covered by the report and with respect to which the
company was entitled to vote:
- The name of the issuer of the portfolio security;
- The exchange ticker symbol of the portfolio security (if symbol is
available through reasonably practicable means);
- The Council on Uniform Securities Identification Procedures number for
the portfolio security (if the number is available through reasonably
practicable means);
- The shareholder meeting date;
- A brief identification of the matter voted on;
- Whether the matter was proposed by the issuer or by a security holder;
- Whether the company cast its vote on the matter;
- How the company cast its vote (e.g., for or against proposal, or
abstain; for or withhold regarding election of directors); and
- Whether the company cast its vote for or against management.
Note: This list is intended to provide guidance only in terms of the records
that must be maintained in accordance with this policy. In addition, please
note that records must be maintained in accordance with the applicable AM
Records Management Policy.
With respect to electronically stored records, "properly maintained" is defined
as complete, authentic (unalterable) usable and backed-up. At a minimum,
records should be retained for a period of not less than six years (or longer,
if necessary to comply with applicable regulatory requirements), the first
three years in an appropriate AM office.
VI. THE GPVSC'S OVERSIGHT ROLE
In addition to adopting the Guidelines and making proxy voting decisions on
matters referred to it as set forth above, the GPVSC will monitor the proxy
voting process by reviewing summary proxy information presented by ISS. The
GPVSC will use this review process to determine, among other things, whether
any changes should be made to the Guidelines. This review will take place at
least quarterly and will be documented in the GPVSC's minutes.
II-148
ATTACHMENT A - GLOBAL PROXY VOTING GUIDELINES
DEUTSCHE ASSET MANAGEMENT
GLOBAL PROXY VOTING GUIDELINESAS AMENDED OCTOBER 2008
[GRAPHIC OMITTED]
II-149
TABLE OF CONTENTS
I BOARD OF DIRECTORS AND EXECUTIVES
A Election Of Directors
B Classified Boards Of Directors
C Board And Committee Independence
D Liability And Indemnification Of Directors
E Qualifications Of Directors
F Removal Of Directors And Filling Of Vacancies
G Proposals To Fix The Size Of The Board
H Proposals to Restrict Chief Executive Officer's
Service on Multiple Boards
I Proposals to Restrict Supervisory Board
Members Service on Multiple Boards
J Proposals to Establish Audit Committees
II CAPITAL STRUCTURE
A Authorization Of Additional Shares
B Authorization Of "Blank Check" Preferred Stock
C Stock Splits/Reverse Stock Splits
D Dual Class/Supervoting Stock
E Large Block Issuance
F Recapitalization Into A Single Class Of Stock
G Share Repurchases
H Reductions In Par Value
III CORPORATE GOVERNANCE ISSUES
A Confidential Voting
B Cumulative Voting
C Supermajority Voting Requirements
D Shareholder Right To Vote
IV COMPENSATION
A Establishment of a Remuneration Committee
B Executive And Director Stock Option Plans
C Employee Stock Option/Purchase Plans
D Golden Parachutes
E Proposals To Limit Benefits Or Executive
Compensation
F Option Expensing
G Management board election and motion
H Remuneration (variable pay)
I Long-term incentive plans
J Shareholder Proposals Concerning "Pay For
Superior Performance"
K Executive Compensation Advisory
V ANTI-TAKEOVER RELATED ISSUES
A Shareholder Rights Plans ("Poison Pills")
B Reincorporation
C Fair-Price Proposals
D Exemption From State Takeover Laws
E Non-Financial Effects Of Takeover Bids
VI MERGERS & ACQUISITIONS
II-150
VII SOCIAL & POLITICAL ISSUES
A Labor & Human Rights
B Diversity & Equality
C Health & Safety
D Government/Military
E Tobacco
VIII ENVIRONMENTAL ISSUES
IX MISCELLANEOUS ITEMS
A Ratification Of Auditors
B Limitation Of Non-Audit Services Provided By
Independent Auditor
C Audit Firm Rotation
D Transaction Of Other Business
E Motions To Adjourn The Meeting
F Bundled Proposals
G Change Of Company Name
H Proposals Related To The Annual Meeting
I Reimbursement Of Expenses Incurred From
Candidate Nomination
J Investment Company Proxies
K International Proxy Voting
II-151
These Guidelines may reflect a voting position that differs from the actual
practices of the public company (ies) within the Deutsche Bank organization or
of the investment companies for which AM or an affiliate serves as investment
adviser or sponsor.
NOTE: Because of the unique structure and regulatory scheme applicable to
closed-end investment companies, the voting guidelines (particularly those
related to governance issues) generally will be inapplicable to holdings of
closed-end investment companies. As a result, determinations on the appropriate
voting recommendation for closed-end investment company shares will be made on
a case-by-case basis.
I. BOARD OF DIRECTORS AND EXECUTIVES
A. ELECTION OF DIRECTORS
Routine: AM Policy is to vote "for" the uncontested election of directors.
Votes for a director in an uncontested election will be withheld in cases where
a director has shown an inability to perform his/her duties in the best
interests of the shareholders.
Proxy contest: In a proxy contest involving election of directors, a
case-by-case voting decision will be made based upon analysis of the issues
involved and the merits of the incumbent and dissident slates of directors. AM
will incorporate the decisions of a third party proxy research vendor,
currently, Institutional Shareholder Services ("ISS") subject to review by the
Proxy Voting Sub-Committee (GPVSC) as set forth in the AM's Proxy Voting
Policies and Procedures.
Rationale: The large majority of corporate directors fulfill their fiduciary
obligation and in most cases support for management's nominees is warranted. As
the issues relevant to a contested election differ in each instance, those
cases must be addressed as they arise.
B. CLASSIFIED BOARDS OF DIRECTORS
AM policy is to vote against proposals to classify the board and for proposals
to repeal classified boards and elect directors annually.
Rationale: Directors should be held accountable on an annual basis. By
entrenching the incumbent board, a classified board may be used as an
anti-takeover device to the detriment of the shareholders in a hostile
take-over situation.
C. BOARD AND COMMITTEE INDEPENDENCE
AM policy is to vote:
1. "For" proposals that require that a certain percentage (majority up to 66
2/3%) of members of a board of directors be comprised of independent or
unaffiliated directors.
2. "For" proposals that require all members of a company's compensation, audit,
nominating, or other similar committees be comprised of independent or
unaffiliated directors.
3. "Against" shareholder proposals to require the addition of special interest,
or constituency, representatives to boards of directors.
4. "For" separation of the Chairman and CEO positions.
5. "Against" proposals that require a company to appoint a Chairman who is an
independent director.
Rationale: Board independence is a cornerstone of effective governance and
accountability. A board that is sufficiently independent from management
assures that shareholders' interests are adequately represented. However, the
Chairman of the board must have sufficient involvement in and experience with
the operations of the company to perform the functions required of that
position and lead the company.
II-152
No director qualifies as 'independent' unless the board of directors
affirmatively determines that the director has no material relationship with
the listed company (either directly or as a partner, shareholder or officer of
an organization that has a relationship with the company).
Whether a director is in fact not "independent" will depend on the laws and
regulations of the primary market for the security and the exchanges, if any,
on which the security trades.
D. LIABILITY AND INDEMNIFICATION OF DIRECTORS
AM policy is to vote "for" management proposals to limit directors' liability
and to broaden the indemnification of directors, unless broader indemnification
or limitations on directors' liability would effect shareholders' interests in
pending litigation.
Rationale: While shareholders want directors and officers to be responsible for
their actions, it is not in the best interests of the shareholders for them to
be to risk averse. If the risk of personal liability is too great, companies
may not be able to find capable directors willing to serve. We support
expanding coverage only for actions taken in good faith and not for serious
violations of fiduciary obligation or negligence.
E. QUALIFICATIONS OF DIRECTORS
AM policy is to follow management's recommended vote on either management or
shareholder proposals that set retirement ages for directors or require
specific levels of stock ownership by directors.
Rationale: As a general rule, the board of directors, and not the shareholders,
is most qualified to establish qualification policies.
F. REMOVAL OF DIRECTORS AND FILLING OF VACANCIES
AM policy is to vote "against" proposals that include provisions that directors
may be removed only for cause or proposals that include provisions that only
continuing directors may fill board vacancies.
Rationale: Differing state statutes permit removal of directors with or without
cause. Removal of directors for cause usually requires proof of self-dealing,
fraud or misappropriation of corporate assets, limiting shareholders' ability
to remove directors except under extreme circumstances. Removal without cause
requires no such showing.
Allowing only incumbent directors to fill vacancies can serve as an
anti-takeover device, precluding shareholders from filling the board until the
next regular election.
G. PROPOSALS TO FIX THE SIZE OF THE BOARD
AM policy is to vote:
1. "For" proposals to fix the size of the board unless: (a) no specific reason
for the proposed change is given; or (b) the proposal is part of a package
of takeover defenses.
2. "Against" proposals allowing management to fix the size of the board without
shareholder approval.
Rationale: Absent danger of anti-takeover use, companies should be granted a
reasonable amount of flexibility in fixing the size of its board.
H. PROPOSALS TO RESTRICT CHIEF EXECUTIVE OFFICER'S SERVICE ON MULTIPLE BOARDS
AM policy is to vote "For" proposals to restrict a Chief Executive Officer from
serving on more than three outside boards of directors.
II-153
Rationale: Chief Executive Officer must have sufficient time to ensure that
shareholders' interests are represented adequately.
Note: A director's service on multiple closed-end fund boards within a fund
complex are treated as service on a single Board for the purpose of the proxy
voting guidelines.
I. PROPOSALS TO RESTRICT SUPERVISORY BOARD MEMBERS SERVICE ON MULTIPLE BOARDS
(FOR FFT SECURITIES)
AM policy is to vote "for" proposals to restrict a Supervisory Board Member
from serving on more than five supervisory boards.
Rationale: We consider a strong, independent and knowledgeable supervisory
board as important counter-balance to executive management to ensure that the
interests of shareholders are fully reflected by the company.
Full information should be disclosed in the annual reports and accounts to
allow all shareholders to judge the success of the supervisory board
controlling their company.
Supervisory Board Member must have sufficient time to ensure that shareholders'
interests are represented adequately.
Note: A director's service on multiple closed-end fund boards within a fund
complex are treated as service on a single Board for the purpose of the proxy
voting guidelines.
J. PROPOSALS TO ESTABLISH AUDIT COMMITTEES (FOR FFT AND U.S. SECURITIES)
AM policy is to vote "for" proposals that require the establishment of audit
committees.
Rationale: The audit committee should deal with accounting and risk management
related questions, verifies the independence of the auditor with due regard to
possible conflicts of interest. It also should determine the procedure of the
audit process.
II. CAPITAL STRUCTURE
A. AUTHORIZATION OF ADDITIONAL SHARES (FOR U.S. SECURITIES)
AM policy is to vote "for" proposals to increase the authorization of existing
classes of stock that do not exceed a 3:1 ratio of shares authorized to shares
outstanding for a large cap company, and do not exceed a 4:1 ratio of shares
authorized to shares outstanding for a small-midcap company (companies having a
market capitalization under one billion U.S. dollars.).
Rationale: While companies need an adequate number of shares in order to carry
on business, increases requested for general financial flexibility must be
limited to protect shareholders from their potential use as an anti-takeover
device. Requested increases for specifically designated, reasonable business
purposes (stock split, merger, etc.) will be considered in light of those
purposes and the number of shares required.
B. AUTHORIZATION OF "BLANK CHECK" PREFERRED STOCK (FOR U.S. SECURITIES)
AM policy is to vote:
1. "Against" proposals to create blank check preferred stock or to increase the
number of authorized shares of blank check preferred stock unless the
company expressly states that the stock will not be used for anti-takeover
purposes and will not be issued without shareholder approval.
2. "For" proposals mandating shareholder approval of blank check stock
placement.
Rationale: Shareholders should be permitted to monitor the issuance of classes
of preferred stock in which the board of directors is given unfettered
discretion to set voting, dividend, conversion and other rights for the shares
issued.
II-154
C. STOCK SPLITS/REVERSE STOCK SPLITS
AM policy is to vote "for" stock splits if a legitimate business purpose is set
forth and the split is in the shareholders' best interests. A vote is cast
"for" a reverse stock split only if the number of shares authorized is reduced
in the same proportion as the reverse split or if the effective increase in
authorized shares (relative to outstanding shares) complies with the proxy
guidelines for common stock increases (see, Section II.A, above.)
Rationale: Generally, stock splits do not detrimentally effect shareholders.
Reverse stock splits, however, may have the same result as an increase in
authorized shares and should be analyzed accordingly.
D. DUAL CLASS/SUPERVOTING STOCK
AM policy is to vote "against" proposals to create or authorize additional
shares of super-voting stock or stock with unequal voting rights.
Rationale: The "one share, one vote" principal ensures that no shareholder
maintains a voting interest exceeding their equity interest in the company.
E. LARGE BLOCK ISSUANCE (FOR U.S. SECURITIES)
AM policy is to address large block issuances of stock on a case-by-case basis,
incorporating the recommendation of an independent third party proxy research
firm (currently ISS) subject to review by the GPVSC as set forth in AM's Proxy
Policies and Procedures.
Additionally, AM supports proposals requiring shareholder approval of large
block issuances.
Rationale: Stock issuances must be reviewed in light of the business
circumstances leading to the request and the potential impact on shareholder
value.
F. RECAPITALIZATION INTO A SINGLE CLASS OF STOCK
AM policy is to vote "for" recapitalization plans to provide for a single class
of common stock, provided the terms are fair, with no class of stock being
unduly disadvantaged.
Rationale: Consolidation of multiple classes of stock is a business decision
that may be left to the board and/management if there is no adverse effect on
shareholders.
G. SHARE REPURCHASES
AM policy is to vote "for" share repurchase plans provided all shareholders are
able to participate on equal terms.
Rationale: Buybacks are generally considered beneficial to shareholders because
they tend to increase returns to the remaining shareholders.
H. REDUCTIONS IN PAR VALUE
AM policy is to vote "for" proposals to reduce par value, provided a legitimate
business purpose is stated (e.g., the reduction of corporate tax
responsibility.)
Rationale: Usually, adjustments to par value are a routine financial decision
with no substantial impact on shareholders.
III. CORPORATE GOVERNANCE ISSUES
A. CONFIDENTIAL VOTING
AM policy is to vote "for" proposals to provide for confidential voting and
independent tabulation of voting results and to vote "against" proposals to
repeal such provisions.
II-155
Rationale: Confidential voting protects the privacy rights of all shareholders.
This is particularly important for employee-shareholders or shareholders with
business or other affiliations with the company, who may be vulnerable to
coercion or retaliation when opposing management. Confidential voting does not
interfere with the ability of corporations to communicate with all
shareholders, nor does it prohibit shareholders from making their views known
directly to management.
B. CUMULATIVE VOTING (FOR U.S. SECURITIES)
AM policy is to vote "against" shareholder proposals requesting cumulative
voting and "for" management proposals to eliminate it. The protections afforded
shareholders by cumulative voting are not necessary when a company has a
history of good performance and does not have a concentrated ownership
interest. Accordingly, a vote is cast "against" cumulative voting and "for"
proposals to eliminate it if:
a) The company has a five year return on investment greater than the relevant
industry index,
b) All directors and executive officers as a group beneficially own less than
10% of the outstanding stock, and
c) No shareholder (or voting block) beneficially owns 15% or more of the
company.
Thus, failure of any one of the three criteria results in a vote for cumulative
voting in accordance with the general policy.
Rationale: Cumulative voting is a tool that should be used to ensure that
holders of a significant number of shares may have board representation;
however, the presence of other safeguards may make their use unnecessary.
C. SUPERMAJORITY VOTING REQUIREMENTS
AM policy is to vote "against" management proposals to require a supermajority
vote to amend the charter or bylaws and to vote "for" shareholder proposals to
modify or rescind existing supermajority requirements.
* Exception made when company holds a controlling position and seeks to
lower threshold to maintain control and/or make changes to corporate
by-laws.
Rationale: Supermajority voting provisions violate the democratic principle
that a simple majority should carry the vote. Setting supermajority
requirements may make it difficult or impossible for shareholders to remove
egregious by-law or charter provisions. Occasionally, a company with a
significant insider held position might attempt to lower a supermajority
threshold to make it easier for management to approve provisions that may be
detrimental to shareholders. In that case, it may not be in the shareholders
interests to lower the supermajority provision.
D. SHAREHOLDER RIGHT TO VOTE
AM policy is to vote "against" proposals that restrict the right of
shareholders to call special meetings, amend the bylaws, or act by written
consent. Policy is to vote "for" proposals that remove such restrictions.
Rationale: Any reasonable means whereby shareholders can make their views known
to management or effect the governance process should be supported.
IV. COMPENSATION
Annual Incentive Plans or Bonus Plans are often submitted to shareholders for
approval. These plans typically award cash to executives based on company
performance. Deutsche Bank believes that the responsibility for executive
compensation decisions rest with the board of directors and/or the compensation
committee, and its policy is not to second-guess the board's award of cash
compensation amounts to executives unless a particular award or series of
awards is deemed excessive. If stock options are awarded as part of these bonus
or incentive plans, the provisions must meet Deutsche Bank's criteria regarding
stock option plans, or similar stock-based incentive compensation schemes, as
set forth below.
II-156
A. ESTABLISHMENT OF A REMUNERATION COMMITTEE (FOR FFT SECURITIES)
AM policy is to vote "for" proposals that require the establishment of a
remuneration committee.
Rationale: Corporations should disclose in each annual report or proxy
statement their policies on remuneration. Essential details regarding executive
remuneration including share options, long-term incentive plans and bonuses,
should be disclosed in the annual report, so that investors can judge whether
corporate pay policies and practices meet the standard.
The remuneration committee shall not comprise any board members and should be
sensitive to the wider scene on executive pay. It should ensure that
performance-based elements of executive pay are designed to align the interests
of shareholders.
B. EXECUTIVE AND DIRECTOR STOCK OPTION PLANS
AM policy is to vote "for" stock option plans that meet the following criteria:
(1) The resulting dilution of existing shares is less than (a) 15 percent of
outstanding shares for large capital corporations or (b) 20 percent of
outstanding shares for small-mid capital companies (companies having a
market capitalization under one billion U.S. dollars.)
(2) The transfer of equity resulting from granting options at less than FMV
is no greater than 3% of the over-all market capitalization of large
capital corporations, or 5% of market cap for small-mid capital
companies.
(3) The plan does not contain express repricing provisions and, in the
absence of an express statement that options will not be repriced; the
company does not have a history of repricing options.
(4) The plan does not grant options on super-voting stock.
AM will support performance-based option proposals as long as a) they do not
mandate that all options granted by the company must be performance based, and
b) only certain high-level executives are subject to receive the performance
based options.
AM will support proposals to eliminate the payment of outside director
pensions.
Rationale: Determining the cost to the company and to shareholders of
stock-based incentive plans raises significant issues not encountered with
cash-based compensation plans. These include the potential dilution of existing
shareholders' voting power, the transfer of equity out of the company resulting
from the grant and execution of options at less than FMV and the authority to
reprice or replace underwater options. Our stock option plan analysis model
seeks to allow reasonable levels of flexibility for a company yet still protect
shareholders from the negative impact of excessive stock compensation.
Acknowledging that small mid-capital corporations often rely more heavily on
stock option plans as their main source of executive compensation and may not
be able to compete with their large capital competitors with cash compensation,
we provide slightly more flexibility for those companies.
C. EMPLOYEE STOCK OPTION/PURCHASE PLANS
AM policy is to vote for employee stock purchase plans (ESPP's) when the plan
complies with Internal Revenue Code 423, allowing non-management employees to
purchase stock at 85% of FMV.
AM policy is to vote "for" employee stock option plans (ESOPs) provided they
meet the standards for stock option plans in general. However, when computing
dilution and transfer of equity, ESOPs are considered independently from
executive and director option plans.
Rationale: ESOPs and ESPP's encourage rank-and-file employees to acquire an
ownership stake in the companies they work for and have been shown to promote
employee loyalty and improve productivity.
II-157
D. GOLDEN PARACHUTES
AM policy is to vote "for" proposals to require shareholder approval of golden
parachutes and for proposals that would limit golden parachutes to no more than
three times base compensation. Policy is to vote "against" more restrictive
shareholder proposals to limit golden parachutes.
Rationale: In setting a reasonable limitation, AM considers that an effective
parachute should be less attractive than continued employment and that the IRS
has opined that amounts greater than three times annual salary, are excessive.
E. PROPOSALS TO LIMIT BENEFITS OR EXECUTIVE COMPENSATION
AM policy is to vote "against"
1. Proposals to limit benefits, pensions or compensation and
2. Proposals that request or require disclosure of executive compensation
greater than the disclosure required by Securities and Exchange Commission
(SEC) regulations.
Rationale: Levels of compensation and benefits are generally considered to be
day-to-day operations of the company, and are best left unrestricted by
arbitrary limitations proposed by shareholders.
F. OPTION EXPENSING
AM policy is to support proposals requesting companies to expense stock
options.
Rationale: Although companies can choose to expense options voluntarily, the
Financial Accounting Standards Board (FASB) does not yet require it, instead
allowing companies to disclose the theoretical value of options as a footnote.
Because the expensing of stock options lowers earnings, most companies elect
not to do so. Given the fact that options have become an integral component of
compensation and their exercise results in a transfer of shareholder value, AM
agrees that their value should not be ignored and treated as "no cost"
compensation. The expensing of stock options would promote more modest and
appropriate use of stock options in executive compensation plans and present a
more accurate picture of company operational earnings.
G. MANAGEMENT BOARD ELECTION AND MOTION (FOR FFT SECURITIES)
AM policy is to vote "against":
o the election of board members with positions on either remuneration or audit
committees;
o the election of supervisory board members with too many supervisory board
mandates;
o "automatic" election of former board members into the supervisory board.
Rationale: Management as an entity, and each of its members, are responsible
for all actions of the company, and are - subject to applicable laws and
regulations - accountable to the shareholders as a whole for their actions.
Sufficient information should be disclosed in the annual company report and
account to allow shareholders to judge the success of the company.
H. REMUNERATION (VARIABLE PAY): (FOR FFT SECURITIES)
EXECUTIVE REMUNERATION FOR MANAGEMENT BOARD
AM policy is to vote "for" remuneration for Management Board that is
transparent and linked to results.
II-158
Rationale: Executive compensation should motivate management and align the
interests of management with the shareholders. The focus should be on criteria
that prevent excessive remuneration; but enable the company to hire and retain
first-class professionals.
Shareholder interests are normally best served when management is remunerated
to optimise long-term returns. Criteria should include suitable measurements
like return on capital employed or economic value added.
Interests should generally also be correctly aligned when management own shares
in the company - even more so if these shares represent a substantial portion
of their own wealth.
Its disclosure shall differentiate between fixed pay, variable (performance
related) pay and long-term incentives, including stock option plans with
valuation ranges as well as pension and any other significant arrangements.
EXECUTIVE REMUNERATION FOR SUPERVISORY BOARD
AM policy is to vote "for" remuneration for Supervisory Board that is at least
50% in fixed form.
Rationale: It would normally be preferable if performance linked compensation
were not based on dividend payments, but linked to suitable result based
parameters. Consulting and procurement services should also be published in the
company report.
I. LONG-TERM INCENTIVE PLANS (FOR FFT SECURITIES)
AM policy is to vote "for" long-term incentive plans for members of a
management board that reward for above average company performance.
Rationale: Incentive plans will normally be supported if they:
o directly align the interests of members of management boards with those of
shareholders;
o establish challenging performance criteria to reward only above average
performance;
o measure performance by total shareholder return in relation to the market or
a range of comparable companies;
o are long-term in nature and encourage long-term ownership of the shares once
exercised through minimum holding periods;
o do not allow a repricing of the exercise price in stock option plans.
J. SHAREHOLDER PROPOSALS CONCERNING "PAY FOR SUPERIOR PERFORMANCE"
AM policy is to address pay for superior performance proposals on a
case-by-case basis, incorporating the recommendation of an independent third
party proxy research firm (currently ISS) subject to review by the GPVSC as set
forth in AM's Proxy Policies and Procedures.
Rationale: While AM agrees that compensation issues are better left to the
discretion of management, they appreciate the need to monitor for excessive
compensation practices on a case by case basis. If, after a review of the ISS
metrics, AM is comfortable with ISS's applying this calculation and will vote
according to their recommendation.
K. EXECUTIVE COMPENSATION ADVISORY
AM policy is to follow management's recommended vote on shareholder proposals
to propose an advisory resolution seeking to ratify the compensation of the
company's named executive officers (NEOs) on an annual basis.
II-159
Rationale: AM believes that controls exist within senior management and
corporate compensation committees, ensuring fair compensation to executives.
This might allow shareholders to require approval for all levels of
management's compensation.
V. ANTI-TAKEOVER RELATED ISSUES
A. SHAREHOLDER RIGHTS PLANS ("POISON PILLS")
AM policy is to vote "for" proposals to require shareholder ratification of
poison pills or that request boards to redeem poison pills, and to vote
"against" the adoption of poison pills if they are submitted for shareholder
ratification.
Rationale: Poison pills are the most prevalent form of corporate takeover
defenses and can be (and usually are) adopted without shareholder review or
consent. The potential cost of poison pills to shareholders during an attempted
takeover outweighs the benefits.
B. REINCORPORATION
AM policy is to examine reincorporation proposals on a case-by-case basis. The
voting decision is based on: (1) differences in state law between the existing
state of incorporation and the proposed state of incorporation; and (2)
differences between the existing and the proposed charter/bylaws/articles of
incorporation and their effect on shareholder rights. If changes resulting from
the proposed reincorporation violate the corporate governance principles set
forth in these guidelines, the reincorporation will be deemed contrary to
shareholder's interests and a vote cast "against."
Rationale: Reincorporations can be properly analyzed only by looking at the
advantages and disadvantages to their shareholders. Care must be taken that
anti-takeover protection is not the sole or primary result of a proposed
change.
C. FAIR-PRICE PROPOSALS
AM policy is to vote "for" management fair-price proposals, provided that: (1)
the proposal applies only to two-tier offers; (2) the proposal sets an
objective fair-price test based on the highest price that the acquirer has paid
for a company's shares; (3) the supermajority requirement for bids that fail
the fair-price test is no higher than two-thirds of the outstanding shares; (4)
the proposal contains no other anti-takeover provisions or provisions that
restrict shareholders rights.
A vote is cast for shareholder proposals that would modify or repeal existing
fair-price requirements that do not meet these standards.
Rationale: While fair price provisions may be used as anti-takeover devices, if
adequate provisions are included, they provide some protection to shareholders
who have some say in their application and the ability to reject those
protections if desired.
D. EXEMPTION FROM STATE TAKEOVER LAWS
AM policy is to vote "for" shareholder proposals to opt out of state takeover
laws and to vote "against" management proposals requesting to opt out of state
takeover laws.
Rationale: Control share statutes, enacted at the state level, may harm
long-term share value by entrenching management. They also unfairly deny
certain shares their inherent voting rights.
E.NON-FINANCIAL EFFECTS OF TAKEOVER BIDS
Policy is to vote "against" shareholder proposals to require consideration of
non-financial effects of merger or acquisition proposals.
Rationale: Non-financial effects may often be subjective and are secondary to
AM's stated purpose of acting in its client's best economic interest.
II-160
VI. MERGERS & ACQUISITIONS
Evaluation of mergers, acquisitions and other special corporate transactions
(i.e., takeovers, spin-offs, sales of assets, reorganizations, restructurings
and recapitalizations) are performed on a case-by-case basis incorporating
information from an independent proxy research source (currently ISS.)
Additional resources including portfolio management and research analysts may
be considered as set forth in AM's Policies and Procedures.
VII. SOCIAL, ENVIRONMENTAL & POLITICAL ISSUES
Social and environmental issues are becoming increasingly important to
corporate success. We incorporate social and environmental considerations into
both our investment decisions and our proxy voting decisions - particularly if
the financial performance of the company could be impacted.
With increasing frequency, shareholder proposals are submitted relating to
social and political responsibility issues. Almost universally, the company
management will recommend a vote "against" these proposals. These types of
proposals cover an extremely wide range of issues. Many of the issues tend to
be controversial and are subject to more than one reasonable, yet opposing,
theory of support. More so than with other types of proxy proposals, social and
political responsibility issues may not have a connection to the economic and
corporate governance principles effecting shareholders' interests. AM's policy
regarding social and political responsibility issues, as with any other issue,
is designed to protect our client shareholders' economic interests.
Occasionally, a distinction is made between a shareholder proposal requesting
direct action on behalf of the board and a request for a report on (or
disclosure of) some information. In order to avoid unduly burdening any company
with reporting requirements, AM's policy is to vote against shareholder
proposals that demand additional disclosure or reporting than is required by
the Securities and Exchange Commission unless it appears there is a legitimate
issue and the company has not adequately addressed shareholders' concerns.
A. LABOR & HUMAN RIGHTS
AM policy is to vote "against" adopting global codes of conduct or workplace
standards exceeding those mandated by law.
Rationale: Additional requirements beyond those mandated by law are deemed
unnecessary and potentially burdensome to companies
B. DIVERSITY & EQUALITY
1. AM policy is to vote "against" shareholder proposals to force equal
employment opportunity, affirmative action or board diversity.
Rationale: Compliance with State and Federal legislation along with information
made available through filings with the EEOC provides sufficient assurance that
companies act responsibly and make information public.
2. AM policy is also to vote "against" proposals to adopt the Mac Bride
Principles. The Mac Bride Principles promote fair employment, specifically
regarding religious discrimination.
Rationale: Compliance with the Fair Employment Act of 1989 makes adoption of
the Mac Bride Principles redundant. Their adoption could potentially lead to
charges of reverse discrimination.
C. HEALTH & SAFETY
1. AM policy is to vote "against" adopting a pharmaceutical price restraint
policy or reporting pricing policy changes.
Rationale: Pricing is an integral part of business for pharmaceutical companies
and should not be dictated by shareholders (particularly pursuant to an
arbitrary formula.) Disclosing pricing policies may also jeopardize a company's
competitive position in the marketplace.
II-161
2. AM policy is to vote "against" shareholder proposals to control the use or
labeling of and reporting on genetically engineered products.
Rationale: Additional requirements beyond those mandated by law are deemed
unnecessary and potentially burdensome to companies.
D. GOVERNMENT/MILITARY
1. AM policy is to vote against shareholder proposals regarding the production
or sale of military arms or nuclear or space-based weapons, including
proposals seeking to dictate a company's interaction with a particular
foreign country or agency.
Rationale: Generally, management is in a better position to determine what
products or industries a company can and should participate in. Regulation of
the production or distribution of military supplies is, or should be, a matter
of government policy.
2. AM policy is to vote "against" shareholder proposals regarding political
contributions and donations.
Rationale: The Board of Directors and Management, not shareholders, should
evaluate and determine the recipients of any contributions made by the company.
3. AM policy is to vote "against" shareholder proposals regarding charitable
contributions and donations.
Rationale: The Board of Directors and Management, not shareholders, should
evaluate and determine the recipients of any contributions made by the company.
E. TOBACCO
1. AM policy is to vote "against" shareholder proposals requesting additional
standards or reporting requirements for tobacco companies as well as
"against" requesting companies to report on the intentional manipulation of
nicotine content.
Rationale: Where a tobacco company's actions meet the requirements of legal and
industry standards, imposing additional burdens may detrimentally effect a
company's ability to compete. The disclosure of nicotine content information
could affect the company's rights in any pending or future litigation.
2. Shareholder requests to spin-off or restructure tobacco businesses will be
opposed.
Rationale: These decisions are more appropriately left to the Board and
management, and not to shareholder mandate.
VIII. ENVIRONMENTAL ISSUES
AM policy is to follow management's recommended vote on CERES Principles or
other similar environmental mandates (e.g., those relating to Greenhouse gas
emissions or the use of nuclear power).
Rationale: Environmental issues are extensively regulated by outside agencies
and compliance with additional requirements often involves significant cost to
companies.
IX. MISCELLANEOUS ITEMS
A. RATIFICATION OF AUDITORS
AM policy is to vote "for" a) the management recommended selection of auditors
and b) proposals to require shareholder approval of auditors.
II-162
Rationale: Absent evidence that auditors have not performed their duties
adequately, support for management's nomination is warranted.
B. LIMITATION OF NON-AUDIT SERVICES PROVIDED BY INDEPENDENT AUDITOR
AM policy is to support proposals limiting non-audit fees to 50% of the
aggregate annual fees earned by the firm retained as a company's independent
auditor.
Rationale: In the wake of financial reporting problems and alleged audit
failures at a number of companies, AM supports the general principle that
companies should retain separate firms for audit and consulting services to
avoid potential conflicts of interest. However, given the protections afforded
by the recently enacted Sarbanes-Oxley Act of 2002 (which requires Audit
Committee pre-approval for non-audit services and prohibits auditors from
providing specific types of services), and the fact that some non-audit
services are legitimate audit-related services, complete separation of audit
and consulting fees may not be warranted. A reasonable limitation is
appropriate to help ensure auditor independence and it is reasonable to expect
that audit fees exceed non-audit fees.
C. AUDIT FIRM ROTATION
AM policy is to support proposals seeking audit firm rotation unless the
rotation period sought is less than five years.
Rationale: While the Sarbanes-Oxley Act mandates that the lead audit partner be
switched every five years, AM believes that rotation of the actual audit firm
would provide an even stronger system of checks and balances on the audit
function.
D. Transaction of Other Business
AM policy is to vote against "transaction of other business" proposals.
Rationale: This is a routine item to allow shareholders to raise other issues
and discuss them at the meeting. As the nature of these issues may not be
disclosed prior to the meeting, we recommend a vote against these proposals.
This protects shareholders voting by proxy (and not physically present at a
meeting) from having action taken at the meeting that they did not receive
proper notification of or sufficient opportunity to consider.
E. MOTIONS TO ADJOURN THE MEETING
AM Policy is to vote against proposals to adjourn the meeting.
Rationale: Management may seek authority to adjourn the meeting if a favorable
outcome is not secured. Shareholders should already have had enough information
to make a decision. Once votes have been cast, there is no justification for
management to continue spending time and money to press shareholders for
support.
F. BUNDLED PROPOSALS
AM policy is to vote against bundled proposals if any bundled issue would
require a vote against it if proposed individually.
Rationale: Shareholders should not be forced to "take the good with the bad" in
cases where the proposals could reasonably have been submitted separately.
G. CHANGE OF COMPANY NAME
AM policy is to support management on proposals to change the company name.
Rationale: This is generally considered a business decision for a company.
II-163
H. PROPOSALS RELATED TO THE ANNUAL MEETING
AM Policy is to vote in favor of management for proposals related to the
conduct of the annual meeting (meeting time, place, etc.)
Rationale: These are considered routine administrative proposals.
I. REIMBURSEMENT OF EXPENSES INCURRED FROM CANDIDATE NOMINATION
AM policy is to follow management's recommended vote on shareholder proposals
related to the amending of company bylaws to provide for the reimbursement of
reasonable expenses incurred in connection with nominating one or more
candidates in a contested election of directors to the corporation's board of
directors.
Rationale: Corporations should not be liable for costs associated with
shareholder proposals for directors.
J. INVESTMENT COMPANY PROXIES
Proxies solicited by investment companies are voted in accordance with the
recommendations of an independent third party, currently ISS. However,
regarding investment companies for which AM or an affiliate serves as
investment adviser or principal underwriter, such proxies are voted in the same
proportion as the vote of all other shareholders. Proxies solicited by master
funds from feeder funds will be voted in accordance with applicable provisions
of Section 12 of the Investment Company Act of 1940.
Investment companies, particularly closed-end investment companies, are
different from traditional operating companies. These differences may call for
differences in voting positions on the same matter. For example, AM could vote
"for" staggered boards of closed-end investment companies, although AM
generally votes "against" staggered boards for operating companies. Further,
the manner in which AM votes investment company proxies may differ from
proposals for which a AM-advised investment company solicits proxies from its
shareholders. As reflected in the Guidelines, proxies solicited by closed-end
(and open-end) investment companies are voted in accordance with the
pre-determined guidelines of an independent third-party.
Subject to participation agreements with certain Exchange Traded Funds ("ETF")
issuers that have received exemptive orders from the U.S. Securities and
Exchange Commission allowing investing DWS funds to exceed the limits set forth
in Section 12(d)(1)(A) and (B) of the Investment Company Act of 1940, DeAM will
echo vote proxies for ETFs in which Deutsche Bank holds more than 25% of
outstanding voting shares globally when required to do so by participation
agreements and SEC orders.
Note: With respect to the QP Trust (not registered under the Investment Company
Act of 1940), the Fund is not required to engage in echo voting and the
investment adviser will use these Guidelines, and may determine, with respect
to the QP Trust, to vote contrary to the positions in the Guidelines,
consistent with the Fund's best interest.
K. INTERNATIONAL PROXY VOTING
The above guidelines pertain to issuers organized in the United States, Canada
and Germany. Proxies solicited by other issuers are voted in accordance with
international guidelines or the recommendation of ISS and in accordance with
applicable law and regulation.
-------------------------------------------------------------------------------
IMPORTANT: The information contained herein is the property of Deutsche Bank
Group and may not be copied, used or disclosed in whole or in part, stored in
a retrieval system or transmitted in any form or by any means (electronic,
mechanical, reprographic, recording or otherwise) without the prior written
permission of Deutsche Bank Group.
-------------------------------------------------------------------------------
II-164
[BARGRAPHIC APPEARS HERE]
STATEMENT OF ADDITIONAL INFORMATION
MAY 1, 2010 AS REVISED OCTOBER 4, 2010
DWS VARIABLE SERIES II
CLASS A AND B SHARES
345 PARK AVENUE, NEW YORK, NEW YORK 10154
This combined Statement of Additional Information ("SAI") is not a prospectus
and should be read in conjunction with the applicable combined prospectus for
DWS Variable Series II, dated May 1, 2010 as supplemented from time to time, a
copy of which may be obtained without charge by calling (800) 728-3337. This
SAI is incorporated by reference into the prospectus.
Portions of the Annual Report to Shareholders of each fund are incorporated
herein by reference, as specified herein, and are hereby deemed to be part of
this SAI. Reports to Shareholders may also be obtained without charge by
calling (800) 728-3337.
This SAI is divided into two Parts - Part I and Part II. Part I contains
information that is specific to each fund, while Part II contains information
that generally applies to each of the funds in the DWS funds.
DWS Variable Series II offers a choice of 17 funds to holders of certain
variable life insurance and variable annuity contracts offered by participating
insurance companies ("Participating Insurance Companies").
Except as noted below, each fund offers Class A and Class B shares. The funds
are:
DWS ALTERNATIVE ASSET ALLOCATION PLUS VIP DWS LARGE CAP VALUE VIP
DWS BALANCED VIP (CLASS A ONLY) DWS MID CAP GROWTH VIP (CLASS A ONLY)
DWS BLUE CHIP VIP DWS MONEY MARKET VIP (CLASS A ONLY)
DWS CORE FIXED INCOME VIP (CLASS A ONLY) DWS SMALL CAP GROWTH VIP (CLASS A ONLY)
DWS DIVERSIFIED INTERNATIONAL EQUITY VIP (CLASS A ONLY) DWS STRATEGIC INCOME VIP (CLASS A ONLY)
DWS DREMAN SMALL MID CAP VALUE VIP DWS STRATEGIC VALUE VIP
DWS GLOBAL THEMATIC VIP DWS TECHNOLOGY VIP
DWS GOVERNMENT & AGENCY SECURITIES VIP DWS TURNER MID CAP GROWTH VIP (CLASS A ONLY)
DWS HIGH INCOME VIP
[DWS INVESTMENTS LOGO]
Deutsche Bank Group
STATEMENT OF ADDITIONAL INFORMATION (SAI) - PART I
PAGE
Part I................................................................................... I-1
Definitions............................................................................ I-1
Fund Organization...................................................................... I-2
Management of Each Fund................................................................ I-2
Distribution Plan Payments............................................................. I-3
Portfolio Transactions and Brokerage Commissions....................................... I-3
Investments............................................................................ I-3
Investment Restrictions................................................................ I-3
Taxes.................................................................................. I-7
Independent Registered Public Accounting Firm, Reports to Shareholders and Financial I-7
Statements
Additional Information................................................................. I-7
Part I: Appendix I-A - Board Member Share Ownership and Control........................ I-8
Part I: Appendix I-B - Board Committees and Meetings................................... I-17
Part I: Appendix I-C - Board Member Compensation....................................... I-21
Part I: Appendix I-D - Portfolio Management............................................ I-25
Part I: Appendix I-E - Affiliated Service Provider Compensation........................ I-42
Part I: Appendix I-F - Distribution Plan Payments...................................... I-51
Part I: Appendix I-G - Portfolio Transactions and Brokerage Commissions................ I-52
Part I: Appendix I-H - Investment Practices and Techniques............................. I-69
Part I: Appendix I-I - Additional Information.......................................... I-76
Part II.................................................................................. II-1
PART I
DEFINITIONS
"1934 Act" - the Securities Exchange Act of 1934, as amended
"1940 Act" - the Investment Company Act of 1940, as amended
"Code" - the Internal Revenue Code of 1986, as amended
"DeAM" - Deutsche Asset Management
"DIMA" or "Advisor" or "Administrator" - Deutsche Investment Management
Americas Inc., 345 Park Avenue, New York, New York 10154
"Subadvisor" - RREEF America L.L.C., 875 N. Michigan Avenue, Chicago, IL 60611
for DWS Alternative Asset Allocation Plus VIP; QS Investors, LLC, 880 Third
Avenue, 7th Floor, New York, NY 10017 for DWS Alternative Asset Allocation VIP,
DWS Balanced VIP, DWS Blue Chip VIP, DWS Diversified International Equity VIP
and DWS Strategic Income VIP; Deutsche Asset Management International GmbH,
Mainzer Landstrasse 178-190, Frankfurt am Main, Germany for DWS Balanced VIP
and DWS Large Cap Value VIP; Dreman Value Management, L.L.C., 520 East Cooper
Avenue, Suite 230-4, Aspen, CO 81611 for DWS Dreman Small Mid Cap Value VIP;
Global Thematic Partners, LLC, 681 Fifth Avenue, New York, NY 10022 for DWS
Global Thematic VIP; Turner Investment Partners, Inc., 1205 Westlakes Drive,
Suite 100, Berwyn, Pennsylvania 19312 for DWS Turner Mid Cap Growth VIP
"Sub-subadvisors"- Deutsche Alternatives Asset Management (Global) Limited, 1
Great Winchester Street, London, United Kingdom, EC2N 2DB; Deutsche Asset
Management (Hong Kong) Limited, 48/ F Cheung Kong Center, 2 Queen's Road
Central, Hong Kong, China and Deutsche Investments Australia Limited, Level 16,
Deutsche Bank Place, Cnr Hunter & Phillip Streets, Sydney, Australia, NSW, 2000
for DWS Alternative Asset Allocation Plus VIP.
"DIDI" or "Distributor" - DWS Investments Distributors, Inc., 222 South
Riverside Plaza, Chicago, Illinois 60606
"DISC" or "Transfer Agent" - DWS Investments Service Company, 210 W. 10th
Street, Kansas City, Missouri 64105-1614
"DIFA" - DWS Investments Fund Accounting Corporation, One Beacon Street,
Boston, Massachusetts 02108 (formerly Scudder Fund Accounting Corporation)
"DWS funds" - The US registered investment companies advised by DIMA
"Board Members" - Members of the Board of Trustees of the Trust
"Board" - Board of Trustees of the Trust
"Independent Board Members"- Board Members who are not interested persons (as
defined in the 1940 Act)
"fund" or "series" - DWS Alternative Asset Allocation VIP, DWS Balanced VIP,
DWS Blue Chip VIP, DWS Core Fixed Income VIP, DWS Dreman Small Mid Cap Value
VIP, DWS Global Thematic VIP, DWS Government & Agency Securities VIP, DWS High
Income VIP, DWS Diversified International Equity VIP, DWS Large Cap Value VIP,
DWS Mid Cap Growth VIP, DWS Money Market VIP, DWS Small Cap Growth VIP, DWS
Strategic Income VIP, DWS Strategic Value VIP, DWS Technology VIP, DWS Turner
Mid Cap Growth VIP as the context may require
"Custodian" - For all funds (other than DWS Diversified International Equity
VIP and DWS Global Thematic VIP): State Street Bank and Trust Company,
Lafayette Corporate Center, 2 Avenue De Lafayette, Boston, MA 02111, for DWS
Diversified International Equity VIP and DWS Global Thematic VIP: Brown
Brothers Harriman & Company, 40 Water Street, Boston, Massachusetts 02109
"Fund Legal Counsel" - Vedder Price P.C., 222 North LaSalle Street, Chicago, IL
60601
"Trustee/Director Legal Counsel" - Ropes & Gray LLP, Prudential Tower, 800
Boylston Street, Boston, MA 02199
"Trust" - DWS Variable Series II
"NRSRO"- A nationally recognized statistical rating organization
"S&P" - Standards & Poor's Ratings Group, an NRSRO
"Moody's" - Moody's Investors Service, Inc., an NRSRO
"Fitch" - Fitch Investors Service, Inc., an NRSRO
I-1
FUND ORGANIZATION
Each of the funds is a series of DWS Variable Series II (the "Trust"), a
Massachusetts business trust established under an Amended and Restated
Agreement and Declaration of Trust dated January 22, 1987, as amended from time
to time. On February 6, 2006, Scudder Variable Series II was renamed DWS
Variable Series II. On February 6, 2006, Scudder Total Return Portfolio was
renamed DWS Balanced VIP; Scudder Blue Chip Portfolio was renamed DWS Blue Chip
VIP; Scudder Fixed Income Portfolio was renamed DWS Core Fixed Income VIP;
Scudder International Select Equity Portfolio was renamed DWS International
Select Equity VIP, which on May 1, 2009 was renamed DWS Diversified
International Equity VIP; SVS Dreman Small Cap Value Portfolio was renamed DWS
Dreman Small Cap Value VIP, which on November 3, 2006 was renamed DWS Dreman
Small Mid Cap Value VIP; Scudder Global Blue Chip Portfolio was renamed DWS
Global Thematic VIP; Scudder Government & Agency Securities Portfolio was
renamed DWS Government & Agency Securities VIP; Scudder High Income Portfolio
was renamed DWS High Income VIP; Scudder Large Cap Value Portfolio was renamed
DWS Large Cap Value VIP; Scudder Mid Cap Growth Portfolio (known as Scudder
Aggressive Growth Portfolio from May 1, 2001 until October 27, 2005) was
renamed DWS Mid Cap Growth VIP; Scudder Money Market Portfolio was renamed DWS
Money Market VIP; Scudder Small Cap Growth Portfolio was renamed DWS Small Cap
Growth VIP; Scudder Strategic Income Portfolio was renamed DWS Strategic Income
VIP; SVS Dreman High Return Equity Portfolio was renamed DWS Dreman High Return
Equity VIP, which on June 1, 2009 was renamed DWS Strategic Value VIP; Scudder
Technology Growth Portfolio was renamed DWS Technology VIP; and SVS Turner Mid
Cap Growth Portfolio was renamed DWS Turner Mid Cap Growth VIP.
The Trust is governed by an Amended and Restated Declaration of Trust dated
June 2, 2008, as may be further amended from time to time (the "Declaration of
Trust"). The Declaration of Trust was last approved by shareholders in 2008.
Additional information about the Trust is set forth in PART II under "Fund
Organization."
MULTI-MANAGER STRUCTURE. The Advisor, subject to the approval of the Board, has
ultimate responsibility to recommend the hiring, termination and replacement of
subadvisors. Each fund and the Advisor have received an order from the SEC that
allows each fund and the Advisor to utilize a multi-manager structure in
managing each fund's assets. Pursuant to the SEC order, the Advisor, with the
approval of each fund's Board, is permitted to select subadvisors that are not
affiliates of the Advisor ("non-affiliated subadvisors") to manage all or a
portion of each fund's assets without obtaining shareholder approval. The
Advisor also has the discretion to terminate any subadvisor and allocate and
reallocate each fund's assets among any non-affiliated subadvisors. The SEC
order also permits the Advisor, subject to the approval of the Board, to
materially amend an existing subadvisory agreement with a non-affiliated
subadvisor without shareholder approval. Each fund and the Advisor are subject
to the conditions imposed by the SEC order, including the condition that within
90 days of hiring of a new non-affiliated subadvisor, each fund will provide
shareholders with an information statement containing information about the new
non-affiliated subadvisor.
Each fund and the Advisor have also filed an exemptive application with the SEC
requesting an order that would extend the relief granted with respect to
non-affiliated subadvisors to certain subadvisors that are affiliates of the
Advisor ("affiliated subadvisors"). If such relief is granted by the SEC, the
Advisor, with the approval of each fund's Board, would be able to hire
non-affiliated and/or affiliated subadvisors to manage all or a portion of each
fund's assets without obtaining shareholder approval. The Advisor would also
have the discretion to terminate any subadvisor and allocate and reallocate
each fund's assets among any other subadvisors (including terminating a
non-affiliated subadvisor and replacing them with an affiliated subadvisor).
The Advisor, subject to the approval of the Board, would also be able to
materially amend an existing subadvisory agreement with any such subadvisor
without shareholder approval. There can be no assurance that such relief will
be granted by the SEC. Each fund and the Advisor will be subject to any new
conditions imposed by the SEC.
MANAGEMENT OF EACH FUND
BOARD MEMBERS AND OFFICERS' IDENTIFICATION AND BACKGROUND
The identification and background of the Board Members and officers are set
forth in PART II - APPENDIX II-A.
BOARD COMMITTEES AND COMPENSATION
Compensation paid to the Independent Board Members, for certain specified
periods is set forth in PART I - APPENDIX I-C. Information regarding the
committees of the Board, is set forth in PART I - APPENDIX I-B.
I-2
BOARD MEMBER SHARE OWNERSHIP AND CONTROL PERSONS
Information concerning the ownership of fund shares by Board Members and
officers, as a group, as well as the dollar range value of each Board Member's
share ownership in each fund and, on an aggregate basis, in all DWS funds
overseen, by investors who control the fund, if any, and by investors who own
5% or more of any class of fund shares, if any, is set forth in PART I -
APPENDIX I-A.
PORTFOLIO MANAGEMENT
Information regarding each fund's portfolio manager(s), including other
accounts managed, compensation, ownership of fund shares and possible conflicts
of interest, is set forth in PART I - APPENDIX I-D and PART II - APPENDIX II-B.
This section does not apply to money market funds.
AFFILIATED SERVICE PROVIDER COMPENSATION
Compensation paid by each fund to its affiliated service providers for various
services including investment management, administrative, transfer agency, and,
for certain funds, fund accounting services, is set forth in PART I - APPENDIX
I-E. For information regarding payments made to DIDI, see PART I - APPENDIX
I-E. Fee rates for services of the above referenced affiliated service
providers are included in PART II - APPENDIX II-C.
DISTRIBUTION PLAN PAYMENTS
DISTRIBUTION PLAN PAYMENTS
Payments made by each fund for the most recent fiscal year under each fund's
Rule 12b-1 Plans are set forth in PART I - APPENDIX I-F. This information is
not applicable to a fund/class that does not incur expenses paid in connection
with Rule 12b-1 Plans.
PORTFOLIO TRANSACTIONS AND BROKERAGE COMMISSIONS
PORTFOLIO TURNOVER
The portfolio turnover rates for the two most recent fiscal year are set forth
in PART I - APPENDIX I-G. This section does not apply to money market funds or
to a new fund that has not completed a fiscal reporting period.
BROKERAGE COMMISSIONS
Total brokerage commissions paid by each fund for the three most recent fiscal
years are set forth in PART I - APPENDIX I-G.
Each fund's policy with respect to portfolio transactions and brokerage is set
forth under "Portfolio Transactions" in Part II of this SAI.
INVESTMENTS
GENERAL INVESTMENT PRACTICES AND TECHNIQUES
PART I - APPENDIX I-H includes a list of the investment practices and
techniques which each fund may employ in pursuing its investment objective.
PART II - APPENDIX II-G includes a description of these investment practices
and techniques as well as the associated risks.
INVESTMENT RESTRICTIONS
Unless otherwise stated, the policies below apply to each fund.
Except as otherwise indicated, each fund's investment objective and policies
are not fundamental and may be changed without a vote of shareholders. There
can be no assurance that each fund's investment objective will be met.
Any investment restrictions herein which involve a maximum percentage of
securities or assets shall not be considered to be violated unless an excess
over the percentage occurs immediately after and is caused by an acquisition or
encumbrance of securities or assets of, or borrowings by, a fund.
Each fund (except DWS Technology VIP) has elected to be classified as a
diversified series of an open-end management investment company. A diversified
fund may not, with respect to 75% of total assets, invest more than 5% of total
assets in the securities of a single issuer (other than cash and cash items, US
government securities or securities of other investment companies) or invest in
more than 10% of the outstanding voting securities of such issuer. The fund's
election to be classified as diversified under the 1940 Act may not be changed
without a shareholder vote.
DWS Technology VIP has elected to be classified as a non-diversified series of
an open-end management investment company. A non-diversified fund may invest
I-3
a greater proportion of its assets in the obligations of a small number of
issuers, and may be subject to greater risk and substantial losses as a result
of changes in the financial condition or the market's assessment of the
issuers.
Unless specified to the contrary, the following fundamental policies may not be
changed without the approval of a majority of the outstanding voting securities
of a fund which, under the 1940 Act and the rules thereunder and as used in
this SAI, means the lesser of (1) 67% or more of the voting securities present
at such meeting, if the holders of more than 50% of the outstanding voting
securities of a fund are present or represented by proxy, or (2) more than 50%
of the outstanding voting securities of a fund.
As a matter of fundamental policy, a fund may not do any of the following:
(1) borrow money, except as permitted under the 1940 Act, as interpreted or
modified by regulatory authority having jurisdiction, from time to time.
(2) issue senior securities, except as permitted under the 1940 Act, as
interpreted or modified by regulatory authority having jurisdiction,
from time to time.
(3) purchase or sell commodities, except as permitted by the 1940 Act, as
interpreted or modified by the regulatory authority having jurisdiction,
from time to time.
(4) engage in the business of underwriting securities issued by others,
except to the extent that the fund may be deemed to be an underwriter in
connection with the disposition of portfolio securities.
(5) purchase or sell real estate, which term does not include securities of
companies which deal in real estate or mortgages or investments secured
by real estate or interests therein, except that the fund reserves
freedom of action to hold and to sell real estate acquired as a result
of the fund's ownership of securities.
(6) make loans except as permitted under the 1940 Act, as interpreted or
modified by regulatory authority having jurisdiction, from time to time.
(7) (for all funds except DWS Alternative Asset Allocation Plus VIP, DWS
Money Market VIP and DWS Technology VIP) concentrate its investments in
a particular industry, as that term is used in the 1940 Act, as
interpreted or modified by regulatory authority having jurisdiction,
from time to time.
(8) (for DWS Alternative Asset Allocation Plus VIP only) concentrate its
investments in a particular industry, as that term is used in the 1940
Act, and as interpreted or modified by regulatory authority having
jurisdiction, from time to time, except that the fund may concentrate in
any underlying DWS fund.
(9) (for DWS Money Market VIP only) concentrate its investments in a
particular industry (excluding U.S. Government Obligations), as that
term is used in the 1940 Act, as interpreted or modified by the
regulatory authority having jurisdiction from time to time; except that
the fund will invest more than 25% of its total assets in the
obligations of banks and other financial institutions.
(10) (for DWS Technology VIP only) concentrate its investments in a
particular industry, as that term is used in the 1940 Act, as
interpreted or modified by regulatory authority having jurisdiction,
from time to time, except that the fund will concentrate its assets in
the group of industries constituting the technology sector and may
concentrate in one or more industries in the technology sector.
With respect to fundamental policy (9) for DWS Money Market VIP, domestic banks
include US banks and US branches of foreign banks that are subject to the same
regulation as US banks. Domestic banks may also include foreign branches of
domestic banks if the investment risk associated with investing in instruments
issued by the foreign branch of a domestic bank is the same as investing in
instruments issued by the domestic parent. As a result, the fund may be more
adversely affected by changes in market or economic conditions and other
circumstances affecting the banking industry than it would be if the fund's
assets were not so concentrated.
With respect to fundamental policy (9) for DWS Money Market VIP, for purposes
of determining the percentage of the fund's total assets invested in securities
of issuers having their principal business activites in a particular industry,
asset-backed securities will be classified based on standard classifications
utilized by ratings agencies.
OTHER INVESTMENT POLICIES. The Board has adopted certain non-fundamental
policies and restrictions which are observed in the conduct of a fund's
affairs. They differ
I-4
from fundamental investment policies in that they may be changed or amended by
action of the Board without requiring prior notice to, or approval of, the
shareholders.
As a matter of non-fundamental policy:
(1) (for all funds except DWS Money Market VIP) the fund may not purchase
illiquid securities, including time deposits and repurchase agreements
maturing in more than seven days, if, as a result, more than 15% of the
fund's net assets would be invested in such securities.
(2) (for all funds except DWS Alternative Asset Allocation Plus VIP) the
Board has the discretion to retain the current distribution arrangement
for the fund while investing in a master fund in a master-feeder
structure (this policy would permit the Board, without shareholder
approval to convert the fund to a master-feeder structure).
(3) (for all funds except DWS Alternative Asset Allocation Plus VIP and DWS
Strategic Income VIP) the fund may not acquire securities of registered
open-end investment companies or registered unit investment trusts in
reliance on Sections 12(d)(1)(F) or 12(d)(1)(G) of the 1940 Act.
(4) the fund may not acquire securities of other investment companies,
except as permitted by the 1940 Act and the rules, regulations and any
applicable exemptive order issued thereunder.
(5) the fund will not pay any additional or separate fees for credit
support.
(6) (for all funds except DWS Alternative Asset Allocation Plus VIP, DWS
Money Market VIP, DWS Core Fixed Income VIP and DWS Balanced VIP) the
fund does not intend to invest more than 5% of its total assets in
asset-backed securities.
(7) (for DWS Core Fixed Income VIP and DWS Balanced VIP only) the fund does
not intend to invest more than 25% of its total assets in asset-backed
securities.
(8) (for DWS Alternative Asset Allocation Plus VIP only) the fund will enter
into transactions only in publicly traded asset-indexed securities.
(9) (for DWS Money Market VIP only) the fund may not invest more than 50% of
its assets in asset-backed securities.
(10) (for DWS Balanced VIP, DWS High Income VIP and DWS Strategic Income VIP
only) the fund may invest in all types of direct debt investments, but
among these investments the fund currently intends to invest primarily
in direct loans and trade claims.
(11) (for DWS Money Market VIP and DWS Government Agency Securities VIP only)
the fund's non-US investments may be denominated only in the US dollar.
(12) (for DWS Blue Chip VIP and DWS Mid Cap Growth VIP only) the fund may not
invest more than 20% of its net assets in foreign securities.
(13) (for DWS Small Cap Growth VIP only) the fund may not invest more than
25% of total assets in foreign securities.
(14) (for DWS Technology VIP only) the fund may not invest more than 35% of
net assets in foreign securities.
(15) (for DWS Strategic Value VIP and DWS Dreman Small Mid Cap Value VIP
only) the fund may invest up to 20% of net assets in US dollar
denominated American Depositary Receipts and in securities of foreign
companies traded primarily in markets outside the US.
(16) (for DWS High Income VIP only) the fund may not invest more than 50% of
total assets in bonds from foreign issuers.
(17) (for DWS Core Fixed Income VIP only) the fund may not invest more than
25% of its total assets in bonds from foreign issuers.
(18) (for all funds except DWS Money Market VIP) the fund may not invest more
than 5% of its net assets in inverse floaters.
(19) (for DWS Money Market VIP only) the fund may not invest in inverse
floaters.
(20) (for all funds except DWS Alternative Asset Allocation Plus VIP) it is
anticipated that no more than 5% of a fund's net assets will be invested
in interest only (IO) and principal only (PO) securities.
(21) (for all funds except DWS Alternative Asset Allocation Plus VIP) the
fund will only invest in those
I-5
collateralized obligations that are fully collateralized and that meet
quality standards otherwise applicable to a fund's investments
(22) (for DWS Alternative Asset Allocation Plus VIP only) if a participation
interest in which the fund invests is unrated, or has been given a
rating below that which is permissible for purchase by the fund, the
participation interest will be backed by an irrevocable letter of credit
or guarantee of a bank, or the payment obligation otherwise will be
collateralized by US Government securities, or, in the case of unrated
participation interests, determined by the Advisor to be of comparable
quality to those instruments in which the fund may invest.
(23) (for DWS Alternative Asset Allocation Plus VIP only) the fund will
generally invest in preferred stock that is be rated at least CCC by S&P
or Caa by Moody's or, if unrated, is of comparable quality in the
opinion of the Advisor.
(24) (for all funds except DWS Money Market VIP) the fund will enter into
reverse repurchase agreements only when the Advisor or Subadvisor
believes that the interest income to be earned from the investment or
proceeds of the transaction will be greater than the interest expense of
the transaction.
(25) (for all funds except DWS Alternative Asset Allocation Plus VIP) the
fund does not intend to invest more than 20% of its net assets in zero
coupon US Government Securities.
(26) (for all funds except DWS Alternative Asset Allocation Plus VIP and DWS
Money Market VIP) the fund may not purchase options, unless the
aggregate premiums paid on all such options held by the fund at any time
do not exceed 20% of its total assets; or sell put options, if, as a
result, the aggregate value of the obligations underlying such put
options would exceed 50% of its total assets.
(27) (for all funds except DWS Money Market VIP) the fund may not purchase
warrants if, as a result, such securities, taken at the lower of cost or
market value, would represent more than 5% of the value of the fund's
total assets (for this purpose, warrants acquired in units or attached
to securities will be deemed to have no value).
(28) (for all funds except DWS Money Market VIP) the fund will not sell put
options if, as a result, more than 50% of the fund's total assets would
be required to be segregated to cover its potential obligations under
such put options other than those with respect to futures and options
thereon.
(29) (for all funds except DWS Money Market VIP) the fund generally will not
enter into a transaction to hedge currency exposure to an extent
greater, after netting all transactions intended wholly or partially to
offset other transactions, than the aggregate market value (at the time
of entering into the transaction) of the securities held in its
portfolio that are denominated or generally quoted in or currently
convertible into such currency, other than with respect to proxy hedging
or cross hedging.
(30) (for all funds except DWS Money Market VIP) to the extent the fund
engages in proxy hedging, the amount of the commitment or option would
not exceed the value of the fund's securities denominated in correlated
currencies.
(31) (for all funds except DWS Money Market VIP) the fund will not sell
interest rate caps or floors where it does not own securities or other
instruments providing the income stream the fund may be obligated to
pay.
(32) (for all funds except DWS Money Market VIP) the fund will only sell
credit protection with respect to securities in which it would be
authorized to invest directly.
(33) (for DWS Balanced VIP, DWS High Income VIP and DWS Strategic Income VIP
only) no more than 5% of total assets may be invested in credit default
swaps for purposes of buying credit protection on individual securities
if the fund does not own the underlying security or securities at the
time of investment.
(34) (for DWS Balanced VIP, DWS High Income VIP and DWS Strategic Income VIP
only) the fund may invest up to 15% of its total assets in credit
default swaps.
(35) (for DWS Core Fixed Income VIP only) the fund may not invest more than
5% of its net assets in below investment-grade bonds (i.e., junk bonds).
For purposes of non-fundamental policy (1), and for so long as it remains a
position of the SEC, fixed time deposits maturing in more than seven days that
cannot be traded on a secondary market and participation
I-6
interests in loans will be treated as illiquid. Restricted securities
(including commercial paper issued pursuant to Section 4(2) of the Securities
Act of 1933) that the Board has determined to be readily marketable will not be
deemed to be illiquid for purposes of non-fundamental policy (1).
TAXES
Important information concerning the tax consequences of an investment in each
fund is contained in PART II - APPENDIX II-H.
INDEPENDENT REGISTERED PUBLIC ACCOUNTING FIRM, REPORTS TO SHAREHOLDERS AND
FINANCIAL STATEMENTS
The financial highlights of each fund included in the prospectus and the
financial statements incorporated by reference into this SAI have been so
included or incorporated by reference in reliance on the report of Ernst &
Young LLP, 200 Clarendon Street, Boston, MA 02116. Ernst & Young LLP is an
independent registered public accounting firm. The report is given on the
authority of said firm as experts in auditing and accounting. The accounting
firm audits the financial statements of each fund and provides other audit, tax
and related services. Shareholders will receive annual audited financial
statements and semi-annual unaudited financial statements.
The financial statements, together with the report of the Independent
Registered Public Accounting Firm, Financial Highlights and notes to financial
statements in the Annual Report to the Shareholders of each fund, dated
December 31, 2009 (SEC File No. 811-05002), are incorporated herein by
reference and are hereby deemed to be a part of this combined SAI.
ADDITIONAL INFORMATION
For information on CUSIP numbers and fund fiscal year end information, see PART
I - APPENDIX I-I.
I-7
PART I: APPENDIX I-A - BOARD MEMBER SHARE OWNERSHIP AND CONTROL
BOARD MEMBER SHARE OWNERSHIP IN EACH FUND
The following tables show the dollar range of equity securities beneficially
owned by each Board Member in each fund and in DWS funds as of December 31,
2009.
DOLLAR RANGE OF BENEFICIAL OWNERSHIP/(1)/
BOARD MEMBER DWS VARIABLE SERIES II
INDEPENDENT BOARD MEMBER:
John W. Ballantine None
Henry P. Becton, Jr. None
Dawn-Marie Driscoll None
Keith R. Fox None
Paul K. Freeman None
Kenneth C. Froewiss None
Richard J. Herring None
William McClayton None
Rebecca W. Rimel None
William N. Searcy, Jr. None
Jean Gleason Stromberg None
Robert Wadsworth None
INTERESTED BOARD MEMBER
Ingo Gefeke None
AGGREGATE DOLLAR RANGE OF BENEFICIAL OWNERSHIP/(1)/
FUNDS OVERSEEN BY
BOARD MEMBER IN THE
BOARD MEMBER DWS FUND COMPLEX
INDEPENDENT BOARD MEMBER:
John W. Ballantine Over $100,000
Henry P. Becton, Jr. Over $100,000
Dawn-Marie Driscoll Over $100,000
Keith R. Fox Over $100,000
Paul K. Freeman Over $100,000
Kenneth C. Froewiss Over $100,000
Richard J. Herring Over $100,000
William McClayton Over $100,000
Rebecca W. Rimel Over $100,000
William N. Searcy, Jr. Over $100,000
Jean Gleason Stromberg Over $100,000
Robert Wadsworth Over $100,000
INTERESTED BOARD MEMBER:
Ingo Gefeke/(2)/ None
I-8
(1) Securities beneficially owned as defined under the 1934 Act include
direct and/or indirect ownership of securities where the Board Member's
economic interest is tied to the securities, employment ownership and
securities when the Board Member can exert voting power and when the
Board Member has authority to sell the securities. The dollar ranges are:
None, $1 - $10,000, $10,001 - $50,000, $50,001 - $100,000, over $100,000.
(2) Mr. Gefeke is a board member of the following trusts and corporations:
Cash Account Trust, DWS Balanced Fund, DWS Blue Chip Fund, DWS Equity
Trust, DWS High Income Series, DWS Money Funds, DWS State Tax-Free Income
Series, DWS Strategic Government Securities Fund, DWS Strategic Income
Fund, DWS Target Fund, DWS Technology Fund, DWS Value Series, Inc., DWS
Variable Series II, Investors Cash Trust, Tax-Exempt California Money
Market Fund, DWS Dreman Value Income Edge Fund, Inc., DWS Global High
Income Fund, Inc., DWS High Income Trust, DWS Multi-Market Income Trust,
DWS Municipal Income Trust, DWS RREEF World Real Estate Fund, Inc., DWS
Strategic Income Trust, and DWS Strategic Municipal Income Trust.
OWNERSHIP IN SECURITIES OF THE ADVISOR AND RELATED COMPANIES
As reported to each fund, the information in the table below reflects ownership
by the Independent Board Members and their immediate family members of certain
securities as of December 31, 2009. An immediate family member can be a spouse,
children residing in the same household including step and adoptive children
and any dependents. The securities represent ownership in the Advisor or
Distributor and any persons (other than a registered investment company)
directly or indirectly controlling, controlled by, or under common control with
the Advisor or Distributor (including Deutsche Bank AG).
OWNER AND VALUE OF PERCENT OF
INDEPENDENT RELATIONSHIP TO TITLE OF SECURITIES ON AN CLASS ON AN
BOARD MEMBER BOARD MEMBER COMPANY CLASS AGGREGATE BASIS AGGREGATE BASIS
John W. Ballantine None
Henry P. Becton, Jr. None
Dawn-Marie Driscoll None
Keith R. Fox None
Paul K. Freeman None
Kenneth C. Froewiss None
Richard J. Herring None
William McClayton None
Rebecca W. Rimel None
William N. Searcy, Jr. None
Jean Gleason Stromberg None
Robert H. Wadsworth None
As of April 7, 2010, all Board Members and officers owned, as a group, less
than 1% of the outstanding shares of a fund.
25% OR GREATER OWNERSHIP
No investor owns 25% or more of a fund's shares as of April 7, 2010, and
therefore there is no presumed control of a fund. Shareholders who beneficially
own 25% or more of a fund's shares may have a significant impact on any
shareholder vote of the fund.
5% OR GREATER OWNERSHIP OF SHARE CLASSES
The following table identifies those investors who own 5% or more of a fund
share class as of April 7, 2010. All holdings are of record, unless otherwise
indicated.
I-9
DWS ALTERNATIVE ASSET ALLOCATION PLUS VIP
NAME AND ADDRESS OF INVESTOR SHARES CLASS PERCENTAGE
LINCOLN NATIONAL LIFE INSURANCE 164,442.53 A 98.93%
VARIABLE LIFE ACCOUNT M
FORT WAYNE IN 46802-3506
LINCOLN NATIONAL LIFE INSURANCE 487,302.67 B 96.42%
VARIABLE LIFE ACCOUNT M
FORT WAYNE IN 46802-3506
DWS BALANCED VIP
NAME AND ADDRESS OF INVESTOR SHARES CLASS PERCENTAGE
KEMPER INVESTORS LIFE 6,624,075.29 A 44.19%
ATTN PRODUCT VALUATION
SECURITY BENEFIT
TOPEKA KS 66636-1000
ALLMERICA LIFE SVSII 3,398,966.62 A 22.67%
ATTN PRODUCT VALUATION
TOPEKA KS 66636-1000
ZURICH DESTINATIONS FARMERS SVSII 2,163,343.20 A 14.43%
C/O KILICO
ATTN INVESTMENT ACCOUNTING LL-2W
GREENVILLE SC 29602-9097
SYMETRA LIFE INSURANCE CO 1,044,392.22 A 6.97%
ATTN LIFE FINANCE
SEPARATE ACCOUNTS
BELLEVUE WA 98004-5130
CHARTER NAT LIFE INS CO-HORIZON 914,007.16 A 6.10%
ATTN ACCTNG FINANCIAL CONTROL TEAM
PALATINE IL 60094-4210
DWS BLUE CHIP VIP
NAME AND ADDRESS OF INVESTOR SHARES CLASS PERCENTAGE
ZURICH DESTINATIONS FARMERS SVSII 5,931,174.49 A 53.04%
C/O KILICO
ATTN INVESTMENT ACCOUNTING LL-2W
GREENVILLE SC 29602-9097
ALLMERICA LIFE SVSII 4,374,313.05 A 39.12%
ATTN PRODUCT VALUATION
TOPEKA KS 66636-1000
KEMPER INVESTORS LIFE INS CO 17,120.85 B 100.00%
VARIABLE ANNUITY SEPARATE ACCOUNTS
ATTN PRODUCT VALUATION
SECURITY BENEFIT
TOPEKA KS 66636-1000
I-10
DWS CORE FIXED INCOME VIP
NAME AND ADDRESS OF INVESTOR SHARES CLASS PERCENTAGE
ALLMERICA LIFE SVSII 4,471,223.80 A 44.03%
ATTN PRODUCT VALUATION
TOPEKA KS 66636-1000
ZURICH DESTINATIONS FARMERS SVSII 4,228,230.24 A 41.64%
C/O KILICO
ATTN INVESTMENT ACCOUNTING LL-2W
GREENVILLE SC 29602-9097
KEMPER INVESTORS LIFE 1,315,553.72 A 12.95%
ATTN PRODUCT VALUATION
SECURITY BENEFIT
TOPEKA KS 66636-1000
DWS DIVERSIFIED INTERNATIONAL EQUITY VIP
NAME AND ADDRESS OF INVESTOR SHARES CLASS PERCENTAGE
ZURICH DESTINATIONS FARMERS SVSII 4,584,213.13 A 41.15%
C/O KILICO
ATTN INVESTMENT ACCOUNTING LL-2W
GREENVILLE SC 29602-9097
KEMPER INVESTORS LIFE 3,255,504.36 A 29.22%
ATTN PRODUCT VALUATION
SECURITY BENEFIT
TOPEKA KS 66636-1000
ALLMERICA LIFE SVSII 3,222,591.51 A 28.93%
ATTN PRODUCT VALUATION
TOPEKA KS 66636-1000
DWS DREMAN SMALL MID CAP VALUE VIP
NAME AND ADDRESS OF INVESTOR SHARES CLASS PERCENTAGE
ZURICH DESTINATIONS FARMERS SVSII 8,669,415.53 A 38.17%
C/O KILICO
ATTN INVESTMENT ACCOUNTING LL-2W
GREENVILLE SC 29602-9097
ALLMERICA LIFE SVSII 5,854,769.62 A 25.77%
ATTN PRODUCT VALUATION
TOPEKA KS 66636-1000
KEMPER INVESTORS LIFE 3,230,627.49 A 14.22%
ATTN PRODUCT VALUATION
SECURITY BENEFIT
TOPEKA KS 66636-1000
AMERITAS LIFE INSURANCE GROUP 1,679,402.00 A 7.39%
SEPARATE ACCOUNT VA2
LINCOLN NE 68510-2234
METLIFE INSURANCE CO OF CT 1,034,582.89 B 44.95%
ATTN SHAREHOLDER ACCOUNTING DEPT
HARTFORD CT 06199-0027
I-11
NAME AND ADDRESS OF INVESTOR SHARES CLASS PERCENTAGE
NATIONAL LIFE INS CO 462,409.04 B 20.09%
SENTINEL ADVANTAGE (VA)
MONTPELIER VT 05604-0001
NATIONAL LIFE INS CO 256,299.41 B 11.14%
VARITRAK (VUL)
MONTPELIER VT 05604-0001
NATIONWIDE LIFE INSURANCE CO 157,400.42 B 6.84%
NWVLI4
C/O IPO PORTFOLIO ACCOUNTING
COLUMBUS OH 43218-2029
NATIONWIDE LIFE INSURANCE CO 153,040.40 B 6.65%
NWPP
IPO PORTFOLIO ACCOUNTING
COLUMBUS OH 43218-2029
DWS GLOBAL THEMATIC VIP
NAME AND ADDRESS OF INVESTOR SHARES CLASS PERCENTAGE
ZURICH DESTINATIONS FARMERS SVSII 4,614,538.00 A 58.85%
C/O KILICO
ATTN INVESTMENT ACCOUNTING LL-2W
GREENVILLE SC 29602-9097
ALLMERICA LIFE SVSII 2,590,193.28 A 33.03%
ATTN PRODUCT VALUATION
TOPEKA KS 66636-1000
METLIFE INSURANCE CO OF CT 568,896.73 B 98.52%
ATTN SHAREHOLDER ACCOUNTING DEPT
HARTFORD CT 06199-0027
DWS GOVERNMENT & AGENCY SECURITIES VIP
NAME AND ADDRESS OF INVESTOR SHARES CLASS PERCENTAGE
ALLMERICA LIFE SVSII 5,231,993.29 A 40.85%
ATTN PRODUCT VALUATION
TOPEKA KS 66636-1000
ZURICH DESTINATIONS FARMERS SVSII 4,863,384.72 A 37.97%
C/O KILICO
ATTN INVESTMENT ACCOUNTING LL-2W
GREENVILLE SC 29602-9097
KEMPER INVESTORS LIFE 1,983,435.65 A 15.49%
ATTN PRODUCT VALUATION
SECURITY BENEFIT
TOPEKA KS 66636-1000
METLIFE INSURANCE CO OF CT 471,757.18 96.73%
ATTN SHAREHOLDER ACCOUNTING DEPT
HARTFORD CT 06199-0027
I-12
DWS HIGH INCOME VIP
NAME AND ADDRESS OF INVESTOR SHARES CLASS PERCENTAGE
ZURICH DESTINATIONS FARMERS SVSII 9,273,111.20 A 33.53%
C/O KILICO
ATTN INVESTMENT ACCOUNTING LL-2W
GREENVILLE SC 29602-9097
ALLMERICA LIFE SVSII 8,791,852.15 A 31.79%
ATTN PRODUCT VALUATION
TOPEKA KS 66636-1000
KEMPER INVESTORS LIFE 7,633,181.08 A 27.60%
ATTN PRODUCT VALUATION
SECURITY BENEFIT
TOPEKA KS 66636-1000
KEMPER INVESTORS LIFE INS CO 22,977.90 B 100.00%
VARIABLE ANNUITY SEPARATE ACCOUNTS
ATTN PRODUCT VALUATION
SECURITY BENEFIT
TOPEKA KS 66636-1000
DWS LARGE CAP VALUE VIP
NAME AND ADDRESS OF INVESTOR SHARES CLASS PERCENTAGE
ZURICH DESTINATIONS FARMERS SVSII 10,414,285.26 A 55.11%
C/O KILICO
ATTN INVESTMENT ACCOUNTING LL-2W
GREENVILLE SC 29602-9097
ALLMERICA LIFE SVSII 5,745,490.60 A 30.41%
ATTN PRODUCT VALUATION
TOPEKA KS 66636-1000
KEMPER INVESTORS LIFE 1,947,086.01 A 10.30%
ATTN PRODUCT VALUATION
SECURITY BENEFIT
TOPEKA KS 66636-1000
NATIONWIDE LIFE INSURANCE CO 54,326.65 B 77.25%
NWPP
IPO PORTFOLIO ACCOUNTING
COLUMBUS OH 43218-2029
KEMPER INVESTORS LIFE INS CO 15,995.30 B 22.75%
VARIABLE ANNUITY SEPARATE ACCOUNTS
ATTN PRODUCT VALUATION
SECURITY BENEFIT
TOPEKA KS 66636-1000
I-13
DWS MID CAP GROWTH VIP
NAME AND ADDRESS OF INVESTOR SHARES CLASS PERCENTAGE
ZURICH DESTINATIONS FARMERS SVSII 1,389,795.29 A 62.75%
C/O KILICO
ATTN INVESTMENT ACCOUNTING LL-2W
GREENVILLE SC 29602-9097
ALLMERICA LIFE SVSII 785,197.51 A 35.45%
ATTN PRODUCT VALUATION
TOPEKA KS 66636-1000
DWS MONEY MARKET VIP
NAME AND ADDRESS OF INVESTOR SHARES CLASS PERCENTAGE
ZURICH DESTINATIONS FARMERS SVSII 82,653,549.52 A 32.48%
C/O KILICO
ATTN INVESTMENT ACCOUNTING LL-2W
GREENVILLE SC 29602-9097
ALLMERICA LIFE SVSII 56,298,675.46 A 22.12%
ATTN PRODUCT VALUATION
TOPEKA KS 66636-1000
KEMPER INVESTORS LIFE 36,442,446.57 A 14.32%
ATTN PRODUCT VALUATION
SECURITY BENEFIT
TOPEKA KS 66636-1000
SEPARATE ACCOUNT B 19,651,411.80 A 7.72%
SAINT LOUIS MO 63105-3443
POWERV FARMERS POWERV & FLEX VULNET 18,537,349.07 A 7.29%
ST LOUIS MO 63131-1834
CHARTER NAT LIFE INS CO-HORIZON 14,403,047.07 A 5.66%
ATTN ACCTNG FINANCIAL CONTROL TEAM
PALATINE IL 60094-4210
UNION CEN INDIVIDUAL MONEY MARKET 13,917,088.28 A 5.47%
CINCINNATI OH 45201-0179
DWS SMALL CAP GROWTH VIP
NAME AND ADDRESS OF INVESTOR SHARES CLASS PERCENTAGE
ZURICH DESTINATIONS FARMERS SVSII 3,089,586.58 A 42.44%
C/O KILICO
ATTN INVESTMENT ACCOUNTING LL-2W
GREENVILLE SC 29602-9097
KEMPER INVESTORS LIFE 1,968,352.83 A 27.04%
ATTN PRODUCT VALUATION
SECURITY BENEFIT
TOPEKA KS 66636-1000
ALLMERICA LIFE SVSII 1,814,650.10 A 24.93%
ATTN PRODUCT VALUATION
TOPEKA KS 66636-1000
I-14
DWS STRATEGIC INCOME VIP
NAME AND ADDRESS OF INVESTOR SHARES CLASS PERCENTAGE
ZURICH DESTINATIONS FARMERS SVSII 3,676,683.30 A 59.64%
C/O KILICO
ATTN INVESTMENT ACCOUNTING LL-2W
GREENVILLE SC 29602-9097
ALLMERICA LIFE SVSII 2,345,512.93 A 38.05%
ATTN PRODUCT VALUATION
TOPEKA KS 66636-1000
DWS STRATEGIC VALUE VIP
NAME AND ADDRESS OF INVESTOR SHARES CLASS PERCENTAGE
ZURICH DESTINATIONS FARMERS SVSII 20,628,006.50 A 56.40%
C/O KILICO
ATTN INVESTMENT ACCOUNTING LL-2W
GREENVILLE SC 29602-9097
ALLMERICA LIFE SVSII 11,091,050.56 A 30.33%
ATTN PRODUCT VALUATION
TOPEKA KS 66636-1000
FARMERS VUL 2,089,773.61 A 5.71%
MERCER ISLAND WA 98040-2837
GE CAPITAL LIFE ASSURANCE CO 61,308.67 B 25.68%
OF NEW YORK
RICHMOND VA 23230-1702
NATIONWIDE LIFE INSURANCE CO 42,212.94 B 17.68%
NWVLI4
C/O IPO PORTFOLIO ACCOUNTING
COLUMBUS OH 43218-2029
NATIONWIDE LIFE INSURANCE CO 39,951.71 B 16.73%
NWPP
IPO PORTFOLIO ACCOUNTING
COLUMBUS OH 43218-2029
NATIONAL LIFE INS CO 36,124.81 B 15.13%
SENTINEL ADVANTAGE (VA)
MONTPELIER VT 05604-0001
NATIONAL LIFE INS CO 25,403.11 B 10.64%
VARITRAK (VUL)
MONTPELIER VT 05604-0001
KEMPER INVESTORS LIFE INS CO 22,878.92 B 9.58%
VARIABLE ANNUITY SEPARATE ACCOUNTS
ATTN PRODUCT VALUATION
SECURITY BENEFIT
TOPEKA KS 66636-1000
I-15
DWS TECHNOLOGY VIP
NAME AND ADDRESS OF INVESTOR SHARES CLASS PERCENTAGE
ZURICH DESTINATIONS FARMERS SVSII 4,578,025.91 A 57.12%
C/O KILICO
ATTN INVESTMENT ACCOUNTING LL-2W
GREENVILLE SC 29602-9097
ALLMERICA LIFE SVSII 2,958,327.45 A 36.91%
ATTN PRODUCT VALUATION
TOPEKA KS 66636-1000
METLIFE INSURANCE CO OF CT 269,669.18 B 92.40%
ATTN SHAREHOLDER ACCOUNTING DEPT
HARTFORD CT 06199-0027
GE CAPITAL LIFE ASSURANCE CO 18,410.89 B 6.31%
OF NEW YORK
RICHMOND VA 23230-1702
DWS TURNER MID CAP GROWTH VIP
NAME AND ADDRESS OF INVESTOR SHARES CLASS PERCENTAGE
ZURICH DESTINATIONS FARMERS SVSII 4,837,328.11 A 74.44%
C/O KILICO
ATTN INVESTMENT ACCOUNTING LL-2W
GREENVILLE SC 29602-9097
ALLMERICA LIFE SVSII 1,620,570.89 A 24.94%
ATTN PRODUCT VALUATION
TOPEKA KS 66636-1000
I-16
PART I: APPENDIX I-B - BOARD COMMITTEES AND MEETINGS
INFORMATION CONCERNING COMMITTEES AND MEETINGS OF THE BOARD
The Board oversees the operation of the DWS funds and meets periodically to
oversee fund activities, and to review fund performance and contractual
arrangements with fund service providers. The Board met 10 times during the
most recently completed calendar year. Each Board Member attended at least 75%
of the meetings of the Board and meetings of the Board Committees on which such
Board Member served.
BOARD LEADERSHIP STRUCTURE
A fund's Board is responsible for the general oversight of the fund's affairs
and for assuring that the fund is managed in the best interests of its
shareholders. The Board regularly reviews the fund's investment performance as
well as the quality of other services provided to the fund and its shareholders
by DIMA and its affiliates, including administration and shareholder servicing.
At least annually, the Board reviews and evaluates the fees and operating
expenses paid by the fund for these services and negotiates changes that it
deems appropriate. In carrying out these responsibilities, the Board is
assisted by the fund's auditors, independent counsel and other experts as
appropriate, selected by and responsible to the Board.
Currently, all or in some cases all but one of a fund's Board Members are
Independent Board Members, meaning that they are not considered "interested
persons" (as defined in the 1940 Act) of the fund or its investment adviser.
These Independent Board Members must vote separately to approve all financial
arrangements and other agreements with a fund's investment adviser and other
affiliated parties. The role of the Independent Board Members has been
characterized as that of a "watchdog" charged with oversight to protect
shareholders' interests against overreaching and abuse by those who are in a
position to control or influence a fund. A fund's Independent Board Members
meet regularly as a group in executive session without representatives of the
investment adviser present. An Independent Board Member currently serves as
chairman of the Board.
Taking into account the number, the diversity and the complexity of the funds
overseen by the Board Members and the aggregate amount of assets under
management in the DWS funds, the Board has determined that the efficient
conduct of its affairs makes it desirable to delegate responsibility for
certain specific matters to committees of the Board. These committees, which
are described in more detail below, review and evaluate matters specified in
their charters and make recommendations to the Board as they deem appropriate.
Each committee may utilize the resources of a fund's counsel and auditors as
well as other experts. The committees meet as often as necessary, either in
conjunction with regular meetings of the Board or otherwise. The membership and
chair of each committee are appointed by the Board upon recommendation of the
Nominating and Governance Committee. The membership and chair of each committee
consists exclusively of Independent Board Members.
The Board has determined that this committee structure also allows the Board to
focus more effectively on the oversight of risk as part of its broader
oversight of the fund's affairs. While risk management is the primary
responsibility of a fund's investment adviser, the Board regularly receives
reports regarding investment risks and compliance risks. The Board's committee
structure allows separate committees to focus on different aspects of these
risks and their potential impact on some or all of the DWS funds and to discuss
with the fund's investment adviser and administrator how it monitors and
controls such risks.
I-17
BOARD COMMITTEES. The Board has established the following standing committees:
Audit Committee, Nominating and Governance Committee, Contract Committee,
Equity Oversight Committee, Fixed-Income and Quant Oversight Committee, and
Operations Committee.
NUMBER OF
MEETINGS IN LAST
NAME OF COMMITTEE CALENDAR YEAR FUNCTIONS CURRENT MEMBERS
AUDIT COMMITTEE 10 Assists the Board in fulfilling its responsibility William McClayton (Chair),
for oversight of (1) the integrity of the financial Kenneth C. Froewiss (Vice
statements, (2) the fund's accounting and Chair), Henry P. Becton, Jr.,
financial reporting policies and procedures, (3) Keith R. Fox, Richard J.
the fund's compliance with legal and regulatory Herring and William N.
requirements related to accounting and Searcy, Jr.
financial reporting and (4) the qualifications,
independence and performance of the
independent registered public accounting firm
for the fund. It also approves and recommends
to the Board the appointment, retention or
termination of the independent registered
public accounting firm for the fund, reviews the
scope of audit and internal controls, considers
and reports to the Board on matters relating to
the fund's accounting and financial reporting
practices, and performs such other tasks as
the full Board deems necessary or appropriate.
The Audit Committee receives annual
representations from the independent
registered public accounting firm as to its
independence.
I-18
NUMBER OF
MEETINGS IN LAST
NAME OF COMMITTEE CALENDAR YEAR FUNCTIONS CURRENT MEMBERS
NOMINATING AND 7 Recommends individuals for membership on Henry P. Becton, Jr. (Chair),
GOVERNANCE the Board, nominates officers, Board and Rebecca W. Rimel (Vice
COMMITTEE committee chairs, vice chairs and committee Chair), Paul K. Freeman and
members, and oversees the operations of the William McClayton
Board. The Nominating and Governance
Committee has not established specific,
minimum qualifications that must be met by an
individual to be considered by the Nominating
and Governance Committee for nomination as
a Board Member. The Nominating and
Governance Committee may take into account
a wide variety of factors in considering Board
Member candidates, including, but not limited
to: (i) availability and commitment of a
candidate to attend meetings and perform his
or her responsibilities to the Board, (ii) relevant
industry and related experience, (iii)
educational background, (iv) financial expertise,
(v) an assessment of the candidate's ability,
judgment and expertise, and (vi) the current
composition of the Board. The Committee
generally believes the the Board benefits from
diversity of background, experience and views
among its members, and considers this as a
factor in evaluating the composition of the
Board, but has not adopted any specific policy
in this regard. The Nominating and Governance
Committee reviews recommendations by
shareholders for candidates for Board positions
on the same basis as candidates
recommended by other sources. Shareholders
may recommend candidates for Board
positions by forwarding their correspondence
by US mail or courier service to Paul K.
Freeman, Independent Chairman, DWS Funds,
P.O. Box 101833, Denver, CO 80250-1833.
CONTRACT 7 Reviews at least annually, (a) the fund's Robert H. Wadsworth
COMMITTEE financial arrangements with DIMA and its (Chair), Keith R. Fox (Vice
affiliates, and (b) the fund's expense ratios. Chair), John W. Ballantine,
Dawn-Marie Driscoll and
William N. Searcy, Jr.
EQUITY OVERSIGHT 7 Reviews the investment operations of those John W. Ballantine (Chair),
COMMITTEE funds that primarily invest in equity securities William McClayton (Vice
(except for those funds managed by a Chair), Henry P. Becton, Jr.,
quantitative investment team). Keith R. Fox, Richard J.
Herring and Rebecca W.
Rimel
FIXED INCOME AND 7 Reviews the investment operations of those William N. Searcy, Jr.
QUANT OVERSIGHT funds that primarily invest in fixed-income (Chair), Jean Gleason
COMMITTEE securities or are managed by a quantitative Stromberg (Vice Chair),
investment team. Dawn-Marie Driscoll,
Kenneth C. Froewiss and
Robert H. Wadsworth
I-19
NUMBER OF
MEETINGS IN LAST
NAME OF COMMITTEE CALENDAR YEAR FUNCTIONS CURRENT MEMBERS
OPERATIONS 6 Reviews the administrative operations and Dawn-Marie Driscoll (Chair),
COMMITTEE general compliance matters of the fund. John W. Ballantine ( Vice
Reviews administrative matters related to the Chair), Rebecca W. Rimel,
operations of the fund, policies and procedures Jean Gleason Stromberg
relating to portfolio transactions, custody and Robert H. Wadsworth
arrangements, fidelity bond and insurance
arrangements, valuation of fund assets and
securities and such other tasks as the full
Board deems necessary or appropriate.
Oversees the valuation of the fund's securities
and other assets and determines, as needed,
the fair value of fund securities or other assets
under certain circumstances as described in
the fund's Valuation Procedures.
VALUATION SUB- 0 Appointed by the Operations Committee, the John W. Ballantine, Robert
COMMITTEE Valuation Sub-Committee may make H. Wadsworth, Dawn-Marie
determinations of fair value required when the Driscoll (Alternate), Rebecca
Operations Committee is not in session. W. Rimel (Alternate), and
Jean Gleason Stromberg
(Alternate)
AD HOC COMMITTEES. In addition to the standing committees described above, from
time to time the Board may also form ad hoc committees to consider specific
issues.
I-20
PART I: APPENDIX I-C - BOARD MEMBER COMPENSATION
Each Independent Board Member receives compensation from each fund for his or
her services, which includes retainer fees and specified amounts for various
committee services and for the Board Chairperson. No additional compensation is
paid to any Independent Board Member for travel time to meetings, attendance at
directors' educational seminars or conferences, service on industry or
association committees, participation as speakers at directors' conferences or
service on special fund industry director task forces or subcommittees.
Independent Board Members do not receive any employee benefits such as pension
or retirement benefits or health insurance from a fund or any fund in the DWS
fund complex.
Board Members who are officers, directors, employees or stockholders of
Deutsche Asset Management or its affiliates receive no direct compensation from
the fund, although they are compensated as employees of Deutsche Asset
Management, or its affiliates, and as a result may be deemed to participate in
fees paid by a fund. The following tables show, for each Independent Board
Member, compensation from each fund during its most recently completed fiscal
year, and aggregate compensation from all of the funds in the DWS fund complex
during calendar year 2009.
AGGREGATE COMPENSATION FROM EACH FUND
DWS ALTERNATIVE DWS
ASSET ALLOCATION DWS DWS BLUE CORE FIXED
PLUS VIP BALANCED VIP CHIP VIP INCOME VIP
INDEPENDENT BOARD MEMBER:
John W. Ballantine $84 $793 $383 $450
Henry P. Becton, Jr. $84 $793 $383 $450
Dawn-Marie Driscoll $84 $793 $383 $450
Keith R. Fox $84 $753 $369 $432
Paul K. Freeman $84 $956 $439 $523
Kenneth C. Froewiss $84 $753 $369 $432
Richard J. Herring $84 $793 $383 $450
William McClayton $84 $820 $393 $462
Rebecca W. Rimel $84 $753 $369 $432
William N. Searcy, Jr. $84 $793 $383 $450
Jean Gleason Stromberg $84 $753 $369 $432
Robert Wadsworth $84 $820 $393 $462
I-21
AGGREGATE COMPENSATION FROM EACH FUND
DWS
DWS DIVERSIFIED DWS DREMAN GOVERNMENT &
INTERNATIONAL SMALL MID CAP DWS GLOBAL AGENCY
EQUITY VIP VALUE VIP THEMATIC VIP SECURITIES VIP
INDEPENDENT BOARD MEMBER:
John W. Ballantine $345 $654 $296 $602
Henry P. Becton, Jr. $345 $654 $296 $602
Dawn-Marie Driscoll $345 $654 $296 $602
Keith R. Fox $334 $623 $287 $574
Paul K. Freeman $391 $780 $329 $714
Kenneth C. Froewiss $334 $623 $287 $574
Richard J. Herring $345 $654 $296 $602
William McClayton $353 $675 $301 $621
Rebecca W. Rimel $334 $623 $287 $574
William N. Searcy, Jr. $345 $654 $296 $602
Jean Gleason Stromberg $334 $623 $287 $574
Robert Wadsworth $353 $675 $301 $621
AGGREGATE COMPENSATION FROM EACH FUND
DWS HIGH DWS LARGE DWS MID CAP DWS MONEY
INCOME VIP CAP VALUE VIP GROWTH VIP MARKET VIP
INDEPENDENT BOARD MEMBER:
John W. Ballantine $492 $508 $206 $ 943
Henry P. Becton, Jr. $492 $508 $206 $ 943
Dawn-Marie Driscoll $492 $508 $206 $ 943
Keith R. Fox $471 $486 $204 $ 893
Paul K. Freeman $578 $598 $217 $1,141
Kenneth C. Froewiss $471 $486 $204 $ 893
Richard J. Herring $492 $508 $206 $ 943
William McClayton $506 $522 $208 $ 976
Rebecca W. Rimel $471 $486 $204 $ 893
William N. Searcy, Jr. $492 $508 $206 $ 943
Jean Gleason Stromberg $471 $486 $204 $ 893
Robert Wadsworth $506 $522 $208 $ 976
I-22
AGGREGATE COMPENSATION FROM EACH FUND
DWS SMALL DWS STRATEGIC DWS STRATEGIC DWS
CAP GROWTH VIP INCOME VIP VALUE VIP TECHNOLOGY VIP
INDEPENDENT BOARD MEMBER:
John W. Ballantine $307 $313 $794 $302
Henry P. Becton, Jr. $307 $313 $794 $302
Dawn-Marie Driscoll $307 $313 $794 $302
Keith R. Fox $298 $304 $753 $293
Paul K. Freeman $343 $351 $955 $337
Kenneth C. Froewiss $298 $304 $753 $293
Richard J. Herring $307 $313 $794 $302
William McClayton $313 $319 $820 $307
Rebecca W. Rimel $298 $304 $753 $293
William N. Searcy, Jr. $307 $313 $794 $302
Jean Gleason Stromberg $298 $304 $753 $293
Robert Wadsworth $313 $319 $820 $307
AGGREGATE COMPENSATION FROM EACH FUND
DWS TURNER MID CAP GROWTH VIP
INDEPENDENT BOARD MEMBER:
John W. Ballantine $268
Henry P. Becton, Jr. $268
Dawn-Marie Driscoll $268
Keith R. Fox $261
Paul K. Freeman $294
Kenneth C. Froewiss $261
Richard J. Herring $268
William McClayton $272
Rebecca W. Rimel $261
William N. Searcy, Jr. $268
Jean Gleason Stromberg $261
Robert Wadsworth $272
I-23
TOTAL COMPENSATION FROM DWS FUND COMPLEX
TOTAL COMPENSATION
FROM EACH FUND AND
BOARD MEMBER DWS FUND COMPLEX/(1)/
INDEPENDENT BOARD MEMBER:
John W. Ballantine $255,000
Henry P. Becton, Jr. $255,000
Dawn-Marie Driscoll $255,000
Keith R. Fox $240,000
Paul K. Freeman/(2)/ $315,829
Kenneth C. Froewiss $240,000
Richard J. Herring $255,000
William McClayton $265,000
Rebecca W. Rimel $240,000
William N. Searcy, Jr. $255,000
Jean Gleason Stromberg $240,000
Robert Wadsworth $298,000
(1) The DWS Fund Complex was composed of 129 funds as of December 31, 2009.
(2) Includes $75,829 in annual retainer fees received by Dr. Freeman as
Chairperson of DWS funds.
I-24
PART I: APPENDIX I-D - PORTFOLIO MANAGEMENT
FUND OWNERSHIP OF PORTFOLIO MANAGERS
The following table shows the dollar range of shares owned beneficially and of
record by the portfolio management team for each fund as well as in all DWS
Funds as a group (i.e., those funds advised by Deutsche Asset Management or its
affiliates), including investments by their immediate family members sharing
the same household and amounts invested through retirement and deferred
compensation plans. This information is provided as of each fund's most recent
fiscal year end.
DWS ALTERNATIVE ASSET ALLOCATION PLUS VIP
DOLLAR RANGE OF DOLLAR RANGE OF ALL DWS
NAME OF PORTFOLIO MANAGER FUND SHARES OWNED FUND SHARES OWNED
Robert Wang $ 0/(1)/ $100,001 - $500,000
Inna Okounkova $ 0/(2)/ $100,001 - $500,000
Thomas Picciochi $ 0/(3)/ $100,001 - $500,000
DWS BALANCED VIP
DOLLAR RANGE OF DOLLAR RANGE OF ALL DWS
NAME OF PORTFOLIO MANAGER FUND SHARES OWNED FUND SHARES OWNED
Robert Wang $ 0/(4)/ $100,001 - $500,000
Inna Okounkova $ 0/(5)/ $100,001 - $500,000
Thomas Picciochi $ 0/(6)/ $100,001 - $500,000
DWS BLUE CHIP VIP
DOLLAR RANGE OF DOLLAR RANGE OF ALL DWS
NAME OF PORTFOLIO MANAGER FUND SHARES OWNED FUND SHARES OWNED
Robert Wang $ 0/(7)/ $100,001 - $500,000
Russell Shtern $ 0 $50,001 - $100,000
DWS CORE FIXED INCOME VIP
DOLLAR RANGE OF DOLLAR RANGE OF ALL DWS
NAME OF PORTFOLIO MANAGER FUND SHARES OWNED FUND SHARES OWNED
Kenneth R. Bowling $ 0 $10,001 - $50,000
Jamie Guenther $0/(8)/ $10,001 - $50,000
John Brennan $0/(9)/ $50,001 - $100,000
Bruce Harley $0/(10)/ $10,001 - $50,000
J. Richard Robben $0/(11)/ $50,001 - $100,000
David Vignolo $ 0 $100,001 - $500,000
J. Kevin Horsley $0/(12)/ $10,001 - $50,000
Stephen Willer $0/(13)/ $50,001 - $100,000
I-25
DWS DIVERSIFIED INTERNATIONAL EQUITY VIP
DOLLAR RANGE OF DOLLAR RANGE OF ALL DWS
NAME OF PORTFOLIO MANAGER FUND SHARES OWNED FUND SHARES OWNED
Robert Wang $ 0/(14)/ $100,001 - $500,000
Russell Shtern $ 0/(15)/ $50,001 - $100,000
DWS DREMAN SMALL MID CAP VALUE VIP
DOLLAR RANGE OF
NAME OF PORTFOLIO MANAGER FUND SHARES OWNED
David N. Dreman $0
E. Clifton Hoover $0
Mark Roach $0
DWS GLOBAL THEMATIC VIP
DOLLAR RANGE OF DOLLAR RANGE OF ALL DWS
NAME OF PORTFOLIO MANAGER FUND SHARES OWNED FUND SHARES OWNED
Oliver Kratz $ 0/(16)/ $100,001 - $500,000
DWS GOVERNMENT & AGENCY SECURITIES VIP
DOLLAR RANGE OF DOLLAR RANGE OF ALL DWS
NAME OF PORTFOLIO MANAGER FUND SHARES OWNED FUND SHARES OWNED
William Chepolis $ 0/(17)/ $100,001 - $500,000
Ohn Choe $ 0 $10,001 - $50,000
DWS HIGH INCOME VIP
DOLLAR RANGE OF DOLLAR RANGE OF ALL DWS
NAME OF PORTFOLIO MANAGER FUND SHARES OWNED FUND SHARES OWNED
Gary Sullivan $ 0/(18)/ $100,001 - $500,000
DWS LARGE CAP VALUE VIP
DOLLAR RANGE OF DOLLAR RANGE OF ALL DWS
NAME OF PORTFOLIO MANAGER FUND SHARES OWNED FUND SHARES OWNED
Thomas Schuessler $0 $0
Oliver Pfeil $0 $0
Volker Dosch $0 $0
DWS MID CAP GROWTH VIP
DOLLAR RANGE OF DOLLAR RANGE OF ALL DWS
NAME OF PORTFOLIO MANAGER FUND SHARES OWNED FUND SHARES OWNED
Joseph Axtell $0 $100,001 - $500,000
Rafaelina M. Lee $0 $ 0
I-26
DWS SMALL CAP GROWTH VIP
DOLLAR RANGE OF DOLLAR RANGE OF ALL DWS
NAME OF PORTFOLIO MANAGER FUND SHARES OWNED FUND SHARES OWNED
Joseph Axtell $ 0/(19)/ $100,001 - $500,000
Rafaelina M. Lee $ 0 $ 0
DWS STRATEGIC INCOME VIP
DOLLAR RANGE OF DOLLAR RANGE OF ALL DWS
NAME OF PORTFOLIO MANAGER FUND SHARES OWNED FUND SHARES OWNED
Gary Sullivan $ 0 $100,001 - $500,000
William Chepolis $ 0 $100,001 - $500,000
Robert Wang $ 0/(20)/ $100,001 - $500,000
Ohn Choe $ 0 $10,001 - $50,000
Thomas Picciochi $ 0/(21)/ $100,001 - $500,000
DWS STRATEGIC VALUE VIP
DOLLAR RANGE OF DOLLAR RANGE OF ALL DWS
NAME OF PORTFOLIO MANAGER FUND SHARES OWNED FUND SHARES OWNED
Volker Dosch $0 $0
Oliver Pfeil $0 $0
Thomas Schuessler $0 $0
DWS TECHNOLOGY VIP
DOLLAR RANGE OF DOLLAR RANGE OF ALL DWS
NAME OF PORTFOLIO MANAGER FUND SHARES OWNED FUND SHARES OWNED
Frederic L. Fayolle $0 $0
Clark Chang $0 $0
Walter Holick $0 $0
DWS TURNER MID CAP GROWTH VIP
DOLLAR RANGE OF
NAME OF PORTFOLIO MANAGER FUND SHARES OWNED
Christopher K. McHugh $0
Tara Hedlund $0
Jason Schrotberger $0
/(1)/ Although the Portfolio Manager does not have an investment in this
variable annuity fund, the Portfolio Manager does hold $1 - $10,000 in DWS
Alternative Asset Allocation Plus Fund, the retail mutual fund that has the
same investment strategy.
/(2)/ Although the Portfolio Manager does not have an investment in this
variable annuity fund, the Portfolio Manager does hold $1 - $10,000 in DWS
Alternative Asset Allocation Plus Fund, the retail mutual fund that has the
same investment strategy.
I-27
/(3)/ Although the Portfolio Manager does not have an investment in this
variable annuity fund, the Portfolio Manager does hold $1 - $10,000 in DWS
Alternative Asset Allocation Plus Fund, the retail mutual fund that has the
same investment strategy.
/(4)/ Although the Portfolio Manager does not have an investment in this
variable annuity fund, the Portfolio Manager does hold $1 - $10,000 in DWS
Balanced Fund, the retail mutual fund that has the same investment strategy.
/(5)/ Although the Portfolio Manager does not have an investment in this
variable annuity fund, the Portfolio Manager does hold $10,001 - $50,000 in DWS
Balanced Fund, the retail mutual fund that has the same investment strategy.
/(6)/ Although the Portfolio Manager does not have an investment in this
variable annuity fund, the Portfolio Manager does hold $1 - $10,000 in DWS
Balanced Fund, the retail mutual fund that has the same investment strategy.
/(7)/ Although the Portfolio Manager does not have an investment in this
variable annuity fund, the Portfolio Manager does hold $1 - $10,000 in DWS Blue
Chip Fund, the retail mutual fund that has the same investment strategy.
/(8)/ Although the Portfolio Manager does not have an investment in this
variable annuity fund, the Portfolio Manager does hold $10,001 - $50,000 in DWS
Core Fixed Income Fund, the retail mutual fund that has the same investment
strategy.
/(9)/ Although the Portfolio Manager does not have an investment in this
variable annuity fund, the Portfolio Manager does hold $10,001 - $50,000 in DWS
Core Fixed Income Fund, the retail mutual fund that has the same investment
strategy.
/(10)/ Although the Portfolio Manager does not have an investment in this
variable annuity fund, the Portfolio Manager does hold $10,001 - $50,000 in DWS
Core Fixed Income Fund, the retail mutual fund that has the same investment
strategy.
/(11)/ Although the Portfolio Manager does not have an investment in this
variable annuity fund, the Portfolio Manager does hold $1 - $10,000 in DWS Core
Fixed Income Fund, the retail mutual fund that has the same investment
strategy.
/(12)/ Although the Portfolio Manager does not have an investment in this
variable annuity fund, the Portfolio Manager does hold $10,001 - $50,000 in DWS
Core Fixed Income Fund, the retail mutual fund that has the same investment
strategy.
/(13)/ Although the Portfolio Manager does not have an investment in this
variable annuity fund, the Portfolio Manager does hold $10,001 - $50,000 in DWS
Core Fixed Income Fund, the retail mutual fund that has the same investment
strategy.
/(14)/ Although the Portfolio Manager does not have an investment in this
variable annuity fund, the Portfolio Manager does hold $1 - $10,000 in DWS
Diversified International Fund, the retail mutual fund that has the same
investment strategy.
/(15)/ Although the Portfolio Manager does not have an investment in this
variable annuity fund, the Portfolio Manager does hold $1 - $10,000 in DWS
Diversified International Fund, the retail mutual fund that has the same
investment strategy.
/(16)/ Although the Portfolio Manager does not have an investment in this
variable annuity fund, the Portfolio Manager does hold $100,001 - $500,000 in
DWS Global Thematic Fund, the retail mutual fund that has the same investment
strategy.
/(17)/ Although the Portfolio Manager does not have an investment in this
variable annuity fund, the Portfolio Manager does hold $10,001 - $50,000 in DWS
Strategic Government Securities Fund, the retail mutual fund that has the same
investment strategy.
I-28
/(18)/ Although the Portfolio Manager does not have an investment in this
variable annuity fund, the Portfolio Manager does hold $100,001 - $500,000 in
DWS High Income Fund, the retail mutual fund that has the same investment
strategy.
/(19)/ Although the Portfolio Manager does not have an investment in this
variable annuity fund, the Portfolio Manager does hold $10,001 - $50,000 in DWS
Small Cap Growth Fund, the retail mutual fund that has the same investment
strategy.
/(20)/ Although the Portfolio Manager does not have an investment in this
variable annuity fund, the Portfolio Manager does hold $1 - $10,000 in DWS
Strategic Income Fund, the retail mutual fund that has the same investment
strategy.
/(21)/ Although the Portfolio Manager does not have an investment in this
variable annuity fund, the Portfolio Manager does hold $1 - $10,000 in DWS
Strategic Income Fund, the retail mutual fund that has the same investment
strategy.
Because DWS Large Cap Value VIP's, DWS Strategic Value VIP's and DWS Technology
VIP's (Frederic L. Fayolle and Walter Holick only) portfolio managers are not
resident in the US, they generally do not invest in US registered investment
companies, such as a fund, on account of US tax and other regulatory
limitations applicable to foreign investors.
CONFLICTS OF INTEREST
In addition to managing the assets of each fund, a portfolio manager may have
responsibility for managing other client accounts of the Advisor or its
affiliates. The tables below show, per portfolio manager, the number and asset
size of (1) SEC registered investment companies (or series thereof) other than
each fund, (2) pooled investment vehicles that are not registered investment
companies and (3) other accounts (e.g., accounts managed for individuals or
organizations) managed by a portfolio manager. Total assets attributed to a
portfolio manager in the tables below include total assets of each account
managed, although a portfolio manager may only manage a portion of such
account's assets. The tables also show the number of performance based fee
accounts, as well as the total assets of the accounts for which the advisory
fee is based on the performance of the account. This information is provided as
of each fund's most recent fiscal year end.
DWS ALTERNATIVE ASSET ALLOCATION PLUS VIP
OTHER SEC REGISTERED INVESTMENT COMPANIES MANAGED:
NUMBER OF TOTAL ASSETS OF NUMBER OF INVESTMENT
REGISTERED REGISTERED COMPANY ACCOUNTS TOTAL ASSETS OF
NAME OF INVESTMENT INVESTMENT WITH PERFORMANCE- PERFORMANCE-BASED
PORTFOLIO MANAGER COMPANIES COMPANIES BASED FEE FEE ACCOUNTS
Robert Wang 39 $15,421,677,075 0 $0
Inna Okounkova 11 $ 3,300,009,562 0 $0
Thomas Picciochi 12 $ 8,472,926,706 0 $0
DWS BALANCED VIP
OTHER SEC REGISTERED INVESTMENT COMPANIES MANAGED:
NUMBER OF TOTAL ASSETS OF NUMBER OF INVESTMENT
REGISTERED REGISTERED COMPANY ACCOUNTS TOTAL ASSETS OF
NAME OF INVESTMENT INVESTMENT WITH PERFORMANCE- PERFORMANCE-BASED
PORTFOLIO MANAGER COMPANIES COMPANIES BASED FEE FEE ACCOUNTS
Robert Wang 39 $15,104,041,817 0 $0
Inna Okounkova 11 $ 2,982,374,305 0 $0
Thomas Picciochi 12 $ 8,155,291,448 0 $0
I-29
DWS BLUE CHIP VIP
OTHER SEC REGISTERED INVESTMENT COMPANIES MANAGED:
NUMBER OF TOTAL ASSETS OF NUMBER OF INVESTMENT
REGISTERED REGISTERED COMPANY ACCOUNTS TOTAL ASSETS OF
NAME OF INVESTMENT INVESTMENT WITH PERFORMANCE- PERFORMANCE-BASED
PORTFOLIO MANAGER COMPANIES COMPANIES BASED FEE FEE ACCOUNTS
Robert Wang 39 $15,311,473,885 0 $0
Russell Shtern 3 $ 757,657,889 0 $0
DWS CORE FIXED INCOME VIP
OTHER SEC REGISTERED INVESTMENT COMPANIES MANAGED:
NUMBER OF TOTAL ASSETS OF NUMBER OF INVESTMENT
REGISTERED REGISTERED COMPANY ACCOUNTS TOTAL ASSETS OF
NAME OF INVESTMENT INVESTMENT WITH PERFORMANCE- PERFORMANCE-BASED
PORTFOLIO MANAGER COMPANIES COMPANIES BASED FEE FEE ACCOUNTS
Kenneth R. Bowling 6 $1,656,359,296 0 $0
Jamie Guenther 6 $1,656,359,296 0 $0
John Brennan 7 $1,974,928,185 0 $0
Bruce Harley 6 $1,656,359,296 0 $0
J. Richard Robben 7 $1,974,928,185 0 $0
David Vignolo 6 $1,656,359,296 0 $0
J. Kevin Horsley 6 $1,656,359,296 0 $0
Stephen Willer 6 $1,656,359,296 0 $0
DWS DIVERSIFIED INTERNATIONAL EQUITY VIP
OTHER SEC REGISTERED INVESTMENT COMPANIES MANAGED:
NUMBER OF TOTAL ASSETS OF NUMBER OF INVESTMENT
REGISTERED REGISTERED COMPANY ACCOUNTS TOTAL ASSETS OF
NAME OF INVESTMENT INVESTMENT WITH PERFORMANCE- PERFORMANCE-BASED
PORTFOLIO MANAGER COMPANIES COMPANIES BASED FEE FEE ACCOUNTS
Robert Wang 39 $15,336,435,047 0 $0
Russell Shtern 2 $ 671,482,229 0 $0
DWS DREMAN SMALL MID CAP VALUE VIP
OTHER SEC REGISTERED INVESTMENT COMPANIES MANAGED:
NUMBER OF TOTAL ASSETS OF NUMBER OF INVESTMENT
REGISTERED REGISTERED COMPANY ACCOUNTS TOTAL ASSETS OF
NAME OF INVESTMENT INVESTMENT WITH PERFORMANCE- PERFORMANCE-BASED
PORTFOLIO MANAGER COMPANIES COMPANIES BASED FEE FEE ACCOUNTS
David N. Dreman 13 $3,187,000,000 0 $0
E. Clifton Hoover 11 $3,081,000,000 0 $0
Mark Roach 9 $2,729,000,000 0 $0
I-30
DWS GLOBAL THEMATIC VIP
OTHER SEC REGISTERED INVESTMENT COMPANIES MANAGED:
NUMBER OF TOTAL ASSETS OF NUMBER OF INVESTMENT
REGISTERED REGISTERED COMPANY ACCOUNTS TOTAL ASSETS OF
NAME OF INVESTMENT INVESTMENT WITH PERFORMANCE- PERFORMANCE-BASED
PORTFOLIO MANAGER COMPANIES COMPANIES BASED FEE FEE ACCOUNTS
Oliver Kratz 1 $1,220,959,560 0 $0
DWS GOVERNMENT & AGENCY SECURITIES VIP
OTHER SEC REGISTERED INVESTMENT COMPANIES MANAGED:
NUMBER OF TOTAL ASSETS OF NUMBER OF INVESTMENT
REGISTERED REGISTERED COMPANY ACCOUNTS TOTAL ASSETS OF
NAME OF INVESTMENT INVESTMENT WITH PERFORMANCE- PERFORMANCE-BASED
PORTFOLIO MANAGER COMPANIES COMPANIES BASED FEE FEE ACCOUNTS
William Chepolis 15 $9,291,001,912 0 $0
Ohn Choe 5 $ 185,651,855 0 $0
DWS HIGH INCOME VIP
OTHER SEC REGISTERED INVESTMENT COMPANIES MANAGED:
NUMBER OF TOTAL ASSETS OF NUMBER OF INVESTMENT
REGISTERED REGISTERED COMPANY ACCOUNTS TOTAL ASSETS OF
NAME OF INVESTMENT INVESTMENT WITH PERFORMANCE- PERFORMANCE-BASED
PORTFOLIO MANAGER COMPANIES COMPANIES BASED FEE FEE ACCOUNTS
Gary Sullivan 10 $5,827,734,408 0 $0
DWS LARGE CAP VALUE VIP
OTHER SEC REGISTERED INVESTMENT COMPANIES MANAGED:
NUMBER OF TOTAL ASSETS OF NUMBER OF INVESTMENT
REGISTERED REGISTERED COMPANY ACCOUNTS TOTAL ASSETS OF
NAME OF INVESTMENT INVESTMENT WITH PERFORMANCE- PERFORMANCE-BASED
PORTFOLIO MANAGER COMPANIES COMPANIES BASED FEE FEE ACCOUNTS
Thomas Schuessler 5 $4,279,713,091 0 $0
Oliver Pfeil 3 $4,123,252,972 0 $0
Volker Dosch 3 $4,123,252,972 0 $0
I-31
DWS MID CAP GROWTH VIP
OTHER SEC REGISTERED INVESTMENT COMPANIES MANAGED:
NUMBER OF TOTAL ASSETS OF NUMBER OF INVESTMENT
REGISTERED REGISTERED COMPANY ACCOUNTS TOTAL ASSETS OF
NAME OF INVESTMENT INVESTMENT WITH PERFORMANCE- PERFORMANCE-BASED
PORTFOLIO MANAGER COMPANIES COMPANIES BASED FEE FEE ACCOUNTS
Joseph Axtell 5 $1,113,702,054 0 $0
Rafaelina M. Lee 3 $ 511,478,315 0 $0
DWS SMALL CAP GROWTH VIP
OTHER SEC REGISTERED INVESTMENT COMPANIES MANAGED:
NUMBER OF TOTAL ASSETS OF NUMBER OF INVESTMENT
REGISTERED REGISTERED COMPANY ACCOUNTS TOTAL ASSETS OF
NAME OF INVESTMENT INVESTMENT WITH PERFORMANCE- PERFORMANCE-BASED
PORTFOLIO MANAGER COMPANIES COMPANIES BASED FEE FEE ACCOUNTS
Joseph Axtell 5 $1,056,389,140 0 $0
Rafaelina M. Lee 3 $ 454,165,400 0 $0
DWS STRATEGIC INCOME VIP
OTHER SEC REGISTERED INVESTMENT COMPANIES MANAGED:
NUMBER OF TOTAL ASSETS OF NUMBER OF INVESTMENT
REGISTERED REGISTERED COMPANY ACCOUNTS TOTAL ASSETS OF
NAME OF INVESTMENT INVESTMENT WITH PERFORMANCE- PERFORMANCE-BASED
PORTFOLIO MANAGER COMPANIES COMPANIES BASED FEE FEE ACCOUNTS
Gary Sullivan 10 $ 5,951,046,214 0 $0
William Chepolis 15 $ 9,392,834,520 0 $0
Robert Wang 39 $15,348,761,449 0 $0
Ohn Choe 5 $ 185,651,855 0 $0
Thomas Picciochi 12 $ 8,400,011,080 0 $0
DWS STRATEGIC VALUE VIP
OTHER SEC REGISTERED INVESTMENT COMPANIES MANAGED:
NUMBER OF TOTAL ASSETS OF NUMBER OF INVESTMENT
REGISTERED REGISTERED COMPANY ACCOUNTS TOTAL ASSETS OF
NAME OF INVESTMENT INVESTMENT WITH PERFORMANCE- PERFORMANCE-BASED
PORTFOLIO MANAGER COMPANIES COMPANIES BASED FEE FEE ACCOUNTS
Volker Dosch 3 $4,053,192,143 0 $0
Oliver Pfeil 3 $4,053,192,143 0 $0
Thomas Schuessler 5 $4,209,652,262 0 $0
I-32
DWS TECHNOLOGY VIP
OTHER SEC REGISTERED INVESTMENT COMPANIES MANAGED:
NUMBER OF TOTAL ASSETS OF NUMBER OF INVESTMENT
REGISTERED REGISTERED COMPANY ACCOUNTS TOTAL ASSETS OF
NAME OF INVESTMENT INVESTMENT WITH PERFORMANCE- PERFORMANCE-BASED
PORTFOLIO MANAGER COMPANIES COMPANIES BASED FEE FEE ACCOUNTS
Frederic L. Fayolle 1 $679,277,138 0 $0
Clark Chang 1 $679,277,138 0 $0
Walter Holick 1 $679,277,138 0 $0
DWS TURNER MID CAP GROWTH VIP
OTHER SEC REGISTERED INVESTMENT COMPANIES MANAGED:
NUMBER OF TOTAL ASSETS OF NUMBER OF INVESTMENT
REGISTERED REGISTERED COMPANY ACCOUNTS TOTAL ASSETS OF
NAME OF INVESTMENT INVESTMENT WITH PERFORMANCE- PERFORMANCE-BASED
PORTFOLIO MANAGER COMPANIES COMPANIES BASED FEE FEE ACCOUNTS
Christopher K. McHugh 11 $2,400,000,000 2 $69,000,000
Tara Hedlund 7 $2,300,000,000 1 $27,000,000
Jason Schrotberger 12 $2,800,000,000 1 $27,000,000
DWS ALTERNATIVE ASSET ALLOCATION PLUS VIP
OTHER POOLED INVESTMENT VEHICLES MANAGED:
NUMBER OF POOLED
NUMBER OF INVESTMENT VEHICLE TOTAL ASSETS OF
POOLED TOTAL ASSETS OF ACCOUNTS WITH PERFORMANCE-
NAME OF INVESTMENT POOLED INVESTMENT PERFORMANCE- BASED FEE
PORTFOLIO MANAGER VEHICLES VEHICLES BASED FEE ACCOUNTS
Robert Wang 33 $1,606,231,663 0 $0
Inna Okounkova 3 $ 51,323,542 0 $0
Thomas Picciochi 10 $ 652,680,862 0 $0
DWS BALANCED VIP
OTHER POOLED INVESTMENT VEHICLES MANAGED:
NUMBER OF POOLED
NUMBER OF INVESTMENT VEHICLE TOTAL ASSETS OF
POOLED TOTAL ASSETS OF ACCOUNTS WITH PERFORMANCE-
NAME OF INVESTMENT POOLED INVESTMENT PERFORMANCE- BASED FEE
PORTFOLIO MANAGER VEHICLES VEHICLES BASED FEE ACCOUNTS
Robert Wang 33 $1,606,231,663 0 $0
Inna Okounkova 3 $ 51,323,542 0 $0
Thomas Picciochi 10 $ 652,680,862 0 $0
I-33
DWS BLUE CHIP VIP
OTHER POOLED INVESTMENT VEHICLES MANAGED:
NUMBER OF POOLED
NUMBER OF INVESTMENT VEHICLE TOTAL ASSETS OF
POOLED TOTAL ASSETS OF ACCOUNTS WITH PERFORMANCE-
NAME OF INVESTMENT POOLED INVESTMENT PERFORMANCE- BASED FEE
PORTFOLIO MANAGER VEHICLES VEHICLES BASED FEE ACCOUNTS
Robert Wang 33 $1,606,231,663 0 $0
Russell Shtern 3 $ 694,098,530 0 $0
DWS CORE FIXED INCOME VIP
OTHER POOLED INVESTMENT VEHICLES MANAGED:
NUMBER OF POOLED
NUMBER OF INVESTMENT VEHICLE TOTAL ASSETS OF
POOLED TOTAL ASSETS OF ACCOUNTS WITH PERFORMANCE-
NAME OF INVESTMENT POOLED INVESTMENT PERFORMANCE- BASED FEE
PORTFOLIO MANAGER VEHICLES VEHICLES BASED FEE ACCOUNTS
Kenneth R. Bowling 0 $0 0 $0
Jamie Guenther 0 $0 0 $0
John Brennan 0 $0 0 $0
Bruce Harley 0 $0 0 $0
J. Richard Robben 0 $0 0 $0
David Vignolo 0 $0 0 $0
J. Kevin Horsley 0 $0 0 $0
Stephen Willer 0 $0 0 $0
DWS DIVERSIFIED INTERNATIONAL EQUITY VIP
OTHER POOLED INVESTMENT VEHICLES MANAGED:
NUMBER OF POOLED
NUMBER OF INVESTMENT VEHICLE TOTAL ASSETS OF
POOLED TOTAL ASSETS OF ACCOUNTS WITH PERFORMANCE-
NAME OF INVESTMENT POOLED INVESTMENT PERFORMANCE- BASED FEE
PORTFOLIO MANAGER VEHICLES VEHICLES BASED FEE ACCOUNTS
Robert Wang 33 $1,606,231,663 0 $0
Russell Shtern 3 $ 694,098,530 0 $0
I-34
DWS DREMAN SMALL MID CAP VALUE VIP
OTHER POOLED INVESTMENT VEHICLES MANAGED:
NUMBER OF POOLED
NUMBER OF INVESTMENT VEHICLE TOTAL ASSETS OF
POOLED TOTAL ASSETS OF ACCOUNTS WITH PERFORMANCE-
NAME OF INVESTMENT POOLED INVESTMENT PERFORMANCE- BASED FEE
PORTFOLIO MANAGER VEHICLES VEHICLES BASED FEE ACCOUNTS
David N. Dreman 4 $122,000,000 1 $1,700,000
E. Clifton Hoover 0 $ 0 0 $ 0
Mark Roach 0 $ 0 0 $ 0
DWS GLOBAL THEMATIC VIP
OTHER POOLED INVESTMENT VEHICLES MANAGED:
NUMBER OF POOLED
NUMBER OF INVESTMENT VEHICLE TOTAL ASSETS OF
POOLED TOTAL ASSETS OF ACCOUNTS WITH PERFORMANCE-
NAME OF INVESTMENT POOLED INVESTMENT PERFORMANCE- BASED FEE
PORTFOLIO MANAGER VEHICLES VEHICLES BASED FEE ACCOUNTS
Oliver Kratz 22 $4,186,966,417 0 $0
DWS GOVERNMENT & AGENCY SECURITIES VIP
OTHER POOLED INVESTMENT VEHICLES MANAGED:
NUMBER OF POOLED
NUMBER OF INVESTMENT VEHICLE TOTAL ASSETS OF
POOLED TOTAL ASSETS OF ACCOUNTS WITH PERFORMANCE-
NAME OF INVESTMENT POOLED INVESTMENT PERFORMANCE- BASED FEE
PORTFOLIO MANAGER VEHICLES VEHICLES BASED FEE ACCOUNTS
William Chepolis 0 $0 0 $0
Ohn Choe 0 $0 0 $0
DWS HIGH INCOME VIP
OTHER POOLED INVESTMENT VEHICLES MANAGED:
NUMBER OF POOLED
NUMBER OF INVESTMENT VEHICLE TOTAL ASSETS OF
POOLED TOTAL ASSETS OF ACCOUNTS WITH PERFORMANCE-
NAME OF INVESTMENT POOLED INVESTMENT PERFORMANCE- BASED FEE
PORTFOLIO MANAGER VEHICLES VEHICLES BASED FEE ACCOUNTS
Gary Sullivan 0 $0 0 $0
I-35
DWS LARGE CAP VALUE VIP
OTHER POOLED INVESTMENT VEHICLES MANAGED:
NUMBER OF POOLED
NUMBER OF INVESTMENT VEHICLE TOTAL ASSETS OF
POOLED TOTAL ASSETS OF ACCOUNTS WITH PERFORMANCE-
NAME OF INVESTMENT POOLED INVESTMENT PERFORMANCE- BASED FEE
PORTFOLIO MANAGER VEHICLES VEHICLES BASED FEE ACCOUNTS
Thomas Schuessler 4 $6,484,870,880 1 $867,775,387
Oliver Pfeil 2 $ 367,179,014 1 $263,422,492
Volker Dosch 3 $2,189,404,340 1 $ 56,881,447
DWS MID CAP GROWTH VIP
OTHER POOLED INVESTMENT VEHICLES MANAGED:
NUMBER OF POOLED
NUMBER OF INVESTMENT VEHICLE TOTAL ASSETS OF
POOLED TOTAL ASSETS OF ACCOUNTS WITH PERFORMANCE-
NAME OF INVESTMENT POOLED INVESTMENT PERFORMANCE- BASED FEE
PORTFOLIO MANAGER VEHICLES VEHICLES BASED FEE ACCOUNTS
Joseph Axtell 0 $0 0 $0
Rafaelina M. Lee 0 $0 0 $0
DWS SMALL CAP GROWTH VIP
OTHER POOLED INVESTMENT VEHICLES MANAGED:
NUMBER OF POOLED
NUMBER OF INVESTMENT VEHICLE TOTAL ASSETS OF
POOLED TOTAL ASSETS OF ACCOUNTS WITH PERFORMANCE-
NAME OF INVESTMENT POOLED INVESTMENT PERFORMANCE- BASED FEE
PORTFOLIO MANAGER VEHICLES VEHICLES BASED FEE ACCOUNTS
Joseph Axtell 0 $0 0 $0
Rafaelina M. Lee 0 $0 0 $0
DWS STRATEGIC INCOME VIP
OTHER POOLED INVESTMENT VEHICLES MANAGED:
NUMBER OF POOLED
NUMBER OF INVESTMENT VEHICLE TOTAL ASSETS OF
POOLED TOTAL ASSETS OF ACCOUNTS WITH PERFORMANCE-
NAME OF INVESTMENT POOLED INVESTMENT PERFORMANCE- BASED FEE
PORTFOLIO MANAGER VEHICLES VEHICLES BASED FEE ACCOUNTS
Gary Sullivan 0 $ 0 0 $0
William Chepolis 0 $ 0 0 $0
Robert Wang 33 $1,606,231,663 0 $0
Ohn Choe 0 $ 0 0 $0
Thomas Picciochi 10 $ 652,680,862 0 $0
I-36
DWS STRATEGIC VALUE VIP
OTHER POOLED INVESTMENT VEHICLES MANAGED:
NUMBER OF POOLED
NUMBER OF INVESTMENT VEHICLE TOTAL ASSETS OF
POOLED TOTAL ASSETS OF ACCOUNTS WITH PERFORMANCE-
NAME OF INVESTMENT POOLED INVESTMENT PERFORMANCE- BASED FEE
PORTFOLIO MANAGER VEHICLES VEHICLES BASED FEE ACCOUNTS
Volker Dosch 3 $2,189,404,340 1 $ 56,881,447
Oliver Pfeil 2 $ 367,179,014 1 $263,422,492
Thomas Schuessler 4 $6,484,870,880 1 $867,775,387
DWS TECHNOLOGY VIP
OTHER POOLED INVESTMENT VEHICLES MANAGED:
NUMBER OF POOLED
NUMBER OF INVESTMENT VEHICLE TOTAL ASSETS OF
POOLED TOTAL ASSETS OF ACCOUNTS WITH PERFORMANCE-
NAME OF INVESTMENT POOLED INVESTMENT PERFORMANCE- BASED FEE
PORTFOLIO MANAGER VEHICLES VEHICLES BASED FEE ACCOUNTS
Frederic L. Fayolle 2 $455,602,288 2 $455,602,288
Clark Chang 0 $ 0 0 $ 0
Walter Holick 2 $455,602,288 0 $ 0
DWS TURNER MID CAP GROWTH VIP
OTHER POOLED INVESTMENT VEHICLES MANAGED:
NUMBER OF POOLED
NUMBER OF INVESTMENT VEHICLE TOTAL ASSETS OF
POOLED TOTAL ASSETS OF ACCOUNTS WITH PERFORMANCE-
NAME OF INVESTMENT POOLED INVESTMENT PERFORMANCE- BASED FEE
PORTFOLIO MANAGER VEHICLES VEHICLES BASED FEE ACCOUNTS
Christopher K. McHugh 37 $308,000,000 2 $59,000,000
Tara Hedlund 22 $193,000,000 0 $ 0
Jason Schrotberger 32 $303,000,000 3 $60,000,000
DWS ALTERNATIVE ASSET ALLOCATION PLUS VIP
OTHER ACCOUNTS MANAGED:
NUMBER OF OTHER TOTAL ASSETS OF
TOTAL ASSETS ACCOUNTS WITH PERFORMANCE-
NAME OF NUMBER OF OF OTHER PERFORMANCE- BASED FEE
PORTFOLIO MANAGER OTHER ACCOUNTS ACCOUNTS BASED FEE ACCOUNTS
Robert Wang 34 $6,432,005,203 3 $37,280,448
Inna Okounkova 2 $ 110,384,601 0 $ 0
Thomas Picciochi 8 $ 938,277,081 3 $37,280,448
I-37
DWS BALANCED VIP
OTHER ACCOUNTS MANAGED:
NUMBER OF OTHER TOTAL ASSETS OF
TOTAL ASSETS ACCOUNTS WITH PERFORMANCE-
NAME OF NUMBER OF OF OTHER PERFORMANCE- BASED FEE
PORTFOLIO MANAGER OTHER ACCOUNTS ACCOUNTS BASED FEE ACCOUNTS
Robert Wang 34 $6,432,005,203 3 $37,280,448
Inna Okounkova 2 $ 110,384,601 0 $ 0
Thomas Picciochi 8 $ 938,277,081 3 $37,280,448
DWS BLUE CHIP VIP
OTHER ACCOUNTS MANAGED:
NUMBER OF OTHER TOTAL ASSETS OF
TOTAL ASSETS ACCOUNTS WITH PERFORMANCE-
NAME OF NUMBER OF OF OTHER PERFORMANCE- BASED FEE
PORTFOLIO MANAGER OTHER ACCOUNTS ACCOUNTS BASED FEE ACCOUNTS
Robert Wang 34 $6,432,005,203 3 $37,280,448
Russell Shtern 21 $5,170,969,622 0 $ 0
DWS CORE FIXED INCOME VIP
OTHER ACCOUNTS MANAGED:
NUMBER OF OTHER TOTAL ASSETS OF
TOTAL ASSETS ACCOUNTS WITH PERFORMANCE-
NAME OF NUMBER OF OF OTHER PERFORMANCE- BASED FEE
PORTFOLIO MANAGER OTHER ACCOUNTS ACCOUNTS BASED FEE ACCOUNTS
Kenneth R. Bowling 5 $484,913,584 0 $0
Jamie Guenther 1 $ 83,299,819 0 $0
John Brennan 1 $ 83,299,819 0 $0
Bruce Harley 1 $ 83,299,819 0 $0
J. Richard Robben 4 $399,367,508 0 $0
David Vignolo 4 $431,300,522 0 $0
J. Kevin Horsley 1 $ 83,299,819 0 $0
Stephen Willer 1 $ 83,299,819 0 $0
DWS DIVERSIFIED INTERNATIONAL EQUITY VIP
OTHER ACCOUNTS MANAGED:
NUMBER OF OTHER TOTAL ASSETS OF
TOTAL ASSETS ACCOUNTS WITH PERFORMANCE-
NAME OF NUMBER OF OF OTHER PERFORMANCE- BASED FEE
PORTFOLIO MANAGER OTHER ACCOUNTS ACCOUNTS BASED FEE ACCOUNTS
Robert Wang 34 $6,432,005,203 3 $37,280,448
Russell Shtern 21 $5,170,969,622 0 $ 0
I-38
DWS DREMAN SMALL MID CAP VALUE VIP
OTHER ACCOUNTS MANAGED:
NUMBER OF OTHER TOTAL ASSETS OF
TOTAL ASSETS ACCOUNTS WITH PERFORMANCE-
NAME OF NUMBER OF OF OTHER PERFORMANCE- BASED FEE
PORTFOLIO MANAGER OTHER ACCOUNTS ACCOUNTS BASED FEE ACCOUNTS
David N. Dreman 82 $1,012,000,000 0 $0
E. Clifton Hoover 77 $ 854,000,000 0 $0
Mark Roach 21 $ 157,000,000 0 $0
DWS GLOBAL THEMATIC VIP
OTHER ACCOUNTS MANAGED:
NUMBER OF OTHER TOTAL ASSETS OF
TOTAL ASSETS ACCOUNTS WITH PERFORMANCE-
NAME OF NUMBER OF OF OTHER PERFORMANCE- BASED FEE
PORTFOLIO MANAGER OTHER ACCOUNTS ACCOUNTS BASED FEE ACCOUNTS
Oliver Kratz 22 $4,826,112,795 0 $0
DWS GOVERNMENT & AGENCY SECURITIES VIP
OTHER ACCOUNTS MANAGED:
NUMBER OF OTHER TOTAL ASSETS OF
TOTAL ASSETS ACCOUNTS WITH PERFORMANCE-
NAME OF NUMBER OF OF OTHER PERFORMANCE- BASED FEE
PORTFOLIO MANAGER OTHER ACCOUNTS ACCOUNTS BASED FEE ACCOUNTS
William Chepolis 1 $119,545,835 0 $0
Ohn Choe 1 $119,545,835 0 $0
DWS HIGH INCOME VIP
OTHER ACCOUNTS MANAGED:
NUMBER OF OTHER TOTAL ASSETS OF
TOTAL ASSETS ACCOUNTS WITH PERFORMANCE-
NAME OF NUMBER OF OF OTHER PERFORMANCE- BASED FEE
PORTFOLIO MANAGER OTHER ACCOUNTS ACCOUNTS BASED FEE ACCOUNTS
Gary Sullivan 0 $0 0 $0
I-39
DWS LARGE CAP VALUE VIP
OTHER ACCOUNTS MANAGED:
NUMBER OF OTHER TOTAL ASSETS OF
TOTAL ASSETS ACCOUNTS WITH PERFORMANCE-
NAME OF NUMBER OF OF OTHER PERFORMANCE- BASED FEE
PORTFOLIO MANAGER OTHER ACCOUNTS ACCOUNTS BASED FEE ACCOUNTS
Thomas Schuessler 2 $12,885,087 0 $0
Oliver Pfeil 0 $ 0 0 $0
Volker Dosch 0 $ 0 0 $0
DWS MID CAP GROWTH VIP
OTHER ACCOUNTS MANAGED:
NUMBER OF OTHER TOTAL ASSETS OF
TOTAL ASSETS ACCOUNTS WITH PERFORMANCE-
NAME OF NUMBER OF OF OTHER PERFORMANCE- BASED FEE
PORTFOLIO MANAGER OTHER ACCOUNTS ACCOUNTS BASED FEE ACCOUNTS
Joseph Axtell 3 $219,451,380 0 $0
Rafaelina M. Lee 2 $175,511,148 0 $0
DWS SMALL CAP GROWTH VIP
OTHER ACCOUNTS MANAGED:
NUMBER OF OTHER TOTAL ASSETS OF
TOTAL ASSETS ACCOUNTS WITH PERFORMANCE-
NAME OF NUMBER OF OF OTHER PERFORMANCE- BASED FEE
PORTFOLIO MANAGER OTHER ACCOUNTS ACCOUNTS BASED FEE ACCOUNTS
Joseph Axtell 3 $219,451,380 0 $0
Rafaelina M. Lee 2 $175,511,148 0 $0
DWS STRATEGIC INCOME VIP
OTHER ACCOUNTS MANAGED:
NUMBER OF OTHER TOTAL ASSETS OF
TOTAL ASSETS ACCOUNTS WITH PERFORMANCE-
NAME OF NUMBER OF OF OTHER PERFORMANCE- BASED FEE
PORTFOLIO MANAGER OTHER ACCOUNTS ACCOUNTS BASED FEE ACCOUNTS
Gary Sullivan 0 $ 0 0 $ 0
William Chepolis 1 $ 119,545,835 0 $ 0
Robert Wang 34 $6,432,005,203 3 $37,280,448
Ohn Choe 1 $ 119,545,835 0 $ 0
Thomas Picciochi 8 $ 938,277,081 3 $37,280,448
I-40
DWS STRATEGIC VALUE VIP
OTHER ACCOUNTS MANAGED:
NUMBER OF OTHER TOTAL ASSETS OF
TOTAL ASSETS ACCOUNTS WITH PERFORMANCE-
NAME OF NUMBER OF OF OTHER PERFORMANCE- BASED FEE
PORTFOLIO MANAGER OTHER ACCOUNTS ACCOUNTS BASED FEE ACCOUNTS
Volker Dosch 0 0 0 $0
Oliver Pfeil 0 $ 0 0 $0
Thomas Schuessler 2 $12,885,087 0 $0
DWS TECHNOLOGY VIP
OTHER ACCOUNTS MANAGED:
NUMBER OF OTHER TOTAL ASSETS OF
TOTAL ASSETS ACCOUNTS WITH PERFORMANCE-
NAME OF NUMBER OF OF OTHER PERFORMANCE- BASED FEE
PORTFOLIO MANAGER OTHER ACCOUNTS ACCOUNTS BASED FEE ACCOUNTS
Frederic L. Fayolle 0 $0 0 $0
Clark Chang 0 $0 0 $0
Walter Holick 0 $0 0 $0
DWS TURNER MID CAP GROWTH VIP
OTHER ACCOUNTS MANAGED:
NUMBER OF OTHER TOTAL ASSETS OF
TOTAL ASSETS ACCOUNTS WITH PERFORMANCE-
NAME OF NUMBER OF OF OTHER PERFORMANCE- BASED FEE
PORTFOLIO MANAGER OTHER ACCOUNTS ACCOUNTS BASED FEE ACCOUNTS
Christopher K. McHugh 31 $1,900,000,000 3 $208,000,000
Tara Hedlund 16 $ 657,000,000 1 $ 94,000,000
Jason Schrotberger 58 $2,700,000,000 6 $498,000,000
In addition to the accounts above, an investment professional may manage
accounts in a personal capacity that may include holdings that are similar to,
or the same as, those of each fund. The Advisor has in place a Code of Ethics
that is designed to address conflicts of interest and that, among other things,
imposes restrictions on the ability of portfolio managers and other "access
persons" to invest in securities that may be recommended or traded in each fund
and other client accounts.
I-41
PART I: APPENDIX I-E - AFFILIATED SERVICE PROVIDER COMPENSATION
DWS ALTERNATIVE ASSET ALLOCATION PLUS VIP
GROSS AMOUNT AMOUNT WAIVED GROSS AMOUNT PAID TO AMOUNT WAIVED BY
PAID TO DIMA BY DIMA FOR DIMA FOR GENERAL DIMA FOR GENERAL
FOR ADVISORY ADVISORY ADMINISTRATIVE ADMINISTRATIVE
FISCAL YEAR ENDED SERVICES SERVICES SERVICES SERVICES
2009 $4,064/1/ $4,064 $2,032/1/ $2,032
GROSS AMOUNT PAID TO AMOUNT WAIVED BY
DISC FOR TRANSFER DISC FOR TRANSFER
FISCAL YEAR ENDED AGENCY SERVICES AGENCY SERVICES
2009 $101 $71
DWS BALANCED VIP
GROSS AMOUNT AMOUNT WAIVED GROSS AMOUNT PAID TO AMOUNT WAIVED BY
PAID TO DIMA BY DIMA FOR DIMA FOR GENERAL DIMA FOR GENERAL
FOR ADVISORY ADVISORY ADMINISTRATIVE ADMINISTRATIVE
FISCAL YEAR ENDED SERVICES SERVICES SERVICES SERVICES
2009 $1,107,448 $ 0 $ 302,883 $0
2008 $1,716,044 $48,022 $267,755/2/ $0
2007 $2,666,534 $30,062 $ 0 $0
GROSS AMOUNT PAID TO AMOUNT WAIVED BY
DISC FOR TRANSFER DISC FOR TRANSFER
FISCAL YEAR ENDED AGENCY SERVICES AGENCY SERVICES
2009 $626 $ 0
2008 $221 $221
2007 $453 $453
DWS BLUE CHIP VIP
GROSS AMOUNT AMOUNT WAIVED GROSS AMOUNT PAID TO AMOUNT WAIVED BY
PAID TO DIMA BY DIMA FOR DIMA FOR GENERAL DIMA FOR GENERAL
FOR ADVISORY ADVISORY ADMINISTRATIVE ADMINISTRATIVE
FISCAL YEAR ENDED SERVICES SERVICES SERVICES SERVICES
2009 $ 556,755 $0 $ 101,228 $0
2008 $1,059,617 $0 $105,793/2/ $0
2007 $2,018,922 $0 $ 0 $0
GROSS AMOUNT PAID TO AMOUNT WAIVED BY
DISC FOR TRANSFER DISC FOR TRANSFER
FISCAL YEAR ENDED AGENCY SERVICES AGENCY SERVICES
2009 $293 $0
2008 $383 $0
2007 $450 $0
I-42
DWS CORE FIXED INCOME VIP
GROSS AMOUNT AMOUNT WAIVED GROSS AMOUNT PAID TO AMOUNT WAIVED BY
PAID TO DIMA BY DIMA FOR DIMA FOR GENERAL DIMA FOR GENERAL
FOR ADVISORY ADVISORY ADMINISTRATIVE ADMINISTRATIVE
FISCAL YEAR ENDED SERVICES SERVICES SERVICES SERVICES
2009 $ 635,016 $0 $ 127,003 $0
2008 $1,158,767 $0 $129,626/2/ $0
2007 $2,144,122 $0 $ 0 $0
GROSS AMOUNT PAID TO AMOUNT WAIVED BY
DISC FOR TRANSFER DISC FOR TRANSFER
FISCAL YEAR ENDED AGENCY SERVICES AGENCY SERVICES
2009 $ 76 $0
2008 $341 $0
2007 $368 $0
DWS DIVERSIFIED INTERNATIONAL EQUITY VIP
GROSS AMOUNT AMOUNT WAIVED GROSS AMOUNT PAID TO AMOUNT WAIVED BY
PAID TO DIMA BY DIMA FOR DIMA FOR GENERAL DIMA FOR GENERAL
FOR ADVISORY ADVISORY ADMINISTRATIVE ADMINISTRATIVE
FISCAL YEAR ENDED SERVICES SERVICES SERVICES SERVICES
2009 $ 527,405 $0 $ 81,139 $0
2008 $1,244,991 $0 $105,669/2/ $0
2007 $2,007,490 $0 $ 0 $0
GROSS AMOUNT PAID TO AMOUNT WAIVED BY
DISC FOR TRANSFER DISC FOR TRANSFER
FISCAL YEAR ENDED AGENCY SERVICES AGENCY SERVICES
2009 $151 $0
2008 $152 $0
2007 $247 $0
DWS DREMAN SMALL MID CAP VALUE VIP
GROSS AMOUNT AMOUNT WAIVED GROSS AMOUNT PAID TO AMOUNT WAIVED BY
PAID TO DIMA BY DIMA FOR DIMA FOR GENERAL DIMA FOR GENERAL
FOR ADVISORY ADVISORY ADMINISTRATIVE ADMINISTRATIVE
FISCAL YEAR ENDED SERVICES SERVICES SERVICES SERVICES
2009 $1,488,279 $0 $ 229,045 $0
2008 $2,646,998 $0 $244,036/2/ $0
2007 $4,418,373 $0 $ 0 $0
GROSS AMOUNT PAID TO AMOUNT WAIVED BY
DISC FOR TRANSFER DISC FOR TRANSFER
FISCAL YEAR ENDED AGENCY SERVICES AGENCY SERVICES
2009 $1,040 $0
2008 $ 995 $0
2007 $1,013 $0
I-43
DWS GLOBAL THEMATIC VIP
GROSS AMOUNT AMOUNT WAIVED GROSS AMOUNT PAID TO AMOUNT WAIVED BY
PAID TO DIMA BY DIMA FOR DIMA FOR GENERAL DIMA FOR GENERAL
FOR ADVISORY ADVISORY ADMINISTRATIVE ADMINISTRATIVE
FISCAL YEAR ENDED SERVICES SERVICES SERVICES SERVICES
2009 $ 567,449 $212,704 $ 62,016 $0
2008 $1,138,988 $441,223 $72,094/2/ $0
2007 $1,732,290 $578,480 $ 0 $0
GROSS AMOUNT PAID TO AMOUNT WAIVED BY GROSS AMOUNT PAID TO AMOUNT WAIVED BY
DISC FOR TRANSFER DISC FOR TRANSFER DIFA FOR FUND DIFA FOR FUND
FISCAL YEAR ENDED AGENCY SERVICES AGENCY SERVICES ACCOUNTING SERVICES ACCOUNTING SERVICES
2009 $445 $383 $ 0 $0
2008 $224 $ 0 $69,550/4/ $0
2007 $466 $466 $ 242,233 $0
DWS GOVERNMENT & AGENCY SECURITIES VIP
GROSS AMOUNT AMOUNT WAIVED GROSS AMOUNT PAID TO AMOUNT WAIVED BY
PAID TO DIMA BY DIMA FOR DIMA FOR GENERAL DIMA FOR GENERAL
FOR ADVISORY ADVISORY ADMINISTRATIVE ADMINISTRATIVE
FISCAL YEAR ENDED SERVICES SERVICES SERVICES SERVICES
2009 $ 886,913 $ 0 $ 197,092 $0
2008 $1,045,390 $ 9,385 $143,349/2/ $0
2007 $1,209,630 $41,529 $ 0 $0
GROSS AMOUNT PAID TO AMOUNT WAIVED BY
DISC FOR TRANSFER DISC FOR TRANSFER
FISCAL YEAR ENDED AGENCY SERVICES AGENCY SERVICES
2009 $ 434 $ 0
2008 $ 623 $552
2007 $1,014 $918
DWS HIGH INCOME VIP
GROSS AMOUNT AMOUNT WAIVED GROSS AMOUNT PAID TO AMOUNT WAIVED BY
PAID TO DIMA BY DIMA FOR DIMA FOR GENERAL DIMA FOR GENERAL
FOR ADVISORY ADVISORY ADMINISTRATIVE ADMINISTRATIVE
FISCAL YEAR ENDED SERVICES SERVICES SERVICES SERVICES
2009 $ 879,928 $0 $ 175,986 $0
2008 $1,139,273 $0 $131,305/2/ $0
2007 $1,912,439 $0 $ 0 $0
GROSS AMOUNT PAID TO AMOUNT WAIVED BY
DISC FOR TRANSFER DISC FOR TRANSFER
FISCAL YEAR ENDED AGENCY SERVICES AGENCY SERVICES
2009 $333 $0
2008 $432 $0
2007 $548 $0
I-44
DWS LARGE CAP VALUE VIP
GROSS AMOUNT AMOUNT WAIVED GROSS AMOUNT PAID TO AMOUNT WAIVED BY
PAID TO DIMA BY DIMA FOR DIMA FOR GENERAL DIMA FOR GENERAL
FOR ADVISORY ADVISORY ADMINISTRATIVE ADMINISTRATIVE
FISCAL YEAR ENDED SERVICES SERVICES SERVICES SERVICES
2009 $1,164,765 $0 $ 179,195 $0
2008 $1,214,541 $0 $ 186,852 $0
2007 $1,950,386 $0 $197,410/3/ $0
GROSS AMOUNT PAID TO AMOUNT WAIVED BY
DISC FOR TRANSFER DISC FOR TRANSFER
FISCAL YEAR ENDED AGENCY SERVICES AGENCY SERVICES
2009 $187 $ 0
2008 $372 $60
2007 $478 $ 0
DWS MID CAP GROWTH VIP
GROSS AMOUNT AMOUNT WAIVED GROSS AMOUNT PAID TO AMOUNT WAIVED BY
PAID TO DIMA BY DIMA FOR DIMA FOR GENERAL DIMA FOR GENERAL
FOR ADVISORY ADVISORY ADMINISTRATIVE ADMINISTRATIVE
FISCAL YEAR ENDED SERVICES SERVICES SERVICES SERVICES
2009 $129,856 $48,037 $ 19,527 $0
2008 $252,379 $51,613 $21,460/2/ $0
2007 $435,886 $83,897 $ 0 $0
GROSS AMOUNT PAID TO AMOUNT WAIVED BY GROSS AMOUNT PAID TO AMOUNT WAIVED BY
DISC FOR TRANSFER DISC FOR TRANSFER DIFA FOR FUND DIFA FOR FUND
FISCAL YEAR ENDED AGENCY SERVICES AGENCY SERVICES ACCOUNTING SERVICES ACCOUNTING SERVICES
2009 $473 $473 $ 0 $0
2008 $208 $208 $20,790/4/ $0
2007 $237 $237 $ 60,283 $0
DWS MONEY MARKET VIP
GROSS AMOUNT AMOUNT WAIVED GROSS AMOUNT PAID TO AMOUNT WAIVED BY
PAID TO DIMA BY DIMA FOR DIMA FOR GENERAL DIMA FOR GENERAL
FOR ADVISORY ADVISORY ADMINISTRATIVE ADMINISTRATIVE
FISCAL YEAR ENDED SERVICES SERVICES SERVICES SERVICES
2009 $ 946,882 $ 0 $ 332,239 $0
2008 $1,247,502 $74,810 $263,770/2/ $0
2007 $1,392,290 $23,928 $ 0 $0
GROSS AMOUNT PAID TO AMOUNT WAIVED BY
DISC FOR TRANSFER DISC FOR TRANSFER
FISCAL YEAR ENDED AGENCY SERVICES AGENCY SERVICES
2009 $574 $ 0
2008 $711 $711
2007 $690 $690
I-45
DWS SMALL CAP GROWTH VIP
GROSS AMOUNT AMOUNT WAIVED GROSS AMOUNT PAID TO AMOUNT WAIVED BY
PAID TO DIMA BY DIMA FOR DIMA FOR GENERAL DIMA FOR GENERAL
FOR ADVISORY ADVISORY ADMINISTRATIVE ADMINISTRATIVE
FISCAL YEAR ENDED SERVICES SERVICES SERVICES SERVICES
2009 $ 373,273 $ 0 $ 67,868 $0
2008 $ 733,616 $29,376 $74,373/2/ $0
2007 $1,413,741 $54,596 $ 0 $0
GROSS AMOUNT PAID TO AMOUNT WAIVED BY
DISC FOR TRANSFER DISC FOR TRANSFER
FISCAL YEAR ENDED AGENCY SERVICES AGENCY SERVICES
2009 $569 $ 0
2008 $387 $151
2007 $365 $365
DWS STRATEGIC INCOME VIP
GROSS AMOUNT AMOUNT WAIVED GROSS AMOUNT PAID TO AMOUNT WAIVED BY
PAID TO DIMA BY DIMA FOR DIMA FOR GENERAL DIMA FOR GENERAL
FOR ADVISORY ADVISORY ADMINISTRATIVE ADMINISTRATIVE
FISCAL YEAR ENDED SERVICES SERVICES SERVICES SERVICES
2009 $391,763 $43,268 $ 71,230 $0
2008 $578,416 $12,958 $62,261/2/ $0
2007 $697,461 $ 0 $ 0 $0
GROSS AMOUNT PAID TO AMOUNT WAIVED BY
DISC FOR TRANSFER DISC FOR TRANSFER
FISCAL YEAR ENDED AGENCY SERVICES AGENCY SERVICES
2009 $207 $207
2008 $147 $ 0
2007 $225 $ 0
DWS STRATEGIC VALUE VIP
GROSS AMOUNT AMOUNT WAIVED GROSS AMOUNT PAID TO AMOUNT WAIVED BY
PAID TO DIMA BY DIMA FOR DIMA FOR GENERAL DIMA FOR GENERAL
FOR ADVISORY ADVISORY ADMINISTRATIVE ADMINISTRATIVE
FISCAL YEAR ENDED SERVICES SERVICES SERVICES SERVICES
2009 $1,818,873 $104,023 $ 274,743 $0
2008 $3,949,911 $ 0 $331,580/2/ $0
2007 $7,381,802 $ 0 $ 0 $0
GROSS AMOUNT PAID TO AMOUNT WAIVED BY GROSS AMOUNT PAID TO AMOUNT WAIVED BY
DISC FOR TRANSFER DISC FOR TRANSFER DIFA FOR FUND DIFA FOR FUND
FISCAL YEAR ENDED AGENCY SERVICES AGENCY SERVICES ACCOUNTING SERVICES ACCOUNTING SERVICES
2009 $709 $494 $ 0 $0
2008 $847 $243 $40,370/4/ $0
2007 $995 $313 $ 141,319 $0
I-46
DWS TECHNOLOGY VIP
GROSS AMOUNT AMOUNT WAIVED GROSS AMOUNT PAID TO AMOUNT WAIVED BY
PAID TO DIMA BY DIMA FOR DIMA FOR GENERAL DIMA FOR GENERAL
FOR ADVISORY ADVISORY ADMINISTRATIVE ADMINISTRATIVE
FISCAL YEAR ENDED SERVICES SERVICES SERVICES SERVICES
2009 $ 452,097 $0 $ 67,985 $0
2008 $ 762,698 $0 $66,748/2/ $0
2007 $1,237,197 $0 $ 0 $0
GROSS AMOUNT PAID TO AMOUNT WAIVED BY GROSS AMOUNT PAID TO AMOUNT WAIVED BY
DISC FOR TRANSFER DISC FOR TRANSFER DIFA FOR FUND DIFA FOR FUND
FISCAL YEAR ENDED AGENCY SERVICES AGENCY SERVICES ACCOUNTING SERVICES ACCOUNTING SERVICES
2009 $296 $0 $ 0 $0
2008 $375 $0 $21,129/4/ $0
2007 $490 $0 $ 59,280 $0
DWS TURNER MID CAP GROWTH VIP
GROSS AMOUNT AMOUNT WAIVED GROSS AMOUNT PAID TO AMOUNT WAIVED BY
PAID TO DIMA BY DIMA FOR DIMA FOR GENERAL DIMA FOR GENERAL
FOR ADVISORY ADVISORY ADMINISTRATIVE ADMINISTRATIVE
FISCAL YEAR ENDED SERVICES SERVICES SERVICES SERVICES
2009 $ 324,784 $ 0 $ 45,424 $0
2008 $ 737,881 $16,056 $59,597/2/ $0
2007 $1,067,206 $ 0 $ 0 $0
GROSS AMOUNT PAID TO AMOUNT WAIVED BY GROSS AMOUNT PAID TO AMOUNT WAIVED BY
DISC FOR TRANSFER DISC FOR TRANSFER DIFA FOR FUND DIFA FOR FUND
FISCAL YEAR ENDED AGENCY SERVICES AGENCY SERVICES ACCOUNTING SERVICES ACCOUNTING SERVICES
2009 $102 $ 0 $ 0 $0
2008 $ 93 $93 $22,504/4/ $0
2007 $104 $ 0 $ 81,746 $0
/1/ For the period from February 2, 2009 (commencement of operations) through
December 31, 2009.
/2/ For the period from May 1, 2008 through December 31, 2008. Prior to May 1,
2008, the administrative services fee for each fund was included in the
investment management agreement.
/3/ For the period from April 11, 2007 through December 31, 2007. Prior to
April 11, 2007, the administrative services fee for the fund was included
in the investment management agreement.
/4/ For the period from January 1, 2008 through April 30, 2008.
The following waivers were in effect during the most recent three fiscal years:
For the period from February 2, 2009 (commencement of operations) through
December 31, 2009, the Advisor has agreed to waive 0.15% of the monthly
management fee based on average daily net assets for DWS Alternative Asset
Allocation VIP.
For the period from January 1, 2007 through April 30, 2008, the Advisor, the
underwriter and accounting agent had contractually agreed to waive all or a
portion of its fee and reimburse or pay certain operating expenses to the
extent necessary to maintain DWS Balanced VIP's total annual operating expenses
at 0.51% for Class A shares, excluding certain expenses such as extraordinary
expenses, taxes, brokerage and interest expense.
I-47
For the period from October 1, 2008 through September 30, 2009, the Advisor had
contractually agreed to waive its fee and/or reimburse certain operating
expenses to the extent necessary to maintain DWS Blue Chip VIP's total annual
operating expenses at 1.25% for Class B shares, excluding certain expenses such
as extraordinary expenses, taxes, brokerage and interest expense.
For the period from October 1, 2007 through September 30, 2008, the Advisor,
the underwriter and accounting agent had contractually agreed to waive all or a
portion of its fee and reimburse or pay certain operating expenses to the
extent necessary to maintain DWS Core Fixed Income VIP's total annual operating
expenses at 0.70% for Class A shares, excluding certain expenses such as
extraordinary expenses, taxes, brokerage and interest expense.
Effective October 1, 2009 through April 30, 2010, the Advisor has contractually
agreed to waive all or a portion of its management fee and reimburse or pay
certain operating expenses of DWS Global Thematic VIP to the extent necessary
to maintain the DWS Global Thematic VIP's total operating expenses at ratios no
higher than 1.25% and 1.65% for Class A shares, and Class B shares,
respectively, excluding certain expenses such as extraordinary expenses, taxes,
brokerage and interest. For the period from May 1, 2009 through September 30,
2009, the Advisor had contractually agreed to waive its fee and/or reimburse
certain operating expenses to the extent necessary to maintain DWS Global
Thematic VIP's total annual operating expenses at 1.07% and 1.47% for Class A
shares and Class B shares, respectively, excluding certain expenses such as
extraordinary expenses, taxes, brokerage and interest expense. For the period
from January 1, 2008 through April 30, 2009, the Advisor had contractually
agreed to waive all or a portion of its fee and reimburse or pay certain
operating expenses to the extent necessary to maintain DWS Global Thematic
VIP's total annual operating expenses at 1.05% and 1.45% for Class A shares and
Class B shares, respectively, excluding certain expenses such as extraordinary
expenses, taxes, brokerage and interest expense. From October 1, 2007 through
September 30, 2008, the Advisor, the underwriter and accounting agent had
contractually agreed to waive all or a portion of its fee and reimburse or pay
certain operating expenses to the extent necessary to maintain the DWS Global
Thematic VIP's total operating expenses at 1.05% and 1.45% for Class A and
Class B shares, respectively, excluding certain expenses such as extraordinary
expenses, taxes, brokerage, interest expense. For the period from February 1,
2007 through September 30, 2007, the Advisor, the underwriter and accounting
agent had contractually agreed to waive all or a portion of its fee and
reimburse or pay certain operating expenses to the extent necessary to maintain
DWS Global Thematic VIP's total annual operating expenses at 1.12% and 1.52%
for Class A shares and Class B shares, respectively, excluding certain expenses
such as extraordinary expenses, taxes, brokerage and interest expense. For the
period from January 1, 2007 through January 30, 2007, the Advisor, the
underwriter and accounting agent had contractually agreed to waive all or a
portion of its fee and reimburse or pay certain operating expenses to the
extent necessary to maintain DWS Global Thematic VIP's total annual operating
expenses at 1.05% and 1.49% for Class A shares and Class B shares,
respectively, excluding certain expenses such as extraordinary expenses, taxes,
brokerage, interest and organizational and offering expenses.
For the period from October 1, 2008 through September 30, 2009, the Advisor had
contractually agreed to waive its fee and/or reimburse certain operating
expenses of DWS Government & Agency Securities VIP to the extent necessary to
maintain DWS Government & Agency Securities VIP's total annual operating
expenses at 0.65% and 1.05% for Class A shares and Class B shares,
respectively, excluding certain expenses such as extraordinary expenses, taxes,
brokerage and interest expense. For the period from May 1, 2008 through
September 30, 2008, the Advisor had contractually agreed to waive all or a
portion of its fee and reimburse or pay certain operating expenses to the
extent necessary to maintain the total annual operating expenses of DWS
Government & Agency Securities VIP at 0.64% for Class A shares, excluding
certain expenses such as extraordinary expenses, taxes, brokerage and interest
expense. For the period from October 1, 2007 through September 30, 2008, the
Advisor, the underwriter and accounting agent had contractually agreed to waive
all or a portion of its fee and reimburse or pay certain operating expenses to
the extent necessary to maintain DWS Government & Agency Securities VIP's total
annual operating expenses at 1.04% for Class B shares, excluding certain
expenses such as extraordinary expenses, taxes, brokerage and interest expense.
For the period from February 1, 2007 through April 30, 2008, the Advisor, the
underwriter and accounting agent had contractually agreed to waive all or a
portion of its fee and reimburse or pay certain operating expenses to the
extent necessary to maintain DWS Government & Agency Securities VIP's total
annual operating expenses at 0.63% for Class A shares, excluding certain
expenses such as extraordinary expenses, taxes, brokerage, interest and
organizational and offering expenses.
I-48
For the period from October 1, 2008 through September 30, 2009, the Advisor had
contractually agreed to waive its fee and/or reimburse certain operating
expenses of DWS High Income VIP to the extent necessary to maintain DWS High
Income VIP's total annual operating expenses at 1.18% for Class B shares,
excluding certain expenses such as extraordinary expenses, taxes, brokerage and
interest expense.
For the period from April 27, 2009 through September 30, 2009, the Advisor had
contractually agreed to waive its fee and/or reimburse certain operating
expenses of DWS Large Cap Value VIP to the extent necessary to maintain DWS
Large Cap Value VIP's total operating expenses at 0.88% for Class A shares,
excluding certain expenses such as extraordinary expenses, taxes, brokerage and
interest expense. For the period from October 1, 2008 through September 30,
2009, the Advisor had contractually agreed to waive its fee and/or reimburse
certain operating expenses of DWS Large Cap Value VIP to the extent necessary
to maintain DWS Large Cap Value VIP's total operating expenses at 1.25% for
Class B shares, excluding certain expenses such as extraordinary expenses,
taxes, brokerage and interest expense.
For the period from October 1, 2009 through April 30, 2010, the Advisor had
contractually agreed to waive all or a portion of its management fee and
reimburse or pay certain expense of DWS Mid Cap Growth VIP to the extent
necessary to maintain DWS Mid Cap Growth VIP's total operating expenses at a
ratio no higher than 1.10% for Class A shares, excluding certain expenses such
as extraordinary expenses, taxes, brokerage and interest. For the period from
October 1, 2007 through September 30, 2009, the Advisor, the underwriter and
accounting agent had contractually agreed to waive its fee and/or reimburse
certain operating expenses of DWS Mid Cap Growth VIP to the extent necessary to
maintain DWS Mid Cap Growth VIP's total operating expenses at 0.94% for Class A
shares, excluding certain expenses such as extraordinary expenses, taxes,
brokerage and interest expense. For the period from February 1, 2007 through
September 30, 2007, the Advisor, the underwriter and accounting agent had
contractually agreed to waive all or a portion of its fee and reimburse or pay
certain operating expenses to the extent necessary to maintain DWS Mid Cap
Growth VIP's total annual operating expenses at 0.90% for Class A shares
excluding certain expenses such as extraordinary expenses, taxes, brokerage and
interest expense. For the period from January 1, 2007 through January 30, 2007,
the Advisor, the underwriter and accounting agent had contractually agreed to
waive all or a portion of its fee and reimburse or pay certain operating
expenses to the extent necessary to maintain DWS Mid Cap Growth VIP's total
annual operating expenses at 0.86% for Class A shares excluding certain
expenses such as extraordinary expenses, taxes, brokerage, interest and
organizational and offering expenses.
For the period from January 1, 2007 through April 30, 2010, the Advisor, the
underwriter and accounting agent had contractually agreed to waive its fee
and/or reimburse certain operating expenses to the extent necessary to maintain
DWS Money Market VIP's total annual operating expenses at 0.44% for Class A
shares, excluding certain expenses such as extraordinary expenses, taxes,
brokerage, interest and organizational and offering expenses.
For the period from January 1, 2007 through April 30, 2008, the Advisor, the
underwriter and accounting agent had contractually agreed to waive all or a
portion of its fee and reimburse or pay certain operating expenses to the
extent necessary to maintain DWS Small Cap Growth VIP's total annual operating
expenses at 0.72% for Class A shares, excluding certain expenses such as
extraordinary expenses, taxes, brokerage and interest expense.
For the period from October 1, 2008 through September 30, 2009, the Advisor had
contractually agreed to waive its fee and/or reimburse certain operating
expenses of DWS Strategic Income VIP to the extent necessary to maintain DWS
Strategic Income VIP's total operating expenses at 0.82% for Class A shares,
excluding certain expenses such as extraordinary expenses, taxes, brokerage and
interest expense. For the period from October 1, 2007 through September 30,
2008, the Advisor, the underwriter and accounting agent had contractually
agreed to waive all or a portion of its fee and reimburse or pay certain
operating expenses to the extent necessary to maintain DWS Strategic Income
VIP's total annual operating expenses at 0.83% for Class A shares, excluding
certain expenses such as extraordinary expenses, taxes, brokerage and interest
expense.
For the period from January 1, 2007 through April 30, 2010, the Advisor, the
underwriter and accounting agent had contractually agreed to waive its fee
and/or reimburse certain operating expenses to the extent necessary to maintain
the total annual operating expenses of DWS Strategic Value VIP at 0.78% for
Class A shares, excluding certain expenses such as extraordinary expenses,
taxes, brokerage and interest expense. For the period from May 7, 2007 through
April 30, 2010, the Advisor had contractually agreed to waive its fee and/or
reimburse certain operating expenses to the extent necessary to maintain the
total annual operating expenses of DWS Strategic Value VIP at 1.11% for Class B
shares, excluding certain expenses such as extraordinary expenses, taxes,
brokerage and interest expense. For
I-49
the period from January 1, 2007 through May 6, 2007, the Advisor, the
underwriter and accounting agent had contractually agreed to waive all or a
portion of its fee and reimburse or pay certain operating expenses to the
extent necessary to maintain the total annual operating expenses of DWS
Strategic Value VIP at 1.15% for Class B shares, excluding certain expenses
such as extraordinary expenses, taxes, brokerage, interest and organizational
and offering expenses.
For the period from January 1, 2009 through September 30, 2009, the Advisor had
contractually agreed to waive its fee and/or reimburse certain operating
expenses of DWS Technology VIP to the extent necessary to maintain DWS
Technology VIP's total annual operating expenses at 1.48% for Class B shares,
excluding certain expenses such as extraordinary expenses, taxes, brokerage and
interest expense.
For the period from October 1, 2007 through September 30, 2008, the Advisor,
the underwriter and accounting agent had contractually agreed to waive all or a
portion of its fee and reimburse or pay certain operating expenses to the
extent necessary to maintain DWS Turner Mid Cap Growth VIP's total annual
operating expenses at 0.94% for Class A shares, excluding certain expenses such
as extraordinary expenses, taxes, brokerage and interest expense.
The following waivers are currently in effect:
The Advisor has contractually agreed through April 30, 2011 to waive and/or
reimburse fund expenses so that DWS Alternative Asset Allocation Plus VIP's
total annual operating expenses will not exceed 0.21% and 0.61% for Class A and
Class B. The agreement may only be terminated with the consent of the fund's
Board and does not extend to extraordinary expenses, taxes, brokerage and
interest expense and acquired funds (underlying funds) fees and expenses
(estimated at 1.23%).
For DWS Global Thematic VIP, the Advisor has contractually agreed through
September 30, 2010 to waive and/or reimburse fund expenses to the extent
necessary to maintain the fund's total annual operating expenses at 1.06% and
1.46% for Class A and Class B. The agreement may only be terminated with the
consent of the fund's Board and does not extend to extraordinary expenses,
taxes, brokerage and interest expense.
For DWS High Income VIP, the Advisor has contractually agreed through September
30, 2010 to waive and/or reimburse fund expenses to the extent necessary to
maintain the fund's total annual operating expenses at 1.25% for Class B. The
agreement may only be terminated with the consent of the fund's Board and does
not extend to extraordinary expenses, taxes, brokerage and interest expense.
For DWS Large Cap Value VIP, the Advisor has contractually agreed through
September 30, 2010 to waive and/or reimburse fund expenses to the extent
necessary to maintain the fund's total annual operating expenses at 0.88% and
1.28% for Class A and Class B. The agreement may only be terminated with the
consent of the fund's Board and does not extend o extraordinary expenses,
taxes, brokerage and interest expense.
For DWS Mid Cap Growth VIP, the Advisor has contractually agreed through
September 30, 2010 to waive and/or reimburse fund expenses to the extent
necessary to maintain the fund's total annual operating expenses at 1.09% for
Class A. The agreement may only be terminated with the consent of the fund's
Board and does not extend to extraordinary expenses, taxes, brokerage and
interest expense.
For DWS Money Market VIP, the Advisor has contractually agreed through
September 30, 2010 to waive and/or reimburse fund expenses to the extent
necessary to maintain the fund's total annual operating expenses at 0.51% for
Class A. The agreement may only be terminated with the consent of the fund's
Board and does not extend to extraordinary expenses, taxes, brokerage and
interest expense.
For DWS Strategic Income VIP, the Advisor has contractually agreed through
September 30, 2010 to waive and/or reimburse fund expenses to the extent
necessary to maintain the fund's total annual operating expenses at 0.87% for
Class A. The agreement may only be terminated with the consent of the fund's
Board and does not extend to extraordinary expenses, taxes, brokerage and
interest expense.
For DWS Turner Mid Cap Growth VIP, the Advisor has contractually agreed through
September 30, 2010 to waive and/or reimburse fund expenses to the extent
necessary to maintain the fund's total annual operating expenses at 1.01% for
Class A. The agreement may only be terminated with the consent of the fund's
Board and does not extend to extraordinary expenses, taxes, brokerage and
interest expense.
I-50
PART I: APPENDIX I-F - DISTRIBUTION PLAN PAYMENTS
Expenses of each fund paid in connection with the Rule 12b-1 Plans for each
class of shares that has adopted a Rule 12b-1 Plan are set forth below for the
most recent calendar year.
12B-1 COMPENSATION TO UNDERWRITER AND FIRMS:
12B-1 DISTRIBUTION
FEES
DWS Alternative Asset Allocation Plus VIP Class B $ 4,099
DWS Blue Chip VIP Class B $ 357
DWS Dreman Small Mid Cap Value VIP Class B $57,670
DWS Global Thematic VIP Class B $10,871
DWS Government & Agency Securities VIP Class B $17,935
DWS High Income VIP Class B $ 351
DWS Large Cap Value VIP Class B $ 1,457
DWS Strategic Value VIP Class B $ 4,762
DWS Technology VIP Class B $ 5,456
I-51
PART I: APPENDIX I-G - PORTFOLIO TRANSACTIONS AND BROKERAGE COMMISSIONS
PORTFOLIO TURNOVER RATES
FUND 2009 2008
DWS Alternative Asset Allocation Plus VIP 155%/**/ NA
DWS Balanced VIP 207% 263%
DWS Blue Chip VIP 82% 127%
DWS Core Fixed Income VIP 222% 215%
DWS Diversified International Equity VIP 139% 132%
DWS Dreman Small Mid Cap Value VIP 72% 49%
DWS Global Thematic VIP 190% 229%
DWS Government & Agency Securities VIP 390% 543%
DWS High Income VIP 66% 38%
DWS Large Cap Value VIP 76% 97%
DWS Mid Cap Growth VIP 89% 82%
DWS Small Cap Growth VIP 93% 67%
DWS Strategic Income VIP 370% 234%
DWS Strategic Value VIP 91% 28%
DWS Technology VIP 45% 71%
DWS Turner Mid Cap Growth VIP 86% 156%
/**/ Not annualized.
BROKERAGE COMMISSIONS
FISCAL BROKERAGE COMMISSIONS
YEAR PAID BY FUND
DWS Alternative Asset Allocation Plus VIP 2009 $ 47
2008 $ 0
2007 $ 0
DWS Balanced VIP 2009 $ 455,000
2008 $ 0
2007 $ 0
DWS Blue Chip VIP 2009 $ 79,447
2008 $ 131,526
2007 $ 434,083
DWS Core Fixed Income VIP 2009 $ 10,774
2008 $ 4,953
2007 $ 0
DWS Diversified International Equity VIP 2009 $ 196,584
2008 $ 821,263
2007 $ 911,116
DWS Dreman Small Mid Cap Value VIP 2009 $ 411,185
2008 $ 447,757
2007 $1,193,080
DWS Global Thematic VIP 2009 $ 452,640
I-52
FISCAL BROKERAGE COMMISSIONS
YEAR PAID BY FUND
2008 $811,767
2007 $982,359
DWS Government & Agency Securities 2009 $ 19,143
VIP
2008 $ 27,364
2007 $ 13,354
DWS High Income VIP 2009 $ 0
2008 $ 0
2007 $ 0
DWS Large Cap Value VIP 2009 $471,798
2008 $501,313
2007 $507,082
DWS Mid Cap Growth VIP 2009 $ 57,024
2008 $ 80,219
2007 $ 80,264
DWS Money Market VIP 2009 $ 0
2008 $ 0
2007 $ 0
DWS Small Cap Growth VIP 2009 $276,913
2008 $327,182
2007 $437,462
DWS Strategic Income VIP 2009 $ 12,407
2008 $ 11,589
2007 $ 0
DWS Strategic Value VIP 2009 $733,553
2008 $403,090
2007 $581,172
DWS Technology VIP 2009 $130,579
2008 $279,514
2007 $433,195
DWS Turner Mid Cap Growth VIP 2009 $121,492
2008 $312,743
2007 $298,896
BROKERAGE COMMISSIONS PAID TO AFFILIATED BROKERS
AGGREGATE % OF THE
BROKERAGE AGGREGATE
COMMISSIONS DOLLAR
NAME OF PAID BY FUND % OF THE TOTAL VALUE OF ALL
FISCAL AFFILIATED TO AFFILIATED BROKERAGE PORTFOLIO
YEAR BROKER AFFILIATION BROKERS COMMISSIONS TRANSACTIONS
DWS Alternative Asset Allocation Plus VIP 2009 None - None - -
DWS Balanced VIP 2009 None - None - -
I-53
AGGREGATE % OF THE
BROKERAGE AGGREGATE
COMMISSIONS DOLLAR
NAME OF PAID BY FUND % OF THE TOTAL VALUE OF ALL
FISCAL AFFILIATED TO AFFILIATED BROKERAGE PORTFOLIO
YEAR BROKER AFFILIATION BROKERS COMMISSIONS TRANSACTIONS
2008 None - None - -
2007 None - None - -
DWS Blue Chip VIP 2009 None - None - -
2008 None - None - -
2007 None - None - -
DWS Core Fixed Income VIP 2009 None - None - -
2008 None - None - -
2007 None - None - -
DWS Diversified International Equity VIP 2009 None - None - -
2008 None - None - -
2007 None - None - -
DWS Dreman Small Mid Cap Value VIP 2009 None - None - -
2008 None - None - -
2007 None - None - -
DWS Global Thematic VIP 2009 None - None - -
2008 None - None - -
2007 None - None - -
DWS Government & Agency Securities 2009 None - None - -
VIP
2008 None - None - -
2007 None - None - -
DWS High Income VIP 2009 None - None - -
2008 None - None - -
2007 None - None - -
DWS Large Cap Value VIP 2009 None - None - -
2008 None - None - -
2007 None - None - -
DWS Mid Cap Growth VIP 2009 None - None - -
2008 None - None - -
2007 None - None - -
DWS Money Market VIP 2009 None - None - -
2008 None - None - -
2007 None - None - -
DWS Small Cap Growth VIP 2009 None - None - -
2008 None - None - -
2007 None - None - -
DWS Strategic Income VIP 2009 None - None - -
2008 None - None - -
2007 None - None - -
DWS Strategic Value VIP 2009 None - None - -
I-54
AGGREGATE % OF THE
BROKERAGE AGGREGATE
COMMISSIONS DOLLAR
NAME OF PAID BY FUND % OF THE TOTAL VALUE OF ALL
FISCAL AFFILIATED TO AFFILIATED BROKERAGE PORTFOLIO
YEAR BROKER AFFILIATION BROKERS COMMISSIONS TRANSACTIONS
2008 None - None - -
2007 None - None - -
DWS Technology VIP 2009 None - None - -
2008 None - None - -
2007 None - None - -
DWS Turner Mid Cap Growth VIP 2009 None - None - -
2008 None - None - -
2007 None - None - -
Each fund is required to identify any securities of its "regular brokers or
dealers" (as such term is defined in the 1940 Act) that each fund held as of
the end of its most recent fiscal year.
Listed below are the regular broker dealers of each fund whose securities each
fund held as of the end of its most recent fiscal year and the dollar value of
such securities.
DWS ALTERNATIVE ASSET ALLOCATION PLUS VIP
NAME OF REGULAR BROKER OR DEALER OR PARENT
(ISSUER) SECURITIES OF REGULAR BROKER DEALERS
SPDR BARCLAY'S CAPITAL INT'L TREASURY BOND $62,000
DWS BALANCED VIP
NAME OF REGULAR BROKER OR DEALER OR PARENT
(ISSUER) SECURITIES OF REGULAR BROKER DEALERS
1ST SOURCE CORP. $ 26,000
AEGON NV $ 12,000
ALLIANZ SE $ 25,000
ALLIED WORLD ASSURANCE CO. $ 88,000
ALPHA BANK $ 112,000
AMERICAN EXPRESS COMPANY $ 628,000
AMP LIMITED NPV $ 6,000
ANGLO IRISH BANKCORP. PLC $ 0
ASHTON WOODS USA LLC $ 11,000
ASSICURAZIONI GENERALI SPA $ 16,000
AUSTRALIA & NEW ZEALAND BANKING GROUP, $ 11,000
PLC
AVIVA PLC $ 4,000
AXA $ 141,000
BANCO LATINOAMERICANO DE EXPORTACIONES $ 50,000
BANCO SANTANDER, S.A. $ 415,000
THE BANCORP., INC. $ 16,000
BANK OF AMERICA CORP. $2,155,000
I-55
NAME OF REGULAR BROKER OR DEALER OR PARENT
(ISSUER) SECURITIES OF REGULAR BROKER DEALERS
BANK OFMONTREAL $ 5,000
BANK OF NOVA SCOTIA $ 14,000
BANK OF NEW YORK MELLON CORP $ 101,000
BANK OF EAST ASIA $ 2,000
BANK OF YOKOHAMA LTD. $ 5,000
BARCLAYS PLC $ 183,000
BANCO BILBAO VIZCAYA ARGENTA $ 13,000
BANCO POPULAR ESPANOL SA $ 4,000
BGC PARTNERS INC. $ 10,000
BANK OF CYPRUS PCL $ 4,000
PIRAEUS BANK S.A. $ 8,000
BNP PARIBAS $ 246,000
BOC HONG KONG (HOLDINGS) LTD. $ 5,000
BROOKFIELD ASSET MANAGEMENT, INC. $ 7,000
BUFFALO THUNDER DEVELOPMENT AUTHORITY $ 3,000
CAPITAL ONE FINANCIAL CORP $1,068,000
CAPITALAND LTD $ 9,000
CARDINAL FINANCIAL CORP $ 3,000
CANADIAN IMPERIAL BANK OF COMMERCE $ 7,000
CHEUNG KONG (HOLDINGS) LTD $ 17,000
CHINA LIFE INSURANCE CO LTD $ 282,000
CHUO MITSUI TRUST HOLDINGS, INC. $ 3,000
CITIGROUP INC. $2,797,000
COMMONWEALTH BANK OF AUSTRALIA $ 14,000
CREDIT AGRICOLE SA $ 4,000
CREDIT SUISSE GROUP AG $ 211,000
DAIWA SECURITIES GROUP, INC. $ 5,000
DANSKE BANK A/S $ 42,000
DBS GROUP HOLDINGS LTD. $ 22,000
DEUTSCHE BOERSE AG $ 11,000
DEUTSCHE POST AG (REGISTERED) $ 10,000
DEXIA SA $ 6,000
DNB NOR BANK ASA $ 59,000
EFG EUROBANK ERGAS $ 7,000
ERSTE GROUP BANK AG $ 29,000
FORD MOTOR CREDIT CO. $1,097,000
FORTIS $ 133,000
GENERAL ELECTRIC CAPITAL CORP $1,335,000
GENTING SINGAPORE PLC $ 27,000
GMAC LLC $ 130,000
GOLDMAN SACHS GROUP, INC. $ 796,000
GREENLIGHT CAPITAL RE LTD. $ 9,000
I-56
NAME OF REGULAR BROKER OR DEALER OR PARENT
(ISSUER) SECURITIES OF REGULAR BROKER DEALERS
HANG LUNG PROPERTIES LTD. $ 8,000
HANG SENG BANK LTD $ 9,000
HENDERSON LANDDEVELOPMENT CO., $ 7,000
HONG KONG EXCHANGE & CLEARING LTD. $ 12,000
HSBC HOLDINGS PLC $ 240,000
IMMOEAST AG $ 210,000
ING GROEP NV $ 330,000
INSURANCE AUSTRAILIA GROUP LTD. $ 4,000
INTESA SANPAOLO SpA $ 13,000
ISHARES BARCLAYS AGGREGATE BOND FUND $10,527,000
JEFFERIES GROUP, INC. $ 116,000
JPMORGAN CHASE & CO. $ 1,779,000
JULIUS BAER HOLDINGS AG-B $ 4,000
KBC GROEP NV $ 14,000
KBW INC. $ 38,000
KEYCORP $ 369,000
LLOYD'S BANKING GROUP PLC $ 282
M&T BANK CORP. $ 208
MANULIFE FINANCIAL CORP $ 6,000
MARFIN INVESTMENT GROUP SA $ 4,000
MARSHALL & ILSLEY CORP $ 188,000
MEDIOBANCA SPA $ 4,000
METLIFE INC. $ 749,000
MITSUBISHI ESTATE CO., LTD. $ 16,000
MITSUBISHI UFJ FINANCIAL GROUP $ 24,000
MITSUI FUDOSAN CO., LTD. $ 17,000
MITSUI SUMITOMO GROUP $ 8,000
MIZUHO FINANCIAL GROUP, INC. $ 11,000
BANCA MONTE DEI PASCHI DI SIENA SpA $ 3,000
MORGAN STANLEY $ 680,000
MUENCHENER RUECKVERSICHERUNGS- $ 9,000
GESELLSCHAFT AG
NATIONAL BANK OF CANADA $ 6,000
NATIONAL AUSTRALIA BANK LTD $ 13,000
NATIONAL BANK OF GREECE SA $ 17,000
NEW YORK COMMUNITY BANCORP $ 188,000
NOMURA HOLDINGS, INC. $ 16,000
NORDEA BANK AB. $ 26,000
OPPENHEIMER & CO. $ 83,000
ORIX CORP. $ 3,000
OVERSEA-CHINESE BANKING CORP $ 6,000
PARTNERRE LTD. $ 299,000
PARTNERS GROUP HOLDING AG $ 133,000
I-57
NAME OF REGULAR BROKER OR DEALER OR PARENT
(ISSUER) SECURITIES OF REGULAR BROKER DEALERS
PIPER JAFFRAY COMPANIES, INC. $ 81,000
PNC FINANCIAL SERVICES GROUP, INC. $514,000
POHJOLA BANK PLC $ 9,000
POWER CORP. OF CANADA $ 6,000
PRINCIPAL FINANCIAL GROUP INC. $348,000
PROVIDENT FINANCIAL SERVICES, INC. $107,000
PRUDENTIAL FINANCIAL INC. $251,000
QBE INSURANCE GROUP LTD. $ 3,000
RAIFFEISEN INTERNATIONAL BANK-HOLDING $ 15,000
REGIONS FINANCIAL CORP. $290,000
RESONA HOLDINGS $ 3,000
ROYAL BANK OF CANADA $ 16,000
SAMPO OYJ $ 55,000
SIGNATURE BANK $ 16,000
SINGAPORE EXCHANGE $ 6,000
SKANDINAVISKA ENSKILDA BANKEN AB $ 10,000
SOCIETE GENERALE $ 12,000
SOMPO JAPAN INSURANCE, INC. $ 6,000
SOUTHSIDE BANCSHARES $ 71,000
STANDARD CHARTER PLC $ 9,000
SUMITOMO MITSUI FINANCIAL GROUP $ 17,000
SUMITOMO TRUST & BANKING CO., LTD. $ 5,000
SUN HUNG KAI PROPERTIES LTD. $ 15,000
SUN LIFE FINANCIAL, INC. $ 3,000
SVENSKA HANDELSBANKEN SERIES A $ 16,000
SWISS REINSURANCE LTD $ 5,000
T&D HOLDINGS, INC. $ 2,000
TOKIO MARINE HOLDINGS, INC. $ 8,000
TOMPKINS FINANCIAL CORP $ 45,000
TOPDANMARK AS $ 12,000
TORONTO DOMINION BANK $ 13,000
TROPICANA ENTERTAINMENT LLC $ 0
TRUSTCO BANK CORP. NY $ 15,000
TRYGVESTA A/S $ 7,000
UBI BANCA $ 5,000
UBS AG $396,000
UCI HOLDCO, INC. $ 33,000
UNICREDIT SpA $151,000
UNITED OVERSEAS BANK LTD. $ 14,000
VANGUARD HEALTH HOLDING CO. $104,000
VIENNA INSURANCE GROUP $ 10,000
WACHOVIA CORP. $499,000
I-58
NAME OF REGULAR BROKER OR DEALER OR PARENT
(ISSUER) SECURITIES OF REGULAR BROKER DEALERS
WESBANCO INC $ 7,000
WESTPAC BANKING CORP $192,000
WING HANG BANK LTD. $139,000
YADKIN VALLEY FINANCIAL CORP. $ 5,000
ZURICH FINANCIAL SERVICES AG $ 8,000
ARGO GROUP INTERNATIONAL HOLDING $ 12,000
ASHMORE GROUP PLC $138,000
BROADPOINT GLEACHER SECURITIES, INC $ 3,000
BROOKLINE BANCORP, INC $ 84,000
COMMERCE BANCSHARES, INC. $264,000
CVB FINANCIAL CORP. $ 92,000
DAH SING BANKING GROUP LTD. $ 29,000
DIME COMMUNITY BANCSHARES $ 8,000
DISCOVER FINANCIAL SERVICES $257,000
ENDURANCE SPECIALTY HOLDINGS LTD. $ 93,000
EVERCORE PARTNERS INC. $ 15,000
FIRST BUSEY CORP $ 12,000
FIRST DDFIANCE FINANCIALCORP. $ 17,000
FIRST FINANCIAL BANCORP $ 31,000
HELLENIC EXCHANGES SA $ 56,000
HUNTINGTON BANCSHARES, INC. $ 68,000
IBERIABANK CORP. $129,000
ICAP PLC $ 49,000
LAZARD LTD. $ 95,000
LINCOLN NATIONAL CORP. $528,000
MARKETAXESS HOLDINGS, INC. $ 10,000
MIDLAND HOLDING LTD $182,000
NEWALLIANCE BANCSHARES, INC. $145,000
ROYAL BANK OF SCOTLAND PLC. $431,000
S & T BANCORP, INC. $ 17,000
SUNTRUST BANKS, INC. $303,000
SWEDBANK AB $ 3,000
UMB FINANCIAL CORP. $ 8,000
WESTFEILD FINANCIAL, INC. $ 7,000
MONTELIER RE HOLDINGS LTD $ 95,000
SUMITOMO REALTY & DEVELOPMENT CO. LTD $ 94,000
DWS BLUE CHIP VIP
NAME OF REGULAR BROKER OR DEALER OR PARENT
(ISSUER) SECURITIES OF REGULAR BROKER DEALERS
BANK OF AMERICA CORP. $1,047,000
BANK OF NEW YORK MELLON CORP. $ 772,000
I-59
NAME OF REGULAR BROKER OR DEALER OR PARENT
(ISSUER) SECURITIES OF REGULAR BROKER DEALERS
CITIGROUP $ 600,000
COMERICA INC. $ 112,000
DISCOVER FINANCIAL SERVICES $1,022,000
EVEREST RE GROUP LTD. $ 129,000
ARCH CAPITALGROUP LTD. $ 179,000
HSBC HOLDINGS PLC $ 166,000
HUNTINGTON BANCSHARES, INC. $ 105,000
JP MORGAN CHASE $1,963,000
KEYCORP $ 77,000
MARSHALL & ILSLEY CORP $ 355,000
POPULAR, INC. $ 64,000
REGIONS FINANCIAL CORP. $ 471,000
TRAVELERS COS INC COM $ 334,000
UBS A.G. $ 123,000
ALLIED WORLD ASSURANCE CO. $ 152,000
ACE LIMITED $1,361,000
DWS CORE FIXED INCOME VIP
NAME OF REGULAR BROKER OR DEALER OR PARENT
(ISSUER) SECURITIES OF REGULAR BROKER DEALERS
AMERICAN EXPRESS CO. $ 758,000
BANK OF AMERICA CORP. $2,059,000
BARCLAYS BANK $ 291,000
CAPITAL ONE $ 743,000
CITIGROUP $1,028,000
GENERAL ELECTRIC CO. $1,004,000
GOLDMAN SACHS $1,048,000
JP MORGAN CHASE $ 484,000
LINCOLN NATIONAL CORP. $ 286,000
METLIFE ADVISORS, LCC $ 464,000
MORGAN STANELY $ 758,000
NATIONAL RURAL UTILITIES COOPERATIVE $ 265,000
FINANCE
PRINCIPAL FINANCIAL GROUP, INC. $ 359,000
PRUDENTIAL FINANCIAL INC. $ 153,000
ROYAL BANK OF SCOTLAND GROUP PLC (THE) $ 304,000
WACHOVIA $ 451,000
WESTPAC BANKING CORP $ 301,000
I-60
DWS DIVERSIFIED INTERNATIONAL EQUITY VIP
NAME OF REGULAR BROKER OR DEALER OR PARENT
(ISSUER) SECURITIES OF REGULAR BROKER DEALERS
AEGON NV $ 88,000
ALLIANZ SE $181,000
ALPHA BANK $ 41,000
ASSICURAZIONI GENERALI SpA $ 87,000
AUSTRALIA & NEW ZEALAND BANKING GROUP, $ 78,000
PLC
AXA $ 73,000
BANCO SANTANDER SA $217,000
BANK OF MONTREAL $ 53,000
BANK OF NOVA SCOTIA $ 52,000
BARCLAYS PLC $ 52,000
BANCO BILBAO VIZCAYA ARGENTA $ 94,000
BANK OF CYPRUS PCL $ 30,000
PIRAEUS BANK S.A. $ 25,000
BNP PARIBAS $122,000
CAPITALAND LTD $ 59,000
CANADIAN IMPERIAL BANK OF COMMERCE $ 46,000
CHEUNG KONG $155,000
COMMONWEALTH BANK OF AUSTRALIA $ 98,000
COMMERZBANK AG $ 28,000
CREDIT AGRICOLE SA $ 55,000
CREDIT SUISSE $ 98,000
DAIWA SECURITIES GROUP, INC. $ 82,000
DANSKE BANK AS $241,000
DBS GROUP HOLDINGS LTD. $109,000
DEUTSCHE BOERSE AG $ 57,000
DEUTSCHE POST AG (REGISTERED) $ 68,000
DEXIA SA $ 58,000
DNB NOR ASA $367,000
EFG EUROBANK ERGAS $ 49,000
ERSTE GROUP BANK AG $194,000
FORTIS $301,000
GAM HOLDING LTD $ 11,000
GENTING SINGAPORE PLC $154,000
HANG SENG BANK LTD $ 56,000
HONG KONG EXCHANGE & CLEARING LTD. $ 84,000
HSBC HOLDINGS PLC $147,000
IMMOEAST AG $ 55,000
ING GROEP NV $270,000
INTESA SANPAOLO $112,000
INVESTOR AB $ 14,000
I-61
NAME OF REGULAR BROKER OR DEALER OR PARENT
(ISSUER) SECURITIES OF REGULAR BROKER DEALERS
KBC GROEP NV $ 85,000
MANULIFE FINANCIAL CORP $ 52,000
MARFIN INVESTMENT GROUP SA $ 24,000
MITSUBISHI UFJ FINANCIAL GROUP $641,000
MITSUI & CO., LTD. $264,000
MIZUHO FINANCIAL GROUP, INC. $ 65,000
MUENCHENER RUECKVERSICHERUNGS- $ 93,000
GESELLSCHAFT AG
NATIONAL AUSTRALIA BANK LTD $ 63,000
NATIONAL BANK OF GREECE SA $ 92,000
NISHI-NIPPON CITY BANK LTD. $ 32,000
NOMURA HOLDINGS, INC. $126,000
NORDEA BANK AB. $191,000
ORIX CORP. $ 18,000
OVERSEA-CHINESE BANKING CORP $109,000
POHJOLA BANK PLC $ 77,000
QBE INSURANCE GROUP LTD. $ 47,000
RAIFFEISEN INTERNATIONAL BANK-HOLDINGS $ 72,000
RESONA HOLDING, INC. $ 26,000
ROYAL BANK OF CANADA $ 75,000
SAMPO OYJ $341,000
SAPPORO HOKUYO HOLDINGS, INC. $ 56,000
SHIZUOKA BANK LTD $ 17,000
SINGAPORE EXCHANGE $ 41,000
SKANDINAVISKA ENSKILDA BANKEN AB $ 55,000
SOCIETE GENERALE $ 59,000
STANDARD CHARTER BANK $ 42,000
SUMITOMO MITSUI FINANCIAL GROUP $153,000
SUN HUNG KAI PROPERTIES LTD. $119,000
SVENSKA HANDELSBANKEN AB $ 80,000
SWISS REINSURANCE LTD $ 52,000
TOKIO MARINE HOLDINGS, INC. $ 81,000
TOPDANMARK AS $ 56,000
TORONTO DOMINION BANK $ 63,000
TRYGVESTA A/S $ 41,000
UBI BANCA $ 56,000
UBS AG $116,000
UNICREDIT SpA $119,000
UNITED OVERSEAS BANK LTD. $125,000
VIENNA INSURANCE GROUP $ 68,000
WESTPAC BANKING CORP $ 58,000
YAMAGUCHI FINANCIAL GROUP, INC. $ 28,000
ZURICH FINANCIAL SERVICES AG $ 87,000
I-62
DWS DREMAN SMALL MID CAP VALUE VIP
NAME OF REGULAR BROKER OR DEALER OR PARENT
(ISSUER) SECURITIES OF REGULAR BROKER DEALERS
ALLIED WORLD ASSURANCE CO. $3,140,000
ARCH CAPITALGROUP LTD. $2,948,000
ARGO GROUP INTERNATIONAL HOLDING $2,598,000
BANK OF HAWAII CORP $3,198,000
BOK FINANCIAL CORP $3,475,000
ENDURANCE SPECIALTY HOLDINGS LTD. $3,175,000
PLATINUM UNDERWRITERS HOLDINGS LTD $3,290,000
RAYMOND JAMES FINANCIAL, INC. $3,087,000
DWS GLOBAL THEMATIC VIP
NAME OF REGULAR BROKER OR DEALER OR PARENT
(ISSUER) SECURITIES OF REGULAR BROKER DEALERS
ABERDEEN ASSET MANAGEMENT $ 428,000
BANK OF AMERICA CORP $ 794,000
CITIGROUP INC. $ 524,000
EFG-HERMES HOLDING SAE $ 421,000
GOVERNOR & CO. OF THE BANK OF IRELAND $ 224,000
ALPHA BANK AE $ 116,000
COMMERZBANK AG $ 221,000
JPMORGAN CHASE & CO $ 542,000
LEGG MASON, INC. $ 244,000
ERSTE GROUP BANK AG $1,451,000
MUENCHENER RUECKVERSICHERUNGS- $ 327,000
GESELLSCHAFT AG
AMMB HOLDINGS BHD $ 208,000
MIZUHO FINANCIAL GROUP, INC. $ 450,000
BANGKOK BANK PCL $ 278,000
MORGAN STANELY $ 361,000
MITSUBISHI UFJ FINANCIAL GROUP $ 772,000
CHUO MITSUI TRUST HOLDINGS, INC. $ 464,000
SUMITOMO MITSUI FINANCIAL GROUP $ 314,000
NOMURA HOLDINGS, INC. $ 782,000
IOOF HOLDINGS LTD. $ 123,000
SEAMICO SECURITIES PCL $ 81,000
KASIKORNBANK PCL $ 246,000
AKBANK TAS $ 28,000
RAIFFEISEN INTERNATIONAL BANK-HOLDING $ 511,000
LAZARD LTD. $ 494,000
UBS AG $ 918,000
GAGFAH SA $ 104,000
BANCO COMPARTAMOS SA DECV $ 1,000
I-63
NAME OF REGULAR BROKER OR DEALER OR PARENT
(ISSUER) SECURITIES OF REGULAR BROKER DEALERS
MERRILL LYNCH INTERNATIONAL $ 278,000
RENHE COMMERCIAL HOLDINGS $ 269,000
SBERBANK $1,053,000
DWS GOVERNMENT & AGENCY SECURITIES VIP
NAME OF REGULAR BROKER OR DEALER OR PARENT
(ISSUER) SECURITIES OF REGULAR BROKER DEALERS
CITIGROUP $2,804,000
JP MORGAN CHASE $1,008,000
DWS HIGH INCOME VIP
NAME OF REGULAR BROKER OR DEALER OR PARENT
(ISSUER) SECURITIES OF REGULAR BROKER DEALERS
ASHTON WOODS USA LLC $ 214,000
BANK OF AMERICA NA $ 462,000
BUFFALO THUNDER DEVELOPMENT AUTHORITY $ 44,000
CEMEX FINANCE LLC $ 120,000
CEDC FIN CORP INTL $ 675,000
E*TRADE FINANCIAL CORP. $1,645,000
FRESENIUS US FINANCE II, INC $ 462,000
PINNACLE FOODS FINANCE $ 705,000
GMAC LLC $4,405,000
TROPICANA ENTERTAINMENT LLC $ 6,000
UCI HOLDCO, INC. $ 597,000
VANGUARD HEALTH HOLDING CO. I LLC $ 753,000
HELLAS TELECOM $ 570,000
FIBRIA OVERSEAS FINANCE LTD. $ 241,000
FORD MOTOR CREDIT CO. $4,937,000
UPC GERMANY GMBH $1,164,000
FCE BANK PLC $1,289,000
DWS LARGE CAP VALUE VIP
NAME OF REGULAR BROKER OR DEALER OR PARENT
(ISSUER) SECURITIES OF REGULAR BROKER DEALERS
BANK OF AMERICA CORP $2,860,000
JPMORGAN CHASE & CO $3,914,000
KEYCORP $1,051,000
M&T BANK CORP. $1,281,000
MORGAN STANLEY $1,940,000
NEW YORK COMMUNITY BANCORP $1,134,000
PARTNERRE LTD. $2,003,000
REGIONS FINANCIAL CORP. $1,077,000
I-64
NAME OF REGULAR BROKER OR DEALER OR PARENT
(ISSUER) SECURITIES OF REGULAR BROKER DEALERS
SUNTRUST BANK $975,000
DWS MID CAP GROWTH VIP
NAME OF REGULAR BROKER OR DEALER OR PARENT
(ISSUER) SECURITIES OF REGULAR BROKER DEALERS
JEFFERIES GROUP, INC. $157,000
LAZARD LTD. $266,000
NEW YORK COMMUNITY BANCORP $148,000
OCH-ZIFF CAPITAL MANAGEMENT GROUP $224,000
TD AMERITRADE HOLDING CORP. $196,000
DWS MONEY MARKET VIP
NAME OF REGULAR BROKER OR DEALER OR PARENT
(ISSUER) SECURITIES OF REGULAR BROKER DEALERS
ASB FINANCE, LTD $5,499,000
ANGLO IRISH BANK CORP., LTD. $1,999,000
BANK OF NOVA SCOTIA $2,500,000
BARCLAYS BANK PLC $2,000,000
CANADIAN IMPERIAL BANK OF COMMERCE $7,500,000
CITIBANK OMNI MASTER TRUST $4,999,000
COMMONWEALTH BANK OF AUSTRALIA $4,380,000
GOVERNOR & CO. OF THE BANK OF IRELAND $2,300,000
KREDITANSTALT FUER WIEDERAUFBAU $2,500,000
NATIXIS $4,500,000
RABOBANK NEDERLAND $5,803,000
ROYAL BANK OF SCOTLAND PLC. $2,000,000
WESTPAC BANKING CORP $4,500,000
LANDWIRTSCHAFTLICHE RENTENBANK $1,404,000
DWS SMALL CAP GROWTH VIP
NAME OF REGULAR BROKER OR DEALER OR PARENT
(ISSUER) SECURITIES OF REGULAR BROKER DEALERS
DUFF & PHELPS CORP. $409,000
EAST WEST BANCORP, INC $959,000
STIFEL FINANCIAL CORP. $966,000
DWS STRATEGIC INCOME VIP
NAME OF REGULAR BROKER OR DEALER OR PARENT
(ISSUER) SECURITIES OF REGULAR BROKER DEALERS
REPUBLIC OF INDONESIA $482,000
INTERGRAS FINANCE $281,000
I-65
NAME OF REGULAR BROKER OR DEALER OR PARENT
(ISSUER) SECURITIES OF REGULAR BROKER DEALERS
CITIBANK NA $1,326,000
JPMORGAN CHASE & CO $ 706,000
AMERICAN INTERNATIONAL GROUP, INC. $ 280,000
BANK OF AMERICA CORP $ 402,000
BEAR STEARNS ADJUSTABLE RATE $ 283,000
MORTGAGE TRUST
BLACKROCK INC. $ 128,000
CAPITAL ONE CAPITAL $ 351,000
DEPFA ACS BANK $ 879,000
DISCOVER BANK $ 311,000
GENERAL ELECTRIC CAPITAL CORP. $ 275,000
ICICI BANK LTD. $ 284,000
LINCOLN NATIONAL CORP. $ 191,000
MACQUARIE GROUP LTD. $ 361,000
MERRILL LYNCH MORTGAGE INVESTORS $ 438,000
INC.
METLIFE, INC $ 363,000
MORGAN STANLEY $ 332,000
PNC BANK NA $ 191,000
PACIFIC LIFE GLOBAL FUNDING $ 361,000
PRINCIPAL FINANCIAL GROUP INC. $ 208,000
TEACHERS INSURANCE & ANNUITY $ 191,000
ASSOCIATION
USB CAPITAL XIII TRUST $ 147,000
WESTPAC BANKING CORP. $ 286,000
KREDITANSTALT FUER WIEDERAUFBAU $1,483,000
TOYOTA MOTOR CREDIT CORP $1,287,000
ASHTON WOODS USA LLC $ 23,000
BUFFALO THUNDER DEVELOPMENT $ 5,000
AUTHORITY
E*TRADE FINANCIAL CORP $ 112,000
FORD MOTOR CREDIT CO., LLC $ 656,000
GMAC LLC $ 615,000
PINNACLE FOODS FINANCE $ 36,000
TROPICANA ENTERTAINMENT LLC $ 1,000
UCI HOLDCO, INC. $ 65,000
VANGUARD HEALTH HOLDING CO. $ 79,000
HELLAS TELECOMMUNICATIONS $ 235,000
LUXEMBOURG V
FCE BANK PLC $ 144,000
I-66
DWS STRATEGIC VALUE VIP
NAME OF REGULAR BROKER OR DEALER OR PARENT
(ISSUER) SECURITIES OF REGULAR BROKER DEALERS
BANK OF AMERICA CORP $ 9,905,000
THE GOLDMAN SACHS GROUP $ 2,951,000
JPMORGAN CHASE & CO $10,175,000
KEYCORP $ 1,677,000
STATE STREET CORP. $ 3,081,000
THE TRAVELERS COMPANIES, INC. $ 4,175,000
WASHINGTON MUTUAL, INC $ 195,000
DWS TECHNOLOGY VIP
The fund did not hold any securities of its regular brokers or dealers.
DWS TURNER MID CAP GROWTH VIP
NAME OF REGULAR BROKER OR DEALER OR PARENT
(ISSUER) SECURITIES OF REGULAR BROKER DEALERS
FIFTH THIRD BANCORP. $393,000
TD AMERITRADE HOLDING CORP. $535,000
TRANSACTIONS FOR RESEARCH SERVICES
For the most recent fiscal year, each fund allocated the following amount of
transactions, and related commissions, to broker-dealer firms that have been
deemed by the Advisor to provide research services. The provision of research
services was not necessarily a factor in the placement of business with such
firms.
COMMISSIONS PAID
AMOUNT OF TRANSACTIONS ON TRANSACTIONS
FUND WITH RESEARCH FIRMS WITH RESEARCH FIRMS
DWS Alternative Asset Allocation Plus VIP $ 0 $ 0
DWS Balanced VIP $144,009,267 $ 154,541/(1)/
DWS Blue Chip VIP $ 0 $ 0
DWS Core Fixed Income VIP $ 0 $ 0
DWS Diversified International Equity VIP $ 42,924,418 $ 75,484/(1)/
DWS Dreman Small Mid Cap Value VIP $ 0 $ 0
DWS Global Thematic VIP $152,450,131 $ 306,678/(1)/
DWS Government & Agency Securities VIP $ 0 $ 0
DWS High Income VIP $ 0 $ 0
DWS Large Cap Value VIP $ 0 $ 0
DWS Mid Cap Growth VIP $ 21,268,558 $ 34,426/(1)/
DWS Money Market VIP $ 0 $ 0
DWS Small Cap Growth VIP $ 66,012,630 $ 132,331/(1)/
DWS Strategic Income VIP $ 0 $ 0
DWS Strategic Value VIP $ 1,214,727 $ 825/(1)/
DWS Technology VIP $ 0 $ 0
DWS Turner Mid Cap Growth VIP $ 29,986,914 $ 22,673/(1)/
I-67
(1) The fund has commission sharing arrangements (CSA) in place with some
broker-dealers pursuant to which a specified percentage of the total
commissions paid on qualifiying trades are contributed to a CSA pool. The
Advisor may utilize the related commissions in the CSA pool to pay for market
data, third-party research and research from certain other broker-dealers with
whom the Advisor either does not trade or does not trade at significant levels.
I-68
PART I: APPENDIX I-H - INVESTMENT PRACTICES AND TECHNIQUES
Below is a list of headings related to investment policies and techniques which
are further described in Appendix II-G.
DWS ALTERNATIVE ASSET ALLOCATION PLUS VIP
Adjustable Rate Securities
Advance Refunded Bonds
Asset Segregation
Asset-Backed Securities
Asset-Indexed Securities
Auction Rate Securities
Bank and Savings and Loan Obligations
Bank Loans
Borrowing
Brady Bonds
Cash Management Vehicles
Commercial Paper
Common Stocks
Convertible Securities
Credit Enhancement
Custodial Receipts
Depository Receipts
Derivatives
Dollar Roll Transactions
Eurodollar Obligations
Fixed Income Securities
Foreign Currencies
Foreign Investment(s)
Funding Agreements
Gold or Precious Metals
Hedge Funds
High Yield Fixed Income Securities - Junk Bonds
iGAP Overlay Strategy
Illiquid Securities
Impact of Large Redemptions and Purchases of Fund Shares
Indexed Securities
Industrial Development and Pollution Control Bonds
Inflation-Indexed Bonds
Interfund Borrowing and Lending Program
Inverse Floaters
Investment Company Securities
Investment-Grade Bonds
IPO Risk
Lending of Portfolio Securities
Micro-Cap Companies
Mining and Exploration Risks
Mortgage-Backed Securities
Municipal Leases, Certificates of Participation and other Participation
Interests
Municipal Securities
Obligations of Banks and Other Financial Institutions
Participation Interests
Preferred Stock
Private Activity Bonds
Privatized Enterprises
Put Bonds
Real Estate Investment Trusts (REITs)
Repurchase Agreements
Reverse Repurchase Agreements
Securities with Put Rights
Short Sales
Short Sales Against the Box
Short-Term Securities
Small Companies
Sovereign Debt
Stand-by Commitments
Subsidiary Companies
Tax-Exempt Commercial Paper
Tax-Exempt Custodial Receipts
Third Party Puts
To Be Announced (TBA) Purchase Commitments
Trust Preferred Securities
US Government Securities
Variable and Floating Rate Instruments
Warrants
When-Issued and Delayed Delivery Securities
Yields and Ratings
Zero Coupon Securities and Deferred Interest Bonds
DWS BALANCED VIP
Asset Segregation
Asset-Backed Securities
Bank Loans
Brady Bonds
Borrowing
Cash Management Vehicles
Commercial Paper
Common Stocks
Convertible Securities
I-69
Depository Receipts
Derivatives
Direct Debt Instruments
Foreign Investment(s)
High Yield Fixed Income Securities - Junk Bonds
iGAP Overlay Strategy
Impact of Large Redemptions and Purchases of Fund Shares
Inflation-Indexed Bonds
Interfund Borrowing and Lending Program
Inverse Floaters
Investment Company Securities
Investment-Grade Bonds
Lending of Portfolio Securities
Mortgage-Backed Securities
Obligations of Banks and Other Financial Institutions
Privatized Enterprises
Real Estate Investment Trusts (REITs)
Repurchase Agreements
Reverse Repurchase Agreements
Securities as a Result of Exchanges or Workouts
Short Sales Against the Box
Short-Term Securities
Small Companies
Sovereign Debt
Warrants
When-Issued and Delayed Delivery Securities
Zero Coupon Securities and Deferred Interest Bonds
DWS BLUE CHIP VIP
Asset Segregation
Asset-Backed Securities
Brady Bonds
Borrowing
Cash Management Vehicles
Commercial Paper
Common Stocks
Convertible Securities
Depository Receipts
Derivatives
Direct Debt Instruments
Foreign Investment(s)
High Yield Fixed Income Securities - Junk Bonds
Impact of Large Redemptions and Purchases of Fund Shares
Interfund Borrowing and Lending Program
Inverse Floaters
Investment Company Securities
Investment-Grade Bonds
Lending of Portfolio Securities
Mortgage-Backed Securities
Obligations of Banks and Other Financial Institutions
Privatized Enterprises
Real Estate Investment Trusts (REITs)
Repurchase Agreements
Reverse Repurchase Agreements
Short Sales Against the Box
Short-Term Securities
Sovereign Debt
Warrants
Zero Coupon Securities and Deferred Interest Bonds
DWS CORE FIXED INCOME VIP
Asset Segregation
Asset-Backed Securities
Brady Bonds
Borrowing
Cash Management Vehicles
Commercial Paper
Common Stocks
Convertible Securities
Depository Receipts
Derivatives
Direct Debt Instruments
Foreign Investment(s)
High Yield Fixed Income Securities - Junk Bonds
Impact of Large Redemptions and Purchases of Fund Shares
Interfund Borrowing and Lending Program
Inverse Floaters
Investment Company Securities
Investment-Grade Bonds
Lending of Portfolio Securities
Mortgage-Backed Securities
Obligations of Banks and Other Financial Institutions
Privatized Enterprises
Real Estate Investment Trusts (REITs)
Repurchase Agreements
Reverse Repurchase Agreements
Short Sales Against the Box
Short-Term Securities
Sovereign Debt
When-Issued and Delayed Delivery Securities
Zero Coupon Securities and Deferred Interest Bonds
I-70
DWS DIVERSIFIED INTERNATIONAL EQUITY VIP
Asset Segregation
Asset-Backed Securities
Brady Bonds
Borrowing
Cash Management Vehicles
Commercial Paper
Common Stocks
Convertible Securities
Depository Receipts
Derivatives
Direct Debt Instruments
Foreign Investment(s)
High Yield Fixed Income Securities - Junk Bonds
Impact of Large Redemptions and Purchases of Fund Shares
Interfund Borrowing and Lending Program
Inverse Floaters
Investment Company Securities
Investment-Grade Bonds
Lending of Portfolio Securities
Mortgage-Backed Securities
Obligations of Banks and Other Financial Institutions
Privatized Enterprises
Real Estate Investment Trusts (REITs)
Repurchase Agreements
Reverse Repurchase Agreements
Short Sales Against the Box
Short-Term Securities
Sovereign Debt
Warrants
Zero Coupon Securities and Deferred Interest Bonds
DWS DREMAN SMALL MID CAP VALUE VIP
Asset Segregation
Asset-Backed Securities
Brady Bonds
Borrowing
Cash Management Vehicles
Commercial Paper
Common Stocks
Convertible Securities
Depository Receipts
Derivatives
Direct Debt Instruments
Foreign Investment(s)
High Yield Fixed Income Securities - Junk Bonds
Impact of Large Redemptions and Purchases of Fund Shares
Interfund Borrowing and Lending Program
Inverse Floaters
Investment Company Securities
Investment-Grade Bonds
Lending of Portfolio Securities
Mortgage-Backed Securities
Obligations of Banks and Other Financial Institutions
Privatized Enterprises
Real Estate Investment Trusts (REITs)
Repurchase Agreements
Reverse Repurchase Agreements
Short Sales Against the Box
Short-Term Securities
Small Companies
Sovereign Debt
Warrants
Zero Coupon Securites and Deferred Interest Bonds
DWS GLOBAL THEMATIC VIP
Asset Segregation
Asset-Backed Securities
Brady Bonds
Borrowing
Cash Management Vehicles
Commercial Paper
Common Stocks
Convertible Securities
Depository Receipts
Derivatives
Direct Debt Instruments
Foreign Investment(s)
High Yield Fixed Income Securities - Junk Bonds
Impact of Large Redemptions and Purchases of Fund Shares
Interfund Borrowing and Lending Program
Inverse Floaters
Investment Company Securities
Investment-Grade Bonds
Lending of Portfolio Securities
Mortgage-Backed Securities
Obligations of Banks and Other Financial Institutions
Privatized Enterprises
Real Estate Investment Trusts (REITs)
Repurchase Agreements
Reverse Repurchase Agreements
I-71
Short Sales Against the Box
Short-Term Securities
Sovereign Debt
Warrants
When-Issued and Delayed Delivery Securities
Zero Coupon Securities and Deferred Interest Bonds
DWS GOVERNMENT & AGENCY SECURITIES VIP
Asset Segregation
Asset-Backed Securities
Brady Bonds
Borrowing
Cash Management Vehicles
Commercial Paper
Common Stocks
Convertible Securities
Depository Receipts
Derivatives
Direct Debt Instruments
Foreign Investment(s)
High Yield Fixed Income Securities - Junk Bonds
Impact of Large Redemptions and Purchases of Fund Shares
Interfund Borrowing and Lending Program
Inverse Floaters
Investment Company Securities
Investment-Grade Bonds
Lending of Portfolio Securities
Mortgage-Backed Securities
Obligations of Banks and Other Financial Institutions
Privatized Enterprises
Real Estate Investment Trusts (REITs)
Repurchase Agreements
Reverse Repurchase Agreements
Short Sales Against the Box
Short-Term Securities
Sovereign Debt
When-Issued and Delayed Delivery Securities
Warrants
Zero Coupon Securities and Deferred Interest Bonds
DWS HIGH INCOME VIP
Asset Segregation
Asset-Backed Securities
Bank Loans
Brady Bonds
Borrowing
Cash Management Vehicles
Commercial Paper
Common Stocks
Convertible Securities
Depository Receipts
Derivatives
Direct Debt Instruments
Foreign Investment(s)
High Yield Fixed Income Securities - Junk Bonds
Impact of Large Redemptions and Purchases of Fund Shares
Interfund Borrowing and Lending Program
Inverse Floaters
Investment Company Securities
Investment-Grade Bonds
Lending of Portfolio Securities
Mortgage-Backed Securities
Obligations of Banks and Other Financial Institutions
Privatized Enterprises
Real Estate Investment Trusts (REITs)
Repurchase Agreements
Reverse Repurchase Agreements
Securities as a Result of Exchanges or Workouts
Short Sales Against the Box
Short-Term Securities
Sovereign Debt
Warrants
When-Issued and Delayed Delivery Securities
Zero Coupon Securities and Deferred Interest Bonds
DWS LARGE CAP VALUE VIP
Asset Segregation
Asset-Backed Securities
Brady Bonds
Borrowing
Cash Management Vehicles
Commercial Paper
Common Stocks
Convertible Securities
Depository Receipts
Derivatives
Direct Debt Instruments
Foreign Investment(s)
High Yield Fixed Income Securities - Junk Bonds
Impact of Large Redemptions and Purchases of Fund Shares
Interfund Borrowing and Lending Program
I-72
Inverse Floaters
Investment Company Securities
Investment-Grade Bonds
Lending of Portfolio Securities
Mortgage-Backed Securities
Obligations of Banks and Other Financial Institutions
Privatized Enterprises
Real Estate Investment Trusts (REITs)
Repurchase Agreements
Reverse Repurchase Agreements
Short Sales Against the Box
Short-Term Securities
Sovereign Debt
Warrants
Zero Coupon Securities and Deferred Interest Bonds
DWS MID CAP GROWTH VIP
Asset Segregation
Asset-Backed Securities
Brady Bonds
Borrowing
Cash Management Vehicles
Commercial Paper
Common Stocks
Convertible Securities
Depository Receipts
Derivatives
Direct Debt Instruments
Foreign Investment(s)
High Yield Fixed Income Securities - Junk Bonds
Impact of Large Redemptions and Purchases of Fund Shares
Interfund Borrowing and Lending Program
Inverse Floaters
Investment Company Securities
Investment-Grade Bonds
Lending of Portfolio Securities
Mortgage-Backed Securities
Obligations of Banks and Other Financial Institutions
Privatized Enterprises
Real Estate Investment Trusts (REITs)
Repurchase Agreements
Reverse Repurchase Agreements
Short Sales Against the Box
Short-Term Securities
Sovereign Debt
Warrants
When-Issued and Delayed Delivery Securities
Zero Coupon Securities and Deferred Interest Bonds
DWS MONEY MARKET VIP
Asset Segregation
Asset-Backed Securities
Brady Bonds
Borrowing
Cash Management Vehicles
Commercial Paper
Common Stocks
Depository Receipts
Derivatives
Direct Debt Instruments
Foreign Investment(s)
High Yield Fixed Income Securities - Junk Bonds
Impact of Large Redemptions and Purchases of Fund Shares
Interfund Borrowing and Lending Program
Investment Company Securities
Investment-Grade Bonds
Maintenance of $1.00 Net Asset Value, Credit Quality and Portfolio Maturity
(for Money Market funds only)
Mortgage-Backed Securities
Obligations of Banks and Other Financial Institutions
Privatized Enterprises
Real Estate Investment Trusts (REITs)
Repurchase Agreements
Sovereign Debt
Variable and Floating Rate Instruments
Zero Coupon Securities and Deferred Interest Bonds
DWS SMALL CAP GROWTH VIP
Asset Segregation
Asset-Backed Securities
Brady Bonds
Borrowing
Cash Management Vehicles
Commercial Paper
Common Stocks
Convertible Securities
Depository Receipts
Derivatives
Direct Debt Instruments
Foreign Investment(s)
High Yield Fixed Income Securities - Junk Bonds
I-73
Impact of Large Redemptions and Purchases of Fund Shares
Interfund Borrowing and Lending Program
Inverse Floaters
Investment Company Securities
Investment-Grade Bonds
Lending of Portfolio Securities
Mortgage-Backed Securities
Obligations of Banks and Other Financial Institutions
Privatized Enterprises
Real Estate Investment Trusts (REITs)
Repurchase Agreements
Reverse Repurchase Agreements
Short Sales Against the Box
Short-Term Securities
Small Companies
Sovereign Debt
Warrants
When-Issued and Delayed Delivery Securities
Zero Coupon Securities and Deferred Interest Bonds
DWS STRATEGIC INCOME VIP
Asset Segregation
Asset-Backed Securities
Bank Loans
Brady Bonds
Borrowing
Cash Management Vehicles
Commercial Paper
Common Stocks
Convertible Securities
Depository Receipts
Derivatives
Direct Debt Instruments
Foreign Investment(s)
High Yield Fixed Income Securities - Junk Bonds
iGAP Overlay Strategy
Impact of Large Redemptions and Purchases of Fund Shares
Interfund Borrowing and Lending Program
Inverse Floaters
Investment Company Securities
Investment-Grade Bonds
Lending of Portfolio Securities
Mortgage-Backed Securities
Obligations of Banks and Other Financial Institutions
Privatized Enterprises
Real Estate Investment Trusts (REITs)
Repurchase Agreements
Reverse Repurchase Agreements
Securities as a Result of Exchanges or Workouts
Short Sales Against the Box
Short-Term Securities
Sovereign Debt
Warrants
When-Issued and Delayed Delivery Securities
Zero Coupon Securities and Deferred Interest Bonds
DWS STRATEGIC VALUE VIP
Asset Segregation
Asset-Backed Securities
Brady Bonds
Borrowing
Cash Management Vehicles
Commercial Paper
Common Stocks
Convertible Securities
Depository Receipts
Derivatives
Direct Debt Instruments
Foreign Investment(s)
High Yield Fixed Income Securities - Junk Bonds
Impact of Large Redemptions and Purchases of Fund Shares
Interfund Borrowing and Lending Program
Inverse Floaters
Investment Company Securities
Investment-Grade Bonds
Lending of Portfolio Securities
Mortgage-Backed Securities
Obligations of Banks and Other Financial Institutions
Privatized Enterprises
Real Estate Investment Trusts (REITs)
Repurchase Agreements
Reverse Repurchase Agreements
Short Sales Against the Box
Short-Term Securities
Sovereign Debt
Warrants
Zero Coupon Securities and Deferred Interest Bonds
DWS TECHNOLOGY VIP
Asset Segregation
Asset-Backed Securities
I-74
Brady Bonds
Borrowing
Cash Management Vehicles
Commercial Paper
Common Stocks
Convertible Securities
Depository Receipts
Derivatives
Direct Debt Instruments
Foreign Investment(s)
High Yield Fixed Income Securities - Junk Bonds
Impact of Large Redemptions and Purchases of Fund Shares
Interfund Borrowing and Lending Program
Inverse Floaters
Investment Company Securities
Investment-Grade Bonds
Lending of Portfolio Securities
Mortgage-Backed Securities
Obligations of Banks and Other Financial Institutions
Privatized Enterprises
Real Estate Investment Trusts (REITs)
Repurchase Agreements
Reverse Repurchase Agreements
Short Sales Against the Box
Short-Term Securities
Sovereign Debt
Warrants
When-Issued and Delayed Delivery Securities
Zero Coupon Securities and Deferred Interest Bonds
DWS TURNER MID CAP GROWTH VIP
Asset Segregation
Asset-Backed Securities
Brady Bonds
Borrowing
Cash Management Vehicles
Commercial Paper
Common Stocks
Convertible Securities
Depository Receipts
Derivatives
Direct Debt Instruments
Foreign Investment(s)
High Yield Fixed Income Securities - Junk Bonds
Impact of Large Redemptions and Purchases of Fund Shares
Interfund Borrowing and Lending Program
Inverse Floaters
Investment Company Securities
Investment-Grade Bonds
Lending of Portfolio Securities
Mortgage-Backed Securities
Obligations of Banks and Other Financial Institutions
Privatized Enterprises
Real Estate Investment Trusts (REITs)
Repurchase Agreements
Reverse Repurchase Agreements
Short Sales Against the Box
Short-Term Securities
Sovereign Debt
Warrants
When-Issued and Delayed Delivery Securities
Zero Coupon Securities and Deferred Interest Bonds
I-75
PART I: APPENDIX I-I - ADDITIONAL INFORMATION
FUND CLASS CUSIP NUMBER
DWS Alternative Asset Allocation Plus VIP Class A 23338H370
Fiscal Year End: 12/31 Class B 23338H362
DWS Balanced VIP Class A 23338H685
Fiscal Year End: 12/31
DWS Blue Chip VIP Class A 23338H305
Fiscal Year End: 12/31 Class B 23338H404
DWS Core Fixed Income VIP Class A 23338H826
Fiscal Year End: 12/31
DWS Diversified International Equity VIP Class A 23338H842
Fiscal Year End: 12/31
DWS Dreman Small Mid Cap Value VIP Class A 23338H750
Fiscal Year End: 12/31 Class B 23338H743
DWS Global Thematic VIP Class A 23338H701
Fiscal Year End: 12/31 Class B 23338H800
DWS Government & Agency Securities VIP Class A 23338H883
Fiscal Year End: 12/31 Class B 23338H875
DWS High Income VIP Class A 23338H867
Fiscal Year End: 12/31 Class B 23338H859
DWS Large Cap Value VIP Class A 23338H503
Fiscal Year End: 12/31 Class B 23338H602
DWS Mid Cap Growth VIP Class A 23338H107
Fiscal Year End: 12/31
DWS Money Market VIP Class A 23338H792
Fiscal Year End: 12/31
DWS Small Cap Growth VIP Class A 23338H776
Fiscal Year End: 12/31
DWS Strategic Income VIP Class A 23338H735
Fiscal Year End: 12/31
I-76
FUND CLASS CUSIP NUMBER
DWS Strategic Value VIP Class A 23338H628
Fiscal Year End: 12/31 Class B 23338H610
DWS Technology VIP Class A 23338H719
Fiscal Year End: 12/31 Class B 23338H693
DWS Turner Mid Cap Growth VIP Class A 23338H578
Fiscal Year End: 12/31
I-77
STATEMENT OF ADDITIONAL INFORMATION (SAI) - PART II
PAGE
Part II................................................................................... II-1
Management of the Funds................................................................. II-1
Board Members.......................................................................... II-6
Fund Organization....................................................................... II-11
Purchase and Redemption of Shares....................................................... II-17
Purchases.............................................................................. II-18
Redemptions............................................................................ II-22
Distribution and Service Agreements and Plans........................................... II-32
Investments............................................................................. II-38
General Investment Practices and Techniques............................................ II-38
Portfolio Transactions.................................................................. II-38
Portfolio Holdings Information.......................................................... II-40
Net Asset Value......................................................................... II-41
Proxy Voting Guidelines................................................................. II-45
Miscellaneous........................................................................... II-45
Ratings Of Investments.................................................................. II-45
Part II: Appendix II-A - Board Members and Officers..................................... II-51
Part II: Appendix II-B - Portfolio Management Compensation.............................. II-56
Part II: Appendix II-C - Fee Rates of Service Providers................................. II-63
Part II: Appendix II-D - Financial Services Firms' Compensation......................... II-76
Part II: Appendix II-E - Firms With Which Deutsche Asset Management Has Revenue Sharing II-80
Arrangements
Part II: Appendix II-F - Class A Sales Charge Schedule.................................. II-83
Part II: Appendix II-G - Investment Practices and Techniques............................ II-85
Part II: Appendix II-H - Taxes.......................................................... II-134
Part II: Appendix II-I - Proxy Voting Guidelines........................................ II-150
PART II
Part II of this SAI includes policies, investment techniques and information
that apply to the DWS funds. Unless otherwise noted, the use of the term "fund"
applies to all funds in the DWS funds complex.
MANAGEMENT OF THE FUNDS
INVESTMENT ADVISOR. DIMA, with headquarters at 345 Park Avenue, New York, New
York, is the investment advisor for each fund. Under the oversight of the
Board, DIMA on behalf of a fund makes the investment decisions, buys and sells
securities and conducts research that leads to these purchase and sale
decisions. DIMA manages the fund's daily investment and business affairs
subject to the policies established by the Board. DIMA and its predecessors
have more than 80 years of experience managing mutual funds.
DIMA is an indirect, wholly-owned subsidiary of Deutsche Bank AG, a
multi-national financial services company with limited liability organized
under the laws of the Federal Republic of Germany. As a result, DIMA, which is
part of DeAM, is affiliated with a variety of entities that provide, and/or
engage in commercial banking, insurance, brokerage, investment banking,
financial advisory, broker-dealer activities (including sales and trading),
hedge funds, real estate and private equity investing, in addition to the
provision of investment management services to institutional and individual
investors. DWS Investments is part of the Asset Management division of Deutsche
Bank AG and, within the US, represents the retail asset management activities
of Deutsche Bank AG, Deutsche Bank Trust Company Americas, DIMA and DWS Trust
Company.
DIMA provides investment advisory services to many individuals and
institutions, including insurance companies, corporations, and financial and
banking organizations, as well as providing investment advice to open- and
closed-end registered investment companies.
DeAM is the marketing name in the US for the asset management activities of
Deutsche Bank AG, DIMA, Deutsche Bank Trust Company Americas and DWS Trust
Company. DeAM is a global asset management organization that offers a wide
range of investing expertise and resources, including hundreds of portfolio
managers and analysts and an office network that reaches the world's major
investment centers. This well-resourced global investment platform brings
together a wide variety of experience and investment insight, across
industries, regions, asset classes and investing styles.
In some instances, the investments for a fund may be managed by the same
individuals who manage one or more other mutual funds advised by DIMA that have
similar names, objectives and investment styles. A fund may differ from these
other mutual funds in size, cash flow patterns, distribution arrangements,
expenses and tax matters. Accordingly, the holdings and performance of a fund
may be expected to vary from those of other mutual funds.
Certain investments may be appropriate for a fund and also for other clients
advised by DIMA. Investment decisions for a fund and other clients are made
with a view to achieving their respective investment objectives and after
consideration of such factors as their current holdings, availability of cash
for investment and the size of their investments generally. Frequently, a
particular security may be bought or sold for only one client or in different
amounts and at different times for more than one but less than all clients.
Likewise, a particular security may be bought for one or more clients when one
or more other clients are selling the security. In addition, purchases or sales
of the same security may be made for two or more clients on the same day. In
such event, such transactions will be allocated among the clients in a manner
believed by DIMA to be equitable to each. In some cases, this procedure could
have an adverse effect on the price or amount of the securities purchased or
sold by a fund. Purchase and sale orders for a fund may be combined with those
of other clients of DIMA in the interest of achieving the most favorable net
results to a fund.
DIMA, its parent or its subsidiaries, or affiliates may have deposit, loan and
other commercial banking relationships with the issuers of obligations which
may be purchased on behalf of a fund, including outstanding loans to such
issuers which could be repaid in whole or in part with the proceeds of
securities so purchased. Such affiliates deal, trade and invest for their own
accounts in such obligations and are among the leading dealers of various types
of such obligations. DIMA has informed a fund that, in making its investment
decisions, it does not obtain or use material inside information in its
possession or in the possession of any of its affiliates. In making investment
recommendations for a fund, DIMA will not inquire or take into consideration
whether an
II-1
issuer of securities proposed for purchase or sale by a fund is a customer of
DIMA, its parent or its subsidiaries or affiliates. Also, in dealing with its
customers, the Advisor, its parent, subsidiaries, and affiliates will not
inquire or take into consideration whether securities of such customers are
held by any fund managed by DIMA or any such affiliate.
Officers and employees of the Advisor from time to time may have transactions
with various banks, including a fund's custodian bank. It is the Advisor's
opinion that the terms and conditions of those transactions which have occurred
were not influenced by existing or potential custodial or other fund
relationships.
From time to time, DIMA, Deutsche Bank AG or their affiliates may at their sole
discretion invest their own assets in shares of a fund for such purposes it
deems appropriate, including investments designed to assist in the management
of a fund. Any such investment may be hedged by DIMA, Deutsche Bank AG or their
affiliates and, in that event, the return on such investment, net of the effect
of the hedge, would be expected to differ from the return of a fund. DIMA,
Deutsche Bank AG or their affiliates have no obligation to make any investment
in a fund and the amount of any such investment may or may not be significant
in comparison to the level of assets of a fund. In the event that such an
investment is made, except as otherwise required under the 1940 Act, DIMA,
Deutsche Bank AG or their affiliates would be permitted to redeem the
investment at such time that they deem appropriate.
CONSULTANTS. DWS Health Care Fund and DWS Health Care VIP: Thomas E. Bucher,
CFA provides consulting services to DIMA in connection with the investment
management services it provides to the fund. Mr. Bucher is employed by Deutsche
Asset Management International GmbH, Mainzer Landstrasse 178-190, 60325
Frankfurt am Main, Germany. Deutsche Asset Management International GmbH is an
investment advisor registered with the U.S. Securities and Exchange Commission.
Deutsche Asset Management International GmbH is an affiliate of DIMA and a
subsidiary of Deutsche Bank AG.
TERMS OF THE INVESTMENT MANAGEMENT AGREEMENTS. Pursuant to the applicable
Investment Management Agreement, DIMA provides continuing investment management
of the assets of a fund. In addition to the investment management of the assets
of a fund, the Advisor determines the investments to be made for each fund,
including what portion of its assets remain uninvested in cash or cash
equivalents, and with whom the orders for investments are placed, consistent
with a fund's policies as stated in its prospectus and SAI, or as adopted by a
fund's Board. DIMA will also monitor, to the extent not monitored by a fund's
administrator or other agent, a fund's compliance with its investment and tax
guidelines and other compliance policies.
DIMA provides assistance to a fund's Board in valuing the securities and other
instruments held by a fund, to the extent reasonably required by valuation
policies and procedures that may be adopted by a fund.
Pursuant to the Investment Management Agreement, (unless otherwise provided in
the agreement or as determined by a fund's Board and to the extent permitted by
applicable law), DIMA pays the compensation and expenses of all the Board
members, officers, and executive employees of a fund, including a fund's share
of payroll taxes, who are affiliated persons of DIMA.
DIMA may enter into arrangements with affiliates and third party service
providers to perform various administrative, back-office and other services.
Such service providers may be located in the US or in non-US jurisdictions. The
costs and expenses of such arrangements are borne by DIMA, not by a fund.
The Investment Management Agreement provides that a fund, except as noted
below, is generally responsible for expenses that include, but are not limited
to: fees payable to the Advisor; outside legal, accounting or auditing
expenses, including with respect to expenses related to negotiation,
acquisition or distribution of portfolio investments; maintenance of books and
records that are maintained by a fund, a fund's custodian, or other agents of a
fund; taxes and governmental fees; fees and expenses of a fund's accounting
agent, custodian, sub-custodians, depositories, transfer agents, dividend
reimbursing agents and registrars; payment for portfolio pricing or valuation
services to pricing agents, accountants, bankers and other specialists, if any;
brokerage commissions or other costs of acquiring or disposing of any portfolio
securities or other instruments of a fund; and litigation expenses and other
extraordinary expenses not incurred in the ordinary course of a fund's
business.
DWS S&P 500 Plus Fund pays DIMA a single fee (Unitary Fee) under the Investment
Management Agreement and Unitary Fee Agreement (UFA) that covers not only
DIMA's investment management services, but also all of the fund's day-to-day
expenses in the ordinary course of business, except as noted below. Except as
determined by the Board and to the extent permitted by applicable
II-2
law, DIMA is responsible under the UFA for the payment of all of the fund's
day-to-day operating expenses other than distribution fees and expenses (e.g.,
sales charges and 12b-1 fees), brokerage and other portfolio trading expenses
and taxes, as well as extraordinary expenses (as determined by the Board). DIMA
will pay, among other expenses, the fees of the fund's custodian,
administrator, transfer agent and other service providers to the fund. DIMA
will pay the compensation of all Board members, officer and executive employees
of the fund who are affiliated persons of DIMA. DIMA will also reimburse the
fund for the fees and expenses of the Independent Board Members and
Trustee/Director Legal Counsel, and for the fees of the independent
accountants.
For Money Market Portfolio, DWS Dreman Mid Cap Value Fund, DWS Dreman Small Cap
Value Fund, and DWS Strategic Value Fund, the Investment Management Agreement
also provides that DIMA shall render administrative services (not otherwise
provided by third parties) necessary for a fund's operation as an open-end
investment company including, but not limited to, preparing reports and notices
to the Board and shareholders; supervising, negotiating contractual
arrangements with, and monitoring various third-party service providers to the
Registrant (such as the Registrant's transfer agent, pricing agents, custodian,
accountants and others); preparing and making filings with the SEC and other
regulatory agencies; assisting in the preparation and filing of the
Registrant's federal, state and local tax returns; preparing and filing the
Registrant's federal excise tax returns; assisting with investor and public
relations matters; monitoring the valuation of securities and the calculation
of net asset value; monitoring the registration of shares of the Registrant
under applicable federal and state securities laws; maintaining the
Registrant's books and records to the extent not otherwise maintained by a
third party; assisting in establishing accounting policies of the Registrant;
assisting in the resolution of accounting and legal issues; establishing and
monitoring the Registrant's operating budget; processing the payment of the
Registrant's bills; assisting the Registrant in, and otherwise arranging for,
the payment of distributions and dividends; and otherwise assisting the
Registrant in the conduct of its business, subject to the direction and control
of the Board.
On behalf of Money Market Portfolio, DWS Dreman Mid Cap Value Fund, DWS Dreman
Small Cap Value Fund, and DWS Strategic Value Fund, DIMA may enter into
arrangements with affiliates and third party service providers to perform
various administrative, back-office and other services relating to client
accounts. Such service providers may be located in the US or in non-US
jurisdictions. Pursuant to a sub-administration agreement between DIMA and
State Street Bank & Trust Company (SSB), DIMA has delegated certain
administrative functions for each of these funds to SSB under the Investment
Management Agreement. The costs and expenses of such delegation are borne by
DIMA, not by a fund.
The Investment Management Agreement allows DIMA to delegate any of its duties
under the Investment Management Agreement to a sub-advisor, subject to a
majority vote of the Board, including a majority of the Board who are not
interested persons of a fund, and, if required by applicable law, subject to a
majority vote of a fund's shareholders.
The Investment Management Agreement provides that DIMA shall not be liable for
any error of judgment or mistake of law or for any loss suffered by a fund in
connection with matters to which the agreement relates, except a loss resulting
from willful malfeasance, bad faith or gross negligence on the part of DIMA in
the performance of its duties or from reckless disregard by DIMA of its
obligations and duties under the agreement. The Investment Management Agreement
may be terminated at any time, without payment of penalty, by either party or
by vote of a majority of the outstanding voting securities of a fund on 60
days' written notice.
The Investment Management Agreement continues in effect from year to year only
if its continuance is approved annually by the vote of a majority of the Board
Members who are not parties to such agreement or interested persons of any such
party, cast in person at a meeting called for the purpose of voting on such
approval, and either by a vote of the Board or of a majority of the outstanding
voting securities of a fund.
Under the Investment Management Agreement, a fund, except as otherwise noted,
pays DIMA a management fee calculated daily based on the prior day's net assets
and then aggregated for a particular month. For Money Market Portfolio, a
series of Cash Account Trust, DWS Dreman Mid Cap Value Fund, DWS Dreman Small
Cap Value Fund, and DWS Strategic Value Fund, the management fee paid to DIMA
is calculated and payable monthly based on the average daily net assets for the
particular month. The annual management fee rate for each fund, except for DWS
S&P 500 Plus Fund, is set forth in PART II - APPENDIX II-C.
II-3
Under the Investment Management Agreement between DWS S&P 500 Plus Fund and
DIMA, a fund pays DIMA a Unitary Fee calculated daily and payable monthly equal
to a base fee rate that beginning January 1, 2010 will be adjusted based upon
the performance of a fund relative to a benchmark as further described in PART
II - APPENDIX II-C.
The management fee or Unitary Fee is payable monthly, provided that a fund will
make such interim payments as may be requested by DIMA not to exceed 75% of the
amount of the fee then accrued on the books of a fund and unpaid.
Under a separate agreement between Deutsche Bank AG and the funds, Deutsche
Bank AG has granted a license to the funds to utilize the trademark "DWS."
SUB-ADVISORS (APPLICABLE ONLY TO THOSE FUNDS THAT HAVE SUB-ADVISORY
ARRANGEMENTS AS DESCRIBED IN PART I). Each Sub-Advisor serves as a sub-advisor
to a fund pursuant to the terms of a sub-advisor agreement between it and DIMA
(Sub-Advisory Agreement).
Aberdeen Asset Management Inc. (AAMI), 1735 Market Street, Philadelphia, PA
19103, serves as a Sub-Advisor of a portion of the assets for DWS Lifecycle
Long Range Fund. AAMI is an investment advisor registered with the SEC. AAMI is
a direct wholly owned subsidiary of Aberdeen Asset Management PLC, the parent
company of an asset management group formed in 1983. AAMI provides a full range
of international investment advisory services to institutional and retail
clients.
Deutsche Asset Management International GmbH (DeAMi), Mainzer Landstrasse
178-190, 60325 Frankfurt am Main, Germany, serves as a Sub-Advisor of all or a
portion of the assets of certain funds. DeAMi is an investment advisor
registered with the SEC and is an affiliate of DIMA and a subsidiary of
Deutsche Bank AG.
Dreman Value Management, L.L.C. (Dreman), 520 East Cooper Avenue Suite 230-4,
Aspen, Colorado 81611, serves as a Sub-Advisor of all the assets of certain
funds. Dreman was formed in April 1977 and is an investment advisor registered
with the SEC. DVM is controlled by David Dreman.
Northern Trust Investments, N.A. (NTI), 50 South LaSalle Street, Chicago, IL
60603, serves as a Sub-Advisor of all the assets of certain funds. NTI is a
national banking association and an investment advisor registered under the
1940 Act. NTI is a subsidiary of The Northern Trust Company (TNTC). TNTC is an
Illinois state chartered banking organization and a member of the Federal
Reserve System. Formed in 1889, TNTC administers and manages assets for
individuals, personal trusts, defined contribution and benefit plans and other
institutional and corporate clients. TNTC is the principal subsidiary of
Northern Trust Corporation, a company that is regulated by the Board of
Governors of the Federal Reserve System as a financial holding company under
the U.S. Bank Holding Company Act of 1956, as amended.
Global Thematic Partners, LLC, 681 Fifth Avenue, New York, NY 10022, serves as
Sub-Advisor to certain funds. Global Thematic Partners commenced operations in
July 2010 and is an investment advisor registered under the 1940 Act.
QS Investors, LLC (QS Investors) 880 Third Avenue, 7th Floor, New York, NY
10017, serves as a Sub-Advisor of all or a portion of the assets of certain
funds. QS Investors manages a range of quantitative investment strategies and
assists clients with investment solutions that leverage expertise in research,
portfolio management, and quantitative analysis. QS Investors commenced
operations in August 2010 and is an investment advisor registered with the SEC.
RREEF America L.L.C. (RREEF), 875 North Michigan Avenue, 41st Floor, Chicago,
Illinois 60611, serves as a Sub-Advisor of all or a portion of the assets of
certain funds. RREEF is an investment advisor registered with the SEC. RREEF is
an affiliate of DIMA and a subsidiary of Deutsche Bank AG. RREEF has provided
real estate investment management services to institutional investors since
1975 and has been an investment advisor of real estate securities since 1993.
Turner Investment Partners, Inc. (Turner), 1205 Westlakes Drive, Suite 100,
Berwyn, PA 19312, serves as a Sub-Advisor to DWS Turner Mid Cap VIP. Turner is
an investment advisor registered with the SEC and is controlled by Robert E.
Turner and Mark D. Turner.
TERMS OF THE SUB-ADVISORY AGREEMENTS. Pursuant to the terms of the applicable
Sub-Advisory Agreement, a Sub-Advisor makes the investment decisions, buys and
sells securities, and conducts the research that leads to these purchase and
sale decisions for a fund. A Sub-Advisor is also responsible for selecting
brokers and dealers to execute portfolio transactions and for negotiating
brokerage commissions and dealer charges on behalf of a fund. Under the terms
of the Sub-Advisory Agreement, a Sub-Advisor manages the investment and
II-4
reinvestment of a fund's assets and provides such investment advice, research
and assistance as DIMA may, from time to time, reasonably request.
Each Sub-Advisory Agreement provides that the Sub-Advisor will not be liable
for any error of judgment or mistake of law or for any loss suffered by a fund
in connection with matters to which the Sub-Advisory Agreement relates, except
a loss resulting from (a) the sub-advisor causing a fund to be in violation of
any applicable federal or state law, rule or regulation or any investment
policy or restriction set forth in a fund's prospectus or as may be provided in
writing by the Board or DIMA, or (b) willful misconduct, bad faith or gross
negligence on the part of the Sub-Advisor in the performance of its duties or
from reckless disregard by the Sub-Advisor of its obligations and duties under
the Sub-Advisory Agreement.
A Sub-Advisory Agreement continues from year to year only as long as such
continuance is specifically approved at least annually (a) by a majority of the
Board Members who are not parties to such agreement or interested persons of
any such party, and (b) by the shareholders or the Board of the Registrant. A
Sub-Advisory Agreement may be terminated at any time upon 60 days' written
notice by DIMA or by the Board of the Registrant or by majority vote of the
outstanding shares of a fund, and will terminate automatically upon assignment
or upon termination of a fund's Investment Management Agreement.
Under the Sub-Advisory Agreements between DIMA and the Sub-Advisors, DIMA, not
the fund, pays each Sub-Advisor a sub-advisory fee based on the percentage of
the assets overseen by the Sub-Advisor or based on a percentage of the fee
received by DIMA from a fund. The Sub-Advisor fee is paid directly by DIMA at
specific rates negotiated between DIMA and the Sub-Advisor. No fund is
responsible for paying the Sub-Advisor.
SUB-SUBADVISORS (APPLICABLE ONLY TO THOSE FUNDS THAT HAVE SUB-SUBADVISORY
ARRANGEMENTS AS DESCRIBED IN PART I). Each Sub-Subadvisor serves as a
sub-subadvisor with respect to a fund pursuant to the terms of a sub-subadvisor
agreement between it and the Sub-Advisor (Sub-Subadvisory Agreement).
Deutsche Alternatives Asset Management (Global) Limited (DAAM Global), formerly
known as RREEF Global Advisors Limited (RGAL), 1 Great Winchester Street,
London, United Kingdom, EC2N 2DB, serves as Sub-Subadvisor to a fund. DAAM
Global is an investment advisor registered with the SEC. In addition, DAAM
Global is an affiliate of DIMA and an indirect, wholly owned subsidiary of
Deutsche Bank AG.
Deutsche Asset Management (Hong Kong) Limited (DeAM Hong Kong), 48/F Cheung
Kong Center, 2 Queen's Road Central, Hong Kong, China, serve as Sub-Subadvisors
to a fund. DeAM Hong Kong is an investment advisor registered with the SEC. In
addition, DeAM Hong Kong is an affiliate of DIMA and an indirect, wholly owned
subsidiary of Deutsche Bank AG.
Deutsche Investments Australia Limited (DIAL), Level 16, 126 Phillip Street,
Sydney NSW 200, Australia, serve as Sub-Subadvisors to a fund. DIAL is an
investment advisor registered with the SEC. In addition, DIAL is an affiliate
of DIMA and an indirect, wholly owned subsidiary of Deutsche Bank AG.
TERMS OF THE SUB-SUBADVISORY AGREEMENT. Pursuant to the terms of the applicable
Sub-Subadvisory Agreement and under the oversight of the Board, DIMA and the
Sub-Advisor, the Sub-Subadvisors provide investment management services with
respect to a fund's assets related to specific foreign markets and provides
such investment advice, research and assistance as the Sub-Advisor may, from
time to time, reasonably request. The Sub-Advisor allocates, and reallocates as
it deems appropriate, each of a fund's assets among the Sub-Subadvisors. A
Sub-Subadvisor is also responsible for selecting brokers and dealers to execute
portfolio transactions and for negotiating brokerage commissions and dealer
charges on behalf of a fund. Under the terms of the Sub-Subadvisory Agreement,
a Sub-Subadvisor manages the investment and reinvestment of a portion of a
fund's assets.
Each Sub-Subadvisory Agreement provides that the Sub-Subadvisor shall not be
subject to any liability for any act or omission in the course of providing
investment management services to a fund, except a loss resulting from willful
misconduct, bad faith or gross negligence on the part of the Sub-Subadvisor in
the performance of its duties or from reckless disregard by the Sub-Subadvisor
of its obligations and duties under the Sub-Subadvisory Agreement.
A Sub-Subadvisory Agreement continues from year to year only as long as such
continuance is specifically approved at least annually (a) by a majority of the
Board Members who are not parties to such agreement or interested persons of
any such party, and (b) by the shareholders or the Board of the
Trust/Corporation. A
II-5
Sub-Subadvisory Agreement may be terminated at any time upon 60 days' written
notice by the Board of the Trust/Corporation or by majority vote of the
outstanding shares of a fund, and will terminate automatically upon assignment
or upon termination of a fund's Sub-Advisory Agreement.
Under the Sub-Subadvisory Agreements, the Sub-Advisor, not a fund, pays each
Sub-Subadvisor a sub-subadvisory fee based on the percentage of the assets
overseen by the Sub-Subadvisor from the fee received by the Sub-Advisor from
DIMA. The Sub-Subadvisor fee is paid directly by the Sub-Advisor at specific
rates negotiated between the Sub-Advisor and the Sub-Subadvisor. No fund is
responsible for paying the Sub-Subadvisor.
AGREEMENT TO INDEMNIFY INDEPENDENT BOARD MEMBERS FOR CERTAIN EXPENSES. In
connection with litigation or regulatory action related to possible improper
market timing or other improper trading activity or possible improper marketing
and sales activity in certain DWS funds (Affected Funds), DIMA has agreed to
indemnify and hold harmless the Affected Funds (Fund Indemnification Agreement)
against any and all loss, damage, liability and expense, arising from market
timing or marketing and sales matters alleged in any enforcement actions
brought by governmental authorities involving or potentially affecting the
Affected Funds or DIMA (Enforcement Actions) or that are the basis for private
actions brought by shareholders of the Affected Funds against the Affected
Funds, their directors and officers, DIMA and/or certain other parties (Private
Litigation), or any proceedings or actions that may be threatened or commenced
in the future by any person (including governmental authorities), arising from
or similar to the matters alleged in the Enforcement Actions or Private
Litigation. In recognition of its undertaking to indemnify the Affected Funds
and in light of the rebuttable presumption generally afforded to independent
directors/trustees of investment companies that they have not engaged in
disabling conduct, DIMA has also agreed, subject to applicable law and
regulation, to indemnify certain (or, with respect to certain Affected Funds,
all) of the Independent Board Members of the Affected Funds, against certain
liabilities the Independent Board Members may incur from the matters alleged in
any Enforcement Actions or Private Litigation or arising from or similar to the
matters alleged in the Enforcement Actions or Private Litigation, and advance
expenses that may be incurred by the Independent Board Members in connection
with any Enforcement Actions or Private Litigation. DIMA is not, however,
required to provide indemnification and advancement of expenses: (1) with
respect to any proceeding or action which the Affected Funds' Board determines
that the Independent Board Members ultimately would not be entitled to
indemnification or (2) for any liability of the Independent Board Members or
their shareholders to which the Independent Board Member would otherwise be
subject by reason of willful misfeasance, bad faith, gross negligence or
reckless disregard of the Independent Board Member's duties as a director or
trustee of the Affected Funds as determined in a final adjudication in such
action or proceeding. The estimated amount of any expenses that may be advanced
to the Independent Board Members or indemnity that may be payable under the
indemnity agreements is currently unknown. These agreements by DIMA will
survive the termination of the Investment Management Agreements between DIMA
and the Affected Funds.
BOARD MEMBERS
BOARD MEMBERS AND OFFICERS' IDENTIFICATION AND BACKGROUND. The identification
and background of the Board Members and Officers of the Registrant are set
forth in PART II - APPENDIX II-A.
BOARD COMMITTEES AND COMPENSATION. Information regarding the Committees of the
Board, as well as compensation paid to the Independent Board Members and to
Board Members who are not officers of the Registrant, for certain specified
periods, is set forth in PART I - APPENDIX I-B AND PART I - APPENDIX I-C.
ADMINISTRATOR, FUND ACCOUNTING AGENT, TRANSFER AGENT AND SHAREHOLDER SERVICE
AGENT, AND CUSTODIAN
ADMINISTRATOR. For all funds except Money Market Portfolio, DWS Dreman Mid Cap
Value Fund, DWS Dreman Small Cap Value Fund, and DWS Strategic Value Fund. DIMA
serves as a fund's administrator pursuant to an Administrative Services
Agreement.
For its services under the Administrative Services Agreement, the Administrator
receives a fee at the rate set forth in PART II - APPENDIX II-C. For all funds
except Money Market Portfolio, DWS Dreman Mid Cap Value Fund, DWS Dreman Small
Cap Value Fund and DWS Strategic Value Fund, the Administrator will pay
Accounting Agency fees out of the Administrative Services fee.
Under the Administrative Services Agreement, the Administrator is obligated on
a continuous basis to provide such administrative services as the Board of a
fund reasonably deems necessary for the proper administration of a fund. The
Administrator provides a fund with personnel; arranges for the preparation and
filing of a fund's tax
II-6
returns; prepares and submits reports and meeting materials to the Board and
the shareholders; prepares and files updates to a fund's prospectus and
statement of additional information as well as other reports required to be
filed by the SEC; maintains a fund's records; provides a fund with office
space, equipment and services; supervises, negotiates the contracts of and
monitors the performance of third parties contractors; oversees the tabulation
of proxies; monitors the valuation of portfolio securities and monitors
compliance with Board-approved valuation procedures; assists in establishing
the accounting and tax policies of a fund; assists in the resolution of
accounting issues that may arise with respect to a fund; establishes and
monitors a fund's operating expense budgets; reviews and processes a fund's
bills; assists in determining the amount of dividends and distributions
available to be paid by a fund, prepares and arranges dividend notifications
and provides information to agents to effect payments thereof; provides to the
Board periodic and special reports; provides assistance with investor and
public relations matters; and monitors the registration of shares under
applicable federal and state law. The Administrator also performs certain fund
accounting services under the Administrative Services Agreement.
The Administrative Services Agreement provides that the Administrator will not
be liable under the Administrative Services Agreement except for willful
misfeasance, bad faith or negligence in the performance of its duties or from
the reckless disregard by it of its duties and obligations thereunder. Pursuant
to an agreement between the Administrator and SSB, the Administrator has
delegated certain administrative functions to SSB. The costs and expenses of
such delegation are borne by the Administrator, not by a fund.
Pursuant to the Advisor's procedures, approved by the Board, proof of claim
forms are routinely filed on behalf of a fund by a third party service
provider, with certain limited exceptions. The Board receives periodic reports
regarding the implementation of these procedures.
FUND ACCOUNTING AGENT. For Money Market Portfolio, DWS Dreman Mid Cap Value
Fund, DWS Dreman Small Cap Value Fund, and DWS Strategic Value Fund, DIFA, One
Beacon Street, Boston, Massachusetts 02108, a subsidiary of DIMA, is
responsible for determining net asset value per share and maintaining the
portfolio and general accounting records for a fund pursuant to a Fund
Accounting Agreement. For its services under a Fund Accounting Agreement, DIFA
receives a fee at the rate set forth in PART II - APPENDIX II-C.
Pursuant to an agreement between DIFA and SSB, DIFA has delegated certain fund
accounting functions to SSB under the Fund Accounting Agreement. The costs and
expenses of such delegation are borne by DIFA, not by a fund.
TRANSFER AGENT AND SHAREHOLDER SERVICE AGENT. DISC, 210 W. 10th Street, Kansas
City, Missouri 64105-1614, an affiliate of the Advisor, is each fund's transfer
agent, dividend-paying agent and shareholder service agent pursuant to the
Transfer Agency and Services Agreement. Pursuant to a sub-transfer agency
agreement between DISC and DST Systems, Inc. (DST), DISC has delegated certain
transfer agent, dividend paying agent and shareholder servicing agent functions
to DST. The costs and expenses of such delegation are borne by DISC, not by a
fund. For its services under the Transfer Agency and Services Agreement, DISC
receives a fee at the rate set forth in PART II - APPENDIX II-C. Each fund, or
the Advisor (including any affiliate of the Advisor), or both, may pay
unaffiliated third parties for providing recordkeeping and other administrative
services with respect to accounts of participants in retirement plans or other
beneficial owners of shares whose interests are generally held in an omnibus
account.
CUSTODIAN. Under its custody agreement with a fund, the Custodian (i) maintains
separate accounts in the name of a fund, (ii) holds and transfers portfolio
securities on account of a fund, (iii) accepts receipts and makes disbursements
of money on behalf of a fund, and (iv) collects and receives all income and
other payments and distributions on account of a fund's portfolio securities.
The Custodian has entered into agreements with foreign subcustodians approved
by the Board pursuant to Rule 17f-5 under the 1940 Act.
In some instances, the Custodian may use Deutsche Bank AG or its affiliates, as
subcustodian (DB Subcustodian) in certain countries. To the extent a fund holds
any securities in the countries in which the Custodian uses a DB Subcustodian
as a subcustodian, those securities will be held by DB Subcustodian as part of
a larger omnibus account in the name of the Custodian (Omnibus Account). For
its services, DB Subcustodian receives (1) an annual fee based on a percentage
of the average daily net assets of the Omnibus Account and (2) transaction
charges with respect to transactions that occur within the Omnibus Account. To
the extent that a DB Subcustodian receives any brokerage commissions for any
transactions, such transactions and amount of brokerage commissions paid by the
fund are set forth in PART I - APPENDIX I-H.
II-7
The Custodian's fee may be reduced by certain earnings credits in favor of a
fund.
FUND LEGAL COUNSEL. Provides legal services to the funds.
BOARD LEGAL COUNSEL. Serves as legal counsel to the Independent Board Members.
PRINCIPAL UNDERWRITER AND DISTRIBUTION AGREEMENT. Pursuant to a distribution
agreement (Distribution Agreement) with a fund, DIDI, 222 South Riverside
Plaza, Chicago, Illinois 60606, an affiliate of the Advisor, is the principal
underwriter and distributor for each class of shares of a fund and acts as
agent of a fund in the continuous offering of its shares. The Distribution
Agreement remains in effect for a class from year to year only if its
continuance is approved for the class at least annually by a vote of the Board,
including the Board Members who are not parties to the Distribution Agreement
or interested persons of any such party.
The Distribution Agreement automatically terminates in the event of its
assignment and may be terminated for a class at any time without penalty by a
fund or by DIDI upon 60 days' notice. Termination by a fund with respect to a
class may be by vote of (i) a majority of the Board Members who are not
interested persons of a fund and who have no direct or indirect financial
interest in the Distribution Agreement or any related agreement, or (ii) a
"majority of the outstanding voting securities" of the class of a fund, as
defined under the 1940 Act. All material amendments must be approved by the
Board in the manner described above with respect to the continuation of the
Distribution Agreement. The provisions concerning continuation, amendment and
termination of a Distribution Agreement are on a series by series and class by
class basis.
Under the Distribution Agreement, DIDI uses reasonable efforts to sell shares
of a fund and may appoint various financial services firms to sell shares of a
fund. DIDI bears all of its expenses of providing services pursuant to the
Distribution Agreement, including the payment of any commissions, concessions,
and distribution fees to financial services firms. A fund pays the cost of the
registration of its shares for sale under the federal securities laws and the
registration or qualification of its shares for sale under the securities laws
of the various states. A fund also pays the cost for the prospectus and
shareholder reports to be typeset and printed for existing shareholders, and
DIDI, as principal underwriter, pays for the printing and distribution of
copies thereof used in connection with the offering of shares to prospective
investors. DIDI also pays for supplementary sales literature and advertising
costs. DIDI receives any sales charge upon the purchase of shares of a class
with an initial sales charge and pays commissions, concessions and distribution
fees to firms for the sale of a fund's shares. DIDI also receives any
contingent deferred sales charges paid with respect to the redemption of any
shares having such a charge. DIDI receives no compensation from a fund as
principal underwriter and distributor except with respect to certain fund
classes in amounts authorized by a Rule 12b-1 Plan adopted for a class by a
fund (see Distribution and Service Agreements and Plans).
SHAREHOLDER AND ADMINISTRATIVE SERVICES. Shareholder and administrative
services are provided to certain fund classes under a shareholder services
agreement (Services Agreement) with DIDI. The Services Agreement continues in
effect for each class from year to year so long as such continuance is approved
for the class at least annually by a vote of the Board, including the Board
Members who are not interested persons of a fund and who have no direct or
indirect financial interest in the Services Agreement or in any related
agreement. The Services Agreement automatically terminates in the event of its
assignment and may be terminated for a class at any time without penalty by a
fund or by DIDI upon 60 days' notice. Termination by a fund with respect to a
class may be by a vote of (i) the majority of the Board Members who are not
interested persons of a fund and who have no direct or indirect financial
interest in the Services Agreement or in any related agreement, or (ii) a
"majority of the outstanding voting securities" of the class of such fund, as
defined under the 1940 Act. The Services Agreement may not be amended for a
class to increase materially the fee to be paid by a fund without approval of a
majority of the outstanding voting securities of such class of a fund, and all
material amendments must in any event be approved by the Board in the manner
described above with respect to the continuation of the Services Agreement.
Under the Services Agreement, DIDI provides, and may appoint various financial
services firms to provide, information and services to investors in certain
classes of a fund. Firms appointed by DIDI provide such office space and
equipment, telephone facilities and personnel as is necessary or beneficial for
providing information and services to shareholders in the applicable classes of
a fund. Such services and assistance may include, but are not limited to,
establishing and maintaining accounts and records, processing purchase and
redemption transactions, answering routine inquiries regarding a fund,
providing assistance to clients in changing dividend and investment options,
account designations and addresses
II-8
and such other administrative services as may be agreed upon from time to time
and permitted by applicable statute, rule or regulation.
DIDI bears all of its expenses of providing those services pursuant to the
Services Agreement, including the payment of any service fees to financial
services firms appointed by DIDI to provide such services and DIDI receives
compensation from a fund for its services under the Services Agreement in
amounts authorized by a Rule 12b-1 Plan adopted for a class by a fund (see
Distribution and Service Agreements and Plans).
DIDI may itself provide some of the above distribution and shareholder and
administrative services and may retain any portion of the fees received under
the Distribution Agreement and/or the Services Agreement not paid to financial
services firms to compensate itself for such distribution and shareholder and
administrative functions performed for a fund. Firms to which DIDI may pay
commissions, concessions, and distribution fees or service fees or other
compensation may include affiliates of DIDI.
REGULATORY MATTERS AND LEGAL PROCEEDINGS. On December 21, 2006, Deutsche Asset
Management (DeAM) settled proceedings with the Securities and Exchange
Commission (SEC) and the New York Attorney General on behalf of Deutsche Asset
Management, Inc. (DAMI) and DIMA, the investment advisors to many of the DWS
Investments funds, regarding allegations of improper trading of fund shares at
DeAM and at the legacy Scudder and Kemper organizations prior to their
acquisition by DeAM in April 2002. These regulators alleged that although the
prospectuses for certain funds in the regulators' view indicated that the funds
did not permit market timing, DAMI and DIMA breached their fiduciary duty to
those funds in that their efforts to limit trading activity in the funds were
not effective at certain times. The regulators also alleged that DAMI and DIMA
breached their fiduciary duty to certain funds by entering into certain market
timing arrangements with investors. These trading arrangements originated in
businesses that existed prior to the currently constituted DeAM organization,
which came together as a result of various mergers of the legacy Scudder,
Kemper and Deutsche fund groups, and all of the arrangements were terminated
prior to the start of the regulatory investigations that began in the summer of
2003. No current DeAM employee approved these trading arrangements. Under the
terms of the settlements, DAMI and DIMA neither admitted nor denied any
wrongdoing.
The terms of the SEC settlement, which identified improper trading in the
legacy Deutsche and Kemper mutual funds only, provide for payment of
disgorgement in the amount of $17.2 million. The terms of the settlement with
the New York Attorney General provide for payment of disgorgement in the amount
of $102.3 million, which is inclusive of the amount payable under the SEC
settlement, plus a civil penalty in the amount of $20 million. The total amount
payable by DeAM, approximately $122.3 million, will be distributed to
shareholders of the affected funds in accordance with a distribution plan to be
developed by a distribution consultant. The funds' investment advisors do not
believe these amounts will have a material adverse financial impact on them or
materially affect their ability to perform under their investment management
agreements with the DWS funds. The above-described amounts are not material to
Deutsche Bank, and have already been reserved.
Among the terms of the settled orders, DeAM is subject to certain undertakings
regarding the conduct of its business in the future, including formation of a
Code of Ethics Oversight Committee to oversee all matters relating to issues
arising under the advisors' Code of Ethics; establishment of an Internal
Compliance Controls Committee having overall compliance oversight
responsibility of the advisors; engagement of an Independent Compliance
Consultant to conduct a comprehensive review of the advisors' supervisory
compliance and other policies and procedures designed to prevent and detect
breaches of fiduciary duty, breaches of the Code of Ethics and federal
securities law violations by the advisors and their employees; and commencing
in 2008, the advisors shall undergo a compliance review by an independent third
party.
In addition, DeAM is subject to certain further undertakings relating to the
governance of the mutual funds, including that at least 75% of the members of
the Boards of Trustees/Directors overseeing the DWS funds continue to be
independent of DeAM; the Chairmen of the DWS funds' Boards of Trustees continue
to be independent of DeAM; DeAM maintain existing management fee reductions for
certain funds for a period of five years and not increase management fees for
these certain funds during this period; the funds retain a senior officer (or
independent consultants, as applicable) responsible for assisting in the review
of fee arrangements and monitoring compliance by the funds and the investment
advisors with securities laws, fiduciary duties, codes of ethics and other
compliance policies, the expense of which shall be borne by DeAM; and periodic
account statements, fund prospectuses and the mutual funds' web site contain
II-9
additional disclosure and/or tools that assist investors in understanding the
fees and costs associated with an investment in the funds and the impact of
fees and expenses on fund returns.
DeAM has also settled proceedings with the Illinois Secretary of State
regarding market timing matters. The terms of the Illinois settlement provide
for investor education contributions totaling approximately $4 million and a
payment in the amount of $2 million to the Securities Audit and Enforcement
Fund.
On September 28, 2006, the SEC and the National Association of Securities
Dealers (NASD) (now known as the Financial Industry Regulatory Authority, or
FINRA) announced final agreements in which Deutsche Investment Management
Americas Inc. (DIMA), Deutsche Asset Management, Inc. (DAMI) and DWS Scudder
Distributors, Inc. (now known as DWS Investments Distributors, Inc. ("DIDI"))
settled administrative proceedings regarding disclosure of brokerage allocation
practices in connection with sales of the DWS funds' (now known as the DWS
Investments Funds) shares during 2001-2003. The agreements with the SEC and
NASD are reflected in orders which state, among other things, that DIMA and
DAMI failed to disclose potential conflicts of interest to the funds' Boards
and to shareholders relating to DIDI's use of certain funds' brokerage
commissions to reduce revenue sharing costs to broker dealer firms with whom it
had arrangements to market and distribute DWS fund shares. These directed
brokerage practices were discontinued in October 2003.
Under the terms of the settlements, in which DIMA, DAMI and DIDI neither
admitted nor denied any of the regulators' findings, DIMA, DAMI and DIDI agreed
to pay disgorgement, prejudgment interest and civil penalties in the total
amount of $19.3 million. The portion of the settlements distributed to the
funds was approximately $17.8 million and was paid to the funds as prescribed
by the settlement orders based upon the amount of brokerage commissions from
each fund used to satisfy revenue sharing agreements with broker dealers who
sold fund shares.
As part of the settlements, DIMA, DAMI and DIDI also agreed to implement
certain measures and undertakings relating to revenue sharing payments
including making additional disclosures in the funds' prospectuses or
Statements of Additional Information, adopting or modifying relevant policies
and procedures and providing regular reporting to the fund Boards.
Additional information announced by DeAM regarding the terms of the settlements
is available at www.dws investments.com/regulatory_settlements.
The matters alleged in the regulatory settlements described above also serve as
the general basis of a number of private class action lawsuits involving the
DWS funds. These lawsuits name as defendants various persons, including certain
DWS funds, the funds' investment advisors and their affiliates, and certain
individuals, including in some cases fund Trustees/ Directors, officers, and
other parties. Each DWS fund's investment advisor has agreed to indemnify the
applicable DWS funds in connection with these lawsuits, or other lawsuits or
regulatory actions that may be filed making similar allegations.
Based on currently available information, the funds' investment advisors
believe the likelihood that the pending lawsuits will have a material adverse
financial impact on a DWS fund is remote and such actions are not likely to
materially affect their ability to perform under their investment management
agreements with the DWS funds.
CODES OF ETHICS. Each fund, the Advisor, a fund's principal underwriter and, if
applicable, a fund's sub-advisor (and sub-subadvisor) have each adopted codes
of ethics under Rule 17j-1 under the 1940 Act. Board Members, officers of a
Registrant and employees of the Advisor and principal underwriter are permitted
to make personal securities transactions, including transactions in securities
that may be purchased or held by a fund, subject to requirements and
restrictions set forth in the applicable Code of Ethics. The Advisor's Code of
Ethics contains provisions and requirements designed to identify and address
certain conflicts of interest between personal investment activities and the
interests of a fund. Among other things, the Advisor's Code of Ethics prohibits
certain types of transactions absent prior approval, imposes time periods
during which personal transactions may not be made in certain securities, and
requires the submission of duplicate broker confirmations and quarterly
reporting of securities transactions. Additional restrictions apply to
portfolio managers, traders, research analysts and others involved in the
investment advisory process. Exceptions to these and other provisions of the
Advisor's or sub-advisors Codes of Ethics may be granted in particular
circumstances after review by appropriate personnel.
II-10
FUND ORGANIZATION
FOR EACH TRUST (EXCEPT DWS TARGET DATE SERIES, DWS PORTFOLIO TRUST, DWS TAX
FREE TRUST, DWS VALUE EQUITY TRUST AND CASH ACCOUNT TRUST)
The Board has the authority to divide the shares of the Trust into multiple
funds by establishing and designating two or more series of the Trust. The
Board also has the authority to establish and designate two or more classes of
shares of the Trust, or of any series thereof, with variations in the relative
rights and preferences between the classes as determined by the Board; provided
that all shares of a class shall be identical with each other and with the
shares of each other class of the same series except for such variations
between the classes, including bearing different expenses, as may be authorized
by the Board and not prohibited by the 1940 Act and the rules and regulations
thereunder. All shares issued and outstanding are transferable, have no
pre-emptive or conversion rights (except as may be determined by the Board) and
are redeemable as described in the SAI and in the prospectus. Each share has
equal rights with each other share of the same class of the fund as to voting,
dividends, exchanges, conversion features and liquidation. Shareholders are
entitled to one vote for each full share held and fractional votes for
fractional shares held.
A fund generally is not required to hold meetings of its shareholders. Under
the Declaration of Trust, shareholders only have the power to vote in
connection with the following matters and only to the extent and as provided in
the Declaration of Trust and as required by applicable law: (a) the election,
re-election or removal of one or more Trustees if a meeting of shareholders is
called by or at the direction of the Board for such purpose(s), provided that
the Board shall promptly call a meeting of shareholders for the purpose of
voting upon the question of removal of one or more Trustees as a result of a
request in writing by the holders of not less than ten percent of the
outstanding shares of the Trust; (b) the termination of the Trust or a fund if,
in either case, the Board submits the matter to a vote of shareholders; (c) any
amendment of the Declaration of Trust that (i) would affect the rights of
shareholders to vote under the Declaration of Trust, (ii) requires shareholder
approval under applicable law or (iii) the Board submits to a vote of
shareholders; and (d) such additional matters as may be required by law or as
the Board may determine to be necessary or desirable. Shareholders also vote
upon changes in fundamental policies or restrictions.
The Declaration of Trust provides that shareholder meeting quorum requirements
shall be established in the By-laws. The By-laws of the Trust currently provide
that the presence in person or by proxy of the holders of thirty percent of the
shares entitled to vote at a meeting shall constitute a quorum for the
transaction of business at meetings of shareholders of the Trust (or of an
individual series or class if required to vote separately).
On any matter submitted to a vote of shareholders, all shares of the Trust
entitled to vote shall, except as otherwise provided in the By-laws, be voted
in the aggregate as a single class without regard to series or classes of
shares, except (a) when required by applicable law or when the Board has
determined that the matter affects one or more series or classes of shares
materially differently, shares shall be voted by individual series or class;
and (b) when the Board has determined that the matter affects only the
interests of one or more series or classes, only shareholders of such series or
classes shall be entitled to vote thereon.
The Declaration of Trust provides that the Board may, in its discretion,
establish minimum investment amounts for shareholder accounts, impose fees on
accounts that do not exceed a minimum investment amount and involuntarily
redeem shares in any such account in payment of such fees. The Board, in its
sole discretion, also may cause the Trust to redeem all of the shares of the
Trust or one or more series or classes held by any shareholder for any reason,
to the extent permissible by the 1940 Act, including (a) if the shareholder
owns shares having an aggregate net asset value of less than a specified
minimum amount, (b) if a particular shareholder's ownership of shares would
disqualify a series from being a regulated investment company, (c) upon a
shareholder's failure to provide sufficient identification to permit the Trust
to verify the shareholder's identity, (d) upon a shareholder's failure to pay
for shares or meet or maintain the qualifications for ownership of a particular
class or series of shares, (e) if the Board determines (or pursuant to policies
established by the Board it is determined) that share ownership by a particular
shareholder is not in the best interests of remaining shareholders, (f) when a
fund is requested or compelled to do so by governmental authority or applicable
law and (g) upon a shareholder's failure to comply with a request for
information with respect to the direct or indirect ownership of shares or other
securities of the Trust. The Declaration of Trust also authorizes the Board to
terminate a fund or any class without shareholder approval, and the
II-11
Trust may suspend the right of shareholders to require the Trust to redeem
shares to the extent permissible under the 1940 Act.
The Declaration of Trust provides that, except as otherwise required by
applicable law, the Board may authorize the Trust or any series or class
thereof to merge, reorganize or consolidate with any corporation, association,
trust or series thereof (including another series or class of the Trust) or
other entity (in each case, the "Surviving Entity") or the Board may sell,
lease or exchange all or substantially all of the Trust property (or all or
substantially all of the Trust property allocated or belonging to a particular
series or class), including its good will, to any Surviving Entity, upon such
terms and conditions and for such consideration as authorized by the Board.
Such transactions may be effected through share-for-share exchanges, transfers
or sales of assets, in-kind redemptions and purchases, exchange offers or any
other method approved by the Board. The Board shall provide notice to affected
shareholders of each such transaction. The authority of the Board with respect
to the merger, reorganization or consolidation of any class of the Trust is in
addition to the authority of the Board to combine two or more classes of a
series into a single class.
Upon the termination of the Trust or any series, after paying or adequately
providing for the payment of all liabilities, which may include the
establishment of a liquidating trust or similar vehicle, and upon receipt of
such releases, indemnities and refunding agreements as they deem necessary for
their protection, the Board may distribute the remaining Trust property or
property of the series to the shareholders of the Trust or the series involved,
ratably according to the number of shares of the Trust or such series held by
the several shareholders of the Trust or such series on the date of
termination, except to the extent otherwise required or permitted by the
preferences and special or relative rights and privileges of any classes of
shares of a series involved, provided that any distribution to the shareholders
of a particular class of shares shall be made to such shareholders pro rata in
proportion to the number of shares of such class held by each of them. The
composition of any such distribution (e.g., cash, securities or other assets)
shall be determined by the Trust in its sole discretion and may be different
among shareholders (including differences among shareholders in the same series
or class).
Under Massachusetts law, shareholders of a Massachusetts business trust could,
under certain circumstances, be held personally liable for obligations of a
fund. The Declaration of Trust, however, disclaims shareholder liability for
acts or obligations of the fund and requires that notice of such disclaimer be
given in each agreement, obligation, or instrument entered into or executed by
a fund or a fund's trustees. Moreover, the Declaration of Trust provides for
indemnification out of fund property for all losses and expenses of any
shareholder held personally liable for the obligations of the fund and the fund
may be covered by insurance which the Board considers adequate to cover
foreseeable tort claims. Thus, the risk of a shareholder incurring financial
loss on account of shareholder liability is limited to circumstances in which a
disclaimer is inoperative and a fund itself is unable to meet its obligations.
FOR DWS TARGET DATE SERIES, DWS PORTFOLIO TRUST, DWS TAX FREE TRUST AND DWS
VALUE EQUITY TRUST
The Board has the authority to divide the shares of the Trust into multiple
funds by establishing and designating two or more series of the Trust. The
Board also has the authority to establish and designate two or more classes of
shares of the Trust, or of any series thereof, with variations in the relative
rights and preferences between the classes as determined by the Board; provided
that all shares of a class shall be identical with each other and with the
shares of each other class of the same series except for such variations
between the classes, including bearing different expenses, as may be authorized
by the Board and not prohibited by the 1940 Act and the rules and regulations
thereunder. All shares issued and outstanding are transferable, have no
pre-emptive or conversion rights (except as may be determined by the Board) and
are redeemable as described in the SAI and in the prospectus. Each share has
equal rights with each other share of the same class of the fund as to voting,
dividends, exchanges, conversion features and liquidation. Shareholders are
entitled to one vote for each full share held and fractional votes for
fractional shares held.
A fund generally is not required to hold meetings of its shareholders. Under
the Declaration of Trust, shareholders only have the power to vote in
connection with the following matters and only to the extent and as provided in
the Declaration of Trust and as required by applicable law: (a) the election,
re-election or removal of one or more Trustees if a meeting of shareholders is
called by or at the direction of the Board for such purpose(s), provided that
the Board shall promptly call a meeting of shareholders for the purpose of
voting upon the question of removal of one or more Trustees as a result of a
request in writing by the holders of not less than ten percent of the
outstanding shares of the Trust; (b) the termination of the Trust or a fund if,
in either case, the Board submits
II-12
the matter to a vote of shareholders; (c) any amendment of the Declaration of
Trust that (i) would change any right with respect to any shares of the Trust
or fund by reducing the amount payable thereon upon liquidation of the Trust or
fund or by diminishing or eliminating any voting rights pertaining thereto, in
which case the vote or consent of the holders of two-thirds of the shares of
the Trust or fund outstanding and entitled to vote would be required (ii)
requires shareholder approval under applicable law or (iii) the Board submits
to a vote of shareholders; and (d) such additional matters as may be required
by law or as the Board may determine to be necessary or desirable. Shareholders
also vote upon changes in fundamental policies or restrictions.
In addition, under the Declaration of Trust, shareholders of the Trust also
have the power to vote in connection with the following matters to the extent
and as provided in the Declaration of Trust and as required by applicable law:
(a) to the same extent as the stockholders of a Massachusetts business
corporation as to whether or not a court action, proceeding or claims should or
should not be brought or maintained derivatively or as a class action on behalf
of the Trust or the shareholders; (b) with respect to any merger, consolidation
or sale of assets; (c) with respect to any investment advisory or management
contract entered into with respect to one or more funds; (d) with respect to
the incorporation of the Trust or a fund; (e) with respect to any plan adopted
pursuant to Rule 12b-1 (or any successor rule) under the 1940 Act; and (f) with
respect to such additional matters relating to the Trust as may be required by
the Declaration of Trust, the By-laws or any registration of the Trust with the
SEC as an investment company under the 1940 Act.
The Declaration of Trust provides that shareholder meeting quorum requirements
shall be established in the By-laws. The By-laws of the Trust currently provide
that the presence in person or by proxy of the holders of thirty percent of the
shares entitled to vote at a meeting shall constitute a quorum for the
transaction of business at meetings of shareholders of the Trust (or of an
individual series or class if required to vote separately).
On any matter submitted to a vote of shareholders, all shares of the Trust
entitled to vote shall, except as otherwise provided in the By-laws, be voted
in the aggregate as a single class without regard to series or classes of
shares, except (a) when required by applicable law or when the Board has
determined that the matter affects one or more series or classes of shares
materially differently, shares shall be voted by individual series or class;
and (b) when the Board has determined that the matter affects only the
interests of one or more series or classes, only shareholders of such series or
classes shall be entitled to vote thereon.
The Declaration of Trust provides that the Board may, in its discretion,
establish minimum investment amounts for shareholder accounts, impose fees on
accounts that do not exceed a minimum investment amount and involuntarily
redeem shares in any such account in payment of such fees. The Board, in its
sole discretion, also may cause the Trust to redeem all of the shares of the
Trust or one or more series or classes held by any shareholder for any reason,
to the extent permissible by the 1940 Act, including (a) if the shareholder
owns shares having an aggregate net asset value of less than a specified
minimum amount, (b) if a particular shareholder's ownership of shares would
disqualify a series from being a regulated investment company, (c) upon a
shareholder's failure to provide sufficient identification to permit the Trust
to verify the shareholder's identity, (d) upon a shareholder's failure to pay
for shares or meet or maintain the qualifications for ownership of a particular
class or series of shares, (e) if the Board determines (or pursuant to policies
established by the Board it is determined) that share ownership by a particular
shareholder is not in the best interests of remaining shareholders, (f) when a
fund is requested or compelled to do so by governmental authority or applicable
law and (g) upon a shareholder's failure to comply with a request for
information with respect to the direct or indirect ownership of shares or other
securities of the Trust. The Declaration of Trust also authorizes the Board to
terminate a fund or any class without shareholder approval, and the Trust may
suspend the right of shareholders to require the Trust to redeem shares to the
extent permissible under the 1940 Act.
Upon the termination of the Trust or any series, after paying or adequately
providing for the payment of all liabilities, which may include the
establishment of a liquidating trust or similar vehicle, and upon receipt of
such releases, indemnities and refunding agreements as they deem necessary for
their protection, the Board may distribute the remaining Trust property or
property of the series to the shareholders of the Trust or the series involved,
ratably according to the number of shares of the Trust or such series held by
the several shareholders of the Trust or such series on the date of
termination, except to the extent otherwise required or permitted by the
preferences and special or relative rights and privileges of any classes of
shares of a series involved, provided that any distribution to the shareholders
of a particular class of shares shall be made to such shareholders pro rata in
II-13
proportion to the number of shares of such class held by each of them. The
composition of any such distribution (e.g., cash, securities or other assets)
shall be determined by the Trust in its sole discretion and may be different
among shareholders (including differences among shareholders in the same series
or class).
Under Massachusetts law, shareholders of a Massachusetts business trust could,
under certain circumstances, be held personally liable for obligations of a
fund. The Declaration of Trust, however, disclaims shareholder liability for
acts or obligations of the fund and requires that notice of such disclaimer be
given in each agreement, obligation, or instrument entered into or executed by
a fund or a fund's trustees. Moreover, the Declaration of Trust provides for
indemnification out of fund property for all losses and expenses of any
shareholder held personally liable for the obligations of the fund and the fund
may be covered by insurance which the Board considers adequate to cover
foreseeable tort claims. Thus, the risk of a shareholder incurring financial
loss on account of shareholder liability is limited to circumstances in which a
disclaimer is inoperative and a fund itself is unable to meet its obligations.
FOR CASH ACCOUNT TRUST
The Board Members have the authority to create additional funds and to
designate the relative rights and preferences as between the different funds.
The Board Members also may authorize the division of shares of a fund into
different classes, which may bear different expenses. All shares issued and
outstanding are fully paid and non-assessable, transferable, have no
pre-emptive or conversion rights and are redeemable as described in the funds'
prospectuses and SAIs. Each share has equal rights with each other share of the
same class of the fund as to voting, dividends, exchanges, conversion features
and liquidation. Shareholders are entitled to one vote for each full share held
and fractional votes for fractional shares held. The Board Members may also
terminate any fund or class by notice to the shareholders without shareholder
approval.
The Trust generally is not required to hold meetings of its shareholders. Under
the Declaration of Trust, however, shareholder meetings will be held in
connection with the following matters: (a) the election or removal of Board
Members if a meeting is called for such purpose; (b) the adoption of any
contract for which shareholder approval is required by the 1940 Act; (c) any
termination or reorganization of the Trust to the extent and as provided in the
Declaration of Trust; (d) any amendment of the Declaration of Trust (other than
amendments changing the name of the Trust or any fund, establishing a fund,
supplying any omission, curing any ambiguity or curing, correcting or
supplementing any defective or inconsistent provision thereof); and (e) such
additional matters as may be required by law, the Declaration of Trust, the
By-laws of the Trust, or any registration of the Trust with the Securities and
Exchange Commission or any state, or as the Board Members may consider
necessary or desirable. The shareholders also would vote upon changes in
fundamental investment objectives, policies or restrictions.
Subject to the Declaration of Trust, shareholders may remove Board Members.
Each Board Member serves until the next meeting of shareholders, if any, called
for the purpose of electing Board Members and until the election and
qualification of a successor or until such Board Member sooner dies, resigns,
retires or is removed by a majority vote of the shares entitled to vote (as
described below) or a majority of the Board Members. In accordance with the
1940 Act (a) the Trust will hold a shareholder meeting for the election of
Board Members at such time as less than a majority of the Board Members have
been elected by shareholders, and (b) if, as a result of a vacancy in the
Board, less than two-thirds of the Board Members have been elected by the
shareholders, that vacancy will be filled only by a vote of the shareholders.
The Declaration of Trust provides that obligations of the Trust are not binding
upon the Board Members individually but only upon the property of the Trust,
that the Board Members and officers will not be liable for errors of judgment
or mistakes of fact or law, and that a Trust will indemnify its Board Members
and officers against liabilities and expenses incurred in connection with
litigation in which they may be involved because of their offices with a Trust
except if it is determined in the manner provided in the Declaration of Trust
that they have not acted in good faith in the reasonable belief that their
actions were in the best interests of the Trust. However, nothing in the
Declaration of Trust protects or indemnifies a Board Member or officer against
any liability to which he would otherwise be subject by reason of willful
misfeasance, bad faith, gross negligence, or reckless disregard of the duties
involved in the conduct of their office.
Board Members may be removed from office by a vote of the holders of a majority
of the outstanding shares at a meeting called for that purpose, which meeting
shall be held upon the written request of the holders of not less than 10% of
the outstanding shares. Upon the written request of ten or more shareholders
who have been such for at least six months and who hold shares constituting
II-14
at least 1% of the outstanding shares of the Trust stating that such
shareholders wish to communicate with the other shareholders for the purpose of
obtaining the signatures necessary to demand a meeting to consider removal of a
trustee, the Trust has undertaken to disseminate appropriate materials at the
expense of the requesting shareholders.
The Declaration of Trust provides that the presence at a shareholder meeting in
person or by proxy of at least 30% of the shares entitled to vote on a matter
shall constitute a quorum. Thus, a meeting of shareholders of a fund could take
place even if less than a majority of the shareholders were represented on its
scheduled date. Shareholders would in such a case be permitted to take action
which does not require a larger vote than a majority of a quorum, such as the
election of Board Members and ratification of the selection of auditors. Some
matters requiring a larger vote under the Declaration of Trust, such as
termination or reorganization of a fund and certain amendments of the
Declaration of Trust, would not be affected by this provision; nor would
matters which under the 1940 Act require the vote of a "majority of the
outstanding voting securities" as defined in the 1940 Act.
The Declaration of Trust specifically authorizes the Board to terminate the
Trust (or any fund or class) by notice to the shareholders without shareholder
approval.
Under Massachusetts law, shareholders of a Massachusetts business trust could,
under certain circumstances, be held personally liable for obligations of the
Trust. The Declaration of Trust, however, disclaims shareholder liability for
acts or obligations of the Trust and requires that notice of such disclaimer be
given in each agreement, obligation, or instrument entered into or executed by
the Trust or the Board Members. Moreover, the Declaration of Trust provides for
indemnification out of Trust property for all losses and expenses of any
shareholder held personally liable for the obligations of the Trust and the
Trust may be covered by insurance. Thus, the risk of a shareholder incurring
financial loss on account of shareholder liability is considered by the Advisor
remote and not material, since it is limited to circumstances in which a
disclaimer is inoperative and the Trust itself is unable to meet its
obligations.
FOR EACH CORPORATION (EXCEPT DWS VALUE SERIES, INC.)
All shares issued and outstanding are fully paid and non-assessable,
transferable, have no pre-emptive rights (except as may be determined by the
Board of Directors) or conversion rights (except as described below) and are
redeemable as described in the SAI and in each fund's prospectus. Each share
has equal rights with each other share of the same class of a fund as to
voting, dividends, exchanges and liquidation. Shareholders are entitled to one
vote for each share held and fractional votes for fractional shares held.
The Board of Directors may determine that shares of a fund or a class of a fund
shall be automatically converted into shares of another fund of the Corporation
or of another class of the same or another fund based on the relative net
assets of such fund or class at the time of conversion. The Board of Directors
may also provide that the holders of shares of a fund or a class of a fund
shall have the right to convert or exchange their shares into shares of one or
more other funds or classes on terms established by the Board of Directors.
Each share of the Corporation may be subject to such sales loads or charges,
expenses and fees, account size requirements, and other rights and provisions,
which may be the same or different from any other share of the Corporation or
any other share of any fund or class of a fund (including shares of the same
fund or class as the share), as the Board of Directors may establish or change
from time to time and to the extent permitted under the 1940 Act.
The Corporation is not required to hold an annual meeting of shareholders in
any year in which the election of Directors is not required by the 1940 Act. If
a meeting of shareholders of the Corporation is required by the 1940 Act to
take action on the election of Directors, then an annual meeting shall be held
to elect Directors and take such other action as may come before the meeting.
Special meetings of the shareholders of the Corporation, or of the shareholders
of one or more funds or classes thereof, for any purpose or purposes, may be
called at any time by the Board of Directors or by the President, and shall be
called by the President or Secretary at the request in writing of shareholders
entitled to cast a majority of the votes entitled to be cast at the meeting.
Except as provided in the 1940 Act, the presence in person or by proxy of the
holders of one-third of the shares entitled to vote at a meeting shall
constitute a quorum for the transaction of business at meetings of shareholders
of the Corporation or of a fund or class.
On any matter submitted to a vote of shareholders, all shares of the
Corporation entitled to vote shall be voted in the aggregate as a single class
without regard to series
II-15
or classes of shares, provided, however, that (a) when applicable law requires
that one or more series or classes vote separately, such series or classes
shall vote separately and, subject to (b) below, all other series or classes
shall vote in the aggregate; and (b) when the Board of Directors determines
that a matter does not affect the interests of a particular series or class,
such series or class shall not be entitled to any vote and only the shares of
the affected series or classes shall be entitled to vote.
Notwithstanding any provision of Maryland corporate law requiring authorization
of any action by a greater proportion than a majority of the total number of
shares entitled to vote on a matter, such action shall be effective if
authorized by the majority vote of the outstanding shares entitled to vote.
Subject to the requirements of applicable law and any procedures adopted by the
Board of Directors from time to time, the holders of shares of the Corporation
or any one or more series or classes thereof may take action or consent to any
action by delivering a consent, in writing or by electronic transmission, of
the holders entitled to cast not less than the minimum number of votes that
would be necessary to authorize or take the action at a formal meeting.
The Articles of Incorporation provide that the Board of Directors may, in its
discretion, establish minimum investment amounts for shareholder accounts,
impose fees on accounts that do not exceed a minimum investment amount and
involuntarily redeem shares in any such account in payment of such fees. The
Board of Directors, in its sole discretion, also may cause the Corporation to
redeem all of the shares of the Corporation or one or more series or classes
held by any shareholder for any reason, to the extent permissible by the 1940
Act, including (a) if the shareholder owns shares having an aggregate net asset
value of less than a specified minimum amount, (b) if the shareholder's
ownership of shares would disqualify a series from being a regulated investment
company, (c) upon a shareholder's failure to provide sufficient identification
to permit the Corporation to verify the shareholder's identity, (d) upon a
shareholder's failure to pay for shares or meet or maintain the qualifications
for ownership of a particular series or class, (e) if the Board of Directors
determines (or pursuant to policies established by the Board of Directors it is
determined) that share ownership by a shareholder is not in the best interests
of the remaining shareholders, (f) when the Corporation is requested or
compelled to do so by governmental authority or applicable law, or (g) upon a
shareholder's failure to comply with a request for information with respect to
the direct or indirect ownership of shares of the Corporation. By redeeming
shares the Corporation may terminate a fund or any class without shareholder
approval, and the Corporation may suspend the right of shareholders to require
the Corporation to redeem shares to the extent permissible under the 1940 Act.
Except as otherwise permitted by the Articles of Incorporation, upon
liquidation or termination of a fund or class, shareholders of such fund or
class of such fund shall be entitled to receive, pro rata in proportion to the
number of shares of such fund or class held by each of them, a share of the net
assets of such fund or class, and the holders of shares of any other particular
fund or class shall not be entitled to any such distribution, provided,
however, that the composition of any such payment (e.g., cash, securities
and/or other assets) to any shareholder shall be determined by the Corporation
in its sole discretion, and may be different among shareholders (including
differences among shareholders in the same fund or class).
FOR DWS VALUE SERIES, INC.
All shares issued and outstanding are fully paid and non-assessable,
transferable, have no pre-emptive or conversion rights and are redeemable as
described in the SAI and in each fund's prospectus. Each share has equal rights
with each other share of the same class of a fund as to voting, dividends,
exchanges, conversion features and liquidation. Shareholders are entitled to
one vote for each full share held and fractional votes for fractional shares
held. The Directors may also terminate any fund or class by notice to the
shareholders without shareholder approval.
The Corporation is not required to hold annual meetings of shareholders unless
required by the 1940 Act. Special meetings of shareholders may be called by the
Chairman, President or a majority of the members of the Board of Directors and
shall be called by the Secretary upon the written request of the holders of at
least twenty-five percent of the shares of the capital stock of the Corporation
issued and outstanding and entitled to vote at such meeting.
Maryland corporate law provides that a Director of the Corporation shall not be
liable for actions taken in good faith, in a manner he or she reasonable
believes to be in the best interests of the Corporation and with the care that
an ordinarily prudent person in a like position would use in similar
circumstances. In so acting, a Director shall be fully protected in relying in
good faith upon the records
II-16
of the Corporation and upon reports made to the Corporation by persons selected
in good faith by the Directors as qualified to make such reports. The By-Laws
provide that the Corporation will indemnify Directors and officers of the
Corporation against liabilities and expenses actually incurred in connection
with litigation in which they may be involved because of their positions with
the Corporation. However, nothing in the Articles of Incorporation, as amended,
or the By-Laws protects or indemnifies a Director or officer against any
liability to which he or she would otherwise be subject by reason of willful
misfeasance, bad faith, gross negligence or reckless disregard of the duties
involved in the conduct of his or her office.
Each Director serves until the next meeting of shareholders, if any, called for
the purpose of electing Directors and until the election and qualification of a
successor or until such Director sooner dies, resigns, retires or is removed.
Any of the Directors may be removed (provided the aggregate number of Directors
after such removal shall not be less than one) with cause, by the action of a
majority of the remaining Directors. Any Director may be removed at any meeting
of shareholders by vote of a majority of the outstanding shares. The Directors
shall promptly call a meeting of the shareholders for the purpose of voting
upon the question of removal of any such Director or Directors when requested
in writing to do so by the holders of not less than ten percent of the
outstanding shares, and in that connection, the Directors will assist
shareholder communications to the extent provided for in Section 16(c) under
the 1940 Act.
It is possible that a fund might become liable for a misstatement regarding
another fund in this SAI.
PURCHASE AND REDEMPTION OF SHARES
GENERAL INFORMATION. Policies and procedures affecting transactions in a fund's
shares can be changed at any time without notice, subject to applicable law.
Transactions may be contingent upon proper completion of application forms and
other documents by shareholders and their receipt by a fund's agents.
Transaction delays in processing (and changing account features) due to
circumstances within or beyond the control of a fund and its agents may occur.
Shareholders (or their financial service firms) are responsible for all losses
and fees resulting from bad checks, cancelled orders or the failure to
consummate transactions effected pursuant to instructions reasonably believed
to be genuine.
The Board and DIDI each may suspend (in whole or in part) or terminate the
offering of shares of a fund at any time for any reason and may limit the
amount of purchases by, and refuse to sell to, any person. During the period of
such suspension, the Board or DIDI potentially may permit certain persons (for
example, persons who are already shareholders the fund) to continue to purchase
additional shares of a fund and to have dividends reinvested.
Orders will be confirmed at a price based on the net asset value of a fund next
determined after receipt in good order by DIDI of the order accompanied by
payment in the case of a purchase order. Except as described below, orders
received by certain dealers or other financial services firms prior to the
close of a fund's business day will be confirmed at a price based on the net
asset value determined on that day (trade date).
USE OF FINANCIAL SERVICES FIRMS. Dealers and other financial services firms
provide varying arrangements for their clients to purchase and redeem a fund's
shares, including different minimum investments, and may assess transaction or
other fees. In addition, certain privileges with respect to the purchase and
redemption of shares or the reinvestment of dividends may not be available
through such firms. Firms may arrange with their clients for other investment
or administrative services. Such firms may independently establish and charge
additional amounts to their clients for such services. Firms also may hold a
fund's shares in nominee or street name as agent for and on behalf of their
customers. In such instances, the Shareholder Service Agent will have no
information with respect to or control over the accounts of specific
shareholders. Such shareholders may obtain access to their accounts and
information about their accounts only from their firm. Certain of these firms
may receive compensation from a fund through the Shareholder Service Agent for
record-keeping and other expenses relating to these nominee accounts. Some
firms may participate in a program allowing them access to their clients'
accounts for servicing including, without limitation, transfers of registration
and dividend payee changes; and may perform functions such as generation of
confirmation statements and disbursement of cash dividends. Such firms,
including affiliates of DIDI, may receive compensation from a fund through the
Shareholder Service Agent for these services.
A fund has authorized one or more financial service institutions, including
certain members of the Financial Industry Regulatory Authority (FINRA) other
than DIDI (financial institutions), to accept purchase and redemption
II-17
orders for a fund's shares. Such financial institutions may also designate
other parties, including plan administrator intermediaries, to accept purchase
and redemption orders on a fund's behalf. Orders for purchases or redemptions
will be deemed to have been received by a fund when such financial institutions
or, if applicable, their authorized designees accept the orders. Subject to the
terms of the contract between a fund and the financial institution, ordinarily
orders will be priced at a fund's net asset value next computed after
acceptance by such financial institution or its authorized designees. Further,
if purchases or redemptions of a fund's shares are arranged and settlement is
made at an investor's election through any other authorized financial
institution, that financial institution may, at its discretion, charge a fee
for that service.
TAX-SHELTERED RETIREMENT PLANS. The Shareholder Service Agent and DIDI provide
retirement plan services and documents and can establish investor accounts in
any of the following types of retirement plans:
o Traditional, Roth and Education IRAs. This includes Savings Incentive
Match Plan for Employees of Small Employers (SIMPLE), Simplified Employee
Pension Plan (SEP) IRA accounts and prototype documents.
o 403(b)(7) Custodial Accounts. This type of plan is available to employees
of most non-profit organizations.
o Prototype money purchase pension and profit-sharing plans may be adopted
by employers.
Materials describing these plans as well as model defined benefit plans, target
benefit plans, 457 plans, 401(k) plans, simple 401(k) plans and materials for
establishing them are available from the Shareholder Service Agent upon
request. DIDI may pay commissions to dealers and other financial services firms
in connection with shares sold to retirement plans. For further information
about such compensation, see Compensation Schedules #1 and #2 as set forth in
PART II - APPENDIX II-D. Additional fees and transaction policies and
procedures may apply to such plans. Investors should consult their own tax
advisors before establishing a retirement plan.
PURCHASES
A fund may offer only certain of the classes of shares referred to in the
subsections below. Thus, the information provided below in regard to the
purchase of certain classes of shares is only applicable to funds offering such
classes of shares.
PURCHASE OF CLASS A SHARES. The public offering price of Class A shares is the
net asset value plus a sales charge based on investment amount, as set forth in
the relevant prospectus and the "DWS Sales Charge and Dealer Commission
Schedule" set forth in PART II - APPENDIX II-F.
CLASS A SHARES REDUCED SALES CHARGES
QUANTITY DISCOUNTS. An investor or the investor's dealer or other financial
services firm must notify the Shareholder Service Agent or DIDI whenever a
quantity discount or reduced sales charge is applicable to a purchase. In order
to qualify for a lower sales charge, all orders from an organized group will
have to be placed through a single dealer or other firm and identified as
originating from a qualifying purchaser.
COMBINED PURCHASES. A fund's Class A shares may be purchased at the rate
applicable to the sales charge discount bracket attained by combining same day
investments in Class A shares of any DWS funds that bear a sales charge.
CUMULATIVE DISCOUNT. Class A shares of a fund may also be purchased at the rate
applicable to the discount bracket attained by adding to the cost of shares
being purchased, the value of all Class A shares of DWS funds that bear a sales
charge (computed at the maximum offering price at the time of the purchase for
which the discount is applicable) already owned by the investor or his or her
immediate family member (including the investor's spouse or life partner and
children or stepchildren age 21 or younger).
LETTER OF INTENT. The reduced sales charges for Class A shares, as shown in the
relevant prospectus and the "DWS Sales Charge and Dealer Commission Schedule"
set forth in PART II - APPENDIX II-F, also apply to the aggregate amount of
purchases of Class A shares of DWS funds that bear a sales charge made by any
purchaser within a 24-month period under a written Letter of Intent (Letter)
provided to DIDI. The Letter, which imposes no obligation to purchase or sell
additional Class A shares, provides for a price adjustment depending upon the
actual amount purchased within such period. The Letter provides that the first
purchase following execution of the Letter must be at least 5% of the amount of
the intended purchase, and that 5% of the amount of the intended purchase
normally will be held in escrow in the form of shares pending completion of the
intended purchase. If the total investments under the Letter are less than the
intended amount and thereby qualify only for a higher sales charge than
actually paid, the appropriate number
II-18
of escrowed shares are redeemed and the proceeds used toward satisfaction of
the obligation to pay the increased sales charge. The Letter for an
employer-sponsored employee benefit plan maintained on the subaccount record
keeping system available through ADP, Inc. (or ExpertPlan for Flex Plans) under
an alliance between ADP, Inc. (or ExpertPlan for Flex Plans) and DIDI and its
affiliates may have special provisions regarding payment of any increased sales
charge resulting from a failure to complete the intended purchase under the
Letter. A shareholder may include the value (at the maximum offering price,
which is determined by adding the maximum applicable sales load charged to the
net asset value) of all Class A shares of such DWS funds held of record as of
the initial purchase date under the Letter as an "accumulation credit" toward
the completion of the Letter, but no price adjustment will be made on such
shares.
RETIREMENT PLANS ON FLEX SYSTEM. For purposes of the Combined Purchases,
Cumulative Discount and Letter of Intent features described above,
employer-sponsored employee benefit plans using the Flex subaccount record
keeping system available through ExpertPlan under an alliance with DIDI and its
affiliates may include: (a) Money Market funds as "DWS funds," (b) all classes
of shares of any DWS fund and (c) the value of any other plan investments, such
as guaranteed investment contracts and employer stock, maintained on such
subaccount record keeping system.
CLASS A NAV SALES. Class A shares may be sold at net asset value without a
sales charge to:
(1) a current or former director or trustee of Deutsche or DWS mutual funds;
(2) an employee (including the employee's spouse or life partner and
children or stepchildren age 21 or younger) of Deutsche Bank AG or its
affiliates or of a subadvisor to any fund in the DWS family of funds or
of a broker-dealer authorized to sell shares of a fund or service agents
of a fund;
(3) certain professionals who assist in the promotion of DWS funds pursuant
to personal services contracts with DIDI, for themselves or immediate
members of their families;
(4) any trust, pension, profit-sharing or other benefit plan for only such
persons listed under the preceding paragraphs (a) and (b);
(5) persons who purchase such shares through bank trust departments that
process such trades through an automated, integrated mutual fund
clearing program provided by a third party clearing firm;
(6) selected employees (including their spouses or life partners and
children or stepchildren age 21 or younger) of banks and other financial
services firms that provide administrative services related to order
placement and payment to facilitate transactions in shares of a fund for
their clients pursuant to an agreement with DIDI or one of its
affiliates. Only those employees of such banks and other firms who as
part of their usual duties provide services related to transactions in
fund shares qualify;
(7) unit investment trusts sponsored by Ranson & Associates, Inc. and
unitholders of unit investment trusts sponsored by Ranson & Associates,
Inc. or its predecessors through reinvestment programs described in the
prospectuses of such trusts that have such programs;
(8) through certain investment advisors registered under the Investment
Advisers Act of 1940 and other financial services firms acting solely as
agent for their clients, that adhere to certain standards established by
DIDI, including a requirement that such shares be sold for the benefit
of their clients participating in an investment advisory program or
agency commission program under which such clients pay a fee to the
investment advisor or other firm for portfolio management or agency
brokerage services. Such shares are sold for investment purposes and on
the condition that they will not be resold except through redemption or
repurchase by a fund;
(9) employer-sponsored employee benefit plans using the Flex subaccount
recordkeeping system (Flex Plans) made available through ExpertPlan
under an alliance with DIDI and its affiliates, established prior to
October 1, 2003, provided that the Flex Plan is a participant-directed
plan that has not less than 200 eligible employees;
(10) investors investing $1 million or more ($250,000 or more for DWS
Alternative Asset Allocation Plus Fund, DWS California Tax-Free Income
Fund, DWS Disciplined Market Neutral Fund, DWS Floating Rate Plus Fund,
DWS Global Thematic Fund, DWS GNMA Fund, DWS Intermediate Tax/AMT Free
Fund, DWS Large Cap Value Fund, DWS Managed Municipal Bond Fund, DWS
Massachusetts Tax-Free Fund,
II-19
DWS New York Tax-Free Income Fund, DWS Short-Term Municipal Bond Fund,
DWS Short Duration Plus Fund, DWS Strategic High Yield Tax-Free Fund,
DWS Select Alternative Allocation Fund, DWS Strategic Government
Securities Fund and DWS Strategic Income Fund), either as a lump sum or
through the Combined Purchases, Letter of Intent and Cumulative Discount
features referred to above (collectively, the Large Order NAV Purchase
Privilege). The Large Order NAV Purchase Privilege is not available if
another net asset value purchase privilege is available;
(11) defined contribution investment only plans with a minimum of $1 million
in plan assets regardless of the amount allocated to the DWS funds;
In addition, Class A shares may be sold at net asset value without a sales
charge in connection with:
(12) the acquisition of assets or merger or consolidation with another
investment company, and under other circumstances deemed appropriate by
DIDI and consistent with regulatory requirements;
(13) a direct "roll over" of a distribution from a Flex Plan or from
participants in employer sponsored employee benefit plans maintained on
the OmniPlus subaccount record keeping system made available through
ExpertPlan under an alliance between ExpertPlan and DIDI and its
affiliates into a DWS Investments IRA;
(14) reinvestment of fund dividends and distributions; and
(15) exchanging an investment in Class A shares of another fund in the DWS
family of funds for an investment in a fund.
Class A shares also may be purchased at net asset value without a sales charge
in any amount by members of the plaintiff class in the proceeding known as
Howard and Audrey Tabankin, et al. v. Kemper Short-Term Global Income Fund, et
al., Case No. 93 C 5231 (N.D. IL). This privilege is generally non-transferable
and continues for the lifetime of individual class members and has expired for
non-individual class members. To make a purchase at net asset value under this
privilege, the investor must, at the time of purchase, submit a written request
that the purchase be processed at net asset value pursuant to this privilege
specifically identifying the purchaser as a member of the "Tabankin Class."
Shares purchased under this privilege will be maintained in a separate account
that includes only shares purchased under this privilege. For more details
concerning this privilege, class members should refer to the Notice of (i)
Proposed Settlement with Defendants; and (ii) Hearing to Determine Fairness of
Proposed Settlement, dated August 31, 1995, issued in connection with the
aforementioned court proceeding. For sales of fund shares at net asset value
pursuant to this privilege, DIDI may in its discretion pay dealers and other
financial services firms a concession, payable quarterly, at an annual rate of
up to 0.25% of net assets attributable to such shares maintained and serviced
by the firm. A firm becomes eligible for the concession based upon assets in
accounts attributable to shares purchased under this privilege in the month
after the month of purchase and the concession continues until terminated by
DIDI. The privilege of purchasing Class A shares of a fund at net asset value
under this privilege is not available if another net asset value purchase
privilege also applies.
PURCHASE OF CLASS B SHARES. Class B shares of a fund are offered at net asset
value. No initial sales charge is imposed, which allows the full amount of the
investor's purchase payment to be invested in Class B shares for his or her
account. Class B shares are subject to a contingent deferred sales charge of
4.00% that declines over time (for shares sold within six years of purchase)
and Rule 12b-1 fees, as described in the relevant prospectus (see DWS Sales
Charge and Dealer Commission Schedule set forth in PART II - APPENDIX II-F, and
the discussion of Rule 12b-1 Plans under Distribution and Service Agreements
and Plans below). Class B shares automatically convert to Class A shares after
six years.
As described in the prospectus, Class B shares are closed to new purchases,
except for exchanges and the reinvestment of dividends or other distributions.
PURCHASE OF CLASS C SHARES. Class C shares of a fund are offered at net asset
value. No initial sales charge is imposed, which allows the full amount of the
investor's purchase payment to be invested in Class C shares for his or her
account. Class C shares are subject to a contingent deferred sales charge of
1.00% (for shares sold within one year of purchase) and Rule 12b-1 fees, as
described in the relevant prospectus (see DWS Sales Charge and Dealer
Commission Schedule set forth in PART II - APPENDIX II-F, and the discussion of
Rule 12b-1 Plans under Distribution and Service Agreements and Plans below).
II-20
PURCHASE OF CLASS R SHARES. Class R shares of a fund are offered at net asset
value. No initial sales charge is imposed, which allows the full amount of the
investor's purchase payment to be invested in Class R shares for his or her
account. Class R shares are subject to Rule 12b-1 fees, as described in the
relevant prospectus (see DWS Sales Charge and Dealer Commission Schedule set
forth in PART II - APPENDIX II-H, and the discussion of Rule 12b-1 Plans under
Distribution and Service Agreements and Plans below).
The Shareholder Service Agent monitors transactions in Class R shares to help
to ensure that investors purchasing Class R shares meet the eligibility
requirements described in the prospectus. If the Shareholder Service Agent is
unable to verify that an investor meets the eligibility requirements for Class
R, either following receipt of a completed application form within time frames
established by a fund or as part of its ongoing monitoring, the Shareholder
Service Agent may take corrective action up to and including canceling the
purchase order or redeeming the account.
PURCHASE OF INSTITUTIONAL CLASS SHARES. Institutional Class shares of a fund
are offered at net asset value without a sales charge to certain eligible
investors as described in the section entitled "Buying and Selling Shares" in a
fund's prospectus.
Investors may invest in Institutional Class shares by setting up an account
directly with the Shareholder Service Agent or through an authorized service
agent. Investors who establish shareholder accounts directly with the
Shareholder Service Agent should submit purchase and redemption orders as
described in the relevant prospectus.
PURCHASE OF CLASS S. Class S shares are generally only available to new
investors through fee-based programs of investment dealers that have special
agreements with a fund's distributor, through certain group retirement plans
and through certain registered investment advisors. These dealers and advisors
typically charge ongoing fees for services they provide.
MULTI-CLASS SUITABILITY FOR CLASSES A, B AND C. DIDI has established the
following procedures regarding the purchase of Class A, Class B and Class C
shares. Orders to purchase Class B shares of $100,000 or more and orders to
purchase Class C shares of $500,000 or more (certain funds have a $250,000
maximum for Class C purchases, see the applicable fund's prospectus) will be
declined with the exception of orders received from financial representatives
acting for clients whose shares are held in an omnibus account and
employer-sponsored employee benefit plans using the subaccount record keeping
system (System) maintained for DWS Investments-branded plans on record keeping
systems made available through ExpertPlan under an alliance between ExpertPlan
and DIDI and its affiliates (DWS Investments Flex Plans). The foregoing Class C
order limit of $500,000 or more is $250,000 or more for the certain funds, see
the relevant prospectus for additional information.
The following provisions apply to DWS Investments Flex Plans.
(1) Class B Share DWS Investments Flex Plans. Class B shares have not been
sold to DWS Investments Flex Plans that were established on the System
after October 1, 2003. Orders to purchase Class B shares for a DWS
Investments Flex Plan established on the System prior to October 1, 2003
that has regularly been purchasing Class B shares will be invested
instead in Class A shares at net asset value when the combined
subaccount value in DWS funds or other eligible assets held by the plan
is $100,000 or more. This provision will be imposed for the first
purchase after eligible plan assets reach the $100,000 threshold. A
later decline in assets below the $100,000 threshold will not affect the
plan's ability to continue to purchase Class A shares at net asset
value.
(2) Class C Share DWS Investments Flex Plans. Orders to purchase Class C
shares for a DWS Investments Flex Plan, regardless of when such plan was
established on the System, will be invested instead in Class A shares at
net asset value when the combined subaccount value in DWS funds or other
eligible assets held by the plan is $1,000,000 or more. This provision
will be imposed for the first purchase after eligible plan assets reach
the $1,000,000 threshold. A later decline in assets below the $1,000,000
threshold will not affect the plan's ability to continue to purchase
Class A shares at net asset value.
The procedures described above do not reflect in any way the suitability of a
particular class of shares for a particular investor and should not be relied
upon as such. A suitability determination must be made by investors with the
assistance of their financial representative.
PURCHASE PRIVILEGES FOR DWS AFFILIATED INDIVIDUALS. Current or former Board
members of the DWS funds, employees, their spouses or life partners and
children
II-21
or step-children age 21 or younger, of Deutsche Bank AG or its affiliates or a
sub-adviser to any DWS fund or a broker-dealer authorized to sell shares of a
fund are generally eligible to purchase shares in the class of a fund with the
lowest expense ratio, usually the Institutional Class shares. If a fund does
not offer Institutional Class shares, these individuals are eligible to buy
Class A shares at NAV. Each fund also reserves the right to waive the minimum
account balance requirement for employee and director accounts. Fees generally
charged to IRA accounts will be charged to accounts of employees and directors.
MONEY MARKET FUNDS. Shares of a fund are sold at net asset value (normally,
$1.00) directly from a fund or through selected financial services firms, such
as broker-dealers and banks. Each fund seeks to have its investment portfolio
as fully invested as possible at all times in order to achieve maximum income.
Since each fund will be investing in instruments that normally require
immediate payment in Federal Funds (monies credited to a bank's account with
its regional Federal Reserve Bank), as described in the applicable prospectus,
each fund has adopted procedures for the convenience of its shareholders and to
ensure that each fund receives investable funds.
VARIABLE INSURANCE FUNDS. Shares of DWS Variable Series I, DWS Variable Series
II and DWS Investments VIT Fund are continuously offered to separate accounts
of participating insurance companies at the net asset value per share next
determined after a proper purchase request has been received by the insurance
company. The insurance companies offer to variable annuity and variable life
insurance contract owners units in its separate accounts which directly
correspond to shares in a fund. Each insurance company submits purchase and
redemption orders to a fund based on allocation instructions for premium
payments, transfer instructions and surrender or partial withdrawal requests
which are furnished to the insurance company by such contract owners. Contract
owners can send such instructions and requests to the insurance companies in
accordance with procedures set forth in the prospectus for the applicable
variable insurance product offered by the insurance company.
PURCHASES IN-KIND. This section is applicable only to the following funds: DWS
High Income Plus Fund, DWS Mid Cap Growth Fund, DWS Small Cap Growth Fund, DWS
Equity 500 Index VIP and DWS Small Cap Index VIP. A fund may, at its own
option, accept securities in payment for shares. The securities delivered in
payment for shares are valued by the method described under "Net Asset Value"
as of the day a fund receives the securities. This is a taxable transaction to
the shareholder. Securities may be accepted in payment for shares only if they
are, in the judgment of the Advisor, appropriate investments for a fund. In
addition, securities accepted in payment for shares must: (i) meet the
investment objective and policies of the acquiring fund; (ii) be acquired by
the applicable fund for investment and not for resale; (iii) be liquid
securities which are not restricted as to transfer either by law or liquidity
of market; and (iv) if stock, have a value which is readily ascertainable as
evidenced by a listing on a stock exchange, over-the-counter market or by
readily available market quotations from a dealer in such securities. The
shareholder will be charged the costs associated with receiving or delivering
the securities. These costs include security movement costs and taxes and
registration costs. A fund reserves the right to accept or reject at its own
option any and all securities offered in payment for its shares.
REDEMPTIONS
A fund may offer only certain of the classes of shares referred to in the
subsections below. Thus, the information provided below in regard to the
redemption of certain classes of shares is only applicable to funds offering
such classes of shares.
A request for repurchase (confirmed redemption) may be communicated by a
shareholder through a financial services firm to DIDI, which firms must
promptly submit orders to be effective.
Redemption requests must be unconditional. Redemption requests (and a stock
power for certificated shares) must be duly endorsed by the account holder. As
specified in the relevant prospectus, signatures may need to be guaranteed by a
commercial bank, trust company, savings and loan association, federal savings
bank, member firm of a national securities exchange or other financial
institution permitted by SEC rule. Additional documentation may be required,
particularly from institutional and fiduciary account holders, such as
corporations, custodians (e.g., under the Uniform Transfers to Minors Act),
executors, administrators, trustees or guardians.
WIRES. The ability to send wires is limited by the business hours and holidays
of the firms involved. A fund is not responsible for the efficiency of the
federal wire system or the account holder's financial services firm or bank.
The account holder is responsible for any charges imposed by the account
holder's firm or bank. To change the designated account to receive wire
redemption proceeds, send
II-22
a written request to the Shareholder Service Agent with signatures guaranteed
as described above or contact the firm through which fund shares were
purchased.
AUTOMATIC WITHDRAWAL PLAN. An owner of $5,000 or more of a class of a fund's
shares at the offering price (net asset value plus, in the case of Class A
shares, the initial sales charge) may provide for the payment from the owner's
account of any requested dollar amount to be paid to the owner or a designated
payee monthly, quarterly, semiannually or annually pursuant to an Automatic
Withdrawal Plan (the "Plan"). The $5,000 minimum account size is not applicable
to IRAs. The minimum periodic payment is $50. The maximum annual rate at which
shares subject to CDSC may be redeemed without the imposition of the CDSC is
12% of the net asset value of the account. Shares are redeemed so that the
payee should receive payment approximately on the first of the month. Investors
using this Plan must reinvest fund distributions.
Non-retirement plan shareholders may establish a Plan to receive monthly,
quarterly or periodic redemptions from his or her account for any designated
amount of $50 or more. Shareholders may designate which day they want the
automatic withdrawal to be processed. The check amounts may be based on the
redemption of a fixed dollar amount, fixed share amount, percent of account
value or declining balance. The Plan provides for income dividends and capital
gains distributions, if any, to be reinvested in additional shares. Shares are
then liquidated as necessary to provide for withdrawal payments. Since the
withdrawals are in amounts selected by the investor and have no relationship to
yield or income, payments received cannot be considered as yield or income on
the investment and the resulting liquidations may deplete or possibly
extinguish the initial investment and any reinvested dividends and capital
gains distributions. Any such requests must be received by the Shareholder
Service Agent ten days prior to the date of the first automatic withdrawal. A
Plan may be terminated at any time by the shareholder, the Trust or its agent
on written notice, and will be terminated when all fund shares under the Plan
have been liquidated or upon receipt by the Trust of notice of death of the
shareholder.
The purchase of Class A shares while participating in a Plan will ordinarily be
disadvantageous to the investor because the investor will be paying a sales
charge on the purchase of shares at the same time that the investor is
redeeming shares upon which a sales charge may have already been paid.
Therefore, a fund will not knowingly permit additional investments in Class A
shares of less than $2,000 if the investor is at the same time making
systematic withdrawals.
CONTINGENT DEFERRED SALES CHARGE (CDSC). The following example will illustrate
the operation of the CDSC for Class A (when applicable), Class B and Class C
shares, to the extent applicable. Assume that an investor makes a single
purchase of $10,000 of a fund's Class B shares and that 16 months later the
value of the shares has grown by $1,000 through reinvested dividends and by an
additional $1,000 of share appreciation to a total of $12,000. If the investor
were then to redeem the entire $12,000 in share value, the CDSC would be
payable only with respect to $10,000 because neither the $1,000 of reinvested
dividends nor the $1,000 of share appreciation is subject to the charge. The
charge would be at the rate of 3.00% ($300) because the redemption was in the
second year after the purchase was made.
The rate of the CDSC is determined by the length of the period of ownership.
Investments are tracked on a monthly basis. The period of ownership for this
purpose begins the first day of the month in which the order for the investment
is received. For example, an investment made in March of the year of investment
will be eligible for the second year's charge if redeemed on or after the first
day of March of the following year. In the event no specific order is requested
when redeeming shares subject to a CDSC, the redemption will be made first from
shares representing reinvested dividends and then from the earliest purchase of
shares. DIDI receives any CDSC directly. The CDSC will not be imposed upon
redemption of reinvested dividends or share appreciation.
The Class A CDSC for shares purchased through the Large Order NAV Purchase
Privilege will be waived in the event of:
(1) redemptions by a participant-directed qualified retirement plan
described in Code Section 401(a), a participant-directed non-qualified
deferred compensation plan described in Code Section 457 or a
participant-directed qualified retirement plan described in Code Section
403(b)(7) which is not sponsored by a K-12 school district;
(2) redemptions by employer-sponsored employee benefit plans using the
subaccount record keeping system made available through ADP, Inc. (or
ExpertPlan for Flex Plans) under an alliance between ADP, Inc. (or
ExpertPlan for Flex Plans) and DIDI and its affiliates;
II-23
(3) redemption of shares of a shareholder (including a registered joint
owner) who has died;
(4) redemption of shares of a shareholder (including a registered joint
owner) who after purchase of the shares being redeemed becomes totally
disabled (as evidenced by a determination by the federal Social Security
Administration);
(5) redemptions under a fund's Automatic Withdrawal Plan at a maximum of 12%
per year of the net asset value of the account;
(6) redemptions of shares whose dealer of record at the time of the
investment notifies DIDI that the dealer waives the discretionary
commission applicable to such Large Order NAV Purchase; and
(7) redemptions for certain loan advances, hardship provisions or returns of
excess contributions from retirement plans.
The Class B CDSC will be waived for the circumstances set forth in items (3),
(4), (5) and (7) above for Class A shares. In addition, this CDSC will be
waived:
(a) for redemptions made pursuant to any IRA systematic withdrawal based
on the shareholder's life expectancy including, but not limited to,
substantially equal periodic payments described in Code Section
72(t)(2)(A)(iv) prior to age 59 1/2;
(b) for redemptions to satisfy required minimum distributions after age
70 1/2 from an IRA account (with the maximum amount subject to this
waiver being based only upon the shareholder's DWS Investments IRA
accounts); and
(c) in connection with the following redemptions of shares held by
employer-sponsored employee benefit plans maintained on the
subaccount record keeping system made available by ADP, Inc. under
an alliance between ADP, Inc. and DIDI and its affiliates: (1) to
satisfy participant loan advances (note that loan repayments
constitute new purchases for purposes of the CDSC and the conversion
privilege), (2) in connection with retirement distributions (limited
at any one time to 12% of the total value of plan assets invested in
a fund), (3) in connection with distributions qualifying under the
hardship provisions of the Internal Revenue Code, (4) representing
returns of excess contributions to such plans and (5) in connection
with direct "roll over" distributions from a Flex Plan into a DWS
Investments IRA under the Class A net asset value purchase
privilege.
The Class C CDSC will be waived for the circumstances set forth in items (2),
(3), (4), (5) and (7) above for Class A shares and for the circumstances set
forth in items (a) and (b) above for Class B shares. In addition, this CDSC
will be waived for:
(i) redemption of shares by an employer-sponsored employee benefit plan
that offers funds in addition to DWS funds and whose dealer of
record has waived the advance of the first year administrative
service and distribution fees applicable to such shares and agrees
to receive such fees quarterly; and
(ii) redemption of shares purchased through a dealer-sponsored
asset allocation program maintained on an omnibus record-keeping system
provided the dealer of record had waived the advance of the first year
administrative services and distribution fees applicable to such shares
and has agreed to receive such fees quarterly.
REDEMPTIONS IN-KIND. A fund reserves the right to honor any request for
redemption or repurchase by making payment in whole or in part in readily
marketable securities. These securities will be chosen by a fund and valued as
they are for purposes of computing a fund's net asset value. A shareholder may
incur transaction expenses in converting these securities to cash. Please see
the prospectus for any requirements that may be applicable to certain funds to
provide cash up to certain amounts. For the following funds, this right may
only be exercised upon the consent of the shareholder: Money Market Portfolio
and Government & Agency Securities Portfolio, each a series of Cash Account
Trust; Cash Reserves Fund Institutional, a series of DWS Institutional Funds;
DWS Money Market Series, a series of DWS Money Market Trust; and Treasury
Portfolio, a series of Investors Cash Trust.
CHECKWRITING FOR CLASS A, B AND C SHARES (applicable to DWS Short Duration Plus
Fund, DWS Intermediate Tax/AMT Free Fund and DWS Massachusetts Tax-Free Fund
only). The Checkwriting Privilege is not offered to new investors. The
Checkwriting Privilege is available for shareholders of DWS Intermediate
Tax/AMT Free Fund and DWS Short Term Bond Fund (which was acquired by DWS Short
Duration Plus Fund) who previously elected
II-24
this privilege prior to August 19, 2002, and to shareholders of DWS
Massachusetts Tax-Free Fund who were shareholders of the Scudder Massachusetts
Limited Term Tax Free Fund prior to July 31, 2000. Checks may be used to pay
any person, provided that each check is for at least $100 and not more than $5
million. By using the checks, the shareholder will receive daily dividend
credit on his or her shares until the check has cleared the banking system.
Investors who purchased shares by check may write checks against those shares
only after they have been on a fund's book for 10 calendar days. Shareholders
who use this service may also use other redemption procedures. No shareholder
may write checks against certificated shares. A fund pays the bank charges for
this service. However, each fund will review the cost of operation periodically
and reserve the right to determine if direct charges to the persons who avail
themselves of this service would be appropriate. Each fund, State Street Bank
and Trust Company and the Transfer Agent reserve the right at any time to
suspend or terminate the Checkwriting procedure.
MONEY MARKET FUNDS ONLY
The following sections relate to Money Market Funds (except DWS Cash Investment
Trust Class A, B and C Shares of DWS Money Market Prime Series.
REDEMPTION BY CHECK/ACH DEBIT DISCLOSURE. A fund will accept Automated Clearing
House (ACH) debit entries for accounts that have elected the checkwriting
redemption privilege (see Redemptions by Draft below). Please consult the
prospectus for the availability of the checkwriting privilege for a specific
fund. An example of an ACH debit is a transaction in which you have given your
insurance company, mortgage company, credit card company, utility company,
health club, etc., the right to withdraw your monthly payment from your fund
account or the right to convert your mailed check into an ACH debit. Sometimes,
you may give a merchant from whom you wish to purchase goods the right to
convert your check to an ACH debit. You may also authorize a third party to
initiate an individual payment in a specific amount from your account by
providing your account information and authorization to such third party via
the Internet or telephone. You authorize a fund upon receipt of an ACH debit
entry referencing your account number, to redeem fund shares in your account to
pay the entry to the third party originating the debit. A fund will make the
payment on the basis of the account number that you provide to your merchant
and will not compare this account number with the name on the account. A fund,
the Shareholder Service Agent or any other person or system handling the
transaction are not required to determine if there is a discrepancy between the
name and the account number shown on the transfer instructions.
The payment of any ACH debit entry will be subject to sufficient funds being
available in the designated account; a fund will not be able to honor an ACH
debit entry if sufficient funds are not available. ACH debit entry transactions
to your fund account should not be initiated or authorized by you in amounts
exceeding the amount of Shares of a fund then in the account and available for
redemption. A fund may refuse to honor ACH debit entry transactions whenever
the right of redemption has been suspended or postponed, or whenever the
account is otherwise impaired. Your fund account statement will show any ACH
debit entries in your account; you will not receive any other separate notice.
(Merchants are permitted to convert your checks into ACH debits only with your
prior consent.)
You may authorize payment of a specific amount to be made from your account
directly by a fund to third parties on a continuing periodic basis. To arrange
for this service, you should contact the person or company you will be paying.
Any preauthorized transfers will be subject to sufficient funds being available
in the designated account. A preauthorized transfer will continue to be made
from the account in the same amount and frequency as initially established
until you terminate the preauthorized transfer instructions with the person or
company whom you have been paying. If regular preauthorized payments may vary
in amount, the person or company you are going to pay should tell you ten (10)
days before each payment will be made and how much the payment will be. If you
have told a fund in advance to make regular payments out of your account, you
may stop any of these payments by writing or calling the Shareholder Service
Agent at the address and telephone number listed in the next paragraph in time
for the Shareholder Service Agent to receive your request three (3) business
days or more before the payment is scheduled to be made. If you call, a fund
may also require that you put your request in writing so that a fund will
receive it within 14 days after you call. If you order a fund to stop one of
these payments three (3) business days or more before the transfer is scheduled
and a fund does not do so, a fund will be liable for your loss or damages but
not in an amount exceeding the amount of the payment. A stop payment order will
stop only the designated periodic payment. If you wish to terminate the
periodic preauthorized transfers, you should do so with the person or company
to whom you have been making payments.
II-25
IN CASE OF ERRORS OR QUESTIONS ABOUT YOUR ACH DEBIT ENTRY TRANSACTIONS please
telephone (800-621-1048 but for Class S shares use 800-728-3337 and for
Institutional class shares use 800-730-1313) or write (DWS Investments Service
Company, P.O. Box 219151, Kansas City, MO 64121-9151) the Shareholder Service
Agent as soon as possible if you think your statement is wrong or shows an
improper transfer or if you need more information about a transfer listed on
the statement. Our business days are Monday through Friday except holidays. The
Shareholder Service Agent must hear from you no later than 60 days after a fund
sent you the first fund account statement on which the problem or error
appeared. If you do not notify the Shareholder Service Agent within sixty (60)
days after a fund sends you the account statement, you may not get back any
money you have lost, and you may not get back any additional money you lose
after the sixty (60) days if a fund or the Shareholder Service Agent could have
stopped someone from taking that money if you had notified the Shareholder
Service Agent in time.
Tell us your name and account number, describe the error or the transfer you
are unsure about, and explain why you believe it is an error or why you need
more information. Tell us the dollar amount of the suspected error. If you tell
the Shareholder Service Agent orally, the Shareholder Service Agent may require
that you send your complaint or questions in writing within ten (10) business
days. The Shareholder Service Agent will determine whether an error occurred
within ten (10) business days after it hears from you and will correct any
error promptly. If the Shareholder Service Agent needs more time, however, it
may take up to 45 days (90 days for certain types of transactions) to
investigate your complaint or question. If the Shareholder Service Agent
decides to do this, your account will be credited with escrowed fund shares
within ten (10) business days for the amount you think is in error so that you
will have the use of the money during the time it takes the Shareholder Service
Agent to complete its investigation. If the Shareholder Service Agent asks you
to put your complaint or questions in writing and the Shareholder Service Agent
does not receive it within ten (10) business days, your account may not be
credited. The Shareholder Service Agent will tell you the results within three
(3) business days after completing its investigation. If the Shareholder
Service Agent determines that there was no error, the Shareholder Service Agent
will send you a written explanation. You may ask for copies of documents that
were used by the Shareholder Service Agent in the investigation.
In the event a fund or the Shareholder Service Agent does not complete a
transfer from your account on time or in the correct amount according to a
fund's agreement with you, a fund may be liable for your losses or damages. A
fund will not be liable to you if (i) there are not sufficient funds available
in your account, (ii) circumstances beyond our control (such as fire or flood
or malfunction of equipment) prevent the transfer, (iii) you or another
shareholder have supplied a merchant with incorrect account information, or
(iv) a merchant has incorrectly formulated an ACH debit entry. In any case, a
fund's liability shall not exceed the amount of the transfer in question.
A fund or the Shareholder Service Agent will disclose information to third
parties about your account or the transfers you make: (1) where it is necessary
for completing the transfers, (2) in order to verify the existence or condition
of your account for a third party such as a credit bureau or a merchant, (3) in
order to comply with government agencies or court orders or (4) if you have
given a fund written permission.
The acceptance and processing of ACH debit entry transactions is established
solely for your convenience and a fund reserves the right to suspend, terminate
or modify your ability to redeem fund shares by ACH debit entry transactions at
any time. ACH debit entry transactions are governed by the rules of the
National Automated Clearing House Association (NACHA) Operating Rules and any
local ACH operating rules then in effect, as well as Regulation E of the
Federal Reserve Board.
REDEMPTIONS BY DRAFT. Upon request, shareholders of certain Money Market Funds
will be provided with drafts to be drawn on a fund (Redemption Checks). Please
consult the prospectus for the availability of the checkwriting redemption
privilege for a specific Money Market Fund. These Redemption Checks may be made
payable to the order of any person for not more than $5 million. When a
Redemption Check is presented for payment, a sufficient number of full and
fractional shares in the shareholder's account will be redeemed as of the next
determined net asset value to cover the amount of the Redemption Check. This
will enable the shareholder to continue earning dividends until a fund receives
the Redemption Check. A shareholder wishing to use this method of redemption
must complete and file an Account Application which is available from a fund or
firms through which shares were purchased. Redemption Checks should not be used
to close an account since the account normally includes accrued but unpaid
dividends. A fund reserves the right to terminate or modify this privilege at
any time. This privilege may not be available through
II-26
some firms that distribute shares of a fund. In addition, firms may impose
minimum balance requirements in order to offer this feature. Firms may also
impose fees to investors for this privilege or establish variations of minimum
check amounts.
Unless more than one signature is required pursuant to the Account Application,
only one signature will be required on Redemption Checks. Any change in the
signature authorization must be made by written notice to the Shareholder
Service Agent. Shares purchased by check or through certain ACH transactions
may not be redeemed by Redemption Check until the shares have been on a fund's
books for at least 10 days. Shareholders may not use this procedure to redeem
shares held in certificate form. A fund reserves the right to terminate or
modify this privilege at any time.
A fund may refuse to honor Redemption Checks whenever the right of redemption
has been suspended or postponed, or whenever the account is otherwise impaired.
A $10 service fee will be charged when a Redemption Check is presented to
redeem fund shares in excess of the value of a fund account or in an amount
less than the minimum Redemption Check amount specified in the prospectus; when
a Redemption Check is presented that would require redemption of shares that
were purchased by check or certain ACH transactions within 10 days; or when
"stop payment" of a Redemption Check is requested.
SPECIAL REDEMPTION FEATURES. Certain firms that offer Shares of the Money
Market Funds also provide special redemption features through charge or debit
cards and checks that redeem fund shares. Various firms have different charges
for their services. Shareholders should obtain information from their firm with
respect to any special redemption features, applicable charges, minimum balance
requirements and special rules of the cash management program being offered.
EXCHANGES
A fund may offer only certain of the classes of shares referred to in the
subsections below. Thus, the information provided below in regard to the
exchange of certain classes of shares is only applicable to funds offering such
classes of shares.
GENERAL. Shareholders may request a taxable exchange of their shares for shares
of the corresponding class of other DWS funds without imposition of a sales
charge, subject to the provisions below. If you exchange shares that have a
CDSC, the CDSC is not imposed on the exchange; however, the later redemption of
the acquired shares would be subject to the CDSC schedule of the acquired fund
(which, for Class A shares only, may differ from the schedule for a fund you
are exchanging out of), based on original cost and purchase date of the shares
you exchanged out of.
Shareholders who exchange their shares out of a DWS money market fund into
Class A shares of certain other DWS funds will generally be subject to the
applicable sales charge (not including shares acquired by dividend reinvestment
or by exchange from Class A shares of another DWS fund).
Certain DWS funds may not be available to shareholders on an exchange. To learn
more about which DWS funds may be available on exchange, please contact your
financial services firm or visit our Web site at: www.dws-investments.com or
call 800-621-1048 (for Class S shares use 800-728-3337 and for Institutional
class shares use 800-730-1313).
Shareholders must obtain prospectus(es) of the DWS fund they are exchanging
into from dealers, other firms or DIDI.
MULTI-CLASS CONVERSIONS. For purposes of conversion to Class A shares, shares
purchased through the reinvestment of dividends and other distributions paid
with respect to Class B shares in a shareholder's fund account will be
converted to Class A shares on a pro rata basis.
EXCHANGES INVOLVING INSTITUTIONAL SHARES. The following persons may, subject to
certain limitations, exchange the DWS Money Market Fund shares of DWS Money
Market Prime Series, for shares of the institutional class of other DWS funds,
and may exchange shares of the institutional class of other DWS funds for DWS
Money Market Fund shares: (1) a current or former director or trustee of the
Deutsche or DWS mutual funds; and (2) an employee, the employee's spouse or
life partner and children or stepchildren age 21 or younger of Deutsche Bank or
its affiliates or a subadvisor to any fund in the DWS family of funds or a
broker-dealer authorized to sell shares of a fund.
CLASS A TO CLASS S IN THE SAME FUND EXCHANGE PRIVILEGE: Investors who have
invested in Class A shares through a comprehensive or "wrap" fee program, or
other fee-based program sponsored by a broker-dealer, bank or registered
investment adviser may become eligible to invest in Class S shares. Subject to
the discretion of
II-27
DWS Investments Distributors, Inc., such shareholders may exchange their Class
A shares for Class S shares of equal aggregate value of the same fund. No sales
charge or other charges will apply to any such exchanges. Investors should
contact their selling and/or servicing agents to learn more about the details
of this exchange feature.
COMPENSATION OF FINANCIAL INTERMEDIARIES
INCENTIVE PLAN FOR DWS INVESTMENTS DISTRIBUTORS PERSONNEL. DIDI has adopted an
Incentive Plan (Plan) covering wholesalers that are regional vice presidents
(DWS Investments Wholesalers). Generally, DWS Investments Wholesalers market
shares of the DWS funds to financial advisors, who in turn may recommend that
investors purchase shares of a DWS fund. The Plan is an incentive program that
combines a monthly incentive component with an annual outperformance award
potential, based on achieving certain sales and other performance metrics.
Under the Plan, DWS Investments Wholesalers will receive a monetary monthly
incentive based on the amount of sales generated from their marketing of the
funds, and that incentive will differ depending on the product tier of a fund.
Each fund is assigned to one of four product tiers - Tier I: cornerstone or
capital market compass funds; Tier II: core or baseline funds; Tier III:
non-core funds; and Tier IV: index or passive funds - taking into
consideration, among other things, the following criteria, where applicable:
o a fund's consistency with DWS Investments' branding and long-term
strategy
o a fund's competitive performance
o a fund's Morningstar rating
o The length of time a fund's Portfolio Managers have managed a
fund/Strategy
o Market size for the fund tier
o a fund's size, including sales and redemptions of a fund's shares
This information and other factors are presented to a senior management
committee comprised of representatives from various groups within DWS
Investments, who review on a regular basis the funds assigned to each product
tier described above, and may make changes to those assignments periodically.
No one factor, whether positive or negative, determines a fund's placement in a
given product tier; all these factors together are considered, and the
designation of funds in a particular tier represents management's judgment
based on the above criteria. In addition, management may consider a fund's
profile over the course of several review periods before making a change to its
tier assignment. These tier assignments will be posted quarterly to the DWS
funds' Web site at www.dws-investments.com/EN/ wholesaler-compensation.jsp,
approximately one month after the end of each quarter. DWS Investments
Wholesalers receive the highest compensation for Tier I funds, successively
less for Tier II (within which there are two payout sub-tiers) and Tier III
funds, and the lowest for Tier IV funds. The level of compensation among these
product tiers may differ significantly.
In the normal course of business, DWS Investments will from time to time
introduce new funds into the DWS family of funds. As a general rule, new funds
will be assigned to the product tier that is most appropriate to the type of
fund at the time of its launch based on the criteria described above. As
described above, the fund tier assignments are reviewed periodically and are
subject to change.
The prospect of receiving, or the receipt of, additional compensation by a DWS
Investments Wholesaler under the Plan may provide an incentive to favor
marketing funds in higher payout tiers over funds in lower payout tiers. The
Plan, however, will not change the price that investors pay for shares of a
fund. The DWS Investments Compliance Department monitors DWS Investments
Wholesaler sales and other activity in an effort to detect unusual activity in
the context of the compensation structure under the Plan. However, investors
may wish to take the Plan and the product tier of the fund into account when
considering purchasing a fund or evaluating any recommendations relating to
fund shares.
FINANCIAL SERVICES FIRMS' COMPENSATION. DIDI may pay compensation to financial
intermediaries in connection with the sale of fund shares as described in PART
II - APPENDIX II-D. In addition, financial intermediaries may receive
compensation for post-sale administrative services from DIDI or directly from a
fund as described in PART II - APPENDIX II-D.
COMPENSATION FOR RECORDKEEPING SERVICES. Certain financial institutions,
including affiliates of DIDI, may receive compensation from a fund for
recordkeeping and other expenses relating to nominee accounts or for providing
certain services to their client accounts. Generally, payments by a fund to
financial institutions for providing such services are not expected to exceed
II-28
0.25% of shareholder assets for which such services are provided. Normally,
compensation for these financial institutions is paid by the Transfer Agent,
which is in turn reimbursed by the applicable fund. To the extent that record
keeping compensation in excess of the amount reimbursed by a fund is owed to a
financial institution, the Transfer Agent, Distributor or Advisor may pay
compensation from their own resources (see Financial Intermediary Support
Payments below).
COMPENSATION FOR RECORDKEEPING SERVICES: VARIABLE INSURANCE FUNDS. Technically,
the shareholders of DWS Variable Series I, DWS Variable Series II and DWS
Investments VIT Funds are the participating insurance companies that offer
shares of the funds as investment options for holders of certain variable
annuity contracts and variable life insurance policies. Effectively, ownership
of fund shares is passed through to insurance company contract and policy
holders. The holders of the shares of a fund on the records of a fund are the
insurance companies and no information concerning fund holdings of specific
contract and policy holders is maintained by a fund. The insurance companies
place orders for the purchase and redemption of fund shares with a fund
reflecting the investment of premiums paid, surrender and transfer requests and
other matters on a net basis; they maintain all records of the transactions and
holdings of fund shares and distributions thereon for individual contract and
policy holders; and they prepare and mail to contract and policy holders
confirmations and periodic account statements reflecting such transactions and
holdings.
A fund may compensate certain insurance companies for record keeping and other
administrative services performed with regard to holdings of Class B shares as
an expense of the Class B shares up to 0.15%. These fees are included within
the "Other Expenses" category in the fee table for each portfolio in the Class
B Shares Prospectus (see How Much Investors Pay in the applicable fund's
prospectus). In addition, the Advisor may, from time to time, pay from its own
resources certain insurance companies for record keeping and other
administrative services related to Class A and Class B shares of the Portfolios
held by such insurance companies on behalf of their contract and policy holders
(see Financial Intermediary Support Payments below).
FINANCIAL INTERMEDIARY SUPPORT PAYMENTS. In light of recent regulatory
developments, the Advisor, the Distributor and their affiliates have undertaken
to furnish certain additional information below regarding the level of payments
made by them to selected affiliated and unaffiliated brokers, dealers,
participating insurance companies or other financial intermediaries (financial
advisors) in connection with the sale and/or distribution of fund shares or the
retention and/or servicing of investors and fund shares (revenue sharing).
The Advisor, the Distributor and/or their affiliates may pay additional
compensation, out of their own assets and not as an additional charge to each
fund, to financial advisors in connection with the sale and/or distribution of
fund shares or the retention and/or servicing of fund investors and fund
shares. Such revenue sharing payments are in addition to any distribution or
service fees payable under any Rule 12b-1 or service plan of any fund, any
record keeping/sub-transfer agency/networking fees payable by each fund
(generally through the Distributor or an affiliate) and/or the Distributor to
certain financial advisors for performing such services and any sales charges,
commissions, non-cash compensation arrangements expressly permitted under
applicable rules of FINRA or other concessions described in the fee table or
elsewhere in the prospectuses or the SAI as payable to all financial advisors.
For example, the Advisor, the Distributor and/or their affiliates may
compensate financial advisors for providing each fund with "shelf space" or
access to a third party platform or fund offering list, or other marketing
programs including, without limitation, inclusion of each fund on preferred or
recommended sales lists, mutual fund "supermarket" platforms and other formal
sales programs; granting the Distributor access to the financial advisor's
sales force; granting the Distributor access to the financial advisor's
conferences and meetings; assistance in training and educating the financial
advisor's personnel; and, obtaining other forms of marketing support. The level
of revenue sharing payments made to financial advisors may be a fixed fee or
based upon one or more of the following factors: gross sales, current assets
and/or number of accounts of each fund attributable to the financial advisor,
the particular fund or fund type or other measures as agreed to by the Advisor,
the Distributor and/or their affiliates and the financial advisors or any
combination thereof. The amount of these payments is determined at the
discretion of the Advisor, the Distributor and/or their affiliates from time to
time, may be substantial, and may be different for different financial advisors
based on, for example, the nature of the services provided by the financial
advisor.
The Advisor, the Distributor and/or their affiliates currently make revenue
sharing payments from their own assets in connection with the sale and/or
distribution of DWS fund shares, or the retention and/or servicing of
investors, to financial advisors in amounts that generally range from 0.01% up
to 0.26% of assets of a fund serviced and maintained by the financial advisor,
0.05% to 0.25% of
II-29
sales of a fund attributable to the financial advisor, a flat fee of $4,000 up
to $10,000, or any combination thereof. These amounts are annual figures
typically paid on a quarterly basis and are subject to change at the discretion
of the Advisor, the Distributor and/or their affiliates. Receipt of, or the
prospect of receiving, this additional compensation, may influence your
financial advisor's recommendation of a fund or of any particular share class
of a fund. You should review your financial advisor's compensation disclosure
and/or talk to your financial advisor to obtain more information on how this
compensation may have influenced your financial advisor's recommendation of a
fund.
The Advisor, the Distributor and/or their affiliates may also make such revenue
sharing payments to financial advisors under the terms discussed above in
connection with the distribution of both DWS funds and non-DWS funds by
financial advisors to retirement plans that obtain record keeping services from
ADP, Inc. or ExpertPlan, Inc. on the DWS Investments branded retirement plan
platform (the "Platform") with the level of revenue sharing payments being
based upon sales of both the DWS funds and the non-DWS funds by the financial
advisor on the Platform or current assets of both the DWS funds and the non-DWS
funds serviced and maintained by the financial advisor on the Platform.
As of the date hereof, each fund has been advised that the Advisor, the
Distributor and their affiliates expect that the firms listed in PART II -
APPENDIX II-E will receive revenue sharing payments at different points during
the coming year as described above.
The Advisor, the Distributor or their affiliates may enter into additional
revenue sharing arrangements or change or discontinue existing arrangements
with financial advisors at any time without notice.
The prospect of receiving, or the receipt of additional compensation or
promotional incentives described above by financial advisors may provide such
financial advisors and/or their salespersons with an incentive to favor sales
of shares of the DWS funds or a particular DWS fund over sales of shares of
mutual funds (or non-mutual fund investments) with respect to which the
financial advisor does not receive additional compensation or promotional
incentives, or receives lower levels of additional compensation or promotional
incentives. Similarly, financial advisors may receive different compensation or
incentives that may influence their recommendation of any particular share
class of a fund or of other funds. These payment arrangements, however, will
not change the price that an investor pays for fund shares or the amount that a
fund receives to invest on behalf of an investor and will not increase fund
expenses. You may wish to take such payment arrangements into account when
considering and evaluating any recommendations relating to fund shares and you
should discuss this matter with your financial advisor and review your
financial advisor's disclosures.
It is likely that broker-dealers that execute portfolio transactions for a fund
will include firms that also sell shares of the DWS funds to their customers.
However, the Advisor will not consider sales of DWS fund shares as a factor in
the selection of broker-dealers to execute portfolio transactions for the DWS
funds. Accordingly, the Advisor has implemented policies and procedures
reasonably designed to prevent its traders from considering sales of DWS fund
shares as a factor in the selection of broker-dealers to execute portfolio
transactions for a fund. In addition, the Advisor, the Distributor and/or their
affiliates will not use fund brokerage to pay for their obligation to provide
additional compensation to financial advisors as described above.
DIVIDENDS (FOR ALL FUNDS EXCEPT MONEY FUNDS). A fund, other than a money fund,
intends to distribute, at least annually: (i) substantially all of its
investment company taxable income (computed without regard to the
dividends-paid deduction), which includes any excess of net realized short-term
capital gains over net realized long-term capital losses and net tax-exempt
income, if any; and (ii) the entire excess of net realized long-term capital
gains over net realized short-term capital losses. However, if a fund
determines that it is in the interest of its shareholders, a fund may decide to
retain all or part of its net realized long-term capital gains for
reinvestment, after paying the related federal taxes. In such a case,
shareholders will generally be treated for federal income tax purposes as
having received their share of such gains, but will then be able to claim a
credit against their federal income tax liability for the federal income tax a
fund pays on such gain. If a fund does not distribute the amount of ordinary
income and/or capital gain required to be distributed by an excise tax
provision of the Code, a fund may be subject to that excise tax on the
undistributed amounts. In certain circumstances, a fund may determine that it
is in the interest of shareholders to distribute less than the required amount.
A fund has a schedule for paying out any earnings to shareholders (see
Understanding Distributions and Taxes in each fund's prospectus).
II-30
Additional distributions may also be made in November or December (or treated
as made on December 31) if necessary to avoid an excise tax imposed under the
Code. Both types of distributions will be made in shares of a fund and
confirmations will be mailed to each shareholder unless a shareholder has
elected to receive cash, in which case a check will be sent.
Any dividends or capital gains distributions declared in October, November or
December with a record date in such a month and paid during the following
January will be treated by shareholders for federal income tax purposes as if
received on December 31 of the calendar year declared.
Dividends paid by a fund with respect to each class of its shares will be
calculated in the same manner, at the same time and on the same day.
The level of income dividends per share (as a percentage of net asset value)
will be lower for Class B and C shares than for other share classes primarily
as a result of the distribution services fee applicable to Class B and C
shares. Distributions of capital gains, if any, will be paid in the same amount
for each class.
Income dividends and capital gain dividends (see Taxation of US Shareholders -
Dividends and Distributions), if any, of a fund will be credited to shareholder
accounts in full and fractional shares of the same class of that fund at net
asset value on the reinvestment date, unless shareholders indicate to the
Shareholder Service Agent, in writing, that they wish to receive them in cash
or in shares of other DWS funds as provided in the fund's prospectus.
Shareholders must maintain the required minimum account balance in the fund
distributing the dividends in order to use this privilege of investing
dividends of a fund in shares of another DWS fund. A fund will reinvest
dividend checks (and future dividends) in shares of that same fund and class if
checks are returned as undeliverable. Dividends and other distributions of a
fund in the aggregate amount of $10 or less are automatically reinvested in
shares of that fund and class unless the shareholder requests in writing that a
check be issued for that particular distribution. Shareholders who chose to
receive distributions by electronic transfer are not subject to this minimum.
If a shareholder has elected to reinvest any dividends and/or other
distributions, such distributions will be made in shares of that fund and
confirmations will be mailed to each shareholder. If a shareholder has chosen
to receive cash, a check will be sent. Distributions of investment company
taxable income and net realized capital gains are generally taxable, whether
made in shares or cash.
Each distribution is accompanied by a brief explanation of the form and
character of the distribution. The characterization of distributions on such
correspondence may differ from the characterization for federal income tax
purposes. Early each year, a fund issues to each shareholder a statement of the
federal income tax status of all distributions in the prior calendar year.
A fund may at any time vary its foregoing distribution practices and,
therefore, reserves the right from time to time to either distribute or retain
for reinvestment such of its net investment income and its net short-term and
net long-term capital gains as its Board determines appropriate under the
then-current circumstances. In particular, and without limiting the foregoing,
a fund may make additional distributions of net investment income or capital
gain net income in order to satisfy the minimum distribution requirements
contained in the Code.
DIVIDENDS (MONEY FUNDS). Dividends are declared daily and paid monthly.
Shareholders will receive dividends in additional shares unless they elect to
receive cash, as provided in a fund's prospectus. Dividends will be reinvested
monthly in shares of a fund at net asset value on the last business day of the
month. A fund will pay shareholders that redeem their entire accounts all
unpaid dividends at the time of the redemption not later than the next dividend
payment date.
Each money fund calculates its dividends based on its daily net investment
income. For this purpose, the net investment income of a money fund generally
consists of (a) accrued interest income plus or minus amortized discount or
premium, (b) plus or minus all short-term realized gains and losses on
investments and (c) minus accrued expenses allocated to the applicable fund.
Expenses of each money fund are accrued each day. Dividends are reinvested
monthly and shareholders will receive monthly confirmations of dividends and of
purchase and redemption transactions except that confirmations of dividend
reinvestment for Individual Retirement Accounts and other fiduciary accounts
for which SSB acts as trustee will be sent quarterly.
Distributions of a fund's pro rata share of a fund's net realized long-term
capital gains in excess of net realized short-term capital losses, if any, and
any undistributed net realized short-term capital gains in excess of net
realized long-term capital losses are normally declared
II-31
and paid annually at the end of the fiscal year in which they were earned to
the extent they are not offset by any capital loss carryforwards.
If the shareholder elects to receive dividends or distributions in cash, checks
will be mailed monthly, within five business days of the reinvestment date, to
the shareholder or any person designated by the shareholder. A fund reinvests
dividend checks (and future dividends) in shares of a fund if checks are
returned as undeliverable. Dividends and other distributions in the aggregate
amount of $10 or less are automatically reinvested in shares of a fund unless
the shareholder requests that such policy not be applied to the shareholder's
account. Shareholders who chose to receive distributions by electronic transfer
are not subject to this minimum.
Dividends and distributions are treated the same for federal income tax
purposes, whether made in shares or cash.
DISTRIBUTION AND SERVICE AGREEMENTS AND PLANS
I. RETAIL FUNDS
A fund may offer only certain of the classes of shares referred to in the
subsections below. Thus, the information provided below in regard to certain
classes of shares is only applicable to funds offering such classes of shares.
RULE 12B-1 PLANS. Certain funds, as described in the applicable prospectuses,
have adopted plans pursuant to Rule 12b-1 under the 1940 Act (each a Rule 12b-1
Plan) on behalf of their Class A, B, C and R shares, as applicable, that
authorize payments out of class assets for distribution and/or shareholder and
administrative services as described in more detail below. Because Rule 12b-1
fees are paid out of class assets on an ongoing basis, they will, over time,
increase the cost of an investment and may cost more than other types of sales
charges.
Rule 12b-1 Plans provide alternative methods for paying sales charges and
provide compensation to DIDI or intermediaries for post-sale servicing, which
may help funds grow or maintain asset levels to provide operational
efficiencies and economies of scale. Each Rule 12b-1 Plan is approved and
reviewed separately for each applicable class in accordance with Rule 12b-1
under the 1940 Act, which regulates the manner in which an investment company
may, directly or indirectly, bear the expenses of distributing its shares. A
Rule 12b-1 Plan may not be amended to increase the fee to be paid by a fund
with respect to a class without approval by a majority of the outstanding
voting securities of such class.
If a Rule 12b-1 Plan is terminated in accordance with its terms, the obligation
of the applicable class to make payments to DIDI pursuant to the Rule 12b-1
Plan will cease and a fund will not be required to make any payments not
previously accrued past the termination date. Thus, there is no legal
obligation for a class to pay any expenses incurred by DIDI other than fees
previously accrued and payable under a Rule 12b-1 Plan, if for any reason the
Rule 12b-1 Plan is terminated in accordance with its terms. Because the Rule
12b-1 Plans are compensation plans, future fees under a Rule 12b-1 Plan may or
may not be sufficient to cover DIDI for its expenses incurred. On the other
hand, under certain circumstances, DIDI might collect in the aggregate over
certain periods more in fees under the applicable Rule 12b-1 Plan than it has
expended over that same period in providing distribution services for a fund.
For example, if Class B shares of a fund were to appreciate (resulting in
greater asset base against which Rule 12b-1 fees are charged) and sales of a
fund's Class B shares were to decline (resulting in lower expenditures by DIDI
under the Rule 12b-1 Plan), fees payable could exceed expenditures. Similarly,
fees paid to DIDI could exceed DIDI's expenditures over certain periods shorter
than the life of the Rule 12b-1 Plan simply due to the timing of expenses
incurred by DIDI that is not matched to the timing of revenues received (e.g.,
a sales commission may be paid by DIDI related to an investment in Class B
shares in year 1, while the Rule 12b-1 fee to DIDI related to that investment
may accrue during year 1 through year 6 prior to conversion of the Class B
shares investment to Class A shares). Under these or other circumstances where
DIDI's expenses are less than the Rule 12b-1 fees, DIDI will retain its full
fees and make a profit.
CLASS B, CLASS C AND CLASS R SHARES
FEES FOR DISTRIBUTION SERVICES. For its services under the Distribution
Agreement, DIDI receives a fee from a fund under its Rule 12b-1 Plan, payable
monthly, at the annual rate of 0.75% of average daily net assets of a fund
attributable to its Class B shares. This fee is accrued daily as an expense of
Class B shares. Under the Distribution Agreement, DIDI also receives any
contingent deferred sales charges paid with respect to Class B shares. DIDI
currently compensates firms for sales of Class B shares at a commission rate of
3.75%.
II-32
For its services under the Distribution Agreement, DIDI receives a fee from a
fund under its Rule 12b-1 Plan, payable monthly, at the annual rate of 0.75% of
average daily net assets of a fund attributable to Class C shares. This fee is
accrued daily as an expense of Class C shares. DIDI currently advances to firms
the first year distribution fee at a rate of 0.75% of the purchase price of
Class C shares. DIDI does not advance the first year distribution fee to firms
for sales of Class C shares to employer-sponsored employee benefit plans using
the OmniPlus subaccount record keeping system made available through ADP, Inc.
under an alliance between ADP, Inc. and DIDI and its affiliates. For periods
after the first year, DIDI currently pays firms for sales of Class C shares a
distribution fee, payable quarterly, at an annual rate of 0.75% of net assets
attributable to Class C shares maintained and serviced by the firm. This fee
continues until terminated by DIDI or the applicable fund. Under the
Distribution Agreement, DIDI also receives any contingent deferred sales
charges paid with respect to Class C shares.
For its services under the Distribution Agreement, DIDI receives a fee from a
fund under its Rule 12b-1 Plan, payable monthly, at the annual rate of 0.25% of
average daily net assets of a fund attributable to Class R shares. This fee is
accrued daily as an expense of Class R shares. DIDI currently pays firms for
sales of Class R shares a distribution fee, payable quarterly, at an annual
rate of 0.25% of net assets attributable to Class R shares maintained and
serviced by the firm. This fee continues until terminated by DIDI or the
applicable fund.
CLASS A, CLASS B, CLASS C AND CLASS R SHARES
FEES FOR SHAREHOLDER SERVICES. For its services under the Services Agreement,
DIDI receives a shareholder services fee from a fund under a Rule 12b-1 Plan,
payable monthly, at an annual rate of up to 0.25% of the average daily net
assets of Class A, B, C and R shares of a fund, as applicable.
With respect to Class A and Class R Shares of a fund, DIDI pays each firm a
service fee, payable quarterly, at an annual rate of up to 0.25% of the net
assets in fund accounts that it maintains and services attributable to Class A
and Class R Shares of a fund, generally commencing with the month after
investment. With respect to Class B and Class C Shares of a fund, DIDI
currently advances to firms the first-year service fee at a rate of up to 0.25%
of the purchase price of such shares. DIDI does not advance the first year
service fee to firms for sales of Class C shares to employer-sponsored employee
benefit plans using the OmniPlus subaccount record keeping system made
available through ADP, Inc. under an alliance between ADP, Inc. and DIDI and
its affiliates. For periods after the first year, DIDI currently intends to pay
firms a service fee at a rate of up to 0.25% (calculated monthly and paid
quarterly) of the net assets attributable to Class B and Class C shares of a
fund maintained and serviced by the firm.
Firms to which service fees may be paid include affiliates of DIDI. In addition
DIDI may, from time to time, pay certain firms from it own resources additional
amounts for ongoing administrative services and assistance provided to their
customers and clients who are shareholders of a fund.
DIDI also may provide some of the above services and may retain any portion of
the fee under the Services Agreement not paid to firms to compensate itself for
shareholder or administrative functions performed for a fund. Currently, the
shareholder services fee payable to DIDI is payable at an annual rate of up to
0.25% of net assets based upon fund assets in accounts for which a firm
provides administrative services and at the annual rate of 0.15% of net assets
based upon fund assets in accounts for which there is no firm of record (other
than DIDI) listed on a fund's records. The effective shareholder services fee
rate to be charged against all assets of each fund while this procedure is in
effect will depend upon the proportion of fund assets that is held in accounts
for which a firm of record provides shareholder services. The Board of each
fund, in its discretion, may approve basing the fee to DIDI at the annual rate
of 0.25% on all fund assets in the future.
II. MONEY MARKET FUNDS (EXCEPT DWS CASH INVESTMENT TRUST CLASS A, B AND C
SHARES, WHICH ARE ADDRESSED UNDER RETAIL FUNDS ABOVE)
RULE 12B-1 PLANS. Certain Money Market Funds have adopted for certain classes
of shares a plan pursuant to Rule 12b-1 under the 1940 Act (each a Rule 12b-1
Plan) that provides for fees payable as an expense of the class that are used
by DIDI to pay for distribution services for those classes. Additionally, in
accordance with the Rule 12b-1 Plan for certain classes, shareholder and
administrative services are provided to the applicable fund for the benefit of
the relevant classes under a fund's Services Agreement with DIDI. With respect
to certain classes, shareholder and administrative services may be provided
outside of a Rule 12b-1 Plan either by DIDI pursuant to the Services Agreement
or by financial services firms under a Shareholder Services Plan. Because Rule
12b-1
II-33
fees are paid out of fund assets on an ongoing basis, they will, over time,
increase the cost of an investment and may cost more than other types of sales
charges.
The Rule 12b-1 Plans provide alternative methods for paying for distribution
services and provide compensation to DIDI or financial services firms for
post-sales servicing, which may help funds grow or maintain asset levels to
provide operational efficiencies and economies of scale. Each Rule 12b-1 Plan
is approved and reviewed separately for each such class in accordance with Rule
12b-1 under the 1940 Act, which regulates the manner in which an investment
company may, directly or indirectly, bear the expenses of distributing its
shares. A Rule 12b-1 Plan may not be amended to increase the fee to be paid by
a fund with respect to a class without approval by a majority of the
outstanding voting securities of such class of a fund.
If a Rule 12b-1 Plan is terminated in accordance with its terms, the obligation
of the applicable fund to make payments to DIDI pursuant to the Rule 12b-1 Plan
will cease and a fund will not be required to make any payments not previously
accrued past the termination date. Thus, there is no legal obligation for a
fund to pay any expenses incurred by DIDI other than fees previously accrued
and payable under a Rule 12b-1 Plan, if for any reason the Rule 12b-1 Plan is
terminated in accordance with its terms. Because the Rule 12b-1 Plans are
compensation plans, future fees under a Rule 12b-1 Plan may or may not be
sufficient to cover DIDI for its expenses incurred. On the other hand, under
certain circumstances, DIDI might collect in the aggregate over certain periods
more in fees under the applicable Rule 12b-1 Plan than it has expended over
that same period.
DISTRIBUTION AND SHAREHOLDER SERVICES
Service Shares - Cash Account Trust. The Distribution Agreement authorizes the
fund to pay DIDI, as an expense of the Service Shares classes of the Money
Market Portfolio, the Government & Agency Securities Portfolio and the
Tax-Exempt Portfolio of Cash Account Trust, a distribution services fee,
payable monthly, at an annual rate of 0.60% of average daily net assets of the
Service Shares of the applicable fund. This fee is paid pursuant to a Rule
12b-1 Plan. DIDI normally pays firms a fee for distribution and administrative
services, payable monthly, at a maximum annual rate of up to 0.60% of average
daily net assets of Service Shares held in accounts that they maintain and
service.
Premier Shares - Tax-Exempt California Money Market Fund. The Distribution
Agreement authorizes the fund to pay DIDI, as an expense of the Premier Shares
class of the Tax-Exempt California Money Market Fund, a distribution services
fee, payable monthly, at an annual rate of 0.33% of average daily net assets of
the Premier Shares of the fund. This fee is paid pursuant to a Rule 12b-1 Plan.
DIDI normally pays firms a fee for distribution and administrative services,
payable monthly, at a maximum annual rate of up to 0.33% of average daily net
assets of Premier Shares held in accounts that they maintain and service.
Tax-Exempt New York Money Market Fund - NY Tax Free Money Fund. The
Distribution Agreement authorizes the fund to pay DIDI, as an expense of
Tax-Exempt New York Money Market Fund shares, a class of NY Tax Free Money
fund, a series of DWS Advisor funds, a distribution services fee, payable
monthly, at an annual rate of 0.50% of average daily net assets of the
Tax-Exempt New York Money Market Fund shares of the fund. This fee is paid
pursuant to a Rule 12b-1 Plan. DIDI normally pays firms a fee for distribution
and administrative services, payable monthly, at a maximum annual rate of up to
0.50% of average daily net assets of Tax-Exempt New York Money Market Fund
shares held in accounts that they maintain and service.
Premium Reserve Money Market Shares - Cash Account Trust. The Services
Agreement authorizes the fund to pay DIDI, as an expense of the Premium Reserve
Money Market Shares class of the Money Market Portfolio of Cash Account Trust,
an administrative service fee, payable monthly, at an annual rate of 0.25% of
average daily net assets of the Premium Reserve Money Market Shares of the
fund. A portion of this administrative service fee (0.10% of the 0.25% fee) is
paid pursuant to a Rule 12b-1 Plan. The Premium Money Market Reserve Shares pay
the full amount authorized by the Plan as part of its 0.25% administrative
service rate. DIDI normally pays firms a fee for administrative services,
payable monthly, at a maximum annual rate of up to 0.25% of average daily net
assets of Premium Reserve Money Market Shares held in accounts that they
maintain and service.
Premier Money Market Shares - Cash Account Trust and Investors Cash Trust. The
Distribution Agreement authorizes a fund to pay DIDI, as an expense of the
Premier Money Market Shares classes of the Money Market Portfolio and the
Tax-Exempt Portfolio of Cash Account Trust and of the Treasury Portfolio of
Investors Cash Trust, a distribution services fee, payable monthly, at an
annual rate of 0.25% of average daily net assets of the Premier
II-34
Money Market Shares of the applicable fund. This fee is paid pursuant to a Rule
12b-1 Plan. DIDI normally pays firms a fee for distribution services, payable
monthly, at a maximum annual rate of up to 0.25% of average daily net assets of
Premier Money Market Shares held in accounts that they maintain and service.
The Services Agreement authorizes a fund to pay DIDI, as an expense of the
Premier Money Market Shares of the aforementioned funds, an administrative
service fee, payable monthly, at an annual rate of 0.25% of average daily net
assets of the Premier Money Market Shares of the applicable fund. This
administrative service fee is not paid pursuant to a Rule 12b-1 Plan. DIDI
normally pays firms a fee for administrative services, payable monthly, at a
maximum annual rate of up to 0.25% of average daily net assets of Premier Money
Market Shares held in accounts that they maintain and service.
Davidson Cash Equivalent Shares - Cash Account Trust. The Distribution
Agreement authorizes a fund to pay DIDI, as an expense of the Davidson Cash
Equivalent Shares and the Davidson Cash Equivalent Plus Shares classes of the
Money Market Portfolio, the Government & Agency Securities Portfolio and the
Tax-Exempt Portfolio of Cash Account Trust, a distribution services fee,
payable monthly, at an annual rate of 0.30% in the case of the Davidson Cash
Equivalent Shares and 0.25% in the case of the Davidson Cash Equivalent Plus
Shares of average daily net assets of the applicable class of a fund. This fee
is paid pursuant to a Rule 12b-1 Plan. DIDI normally pays the sole
sub-distributor for the classes, D.A. Davidson & Co., a fee for distribution
services, payable monthly, at a maximum annual rate of up to 0.30% of average
daily net assets of those accounts in the Davidson Cash Equivalent Shares that
it maintains and services and 0.25% of average daily net assets in the case of
those accounts in the Davidson Cash Equivalent Plus Shares that it maintains
and services. The Services Agreement authorizes a fund to pay DIDI, as an
expense of the aforementioned classes, an administrative service fee, payable
monthly, at an annual rate of 0.25% in the case of the Davidson Cash Equivalent
Shares and 0.25% (currently limited to 0.20%) in the case of the Davidson Cash
Equivalent Plus Shares of average daily net assets of those shares of a fund.
This administrative service fee is not paid pursuant to a Rule 12b-1 Plan. DIDI
normally pays the sole sub-distributor a fee for administrative services,
payable monthly, at a maximum annual rate of up to 0.25% of average daily net
assets of those accounts in the Davidson Cash Equivalent Shares that it
maintains and services and 0.20% of average daily net assets in the case of
those accounts in the Davidson Cash Equivalent Plus Shares that it maintains
and services. The Davidson Cash Equivalent Plus Shares class is limited to the
Money Market Portfolio and the Government & Agency Securities Portfolio.
Capital Assets Funds - Cash Account Trust. The Distribution Agreement
authorizes a fund to pay DIDI, as an expense of the Capital Assets Funds Shares
and the Capital Assets Funds Preferred Shares classes of the Money Market
Portfolio, the Government & Agency Securities Portfolio and the Tax-Exempt
Portfolio of Cash Account Trust, a distribution services fee, payable monthly,
at an annual rate of 0.33% in the case of the Capital Assets Funds Shares and
0.20% in the case of the Capital Assets Funds Preferred Shares of average daily
net assets of the applicable class of a fund. This fee is paid pursuant to a
Rule 12b-1 Plan. DIDI normally pays the sole sub-distributor for the classes,
RIDGE Clearing and Outsourcing Services, Inc., a fee for distribution services,
payable monthly, at a maximum annual rate of up to 0.33% of average daily net
assets of those accounts in the Capital Assets Funds Shares that it maintains
and services and 0.20% of average daily net assets in the case of those
accounts in the Capital Assets Funds Preferred Shares that it maintains and
services. The Services Agreement authorizes a fund to pay DIDI, as an expense
of the aforementioned classes, an administrative service fee, payable monthly,
at an annual rate of 0.25% in the case of the Capital Assets Funds Shares and
0.10% in the case of the Capital Assets Funds Preferred Shares of average daily
net assets of the applicable class of a fund. This administrative service fee
is not paid pursuant to a Rule 12b-1 Plan. DIDI normally pays the sole
sub-distributor a fee for administrative services, payable monthly, at a
maximum annual rate of up to 0.25% of average daily net assets of those
accounts in the Capital Assets Funds Shares that it maintains and services and
0.10% of average daily net assets in the case of those accounts in the Capital
Assets Funds Preferred Shares that it maintains and services. The Capital
Assets Funds Preferred Shares class is limited to the Money Market Portfolio.
Managed Shares - Cash Account Trust. The Services Agreement currently
authorizes a fund to pay DIDI, as an expense of the Government Cash Managed
Shares class of the Government & Agency Securities Portfolio of Cash Account
Trust and the Tax-Exempt Cash Managed Shares class of the Tax-Exempt Portfolio
of Cash Account Trust, an administrative service fee, payable monthly, at an
annual rate of 0.15% of average daily net assets of the Managed Shares of a
fund. This fee is paid pursuant to a Rule 12b-1 Plan. The Rule 12b-1 Plan
authorizes the payment of up to 0.25% of average daily net assets of those
shares of a fund and, at the discretion of the Board,
II-35
the administrative service fee may be increased from the current level to a
maximum of 0.25% of average daily net assets. DIDI normally pays firms a fee
for administrative services, payable monthly, at a maximum annual rate of up to
0.15% of average daily net assets of Managed Shares held in accounts that they
maintain and service.
Institutional Shares - Investors Cash Trust. The Services Agreement authorizes
the fund to pay DIDI, as an expense of the Institutional Shares class of the
Treasury Portfolio of Investors Cash Trust, an administrative service fee,
payable monthly, at an annual rate of 0.05% of average daily net assets of the
Institutional Shares of the fund, which may be increased to 0.10% in the
discretion of the Board. This fee is not paid pursuant to a Rule 12b-1 Plan.
DIDI normally pays firms a fee for administrative services, payable monthly, at
a maximum annual rate of up to 0.05% of average daily net assets of
Institutional Shares held in accounts that they maintain and service.
Tax-Free Investment Class - Cash Account Trust and Investment Class - Investors
Cash Trust. The Distribution Agreement authorizes a fund to pay DIDI, as an
expense of the Tax-Free Investment Class of the Tax-Exempt Portfolio of Cash
Account Trust and the Investment Class of the Treasury Portfolio of Investors
Cash Trust (collectively, Investment Class), a distribution services fee,
payable monthly, at an annual rate of 0.25% of average daily net assets of the
Investment Class shares of the applicable fund. This fee is paid pursuant to a
Rule 12b-1 Plan. DIDI normally pays firms a fee for distribution services,
payable monthly, at a maximum annual rate of up to 0.25% of average daily net
assets of shares of the Investment Class held in accounts that they maintain
and service. The Services Agreement authorizes a fund to pay DIDI, as an
expense of the Investment Class of the aforementioned funds, an administrative
service fee, payable monthly, at an annual rate of 0.07% of average daily net
assets of the Investment Class shares of the applicable fund. This
administrative service fee is not paid pursuant to Rule 12b-1 Plan. DIDI
normally pays firms a fee for administrative services, payable monthly, at a
maximum annual rate of up to 0.07% of average daily net assets of shares of the
Investment Class held in accounts that they maintain and service.
Cash Reserve Prime Shares - Cash Reserve Fund, Inc. The Distribution Agreement
authorizes the fund to pay DIDI, as an expense of the Cash Reserve Prime Shares
class of the Prime Series of Cash Reserve Fund Inc., a distribution services
fee, payable monthly, at an annual rate of 0.25% of average daily net assets of
the Cash Reserve Prime Shares of the fund. This fee is paid pursuant to a Rule
12b-1 Plan. DIDI normally pays firms a fee for distribution services, payable
monthly, at a maximum annual rate of up to 0.25% of average daily net assets of
shares of the Cash Reserve Prime Shares held in accounts that they maintain and
service. The Distribution Agreement also authorizes the fund to pay DIDI, as an
expense of the Cash Reserve Prime Shares, an administrative service fee,
payable monthly, at an annual rate of 0.07% of average daily net assets of the
Cash Reserve Prime Shares of the fund. This administrative service fee is not
paid pursuant to a Rule 12b-1 Plan. DIDI normally pays firms a fee for
administrative services, payable monthly, at a maximum annual rate of up to
0.07% of average daily net assets of shares of the Cash Reserve Prime Shares
held in accounts that they maintain and service.
Managed Shares - Cash Reserve Fund, Inc. The Services Agreement authorizes the
fund to pay DIDI, as an expense of the Managed Shares class of the Prime Series
of Cash Reserve Fund, Inc., an administrative service fee, payable monthly, at
an annual rate of 0.15% of average daily net assets of the Managed Shares of
the fund. This fee is paid pursuant to a Rule 12b-1 Plan. DIDI normally pays
firms a fee for adminstrative services, payable monthly, at a maximum annual
rate of up to 0.15% of average daily net assets of Managed Shares held in
accounts that they maintain and service.
Shareholder Services Plan for Cash Management Fund - Institutional and Cash
Reserves Fund - Institutional, each a series of DWS Institutional Funds, and NY
Tax Free Money Fund Investment Class and Tax-Free Money Fund Investment Premier
Shares, each a series and class of DWS Advisor Funds. Each fund has adopted for
the classes specified (Class) a shareholder service plan (Plan). Under the
Plan, which is not a Rule 12b-1 Plan, a fund may pay financial services firms a
service fee at an annual rate of up to 0.25 of 1% of the average daily net
assets of shares of the Class held in accounts that the firm maintains and
services. The service fee is accrued daily as an expense of the Class. A fund
together with DIDI may enter into agreements with firms pursuant to which the
firms provide personal service and/or maintenance of shareholder accounts
including, but not limited to, establishing and maintaining shareholder
accounts and records, distributing monthly statements, processing purchase and
redemption transactions, automatic investment in fund shares of client account
cash balances, answering routine client inquiries regarding a fund, assistance
to clients in changing dividend options, account designations and addresses,
aggregating trades of all the firm's clients, providing account information to
clients
II-36
in client sensitive formats and such other services as a fund may reasonably
request. Service fees are not payable for advertising, promotion or other
distribution services.
The Plan continues in effect from year to year so long as its continuance is
approved at least annually by the vote of a majority of (a) the Board, and (b)
the Board Members who are not "interested persons" of a fund and who have no
direct or indirect financial interest in the operation of the Plan, or any
related agreements. The Plan may be terminated with respect to the Class at any
time by vote of the Board, including a vote by the Board Members who are not
"interested persons" of a fund and who have no direct or indirect financial
interest in the operation of the Plan, or any related agreements. The Plan may
not be amended to increase materially the amount of service fees provided for
in the Plan unless the amendment is approved in the manner provided for annual
continuance of the Plan discussed above. If the Plan is terminated or not
renewed, a fund will not be obligated to make any payments of service fees that
accrued after the termination date.
III. DWS VARIABLE SERIES I AND DWS VARIABLE SERIES II
RULE 12B-1 PLAN. Each fund of DWS Variable Series I and DWS Variable Series II
that has authorized the issuance of Class B shares has adopted a distribution
plan under Rule 12b-1 (Plan) that provides for fees payable as an expense of
the Class B shares. Under the Plan, a fund may make quarterly payments as
reimbursement to DIDI for distribution and shareholder servicing related
expenses incurred or paid by the Distributor or a participating insurance
company. No such payment shall be made with respect to any quarterly period in
excess of an amount determined for such period at the annual rate of 0.25% of
the average daily net assets of Class B shares during that quarterly period.
The fee is payable by a fund, on behalf of Class B shares, of up to 0.25% of
the average daily net assets attributable to Class B shares of the fund.
Because 12b-1 fees are paid out of fund assets on an ongoing basis, they will,
over time, increase the cost of investment and may cost more than other types
of sales charges. The Plan and any Rule 12b-1 related agreement that is entered
into by a fund or the Distributor in connection with the Plan will continue in
effect for a period of more than one year only so long as continuance is
specifically approved at least annually by a vote of a majority of the Board,
and of a majority of the Board Members who are not interested persons (as
defined in the 1940 Act) of a fund, cast in person at a meeting called for the
purpose of voting on the Plan, or the Rule 12b-1 related agreement, as
applicable. In addition, the Plan and any Rule 12b-1 related agreement may be
terminated as to Class B shares of a fund at any time, without penalty, by vote
of a majority of the outstanding Class B shares of that fund or by vote of a
majority of the Board Members who are not interested persons of a fund and who
have no direct or indirect financial interest in the operation of the Plan or
any Rule 12b-1 related agreement. The Plan provides that it may not be amended
to increase materially the amount that may be spent for distribution of Class B
shares of a fund without the approval of Class B shareholders of that fund.
IV. DWS INVESTMENTS VIT FUNDS
RULE 12B-1 PLAN. DWS Equity 500 Index VIP and DWS Small Cap Index VIP of DWS
Investments VIT Funds have each adopted a distribution plan under Rule 12b-1
(Plan) that provides for fees payable as an expense of the Class B shares and,
in the case of the DWS Equity 500 Index VIP, the Class B-2 shares. Under the
Plan, a fund may make payments to DIDI for remittance directly or indirectly to
a participating dealer, shareholder service agent, life insurance company or
other applicable party a fee in an amount not to exceed the annual rate of
0.25% of the average daily net assets of the Class B shares or Class B-2
shares, as applicable, under a participation agreement, service agreement,
sub-distribution agreement or other similar agreement which provides for Class
B shares or Class B-2 shares. DIDI is authorized pursuant to the Plan to pay
for anything reasonably designed to enhance sales or retention of shareholders
and for the provision of services to shareholders of the Class B shares or
Class B-2 shares. Because 12b-1 fees are paid out of fund assets on an ongoing
basis, they will, over time, increase the cost of investment in Class B or
Class B-2 shares, and may cost more than other types of sales charges. The Plan
and any Rule 12b-1 related agreement that is entered into by a fund or the
Distributor in connection with the Plan will continue in effect for a period of
more than one year only so long as continuance is specifically approved at
least annually by a vote of a majority of the Board, and of a majority of the
Board Members who are not interested persons (as defined in the 1940 Act) of a
fund, cast in person at a meeting called for the purpose of voting on the Plan,
or the Rule 12b-1 related agreement, as applicable. In addition, the Plan and
any Rule 12b-1 related agreement may be terminated as to Class B shares or
Class B-2 shares of a fund at any time, without penalty, by vote of a majority
of the outstanding Class B shares or Class B-2 shares, as applicable, of that
fund or by vote of a majority of the Board Members who are not interested
persons of a fund and who have no direct or indirect financial interest in the
operation of the Plan or any Rule 12b-1 related agreement. The Plan provides
that it may not be amended to increase materially the amount that
II-37
may be spent for distribution of Class B shares or Class B-2 shares of a fund
without the approval of the shareholders of such class.
INVESTMENTS
GENERAL INVESTMENT PRACTICES AND TECHNIQUES
PART II - APPENDIX II-G includes a description of the investment practices and
techniques which a fund may employ in pursuing its investment objective, as
well as the associated risks. Descriptions in this SAI of a particular
investment practice or technique in which a fund may engage are meant to
describe the spectrum of investments that the Advisor (and/or sub-advisor or
sub-subadvisor, if applicable) in its discretion might, but is not required to,
use in managing a fund. The Advisor (and/or sub-advisor or sub-subadvisor, if
applicable) may in its discretion at any time employ such practice, technique
or instrument for one or more funds but not for all funds advised by it.
Furthermore, it is possible that certain types of financial instruments or
investment techniques described herein may not be available, permissible,
economically feasible or effective for their intended purposes in all markets.
Certain practices, techniques or instruments may not be principal activities of
the fund, but, to the extent employed, could from time to time have a material
impact on a fund's performance.
IT IS POSSIBLE THAT CERTAIN INVESTMENT PRACTICES AND TECHNIQUES MAY NOT BE
PERMISSIBLE FOR A FUND BASED ON ITS INVESTMENT RESTRICTIONS, AS DESCRIBED
HEREIN, AND IN A FUND'S PROSPECTUS.
PORTFOLIO TRANSACTIONS
The Advisor is generally responsible for placing orders for the purchase and
sale of portfolio securities, including the allocation of brokerage. With
respect to those funds for which a sub-investment advisor manages a fund's
investments, references in this section to the "Advisor" should be read to mean
the Subadvisor, except as noted below.
The policy of the Advisor in placing orders for the purchase and sale of
securities for a fund is to seek best execution, taking into account such
factors, among others, as price; commission (where applicable); the
broker-dealer's ability to ensure that securities will be delivered on
settlement date; the willingness of the broker-dealer to commit its capital and
purchase a thinly traded security for its own inventory; whether the
broker-dealer specializes in block orders or large program trades; the
broker-dealer's knowledge of the market and the security; the broker-dealer's
ability to maintain confidentiality; the broker-dealer's ability to provide
access to new issues; the broker-dealer's ability to provide support when
placing a difficult trade; the financial condition of the broker-dealer; and
whether the broker-dealer has the infrastructure and operational capabilities
to execute and settle the trade. The Advisor seeks to evaluate the overall
reasonableness of brokerage commissions with commissions charged on comparable
transactions and compares the brokerage commissions (if any) paid by the funds
to reported commissions paid by others. The Advisor routinely reviews
commission rates, execution and settlement services performed and makes
internal and external comparisons.
Commission rates on transactions in equity securities on US securities
exchanges are subject to negotiation. Commission rates on transactions in
equity securities on foreign securities exchanges are generally fixed.
Purchases and sales of fixed-income securities and certain over-the-counter
securities are effected on a net basis, without the payment of brokerage
commissions. Transactions in fixed income and certain over-the-counter
securities are generally placed by the Advisor with the principal market makers
for these securities unless the Advisor reasonably believes more favorable
results are available elsewhere. Transactions with dealers serving as market
makers reflect the spread between the bid and asked prices. Purchases of
underwritten issues will include an underwriting fee paid to the underwriter.
Money market instruments are normally purchased in principal transactions
directly from the issuer or from an underwriter or market maker.
It is likely that the broker-dealers selected based on the considerations
described in this section will include firms that also sell shares of the funds
to their customers. However, the Advisor does not consider sales of shares of
the funds as a factor in the selection of broker-dealers to execute portfolio
transactions for the funds and, accordingly, has implemented policies and
procedures reasonably designed to prevent its traders from considering sales of
shares of the funds as a factor in the selection of broker-dealers to execute
portfolio transactions for the funds.
The Advisor is permitted by Section 28(e) of the Securities Exchange Act of
1934, as amended (1934 Act), when placing portfolio transactions for a fund, to
cause a fund to pay brokerage commissions in excess of that which another
broker-dealer might charge for executing the same transaction in order to
obtain research and brokerage services if the Advisor determines that such
commissions are reasonable in relation to the overall services
II-38
provided. The Advisor may from time to time, in reliance on Section 28(e) of
the 1934 Act, execute portfolio transactions with broker-dealers that provide
research and brokerage services to the Advisor. Consistent with the Advisor's
policy regarding best execution, where more than one broker is believed to be
capable of providing best execution for a particular trade, the Advisor may
take into consideration the receipt of research and brokerage services in
selecting the broker-dealer to execute the trade. Although certain research and
brokerage services from broker-dealers may be useful to a fund and to the
Advisor, it is the opinion of the Advisor that such information only
supplements its own research effort since the information must still be
analyzed, weighed and reviewed by the Advisor's staff. To the extent that
research and brokerage services of value are received by the Advisor, the
Advisor may avoid expenses that it might otherwise incur. Research and
brokerage services received from a broker-dealer may be useful to the Advisor
and its affiliates in providing investment management services to all or some
of its clients, which includes a fund. Services received from broker-dealers
that executed securities transactions for a fund will not necessarily be used
by the Advisor specifically to service that fund.
Research and brokerage services provided by broker-dealers may include, but are
not limited to, information on the economy, industries, groups of securities,
individual companies, statistical information, accounting and tax law
interpretations, political developments, legal developments affecting portfolio
securities, technical market action, pricing and appraisal services, credit
analysis, risk measurement analysis, performance analysis and measurement and
analysis of corporate responsibility issues. Research and brokerage services
are typically received in the form of written or electronic reports, access to
specialized financial publications, telephone contacts and personal meetings
with security analysts, but may also be provided in the form of access to
various computer software and meetings arranged with corporate and industry
representatives.
The Advisor may also select broker-dealers and obtain from them research and
brokerage services that are used in connection with executing trades provided
that such services are consistent with interpretations under Section 28(e) of
the 1934 Act. Typically, these services take the form of computer software
and/or electronic communication services used by the Advisor to facilitate
trading activity with those broker-dealers.
Research and brokerage services may include products obtained from third
parties if the Advisor determines that such product or service constitutes
brokerage and research as defined in Section 28(e) and interpretations
thereunder. Provided a Subadvisor is acting in accordance with any instructions
and directions of the Advisor or the Board, the Subadvisor is authorized to pay
to a broker or dealer who provides third party brokerage and research services
a commission for executing a portfolio transaction for a fund in excess of what
another broker or dealer may charge, if the Subadvisor determines in good faith
that such commission was reasonable in relation to the value of the third party
brokerage and research services provided by such broker or dealer.
The Advisor may use brokerage commissions to obtain certain brokerage products
or services that have a mixed use (i.e., it also serves a function that does
not relate to the investment decision-making process). In those circumstances,
the Advisor will make a good faith judgment to evaluate the various benefits
and uses to which it intends to put the mixed use product or service and will
pay for that portion of the mixed use product or service that it reasonably
believes does not constitute research and brokerage services with its own
resources.
The Advisor will monitor regulatory developments and market practice in the use
of client commissions to obtain research and brokerage services and may adjust
its portfolio transactions policies in response thereto.
Investment decisions for a fund and for other investment accounts managed by
the Advisor are made independently of each other in light of differing
conditions. However, the same investment decision may be made for two or more
of such accounts. In such cases, simultaneous transactions are inevitable. To
the extent permitted by law, the Advisor may aggregate the securities to be
sold or purchased for a fund with those to be sold or purchased for other
accounts in executing transactions. Purchases or sales are then averaged as to
price and commission and allocated as to amount in a manner deemed equitable to
each account. While in some cases this practice could have a detrimental effect
on the price paid or received by, or on the size of the position obtained or
disposed of for, a fund, in other cases it is believed that the ability to
engage in volume transactions will be beneficial to a fund.
The Advisor and its affiliates and each fund's management team manage other
mutual funds and separate accounts, some of which use short sales of securities
as a part of its investment strategy. The simultaneous management of long and
short portfolios creates potential conflicts of interest including the risk
that short sale activity could adversely affect the market value of the long
positions
II-39
(and vice versa), the risk arising from sequential orders in long and short
positions, and the risks associated with receiving opposing orders at the same
time. The Advisor has adopted procedures that it believes are reasonably
designed to mitigate these potential conflicts of interest. Incorporated in the
procedures are specific guidelines developed to ensure fair and equitable
treatment for all clients. The Advisor and the investment team have established
monitoring procedures and a protocol for supervisory reviews, as well as
compliance oversight to ensure that potential conflicts of interest relating to
this type of activity are properly addressed.
Deutsche Bank AG or one of its affiliates (or in the case of a Subadvisor, the
Subadvisor or one of its affiliates) may act as a broker for the funds and
receive brokerage commissions or other transaction-related compensation from
the funds in the purchase and sale of securities, options or futures contracts
when, in the judgment of the Advisor, and in accordance with procedures
approved by the Board, the affiliated broker will be able to obtain a price and
execution at least as favorable as those obtained from other qualified brokers
and if, in the transaction, the affiliated broker charges the funds a rate
consistent with that charged to comparable unaffiliated customers in similar
transactions.
PORTFOLIO TURNOVER. Portfolio turnover rate is defined by the SEC as the ratio
of the lesser of sales or purchases to the monthly average value of such
securities owned during the year, excluding all securities whose remaining
maturities at the time of acquisition were one year or less.
Higher levels of activity by a fund result in higher transaction costs and may
also result in taxes on realized capital gains to be borne by a fund's
shareholders. Purchases and sales are made whenever necessary, in the Advisor's
discretion, to meet a fund's objective.
PORTFOLIO HOLDINGS INFORMATION
In addition to the public disclosure of fund portfolio holdings through
required Securities and Exchange Commission (SEC) quarterly filings, each fund
may make its portfolio holdings information publicly available on the DWS
funds' Web site as described in a fund's prospectus. Each fund does not
disseminate non-public information about portfolio holdings except in
accordance with policies and procedures adopted by a fund.
Each fund's procedures permit non-public portfolio holdings information to be
shared with Deutsche Asset Management and its affiliates (DeAM), subadvisors,
if any, custodians, independent registered public accounting firms, attorneys,
officers and trustees/directors and each of their respective affiliates and
advisers who require access to this information to fulfill their duties to the
fund and are subject to the duties of confidentiality, including the duty not
to trade on non-public information, imposed by law or contract, or by a fund's
procedures. This non-public information may also be disclosed, subject to the
requirements described below, to certain third parties, such as securities
lending agents, financial printers, proxy voting firms, mutual fund analysts
and rating and tracking agencies, or to shareholders in connection with in-kind
redemptions (Authorized Third Parties).
Prior to any disclosure of a fund's non-public portfolio holdings information
to Authorized Third Parties, a person authorized by the Board must make a good
faith determination in light of the facts then known that a fund has a
legitimate business purpose for providing the information, that the disclosure
is in the best interest of a fund, and that the recipient assents or otherwise
has a duty to keep the information confidential and to not trade based on the
information received while the information remains non-public. No compensation
is received by a fund or DeAM for disclosing non-public holdings information.
Periodic reports regarding these procedures will be provided to the Board.
Portfolio holdings information distributed by the trading desks of DeAM or a
subadvisor for the purpose of facilitating efficient trading of such securities
and receipt of relevant research is not subject to the foregoing requirements.
Non-public portfolio holding information does not include portfolio
characteristics (other than holdings or subsets of holdings) about a fund and
information derived therefrom, including, but not limited to, how the fund's
investments are divided among various sectors, industries, countries, value and
growth stocks, bonds, small, mid and large cap stocks, currencies and cash,
types of bonds, bond maturities, duration, bond coupons and bond credit quality
ratings, alpha, beta, tracking error, default rate, portfolio turnover, and
risk and style characteristics so long as the identity of the fund's holdings
could not be derived from such information.
Registered investment companies that are subadvised by DeAM may be subject to
different portfolio holdings disclosure policies, and neither DeAM nor the
Board exercise control over such policies. In addition, separate
II-40
account clients of DeAM have access to their portfolio holdings and are not
subject to a fund's portfolio holdings disclosure policy. The portfolio
holdings of some of the funds subadvised by DeAM and some of the separate
accounts managed by DeAM may substantially overlap with the portfolio holdings
of a fund.
DeAM also manages certain unregistered commingled trusts and creates model
portfolios, the portfolio holdings of which may substantially overlap with the
portfolio holdings of a fund. To the extent that investors in these commingled
trusts or recipients of model portfolio holdings information may receive
portfolio holdings information of their trust or of a model portfolio on a
different basis from that on which fund portfolio holdings information is made
public, DeAM has implemented procedures reasonably designed to encourage such
investors and recipients to keep such information confidential, and to prevent
those investors from trading on the basis of non-public holdings information.
There is no assurance that a fund's policies and procedures with respect to the
disclosure of portfolio holdings information will protect the fund from the
potential misuse of portfolio holdings information by those in possession of
that information.
NET ASSET VALUE
APPLICABLE TO FUNDS OTHER THAN MONEY MARKET FUNDS. The net asset value per
share of a fund is normally computed as of the close of regular trading on the
New York Stock Exchange (Exchange) on each day the Exchange is open for trading
(Value Time). The Exchange is scheduled to be closed on the following holidays:
New Year's Day (except 2011), Dr. Martin Luther King, Jr. Day, Presidents' Day,
Good Friday, Memorial Day, Independence Day, Labor Day, Thanksgiving and
Christmas, and on the preceding Friday or subsequent Monday when one of these
holidays falls on a Saturday or Sunday, respectively. Net asset value per share
is determined separately for each class of shares by dividing the value of the
total assets of the fund attributable to the shares of that class, less all
liabilities attributable to that class, by the total number of shares of that
class outstanding. The per share net asset value may be lower for certain
classes of the fund because of higher expenses borne by these classes.
An equity security is valued at its most recent sale price on the security's
primary exchange or over-the-counter (OTC) market as of the Value Time. Lacking
any sales, the security is valued at the calculated mean between the most
recent bid quotation and the most recent asked quotation (Calculated Mean) on
such exchange or OTC market as of the Value Time. If it is not possible to
determine the Calculated Mean, the security is valued at the most recent bid
quotation on such exchange or OTC market as of the Value Time. In the case of
certain foreign exchanges or OTC markets, the closing price reported by the
foreign exchange or OTC market (which may sometimes be referred to by the
exchange or one or more pricing agents as the "official close" or the "official
closing price" or other similar term) will be considered the most recent sale
price.
Debt securities are valued as follows. Money market instruments purchased with
an original or remaining maturity of 60 days or less, maturing at par, are
valued at amortized cost. Other money market instruments are valued based on
information obtained from an approved pricing agent or, if such information is
not readily available, by using matrix pricing techniques (formula driven
calculations based primarily on current market yields). Bank loans are valued
at prices supplied by an approved pricing agent (which are intended to reflect
the mean between the bid and asked prices), if available, and otherwise at the
mean of the most recent bid and asked quotations or evaluated prices, as
applicable, based on quotations or evaluated prices obtained from one or more
broker-dealers. Privately placed debt securities, other than Rule 144A debt
securities, initially are valued at cost and thereafter based on all relevant
factors, including type of security, size of holding and restrictions on
disposition. Municipal debt securities are valued at prices supplied by an
approved pricing agent (which are intended to reflect the mean between the bid
and asked prices), if available, and otherwise at the mean of the most recent
bid and asked quotations or evaluated prices obtained from a broker-dealer.
Other debt securities are valued at prices supplied by an approved pricing
agent, if available, and otherwise at the most recent bid quotation or
evaluated price, as applicable, obtained from one or more broker-dealers. If it
is not possible to value a particular debt security pursuant to the above
methods, the security is valued on the basis of factors including (but not
limited to) maturity, coupon, creditworthiness, currency denomination, and the
movement of the market in which the security is normally traded.
An exchange-traded option contract on securities, currencies and other
financial instruments is valued at its most recent sale price on the relevant
exchange. Lacking any sales, the option contract is valued at the Calculated
Mean. If it is not possible to determine the Calculated Mean, the option
contract is valued at the most recent bid quotation in the case of a purchased
II-41
option contract or the most recent asked quotation in the case of a written
option contract, in each case as of the Value Time. An option contract on
securities, currencies and other financial instruments traded in the OTC market
is valued as of the Value Time at the evaluated price provided by the
broker-dealer with which it was traded. Futures contracts (and options thereon)
are valued at the most recent settlement price, if available, on the exchange
on which they are traded most extensively. With the exception of stock index
futures contracts which trade on the Chicago Mercantile Exchange, closing
settlement times are prior to the close of trading on the Exchange. For stock
index futures contracts which trade on the Chicago Mercantile Exchange, closing
settlement prices are normally available at approximately 4:20 pm Eastern time.
If no settlement price is available, the last traded price on such exchange
will be used.
If market quotations for a fund asset are not readily available or if the
Advisor believes that the value of a fund asset as determined in accordance
with Board-approved procedures is unreliable, the value of the fund asset is
taken to be an amount which, in the opinion of a fund's Pricing Committee (or,
in some cases, the Board's Valuation Committee), represents fair market value.
The value of other holdings is determined in a manner which is intended to
fairly reflect the fair market value of the asset on the valuation date, based
on valuation procedures adopted by the Board and overseen primarily by a fund's
Pricing Committee.
The following paragraph applies to: DWS Life Compass Retirement Fund, DWS Life
Compass 2015 Fund, DWS Life Compass 2020 Fund, DWS Life Compass 2030 Fund, DWS
Life Compass 2040 Fund, DWS Alternative Asset Allocation Plus Fund, DWS Select
Alternative Asset Allocation Fund and DWS Alternative Asset Allocation Plus
VIP. The net asset value of each Underlying DWS Fund is determined based upon
the nature of the securities as set forth in the prospectus and statement of
additional information of such Underlying DWS Fund. Shares of each Underlying
DWS Fund in which the fund may invest are valued at the net asset value per
share of each Underlying DWS Fund as of the close of regular trading on the
Exchange on each day the Exchange is open for trading. The net asset value per
share of the Underlying DWS Funds will be calculated and reported to the fund
by each Underlying DWS Fund's accounting agent.
The following additional paragraphs apply to: DWS Equity 500 Index Fund and DWS
S&P 500 Index Fund (feeder funds). Each feeder fund pursues its investment
objective by investing substantially all of its assets in a master portfolio -
the DWS Equity 500 Index Portfolio (Portfolio), which has the same investment
objective and is subject to the same investment risks as the feeder fund.
Net asset value per share of a feeder fund is determined as of the Value Time
separately for each class of shares by dividing the value of the total assets
of the feeder fund (i.e., the value of the feeder fund's investment in the
Portfolio and any other assets) attributable to the shares of that class, less
all liabilities attributable to that class, by the total number of shares of
that class outstanding.
As of the Value Time, the Portfolio determines its net value (i.e., the value
of the Portfolio's portfolio instruments and any other assets less all
liabilities) using the valuation procedures for securities and other assets
described above.
Each investor in the Portfolio, including a feeder fund, may add to or reduce
its investment in the Portfolio on each day that net asset value of the feeder
fund and the Portfolio are computed as described above. At the close of a Value
Time, the value of each investor's beneficial interest in the Portfolio will be
determined by multiplying the net value of the Portfolio, determined as
provided above, by the percentage, effective for that day, which represents
that investor's share of the aggregate beneficial interests in the Portfolio.
Any additions or withdrawals, which are to be effected as of the Value Time on
that day, will then be effected. The percentage of the aggregate beneficial
interests in the Portfolio held by each investor in the Portfolio, including a
feeder fund, will then be recomputed as the percentage equal to the fraction
(i) the numerator of which is the value of the investor's investment in the
Portfolio as of the Value Time on such day plus or minus, as the case may be,
the amount of net additions to or withdrawals from such investor's investment
in the Portfolio effected as of the Value Time on such day, and (ii) the
denominator of which is the aggregate net value of the Portfolio, determined as
provided above, as of the Value Time on such day plus or minus, as the case may
be, the amount of net additions to or withdrawals from the aggregate
investments in the Portfolio by all investors, including the feeder fund, in
the Portfolio. The percentage so determined for a feeder fund will then be
applied to determine the value of the feeder fund's interest in the Portfolio
as of the Value Time on the following day that net asset value is determined.
Applicable to money market funds other than DWS Money Market Series, Cash
Management Fund-Institutional, Cash Reserves Fund-Institutional and Prime
Series. The net
II-42
asset value (NAV) per share of a fund is calculated on each day (Valuation Day)
on which the fund is open for business as of the time described in the fund's
prospectus. A fund is open for business each day the New York Stock Exchange
(Exchange) is open for trading, and the fund may, but is not required to,
accept certain types of purchase and redemption orders (not including
exchanges) on days that the Exchange is not open or beyond an early Exchange
closing time, as described in the fund's prospectus. The Exchange is scheduled
to be closed on the following holidays: New Year's Day, Dr. Martin Luther King,
Jr. Day, Presidents' Day, Good Friday, Memorial Day, Independence Day, Labor
Day, Thanksgiving and Christmas, and on the preceding Friday or subsequent
Monday when one of these holidays falls on a Saturday or Sunday, respectively.
Net asset value per share is determined separately for each class of shares by
dividing the value of the total assets of the fund attributable to the shares
of that class, less all liabilities attributable to that class, by the total
number of shares of that class outstanding. Although there is no guarantee, a
fund's NAV per share will normally be $1.00.
A fund values its portfolio instruments at amortized cost, which does not take
into account unrealized capital gains or losses. This involves initially
valuing an instrument at its cost and thereafter assuming a constant
amortization to maturity of any discount or premium, regardless of the impact
of fluctuating interest rates on the market value of the instrument. While this
method provides certainty in valuation, it may result in periods during which
value, as determined by amortized cost, is higher or lower than the price the
fund would receive if it sold the instrument.
The Board has established procedures reasonably designed to stabilize a fund's
NAV per share at $1.00. Under the procedures, the Advisor will monitor and
notify the Board of circumstances where a fund's NAV per share calculated by
using market valuations may deviate from the $1.00 per share calculated using
amortized cost. If there were any deviation that the Board believed would
result in a material dilution or unfair result for investors or existing
shareholders, the Board would promptly consider what action, if any, should be
initiated. Such actions could include selling assets prior to maturity to
realize capital gains or losses; shortening the average maturity of a fund's
portfolio; adjusting the level of dividends; redeeming shares in kind; or
valuing assets based on market valuations. For example, if a fund's net asset
value per share (computed using market values) declined, or was expected to
decline, below $1.00 (computed using amortized cost), the fund might
temporarily reduce or suspend dividend payments in an effort to maintain the
net asset value at $1.00 per share. As a result of such reduction or suspension
of dividends or other action by the Board, an investor would receive less
income during a given period than if such a reduction or suspension had not
taken place. Such action could result in investors receiving no dividend for
the period during which they hold their shares and receiving, upon redemption,
a price per share lower than that which they paid. On the other hand, if a
fund's net asset value per share (computed using market values) were to
increase, or were anticipated to increase above $1.00 (computed using amortized
cost), a fund might supplement dividends in an effort to maintain the net asset
value at $1.00 per share.
Market valuations are obtained by using actual quotations provided by market
makers, estimates of market value, or values obtained from yield data relating
to classes of money market instruments published by reputable sources at the
mean between the bid and asked prices for the instruments. In accordance with
procedures approved by the Board, in the event market quotations are not
readily available for certain portfolio assets the fair value of such portfolio
assets will be determined in good faith by a fund's Pricing Committee (or, in
some cases, the Board's Valuation Committee) based upon input from the Advisor
or other third parties.
Applicable to the following money market funds (each, a fund): DWS Money Market
Series, Cash Management Fund-Institutional, Cash Reserves Fund-Institutional
and Prime Series. Each of these funds pursues its investment objective by
investing substantially all of its assets in a master portfolio - the Cash
Management Portfolio (Portfolio), which has the same investment objective and
is subject to the same investment risks as a fund. The net asset value (NAV)
per share of a fund is calculated on each day (Valuation Day) on which a fund
is open for business as of the time described in a fund's prospectus. The fund
is open for business each day the New York Stock Exchange (Exchange) is open
for trading, and the fund may, but is not required to, accept certain types of
purchase and redemption orders (not including exchanges) on days that the
Exchange is not open or beyond an early Exchange closing time, as described in
a fund's prospectus. The Exchange is scheduled to be closed on the following
holidays: New Year's Day, Dr. Martin Luther King, Jr. Day, Presidents' Day,
Good Friday, Memorial Day, Independence Day, Labor Day, Thanksgiving and
Christmas, and on the preceding Friday or subsequent Monday when one of these
holidays falls on a Saturday or Sunday, respectively. Net asset value per share
is determined separately for each class of shares by dividing the
II-43
value of the total assets of the fund (i.e., the value of a fund's investment
in the Portfolio and any other assets) attributable to the shares of that
class, less all liabilities attributable to that class, by the total number of
shares of that class outstanding. Although there is no guarantee, a fund's NAV
per share will normally be $1.00.
On each Valuation Day, the Portfolio determines its net value (i.e., the value
of the Portfolio's portfolio instruments and any other assets less all
liabilities). The Portfolio values its portfolio instruments at amortized cost,
which does not take into account unrealized capital gains or losses. This
involves initially valuing an instrument at its cost and thereafter assuming a
constant amortization to maturity of any discount or premium, regardless of the
impact of fluctuating interest rates on the market value of the instrument.
While this method provides certainty in valuation, it may result in periods
during which value, as determined by amortized cost, is higher or lower than
the price the Portfolio would receive if it sold the instrument.
Each investor in the Portfolio, including a fund, may add to or reduce its
investment in the Portfolio on each Valuation Day. At the close of each such
Valuation Day, the value of each investor's beneficial interest in the
Portfolio will be determined by multiplying the net value of the Portfolio, as
determined by amortized cost, by the percentage, effective for that day, which
represents that investor's share of the aggregate beneficial interests in the
Portfolio. Any additions or withdrawals, which are to be effected as of the
close of business on that day, will then be effected. The percentage of the
aggregate beneficial interests in the Portfolio held by each investor in the
Portfolio, including a fund will then be recomputed as the percentage equal to
the fraction (i) the numerator of which is the value of the investor's
investment in the Portfolio as of the close of business on such day plus or
minus, as the case may be, the amount of net additions to or withdrawals from
such investor's investment in the Portfolio effected as of the close of
business on such day, and (ii) the denominator of which is the aggregate net
value of the Portfolio, as determined by amortized cost, as of the close of
business on such day plus or minus, as the case may be, the amount of net
additions to or withdrawals from the aggregate investments in the Portfolio by
all investors, including a fund, in the Portfolio. The percentage so determined
for a fund will then be applied to determine the value of a fund's interest in
the Portfolio as of the close of the following Valuation Day.
The Board has established procedures reasonably designed to stabilize a fund's
NAV per share at $1.00. Under the procedures, the Advisor will monitor and
notify the Board of circumstances where a fund's NAV per share calculated based
on valuing the fund's investment in the Portfolio and the fund's other assets
using market valuations may deviate from the $1.00 per share calculated based
on valuing a fund's investment in the Portfolio and a fund's other assets using
amortized cost. If there were any deviation that the Board believed would
result in a material dilution or unfair result for investors or existing
shareholders, the Board would promptly consider what action, if any, should be
initiated. Such actions could include selling assets prior to maturity to
realize capital gains or losses; shortening average maturity of the investment
portfolio; adjusting the level of dividends; redeeming shares in kind; or
valuing assets based on market valuations. For example, if a fund's net asset
value per share (computed using market values) declined, or was expected to
decline, below $1.00 (computed using amortized cost), the fund might
temporarily reduce or suspend dividend payments in an effort to maintain the
net asset value at $1.00 per share. As a result of such reduction or suspension
of dividends or other action by the Board, an investor would receive less
income during a given period than if such a reduction or suspension had not
taken place. Such action could result in investors receiving no dividend for
the period during which they hold their shares and receiving, upon redemption,
a price per share lower than that which they paid. On the other hand, if a
fund's net asset value per share (computed using market values) were to
increase, or were anticipated to increase above $1.00 (computed using amortized
cost), a fund might supplement dividends in an effort to maintain the net asset
value at $1.00 per share. Because a fund invests substantially all of its
assets in the Portfolio, certain of these actions could be implemented at the
Portfolio level at the discretion of its Board.
Market valuations are obtained by using actual quotations provided by market
makers, estimates of market value, or values obtained from yield data relating
to classes of money market instruments published by reputable sources at the
mean between the bid and asked prices for the instruments. In accordance with
procedures approved by the Board, in the event market quotations are not
readily available for certain portfolio assets the fair value of such portfolio
assets will be determined in good faith by the Portfolio's Pricing Committee
(or, in some cases, the Board's Valuation Committee) based upon input from the
Advisor or other third parties.
II-44
PROXY VOTING GUIDELINES
Each fund has delegated proxy voting responsibilities to the Advisor, subject
to the Board's general oversight. A fund has delegated proxy voting to the
Advisor with the direction that proxies should be voted consistent with the
fund's best economic interests. The Advisor has adopted its own Proxy Voting
Policies and Procedures (Policies), and Proxy Voting Guidelines (Guidelines)
for this purpose. The Policies address, among other things, conflicts of
interest that may arise between the interests of a fund, and the interests of
the Advisor and its affiliates, including a fund's principal underwriter. The
Policies are included in PART II - APPENDIX II-I.
You may obtain information about how a fund voted proxies related to its
portfolio securities during the 12-month period ended June 30 by visiting the
Securities and Exchange Commission's Web site at www.sec.gov or by visiting our
Web site at: www.dws-investments.com (click on "proxy voting" at the bottom of
the page).
MISCELLANEOUS
A fund's prospectuses and this SAI omit certain information contained in the
Registration Statement which a fund has filed with the SEC under the Securities
Act of 1933 and reference is hereby made to the Registration Statement for
further information with respect to a fund and the securities offered hereby.
This Registration Statement and its amendments are available for inspection by
the public at the SEC in Washington, D.C.
RATINGS OF INVESTMENTS
BONDS AND COMMERCIAL PAPER RATINGS
Set forth below are descriptions of ratings which represent opinions as to the
quality of the securities. It should be emphasized, however, that ratings are
relative and subjective and are not absolute standards of quality.
MOODY'S INVESTORS SERVICE, INC.'S LONG-TERM RATINGS
AAA: Bonds which are rated Aaa are judged to be of the best quality. They carry
the smallest degree of investment risk and are generally referred to as
"gilt-edged." Interest payments are protected by a large or by an exceptionally
stable margin and principal is secure. While the various protective elements
are likely to change, such changes as can be visualized are most unlikely to
impair the fundamentally strong position of such issues.
AA: Bonds which are rated Aa are judged to be of high quality by all standards.
Together with the Aaa group they comprise what are generally known as high
grade bonds. They are rated lower than the best bonds because margins of
protection may not be as large as in Aaa securities or fluctuations of
protective elements may be of greater amplitude or there may be other elements
present which make the long-term risk appear somewhat larger than in Aaa
securities.
A: Bonds which are rated A possess many favorable investment attributes and are
to be considered as upper-medium-grade obligations. Factors giving security to
principal and interest are considered adequate, but elements may be present
which suggest a susceptibility to impairment sometime in the future.
BAA: Bonds which are rated Baa are considered as medium-grade obligations,
(i.e., they are neither highly protected nor poorly secured). Interest payments
and principal security appear adequate for the present, but certain protective
elements may be lacking or may be characteristically unreliable over any great
length of time. Such bonds lack outstanding investment characteristics and in
fact have speculative characteristics as well.
BA: Bonds which are rated Ba are judged to have speculative elements; their
future cannot be considered as well assured. Often the protection of interest
and principal payments may be very moderate and thereby not well safe-guarded
during both good and bad times over the future. Uncertainty of position
characterizes bonds in this class.
B: Bonds which are rated B generally lack characteristics of the desirable
investment. Assurance of interest and principal payments or of maintenance of
other terms of the contract over any long period of time may be small.
CAA: Bonds which are rated Caa are of poor standing. Such issues may be in
default or there may be present elements of danger with respect to principal or
interest.
CA: Bonds which are rated Ca represent obligations which are speculative in a
high degree. Such issues are often in default or have other marked
shortcomings.
C: Bonds which are rated C are the lowest rated class of bonds, and issues so
rated can be regarded as having extremely poor prospects of ever attaining any
real investment standing.
II-45
CON.: Bonds for which the security depends upon the completion of some act or
the fulfillment of some condition are rated conditionally.
NOTE: Moody's applies numerical modifiers 1, 2 and 3 to each generic rating
classification from Aa through Caa. The modifier 1 indicates that the
obligation ranks in the higher end of its generic rating category; the modifier
2 indicates a mid-range ranking; and the modifier 3 indicates a ranking in the
lower end of its generic rating category.
MOODY'S INVESTORS SERVICE, INC.'S PREFERRED STOCK RATINGS
Because of the fundamental differences between preferred stocks and bonds,
Moody's employs a variation of our familiar bond rating symbols in the quality
ranking of preferred stock.
These symbols, presented below, are designed to avoid comparison with bond
quality in absolute terms. It should always be borne in mind that preferred
stock occupies a junior position to bonds within a particular capital structure
and that these securities are rated within the universe of preferred stocks.
AAA: An issue rated aaa is considered to be a top-quality preferred stock. This
rating indicates good asset protection and the least risk of dividend
impairment within the universe of preferred stocks.
AA: An issue rated aa is considered a high-grade preferred stock. This rating
indicates that there is a reasonable assurance the earnings and asset
protection will remain relatively well maintained in the foreseeable future.
A: An issue rated a is considered to be an upper-medium-grade preferred stock.
While risks are judged to be somewhat greater than in the aaa and aa
classifications, earnings and asset protection are, nevertheless, expected to
be maintained at adequate levels.
BAA: An issue rated baa is considered to be a medium-grade preferred stock,
neither highly protected nor poorly secured. Earnings and asset protection
appear adequate at present, but may be questionable over any great length of
time.
BA: An issue rated ba is considered to have speculative elements. Its future
cannot be considered well assured. Earnings and asset protection may be very
moderate and not well safeguarded during adverse periods. Uncertainty of
position characterizes preferred stocks in this class.
B: An issue rated b generally lacks the characteristics of a desirable
investment. Assurance of dividend payments and maintenance of other terms of
the issue over any long period of time may be small.
CAA: An issue rated caa is likely to be in arrears on dividend payments. This
rating designation does not purport to indicate the future status of payments.
CA: An issue rated ca is speculative in a high degree and is likely to be in
arrears on dividends with little likelihood of eventual payments.
C: This is the lowest-rated class of preferred or preference stock. Issues so
rated can thus be regarded as having extremely poor prospects of ever attaining
any real investment standing.
NOTE: As in the case of bond ratings, Moody's applies to preferred stock
ratings the numerical modifiers 1, 2, and 3 in rating classifications aa
through b. The modifier 1 indicates that the security ranks in the higher end
of its generic rating category; the modifier 2 indicates a mid-range ranking;
and the modifier 3 indicates that the issue ranks in the lower end of its
generic rating category.
MOODY'S INVESTORS SERVICE, INC.'S SHORT-TERM RATINGS
Moody's short-term debt ratings are opinions of the ability of issuers to repay
punctually senior debt obligations. These obligations have an original maturity
not exceeding one year, unless explicitly noted.
PRIME-1 OR P-1: (or supporting institutions) have a superior ability for
repayment of senior short-term debt obligations. Prime-1 or P-1 repayment
ability will often be evidenced by many of the following characteristics:
o Leading market positions in well established industries.
o High rates of return on funds employed.
o Conservative capitalization structure with moderate reliance on debt and
ample asset protection.
o Broad margins in earnings coverage of fixed financial charges and high
internal cash generation.
o Well established access to a range of financial markets and assured
sources of alternate liquidity.
II-46
PRIME-2 OR P-2: (or supporting institutions) have a strong ability for
repayment of short term debt obligations. This will normally be evidenced by
many of the characteristics cited above but to a lesser degree. Earnings trends
and coverage ratios, while sound, may be more subject to variation.
Capitalization characteristics, while still appropriate, may be more affected
by external conditions. Ample alternate liquidity is maintained.
PRIME-3 OR P-3: (or supporting institutions) have an acceptable ability for
repayment of senior short-term obligations. The effect of industry
characteristics and market compositions may be more pronounced. Variability in
earnings and profitability may result in changes in the level of debt
protection measurements and may require relatively high financial leverage.
Adequate alternate liquidity is maintained.
NOT PRIME: Do not fall within any of the Prime rating categories.
MOODY'S INVESTORS SERVICE, INC.'S MUNICIPAL SHORT-TERM RATINGS
There are four rating categories for state and municipal short-term obligations
that define an investment grade situation: MIG 1, MIG 2, MIG 3, and MIG 4 (or
VMIG 1, VMIG 2, VMIG 3, and VMIG 4 in the case of an issue having a variable
rate demand feature).
MIG 1 OR VMIG 1: Judged to be of the best quality.
MIG 2 OR VMIG 2: Judged to be of the high quality, with margins or protection
ample although not as large as in the preceding group.
MIG 3 OR VMIG 3: Judged to be of favorable quality, with all security elements
accounted for but lacking the strength of the preceding grades. Liquidity and
cash flow protection may be narrow and market access for refinancing is likely
to be less well established.
MIG4 OR VMIG 4: Judged to be of adequate quality.
SG: Denotes speculative quality.
STANDARD & POOR'S RATINGS SERVICES LONG-TERM RATINGS
INVESTMENT GRADE
AAA: Debt rated AAA has the highest rating assigned by S&P to a debt
obligation. Capacity to meet its financial commitment on the debt is extremely
strong.
AA: Debt rated AA has a very strong capacity to meet its financial commitment
and differs from the higher rated issues only in small degree.
A: Debt rated A has a strong capacity to meet its financial commitment,
although it is somewhat more susceptible to the adverse effects of changes in
circumstances and economic conditions than debt in higher-rated categories.
BBB: Debt rated BBB has an adequate capacity to meet its financial commitment.
Whereas it normally exhibits adequate protection parameters, adverse economic
conditions or changing circumstances are more likely to lead to a weakened
capacity to meet its financial commitment.
SPECULATIVE GRADE
Debt rated BB, B, CCC, CC, and C has significant speculative characteristics
with respect to meeting its financial commitment. BB indicates the least degree
of speculation and C the highest. While such debt will likely have some quality
and protective characteristics, these may be outweighed by large uncertainties
or major exposures to adverse conditions.
BB: Debt rated BB has less vulnerability to nonpayment than other speculative
issues. However, it faces major ongoing uncertainties or exposure to adverse
business, financial, or economic conditions which could lead to inadequate
capacity to meet its financial commitment.
B: Debt rated B has a greater vulnerability to default but currently has the
capacity to meet its financial commitment. Adverse business, financial, or
economic conditions will likely impair capacity or willingness to meet its
financial commitment.
CCC: Debt rated CCC is currently vulnerability to default, and is dependent
upon favorable business, financial, and economic conditions to meet its
financial commitment. In the event of adverse business, financial, or economic
conditions, it is not likely to have the capacity to meet its financial
commitment.
CC: Debt rated CC is currently high vulnerability to default.
C: Debt rated C is currently highly vulnerable to nonpayment, obligations that
have payment arrearages allowed by the terms of the documents, or obligations
of an issuer that is the subject of a bankruptcy petition or similar action
which have not experienced a payment default. Among others, the C rating may be
assigned to
II-47
subordinated debt, preferred stock or other obligations on which cash payments
have been suspended in accordance with the instrument's terms.
D: Debt rated D is in payment default. The D rating category is used when
payments are not made on the date due even if the applicable grace period has
not expired, unless Standard & Poor's believes that such payments will be made
during such grace period. The D rating also will be used upon the filing of a
bankruptcy petition if debt service payments are jeopardized.
PLUS (+) OR MINUS (-): The ratings from AA to CCC may be modified by the
addition of a plus or minus sign to show relative standing within the major
rating categories.
R: Debt rated "R" is under regulatory supervision owing to its financial
condition. During the pendency of the regulatory supervision, the regulators
may have the power to favor one class of obligations over others or pay some
obligations and not others.
NR: Debt may lack a S&P rating because no rating has been requested, because
there is insufficient information on which to base a rating, or because S&P
does not rate a particular type of obligation as a matter of policy.
STANDARD & POOR'S RATINGS SERVICES SHORT-TERM RATINGS
A-1: This highest category indicates a strong capacity to meet its financial
commitment. Those obligors determined to possess extremely strong safety
characteristics are denoted with a plus (+) sign designation.
A-2: Capacity to meet its financial commitment is satisfactory. However, its
ability to meet its financial commitment is somewhat more susceptible to
adverse effects of changes in circumstances and economic conditions.
A-3: Issues carrying this designation have adequate protection parameters.
However, adverse economic conditions or changing circumstances are more likely
to lead to a weakened capacity to meet its financial commitment.
B: Obligations are regarded as having significant speculative characteristics.
Ratings of `B-1', `B-2' and `B-3' may be assigned to indicate finer
distinctions within the `B' category. The obligor currently has the capacity to
meet its financial commitment on the obligation; however, it faces major
ongoing uncertainties which could lead to the obligor's inadequate capacity to
meet its financial commitment on the obligation.
B-1: Obligations are regarded as having significant speculative
characteristics, but the obligor has a relatively stronger capacity to meet its
financial commitments over the short-term compared to other speculative-grade
obligors.
B-2: An obligation is regarded as having significant speculative
characteristics, and the obligor has an average speculative-grade capacity to
meet its financial commitments over the short-term compared to other
speculative-grade obligors.
B-3: An obligation is regarded as having significant speculative
characteristics, and the obligor has a relatively weaker capacity to meet its
financial commitments over the short-term compared to other speculative-grade
obligors.
C: An obligation is currently vulnerable to nonpayment and is dependent upon
favorable business, financial, and economic conditions for the obligor to meet
its financial commitment on the obligation.
D: An obligation rated `D' is in payment default. The `D' rating category is
used when payments on an obligation are not made on the date due even if the
applicable grace period has not expired, unless S&P believes that such payments
will be made during such grace period. The `D' rating also will be used upon
the filing of a bankruptcy petition or the taking of a similar action if
payments on an obligation are jeopardized.
STANDARD & POOR'S RATINGS SERVICES MUNICIPAL SHORT-TERM RATINGS
SP-1: Reflects a very strong or strong capacity to pay principal and interest.
Notes issued with "overwhelming safety characteristics" will be rated "SP-1+".
SP-2: Reflects a satisfactory capacity to pay principal and interest.
SP-3: Reflects a speculative capacity to pay principal and interest.
DUAL RATINGS
S&P assigns "dual" ratings to all debt issues that have a put option or demand
feature as part of their structure. The first rating addresses the likelihood
of repayment of principal and interest as due, and the second rating addresses
only the demand feature. The long-term rating symbols are used for bonds to
denote the long-term maturity and the short-term rating symbols for the put
II-48
option (for example, `AAA/A-1+'). With U.S. municipal short-term demand debt,
S&P note rating symbols are used with the short-term issue credit rating
symbols (for example, `SP-1+/A-1+').
FITCH INVESTORS SERVICE, INC. LONG-TERM RATINGS
INVESTMENT GRADE
AAA: Bonds considered to be investment grade and of the highest credit quality.
The obligor has an exceptionally strong ability to pay interest and repay
principal, which is unlikely to be affected by reasonably foreseeable events.
AA: Bonds considered to be investment grade and of very high credit quality.
The obligor's ability to pay interest and repay principal is very strong,
although not quite as strong as bonds rated AAA. Bonds rated in the AAA and AA
categories are not significantly vulnerable to foreseeable events.
A: Bonds considered to be investment grade and of high credit quality. The
obligor's ability to pay interest and repay principal is considered to be
strong, but may be more vulnerable to adverse changes in economic conditions
and circumstances than bonds with higher ratings.
BBB: Bonds considered to be investment grade and of good credit quality. The
obligor's ability to pay interest and repay principal is considered to be
adequate. Adverse changes in economic conditions and circumstances, however,
are more likely to have adverse impact on these bonds, and therefore, impair
timely payment. The likelihood that the ratings of these bonds will fall below
investment grade is higher than for bonds with higher ratings.
SPECULATIVE
BB: Bonds are considered speculative. The obligor's ability to pay interest and
repay principal may be affected over time by adverse economic changes. However,
business or financial alternatives may be available which could assist the
obligor in satisfying its debt service requirements.
B: Bonds are considered highly speculative. While bonds in this class are
currently meeting debt service requirements, the probability of continued
timely payment of principal and interest reflects the obligor's limited margin
of safety and the need for reasonable business and economic activity throughout
the life of the issue.
CCC, CC, C: High default risk. Default is a real possibility. Capacity for
meeting financial commitments is solely reliant upon sustained, favorable
business or economic developments. A "CC" rating indicates that default of some
kind appears probable. "C" ratings signal imminent default.
DDD, DD, AND D: Bonds are in default of interest and/or principal payments.
Such bonds are extremely speculative and should be valued on the basis of their
ultimate recovery value in liquidation or reorganization of the obligor. DDD
represents the highest potential for recovery on these bonds, and D represents
the lowest potential for recovery.
PLUS (+) OR MINUS (-): The ratings from AA to CC may be appended by the
addition of a plus or minus sign to denote the relative status within the
rating category.
CONDITIONAL: A conditional rating is premised on the successful completion of a
project or the occurrence of a specific event.
NR: Indicates that Fitch Rating does not publicly rate the specific issue.
FITCH INVESTORS SERVICE, INC. SHORT-TERM RATINGS
F1: Highest credit quality. Indicates the Best capacity for timely payment of
financial commitments; may have an added "+" to denote any exceptionally strong
credit feature.
F2: Good Credit Quality. Issues assigned this rating have a satisfactory
capacity for timely payment, but the margin of safety is not as great as the
F-1+ and F-1 categories.
F3: Fair Credit Quality. Issues assigned this rating have characteristics
suggesting that the capacity for timely payment is adequate; however, near-term
adverse changes could cause these securities to be rated below investment
grade.
B: Speculative. Minimal capacity for timely payment of financial commitments,
plus vulnerability to near-term adverse changes in financial and economic
conditions.
C: High default risk. Default is a real possibility. Capacity for meeting
financial commitments is solely reliant upon a sustained, favorable business
and economic environment.
D: Default. Denotes actual or imminent payment default.
II-49
FITCH INVESTORS SERVICE, INC. MUNICIPAL SHORT-TERM RATINGS
The highest ratings for state and municipal short-term obligations are "F-1+,"
"F-1," and "F-2."
STANDARD & POOR'S DIVIDEND RANKINGS FOR COMMON STOCKS
The investment process involves assessment of various factors - such as product
and industry position, corporate resources and financial policy - with results
that make some common stocks more highly esteemed than others. In this
assessment, Standard & Poor believes that earnings and dividend performance is
the end result of the interplay of these factors and that, over the long run,
the record of this performance has a considerable bearing on relative quality.
The rankings, however, do not pretend to reflect all of the factors, tangible
or intangible, that bear on stock quality.
Relative quality of bonds or other debt, that is, degrees of protection for
principal and interest, called creditworthiness, cannot be applied to common
stocks, and therefore rankings are not to be confused with bond quality ratings
which are arrived at by a necessarily different approach.
Growth and stability of earnings and dividends are deemed key elements in
establishing Standard & Poor's earnings and dividend rankings for common
stocks, which are designed to capsulize the nature of this record in a single
symbol. It should be noted, however, that the process also takes into
consideration certain adjustments and modifications deemed desirable in
establishing such rankings.
The point of departure in arriving at these rankings is a computerized scoring
system based on per-share earnings and dividend records of the most recent ten
years - a period deemed long enough to measure significant time segments of
secular growth, to capture indications of basic change in trend as they
develop, and to encompass the full peak-to-peak range of the business cycle.
Basic scores are computed for earnings and dividends, then adjusted as
indicated by a set of predetermined modifiers for growth, stability within
long-term trend, and cyclicality. Adjusted scores for earnings and dividends
are then combined to yield a final score.
Further, the ranking system makes allowance for the fact that, in general,
corporate size imparts certain recognized advantages from an investment
standpoint. Conversely, minimum size limits (in terms of corporate sales
volume) are set for the various rankings, but the system provides for making
exceptions where the score reflects an outstanding earnings-dividend record.
The final score for each stock is measured against a scoring matrix determined
by analysis of the scores of a large and representative sample of stocks. The
range of scores in the array of this sample has been aligned with the following
ladder of rankings:
A+ Highest B+ Average C Lowest
A High B Below Average D In Reorganization
A- Above Average B- Lower
NR signifies no ranking because of insufficient data or because the stock is
not amenable to the ranking process.
The positions as determined above may be modified in some instances by special
considerations, such as natural disasters, massive strikes, and non-recurring
accounting adjustments. A ranking is not a forecast of future market price
performance, but is basically an appraisal of past performance of earnings and
dividends, and relative current standing. These rankings must not be used as
market recommendations; a high-score stock may at times be so overpriced as to
justify its sale, while a low-score stock may be attractively priced for
purchase. Rankings based upon earnings and dividend records are no substitute
for complete analysis. They cannot take into account potential effects of
management changes, internal company policies not yet fully reflected in the
earnings and dividend record, public relations standing, recent competitive
shifts, and a host of other factors that may be relevant to investment status
and decision.
II-50
PART II: APPENDIX II-A - BOARD MEMBERS AND OFFICERS
IDENTIFICATION AND BACKGROUND
The following table presents certain information regarding the Board Members of
the Trust/Corporation. Each Board Member's year of birth is set forth in
parentheses after his or her name. Unless otherwise noted, (i) each Board
Member has engaged in the principal occupation(s) noted in the table for at
least the most recent five years, although not necessarily in the same
capacity, and (ii) the address of each Board Member that is not an "interested
person" (as defined in the 1940 Act) of the Trust/Corporation or the Advisor
(each, an "Independent Board Member") is c/o Paul K. Freeman, Independent
Chairman, DWS Funds, PO Box 101833, Denver, CO 80250-1833. The term of office
for each Board Member is until the election and qualification of a successor,
or until such Board Member sooner dies, resigns, is removed or as otherwise
provided in the governing documents of the Trust/Corporation. Because the fund
does not hold an annual meeting of shareholders, each Board Member will hold
office for an indeterminate period.
INDEPENDENT BOARD MEMBERS
NUMBER OF
NAME, YEAR OF BIRTH, POSITION FUNDS IN DWS
WITH THE TRUST/CORPORATION BUSINESS EXPERIENCE AND FUND COMPLEX
AND LENGTH OF TIME SERVED/(1)/ DIRECTORSHIPS DURING THE PAST 5 YEARS OVERSEEN
Paul K. Freeman (1950) Consultant, World Bank/Inter-American Development Bank; Governing 123
Chairperson since 2009, and Council of the Independent Directors Council (governance, education
Board Member since 1993 committees); formerly: Project Leader, International Institute for Applied
Systems Analysis (1998-2001); Chief Executive Officer, The Eric Group,
Inc. (environmental insurance) (1986-1998)
John W. Ballantine (1946) Retired; formerly: Executive Vice President and Chief Risk Management 123
Board Member since 1999 Officer, First Chicago NBD Corporation/The First National Bank of
Chicago (1996-1998); Executive Vice President and Head of International
Banking (1995-1996); Directorships: Healthways Inc. (provider of
disease and care management services); Portland General Electric
(utility company); Stockwell Capital Investments PLC (private equity);
former Directorships: First Oak Brook Bancshares, Inc. and Oak Brook
Bank; Prisma Energy International
Henry P. Becton, Jr. (1943) Vice Chair and former President, WGBH Educational Foundation; 123
Board Member since 1990 Directorships: Association of Public Television Stations; Lead Director,
Becton Dickinson and Company/(2)/ (medical technology company); Lead
Director, Belo Corporation/(2)/ (media company); Public Radio
International; Public Radio Exchange (PRX); The PBS Foundation; former
Directorships: Boston Museum of Science; American Public Television;
Concord Academy; New England Aquarium; Mass. Corporation for
Educational Telecommunications; Committee for Economic
Development; Public Broadcasting Service
Dawn-Marie Driscoll (1946) President, Driscoll Associates (consulting firm); Executive Fellow, 123
Board Member since 1987 Center for Business Ethics, Bentley University; formerly: Partner,
Palmer & Dodge (1988-1990); Vice President of Corporate Affairs and
General Counsel, Filene's (1978-1988); Directorships: Trustee of 20
open-end mutual funds managed by Sun Capital Advisers, Inc. (since
2007); Director of ICI Mutual Insurance Company (since 2007); Advisory
Board, Center for Business Ethics, Bentley University; Trustee,
Southwest Florida Community Foundation (charitable organization);
former Directorships: Investment Company Institute (audit, executive,
nominating committees) and Independent Directors Council
(governance, executive committees)
Keith R. Fox (1954) Managing General Partner, Exeter Capital Partners (a series of private 123
Board Member since 1996 investment funds); Directorships: Progressive Holding Corporation
(kitchen goods importer and distributor); Box Top Media Inc.
(advertising); The Kennel Shop (retailer); former Chairman, National
Association of Small Business Investment Companies
II-51
NUMBER OF
NAME, YEAR OF BIRTH, POSITION FUNDS IN DWS
WITH THE TRUST/CORPORATION BUSINESS EXPERIENCE AND FUND COMPLEX
AND LENGTH OF TIME SERVED/(1)/ DIRECTORSHIPS DURING THE PAST 5 YEARS OVERSEEN
Kenneth C. Froewiss Adjunct Professor of Finance, NYU Stern School of Business 123
(1945) Board Member since (September 2009 - present; Clinical Professor from 1997-September
2001 2009); Member, Finance Committee, Association for Asian Studies
(2002-present); Director, Mitsui Sumitomo Insurance Group (US) (2004-
present); prior thereto, Managing Director, J.P. Morgan (investment
banking firm) (until 1996)
Richard J. Herring Jacob Safra Professor of International Banking and Professor, Finance 123
(1946) Board Member since Department, The Wharton School, University of Pennsylvania (since July
1990 1972); Co-Director, Wharton Financial Institutions Center (since July
2000); Director, Japan Equity Fund, Inc. (since September 2007), Thai
Capital Fund, Inc. (since September 2007), Singapore Fund, Inc. (since
September 2007); formerly: Vice Dean and Director, Wharton
Undergraduate Division (July 1995-June 2000); Director, Lauder Institute
of International Management Studies (July 2000-June 2006)
William McClayton Private equity investor (since October 2009); previously: Managing 123
(1944) Board Member since Director, Diamond Management & Technology Consultants, Inc. (global
2004 consulting firm) (2001-2009); Directorship: Board of Managers, YMCA of
Metropolitan Chicago; formerly: Senior Partner, Arthur Andersen LLP
(accounting) (1966-2001); Trustee, Ravinia Festival
Rebecca W. Rimel (1951) President and Chief Executive Officer, The Pew Charitable Trusts 123
Board Member since 1995 (charitable organization) (1994 to present); Trustee, Thomas Jefferson
Foundation (charitable organization) (1994 to present); Trustee,
Executive Committee, Philadelphia Chamber of Commerce (2001 to
2007); Trustee, Pro Publica (2007-present) (charitable organization);
Director, CardioNet, Inc./(2)/ (2009-present) (health care); formerly:
Executive Vice President, The Glenmede Trust Company (investment
trust and wealth management) (1983 to 2004); Board Member, Investor
Education (charitable organization) (2004-2005); Director, Viasys Health
Care/(2)/ (January 2007-June 2007)
William N. Searcy, Jr. (1946) Private investor since October 2003; Trustee of 20 open-end mutual 123
Board Member since 1993 funds managed by Sun Capital Advisers, Inc. (since October 1998);
formerly: Pension & Savings Trust Officer, Sprint Corporation/(2)/
(telecommunications) (November 1989-September 2003)
Jean Gleason Stromberg Retired; formerly: Consultant (1997-2001); Director, Financial Markets 123
(1943) Board Member since US Government Accountability Office (1996-1997); Partner, Fulbright &
1997 Jaworski, L.L.P. (law firm) (1978-1996); Directorships: The William and
Flora Hewlett Foundation; former Directorships: Service Source, Inc.,
Mutual Fund Directors Forum (2002-2004), American Bar Retirement
Association (funding vehicle for retirement plans) (1987-1990 and 1994-
1996)
Robert H. Wadsworth (1940) President, Robert H. Wadsworth & Associates, Inc. (consulting firm) 126
Board Member since 1999 (1983 to present); Director, The Phoenix Boys Choir Association
II-52
INTERESTED BOARD MEMBER AND OFFICER/(5)/
NAME, YEAR OF BIRTH,
POSITION WITH THE TRUST/ NUMBER OF
CORPORATION FUNDS IN DWS
AND LENGTH OF TIME BUSINESS EXPERIENCE AND FUND COMPLEX
SERVED/(1)(6)/ DIRECTORSHIPS DURING THE PAST 5 YEARS OVERSEEN
Ingo Gefeke/(3)/ (1967) Managing Director/(4)/, Deutsche Asset Management; Global Head of 56
Board Member since 2010 Distribution and Product Management, DWS Global Head of Trading and
Executive Vice President since Securities Lending. Member of the Board of Directors of DWS
2010 Investment GmbH Frankfurt (since July 2009) and DWS Holding &
Service GmbH Frankfurt (since January 2010); formerly: Global Chief
Administrative Officer Deutsche Asset Management (2004-2009);
Global Chief Operating Officer, Global Transaction Banking, Deutsche
Bank AG, New York (2001-2004); Chief Operating Officer, Global Banking
Division Americas, Deutsche Bank AG, New York (1999-2001); Central
Management, Global Banking Services, Deutsche Bank AG, Frankfurt
(1998-1999); Relationship Management, Deutsche Bank AG, Tokyo,
Japan (1997-1998)
OFFICERS/(5)/
NAME, YEAR OF BIRTH, POSITION
WITH THE TRUST/CORPORATION BUSINESS EXPERIENCE AND
AND LENGTH OF TIME SERVED/(6)/ DIRECTORSHIPS DURING THE PAST 5 YEARS
Michael G. Clark/(7)/ (1965) Managing Director/(4)/, Deutsche Asset Management (2006-present); President of DWS
President, 2006-present family of funds; Director, ICI Mutual Insurance Company (since October 2007);
formerly: Director of Fund Board Relations (2004-2006) and Director of Product
Development (2000-2004), Merrill Lynch Investment Managers; Senior Vice President
Operations, Merrill Lynch Asset Management (1999-2000)
John Millette/(8)/ (1962) Director/(4)/, Deutsche Asset Management
Vice President and Secretary,
1999-present
Paul H. Schubert/(7)/ (1963) Managing Director/(4)/, Deutsche Asset Management (since July 2004); formerly:
Chief Financial Officer, 2004- Executive Director, Head of Mutual Fund Services and Treasurer for UBS Family of
present Treasurer, 2005- Funds (1998-2004); Vice President and Director of Mutual Fund Finance at UBS Global
present Asset Management (1994-1998)
Caroline Pearson/(8)/ (1962) Managing Director/(4)/, Deutsche Asset Management; formerly: Assistant Secretary for
Chief Legal Officer, April 2010- DWS family of funds (1997 -2010)
present
Rita Rubin/(9)/ (1970) Vice President and Counsel, Deutsche Asset Management (since October 2007);
Assistant Secretary, 2009- formerly, Vice President, Morgan Stanley Investment Management (2004-2007)
present
Paul Antosca/(8) /(1957) Director/(4)/, Deutsche Asset Management (since 2006); formerly: Vice President, The
Assistant Treasurer, 2007- Manufacturers Life Insurance Company (U.S.A.) (1990-2006)
present
Jack Clark /(8)/ (1967) Director/(4)/, Deutsche Asset Management (since 2007); formerly: Vice President, State
Assistant Treasurer,2007- Street Corporation (2002-2007)
present
Diane Kenneally/(8)/ (1966) Director/(4)/, Deutsche Asset Management
Assistant Treasurer,2007-
present
John Caruso/(10)/ (1965) Managing Director/(4)/, Deutsche Asset Management
Anti-Money Laundering
Compliance Officer, 2010-
present
Robert Kloby/(9)/ (1962) Managing Director/(4)/, Deutsche Asset Management
Chief Compliance Officer,
2006-present
II-53
/(1)/ The length of time served represents the year in which the Board Member
joined the board of one or more DWS funds currently overseen by the
Board.
/(2)/ A publicly held company with securities registered pursuant to Section
12 of the Securities Exchange Act of 1934.
/(3)/ The mailing address of Mr. Gefeke is 345 Park Avenue, New York, New
York 10154. Mr. Gefeke is an interested Board Member by virtue of his
positions with Deutsche Asset Management. As an interested person, Mr.
Gefeke receives no compensation from the fund. Mr. Gefeke is a board
member of the following trusts and corporations: Cash Account Trust,
DWS Balanced Fund, DWS Blue Chip Fund, DWS Equity Trust, DWS High
Income Series, DWS Money Funds, DWS State Tax-Free Income Series, DWS
Strategic Government Securities Fund, DWS Strategic Income Fund, DWS
Target Fund, DWS Technology Fund, DWS Value Series, Inc., DWS Variable
Series II, Investors Cash Trust, Tax-Exempt California Money Market
Fund, DWS Dreman Value Income Edge Fund, Inc., DWS Global High Income
Fund, Inc., DWS High Income Trust, DWS Multi-Market Income Trust, DWS
Municipal Income Trust, DWS RREEF World Real Estate & Tactical
Strategies Fund, Inc., DWS Strategic Income Trust, and DWS Strategic
Municipal Income Trust.
/(4)/ Executive title, not a board directorship.
/(5)/ As a result of their respective positions held with the Advisor, these
individuals are considered "interested persons" of the Advisor within
the meaning of the 1940 Act. Interested persons receive no compensation
from the fund.
/(6)/ The length of time served represents the year in which the officer was
first elected in such capacity for one or more DWS funds.
/(7)/ Address: 100 Plaza One, Jersey City, New Jersey 07311.
/(8)/ Address: One Beacon Street, Boston, Massachusetts 02108.
/(9)/ Address: 280 Park Avenue, New York, New York 10017.
/(10)/ Address: 60 Wall Street, New York, New York 10005.
Certain officers hold similar positions for other investment companies for
which DIMA or an affiliate serves as the Advisor.
OFFICER'S ROLE WITH PRINCIPAL UNDERWRITER: DWS INVESTMENTS DISTRIBUTORS, INC.
Paul H. Schubert: Vice President
Caroline Pearson: Secretary
John Caruso: AML Compliance Officer
BOARD MEMBER QUALIFICATIONS
The Nominating and Governance Committee is responsible for recommending
proposed nominees for election to the full Board for its approval. In
recommending the election of the current Board Members, the Committee generally
considered the educational, business and professional experience of each Board
Member in determining his or her qualifications to serve as a Board Member,
including the Board Member's record of service as a director or trustee of
public and private organizations. In the case of most Board Members, this
included their many years of previous service as a trustee of certain of the
DWS funds. This previous service has provided these Board Members with a
valuable understanding of the history of the DWS funds and the DIMA
organization and has also served to demonstrate their high level of diligence
and commitment to the interests of fund shareholders and their ability to work
effectively and collegially with other members of the Board. The Committee also
considered, among other factors, the particular attributes described below with
respect to the various individual Board Members:
John W. Ballantine - Mr. Ballantine's experience in banking, financial risk
management and investments acquired in the course of his service as a senior
executive of various US and foreign banks.
Henry P. Becton, Jr. - Mr. Becton's professional training and experience as an
attorney, his experience as the chief executive officer of a major public media
company and his experience as lead director of two NYSE companies, including
his service at various times as the chair of the audit, compensation and
nominating committees of one or both of such boards.
Dawn-Marie Driscoll - Ms. Dricoll's professional training and experience as an
attorney, her expertise as a consultant, professor and author on the subject of
business ethics, her service as a member of the executive committee of the
Independent Directors Council of the Investment Company Institute and her
experience as a director of an insurance company serving the mutual fund
industry.
Keith R. Fox - Mr. Fox's experience as the chairman and a director of various
private operating companies and investment partnerships and his experience as a
director and audit committee member of several public companies.
II-54
Paul K. Freeman - Dr. Freeman's professional training and experience as an
attorney and an economist, his experience as the founder and chief executive
officer of an insurance company, his experience as a senior executive and
consultant for various companies focusing on matters relating to risk
management and his service on the Independent Directors Council of the
Investment Company Institute.
Kenneth C. Froewiss - Dr. Froewiss' professional training and experience as an
economist, his experience in finance acquired in various professional positions
with governmental and private banking organizations and his experience as a
professor of finance at a leading business school.
Ingo Gefeke - Mr. Gefeke's experience as a senior executive in various parts of
Deutsche Bank's investment management business and his current service as the
chief executive officer of DWS Investments.
Richard J. Herring - Mr. Herring's experience as a professor of finance at a
leading business school and his service as an advisor to various professional
and governmental organizations.
William McClayton - Mr. McClayton's professional training and experience in
public accounting, including his service as a senior partner of a major public
accounting firm focusing on financial markets companies and his service as a
senior executive of a public management consulting firm.
Rebecca W. Rimel - Ms. Rimel's experience on a broad range of public policy
issues acquired during her service as the executive director of a major
foundation and her experience as a director of several public companies.
William N. Searcy - Mr. Searcy's experience as an investment officer for
various major public company retirement plans, which included evaluation of
unaffiliated investment advisers and supervision of various administrative and
accounting functions.
Jean Gleason Stromberg - Ms. Stromberg's professional training and experience
as an attorney specializing in federal securities law, her service in a senior
position with the Securities and Exchange Commission and her experience as a
director and audit committee member of several major non-profit organizations.
Robert H. Wadsworth - Mr. Wadsworth's experience as an owner and chief
executive officer of various businesses serving the mutual fund industry,
including a registered broker-dealer and a registered transfer agent, and his
service as a senior executive officer of several mutual funds.
II-55
PART II: APPENDIX II-B - PORTFOLIO MANAGEMENT COMPENSATION
FOR FUNDS ADVISED BY DEUTSCHE INVESTMENT MANAGEMENT AMERICAS INC. OR ITS
AFFILIATES
Each fund is managed by a team of investment professionals who each play an
important role in a fund's management process. Team members work together to
develop investment strategies and select securities for a fund. This team works
for the Advisor or its affiliates and is supported by a large staff of
economists, research analysts, traders and other investment specialists. The
Advisor or its affiliates believe(s) its team approach benefits investors by
bringing together many disciplines and leveraging its extensive resources. Team
members with primary responsibility for management of a fund, as well as team
members who have other ongoing management responsibilities for a fund, are
identified in each fund's prospectus, as of the date of a fund's prospectus.
Composition of the team may change over time, and shareholders and investors
will be notified of changes affecting individuals with primary fund management
responsibility.
COMPENSATION OF PORTFOLIO MANAGERS
Portfolio managers are paid on a Total Compensation basis, which includes: (i)
fixed pay (base salary), which is linked to job function, responsibilities and
internal and external peer comparison, and (ii) variable pay, which is linked
to investment performance, individual contributions to the team, and the
overall financial results of both Deutsche Asset Management and Deutsche Bank
AG.
Variable pay can be delivered via a short-term and/or long-term vehicle, namely
cash, restricted equity awards, and/or restricted incentive awards. Variable
pay comprises a greater proportion of total compensation as a portfolio
manager's seniority and total compensation level increase. The proportion of
variable pay delivered via a long-term incentive award, which is subject to
clawback, will increase significantly as the amount of variable pay increases.
All variable pay delivered via long-term incentive award is subject to
clawback.
To evaluate its investment professionals, Deutsche Asset Management reviews
investment performance for all accounts managed in relation to both account
peer group and benchmark related data (i.e., appropriate Morningstar and Lipper
peer group universes and/or benchmark index(es) with respect to each account).
The ultimate goal of this process is to evaluate the degree to which investment
professionals deliver investment performance that meets or exceeds their
clients' risk and return objectives. When determining Total Compensation,
Deutsche Asset Management considers a number of quantitative and qualitative
factors:
o Quantitative measures (e.g. one-, three- and five-year pre-tax returns
versus the benchmark and appropriate peer group, taking risk targets into
account) are utilized to measure performance.
o Qualitative measures (e.g. adherence to, as well as contributions to, the
enhancement of the investment process) are included in the performance
review.
o Other factors (e.g. teamwork, adherence to compliance rules, risk management
and 'living the values" of Deutsche Asset Management) are included as part
of a discretionary component of the review process, giving management the
ability to consider additional markers of performance on a subjective
basis.
CONFLICTS
Real, potential or apparent conflicts of interest may arise when a portfolio
manager has day-to-day portfolio management responsibilities with respect to
more than one fund or account, including the following:
II-56
o Certain investments may be appropriate for a fund and also for other clients
advised by the Advisor, including other client accounts managed by a fund's
portfolio management team. Investment decisions for a fund and other
clients are made with a view to achieving their respective investment
objectives and after consideration of such factors as their current
holdings, availability of cash for investment and the size of their
investments generally. A particular security may be bought or sold for only
one client or in different amounts and at different times for more than one
but less than all clients. Likewise, because clients of the Advisor may
have differing investment strategies, a particular security may be bought
for one or more clients when one or more other clients are selling the
security. The investment results achieved for a fund may differ from the
results achieved for other clients of the Advisor. In addition, purchases
or sales of the same security may be made for two or more clients on the
same day. In such event, such transactions will be allocated among the
clients in a manner believed by the Advisor to be most equitable to each
client, generally utilizing a pro rata allocation methodology. In some
cases, the allocation procedure could potentially have an adverse effect or
positive effect on the price or amount of the securities purchased or sold
by a fund. Purchase and sale orders for a fund may be combined with those
of other clients of the Advisor in the interest of achieving the most
favorable net results to a fund and the other clients.
o To the extent that a portfolio manager has responsibilities for managing
multiple client accounts, a portfolio manager will need to divide time and
attention among relevant accounts. The Advisor attempts to minimize these
conflicts by aligning its portfolio management teams by investment strategy
and by employing similar investment models across multiple client accounts.
o In some cases, an apparent conflict may arise where the Advisor has an
incentive, such as a performance-based fee, in managing one account and not
with respect to other accounts it manages. The Advisor will not determine
allocations based on whether it receives a performance-based fee from the
client. Additionally, the Advisor has in place supervisory oversight
processes to periodically monitor performance deviations for accounts with
like strategies.
o The Advisor and its affiliates and the investment team of a fund may manage
other mutual funds and separate accounts on a long only or a long-short
basis. The simultaneous management of long and short portfolios creates
potential conflicts of interest including the risk that short sale activity
could adversely affect the market value of the long positions (and vice
versa), the risk arising from sequential orders in long and short
positions, and the risks associated with receiving opposing orders at the
same time. The Advisor has adopted procedures that it believes are
reasonably designed to mitigate these and other potential conflicts of
interest. Included in these procedures are specific guidelines developed to
provide fair and equitable treatment for all clients whose accounts are
managed by each fund's portfolio management team. The Advisor and the
portfolio management team have established monitoring procedures, a
protocol for supervisory reviews, as well as compliance oversight to ensure
that potential conflicts of interest relating to this type of activity are
properly addressed.
The Advisor is owned by Deutsche Bank AG, a multi-national financial services
company. Therefore, the Advisor is affiliated with a variety of entities that
provide, and/or engage in commercial banking, insurance, brokerage, investment
banking, financial advisory, broker-dealer activities (including sales and
trading), hedge funds, real estate and private equity investing, in addition to
the provision of investment management services to institutional and individual
investors. Since Deutsche Bank AG, its affiliates, directors, officers and
employees (the "Firm") are engaged in businesses and have interests in addition
to managing asset management accounts, such wide ranging activities involve
real, potential or apparent conflicts of interest. These interests and
activities include potential advisory, transactional and financial activities
and other interests in securities and companies that may be directly or
indirectly purchased or sold by the Firm for its clients' advisory accounts.
The Advisor may take investment positions in securities in which other clients
or related persons within the Firm have different investment positions. There
may be instances in which the Advisor is purchasing or selling for its client
accounts, or pursuing an outcome in the context of a workout or restructuring
with respect to, securities in which the Firm is undertaking the same or
differing strategy in other businesses or other client accounts. These are
considerations of which advisory clients should be aware and which may cause
conflicts that could be to the disadvantage of the Advisor's advisory clients,
including the Fund. The Advisor has instituted business and compliance
policies, procedures and disclosures that are designed to identify, monitor and
mitigate conflicts of interest and, as appropriate, to report them to a fund's
Board.
II-57
FOR FUNDS ADVISED BY ABERDEEN (AAMI)
COMPENSATION
AAMI's remuneration policy (Policy) is designed to reflect the importance of
recruiting, retaining and motivating senior executives and portfolio managers
of the caliber necessary to maintain and improve AAMI's position in the asset
management industry. The Policy seeks to reward performance in a manner which
aligns the interests of clients, shareholders and executives. The elements of
the Policy as it relates to the Portfolio's portfolio managers are as follows:
BASIC SALARY. The salaries of all employees are reviewed annually and are
determined by reference to external market research. AAMI's Policy is to pay
salaries which, when taken together with other benefits, will provide a
remuneration package that is reasonable and competitive in the asset management
industry. AAMI participates in compensation surveys which provide salary
comparisons for a range of employees across AAMI. AAMI also considers
information included in other publicly available research and survey results.
Staff performance is reviewed formally once a year with mid-term reviews. The
review process looks at all of the ways in which an individual has contributed
to the organization, and specifically, in the case of portfolio managers, to
the investment team.
ANNUAL BONUS. The Policy is to recognize corporate and individual achievements
each year through an appropriate annual bonus plan. The aggregate amount of a
cash bonus available in any year is dependent on AAMI's overall performance and
profitability. Consideration will also be given to the levels of bonuses paid
in the marketplace. Individual awards, payable to all members of staff, are
determined by a rigorous assessment of achievement against defined objectives,
and are reviewed and approved by AAMI's Remuneration Committee.
Portfolio managers' bonuses are based on a combination of the investment team's
overall performance, the individual's performance and the overall performance
of AAMI. In calculating a portfolio manager's bonus, AAMI takes into
consideration the performance of funds managed by the team as well as more
subjective issues that benefit AAMI. Portfolio manager performance on
investment matters is judged over all funds to which the fund manager
contributes. Performance is measured against appropriate market indices as well
as peer universes over various time periods.
DEFERRED BONUS. A deferred bonus plan exists and is designed to encourage the
retention of certain key employees identified as critical to AAMI's achievement
of its long-term goals. Deferred bonuses may be in the form of deferred equity
in Aberdeen PLC.
Retention and incentives for former Deutsche Asset Management employees. In
addition to the Policy, appropriate retention and incentive arrangements have
been put into place for certain employees of the former Deutsche Asset
Management businesses, including in some cases participation in the Long Term
Incentive Plan. The costs of these arrangements are being borne by both
Deutsche Asset Management and AAMI.
CONFLICTS
In addition, an investment professional may manage accounts in a personal
capacity that may include holdings that are similar to, or the same as, those
of a fund. AAMI have in place a Code of Ethics that is designed to address
conflicts of interest and that, among other things, imposes restrictions on the
ability of portfolio managers and other "access persons" to invest in
securities that may be recommended or traded in a fund and other client
accounts.
Real, potential or apparent conflicts of interest may arise when a portfolio
manager has day-to-day portfolio management responsibilities with respect to
more than one fund or account, including the following:
II-58
o Certain investments may be appropriate for a fund and also for other clients
advised by AAMI, including other client accounts managed by a fund's
portfolio management team. Investment decisions for a fund and other
clients are made with a view to achieving their respective investment
objectives and after consideration of such factors as their current
holdings, availability of cash for investment and the size of their
investments generally. A particular security may be bought or sold for only
one client or in different amounts and at different times for more than one
but less than all clients. Likewise, because clients of AAMI may have
differing investment strategies, a particular security may be bought for
one or more clients when one or more other clients are selling the
security. The investment results achieved for a fund may differ from the
results achieved for other clients of AAMI. In addition, purchases or sales
of the same security may be made for two or more clients on the same day.
In such event, such transactions will be allocated among the clients in a
manner believed by AAMI to be most equitable to each client, generally
utilizing a pro rata allocation methodology. In some cases, the allocation
procedure could potentially have an adverse effect or positive effect on
the price or amount of the securities purchased or sold by a fund. Purchase
and sale orders for a fund may be combined with those of other clients of
AAMI in the interest of achieving the most favorable net results to a fund
and the other clients.
o To the extent that a portfolio manager has responsibilities for managing
multiple client accounts, a portfolio manager will need to divide time and
attention among relevant accounts. The Advisor attempts to minimize these
conflicts by aligning its portfolio management teams by investment strategy
and by employing similar investment models across multiple client accounts.
o In some cases, an apparent conflict may arise where AAMI have an incentive,
such as a performance based fee, in managing one account and not with
respect to other accounts it manages. The Advisor will not determine
allocations based on whether it receives a performance-based fee from the
client. Additionally, AAMI have in place supervisory oversight processes to
periodically monitor performance deviations for accounts with like
strategies.
FOR FUNDS ADVISED BY DREMAN
COMPENSATION
The Funds have been advised that the Dreman has implemented a highly
competitive compensation plan which seeks to attract and retain exceptional
investment professionals who have demonstrated that they can consistently
outperform their respective fund's benchmark. The plan is made up of a fixed
salary component, a variable bonus component, comprehensive benefits, a profit
sharing plan and the possibility of ownership in the firm. The variable bonus
allows Dreman to compensate its investment professionals based on results,
which aligns their interests directly with Dreman's clients' interests.
Base salaries are a factor of job function. The Funds have been advised that
Dreman offers competitive pay by many measures including compensation surveys
compiled for the asset management industry and the broader financial services
industry.
Variable bonuses, which are based on performance, may include some or all of
the following components: cash, stock appreciation rights and outright stock
grants. There are many measures of performance. For portfolio managers and
analysts, success is defined largely by their ability to generate superior
investment results for our clients relative to their benchmarks, peer group and
client objectives. For Dreman's client service team, important factors are
retention and other measures of general client satisfaction.
In addition to offering employees a comprehensive compensation package with
full benefits (medical, dental, vision, disability, vacation, profit sharing),
Dreman informs the Funds that it is committed to maintaining a rewarding work
environment that fosters teamwork, innovation and camaraderie. Dreman reports
that it offers continuing education and training to its professionals and
actively encourage people to avail themselves of those resources. Dreman states
that it knows that workplace diversity provides real benefits to its firm and
clients and it strives to maintain a professional environment supportive of
that diversity.
CONFLICTS
II-59
The sub-advisor manages clients' accounts using a contrarian value investment
strategy. For both its large capitalization and small capitalization strategies
the subadvisor utilizes a model portfolio and rebalances client's accounts
whenever changes are made to the model portfolio. In addition the sub-advisor
aggregates its trades and allocates the trades to all clients' accounts in an
equitable manner. The sub-advisor strongly believes aggregating its orders
protect all clients from being disadvantaged by price or time execution. The
model portfolio approach and the trade aggregation policy of the subadvisor
seek to eliminate conflicts of interest that could arise when a portfolio
manager has day-to-day portfolio management responsibilities with respect to
more than one fund or account. The subadvisor does not receive any
performance-based fees from any of its accounts with the exception of hedge
funds that are managed by an affiliated firm. The hedge funds are treated like
all other client account and trades done for the fund are generally aggregated
with trades done for its other client accounts.
The sub-advisor's investment professionals are compensated in the same manner
for all client accounts irrespective of the type of account.
FOR FUNDS ADVISED BY NORTHERN TRUST (NTI)
COMPENSATION
As of March 31, 2008 the compensation for the index portfolio managers is based
on the competitive marketplace and consists of a fixed base salary plus a
variable annual cash incentive award. In addition, non-cash incentives, such as
stock options or restricted stock of Northern Trust Corporation, may be awarded
from time to time. The annual incentive award is discretionary and is based on
a quantitative and qualitative evaluation of each portfolio manager's
investment performance and contribution to his or her respective team plus the
financial performance of the investment business unit and Northern Trust
Corporation as a whole. The annual incentive award is not based on performance
of the portfolio/funds or the amount of assets held in a fund. Moreover, no
material differences exist between the compensation structure for mutual fund
accounts and other types of accounts.
CONFLICTS
NTI's portfolio managers are often responsible for managing one or more funds,
as well as other accounts, including separate accounts and other pooled
investment vehicles. A portfolio manager may manage a separate account or other
pooled investment vehicle that may have a materially higher or lower fee
arrangement. The side-by-side management of these accounts may raise potential
conflicts of interest relating to cross trading, the allocation of investment
opportunities and the aggregation and allocation of trades. In addition, while
portfolio managers generally only manage accounts with similar investment
strategies, it is possible that due to varying investment restrictions among
accounts that certain investments are made for some accounts and not others or
conflicting investment positions are taken among accounts. The portfolio
managers have a fiduciary responsibility to manage all client accounts in a
fair and equitable manner. NTI seeks to provide best execution of all
securities transactions and aggregate and then allocate securities to client
accounts in a fair and timely manner. To this end, NTI has developed policies
and procedures designed to mitigate and manage the potential conflicts of
interest that may arise from side-by-side management. In addition, NTI has
adopted policies limiting the circumstances under which cross-trades may be
affected. NTI conducts periodic reviews of trades for consistency with these
policies.
FOR FUNDS ADVISED BY GLOBAL THEMATIC PARTNERS, LLC (GTP)
COMPENSATION
Portfolio managers will be eligible for total compensation comprised of base
salary and variable compensation.
BASE SALARY. Investment professionals are paid a base salary that is determined
by their job functions, responsibilities and financial services industry peer
comparison through the use of market data surveys.
VARIABLE COMPENSATION. Key professionals also receive a cash bonus which
generally comprises a greater proportion of total compensation. Variable
compensation is determined based on an analysis of a number of factors,
including among other things, the performance of GTP, and the individua'sl
contribution. In evaluating individual contribution,
II-60
management will consider a combination of quantitative and qualitative factors.
Top performing investment professionals will earn a total compensation package
that is highly competitive. In addition, key investment personnel are
incentivized through a profit sharing equity plan which is based on each
individuals contribution to out-performance.
CONFLICTS
GTP's portfolio managers are responsible for managing one or more funds, as
well as other accounts, including separate accounts and other pooled investment
vehicles. A portfolio manager may manage a separate account or other pooled
investment vehicle that may have a materially higher or lower fee arrangement
or a performance based fee. This may raise potential conflicts of interest
relating to the allocation of investment opportunities and the aggregation and
allocation of trades, among other things. Additionally, it is possible that due
to varying investment restrictions among accounts that certain investments are
made for some accounts and not others or conflicting investment positions are
taken among accounts. The portfolio managers have a fiduciary responsibility to
manage all client accounts in a fair and equitable manner. GTP has developed
and adopted a Code of Ethics as well as other policies and procedures designed
to mitigate and manage the potential conflicts of interest that may arise.
FOR FUNDS ADVISED BY QS INVESTORS, LLC (QS INVESTORS)
COMPENSATION
Portfolio managers will be eligible for total compensation comprised of base
salary and variable compensation.
BASE SALARY. Base salary will be linked to job functions, responsibilities and
financial services industry peer comparison.
VARIABLE COMPENSATION. Variable compensation for portfolio managers will be
linked to the metrics they have responsibility for; checking and implementing
research models, minimizing transaction costs and market impact, monitoring
client portfolios for appropriate market risk and ensuring that no trading
errors occur. The qualitative analysis of a portfolio manager's individual
performance will be based on, among other things, the results of an annual
management and internal peer review process, and management's assessment of
overall portfolio manager contributions to investor relations, the investment
process and overall performance (distinct from fund and other account
performance). Other factors, including contributions made to the investment
team, as well as adherence to Compliance Policies and Procedures, Risk
Management procedures, the firm's Code of Ethics and "living the values" of the
firm will also be factors.
CONFLICTS
QS Investors maintains policies and procedures reasonably designed to minimize
material conflicts of interest inherent in circumstances when a portfolio
manager has day-to-day portfolio management responsibilities for multiple
portfolios. These conflicts may be real, potential, or perceived, and are
described in detail below.
o QS Investors and its portfolio management team may manage multiple
portfolios with similar investment strategies. Investment decisions for
each portfolio are generally made based on each portfolio's investment
objectives and guidelines, cash availability, and current holdings.
Purchases or sales of securities for the portfolios may be appropriate for
other portfolios with like objectives and may be bought or sold in
different amounts and at different times in multiple portfolios. In these
cases, transactions are allocated to portfolios in a manner believed by QS
Investors to be the most equitable to each client, generally utilizing a
pro rata allocation methodology. Purchase and sale orders for a portfolio
may be combined with those of other portfolios in the interest of achieving
the most favorable net results for all clients.
o QS Investors may manage long-short strategies alongside long-only
strategies. As such, the potential exists for short sales of securities in
certain portfolios while the same security is held long in one or more
other portfolios. In an attempt to mitigate the inherent risks of
simultaneous management of long-short and long only strategies, QS
Investors has established and implemented procedures to promote fair and
equitable treatment of all portfolios. The procedures include monitoring
and surveillance, supervisory reviews, and compliance oversight of short
sale activity.
II-61
o Portfolio managers may be responsible for managing multiple portfolios.
Portfolio managers are aligned by investment strategy and employ similar
investment models across multiple portfolios to support equitable division
of time and attention required to manage all portfolios under their
management.
o In certain cases, portfolios may include incentive-based fees, such as
performance fees. These portfolios may be managed alongside other
portfolios and are managed in the same manner as all other portfolios with
like strategies; investment decisions and allocations are not based on the
existence of performance or other incentive-based fees. To manage conflicts
that may arise from management of portfolios with incentive-based fees,
performance in portfolios with like strategies is regularly reviewed by
management.
o Investment professionals employed by QS Investors may manage personal
accounts in which they have a fiduciary interest with holdings similar to
those of client accounts. QS Investors has implemented a Code of Ethics
which is designed to address the possibility that these professionals could
place their own interests ahead of those of clients. The Code of Ethics
address this potential conflict of interest by imposing reporting
requirements, blackout periods, supervisory oversight and other measures
designed to reduce conflict.
FOR FUNDS ADVISED BY TURNER
COMPENSATION
Turner's investment professionals receive a base salary commensurate with their
level of experience. Turner's goal is to maintain competitive base salaries
through review of industry standards, market conditions, and salary surveys.
Bonus compensation, which is a multiple of base salary, is based on the
performance of each individual's sector and portfolio assignments relative to
appropriate market benchmarks. In addition, each employee is eligible for
equity awards. Turner believes this compensation provides incentive to attract
and retain highly qualified people.
The objective performance criteria noted above accounts for 90% of the bonus
calculation. The remaining 10% is based upon subjective, "good will" factors
including teamwork, interpersonal relations, the individual's contribution to
overall success of the firm, media and client relations, presentation skills,
and professional development. Portfolio managers/analysts are reviewed on an
annual basis. The Chief Investment Officer, Robert E. Turner, CFA, is
responsible for setting base salaries, bonus targets, and making all subjective
judgments related to an investment professionals' compensation.
CONFLICTS
As is typical for many money managers, potential conflicts of interest may
arise related to Turner's management of accounts including the Portfolio where
not all accounts are able to participate in a desired Initial Public Offering
(IPO), or other limited opportunity, relating to use of soft dollars and other
brokerage practices, related to the voting of proxies, employee personal
securities trading, and relating to a variety of other circumstances. In all
cases, however, Turner believes it has written policies and procedures in place
reasonably designed to prevent violations of the federal securities laws and to
prevent material conflicts of interest from arising. Please also see Turner's
Form ADV, Part II for a description of some of its policies and procedures in
this regard.
II-62
PART II: APPENDIX II-C - FEE RATES OF SERVICE PROVIDERS
FEES PAYABLE TO DIMA FOR INVESTMENT MANAGEMENT SERVICES.
The management fee for each fund is accrued daily and paid monthly, at the
annual percentage rate of daily net assets indicated below:
FUND NAME MANAGEMENT FEE RATE
Tax-Free Income Funds
DWS California Tax-Free Income Fund First $250 million 0.450%
Next $750 million 0.420%
Next $1.5 billion 0.400%
Next $2.5 billion 0.380%
Next $2.5 billion 0.350%
Next $2.5 billion 0.330%
Next $2.5 billion 0.310%
Thereafter 0.300%
DWS Strategic High Yield Tax-Free Fund First $300 million 0.565%
Next $200 million 0.515%
Next $500 million 0.490%
Thereafter 0.470%
DWS Intermediate Tax/AMT Free Fund 0.315%
DWS Managed Municipal Bond Fund First $250 million 0.365%
Next $750 million 0.345%
Next $1.5 billion 0.325%
Next $2.5 billion 0.315%
Next $2.5 billion 0.295%
Next $2.5 billion 0.275%
Next $2.5 billion 0.255%
Thereafter 0.235%
DWS Massachusetts Tax-Free Fund First $250 million 0.450%
Next $750 million 0.420%
Next $1.5 billion 0.400%
Next $2.5 billion 0.380%
Next $2.5 billion 0.350%
Next $2.5 billion 0.330%
Next $2.5 billion 0.310%
Thereafter 0.300%
DWS New York Tax-Free Income Fund First $250 million 0.450%
Next $750 million 0.420%
Next $1.5 billion 0.400%
Next $2.5 billion 0.380%
Next $2.5 billion 0.350%
Next $2.5 billion 0.330%
Next $2.5 billion 0.310%
Thereafter 0.300%
DWS Short-Term Municipal Bond Fund First $500 million 0.400%
Next $500 million 0.385%
Next $1.0 billion 0.370%
Thereafter 0.355%
II-63
FUND NAME MANAGEMENT FEE RATE
Taxable Income Funds
DWS Core Fixed Income Fund First $1.5 billion 0.400%
Next $1.75 billion 0.385%
Next $1.75 billion 0.370%
Thereafter 0.355%
DWS Core Plus Income Fund First $250 million 0.465%
Next $750 million 0.435%
Next $1.5 billion 0.415%
Next $2.5 billion 0.395%
Next $2.5 billion 0.365%
Next $2.5 billion 0.345%
Next $2.5 billion 0.325%
Thereafter 0.315%
DWS Floating Rate Plus Fund First $1 billion 0.650%
Next $1.5 billion 0.635%
Next $2.5 billion 0.610%
Next $2.5 billion 0.585%
Next $2.5 billion 0.560%
Thereafter 0.550%
DWS GNMA Fund First $5.0 billion 0.315%
Next $1.0 billion 0.300%
Thereafter 0.285%
DWS High Income Fund First $250 million 0.480%
Next $750 million 0.450%
Next $1.5 billion 0.430%
Next $2.5 billion 0.410%
Next $2.5 billion 0.380%
Next $2.5 billion 0.360%
Next $2.5 billion 0.340%
Thereafter 0.320%
DWS High Income Plus Fund First $1.0 billion 0.500%
Next $1.5 billion 0.490%
Next $2.5 billion 0.480%
Next $5.0 billion 0.470%
Thereafter 0.460%
DWS Global Inflation Plus Fund First $1.5 billion 0.400%
Next $500 million 0.375%
Next $1.0 billion 0.360%
Next $1.0 billion 0.345%
Next $1.0 billion 0.330%
Next $1.0 billion 0.315%
Thereafter 0.300%
DWS Short Duration Fund First $500 million 0.400%
Next $500 million 0.385%
Next $1.0 billion 0.370%
Thereafter 0.355%
II-64
FUND NAME MANAGEMENT FEE RATE
DWS Short Duration Plus Fund First $1.5 billion 0.365%
Next $500 million 0.340%
Next $1.0 billion 0.315%
Next $1.0 billion 0.300%
Next $1.0 billion 0.285%
Next $1.0 billion 0.270%
Thereafter 0.255%
DWS Strategic Income Fund First $250 million 0.480%
Next $750 million 0.450%
Next $1.5 billion 0.430%
Next $2.5 billion 0.410%
Next $2.5 billion 0.380%
Next $2.5 billion 0.360%
Next $2.5 billion 0.340%
Thereafter 0.320%
DWS Strategic Government Securities First $250 million 0.350%
Fund Next $750 million 0.330%
Next $1.5 billion 0.310%
Next $2.5 billion 0.300%
Next $2.5 billion 0.280%
Next $2.5 billion 0.260%
Next $2.5 billion 0.240%
Thereafter 0.220%
Multi-Category/Asset Allocation Funds
DWS Alternative Asset Allocation Plus 0.200%/(1)/
Fund
DWS Balanced Fund First $1.5 billion 0.370%
Next $500 million 0.345%
Next $1.5 billion 0.310%
Next $2.0 billion 0.300%
Next $2.0 billion 0.290%
Next $2.5 billion 0.280%
Next $2.5 billion 0.270%
Thereafter 0.260%
DWS LifeCompass Retirement Fund 0.000%/(1)/
DWS LifeCompass 2015 Fund 0.000%/(1)/
DWS LifeCompass 2020 Fund 0.000%/(1)/
DWS LifeCompass 2030 Fund 0.000%/(1)/
DWS LifeCompass 2040 Fund 0.000%/(1)/
DWS Lifecycle Long Range Fund First $250 million 0.600%
Next $750 million 0.575%
Thereafter 0.550%
DWS Select Alternative Allocation 0.00%/(1)/
Fund
DWS Target 2010 Fund 0.400%
DWS Target 2011 Fund 0.400%
DWS Target 2012 Fund 0.400%
II-65
FUND NAME MANAGEMENT FEE RATE
DWS Target 2013 Fund 0.400%
DWS Target 2014 Fund 0.400%
Value Funds
DWS Enhanced Commodity Strategy First $500 million 0.950%
Fund Next $500 million 0.900%
Thereafter 0.850%
DWS Disciplined Market Neutral Fund First $1.0 billion 1.250%
Next $1.0 billion 1.200%
Next $1.0 billion 1.150%
Thereafter 1.100%
DWS Dreman Mid Cap Value Fund First $250 million 0.750%
Next $250 million 0.720%
Next $2.0 billion 0.700%
Next $1.5 billion 0.680%
Thereafter 0.660%/(3)/
DWS Dreman Small Cap Value Fund First $250 million 0.750%
Next $750 million 0.720%
Next $1.5 billion 0.700%
Next $2.5 billion 0.680%
Next $2.5 billion 0.650%
Next $2.5 billion 0.640%
Next $2.5 billion 0.630%
Thereafter 0.620%/(3)/
DWS Growth & Income Fund First $250 million 0.365%
Next $750 million 0.360%
Next $1.5 billion 0.355%
Next $5.0 billion 0.345%
Next $5.0 billion 0.335%
Next $5.0 billion 0.325%
Thereafter 0.300%
DWS Large Cap Value Fund First $1.5 billion 0.425%
Next $500 million 0.400%
Next $1 billion 0.375%
Next $1 billion 0.350%
Next $1 billion 0.325%
Thereafter 0.300
DWS RREEF Real Estate Securities First $100 million 0.565%
Fund Next $100 million 0.465%
Next $100 million 0.415%
Thereafter 0.365%
DWS Small Cap Core Fund First $500 million 0.665%
Next $500 million 0.615%
Thereafter 0.565%
II-66
FUND NAME MANAGEMENT FEE RATE
DWS Strategic Value Fund First $250 million 0.750%
Next $750 million 0.720%
Next $1.5 billion 0.700%
Next $2.5 billion 0.680%
Next $2.5 billion 0.650%
Next $2.5 billion 0.640%
Next $2.5 billion 0.630%
Thereafter 0.620%/(2)/
Index-Related Funds
DWS EAFE Equity Index Fund 0.250%
DWS Equity 500 Index Fund 0.000%/(3)/
DWS Equity 500 Index Portfolio 0.050%
DWS S&P 500 Index Fund 0.000%/(3)/
DWS U.S. Bond Index Fund 0.150%
Growth Funds
DWS Blue Chip Fund First $250 million 0.480%
Next $750 million 0.450%
Next $1.5 billion 0.430%
Next $2.5 billion 0.410%
Next $2.5 billion 0.380%
Next $2.5 billion 0.360%
Next $2.5 billion 0.340%
Thereafter 0.320%
DWS Capital Growth Fund First $250 million 0.495%
Next $750 million 0.465%
Next $1.5 billion 0.445%
Next $2.5 billion 0.425%
Next $2.5 billion 0.395%
Next $2.5 billion 0.375%
Next $2.5 billion 0.355%
Thereafter 0.335%
DWS Communications Fund First $100 million 1.000%
Next $100 million 0.900%
Next $100 million 0.850%
Next $200 million 0.800%
Next $500 million 0.730%
Next $500 million 0.680%
Thereafter 0.650%
DWS Gold & Precious Metals Fund First $500 million 0.835%
Thereafter 0.785%
DWS Health Care Fund First $500 million 0.765%
Thereafter 0.715%
DWS Large Cap Focus Growth Fund First $1.5 billion 0.615%
Next $500 million 0.565%
Thereafter 0.515%
II-67
FUND NAME MANAGEMENT FEE RATE
DWS Mid Cap Growth Fund First $500 million 0.650%
Next $1 billion 0.600%
Next $2.5 billion 0.550%
Next $2.5 billion 0.540%
Next $2.5 billion 0.530%
Next $2.5 billion 0.520%
Thereafter 0.510%
DWS Small Cap Growth Fund 0.650%
DWS Technology Fund First $250 million 0.480%
Next $750 million 0.450%
Next $1.5 billion 0.430%
Next $2.5 billion 0.410%
Next $2.5 billion 0.380%
Next $2.5 billion 0.360%
Next $2.5 billion 0.340%
Thereafter 0.320%
Global Income Funds
DWS Emerging Markets Fixed Income 0.590%
Fund
DWS Global Bond Fund 0.410%
Global Growth Funds
DWS Climate Change Fund 1.000%
DWS Emerging Markets Equity Fund First $250 million 1.015%
Next $500 million 0.990%
Thereafter 0.965%
DWS Europe Equity Fund First $250 million 0.665%
Next $750 million 0.635%
Next $1.5 billion 0.615%
Next $2.5 billion 0.595%
Next $2.5 billion 0.565%
Next $2.5 billion 0.555%
Next $2.5 billion 0.545%
Thereafter 0.535%
DWS Global Small Cap Growth Fund First $500 million 0.915%
Next $500 million 0.865%
Thereafter 0.815%
DWS Global Thematic Fund First $500 million 0.915%
Next $500 million 0.865%
Next $500 million 0.815%
Next $500 million 0.765%
Thereafter 0.715%
DWS International Fund First $2.5 billion 0.565%
Next $2.5 billion 0.545%
Next $5 billion 0.525%
Next $5 billion 0.515%
Thereafter 0.465%
II-68
FUND NAME MANAGEMENT FEE RATE
DWS Diversified International Equity First $1.5 billion 0.700%
Fund Next $1.75 billion 0.685%
Next $1.75 billion 0.670%
Thereafter 0.655%
DWS Dreman International Value Fund First $500 million 0.800%
Next $500 million 0.780%
Next $1.0 billion 0.760%
Thereafter 0.740%
DWS Latin America Equity Fund First $400 million 1.165%
Next $400 million 1.065%
Thereafter 0.965%
DWS RREEF Global Real Estate First $500 million 1.000%
Securities Fund Next $500 million 0.985%
Next $1 billion 0.960%
Thereafter 0.945%
DWS RREEF Global Infrastructure 0.900%
Fund
Insurance/Annuity Funds
DWS Bond VIP First $250 million 0.390%
Next $750 million 0.365%
Thereafter 0.340%
DWS Capital Growth VIP First $250 million 0.390%
Next $750 million 0.365%
Thereafter 0.340%
DWS Global Opportunities VIP First $500 million 0.890%
Next $500 million 0.875%
Next $1.0 billion 0.860%
0.845% thereafter
DWS Growth & Income VIP First $250 million 0.390%
Next $750 million 0.365%
Thereafter 0.340%
DWS Health Care VIP First $250 million 0.665%
Next $750 million 0.640%
Next $1.5 billion 0.615%
Next $2.5 billion 0.595%
Next $2.5 billion 0.565%
Next $2.5 billion 0.555%
Next $2.5 billion 0.545%
Thereafter 0.535%
DWS International VIP First $500 million 0.790%
Thereafter 0.640%
DWS Equity 500 Index VIP First $1 billion 0.200%
Next $1 billion 0.175%
Thereafter 0.150%
DWS Small Cap Index VIP 0.350%
DWS Alternative Asset Allocation Plus 0.200%/(4)/
VIP
II-69
FUND NAME MANAGEMENT FEE RATE
DWS Balanced VIP First $250 million 0.370%
Next $750 million 0.345%
Thereafter 0.310%
DWS Blue Chip VIP First $250 million 0.550%
Next $750 million 0.520%
Next $1.5 billion 0.500%
Next $2.5 billion 0.480%
Next $2.5 billion 0.450%
Next $2.5 billion 0.430%
Next $2.5 billion 0.410%
Thereafter 0.390%
DWS Conservative Allocation VIP First $500 million 0.065%
Next $500 million 0.055%
Next $500 million 0.045%
Next $1.0 billion 0.035%
Thereafter 0.025%/(1)/
DWS Core Fixed Income VIP First $250 million 0.500%
Next $750 million 0.470%
Next $1.5 billion 0.450%
Next $2.5 billion 0.430%
Next $2.5 billion 0.400%
Next $2.5 billion 0.380%
Next $2.5 billion 0.360%
Thereafter 0.340%
DWS Diversified International Equity First $1.5 billion 0.650%
VIP Next $1.75 billion 0.635%
Next $1.75 billion 0.620%
Thereafter 0.605%
DWS Dreman Small Mid Cap Value VIP First $250 million 0.650%
Next $750 million 0.620%
Next $1.5 billion 0.600%
Next $2.5 billion 0.580%
Next $2.5 billion 0.550%
Next $2.5 billion 0.540%
Next $2.5 billion 0.530%
Thereafter 0.520%
DWS Global Thematic VIP First $250 million 0.915%
Next $500 million 0.865%
Next $750 million 0.815%
Next $1.5 billion 0.765%
Thereafter 0.715%
DWS Government & Agency Securities First $250 million 0.450%
VIP Next $750 million 0.430%
Next $1.5 billion 0.410%
Next $2.5 billion 0.400%
Next $2.5 billion 0.380%
Next $2.5 billion 0.360%
Next $2.5 billion 0.340%
Thereafter 0.320%
II-70
FUND NAME MANAGEMENT FEE RATE
DWS Growth Allocation VIP First $500 million 0.065%
Next $500 million 0.055%
Next $500 million 0.045%
Next $1.0 billion 0.035%
Thereafter 0.025%/(1)/
DWS High Income VIP First $250 million 0.500%
Next $750 million 0.470%
Next $1.5 billion 0.450%
Next $2.5 billion 0.430%
Next $2.5 billion 0.400%
Next $2.5 billion 0.380%
Next $2.5 billion 0.360%
Thereafter 0.340%
DWS Large Cap Value VIP First $250 million 0.650%
Next $750 million 0.625%
Next $1.5 billion 0.600%
Next $2.5 billion 0.575%
Next $2.5 billion 0.550%
Next $2.5 billion 0.525%
Next $2.5 billion 0.500%
Thereafter 0.475%
DWS Mid Cap Growth VIP First $250 million 0.665%
Next $750 million 0.635%
Next $1.5 billion 0.615%
Next $2.5 billion 0.595%
Next $2.5 billion 0.565%
Next $2.5 billion 0.555%
Next $2.5 billion 0.545%
Thereafter 0.535%
DWS Moderate Allocation VIP First $500 million 0.065%
Next $500 million 0.055%
Next $500 million 0.045%
Next $1.0 billion 0.035%
Thereafter 0.025%/(1)/
DWS Money Market VIP First $500 million 0.285%
Next $500 million 0.270%
Next $1.0 billion 0.255%
Thereafter 0.240%
DWS Small Cap Growth VIP First $250 million 0.550%
Next $750 million 0.525%
Thereafter 0.500%
DWS Strategic Income VIP First $250 million 0.550%
Next $750 million 0.520%
Next $1.5 billion 0.500%
Next $2.5 billion 0.480%
Next $2.5 billion 0.450%
Next $2.5 billion 0.430%
Next $2.5 billion 0.410%
Thereafter 0.390%
II-71
FUND NAME MANAGEMENT FEE RATE
DWS Strategic Value VIP First $250 million 0.665%
Next $750 million 0.635%
Next $1.5 billion 0.615%
Next $2.5 billion 0.595%
Next $2.5 billion 0.565%
Next $2.5 billion 0.555%
Next $2.5 billion 0.545%
Thereafter 0.535%
DWS Technology VIP First $250 million 0.665%
Next $750 million 0.635%
Next $1.5 billion 0.615%
Next $2.5 billion 0.595%
Next $2.5 billion 0.565%
Next $2.5 billion 0.555%
Next $2.5 billion 0.545%
Thereafter 0.535%
DWS Turner Mid Cap Growth VIP First $250 million 0.715%
Next $250 million 0.700%
Next $500 million 0.685%
Thereafter 0.670%
Money Market Funds
Cash Account Trust - Government & First $500 million 0.120%
Agency Securities Portfolio Next $500 million 0.100%
Next $1.0 billion 0.075%
Next $1.0 billion 0.060%
Thereafter 0.050%/(5)/
Cash Account Trust - Money Market First $500 million 0.220%
Portfolio Next $500 million 0.200%
Next $1.0 billion 0.175%
Next $2.0 billion 0.160%
Thereafter 0.150%/(2)(5)/
Cash Account Trust - Tax- Exempt First $500 million 0.120%
Portfolio Next $500 million 0.100%
Next $1.0 billion 0.075%
Next $1.0 billion 0.060%
Thereafter 0.050%/(5)/
Cash Management Fund Institutional 0.00%/(6)/
Cash Management Portfolio First $3 billion 0.150%
Next $4.5 billion 0.1325%
Thereafter 0.120%
Cash Reserve Fund, Inc. - Prime 0.00%/(6)/
Series
Cash Reserves Fund Institutional 0.00%/(6)/
DWS Money Market Series 0.000%/(6)/
II-72
FUND NAME MANAGEMENT FEE RATE
DWS Money Market Prime Series First $215 million 0.400%
Next $335 million 0.275%
Next $250 million 0.200%
Next $800 million 0.150%
Next $800 million 0.140%
Next $800 million 0.130%
Thereafter 0.120%
Investors Cash Trust - Treasury 0.050%
Portfolio
NY Tax Free Money Fund 0.120%
Tax-Exempt California Money Market First $500 million 0.120%
Fund Next $500 million 0.100%
Next $1.0 billion 0.075%
Next $1.0 billion 0.060%
Thereafter 0.050%
Tax Free Money Fund Investment 0.150%
Daily Assets Fund Institutional 0.100%
(1) Shareholders of a fund also indirectly bear their pro rata share of the
operating expenses, including the management fee paid to DIMA, of the
underlying DWS Funds in which a fund invests.
(2) The fund's management fee rate includes administrative services provided
by DIMA which are necessary for the Fund's operation as an open-end
investment company.
(3) The fund invests substantially all its assets in DWS Equity 500 Index
Portfolio (Master Fund). DIMA receives a management fee from the Master
Fund. In the event that the fund withdraws its investment in the Master
Fund, DIMA would become responsible for directly managing the assets of
the fund. In such event, the fund would pay DIMA a management fee at an
annual rate of 0.05% or 0.15% of the daily net assets of DWS Equity 500
Index Fund or DWS S&P 500 Index Fund, respectively.
(4) The fund currently invests substantially all its assets in other DWS
Funds. As a result, shareholders of the fund also indirectly bear their
pro rata share of the operating expenses, including the management fee
paid to DIMA, of the underlying DWS Funds in which the fund invests. In
the future, the fund may invest some or all of its assets in other
securities that are not considered DWS Funds (Other Assets). If the
fund's assets were invested in Other Assets, the management fee paid to
DIMA would equal the sum of (a) 0.200% of the daily assets invested in
DWS Funds and (b) 1.200% of the daily assets invested in Other Assets.
(5) The fund's management fee is computed based on the combined average daily
net assets of the Government & Agency Securities Portfolio, Money Market
Portfolio and Tax-Exempt Portfolio, each a series of Cash Account Trust,
and allocated among each fund based upon relative net assets. DIMA has
agreed to reduce its management fee for Government & Agency Securities
Portfolio such that after the allocation of the fee to each series of
Cash Account Trust, the amount payable by Government & Agency Securities
Portfolio will be limited to 0.05% of its average daily net assets.
(6) The fund invests substantially all its assets in Cash Management
Portfolio (the Master Fund). DIMA receives a management fee from the
Master Fund. In the event that the fund withdraws its investment in the
Master Fund, DIMA would become responsible for directly managing the
assets of the fund. In such event, the fund would pay DIMA a management
fee directly and for DWS Money Market Series the management fee rate
would be as follows: (a) first $1.5 billion 0.165%; (b) next $1.75
billion 0.150%; (c) next $1.75 billion 0.135%; and (d) thereafter 0.120%.
UNITARY FEE. For DWS S&P 500 Plus Fund only, for the period between January 1,
2009 and December 31, 2009, the fund paid DIMA a Unitary Fee, calculated each
day and payable monthly, equal to an annual rate of 0.50% of the fund's average
daily net assets.
II-73
Beginning on January 1, 2010, the Unitary Fee continues to be calculated daily
and paid monthly, but equals an annual rate of 0.50% (Base Fee), adjusted as
described below, of the fund's average daily net assets for the previous
365-day period (Performance Period). The Base Fee adjusts to as high as 1.00%
or as low as zero, depending on how the fund's investment performance (based on
the total return of Class S shares, which do not bear Rule 12b-1 fees) for the
Performance Period compares with a benchmark equal to the sum of the investment
record of the S&P 500 Index plus 0.50% (Performance Benchmark) over the
Performance Period. If the fund's investment performance equals the Performance
Benchmark, then DIMA earns the Base Fee of 0.50%. If the fund's investment
performance falls below the Performance Benchmark, then the Unitary Fee
decreases by the difference between them, but not below zero. If the fund's
investment performance exceeds the Performance Benchmark, then the Unitary Fee
increases by the difference between them, but not above 1.00%. In effect, the
Unitary Fee after January 1, 2010 equals the amount by which the investment
performance of the Class S shares of the fund exceeds the performance of the
S&P 500 Index over a given Performance Period, subject to a cap of 1.00% and a
floor of zero. The chart below provides examples of the Unitary Fee that the
fund would pay to DIMA assuming various returns on Class S shares:
INVESTMENT PERFORMANCE DURING
PERFORMANCE PERIOD UNITARY FEE
Exceeds the S&P 500 Index by 1.00% or more 1.00%
Exceeds the S&P 500 Index by 0.75% 0.75%
Exceeds the S&P 500 Index by 0.50% 0.50%
Exceeds the S&P 500 Index by 0.25% 0.25%
Equals or is less than the S&P 500 Index 0.00%
Therefore, if the fund's Class S investment performance is at or below the S&P
500 Index, the shareholders of the fund will neither pay the Unitary Fee nor
bear the fund's day-to-day operating expenses (with the exceptions noted above,
such as Rule 12b-1 fees). To the extent Class A, Class B, Class C and Class R
shares of the fund have higher expenses than Class S shares, using Class S
shares as the measuring class for purposes of calculating the performance
adjustment to the Unitary Fee could result in Class A, Class B, Class C and
Class R shares bearing a larger positive performance adjustment and a smaller
negative performance adjustment than would be the case if each such class's own
performance were considered.
FEE PAYABLE TO DIMA FOR ADMINISTRATIVE SERVICES. Money Market Portfolio, DWS
Dreman Mid Cap Value Fund, DWS Dreman Small Cap Value Fund and DWS Strategic
Value Fund, do not pay DIMA a separate administrative services fee. Each fund,
except those noted below, pays DIMA an administrative services fee, computed
daily and paid monthly, of 0.100% of a fund's average daily net assets. DWS
Equity 500 Index Portfolio and Cash Management Portfolio each pay DIMA an
administrative services, computed daily and paid monthly, of 0.030% of a fund's
average daily net assets.
FEES PAYABLE TO DIFA FOR FUND ACCOUNTING SERVICES. Currently, DIFA receives no
fee for its services to Money Market Portfolio, a series Cash Account Trust,
DWS Dreman Small Cap Value Fund, and DWS Strategic Value Fund; however, subject
to Board approval, DIFA may seek payment from a fund for fund accounting
services in the future.
DIFA receives an annual fee from DWS Dreman Mid Cap Value Fund for fund
accounting services equal to 0.015% of its average daily net assets.
FEE PAYABLE TO DISC FOR TRANSFER AGENCY AND SHAREHOLDER SERVICES. DISC receives
an annual service fee for each account of a fund, based on the type of account.
For open retail accounts, the fee is a flat fee ranging from $20.99 to $24.09
per account, for open wholesale money funds the fee is $35.55 per account,
while for certain retirement accounts serviced on the recordkeeping system of
ExpertPlan, Inc., the fee is a flat fee up to $3.91 per account (as of February
2009, indexed to inflation) plus an asset based fee of up to 0.25% of average
net assets. 1/12th of the annual service charge for each account is charged and
payable to DISC each month. A fee is charged for any account which at any time
during the month had a share balance in a fund. Smaller fees are also charged
for closed accounts for which information must be retained on DISC's system for
up to 18 months after closing for tax reporting purposes.
II-74
Certain out-of-pocket expenses incurred by DISC, including expenses of printing
and mailing routine fund disclosure documents, costs of record retention and
transaction processing costs are reimbursed by a fund or are paid directly by a
fund. Certain additional out-of-pocket expenses, including costs of computer
hardware and software, third party record-keeping fees in excess of 0.25%, and
processing of proxy statements, may only be reimbursed by a fund with the prior
approval of the Board.
II-75
PART II: APPENDIX II-D - FINANCIAL SERVICES FIRMS' COMPENSATION
GENERAL. DIDI may pay compensation to financial intermediaries in connection
with the sale of fund shares as described below. In addition, financial
intermediaries may receive compensation for post-sale administrative services
from DIDI or directly from a fund as described below.
In addition to the discounts or commissions described herein and in the
prospectus, DIDI, the Advisor or its affiliates may pay or allow additional
discounts, commissions or promotional incentives, in the form of cash, to firms
that sell shares of a fund. In some instances, such amounts may be offered only
to certain firms that sell or are expected to sell during specified time
periods certain minimum amounts of shares of a fund, or other funds
underwritten by DIDI (see Financial Intermediary Support Payments under Part
II: Purchase and Redemption of Shares).
Banks and other financial services firms may provide administrative services
related to order placement and payment to facilitate transactions in shares of
a fund for their clients, and DIDI may pay them a transaction fee up to the
level of the discount or commission allowable or payable to dealers.
RETAIL FUNDS: CLASS A, B, C AND R
CLASS A SHARES: The fund receives the entire net asset value of all its Class A
shares sold. DIDI, as principal underwriter, retains the sales charge on sales
of Class A shares from which it allows discounts from the applicable public
offering price to investment dealers, which discounts are uniform for all
dealers in the United States and its territories. The normal discount is set
forth in the sales charge tables set forth in APPENDIX II-F. Upon notice to all
dealers, DIDI may re-allow to dealers up to the full applicable Class A sales
charge during periods and for transactions specified in such notice and such
re-allowances may be based upon attainment of minimum sales levels. During
periods when 90% or more of the sales charge is re-allowed, such dealers may be
deemed to be underwriters as that term is defined in the 1933 Act.
DIDI may at its discretion compensate investment dealers or other financial
services firms in connection with the sale of Class A shares of a fund in
accordance with the Large Order NAV Purchase Privilege and one of the
compensation schedules up to the following amounts:
COMPENSATION SCHEDULE #1: COMPENSATION SCHEDULE #2:
RETAIL SALES AND DWS INVESTMENTS FLEX PLAN/(1)/ DWS INVESTMENTS RETIREMENT PLAN/(2)/
AS A PERCENTAGE OF AS A PERCENTAGE OF
AMOUNT OF SHARES SOLD NET ASSET VALUE AMOUNT OF SHARES SOLD NET ASSET VALUE
$250,000 to $2,999,999 0.75%/(3)/
$250,000 to $49,999,999 0.50%/(4)/ Over $3 million 0.00%-0.50%
$1 million to $2,999,999 0.75%/(5)/, 0.85%/(6)/ - -
1.00%/(7)/
$3 million to $49,999,999 0.50%/(8)/ Over $3 million 0.00%-0.50%
$50 million and greater 0.25%/(8)/ - -
/(1)/ For purposes of determining the appropriate commission percentage to be
applied to a particular sale under the foregoing schedule, DIDI will
consider the cumulative amount invested by the purchaser in a fund and
other funds including purchases pursuant to the "Combined Purchases,"
"Letter of Intent" and "Cumulative Discount" features referred to below.
/(2)/ Compensation Schedules 2 applies to employer sponsored employee benefit
plans using the OmniPlus subaccount record keeping system made available
through ADP, Inc. under an alliance with DIDI and its affiliates.
/(3)/ Applicable to the following funds: DWS Alternative Asset Allocation Fund,
DWS Disciplined Market Neutral Fund, DWS Global Thematic Fund, DWS Large
Cap Value Fund and DWS Select Alternative Asset Allocation Fund.
/(4)/ Applicable to the following funds: DWS California Tax-Free Income Fund,
DWS Floating Rate Plus Fund, DWS GNMA Fund, DWS Intermediate Tax/AMT Free
Fund, DWS Managed Municipal Bond Fund, DWS Massachusetts
II-76
Tax-Free Income Fund, DWS New York Tax-Free Income Fund, DWS Short Duration
Plus Fund, DWS Short-Term Municipal Bond Fund, DWS Strategic Government
Securities Fund, DWS Strategic High Yield Tax-Free Fund and DWS Strategic
Income Fund.
/(5)/ Applicable to DWS Short Duration Fund.
/(6)/ Applicable to income funds except those noted in footnotes (4) and (5),
and DWS U.S. Bond Index Fund.
/(7)/ Applicable to all equity funds except those in footnote (3).
/(8)/ Applicable to all income and equity funds except DWS U.S. Bond Index
Fund.
As indicated under "Purchases" under Part II "Purchase and Redemption of
Shares," Class A shares may be sold at net asset value without a sales charge
to certain professionals who assist in the promotion of DWS mutual funds
pursuant to personal services contracts with DIDI, for themselves or members of
their families. DIDI in its discretion may compensate financial services firms
for sales of Class A shares under this privilege at a commission rate of 0.50%
of the amount of Class A shares purchased.
COMPENSATION FOR CLASS B AND CLASS C SHARES. DIDI compensates firms for sales
of Class B shares at the time of sale at a commission rate of up to 3.75% of
the amount of Class B shares purchased. DIDI is compensated by a fund for
services as distributor and principal underwriter for Class B shares. DIDI
currently pays firms for sales of Class C shares a distribution fee, payable
quarterly, at an annual rate of 0.75% of net assets attributable to Class C
shares maintained and serviced by the firm. Except as provided below, for sales
of Class C shares, DIDI advances to firms the first year distribution fee at a
rate of 0.75% of the purchase price of such shares, and, for periods after the
first year. For sales of Class C shares to employer sponsored employee benefit
plans using the OmniPlus subaccount record keeping system made available
through ADP, Inc. under an alliance with DIDI and its affiliates, DIDI does not
advance the first year distribution fee and for periods after the date of sale,
DIDI currently pays firms a distribution fee, payable quarterly, at an annual
rate of 0.75% based on net assets as of the last business day of the month
attributable to Class C shares maintained and serviced by the firm. DIDI is
compensated by a fund for services as distributor and principal underwriter for
Class C shares.
COMPENSATION FOR CLASS R SHARES. For sales of Class R shares, DIDI currently
pays firms a distribution fee, payable quarterly, at an annual rate of 0.25%
based on net assets attributable to Class R shares maintained and serviced by
the firm.
SERVICE FEES FOR CLASS A, B, C AND R SHARES: With respect to Class A and Class
R Shares of a fund, DIDI pays each firm a service fee, payable quarterly, at an
annual rate of up to 0.25% of the net assets in fund accounts that it maintains
and services attributable to Class A and Class R Shares of a fund, commencing
with the month after investment. With respect to Class B and Class C Shares of
a fund, DIDI currently advances to firms the first-year service fee at a rate
of up to 0.25% of the purchase price of such shares. DIDI does not advance the
first year service fee to firms for sales of Class C shares to
employer-sponsored employee benefit plans using the OmniPlus subaccount record
keeping system made available through ADP, Inc. under an alliance with DIDI and
its affiliates. For periods after the first year, DIDI currently intends to pay
firms a service fee at a rate of up to 0.25% (calculated monthly and paid
quarterly) of the net assets attributable to Class B and Class C shares of a
fund maintained and serviced by the firm (see Retail Funds: Class A, B, C and R
under Part II: Distribution and Service Agreements and Plans).
RETAIL FUNDS: INSTITUTIONAL AND CLASS S SHARES
COMPENSATION FOR INSTITUTIONAL AND CLASS S SHARES. There are no sales charges
for Institutional and Class S shares of the fund.
MONEY MARKET FUNDS (EXCEPT DWS CASH INVESTMENT TRUST CLASS A, B AND C SHARES)
II-77
DWS MONEY MARKET FUND: For DWS Money Market Fund, a series of DWS Money Market
Prime Series, DIDI may in its discretion pay compensation, in amounts not to
exceed 0.50% of net asset value, to firms in connection with the sales of fund
shares to employee benefit plans in excess of $3 million using the OmniPlus
subaccount record keeping system maintained by ADP, Inc. for DWS Retirement
Plans under an alliance with DIDI and its affiliates.
SERVICE SHARES-CASH ACCOUNT TRUST: For the Service Shares classes of the Money
Market Portfolio, the Government & Agency Securities Portfolio and the
Tax-Exempt Portfolio of Cash Account Trust, DIDI normally pays firms a fee for
distribution and administrative services, payable monthly, at a maximum annual
rate of up to 0.60% of average daily net assets of Service Shares held in
accounts that they maintain and service.
PREMIER SHARES-TAX-EXEMPT CALIFORNIA MONEY MARKET FUND: For the Premier Shares
class of the Tax-Exempt California Money Market Fund, DIDI normally pays firms
a fee for distribution and administrative services, payable monthly, at a
maximum annual rate of up to 0.33% of average daily net assets of Premier
Shares held in accounts that they maintain and service.
TAX-EXEMPT NEW YORK MONEY MARKET FUND: For Tax-Exempt New York Money Market
Fund shares, a class of NY Tax Free Money Fund, a series of DWS Advisor Funds,
DIDI normally pays firms a fee for distribution and administrative services,
payable monthly, at a maximum annual rate of up to 0.50% of average daily net
assets of Tax-Exempt New York Money Market Fund shares held in accounts that
they maintain and service.
PREMIUM RESERVE MONEY MARKET SHARES-CASH ACCOUNT TRUST: For the Premium Reserve
Money Market Shares class of the Money Market Portfolio of Cash Account Trust,
DIDI normally pays firms a fee for administrative services, payable monthly, at
a maximum annual rate of up to 0.25% of average daily net assets of Premium
Reserve Money Market Shares held in accounts that they maintain and service.
PREMIER MONEY MARKET SHARES-CASH ACCOUNT TRUST AND INVESTORS CASH TRUST: For
the Premier Money Market Shares classes of the Money Market Portfolio and the
Tax-Exempt Portfolio of Cash Account Trust and of the Treasury Portfolio of
Investors Cash Trust, DIDI normally pays firms a fee for distribution services,
payable monthly, at a maximum annual rate of up to 0.25% of average daily net
assets of Premier Money Market Shares held in accounts that they maintain and
service and DIDI normally pays firms a fee for administrative services, payable
monthly, at a maximum annual rate of up to 0.25% of average daily net assets of
Premier Money Market Shares held in accounts that they maintain and service.
DAVIDSON CASH EQUIVALENT SHARES-CASH ACCOUNT TRUST: For the Davidson Cash
Equivalent Shares and the Davidson Cash Equivalent Plus Shares classes of the
Money Market Portfolio, the Government & Agency Securities Portfolio and the
Tax-Exempt Portfolio of Cash Account Trust, DIDI normally pays the sole
sub-distributor for the classes, D.A. Davidson & Co., a fee for distribution
services, payable monthly, at a maximum annual rate of up to 0.30% of average
daily net assets of those accounts in the Davidson Cash Equivalent Shares that
it maintains and services and 0.25% of average daily net assets in the case of
those accounts in the Davidson Cash Equivalent Plus Shares that it maintains
and services and DIDI normally pays the sole sub-distributor a fee for
administrative services, payable monthly, at a maximum annual rate of up to
0.25% of average daily net assets of those accounts in the Davidson Cash
Equivalent Shares that it maintains and services and 0.20% of average daily net
assets in the case of those accounts in the Davidson Cash Equivalent Plus
Shares that it maintains and services. The Davidson Cash Equivalent Plus Shares
class is limited to the Money Market Portfolio and the Government & Agency
Securities Portfolio.
CAPITAL ASSETS FUNDS-CASH ACCOUNT TRUST: For the Capital Assets Funds Shares
and the Capital Assets Funds Preferred Shares classes of the Money Market
Portfolio, the Government & Agency Securities Portfolio and the Tax-Exempt
Portfolio of Cash Account Trust, DIDI normally pays the sole sub-distributor
for the classes, RIDGE Clearing and Outsourcing Services, Inc., a fee for
distribution services, payable monthly, at a maximum annual rate of up to 0.33%
of average daily net assets of those accounts in the Capital Assets Funds
Shares that it maintains and services and 0.20% of average daily net assets in
the case of those accounts in the Capital Assets Funds Preferred Shares that it
maintains and services and DIDI normally pays the sole sub-distributor a fee
for administrative services, payable monthly, at a maximum annual rate of up to
0.25% of average daily net assets of those accounts in the Capital Assets Funds
Shares
II-78
that it maintains and services and 0.10% of average daily net assets in the
case of those accounts in the Capital Assets Funds Preferred Shares that it
maintains and services. The Capital Assets Funds Preferred Shares class is
limited to the Money Market Portfolio.
MANAGED SHARES-CASH ACCOUNT TRUST: For the Government Cash Managed Shares class
of the Government & Agency Securities Portfolio of Cash Account Trust and the
Tax-Exempt Cash Managed Shares class of the Tax-Exempt Portfolio of Cash
Account Trust, DIDI normally pays firms a fee for administrative services,
payable monthly, at a maximum annual rate of up to 0.15% of average daily net
assets of Managed Shares held in accounts that they maintain and service.
INSTITUTIONAL SHARES-INVESTORS CASH TRUST: For the Institutional Shares class
of the Treasury Portfolio of Investors Cash Trust, DIDI normally pays firms a
fee for administrative services, payable monthly, at a maximum annual rate of
up to 0.05% of average daily net assets of Institutional Shares held in
accounts that they maintain and service.
TAX-FREE INVESTMENT CLASS-CASH ACCOUNT TRUST AND INVESTMENT CLASS-INVESTORS
CASH TRUST: For the Tax-Free Investment Class of the Tax-Exempt Portfolio of
Cash Account Trust and the Investment Class of the Treasury Portfolio of
Investors Cash Trust (collectively, "Investment Class"), DIDI normally pays
firms a fee for distribution services, payable monthly, at a maximum annual
rate of up to 0.25% of average daily net assets of shares of the Investment
Class held in accounts that they maintain and service and DIDI normally pays
firms a fee for administrative services, payable monthly, at a maximum annual
rate of up to 0.07% of average daily net assets of shares of the Investment
Class held in accounts that they maintain and service.
CASH RESERVE PRIME SHARES-PRIME SERIES: For the Cash Reserve Prime Shares class
of the Prime Series of Cash Reserve Fund Inc., DIDI normally pays firms a fee
for distribution services, payable monthly, at a maximum annual rate of up to
0.25% of average daily net assets of shares of the Cash Reserve Prime Shares
held in accounts that they maintain and service and DIDI normally pays firms a
fee for administrative services, payable monthly, at a maximum annual rate of
up to 0.07% of average daily net assets of shares of the Cash Reserve Prime
Shares held in accounts that they maintain and service.
MANAGED SHARES-PRIME SERIES. For the Managed Shares class of the Prime Series
of Cash Reserves Fund, Inc., DIDI normally pays firms a fee for administrative
services, payable monthly, at a maximum annual rate of up to 0.15% of average
daily net assets of Managed Shares held in accounts that they maintain and
service.
SHAREHOLDER SERVICES PLAN FOR CASH MANAGEMENT FUND - INSTITUTIONAL, CASH
RESERVES FUND - INSTITUTIONAL, NY TAX FREE MONEY FUND INVESTMENT CLASS AND
TAX-FREE MONEY FUND INVESTMENT PREMIER SHARES: Cash Management Fund -
Institutional and Cash Reserves Fund - Institutional, each a series of DWS
Institutional Funds, and NY Tax Free Money Fund Investment Class and Tax-Free
Money Fund Investment Premier Shares, each a series and class of DWS Adviser
Funds, pursuant to a shareholder service plan, may pay financial services firms
a service fee at an annual rate of up to 0.25 of 1% of the average daily net
assets of shares of the applicable fund and class held in accounts that the
firm maintains and services.
DWS VARIABLE SERIES I, DWS VARIABLE SERIES II AND DWS INVESTMENTS VIT FUNDS:
For each fund of DWS Variable Series I, DWS Variable Series II and DWS
Investments VIT Funds that has authorized the issuance of Class B shares
(including Class B-2 shares of DWS Equity 500 Index VIP), each fund has adopted
a distribution plan under Rule 12b-1 (Plan) that provides for fees for
distribution and shareholder servicing activities payable through DIDI to
participating insurance companies as an expense of the Class B shares or Class
B-2 shares in an amount of up to 0.25% of the average daily net assets of Class
B shares or Class B-2 shares held by the insurance company.
II-79
PART II: APPENDIX II-E - FIRMS WITH WHICH DEUTSCHE ASSET MANAGEMENT HAS REVENUE
SHARING ARRANGEMENTS
CHANNEL: BROKER-DEALERS AND FINANCIAL ADVISORS
AIG Advisors Group
American Portfolios Financial Services, Inc.
Ameriprise
Capital Analyst, Incorporated
Cetera Financial Group
Commonwealth Equity Services, LLP (dba Commonwealth Financial Network)
Deutsche Bank Group
Ensemble Financial Services
First Allied Securities
HD Vest Investment Securities, Inc.
ING Advisors Network
John Hancock Distributors LLC
LPL Financial
Meridien Financial Group
Merrill Lynch, Pierce, Fenner & Smith Inc.
Morgan Stanley Smith Barney (formerly Citigroup Global Markets, Inc.)
Morgan Stanley Smith Barney (formerly Morgan Stanley & Co.)
Oppenheimer & Co., Inc.
PlanMember Services
Prime Capital Inc.
Raymond James & Associates
Raymond James Financial Services
RBC Wealth Management
Securities America, Inc.
UBS Financial Services
Wells Fargo Advisors, LLC
Wells Fargo Investments, LLC
CHANNEL: CASH PRODUCT PLATFORM
Allegheny Investments LTD
Bank of America
Bank of New York Mellon
Barclays Capital Inc.
BMO Capital Markets
Brown Brothers Harriman
Brown Investment Advisory & Trust Company
Cadaret Grant & Co.
Chicago Mercantile Exchange
Citibank, N.A.
D.A. Davidson & Company
Deutsche Bank Group
Fiduciary Trust Co. - International
First Southwest Company
J.P. Morgan Clearing Corp.
Legent Clearing LLC
Lincoln Investment Planning
LPL Financial
Mesirow Financial, Inc.
Penson Financial Services
II-80
Pershing Choice Platform
ProFunds Distributors, Inc.
Ridge Clearing & Outsourcing Solutions
Romano Brothers and Company
SAMCO Capital Markets
Smith Moore & Company
State Street Global Markets
Sungard Institutional Brokerage Inc.
Treasury Curve LLC
Union Bank, NA
US Bancorp
William Blair & Company
CHANNEL: THIRD PARTY INSURANCE PLATFORMS
Allstate Life Insurance Company of New York
Ameritas Life Insurance Group
Annuity Investors Life Insurance Company
Columbus Life Insurance Company
Commonwealth Annuity and Life Insurance Company
Companion Life Insurance Company
Connecticut General Life Insurance Company
EquiTrust Life Insurance Company
Farm Bureau Life Insurance Company
Farmers New World Life Insurance Company
Fidelity Security Life Insurance Company
First Allmerica Financial Life Insurance Company
First Great West Life and Annuity Company
Genworth Life Insurance Company of New York
Genworth Life and Annuity Insurance Company
Great West Life and Annuity Insurance Company
Hartford Life Insurance Company
Integrity Life Insurance Company
John Hancock Life Insurance companies
Kemper Investors Life Insurance Company
Lincoln Benefit Life Insurance Company
Lincoln Life & Annuity Company of New York
Lincoln National Life Insurance Company
Massachusetts Mutual Life Insurance Group
MetLife Group
Minnesota Life Insurance Company
National Life Insurance Company
National Integrity Life Insurance Company
Nationwide Group
New York Life Insurance and Annuity Corporation
Phoenix Life Insurance Company
Protective Life Insurance
Prudential Insurance Company of America
Sun Life Group
Symetra Life Insurance Company
Transamerica Life Insurance Company
Union Central Life Insurance Company
II-81
United of Omaha Life Insurance Company
United Investors Life Insurance Company
Western Southern Life Assurance Company
Any additions, modifications or deletions to the financial advisors identified
above that have occurred since the date hereof are not reflected.
II-82
PART II: APPENDIX II-F - CLASS A SALES CHARGE SCHEDULE
CLASS A PURCHASES. The public offering price of Class A shares for purchasers
choosing the initial sales charge alternative is the net asset value plus a
sales charge, as set forth below.
INTERNATIONAL/GLOBAL FUNDS: Climate Change, Emerging Markets Equity, Europe
Equity, Global Small Cap Growth, Latin America Equity, International,
Diversified International Equity, Dreman International Value, RREEF Global
Infrastructure, RREEF Global Real Estate; GROWTH FUNDS: Blue Chip, Capital
Growth, Communications, Gold & Precious Metals, Health Care, Large Cap Focus
Growth, Mid Cap Growth, Small Cap Growth, Technology; VALUE FUNDS: Enhanced
Commodity Strategy, Strategic Value, Dreman Mid Cap Value, Dreman Small Cap
Value, Growth & Income, RREEF Real Estate Securities, Small Cap Core, Small Cap
Value; MULTICATEGORY/ASSET ALLOCATION FUNDS: Balanced, LifeCompass Retirement,
LifeCompass 2015, LifeCompass 2020, LifeCompass 2030, LifeCompass 2040,
Lifecycle Long Range; INDEX-RELATED FUNDS: S&P 500 Plus:
SALES CHARGE
AS A PERCENTAGE AS A PERCENTAGE OF ALLOWED TO DEALERS AS A
AMOUNT OF PURCHASE OF OFFERING PRICE* NET ASSET VALUE** PERCENTAGE OF OFFERING PRICE
Less than $50,000 5.75% 6.10% 5.20%
$50,000 but less than $100,000 4.50% 4.71% 4.00%
$100,000 but less than $250,000 3.50% 3.63% 3.00%
$250,000 but less than $500,000 2.60% 2.67% 2.25%
$500,000 but less than $1 million 2.00% 2.04% 1.75%
$1 million and over .00*** .00*** .00****
INTERNATIONAL/GLOBAL FUNDS: Global Thematic; VALUE FUNDS: Disciplined Market
Neutral and Large Cap Value; MULTICATEGORY/
ASSET ALLOCATION FUNDS: Alternative Asset Allocation Plus and Select
Alternative Asset Allocation:
SALES CHARGE
AS A PERCENTAGE AS A PERCENTAGE OF ALLOWED TO DEALERS AS A
AMOUNT OF PURCHASE OF OFFERING PRICE* NET ASSET VALUE** PERCENTAGE OF OFFERING PRICE
Less than $50,000 5.75% 6.10% 5.20%
$50,000 but less than $100,000 4.50% 4.71% 4.00%
$100,000 but less than $250,000 3.50% 3.63% 3.00%
$250,000 and over .00*** .00*** .00****
INTERNATIONAL/GLOBAL FUNDS: Emerging Markets Fixed Income Fund, Global Bond;
INCOME FUNDS: Core Fixed Income, High Income, High Income Plus, Core Plus
Income; INDEX RELATED FUNDS: S&P 500 Index:
SALES CHARGE
AS A PERCENTAGE AS A PERCENTAGE OF ALLOWED TO DEALERS AS A
AMOUNT OF PURCHASE OF OFFERING PRICE* NET ASSET VALUE** PERCENTAGE OF OFFERING PRICE
Less than $100,000 4.50% 4.71% 4.00%
$100,000 but less than $250,000 3.50% 3.63% 3.00%
$250,000 but less than $500,000 2.60% 2.67% 2.25%
$500,000 but less than $1 million 2.00% 2.04% 1.75%
$1 million and over 0.00*** 0.00*** 0.00****
II-83
INCOME FUNDS: Global Inflation Plus, Short Duration and U.S. Bond Index
SALES CHARGE
AS A PERCENTAGE AS A PERCENTAGE OF ALLOWED TO DEALERS AS A
AMOUNT OF PURCHASE OF OFFERING PRICE* NET ASSET VALUE** PERCENTAGE OF OFFERING PRICE
Less than $100,000 2.75% 2.83% 2.25%
$100,000 but less than $250,000 2.50% 2.56% 2.00%
$250,000 but less than $500,000 2.00% 2.04% 1.75%
$500,000 but less than $1 million 1.50% 1.52% 1.25%
$1 million and over 0.00*** 0.00*** 0.00****
TAX-FREE INCOME FUNDS: California Tax-Free Income, New York Tax-Free Income,
Massachusetts Tax-Free Income, Strategic High Yield Tax-Free, Managed Municipal
Bond and Intermediate Tax/AMT Free. INCOME FUNDS: Floating Rate Plus, GNMA,
Short Duration Plus, Strategic Income and Strategic Government Securities.
SALES CHARGE
AS A PERCENTAGE AS A PERCENTAGE OF ALLOWED TO DEALERS AS A
AMOUNT OF PURCHASE OF OFFERING PRICE* NET ASSET VALUE** PERCENTAGE OF OFFERING PRICE
Less than $100,000 2.75% 2.83% 2.25%
$100,000 but less than $250,000 2.50% 2.56% 2.00%
$250,000 and over 0.00*** 0.00*** 0.00***
MULTICATEGORY ASSET ALLOCATION FUNDS: Target 2010, Target 2011, Target 2012,
Target 2013, Target 2014. These funds do not have a share class but are similar
in structure to Class A shares.
SALES CHARGE
AS A PERCENTAGE AS A PERCENTAGE OF ALLOWED TO DEALERS AS A
AMOUNT OF PURCHASE OF OFFERING PRICE NET ASSET VALUE PERCENTAGE OF OFFERING PRICE
Less than $100,000 5.00% 5.26% 4.50%
$100,000 but less than $250,000 4.00% 4.17% 3.60%
$250,000 but less than $500,000 3.00% 3.09% 2.70%
$500,000 but less than $1 million 2.00% 2.04% 1.80%
$1 million and over 0.00 0.00 0.00
TAX FREE INCOME FUNDS: Short-Term Municipal Bond
SALES CHARGE
AS A PERCENTAGE AS A PERCENTAGE OF ALLOWED TO DEALERS AS A
AMOUNT OF PURCHASE OF OFFERING PRICE* NET ASSET VALUE** PERCENTAGE OF OFFERING PRICE
Less than $100,000 2.00% 2.04% 1.50%
$100,000 but less than $250,000 1.75% 1.78% 1.25%
$250,000 and over 0.00*** 0.00*** 0.00****
* The offering price includes the sales charge.
** Rounded to the nearest one-hundredth percent.
*** Redemption of shares may be subject to a contingent deferred sales
charge.
**** Commission is payable by DIDI.
II-84
PART II: APPENDIX II-G - INVESTMENT PRACTICES AND TECHNIQUES
ADJUSTABLE RATE SECURITIES. The interest rates paid on the adjustable rate
securities in which a fund invests generally are readjusted at periodic
intervals, usually by reference to a predetermined interest rate index.
Adjustable rate securities include US Government securities and securities of
other issuers. Some adjustable rate securities are backed by pools of mortgage
loans. There are three main categories of interest rate indices: those based on
US Treasury securities, those derived from a calculated measure such as a cost
of funds index and those based on a moving average of mortgage rates. Commonly
used indices include the one-year, three-year and five-year constant maturity
Treasury rates, the three-month Treasury bill rate, the 180-day Treasury bill
rate, rates on longer-term Treasury securities, the 11th District Federal Home
Loan Bank Cost of Funds, the National Median Cost of Funds, the one-month,
three-month, six-month or one-year London Interbank Offered Rate (LIBOR), the
prime rate of a specific bank or commercial paper rates. As with fixed-rates
securities, changes in market interest rates and changes in the issuer's
creditworthiness may affect the value of adjustable rate securities.
Some indices, such as the one-year constant maturity Treasury rate, closely
mirror changes in market interest rate levels. Others, such as the 11th
District Home Loan Bank Cost of Funds index (Cost of Funds Index), tend to lag
behind changes in market rate levels and tend to be somewhat less volatile. To
the extent that the Cost of Funds index may reflect interest changes on a more
delayed basis than other indices, in a period of rising interest rates, any
increase may produce a higher yield later than would be produced by such other
indices, and in a period of declining interest rates, the Cost of Funds index
may remain higher for a longer period of time than other market interest rates,
which may result in a higher level of principal prepayments on adjustable rate
securities which adjust in accordance with the Cost of Funds index than
adjustable rate securities which adjust in accordance with other indices. In
addition, dislocations in the member institutions of the 11th District Federal
Home Loan Bank in recent years have caused and may continue to cause the Cost
of Funds index to change for reasons unrelated to changes in general interest
rate levels. Furthermore, any movement in the Cost of Funds index as compared
to other indices based upon specific interest rates may be affected by changes
in the method used to calculate the Cost of Funds index.
If prepayments of principal are made on the securities during periods of rising
interest rates, a fund generally will be able to reinvest such amounts in
securities with a higher current rate of return. However, a fund will not
benefit from increases in interest rates to the extent that interest rates rise
to the point where they cause the current coupon of adjustable rate securities
held as investments by a fund to exceed the maximum allowable annual or
lifetime reset limits (cap rates) for a particular adjustable rate security.
Also, a fund's net asset value could vary to the extent that current yields on
adjustable rate securities are different than market yields during interim
periods between coupon reset dates.
During periods of declining interest rates, the coupon rates may readjust
downward, resulting in lower yields to a fund. Further, because of this
feature, the value of adjustable rate securities is unlikely to rise during
periods of declining interest rates to the same extent as fixed-rate
instruments. Interest rate declines may result in accelerated prepayment of
adjustable rate securities, and the proceeds from such prepayments must be
reinvested at lower prevailing interest rates.
ADVANCE REFUNDED BONDS. A fund may purchase municipal securities that are
subsequently refunded by the issuance and delivery of a new issue of bonds
prior to the date on which the outstanding issue of bonds can be redeemed or
paid. The proceeds from the new issue of bonds are typically placed in an
escrow fund consisting of US Government obligations that are used to pay the
interest, principal and call premium on the issue being refunded. A fund may
also purchase municipal securities that have been refunded prior to purchase.
ASSET-BACKED SECURITIES. A fund may invest in securities generally referred to
as asset-backed securities. Asset-backed securities are securities that
directly or indirectly represent interests in, or are secured by and payable
from, an underlying pool of assets such as (but not limited to) first lien
mortgages, motor vehicle installment sale contracts, other installment sale
contracts, home equity loans, leases of various types of real and personal
property, and receivables from revolving credit (i.e., credit card) agreements
and trade receivables. Such assets are securitized through the use of trusts
and special purpose corporations. Asset-backed securities may provide periodic
payments that consist of interest and/or principal payments. Consequently, the
life of an asset-backed security varies with the prepayment and loss experience
II-85
of the underlying assets. Payments of principal and interest may be dependent
upon the cash flow generated by the underlying assets backing the securities
and, in certain cases, may be supported by some form of credit enhancement (for
more information, see Credit Enhancement). The degree of credit enhancement
provided for each issue is generally based on historical information respecting
the level of credit risk associated with the underlying assets. Delinquency or
loss in excess of that anticipated or failure of the credit enhancement could
adversely affect the return on an investment in such a security. The value of
the securities also may change because of changes in interest rates or changes
in the market's perception of the creditworthiness of the servicing agent for
the loan pool, the originator of the loans or the financial institution
providing the credit enhancement. Additionally, since the deterioration of
worldwide economic and liquidity conditions that became acute in 2008,
asset-backed securities have been subject to greater liquidity risk.
Asset-backed securities are ultimately dependent upon payment of loans and
receivables by individuals, businesses and other borrowers, and a fund
generally has no recourse against the entity that originated the loans.
Because asset-backed securities may not have the benefit of a security interest
in the underlying assets, asset-backed securities present certain additional
risks that are not present with mortgage-backed securities. For example, credit
card receivables are generally unsecured, and the debtors are entitled to the
protection of a number of state and federal consumer credit laws, many of which
give such debtors the right to avoid payment of certain amounts owed on the
credit cards, thereby reducing the balance due. Furthermore, most issuers of
automobile receivables permit the servicer to retain possession of the
underlying obligations. If the servicer were to sell these obligations to
another party, there is a risk that the purchaser would acquire an interest
superior to that of the holders of the related automobile receivables. In
addition, because of the large number of vehicles involved in a typical
issuance and technical requirements under state laws, the trustee for the
holders of the automobile receivables may not have a proper security interest
in all of the obligations backing such receivables. Therefore, there is the
possibility that recoveries on repossessed collateral may not, in some cases,
be available to support payments on these securities.
The yield characteristics of the asset-backed securities in which a fund may
invest differ from those of traditional debt securities. Among the major
differences are that interest and principal payments are made more frequently
on asset-backed securities (usually monthly) and that principal may be prepaid
at any time because the underlying assets generally may be prepaid at any time.
As a result, if a fund purchases these securities at a premium, a prepayment
rate that is faster than expected will reduce their yield, while a prepayment
rate that is slower than expected will have the opposite effect of increasing
yield. Conversely, if a fund purchases these securities at a discount, faster
than expected prepayments will increase, while slower than expected prepayments
will reduce, the yield on these securities. Because prepayment of principal
generally occurs during a period of declining interest rates, a fund may
generally have to reinvest the proceeds of such prepayments at lower interest
rates. Therefore, asset-backed securities may have less potential for capital
appreciation in periods of falling interest rates than other income-bearing
securities of comparable maturity.
Other Asset-Backed Securities. The securitization techniques used to develop
mortgage-backed securities are now being applied to a broad range of assets.
Through the use of trusts and special purpose corporations, various types of
assets, including automobile loans, computer leases and credit card
receivables, are being securitized in pass-through structures similar to
mortgage pass-through structures or in a structure similar to the CMO
structure. In general, the collateral supporting these securities is of shorter
maturity than mortgage loans and is less likely to experience substantial
prepayments with interest rate fluctuations.
Several types of asset-backed securities have already been offered to
investors, including Certificates of Automobile Receivables/SM/ (CARS/SM/).
CARS/SM/ represent undivided fractional interests in a trust whose assets
consist of a pool of motor vehicle retail installment sales contracts and
security interests in the vehicles securing the contracts. Payments of
principal and interest on CARS/SM/ are passed through monthly to certificate
holders, and are guaranteed up to certain amounts and for a certain time period
by a letter of credit issued by a financial institution unaffiliated with the
trustee or originator of the trust. An investor's return on CARS/SM/ may be
affected by early prepayment of principal on the underlying vehicle sales
contracts. If the letter of credit is exhausted, the trust may be prevented
from realizing the full amount due on a sales contract because of state law
requirements and restrictions relating to foreclosure sales of vehicles and the
obtaining of deficiency judgments following such sales or because of
depreciation, damage or loss of a vehicle, the application of federal and state
bankruptcy and insolvency laws, or other factors. As a result, certificate
holders may experience delays in payments or losses if the letter of credit is
exhausted.
II-86
A fund may also invest in residual interests in asset-backed securities. In the
case of asset-backed securities issued in a pass-through structure, the cash
flow generated by the underlying assets is applied to make required payments on
the securities and to pay related administrative expenses. The residual in an
asset-backed security pass-through structure represents the interest in any
excess cash flow remaining after making the foregoing payments. The amount of
residual cash flow resulting from a particular issue of asset-backed securities
will depend on, among other things, the characteristics of the underlying
assets, the coupon rates on the securities, prevailing interest rates, the
amount of administrative expenses and the actual prepayment experience on the
underlying assets. Asset-backed security residuals not registered under the
Securities Act may be subject to certain restrictions on transferability. In
addition, there may be no liquid market for such securities.
The availability of asset-backed securities may be affected by legislative or
regulatory developments. It is possible that such developments may require a
fund to dispose of any then-existing holdings of such securities.
ASSET-INDEXED SECURITIES. A fund may purchase asset-indexed securities which
are debt securities usually issued by companies in precious metals related
businesses such as mining, the principal amount, redemption terms, or interest
rates of which are related to the market price of a specified precious metal.
Market prices of asset-indexed securities will relate primarily to changes in
the market prices of the precious metals to which the securities are indexed
rather than to changes in market rates of interest. However, there may not be a
perfect correlation between the price movements of the asset-indexed securities
and the underlying precious metals. Asset-indexed securities typically bear
interest or pay dividends at below market rates (and in certain cases at
nominal rates). The purchase of asset-indexed securities also exposes a fund to
the credit risk of the issuer of the asset-indexed securities.
ASSET SEGREGATION. Certain investment transactions expose a fund to an
obligation to make future payments to third parties. Examples of these types of
transactions, include, but are not limited to, reverse repurchase agreements,
short sales, dollar rolls, when-issued, delayed-delivery or forward commitment
transactions and certain derivatives such as swaps, futures, forwards, and
options. To the extent that a fund engages in such transactions, a fund will
(to the extent required by applicable law) either (1) segregate cash or liquid
assets in the prescribed amount or (2) otherwise "cover" its future obligations
under the transaction, such as by holding an offsetting investment. If a fund
segregates sufficient cash or other liquid assets or otherwise "covers" its
obligations under such transactions, a fund will not consider the transactions
to be borrowings for purposes of its investment restrictions or "senior
securities" under the 1940 Act, and therefore, such transactions will not be
subject to the 300% asset coverage requirement under the 1940 Act otherwise
applicable to borrowings by a fund.
In some cases (e.g., with respect to futures and forwards that are
contractually required to "cash-settle"), a fund will segregate cash or other
liquid assets with respect to the amount of the daily net (marked-to-market)
obligation arising from the transaction, rather than the notional amount of the
underlying contract. By segregating assets in an amount equal to the net
obligation rather than the notional amount, a fund will have the ability to
employ leverage to a greater extent than if it set aside cash or other liquid
assets equal to the notional amount of the contract, which may increase the
risk associated with such transactions.
A fund may utilize methods of segregating assets or otherwise "covering"
transactions that are currently or in the future permitted under the 1940 Act,
the rules and regulations thereunder, or orders issued by the Securities and
Exchange Commission (SEC) thereunder. For these purposes, interpretations and
guidance provided by the SEC staff may be taken into account when deemed
appropriate by a fund.
Assets used as segregation or "cover" cannot be sold while the position in the
corresponding transaction is open, unless they are replaced with other
appropriate assets. As a result, the commitment of a large portion of a fund's
assets for segregation and "cover" purposes could impede portfolio management
or a fund's ability to meet redemption requests or other current obligations.
Segregating assets or otherwise "covering" for these purposes does not
necessarily limit the percentage of the assets of a fund that may be at risk
with respect to certain derivative transactions.
II-87
AUCTION RATE SECURITIES. Auction rate securities in which certain municipal
funds may invest consist of auction rate municipal securities and auction rate
preferred securities issued by closed-end investment companies that invest
primarily in municipal securities. Provided that the auction mechanism is
successful, auction rate securities usually normally permit the holder to sell
the securities in an auction at par value at specified intervals. The dividend
is reset by a "Dutch" auction in which bids are made by broker-dealers and
other institutions for a certain amount of securities at a specified minimum
yield. The dividend rate set by the auction is the lowest interest or dividend
rate that covers all securities offered for sale. While this process is
designed to permit auction rate securities to be traded at par value, there is
the risk that an auction will fail due to insufficient demand for the
securities. If an auction fails, the dividend rate of the securities rate
adjusts to a maximum rate, specified in the issuer's offering documents and, in
the case of closed-end funds, relevant charter documents. Security holders that
submit sell orders in a failed auction may not be able to sell any or all of
the shares for which they have submitted sell orders. Security holders may sell
their shares at the next scheduled auction, subject to the same risk that the
subsequent auction will not attract sufficient demand for a successful auction
to occur. Broker-dealers may also try to facilitate secondary trading in the
auction rate securities, although such secondary trading may be limited and may
only be available for shareholders willing to sell at a discount. Since
February 2008, many municipal issuers and closed-end funds have experienced,
and continue to experience, failed auctions of their auction rate securities.
Repeated auction failures have significantly affected the liquidity of auction
rate securities, shareholders of such securities have generally continued to
receive dividends at the above-mentioned maximum rate. There is no assurance
that auctions will resume or that any market will develop for auction rate
securities. Valuations of such securities is highly speculative, however,
dividends on auction rate preferred securities issued by a closed-end fund may
be designated as exempt from federal income tax to the extent they are
attributable to tax-exempt interest income earned by a fund on the securities
in its portfolio and distributed to holders of the preferred securities,
provided that the preferred securities are treated as equity securities for
federal income tax purposes, and the closed-end fund complies with certain
requirements under the Code. A fund's investments in auction rate preferred
securities of closed-end funds are subject to limitations on investments in
other US registered investment companies, which limitations are prescribed by
the 1940 Act.
BANK LOANS. Bank loans are typically senior debt obligations of borrowers
(issuers) and, as such, are considered to hold a senior position in the capital
structure of the borrower. These may include loans that hold the most senior
position, that hold an equal ranking with other senior debt, or loans that are,
in the judgment of the Advisor, in the category of senior debt of the borrower.
This capital structure position generally gives the holders of these loans a
priority claim on some or all of the borrower's assets in the event of a
default. In most cases, these loans are either partially or fully
collateralized by the assets of a corporation, partnership, limited liability
company or other business entity, or by cash flow that the Advisor believes at
the time of acquisition is sufficient to service the loan. These loans are
often issued in connection with recapitalizations, acquisitions, leveraged
buy-outs and refinancings. Moody's and S&P may rate bank loans higher than high
yield bonds of the same issuer to reflect their more senior position. A fund
may invest in both fixed- and floating-rate loans.
Bank loans may include restrictive covenants which must be maintained by the
borrower. Such covenants, in addition to the timely payment of interest and
principal, may include mandatory prepayment provisions arising from free cash
flow, restrictions on dividend payments and usually state that a borrower must
maintain specific minimum financial ratios as well as establishing limits on
total debt. A breach of covenant, which is not waived by the agent, is normally
an event of acceleration, i.e., the agent has the right to call the outstanding
bank loan. In addition, loan covenants may include mandatory prepayment
provisions stemming from free cash flow. Free cash flow is cash that is in
excess of capital expenditures plus debt service requirements of principal and
interest. The free cash flow shall be applied to prepay the bank loan in an
order of maturity described in the loan documents.
When a fund has an interest in certain types of bank loans, a fund may have an
obligation to make additional loans upon demand by the borrower. These
commitments may have the effect of requiring a fund to increase its investment
in a borrower at a time when it would not otherwise have done so. A fund
intends to reserve against such contingent obligations by segregating
sufficient assets in high quality short-term liquid investments or borrowing to
cover such obligations.
II-88
Under a bank loan, the borrower generally must pledge as collateral assets
which may include one or more of the following: cash; accounts receivable;
inventory; property, plant and equipment; common and preferred stock in its
subsidiaries; trademarks, copyrights, patent rights; and franchise value. A
fund may also receive guarantees as a form of collateral. In some instances, a
bank loan may be secured only by stock in a borrower or its affiliates. A fund
may also invest in bank loans not secured by any collateral. The market value
of the assets serving as collateral (if any) will, at the time of investment,
in the opinion of the Advisor, equal or exceed the principal amount of the bank
loan. The valuations of these assets may be performed by an independent
appraisal. If the agent becomes aware that the value of the collateral has
declined, the agent may take action as it deems necessary for the protection of
its own interests and the interests of the other lenders, including, for
example, giving the borrower an opportunity to provide additional collateral or
accelerating the loan. There is no assurance, however, that the borrower would
provide additional collateral or that the liquidation of the existing
collateral would satisfy the borrower's obligation in the event of nonpayment
of scheduled interest or principal, or that such collateral could be readily
liquidated.
In a typical interest in a bank loan, the agent administers the loan and has
the right to monitor the collateral. The agent is also required to segregate
the principal and interest payments received from the borrower and to hold
these payments for the benefit of the lenders. A fund normally looks to the
agent to collect and distribute principal of and interest on a bank loan.
Furthermore, a fund looks to the agent to use normal credit remedies, such as
to foreclose on collateral; monitor credit loan covenants; and notify the
lenders of any adverse changes in the borrower's financial condition or
declarations of insolvency. In the event of a default by the borrower, it is
possible, though unlikely, that a fund could receive a portion of the
borrower's collateral. If a fund receives collateral other than cash, such
collateral will be liquidated and the cash received from such liquidation will
be available for investment as part of a fund's portfolio. At times a fund may
also negotiate with the agent regarding the agent's exercise of credit remedies
under a bank loan. The agent is compensated for these services by the borrower
as is set forth in the loan agreement. Such compensation may take the form of a
fee or other amount paid upon the making of the bank loan and/or an ongoing fee
or other amount.
The loan agreement in connection with bank loans sets forth the standard of
care to be exercised by the agents on behalf of the lenders and usually
provides for the termination of the agent's agency status in the event that it
fails to act properly, becomes insolvent, enters FDIC receivership, or if not
FDIC insured, enters into bankruptcy or if the agent resigns. In the event an
agent is unable to perform its obligations as agent, another lender would
generally serve in that capacity.
Loan agreements frequently require the borrower to make full or partial
prepayment of a loan when the borrower engages in asset sales or a securities
issuance. Prepayments on bank loans may also be made by the borrower at its
election. The rate of such prepayments may be affected by, among other things,
general business and economic conditions, as well as the financial status of
the borrower. Prepayment would cause the actual duration of a bank loan to be
shorter than its stated maturity. This should, however, allow a fund to
reinvest in a new loan and recognize as income any unamortized loan fees. This
may result in a new facility fee payable to a fund. Because interest rates paid
on bank loans periodically fluctuate with the market, it is expected that the
prepayment and a subsequent purchase of a new bank loan by a fund will not have
a material adverse impact on the yield of the portfolio. A fund generally holds
bank loans to maturity unless it has become necessary to adjust a fund's
portfolio in accordance with the Advisor's view of current or expected economic
or specific industry or borrower conditions.
A fund may be required to pay and may receive various fees and commissions in
the process of purchasing, selling and holding bank loans. The fee may include
any, or a combination of, the following elements: arrangement fees, non-use
fees, facility fees, letter of credit fees and ticking fees. Arrangement fees
are paid at the commencement of a loan as compensation for the initiation of
the transaction. A non-use fee is paid based upon the amount committed but not
used under the loan. Facility fees are on-going annual fees paid in connection
with a loan. Letter of credit fees are paid if a loan involves a letter of
credit. Ticking fees are paid from the initial commitment indication until loan
closing. The amount of fees is negotiated at the time of transaction.
If legislation or state or federal regulators impose additional requirements or
restrictions on the ability of financial institutions to make loans that are
considered highly leveraged transactions, the availability of bank loans for
investment by a fund may be adversely affected. In addition, such requirements
or restrictions could reduce or eliminate sources of financing for certain
borrowers. This would increase the risk of default. If legislation or federal
or state regulators
II-89
require financial institutions to dispose of bank loans that are considered
highly leveraged transactions or subject such bank loans to increased
regulatory scrutiny, financial institutions may determine to sell such bank
loans. Such sales by affected financial institutions may not be at desirable
prices, in the opinion of the Advisor. If a fund attempts to sell a bank loan
at a time when a financial institution is engaging in such a sale, the price a
fund could get for the bank loan may be adversely affected.
Affiliates of the Advisor may participate in the primary and secondary market
for bank loans. Because of limitations imposed by applicable law, the presence
of the Advisor's affiliates in the bank loan market may restrict a fund's
ability to acquire some bank loans, or affect the timing or price of such
acquisition. The Advisor does not believe that this will materially affect a
fund's ability to achieve its investment objective. Also, because the Advisor
may wish to invest in the publicly traded securities of a borrower, it may not
have access to material non-public information regarding the borrower to which
other lenders have access.
Loan Participations and Assignments. A fund's investments in bank loans are
expected in most instances to be in the form of participations in bank loans
(Participations) and assignments of portions of bank loans (Assignments) from
third parties. Large loans to corporations or governments may be shared or
syndicated among several lenders, usually banks. A fund may participate in such
syndicates, or can buy part of a loan, becoming a direct lender. Large loans to
corporations or governments may be shared or syndicated among several lenders,
usually banks. A fund may participate in such syndicates, or can buy part of a
loan, becoming a direct lender.
When a fund buys an Assignment, it is essentially becoming a party to the bank
agreement. The vast majority of all trades are Assignments and would therefore
generally represent the preponderance of bank loans held by a fund. When a fund
is a purchaser of an Assignment, it typically succeeds to all the rights and
obligations under the loan agreement of the assigning lender and becomes a
lender under the loan agreement with the same rights and obligations as the
assigning lender. Because Assignments are arranged through private negotiations
between potential assignees and potential assignors, however, the rights and
obligations acquired by a fund as the purchaser of an Assignment may differ
from, and may be more limited than, those held by the assigning lender.
In certain cases, a fund may buy bank loans on a participation basis, if for
example, a fund did not want to become party to the bank agreement. With
respect to any given bank loan, the rights of a fund when it acquires a
Participation may be more limited than the rights of the original lenders or of
investors who acquire an Assignment. Participations typically will result in a
fund having a contractual relationship only with the lender and not with the
borrower. A fund will have the right to receive payments of principal, interest
and any fees to which it is entitled only from the lender selling the
Participation and only upon receipt by the lender of the payments from the
borrower. In connection with purchasing Participations, a fund generally will
have no right to enforce compliance by the borrower with the terms of the loan
agreement relating to the bank loan, nor any rights of set-off against the
borrower, and a fund may not directly benefit from any collateral supporting
the bank loan in which it has purchased the Participation. As a result, a fund
will assume the credit risk of both the borrower and the lender that is selling
the Participation. In the event of the insolvency of the lender selling a
Participation, a fund may be treated as a general creditor of the lender and
may not benefit from any set-off between the lender and the borrower.
In the case of loan Participations where a bank or other lending institution
serves as financial intermediary between a fund and the borrower, if the
Participation does not shift to a fund the direct debtor-creditor relationship
with the borrower, SEC interpretations require a fund, in some circumstances,
to treat both the lending bank or other lending institution and the borrower as
issuers for purposes of a fund's investment policies. Treating a financial
intermediary as an issuer of indebtedness may restrict a fund's ability to
invest in indebtedness related to a single financial intermediary, or a group
of intermediaries engaged in the same industry, even if the underlying
borrowers represent many different companies and industries.
A fund may pay a fee or forego a portion of interest payments to the lender
selling a Participation or Assignment under the terms of such Participation or
Assignment. In the case of loans administered by a bank or other financial
institution that acts as agent for all holders, if assets held by the agent for
the benefit of a purchaser are determined to be subject to the claims of the
agent's general creditors, the purchaser might incur certain costs and delays
in realizing payment on the loan or loan Participation and could suffer a loss
of principal or interest.
II-90
Participations and Assignments involve credit risk, interest rate risk, and
liquidity risk, as well as the potential liability associated with being a
lender. If a fund purchases a Participation, it may only be able to enforce its
rights through the participating lender, and may assume the credit risk of both
the lender and the borrower. Investments in loans through direct Assignment of
a financial institution's interests with respect to a loan may involve
additional risks. For example, if a loan is foreclosed, a fund could benefit
from becoming part owner of any collateral, however, a fund would bear the
costs and liabilities associated with owning and disposing of the collateral.
A fund may have difficulty disposing of Assignments and Participations. Because
no liquid market for these obligations typically exists, a fund anticipates
that these obligations could be sold only to a limited number of institutional
investors. The lack of a liquid secondary market will have an adverse effect on
a fund's ability to dispose of particular Assignments or Participations when
necessary to meet a fund's liquidity needs or in response to a specific
economic event, such as a deterioration in the creditworthiness of the
borrower. The lack of a liquid secondary market for Assignments and
Participations may also make it more difficult for a fund to assign a value to
those securities for purposes of valuing a fund's portfolio and calculating its
net asset value.
BANK AND SAVINGS AND LOAN OBLIGATIONS. These obligations include negotiable
certificates of deposit, bankers' acceptances, deposit notes, fixed time
deposits or other short-term bank obligations. Certificates of deposit are
negotiable certificates evidencing the obligations of a bank to repay funds
deposited with it for a specified period of time. a fund may invest in
certificates of deposit of large domestic banks and their foreign branches,
large US regulated subsidiaries of large foreign banks (i.e., banks which at
the time of their most recent annual financial statements show total assets in
excess of $1 billion), and of smaller banks, in certain instances. Although a
fund recognizes that the size of a bank is important, this fact alone is not
necessarily indicative of its creditworthiness.
Banker's acceptances are credit instruments evidencing the obligations of a
bank to pay a draft drawn on it by a customer. These instruments reflect the
obligation both of the bank and of the drawer to pay the face amount of the
instrument upon maturity.
Time deposits are non-negotiable deposits maintained in a banking institution
for a specified period of time at a stated interest rate. Time deposits that
may be held by a fund will not benefit from insurance from the Bank Insurance
Fund or the Savings Association Insurance Fund administered by the Federal
Deposit Insurance Corporation. Fixed time deposits may be withdrawn on demand
by the investor, but may be subject to early withdrawal penalties that vary
with market conditions and the remaining maturity of the obligation. Fixed time
deposits, which are subject to withdrawal penalties, maturing in more than
seven calendar days are subject to a fund's limitation on investments in
illiquid securities.
For purposes of a fund's investment policies with respect to bank obligations,
the assets of a bank will be deemed to include the assets of its domestic and
foreign branches. Obligations of foreign branches of US banks and foreign banks
may be general obligations of the parent bank in addition to the issuing bank
or may be limited by the terms of a specific obligation and by government
regulation. A fund may invest in obligations of foreign banks or foreign
branches of US banks, which include banks located in the United Kingdom, Grand
Cayman Island, Nassau, Japan and Canada.
Investments in obligations of foreign banks may entail risks that are different
in some respects from those of investments in obligations of US domestic banks
because of differences in political, regulatory and economic systems and
conditions. These risks include the possibility that these obligations may be
less marketable than comparable obligations of United States banks, and the
selection of these obligations may be more difficult because there may be less
publicly available information concerning foreign banks. Other risks include
future political and economic developments, currency blockage, the possible
imposition of withholding taxes on interest payments, possible seizure or
nationalization of foreign deposits, difficulty or inability to pursue legal
remedies and obtain or enforce judgments in foreign courts, possible
establishment of exchange controls or the adoption of other foreign
governmental restrictions that might affect adversely the payment of principal
and interest on bank obligations. Foreign branches of US banks and foreign
banks may also be subject to less stringent reserve requirements and to
different accounting, auditing, reporting and record keeping standards than
those applicable to domestic branches of US banks.
II-91
BORROWING. Under the 1940 Act, a fund is required to maintain continuous asset
coverage of 300% with respect to permitted borrowings and to sell (within three
days) sufficient portfolio holdings to restore such coverage if it should
decline to less than 300% due to market fluctuations or otherwise, even if such
liquidation of a fund's holdings may be disadvantageous from an investment
standpoint.
BRADY BONDS. Brady Bonds are securities created through the exchange of
existing commercial bank loans to public and private entities in certain
emerging markets for new bonds in connection with debt restructurings under a
debt restructuring plan introduced by former US Secretary of the Treasury,
Nicholas F. Brady (Brady Plan). Brady Bonds may be collateralized or
uncollateralized and are issued in various currencies (but primarily the
dollar). Dollar-denominated, collateralized Brady Bonds, which may be
fixed-rate bonds or floating-rate bonds, are generally collateralized in full
as to principal by US Treasury zero coupon bonds having the same maturity as
the Brady Bonds. Interest payments on these Brady Bonds generally are
collateralized by cash or securities in an amount that, in the case of fixed
rate bonds, is equal to at least one year of rolling interest payments or, in
the case of floating rate bonds, initially is equal to at least one year's
rolling interest payments based on the applicable interest rate at that time
and is adjusted at regular intervals thereafter. Brady Bonds are often viewed
as having three or four valuation components: the collateralized repayment of
principal at final maturity; the collateralized interest payments; the
uncollateralized interest payments; and any uncollateralized repayment of
principal at maturity (these uncollateralized amounts constitute the residual
risk). In light of the residual risk of Brady Bonds and the history of defaults
of countries issuing Brady Bonds, with respect to commercial bank loans by
public and private entities, investments in Brady Bonds may be viewed as
speculative.
CASH MANAGEMENT VEHICLES. A fund may have cash balances that have not been
invested in portfolio securities (Uninvested Cash). Uninvested Cash may result
from a variety of sources, including dividends or interest received from
portfolio securities, unsettled securities transactions, reserves held for
investment strategy purposes, assets to cover a fund's open futures and other
derivatives positions, scheduled maturity of investments, liquidation of
investment securities to meet anticipated redemptions and dividend payments,
and new cash received from investors. Uninvested Cash may be invested directly
in money market instruments or other short-term debt obligations. A fund may
use Uninvested Cash to purchase shares of affiliated money market funds for
which the Advisor may act as investment advisor now or in the future that are
registered under the 1940 Act or that operate in accordance with Rule 2a-7
under the 1940 Act but are excluded from the definition of "investment company"
under Section 3(c)(1) or 3(c)(7) of the 1940 Act. Investments in such cash
management vehicles may exceed the limits of Section 12(d)(1)(A) of the 1940
Act.
COMMERCIAL PAPER. A fund may invest in commercial paper issued by major
corporations under the Securities Act in reliance on the exemption from
registration afforded by Section 3(a)(3) thereof. Such commercial paper may be
issued only to finance current transactions and must mature in nine months or
less. Trading of such commercial paper is conducted primarily by institutional
investors through investment dealers, and individual investor participation in
the commercial paper market is very limited. A fund also may invest in
commercial paper issued in reliance on the so-called "private placement"
exemption from registration afforded by Section 4(2) of the 1933 Act (Section
4(2) paper). Section 4(2) paper is restricted as to disposition under the
federal securities laws, and generally is sold to institutional investors such
as a fund who agree that they are purchasing the paper for investment and not
with a view to public distribution. Any resale by the purchaser must be in an
exempt transaction. Section 4(2) paper normally is resold to other
institutional investors like a fund through or with the assistance of the
issuer or investment dealers who make a market in Section 4(2) paper, thus
providing liquidity.
COMMON STOCK. Common stock is issued by companies to raise cash for business
purposes and represents a proportionate interest in the issuing companies.
Therefore, a fund may participate in the success or failure of any company in
which it holds stock. The market values of common stock can fluctuate
significantly, reflecting the business performance of the issuing company,
investor perception and general economic or financial market movements. Despite
the risk of price volatility, however, common stocks have historically offered
a greater potential for long-term gain on investment, compared to other classes
of financial assets, such as bonds or cash equivalents, although there can be
no assurance that this will be true in the future.
II-92
CONVERTIBLE SECURITIES. A fund may invest in convertible securities; that is,
bonds, notes, debentures, preferred stocks and other securities that are
convertible (by the holder or by the issuer) into common stock. Investments in
convertible securities can provide an opportunity for capital appreciation
and/or income through interest and dividend payments by virtue of their
conversion or exchange features.
The convertible securities in which a fund may invest include fixed-income or
zero coupon debt securities, which may be converted or exchanged at a stated or
determinable exchange ratio into underlying shares of common stock. The
exchange ratio for any particular convertible security may be adjusted from
time to time due to stock splits, dividends, spin-offs, other corporate
distributions or scheduled changes in the exchange ratio. A convertible
security may be called for redemption or conversion by the issuer after a
particular date and under certain circumstances (including a specified price)
established upon issue. If a convertible security held by a fund is called for
redemption or conversion, a fund could be required to tender it for redemption,
convert it into the underlying common stock, or sell it to a third party, which
may have an adverse effect on a fund's ability to achieve its investment
objectives. Convertible securities and convertible preferred stocks, until
converted, have general characteristics similar to both debt and equity
securities. Although to a lesser extent than with debt securities generally,
the market values of convertible securities tend to decline as interest rates
increase and, conversely, tend to increase as interest rates decline. In
addition, because of the conversion or exchange feature, the market values of
convertible securities typically change as the market values of the underlying
common stocks change, and, therefore, also tend to follow movements in the
general market for equity securities. A unique feature of convertible
securities is that, as the market price of the underlying common stock
declines, convertible securities tend to trade increasingly on a yield basis,
and so may not experience market value declines to the same extent as the
underlying common stock. When the market price of the underlying common stock
increases, the prices of the convertible securities tend to rise as a
reflection of the value of the underlying common stock, although typically not
as much as the underlying common stock. While no securities investments are
without risk, investments in convertible securities generally entail less risk
than investments in common stock of the same issuer.
As debt securities, convertible securities are investments that provide for a
stream of income (or in the case of zero coupon securities, accretion of
income) with generally higher yields than common stocks. Convertible securities
generally offer lower yields than non-convertible securities of similar quality
because of their conversion or exchange features.
Of course, like all debt securities, there can be no assurance of income or
principal payments because the issuers of the convertible securities may
default on their obligations.
Convertible securities are generally subordinated to other similar but
non-convertible securities of the same issuer, although convertible bonds, as
corporate debt obligations, enjoy seniority in right of payment to all equity
securities, and convertible preferred stock is senior to common stock, of the
same issuer. However, because of the subordination feature, convertible bonds
and convertible preferred stock typically have lower ratings than similar
non-convertible securities. Convertible securities may be issued as fixed
income obligations that pay current income or as zero coupon notes and bonds,
including Liquid Yield Option Notes (LYONs).
CREDIT ENHANCEMENT. Mortgage-backed securities and asset-backed securities are
often backed by a pool of assets representing the obligations of a number of
different parties. To lessen the effect of failure by obligors on underlying
assets to make payments, such securities may contain elements of credit
enhancement. Such credit enhancement falls into two categories: (1) liquidity
protection and (2) protection against losses resulting from ultimate default by
an obligor on the underlying assets. Liquidity protection refers to the
provision of advances, generally by the entity administering the pool of
assets, to ensure that the pass-through of payments due on the underlying pool
occurs in a timely fashion. Protection against losses resulting from ultimate
default enhances the likelihood of ultimate payment of the obligations on at
least a portion of the assets in the pool. Such protection may be provided
through guarantees, insurance policies or letters of credit obtained by the
issuer or sponsor from third parties; through various means of structuring the
transaction; or through a combination of such approaches. A fund may pay any
additional fees for such credit enhancement, although the existence of credit
enhancement may increase the price of a security.
II-93
The ratings of mortgage-backed securities and asset-backed securities for which
third-party credit enhancement provides liquidity protection or protection
against losses from default are generally dependent upon the continued
creditworthiness of the provider of the credit enhancement. The ratings of such
securities could be subject to reduction in the event of deterioration in the
creditworthiness of the credit enhancement provider even in cases where the
delinquency and loss experience on the underlying pool of assets is better than
expected.
Examples of credit enhancement arising out of the structure of the transaction
include "senior-subordinated securities" (multiple class securities with one or
more classes subordinate to other classes as to the payment of principal
thereof and interest thereon, with the result that defaults on the underlying
assets are borne first by the holders of the subordinated class), creation of
"reserve funds" (where cash or investments, sometimes funded from a portion of
the payments on the underlying assets, are held in reserve against future
losses) and "over-collateralization" (where the scheduled payments on, or the
principal amount of, the underlying assets exceed those required to make
payment of the securities and pay any servicing or other fees). The degree of
credit enhancement provided for each issue is generally based on historical
information with respect to the level of credit risk associated with the
underlying assets. Delinquency or loss in excess of that which is anticipated
could adversely affect the return on an investment in such a security.
Certain of a fund's other investments may be credit-enhanced by a guaranty,
letter of credit, or insurance from a third party. Any bankruptcy,
receivership, default, or change in the credit quality of the third party
providing the credit enhancement may adversely affect the quality and
marketability of the underlying security and could cause losses to a fund and
affect a fund's share price.
CUSTODIAL RECEIPTS. Custodial receipts are interests in separately traded
interest and principal component parts of US Government securities that are
issued by banks or brokerage firms and are created by depositing US Government
securities into a special account at a custodian bank. The custodian holds the
interest and principal payments for the benefit of the registered owners of the
certificates or receipts. The custodian arranges for the issuance of the
certificates or receipts evidencing ownership and maintains the register.
Receipts that are interests in the principal component are usually sold at a
deep discount because the buyer receives only the right to receive a future
fixed payment on the security and does not receive any rights to periodic
interest (cash) payments. In the case of Treasury Investment Growth Receipts
(TIGRs) and Certificates of Accrual on Treasury Securities (CATS), the IRS has
reached this conclusion for the purpose of applying the tax diversification
requirements applicable to regulated investment companies such as a fund. TIGRs
and CATS are not considered US Government securities by the staff of the SEC.
Further, the IRS conclusion noted above is contained only in a general counsel
memorandum, which is an internal document of no precedential value or binding
effect, and a private letter ruling, which also may not be relied upon by a
fund. The Advisor is not aware of any binding legislative, judicial or
administrative authority on this issue.
Custodial receipts include Treasury Receipts (TRs), TIGRs and CATS. TIGRs and
CATS are interests in private proprietary accounts while TRs and STRIPS (see US
Government Securities) are interests in accounts sponsored by the US Treasury.
Receipts are sold as zero coupon securities; for more information (see Zero
Coupon Securities).
DEPOSITARY RECEIPTS. A fund may invest in sponsored or unsponsored American
Depositary Receipts (ADRs), European Depositary Receipts (EDRs), Global
Depositary Receipts (GDRs), International Depositary Receipts (IDRs) and other
types of Depositary Receipts (which, together with ADRs, EDRs, GDRs and IDRs
are hereinafter referred to as Depositary Receipts). Depositary Receipts
provide indirect investment in securities of foreign issuers. Prices of
unsponsored Depositary Receipts may be more volatile than if they were
sponsored by the issuer of the underlying securities. Depositary Receipts may
not necessarily be denominated in the same currency as the underlying
securities into which they may be converted. In addition, the issuers of
unsponsored Depositary Receipts are not obligated to disclose material
information regarding the underlying securities or their issuer in the United
States and, therefore, there may not be a correlation between such information
and the market value of the Depositary Receipts. ADRs are Depositary Receipts
that are bought and sold in the United States and are typically issued by a US
bank or trust company which evidence ownership of underlying securities by a
foreign corporation. GDRs, IDRs and other types of Depositary Receipts are
typically issued by foreign banks or trust companies, although they may also be
issued by United States banks or trust companies, and evidence ownership of
underlying securities issued by either a foreign or a United States
corporation. Generally, Depositary Receipts in registered form are designed for
use in the United States securities markets and Depositary Receipts in bearer
form are designed for use in securities markets outside the United States.
II-94
Depositary Receipts, including those denominated in US dollars will be subject
to foreign currency exchange rate risk. However, by investing in US
dollar-denominated ADRs rather than directly in foreign issuers' stock, a fund
avoids currency risks during the settlement period. In general, there is a
large, liquid market in the United States for most ADRs. However, certain
Depositary Receipts may not be listed on an exchange and therefore may be
illiquid securities.
DERIVATIVES. A fund may use instruments referred to as derivatives
(derivatives). Derivatives are financial instruments the value of which is
derived from another security, a commodity (such as gold or oil), a currency or
an index (a measure of value or rates, such as the S&P 500 Index or the prime
lending rate). Derivatives often allow a fund to increase or decrease the level
of risk to which a fund is exposed more quickly and efficiently than direct
investments in the underlying asset or instruments.
A fund may, to the extent consistent with its investment objective and
policies, purchase and sell (write) exchange-listed and over-the-counter (OTC)
put and call options on securities, equity and fixed-income indices and other
instruments, purchase and sell futures contracts and options thereon, enter
into various transactions such as swaps, caps, floors, and collars, and may
enter into currency forward contracts, currency futures contracts, currency
swaps or options on currencies, or various other currency transactions. In
addition, a fund may invest in structured notes. The types of derivatives
identified above are not intended to be exhaustive and a fund may use types of
derivatives and/or employ derivatives strategies not otherwise described in
this Statement of Additional Information or a fund's prospectuses.
OTC derivatives are purchased from or sold to securities dealers, financial
institutions or other parties (Counterparties) pursuant to an agreement with
the Counterparty. As a result, a significant risk of OTC derivatives is
counterparty risk. The Advisor monitors the creditworthiness of OTC derivative
counterparties and periodically reports to the Board with respect to the
creditworthiness of OTC derivative counterparties.
A fund may use derivatives (subject to certain limits imposed by a fund's
investment objective and policies (see Investment Restrictions) and the 1940
Act, or by the requirements for a fund to qualify as a regulated investment
company for tax purposes (see Taxes) (i) to seek to achieve returns, (ii) to
attempt to protect against possible changes in the market value of securities
held in or to be purchased for a fund's portfolio resulting from securities
markets or currency exchange rate fluctuations, (iii) to protect a fund's
unrealized gains in the value of its portfolio securities, (iv) to facilitate
the sale of such securities for investment purposes, (v) to manage the
effective maturity or duration of a fund's portfolio, (vi) to establish a
position in the derivatives markets as a substitute for purchasing or selling
particular securities, (vii) for funds that invest in foreign securities, to
increase exposure to a foreign currency or to shift exposure to foreign
currency fluctuations from one currency to another (not necessarily the US
dollar), or (viii) for any other purposes permitted by law.
A fund may decide not to employ any of the strategies described below, and no
assurance can be given that any strategy used will succeed. If the Advisor
incorrectly forecasts interest rates, market values or other economic factors
in using a derivatives strategy for a fund, a fund might have been in a better
position if it had not entered into the transaction at all. Also, suitable
derivatives may not be available in all circumstances. The use of these
strategies involves certain special risks, including a possible imperfect
correlation, or even no correlation, between price movements of derivatives and
price movements of related investments. While some strategies involving
derivatives can reduce risk of loss, they can also reduce the opportunity for
gain or even result in losses by offsetting favorable price movements in
related investments or otherwise, due to the possible inability of a fund to
purchase or sell a portfolio security at a time that otherwise would be
favorable or the possible need to sell a portfolio security at a
disadvantageous time because a fund is required to maintain asset coverage or
offsetting positions in connection with transactions in derivatives (refer to
Asset Segregation for more information relating to asset segregation and cover
requirements for derivatives instruments), and the possible inability of a fund
to close out or liquidate its derivatives positions.
General Characteristics of Options. A put option gives the purchaser of the
option, upon payment of a premium, the right to sell, and the writer the
obligation to buy, the underlying security, commodity, index, currency or other
instrument at the exercise price. For instance, a fund's purchase of a put
option on a security might be designed to protect its holdings in the
underlying instrument (or, in some cases, a similar instrument) against a
substantial decline in the market value by giving a fund the right to sell such
instrument at the option exercise price. A call option, upon payment of a
premium, gives the purchaser of the option the right to buy, and the seller the
obligation to sell, the underlying
II-95
instrument at the exercise price. A fund's purchase of a call option on a
security, commodity, index, currency or other instrument might be intended to
protect a fund against an increase in the price of the underlying instrument
that it intends to purchase in the future by fixing the price at which it may
purchase such instrument. If a fund sells or "writes" a call option, the
premium that it receives may partially offset, to the extent of the option
premium, a decrease in the value of the underlying securities or instruments in
its portfolio or may increase a fund's income. The sale of put options can also
provide income and might be used to protect a fund against an increase in the
price of the underlying instrument or provide, in the opinion of portfolio
management, an acceptable entry point with regard to the underlying instrument.
A fund may write call options only if they are "covered." A written call option
is covered if a fund owns the security or instrument underlying the call or has
an absolute right to acquire that security or instrument without additional
cash consideration (or if additional cash consideration is required, liquid
assets in the amount of a fund's obligation are segregated according to the
procedures and policies adopted by the Board). For a call option on an index,
the option is covered if a fund segregates liquid assets equal to the contract
value to the extent required by SEC guidelines. A call option is also covered
if a fund holds a call on the same security, index or instrument as the written
call option where the exercise price of the purchased call (long position) is
(i) equal to or less than the exercise price of the call written, or (ii)
greater than the exercise price of the call written provided that liquid assets
equal to the difference between the exercise prices are segregated to the
extent required by SEC guidelines (see Asset Segregation). Exchange listed
options are issued and cleared by a regulated intermediary such as the Options
Clearing Corporation (OCC). The OCC ensures that the obligations of each option
it clears are fulfilled. The discussion below uses the OCC as an example, but
is also applicable to other financial intermediaries. OCC issued and exchange
listed options generally settle by physical delivery of the underlying security
or currency, or cash delivery for the net amount, if any, by which the option
is "in-the-money" (i.e., where the value of the underlying instrument exceeds,
in the case of a call option, or is less than, in the case of a put option, the
exercise price of the option) at the time the option is exercised. Frequently,
rather than taking or making delivery of the underlying instrument through the
process of exercising the option, listed options are closed by entering into
offsetting purchase or sale transactions that do not result in ownership of the
new option.
As noted above, OTC options are purchased from or sold to Counterparties
through direct bilateral agreement with the Counterparty. In contrast to
exchange listed options, which generally have standardized terms and
performance mechanics, all the terms of an OTC option, including such terms as
method of settlement, term, exercise price, premium, guarantees and security,
are set by negotiation of the parties. Unless the parties provide for it, there
is no central clearing or guaranty function in an OTC option. As a result, if
the Counterparty fails to make or take delivery of the security, currency or
other instrument underlying an OTC option it has entered into with a fund or
fails to make a cash settlement payment due in accordance with the terms of
that option, a fund will lose any premium it paid for the option as well as any
anticipated benefit of the transaction.
There are several risks associated with transactions in options. Options on
particular securities or instruments may be more volatile than a direct
investment in the underlying security or instrument. Additionally, there are
significant differences between the securities and options markets that could
result in an imperfect correlation between these markets, causing a given
options transaction not to achieve its objective. Disruptions in the markets
for the securities underlying options purchased or sold by a fund could result
in losses on the options. If trading is interrupted in an underlying security,
the trading of options on that security is normally halted as well. As a
result, a fund as purchaser or writer of an option will be unable to close out
its positions until options trading resumes, and it may be faced with losses if
trading in the security reopens at a substantially different price. In
addition, the OCC or other options markets may impose exercise restrictions. If
a prohibition on exercise is imposed at a time when trading in the option has
also been halted, a fund as purchaser or writer of an option will be locked
into its position until one of the two restrictions has been lifted. If a
prohibition on exercise remains in effect until an option owned by a fund has
expired, a fund could lose the entire value of its option.
During the option period, the covered call writer has, in return for the
premium on the option, given up the opportunity to profit from a price increase
in the underlying security or instrument above the exercise price, but as long
as its obligations as a writer continues, has retained the risk of loss should
the price of the underlying security or instrument decline. The writer of an
option has no control over the time when it may be required to fulfill its
obligations as a writer of the option. In writing put options, there is a risk
that a fund may be required to buy the underlying security
II-96
or instrument at a disadvantageous price if the put option is exercised against
a fund. If a put or call option purchased by a fund is not sold when it has
remaining value, and if the market price of the underlying security or
instrument remains, in the case of a put, equal to or greater than the exercise
price, or in the case of a call, less than or equal to the exercise price, a
fund will lose the premium that it paid for the option. Also, where a put or
call option is purchased as a hedge against price movements in the underlying
security or instrument, the price of the put or call option may move more or
less than the price of the underlying security or instrument.
A fund's ability to close out its position as a purchaser or seller of an OTC
option or exchange listed put or call option is dependent, in part, upon the
liquidity of the option market. Among the possible reasons for the absence of a
liquid option market on an exchange are: (i) insufficient trading interest in
certain options; (ii) restrictions on transactions imposed by an exchange;
(iii) trading halts, suspensions or other restrictions imposed with respect to
particular classes or series of options or underlying securities including
reaching daily price limits; (iv) interruption of the normal operations of the
OCC or an exchange; (v) inadequacy of the facilities of an exchange or OCC to
handle current trading volume; or (vi) a decision by one or more exchanges to
discontinue the trading of options (or a particular class or series of
options), in which event the relevant market for that option on that exchange
would cease to exist, although outstanding options on that exchange would
generally continue to be exercisable in accordance with their terms.
Special risks are presented by internationally traded options. Because of the
differences in trading hours between the US and various foreign countries, and
because different holidays are observed in different countries, foreign options
markets may be open for trading during hours or on days when US markets are
closed. As a result, option premiums may not reflect the current prices of the
underlying interests in the US.
General Characteristics of Futures Contracts and Options on Futures Contracts.
A futures contract is an agreement between two parties to buy or sell a
financial instrument or commodity for a set price on a future date. Futures are
generally bought and sold on the commodities exchanges where they are listed
with payment of initial and variation margin as described below. A futures
contract generally obligates the purchaser to take delivery from the seller the
specific type of financial instrument or commodity underlying the contract at a
specific future time for a set price. The purchase of a futures contract
enables a fund, during the term of the contract, to lock in the price at which
it may purchase a security, currency or commodity and protect against a rise in
prices pending the purchase of portfolio securities. A futures contract
generally obligates the seller to deliver to the buyer the specific type of
financial instrument underlying the contract at a specific future time for a
set price. The sale of a futures contract enables a fund to lock in a price at
which it may sell a security, currency or commodity and protect against
declines in the value of portfolio securities. Options on futures contracts are
similar to options on securities except that an option on a futures contract
gives the purchaser the right in return for the premium paid to assume a
position in a futures contract and obligates the seller to deliver such
position.
Although most futures contracts call for actual delivery or acceptance of the
underlying financial instrument or commodity, the contracts are usually closed
out before the settlement date without making, or taking, actual delivery.
Futures contracts on financial indices, currency exchange instruments and
certain other instruments provide for the delivery of an amount of cash equal
to a specified dollar amount times the difference between the underlying
instruments value (i.e., the index) at the open or close of the last trading
day of the contract and futures contract price. A futures contract sale is
closed out by effecting a futures contract purchase for the same aggregate
amount of the specific type of underlying financial instrument and the same
delivery date. If the sale price exceeds the offsetting purchase price, the
seller would be paid the difference and would realize a gain. If the offsetting
purchase price exceeds the sale price, the seller would pay the difference and
would realize a loss. Similarly, a futures contract purchase is closed out by
effecting a futures contract sale for the same aggregate amount of the specific
type of underlying financial instrument or commodity and the same delivery
date. If the offsetting sale price exceeds the purchase price, the purchaser
would realize a gain, whereas if the purchase price exceeds the offsetting sale
price, the purchaser would realize a loss. There can be no assurance that a
fund will be able to enter into a closing transaction.
When a purchase or sale of a futures contract is made, a fund is required to
deposit with the financial intermediary as security for its obligations under
the contract an "initial margin" consisting of cash, US Government Securities
or other liquid assets typically ranging from approximately less than 1% to 15%
of the contract amount. The initial margin is set by the exchange on which the
contract is traded and may, from time to time, be modified. In addition,
brokers
II-97
may establish margin deposit requirements in excess of those required by the
exchange. The margin deposits made are marked to market daily and a fund may be
required to make subsequent deposits of cash, US Government securities or other
liquid assets, called "variation margin" or "maintenance margin," which
reflects the price fluctuations of the futures contract. The purchase of an
option on a futures contract involves payment of a premium for the option
without any further obligation on the part of a fund. The sale of an option on
a futures contract involves receipt of a premium for the option and the
obligation to deliver (by physical or cash settlement) the underlying futures
contract. If a fund exercises an option on a futures contract it will be
obligated to post initial margin (and potential subsequent variation margin)
for the resulting futures position just as it would for any position.
Pursuant to a claim filed with the Commodity Futures Trading Commission (CFTC)
on behalf of a fund, neither the registrant nor a fund is deemed to be a
"commodity pool operator" under the Commodity Exchange Act. Therefore, a fund
is not subject to registration and regulation under the Commodity Exchange Act.
The Advisor is not deemed to be a "commodity pool operator" with respect to its
services as Advisor.
There are several risks associated with futures contracts and options on
futures contracts. The prices of financial instruments or commodities subject
to futures contracts (and thereby the futures contract prices) may correlate
imperfectly with the behavior of the cash price of a fund's securities or other
assets (and the currencies in which they are denominated). Also, prices of
futures contracts may not move in tandem with the changes in prevailing
interest rates, market movements and/or currency exchange rates against which a
fund seeks a hedge. Additionally, there is no assurance that a liquid secondary
market will exist for futures contracts and related options in which a fund may
invest. In the event a liquid market does not exist, it may not be possible to
close out a futures position and, in the event of adverse price movements, a
fund would continue to be required to make daily payments of variation margin.
The absence of a liquid market in futures contracts might cause a fund to make
or take delivery of the instruments or commodities underlying futures contracts
at a time when it may be disadvantageous to do so. The inability to close out
positions and futures positions could also have an adverse impact on a fund's
ability to effectively hedge its positions.
The risk of loss in trading futures contracts in some strategies can be
substantial, due both to the relatively low margin deposits required, and the
extremely high degree of leverage involved in futures pricing. As a result, a
relatively small price movement in a futures contract may result in immediate
and substantial loss (as well as gain) to the investor. Thus, a purchase or
sale of a futures contract may result in losses in excess of the amount
invested in the contract.
Futures contracts and options thereon which are purchased or sold on non-US
commodities exchanges may have greater price volatility than their US
counterparts. Furthermore, non-US commodities exchanges may be less regulated
and under less governmental scrutiny than US exchanges. Brokerage commissions,
clearing costs and other transaction costs may be higher on non-US exchanges.
In the event of the bankruptcy of a broker through which a fund engages in
transactions in futures or options thereon, a fund could experience delays
and/or losses in liquidating open positions purchased or sold through the
broker and/or incur a loss on all or part of its margin deposits with the
broker.
Currency Transactions. Currency transactions include forward currency
contracts, exchange listed currency futures, exchange listed and OTC options on
currencies, and currency swaps. A forward currency contract involves a
privately negotiated obligation to purchase or sell (with delivery generally
required) a specific currency at a future date, which may be any fixed number
of days from the date of the contract agreed upon by the parties, at a price
set at the time of the contract. Forward contracts are generally traded in an
interbank market directly between currency traders (usually large commercial
banks) and their customers. The parties to a forward contract may agree to
offset or terminate the contract before its maturity, or may hold the contract
to maturity and complete the contemplated currency exchange. A currency swap is
an agreement to exchange cash flows based on the notional difference among two
or more currencies and operates similarly to an interest rate swap, which is
described below.
"Transaction hedging" is entering into a currency transaction with respect to
specific assets or liabilities of a fund, which will generally arise in
connection with the purchase or sale of its portfolio securities or the receipt
of income therefrom. Entering into a forward contract for the purchase or sale
of an amount of foreign currency involved in an underlying security transaction
may "lock in" the US dollar price of the security. Forward contracts may also
be used
II-98
in anticipation of future purchases and sales of securities, even if specific
securities have not yet been selected. "Position hedging" is entering into a
currency transaction with respect to portfolio security positions denominated
or generally quoted in that currency. Position hedging may protect against a
decline in the value of existing investments denominated in the foreign
currency. While such a transaction would generally offset both positive and
negative currency fluctuations, such currency transactions would not offset
changes in security values caused by other factors.
A fund may also "cross-hedge" currencies by entering into transactions to
purchase or sell one or more currencies that are expected to decline in value
relative to other currencies to which a fund has or to which a fund expects to
have portfolio exposure. This type of investment technique will generally
reduce or eliminate exposure to the currency that is sold, and increase the
exposure to the currency that is purchased. As a result, a fund will assume the
risk of fluctuations in the value of the currency purchased at the same time
that it is protected against losses from a decline in the hedged currency.
To reduce the effect of currency fluctuations on the value of existing or
anticipated holdings of portfolio securities, a fund may also engage in "proxy
hedging." Proxy hedging is often used when the currency to which a fund is
exposed is difficult to hedge or to hedge against the dollar. Proxy hedging
entails entering into a commitment or option to sell a currency whose changes
in value are generally considered to be correlated to a currency or currencies
in which some or all of a fund's securities are or are expected to be
denominated. Proxy hedges may result in losses if the currency used to hedge
does not perform similarly to the currency in which the hedged securities are
denominated.
Currency hedging involves some of the same risks and considerations as other
transactions with similar instruments. Currency transactions can result in
losses to a fund if the currency being hedged fluctuates in value to a degree
or in a direction that is not anticipated. Further, there is the risk that the
perceived correlation between various currencies may not be present or may not
be present during the particular time that a fund is engaging in proxy hedging.
Currency transactions are subject to risks different from those of other
portfolio transactions. Because currency control is of great importance to the
issuing governments and influences economic planning and policy, purchases and
sales of currency and related instruments can be negatively affected by
government exchange controls, blockages, and manipulations or exchange
restrictions imposed by governments. These can result in losses to a fund if it
is unable to deliver or receive currency or funds in settlement of obligations
and could also cause hedges it has entered into to be rendered useless,
resulting in full currency exposure as well as incurring transaction costs.
Currency exchange rates, bid/ask spreads and liquidity may fluctuate based on
factors that may, or may not be, related to that country's economy.
Swap Agreements and Options on Swap Agreements. A fund may engage in swap
transactions, including, but not limited to, swap agreements on interest rates,
currencies, indices, credit and event linked swaps, total return and other
swaps and related caps, floors and collars. Swap agreements are two party
contracts ranging from a few weeks to more than one year. In a standard swap
transaction, two parties agree to exchange the returns (or differentials in
rates of return) earned or realized on a predetermined financial instrument or
instruments, which may be adjusted for an interest factor. The gross return to
be exchanged or "swapped" between the parties is generally calculated with
respect to a "notional amount" which is generally equal to the return on or
increase in value of a particular dollar amount invested at a particular
interest rate in such financial instrument or instruments.
"Interest rate swaps" involve the exchange by a fund with another party of
their respective commitments to pay or receive interest, e.g., an exchange of
floating rate payments for fixed rate payments with respect to a notional
amount of principal. A "currency swap" is an agreement to exchange cash flows
on a notional amount of two or more currencies based on the relative value
differential among them and an index swap is an agreement to swap cash flows on
a notional amount based on changes in the values of the reference indices. The
purchase of a cap entitles the purchaser to receive payments on a notional
principal amount from the party selling such cap to the extent that a specified
index exceeds a predetermined interest rate or amount. The purchase of a floor
entitles the purchaser to receive payments on a notional principal amount from
the party selling such floor to the extent that a specified index falls below a
predetermined interest rate or amount. A collar is a combination of a cap and a
floor that preserves a certain return within a predetermined range of interest
rates or values.
II-99
A "credit default swap" is a contract between a buyer and a seller of
protection against a pre-defined credit event. The buyer of protection pays the
seller a fixed regular fee provided that no event of default on an underlying
reference obligation has occurred. If an event of default occurs, the seller
must pay the buyer the full notional value, or "par value," of the reference
obligation in exchange for the reference obligation. Credit default swaps are
used as a means of "buying" credit protection, i.e., attempting to mitigate the
risk of default or credit quality deterioration in some portion of a fund's
holdings, or "selling" credit protection, i.e., attempting to gain exposure to
an underlying issuer's credit quality characteristics without directly
investing in that issuer. When a fund is a seller of credit protection, it
effectively adds leverage to its portfolio because, in addition, to its net
assets, a fund would be subject to investment exposure on the notional amount
of the swap. A fund will only sell credit protection with respect to securities
in which it would be authorized to invest directly.
If a fund is a buyer of a credit default swap and no event of default occurs, a
fund will lose its investment and recover nothing. However, if a fund is a
buyer and an event of default occurs, a fund will receive the full notional
value of the reference obligation that may have little or no value. As a
seller, a fund receives a fixed rate of income through the term of the contract
(typically between six months and three years), provided that there is no
default event. If an event of default occurs, the seller must pay the buyer the
full notional value of the reference obligation.
Credit default swaps involve greater risks than if a fund had invested in the
reference obligation directly. In addition to the risks applicable to
derivatives generally, credit default swaps involve special risks because they
are difficult to value, are highly susceptible to liquidity and credit risk,
and generally pay a return to the party that has paid the premium only in the
event of an actual default by the issuers of the underlying obligation (as
opposed to a credit downgrade or other indication of financial difficulty).
A fund may use credit default swaps to gain exposure to particular issuers or
particular markets through investments in portfolios of credit default swaps,
such as Dow Jones CDX.NA.HY certificates. By investing in certificates
representing interests in a basket of credit default swaps, a fund is taking
credit risk with respect to an entity or group of entities and providing credit
protection to the swap counterparties.
"Total return" swaps are contracts in which one party agrees to make periodic
payments to another party based on the change in market value of the assets
underlying the contract, which may include a specific security, basket of
securities or securities indices during the specified period, in return for
periodic payments based on a fixed or variable interest rate or the total
return of other underlying assets. Total return swap agreements may be used to
obtain exposure to a security or market without owning or taking physical
custody of such security or investing directly in such market. Total return
swaps may add leverage to a fund because, in addition to its net assets, a fund
would be subject to investment exposure on the notional amount of the swap.
Swaps typically involve a small investment of cash relative to the magnitude of
risks assumed. As a result, swaps can be highly volatile and may have a
considerable impact on a fund's performance. Depending on how they are used,
swaps may increase or decrease the overall volatility of a fund's investments
and its share price and yield. A fund will usually enter into swaps on a net
basis, i.e., the two payment streams are netted out in a cash settlement on the
payment date or dates specified in the instrument, with a fund receiving or
paying, as the case may be, only the net amount of the two payments.
A fund bears the risk of loss of the amount expected to be received under a
swap in the event of the default or bankruptcy of a Counterparty. In addition,
if the Counterparty's creditworthiness declines, the value of a swap will
likely decline, potentially resulting in losses for a fund. A fund may also
suffer losses if it is unable to terminate outstanding swaps (either by
assignment or other disposition) or reduce its exposure through offsetting
transactions (i.e., by entering into an offsetting swap with the same party or
similarly creditworthy party).
II-100
A fund may also enter into swap options. A swap option is a contract that gives
a counterparty the right (but not the obligation) in return for payment of a
premium, to enter into a new swap agreement or to shorten, extend, cancel or
otherwise modify an existing swap agreement, at some future time on specified
terms. Depending on the terms, a fund will generally incur greater risk when it
writes a swap option than when it purchases a swap option. When a fund
purchases a swap option, it risks losing the amount of the premium it has paid
should it decide to let the option expire.
Structured Notes. Structured notes are derivative debt securities, the interest
rate or principal of which is determined by reference to changes in value of a
specific security or securities, reference rate, or index. A participation
note, which is a form of structured note, is designed to give exposure to local
shares in foreign markets. Indexed securities, similar to structured notes, are
typically, but not always, debt securities whose value at maturity or coupon
rate is determined by reference to other securities. The performance of a
structured note or indexed security is based upon the performance of the
underlying instrument.
The terms of a structured note may provide that, in certain circumstances, no
principal is due on maturity and, therefore, may result in loss of investment.
Structured notes may be indexed positively or negatively to the performance of
the underlying instrument such that the appreciation or deprecation of the
underlying instrument will have a similar effect to the value of the structured
note at maturity at the time of any coupon payment. In addition, changes in the
interest rate and value of the principal at maturity may be fixed at a specific
multiple of the change in value of the underlying instrument, making the value
of the structured note more volatile than the underlying instrument. In
addition, structured notes may be less liquid and more difficult to price
accurately than less complex securities or traditional debt securities.
Commodity-Linked Derivatives. A fund may invest in instruments with principal
and/or coupon payments linked to the value of commodities, commodity futures
contracts, or the performance of commodity indices such as "commodity-linked"
or "index-linked" notes. These instruments are sometimes referred to as
"structured notes" because the terms of the instrument may be structured by the
issuer of the note and the purchaser of the note, such as a fund.
The values of commodity-linked notes will rise and fall in response to changes
in the underlying commodity or related index or investment. These notes expose
a fund economically to movements in commodity prices, but a particular note has
many features of a debt obligation. These notes also are subject to credit and
interest rate risks that in general affect the value of debt securities.
Therefore, at the maturity of the note, a fund may receive more or less
principal than it originally invested. A fund might receive interest payments
on the note that are more or less than the stated coupon interest rate
payments.
Commodity-linked notes may involve leverage, meaning that the value of the
instrument will be calculated as a multiple of the upward or downward price
movement of the underlying commodity future or index. The prices of
commodity-linked instruments may move in different directions than investments
in traditional equity and debt securities in periods of rising inflation. Of
course, there can be no guarantee that a fund's commodity-linked investments
would not be correlated with traditional financial assets under any particular
market conditions.
Commodity-linked notes may be issued by US and foreign banks, brokerage firms,
insurance companies and other corporations. These notes, in addition to
fluctuating in response to changes in the underlying commodity assets, will be
subject to credit and interest rate risks that typically affect debt
securities.
Commodity-linked notes may be wholly principal protected, partially principal
protected or offer no principal protection. With a wholly principal protected
instrument, a fund will receive at maturity the greater of the par value of the
note or the increase in value of the underlying index. Partially protected
instruments may suffer some loss of principal up to a specified limit if the
underlying index declines in value during the term of the instrument. For
instruments without principal protection, there is a risk that the instrument
could lose all of its value if the index declines sufficiently. The Advisor's
decision on whether and to what extent to use principal protection depends in
part on the cost of the protection. In addition, the ability of a fund to take
advantage of any protection feature depends on the creditworthiness of the
issuer of the instrument.
II-101
Commodity-linked notes are generally hybrid instruments which are excluded from
regulation under the CEA and the rules thereunder. Additionally, from time to
time a fund may invest in other hybrid instruments that do not qualify for
exemption from regulation under the CEA.
Combined Transactions. A fund may enter into multiple transactions, including
multiple options transactions, multiple futures transactions, multiple currency
transactions (including forward currency contracts) and multiple interest rate
transactions and any combination of futures, options, currency and interest
rate transactions (component transactions), instead of a single derivative, as
part of a single or combined strategy when, in the opinion of the Advisor, it
is in the best interests of a fund to do so. A combined transaction will
usually contain elements of risk that are present in each of its component
transactions. Although combined transactions are normally entered into based on
the Advisor's judgment that the combined strategies will reduce risk or
otherwise more effectively achieve the desired portfolio management goal, it is
possible that the combination will instead increase such risks or hinder
achievement of the portfolio management objective.
DIRECT DEBT INSTRUMENTS. Direct debt instruments are interests in amounts owed
by a corporate, governmental or other borrower to lenders (direct loans), to
suppliers of goods or services (trade claims or other receivables) or to other
parties. When a fund participates in a direct loan it will be lending money
directly to an issuer. Direct loans generally do not have an underwriter or
agent bank, but instead, are negotiated between a company's management team and
a lender or group of lenders. Direct loans typically offer better security and
structural terms than other types of high yield securities. Direct debt
obligations are often the most senior obligations in an issuer's capital
structure or are well-collateralized so that overall risk is lessened. Trade
claims are unsecured rights of payment arising from obligations other than
borrowed funds. Trade claims include vendor claims and other receivables that
are adequately documented and available for purchase from high-yield
broker-dealers. Trade claims typically sell at a discount. In addition to the
risks otherwise associated with low-quality obligations, trade claims have
other risks, including the possibility that the amount of the claim may be
disputed by the obligor. Trade claims normally would be considered illiquid and
pricing can be volatile. Direct debt instruments involve a risk of loss in case
of default or insolvency of the borrower. A fund will rely primarily upon the
creditworthiness of the borrower and/or the collateral for payment of interest
and repayment of principal. The value of a fund's investments may be adversely
affected if scheduled interest or principal payments are not made. Because most
direct loans will be secured, there will be a smaller risk of loss with direct
loans than with an investment in unsecured high yield bonds or trade claims.
Investment in the indebtedness of borrowers whose creditworthiness is poor
involves substantially greater risks and may be highly speculative. Borrowers
that are in bankruptcy or restructuring may never pay off their indebtedness or
may pay only a small fraction of the amount owed. Investments in direct debt
instruments also involve interest rate risk and liquidity risk. However,
interest rate risk is lessened by the generally short-term nature of direct
debt instruments and their interest rate structure, which typically floats. To
the extent the direct debt instruments in which a fund invests are considered
illiquid, the lack of a liquid secondary market (1) will have an adverse impact
on the value of such instruments, (2) will have an adverse impact on a fund's
ability to dispose of them when necessary to meet a fund's liquidity needs or
in response to a specific economic event, such as a decline in creditworthiness
of the issuer, and (3) may make it more difficult for a fund to assign a value
to these instruments for purposes of valuing a fund's portfolio and calculating
its net asset value. In order to lessen liquidity risk, a fund anticipates
investing primarily in direct debt instruments that are quoted and traded in
the high yield market. Trade claims may also present a tax risk to a fund.
DOLLAR ROLL TRANSACTIONS. Dollar roll transactions consist of the sale by a
fund to a bank or broker-dealer (counterparty) of mortgage-backed securities
together with a commitment to purchase from the counterparty similar, but not
identical, securities at a future date, at the same price. The counterparty
receives all principal and interest payments, including prepayments, made on
the security while it is the holder. A fund receives a fee from the
counterparty as consideration for entering into the commitment to purchase.
Dollar rolls may be renewed over a period of several months with a different
purchase and repurchase price fixed and a cash settlement made at each renewal
without physical delivery of securities. Moreover, the transaction may be
preceded by a firm commitment agreement pursuant to which a fund agrees to buy
a security on a future date.
A dollar roll involves costs to a fund. For example, while a fund receives a
fee as consideration for agreeing to repurchase the security, a fund forgoes
the right to receive all principal and interest payments while the counterparty
holds the security. These payments to the counterparty may exceed the fee
received by a fund, in which case the use of this
II-102
technique will result in a lower return than would have been realized without
the use of dollar rolls. Further, although a fund can estimate the amount of
expected principal prepayment over the term of the dollar roll, a variation in
the actual amount of prepayment could increase or decrease the cost of the
dollar roll. A "covered roll" is a specific type of dollar roll for which there
is an offsetting cash position or a cash equivalent security position which
matures on or before the forward settlement date of the dollar roll
transaction. A fund may enter into both covered and uncovered rolls.
The entry into dollar rolls involves potential risks of loss that are different
from those related to the securities underlying the transactions. A fund will
be exposed to counterparty risk. For example, if the counterparty becomes
insolvent, a fund's right to purchase from the counterparty might be
restricted. Additionally, the value of such securities may change adversely
before a fund is able to purchase them. Similarly, a fund may be required to
purchase securities in connection with a dollar roll at a higher price than may
otherwise be available on the open market. Since, as noted above, the
counterparty is required to deliver a similar, but not identical security to a
fund, the security that a fund is required to buy under the dollar roll may be
worth less than the identical security. Finally, there can be no assurance that
a fund's use of the cash that it receives from a dollar roll will provide a
return that exceeds transaction costs associated with the dollar roll.
EURODOLLAR OBLIGATIONS. Eurodollar bank obligations are US dollar-denominated
certificates of deposit and time deposits issued outside the US capital markets
by foreign branches of US banks and US branches of foreign banks. Eurodollar
obligations are subject to the same risks that pertain to domestic issues,
notably credit risk, market risk and liquidity risk. Additionally, Eurodollar
obligations are subject to certain sovereign risks. One such risk is the
possibility that a sovereign country might prevent capital, in the form of
dollars, from flowing across its borders. Other risks include: adverse
political and economic developments; the extent and quality of government
regulation of financial markets and institutions; the imposition of foreign
withholding taxes, and the expropriation or nationalization of foreign issues.
FIXED INCOME SECURITIES. Fixed income securities, including corporate debt
obligations, generally expose a fund to the following types of risk: (1)
interest rate risk (the potential for fluctuations in bond prices due to
changing interest rates); (2) income risk (the potential for a decline in a
fund's income due to falling market interest rates); (3) credit risk (the
possibility that a bond issuer will fail to make timely payments of either
interest or principal to a fund); (4) prepayment risk or call risk (the
likelihood that, during periods of falling interest rates, securities with high
stated interest rates will be prepaid, or "called" prior to maturity, requiring
a fund to invest the proceeds at generally lower interest rates); and (5)
extension risk (the likelihood that as interest rates increase, slower than
expected principal payments may extend the average life of fixed income
securities, which will have the effect of locking in a below-market interest
rate, increasing the security's duration and reducing the value of the
security).
In periods of declining interest rates, the yield (income from a fixed income
security held by a fund over a stated period of time) of a fixed income
security may tend to be higher than prevailing market rates, and in periods of
rising interest rates, the yield of a fixed income security may tend to be
lower than prevailing market rates. In addition, when interest rates are
falling, the inflow of net new money to a fund will likely be invested in
portfolio instruments producing lower yields than the balance of a fund's
portfolio, thereby reducing the yield of a fund. In periods of rising interest
rates, the opposite can be true. The net asset value of a fund can generally be
expected to change as general levels of interest rates fluctuate. The value of
fixed income securities in a fund's portfolio generally varies inversely with
changes in interest rates. Prices of fixed income securities with longer
effective maturities are more sensitive to interest rate changes than those
with shorter effective maturities.
Corporate debt obligations generally offer less current yield than securities
of lower quality, but lower-quality securities generally have less liquidity,
greater credit and market risk, and as a result, more price volatility.
FOREIGN CURRENCIES. Because investments in foreign securities usually will
involve currencies of foreign countries, and because a fund may hold foreign
currencies and forward contracts, futures contracts and options on foreign
currencies and foreign currency futures contracts, the value of the assets of a
fund as measured in US dollars may be affected favorably or unfavorably by
changes in foreign currency exchange rates and exchange control regulations,
and a fund
II-103
may incur costs and experience conversion difficulties and uncertainties in
connection with conversions between various currencies. Fluctuations in
exchange rates may also affect the earning power and asset value of the foreign
entity issuing the security.
The strength or weakness of the US dollar against these currencies is
responsible for part of a fund's investment performance. If the dollar falls in
value relative to the Japanese yen, for example, the dollar value of a Japanese
stock held in the portfolio will rise even though the price of the stock
remains unchanged. Conversely, if the dollar rises in value relative to the
yen, the dollar value of the Japanese stock will fall. Many foreign currencies
have experienced significant devaluation relative to the dollar.
Although a fund values its assets daily in terms of US dollars, it may not
convert its holdings of foreign currencies into US dollars on a daily basis.
Investors should be aware of the costs of currency conversion. Although foreign
exchange dealers do not charge a fee for conversion, they realize a profit
based on the difference (the spread) between the prices at which they are
buying and selling various currencies. Thus, a dealer may offer to sell a
foreign currency to a fund at one rate, while offering a lesser rate of
exchange should a fund desire to resell that currency to the dealer. A fund
will conduct its foreign currency exchange transactions either on a spot (i.e.,
cash) basis at the spot rate prevailing in the foreign currency exchange
market, or through entering into options or forward or futures contracts to
purchase or sell foreign currencies.
FOREIGN INVESTMENT. Foreign securities are normally denominated and traded in
foreign currencies. As a result, the value of a fund's foreign investments and
the value of its shares may be affected favorably or unfavorably by changes in
currency exchange rates relative to the US dollar. There may be less
information publicly available about a foreign issuer than about a US issuer,
and foreign issuers may not be subject to accounting, auditing and financial
reporting standards and practices comparable to those in the US. The securities
of some foreign issuers are less liquid and at times more volatile than
securities of comparable US issuers. Foreign brokerage commissions and other
fees are also generally higher than in the US. Foreign settlement procedures
and trade regulations may involve certain risks (such as delay in payment or
delivery of securities or in the recovery of a fund's assets held abroad) and
expenses not present in the settlement of investments in US markets. Payment
for securities without delivery may be required in certain foreign markets.
In addition, foreign securities may be subject to the risk of nationalization
or expropriation of assets, imposition of currency exchange controls or
restrictions on the repatriation of foreign currency, confiscatory taxation,
political or financial instability and diplomatic developments which could
affect the value of a fund's investments in certain foreign countries.
Governments of many countries have exercised and continue to exercise
substantial influence over many aspects of the private sector through the
ownership or control of many companies, including some of the largest in these
countries. As a result, government actions in the future could have a
significant effect on economic conditions which may adversely affect prices of
certain portfolio securities. There is also generally less government
supervision and regulation of stock exchanges, brokers, and listed companies
than in the US. Dividends or interest on, or proceeds from the sale of, foreign
securities may be subject to foreign withholding taxes, and special US tax
considerations may apply (see Taxes). Moreover, foreign economies may differ
favorably or unfavorably from the US economy in such respects as growth of
gross national product, rate of inflation, capital reinvestment, resource
self-sufficiency and balance of payments position.
Legal remedies available to investors in certain foreign countries may be more
limited than those available with respect to investments in the US or in other
foreign countries. The laws of some foreign countries may limit a fund's
ability to invest in securities of certain issuers organized under the laws of
those foreign countries.
Many foreign countries are heavily dependent upon exports, particularly to
developed countries, and, accordingly, have been and may continue to be
adversely affected by trade barriers, managed adjustments in relative currency
values, and other protectionist measures imposed or negotiated by the US and
other countries with which they trade. These economies also have been and may
continue to be negatively impacted by economic conditions in the US and other
trading partners, which can lower the demand for goods produced in those
countries.
II-104
The risks described above, including the risks of nationalization or
expropriation of assets, typically are increased in connection with investments
in "emerging markets." For example, political and economic structures in these
countries may be in their infancy and developing rapidly, and such countries
may lack the social, political and economic stability characteristic of more
developed countries (including amplified risk of war and terrorism). Certain of
these countries have in the past failed to recognize private property rights
and have at times nationalized and expropriated the assets of private
companies. Investments in emerging markets may be considered speculative.
The currencies of certain emerging market countries have experienced
devaluations relative to the US dollar, and future devaluations may adversely
affect the value of assets denominated in such currencies. In addition,
currency hedging techniques may be unavailable in certain emerging market
countries. Many emerging market countries have experienced substantial, and in
some periods extremely high, rates of inflation or deflation for many years,
and future inflation may adversely affect the economies and securities markets
of such countries.
In addition, unanticipated political or social developments may affect the
value of investments in emerging markets and the availability of additional
investments in these markets. Any change in the leadership or politics of
emerging market countries, or the countries that exercise a significant
influence over those countries, may halt the expansion of or reverse the
liberalization of foreign investment policies now occurring and adversely
affect existing investment opportunities. The small size, limited trading
volume and relative inexperience of the securities markets in these countries
may make investments in securities traded in emerging markets illiquid and more
volatile than investments in securities traded in more developed countries. For
example, limited market size may cause prices to be unduly influenced by
traders who control large positions. In addition, a fund may be required to
establish special custodial or other arrangements before making investments in
securities traded in emerging markets. There may be little financial or
accounting information available with respect to issuers of emerging market
securities, and it may be difficult as a result to assess the value of
prospects of an investment in such securities.
The risk also exists that an emergency situation may arise in one or more
emerging markets as a result of which trading of securities may cease or may be
substantially curtailed and prices for a fund's securities in such markets may
not be readily available. A fund may suspend redemption of its shares for any
period during which an emergency exists.
Certain of the foregoing risks may also apply to some extent to securities of
US issuers that are denominated in foreign currencies or that are traded in
foreign markets, or securities of US issuers having significant foreign
operations.
Supranational Entities. Supranational entities are international organizations
designated or supported by governmental entities to promote economic
reconstruction or development and international banking institutions and
related government agencies. Examples include the International Bank for
Reconstruction and Development (the World Bank), The Asian Development Bank and
the InterAmerican Development Bank. Obligations of supranational entities are
backed by the guarantee of one or more foreign governmental parties which
sponsor the entity.
FUNDING AGREEMENTS. Funding agreements are contracts issued by insurance
companies that provide investors the right to receive a variable rate of
interest and the full return of principal at maturity. Funding agreements also
include a put option that allows a fund to terminate the agreement at a
specified time prior to maturity. Funding agreements generally offer a higher
yield than other variable securities with similar credit ratings. The primary
risk of a funding agreement is the credit quality of the insurance company that
issues it.
GOLD OR PRECIOUS METALS. Gold and other precious metals held by or on behalf of
a fund may be held on either an allocated or an unallocated basis inside or
outside the US. Placing gold or precious metals in an allocated custody account
gives a fund a direct interest in specified gold bars or precious metals,
whereas an unallocated deposit does not and instead gives a fund a right only
to compel the counterparty to deliver a specific amount of gold or precious
metals, as applicable. Consequently, a fund could experience a loss if the
counterparty to an unallocated depository arrangement becomes bankrupt or fails
to deliver the gold or precious metals as requested. An allocated gold or
precious metals custody account also involves the risk that the gold or
precious metals will be stolen or damaged while in
II-105
transit. Both allocated and unallocated arrangements require a fund as seller
to deliver, either by book entry or physically, the gold or precious metals
sold in advance of the receipt of payment. These custody risks would apply to a
wholly-owned subsidiary of a fund to the extent the subsidiary holds gold or
precious metals.
In addition, in order to qualify for the special tax treatment accorded
regulated investment companies and their shareholders, a fund must, among other
things, derive at least 90% of its income from certain specified sources
(qualifying income). Capital gains from the sale of gold or other precious
metals will not constitute qualifying income. As a result, a fund may not be
able to sell or otherwise dispose of all or a portion of its gold or precious
metal holdings without realizing significant adverse tax consequences,
including the failure to qualify as a regulated investment company under
Subchapter M of the Code. Rather than incur those tax consequences, a fund may
choose to hold some amount of gold or precious metal that it would otherwise
sell.
HEDGE FUNDS. A fund may seek exposure to alternative asset classes or
strategies through investment in hedge funds. A fund may substitute derivative
instruments, including warrants and swaps, whose values are tied to the value
of underlying hedge funds in lieu of a direct investment in hedge funds. A
derivative instrument whose value is tied to one or more hedge funds or hedge
fund indices will be subject to the market and other risks associated with the
underlying assets held by the hedge fund. Hedge funds are not subject to the
provisions of the 1940 Act or the reporting requirements of the Securities
Exchange Act of 1934, as amended, and their advisors may not be subject to the
Investment Advisers Act of 1940, as amended. Investments in hedge funds are
illiquid and may be less transparent than an investment in a registered mutual
fund. There are no market quotes for securities of hedge funds and hedge funds
generally value their interests no more frequently than monthly or quarterly,
in some cases. An investment in a derivative instrument based on a hedge fund
may be subject to some or all of the structural risks associated with a direct
investment in a hedge fund.
HIGH YIELD FIXED INCOME SECURITIES - JUNK BONDS. A fund may purchase debt
securities which are rated below investment-grade (junk bonds), that is, rated
Ba and below by Moody's or BB and below by S&P and unrated securities judged to
be of equivalent quality as determined by the Advisor. These securities usually
entail greater risk (including the possibility of default or bankruptcy of the
issuers of such securities), generally involve greater volatility of price and
risk to principal and income, and may be less liquid, than securities in the
higher rating categories. The lower the ratings of such debt securities, the
more their risks render them like equity securities. Securities rated D may be
in default with respect to payment of principal or interest. Investments in
high yield securities are described as "speculative" by ratings agencies.
Securities ranked in the lowest investment grade category may also be
considered speculative by certain ratings agencies. See the Appendix to this
SAI for a more complete description of the ratings assigned by ratings
organizations and their respective characteristics.
Issuers of such high yielding securities often are highly leveraged and may not
have available to them more traditional methods of financing. Therefore, the
risk associated with acquiring the securities of such issuers generally is
greater than is the case with higher rated securities. For example, during an
economic downturn or a sustained period of rising interest rates, highly
leveraged issuers of high yield securities may experience financial stress.
During such periods, such issuers may not have sufficient revenues to meet
their interest payment obligations. The issuer's ability to service its debt
obligations may also be adversely affected by specific corporate developments,
or the issuer's inability to meet specific projected business forecasts, or the
unavailability of additional financing. The risk of loss from default by the
issuer is significantly greater for the holders of high yield securities
because such securities are generally unsecured and are often subordinated to
other creditors of the issuer. Prices and yields of high yield securities will
fluctuate over time and, during periods of economic uncertainty, volatility of
high yield securities may adversely affect a fund's net asset value. In
addition, investments in high yield zero coupon or pay-in-kind bonds, rather
than income-bearing high yield securities, may be more speculative and may be
subject to greater fluctuations in value due to changes in interest rates.
A fund may have difficulty disposing of certain high yield securities because
they may have a thin trading market. Because not all dealers maintain markets
in all high yield securities, a fund anticipates that such securities could be
sold only to a limited number of dealers or institutional investors. The lack
of a liquid secondary market may have an adverse effect on the market price and
a fund's ability to dispose of particular issues and may also make it more
difficult for a fund to obtain accurate market quotations for purposes of
valuing a fund's assets. Market quotations
II-106
generally are available on many high yield issues only from a limited number of
dealers and may not necessarily represent firm bids of such dealers or prices
for actual sales. Adverse publicity and investor perceptions may decrease the
values and liquidity of high yield securities. These securities may also
involve special registration responsibilities, liabilities and costs, and
liquidity and valuation difficulties. Even though such securities do not pay
current interest in cash, a fund nonetheless is required to accrue interest
income on these investments and to distribute the interest income on a current
basis. Thus, a fund could be required at times to liquidate other investments
in order to satisfy its distribution requirements.
Credit quality in the high-yield securities market can change suddenly and
unexpectedly, and even recently issued credit ratings may not fully reflect the
actual risks posed by a particular high-yield security.
Prices for below investment-grade securities may be affected by legislative and
regulatory developments. Also, Congress has from time to time considered
legislation which would restrict or eliminate the corporate tax deduction for
interest payments on these securities and regulate corporate restructurings.
Such legislation may significantly depress the prices of outstanding securities
of this type.
IGAP OVERLAY STRATEGY. In addition to a fund's main investment strategy, the
Advisor seeks to enhance returns by employing a global tactical asset
allocation (GTAA) overlay strategy. The GTAA strategy, which the Advisor calls
iGAP (integrated Global Alpha Platform), is a total return strategy designed to
add value by benefiting from mispricings within global bond (and in some cases,
equity) and currency markets. The iGAP strategy combines diverse macro
investment views from various investment teams within Deutsche Asset
Management. Since a single investment approach rarely works in all market
conditions, the teams are chosen to diversify investment approaches thereby
enhancing the expected return for a given level of risk. The collective views
are then used to determine iGAP's positions using a disciplined, risk managed
process. The result is a collection of long and short investment positions
within global bonds (and in some cases, equities) and currencies (and in some
cases, commodities) designed to generate excess returns that have little
correlation to major markets. The bond and currency positions are then
implemented by the iGAP portfolio managers using futures and forward contracts.
The iGAP portfolio managers consider factors such as liquidity, cost, margin
requirement and credit quality when selecting the appropriate derivative
instrument.
The success of the iGAP strategy depends, in part, on the Advisor's ability to
analyze the correlation between various global markets and asset classes. If
the Advisor's correlation analysis proves to be incorrect, losses to a fund may
be significant and may substantially exceed the intended level of market
exposure for the iGAP strategy.
ILLIQUID SECURITIES. Historically, illiquid securities have included securities
subject to contractual or legal restrictions on resale because they have not
been registered under the 1933 Act, securities which are otherwise not readily
marketable and repurchase agreements having a maturity of longer than seven
days. Securities which have not been registered under the 1933 Act are referred
to as private placements or restricted securities and are purchased directly
from the issuer or in the secondary market. Non-publicly traded securities
(including Rule 144A Securities) may involve a high degree of business and
financial risk and may result in substantial losses. These securities may be
less liquid than publicly traded securities, and it may take longer to
liquidate these positions than would be the case for publicly traded
securities. Companies whose securities are not publicly traded may not be
subject to the disclosure and other investor protection requirements applicable
to companies whose securities are publicly traded. Certain securities may be
deemed to be illiquid as a result of the Advisor's receipt from time to time of
material, non-public information about an issuer, which may limit the Advisor's
ability to trade such securities for the account of any of its clients,
including a fund. In some instances, these trading restrictions could continue
in effect for a substantial period of time. Limitations on resale may have an
adverse effect on the marketability of portfolio securities and a mutual fund
might be unable to dispose of restricted or other illiquid securities promptly
or at reasonable prices and might thereby experience difficulty satisfying
redemptions within seven days. An investment in illiquid securities is subject
to the risk that should a fund desire to sell any of these securities when a
ready buyer is not available at a price that is deemed to be representative of
their value, the value of a fund's net assets could be adversely affected.
Mutual funds do not typically hold a significant amount of these restricted or
other illiquid securities because of the potential for delays on resale and
uncertainty in valuation. A mutual fund might also have to register such
restricted securities in order to dispose of them, resulting in additional
expense and delay. A fund selling its securities in a registered
II-107
offering may be deemed to be an "underwriter" for purposes of Section 11 of the
1933 Act. In such event, a fund may be liable to purchasers of the securities
under Section 11 if the registration statement prepared by the issuer, or the
prospectus forming a part of it, is materially inaccurate or misleading,
although a fund may have a due diligence defense. Adverse market conditions
could impede such a public offering of securities.
A large institutional market has developed for certain securities that are not
registered under the 1933 Act, including repurchase agreements, commercial
paper, non-US securities, municipal securities and corporate bonds and notes.
Institutional investors depend on an efficient institutional market in which
the unregistered security can be readily resold or on an issuer's ability to
honor a demand for repayment. The fact that there are contractual or legal
restrictions on resale of such investments to the general public or to certain
institutions may not be indicative of their liquidity.
The SEC has adopted Rule 144A, which allows a broader institutional trading
market for securities otherwise subject to restriction on their resale to the
general public. Rule 144A establishes a "safe harbor" from the registration
requirements of the 1933 Act for resales of certain securities to qualified
institutional buyers.
An investment in Rule 144A Securities will be considered illiquid and therefore
subject to a fund's limit on the purchase of illiquid securities unless a
fund's Board or its delegates determines that the Rule 144A Securities are
liquid. In reaching liquidity decisions, a fund's Board and its delegates may
consider, inter alia, the following factors: (i) the unregistered nature of the
security; (ii) the frequency of trades and quotes for the security; (iii) the
number of dealers wishing to purchase or sell the security and the number of
other potential purchasers; (iv) dealer undertakings to make a market in the
security; and (v) the nature of the security and the nature of the marketplace
trades (e.g., the time needed to dispose of the security, the method of
soliciting offers and the mechanics of the transfer).
Investing in Rule 144A Securities could have the effect of increasing the level
of illiquidity in a fund to the extent that qualified institutional buyers are
unavailable or uninterested in purchasing such securities from a fund. A fund's
Board has adopted guidelines and delegated to the Advisor the daily function of
determining and monitoring the liquidity of Rule 144A Securities, although a
fund's Board will retain ultimate responsibility for any liquidity
determinations.
IMPACT OF LARGE REDEMPTIONS AND PURCHASES OF FUND SHARES. From time to time,
shareholders of a fund (which may include affiliated and/or non-affiliated
registered investment companies that invest in a fund) may make relatively
large redemptions or purchases of fund shares. These transactions may cause a
fund to have to sell securities or invest additional cash, as the case may be.
While it is impossible to predict the overall impact of these transactions over
time, there could be adverse effects on a fund's performance to the extent that
a fund may be required to sell securities or invest cash at times when it would
not otherwise do so. These transactions could also accelerate the realization
of taxable income if sales of securities resulted in capital gains or other
income and could also increase transaction costs, which may impact a fund's
expense ratio and adversely affect a fund's performance.
INDEXED SECURITIES. A fund may invest in indexed securities, the value of which
is linked to currencies, interest rates, commodities, indices or other
financial indicators (reference instruments). Most indexed securities have
maturities of three years or less.
Indexed securities differ from other types of debt securities in which a fund
may invest in several respects. First, the interest rate or, unlike other debt
securities, the principal amount payable at maturity of an indexed security may
vary based on changes in one or more specified reference instruments, such as
an interest rate compared with a fixed interest rate or the currency exchange
rates between two currencies (neither of which need be the currency in which
the instrument is denominated). The reference instrument need not be related to
the terms of the indexed security. For example, the principal amount of a US
dollar denominated indexed security may vary based on the exchange rate of two
foreign currencies. An indexed security may be positively or negatively
indexed; that is, its value may increase or decrease if the value of the
reference instrument increases. Further, the change in the principal amount
payable or the interest rate of an indexed security may be a multiple of the
percentage change (positive or negative) in the value of the underlying
reference instrument(s).
II-108
Investment in indexed securities involves certain risks. In addition to the
credit risk of the security's issuer and the normal risks of price changes in
response to changes in interest rates, the principal amount of indexed
securities may decrease as a result of changes in the value of reference
instruments. Further, in the case of certain indexed securities in which the
interest rate is linked to a reference instrument, the interest rate may be
reduced to zero, and any further declines in the value of the security may then
reduce the principal amount payable on maturity. Also, indexed securities may
be more volatile than the reference instruments underlying the indexed
securities. Finally, a fund's investments in certain indexed securities may
generate taxable income in excess of the interest paid on the securities to a
fund, which may cause a fund to sell investments to obtain cash to make income
distributions (including at a time when it may not be advantageous to do so).
INDUSTRIAL DEVELOPMENT AND POLLUTION CONTROL BONDS. Industrial Development and
Pollution Control Bonds (which are types of private activity bonds), although
nominally issued by municipal authorities, are generally not secured by the
taxing power of the municipality, but are secured by the revenues of the
authority derived from payments by the industrial user. Consequently, the
credit quality of these securities depends upon the ability of the user of the
facilities financed by the bonds and any guarantor to meet its financial
obligations. Under federal tax legislation, certain types of Industrial
Development Bonds and Pollution Control Bonds may no longer be issued on a
tax-exempt basis, although previously issued bonds of these types and certain
refundings of such bonds are not affected.
INFLATION-INDEXED BONDS. A fund may purchase inflation-indexed securities
issued by the US Treasury, US government agencies and instrumentalities other
than the US Treasury, and entities other than the US Treasury or US government
agencies and instrumentalities.
Inflation-indexed bonds are fixed income securities or other instruments whose
principal value is periodically adjusted according to the rate of inflation.
Two structures are common. The US Treasury and some other issuers use a
structure that accrues inflation on either a current or lagged basis into the
principal value of the bond. Most other issuers pay out the Consumer Price
Index accruals as part of a semi-annual coupon.
Inflation-indexed securities issued by the US Treasury have maturities of
approximately five, ten or twenty years, although it is possible that
securities with other maturities will be issued in the future. The US Treasury
securities pay interest on a semi-annual basis, equal to a fixed percentage of
the inflation-adjusted principal amount. For example, if a fund purchased an
inflation-indexed bond with a par value of $1,000 and a 3% real rate of return
coupon (payable 1.5% semi-annually), and the rate of inflation over the first
six months was 1%, the mid-year par value of the bond would be $1,010 and the
first semi-annual interest payment would be $15.15 ($1,010 times 1.5%). If the
rate of inflation during the second half of the year resulted in the whole
year's inflation equaling 3%, the end of year par value of the bond would be
$1,030 and the second semi-annual interest payment would be $15.45 ($1,030
times 1.5%).
If the periodic adjustment rate measuring inflation falls, the principal value
of inflation-indexed bonds will be adjusted downward, and, consequently, the
interest payable on these securities (calculated with respect to a smaller
principal amount) will be reduced. Repayment of the original bond principal on
maturity (as adjusted for inflation) is guaranteed in the case of US Treasury
inflation-indexed bonds, even during a period of deflation, although the
inflation-adjusted principal received could be less than the inflation-adjusted
principal that had accrued to the bond at the time of purchase. However, the
current market value of the bonds is not guaranteed and will fluctuate. A fund
may also invest in other inflation related bonds that may or may not provide a
similar guarantee. If a guarantee of principal is not provided, the adjusted
principal value of the bond repaid at maturity may be less than the original
principal. In addition, if a fund purchases inflation-indexed bonds offered by
foreign issuers, the rate of inflation measured by the foreign inflation index
may not be correlated to the rate of inflation in the US.
The value of inflation-indexed bonds is expected to change in response to
changes in real interest rates. Real interest rates, in turn, are tied to the
relationship between nominal interest rates and the rate of inflation.
Therefore, if the rate of inflation rises at a faster rate than nominal
interest rates, real interest rates might decline, leading to an increase in
value of inflation-indexed bonds. In contrast, if nominal interest rates
increased at a faster rate than inflation, real interest rates might rise,
leading to a decrease in value of inflation-indexed bonds. There can be no
assurance, however, that the value of inflation-indexed bonds will be directly
correlated to changes in interest rates. In the event of sustained
II-109
deflation, it is possible that the amount of semiannual interest payments, the
inflation-adjusted principal of the security and the value of the stripped
components, will decrease. If any of these possibilities are realized, a fund's
net asset value could be negatively affected.
While these securities are expected to provide protection from long-term
inflationary trends, short-term increases in inflation may lead to a decline in
value. If interest rates rise due to reasons other than inflation (for example,
due to changes in currency exchange rates), investors in these securities may
not be protected to the extent that the increase is not reflected in the bond's
inflation measure.
The periodic adjustment of US inflation-indexed bonds is generally linked to
the Consumer Price Index for Urban Consumers (CPI-U), which is calculated
monthly by the US Bureau of Labor Statistics. The CPI-U is a measurement of
changes in the cost of living, made up of components such as housing, food,
transportation and energy. Inflation-indexed bonds issued by a foreign
government are generally adjusted to reflect a comparable inflation index
calculated by the applicable government. There can be no assurance that the
CPI-U or any foreign inflation index will accurately measure the real rate of
inflation in the prices of goods and services. Moreover, there can be no
assurance that the rate of inflation in a foreign country will be correlated to
the rate of inflation in the US. Finally, income distributions of a fund are
likely to fluctuate more than those of a conventional bond fund.
The taxation of inflation-indexed US Treasury securities is similar to the
taxation of conventional bonds. Both interest payments and the difference
between original principal and the inflation-adjusted principal will be treated
as interest income subject to taxation. Interest payments are taxable when
received or accrued. The inflation adjustment to the principal is subject to
tax in the year the adjustment is made, not at maturity of the security when
the cash from the repayment of principal is received. If an upward adjustment
has been made (which typically should happen), investors in non-tax-deferred
accounts will pay taxes on this amount currently. Decreases in the indexed
principal can be deducted only from current or previous interest payments
reported as income.
Inflation-indexed US Treasury securities therefore have a potential cash flow
mismatch to an investor, because investors must pay taxes on the
inflation-adjusted principal before the repayment of principal is received. It
is possible that, particularly for high income tax bracket investors,
inflation-indexed US Treasury securities would not generate enough income in a
given year to cover the tax liability they could create. This is similar to the
current tax treatment for zero-coupon bonds and other discount securities. If
inflation-indexed US Treasury securities are sold prior to maturity, capital
losses or gains are realized in the same manner as traditional bonds.
Inflation-indexed securities are designed to offer a return linked to
inflation, thereby protecting future purchasing power of the money invested in
them. However, inflation-indexed securities provide this protected return only
if held to maturity. In addition, inflation-indexed securities may not trade at
par value. Real interest rates (the market rate of interest less the
anticipated rate of inflation) change over time as a result of many factors,
such as what investors are demanding as a true value for money. When real rates
do change, inflation-indexed securities prices will be more sensitive to these
changes than conventional bonds, because these securities were sold originally
based upon a real interest rate that is no longer prevailing. Should market
expectations for real interest rates rise, the price of inflation-indexed
securities held by a fund may fall, resulting in a decrease in the share price
of a fund.
INTERFUND BORROWING AND LENDING PROGRAM. The DWS funds have received exemptive
relief from the SEC, which permits the funds to participate in an interfund
lending program. The interfund lending program allows the participating funds
to borrow money from and loan money to each other for temporary or emergency
purposes. The program is subject to a number of conditions designed to ensure
fair and equitable treatment of all participating funds, including the
following: (1) no fund may borrow money through the program unless it receives
a more favorable interest rate than a rate approximating the lowest interest
rate at which bank loans would be available to any of the participating funds
under a loan agreement; and (2) no fund may lend money through the program
unless it receives a more favorable return than that available from an
investment in repurchase agreements and, to the extent applicable, money market
cash sweep arrangements. In addition, a fund may participate in the program
only if and to the extent that such participation is consistent with a fund's
investment objectives and policies (for instance, money market funds would
normally participate only as lenders and tax exempt funds only as borrowers).
Interfund loans and borrowings have a maximum duration
II-110
of seven days. Loans may be called on one day's notice. A fund may have to
borrow from a bank at a higher interest rate if an interfund loan is called or
not renewed. Any delay in repayment to a lending fund could result in a lost
investment opportunity or additional costs. The program is subject to the
oversight and periodic review of the Board.
INVERSE FLOATERS. A fund may invest in inverse floaters. Inverse floaters are
debt instruments with a floating rate of interest that bears an inverse
relationship to changes in short-term market interest rates. Investments in
this type of security involve special risks as compared to investments in, for
example, a fixed rate municipal security. The debt instrument in which a fund
invests may be a tender option bond trust (the trust), which can be established
by a fund, a financial institution or a broker, consisting of underlying
municipal obligations with intermediate to long maturities and a fixed interest
rate. Other investors in the trust usually consist of money market fund
investors receiving weekly floating interest rate payments who have put options
with the financial institutions. A fund may enter into shortfall and
forbearance agreements by which a fund agrees to reimburse the trust, in
certain circumstances, for the difference between the liquidation value of the
fixed rate municipal security held by the trust and the liquidation value of
the floating rate notes. A fund could lose money and its NAV could decline as a
result of investments in inverse floaters if movements in interest rates are
incorrectly anticipated. Moreover, the markets for inverse floaters may be less
developed and may have less liquidity than the markets for more traditional
municipal securities, especially during periods of instability in the credit
markets. An inverse floater may exhibit greater price volatility than a
fixed-rate obligation of similar credit quality. When a fund holds inverse
floating rate securities, an increase in market interest rates will adversely
affect the income received from such securities and the net asset value of a
fund's shares. A fund's investments in inverse floaters will not be considered
borrowing within the meaning of the 1940 Act or for purposes of a fund's
investment restrictions on borrowing.
INVESTMENT COMPANY SECURITIES. A fund may acquire securities of other
investment companies to the extent that such investments are consistent with
its investment objective and the limitations of the 1940 Act. A fund will
indirectly bear its proportionate share of any management fees and other
expenses paid by such other investment companies.
For example, a fund may invest in investment companies which seek to track the
composition and performance of specific indexes or a specific portion of an
index. These index-based investment companies hold substantially all of their
assets in securities representing their specific index. Accordingly, the main
risk of investing in index-based investments is the same as investing in a
portfolio of equity securities comprising the index. The market prices of
index-based investments that are traded on an exchange will fluctuate in
accordance with both changes in the market value of their underlying portfolio
securities and due to supply and demand for the instruments on the exchanges on
which they are traded (which may result in their trading at a discount or
premium to their NAVs). Index-based investments may not replicate exactly the
performance of their specified index because of transaction costs and because
of the temporary unavailability of certain component securities of the index.
Examples of index-based investments include:
SPDRs (Reg. TM): SPDRs, an acronym for "Standard & Poor's Depositary Receipts,"
---------------
are based on the S&P 500 Composite Stock Price Index. They are issued by the
SPDR Trust, a unit investment trust that holds shares of substantially all the
companies in the S&P 500 in substantially the same weighting and seeks to
closely track the price performance and dividend yield of the Index.
MidCap SPDRs (Reg. TM): MidCap SPDRs are based on the S&P MidCap 400 Index.
----------------------
They are issued by the MidCap SPDR Trust, a unit investment trust that holds a
portfolio of securities consisting of substantially all of the common stocks in
the S&P MidCap 400 Index in substantially the same weighting and seeks to
closely track the price performance and dividend yield of the Index.
Select Sector SPDRs (Reg. TM): Select Sector SPDRs are based on a particular
-----------------------------
sector or group of industries that are represented by a specified Select Sector
Index within the Standard & Poor's Composite Stock Price Index. They are issued
by The Select Sector SPDR Trust, an open-end management investment company with
nine portfolios that each seeks to closely track the price performance and
dividend yield of a particular Select Sector Index.
II-111
DIAMONDS/SM/: DIAMONDS are based on the Dow Jones Industrial Average/SM/. They
--------
are issued by the DIAMONDS Trust, a unit investment trust that holds a
portfolio of all the component common stocks of the Dow Jones Industrial
Average and seeks to closely track the price performance and dividend yield of
the Dow.
INVESTMENT-GRADE BONDS. A fund may purchase "investment-grade" bonds, which are
those rated Aaa, Aa, A or Baa by Moody's or AAA, AA, A or BBB by S&P or, if
unrated, judged to be of equivalent quality as determined by the Advisor.
Moody's considers bonds it rates Baa to have speculative elements as well as
investment-grade characteristics. To the extent that a fund invests in
higher-grade securities, a fund will not be able to avail itself of
opportunities for higher income which may be available at lower grades.
IPO RISK. Securities issued through an initial public offering (IPO) can
experience an immediate drop in value if the demand for the securities does not
continue to support the offering price. Information about the issuers of IPO
securities is also difficult to acquire since they are new to the market and
may not have lengthy operating histories. A fund may engage in short-term
trading in connection with its IPO investments, which could produce higher
trading costs and adverse tax consequences.
LENDING OF PORTFOLIO SECURITIES. To generate additional income, a fund may lend
a percentage of its investment securities to approved institutional borrowers
who need to borrow securities in order to complete certain transactions, such
as covering short sales, avoiding failures to deliver securities or completing
arbitrage operations, in exchange for collateral in the form of cash or US
government securities. By lending its investment securities, a fund attempts to
increase its net investment income through the receipt of interest on the loan.
Any gain or loss in the market price of the securities loaned that might occur
during the term of the loan would belong to a fund. A fund may lend its
investment securities so long as the terms, structure and the aggregate amount
of such loans are not inconsistent with the 1940 Act or the rules and
regulations or interpretations of the SEC thereunder, which currently require
that (a) the borrower pledge and maintain with a fund collateral consisting of
liquid, unencumbered assets having a value at all times not less than 100% of
the value of the securities loaned, (b) the borrower add to such collateral
whenever the price of the securities loaned rises or the value of non-cash
collateral declines (i.e., the borrower "marks to the market" on a daily
basis), (c) the loan be made subject to termination by a fund at any time, and
(d) a fund receives a reasonable return on the loan (consisting of the return
achieved on investment of the cash collateral, less the rebate owed to
borrowers, plus distributions on the loaned securities and any increase in
their market value).
A fund may pay reasonable fees in connection with loaned securities, pursuant
to written contracts, including fees paid to a fund's custodian and fees paid
to a securities lending agent. Voting rights may pass with the loaned
securities, but if an event occurs that the Advisor determines to be a material
event affecting an investment on loan, the loan must be called and the
securities voted. Pursuant to an exemptive order granted by the SEC, cash
collateral received by a fund may be invested in a money market fund managed by
the Advisor (or one of its affiliates).
A fund is subject to all investment risks associated with the reinvestment of
any cash collateral received, including, but not limited to, interest rate,
credit and liquidity risk associated with such investments. To the extent the
value or return of a fund's investments of the cash collateral declines below
the amount owed to a borrower, a fund may incur losses that exceed the amount
it earned on lending the security. If the borrower defaults on its obligation
to return securities lent because of insolvency or other reasons, a fund could
experience delays and costs in recovering the securities lent or gaining access
to collateral. If a fund is not able to recover securities lent, a fund may
sell the collateral and purchase a replacement investment in the market,
incurring the risk that the value of the replacement security is greater than
the value of the collateral. However, loans will be made only to borrowers
selected by a fund's delegate after a commercially reasonable review of
relevant facts and circumstances, including the creditworthiness of the
borrower.
MAINTENANCE OF $1.00 NET ASSET VALUE, CREDIT QUALITY AND PORTFOLIO MATURITY
(FOR MONEY MARKET FUNDS ONLY). A fund effects purchases and redemptions at its
net asset value per share. In fulfillment of its responsibilities under Rule
2a-7 of the 1940 Act, the Board has approved policies reasonably designed,
taking into account current market conditions and a fund's investment
objective, to stabilize a fund's net asset value per share, and the Board will
periodically review the Advisor's operations under such policies at regularly
scheduled Board meetings. In addition to imposing limitations on the quality
and maturity of portfolio instruments held by a fund as described in the
prospectus, those
II-112
policies include a weekly monitoring by the Advisor of unrealized gains and
losses in a fund and, when necessary, in an effort to avoid a material
deviation of a fund's net asset value per share determined by reference to
market valuations from a fund's $1.00 price per share, taking corrective
action, such as adjusting the maturity of a fund, or, if possible, realizing
gains or losses to offset in part unrealized losses or gains. The result of
those policies may be that the yield on shares of a fund will be lower than
would be the case if the policies were not in effect. Such policies also
provide for certain action to be taken with respect to portfolio securities
which experience a downgrade in rating or suffer a default. There is no
assurance that a fund's net asset value per share will be maintained at $1.00.
MICRO-CAP COMPANIES. Micro-capitalization company stocks have customarily
involved more investment risk than large company stocks. There can be no
assurance that this will continue to be true in the future.
Micro-capitalization companies may have limited product lines, markets or
financial resources; may lack management depth or experience; and may be more
vulnerable to adverse general market or economic developments than large
companies. The prices of micro-capitalization company securities are often more
volatile than prices associated with large company issues, and can display
abrupt or erratic movements at times, due to limited trading volumes and less
publicly available information.
Also, because micro-capitalization companies normally have fewer shares
outstanding and these shares trade less frequently than large companies, it may
be more difficult for a fund to buy and sell significant amounts of such shares
without an unfavorable impact on prevailing market prices.
Some of the companies in which a fund may invest may distribute, sell or
produce products which have recently been brought to market and may be
dependent on key personnel. The securities of micro-capitalization companies
are often traded over-the-counter and may not be traded in the volumes typical
on a national securities exchange. Consequently, in order to sell this type of
holding, a fund may need to discount the securities from recent prices or
dispose of the securities over a long period of time.
MINING AND EXPLORATION RISKS. The business of mining by its nature involves
significant risks and hazards, including environmental hazards, industrial
accidents, labor disputes, discharge of toxic chemicals, fire, drought,
flooding and natural acts. The occurrence of any of these hazards can delay
production, increase production costs and result in liability to the operator
of the mines. A mining operation may become subject to liability for pollution
or other hazards against which it has not insured or cannot insure, including
those in respect of past mining activities for which it was not responsible.
Exploration for gold and other precious metals is speculative in nature,
involves many risks and frequently is unsuccessful. There can be no assurance
that any mineralisation discovered will result in an increase in the proven and
probable reserves of a mining operation. If reserves are developed, it can take
a number of years from the initial phases of drilling and identification of
mineralisation until production is possible, during which time the economic
feasibility of production may change. Substantial expenditures are required to
establish ore reserves properties and to construct mining and processing
facilities. As a result of these uncertainties, no assurance can be given that
the exploration programs undertaken by a particular mining operation will
actually result in any new commercial mining.
MORTGAGE-BACKED SECURITIES. Mortgage-backed securities represent direct or
indirect participations in or obligations collateralized by and payable from
mortgage loans secured by real property, which may include subprime mortgages.
A fund may invest in mortgage-backed securities issued or guaranteed by (i) US
Government agencies or instrumentalities such as the Government National
Mortgage Association (GNMA) (also known as Ginnie Mae), the Federal National
Mortgage Association (FNMA) (also known as Fannie Mae) and the Federal Home
Loan Mortgage Corporation (FHLMC) (also known as Freddie Mac) or (ii) other
issuers, including private companies.
GNMA is a government-owned corporation that is an agency of the US Department
of Housing and Urban Development. It guarantees, with the full faith and credit
of the United States, full and timely payment of all monthly principal and
interest on its mortgage-backed securities. Until recently, FNMA and FHLMC were
government-sponsored corporations owned entirely by private stockholders. Both
issue mortgage-related securities that contain guarantees as to timely payment
of interest and principal but that are not backed by the full faith and credit
of the US government. The value of the companies' securities fell sharply in
2008 due to concerns that the firms did not have sufficient capital to offset
losses. In mid-2008, the US Treasury was authorized to increase the size of
home loans that FNMA and FHLMC could
II-113
purchase in certain residential areas and, until 2009, to lend FNMA and FHLMC
emergency funds and to purchase the companies' stock. In September 2008, the US
Treasury announced that FNMA and FHLMC had been placed in conservatorship by
the Federal Housing Finance Agency (FHFA), a newly created independent
regulator created under the Federal Housing Finance Regulatory Reform Act of
2008 (Reform Act). In addition to placing the companies in conservatorship, the
US Treasury announced three additional steps that it intended to take with
respect to FNMA and FHLMC. First, the US Treasury has entered into preferred
stock purchase agreements ("PSPAs") under which, if the FHFA determines that
FNMA's or FHLMC's liabilities have exceeded its assets under generally accepted
accounting principles, the US Treasury will contribute cash capital to the
company in an amount equal to the difference between liabilities and assets.
The PSPAs are designed to provide protection to the senior and subordinated
debt and the mortgage-backed securities issued by FNMA and FHLMC. Second, the
US Treasury established a new secured lending credit facility that is available
to FNMA and FHLMC until December 2009. Third, the US Treasury initiated a
temporary program to purchase FNMA and FHLMC mortgage-backed securities, which
is expected to continue until December 2009. No assurance can be given that the
US Treasury initiatives discussed above with respect to the debt and
mortgage-backed securities issued by FNMA and FHLMC will be successful.
FHFA, as conservator or receiver for FNMA and FHLMC, has the power to repudiate
any contract entered into by FNMA or FHLMC prior to FHFA's appointment as
conservator or receiver, as applicable, if FHFA determines, in its sole
discretion, that performance of the contract is burdensome and that repudiation
of the contract promotes the orderly administration of FNMA's or FHLMC's
affairs. The Reform Act requires FHFA to exercise its right to repudiate any
contract within a reasonable period of time after its appointment as
conservator or receiver. FHFA, in its capacity as conservator, has indicated
that it has no intention to repudiate the guaranty obligations of FNMA or FHLMC
because FHFA views repudiation as incompatible with the goals of the
conservatorship. However, in the event that FHFA, as conservator or if it is
later appointed as receiver for FNMA or FHLMC, were to repudiate any such
guaranty obligation, the conservatorship or receivership estate, as applicable,
would be liable for actual direct compensatory damages in accordance with the
provisions of the Reform Act. Any such liability could be satisfied only to the
extent of FNMA's or FHLMC's assets available therefor.
In the event of repudiation, the payments of interest to holders of FNMA or
FHLMC mortgage-backed securities would be reduced if payments on the mortgage
loans represented in the mortgage loan groups related to such mortgage-backed
securities are not made by the borrowers or advanced by the servicer. Any
actual direct compensatory damages for repudiating these guaranty obligations
may not be sufficient to offset any shortfalls experienced by such
mortgage-backed security holders. Further, in its capacity as conservator or
receiver, FHFA has the right to transfer or sell any asset or liability of FNMA
or FHLMC without any approval, assignment or consent. Although FHFA has stated
that it has no present intention to do so, if FHFA, as conservator or receiver,
were to transfer any such guaranty obligation to another party, holders of FNMA
or FHLMC mortgage-backed securities would have to rely on that party for
satisfaction of the guaranty obligation and would be exposed to the credit risk
of that party.
In addition, certain rights provided to holders of mortgage-backed securities
issued by FNMA and FHLMC under the operative documents related to such
securities may not be enforced against FHFA, or enforcement of such rights may
be delayed, during the conservatorship or any future receivership. The
operative documents for FNMA and FHLMC mortgage-backed securities may provide
(or with respect to securities issued prior to the date of the appointment of
the conservator may have provided) that upon the occurrence of an event of
default on the part of FNMA or FHLMC, in its capacity as guarantor, which
includes the appointment of a conservator or receiver, holders of such
mortgage-backed securities have the right to replace FNMA or FHLMC as trustee
if the requisite percentage of mortgage-backed securities holders consent. The
Reform Act prevents mortgage-backed security holders from enforcing such rights
if the event of default arises solely because a conservator or receiver has
been appointed. The Reform Act also provides that no person may exercise any
right or power to terminate, accelerate or declare an event of default under
certain contracts to which FNMA or FHLMC is a party, or obtain possession of or
exercise control over any property of FNMA or FHLMC, or affect any contractual
rights of FNMA or FHLMC, without the approval of FHFA, as conservator or
receiver, for a period of 45 or 90 days following the appointment of FHFA as
conservator or receiver, respectively.
The market value and yield of these mortgage-backed securities can vary due to
market interest rate fluctuations and early prepayments of underlying
mortgages. These securities represent ownership in a pool of federally insured
mortgage loans with a maximum maturity of 30 years. A decline in interest rates
may lead to a faster rate of repayment of the
II-114
underlying mortgages, and may expose a fund to a lower rate of return upon
reinvestment. To the extent that such mortgage-backed securities are held by a
fund, the prepayment right will tend to limit to some degree the increase in
net asset value of a fund because the value of the mortgage-backed securities
held by a fund may not appreciate as rapidly as the price of non-callable debt
securities. Mortgage-backed securities are subject to the risk of prepayment
and the risk that the underlying loans will not be repaid. Because principal
may be prepaid at any time, mortgage-backed securities may involve
significantly greater price and yield volatility than traditional debt
securities. At times, a fund may invest in securities that pay higher than
market interest rates by paying a premium above the securities' par value.
Prepayments of these securities may cause losses on securities purchased at a
premium. Unscheduled payments, which are made at par value, will cause a fund
to experience a loss equal to any unamortized premium.
When interest rates rise, mortgage prepayment rates tend to decline, thus
lengthening the life of a mortgage-related security and increasing the price
volatility of that security, affecting the price volatility of a fund's shares.
The negative effect of interest rate increases on the market-value of mortgage
backed securities is usually more pronounced than it is for other types of
fixed-income securities potentially increasing the volatility of a fund.
Interests in pools of mortgage-backed securities differ from other forms of
debt securities, which normally provide for periodic payment of interest in
fixed amounts with principal payments at maturity or specified call dates.
Instead, these securities provide a monthly payment which consists of both
interest and principal payments. In effect, these payments are a "pass-through"
of the monthly payments made by the individual borrowers on their mortgage
loans, net of any fees paid to the issuer or guarantor of such securities.
Additional payments are caused by repayments of principal resulting from the
sale of the underlying property, refinancing or foreclosure, net of fees or
costs which may be incurred. Some mortgage-related securities (such as
securities issued by GNMA) are described as "modified pass-through." These
securities entitle the holder to receive all interest and principal payments
owed on the mortgage pool, net of certain fees, at the scheduled payment dates
regardless of whether or not the mortgagor actually makes the payment.
Commercial banks, savings and loan institutions, private mortgage insurance
companies, mortgage bankers and other secondary market issuers also create
pass-through pools of conventional mortgage loans. Such issuers may, in
addition, be the originators and/or servicers of the underlying mortgage loans
as well as the guarantors of the mortgage-related securities. Pools created by
such non-governmental issuers generally offer a higher rate of interest than
government and government-related pools because there are no direct or indirect
government or agency guarantees of payments. However, timely payment of
interest and principal of these pools may be supported by various forms of
insurance or guarantees, including individual loan, title, pool and hazard
insurance and letters of credit. The insurance and guarantees are issued by
governmental entities, private insurers and the mortgage poolers. Such
insurance and guarantees and the creditworthiness of the issuers thereof will
be considered in determining whether a mortgage-related security meets a fund's
investment quality standards. There can be no assurance that the private
insurers or guarantors can meet their obligations under the insurance policies
or guarantee arrangements. A fund may buy mortgage-related securities without
insurance or guarantees. Although the market for such securities is becoming
increasingly liquid, securities issued by certain private organizations may not
be readily marketable.
Due to prepayments of the underlying mortgage instruments, mortgage-backed
securities do not have a known actual maturity. In the absence of a known
maturity, market participants generally refer to an estimated average life. An
average life estimate is a function of an assumption regarding anticipated
prepayment patterns. The assumption is based upon current interest rates,
current conditions in the relevant housing markets and other factors. The
assumption is necessarily subjective, and thus different market participants
could produce somewhat different average life estimates with regard to the same
security. There can be no assurance that the average estimated life of
portfolio securities will be the actual average life of such securities.
Fannie Mae Certificates. Fannie Mae is a federally chartered corporation
organized and existing under the Federal National Mortgage Association Charter
Act of 1938. The obligations of Fannie Mae are obligations solely of Fannie Mae
and are not backed by the full faith and credit of the US government.
II-115
Each Fannie Mae Certificate will represent a pro rata interest in one or more
pools of FHA Loans, VA Loans or conventional mortgage loans (i.e., mortgage
loans that are not insured or guaranteed by any governmental agency) of the
following types: (1) fixed-rate level payment mortgage loans; (2) fixed-rate
growing equity mortgage loans; (3) fixed-rate graduated payment mortgage loans;
(4) variable rate mortgage loans; (5) other adjustable rate mortgage loans; and
(6) fixed-rate and adjustable mortgage loans secured by multifamily projects.
Freddie Mac Certificates. Freddie Mac is a federally chartered corporation of
the United States created pursuant to the Emergency Home Finance Act of 1970,
as amended (FHLMC Act). The obligations of Freddie Mac are obligations solely
of Freddie Mac and are not backed by the full faith and credit of the US
government.
Freddie Mac Certificates represent a pro rata interest in a group of
conventional mortgage loans (Freddie Mac Certificate group) purchased by
Freddie Mac. The mortgage loans underlying the Freddie Mac Certificates will
consist of fixed-rate or adjustable rate mortgage loans with original terms to
maturity of between ten and thirty years, substantially all of which are
secured by first liens on one- to four-family residential properties or
multifamily projects. Each mortgage loan must meet the applicable standards set
forth in the FHLMC Act. A Freddie Mac Certificate group may include whole
loans, participating interests in whole loans and undivided interests in whole
loans and participations comprising another Freddie Mac Certificate group.
Ginnie Mae Certificates. The National Housing Act of 1934, as amended (Housing
Act), authorizes Ginnie Mae to guarantee the timely payment of the principal of
and interest on certificates that are based on and backed by a pool of mortgage
loans insured by the Federal Housing Administration under the Housing Act, or
Title V of the Housing Act of 1949 (FHA Loans), or guaranteed by the Department
of Veterans Affairs under the Servicemen's Readjustment Act of 1944, as amended
(VA Loans), or by pools of other eligible mortgage loans. The Housing Act
provides that the full faith and credit of the US government is pledged to the
payment of all amounts that may be required to be paid under any Ginnie Mae
guaranty. In order to meet its obligations under such guaranty, Ginnie Mae is
authorized to borrow from the US Treasury with no limitations as to amount.
The Ginnie Mae Certificates in which a fund invests will represent a pro rata
interest in one or more pools of the following types of mortgage loans: (1)
fixed-rate level payment mortgage loans; (2) fixed-rate graduated payment
mortgage loans; (3) fixed-rate growing equity mortgage loans; (4) fixed-rate
mortgage loans secured by manufactured (mobile) homes; (5) mortgage loans on
multifamily residential properties under construction; (6) mortgage loans on
completed multifamily projects; (7) fixed-rate mortgage loans as to which
escrowed funds are used to reduce the borrower's monthly payments during the
early years of the mortgage loans ("buy down" mortgage loans); (8) mortgage
loans that provide for adjustments in payments based on periodic changes in
interest rates or in other payment terms of the mortgage loans; and (9)
mortgage backed serial notes.
Multiple Class Mortgage-Backed Securities. A fund may invest in multiple class
mortgage-backed securities including collateralized mortgage obligations (CMOs)
and real estate mortgage investment conduits (REMIC Certificates). These
securities may be issued by US government agencies and instrumentalities such
as Fannie Mae or Freddie Mac or by trusts formed by private originators of, or
investors in, mortgage loans, including savings and loan associations, mortgage
bankers, commercial banks, insurance companies, investment banks and special
purpose subsidiaries of the foregoing. In general, CMOs are debt obligations of
a legal entity that are collateralized by a pool of mortgage loans or
mortgage-backed securities the payments on which are used to make payments on
the CMOs or multiple class mortgage-backed securities. REMIC Certificates
represent beneficial ownership interests in a REMIC trust, generally consisting
of mortgage loans or Fannie Mae, Freddie Mac or Ginnie Mae guaranteed
mortgage-backed securities. To the extent that a CMO or REMIC Certificate is
collateralized by Ginnie Mae guaranteed mortgage-backed securities, holders of
the CMO or REMIC Certificate receive all interest and principal payments owed
on the mortgage pool, net of certain fees, regardless of whether the mortgagor
actually makes the payments, as a result of the GNMA guaranty, which is backed
by the full faith and credit of the US government. The obligations of Fannie
Mae or Freddie Mac under their respective guaranty of the REMIC Certificates
are obligations solely of Fannie Mae or Freddie Mac, respectively.
II-116
Fannie Mae REMIC Certificates are issued and guaranteed as to timely
distribution of principal and interest by Fannie Mae. These certificates are
obligations solely of Fannie Mae and are not backed by the full faith and
credit of the US government. In addition, Fannie Mae will be obligated to
distribute the principal balance of each class of REMIC Certificates in full,
whether or not sufficient funds are otherwise available.
Freddie Mac guarantees the timely payment of interest on Freddie Mac REMIC
Certificates and also guarantees the payment of principal as payments are
required to be made on the underlying mortgage participation certificates
(PCs). These certificates are obligations solely of Freddie Mac and are not
backed by the full faith and credit of the US government. PCs represent
undivided interests in specified level payment residential mortgages or
participations therein purchased by Freddie Mac and placed in a PC pool. With
respect to principal payments on PCs, Freddie Mac generally guarantees ultimate
collection of all principal of the related mortgage loans without offset or
deduction. Freddie Mac also guarantees timely payment of principal of certain
PCs.
CMOs and REMIC Certificates are issued in multiple classes. Each class of CMOs
or REMIC Certificates, often referred to as a "tranche," is issued at a
specific adjustable or fixed interest rate and must be fully retired no later
than its final distribution date. Principal prepayments on the underlying
mortgage loans or the mortgage-backed securities underlying the CMOs or REMIC
Certificates may cause some or all of the classes of CMOs or REMIC Certificates
to be retired substantially earlier than their final distribution dates.
Generally, interest is paid or accrues on all classes of CMOs or REMIC
Certificates on a monthly basis.
The principal of and interest on the mortgage-backed securities may be
allocated among the several tranches in various ways. In certain structures
(known as sequential pay CMOs or REMIC Certificates), payments of principal,
including any principal prepayments, on the mortgage-backed securities
generally are applied to the classes of CMOs or REMIC Certificates in the order
of their respective final distribution dates. Thus, no payment of principal
will be made on any class of sequential pay CMOs or REMIC Certificates until
all other classes having an earlier final distribution date have been paid in
full. Additional structures of CMOs and REMIC Certificates include, among
others, "parallel pay" CMOs and REMIC Certificates. Parallel pay CMOs or REMIC
Certificates are those which are structured to apply principal payments and
prepayments of the mortgage-backed securities to two or more classes
concurrently on a proportionate or disproportionate basis. These simultaneous
payments are taken into account in calculating the final distribution date of
each class.
A wide variety of REMIC Certificates may be issued in parallel pay or
sequential pay structures. These securities include accrual certificates (Z
Bonds), which only accrue interest at a specified rate until all other
certificates having an earlier final distribution date have been retired and
are converted thereafter to an interest-paying security, and planned
amortization class (PAC) certificates, which are parallel pay REMIC
Certificates that generally require that specified amounts of principal be
applied on each payment date to one or more classes of REMIC Certificates (PAC
Certificates), even though all other principal payments and prepayments of the
mortgage-backed securities are then required to be applied to one or more other
classes of the PAC Certificates. The scheduled principal payments for the PAC
Certificates generally have the highest priority on each payment date after
interest due has been paid to all classes entitled to receive interest
currently. Shortfalls, if any, are added to the amount payable on the next
payment date. The PAC Certificate payment schedule is taken into account in
calculating the final distribution date of each class of PAC. In order to
create PAC tranches, one or more tranches generally must be created that absorb
most of the volatility in the underlying mortgage-backed securities. These
tranches tend to have market prices and yields that are much more volatile than
other PAC classes.
The prices of certain CMOs and REMIC Certificates, depending on their structure
and the rate of prepayments, may be volatile. Some CMOs may also not be as
liquid as other securities. In addition, the value of a CMO or REMIC
Certificate, including those collateralized by mortgage-backed securities
issued or guaranteed by US government agencies or instrumentalities, may be
affected by other factors, such as the availability of information concerning
the pool and its structure, the creditworthiness of the servicing agent for the
pool, the originator of the underlying assets, or the entities providing credit
enhancement. The value of these securities also can depend on the ability of
their servicers to service the underlying collateral and is, therefore, subject
to risks associated with servicers' performance, including mishandling of
documentation. A fund is permitted to invest in other types of mortgage-backed
securities that may be available in the future to the extent consistent with
its investment policies and objective.
II-117
Impact of Sub-Prime Mortgage Market. A fund may invest in mortgage-backed,
asset-backed and other fixed-income securities whose value and liquidity may be
adversely affected by the critical downturn in the sub-prime mortgage lending
market in the US. Sub-prime loans, which have higher interest rates, are made
to borrowers with low credit ratings or other factors that increase the risk of
default. Concerns about widespread defaults on sub-prime loans have also
created heightened volatility and turmoil in the general credit markets. As a
result, a fund's investments in certain fixed-income securities may decline in
value, their market value may be more difficult to determine, and a fund may
have more difficulty disposing of them.
MUNICIPAL LEASES, CERTIFICATES OF PARTICIPATION AND OTHER PARTICIPATION
INTERESTS. A municipal lease is an obligation in the form of a lease or
installment purchase contract that is issued by a state or local government to
acquire equipment and facilities. Income from such obligations is generally
exempt from state and local taxes in the state of issuance (as well as regular
Federal income tax). Municipal leases frequently involve special risks not
normally associated with general obligation or revenue bonds, such as
non-payment and the risk of bankruptcy of the issuer. Leases and installment
purchase or conditional sale contracts (which normally provide for title to the
leased asset to pass eventually to the governmental issuer) have evolved as a
means for governmental issuers to acquire property and equipment without
meeting the constitutional and statutory requirements for the issuance of debt.
The debt issuance limitations are deemed to be inapplicable because of the
inclusion in many leases or contracts of "non-appropriation" clauses that
relieve the governmental issuer of any obligation to make future payments under
the lease or contract unless money is appropriated for such purpose by the
appropriate legislative body on a yearly or other periodic basis. Thus, a
fund's investment in municipal leases will be subject to the special risk that
the governmental issuer may not appropriate funds for lease payments.
In addition, such leases or contracts may be subject to the temporary abatement
of payments in the event the issuer is prevented from maintaining occupancy of
the leased premises or utilizing the leased equipment. Although the obligations
may be secured by the leased equipment or facilities, the disposition of the
property in the event of non-appropriation or foreclosure might prove
difficult, time consuming and costly, and result in an unsatisfactory or
delayed recoupment of a fund's original investment.
Certificates of participation represent undivided interests in municipal
leases, installment purchase contracts or other instruments. The certificates
are typically issued by a trust or other entity that has received an assignment
of the payments to be made by the state or political subdivision under such
leases or installment purchase contracts.
Certain municipal lease obligations and certificates of participation may be
deemed illiquid for the purpose of a fund's limitations on investments in
illiquid securities. Other municipal lease obligations and certificates of
participation acquired by a fund may be determined by the Advisor, pursuant to
guidelines adopted by the Board, to be liquid securities for the purpose of a
fund's limitation on investments in illiquid securities. In determining the
liquidity of municipal lease obligations and certificates of participation, the
Advisor will consider a variety of factors including: (1) dealer undertakings
to make a market in the security; (2) the number of dealers willing to purchase
or sell the obligation and the number of other potential buyers; (3) the
frequency of trades or quotes for the obligation; and (4) the nature of the
security and market for the security (i.e., the time needed to dispose of the
security, the method of soliciting offers, and the mechanics of the transfer.)
In addition, the Advisor will consider factors unique to particular lease
obligations and certificates of participation affecting the marketability
thereof. These include the general creditworthiness of the issuer, the
importance to the issuer of the property covered by the lease and the
likelihood that the marketability of the obligation will be maintained
throughout the time the obligation is held by a fund.
A fund may purchase participations in municipal securities held by a commercial
bank or other financial institution, provided the participation interest is
fully insured. Such participations provide a fund with the right to a pro rata
undivided interest in the underlying municipal securities. In addition, such
participations generally provide a fund with the right to demand payment, on
not more than seven days notice, of all or any part of a fund's participation
interest in the underlying municipal security, plus accrued interest.
Each participation is backed by an irrevocable letter of credit or guarantee of
the selling bank that the Advisor has determined meets the prescribed quality
standards of a fund. Therefore, either the credit of the issuer of the
municipal obligation or the selling bank, or both, will meet the quality
standards of the particular fund. A fund has the right to
II-118
sell the participation back to the bank after seven days' notice for the full
principal amount of a fund's interest in the municipal obligation plus accrued
interest, but only (i) as required to provide liquidity to a fund, (ii) to
maintain a high quality investment portfolio or (iii) upon a default under the
terms of the municipal obligation. The selling bank will receive a fee from a
fund in connection with the arrangement.
Participation interests in municipal securities are subject to the same general
risks as participation interests in bank loans, as described in the Bank Loans
section above. Such risks include credit risk, interest rate risk, and
liquidity risk, as well as the potential liability associated with being a
lender. If a fund purchases a participation, it may only be able to enforce its
rights through the participating lender, and may assume the credit risk of both
the lender and the borrower.
MUNICIPAL SECURITIES. Municipal obligations are issued by or on behalf of
states, territories and possessions of the United States and their political
subdivisions, agencies and instrumentalities and the District of Columbia to
obtain funds for various public purposes. The interest on these obligations is
generally exempt from regular federal income tax in the hands of most
investors. The two principal classifications of municipal obligations are
"notes" and "bonds."
Municipal notes are generally used to provide for short-term capital needs.
Municipal notes include: Tax Anticipation Notes, Revenue Anticipation Notes,
Bond Anticipation Notes, and Construction Loan Notes. Tax Anticipation Notes
are sold to finance working capital needs of municipalities. They are generally
payable from specific tax revenues expected to be received at a future date,
such as income, sales, property, use and business taxes. Revenue Anticipation
Notes are issued in expectation of receipt of other types of revenue, such as
federal revenues available under federal revenue sharing programs. Bond
Anticipation Notes are sold to provide interim financing until long-term bond
financing can be arranged. In most cases, the long-term bonds provide the funds
needed for the repayment of the notes. Construction Loan Notes are sold to
provide construction financing. After the projects are successfully completed
and accepted, many projects receive permanent financing through the Federal
Housing Administration under Fannie Mae (Federal National Mortgage Association)
or Ginnie Mae (Government National Mortgage Association). These notes are
secured by mortgage notes insured by the Federal Housing Authority; however,
the proceeds from the insurance may be less than the economic equivalent of the
payment of principal and interest on the mortgage note if there has been a
default. The obligations of an issuer of municipal notes are generally secured
by the anticipated revenues from taxes, grants or bond financing. An investment
in such instruments, however, presents a risk that the anticipated revenues
will not be received or that such revenues will be insufficient to satisfy the
issuer's payment obligations under the notes or that refinancing will be
otherwise unavailable. There are, of course, a number of other types of notes
issued for different purposes and secured differently from those described
above.
Municipal bonds, which meet longer-term capital needs and generally have
maturities of more than one year when issued, have two principal
classifications: "general obligation" bonds and "revenue" bonds. Issuers of
general obligation bonds include states, counties, cities, towns and regional
districts. The proceeds of these obligations are used to fund a wide range of
public projects including the construction or improvement of schools, highways
and roads, water and sewer systems and a variety of other public purposes. The
basic security behind general obligation bonds is the issuer's pledge of its
full faith, credit, and taxing power for the payment of principal and interest.
The taxes that can be levied for the payment of debt service may be limited or
unlimited as to rate, amount or special assessments.
The principal security for a revenue bond is generally the net revenues derived
from a particular facility or group of facilities or, in some cases, from the
proceeds of a special excise or other specific revenue source. Revenue bonds
have been issued to fund a wide variety of capital projects including:
electric, gas, water and sewer systems; highways, bridges and tunnels; port and
airport facilities; colleges and universities; and hospitals. Although the
principal security behind these bonds varies widely, many provide additional
security in the form of a debt service reserve fund whose monies may also be
used to make principal and interest payments on the issuer's obligations.
Housing finance authorities have a wide range of security including partially
or fully-insured, rent-subsidized or collateralized mortgages, and the net
revenues from housing or other public projects. In addition to a debt service
reserve fund, some authorities provide further security in the form of a
state's ability (without obligation) to make up deficiencies in the debt
reserve fund. Lease rental bonds issued by a state or local authority for
capital projects are secured by annual lease rental payments from the state or
locality to the authority sufficient to cover debt service on the authority's
obligations.
II-119
Some issues of municipal bonds are payable from United States Treasury bonds
and notes or agency obligations held in escrow by a trustee, frequently a
commercial bank. The interest and principal on these US Government securities
are sufficient to pay all interest and principal requirements of the municipal
securities when due. Some escrowed Treasury securities are used to retire
municipal bonds at their earliest call date, while others are used to retire
municipal bonds at their maturity.
Securities purchased for a fund may include variable/floating rate instruments,
variable mode instruments, put bonds, and other obligations which have a
specified maturity date but also are payable before maturity after notice by
the holder (demand obligations). Demand obligations are considered for a fund's
purposes to mature at the demand date.
In addition, there are a variety of hybrid and special types of municipal
obligations as well as numerous differences in the security of municipal
obligations both within and between the two principal classifications (i.e.,
notes and bonds) discussed above.
An entire issue of municipal securities may be purchased by one or a small
number of institutional investors such as a fund. Thus, such an issue may not
be said to be publicly offered. Unlike the equity securities of operating
companies or mutual funds which must be registered under the 1933 Act prior to
offer and sale unless an exemption from such registration is available,
municipal securities, whether publicly or privately offered, may nevertheless
be readily marketable. A secondary market exists for municipal securities which
have been publicly offered as well as securities which have not been publicly
offered initially but which may nevertheless be readily marketable. Municipal
securities purchased for a fund are subject to the limitations on holdings of
securities which are not readily marketable based on whether it may be sold in
a reasonable time consistent with the customs of the municipal markets (usually
seven days) at a desirable price (or interest rate). A fund believes that the
quality standards applicable to its investments enhance marketability. In
addition, stand-by commitments, participation interests and demand obligations
also enhance marketability.
Provisions of the federal bankruptcy statutes relating to the adjustment of
debts of political subdivisions and authorities of states of the US provide
that, in certain circumstances, such subdivisions or authorities may be
authorized to initiate bankruptcy proceedings without prior notice to or
consent of creditors, which proceedings could result in material and adverse
modification or alteration of the rights of holders of obligations issued by
such subdivisions or authorities.
Litigation challenging the validity under state constitutions of present
systems of financing public education has been initiated or adjudicated in a
number of states, and legislation has been introduced to effect changes in
public school finances in some states. In other instances there has been
litigation challenging the issuance of pollution control revenue bonds or the
validity of their issuance under state or federal law which litigation could
ultimately affect the validity of those municipal securities or the tax-free
nature of the interest thereon.
In some cases, municipalities may issue bonds relying on proceeds from
litigation settlements. These bonds may be further secured by debt service
reserve funds established at the time the bonds were issued. Bonds that are
supported in whole or in part by expected litigation proceeds are subject to
the risk that part or all of the expected proceeds may not be received. For
example, a damage award could be overturned or reduced by a court, or the terms
of a settlement or damage award may allow for reduced or discontinued payments
if certain conditions are met. As a result, bonds that rely on proceeds from
litigation settlements are subject to an increased risk of nonpayment or
default.
Insured Municipal Securities. A fund may purchase municipal securities that are
insured under policies issued by certain insurance companies. Insured municipal
securities typically receive a higher credit rating which means that the issuer
of the securities pays a lower interest rate. In purchasing such insured
securities, the Advisor gives consideration both to the insurer and to the
credit quality of the underlying issuer. The insurance reduces the credit risk
for a particular municipal security by supplementing the creditworthiness of
the underlying bond and provides additional security for payment of the
principal and interest of a municipal security. Certain of the insurance
companies that provide insurance for municipal securities provide insurance for
other types of securities, including some involving subprime mortgages. The
value of subprime mortgage securities has declined recently and some may
default, increasing a bond insurer's risk of having to make payments to holders
of subprime mortgage securities. Because of this risk, the ratings of some
II-120
insurance companies have been, or may be, downgraded and it is possible that an
insurance company may become insolvent. If an insurance company's rating is
downgraded or the company becomes insolvent, the prices of municipal securities
insured by the insurance company may decline.
Letters of Credit. Municipal obligations, including certificates of
participation, commercial paper and other short-term obligations may be backed
by an irrevocable letter of credit of a bank which assumes the obligation for
payment of principal and interest in the event of default by the issuer.
Pre-Refunded Municipal Securities. Pre-refunded municipal securities are
subject to interest rate risk, market risk and limited liquidity. The principal
of and interest on municipal securities that have been pre-refunded are no
longer paid from the original revenue source for the securities. Instead, after
pre-refunding of the principal of and interest on these securities are
typically paid from an escrow fund consisting of obligations issued or
guaranteed by the US Government. The assets in the escrow fund are derived from
the proceeds of refunding bonds issued by the same issuer as the pre-refunded
municipal securities. Issuers of municipal securities use this advance
refunding technique to obtain more favorable terms with respect to securities
that are not yet subject to call or redemption by the issuer. For example,
advance refunding enables an issuer to refinance debt at lower market interest
rates, restructure debt to improve cash flow or eliminate restrictive covenants
in the indenture or other governing instrument for the pre-refunded municipal
securities. However, except for a change in the revenue source from which
principal and interest payments are made, the pre-refunded municipal securities
remain outstanding on their original terms until they mature or are redeemed by
the issuer. Pre-refunded municipal securities are usually purchased at a price
which represents a premium over their face value.
MUNICIPAL TRUST RECEIPTS. Municipal trust receipts (MTRs) are sometimes called
municipal asset-backed securities, floating rate trust certificates, or
municipal securities trust receipts. MTRs are typically structured by a bank,
broker-dealer or other financial institution by depositing municipal securities
into a trust or partnership, coupled with a conditional right to sell, or put,
the holder's interest in the underlying securities at par plus accrued interest
to a financial institution. MTRs may be issued as fixed or variable rate
instruments. These trusts are organized so that the purchaser of the MTR would
be considered to be investing for federal income tax purposes in the underlying
municipal securities. This structure is intended to allow the federal income
tax exempt status of interest generated by the underlying asset to pass through
to the purchaser. A fund's investments in MTRs are subject to similar risks as
other investments in municipal debt obligations, including interest rate risk,
credit risk, prepayment risk and security selection risk. Additionally,
investments in MTRs raise certain tax issues that may not be presented by
direct investments in municipal bonds. There is some risk that certain legal
issues could be resolved in a manner that could adversely impact the
performance of a fund. The Advisor expects that it would invest in MTRs for
which a legal opinion has been given to the effect that the income from an MTR
is tax-exempt for federal income tax purposes to the same extent as the
underlying bond(s), although it is possible that the IRS will take a different
position and there is a risk that the interest paid on such MTRs would be
deemed taxable.
OBLIGATIONS OF BANKS AND OTHER FINANCIAL INSTITUTIONS. A fund may invest in US
dollar-denominated fixed rate or variable rate obligations of US or foreign
financial institutions, including banks. Obligations of domestic and foreign
financial institutions in which a fund may invest include (but are not limited
to) certificates of deposit, bankers' acceptances, bank time deposits,
commercial paper, and other US dollar-denominated instruments issued or
supported by the credit of US or foreign financial institutions, including
banks.
Obligations of foreign branches of US banks and foreign banks may be general
obligations of the parent bank in addition to the issuing bank or may be
limited by the terms of a specific obligation and by government regulation. a
fund may invest in US dollar-denominated obligations of foreign banks or
foreign branches of US banks, which include banks located in the United
Kingdom, Grand Cayman Island, Nassau, Japan and Canada.
Investments in these obligations may entail risks that are different from those
of investments in obligations of US domestic banks because of differences in
political, regulatory and economic systems and conditions. These risks include
future political and economic developments, currency blockage, the possible
imposition of withholding taxes on interest payments, possible seizure or
nationalization of foreign deposits, difficulty or inability of pursuing legal
remedies and obtaining judgments in foreign courts, possible establishment of
exchange controls, or the adoption of other foreign
II-121
governmental restrictions that might affect adversely the payment of principal
and interest on bank obligations, and potentially limited liquidity. Foreign
branches of US banks and foreign banks may also be subject to less stringent
reserve requirements and to different accounting, auditing, reporting and
record keeping standards than those applicable to domestic branches of US banks
and may have limited information availability.
PARTICIPATION INTERESTS. A fund may purchase from financial institutions
participation interests in securities in which a fund may invest. A
participation interest gives a fund an undivided interest in the security in
the proportion that a fund's participation interest bears to the principal
amount of the security. These instruments may have fixed, floating or variable
interest rates. If the participation interest is unrated, or has been given a
rating below that which is permissible for purchase by a fund, the
participation interest will be backed by an irrevocable letter of credit or
guarantee of a bank, or the payment obligation otherwise will be collateralized
by US Government securities, or, in the case of unrated participation interest,
determined by the Advisor to be of comparable quality to those instruments in
which a fund may invest. For certain participation interests, a fund will have
the right to demand payment, on not more than seven days' notice, for all or
any part of a fund's participation interests in the security, plus accrued
interest. As to these instruments, a fund generally intends to exercise its
right to demand payment only upon a default under the terms of the security.
PREFERRED STOCK. Preferred stock is an equity security, but possesses certain
attributes of debt securities. Holders of preferred stock normally have the
right to receive dividends at a fixed rate when and as declared by the issuer's
board of directors, but do not otherwise participate in amounts available for
distribution by the issuing corporation. Dividends on preferred stock may be
cumulative, and, in such cases, all cumulative dividends usually must be paid
prior to dividend payments to common stockholders. Preferred stock has a
preference (i.e., ranks higher) in liquidation (and generally dividends) over
common stock, but is subordinated (i.e., ranks lower) in liquidation to fixed
income securities. Because of this preference, preferred stocks generally
entail less risk than common stocks. As a general rule, the market value of
preferred stocks with fixed dividend rates and no conversion rights moves
inversely with interest rates and perceived credit risk, with the price
determined by the dividend rate. Some preferred stocks are convertible into
other securities (e.g., common stock) at a fixed price and ratio or upon the
occurrence of certain events. The market price of convertible preferred stocks
generally reflects an element of conversion value. Because many preferred
stocks lack a fixed maturity date, these securities generally fluctuate
substantially in value when interest rates change; such fluctuations often
exceed those of long-term bonds of the same issuer. Some preferred stocks pay
an adjustable dividend that may be based on an index, formula, auction
procedure or other dividend rate reset mechanism. In the absence of credit
deterioration, adjustable rate preferred stocks tend to have more stable market
values than fixed rate preferred stocks.
All preferred stocks are also subject to the same types of credit risks as
corporate bonds. In addition, because preferred stock is subordinate to debt
securities and other obligations of an issuer, deterioration in the credit
rating of the issuer will cause greater changes in the value of a preferred
stock than in a more senior debt security with similar yield characteristics.
Preferred stocks may be rated by the Standard & Poor's Division of the
McGraw-Hill Companies (S&P) and Moody's Investors Service, Inc. (Moody's)
although there is no minimum rating which a preferred stock must have to be an
eligible investment for a fund.
PRIVATE ACTIVITY BONDS. Certain types of municipal securities, generally
referred to as industrial development bonds (and referred to under current tax
law as private activity bonds), are issued by or on behalf of public
authorities to obtain funds for privately-operated housing facilities, airport,
mass transit or port facilities, sewage disposal, solid waste disposal or
hazardous waste treatment or disposal facilities and certain local facilities
for water supply, gas or electricity. Other types of industrial development
bonds, the proceeds of which are used for the construction, equipment, repair
or improvement of privately operated industrial or commercial facilities, may
constitute municipal securities, although the current federal tax laws place
substantial limitations on the size of such issues. The interest from certain
private activity bonds owned by a fund (including a fund's distributions
attributable to such interest) may be a preference item for purposes of the
alternative minimum tax. The credit quality of such bonds depends upon the
ability of the user of the facilities financed by the bonds and any guarantor
to meet its financial obligations.
PRIVATIZED ENTERPRISES. A fund may invest in foreign securities which may
include securities issued by enterprises that have undergone or are currently
undergoing privatization. The governments of certain foreign countries have, to
varying degrees, embarked on privatization programs contemplating the sale of
all or part of their interests in state
II-122
enterprises. A fund's investments in the securities of privatized enterprises
may include privately negotiated investments in a government or state-owned or
controlled company or enterprise that has not yet conducted an initial equity
offering, investments in the initial offering of equity securities of a state
enterprise or former state enterprise and investments in the securities of a
state enterprise following its initial equity offering.
In certain jurisdictions, the ability of foreign entities, such as a fund, to
participate in privatizations may be limited by local law, or the price or
terms on which a fund may be able to participate may be less advantageous than
for local investors. Moreover, there can be no assurance that governments that
have embarked on privatization programs will continue to divest their ownership
of state enterprises, that proposed privatizations will be successful or that
governments will not re-nationalize enterprises that have been privatized.
In the case of the enterprises in which a fund may invest, large blocks of the
stock of those enterprises may be held by a small group of stockholders, even
after the initial equity offerings by those enterprises. The sale of some
portion or all of those blocks could have an adverse effect on the price of the
stock of any such enterprise.
Prior to making an initial equity offering, most state enterprises or former
state enterprises go through an internal reorganization of management. Such
reorganizations are made in an attempt to better enable these enterprises to
compete in the private sector. However, certain reorganizations could result in
a management team that does not function as well as an enterprise's prior
management and may have a negative effect on such enterprise. In addition, the
privatization of an enterprise by its government may occur over a number of
years, with the government continuing to hold a controlling position in the
enterprise even after the initial equity offering for the enterprise.
Prior to privatization, most of the state enterprises in which a fund may
invest enjoy the protection of and receive preferential treatment from the
respective sovereigns that own or control them. After making an initial equity
offering, these enterprises may no longer have such protection or receive such
preferential treatment and may become subject to market competition from which
they were previously protected. Some of these enterprises may not be able to
operate effectively in a competitive market and may suffer losses or experience
bankruptcy due to such competition.
PUT BONDS. A fund may invest in "put" bonds (including securities with variable
interest rates) that may be sold back to the issuer of the security at face
value at the option of the holder prior to their stated maturity. The option to
"put" the bond back to the issuer before the stated final maturity can cushion
the price decline of the bond in a rising interest rate environment. However,
the premium paid, if any, for an option to put will have the effect of reducing
the yield otherwise payable on the underlying security.
REAL ESTATE INVESTMENT TRUSTS (REITS). A REIT invests primarily in
income-producing real estate or makes loans to persons involved in the real
estate industry. REITs are sometimes informally categorized into equity REITs,
mortgage REITs and hybrid REITs. Equity REITs buy real estate and pay investors
income from the rents received from the real estate owned by the REIT and from
any profits on the sale of its properties. Mortgage REITs lend money to
building developers and other real estate companies and pay investors income
from the interest paid on those loans. Hybrid REITs engage in both owning real
estate and making loans. Investment in REITs may subject a fund to risks
associated with the direct ownership of real estate, such as decreases in real
estate values, delays in completion of construction, overbuilding, increased
competition and other risks related to local or general economic conditions,
increases in operating costs and property taxes, changes in zoning laws,
casualty or condemnation losses, possible environmental liabilities, regulatory
limitations on rent and fluctuations in rental income. Equity REITs generally
experience these risks directly through fee or leasehold interests, whereas
mortgage REITs generally experience these risks indirectly through mortgage
interests, unless the mortgage REIT forecloses on the underlying real estate.
Changes in interest rates may also affect the value of a fund's investment in
REITs. For instance, during periods of declining interest rates, certain
mortgage REITs may hold mortgages that the mortgagors elect to prepay, which
prepayment may diminish the yield on securities issued by those REITs.
Certain REITs have relatively small market capitalizations, which may tend to
increase the volatility of the market price of their securities. Furthermore,
REITs are dependent upon specialized management skills, have limited
diversification and are, therefore, subject to risks inherent in operating and
financing a limited number of projects. REITs are also subject to heavy cash
flow dependency, defaults by borrowers or lessees and the possibility of
failing to qualify for
II-123
tax-free pass-through of income under the Code, and to maintain exemption from
the registration requirements of the 1940 Act. By investing in REITs indirectly
through a fund, a shareholder will bear not only his or her proportionate share
of the expenses of a fund, but also, indirectly, similar expenses of the REITs.
In addition, REITs depend generally on their ability to generate cash flow to
make distributions to shareholders.
REPURCHASE AGREEMENTS. A fund may invest in repurchase agreements pursuant to
its investment guidelines. In a repurchase agreement, a fund acquires ownership
of a security (Obligation) and simultaneously commits to resell that security
to the seller, typically a bank or broker/dealer, at a specified time and
price.
A repurchase agreement provides a means for a fund to earn income on funds for
periods as short as overnight. The repurchase price may be higher than the
purchase price, the difference being income to a fund, or the purchase and
repurchase prices may be the same, with interest at a stated rate due to a fund
together with the repurchase price upon repurchase. In either case, the income
to a fund is unrelated to the interest rate on the Obligation itself.
Obligations will be held by the custodian or in the Federal Reserve Book Entry
System.
It is not clear whether a court would consider the Obligation purchased by a
fund subject to a repurchase agreement as being owned by a fund or as being
collateral for a loan by a fund to the seller. In the event of the commencement
of bankruptcy or insolvency proceedings with respect to the seller of the
Obligation before repurchase of the Obligation under a repurchase agreement, a
fund may encounter delay and incur costs before being able to sell the
security. Delays may involve loss of interest or decline in price of the
Obligation. If the court characterizes the transaction as a loan and a fund has
not perfected a security interest in the Obligation, a fund may be required to
return the Obligation to the seller's estate and be treated as an unsecured
creditor of the seller. As an unsecured creditor, a fund would be at risk of
losing some or all of the principal and income involved in the transaction. As
with any unsecured debt obligation purchased for a fund, the Advisor seeks to
reduce the risk of loss through repurchase agreements by analyzing the
creditworthiness of the obligor, in this case the seller of the Obligation.
Apart from the risk of bankruptcy or insolvency proceedings, there is also the
risk that the seller may fail to repurchase the Obligation, in which case a
fund may incur a loss if the proceeds to a fund of the sale to a third party
are less than the repurchase price. However, if the market value (including
interest) of the Obligation subject to the repurchase agreement becomes less
than the repurchase price (including interest), a fund will direct the seller
of the Obligation to deliver additional securities so that the market value
(including interest) of all securities subject to the repurchase agreement will
equal or exceed the repurchase price.
REVERSE REPURCHASE AGREEMENTS. A fund may enter into "reverse repurchase
agreements," which are repurchase agreements in which a fund, as the seller of
the securities, agrees to repurchase such securities at an agreed time and
price. Under a reverse repurchase agreement, a fund continues to receive any
principal and interest payments on the underlying security during the term of
the agreement. A fund segregates assets in an amount at least equal to its
obligation under outstanding reverse repurchase agreements. Such transactions
may increase fluctuations in the market value of fund assets and its yield.
SECURITIES AS A RESULT OF EXCHANGES OR WORKOUTS. Consistent with a fund's
investment objectives, policies and restrictions, a fund may hold various
instruments received in an exchange or workout of a distressed security (i.e.,
a low-rated debt security that is in default or at risk of becoming in
default). Such instruments may include, but are not limited to, equity
securities, warrants, rights, participation interests in sales of assets and
contingent-interest obligations.
SECURITIES WITH PUT RIGHTS. The right of a fund to exercise a put is
unconditional and unqualified. A put is not transferable by a fund, although a
fund may sell the underlying securities to a third party at any time. If
necessary and advisable, a fund may pay for certain puts either separately in
cash or by paying a higher price for portfolio securities that are acquired
subject to such a put (thus reducing the yield to maturity otherwise available
for the same securities).
The ability of a fund to exercise a put will depend on the ability of a
counterparty to pay for the underlying securities at the time the put is
exercised. In the event that a counterparty should default on its obligation to
repurchase an underlying security, a fund might be unable to recover all or a
portion of any loss sustained from having to sell the security elsewhere.
II-124
The acquisition of a put will not affect the valuation by a fund of the
underlying security. The actual put will be valued at zero in determining net
asset value of a fund. Where a fund pays directly or indirectly for a put, its
cost will be reflected in realized gain or loss when the put is exercised or
expires. If the value of the underlying security increases, the potential for
unrealized or realized gain is reduced by the cost of the put.
SHORT SALES. When a fund takes a long position, it purchases a stock outright.
When a fund takes a short position, it sells at the current market price a
stock it does not own but has borrowed in anticipation that the market price of
the stock will decline. To complete, or close out, the short sale transaction,
a fund buys the same stock in the market and returns it to the lender. The
price at such time may be more or less than the price at which the security was
sold by a fund. Until the security is replaced, a fund is required to pay the
lender amounts equal to any dividends or interest, which accrue during the
period of the loan. To borrow the security, a fund may also be required to pay
a premium, which would increase the cost of the security sold. The proceeds of
the short sale will be retained by the broker, to the extent necessary to meet
the margin requirements, until the short position is closed out. A fund makes
money when the market price of the borrowed stock goes down and a fund is able
to replace it for less than it earned by selling it short. Alternatively if the
price of the stock goes up after the short sale and before the short position
is closed, a fund will lose money because it will have to pay more to replace
the borrowed stock than it received when it sold the stock short.
A fund may not always be able to close out a short position at a particular
time or at an acceptable price. A lender may request that the borrowed
securities be returned to it on short notice, and a fund may have to buy the
borrowed securities at an unfavorable price. If this occurs at a time that
other short sellers of the same security also want to close out their
positions, a "short squeeze" can occur. A short squeeze occurs when demand is
greater than supply for the stock sold short. A short squeeze makes it more
likely that a fund will have to cover its short sale at an unfavorable price.
If that happens, a fund will lose some or all of the potential profit from, or
even incur a loss as a result of, the short sale.
Until a fund closes its short position or replaces the borrowed security, a
fund will designate liquid assets it owns (other than the short sales proceeds)
as segregated assets to the books of the broker and/or its custodian in an
amount equal to its obligation to purchase the securities sold short, as
required by the 1940 Act. The amount segregated in this manner will be
increased or decreased each business day equal to the change in market value of
a fund's obligation to purchase the security sold short. If the lending broker
requires a fund to deposit additional collateral (in addition to the short
sales proceeds that the broker holds during the period of the short sale),
which may be as much as 50% of the value of the securities sold short, the
amount of the additional collateral may be deducted in determining the amount
of cash or liquid assets a fund is required to segregate to cover the short
sale obligation pursuant to the 1940 Act. The amount segregated must be
unencumbered by any other obligation or claim than the obligation that is being
covered. A fund believes that short sale obligations that are covered, either
by an offsetting asset or right (acquiring the security sold short or having an
option to purchase the security sold short at exercise price that covers the
obligation), or by a fund's segregated asset procedures (or a combination
thereof), are not senior securities under the 1940 Act and are not subject to a
fund's borrowing restrictions. This requirement to segregate assets limits a
fund's leveraging of its investments and the related risk of losses from
leveraging. A fund also is required to pay the lender of the security any
dividends or interest that accrues on a borrowed security during the period of
the loan. Depending on the arrangements made with the broker or custodian, a
fund may or may not receive any payments (including interest) on collateral it
has deposited with the broker.
Short sales involve the risk that a fund will incur a loss by subsequently
buying a security at a higher price than the price at which a fund previously
sold the security short. Any loss will be increased by the amount of
compensation, interest or dividends, and transaction costs a fund must pay to a
lender of the security. In addition, because a fund's loss on a short sale
stems from increases in the value of the security sold short, the extent of
such loss, like the price of the security sold short, is theoretically
unlimited. By contrast, a fund's loss on a long position arises from decreases
in the value of the security held by a fund and therefore is limited by the
fact that a security's value cannot drop below zero.
The use of short sales, in effect, leverages a fund's portfolio, which could
increase a fund's exposure to the market, magnify losses and increase the
volatility of returns.
II-125
Although a fund's share price may increase if the securities in its long
portfolio increase in value more than the securities underlying its short
positions, a fund's share price may decrease if the securities underlying its
short positions increase in value more than the securities in its long
portfolio.
In addition, a fund's short selling strategies may limit its ability to fully
benefit from increases in the equity markets. Also, there is the risk that the
counterparty to a short sale may fail to honor its contractual terms, causing a
loss to a fund. The SEC and other (including non-U.S.) regulatory authorities
have imposed, and may in the future impose, restrictions on short selling,
either on a temporary or permanent basis, which may include placing limitations
on specific companies and/or industries with respect to which a fund may enter
into short positions. Any such restrictions may hinder a fund in, or prevent it
from, fully implementing its investment strategies, and may negatively affect
performance.
SHORT SALES AGAINST THE BOX. A fund may make short sales of common stocks if,
at all times when a short position is open, a fund owns the stock or owns
preferred stocks or debt securities convertible or exchangeable, without
payment of further consideration, into the shares of common stock sold short.
Short sales of this kind are referred to as short sales "against the box." The
broker/dealer that executes a short sale generally invests cash proceeds of the
sale until they are paid to a fund. Arrangements may be made with the
broker/dealer to obtain a portion of the interest earned by the broker on the
investment of short sale proceeds. A fund will segregate the common stock or
convertible or exchangeable preferred stock or debt securities in a special
account with the custodian. Uncertainty regarding the tax effects of short
sales of appreciated investments may limit the extent to which a fund may enter
into short sales against the box. A fund will incur transaction costs in
connection with short sales against the box.
SHORT-TERM SECURITIES. In order to meet anticipated redemptions, to hold
pending the purchase of additional securities for a fund's portfolio, or, in
some cases, for temporary defensive purposes, a fund may invest a portion (up
to 100%) of its assets in money market and other short-term securities. When a
fund is invested for temporary defensive purposes, it may not achieve or pursue
its investment objective.
Examples of short-term securities include:
o Securities issued or guaranteed by the US government and its agencies and
instrumentalities;
o Commercial paper;
o Certificates of deposit and euro dollar certificates of deposit;
o Bankers' acceptances;
o Short-term notes, bonds, debentures or other debt instruments; and
o Repurchase agreements.
SMALL COMPANIES. The Advisor believes that many small companies often may have
sales and earnings growth rates that exceed those of larger companies, and that
such growth rates may, in turn, be reflected in more rapid share price
appreciation over time. Investing in smaller company stocks, however, involves
greater risk than is customarily associated with investing in larger, more
established companies. For example, smaller companies can have limited product
lines, markets, or financial and managerial resources. Smaller companies may
also be dependent on one or a few key persons, and may be more susceptible to
losses and risks of bankruptcy. Also, the securities of smaller companies may
be thinly traded (and therefore have to be sold at a discount from current
market prices or sold in small lots over an extended period of time or their
stock values may fluctuate more sharply than other securities). Transaction
costs in smaller company stocks may be higher than those of larger companies.
SOVEREIGN DEBT. Investments in sovereign debt can involve a high degree of
risk. The governmental entity that controls the repayment of sovereign debt may
not be able or willing to repay the principal and/or interest when due in
accordance with the terms of such debt. A governmental entity's willingness or
ability to repay principal and interest due in a timely manner may be affected
by, among other factors, its cash flow situation, the extent of its foreign
reserves,
II-126
the availability of sufficient foreign exchange on the date a payment is due,
the relative size of the debt service burden to the economy as a whole, the
governmental entity's policy toward the International Monetary Fund, and the
political constraints to which a governmental entity may be subject.
Governmental entities may also be dependent on expected disbursements from
foreign governments, multilateral agencies and others abroad to reduce
principal and interest arrearages on their debt. The commitment on the part of
these governments, agencies and others to make such disbursements may be
conditioned on a governmental entity's implementation of economic reforms
and/or economic performance and the timely service of such debtor's
obligations. Failure to implement such reforms, achieve such levels of economic
performance or repay principal or interest when due may result in the
cancellation of such third parties' commitments to lend funds to the
governmental entity, which may further impair such debtor's ability or
willingness to service its debts in a timely manner. Consequently, governmental
entities may default on their sovereign debt. Holders of sovereign debt may be
requested to participate in the rescheduling of such debt and to extend further
loans to governmental entities. There is no reliable bankruptcy proceeding by
which sovereign debt on which governmental entities have defaulted may be
collected in whole or in part.
SPECIAL INFORMATION CONCERNING MASTER-FEEDER FUND STRUCTURE. Unlike other
open-end management investment companies (mutual funds) which directly acquire
and manage their own portfolio securities, a fund seeks to achieve its
investment objective by investing substantially all of its assets in a master
portfolio (Portfolio), a separate registered investment company with the same
investment objective as a fund. Therefore, an investor's interest in the
Portfolio's securities is indirect. In addition to selling a beneficial
interest to a fund, the Portfolio may sell beneficial interests to other mutual
funds, investment vehicles or institutional investors. Such investors will
invest in the Portfolio on the same terms and conditions and will pay a
proportionate share of the Portfolio's expenses. However, the other investors
investing in the Portfolio are not required to sell their shares at the same
public offering price as a fund due to variations in sales commissions and
other operating expenses. Therefore, investors in a fund should be aware that
these differences may result in differences in returns experienced by investors
in the different funds that invest in the Portfolio. Such differences in
returns are also present in other mutual fund structures.
Smaller funds investing in the Portfolio may be materially affected by the
actions of larger funds investing in the Portfolio. For example, if a large
fund withdraws from the Portfolio, the remaining funds may experience higher
pro rata operating expenses, thereby producing lower returns (however, this
possibility exists as well for traditionally structured funds which have large
institutional investors). Also, the Portfolio may be required to sell
investments at a price or time not advantageous to the Portfolio in order to
meet such a redemption. Additionally, the Portfolio may become less diverse,
resulting in increased portfolio risk. Also, funds with a greater pro rata
ownership in the Portfolio could have effective voting control of the
operations of the Portfolio. Except as permitted by the SEC, whenever a fund is
requested to vote on matters pertaining to the Portfolio, a fund will hold a
meeting of shareholders of a fund and will cast all of its votes in the same
proportion as the votes of a fund's shareholders.
Certain changes in the Portfolio's investment objectives, policies or
restrictions may require a fund to withdraw its interest in the Portfolio. Any
such withdrawal could result in a distribution "in kind" of portfolio
securities (as opposed to a cash distribution from the Portfolio). If
securities are distributed, a fund could incur brokerage, tax or other charges
in converting the securities to cash. In addition, the distribution in kind may
result in a less diversified portfolio of investments or adversely affect the
liquidity of a fund. Notwithstanding the above, there are other means for
meeting redemption requests, such as borrowing.
A fund may withdraw its investment from the Portfolio at any time, if the Board
determines that it is in the best interests of the shareholders of a fund to do
so. Upon any such withdrawal, the Board would consider what action might be
taken, including the investment of all the assets of a fund in another pooled
investment entity having the same investment objective as a fund or the
retaining of an investment advisor to manage a fund's assets in accordance with
the investment policies described herein with respect to the Portfolio.
STAND-BY COMMITMENTS. A stand-by commitment is a right acquired by a fund, when
it purchases a municipal obligation from a broker, dealer or other financial
institution (seller), to sell up to the same principal amount of such
securities back to the seller, at a fund's option, at a specified price.
Stand-by commitments are also known as "puts." The exercise by a fund of a
stand-by commitment is subject to the ability of the other party to fulfill its
contractual commitment.
II-127
Stand-by commitments acquired by a fund may have the following features: (1)
they will be in writing and will be physically held by a fund's custodian; (2)
a fund's right to exercise them will be unconditional and unqualified; (3) they
will be entered into only with sellers which in the Advisor's opinion present a
minimal risk of default; (4) although stand-by commitments will not be
transferable, municipal obligations purchased subject to such commitments may
be sold to a third party at any time, even though the commitment is
outstanding; and (5) their exercise price will be (i) a fund's acquisition cost
(excluding any accrued interest which a fund paid on their acquisition), less
any amortized market premium or plus any amortized original issue discount
during the period a fund owned the securities, plus (ii) all interest accrued
on the securities since the last interest payment date.
A fund expects that stand-by commitments generally will be available without
the payment of any direct or indirect consideration. However, if necessary or
advisable, a fund will pay for stand-by commitments, either separately in cash
or by paying a higher price for portfolio securities which are acquired subject
to the commitments.
It is difficult to evaluate the likelihood of use or the potential benefit of a
stand-by commitment. Therefore, it is expected that the Advisor will determine
that stand-by commitments ordinarily have a "fair value" of zero, regardless of
whether any direct or indirect consideration was paid. However, if the market
price of the security subject to the stand-by commitment is less than the
exercise price of the stand-by commitment, such security will ordinarily be
valued at such exercise price. Where a fund has paid for a stand-by commitment,
its cost will be reflected as unrealized depreciation for the period during
which the commitment is held.
The IRS has issued a favorable revenue ruling to the effect that, under
specified circumstances, a regulated investment company will be the owner of
tax-exempt municipal obligations acquired subject to a put option. The IRS has
also issued private letter rulings to certain taxpayers (which do not serve as
precedent for other taxpayers) to the effect that tax-exempt interest received
by a regulated investment company with respect to such obligations will be
tax-exempt in the hands of the company and may be distributed to its
shareholders as exempt-interest dividends. The IRS has subsequently announced
that it will not ordinarily issue advance ruling letters as to the identity of
the true owner of property in cases involving the sale of securities or
participation interests therein if the purchaser has the right to cause the
security, or the participation interest therein, to be purchased by either the
seller or a third party. A fund intends to take the position that it owns any
municipal obligations acquired subject to a stand-by commitment and that
tax-exempt interest earned with respect to such municipal obligations will be
tax-exempt in its hands. There is no assurance that the IRS will agree with
such position in any particular case.
SUBSIDIARY COMPANIES. A fund may gain exposure to the commodity markets in part
by investing a portion of a fund's assets in a wholly-owned subsidiary
(Subsidiary). Investments in a Subsidiary are expected to provide exposure to
the commodity markets within the limitations of Subchapter M of the Internal
Revenue Code and recent IRS revenue rulings (see Taxes in Appendix II-J of this
SAI). A fund's Subsidiaries are companies organized under the laws of the
Cayman Islands, and are overseen by their own board of directors.
Among other investments, the Subsidiaries are expected to invest in
commodity-linked derivative instruments, such as swaps and futures. The
Subsidiaries will also invest in fixed income instruments, cash, cash
equivalents and affiliated money market funds. In monitoring compliance with
its investment restrictions, a fund will consider the assets of its Subsidiary
to be assets of the fund. A Subsidiary must, however, comply with the asset
segregation requirements (described elsewhere in this SAI) with respect its
investments in commodity-linked derivatives.
To the extent that a fund invests in its Subsidiary, a fund may be subject to
the risks associated with those derivative instruments and other securities,
which are discussed elsewhere in a fund's prospectuses and this SAI. While the
Subsidiaries may be considered similar to investment companies, they are not
registered under the 1940 Act and are not subject to all of the investor
protections of the 1940 Act and other US regulations. Changes in the laws of
the US or the Cayman Islands could result in the inability of a fund or a
Subsidiary to operate as intended, and could negatively affect a fund and its
shareholders.
In order to qualify for the special tax treatment accorded regulated investment
companies and their shareholders, a fund must, among other things, satisfy
several diversification requirements, including the requirement that not more
than 25% of the value of the fund's total assets may be invested in the
securities (other than those of the US government
II-128
or other regulated investment companies) of any one issuer or of two or more
issuers which the fund controls and which are engaged in the same, similar or
related trades or businesses. Therefore, so long as a fund is subject to this
limit, the fund may not invest any more than 25% of the value of its assets in
a Subsidiary. Absent this diversification requirement, a fund would be
permitted to invest more than 25% of the value of its assets in a Subsidiary.
TAX-EXEMPT COMMERCIAL PAPER. Issues of tax-exempt commercial paper typically
represent short-term, unsecured, negotiable promissory notes. These obligations
are issued by state and local governments and their agencies to finance working
capital needs of municipalities or to provide interim construction financing
and are paid from general revenues of municipalities or are refinanced with
long-term debt. In most cases, tax-exempt commercial paper is backed by letters
of credit, lending agreements, note repurchase agreements or other credit
facility agreements offered by banks or other institutions.
TAX-EXEMPT CUSTODIAL RECEIPTS. Tax-exempt custodial receipts (Receipts)
evidence ownership in an underlying bond that is deposited with a custodian for
safekeeping. Holders of the Receipts receive all payments of principal and
interest when paid on the bonds. Receipts can be purchased in an offering or
from a counterparty (typically an investment bank). To the extent that any
Receipt is illiquid, it is subject to a fund's limit on illiquid securities.
TAX-EXEMPT PASS-THROUGH SECURITIES. Tax exempt pass-through certificates
represent an interest in a pool or group of fixed-rate long-term debt
obligations issued by or on behalf of primarily not-for-profit institutions,
the interest on which is exempt from federal income taxation, including
alternative minimum taxation. Such fixed-rate long-term debt obligations may be
private activity bonds issued by states, municipalities or public authorities
to provide funds, usually through a loan or lease arrangement, to a non-profit
corporation for the purpose of financing or refinancing the construction or
improvement of a facility to be used by the non-profit corporation.
Distributions on tax exempt pass-through certificates may be adversely affected
by defaults in or prepayment of the underlying debt obligations. Certain tax
exempt pass-through certificates are issued in several classes with different
levels of yields and credit protection. A fund may invest in lower classes of
tax exempt pass-through certificates that have less credit protection. Tax
exempt pass-through certificates have limited liquidity and certain transfer
restrictions may apply. There currently is no trading market for tax exempt
pass-through certificates and there can be no assurance that such a market will
develop.
TO BE ANNOUNCED (TBA) PURCHASE COMMITMENTS. Similar to When-Issued or
Delayed-Delivery securities, a TBA purchase commitment is a security that is
purchased or sold for a fixed price with the underlying securities to be
announced at a future date. However, the seller does not specify the particular
securities to be delivered. Instead, a fund agrees to accept any securities
that meets the specified terms. For example, in a TBA mortgage-backed
transaction, a fund and seller would agree upon the issuer, interest rate and
terms of the underlying mortgages, but the seller would not identify the
specific underlying security until it issues the security. T
BA purchase commitments involve a risk of loss if the value of the underlying
security to be purchased declines prior to delivery date. The yield obtained
for such securities may be higher or lower than yields available in the market
on delivery date. Unsettled TBA purchase commitments are valued at the current
market value of the underlying securities.
THIRD PARTY PUTS. A fund may purchase long-term fixed rate bonds that have been
coupled with an option granted by a third party financial institution allowing
a fund at specified intervals to tender (put) the bonds to the institution and
receive the face value thereof (plus accrued interest). These third party puts
are available in several different forms, may be represented by custodial
receipts or trust certificates and may be combined with other features such as
interest rate swaps. A fund receives a short-term rate of interest (which is
periodically reset), and the interest rate differential between that rate and
the fixed rate on the bond is retained by the financial institution. The
financial institution granting the option does not provide credit enhancement,
and in the event that there is a default in the payment of principal or
interest, or downgrading of a bond to below investment grade, or a loss of the
bond's tax-exempt status, the put option will terminate automatically. As a
result, a fund would be subject to the risks associated with holding such a
long-term bond and the weighted average maturity of that fund's portfolio would
be adversely affected.
These bonds coupled with puts may present the same tax issues as are associated
with Stand-By Commitments. As with any Stand-By Commitments acquired by a fund,
a fund intends to take the position that it is the owner of any municipal
obligation acquired subject to a third-party put, and that tax-exempt interest
earned with respect to
II-129
such municipal obligations will be tax-exempt in its hands. There is no
assurance that the IRS will agree with such position in any particular case.
Additionally, the federal income tax treatment of certain other aspects of
these investments, including the treatment of tender fees and swap payments, in
relation to various regulated investment company tax provisions is unclear.
However, the Advisor seeks to manage a fund's portfolio in a manner designed to
minimize any adverse impact from these investments.
TRUST PREFERRED SECURITIES. A fund may invest in Trust Preferred Securities,
which are hybrid instruments issued by a special purpose trust (Special Trust),
the entire equity interest of which is owned by a single issuer. The proceeds
of the issuance to a fund of Trust Preferred Securities are typically used to
purchase a junior subordinated debenture, and distributions from the Special
Trust are funded by the payments of principal and interest on the subordinated
debenture.
If payments on the underlying junior subordinated debentures held by the
Special Trust are deferred by the debenture issuer, the debentures would be
treated as original issue discount (OID) obligations for the remainder of their
term. As a result, holders of Trust Preferred Securities, such as a fund, would
be required to accrue daily for federal income tax purposes their share of the
stated interest and the de minimis OID on the debentures (regardless of whether
a fund receives any cash distributions from the Special Trust), and the value
of Trust Preferred Securities would likely be negatively affected. Interest
payments on the underlying junior subordinated debentures typically may only be
deferred if dividends are suspended on both common and preferred stock of the
issuer. The underlying junior subordinated debentures generally rank slightly
higher in terms of payment priority than both common and preferred securities
of the issuer, but rank below other subordinated debentures and debt
securities. Trust Preferred Securities may be subject to mandatory prepayment
under certain circumstances. The market values of Trust Preferred Securities
may be more volatile than those of conventional debt securities. Trust
Preferred Securities may be issued in reliance on Rule 144A under the 1933 Act,
and, unless and until registered, are restricted securities. There can be no
assurance as to the liquidity of Trust Preferred Securities and the ability of
holders of Trust Preferred Securities, such as a fund, to sell their holdings.
US GOVERNMENT SECURITIES. A fund may invest in obligations issued or guaranteed
as to both principal and interest by the US Government, its agencies,
instrumentalities or sponsored enterprises which include (a) direct obligations
of the US Treasury, and (b) securities issued or guaranteed by US Government
agencies.
Examples of direct obligations of the US Treasury are Treasury bills, notes,
bonds and other debt securities issued by the US Treasury. These instruments
are backed by the "full faith and credit" of the United States. They differ
primarily in interest rates, the length of maturities and the dates of
issuance. Treasury bills have original maturities of one year or less. Treasury
notes have original maturities of one to ten years and Treasury bonds generally
have original maturities of greater than ten years.
Some agency securities are backed by the full faith and credit of the United
States (such as Maritime Administration Title XI Ship Financing Bonds and
Agency for International Development Housing Guarantee Program Bonds) and
others are backed only by the rights of the issuer to borrow from the US
Treasury (such as Federal Home Loan Bank Bonds and Federal National Mortgage
Association Bonds), while still others, such as the securities of the Federal
Farm Credit Bank, are supported only by the credit of the issuer. With respect
to securities supported only by the credit of the issuing agency or by an
additional line of credit with the US Treasury, there is no guarantee that the
US Government will provide support to such agencies and such securities may
involve risk of loss of principal and interest.
US Government securities may include "zero coupon" securities that have been
stripped by the US Government of their unmatured interest coupons and
collateralized obligations issued or guaranteed by a US Government agency or
instrumentality. Because interest on zero coupon securities is not distributed
on a current basis but is, in effect, compounded, zero coupon securities tend
to be subject to greater risk than interest-paying securities of similar
maturities.
Interest rates on US Government securities may be fixed or variable. Interest
rates on variable rate obligations are adjusted at regular intervals, at least
annually, according to a formula reflecting then current specified standard
rates, such as 91-day US Treasury bill rates. These adjustments generally tend
to reduce fluctuations in the market value of the securities.
II-130
The government guarantee of the US Government securities in a fund's portfolio
does not guarantee the net asset value of the shares of a fund. There are
market risks inherent in all investments in securities and the value of an
investment in a fund will fluctuate over time. Normally, the value of
investments in US Government securities varies inversely with changes in
interest rates. For example, as interest rates rise the value of investments in
US Government securities will tend to decline, and as interest rates fall the
value of a fund's investments in US Government securities will tend to
increase. In addition, the potential for appreciation in the event of a decline
in interest rates may be limited or negated by increased principal prepayments
with respect to certain mortgage-backed securities, such as GNMA Certificates.
Prepayments of high interest rate mortgage-backed securities during times of
declining interest rates will tend to lower the return of a fund and may even
result in losses to a fund if some securities were acquired at a premium.
Moreover, during periods of rising interest rates, prepayments of
mortgage-backed securities may decline, resulting in the extension of a fund's
average portfolio maturity. As a result, a fund's portfolio may experience
greater volatility during periods of rising interest rates than under normal
market conditions.
VARIABLE AND FLOATING RATE INSTRUMENTS. Debt instruments purchased by a fund
may be structured to have variable or floating interest rates. The interest
rate on variable and floating rate securities may be reset daily, weekly or on
some other reset period and may have a floor or ceiling on interest rate
changes. The interest rate of variable rate securities ordinarily is determined
by reference to or is a percentage of an objective standard such as a bank's
prime rate, the 90-day US Treasury Bill rate, or the rate of return on
commercial paper or bank certificates of deposit. Generally, the changes in the
interest rate on variable rate securities reduce the fluctuation in the market
value of such securities. Accordingly, as interest rates decrease or increase,
the potential for capital appreciation or depreciation is less than for
fixed-rate obligations. A fund may purchase variable rate securities on which
stated minimum or maximum rates, or maximum rates set by state law, limit the
degree to which interest on such instruments may fluctuate; to the extent it
does, increases or decreases in value of such instruments may be somewhat
greater than would be the case without such limits. Because the adjustment of
interest rates on the variable rate securities is made in relation to movements
of the applicable rate adjustment index, the instruments are not comparable to
long-term fixed interest rate securities. Accordingly, interest rates on the
variable rate securities may be higher or lower than current market rates for
fixed rate obligations of comparable quality with similar final maturities. A
money market fund determines the maturity of variable rate securities in
accordance with Rule 2a-7, which allows a fund to consider certain of such
instruments as having maturities shorter than the maturity date on the face of
the instrument.
The Advisor will consider the earning power, cash flows and other liquidity
ratios of the issuers and guarantors of such instruments and, if the instrument
is subject to a demand feature (described below), will continuously monitor the
issuer's financial ability to meet payment on demand. Where necessary to ensure
that a variable or floating rate instrument is equivalent to the quality
standards applicable to a fund's fixed income investments, the issuer's
obligation to pay the principal of the instrument will be backed by an
unconditional bank letter or line of credit, guarantee or commitment to lend.
Any bank providing such a bank letter, line of credit, guarantee or loan
commitment will meet a fund's investment quality standards relating to
investments in bank obligations. The Advisor will also monitor the
creditworthiness of issuers of such instruments to determine whether a fund
should continue to hold the investments.
The absence of an active secondary market for certain variable and floating
rate notes could make it difficult to dispose of the instruments, and a fund
could suffer a loss if the issuer defaults or during periods in which a fund is
not entitled to exercise its demand rights. When a reliable trading market for
the variable and floating rate instruments held by a fund does not exist and a
fund may not demand payment of the principal amount of such instruments within
seven days, the instruments will be subject to a fund's limitation on
investments in illiquid securities.
Variable Rate Demand Securities. A fund may purchase variable rate demand
securities, which are variable rate securities that permit a fund to demand
payment of the unpaid principal balance plus accrued interest upon a specified
number of days' notice to the issuer or its agent. The demand feature may be
backed by a bank letter of credit or guarantee issued with respect to such
instrument. A bank that issues a repurchase commitment may receive a fee from a
fund for this arrangement. The issuer of a variable rate demand security may
have a corresponding right to prepay in its discretion the outstanding
principal of the instrument plus accrued interest upon notice comparable to
that required for the holder to demand payment.
II-131
Variable Rate Master Demand Notes. A fund may purchase variable rate master
demand notes, which are unsecured instruments that permit the indebtedness
thereunder to vary and provide for periodic adjustments in the interest rate.
Because variable rate master demand notes are direct lending arrangements
between a fund and the issuer, they are not ordinarily traded. Although no
active secondary market may exist for these notes, a fund will purchase only
those notes under which it may demand and receive payment of principal and
accrued interest daily or may resell the note at any time to a third party.
These notes are not typically rated by credit rating agencies.
WARRANTS. The holder of a warrant has the right, until the warrant expires, to
purchase a given number of shares of a particular issuer at a specified price.
Such investments can provide a greater potential for profit or loss than an
equivalent investment in the underlying security. Prices of warrants do not
necessarily move, however, in tandem with the prices of the underlying
securities and are, therefore, considered speculative investments. Warrants pay
no dividends and confer no rights other than a purchase option. Thus, if a
warrant held by a fund were not exercised by the date of its expiration, a fund
would lose the entire purchase price of the warrant.
WHEN-ISSUED AND DELAYED-DELIVERY SECURITIES. A fund may purchase securities on
a when-issued or delayed-delivery basis. Delivery of and payment for these
securities can take place a month or more after the date of the purchase
commitment. The payment obligation and the interest rate that will be received
on when-issued and delayed-delivery securities are fixed at the time the buyer
enters into the commitment. Due to fluctuations in the value of securities
purchased or sold on a when-issued or delayed-delivery basis, the yields
obtained on such securities may be higher or lower than the yields available in
the market on the dates when the investments are actually delivered to the
buyers. When-issued securities may include securities purchased on a "when, as
and if issued" basis, under which the issuance of the security depends on the
occurrence of a subsequent event, such as approval of a merger, corporate
reorganization or debt restructuring. The value of such securities is subject
to market fluctuation during this period and no interest or income, as
applicable, accrues to a fund until settlement takes place.
At the time a fund makes the commitment to purchase securities on a when-issued
or delayed delivery basis, it will record the transaction, reflect the value
each day of such securities in determining its net asset value and, if
applicable, calculate the maturity for the purposes of average maturity from
that date. At the time of settlement a when-issued security may be valued at
less than the purchase price. To facilitate such acquisitions, a fund
identifies on its books cash or liquid assets in an amount at least equal to
such commitments. It may be expected that a fund's net assets will fluctuate to
a greater degree when it sets aside portfolio securities to cover such purchase
commitments than when it sets aside cash. On delivery dates for such
transactions, a fund will meet its obligations from maturities or sales of the
segregated securities and/or from cash flow. If a fund chooses to dispose of
the right to acquire a when-issued security prior to its acquisition, it could,
as with the disposition of any other portfolio obligation, incur a gain or loss
due to market fluctuation. When a fund engages in when-issued or
delayed-delivery transactions, it relies on the other party to consummate the
trade and is, therefore, exposed to counterparty risk. Failure of the seller to
do so may result in a fund's incurring a loss or missing an opportunity to
obtain a price considered to be advantageous.
YANKEE BONDS. Yankee Bonds are US dollar-denominated bonds sold in the US by
non-US issuers. As compared with bonds issued in the US, such bond issues
normally pay interest but are less actively traded. Investing in the securities
of foreign companies involves more risks than investing in securities of US
companies. Their value is subject to economic and political developments in the
countries where the companies operate and to changes in foreign currency
values. Values may also be affected by foreign tax laws, changes in foreign
economic or monetary policies, exchange control regulations and regulations
involving prohibitions on the repatriation of foreign currencies. In many
foreign countries, there is less publicly available information about foreign
issuers, and there is less government regulation and supervision of foreign
stock exchanges, brokers and listed companies. Also in many foreign countries,
companies are not subject to uniform accounting, auditing, and financial
reporting standards comparable to those applicable to domestic issuers.
Security trading practices and custody arrangements abroad may offer less
protection to a fund's investments and there may be difficulty in enforcing
legal rights outside the United States. Settlement of transactions in some
foreign markets may be delayed or may be less frequent than in the United
States which could affect the liquidity of a fund's portfolio. Additionally, in
some foreign countries, there is the possibility of expropriation or
confiscatory taxation, limitations on the removal of securities, property, or
other fund assets, political or social instability or diplomatic developments
which could affect investments in foreign securities. In addition, the relative
performance of various countries' fixed
II-132
income markets historically has reflected wide variations relating to the
unique characteristics of each country's economy. Year-to-year fluctuations in
certain markets have been significant, and negative returns have been
experienced in various markets from time to time.
YIELDS AND RATINGS. The yields on certain obligations in which a fund may
invest (such as commercial paper and bank obligations), are dependent on a
variety of factors, including general market conditions, conditions in the
particular market for the obligation, the financial condition of the issuer,
the size of the offering, the maturity of the obligation and the ratings of the
issue. The ratings of Moody's Investors Service (Moody's), the Standard &
Poor's (S&P) Division of The McGraw-Hill Companies and Fitch Ratings, Inc.
(Fitch) represent their opinions as to the quality of the securities that they
undertake to rate. Ratings, however, are general and are not absolute standards
of quality or value. Consequently, obligations with the same rating, maturity
and interest rate may have different market prices. See Appendix A for a
description of the ratings provided by certain recognized rating organizations.
ZERO COUPON SECURITIES AND DEFERRED INTEREST BONDS. A fund may invest in zero
coupon securities that are "stripped" US Treasury notes and bonds and in
deferred interest bonds. Zero coupon securities are the separate income or
principal components of a debt instrument. Zero coupon and deferred interest
bonds are debt obligations which are issued at a significant discount from face
value. The original discount approximates the total amount of interest the
bonds will accrue and compound over the period until maturity or the first
interest accrual date at a rate of interest reflecting the market rate of the
security at the time of issuance. Zero coupon securities are redeemed at face
value at their maturity date without interim cash payments of interest or
principal. The amount of this discount is accrued over the life of the
security, and the accrual constitutes the income earned on the security for
both accounting and federal income tax purposes. Because of these features, the
market prices of zero coupon securities are generally more volatile than the
market prices of securities that have similar maturity but that pay interest
periodically.
While zero coupon bonds do not require the periodic payment of interest,
deferred interest bonds generally provide for a period of delay before the
regular payment of interest begins. Although this period of delay is different
for each deferred interest bond, a typical period is approximately one-third of
the bond's term to maturity. Such investments benefit the issuer by mitigating
its initial need for cash to meet debt service, but some also provide a higher
rate of return to attract investors who are willing to defer receipt of such
cash.
A fund will accrue income on such investments for tax and accounting purposes,
as required, which will generally be prior to the receipt of the corresponding
cash payments. Because a fund is required to distribute to shareholders
substantially all of its net investment income, including such accrued income,
to avoid federal income and excise taxes, a fund may be required to liquidate
other portfolio securities to satisfy a fund's distribution obligations
(including at a time when it may not be advantageous to do so). Under many
market conditions, investments in zero coupon, step-coupon and pay-in-kind
securities may be illiquid, making it difficult for a fund to dispose of them
or to determine their current value.
II-133
PART II: APPENDIX II-H - TAXES
TAXES
The following is intended to be a general summary of certain federal income tax
consequences of investing in a fund. It is not intended as a complete
discussion of all such consequences, nor does it purport to deal with all
categories of investors, some of which may be subject to special tax rules.
Current and prospective investors are therefore advised to consult with their
tax advisors before making an investment in a fund. This summary is based on
the laws in effect on the date of this SAI and on existing judicial and
administrative interpretations thereof, all of which are subject to change,
possibly with retroactive effect.
Feeder Funds. Certain funds (Feeder Funds) invest all or substantially all of
their assets in either the DWS Equity 500 Index Portfolio or the Cash
Management Portfolio (each, a Master Portfolio), which are partnerships for US
income tax purposes. For a discussion of the US federal income tax treatment of
a Master Portfolio, please see the registration statement for that Master
Portfolio. The amount and character of a Feeder Fund's income, gains, losses,
deductions and other tax items will generally be determined at the Master
Portfolio level and the Feeder Fund will be allocated, and is required to take
into account, its share of its Master Portfolio's income, gains, losses and
other tax items. Consequently, references herein to a fund's income, gains,
losses and other tax items, as well as its activities, investment and holdings,
as applied to a Feeder Fund, generally include the tax items, activities,
investments and holdings realized, recognized, conducted or held, as
applicable, either by the Feeder Fund directly or through its Master Portfolio.
See "Investments in the Master Portfolios" for more information.
TAXATION OF A FUND AND ITS INVESTMENTS
QUALIFICATION AS A REGULATED INVESTMENT COMPANY. A fund has elected (or in the
case of a new fund, intends to elect) to be treated, and intends to qualify
each year, as a regulated investment company under Subchapter M of the Code. If
a fund qualifies for treatment as a regulated investment company that is
accorded special tax treatment, such fund will not be subject to federal income
tax on income distributed in a timely manner to its shareholders in the form of
dividends (including Capital Gain Dividends, as defined below). In order to
qualify for the special tax treatment accorded regulated investment companies
and their shareholders under the Code, a fund must, among other things:
(a) derive at least 90% of its gross income from (i) dividends, interest,
payments with respect to certain securities loans, gains from the sale or other
disposition of stock, securities or foreign currencies, or other income
(including but not limited to gains from options, futures, or forward
contracts) derived with respect to its business of investing in such stock,
securities, or currencies and (ii) net income derived from interests in
"qualified publicly traded partnerships" (as defined below);
(b) diversify its holdings so that, at the end of each quarter of its taxable
year, (i) at least 50% of the market value of its total assets are represented
by cash and cash items, US Government securities, securities of other regulated
investment companies, and other securities limited in respect of any one issuer
to a value not greater than 5% of the value of a fund's total assets and not
more than 10% of the outstanding voting securities of such issuer, and (ii) not
more than 25% of the value of its assets are invested (x) in the securities
(other than those of the US Government or other regulated investment companies)
of any one issuer or of two or more issuers which the fund controls and which
are engaged in the same, similar, or related trades or businesses, or (y) in
the securities of one or more qualified publicly traded partnerships (as
defined below); and
(c) distribute with respect to each taxable year at least 90% of the sum of its
investment company taxable income (as that term is defined in the Code without
regard to the deduction for dividends paid; investment company taxable income
generally consists of taxable ordinary income and the excess, if any, of net
short-term capital gains over net long-term capital losses) and net tax-exempt
interest income, if any, for such year.
In general, for purposes of the 90% gross income requirement described in
paragraph (a) above, income derived from a partnership will be treated as
qualifying income only to the extent such income is attributable to items of
income of the partnership which would be qualifying income if realized directly
by a fund. However, 100% of net income
II-134
derived from an interest in a "qualified publicly traded partnership"
(generally, a partnership (x) the interests in which are traded on an
established securities market or readily tradable on a secondary market or the
substantial equivalent thereof, and (y) that derives less than 90% of its
income from the qualifying income described in paragraph (a)(i) above) will be
treated as qualifying income. In general, "qualified publicly traded
partnerships" in which a fund will invest will be treated as partnerships for
federal income tax purposes because they meet the passive income requirement
under Code section 7704(c)(2).
For purposes of the diversification test in paragraph (b) above, the term
"outstanding voting securities of such issuer" will include the equity
securities of a qualified publicly traded partnership. It is possible that
certain partnerships in which a fund may invest could be qualified publicly
traded partnerships and, therefore, the extent to which a fund may invest in
such partnerships, including master limited partnerships, is limited by its
intention to qualify as a regulated investment company under the Code. In
addition, although the passive loss rules of the Code do not generally apply to
regulated investment companies, such rules do apply to a regulated investment
company with respect to items attributable to an interest in a qualified
publicly traded partnership. Fund investments in partnerships, including in
qualified publicly traded partnerships, may result in a fund being subject to
state, local or foreign income, franchise or withholding taxes.
Pursuant to current Internal Revenue Service (IRS) guidance, a Feeder Fund
investing in a Master Portfolio will be treated as holding directly the
underlying assets of the Master Portfolio for purposes of the diversification
test in (b) above.
In addition, for purposes of the diversification test in paragraph (b) above,
the identification of the issuer (or, in some cases, issuers) of a particular
fund investment can depend on the terms and conditions of that investment. In
some cases, identification of the issuer (or issuers) is uncertain under
current law, and an adverse determination or future guidance by the IRS with
respect to issuer identification for a particular type of investment may
adversely affect a fund's ability to meet the diversification test in paragraph
(b) above.
FAILURE TO QUALIFY AS A REGULATED INVESTMENT COMPANY. If for any taxable year a
fund were to fail to qualify for the special federal income tax treatment
accorded regulated investment companies, all of its taxable income would be
subject to federal income tax at regular corporate rates (without any deduction
for distributions to its shareholders), and all distributions from earnings and
profits, including any distributions of net tax-exempt income and net long-term
capital gains, would be taxable to shareholders as ordinary income. Some
portions of such distributions, however, could be eligible (i) to be treated as
qualified dividend income in the case of shareholders taxed as individuals and
other noncorporate shareholders and (ii) for the dividends-received deduction
in the case of corporate shareholders. In addition, a fund could be required to
recognize unrealized gains, pay substantial taxes and interest and make
substantial distributions before requalifying as a regulated investment company
that is accorded special federal income tax treatment.
A fund is subject to a 4% nondeductible excise tax on amounts that have been
retained rather than distributed, as required, under a prescribed formula. The
formula requires payment to shareholders during a calendar year of
distributions representing at least 98% of a fund's taxable ordinary income for
the calendar year and at least 98% of the excess of its capital gains over
capital losses realized during the one-year period ending October 31 of such
year (or the last day of a fund's taxable year if a fund's taxable year ends in
November or December and a fund makes an election to use such later date), as
well as amounts that were neither distributed by nor taxed to a fund during the
prior calendar year. For this purpose, a fund will be treated as having
distributed any ordinary income or capital gain net income on which it has been
subject to corporate income tax in the taxable year ending within the calendar
year. Although a fund's distribution policies should enable it to avoid this
excise tax liability, a fund may retain (and be subject to income or excise tax
on) a portion of its capital gain or other income if it appears to be in the
interest of such fund.
SPECIAL TAX PROVISIONS THAT APPLY TO CERTAIN INVESTMENTS. Certain of a fund's
investment practices are subject to special and complex federal income tax
provisions, including rules relating to short sales, constructive sales,
"straddle" and "wash sale" transactions and section 1256 contracts (as defined
below), that may, among other things, (i) disallow, suspend or otherwise limit
the allowance of certain losses or deductions, (ii) convert lower taxed
long-term capital gains into higher taxed short-term capital gains or ordinary
income, (iii) convert an ordinary loss or a deduction into a
II-135
capital loss, (iv) cause a fund to recognize income or gain without a
corresponding receipt of cash and/or (v) adversely alter the characterization
of certain fund investments. Moreover, the straddle rules and short sale rules
may require the capitalization of certain related expenses of a fund.
Certain debt obligations. A fund's investment in debt obligations that are
issued with original issue discount (OID) or acquired with market discount or
acquisition discount will be subject to special federal income tax rules. If a
fund holds the foregoing kinds of securities, it may be required to pay out as
an income distribution each year an amount which is greater than the total
amount of cash interest a fund actually received. Such distributions may be
made from the cash assets of a fund or by liquidation of portfolio securities
that it might otherwise have continued to hold. A fund may realize gains or
losses from such liquidations. In the event a fund realizes net capital gains
from such transactions, its shareholders may receive larger distributions than
they would have received in the absence of such transactions. These investments
may also affect the character of income recognized by a fund.
Investments in debt obligations that are at risk of or in default present
special tax issues for a fund. Federal income tax rules are not entirely clear
about issues such as whether and, if so, to what extent a fund should recognize
market discount on such a debt obligation, when a fund may cease to accrue
interest, original issue discount or market discount, when and to what extent
deductions may be taken for bad debts or worthless securities, how payments
received on obligations in default should be allocated between principal and
income and whether exchanges of debt obligations in a workout context are
taxable. These and other issues will be addressed by a fund, when, as and if it
invests in such securities, in order to seek to ensure that it distributes
sufficient income to preserve its status as a regulated investment company and
does not become subject to US federal income or excise tax.
Derivatives. A fund's transactions in foreign currencies, derivative
instruments (e.g. forward contracts, swap agreements, options and futures
contracts (including options and futures contracts on foreign currencies)), as
well other hedging, short sale or similar transactions, may be subject to
special provisions of the Code (including provisions relating to "hedging
transactions" and "straddles") that, among other things, may affect the
character of gains and losses realized by a fund (i.e., may affect whether
gains or losses are ordinary or capital), accelerate recognition of income to a
fund and defer fund losses. These rules could therefore affect the character,
amount and timing of distributions to shareholders. These provisions may also
(i) require a fund to mark to market annually certain types of the positions in
its portfolio (i.e., treat them as if they were closed out at the end of each
year), or (ii) cause a fund to recognize income without receiving cash with
which to pay dividends or make distributions in amounts necessary to satisfy
the distribution requirements described above in order to avoid certain income
and excise taxes. A fund may be required to liquidate other investments
(including when it is not advantageous to do so) to meet its distribution
requirements, which may also accelerate the recognition of gain by the fund. A
fund will monitor its transactions, make the appropriate tax elections and make
the appropriate entries in its books and records when it acquires any foreign
currency, forward contract, option, futures contract or hedged investment in
order to mitigate the effect of these rules and prevent disqualification of a
fund as a regulated investment company.
In general, option premiums received by a fund are not immediately included in
the income of a fund. Instead, the premiums are recognized when the option
contract expires, the option is exercised by the holder, or a fund transfers or
otherwise terminates the option (e.g., through a closing transaction). If a
call option written by a fund is exercised and a fund sells or delivers the
underlying stock, a fund generally will recognize capital gain or loss equal to
(a) the sum of the strike price and the option premium received by a fund minus
(b) a fund's basis in the stock. Such gain or loss generally will be short-term
or long-term depending upon the holding period of the underlying stock. If
securities are purchased by a fund pursuant to the exercise of a put option
written by it, a fund generally will subtract the premium received from its
cost basis in the securities purchased. The gain or loss with respect to any
termination of a fund's obligation under an option other than through the
exercise of the option and related sale or delivery of the underlying stock
generally will be short-term gain or loss depending on whether the premium
income received by a fund is greater or less than the amount paid by a fund (if
any) in terminating the transaction. Thus, for example, if an option written by
a fund expires unexercised, a fund generally will recognize short-term gain
equal to the premium received.
Certain covered call writing activities of a fund may trigger the US federal
income tax straddle rules of Section 1092 of the Code, requiring that losses be
deferred and holding periods be tolled on offsetting positions in options and
stocks deemed to constitute substantially similar or related property. Options
on single stocks that are not "deep in
II-136
the money" may give rise to qualified covered calls, which generally are not
subject to the straddle rules; the holding period on stock underlying qualified
covered calls that are "in the money" although not "deep in the money" will be
suspended during the period that such calls are outstanding. Thus, the straddle
rules and the rules governing qualified covered calls could cause gains that
would otherwise constitute long-term capital gains to be treated as short-term
capital gains, and distributions that would otherwise constitute "qualified
dividend income" (as discussed below) or qualify for the dividends-received
deduction (as discussed below) to fail to satisfy the holding period
requirements and therefore to be taxed at ordinary income tax rates or to fail
to qualify for the 70% dividends-received deduction, as the case may be.
A fund's investment in so called "section 1256 contracts," which include
certain futures contracts as well as listed non-equity options written or
purchased by a fund on US exchanges (including options on futures contracts,
equity indices and debt securities), are subject to special federal income tax
rules. All section 1256 contracts held by a fund at the end of its taxable year
are required to be marked to their market value, and any unrealized gain or
loss on those positions will be included in a fund's income as if each position
had been sold for its fair market value at the end of the taxable year. The
resulting gain or loss will be combined with any gain or loss realized by a
fund from positions in section 1256 contracts closed during the taxable year.
Provided such positions were held as capital assets and were neither part of a
"hedging transaction" nor part of a "straddle," 60% of the resulting net gain
or loss will be treated as long-term capital gain or loss, and 40% of such net
gain or loss will be treated as short-term capital gain or loss (although
certain foreign currency gains and losses from such contracts may be treated as
ordinary in character), regardless of the period of time the positions were
actually held by a fund.
As a result of entering into swap contracts, a fund may make or receive
periodic net payments. A fund may also make or receive a payment when a swap is
terminated prior to maturity through an assignment of the swap or other closing
transaction. Periodic net payments will generally constitute ordinary income or
deductions, while termination of a swap will generally result in capital gain
or loss (which will be a long-term capital gain or loss if a fund has been a
party to the swap for more than one year). With respect to certain types of
swaps, a fund may be required to currently recognize income or loss with
respect to future payments on such swaps or may elect under certain
circumstances to mark such swaps to market annually for federal income tax
purposes as ordinary income or loss. The federal income tax treatment of many
types of credit default swaps is uncertain under current law.
In general, gain or loss on a short sale is recognized when a fund closes the
sale by delivering the borrowed property to the lender, not when the borrowed
property is sold. Gain or loss from a short sale is generally treated as
capital gain or loss to the extent that the property used to close the short
sale constitutes a capital asset in a fund's hands. Except with respect to
certain situations where the property used by a fund to close a short sale has
a long-term holding period on the date of the short sale, special rules would
generally treat the gains on short sales as short-term capital gains. These
rules may also terminate the running of the holding period of "substantially
identical property" held by a fund. Moreover, a loss on a short sale will be
treated as a long-term capital loss if, on the date of the short sale,
"substantially identical property" has been held by a fund for more than a
year. In general, a fund will not be permitted to deduct payments made to
reimburse the lender of securities for dividends paid on borrowed stock if the
short sale is closed on or before the 45th day after the short sale is entered
into.
Because the rules described above and other federal income tax rules applicable
to these types of transactions are in some cases uncertain under current law,
an adverse determination or future guidance by the IRS with respect to these
rules (which determination or guidance could be retroactive) may affect whether
a fund has made sufficient distributions, and otherwise satisfied the relevant
requirements, to maintain its qualification as a regulated investment company
and avoid a fund-level tax. A fund intends to limit its activities in options,
futures contracts, forward contracts, short sales, swaps and related
transactions to the extent necessary to meet the requirements for qualification
and treatment as a regulated investment company under the Code.
REITs. A fund's investments in equity securities of real estate investment
trusts (REITs) may result in a fund's receipt of cash in excess of the REIT's
earnings; if a fund distributes these amounts, the distributions could
constitute a return of capital to fund shareholders for federal income tax
purposes. In addition, such investments in REIT equity securities also may
require a fund to accrue and distribute income not yet received. To generate
sufficient cash to make the
II-137
requisite distributions, a fund may be required to sell securities in its
portfolio (including when it is not advantageous to do so) that it otherwise
would have continued to hold. Dividends received by a fund from a REIT will not
qualify for the corporate dividends-received deduction and generally will not
constitute qualified dividend income.
Under a notice issued by the IRS in October 2006 and Treasury regulations that
have yet to be issued but may apply retroactively, a portion of a fund's income
from a REIT (or other pass-through entity) that is attributable to the REIT's
residual interest in a real estate mortgage investment conduit (REMIC) or an
equity interest in a taxable mortgage pool (TMP) (referred to in the Code as an
"excess inclusion") will be subject to federal income tax in all events. This
notice also provides, and the regulations are expected to provide, that excess
inclusion income of a regulated investment company will be allocated to
shareholders of the regulated investment company in proportion to the dividends
received by such shareholders, with the same consequences as if the
shareholders held the related REMIC or TMP interest directly (see Taxation of
US Shareholders - Dividends and distributions - Additional considerations for a
summary of certain federal income tax consequences to shareholders of
distributions designated as excess inclusion income).
Standby commitments. A fund may purchase municipal securities together with the
right to resell the securities to the seller at an agreed upon price or yield
within a specified period prior to the maturity date of the securities. Such a
right to resell is commonly known as a "put" and is also referred to as a
"standby commitment." A fund may pay for a standby commitment either in cash or
in the form of a higher price for the securities which are acquired subject to
the standby commitment, thus increasing the cost of securities and reducing the
yield otherwise available. Additionally, a fund may purchase beneficial
interests in municipal securities held by trusts, custodial arrangements or
partnerships and/or combined with third-party puts or other types of features
such as interest rate swaps; those investments may require a fund to pay
"tender fees" or other fees for the various features provided. The IRS has
issued a revenue ruling to the effect that, under specified circumstances, a
regulated investment company will be the owner of tax-exempt municipal
obligations acquired subject to a put option. The IRS has also issued private
letter rulings to certain taxpayers (which do not serve as precedent for other
taxpayers) to the effect that tax-exempt interest received by a regulated
investment company with respect to such obligations will be tax-exempt in the
hands of the company and may be distributed to its shareholders as
exempt-interest dividends. The IRS has subsequently announced that it will not
ordinarily issue advance ruling letters as to the identity of the true owner of
property in cases involving the sale of securities or participation interests
therein if the purchaser has the right to cause the security, or the
participation interest therein, to be purchased by either the seller or a third
party. A fund, where relevant, intends to take the position that it is the
owner of any municipal obligations acquired subject to a standby commitment or
other third party put and that tax-exempt interest earned with respect to such
municipal obligations will be tax-exempt in its hands. There is no assurance
that the IRS will agree with such position in any particular case. If a fund is
not viewed as the owner of such municipal obligations, it will not be permitted
to treat the exempt interest paid on such obligations as belonging to it. This
may affect the fund's eligibility to pay exempt-interest dividends to its
shareholders. Additionally, the federal income tax treatment of certain other
aspects of these investments, including the treatment of tender fees paid by a
fund, in relation to various regulated investment company tax provisions is
unclear. However, the Advisor intends to manage a fund's portfolio in a manner
designed to minimize any adverse impact from the tax rules applicable to these
investments.
As described herein, in certain circumstances a fund may be required to
recognize taxable income or gain even though no corresponding amounts of cash
are received concurrently. A fund may therefore be required to obtain cash to
satisfy its distribution requirements by selling securities at times when it
might not otherwise be desirable to do so or by borrowing the necessary cash,
thereby incurring interest expense. In certain situations, a fund will, for a
taxable year, defer all or a portion of its capital losses and currency losses
realized after October 31 until the next taxable year in computing its
investment company taxable income and net capital gain, which will defer the
recognition of such realized losses. Such deferrals and other rules regarding
gains and losses realized after October 31 may affect the federal income tax
character of shareholder distributions.
Foreign investments. Income (including, in some cases, capital gains) from
investments in foreign stocks or securities may be subject to foreign taxes,
including withholding and other taxes imposed by foreign jurisdictions. Tax
conventions between certain countries and the US may reduce or eliminate such
taxes. It is not possible to determine a fund's effective rate of foreign tax
in advance since the amount of a fund's assets to be invested in various
countries is not known. Payment of such taxes will reduce a fund's yield on
those investments.
II-138
If a fund is liable for foreign taxes and if more than 50% of the value of a
fund's total assets at the close of its taxable year consists of stocks or
securities of foreign corporations (including foreign governments), a fund may
make an election pursuant to which certain foreign taxes paid by a fund would
be treated as having been paid directly by shareholders of a fund. Pursuant to
such election, shareholders may be able to claim a credit or deduction on their
federal income tax returns for their pro rata portions of qualified taxes paid
by a fund to foreign countries in respect of foreign securities that such fund
has held for at least the minimum period specified in the Code. In such a case,
shareholders will include in gross income from foreign sources their pro rata
shares of such taxes paid by a fund. Each shareholder of a fund will be
notified after the close of a fund's taxable year whether the foreign taxes
paid by a fund will "pass through" for that year and, if so, such notification
will designate the shareholder's portion of (i) the foreign taxes paid by a
fund and (ii) a fund's foreign source income.
A shareholder's ability to claim an offsetting foreign tax credit or deduction
in respect of foreign taxes paid by a fund is subject to certain limitations
imposed by the Code, which may result in the shareholder not receiving a full
credit or deduction (if any) for the amount of such taxes. Shareholders who do
not itemize on their US federal income tax returns may claim a credit (but not
a deduction) for such foreign taxes. The amount of foreign taxes that a
shareholder may claim as a credit in any year will generally be subject to a
separate limitation for "passive income" which includes, among other types of
income, dividends, interest and certain foreign currency gains. Because capital
gains realized by a fund on the sale of foreign securities will be treated as
US source income, the available credit of foreign taxes paid with respect to
such gains may be restricted by this limitation.
If a fund does not satisfy the requirements for passing through to its
shareholders their proportionate shares of any foreign taxes paid by a fund,
shareholders generally will not be entitled to claim a credit or deduction with
respect to foreign taxes incurred by a fund but will not be required to include
such taxes in their gross incomes.
A fund's transactions in foreign currencies, foreign-currency-denominated debt
obligations and certain foreign currency options, futures contracts and forward
contracts (and similar instruments) may give rise to ordinary income or loss to
the extent such income or loss results from fluctuations in the value of the
foreign currency concerned. Under section 988 of the Code, gains or losses
attributable to fluctuations in exchange rates between the time a fund accrues
income or receivables or expenses or other liabilities denominated in a foreign
currency and the time a fund actually collects such income or pays such
liabilities are generally treated as ordinary income or ordinary loss. In
general, gains (and losses) realized on debt instruments will be treated as
section 988 gain (or loss) to the extent attributable to changes in exchange
rates between the US dollar and the currencies in which the instruments are
denominated. Similarly, gains or losses on foreign currency, foreign currency
forward contracts and certain foreign currency options or futures contracts, to
the extent attributable to fluctuations in exchange rates between the
acquisition and disposition dates, are also treated as ordinary income or loss
unless a fund elects otherwise. Such ordinary income treatment may accelerate
fund distributions to shareholders and increase the distributions taxed to
shareholders as ordinary income. Any net ordinary losses so created cannot be
carried forward by a fund to offset income or gains earned in subsequent
taxable years.
Investment in passive foreign investment companies (PFICs). If a fund purchases
shares in certain foreign investment entities, called "passive foreign
investment companies" (PFICs), it may be subject to US federal income tax on a
portion of any "excess distribution" or gain from the disposition of such
shares, which tax cannot be eliminated by making distributions to fund
shareholders. Such excess distributions and gains will be considered ordinary
income. Additional charges in the nature of interest may be imposed on a fund
in respect of deferred taxes arising from such distributions or gains.
However, a fund may elect to avoid the imposition of that tax. For example, a
fund may in certain cases elect to treat the PFIC as a "qualified electing
fund" under the Code (i.e., make a "QEF election"), in which case a fund would
be required to include in income each year its share of the ordinary earnings
and net capital gains of the qualified electing fund, even if such amounts were
not distributed to a fund. In order to make this election, a fund would be
required to obtain certain annual information from the PFICs in which it
invests, which may be difficult or not possible to obtain.
II-139
Alternatively, a fund may make a mark-to-market election that will result in a
fund being treated as if it had sold (and, solely for purposes of this
mark-to-market election, repurchased) its PFIC stock at the end of such fund's
taxable year. In such case, a fund would report any such gains as ordinary
income and would deduct any such losses as ordinary losses to the extent of
previously recognized gains. The QEF and mark-to-market elections must be made
separately for each PFIC owned by a fund and, once made, would be effective for
all subsequent taxable years, unless revoked with the consent of the IRS. By
making the election, a fund could potentially ameliorate the adverse federal
income tax consequences with respect to its ownership of shares in a PFIC, but
in any particular year may be required to recognize income in excess of the
distributions it receives from PFICs and its proceeds from dispositions of PFIC
stock. A fund may have to distribute this "phantom" income and gain to satisfy
the 90% distribution requirement and/or to avoid imposition of the 4% excise
tax. Making either of these elections therefore may require a fund to liquidate
other investments (including when it is not advantageous to do so) to meet its
distribution requirement, which also may accelerate the recognition of gain and
affect a fund's total return. A fund will make the appropriate tax elections,
if possible, and take any additional steps that are necessary to mitigate the
effect of these rules. Dividends paid by PFICs will not be eligible to be
treated as "qualified dividend income."
Investments in the Master Portfolios. Special tax considerations apply to a
Feeder Fund investing in a Master Portfolio. As noted above, each Master
Portfolio is treated as a partnership for US federal income tax purposes. For
US federal income tax purposes, a Feeder Fund generally will be allocated its
distributive share (as determined in accordance with the governing instruments
of the applicable Master Portfolio, as well as with the Code, the Treasury
regulations thereunder, and other applicable authority) of the income, gains,
losses, deductions, credits, and other tax items of its Master Portfolio so as
to reflect the Feeder Fund's interests in the Master Portfolio. A Master
Portfolio may modify its partner allocations to comply with applicable tax
regulations, including, without limitation, the income tax regulations under
Sections 704, 734, 743, 754, and 755 of the Code. It also may make special
allocations of specific tax items, including gross income, gain, deduction, or
loss. These modified or special allocations could result in a Feeder Fund, as a
partner, receiving more or less items of income, gain, deduction, or loss
(and/or income, gain, deduction, or loss of a different character) than it
would in the absence of such modified or special allocations. A Feeder Fund
will be required to include in its income its share of its Master Portfolio's
tax items, including gross income, gain, deduction, or loss, for any taxable
year regardless of whether or not the Master Portfolio distributes any cash to
the Feeder Fund in such year. A
Master Portfolio is are not required, and generally does not expect, to make
distributions (other than distributions in redemption of Master Portfolio
interests) to investors each year. Accordingly, the income recognized by a
Feeder Fund in respect of its investment in a Master Portfolio could exceed
amounts distributed (if any) by the Master Portfolio to the Feeder Fund in a
particular taxable year, and thus the Feeder Fund could be required to redeem a
portion of its interests in the Master Portfolio in order to obtain sufficient
cash to satisfy its annual distribution requirements (described above) and to
otherwise avoid fund-level US federal income and excise taxes.
A Feeder Fund's receipt of a non-liquidating cash distribution from a Master
Portfolio generally will result in recognized gain (but not loss) only to the
extent that the amount of the distribution exceeds the Feeder Fund's adjusted
basis in shares of the Master Portfolio before the distribution. A Feeder Fund
that receives a liquidating cash distribution from a Master Portfolio generally
will recognize capital gain to the extent of the difference between the
proceeds received by the Feeder Fund and the Feeder Fund's adjusted tax basis
in shares of such Master Portfolio; however, the Feeder Fund generally will
recognize ordinary income, rather than capital gain, to the extent that the
Feeder Fund's allocable share of "unrealized receivables" (including any
accrued but untaxed market discount) and substantially appreciated inventory,
if any, exceeds the Feeder Fund's share of the basis in those unrealized
receivables and substantially appreciated inventory. Any capital loss realized
on a liquidating cash distribution may be recognized by a Feeder Fund only if
it redeems all of its Master Portfolio interests for cash. A Feeder Fund
generally will not recognize gain or loss on an in-kind distribution of
property from a Master Portfolio, including on an in-kind redemption of Master
Portfolio interests. However, certain exceptions to this general rule may
apply.
TAXATION OF US SHAREHOLDERS
II-140
DIVIDENDS AND DISTRIBUTIONS. A fund intends to distribute substantially all of
its net investment company taxable income (computed without regard to the
dividends-paid deduction) and net capital gain (that is, the excess of net
realized long-term capital gains over net realized short-term capital losses),
if any, to shareholders each year. Unless a shareholder instructs the
Trust/Corporation to pay such dividends and distributions in cash, they will be
automatically reinvested in additional shares of a fund.
Dividends and other distributions by a fund are generally treated under the
Code as received by the shareholders at the time the dividend or distribution
is made, whether you receive them in cash or reinvest them in additional
shares. However, any dividend or distribution declared by a fund in October,
November or December of any calendar year and payable to shareholders of record
on a specified date in such a month shall be deemed to have been received by
each shareholder on December 31 of such calendar year and to have been paid by
a fund not later than such December 31, provided such dividend is actually paid
by a fund during January of the following calendar year. Dividends and
distributions received by a retirement plan qualifying for tax-exempt treatment
under the Code will not be subject to US federal income tax.
If a fund retains for investment an amount equal to all or a portion of its net
capital gain, it will be subject to federal income tax at the fund level at
regular corporate rates on the amount retained. In that event, a fund may
designate such retained amount as undistributed capital gains in a notice to
its shareholders who (i) will be required to include in income for US federal
income tax purposes, as long-term capital gains, their proportionate shares of
the undistributed amount, and (ii) will be entitled to credit their
proportionate shares of the federal income tax paid by a fund on the
undistributed amount against their US federal income tax liabilities, if any,
and to claim refunds to the extent their credits exceed their liabilities. The
tax basis of shares owned by a fund shareholder, for US federal income tax
purposes, will be increased by an amount equal to the difference between the
amount of undistributed capital gains included in the shareholder's gross
income and the federal income tax deemed paid by the shareholder under clause
(ii) of the preceding sentence. Organizations or persons not subject to federal
income tax on such capital gains will be entitled to a refund of their pro rata
share of such taxes paid by a fund upon filing appropriate returns or claims
for refund with the IRS.
For federal income tax purposes, distributions of investment income are
generally taxable to shareholders as ordinary income. Taxes on distributions of
capital gains are determined by how long a fund owned (or is deemed to have
owned) the investments that generated them, rather than how long a shareholder
has owned his or her shares. In general, the fund will recognize long-term
capital gain or loss on assets it has owned (or is deemed to have owned) for
more than one year, and short-term capital gain or loss on investments it has
owned (or is deemed to have owned) for one year or less. Distributions of net
capital gains that are properly designated by a fund as capital gain dividends
(Capital Gain Dividends) will be taxable as long-term capital gains.
Distributions from capital gains are generally made after applying any
available capital loss carryovers. Long-term capital gain rates applicable to
individuals and other noncorporate investors have been temporarily reduced to
15% - with a 0% rate applying to taxpayers in the 10% and 15% rate brackets -
for taxable years beginning before January 1, 2011. It is currently unclear
whether Congress will extend this provision for taxable years beginning on or
after January 1, 2011. However, a portion of the proceeds from the disposition
of certain real property assets held by a fund for more than one year may
produce "unrecaptured section 1250 gain." Any unrecaptured section 1250 gain
received by a fund will be taxable to shareholders at a 25% rate. Except as
discussed below, all other dividends of a fund (including dividends from
short-term capital gains) from current and accumulated earnings and profits are
generally subject to federal income tax as ordinary income.
Qualified dividend income. For taxable years beginning before January 1, 2011,
dividends designated by a fund as derived from "qualified dividend income" will
be taxed to individuals and other noncorporate shareholders at the federal
income tax rates generally applicable to long-term capital gains, provided
certain holding period and other requirements are met at both the shareholder
and fund levels. Dividends subject to these special rules are not actually
treated as capital gains, however, and thus are not included in the computation
of an individual's net capital gain and generally cannot be used to offset by
capital losses. It is currently unclear whether Congress will extend this
provision for taxable years beginning on or after January 1, 2011.
II-141
If 95% or more of a fund's gross income (excluding net long-term capital gain
over net short-term capital loss) in a taxable year is attributable to
qualified dividend income received by a fund, 100% of the dividends paid by a
fund (other than distributions designated by a fund as Capital Gain Dividends)
to individuals and other noncorporate shareholders during such taxable year
will be eligible to be treated as qualified dividend income. If less than 95%
of a fund's gross income is attributable to qualified dividend income, then
only the portion of the fund's dividends that is attributable to qualified
dividend income and designated as such by the fund will be eligible to be
treated as qualified dividend income.
For these purposes, qualified dividend income generally means income from
dividends received by a fund from US corporations and certain foreign
corporations. Dividend income received by a fund and distributed to a fund
shareholder may not be treated as qualified dividend income by the shareholder
unless a fund satisfies certain holding period and other requirements with
respect to the stock in its portfolio generating such dividend income and the
shareholder meets certain holding period and other requirements with respect to
a fund's shares. A dividend will not be treated as qualified dividend income
(at either a fund or shareholder level) (1) if the dividend is received with
respect to any share of stock held for fewer than 61 days during the 121-day
period beginning on the date which is 60 days before the date on which such
share becomes ex-dividend with respect to such dividend (or, in the case of
certain preferred stock, 91 days during the 181-day period beginning 90 days
before such date), (2) to the extent that the recipient is under an obligation
(whether pursuant to a short sale or otherwise) to make related payments with
respect to positions in substantially similar or related property, (3) if the
recipient elects to have the dividend income treated as investment income for
purposes of the limitation on deductibility of investment interest, or (4) if
the dividend is received from a foreign corporation that is (a) not eligible
for the benefits of a comprehensive income tax treaty with the United States
(with the exception of dividends paid on stock of such a foreign corporation
readily tradable on an established securities market in the United States) or
(b) treated as a passive foreign investment company. For purposes of
determining the holding period for stock on which a dividend is received, such
holding period is reduced for any period the recipient has an option to sell,
is under a contractual obligation to sell or has made (and not closed) a short
sale of substantially identical stock or securities, and in certain other
circumstances.
Qualified dividend income does not include any dividends received from
tax-exempt corporations or interest from fixed income securities. Also,
dividends received by a fund from a REIT or another regulated investment
company are generally qualified dividend income only to the extent the dividend
distributions are made out of qualified dividend income received by such REIT
or other regulated investment company. In the case of securities lending
transactions, payments in lieu of dividends are not qualified dividend income.
Dividends-received deduction. If dividends from domestic corporations comprise
a portion of a fund's gross income, a portion of the income distributions of a
fund may be eligible for the 70% dividends-received deduction generally
available to corporations to the extent of the amount of eligible dividends
received by a fund from domestic corporations for the taxable year. A dividend
received by a fund will not be treated as a dividend eligible for the
dividends-received deduction (i) if it has been received with respect to any
share of stock that the fund has held for less than 46 days (91 days in the
case of certain preferred stock) during the 91-day period beginning on the date
which is 45 days before the date on which such share becomes ex-dividend with
respect to such dividend (during the 181-day period beginning 90 days before
such date in the case of certain preferred stock) or (ii) to the extent that
the fund is under an obligation (pursuant to a short sale or otherwise) to make
related payments with respect to positions in substantially similar or related
property. Moreover, the dividends -received deduction may otherwise be
disallowed or reduced (i) if a corporate shareholder fails to satisfy the
foregoing requirements with respect to its shares of a fund or (ii) by
application of various provisions of the Code (for instance, the
dividends-received deduction is reduced in the case of a dividend received on
debt-financed portfolio stock (generally, stock acquired with borrowed funds)).
For purposes of determining the holding period for stock on which a dividend is
received, such holding period is reduced for any period the recipient has an
option to sell, is under a contractual obligation to sell or has made (and not
closed) a short sale of substantially identical stock or securities, and in
certain other circumstances.
Distributions from REITs do not qualify for the deduction for dividends
received. Shareholders will be informed of the portion of dividends which so
qualify.
II-142
Capital gains. In determining its Capital Gain Dividend (as defined above), a
regulated investment company generally must treat any net capital loss or any
net long-term capital loss incurred after October 31 as if it had been incurred
in the succeeding year. In addition, in determining its taxable income, a
regulated investment company is permitted to elect to treat all or part of any
net capital loss, any net long-term capital loss or any foreign currency loss
incurred after October 31 as if it had been incurred in the succeeding year.
Capital gains distributions may be reduced if a fund has capital loss
carryforwards available. Capital losses in excess of capital gains ("net
capital losses") are not permitted to be deducted against a fund's net
investment income. A fund may carry net capital losses forward for eight years
and use them to offset capital gains realized during this period; any net
capital losses remaining at the conclusion of the eighth taxable year
succeeding the taxable year in which such net capital losses arose will expire
unused. All net capital losses carried forward are treated as short-term
capital losses, and will offset any short-term capital gains before offsetting
any long-term capital gains. A fund's ability to use net capital losses to
offset gains may be limited as a result of certain (i) acquisitive
reorganizations and (ii) shifts in the ownership of a fund by a shareholder
owning or treated as owning 5% or more of the stock of such fund. Any capital
loss carryforwards and any post-October loss deferrals to which a fund is
entitled are disclosed in a fund's annual reports to shareholders.
Additional considerations. Certain of a fund's investments in derivative
instruments and foreign currency-denominated instruments, and any of a fund's
transactions in foreign currencies and hedging activities, are likely to
produce a difference between its book income and the sum of its taxable income
and net tax-exempt income. If there are differences between a fund's book
income and the sum of its taxable income and net tax-exempt income, a fund may
be required to distribute amounts in excess of its book income or a portion of
fund distributions may be treated as a return of capital to shareholders. If a
fund's book income exceeds the sum of its taxable income (including realized
capital gains) and net tax-exempt income, the distribution of such excess
generally will be treated as (i) a dividend to the extent of a fund's remaining
earnings and profits, (ii) thereafter, as a return of capital to the extent of
the recipient's basis in its shares, and (iii) thereafter, as gain from the
sale or exchange of a capital asset. If a fund's book income is less than the
sum of its taxable income and net tax-exempt income, a fund could be required
to make distributions exceeding its book income to qualify for treatment as a
regulated investment company.
Distributions to shareholders designated as excess inclusion income (see
Special tax provisions that apply to certain investments - REITs) (i) may
constitute "unrelated business taxable income" (UBTI) for those shareholders
who would otherwise be exempt from federal income tax, such as individual
retirement accounts, 401(k) accounts, Keogh plans, pension plans and certain
charitable entities, thereby potentially requiring such an entity that is
allocated excess inclusion income, and otherwise might not be required to file
a federal income tax return, to file a tax return and pay tax on such income,
(ii) cannot be offset by net operating losses (subject to a limited exception
for certain thrift institutions), (iii) will not be eligible for reduced US
withholding tax rates for non-US shareholders (including non-US shareholders
eligible for the benefits of a US income tax treaty), and (iv) may cause a fund
to be subject to tax if certain "disqualified organizations," as defined in the
Code, are fund shareholders.
All distributions by a fund result in a reduction in the net asset value of a
fund's shares. Should a distribution reduce the net asset value below a
shareholder's cost basis, such distribution would nevertheless be taxable to
the shareholder as ordinary income, qualified dividend income or capital gain
as described above, even though, from an investment standpoint, it may
constitute a partial return of capital. In particular, investors should be
careful to consider the tax implications of buying shares just prior to a
distribution. The price of shares purchased at that time includes the amount of
the forthcoming distribution. Those purchasing fund shares just prior to a
distribution will receive a partial return of capital upon the distribution,
which nevertheless may be taxable to them for federal income tax purposes.
After the end of each calendar year, a fund will inform shareholders of the
federal income tax status of dividends and distributions paid (or treated as
paid) during such calendar year.
Exempt-interest dividends. Any dividends paid by a fund that are properly
designated as exempt-interest dividends will not be subject to regular federal
income tax. A fund will be qualified to pay exempt-interest dividends to its
shareholders only if, at the end of each quarter of a fund's taxable year, at
least 50% of the total value of a fund's assets consists of obligations of a
state or political subdivision thereof the interest on which is exempt from
federal income tax under
II-143
Code section 103(a). Distributions that a fund properly designates as
exempt-interest dividends are treated as interest excludable from shareholders'
gross income for federal income tax purposes but may result in liability for
federal alternative minimum tax purposes and for state and local tax purposes,
both for individual and corporate shareholders. For example, if a fund invests
in "private activity bonds," certain shareholders may be subject to alternative
minimum tax on the part of a fund's distributions derived from interest on such
bonds.
Interest on indebtedness incurred directly or indirectly to purchase or carry
shares of a fund will not be deductible to the extent it is deemed related to
exempt-interest dividends paid by a fund. The portion of interest that is not
deductible is equal to the total interest paid or accrued on the indebtedness,
multiplied by the percentage of a fund's total distributions (not including
Capital Gain Dividends) paid to the shareholder that are exempt-interest
dividends. Under rules used by the IRS to determine when borrowed funds are
considered incurred for the purpose of purchasing or carrying particular
assets, the purchase of shares may be considered to have been made with
borrowed funds even though such funds are not directly traceable to the
purchase of shares. In addition, the Code may require a shareholder that
receives exempt-interest dividends to treat as taxable income a portion of
certain otherwise, non-taxable social security and railroad retirement benefit
payments. A portion of any exempt-interest dividend paid by a fund that
represents income derived from certain revenue or private activity bonds held
by a fund may not retain its tax-exempt status in the hands of a shareholder
who is a "substantial user" of a facility financed by such bonds, or a "related
person" thereof. Moreover, some or all of the exempt-interest dividends
distributed by a fund may be a specific preference item, or a component of an
adjustment item, for purposes of the federal individual and corporate
alternative minimum taxes. The receipt of dividends and distributions from a
fund may affect a foreign corporate shareholder's federal "branch profits" tax
liability and the federal "excess net passive income" tax liability of a
shareholder that is a Subchapter S corporation. Shareholders should consult
their own tax advisors as to whether they are (i) "substantial users" with
respect to a facility or "related" to such users within the meaning of the Code
or (ii) subject to a federal alternative minimum tax, the federal "branch
profits" tax or the federal "excess net passive income" tax.
Shareholders that are required to file tax returns are required to report
tax-exempt interest income, including exempt-interest dividends, on their
federal income tax returns. A fund will inform shareholders of the federal
income tax status of its distributions after the end of each calendar year,
including the amounts, if any, that qualify as exempt-interest dividends and
any portions of such amounts that constitute tax preference items under the
federal alternative minimum tax. Shareholders who have not held shares of a
fund for a full taxable year may have designated as tax-exempt or as a tax
preference item a percentage of their distributions which is different from the
percentage of a fund's income that was tax-exempt or comprising tax preference
items during the period of their investment in a fund. Shareholders should
consult their tax advisors for more information.
TRANSACTIONS IN FUND SHARES. Upon the sale or exchange of his or her shares, a
shareholder generally will realize a taxable gain or loss equal to the
difference between the amount realized and his or her basis in the shares. A
redemption of shares by a fund generally will be treated as a sale for this
purpose. Such gain or loss will be treated as capital gain or loss if the
shares are capital assets in the shareholder's hands, and will be long-term
capital gain or loss if the shares are held for more than one year and
short-term capital gain or loss if the shares are held for one year or less.
Any loss realized on a sale or exchange will be disallowed to the extent the
shares disposed of are replaced, including replacement through the reinvesting
of dividends and capital gains distributions in a fund, within a 61-day period
beginning 30 days before and ending 30 days after the disposition of the
shares. In such a case, the basis of the shares acquired will be increased to
reflect the disallowed loss.
Any loss realized by a shareholder on the sale of fund shares held by the
shareholder for six months or less will be disallowed to the extent of any
exempt-interest dividends received by the shareholder with respect to such
shares and, to the extent not disallowed, will be treated for US federal income
tax purposes as a long-term capital loss to the extent of any distributions or
deemed distributions of long-term capital gains received by the shareholder
with respect to such shares. A shareholder's ability to utilize capital losses
may be limited under the Code. If a shareholder incurs a sales charge in
acquiring shares of a fund, disposes of those shares within 90 days and then
acquires shares in a mutual fund for which the otherwise applicable sales
charge is reduced by reason of a reinvestment right (e.g., an exchange
privilege), the original sales charge will not be taken into account in
computing gain or loss on the original shares to the extent the subsequent
sales charge is reduced. Instead, the disregarded portion of the original sales
II-144
charge will be added to the tax basis of the newly acquired shares.
Furthermore, the same rule also applies to a disposition of the newly acquired
shares made within 90 days of the second acquisition. This provision prevents a
shareholder from immediately deducting the sales charge by shifting his or her
investment within a family of mutual funds.
The sale or other disposition of shares of a fund by a retirement plan
qualifying for tax-exempt treatment under the Code will not be subject to US
federal income tax. Because the federal income tax treatment of a sale or
exchange of fund shares depends on your purchase price and your personal tax
position, you should keep your regular account statements to use in determining
your federal income tax liability.
TAX-EXEMPT SHAREHOLDERS. Under current law, a fund generally serves to "block"
(that is, prevent the attribution to shareholders of) UBTI from being realized
by tax-exempt shareholders. Notwithstanding this "blocking" effect, a
tax-exempt shareholder could recognize UBTI by virtue of its investment in a
fund if shares in a fund constitute debt-financed property in the hands of the
tax-exempt shareholder within the meaning of Code Section 514(b).
Furthermore, a tax-exempt shareholder may recognize UBTI if a fund recognizes
"excess inclusion income" derived from direct or indirect investments in REMIC
residual interests or TMPs if the amount of such income recognized by a fund
exceeds a fund's investment company taxable income (after taking into account
deductions for dividends paid by a fund). Any investment in residual interests
of a Collateralized Mortgage Obligation (CMO) that has elected to be treated as
a REMIC likewise can create complex tax problems, especially if a fund has
state or local governments or other tax-exempt organizations as shareholders.
In addition, special tax consequences apply to charitable remainder trusts
(CRTs) that invest in regulated investment companies that invest directly or
indirectly in residual interests in REMICs or equity interests in TMPs. Under
legislation enacted in December 2006, if a CRT (defined in section 664 of the
Code) realizes any UBTI for a taxable year, it must pay an excise tax annually
of an amount equal to such UBTI. Under IRS guidance issued in October 2006, a
CRT will not recognize UBTI as a result of investing in a fund that recognizes
"excess inclusion income." Rather, if at any time during any taxable year a CRT
(or one of certain other tax-exempt shareholders, such as the United States, a
state or political subdivision, or an agency or instrumentality thereof, and
certain energy cooperatives) is a record holder of a share in a fund that
recognizes "excess inclusion income," then a fund will be subject to a tax on
that portion of its "excess inclusion income" for the taxable year that is
allocable to such shareholders at the highest federal corporate income tax
rate. The extent to which this IRS guidance remains applicable in light of the
December 2006 legislation is unclear. To the extent permitted under the 1940
Act and the Code, a fund may elect to specially allocate any such tax to the
applicable CRT, or other shareholder, and thus reduce such shareholder's
distributions for the year by the amount of the tax that relates to such
shareholder's interest in a fund. CRTs and other tax-exempt investors are urged
to consult their tax advisors concerning the consequences of investing in a
fund.
BACKUP WITHHOLDING AND OTHER TAX CONSIDERATIONS. A fund may be required to
withhold US federal income tax on distributions (including exempt-interest
dividends) and redemption proceeds payable to shareholders who fail to provide
a fund with their correct taxpayer identification number or to make required
certifications, who have underreported dividend or interest income, or who have
been notified (or when a fund is notified) by the IRS that they are subject to
backup withholding. The backup withholding tax rate is 28% for amounts paid
through 2010. This rate will expire and the backup withholding rate will be 31%
for amounts paid after December 31, 2010, unless Congress enacts tax
legislation providing otherwise. Corporate shareholders and certain other
shareholders specified in the Code generally are exempt from such backup
withholding. Backup withholding is not an additional tax. Any amounts withheld
may be credited against the shareholder's US federal income tax liability.
Special tax rules apply to investments through defined contribution plans and
other tax-qualified plans. Shareholders should consult their tax advisors to
determine the suitability of shares of a fund as an investment through such
plans and the precise effect of an investment on their particular tax
situation.
II-145
A fund's shareholders may be subject to state and local taxes on distributions
received from a fund and on redemptions of a fund's shares. Rules of state and
local taxation of dividend and capital gains distributions from regulated
investment companies often differ from rules for federal income taxation
described above. You are urged to consult your tax advisor as to the
consequences of these and other state and local tax rules affecting an
investment in a fund.
If a shareholder recognizes a loss with respect to a fund's shares of $2
million or more for an individual shareholder or $10 million or more for a
corporate shareholder, the shareholder must file with the IRS a disclosure
statement on Form 8886. Direct shareholders of portfolio securities are in many
cases excepted from this reporting requirement, but under current guidance
shareholders of a regulated investment company are not excepted. The fact that
a loss is reportable under these regulations does not affect the legal
determination of whether the taxpayer's treatment of the loss is proper.
Shareholders should consult their tax advisors to determine the applicability
of these regulations in light of their individual circumstances.
TAXATION OF NON-US SHAREHOLDERS. In general, dividends other than Capital Gain
Dividends and exempt-interest dividends paid by a fund to a shareholder that is
not a "US person" within the meaning of the Code (non-US shareholder) are
subject to withholding of US federal income tax at a rate of 30% (or lower
applicable treaty rate) even if they are funded by income or gains (such as
portfolio interest, short-term capital gains, or foreign-source dividend and
interest income) that, if paid to a non-US shareholder directly, would not be
subject to withholding. Distributions properly designated as Capital Gain
Dividends and exempt-interest dividends generally are not subject to
withholding of federal income tax.
Effective for taxable years of a fund beginning before January 1, 2010 (and for
taxable years beginning before January 1, 2011, if pending legislation
discussed below is enacted), however, a fund is not required to withhold any
amounts (i) with respect to distributions from US-source interest income of
types similar to those not subject to US federal income tax if earned directly
by an individual non-US shareholder, to the extent such distributions are
properly designated by a fund (interest-related dividends), and (ii) with
respect to distributions of net short-term capital gains in excess of net
long-term capital losses, to the extent such distributions are properly
designated by the fund (short-term capital gain dividends). The exception to
withholding for interest-related dividends does not apply to distributions to a
non-US shareholder (A) that has not provided a satisfactory statement that the
beneficial owner is not a US person, (B) to the extent that the dividend is
attributable to certain interest on an obligation if the non-US shareholder is
the issuer or is a 10% shareholder of the issuer, (C) that is within certain
foreign countries that have inadequate information exchange with the United
States, or (D) to the extent the dividend is attributable to interest paid by a
person that is a related person of the non-US shareholder and the non-US
shareholder is a controlled foreign corporation. The exception to withholding
for short-term capital gain dividends does not apply to (A) distributions to an
individual non-US shareholder who is present in the United States for a period
or periods aggregating 183 days or more during the year of the distribution and
(B) distributions subject to special rules regarding the disposition of US real
property interests (USRPIs) as defined below. Depending on the circumstances, a
fund may make designations of interest-related and/or short-term capital gain
dividends with respect to all, some or none of its potentially eligible
dividends and/or treat such dividends, in whole or in part, as ineligible for
these exemptions from withholding. A fund does not currently intend to make
designations of interest-related dividends. Pending legislation proposes to
extend the exemption from withholding for interest-related dividends and
short-term capital gain dividends for one additional year, i.e., for dividends
with respect to taxable years beginning on or after January 1, 2010 but before
January 1, 2011. As of the date of this Statement of Additional Information, it
is unclear whether such legistlation will be enacted and, if enacted, what the
terms of the extension will be.
A non-US shareholder is not, in general, subject to US federal income tax on
gains (and is not allowed a deduction for losses) realized on the sale of
shares of a fund or on Capital Gain Dividends or exempt-interest dividends
unless (i) such gain or dividend is effectively connected with the conduct by
the non-US shareholder of a trade or business within the United States, (ii) in
the case of a non-US shareholder that is an individual, the shareholder is
present in the United States for a period or periods aggregating 183 days or
more during the year of the sale or the receipt of the Capital Gain Dividend
and certain other conditions are met, or (iii) the shares constitute USRPIs or
the Capital Gain Dividends are attributable to gains from the sale or exchange
of USRPIs in accordance with the rules set forth
II-146
below. If a non-US shareholder is eligible for the benefits of a tax treaty,
any effectively connected income or gain will generally be subject to US
federal income tax on a net basis only if it is also attributable to a
permanent establishment maintained by the non-US shareholder in the United
States.
In order to qualify for any exemption from withholding tax or a reduced rate of
withholding tax under an applicable income tax treaty, a non-US shareholder
will need to comply with applicable certification requirements relating to its
non-US status (including, in general, furnishing an IRS Form W-8BEN or
substitute form). In the case of shares held through an intermediary, the
intermediary may withhold tax even if a fund designates a dividend as an
interest-related dividend or short-term capital gain dividend. Non-US
shareholders should contact their intermediaries with respect to the
application of these rules to their accounts.
The withholding tax does not apply to dividends paid to a non-US shareholder
who provides a Form W-8ECI, certifying that the dividends are effectively
connected with the non-US shareholder's conduct of a trade or business within
the United States. Instead, the effectively connected dividends will be subject
to regular US income tax as if the non-US shareholder were a US shareholder. A
non-US corporation receiving effectively connected dividends may also be
subject to additional "branch profits tax" imposed at a rate of 30% (or a lower
treaty rate). A non-US shareholder who fails to provide an IRS Form W-8BEN or
other applicable form may be subject to backup withholding at the appropriate
rate.
In general, except as noted in this subsection, United States federal
withholding tax will not apply to any gain or income realized by a non-US
shareholder in respect of any distributions of net long-term capital gains over
net short-term capital losses, exempt-interest dividends, or upon the sale or
other disposition of shares of a fund.
Special rules apply to distributions to certain foreign persons from a fund if
a fund is either a "US real property holding corporation" (USRPHC) or would be
a USRPHC but for the operation of the exceptions to the definition thereof
described below. Additionally, special rules apply to the sale of shares in a
fund if a fund is a USRPHC. Very generally, a USRPHC is a corporation that
holds US real property interests (USRPIs) the fair market value of which equals
or exceeds 50% of the sum of the fair market values of the corporation's USRPIs
plus interests in real property located outside the United States and other
assets. USRPIs are defined as any interest in US real property or any interest
(other than a creditor) in a USRPHC or former USRPHC. If a fund holds (directly
or indirectly) significant interests in REITs, it may be a USRPHC. The special
rules discussed in the next paragraph also apply to distributions from a fund
if it would be a USRPHC absent exclusions from USRPI treatment for interests in
domestically controlled REITs or regulated investment companies and
not-greater-than-5% interests in publicly traded classes of stock in REITs or
regulated investment companies.
If a fund is a USRPHC or would be a USRPHC but for the exceptions from the
definition of USRPI (described above), distributions by a fund that are
attributable to (a) gains realized on the disposition of USRPIs by a fund and
(b) distributions received by a fund from a lower-tier regulated investment
company or REIT that a fund is required to treat as USRPI gain in its hands
will retain their character as gains realized from USRPIs in the hands of the
foreign persons. (However, absent the enaction of pending legislation described
below, on or after January 10, 2010, this "look-through" treatment for
distributions by a fund to foreign persons applies only to such distributions
that, in turn, are attributable to distributions received by a fund from a
lower-tier REIT and are required to be treated as USRPI gain in a fund's
hands.) If the foreign shareholder holds (or has held at any time during the
prior year) more than a 5% interest in a class of stock of a fund, such
distributions received by the shareholder with respect to such class of stock
will be treated as gains "effectively connected" with the conduct of a "US
trade or business," and subject to tax at graduated rates. Moreover, such
shareholders will be required to file a US income tax return for the year in
which the gain was recognized and a fund will be required to withhold 35% of
the amount of such distribution. In the case of all other foreign persons
(i.e., those whose interest in a fund did not exceed 5% at any time during the
prior year), the USRPI distribution will be treated as ordinary income
(regardless of any designation by a fund that such distribution is qualified
short-term capital gain (in the event that certain pending legislation is
enacted, as described above (or net capital gain) and a fund must withhold 30%
(or a lower applicable treaty rate) of the amount of the distribution paid to
such foreign persons. Pending legislation proposes to extend the "look-through"
provisions applicable before January 1, 2010 described above for one additional
year, i.e., for the distributions made on or after January 1, 2010 but before
January 1, 2011. However, as of the date of this
II-147
Statement of Additional Information, it is unclear whether such legislation
will be enacted and, if enacted, what the terms of the extension will be.
Foreign persons are also subject to "wash sale" rules to prevent the avoidance
of the tax-filing and payment obligations discussed above through the sale and
repurchase of fund shares.
In addition, if a fund is a USRPHC or former USRPHC, a fund may be required to
withhold US tax upon a redemption of shares by a greater-than-5% shareholder
that is a foreign person, and that shareholder would be required to file a US
income tax return for the year of the disposition of the USRPI and pay any
additional tax due on the gain. Prior to January 1, 2010, no withholding was
generally required with respect to amounts paid in redemption of shares of a
fund if a fund was a domestically controlled qualified investment entity, or,
in certain other limited cases, if a fund (whether or not domestically
controlled) held substantial investments in regulated investment companies that
were domestically controlled qualified investment entities. Pending legislation
proposes to extend the exemption from withholding for one additional year,
i.e., for redemptions made on or after January 1, 2010 but before January 1,
2011. However, as of the date of this Statement of Additional Information, it
is unclear whether such legislation will be enacted and, if enacted, what the
terms of the extension will be. Unless and until the legislation is enacted,
beginning on January 1, 2010, such withholding is required, without regard to
whether a fund or any regulated investment company in which it invests is
domestically controlled.
Shares of a fund held by a non-US shareholder at death will be considered
situated within the United States and will be subject to the US estate tax.
The tax consequences to a foreign shareholder entitled to claim the benefits of
an applicable tax treaty may be different from those described herein. Foreign
shareholders should consult their own tax advisors with respect to the
particular tax consequences to them of an investment in a fund, including the
applicability of foreign taxes.
Variable annuity funds. Certain special tax considerations apply to the
variable annuity funds (DWS Variable Series I, DWS Variable Series II and DWS
Investments VIT Funds). These funds intend to comply with the separate
diversification requirements imposed by Section 817(h) of the Code and the
regulations thereunder on certain insurance company separate accounts. These
requirements limit the percentage of total assets used to fund variable
contracts that an insurance company separate account may invest in any single
investment. Because Section 817(h) and those regulations treat the assets of a
regulated investment company owned exclusively by insurance company separate
accounts and certain other permitted investors as assets of the separate
accounts investing in that regulated investment company, these regulations are
imposed on the assets of the variable annuity funds in addition to the
diversification requirements imposed on the funds by the 1940 Act and
Subchapter M of the Code. Specifically, the regulations provide that, except as
permitted by the "safe harbor" described below (and, in general, during a one
year start-up period), as of the end of each calendar quarter or within 30 days
thereafter no more than 55% of the total assets of a separate account may be
represented by any one investment, no more than 70% by any two investments, no
more than 80% by any three investments, and no more than 90% by any four
investments. For this purpose, all securities of the same issuer are generally
considered a single investment, and each U.S. Government agency and
instrumentality is considered a separate issuer. Section 817(h) provides, as a
safe harbor, that a separate account will be treated as being adequately
diversified if the diversification requirements under Subchapter M are
satisfied and no more than 55% of the value of the account's total assets is
attributable to cash and cash items (including receivables), U.S. Government
securities and securities of other regulated investment companies.
Failure by a variable annuity fund to qualify as a regulated investment company
or to satisfy the Section 817(h) requirements by failing to comply with the
"55%-70%-80%-90%" diversification test or the safe harbor described above could
cause the variable contracts to lose their favorable tax status and require a
contract holder to include in ordinary income any income accrued under the
contracts for the current and all prior taxable years. Under certain
circumstances described in the applicable Treasury regulations, inadvertent
failure to satisfy the Section 817(h) diversification requirements may be
corrected, but such a correction could require a payment to the IRS with
respect to the period or periods during which the investments of the account
did not meet the diversification requirements. The amount of any such payment
could be based on the tax contract holders would have incurred if they were
treated as receiving the income on the contract for the period during which the
diversification requirements were not satisfied. Any such failure could also
result in adverse tax consequences for the insurance company issuing the
contracts.
II-148
The 4% excise tax described above does not apply to any regulated investment
company whose sole shareholders are tax-exempt pension trusts and separate
accounts of life insurance companies funding variable contracts. In determining
whether tax-exempt pension trusts or separate accounts of life insurance
companies are the sole shareholders of a regulated investment company for
purposes of this exception to the excise tax, shares attributable to an
investment in the regulated investment company (not exceeding $250,000) made in
connection with the organization of the regulated investment company are not
taken into account.
The IRS has indicated that too great a degree of investor control over the
investment options underlying variable contracts may result in the loss of
tax-deferred treatment for such contracts. The Treasury Department has issued
rulings addressing the circumstances in which a variable contract owner's
control of the investments of the separate account may cause the contract
owner, rather than the insurance company, to be treated as the owner of the
assets held by the separate account, and is likely to issue additional rulings
in the future. If the contract owner is considered the owner of the securities
underlying the separate account, income and gains produced by those securities
would be included currently in the contract owner's gross income.
In determining whether an impermissible level of investor control is present,
one factor the IRS considers when a separate account invests in one or more
regulated investment companies is whether a regulated investment company's
investment strategies are sufficiently broad to prevent a contract holder from
being deemed to be making particular investment decisions through its
investment in the separate account. Current IRS guidance indicates that typical
regulated investment company investment strategies, even those with a specific
sector or geographical focus, are generally considered sufficiently broad to
prevent a contract holder from being deemed to be making particular investment
decisions through its investment in a separate account. For example, the IRS
has issued a favorable ruling concerning a separate account offering
sub-accounts (each funded through a single regulated investment company) with
the following investment strategies: money market, bonds, large company stock,
international stock, small company stock, mortgage-backed securities, health
care industry, emerging markets, telecommunications, financial services, South
American stock, energy, and Asian markets. Each variable annuity fund has an
investment objective and strategies that are not materially narrower than the
investment strategies described in this IRS ruling.
The above discussion addresses only one of several factors that the IRS
considers in determining whether a contract holder has an impermissible level
of investor control over a separate account. Contract holders should consult
with their insurance companies, their tax advisers, as well as the prospectus
relating to their particular contract for more information concerning this
investor control issue.
If an insurance company holding a significant interest (including through
separate accounts) in a fund redeems only a small portion of such interest, the
insurance company could be treated for federal income tax purposes as receiving
a dividend in the full amount of the redemption proceeds delivered to the
shareholder in exchange for the shares.
In the event that additional rules, regulations or other guidance are issued by
the IRS or the Treasury Department concerning this issue, such guidance could
affect the treatment of a variable annuity fund as described above, including
retroactively. In addition, there can be no assurance that a variable annuity
fund will be able to continue to operate as currently described, or that a
variable annuity fund will not have to change its investment objective or
investment policies in order to prevent, on a prospective basis, any such rules
and regulations from causing variable contract owners to be considered the
owners of the shares of the variable annuity fund.
THE FOREGOING IS ONLY A SUMMARY OF CERTAIN MATERIAL US FEDERAL INCOME TAX
CONSEQUENCES AFFECTING A FUND AND ITS SHAREHOLDERS. CURRENT AND PROSPECTIVE
SHAREHOLDERS ARE ADVISED TO CONSULT THEIR OWN TAX ADVISORS WITH RESPECT TO THE
PARTICULAR TAX CONSEQUENCES TO THEM OF AN INVESTMENT IN A FUND.
II-149
PART II: APPENDIX II-I - PROXY VOTING GUIDELINES
I. INTRODUCTION
Deutsche Asset Management ("AM") has adopted and implemented the following
policies and procedures, which it believes are reasonably designed to ensure
that proxies are voted in the best economic interest of clients, in accordance
with its fiduciary duties and local regulation. These Proxy Voting Policies,
Procedures and Guidelines shall apply to all accounts managed by US domiciled
advisers and to all US client accounts managed by non US regional offices. Non
US regional offices are required to maintain procedures and to vote proxies as
may be required by law on behalf of their non US clients. In addition, AM's
proxy policies reflect the fiduciary standards and responsibilities for ERISA
accounts.
The attached guidelines represent a set of global recommendations that were
determined by the Global Proxy Voting Sub-Committee ("the GPVSC"). These
guidelines were developed to provide AM with a comprehensive list of
recommendations that represent how AM will generally vote proxies for its
clients. The recommendations derived from the application of these guidelines
are not intended to influence the various AM legal entities either directly or
indirectly by parent or affiliated companies. In addition, the organizational
structures and documents of the various AM legal entities allows, where
necessary or appropriate, the execution by individual AM subsidiaries of the
proxy voting rights independently of any DB parent or affiliated company. This
applies in particular to non U.S. fund management companies. The individuals
that make proxy voting decisions are also free to act independently, subject to
the normal and customary supervision by the management/boards of these AM legal
entities.
II. AM'S PROXY VOTING RESPONSIBILITIES
Proxy votes are the property of AM's advisory clients./1/ As such, AM's
authority and responsibility to vote such proxies depend upon its contractual
relationships with its clients. AM has delegated responsibility for effecting
its advisory clients' proxy votes to Institutional Shareholder Services
("ISS"), an independent third-party proxy voting specialist. ISS votes AM's
advisory clients' proxies in accordance with AM's proxy guidelines or AM's
specific instructions. Where a client has given specific instructions as to how
a proxy should be voted, AM will notify ISS to carry out those instructions.
Where no specific instruction exists, AM will follow the procedures in voting
the proxies set forth in this document. Certain Taft-Hartley clients may direct
AM to have ISS vote their proxies in accordance with Taft Hartley voting
Guidelines.
---------
/1/ For purposes of these Policies and Procedures, "clients" refers to persons
or entities: for which AM serves as investment adviser or sub-adviser; for
which AM votes proxies; and that have an economic or beneficial ownership
interest in the portfolio securities of issuers soliciting such proxies.
Clients may in certain instances contract with their custodial agent and notify
AM that they wish to engage in securities lending transactions. In such cases,
it is the responsibility of the custodian to deduct the number of shares that
are on loan so that they do not get voted twice.
III. POLICIES
1. PROXY VOTING ACTIVITIES ARE CONDUCTED IN THE BEST ECONOMIC INTEREST OF
CLIENTS
AM has adopted the following policies and procedures to ensure that proxies are
voted in accordance with the best economic interest of its clients, as
determined by AM in good faith after appropriate review.
2. THE GLOBAL PROXY VOTING SUB-COMMITTEE
The Global Proxy Voting Sub-Committee (the "GPVSC") is an internal working
group established by the applicable AM's Investment Risk Oversight Committee
pursuant to a written charter. The GPVSC is responsible for overseeing AM's
proxy voting activities, including:
II-150
(i) adopting, monitoring and updating guidelines, attached as Exhibit A
(the "Guidelines"), that provide how AM will generally vote proxies
pertaining to a comprehensive list of common proxy voting matters;
(ii) voting proxies where (A) the issues are not covered by specific
client instruction or the Guidelines; (B) the Guidelines specify
that the issues are to be determined on a case-by-case basis; or (C)
where an exception to the Guidelines may be in the best economic
interest of AM's clients; and
(iii) monitoring the Proxy Vendor Oversight's proxy voting activities (see
below).AM's Proxy Vendor Oversight, a function of AM's Operations
Group, is responsible for coordinating with ISS to administer AM's
proxy voting process and for voting proxies in accordance with any
specific client instructions or, if there are none, the Guidelines,
and overseeing ISS' proxy responsibilities in this regard.
3. AVAILABILITY OF PROXY VOTING POLICIES AND PROCEDURES AND PROXY VOTING
RECORD
Copies of these Policies and Procedures, as they may be updated from time to
time, are made available to clients as required by law and otherwise at AM's
discretion. Clients may also obtain information on how their proxies were voted
by AM as required by law and otherwise at AM's discretion; however, AM must not
selectively disclose its investment company clients' proxy voting records. The
Proxy Vendor Oversight will make proxy voting reports available to advisory
clients upon request. The investment companies' proxy voting records will be
disclosed to shareholders by means of publicly-available annual filings of each
company's proxy voting record for 12-month periods ended June 30 (see
"Recordkeeping" below), if so required by relevant law.
IV. PROCEDURES
The key aspects of AM's proxy voting process are as follows:
1. THE GPVSC'S PROXY VOTING GUIDELINES
The Guidelines set forth the GPVSC's standard voting positions on a
comprehensive list of common proxy voting matters. The GPVSC has developed, and
continues to update the Guidelines based on consideration of current corporate
governance principles, industry standards, client feedback, and the impact of
the matter on issuers and the value of the investments.
The GPVSC will review the Guidelines as necessary to support the best economic
interests of AM's clients and, in any event, at least annually. The GPVSC will
make changes to the Guidelines, whether as a result of the annual review or
otherwise, taking solely into account the best economic interests of clients.
Before changing the Guidelines, the GPVSC will thoroughly review and evaluate
the proposed change and the reasons therefore, and the GPVSC Chair will ask
GPVSC members whether anyone outside of the AM organization (but within
Deutsche Bank and its affiliates) or any entity that identifies itself as a AM
advisory client has requested or attempted to influence the proposed change and
whether any member has a conflict of interest with respect to the proposed
change. If any such matter is reported to the GPVSC Chair, the Chair will
promptly notify the Conflicts of Interest Management Sub-Committee (see below)
and will defer the approval, if possible. Lastly, the GPVSC will fully document
its rationale for approving any change to the Guidelines.
The Guidelines may reflect a voting position that differs from the actual
practices of the public company(ies) within the Deutsche Bank organization or
of the investment companies for which AM or an affiliate serves as investment
adviser or sponsor. Investment companies, particularly closed-end investment
companies, are different from traditional operating companies. These
differences may call for differences in voting positions on the same matter.
Further, the manner in which AM votes investment company proxies may differ
from proposals for which a AM-advised or sponsored investment company solicits
proxies from its shareholders. As reflected in the Guidelines, proxies
solicited by closed-end (and open-end) investment companies are generally voted
in accordance with the pre-determined guidelines of ISS. See Section IV.3.B.
II-151
Funds ("Underlying Funds") in which Topiary Fund Management Fund of Funds
(each, a "Fund") invest, may from time to time seek to revise their investment
terms (i.e. liquidity, fees, etc.) or investment structure. In such event, the
Underlying Funds may require approval/consent from its investors to effect the
relevant changes. Topiary Fund Management has adopted Proxy Voting Procedures
which outline the process for these approvals.
2. SPECIFIC PROXY VOTING DECISIONS MADE BY THE GPVSC
The Proxy Vendor Oversight will refer to the GPVSC all proxy proposals (i) that
are not covered by specific client instructions or the Guidelines; or (ii)
that, according to the Guidelines, should be evaluated and voted on a
case-by-case basis.
Additionally, if, the Proxy Vendor Oversight, the GPVSC Chair or any member of
the GPVSC, a portfolio manager, a research analyst or a sub-adviser believes
that voting a particular proxy in accordance with the Guidelines may not be in
the best economic interests of clients, that individual may bring the matter to
the attention of the GPVSC Chair and/or the Proxy Vendor Oversight./2/
---------
/2/ The Proxy Vendor Oversight generally monitors upcoming proxy solicitations
for heightened attention from the press or the industry and for novel or
unusual proposals or circumstances, which may prompt the Proxy Vendor
Oversight to bring the solicitation to the attention of the GPVSC Chair. AM
portfolio managers, AM research analysts and sub-advisers also may bring a
particular proxy vote to the attention of the GPVSC Chair, as a result of
their ongoing monitoring of portfolio securities held by advisory clients
and/or their review of the periodic proxy voting record reports that the
GPVSC Chair distributes to AM portfolio managers and AM research analysts.
If the Proxy Vendor Oversight refers a proxy proposal to the GPVSC or the GPVSC
determines that voting a particular proxy in accordance with the Guidelines is
not in the best economic interests of clients, the GPVSC will evaluate and vote
the proxy, subject to the procedures below regarding conflicts.
The GPVSC endeavors to hold meetings to decide how to vote particular proxies
sufficiently before the voting deadline so that the procedures below regarding
conflicts can be completed before the GPVSC's voting determination.
3. CERTAIN PROXY VOTES MAY NOT BE CAST
In some cases, the GPVSC may determine that it is in the best economic
interests of its clients not to vote certain proxies. If the conditions below
are met with regard to a proxy proposal, AM will abstain from voting:
o Neither the Guidelines nor specific client instructions cover an issue;
o ISS does not make a recommendation on the issue;
o The GPVSC cannot convene on the proxy proposal at issue to make a
determination as to what would be in the client's best interest. (This
could happen, for example, if the Conflicts of Interest Management
Sub-committee found that there was a material conflict or if despite all
best efforts being made, the GPVSC quorum requirement could not be met).
In addition, it is AM's policy not to vote proxies of issuers subject to laws
of those jurisdictions that impose restrictions upon selling shares after
proxies are voted, in order to preserve liquidity. In other cases, it may not
be possible to vote certain proxies, despite good faith efforts to do so. For
example, some jurisdictions do not provide adequate notice to shareholders so
that proxies may be voted on a timely basis. Voting rights on securities that
have been loaned to third-parties transfer to those third-parties, with loan
termination often being the only way to attempt to vote proxies on the loaned
securities. Lastly, the GPVSC may determine that the costs to the client(s)
associated with voting a particular proxy or group of proxies outweighs the
economic benefits expected from voting the proxy or group of proxies.
The Proxy Vendor Oversight will coordinate with the GPVSC Chair regarding any
specific proxies and any categories of proxies that will not or cannot be
voted. The reasons for not voting any proxy shall be documented.
II-152
4. CONFLICT OF INTEREST PROCEDURES
A. PROCEDURES TO ADDRESS CONFLICTS OF INTEREST AND IMPROPER INFLUENCE
Overriding Principle. In the limited circumstances where the GPVSC votes
proxies,/3/ the GPVSC will vote those proxies in accordance with what it, in
good faith, determines to be the best economic interests of AM's clients./4/
---------
/3/ As mentioned above, the GPVSC votes proxies (i) where neither a specific
client instruction nor a Guideline directs how the proxy should be voted,
(ii) where the Guidelines specify that an issue is to be determined on a
case by case basis or (iii) where voting in accordance with the Guidelines
may not be in the best economic interests of clients.
/4/ The Proxy Vendor Oversight, who serves as the non-voting secretary of the
GPVSC, may receive routine calls from proxy solicitors and other parties
interested in a particular proxy vote. Any contact that attempts to exert
improper pressure or influence shall be reported to the Conflicts of
Interest Management Sub-Committee.
Independence of the GPVSC. As a matter of Compliance policy, the GPVSC and the
Proxy Vendor Oversight are structured to be independent from other parts of
Deutsche Bank. Members of the GPVSC and the employee responsible for Proxy
Vendor Oversight are employees of AM. As such, they may not be subject to the
supervision or control of any employees of Deutsche Bank Corporate and
Investment Banking division ("CIB"). Their compensation cannot be based upon
their contribution to any business activity outside of AM without prior
approval of Legal and Compliance. They can have no contact with employees of
Deutsche Bank outside of the Private Client and Asset Management division
("PCAM") regarding specific clients, business matters or initiatives without
the prior approval of Legal and Compliance. They furthermore may not discuss
proxy votes with any person outside of AM (and within AM only on a need to know
basis).
Conflict Review Procedures. There will be a committee (the "Conflicts of
Interest Management Sub-Committee") established within AM that will monitor for
potential material conflicts of interest in connection with proxy proposals
that are to be evaluated by the GPVSC. Promptly upon a determination that a
vote shall be presented to the GPVSC, the GPVSC Chair shall notify the
Conflicts of Interest Management Sub-Committee. The Conflicts of Interest
Management Sub-Committee shall promptly collect and review any information
deemed reasonably appropriate to evaluate, in its reasonable judgment, if AM or
any person participating in the proxy voting process has, or has the appearance
of, a material conflict of interest. For the purposes of this policy, a
conflict of interest shall be considered "material" to the extent that a
reasonable person could expect the conflict to influence, or appear to
influence, the GPVSC's decision on the particular vote at issue. GPVSC should
provide the Conflicts of Interest Management Sub-Committee a reasonable amount
of time (no less than 24 hours) to perform all necessary and appropriate
reviews. To the extent that a conflicts review can not be sufficiently
completed by the Conflicts of Interest Management Sub-Committee the proxies
will be voted in accordance with the standard guidelines.
The information considered by the Conflicts of Interest Management
Sub-Committee may include without limitation information regarding (i) AM
client relationships; (ii) any relevant personal conflict known by the
Conflicts of Interest Management Sub-Committee or brought to the attention of
that sub-committee; (iii) and any communications with members of the GPVSC (or
anyone participating or providing information to the GPVSC) and any person
outside of the AM organization (but within Deutsche Bank and its affiliates) or
any entity that identifies itself as a AM advisory client regarding the vote at
issue. In the context of any determination, the Conflicts of Interest
Management Sub-Committee may consult with, and shall be entitled to rely upon,
all applicable outside experts, including legal counsel.
Upon completion of the investigation, the Conflicts of Interest Management
Sub-Committee will document its findings and conclusions. If the Conflicts of
Interest Management Sub-Committee determines that (i) AM has a material
conflict of interest that would prevent it from deciding how to vote the
proxies concerned without further client consent or (ii) certain individuals
should be recused from participating in the proxy vote at issue, the Conflicts
of Interest Management Sub-Committee will so inform the GPVSC chair.
II-153
If notified that AM has a material conflict of interest as described above, the
GPVSC chair will obtain instructions as to how the proxies should be voted
either from (i) if time permits, the effected clients, or (ii) in accordance
with the standard guidelines. If notified that certain individuals should be
recused from the proxy vote at issue, the GPVSC Chair shall do so in accordance
with the procedures set forth below.
Note: Any AM employee who becomes aware of a potential, material conflict of
interest in respect of any proxy vote to be made on behalf of clients shall
notify Compliance. Compliance shall call a meeting of the conflict review
committee to evaluate such conflict and determine a recommended course of
action.
Procedures to be followed by the GPVSC. At the beginning of any discussion
regarding how to vote any proxy, the GPVSC Chair (or his or her delegate) will
inquire as to whether any GPVSC member (whether voting or ex officio) or any
person participating in the proxy voting process has a personal conflict of
interest or has actual knowledge of an actual or apparent conflict that has not
been reported to the Conflicts of Interest Management Sub-Committee.
The GPVSC Chair also will inquire of these same parties whether they have
actual knowledge regarding whether any director, officer or employee outside of
the AM organization (but within Deutsche Bank and its affiliates) or any entity
that identifies itself as a AM advisory client, has: (i) requested that AM, the
Proxy Vendor Oversight (or any member thereof) or a GPVSC member vote a
particular proxy in a certain manner; (ii) attempted to influence AM, the Proxy
Vendor Oversight (or any member thereof), a GPVSC member or any other person in
connection with proxy voting activities; or (iii) otherwise communicated with a
GPVSC member or any other person participating or providing information to the
GPVSC regarding the particular proxy vote at issue, and which incident has not
yet been reported to the Conflicts of Interest Management Sub- Committee.
If any such incidents are reported to the GPVSC Chair, the Chair will promptly
notify the Conflicts of Interest Management Sub-Committee and, if possible,
will delay the vote until the Conflicts of Interest Management Sub-Committee
can complete the conflicts report. If a delay is not possible, the Conflicts of
Interest Management Sub-Committee will instruct the GPVSC whether anyone should
be recused from the proxy voting process, or whether AM should vote the proxy
in accordance with the standard guidelines, seek instructions as to how to vote
the proxy at issue from ISS or, if time permits, the effected clients. These
inquiries and discussions will be properly reflected in the GPVSC's minutes.
Duty to Report. Any AM employee, including any GPVSC member (whether voting or
ex officio), that is aware of any actual or apparent conflict of interest
relevant to, or any attempt by any person outside of the AM organization (but
within Deutsche Bank and its affiliates) or any entity that identifies itself
as a AM advisory client to influence, how AM votes its proxies has a duty to
disclose the existence of the situation to the GPVSC Chair (or his or her
designee) and the details of the matter to the Conflicts of Interest Management
Sub-Committee. In the case of any person participating in the deliberations on
a specific vote, such disclosure should be made before engaging in any
activities or participating in any discussion pertaining to that vote.
Recusal of Members. The GPVSC will recuse from participating in a specific
proxy vote any GPVSC members (whether voting or ex officio) and/or any other
person who (i) are personally involved in a material conflict of interest; or
(ii) who, as determined by the Conflicts of Interest Management Sub-Committee,
have actual knowledge of a circumstance or fact that could effect their
independent judgment, in respect of such vote. The GPVSC will also exclude from
consideration the views of any person (whether requested or volunteered) if the
GPVSC or any member thereof knows, or if the Conflicts of Interest Management
Sub-Committee has determined, that such other person has a material conflict of
interest with respect to the particular proxy, or has attempted to influence
the vote in any manner prohibited by these policies.
If, after excluding all relevant GPVSC voting members pursuant to the paragraph
above, there are three or more GPVSC voting members remaining, those remaining
GPVSC members will determine how to vote the proxy in accordance with these
Policies and Procedures. If there are fewer than three GPVSC voting members
remaining, the GPVSC Chair will vote the proxy in accordance with the standard
guidelines, will obtain instructions as to how to have the proxy voted from, if
time permits, the effected clients and otherwise from ISS.
II-154
B. INVESTMENT COMPANIES AND AFFILIATED PUBLIC COMPANIES
Investment Companies. As reflected in the Guidelines, all proxies solicited by
open-end and closed-end investment companies are voted in accordance with the
pre-determined guidelines of ISS, unless the investment company client directs
AM to vote differently on a specific proxy or specific categories of proxies.
However, regarding investment companies for which AM or an affiliate serves as
investment adviser or principal underwriter, such proxies are voted in the same
proportion as the vote of all other shareholders (i.e., "mirror" or "echo"
voting). Master fund proxies solicited from feeder funds are voted in
accordance with applicable provisions of Section 12 of the Investment Company
Act of 1940.
Subject to participation agreements with certain Exchange Traded Funds ("ETF")
issuers that have received exemptive orders from the U.S. Securities and
Exchange Commission allowing investing DWS funds to exceed the limits set forth
in Section 12(d)(1)(A) and (B) of the Investment Company Act of 1940, DeAM will
echo vote proxies for ETFs in which Deutsche Bank holds more than 25% of
outstanding voting shares globally when required to do so by participation
agreements and SEC orders.
Affiliated Public Companies. For proxies solicited by non-investment company
issuers of or within the Deutsche Bank organization, e.g., Deutsche bank
itself, these proxies will be voted in the same proportion as the vote of other
shareholders (i.e., "mirror" or "echo" voting).
Note: With respect to the QP Trust (not registered under the Investment Company
Act of 1940), the Fund is not required to engage in echo voting and the
investment adviser will use these Guidelines, and may determine, with respect
to the QP Trust, to vote contrary to the positions in the Guidelines,
consistent with the Fund's best interest.
C. OTHER PROCEDURES THAT LIMIT CONFLICTS OF INTEREST
AM and other entities in the Deutsche Bank organization have adopted a number
of policies, procedures and internal controls that are designed to avoid
various conflicts of interest, including those that may arise in connection
with proxy voting, including:
o Deutsche Bank Americas Restricted Activities Policy. This policy provides
for, among other things, independence of AM employees from CIB, and
information barriers between AM and other affiliates. Specifically, no AM
employee may be subject to the supervision or control of any employee of
CIB. No AM employee shall have his or her compensation based upon his or
her contribution to any business activity within the Bank outside of the
business of AM, without the prior approval of Legal or Compliance. Further,
no employee of CIB shall have any input into the compensation of a AM
employee without the prior approval of Legal or Compliance. Under the
information barriers section of this policy, as a general rule, AM
employees who are associated with the investment process should have no
contact with employees of Deutsche Bank or its affiliates, outside of PCAM,
regarding specific clients, business matters, or initiatives. Further,
under no circumstances should proxy votes be discussed with any Deutsche
Bank employee outside of AM (and should only be discussed on a need-to-know
basis within AM).
Other relevant internal policies include the Deutsche Bank Americas Code of
Professional Conduct, the Deutsche Asset Management Information Sharing
Procedures, the Deutsche Asset Management Code of Ethics, the Sarbanes-Oxley
Senior Officer Code of Ethics, and the Deutsche Bank Group Code of Conduct. The
GPVSC expects that these policies, procedures and internal controls will
greatly reduce the chance that the GPVSC (or, its members) would be involved
in, aware of or influenced by, an actual or apparent conflict of interest.
V. RECORDKEEPING
At a minimum, the following types of records must be properly maintained and
readily accessible in order to evidence compliance with this policy.
o AM will maintain a record of each vote cast by AM that includes among other
things, company name, meeting date, proposals presented, vote cast and
shares voted.
II-155
o The Proxy Vendor Oversight maintains records for each of the proxy ballots
it votes. Specifically, the records include, but are not limited to:
- The proxy statement (and any additional solicitation materials) and
relevant portions of annual statements.
- Any additional information considered in the voting process that may be
obtained from an issuing company, its agents or proxy research firms.
- Analyst worksheets created for stock option plan and share increase
analyses.
- Proxy Edge print-screen of actual vote election.
o AM will retain these Policies and Procedures and the Guidelines; will
maintain records of client requests for proxy voting information; and will
retain any documents the Proxy Vendor Oversight or the GPVSC prepared that
were material to making a voting decision or that memorialized the basis
for a proxy voting decision.
o The GPVSC also will create and maintain appropriate records documenting its
compliance with these Policies and Procedures, including records of its
deliberations and decisions regarding conflicts of interest and their
resolution.
o With respect to AM's investment company clients, ISS will create and
maintain records of each company's proxy voting record for 12-month periods
ended June 30. AM will compile the following information for each matter
relating to a portfolio security considered at any shareholder meeting held
during the period covered by the report and with respect to which the
company was entitled to vote:
- The name of the issuer of the portfolio security;
- The exchange ticker symbol of the portfolio security (if symbol is
available through reasonably practicable means);
- The Council on Uniform Securities Identification Procedures number for
the portfolio security (if the number is available through reasonably
practicable means);
- The shareholder meeting date;
- A brief identification of the matter voted on;
- Whether the matter was proposed by the issuer or by a security holder;
- Whether the company cast its vote on the matter;
- How the company cast its vote (e.g., for or against proposal, or
abstain; for or withhold regarding election of directors); and
- Whether the company cast its vote for or against management.
Note: This list is intended to provide guidance only in terms of the records
that must be maintained in accordance with this policy. In addition, please
note that records must be maintained in accordance with the applicable AM
Records Management Policy.
With respect to electronically stored records, "properly maintained" is defined
as complete, authentic (unalterable) usable and backed-up. At a minimum,
records should be retained for a period of not less than six years (or longer,
if necessary to comply with applicable regulatory requirements), the first
three years in an appropriate AM office.
VI. THE GPVSC'S OVERSIGHT ROLE
In addition to adopting the Guidelines and making proxy voting decisions on
matters referred to it as set forth above, the GPVSC will monitor the proxy
voting process by reviewing summary proxy information presented by ISS. The
GPVSC will use this review process to determine, among other things, whether
any changes should be made to the Guidelines. This review will take place at
least quarterly and will be documented in the GPVSC's minutes.
II-156
ATTACHMENT A - GLOBAL PROXY VOTING GUIDELINES
DEUTSCHE ASSET MANAGEMENT
GLOBAL PROXY VOTING GUIDELINES
AS AMENDED OCTOBER 2008
[GRAPHIC OMITTED]
II-157
TABLE OF CONTENTS
I BOARD OF DIRECTORS AND EXECUTIVES
A Election Of Directors
B Classified Boards Of Directors
C Board And Committee Independence
D Liability And Indemnification Of Directors
E Qualifications Of Directors
F Removal Of Directors And Filling Of Vacancies
G Proposals To Fix The Size Of The Board
H Proposals to Restrict Chief Executive Officer's
Service on Multiple Boards
I Proposals to Restrict Supervisory Board
Members Service on Multiple Boards
J Proposals to Establish Audit Committees
II CAPITAL STRUCTURE
A Authorization Of Additional Shares
B Authorization Of "Blank Check" Preferred Stock
C Stock Splits/Reverse Stock Splits
D Dual Class/Supervoting Stock
E Large Block Issuance
F Recapitalization Into A Single Class Of Stock
G Share Repurchases
H Reductions In Par Value
III CORPORATE GOVERNANCE ISSUES
A Confidential Voting
B Cumulative Voting
C Supermajority Voting Requirements
D Shareholder Right To Vote
IV COMPENSATION
A Establishment of a Remuneration Committee
B Executive And Director Stock Option Plans
C Employee Stock Option/Purchase Plans
D Golden Parachutes
E Proposals To Limit Benefits Or Executive
Compensation
F Option Expensing
G Management board election and motion
H Remuneration (variable pay)
I Long-term incentive plans
J Shareholder Proposals Concerning "Pay For
Superior Performance"
K Executive Compensation Advisory
V ANTI-TAKEOVER RELATED ISSUES
A Shareholder Rights Plans ("Poison Pills")
B Reincorporation
C Fair-Price Proposals
D Exemption From State Takeover Laws
E Non-Financial Effects Of Takeover Bids
VI MERGERS & ACQUISITIONS
II-158
VII SOCIAL & POLITICAL ISSUES
A Labor & Human Rights
B Diversity & Equality
C Health & Safety
D Government/Military
E Tobacco
VIII ENVIRONMENTAL ISSUES
IX MISCELLANEOUS ITEMS
A Ratification Of Auditors
B Limitation Of Non-Audit Services Provided By
Independent Auditor
C Audit Firm Rotation
D Transaction Of Other Business
E Motions To Adjourn The Meeting
F Bundled Proposals
G Change Of Company Name
H Proposals Related To The Annual Meeting
I Reimbursement Of Expenses Incurred From
Candidate Nomination
J Investment Company Proxies
K International Proxy Voting
II-159
These Guidelines may reflect a voting position that differs from the actual
practices of the public company (ies) within the Deutsche Bank organization or
of the investment companies for which AM or an affiliate serves as investment
adviser or sponsor.
NOTE: Because of the unique structure and regulatory scheme applicable to
closed-end investment companies, the voting guidelines (particularly those
related to governance issues) generally will be inapplicable to holdings of
closed-end investment companies. As a result, determinations on the appropriate
voting recommendation for closed-end investment company shares will be made on
a case-by-case basis.
I. BOARD OF DIRECTORS AND EXECUTIVES
A. ELECTION OF DIRECTORS
Routine: AM Policy is to vote "for" the uncontested election of directors.
Votes for a director in an uncontested election will be withheld in cases where
a director has shown an inability to perform his/her duties in the best
interests of the shareholders.
Proxy contest: In a proxy contest involving election of directors, a
case-by-case voting decision will be made based upon analysis of the issues
involved and the merits of the incumbent and dissident slates of directors. AM
will incorporate the decisions of a third party proxy research vendor,
currently, Institutional Shareholder Services ("ISS") subject to review by the
Proxy Voting Sub-Committee (GPVSC) as set forth in the AM's Proxy Voting
Policies and Procedures.
Rationale: The large majority of corporate directors fulfill their fiduciary
obligation and in most cases support for management's nominees is warranted. As
the issues relevant to a contested election differ in each instance, those
cases must be addressed as they arise.
B. CLASSIFIED BOARDS OF DIRECTORS
AM policy is to vote against proposals to classify the board and for proposals
to repeal classified boards and elect directors annually.
Rationale: Directors should be held accountable on an annual basis. By
entrenching the incumbent board, a classified board may be used as an
anti-takeover device to the detriment of the shareholders in a hostile
take-over situation.
C. BOARD AND COMMITTEE INDEPENDENCE
AM policy is to vote:
1. "For" proposals that require that a certain percentage (majority up to 66
2/3%) of members of a board of directors be comprised of independent or
unaffiliated directors.
2. "For" proposals that require all members of a company's compensation, audit,
nominating, or other similar committees be comprised of independent or
unaffiliated directors.
3. "Against" shareholder proposals to require the addition of special interest,
or constituency, representatives to boards of directors.
4. "For" separation of the Chairman and CEO positions.
5. "Against" proposals that require a company to appoint a Chairman who is an
independent director.
Rationale: Board independence is a cornerstone of effective governance and
accountability. A board that is sufficiently independent from management
assures that shareholders' interests are adequately represented. However, the
Chairman of the board must have sufficient involvement in and experience with
the operations of the company to perform the functions required of that
position and lead the company.
II-160
No director qualifies as 'independent' unless the board of directors
affirmatively determines that the director has no material relationship with
the listed company (either directly or as a partner, shareholder or officer of
an organization that has a relationship with the company).
Whether a director is in fact not "independent" will depend on the laws and
regulations of the primary market for the security and the exchanges, if any,
on which the security trades.
D. LIABILITY AND INDEMNIFICATION OF DIRECTORS
AM policy is to vote "for" management proposals to limit directors' liability
and to broaden the indemnification of directors, unless broader indemnification
or limitations on directors' liability would effect shareholders' interests in
pending litigation.
Rationale: While shareholders want directors and officers to be responsible for
their actions, it is not in the best interests of the shareholders for them to
be to risk averse. If the risk of personal liability is too great, companies
may not be able to find capable directors willing to serve. We support
expanding coverage only for actions taken in good faith and not for serious
violations of fiduciary obligation or negligence.
E. QUALIFICATIONS OF DIRECTORS
AM policy is to follow management's recommended vote on either management or
shareholder proposals that set retirement ages for directors or require
specific levels of stock ownership by directors.
Rationale: As a general rule, the board of directors, and not the shareholders,
is most qualified to establish qualification policies.
F. REMOVAL OF DIRECTORS AND FILLING OF VACANCIES
AM policy is to vote "against" proposals that include provisions that directors
may be removed only for cause or proposals that include provisions that only
continuing directors may fill board vacancies.
Rationale: Differing state statutes permit removal of directors with or without
cause. Removal of directors for cause usually requires proof of self-dealing,
fraud or misappropriation of corporate assets, limiting shareholders' ability
to remove directors except under extreme circumstances. Removal without cause
requires no such showing.
Allowing only incumbent directors to fill vacancies can serve as an
anti-takeover device, precluding shareholders from filling the board until the
next regular election.
G. PROPOSALS TO FIX THE SIZE OF THE BOARD
AM policy is to vote:
1. "For" proposals to fix the size of the board unless: (a) no specific reason
for the proposed change is given; or (b) the proposal is part of a package
of takeover defenses.
2. "Against" proposals allowing management to fix the size of the board without
shareholder approval.
Rationale: Absent danger of anti-takeover use, companies should be granted a
reasonable amount of flexibility in fixing the size of its board.
H. PROPOSALS TO RESTRICT CHIEF EXECUTIVE OFFICER'S SERVICE ON MULTIPLE BOARDS
AM policy is to vote "For" proposals to restrict a Chief Executive Officer from
serving on more than three outside boards of directors.
II-161
Rationale: Chief Executive Officer must have sufficient time to ensure that
shareholders' interests are represented adequately.
Note: A director's service on multiple closed-end fund boards within a fund
complex are treated as service on a single Board for the purpose of the proxy
voting guidelines.
I. PROPOSALS TO RESTRICT SUPERVISORY BOARD MEMBERS SERVICE ON MULTIPLE BOARDS
(FOR FFT SECURITIES)
AM policy is to vote "for" proposals to restrict a Supervisory Board Member
from serving on more than five supervisory boards.
Rationale: We consider a strong, independent and knowledgeable supervisory
board as important counter-balance to executive management to ensure that the
interests of shareholders are fully reflected by the company.
Full information should be disclosed in the annual reports and accounts to
allow all shareholders to judge the success of the supervisory board
controlling their company.
Supervisory Board Member must have sufficient time to ensure that shareholders'
interests are represented adequately.
Note: A director's service on multiple closed-end fund boards within a fund
complex are treated as service on a single Board for the purpose of the proxy
voting guidelines.
J. PROPOSALS TO ESTABLISH AUDIT COMMITTEES (FOR FFT AND U.S. SECURITIES)
AM policy is to vote "for" proposals that require the establishment of audit
committees.
Rationale: The audit committee should deal with accounting and risk management
related questions, verifies the independence of the auditor with due regard to
possible conflicts of interest. It also should determine the procedure of the
audit process.
II. CAPITAL STRUCTURE
A. AUTHORIZATION OF ADDITIONAL SHARES (FOR U.S. SECURITIES)
AM policy is to vote "for" proposals to increase the authorization of existing
classes of stock that do not exceed a 3:1 ratio of shares authorized to shares
outstanding for a large cap company, and do not exceed a 4:1 ratio of shares
authorized to shares outstanding for a small-midcap company (companies having a
market capitalization under one billion U.S. dollars.).
Rationale: While companies need an adequate number of shares in order to carry
on business, increases requested for general financial flexibility must be
limited to protect shareholders from their potential use as an anti-takeover
device. Requested increases for specifically designated, reasonable business
purposes (stock split, merger, etc.) will be considered in light of those
purposes and the number of shares required.
B. AUTHORIZATION OF "BLANK CHECK" PREFERRED STOCK (FOR U.S. SECURITIES)
AM policy is to vote:
1. "Against" proposals to create blank check preferred stock or to increase the
number of authorized shares of blank check preferred stock unless the
company expressly states that the stock will not be used for anti-takeover
purposes and will not be issued without shareholder approval.
2. "For" proposals mandating shareholder approval of blank check stock
placement.
Rationale: Shareholders should be permitted to monitor the issuance of classes
of preferred stock in which the board of directors is given unfettered
discretion to set voting, dividend, conversion and other rights for the shares
issued.
II-162
C. STOCK SPLITS/REVERSE STOCK SPLITS
AM policy is to vote "for" stock splits if a legitimate business purpose is set
forth and the split is in the shareholders' best interests. A vote is cast
"for" a reverse stock split only if the number of shares authorized is reduced
in the same proportion as the reverse split or if the effective increase in
authorized shares (relative to outstanding shares) complies with the proxy
guidelines for common stock increases (see, Section II.A, above.)
Rationale: Generally, stock splits do not detrimentally effect shareholders.
Reverse stock splits, however, may have the same result as an increase in
authorized shares and should be analyzed accordingly.
D. DUAL CLASS/SUPERVOTING STOCK
AM policy is to vote "against" proposals to create or authorize additional
shares of super-voting stock or stock with unequal voting rights.
Rationale: The "one share, one vote" principal ensures that no shareholder
maintains a voting interest exceeding their equity interest in the company.
E. LARGE BLOCK ISSUANCE (FOR U.S. SECURITIES)
AM policy is to address large block issuances of stock on a case-by-case basis,
incorporating the recommendation of an independent third party proxy research
firm (currently ISS) subject to review by the GPVSC as set forth in AM's Proxy
Policies and Procedures.
Additionally, AM supports proposals requiring shareholder approval of large
block issuances.
Rationale: Stock issuances must be reviewed in light of the business
circumstances leading to the request and the potential impact on shareholder
value.
F. RECAPITALIZATION INTO A SINGLE CLASS OF STOCK
AM policy is to vote "for" recapitalization plans to provide for a single class
of common stock, provided the terms are fair, with no class of stock being
unduly disadvantaged.
Rationale: Consolidation of multiple classes of stock is a business decision
that may be left to the board and/management if there is no adverse effect on
shareholders.
G. SHARE REPURCHASES
AM policy is to vote "for" share repurchase plans provided all shareholders are
able to participate on equal terms.
Rationale: Buybacks are generally considered beneficial to shareholders because
they tend to increase returns to the remaining shareholders.
H. REDUCTIONS IN PAR VALUE
AM policy is to vote "for" proposals to reduce par value, provided a legitimate
business purpose is stated (e.g., the reduction of corporate tax
responsibility.)
Rationale: Usually, adjustments to par value are a routine financial decision
with no substantial impact on shareholders.
III. CORPORATE GOVERNANCE ISSUES
A. CONFIDENTIAL VOTING
AM policy is to vote "for" proposals to provide for confidential voting and
independent tabulation of voting results and to vote "against" proposals to
repeal such provisions.
II-163
Rationale: Confidential voting protects the privacy rights of all shareholders.
This is particularly important for employee-shareholders or shareholders with
business or other affiliations with the company, who may be vulnerable to
coercion or retaliation when opposing management. Confidential voting does not
interfere with the ability of corporations to communicate with all
shareholders, nor does it prohibit shareholders from making their views known
directly to management.
B. CUMULATIVE VOTING (FOR U.S. SECURITIES)
AM policy is to vote "against" shareholder proposals requesting cumulative
voting and "for" management proposals to eliminate it. The protections afforded
shareholders by cumulative voting are not necessary when a company has a
history of good performance and does not have a concentrated ownership
interest. Accordingly, a vote is cast "against" cumulative voting and "for"
proposals to eliminate it if:
a) The company has a five year return on investment greater than the relevant
industry index,
b) All directors and executive officers as a group beneficially own less than
10% of the outstanding stock, and
c) No shareholder (or voting block) beneficially owns 15% or more of the
company.
Thus, failure of any one of the three criteria results in a vote for cumulative
voting in accordance with the general policy.
Rationale: Cumulative voting is a tool that should be used to ensure that
holders of a significant number of shares may have board representation;
however, the presence of other safeguards may make their use unnecessary.
C. SUPERMAJORITY VOTING REQUIREMENTS
AM policy is to vote "against" management proposals to require a supermajority
vote to amend the charter or bylaws and to vote "for" shareholder proposals to
modify or rescind existing supermajority requirements.
* Exception made when company holds a controlling position and seeks to
lower threshold to maintain control and/or make changes to corporate
by-laws.
Rationale: Supermajority voting provisions violate the democratic principle
that a simple majority should carry the vote. Setting supermajority
requirements may make it difficult or impossible for shareholders to remove
egregious by-law or charter provisions. Occasionally, a company with a
significant insider held position might attempt to lower a supermajority
threshold to make it easier for management to approve provisions that may be
detrimental to shareholders. In that case, it may not be in the shareholders
interests to lower the supermajority provision.
D. SHAREHOLDER RIGHT TO VOTE
AM policy is to vote "against" proposals that restrict the right of
shareholders to call special meetings, amend the bylaws, or act by written
consent. Policy is to vote "for" proposals that remove such restrictions.
Rationale: Any reasonable means whereby shareholders can make their views known
to management or effect the governance process should be supported.
IV. COMPENSATION
Annual Incentive Plans or Bonus Plans are often submitted to shareholders for
approval. These plans typically award cash to executives based on company
performance. Deutsche Bank believes that the responsibility for executive
compensation decisions rest with the board of directors and/or the compensation
committee, and its policy is not to second-guess the board's award of cash
compensation amounts to executives unless a particular award or series of
awards is deemed excessive. If stock options are awarded as part of these bonus
or incentive plans, the provisions must meet Deutsche Bank's criteria regarding
stock option plans, or similar stock-based incentive compensation schemes, as
set forth below.
II-164
A. ESTABLISHMENT OF A REMUNERATION COMMITTEE (FOR FFT SECURITIES)
AM policy is to vote "for" proposals that require the establishment of a
remuneration committee.
Rationale: Corporations should disclose in each annual report or proxy
statement their policies on remuneration. Essential details regarding executive
remuneration including share options, long-term incentive plans and bonuses,
should be disclosed in the annual report, so that investors can judge whether
corporate pay policies and practices meet the standard.
The remuneration committee shall not comprise any board members and should be
sensitive to the wider scene on executive pay. It should ensure that
performance-based elements of executive pay are designed to align the interests
of shareholders.
B. EXECUTIVE AND DIRECTOR STOCK OPTION PLANS
AM policy is to vote "for" stock option plans that meet the following criteria:
(1) The resulting dilution of existing shares is less than (a) 15 percent of
outstanding shares for large capital corporations or (b) 20 percent of
outstanding shares for small-mid capital companies (companies having a
market capitalization under one billion U.S. dollars.)
(2) The transfer of equity resulting from granting options at less than FMV
is no greater than 3% of the over-all market capitalization of large
capital corporations, or 5% of market cap for small-mid capital
companies.
(3) The plan does not contain express repricing provisions and, in the
absence of an express statement that options will not be repriced; the
company does not have a history of repricing options.
(4) The plan does not grant options on super-voting stock.
AM will support performance-based option proposals as long as a) they do not
mandate that all options granted by the company must be performance based, and
b) only certain high-level executives are subject to receive the performance
based options.
AM will support proposals to eliminate the payment of outside director
pensions.
Rationale: Determining the cost to the company and to shareholders of
stock-based incentive plans raises significant issues not encountered with
cash-based compensation plans. These include the potential dilution of existing
shareholders' voting power, the transfer of equity out of the company resulting
from the grant and execution of options at less than FMV and the authority to
reprice or replace underwater options. Our stock option plan analysis model
seeks to allow reasonable levels of flexibility for a company yet still protect
shareholders from the negative impact of excessive stock compensation.
Acknowledging that small mid-capital corporations often rely more heavily on
stock option plans as their main source of executive compensation and may not
be able to compete with their large capital competitors with cash compensation,
we provide slightly more flexibility for those companies.
C. EMPLOYEE STOCK OPTION/PURCHASE PLANS
AM policy is to vote for employee stock purchase plans (ESPP's) when the plan
complies with Internal Revenue Code 423, allowing non-management employees to
purchase stock at 85% of FMV.
AM policy is to vote "for" employee stock option plans (ESOPs) provided they
meet the standards for stock option plans in general. However, when computing
dilution and transfer of equity, ESOPs are considered independently from
executive and director option plans.
Rationale: ESOPs and ESPP's encourage rank-and-file employees to acquire an
ownership stake in the companies they work for and have been shown to promote
employee loyalty and improve productivity.
II-165
D. GOLDEN PARACHUTES
AM policy is to vote "for" proposals to require shareholder approval of golden
parachutes and for proposals that would limit golden parachutes to no more than
three times base compensation. Policy is to vote "against" more restrictive
shareholder proposals to limit golden parachutes.
Rationale: In setting a reasonable limitation, AM considers that an effective
parachute should be less attractive than continued employment and that the IRS
has opined that amounts greater than three times annual salary, are excessive.
E. PROPOSALS TO LIMIT BENEFITS OR EXECUTIVE COMPENSATION
AM policy is to vote "against"
1. Proposals to limit benefits, pensions or compensation and
2. Proposals that request or require disclosure of executive compensation
greater than the disclosure required by Securities and Exchange Commission
(SEC) regulations.
Rationale: Levels of compensation and benefits are generally considered to be
day-to-day operations of the company, and are best left unrestricted by
arbitrary limitations proposed by shareholders.
F. OPTION EXPENSING
AM policy is to support proposals requesting companies to expense stock
options.
Rationale: Although companies can choose to expense options voluntarily, the
Financial Accounting Standards Board (FASB) does not yet require it, instead
allowing companies to disclose the theoretical value of options as a footnote.
Because the expensing of stock options lowers earnings, most companies elect
not to do so. Given the fact that options have become an integral component of
compensation and their exercise results in a transfer of shareholder value, AM
agrees that their value should not be ignored and treated as "no cost"
compensation. The expensing of stock options would promote more modest and
appropriate use of stock options in executive compensation plans and present a
more accurate picture of company operational earnings.
G. MANAGEMENT BOARD ELECTION AND MOTION (FOR FFT SECURITIES)
AM policy is to vote "against":
o the election of board members with positions on either remuneration or audit
committees;
o the election of supervisory board members with too many supervisory board
mandates;
o "automatic" election of former board members into the supervisory board.
Rationale: Management as an entity, and each of its members, are responsible
for all actions of the company, and are - subject to applicable laws and
regulations - accountable to the shareholders as a whole for their actions.
Sufficient information should be disclosed in the annual company report and
account to allow shareholders to judge the success of the company.
H. REMUNERATION (VARIABLE PAY): (FOR FFT SECURITIES)
EXECUTIVE REMUNERATION FOR MANAGEMENT BOARD
AM policy is to vote "for" remuneration for Management Board that is
transparent and linked to results.
II-166
Rationale: Executive compensation should motivate management and align the
interests of management with the shareholders. The focus should be on criteria
that prevent excessive remuneration; but enable the company to hire and retain
first-class professionals.
Shareholder interests are normally best served when management is remunerated
to optimise long-term returns. Criteria should include suitable measurements
like return on capital employed or economic value added.
Interests should generally also be correctly aligned when management own shares
in the company - even more so if these shares represent a substantial portion
of their own wealth.
Its disclosure shall differentiate between fixed pay, variable (performance
related) pay and long-term incentives, including stock option plans with
valuation ranges as well as pension and any other significant arrangements.
EXECUTIVE REMUNERATION FOR SUPERVISORY BOARD
AM policy is to vote "for" remuneration for Supervisory Board that is at least
50% in fixed form.
Rationale: It would normally be preferable if performance linked compensation
were not based on dividend payments, but linked to suitable result based
parameters. Consulting and procurement services should also be published in the
company report.
I. LONG-TERM INCENTIVE PLANS (FOR FFT SECURITIES)
AM policy is to vote "for" long-term incentive plans for members of a
management board that reward for above average company performance.
Rationale: Incentive plans will normally be supported if they:
o directly align the interests of members of management boards with those of
shareholders;
o establish challenging performance criteria to reward only above average
performance;
o measure performance by total shareholder return in relation to the market or
a range of comparable companies;
o are long-term in nature and encourage long-term ownership of the shares once
exercised through minimum holding periods;
o do not allow a repricing of the exercise price in stock option plans.
J. SHAREHOLDER PROPOSALS CONCERNING "PAY FOR SUPERIOR PERFORMANCE"
AM policy is to address pay for superior performance proposals on a
case-by-case basis, incorporating the recommendation of an independent third
party proxy research firm (currently ISS) subject to review by the GPVSC as set
forth in AM's Proxy Policies and Procedures.
Rationale: While AM agrees that compensation issues are better left to the
discretion of management, they appreciate the need to monitor for excessive
compensation practices on a case by case basis. If, after a review of the ISS
metrics, AM is comfortable with ISS's applying this calculation and will vote
according to their recommendation.
K. EXECUTIVE COMPENSATION ADVISORY
AM policy is to follow management's recommended vote on shareholder proposals
to propose an advisory resolution seeking to ratify the compensation of the
company's named executive officers (NEOs) on an annual basis.
II-167
Rationale: AM believes that controls exist within senior management and
corporate compensation committees, ensuring fair compensation to executives.
This might allow shareholders to require approval for all levels of
management's compensation.
V. ANTI-TAKEOVER RELATED ISSUES
A. SHAREHOLDER RIGHTS PLANS ("POISON PILLS")
AM policy is to vote "for" proposals to require shareholder ratification of
poison pills or that request boards to redeem poison pills, and to vote
"against" the adoption of poison pills if they are submitted for shareholder
ratification.
Rationale: Poison pills are the most prevalent form of corporate takeover
defenses and can be (and usually are) adopted without shareholder review or
consent. The potential cost of poison pills to shareholders during an attempted
takeover outweighs the benefits.
B. REINCORPORATION
AM policy is to examine reincorporation proposals on a case-by-case basis. The
voting decision is based on: (1) differences in state law between the existing
state of incorporation and the proposed state of incorporation; and (2)
differences between the existing and the proposed charter/bylaws/articles of
incorporation and their effect on shareholder rights. If changes resulting from
the proposed reincorporation violate the corporate governance principles set
forth in these guidelines, the reincorporation will be deemed contrary to
shareholder's interests and a vote cast "against."
Rationale: Reincorporations can be properly analyzed only by looking at the
advantages and disadvantages to their shareholders. Care must be taken that
anti-takeover protection is not the sole or primary result of a proposed
change.
C. FAIR-PRICE PROPOSALS
AM policy is to vote "for" management fair-price proposals, provided that: (1)
the proposal applies only to two-tier offers; (2) the proposal sets an
objective fair-price test based on the highest price that the acquirer has paid
for a company's shares; (3) the supermajority requirement for bids that fail
the fair-price test is no higher than two-thirds of the outstanding shares; (4)
the proposal contains no other anti-takeover provisions or provisions that
restrict shareholders rights.
A vote is cast for shareholder proposals that would modify or repeal existing
fair-price requirements that do not meet these standards.
Rationale: While fair price provisions may be used as anti-takeover devices, if
adequate provisions are included, they provide some protection to shareholders
who have some say in their application and the ability to reject those
protections if desired.
D. EXEMPTION FROM STATE TAKEOVER LAWS
AM policy is to vote "for" shareholder proposals to opt out of state takeover
laws and to vote "against" management proposals requesting to opt out of state
takeover laws.
Rationale: Control share statutes, enacted at the state level, may harm
long-term share value by entrenching management. They also unfairly deny
certain shares their inherent voting rights.
E.NON-FINANCIAL EFFECTS OF TAKEOVER BIDS
Policy is to vote "against" shareholder proposals to require consideration of
non-financial effects of merger or acquisition proposals.
Rationale: Non-financial effects may often be subjective and are secondary to
AM's stated purpose of acting in its client's best economic interest.
II-168
VI. MERGERS & ACQUISITIONS
Evaluation of mergers, acquisitions and other special corporate transactions
(i.e., takeovers, spin-offs, sales of assets, reorganizations, restructurings
and recapitalizations) are performed on a case-by-case basis incorporating
information from an independent proxy research source (currently ISS.)
Additional resources including portfolio management and research analysts may
be considered as set forth in AM's Policies and Procedures.
VII. SOCIAL, ENVIRONMENTAL & POLITICAL ISSUES
Social and environmental issues are becoming increasingly important to
corporate success. We incorporate social and environmental considerations into
both our investment decisions and our proxy voting decisions - particularly if
the financial performance of the company could be impacted.
With increasing frequency, shareholder proposals are submitted relating to
social and political responsibility issues. Almost universally, the company
management will recommend a vote "against" these proposals. These types of
proposals cover an extremely wide range of issues. Many of the issues tend to
be controversial and are subject to more than one reasonable, yet opposing,
theory of support. More so than with other types of proxy proposals, social and
political responsibility issues may not have a connection to the economic and
corporate governance principles effecting shareholders' interests. AM's policy
regarding social and political responsibility issues, as with any other issue,
is designed to protect our client shareholders' economic interests.
Occasionally, a distinction is made between a shareholder proposal requesting
direct action on behalf of the board and a request for a report on (or
disclosure of) some information. In order to avoid unduly burdening any company
with reporting requirements, AM's policy is to vote against shareholder
proposals that demand additional disclosure or reporting than is required by
the Securities and Exchange Commission unless it appears there is a legitimate
issue and the company has not adequately addressed shareholders' concerns.
A. LABOR & HUMAN RIGHTS
AM policy is to vote "against" adopting global codes of conduct or workplace
standards exceeding those mandated by law.
Rationale: Additional requirements beyond those mandated by law are deemed
unnecessary and potentially burdensome to companies
B. DIVERSITY & EQUALITY
1. AM policy is to vote "against" shareholder proposals to force equal
employment opportunity, affirmative action or board diversity.
Rationale: Compliance with State and Federal legislation along with information
made available through filings with the EEOC provides sufficient assurance that
companies act responsibly and make information public.
2. AM policy is also to vote "against" proposals to adopt the Mac Bride
Principles. The Mac Bride Principles promote fair employment, specifically
regarding religious discrimination.
Rationale: Compliance with the Fair Employment Act of 1989 makes adoption of
the Mac Bride Principles redundant. Their adoption could potentially lead to
charges of reverse discrimination.
C. HEALTH & SAFETY
1. AM policy is to vote "against" adopting a pharmaceutical price restraint
policy or reporting pricing policy changes.
Rationale: Pricing is an integral part of business for pharmaceutical companies
and should not be dictated by shareholders (particularly pursuant to an
arbitrary formula.) Disclosing pricing policies may also jeopardize a company's
competitive position in the marketplace.
II-169
2. AM policy is to vote "against" shareholder proposals to control the use or
labeling of and reporting on genetically engineered products.
Rationale: Additional requirements beyond those mandated by law are deemed
unnecessary and potentially burdensome to companies.
D. GOVERNMENT/MILITARY
1. AM policy is to vote against shareholder proposals regarding the production
or sale of military arms or nuclear or space-based weapons, including
proposals seeking to dictate a company's interaction with a particular
foreign country or agency.
Rationale: Generally, management is in a better position to determine what
products or industries a company can and should participate in. Regulation of
the production or distribution of military supplies is, or should be, a matter
of government policy.
2. AM policy is to vote "against" shareholder proposals regarding political
contributions and donations.
Rationale: The Board of Directors and Management, not shareholders, should
evaluate and determine the recipients of any contributions made by the company.
3. AM policy is to vote "against" shareholder proposals regarding charitable
contributions and donations.
Rationale: The Board of Directors and Management, not shareholders, should
evaluate and determine the recipients of any contributions made by the company.
E. TOBACCO
1. AM policy is to vote "against" shareholder proposals requesting additional
standards or reporting requirements for tobacco companies as well as
"against" requesting companies to report on the intentional manipulation of
nicotine content.
Rationale: Where a tobacco company's actions meet the requirements of legal and
industry standards, imposing additional burdens may detrimentally effect a
company's ability to compete. The disclosure of nicotine content information
could affect the company's rights in any pending or future litigation.
2. Shareholder requests to spin-off or restructure tobacco businesses will be
opposed.
Rationale: These decisions are more appropriately left to the Board and
management, and not to shareholder mandate.
VIII. ENVIRONMENTAL ISSUES
AM policy is to follow management's recommended vote on CERES Principles or
other similar environmental mandates (e.g., those relating to Greenhouse gas
emissions or the use of nuclear power).
Rationale: Environmental issues are extensively regulated by outside agencies
and compliance with additional requirements often involves significant cost to
companies.
IX. MISCELLANEOUS ITEMS
A. RATIFICATION OF AUDITORS
AM policy is to vote "for" a) the management recommended selection of auditors
and b) proposals to require shareholder approval of auditors.
II-170
Rationale: Absent evidence that auditors have not performed their duties
adequately, support for management's nomination is warranted.
B. LIMITATION OF NON-AUDIT SERVICES PROVIDED BY INDEPENDENT AUDITOR
AM policy is to support proposals limiting non-audit fees to 50% of the
aggregate annual fees earned by the firm retained as a company's independent
auditor.
Rationale: In the wake of financial reporting problems and alleged audit
failures at a number of companies, AM supports the general principle that
companies should retain separate firms for audit and consulting services to
avoid potential conflicts of interest. However, given the protections afforded
by the recently enacted Sarbanes-Oxley Act of 2002 (which requires Audit
Committee pre-approval for non-audit services and prohibits auditors from
providing specific types of services), and the fact that some non-audit
services are legitimate audit-related services, complete separation of audit
and consulting fees may not be warranted. A reasonable limitation is
appropriate to help ensure auditor independence and it is reasonable to expect
that audit fees exceed non-audit fees.
C. AUDIT FIRM ROTATION
AM policy is to support proposals seeking audit firm rotation unless the
rotation period sought is less than five years.
Rationale: While the Sarbanes-Oxley Act mandates that the lead audit partner be
switched every five years, AM believes that rotation of the actual audit firm
would provide an even stronger system of checks and balances on the audit
function.
D. Transaction of Other Business
AM policy is to vote against "transaction of other business" proposals.
Rationale: This is a routine item to allow shareholders to raise other issues
and discuss them at the meeting. As the nature of these issues may not be
disclosed prior to the meeting, we recommend a vote against these proposals.
This protects shareholders voting by proxy (and not physically present at a
meeting) from having action taken at the meeting that they did not receive
proper notification of or sufficient opportunity to consider.
E. MOTIONS TO ADJOURN THE MEETING
AM Policy is to vote against proposals to adjourn the meeting.
Rationale: Management may seek authority to adjourn the meeting if a favorable
outcome is not secured. Shareholders should already have had enough information
to make a decision. Once votes have been cast, there is no justification for
management to continue spending time and money to press shareholders for
support.
F. BUNDLED PROPOSALS
AM policy is to vote against bundled proposals if any bundled issue would
require a vote against it if proposed individually.
Rationale: Shareholders should not be forced to "take the good with the bad" in
cases where the proposals could reasonably have been submitted separately.
G. CHANGE OF COMPANY NAME
AM policy is to support management on proposals to change the company name.
Rationale: This is generally considered a business decision for a company.
II-171
H. PROPOSALS RELATED TO THE ANNUAL MEETING
AM Policy is to vote in favor of management for proposals related to the
conduct of the annual meeting (meeting time, place, etc.)
Rationale: These are considered routine administrative proposals.
I. REIMBURSEMENT OF EXPENSES INCURRED FROM CANDIDATE NOMINATION
AM policy is to follow management's recommended vote on shareholder proposals
related to the amending of company bylaws to provide for the reimbursement of
reasonable expenses incurred in connection with nominating one or more
candidates in a contested election of directors to the corporation's board of
directors.
Rationale: Corporations should not be liable for costs associated with
shareholder proposals for directors.
J. INVESTMENT COMPANY PROXIES
Proxies solicited by investment companies are voted in accordance with the
recommendations of an independent third party, currently ISS. However,
regarding investment companies for which AM or an affiliate serves as
investment adviser or principal underwriter, such proxies are voted in the same
proportion as the vote of all other shareholders. Proxies solicited by master
funds from feeder funds will be voted in accordance with applicable provisions
of Section 12 of the Investment Company Act of 1940.
Investment companies, particularly closed-end investment companies, are
different from traditional operating companies. These differences may call for
differences in voting positions on the same matter. For example, AM could vote
"for" staggered boards of closed-end investment companies, although AM
generally votes "against" staggered boards for operating companies. Further,
the manner in which AM votes investment company proxies may differ from
proposals for which a AM-advised investment company solicits proxies from its
shareholders. As reflected in the Guidelines, proxies solicited by closed-end
(and open-end) investment companies are voted in accordance with the
pre-determined guidelines of an independent third-party.
Subject to participation agreements with certain Exchange Traded Funds ("ETF")
issuers that have received exemptive orders from the U.S. Securities and
Exchange Commission allowing investing DWS funds to exceed the limits set forth
in Section 12(d)(1)(A) and (B) of the Investment Company Act of 1940, DeAM will
echo vote proxies for ETFs in which Deutsche Bank holds more than 25% of
outstanding voting shares globally when required to do so by participation
agreements and SEC orders.
Note: With respect to the QP Trust (not registered under the Investment Company
Act of 1940), the Fund is not required to engage in echo voting and the
investment adviser will use these Guidelines, and may determine, with respect
to the QP Trust, to vote contrary to the positions in the Guidelines,
consistent with the Fund's best interest.
K. INTERNATIONAL PROXY VOTING
The above guidelines pertain to issuers organized in the United States, Canada
and Germany. Proxies solicited by other issuers are voted in accordance with
international guidelines or the recommendation of ISS and in accordance with
applicable law and regulation.
IMPORTANT: The information contained herein is the property of Deutsche Bank
Group and may not be copied, used or disclosed in whole or in part, stored in
a retrieval system or transmitted in any form or by any means (electronic,
mechanical, reprographic, recording or otherwise) without the prior written
permission of Deutsche Bank Group.
-------------------------------------------------------------------------------
II-172
DECEMBER 31, 2010
ANNUAL REPORT
DWS VARIABLE SERIES I
DWS Bond VIP DWS Growth & Income VIP DWS Capital Growth VIP DWS Global Opportunities VIP DWS International VIP DWS Health Care VIP |

Contents
Performance Summary, Information About Your Fund's Expenses, Management Summary, Portfolio Summary, Investment Portfolio, Statement of Assets and Liabilities, Statement of Operations, Statement of Changes in Net Assets and Financial Highlights for:
4 DWS Bond VIP 21 DWS Growth & Income VIP 36 DWS Capital Growth VIP 48 DWS Global Opportunities VIP 61 DWS International VIP 73 DWS Health Care VIP 84 Notes to Financial Statements 94 Report of Independent Registered Public Accounting Firm 95 Tax Information 95 Proxy Voting 96 Investment Management Agreement Approval 109 Summary of Management Fee Evaluation by Independent Fee Consultant 111 Board Members and Officers |
This report must be preceded or accompanied by a prospectus. To obtain an additional prospectus or summary prospectus, if available, call (800) 728-3337 or your financial representative. We advise you to consider the Fund's objectives, risks, charges and expenses carefully before investing. The summary prospectus and prospectus contain this and other important information about the Fund. Please read the prospectus carefully before you invest.
Investments in variable insurance portfolios (VIPs) involve risk. Stocks may decline in value. Bond investments are subject to interest-rate and credit risks. When interest rates rise, bond prices generally fall. Credit risk refers to the ability of an issuer to make timely payments of principal and interest. Investing in derivatives entails special risks relating to liquidity, leverage and credit that may reduce returns and/or increased volatility. Investing in foreign securities, particularly those of emerging markets, presents certain risks, such as currency fluctuations, political and economic changes, and market risks. There are additional risks associated with investing in commodities, high-yield bonds, aggressive growth stocks, non-diversified/ concentrated funds and small- and mid-cap stocks which are more fully explained in the prospectuses. Please read the prospectus for more information.
DWS Investments is part of Deutsche Bank's Asset Management division and, within the US, represents the retail asset management activities of Deutsche Bank AG, Deutsche Bank Trust Company Americas, Deutsche Investment Management Americas Inc. and DWS Trust Company.
NOT FDIC/NCUA INSURED NO BANK GUARANTEE MAY LOSE VALUE NOT A DEPOSIT
NOT INSURED BY ANY FEDERAL GOVERNMENT AGENCY
Performance Summary December 31, 2010
DWS Bond VIP
All performance shown is historical, assumes reinvestment of all dividend and capital gain distributions, and does not guarantee future results. Investment return and principal value fluctuate with changing market conditions so that, when redeemed, shares may be worth more or less than their original cost. Current performance may be lower or higher than the performance data quoted. Please contact your participating insurance company for the Fund's most recent month-end performance. Performance doesn't reflect charges and fees ("contract charges") associated with the separate account that invests in the Fund or any variable life insurance policy or variable annuity contract for which the Fund is an investment option. These charges and fees will reduce returns.
The gross expense ratio of the Fund, as stated in the fee table of the prospectus dated May 1, 2010 is 0.59% for Class A shares and may differ from the expense ratio disclosed in the Financial Highlights table in this report.
Fund returns during 5-year and 10-year periods shown reflect a fee waiver and/or expense reimbursement. Without this waiver/reimbursement, returns would have been lower.
Risk Considerations
Bond investments are subject to interest-rate and credit risks. When interest rates rise, bond prices generally fall. Credit risk refers to the ability of an issuer to make timely payments of principal and interest. Investments in lower-quality and non-rated securities present greater risk of loss than investments in higher-quality securities. Investing in foreign securities, particularly those of emerging markets, presents certain risks, such as currency fluctuations, political and economic changes, and market risks. See the prospectus for details.
Growth of an Assumed $10,000 Investment |
[] DWS Bond VIP — Class A [] Barclays Capital US Aggregate Bond Index | The Barclays Capital US Aggregate Bond Index is an unmanaged, market-value-weighted measure of Treasury issues, agency issues, corporate bond issues and mortgage securities. Index returns, unlike fund returns, do not reflect any fees or expenses. It is not possible to invest directly into an index. |
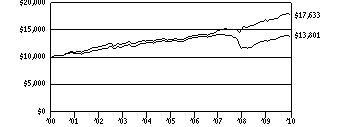 | |
Yearly periods ended December 31 | |
Comparative Results |
DWS Bond VIP | 1-Year | 3-Year | 5-Year | 10-Year |
Class A | Growth of $10,000 | $10,679 | $9,783 | $10,672 | $13,801 |
Average annual total return | 6.79% | -.73% | 1.31% | 3.27% |
Barclays Capital US Aggregate Bond Index | Growth of $10,000 | $10,654 | $11,877 | $13,255 | $17,633 |
Average annual total return | 6.54% | 5.90% | 5.80% | 5.84% |
The growth of $10,000 is cumulative.
Information About Your Fund's Expenses
DWS Bond VIP
As an investor of the Fund, you incur two types of costs: ongoing expenses and transaction costs. Ongoing expenses include management fees, distribution and service (12b-1) fees and other Fund expenses. Examples of transaction costs include contract charges, redemption fees and account maintenance fees, which are not shown in this section. The following tables are intended to help you understand your ongoing expenses (in dollars) of investing in the Fund and to help you compare these expenses with the ongoing expenses of investing in other mutual funds. The example in the table is based on an investment of $1,000 invested at the beginning of the six-month period and held for the entire period (July 1, 2010 to December 31, 2010).
The tables illustrate your Fund's expenses in two ways:
• Actual Fund Return. This helps you estimate the actual dollar amount of ongoing expenses (but not transaction costs) paid on a $1,000 investment in the Fund using the Fund's actual return during the period. To estimate the expenses you paid over the period, simply divide your account value by $1,000 (for example, an $8,600 account value divided by $1,000 = 8.6), then multiply the result by the number in the "Expenses Paid per $1,000" line under the share class you hold.
• Hypothetical 5% Fund Return. This helps you to compare your Fund's ongoing expenses (but not transaction costs) with those of other mutual funds using the Fund's actual expense ratio and a hypothetical rate of return of 5% per year before expenses. Examples using a 5% hypothetical Fund return may be found in the shareholder reports of other mutual funds. The hypothetical account values and expenses may not be used to estimate the actual ending account balance or expenses you paid for the period.
Please note that the expenses shown in these tables are meant to highlight your ongoing expenses only and do not reflect any transaction costs. The "Expenses Paid per $1,000" line of the tables is useful in comparing ongoing expenses only and will not help you determine the relative total expense of owning different funds. If these transaction costs had been included, your costs would have been higher.
Expenses and Value of a $1,000 Investment for the six months ended December 31, 2010 |
Actual Fund Return | Class A |
Beginning Account Value 7/1/10 | $ 1,000.00 |
Ending Account Value 12/31/10 | $ 1,019.80 |
Expenses Paid per $1,000* | $ 2.95 |
Hypothetical 5% Fund Return | Class A |
Beginning Account Value 7/1/10 | $ 1,000.00 |
Ending Account Value 12/31/10 | $ 1,022.28 |
Expenses Paid per $1,000* | $ 2.96 |
* Expenses are equal to the Fund's annualized expense ratio for each share class, multiplied by the average account value over the period, multiplied by the number of days in the most recent six-month period, then divided by 365.
Annualized Expense Ratio | Class A |
DWS Variable Series I — DWS Bond VIP | .58% |
For more information, please refer to the Fund's prospectus.
These tables do not reflect charges and fees ("contract charges") associated with the separate account that invests in the Fund or any variable life insurance policy or variable annuity contract for which the Fund is an investment option.
Management Summary December 31, 2010
DWS Bond VIP
During the 12-month period ended December 31, 2010, the US Federal Reserve Board (the Fed) maintained the benchmark federal funds rate at near-zero levels and engaged in bond purchases designed to lower longer-term interest rates as it sought to stimulate economic growth.1 Treasury yields fell for most of the year, before rising in the fourth quarter as market participants reacted to better economic data and the extension of Bush-era tax cuts. For the year, credit-sensitive sectors outperformed as investors sought yield in an environment of low interest rates. Corporate bonds benefited as corporate profits and balance sheets displayed strength throughout the period, with below-investment-grade issues leading returns. Among other credit sectors, commercial mortgage-backed securities were standout performers despite an ongoing soft leasing environment in many markets.2
During the 12-month period, the Fund provided a total return of 6.79% (Class A shares, unadjusted for contract charges), compared with the 6.54% return of its benchmark, the Barclays Capital US Aggregate Bond Index. (Past performance is no guarantee of future results.)
The Fund's performance versus the benchmark continued to be driven principally by exposure to more credit-sensitive fixed-income sectors. Our overweight in investment-grade corporate bonds was the leading contributor to returns, while our high-yield corporate and emerging-market holdings added to performance as well.3 Currency weightings also added to performance, in particular our exposure to the Australian and Canadian dollars. On the downside, our underweighting early in the period of commercial mortgage-backed securities constrained returns. In addition, our positions in the bonds of a pair of Irish banks suffered as the crisis with respect to European sovereign debt played out over the period. The Fund's positioning with respect to overall duration and interest rate exposure was essentially a neutral factor for performance.4 During the period, we maintained a somewhat conservative stance with respect to interest rate exposure as we monitored the impact of Fed bond purchases on inflation expectations and rates. In addition, we closely watched economic data which appeared to indicate that the recovery is taking hold, a trend that we believe could bode well for continued outperformance by credit-oriented sectors.
Kenneth R. Bowling, CFA
Jamie Guenther, CFA
John Brennan
Bruce Harley, CFA, CEBS
J. Richard Robben, CFA
David Vignolo, CFA
J. Kevin Horsley, CFA, CPA
Stephen Willer, CFA
William Chepolis, CFA (joined the Fund on 2/1/2011)
Portfolio Managers
The Barclays Capital US Aggregate Bond Index is an unmanaged, market-value-weighted measure of Treasury issues, agency issues, corporate bond issues and mortgage securities.
Index returns, unlike fund returns, do not reflect any fees or expenses. It is not possible to invest directly into an index.
1 The federal funds rate is the interest rate, set by the US Federal Reserve Board, at which banks lend money to each other, usually on an overnight basis.
2 Commercial mortgage-backed securities (CMBS) are secured by loans on a commercial property.
3 "Overweight" means the Fund holds a higher weighting in a given sector or security than the benchmark. "Underweight" means the Fund holds a lower weighting.
4 Effective duration is an approximate measure of the Fund's sensitivity to interest rate changes taking into consideration any maturity shortening features.
Portfolio management market commentary is as of December 31, 2010, and may not come to pass. This information is subject to change at any time based on market and other conditions. Past performance does not guarantee future results. Current and future portfolio holdings are subject to risk.
Portfolio Summary
DWS Bond VIP
Asset Allocation (As a % of Investment Portfolio excluding Securities Lending Collateral) | 12/31/10 | 12/31/09 |
| | |
Corporate Bonds | 31% | 24% |
Mortgage-Backed Securities Pass-Throughs | 28% | 32% |
Government & Agency Obligations | 21% | 24% |
Commercial Mortgage-Backed Securities | 9% | 3% |
Municipal Bonds and Notes | 5% | 3% |
Collateralized Mortgage Obligations | 4% | 3% |
Cash Equivalents | 2% | 10% |
Asset-Backed | — | 1% |
| 100% | 100% |
Quality (Excludes Cash Equivalents and Securities Lending Collateral) | 12/31/10 | 12/31/09 |
| | |
US Government & Treasury Obligations | 47% | 59% |
AAA | 5% | 3% |
AA | 5% | 6% |
A | 10% | 9% |
BBB | 17% | 15% |
BB or Below | 14% | 7% |
Not Rated | 2% | 1% |
| 100% | 100% |
Interest Rate Sensitivity | 12/31/10 | 12/31/09 |
| | |
Effective Maturity | 7.30 years | 7.88 years |
Effective Duration | 4.91 years | 4.65 years |
Effective maturity is the weighted average of the bonds held by the Fund taking into consideration any maturity shortening features.
Effective duration is an approximate measure of the Fund's sensitivity to interest rate changes taking into consideration any maturity shortening features.
Asset allocation, quality and interest rate sensitivity are subject to change.
The quality ratings represent the lower of Moody's Investors Service, Inc. ("Moody's") or Standard & Poor's Corporation ("S&P") credit ratings. The ratings of Moody's and S&P represent their opinions as to the quality of the securities they rate. Ratings are relative and subjective and are not absolute standards of quality. The Fund's credit quality does not remove market risk.
For more complete details about the Fund's investment portfolio, see page 8.
Following the Fund's fiscal first and third quarter-end, a complete portfolio holdings listing is filed with the SEC on Form N-Q. The form will be available on the SEC's Web site at www.sec.gov, and it also may be reviewed and copied at the SEC's Public Reference Room in Washington, D.C. Information on the operation of the SEC's Public Reference Room may be obtained by calling (800) SEC-0330. The Fund's portfolio holdings are also posted on www.dws-investments.com from time to time. Please see the Fund's current prospectus for more information.
Investment Portfolio December 31, 2010
DWS Bond VIP
| Principal Amount ($) (a) | Value ($) |
| |
Corporate Bonds 37.3% |
Consumer Discretionary 10.7% |
AMC Entertainment, Inc., 8.75%, 6/1/2019 | | 1,200,000 | 1,281,000 |
Cablevision Systems Corp., 8.625%, 9/15/2017 | | 1,500,000 | 1,633,125 |
CBS Corp., 5.9%, 10/15/2040 | | 600,000 | 577,966 |
Comcast Corp., 5.15%, 3/1/2020 | | 450,000 | 472,655 |
DIRECTV Holdings LLC, 6.35%, 3/15/2040 | | 815,000 | 857,355 |
Expedia, Inc.: |
| 5.95%, 8/15/2020 | | 2,075,000 | 2,085,375 |
| 7.456%, 8/15/2018 | | 1,150,000 | 1,311,000 |
Home Depot, Inc., 5.4%, 9/15/2040 | | 420,000 | 407,870 |
JC Penney Co., Inc., 5.65%, 6/1/2020 | | 1,500,000 | 1,436,250 |
Levi Strauss & Co., 7.625%, 5/15/2020 | | 1,700,000 | 1,755,250 |
Lowe's Companies, Inc.: |
| 2.125%, 4/15/2016 | | 250,000 | 244,490 |
| 3.75%, 4/15/2021 | | 500,000 | 483,405 |
MGM Resorts International, 144A, 9.0%, 3/15/2020 | | 750,000 | 825,000 |
NBC Universal, Inc., 144A, 5.95%, 4/1/2041 | | 500,000 | 499,949 |
Norcraft Companies LP, 10.5%, 12/15/2015 | | 100,000 | 106,250 |
Royal Caribbean Cruises Ltd., 7.25%, 6/15/2016 | | 1,100,000 | 1,185,250 |
Time Warner Cable, Inc., 7.3%, 7/1/2038 | | 40,000 | 46,772 |
Time Warner, Inc.: |
| 6.2%, 3/15/2040 | | 400,000 | 425,222 |
| 7.625%, 4/15/2031 | | 400,000 | 486,273 |
Yum! Brands, Inc.: |
| 3.875%, 11/1/2020 | | 465,000 | 444,208 |
| 5.3%, 9/15/2019 | | 135,000 | 142,988 |
| 16,707,653 |
Consumer Staples 2.3% |
Anheuser-Busch InBev Worldwide, Inc., 144A, 7.75%, 1/15/2019 | | 750,000 | 933,261 |
CVS Caremark Corp.: |
| 6.125%, 9/15/2039 | | 500,000 | 534,229 |
| 6.25%, 6/1/2027 | | 332,000 | 365,103 |
Kraft Foods, Inc., 5.375%, 2/10/2020 | | 1,335,000 | 1,436,819 |
Kroger Co., 5.4%, 7/15/2040 | | 375,000 | 355,431 |
| 3,624,843 |
Energy 4.9% |
Chesapeake Energy Corp., 9.5%, 2/15/2015 | | 550,000 | 620,125 |
DCP Midstream LLC, 144A, 9.75%, 3/15/2019 | | 980,000 | 1,266,474 |
Enterprise Products Operating LLC, 6.125%, 10/15/2039 | | 460,000 | 478,772 |
| Principal Amount ($) (a) | Value ($) |
| |
Kinder Morgan Energy Partners LP: |
| 6.5%, 9/1/2039 | | 500,000 | 516,517 |
| 6.95%, 1/15/2038 | | 510,000 | 554,166 |
ONEOK Partners LP, 6.15%, 10/1/2016 | | 482,000 | 541,702 |
Plains All American Pipeline LP, 8.75%, 5/1/2019 | | 1,200,000 | 1,489,194 |
Reliance Holdings USA, Inc., 144A, 4.5%, 10/19/2020 | | 650,000 | 620,199 |
Weatherford International Ltd., 5.125%, 9/15/2020 | | 1,000,000 | 995,032 |
Williams Partners LP, 4.125%, 11/15/2020 | | 570,000 | 539,898 |
| 7,622,079 |
Financials 10.0% |
American Express Co., 7.0%, 3/19/2018 | | 1,138,000 | 1,325,512 |
Bank of America Corp.: |
| 5.75%, 12/1/2017 | | 710,000 | 738,844 |
| 6.5%, 8/1/2016 | | 175,000 | 189,891 |
Citigroup, Inc., 5.375%, 8/9/2020 | | 1,500,000 | 1,558,511 |
Discover Bank, 8.7%, 11/18/2019 | | 710,000 | 835,751 |
Fifth Third Bancorp., 5.45%, 1/15/2017 | | 651,000 | 665,428 |
Ford Motor Credit Co., LLC: |
| 7.0%, 4/15/2015 | | 900,000 | 967,151 |
| 8.0%, 6/1/2014 | | 1,500,000 | 1,652,560 |
Hartford Financial Services Group, Inc., 5.95%, 10/15/2036 | | 300,000 | 283,030 |
JPMorgan Chase & Co., 5.125%, 9/15/2014 | | 1,500,000 | 1,596,106 |
KeyBank NA, 5.7%, 11/1/2017 | | 800,000 | 814,681 |
Lincoln National Corp., 8.75%, 7/1/2019 | | 500,000 | 625,424 |
MetLife, Inc., Series A, 6.817%, 8/15/2018 | | 400,000 | 466,353 |
Morgan Stanley: |
| 3.45%, 11/2/2015 | | 170,000 | 165,743 |
| Series F, 6.625%, 4/1/2018 | | 475,000 | 515,265 |
PNC Bank NA, 6.875%, 4/1/2018 | | 200,000 | 228,612 |
Prudential Financial, Inc.: |
| Series B, 5.1%, 9/20/2014 | | 150,000 | 161,125 |
| 6.2%, 1/15/2015 | | 100,000 | 110,281 |
| 7.375%, 6/15/2019 | | 120,000 | 141,485 |
Qtel International Finance Ltd., 144A, 5.0%, 10/19/2025 | | 935,000 | 846,390 |
Red Arrow International Leasing PLC, "A", 8.375%, 6/30/2012 | RUB | 1,076,482 | 35,240 |
The Goldman Sachs Group, Inc., 6.0%, 6/15/2020 | | 800,000 | 864,531 |
Toll Brothers Finance Corp., 8.91%, 10/15/2017 | | 350,000 | 412,950 |
Travelers Companies, Inc., 5.35%, 11/1/2040 | | 280,000 | 275,873 |
| 15,476,737 |
| Principal Amount ($) (a) | Value ($) |
| |
Health Care 2.2% |
Express Scripts, Inc.: |
| 6.25%, 6/15/2014 | | 385,000 | 430,415 |
| 7.25%, 6/15/2019 | | 720,000 | 852,208 |
HCA, Inc., 9.25%, 11/15/2016 | | 725,000 | 773,485 |
Laboratory Corp. of America Holdings, 4.625%, 11/15/2020 | | 455,000 | 450,896 |
Medco Health Solutions, Inc., 7.125%, 3/15/2018 | | 715,000 | 839,050 |
| 3,346,054 |
Industrials 0.9% |
CSX Corp.: |
| 6.15%, 5/1/2037 | | 400,000 | 430,065 |
| 6.25%, 3/15/2018 | | 800,000 | 917,729 |
| 1,347,794 |
Materials 2.5% |
ArcelorMittal, 6.125%, 6/1/2018 | | 500,000 | 532,743 |
Corporacion Nacional del Cobre — Codelco, REG S, 7.5%, 1/15/2019 | | 600,000 | 730,404 |
Dow Chemical Co., 4.25%, 11/15/2020 | | 455,000 | 435,844 |
Exopack Holding Corp., 11.25%, 2/1/2014 | | 420,000 | 435,750 |
International Paper Co., 7.3%, 11/15/2039 | | 770,000 | 877,371 |
United States Steel Corp., 7.375%, 4/1/2020 | | 800,000 | 820,000 |
| 3,832,112 |
Telecommunication Services 2.5% |
American Tower Corp., 5.05%, 9/1/2020 | | 1,200,000 | 1,180,121 |
Frontier Communications Corp., 8.125%, 10/1/2018 | | 1,000,000 | 1,097,500 |
Qwest Communications International, Inc., 8.0%, 10/1/2015 | | 750,000 | 806,250 |
Windstream Corp., 8.625%, 8/1/2016 | | 775,000 | 815,687 |
| 3,899,558 |
Utilities 1.3% |
CMS Energy Corp., 5.05%, 2/15/2018 | | 500,000 | 494,392 |
DTE Energy Co., 7.625%, 5/15/2014 | | 152,000 | 175,199 |
Energy Future Competitive Holdings Co., 7.48%, 1/1/2017 | | 26,811 | 22,709 |
FirstEnergy Solutions Corp., 6.8%, 8/15/2039 | | 517,000 | 501,077 |
Majapahit Holding BV, REG S, 7.75%, 10/17/2016 | | 100,000 | 115,679 |
Sempra Energy, 6.5%, 6/1/2016 | | 650,000 | 754,592 |
| 2,063,648 |
Total Corporate Bonds (Cost $55,757,794) | 57,920,478 |
|
Mortgage-Backed Securities Pass-Throughs 34.3% |
Federal Home Loan Mortgage Corp.: |
| 4.5%, 12/1/2034 | | 775,838 | 800,265 |
| 5.5%, with various maturities from 10/1/2023 until 8/1/2024 | 379,240 | 407,623 |
| Principal Amount ($) (a) | Value ($) |
| |
| 5.508%**, 2/1/2038 | | 453,527 | 476,403 |
| 6.5%, 3/1/2026 | | 755,865 | 841,826 |
| 7.0%, 1/1/2038 | | 138,275 | 155,014 |
Federal National Mortgage Association: | |
| 3.274%**, 8/1/2037 | | 118,346 | 123,960 |
| 3.5%, 7/1/2025 (b) | | 7,500,000 | 7,553,906 |
| 4.0%, with various maturities from 9/1/2039 until 9/1/2040 (b) | | 9,694,996 | 9,650,741 |
| 4.5%, 6/1/2034 | | 708,667 | 732,004 |
| 5.0%, with various maturities from 2/1/2021 until 8/1/2040 | | 3,158,126 | 3,329,400 |
| 5.152%**, 9/1/2038 | | 207,642 | 220,428 |
| 5.39%**, 1/1/2038 | | 528,565 | 555,702 |
| 5.5%, with various maturities from 12/1/2032 until 4/1/2037 (b) | | 11,703,856 | 12,535,844 |
| 6.0%, with various maturities from 4/1/2024 until 8/1/2035 (b) | | 7,535,326 | 8,203,130 |
| 6.5%, with various maturities from 3/1/2017 until 1/1/2036 (b) | | 2,376,536 | 2,641,875 |
| 8.0%, 9/1/2015 | | 15,745 | 17,070 |
Government National Mortgage Association: | |
| 4.5%, 6/1/2039 (b) | | 1,600,000 | 1,661,375 |
| 5.0%, 4/1/2038 (b) | | 1,600,000 | 1,701,125 |
| 5.5%, 3/1/2036 (b) | | 1,600,000 | 1,729,125 |
Total Mortgage-Backed Securities Pass-Throughs (Cost $52,686,995) | 53,336,816 |
|
Commercial Mortgage-Backed Securities 10.5% |
Banc of America Commercial Mortgage, Inc., "A4", Series 2007-4, 5.742%**, 2/10/2051 | | 600,000 | 639,110 |
Bear Stearns Commercial Mortgage Securities, Inc., "A4", Series 2007-PW18, 5.7%, 6/13/2050 | | 1,738,000 | 1,810,887 |
Citigroup/Deutsche Bank Commercial Mortgage Trust, "A4", Series 2006-CD2, 5.347%**, 1/15/2046 | | 1,850,000 | 1,985,417 |
Greenwich Capital Commercial Funding Corp., "A4", Series 2006-GG7, 5.883%**, 7/10/2038 | | 2,375,000 | 2,591,122 |
GS Mortgage Securities Corp. II: |
| "J", Series 2007-GG10, 144A, 5.807%**, 8/10/2045* | | 1,096,000 | 9,316 |
| "K", Series 2007-GG10, 144A, 5.807%**, 8/10/2045* | | 767,000 | 4,602 |
JPMorgan Chase Commercial Mortgage Securities Corp.: | | |
| "A4", Series 2005-CB12, 4.895%, 9/12/2037 | | 1,500,000 | 1,588,678 |
| "A4", Series 2006-CB16, 5.552%, 5/12/2045 | | 640,000 | 683,772 |
| "E", Series 2007-LD11, 5.817%**, 6/15/2049 | | 590,000 | 78,486 |
| "F", Series 2007-LD11, 5.817%**, 6/15/2049 | | 650,000 | 52,710 |
| "G", Series 2007-LD11, 144A, 5.817%**, 6/15/2049 | | 760,000 | 51,987 |
| Principal Amount ($) (a) | Value ($) |
| |
| "H", Series 2007-LD11, 144A, 5.817%**, 6/15/2049 | | 460,000 | 13,800 |
| "A4", Series 2006-LDP7, 5.872%**, 4/15/2045 | | 1,500,000 | 1,640,413 |
| "A4", Series 2007-LD12, 5.882%, 2/15/2051 | | 1,380,000 | 1,461,081 |
LB-UBS Commercial Mortgage Trust: | |
| "A3", Series 2006-C7, 5.347%, 11/15/2038 | | 1,750,000 | 1,850,204 |
| "A4", Series 2007-C6, 5.858%, 7/15/2040 | | 1,000,000 | 1,050,670 |
Merrill Lynch Mortgage Trust, "ASB", Series 2007-C1, 5.826%**, 6/12/2050 | | 590,000 | 634,212 |
Wachovia Bank Commercial Mortgage Trust, "H", Series 2007-C32, 144A, 5.744%**, 6/15/2049 | | 770,000 | 99,366 |
Total Commercial Mortgage-Backed Securities (Cost $19,898,506) | 16,245,833 |
|
Collateralized Mortgage Obligations 5.4% |
Countrywide Home Loans, "A2", Series 2006-1, 6.0%, 3/25/2036 | | 641,046 | 555,359 |
CS First Boston Mortgage Securities Corp., "10A3", Series 2005-10, 6.0%, 11/25/2035 | | 159,455 | 101,141 |
FDIC Structured Sale Guaranteed Notes, "1A", Series 2010-S1, 144A, 0.811%**, 2/25/2048 | | 1,731,716 | 1,734,435 |
Federal Home Loan Mortgage Corp.: | | |
| "PD", Series 2774, 5.0%, 8/15/2032 | | 1,010,000 | 1,070,640 |
| "PE", Series 2898, 5.0%, 5/15/2033 | | 335,000 | 358,212 |
| "KG", Series 2987, 5.0%, 12/15/2034 | | 1,470,000 | 1,575,346 |
Federal National Mortgage Association: | |
| ''IO", Series 2010-143, Interest Only, 5.0%, 12/25/2025 | | 5,832,053 | 536,170 |
| "EG", Series 2005-22, 5.0%, 11/25/2033 | | 750,000 | 803,109 |
| "TC", Series 2007-77, 5.5%, 9/25/2034 | | 370,000 | 395,535 |
Government National Mortgage Association: | |
| "IP", Series 2010-79, Interest Only, 4.5%, 5/20/2039 | | 2,338,103 | 397,549 |
| "KI", Series 2010-130, Interest Only, 5.5%, 9/16/2040 | | 480,000 | 73,333 |
MASTR Alternative Loans Trust, "8A1", Series 2004-3, 7.0%, 4/25/2034 | | 12,467 | 11,822 |
NCUA Guaranteed Notes, "1A", Series 2010-R1, 0.716%**, 10/7/2020 | | 776,434 | 775,463 |
Structured Asset Securities Corp., "2A1", Series 2003-1, 6.0%, 2/25/2018 | | 1,979 | 2,030 |
Total Collateralized Mortgage Obligations (Cost $8,330,639) | 8,390,144 |
| Principal Amount ($) (a) | Value ($) |
| |
Government & Agency Obligations 25.1% |
Sovereign Bonds 4.8% |
Kingdom of Morocco, REG S, 4.5%, 10/5/2020 | EUR | 625,000 | 799,065 |
Republic of Argentina: |
| GDP Linked Note, Zero Coupon, 12/15/2035 (g) | | 410,000 | 62,115 |
| 8.28%, 12/31/2033 | | 650,476 | 603,316 |
Republic of Egypt, 9.1%, 9/20/2012 | EGP | 230,000 | 39,673 |
Republic of El Salvador, REG S, 8.25%, 4/10/2032 | | 40,000 | 44,400 |
Republic of Lithuania, REG S, 5.125%, 9/14/2017 | | 200,000 | 196,500 |
Republic of Panama: |
| 5.2%, 1/30/2020 | | 425,000 | 450,500 |
| 7.125%, 1/29/2026 | | 220,000 | 264,550 |
| 7.25%, 3/15/2015 | | 80,000 | 92,400 |
Republic of Peru, 7.125%, 3/30/2019 | | 600,000 | 717,000 |
Republic of Poland, 6.375%, 7/15/2019 | | 560,000 | 627,318 |
Republic of Serbia, REG S, 6.75%, 11/1/2024 | | 480,667 | 470,573 |
Republic of Sri Lanka, 144A, 6.25%, 10/4/2020 | | 825,000 | 836,344 |
Russian Federation, 144A, 5.0%, 4/29/2020 | | 2,200,000 | 2,200,000 |
| 7,403,754 |
US Government Sponsored Agency 0.8% |
Federal National Mortgage Association, 6.625%, 11/15/2030 | | 950,000 | 1,198,680 |
US Treasury Obligations 19.5% |
US Treasury Bills, 0.185%***, 3/17/2011 (c) | | 969,000 | 968,784 |
US Treasury Bond, 4.75%, 2/15/2037 (d) | | 3,600,000 | 3,868,877 |
US Treasury Note, 1.75%, 1/31/2014 (d) | | 25,000,000 | 25,523,450 |
| 30,361,111 |
Total Government & Agency Obligations (Cost $38,267,988) | 38,963,545 |
|
Loan Participations and Assignments 0.2% |
Sovereign Loans |
Gazprom, 144A, 8.125%, 7/31/2014 | | 205,000 | 231,650 |
Russian Agricultural Bank, REG S, 7.75%, 5/29/2018 | | 100,000 | 108,250 |
Total Loan Participations and Assignments (Cost $302,745) | 339,900 |
|
Municipal Bonds and Notes 6.2% |
California, University Revenues, Build America Bonds, 5.946%, 5/15/2045 | 420,000 | 391,885 |
Gwinnett County, GA, Development Authority Revenue, Gwinnett Stadium Project, 6.4%, 1/1/2028 | 655,000 | 729,441 |
| Principal Amount ($) (a) | Value ($) |
| |
Jicarilla, NM, Sales & Special Tax Revenue, Apache Nation Revenue, 144A, 5.2%, 12/1/2013 | 410,000 | 405,957 |
Kentucky, Asset/Liability Commission, General Fund Revenue, 3.165%, 4/1/2018 | 1,800,000 | 1,759,248 |
Los Angeles, CA, Community Development Agency Tax Allocation Revenue, Adelante Eastside Project, Series C, 6.49%, 9/1/2037 INS: Radian | 315,000 | 256,684 |
Louisville & Jefferson County, KY, Metropolitan Sewer District & Drain Systems, Build America Bonds, 6.25%, 5/15/2043 | 400,000 | 402,744 |
Nashville & Davidson County, TN, Metropolitan Government, Convention Center Authority Revenue, Build America Bonds, Series B, 6.731%, 7/1/2043 | 400,000 | 400,632 |
New Jersey, Economic Development Authority Revenue, Series B, 6.5%, 11/1/2013 INS: AGC | 860,000 | 959,975 |
Pennsylvania, State General Obligation, First Series, 5.25%, 2/1/2014 INS: NATL | 625,000 | 700,944 |
Port Authority New York & New Jersey, One Hundred Fiftieth Series, 4.75%, 9/15/2016 | 930,000 | 975,961 |
Rhode Island, Convention Center Authority Revenue, Civic Center, Series A, 6.06%, 5/15/2035 INS: AGMC | 515,000 | 491,233 |
| Principal Amount ($) (a) | Value ($) |
| |
Virgin Islands, Port Authority Marine Revenue, Series B, 5.08%, 9/1/2013 INS: AGMC | 895,000 | 910,126 |
Virginia, College Building Authority, Educational Facilities Revenue, 21st Century College, Series B, 5.0%, 2/1/2014 | 930,000 | 1,034,197 |
Washington, Central Puget Sound Regional Transit Authority, Sales & Use Tax Revenue, Series A, 5.0%, 11/1/2036 | 285,000 | 284,364 |
Total Municipal Bonds and Notes (Cost $9,625,860) | 9,703,391 |
|
Shares
| Value ($) |
| |
Securities Lending Collateral 17.9% |
Daily Assets Fund Institutional, 0.27% (e) (f) (Cost $27,864,495) | 27,864,495 | 27,864,495 |
|
Cash Equivalents 2.0% |
Central Cash Management Fund, 0.19% (e) (Cost $3,051,609) | 3,051,609 | 3,051,609 |
| % of Net Assets | Value ($) |
| |
Total Investment Portfolio (Cost $215,786,631)+ | 138.9 | 215,816,211 |
Other Assets and Liabilities, Net | (38.9) | (60,438,518) |
Net Assets | 100.0 | 155,377,693 |
* Non-income producing security.
** These securities are shown at their current rate as of December 31, 2010. Floating rate securities' yields vary with a designated market index or market rate, such as the coupon-equivalent of the US Treasury bill rate.
*** Annualized yield at time of purchase; not a coupon rate.
+ The cost for federal income tax purposes was $215,805,423. At December 31, 2010, net unrealized appreciation for all securities based on tax cost was $10,788. This consisted of aggregate gross unrealized appreciation for all securities in which there was an excess of value over tax cost of $5,609,966 and aggregate gross unrealized depreciation for all securities in which there was an excess of tax cost over value of $5,599,178.
(a) Principal amount stated in US dollars unless otherwise noted.
(b) When-issued or delayed delivery security included.
(c) At December 31, 2010, this security has been pledged, in whole or in part, to cover initial margin requirements for open futures contracts.
(d) All or a portion of these securities were on loan (see Notes to Financial Statements). The value of all securities loaned at December 31, 2010 amounted to $27,157,007, which is 17.5% of net assets.
(e) Affiliated fund managed by Deutsche Investment Management Americas Inc. The rate shown is the annualized seven-day yield at period end.
(f) Represents collateral held in connection with securities lending. Income earned by the Fund is net of borrower rebates.
(g) Security is linked to Argentine Republic Gross Domestic Product (GDP). Security does not pay principal over life of security or at expiration. Payments are based on growth of Argentina GDP, subject to certain conditions.
144A: Security exempt from registration under Rule 144A of the Securities Act of 1933. These securities may be resold in transactions exempt from registration, normally to qualified institutional buyers.
AGC: Assured Guaranty Corp.
AGMC: Assured Guaranty Municipal Corp.
FDIC: Federal Deposit Insurance Corp.
GDP: Gross Domestic Product
INS: Insured
Interest Only: Interest Only (IO) bonds represent the "interest only" portion of payments on a pool of underlying mortgages or mortgage-backed securities. IO securities are subject to prepayment risk of the pool of underlying mortgages.
NATL: National Public Finance Guaranty Corp.
Radian: Radian Asset Assurance, Inc.
REG S: Securities sold under Regulation S may not be offered, sold or delivered within the United States or to, or for the account or benefit of, US persons, except pursuant to an exemption from, or in a transaction not subject to, the registration requirements of the Securities Act of 1933.
Included in the Fund are investments in mortgage- or asset-backed securities which are interests in separate pools of mortgages or assets. Effective maturities of these investments may be shorter than stated maturities due to prepayments. Some separate investments in the Federal Home Loan Mortgage Corp. and Federal National Mortgage Association issues have similar coupon rates and have been aggregated for presentation purposes in the investment portfolio.
At December 31, 2010, open futures contracts sold were as follows:
Futures | Currency | Expiration Date | Contracts | Notional Value ($) | Unrealized Appreciation (Depreciation) ($) |
10 Year US Treasury Note | USD | 3/22/2011 | 280 | 33,722,500 | 884,109 |
British Pound Currency | USD | 3/14/2011 | 33 | 3,213,581 | 36,094 |
Japanese Yen Currency | USD | 3/14/2011 | 14 | 2,157,400 | (59,484) |
Ultra Long Term US Treasury Bond | USD | 3/22/2011 | 8 | 1,016,750 | 27,937 |
Total net unrealized appreciation | 888,656 |
As of December 31, 2010, the Fund had the following open forward foreign currency exchange contracts:
Contracts to Deliver | | In Exchange For | | Settlement Date | | Unrealized Appreciation ($) | | Counterparty |
USD | 359,989 | | EUR | 275,000 | | 2/4/2011 | | 7,468 | | HSBC Bank USA |
EUR | 900,000 | | USD | 1,244,133 | | 2/4/2011 | | 41,548 | | HSBC Bank USA |
Total net unrealized appreciation | 49,016 | | |
As of December 31, 2010, the Fund had the following open forward foreign currency exchange contracts:
Contracts to Deliver | | In Exchange For | | Settlement Date | | Unrealized Depreciation ($) | | Counterparty |
RUB | 3,600,000 | | USD | 116,522 | | 2/4/2011 | | (990) | | JPMorgan Chase Securities, Inc. |
Currency Abbreviations |
EGP Egyptian Pound EUR Euro RUB Russian Ruble USD United States Dollar |
For information on the Fund's policy and additional disclosures regarding futures contracts and forward foreign currency exchange contracts, please refer to Note B in the accompanying Notes to Financial Statements.
Fair Value Measurements
Various inputs are used in determining the value of the Fund's investments. These inputs are summarized in three broad levels. Level 1 includes quoted prices in active markets for identical securities. Level 2 includes other significant observable inputs (including quoted prices for similar securities, interest rates, prepayment speeds, and credit risk). Level 3 includes significant unobservable inputs (including the Fund's own assumptions in determining the fair value of investments). The inputs or methodology used for valuing securities are not necessarily an indication of the risk associated with investing in those securities.
The following is a summary of the inputs used as of December 31, 2010 in valuing the Fund's investments. For information on the Fund's policy regarding the valuation of investments, please refer to the Security Valuation section of Note A in the accompanying Notes to Financial Statements.
Assets | Level 1 | Level 2 | Level 3 | Total |
|
Fixed Income Investments (h) |
Corporate Bonds | $ — | $ 57,920,478 | $ — | $ 57,920,478 |
Mortgage-Backed Securities Pass-Throughs | — | 53,336,816 | — | 53,336,816 |
Commercial Mortgage-Backed Securities | — | 16,245,833 | — | 16,245,833 |
Collateralized Mortgage Obligations | — | 8,390,144 | — | 8,390,144 |
Government & Agency Obligations | — | 38,963,545 | — | 38,963,545 |
Loan Participations and Assignments | — | 339,900 | — | 339,900 |
Municipal Bonds and Notes | — | 9,703,391 | — | 9,703,391 |
Short-Term Investments (h) | 30,916,104 | — | — | 30,916,104 |
Derivatives (i) | 888,656 | 49,016 | — | 937,672 |
Total | $ 31,804,760 | $ 184,949,123 | $ — | $ 216,753,883 |
Liabilities | | | | |
Derivatives (i) | $ — | $ (990) | $ — | $ (990) |
Total | $ — | $ (990) | $ — | $ (990) |
There have been no significant transfers in and out of Level 1 and Level 2 fair value measurements during the year ended December 31, 2010.
(h) See Investment Portfolio for additional detailed categorizations.
(i) Derivatives include unrealized appreciation (depreciation) on open futures contracts and forward foreign currency exchange contracts.
Level 3 Reconciliation
The following is a reconciliation of the Fund's Level 3 investments for which significant unobservable inputs were used in determining value:
| Government & Agency Obligations |
Balance as of December 31, 2009 | $ 41,830 |
Realized gains (loss) | — |
Change in unrealized appreciation (depreciation) | — |
Amortization premium/discount | — |
Net purchases (sales) | — |
Transfers into of Level 3 | — |
Transfers (out) of Level 3 | (41,830) (j) |
Balance as of December 31, 2010 | $ — |
Net change in unrealized appreciation (depreciation) from investments still held as of December 31, 2010 | $ — |
Transfers between price levels are recognized at the beginning of the reporting period.
(j) The investment was transferred from Level 3 to Level 2 as a result of the availability of a pricing source supported by observable inputs.
The accompanying notes are an integral part of the financial statements.
Statement of Assets and Liabilities
as of December 31, 2010 |
Assets |
Investments: Investments in securities, at value (cost $184,870,527), including $27,157,007 of securities loaned | $ 184,900,107 |
Investment in Daily Assets Fund Institutional (cost $27,864,495)* | 27,864,495 |
Investment in Central Cash Management Fund (cost $3,051,609) | 3,051,609 |
Total investments, at value (cost $215,786,631) | 215,816,211 |
Cash | 68,563 |
Foreign currency, at value (cost $56,665) | 55,198 |
Receivable for Fund shares sold | 117,035 |
Interest receivable | 1,710,134 |
Unrealized appreciation on open forward foreign currency exchange contracts | 49,016 |
Foreign taxes recoverable | 1,177 |
Other assets | 898 |
Total assets | 217,818,232 |
Liabilities |
Payable upon return of securities loaned | 27,864,495 |
Payable for Investments purchased | 8,062 |
Payable for investments purchased — when-issued/delayed delivery securities | 34,176,235 |
Payable for Fund shares redeemed | 61,489 |
Payable for daily variation margin on open futures contracts | 185,468 |
Unrealized depreciation on open forward foreign currency exchange contracts | 990 |
Accrued management fee | 48,171 |
Other accrued expenses and payables | 95,629 |
Total liabilities | 62,440,539 |
Net assets, at value | $ 155,377,693 |
Net Assets Consist of |
Undistributed net investment income | 4,830,117 |
Net unrealized appreciation (depreciation) on: Investments | 29,580 |
Futures | 888,656 |
Foreign currency | 46,460 |
Accumulated net realized gain (loss) | (38,064,434) |
Paid-in capital | 187,647,314 |
Net assets, at value | $ 155,377,693 |
Class A Net Asset Value, offering and redemption price per share ($155,377,693 ÷ 27,458,970 outstanding shares of beneficial interest, $.01 par value, unlimited number of shares authorized) | $ 5.66 |
* Represents collateral on securities loaned.
The accompanying notes are an integral part of the financial statements.
Statement of Operations
for the year ended December 31, 2010 |
Investment Income |
Income: Interest | $ 6,336,947 |
Dividends | 2,496 |
Income distributions — Central Cash Management Fund | 54,930 |
Securities lending income, including income from Daily Assets Fund Institutional, net of borrower rebates | 15,190 |
Total income | 6,409,563 |
Expenses: Management fee | 623,165 |
Administration fee | 159,786 |
Services to shareholders | 6,328 |
Custodian fee | 23,438 |
Professional fees | 57,501 |
Trustees' fees and expenses | 8,721 |
Reports to shareholders | 46,313 |
Other | 23,323 |
Total expenses | 948,575 |
Net investment income | 5,460,988 |
Realized and Unrealized Gain (Loss) |
Net realized gain (loss) from: Investments | 6,379,975 |
Futures | (1,314,321) |
Foreign currency | (58,246) |
Payments by affiliates (see Note H) | 7,050 |
| 5,014,458 |
Change in net unrealized appreciation (depreciation) on: Investments | (372,242) |
Futures | 332,060 |
Foreign currency | 43,683 |
| 3,501 |
Net gain (loss) | 5,017,959 |
Net increase (decrease) in net assets resulting from operations | $ 10,478,947 |
The accompanying notes are an integral part of the financial statements.
Statement of Changes in Net Assets
Increase (Decrease) in Net Assets | Years Ended December 31, |
2010 | 2009 |
Operations: Net investment income | $ 5,460,988 | $ 7,096,250 |
Net realized gain (loss) | 5,014,458 | (22,284,758) |
Change in net unrealized appreciation (depreciation) | 3,501 | 29,440,278 |
Net increase (decrease) in net assets resulting from operations | 10,478,947 | 14,251,770 |
Distributions to shareholders from: Net investment income: Class A | (6,962,542) | (11,985,798) |
Fund share transactions: Class A Proceeds from shares sold | 16,049,365 | 21,968,991 |
Reinvestment of distributions | 6,962,542 | 11,985,798 |
Cost of shares redeemed | (29,824,695) | (32,370,197) |
Net increase (decrease) in net assets from Class A share transactions | (6,812,788) | 1,584,592 |
Increase (decrease) in net assets | (3,296,383) | 3,850,564 |
Net assets at beginning of period | 158,674,076 | 154,823,512 |
Net assets at end of period (including undistributed net investment income of $4,830,117 and $6,639,923, respectively) | $ 155,377,693 | $ 158,674,076 |
Other Information |
Class A Shares outstanding at beginning of period | 28,638,100 | 28,147,936 |
Shares sold | 2,857,267 | 4,088,614 |
Shares issued to shareholders in reinvestment of distributions | 1,277,530 | 2,364,063 |
Shares redeemed | (5,313,927) | (5,962,513) |
Net increase (decrease) in Class A shares | (1,179,130) | 490,164 |
Shares outstanding at end of period | 27,458,970 | 28,638,100 |
The accompanying notes are an integral part of the financial statements.
Financial Highlights
Class A Years Ended December 31, | 2010 | 2009 | 2008 | 2007 | 2006 |
Selected Per Share Data |
Net asset value, beginning of period | $ 5.54 | $ 5.50 | $ 6.98 | $ 7.03 | $ 6.99 |
Income (loss) from investment operations: Net investment incomea | .19 | .25 | .37 | .35 | .33 |
Net realized and unrealized gain (loss) | .18 | .26 | (1.48) | (.06) | (.01) |
Total from investment operations | .37 | .51 | (1.11) | .29 | .32 |
Less distributions from: Net investment income | (.25) | (.47) | (.37) | (.34) | (.27) |
Net realized gains | — | — | — | — | (.01) |
Total distributions | (.25) | (.47) | (.37) | (.34) | (.28) |
Net asset value, end of period | $ 5.66 | $ 5.54 | $ 5.50 | $ 6.98 | $ 7.03 |
Total Return (%) | 6.79 | 10.07 | (16.77) | 4.18 | 4.72b |
Ratios to Average Net Assets and Supplemental Data |
Net assets, end of period ($ millions) | 155 | 159 | 155 | 229 | 218 |
Ratio of expenses before expense reductions (%) | .59 | .59 | .59 | .61 | .66 |
Ratio of expenses after expense reductions (%) | .59 | .59 | .59 | .61 | .62 |
Ratio of net investment income (%) | 3.42 | 4.68 | 5.76 | 5.03 | 4.82 |
Portfolio turnover rate (%) | 357 | 284 | 196 | 185 | 186 |
a Based on average shares outstanding during the period. b Total return would have been lower had certain expenses not been reduced. |
Performance Summary December 31, 2010
DWS Growth & Income VIP
All performance shown is historical, assumes reinvestment of all dividend and capital gain distributions, and does not guarantee future results. Investment return and principal value fluctuate with changing market conditions so that, when redeemed, shares may be worth more or less than their original cost. Current performance may be lower or higher than the performance data quoted. Please contact your participating insurance company for the Fund's most recent month-end performance. Performance doesn't reflect charges and fees ("contract charges") associated with the separate account that invests in the Fund or any variable life insurance policy or variable annuity contract for which the Fund is an investment option. These charges and fees will reduce returns. While all share classes have the same underlying portfolio, their performance will differ.
The gross expense ratios of the Fund, as stated in the fee table of the prospectus dated May 1, 2010 are 0.63% and 0.89% for Class A and Class B shares, respectively, and may differ from the expense ratios disclosed in the Financial Highlights tables in this report.
Fund returns during all periods shown reflect a fee waiver and/or expense reimbursement. Without this waiver/reimbursement, returns would have been lower.
Risk Considerations
Portfolio management could be wrong in its analysis of industries, companies, economic trends and favor a security that underperforms the market. Stocks may decline in value. See the prospectus for details.
Growth of an Assumed $10,000 Investment |
[] DWS Growth & Income VIP — Class A [] Russell 1000® Index | The Russell 1000® Index is an unmanaged index that measures the performance of the 1,000 largest companies in the Russell 3000 Index, which represents approximately 92% of the total market capitalization of the Russell 3000 Index. Index returns assume the reinvestment of dividends and, unlike fund returns, do not reflect any fees or expenses. It is not possible to invest directly into an index. |
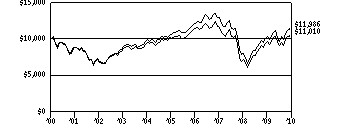 | |
Yearly periods ended December 31 | |
Comparative Results |
DWS Growth & Income VIP | 1-Year | 3-Year | 5-Year | 10-Year |
Class A | Growth of $10,000 | $11,440 | $9,467 | $10,903 | $11,010 |
Average annual total return | 14.40% | -1.81% | 1.74% | 0.97% |
Russell 1000 Index | Growth of $10,000 | $11,610 | $9,305 | $11,364 | $11,986 |
Average annual total return | 16.10% | -2.37% | 2.59% | 1.83% |
DWS Growth & Income VIP | 1-Year | 3-Year | 5-Year | 10-Year |
Class B | Growth of $10,000 | $11,412 | $9,411 | $10,768 | $10,714 |
Average annual total return | 14.12% | -2.00% | 1.49% | 0.69% |
Russell 1000 Index | Growth of $10,000 | $11,610 | $9,305 | $11,364 | $11,986 |
Average annual total return | 16.10% | -2.37% | 2.59% | 1.83% |
The growth of $10,000 is cumulative.
Information About Your Fund's Expenses
DWS Growth & Income VIP
As an investor of the Fund, you incur two types of costs: ongoing expenses and transaction costs. Ongoing expenses include management fees, distribution and service (12b-1) fees and other Fund expenses. Examples of transaction costs include contract charges, redemption fees and account maintenance fees, which are not shown in this section. The following tables are intended to help you understand your ongoing expenses (in dollars) of investing in the Fund and to help you compare these expenses with the ongoing expenses of investing in other mutual funds. The example in the table is based on an investment of $1,000 invested at the beginning of the six-month period and held for the entire period (July 1, 2010 to December 31, 2010).
The tables illustrate your Fund's expenses in two ways:
• Actual Fund Return. This helps you estimate the actual dollar amount of ongoing expenses (but not transaction costs) paid on a $1,000 investment in the Fund using the Fund's actual return during the period. To estimate the expenses you paid over the period, simply divide your account value by $1,000 (for example, an $8,600 account value divided by $1,000 = 8.6), then multiply the result by the number in the "Expenses Paid per $1,000" line under the share class you hold.
• Hypothetical 5% Fund Return. This helps you to compare your Fund's ongoing expenses (but not transaction costs) with those of other mutual funds using the Fund's actual expense ratio and a hypothetical rate of return of 5% per year before expenses. Examples using a 5% hypothetical Fund return may be found in the shareholder reports of other mutual funds. The hypothetical account values and expenses may not be used to estimate the actual ending account balance or expenses you paid for the period.
Please note that the expenses shown in these tables are meant to highlight your ongoing expenses only and do not reflect any transaction costs. The "Expenses Paid per $1,000" line of the tables is useful in comparing ongoing expenses only and will not help you determine the relative total expense of owning different funds. If these transaction costs had been included, your costs would have been higher.
Expenses and Value of a $1,000 Investment for the six months ended December 31, 2010 |
Actual Fund Return | Class A | | Class B | |
Beginning Account Value 7/1/10 | $ 1,000.00 | | $ 1,000.00 | |
Ending Account Value 12/31/10 | $ 1,217.40 | | $ 1,215.80 | |
Expenses Paid per $1,000* | $ 3.41 | | $ 4.86 | |
Hypothetical 5% Portfolio Return | Class A | | Class B | |
Beginning Account Value 7/1/10 | $ 1,000.00 | | $ 1,000.00 | |
Ending Account Value 12/31/10 | $ 1,022.13 | | $ 1,020.82 | |
Expenses Paid per $1,000* | $ 3.11 | | $ 4.43 | |
* Expenses are equal to the Fund's annualized expense ratio for each share class, multiplied by the average account value over the period, multiplied by the number of days in the most recent six-month period, then divided by 365.
Annualized Expense Ratios | Class A | | Class B | |
DWS Variable Series I — DWS Growth & Income VIP | .61% | | .87% | |
For more information, please refer to the Fund's prospectus.
These tables do not reflect charges and fees ("contract charges") associated with the separate account that invests in the Fund or any variable life insurance policy or variable annuity contract for which the Fund is an investment option.
Management Summary December 31, 2010
DWS Growth & Income VIP
US equities performed very well during 2010, as investors were cheered by gradually improving economic data and surprisingly strong corporate profits. The Russell 1000® Index — the Fund's benchmark — gained 16.10% on the year, building on its 28.43% rally of 2009. The Fund, while also producing a positive return of 14.40% (Class A shares, unadjusted for contract charges), fell short of the benchmark. (Past performance is no guarantee of future results.)
Our approach to managing the Fund is disciplined and dynamic — disciplined in the sense that we use a quantitative approach that measures numerous factors related to growth, value, quality and market sentiment, and dynamic in that we can choose to give different weightings to these factors based on a rigorous analysis of the past that seeks to determine which periods are most like now. The Fund's sentiment factors employ a variety of factors to gauge the momentum of individual stock prices. The past year was a highly rotational year for style performance, with leadership changing several times — from growth to sentiment, then to quality, and then back to sentiment. The Fund's growth and sentiment factors performed relatively well over the full year, whereas the value and quality factors were mostly weak. We started the year with healthy weightings to sentiment and growth, which added value early in the year. However, our relatively large weighting toward value throughout the year more than offset this and proved to be the biggest drag on relative performance.
From a sector perspective, our stock selection process was least effective in the information technology segment, where our overweight positions in Microsoft Corp., Computer Sciences Corp. and the disk-drive maker Western Digital Corp.* weighed on performance.1 The industrials sector was an additional area of underperformance, due in part to our overweights in Raytheon Co. and the truck manufacturer Oshkosh Corp. Our stock picks also fell short in the utilities and consumer staples sectors. On the plus side, we outperformed the benchmark by a wide margin in the energy sector. We generated strong performance by moving to overweight positions in stocks that plummeted sharply in the wake of the Gulf oil spill and then staged rebounds from undervalued levels, such as Transocean Ltd., Anadarko Petroleum Corp.* and National Oilwell Varco, Inc. We also performed very well within financials, thanks in part to our overweight positions in Berkshire Hathaway, Inc. and ACE Ltd.
Robert Wang
Russell Shtern, CFA
Portfolio Managers, QS Investors, LLC, Subadvisor to the Fund
The Russell 1000 Index is an unmanaged index that measures the performance of the 1,000 largest companies in the Russell 3000® Index, which represents approximately 92% of the total market capitalization of the Russell 3000 Index.
Index returns assume the reinvestment of dividends and, unlike fund returns, do not reflect any fees or expenses. It is not possible to invest directly into an index.
1 "Overweight" means the Fund holds a higher weighting in a given sector or security than the benchmark. "Underweight" means the Fund holds a lower weighting.
* Not held in the portfolio as of December 31, 2010.
Portfolio management market commentary is as of December 31, 2010, and may not come to pass. This information is subject to change at any time based on market and other conditions. Past performance does not guarantee future results. Current and future portfolio holdings are subject to risk.
Portfolio Summary
DWS Growth & Income VIP
Asset Allocation (As a % of Investment Portfolio excluding Securities Lending Collateral) | 12/31/10 | 12/31/09 |
| | |
Common Stocks | 99% | 98% |
Cash Equivalents | 1% | 1% |
Government & Agency Obligation | — | 1% |
| 100% | 100% |
Sector Diversification (As a % of Common Stocks) | 12/31/10 | 12/31/09 |
| | |
Information Technology | 19% | 19% |
Financials | 17% | 11% |
Health Care | 14% | 14% |
Industrials | 12% | 13% |
Energy | 11% | 9% |
Consumer Discretionary | 11% | 12% |
Consumer Staples | 7% | 11% |
Materials | 5% | 5% |
Telecommunication Services | 2% | 4% |
Utilities | 2% | 2% |
| 100% | 100% |
Asset allocation and sector diversification are subject to change.
For more complete details about the Fund's investment portfolio, see page 25.
Following the Fund's fiscal first and third quarter-end, a complete portfolio holdings listing is filed with the SEC on Form N-Q. The form will be available on the SEC's Web site at www.sec.gov, and it also may be reviewed and copied at the SEC's Public Reference Room in Washington, D.C. Information on the operation of the SEC's Public Reference Room may be obtained by calling (800) SEC-0330. The Fund's portfolio holdings are also posted on www.dws-investments.com from time to time. Please see the Fund's current prospectus for more information.
Investment Portfolio December 31, 2010
DWS Growth & Income VIP
|
Shares
| Value ($) |
| |
Common Stocks 99.0% |
Consumer Discretionary 10.4% |
Auto Components 0.1% |
Goodyear Tire & Rubber Co.* | 6,200 | 73,470 |
Diversified Consumer Services 0.5% |
Apollo Group, Inc. "A"* | 3,100 | 122,419 |
Career Education Corp.* (a) | 9,000 | 186,570 |
Coinstar, Inc.* | 1,600 | 90,304 |
DeVry, Inc. | 1,500 | 71,970 |
Sotheby's | 1,600 | 72,000 |
| 543,263 |
Hotels Restaurants & Leisure 1.0% |
Chipotle Mexican Grill, Inc.* (a) | 600 | 127,596 |
McDonald's Corp. | 3,300 | 253,308 |
Panera Bread Co. "A"* | 1,400 | 141,694 |
Starbucks Corp. | 15,000 | 481,950 |
| 1,004,548 |
Household Durables 0.2% |
Garmin Ltd. (a) | 6,200 | 192,138 |
Internet & Catalog Retail 1.0% |
Liberty Media Corp. — Interactive "A"* | 32,500 | 512,525 |
Priceline.com, Inc.* | 1,300 | 519,415 |
| 1,031,940 |
Media 2.8% |
CBS Corp. "B" | 8,400 | 160,020 |
Comcast Corp. "A" (a) | 50,400 | 1,107,288 |
Liberty Media-Starz "A"* | 1,800 | 119,664 |
McGraw-Hill Companies, Inc. | 4,400 | 160,204 |
News Corp. "A" | 9,100 | 132,496 |
Time Warner, Inc. | 19,600 | 630,532 |
Walt Disney Co. | 12,900 | 483,879 |
| 2,794,083 |
Multiline Retail 0.8% |
Dillard's, Inc. "A" (a) | 16,200 | 614,628 |
Kohl's Corp.* | 4,300 | 233,662 |
| 848,290 |
Specialty Retail 2.6% |
Advance Auto Parts, Inc. | 7,000 | 463,050 |
American Eagle Outfitters, Inc. | 9,500 | 138,985 |
AnnTaylor Stores Corp.* | 2,700 | 73,953 |
Barnes & Noble, Inc. (a) | 7,800 | 110,370 |
Chico's FAS, Inc. | 5,700 | 68,571 |
Guess?, Inc. | 2,300 | 108,836 |
Rent-A-Center, Inc. | 3,600 | 116,208 |
Ross Stores, Inc. | 2,500 | 158,125 |
The Gap, Inc. | 36,300 | 803,682 |
TJX Companies, Inc. | 13,000 | 577,070 |
| 2,618,850 |
Textiles, Apparel & Luxury Goods 1.4% |
Coach, Inc. | 6,700 | 370,577 |
Deckers Outdoor Corp.* | 2,100 | 167,454 |
NIKE, Inc. "B" (a) | 4,300 | 367,306 |
VF Corp. | 5,500 | 473,990 |
| 1,379,327 |
|
Shares
| Value ($) |
| |
Consumer Staples 6.9% |
Beverages 0.2% |
Molson Coors Brewing Co. "B" | 3,900 | 195,741 |
Food & Staples Retailing 1.4% |
Wal-Mart Stores, Inc. | 24,700 | 1,332,071 |
Whole Foods Market, Inc.* (a) | 800 | 40,472 |
| 1,372,543 |
Food Products 2.7% |
Archer-Daniels-Midland Co. | 14,500 | 436,160 |
Corn Products International, Inc. | 4,400 | 202,400 |
Fresh Del Monte Produce, Inc. | 5,700 | 142,215 |
H.J. Heinz Co. | 5,500 | 272,030 |
Hormel Foods Corp. | 2,100 | 107,646 |
The Hershey Co. | 14,500 | 683,675 |
Tyson Foods, Inc. "A" (a) | 47,700 | 821,394 |
Unilever PLC (ADR) | 2,700 | 83,376 |
| 2,748,896 |
Household Products 0.6% |
Kimberly-Clark Corp. | 2,200 | 138,688 |
Procter & Gamble Co. | 7,300 | 469,609 |
| 608,297 |
Personal Products 0.4% |
Estee Lauder Companies, Inc. "A" | 1,100 | 88,770 |
Herbalife Ltd. | 5,100 | 348,687 |
| 437,457 |
Tobacco 1.6% |
Lorillard, Inc. | 8,200 | 672,892 |
Philip Morris International, Inc. | 15,200 | 889,656 |
| 1,562,548 |
Energy 11.2% |
Energy Equipment & Services 3.4% |
Complete Production Services, Inc.* | 10,300 | 304,365 |
Diamond Offshore Drilling, Inc. | 3,000 | 200,610 |
FMC Technologies, Inc.* | 1,200 | 106,692 |
Helmerich & Payne, Inc. | 1,800 | 87,264 |
Nabors Industries Ltd.* | 11,300 | 265,098 |
National Oilwell Varco, Inc. | 15,100 | 1,015,475 |
Noble Corp. (a) | 4,500 | 160,965 |
Oceaneering International, Inc.* | 1,900 | 139,897 |
Oil States International, Inc.* | 10,000 | 640,900 |
Transocean Ltd.* (a) | 6,900 | 479,619 |
| 3,400,885 |
Oil, Gas & Consumable Fuels 7.8% |
Chevron Corp. | 12,000 | 1,095,000 |
Cimarex Energy Co. | 1,400 | 123,942 |
CNOOC Ltd. (ADR) | 400 | 95,348 |
Devon Energy Corp. | 12,100 | 949,971 |
Exxon Mobil Corp. | 27,800 | 2,032,736 |
Hess Corp. | 8,300 | 635,282 |
Murphy Oil Corp. | 9,500 | 708,225 |
Newfield Exploration Co.* | 2,600 | 187,486 |
Noble Energy, Inc. | 3,800 | 327,104 |
Occidental Petroleum Corp. | 6,200 | 608,220 |
Valero Energy Corp. | 45,100 | 1,042,712 |
| 7,806,026 |
|
Shares
| Value ($) |
| |
Financials 17.3% |
Capital Markets 1.8% |
Ameriprise Financial, Inc. | 2,700 | 155,385 |
BlackRock, Inc. | 1,700 | 323,986 |
Janus Capital Group, Inc. | 5,400 | 70,038 |
Legg Mason, Inc. | 4,400 | 159,588 |
State Street Corp. | 5,000 | 231,700 |
T. Rowe Price Group, Inc. | 4,500 | 290,430 |
The Goldman Sachs Group, Inc. | 3,400 | 571,744 |
| 1,802,871 |
Commercial Banks 4.1% |
CIT Group, Inc.* (a) | 8,100 | 381,510 |
Fifth Third Bancorp. (a) | 46,800 | 687,024 |
Huntington Bancshares, Inc. | 33,500 | 230,145 |
KeyCorp | 42,200 | 373,470 |
M&T Bank Corp. (a) | 1,700 | 147,985 |
PNC Financial Services Group, Inc. | 9,200 | 558,624 |
SunTrust Banks, Inc. | 35,600 | 1,050,556 |
Wells Fargo & Co. | 20,500 | 635,295 |
| 4,064,609 |
Consumer Finance 2.4% |
Capital One Financial Corp. (a) | 37,800 | 1,608,768 |
Discover Financial Services | 42,800 | 793,084 |
| 2,401,852 |
Diversified Financial Services 2.8% |
Bank of America Corp. | 28,500 | 380,190 |
Citigroup, Inc.* | 69,700 | 329,681 |
CME Group, Inc. | 800 | 257,400 |
JPMorgan Chase & Co. | 35,800 | 1,518,636 |
PHH Corp.* (a) | 6,900 | 159,735 |
The NASDAQ OMX Group, Inc.* (a) | 4,900 | 116,179 |
| 2,761,821 |
Insurance 5.8% |
ACE Ltd. | 20,300 | 1,263,675 |
Aflac, Inc. | 5,000 | 282,150 |
Allied World Assurance Co. Holdings Ltd. | 5,000 | 297,200 |
Arch Capital Group Ltd.* | 1,800 | 158,490 |
Aspen Insurance Holdings Ltd. | 3,900 | 111,618 |
Assurant, Inc. | 3,100 | 119,412 |
Axis Capital Holdings Ltd. | 3,000 | 107,640 |
Berkshire Hathaway, Inc. "A"* | 2 | 240,900 |
Berkshire Hathaway, Inc. "B"* | 2,100 | 168,231 |
Chubb Corp. | 15,100 | 900,564 |
Everest Re Group Ltd. | 1,800 | 152,676 |
Hartford Financial Services Group, Inc. | 9,300 | 246,357 |
Platinum Underwriters Holdings Ltd. | 2,200 | 98,934 |
The Travelers Companies, Inc. | 30,600 | 1,704,726 |
| 5,852,573 |
Real Estate Investment Trusts 0.4% |
HCP, Inc. (REIT) | 5,100 | 187,629 |
Public Storage (REIT) | 1,500 | 152,130 |
SL Green Realty Corp. (REIT) | 1,500 | 101,265 |
| 441,024 |
Health Care 13.6% |
Biotechnology 1.8% |
Biogen Idec, Inc.* | 7,500 | 502,875 |
Celgene Corp.* | 5,300 | 313,442 |
Cephalon, Inc.* (a) | 15,500 | 956,660 |
| 1,772,977 |
|
Shares
| Value ($) |
| |
Health Care Providers & Services 8.1% |
Aetna, Inc. | 19,300 | 588,843 |
AmerisourceBergen Corp. | 40,500 | 1,381,860 |
Cardinal Health, Inc. | 42,200 | 1,616,682 |
Coventry Health Care, Inc.* | 26,200 | 691,680 |
Health Net, Inc.* | 4,700 | 128,263 |
Humana, Inc.* | 15,400 | 842,996 |
UnitedHealth Group, Inc. | 47,600 | 1,718,836 |
WellPoint, Inc.* | 19,900 | 1,131,514 |
| 8,100,674 |
Pharmaceuticals 3.7% |
Eli Lilly & Co. | 35,100 | 1,229,904 |
Endo Pharmaceuticals Holdings, Inc.* | 12,700 | 453,517 |
Forest Laboratories, Inc.* | 53,400 | 1,707,732 |
Medicis Pharmaceutical Corp. "A" | 3,900 | 104,481 |
Par Pharmaceutical Companies, Inc.* | 5,900 | 227,209 |
| 3,722,843 |
Industrials 11.5% |
Aerospace & Defense 3.1% |
General Dynamics Corp. | 8,700 | 617,352 |
Honeywell International, Inc. | 6,900 | 366,804 |
Northrop Grumman Corp. (a) | 23,700 | 1,535,286 |
Raytheon Co. | 12,300 | 569,982 |
| 3,089,424 |
Air Freight & Logistics 1.6% |
FedEx Corp. | 4,300 | 399,943 |
United Parcel Service, Inc. "B" | 16,700 | 1,212,086 |
| 1,612,029 |
Airlines 0.2% |
Alaska Air Group, Inc.* | 2,700 | 153,063 |
Commercial Services & Supplies 0.4% |
Cintas | 4,400 | 123,024 |
R.R. Donnelley & Sons Co. (a) | 15,400 | 269,038 |
| 392,062 |
Construction & Engineering 0.4% |
EMCOR Group, Inc.* | 9,400 | 272,412 |
KBR, Inc. | 4,900 | 149,303 |
| 421,715 |
Electrical Equipment 0.2% |
Rockwell Automation, Inc. | 2,100 | 150,591 |
Industrial Conglomerates 1.1% |
3M Co. | 13,100 | 1,130,530 |
Machinery 2.0% |
Danaher Corp. | 7,600 | 358,492 |
Dover Corp. | 2,900 | 169,505 |
Eaton Corp. | 4,800 | 487,248 |
Ingersoll-Rand PLC (a) | 6,700 | 315,503 |
Oshkosh Corp.* | 11,300 | 398,212 |
Parker Hannifin Corp. | 1,800 | 155,340 |
Trinity Industries, Inc. (a) | 6,000 | 159,660 |
| 2,043,960 |
Professional Services 0.3% |
Manpower, Inc. (a) | 4,300 | 269,868 |
Road & Rail 1.6% |
Norfolk Southern Corp. | 12,200 | 766,404 |
Ryder System, Inc. | 16,700 | 879,088 |
| 1,645,492 |
Trading Companies & Distributors 0.6% |
W.W. Grainger, Inc. (a) | 4,500 | 621,495 |
|
Shares
| Value ($) |
| |
Information Technology 18.7% |
Communications Equipment 1.6% |
F5 Networks, Inc.* | 4,100 | 533,656 |
Nokia Corp. (ADR) (a) | 31,500 | 325,080 |
Research In Motion Ltd.* (a) | 10,100 | 587,113 |
Tellabs, Inc. | 19,100 | 129,498 |
| 1,575,347 |
Computers & Peripherals 0.7% |
Dell, Inc.* | 8,200 | 111,110 |
Lexmark International, Inc. "A"* | 15,500 | 539,710 |
| 650,820 |
Electronic Equipment, Instruments & Components 3.9% |
Anixter International, Inc. | 1,600 | 95,568 |
Arrow Electronics, Inc.* | 19,900 | 681,575 |
Avnet, Inc.* | 17,000 | 561,510 |
FLIR Systems, Inc.* | 2,400 | 71,400 |
Ingram Micro, Inc. "A"* | 23,000 | 439,070 |
Jabil Circuit, Inc. | 11,900 | 239,071 |
Power-One, Inc.* (a) | 10,600 | 108,120 |
Tech Data Corp.* | 10,700 | 471,014 |
Tyco Electronics Ltd. | 25,600 | 906,240 |
Vishay Intertechnology, Inc.* | 25,900 | 380,212 |
| 3,953,780 |
Internet Software & Services 0.8% |
AOL, Inc.* | 13,900 | 329,569 |
IAC/InterActiveCorp.* (a) | 16,300 | 467,810 |
| 797,379 |
IT Services 5.4% |
Automatic Data Processing, Inc. | 12,100 | 559,988 |
Cognizant Technology Solutions Corp. "A"* | 3,700 | 271,173 |
Computer Sciences Corp. | 26,200 | 1,299,520 |
International Business Machines Corp. | 18,800 | 2,759,088 |
Western Union Co. (a) | 29,500 | 547,815 |
| 5,437,584 |
Semiconductors & Semiconductor Equipment 3.4% |
Altera Corp. (a) | 9,800 | 348,684 |
Analog Devices, Inc. | 8,100 | 305,127 |
Fairchild Semiconductor International, Inc.* (a) | 7,900 | 123,319 |
Intel Corp. | 87,400 | 1,838,022 |
Lam Research Corp.* | 2,800 | 144,984 |
Marvell Technology Group Ltd.* | 18,000 | 333,900 |
Maxim Integrated Products, Inc. | 6,600 | 155,892 |
Micron Technology, Inc.* (a) | 23,900 | 191,678 |
| 3,441,606 |
Software 2.9% |
Activision Blizzard, Inc. | 30,000 | 373,200 |
Microsoft Corp. | 90,575 | 2,528,854 |
| 2,902,054 |
|
Shares
| Value ($) |
| |
Materials 5.3% |
Chemicals 2.4% |
Ashland, Inc. | 6,200 | 315,332 |
Cytec Industries, Inc. | 1,400 | 74,284 |
E.I. du Pont de Nemours & Co. | 19,900 | 992,612 |
Lubrizol Corp. | 8,100 | 865,728 |
Potash Corp. of Saskatchewan, Inc. (a) | 900 | 139,347 |
| 2,387,303 |
Metals & Mining 2.6% |
Barrick Gold Corp. | 6,900 | 366,942 |
Freeport-McMoRan Copper & Gold, Inc. | 10,400 | 1,248,936 |
Newmont Mining Corp. | 17,100 | 1,050,453 |
| 2,666,331 |
Paper & Forest Products 0.3% |
Domtar Corp. | 2,000 | 151,840 |
MeadWestvaco Corp. | 4,500 | 117,720 |
| 269,560 |
Telecommunication Services 2.5% |
Diversified Telecommunication Services 2.2% |
AT&T, Inc. | 15,480 | 454,803 |
Verizon Communications, Inc. | 47,800 | 1,710,284 |
| 2,165,087 |
Wireless Telecommunication Services 0.3% |
Vodafone Group PLC (ADR) | 13,300 | 351,519 |
Utilities 1.6% |
Electric Utilities 0.8% |
Duke Energy Corp. | 32,100 | 571,701 |
Exelon Corp. | 7,000 | 291,480 |
| 863,181 |
Independent Power Producers & Energy Traders 0.6% |
NRG Energy, Inc.* (a) | 31,541 | 616,311 |
Multi-Utilities 0.2% |
Ameren Corp. | 6,300 | 177,596 |
Total Common Stocks (Cost $85,529,136) | 99,325,233 |
|
Securities Lending Collateral 12.1% |
Daily Assets Fund Institutional, 0.27% (b) (c) (Cost $12,109,203) | 12,109,203 | 12,109,203 |
|
Cash Equivalents 0.9% |
Central Cash Management Fund, 0.19% (b) (Cost $862,150) | 862,150 | 862,150 |
| % of Net Assets | Value ($) |
| |
Total Investment Portfolio (Cost $98,500,489)+ | 112.0 | 112,296,586 |
Other Assets and Liabilities, Net | (12.0) | (12,016,763) |
Net Assets | 100.0 | 100,279,823 |
* Non-income producing security.
+ The cost for federal income tax purposes was $99,375,854. At December 31, 2010, net unrealized appreciation for all securities based on tax cost was $12,920,732. This consisted of aggregate gross unrealized appreciation for all securities in which there was an excess of value over tax cost of $14,304,323 and aggregate gross unrealized depreciation for all securities in which there was an excess of tax cost over value of $1,383,591.
(a) All or a portion of these securities were on loan (see Notes to Financial Statements). The value of all securities loaned at December 31, 2010 amounted to $11,776,143, which is 11.7% of net assets.
(b) Affiliated fund managed by Deutsche Investment Management Americas Inc. The rate shown is the annualized seven-day yield at period end.
(c) Represents collateral held in connection with securities lending. Income earned by the Fund is net of borrower rebates.
ADR: American Depositary Receipt
REIT: Real Estate Investment Trust
At December 31, 2010, open futures contracts purchased were as follows:
Futures | Currency | Expiration Date | Contracts | Notional Value ($) | Unrealized Appreciation ($) |
S&P 500 E-Mini Index | USD | 3/18/2011 | 16 | 1,002,400 | 14,510 |
Currency Abbreviation |
USD United States Dollar |
For information on the Fund's policy and additional disclosures regarding futures contracts, please refer to the Derivatives section of Note A in the accompanying Notes to Financial Statements.
Fair Value Measurements
Various inputs are used in determining the value of the Fund's investments. These inputs are summarized in three broad levels. Level 1 includes quoted prices in active markets for identical securities. Level 2 includes other significant observable inputs (including quoted prices for similar securities, interest rates, prepayment speeds, and credit risk). Level 3 includes significant unobservable inputs (including the Fund's own assumptions in determining the fair value of investments). The inputs or methodology used for valuing securities are not necessarily an indication of the risk associated with investing in those securities.
The following is a summary of the inputs used as of December 31, 2010 in valuing the Fund's investments. For information on the Fund's policy regarding the valuation of investments, please refer to the Security Valuation section of Note A in the accompanying Notes to Financial Statements.
Assets | Level 1 | Level 2 | Level 3 | Total |
|
Common Stocks (d) | $ 99,325,233 | $ — | $ — | $ 99,325,233 |
Short-Term Investments (d) | 12,971,353 | — | — | 12,971,353 |
Derivatives (e) | 14,510 | — | — | 14,510 |
Total | $ 112,311,096 | $ — | $ — | $ 112,311,096 |
There have been no significant transfers in and out of Level 1 and Level 2 fair value measurements during the year ended December 31, 2010.
(d) See Investment Portfolio for additional detailed categorizations.
(e) Derivatives include unrealized appreciation (depreciation) on open futures contracts.
The accompanying notes are an integral part of the financial statements.
Statement of Assets and Liabilities
as of December 31, 2010 |
Assets |
Investments: Investments in securities, at value (cost $85,529,136), including $11,776,143 of securities loaned | $ 99,325,233 |
Investment in Daily Assets Fund Institutional (cost $12,109,203)* | 12,109,203 |
Investment in Central Cash Management Fund (cost $862,150) | 862,150 |
Total investments, at value (cost $98,500,489) | 112,296,586 |
Foreign currency, at value (cost $1,777) | 1,847 |
Deposits with broker for open futures contracts | 110,209 |
Receivable for Fund shares sold | 72,187 |
Receivable for variation margin on open futures contracts | 14,510 |
Interest receivable | 2,780 |
Dividends receivable | 71,249 |
Other assets | 531 |
Total assets | 112,569,899 |
Liabilities |
Payable upon return of securities loaned | 12,109,203 |
Payable for Fund shares redeemed | 63,304 |
Accrued management fee | 34,058 |
Accrued distribution service fee (Class B) | 410 |
Other accrued expenses and payables | 83,101 |
Total liabilities | 12,290,076 |
Net assets, at value | $ 100,279,823 |
Net Assets Consist of |
Undistributed net investment income | 1,201,576 |
Net unrealized appreciation (depreciation) on: Investments | 13,796,097 |
Futures | 14,510 |
Foreign currency | 70 |
Accumulated net realized gain (loss) | (47,839,390) |
Paid-in capital | 133,106,960 |
Net assets, at value | $ 100,279,823 |
Class A Net Asset Value, offering and redemption price per share ($98,342,904 ÷ 13,004,152 outstanding shares of beneficial interest, $.01 par value, unlimited number of shares authorized) | $ 7.56 |
Class B Net Asset Value, offering and redemption price per share ($1,936,919 ÷ 256,466 outstanding shares of beneficial interest, $.01 par value, unlimited number of shares authorized) | $ 7.55 |
* Represents collateral on securities loaned.
The accompanying notes are an integral part of the financial statements.
Statement of Operations
for the year ended December 31, 2010 |
Investment Income |
Income: Dividends (net of foreign taxes withheld of $1,154) | $ 1,803,774 |
Interest | 594 |
Income distributions — Central Cash Management Fund | 1,101 |
Securities lending income, including income from Daily Assets Fund Institutional, net of borrower rebates | 68,938 |
Total income | 1,874,407 |
Expenses: Management fee | 381,068 |
Administration fee | 97,710 |
Services to shareholders | 4,142 |
Custodian fee | 23,254 |
Distribution service fee (Class B) | 4,837 |
Legal fees | 17,720 |
Audit and tax fees | 41,911 |
Trustees' fees and expenses | 6,663 |
Reports to shareholders | 31,298 |
Other | 8,782 |
Total expenses before expense reductions | 617,385 |
Expense reductions | (29,349) |
Total expenses after expense reductions | 588,036 |
Net investment income (loss) | 1,286,371 |
Realized and Unrealized Gain (Loss) |
Net realized gain (loss) from: Investments | 10,640,783 |
Futures | 91,175 |
Foreign currency | (35) |
| 10,731,923 |
Change in net unrealized appreciation (depreciation) on: Investments | 853,941 |
Futures | 6,737 |
Foreign currency | 109 |
| 860,787 |
Net gain (loss) | 11,592,710 |
Net increase (decrease) in net assets resulting from operations | $ 12,879,081 |
The accompanying notes are an integral part of the financial statements.
Statement of Changes in Net Assets
Increase (Decrease) in Net Assets | Years Ended December 31, |
2010 | 2009 |
Operations: Net investment income | $ 1,286,371 | $ 1,607,557 |
Net realized gain (loss) | 10,731,923 | (17,473,719) |
Change in net unrealized appreciation (depreciation) | 860,787 | 42,884,018 |
Net increase (decrease) in net assets resulting from operations | 12,879,081 | 27,017,856 |
Distributions to shareholders from: Net investment income: Class A | (1,597,628) | (1,967,417) |
Class B | (27,222) | (35,839) |
Total distributions | (1,624,850) | (2,003,256) |
Fund share transactions: Class A Proceeds from shares sold | 5,336,052 | 5,456,883 |
Reinvestment of distributions | 1,597,628 | 1,967,417 |
Cost of shares redeemed | (20,642,306) | (25,400,088) |
Net increase (decrease) in net assets from Class A share transactions | (13,708,626) | (17,975,788) |
Class B Proceeds from shares sold | 68,140 | 93,741 |
Reinvestment of distributions | 27,222 | 35,839 |
Cost of shares redeemed | (453,581) | (431,050) |
Net increase (decrease) in net assets from Class B share transactions | (358,219) | (301,470) |
Increase (decrease) in net assets | (2,812,614) | 6,737,342 |
Net assets at beginning of period | 103,092,437 | 96,355,095 |
Net assets at end of period (including undistributed net investment income of $1,201,576 and $1,542,732, respectively) | $ 100,279,823 | $ 103,092,437 |
Other Information |
Class A Shares outstanding at beginning of period | 15,048,001 | 18,437,278 |
Shares sold | 774,532 | 954,520 |
Shares issued to shareholders in reinvestment of distributions | 219,153 | 399,070 |
Shares redeemed | (3,037,534) | (4,742,867) |
Net increase (decrease) in Class A shares | (2,043,849) | (3,389,277) |
Shares outstanding at end of period | 13,004,152 | 15,048,001 |
Class B Shares outstanding at beginning of period | 309,228 | 364,787 |
Shares sold | 10,025 | 16,377 |
Shares issued to shareholders in reinvestment of distributions | 3,734 | 7,270 |
Shares redeemed | (66,521) | (79,206) |
Net increase (decrease) in Class B shares | (52,762) | (55,559) |
Shares outstanding at end of period | 256,466 | 309,228 |
The accompanying notes are an integral part of the financial statements.
Financial Highlights
Class A Years Ended December 31, | 2010 | 2009 | 2008 | 2007 | 2006 |
Selected Per Share Data |
Net asset value, beginning of period | $ 6.71 | $ 5.12 | $ 10.81 | $ 10.94 | $ 9.72 |
Income (loss) from investment operations: Net investment income (loss)a | .09 | .10 | .10 | .13 | .13c |
Net realized and unrealized gain (loss) | .87 | 1.61 | (3.45) | .02 | 1.19 |
Total from investment operations | .96 | 1.71 | (3.35) | .15 | 1.32 |
Less distributions from: Net investment income | (.11) | (.12) | (.18) | (.13) | (.10) |
Net realized gains | — | — | (2.16) | (.15) | — |
Total distributions | (.11) | (.12) | (2.34) | (.28) | (.10) |
Net asset value, end of period | $ 7.56 | $ 6.71 | $ 5.12 | $ 10.81 | $ 10.94 |
Total Return (%)b | 14.40 | 34.15 | (38.31) | 1.36 | 13.63c |
Ratios to Average Net Assets and Supplemental Data |
Net assets, end of period ($ millions) | 98 | 101 | 94 | 196 | 280 |
Ratio of expenses before expense reductions (%) | .63 | .63 | .60 | .57 | .56 |
Ratio of expenses after expense reductions (%) | .60 | .54 | .54 | .56 | .54 |
Ratio of net investment income (loss) (%) | 1.32 | 1.74 | 1.34 | 1.18 | 1.24c |
Portfolio turnover rate (%) | 145 | 82 | 130 | 310 | 105 |
a Based on average shares outstanding during the period. b Total return would have been lower had certain expenses not been reduced. c Includes non-recurring income from the Advisor recorded as a result of an administrative proceeding regarding disclosure of brokerage allocation practices in connection with sales of DWS Funds. The non-recurring income resulted in an increase in net investment income of $0.007 per share and an increase in the ratio of net investment income of 0.07%. Excluding this non-recurring income, total return would have been 0.06% lower. |
Class B Years Ended December 31, | 2010 | 2009 | 2008 | 2007 | 2006 |
Selected Per Share Data |
Net asset value, beginning of period | $ 6.70 | $ 5.12 | $ 10.77 | $ 10.90 | $ 9.68 |
Income (loss) from investment operations: Net investment income (loss)a | .07 | .08 | .08 | .09 | .09c |
Net realized and unrealized gain (loss) | .87 | 1.60 | (3.42) | .02 | 1.19 |
Total from investment operations | .94 | 1.68 | (3.34) | .11 | 1.28 |
Less distributions from: Net investment income | (.09) | (.10) | (.15) | (.09) | (.06) |
Net realized gains | — | — | (2.16) | (.15) | — |
Total distributions | (.09) | (.10) | (2.31) | (.24) | (.06) |
Net asset value, end of period | $ 7.55 | $ 6.70 | $ 5.12 | $ 10.77 | $ 10.90 |
Total Return (%)b | 14.12 | 33.64 | (38.29) | 1.00 | 13.28c |
|
Net assets, end of period ($ millions) | 2 | 2 | 2 | 15 | 52 |
Ratio of expenses before expense reductions (%) | .88 | .89 | .82 | .95 | .94 |
Ratio of expenses after expense reductions (%) | .85 | .80 | .77 | .92 | .89 |
Ratio of net investment income (loss) (%) | 1.07 | 1.48 | 1.12 | .82 | .89c |
Portfolio turnover rate (%) | 145 | 82 | 130 | 310 | 105 |
a Based on average shares outstanding during the period. b Total return would have been lower had certain expenses not been reduced. c Includes non-recurring income from the Advisor recorded as a result of an administrative proceeding regarding disclosure of brokerage allocation practices in connection with sales of DWS Funds. The non-recurring income resulted in an increase in net investment income of $0.007 per share and an increase in the ratio of net investment income of 0.07%. Excluding this non-recurring income, total return would have been 0.06% lower. |
Performance Summary December 31, 2010
DWS Capital Growth VIP
All performance shown is historical, assumes reinvestment of all dividend and capital gain distributions, and does not guarantee future results. Investment return and principal value fluctuate with changing market conditions so that, when redeemed, shares may be worth more or less than their original cost. Current performance may be lower or higher than the performance data quoted. Please contact your participating insurance company for the Fund's most recent month-end performance. Performance doesn't reflect charges and fees ("contract charges") associated with the separate account that invests in the Fund or any variable life insurance policy or variable annuity contract for which the Fund is an investment option. These charges and fees will reduce returns. While all share classes have the same underlying portfolio, their performance will differ.
The gross expense ratios of the Fund, as stated in the fee table of the prospectus dated May 1, 2010 are 0.51% and 0.85% for Class A and Class B shares, respectively, and may differ from the expense ratios disclosed in the Financial Highlights tables in this report.
Fund returns during all periods shown reflect a fee waiver and/or expense reimbursement. Without this waiver/reimbursement, returns would have been lower.
Risk Considerations
Stocks may decline in value. See the prospectus for details.
Growth of an Assumed $10,000 Investment |
[] DWS Capital Growth VIP — Class A [] Russell 1000® Growth Index | The Russell 1000® Growth Index is an unmanaged, capitalization-weighted index containing those securities in the Russell 1000 Index with higher price-to-book ratios and higher forecasted growth values. Index returns assume the reinvestment of dividends and, unlike fund returns, do not reflect any fees or expenses. It is not possible to invest directly into an index. |
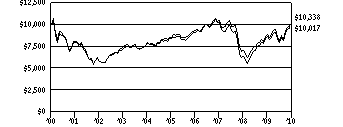 | |
Yearly periods ended December 31 | |
Comparative Results |
DWS Capital Growth VIP | 1-Year | 3-Year | 5-Year | 10-Year |
Class A | Growth of $10,000 | $11,671 | $9,923 | $12,125 | $10,338 |
Average annual total return | 16.71% | -.26% | 3.93% | .33% |
Russell 1000 Growth Index | Growth of $10,000 | $11,671 | $9,858 | $12,023 | $10,017 |
Average annual total return | 16.71% | -.47% | 3.75% | .02% |
DWS Capital Growth VIP | 1-Year | 3-Year | 5-Year | 10-Year |
Class B | Growth of $10,000 | $11,633 | $9,828 | $11,926 | $9,995 |
Average annual total return | 16.33% | -.58% | 3.59% | -.01% |
Russell 1000 Growth Index | Growth of $10,000 | $11,671 | $9,858 | $12,023 | $10,017 |
Average annual total return | 16.71% | -.47% | 3.75% | .02% |
The growth of $10,000 is cumulative.
Information About Your Fund's Expenses
DWS Capital Growth VIP
As an investor of the Fund, you incur two types of costs: ongoing expenses and transaction costs. Ongoing expenses include management fees, distribution and service (12b-1) fees and other Fund expenses. Examples of transaction costs include contract charges, redemption fees and account maintenance fees, which are not shown in this section. The following tables are intended to help you understand your ongoing expenses (in dollars) of investing in the Fund and to help you compare these expenses with the ongoing expenses of investing in other mutual funds. The example in the table is based on an investment of $1,000 invested at the beginning of the six-month period and held for the entire period (July 1, 2010 to December 31, 2010).
The tables illustrate your Fund's expenses in two ways:
• Actual Fund Return. This helps you estimate the actual dollar amount of ongoing expenses (but not transaction costs) paid on a $1,000 investment in the Fund using the Fund's actual return during the period. To estimate the expenses you paid over the period, simply divide your account value by $1,000 (for example, an $8,600 account value divided by $1,000 = 8.6), then multiply the result by the number in the "Expenses Paid per $1,000" line under the share class you hold.
• Hypothetical 5% Fund Return. This helps you to compare your Fund's ongoing expenses (but not transaction costs) with those of other mutual funds using the Fund's actual expense ratio and a hypothetical rate of return of 5% per year before expenses. Examples using a 5% hypothetical Fund return may be found in the shareholder reports of other mutual funds. The hypothetical account values and expenses may not be used to estimate the actual ending account balance or expenses you paid for the period.
Please note that the expenses shown in these tables are meant to highlight your ongoing expenses only and do not reflect any transaction costs. The "Expenses Paid per $1,000" line of the tables is useful in comparing ongoing expenses only and will not help you determine the relative total expense of owning different funds. If these transaction costs had been included, your costs would have been higher.
Expenses and Value of a $1,000 Investment for the six months ended December 31, 2010 |
Actual Fund Return | Class A | | Class B | |
Beginning Account Value 7/1/10 | $ 1,000.00 | | $ 1,000.00 | |
Ending Account Value 12/31/10 | $ 1,268.00 | | $ 1,266.10 | |
Expenses Paid per $1,000* | $ 2.92 | | $ 4.86 | |
Hypothetical 5% Fund Return | Class A | | Class B | |
Beginning Account Value 7/1/10 | $ 1,000.00 | | $ 1,000.00 | |
Ending Account Value 12/31/10 | $ 1,022.63 | | $ 1,020.92 | |
Expenses Paid per $1,000* | $ 2.60 | | $ 4.33 | |
* Expenses are equal to the Fund's annualized expense ratio for each share class, multiplied by the average account value over the period, multiplied by the number of days in the most recent six-month period, then divided by 365.
Annualized Expense Ratios | Class A | | Class B | |
DWS Variable Series I — DWS Capital Growth VIP | .51% | | .85% | |
For more information, please refer to the Fund's prospectus.
These tables do not reflect charges and fees ("contract charges") associated with the separate account that invests in the Fund or any variable life insurance policy or variable annuity contract for which the Fund is an investment option.
Management Summary December 31, 2010
DWS Capital Growth VIP
Coming into 2010, we began to see the gradual withdrawal of government stimulus in response to the recession and increasing worry by market watchers that the recovery might falter as a result. The fiscal crisis in Europe also spurred market turbulence, though austerity pledges by a number of European governments (and central bank intervention there) eased fears of a possible European economic "contagion." In the third quarter, stocks benefited from a robust September rally spurred in part by news that the US Federal Reserve Board (the Fed) would take additional policy measures if needed in order to prevent the US economy from regressing. In the closing months of 2010, positive economic news, including stronger manufacturing reports, continued improvement for US gross domestic product (GDP), and an upturn in consumer confidence, sparked a number of market rallies over the quarter.1 Lastly, investors largely welcomed the congressional compromise where lawmakers extended the Bush-era tax cuts as well as unemployment benefits, as these actions provide some additional economic certainty for 2011.
For the 12 months ended December 31, 2010, the Fund returned 16.71% (Class A shares, unadjusted for contract charges), matching the 16.71% return of the Russell 1000® Growth Index. (Past performance is no guarantee of future results.)
During the period, stock selection was slightly positive offsetting the slightly negative sector allocation. The largest contribution to performance came from a surprising source, consumer discretionary stocks, considering the low expectations for consumer spending entering 2010. However, specialty retail stocks — which have strongly benefited from robust emerging-market consumer demand for specialty/luxury items, along with demand for automobiles globally — boosted the consumer discretionary sector. The Fund's overweight to industrials also contributed, based on improving manufacturing reports and several industrial firms' ability to exceed pessimistic earnings forecasts.2 In contrast, the Fund's slight overweight and stock selection in health care detracted from returns as several holdings proved disappointing. In addition, stock selection within information technology detracted.
Owen Fitzpatrick, CFA
Lead Portfolio Manager
Thomas M. Hynes, Jr., CFA
Brendan O'Neill, CFA
Portfolio Managers
The Russell 1000® Growth Index is an unmanaged, capitalization-weighted index containing those securities in the Russell 1000® Index with higher price-to-book ratios and higher forecasted growth values.
Index returns assume reinvestment of dividends and, unlike fund returns, do not reflect any fees or expenses. It is not possible to invest directly into an index.
1 Gross domestic product is the value of goods and services produced in an economy.
2 "Overweight" means the Fund holds a higher weighting in a given sector or security than the benchmark. "Underweight" means the Fund holds a lower weighting.
Portfolio management market commentary is as of December 31, 2010, and may not come to pass. This information is subject to change at any time based on market and other conditions. Past performance does not guarantee future results. Current and future portfolio holdings are subject to risk.
Portfolio Summary
DWS Capital Growth VIP
Asset Allocation (As a % of Investment Portfolio excluding Securities Lending Collateral) | 12/31/10 | 12/31/09 |
| | |
Common Stocks | 100% | 99% |
Cash Equivalents | — | 1% |
| 100% | 100% |
Sector Diversification (As a % of Common Stocks) | 12/31/10 | 12/31/09 |
| | |
Information Technology | 31% | 34% |
Consumer Discretionary | 16% | 11% |
Industrials | 14% | 12% |
Energy | 12% | 6% |
Health Care | 10% | 17% |
Materials | 6% | 5% |
Consumer Staples | 5% | 8% |
Financials | 5% | 4% |
Telecommunication Services | 1% | 2% |
Utilities | — | 1% |
| 100% | 100% |
Asset allocation and sector diversification are subject to change.
For more complete details about the Fund's investment portfolio, see page 40.
Following the Fund's fiscal first and third quarter-end, a complete portfolio holdings listing is filed with the SEC on Form N-Q. The form will be available on the SEC's Web site at www.sec.gov, and it also may be reviewed and copied at the SEC's Public Reference Room in Washington, D.C. Information on the operation of the SEC's Public Reference Room may be obtained by calling (800) SEC-0330. The Fund's portfolio holdings are also posted on www.dws-investments.com from time to time. Please see the Fund's current prospectus for more information.
Investment Portfolio December 31, 2010
DWS Capital Growth VIP
|
Shares
| Value ($) |
| |
Common Stocks 99.8% |
Consumer Discretionary 15.5% |
Auto Components 3.0% |
Autoliv, Inc. (a) | 78,450 | 6,192,843 |
BorgWarner, Inc.* (a) | 216,840 | 15,690,542 |
| 21,883,385 |
Hotels Restaurants & Leisure 3.5% |
Darden Restaurants, Inc. (a) | 195,460 | 9,077,162 |
Marriott International, Inc. "A" (a) | 276,401 | 11,481,698 |
McDonald's Corp. | 69,100 | 5,304,116 |
| 25,862,976 |
Media 1.8% |
Scripps Networks Interactive "A" (a) | 257,300 | 13,315,275 |
Multiline Retail 2.7% |
Dollar General Corp.* (a) | 133,130 | 4,083,097 |
Kohl's Corp.* | 160,670 | 8,730,808 |
Nordstrom, Inc. (a) | 178,060 | 7,546,183 |
| 20,360,088 |
Specialty Retail 2.6% |
Dick's Sporting Goods, Inc.* (a) | 176,470 | 6,617,625 |
Limited Brands, Inc. (a) | 415,870 | 12,779,685 |
| 19,397,310 |
Textiles, Apparel & Luxury Goods 1.9% |
NIKE, Inc. "B" (a) | 167,735 | 14,327,924 |
Consumer Staples 5.1% |
Beverages 1.4% |
PepsiCo, Inc. | 162,575 | 10,621,025 |
Food & Staples Retailing 1.8% |
Sysco Corp. (a) | 260,880 | 7,669,872 |
Wal-Mart Stores, Inc. (a) | 98,264 | 5,299,377 |
| 12,969,249 |
Household Products 1.9% |
Church & Dwight Co., Inc. (a) | 100,164 | 6,913,319 |
Colgate-Palmolive Co. (a) | 86,840 | 6,979,331 |
| 13,892,650 |
Energy 12.0% |
Energy Equipment & Services 3.5% |
National Oilwell Varco, Inc. | 191,783 | 12,897,407 |
Schlumberger Ltd. (a) | 157,380 | 13,141,230 |
| 26,038,637 |
Oil, Gas & Consumable Fuels 8.5% |
Alpha Natural Resources, Inc.* | 222,900 | 13,380,687 |
Anadarko Petroleum Corp. (a) | 174,580 | 13,296,013 |
EOG Resources, Inc. (a) | 87,490 | 7,997,461 |
Exxon Mobil Corp. (a) | 202,420 | 14,800,950 |
Occidental Petroleum Corp. | 134,320 | 13,176,792 |
| 62,651,903 |
Financials 4.9% |
Capital Markets 4.2% |
Charles Schwab Corp. (a) | 352,250 | 6,026,997 |
Morgan Stanley | 310,490 | 8,448,433 |
T. Rowe Price Group, Inc. (a) | 253,620 | 16,368,635 |
| 30,844,065 |
|
Shares
| Value ($) |
| |
Insurance 0.7% |
MetLife, Inc. | 114,040 | 5,067,938 |
Health Care 9.8% |
Biotechnology 4.5% |
Amgen, Inc.* | 97,292 | 5,341,331 |
Celgene Corp.* | 324,380 | 19,183,833 |
Gilead Sciences, Inc.* | 239,705 | 8,686,909 |
| 33,212,073 |
Health Care Equipment & Supplies 1.7% |
Edwards Lifesciences Corp.* (a) | 89,831 | 7,261,938 |
Thoratec Corp.* (a) | 189,990 | 5,380,517 |
| 12,642,455 |
Health Care Providers & Services 3.6% |
Express Scripts, Inc.* (a) | 297,570 | 16,083,658 |
McKesson Corp. | 147,960 | 10,413,425 |
| 26,497,083 |
Industrials 14.5% |
Aerospace & Defense 2.9% |
TransDigm Group, Inc.* | 110,160 | 7,932,622 |
United Technologies Corp. | 169,220 | 13,320,998 |
| 21,253,620 |
Commercial Services & Supplies 1.0% |
Stericycle, Inc.* (a) | 95,250 | 7,707,630 |
Electrical Equipment 4.3% |
AMETEK, Inc. | 463,500 | 18,192,375 |
Roper Industries, Inc. (a) | 181,940 | 13,905,674 |
| 32,098,049 |
Machinery 4.1% |
Navistar International Corp.* (a) | 218,657 | 12,662,427 |
Parker Hannifin Corp. (a) | 202,120 | 17,442,956 |
| 30,105,383 |
Road & Rail 2.2% |
Norfolk Southern Corp. (a) | 261,180 | 16,407,328 |
Information Technology 30.6% |
Communications Equipment 4.7% |
Cisco Systems, Inc.* | 1,089,685 | 22,044,327 |
QUALCOMM, Inc. | 267,010 | 13,214,325 |
| 35,258,652 |
Computers & Peripherals 8.7% |
Apple, Inc.* | 128,904 | 41,579,274 |
EMC Corp.* (a) | 650,015 | 14,885,343 |
Hewlett-Packard Co. | 185,785 | 7,821,549 |
| 64,286,166 |
Internet Software & Services 3.2% |
Akamai Technologies, Inc.* (a) | 165,840 | 7,802,772 |
Google, Inc. "A"* | 27,175 | 16,141,135 |
| 23,943,907 |
IT Services 3.0% |
Accenture PLC "A" | 117,220 | 5,683,998 |
International Business Machines Corp. | 61,160 | 8,975,841 |
VeriFone Systems, Inc.* | 134,069 | 5,169,701 |
Visa, Inc. "A" (a) | 37,490 | 2,638,546 |
| 22,468,086 |
|
Shares
| Value ($) |
| |
Semiconductors & Semiconductor Equipment 1.6% |
Intel Corp. | 551,870 | 11,605,826 |
Software 9.4% |
Adobe Systems, Inc.* | 123,880 | 3,813,027 |
Check Point Software Technologies Ltd.* (a) | 151,620 | 7,013,941 |
Concur Technologies, Inc.* (a) | 187,410 | 9,732,201 |
Microsoft Corp. | 664,300 | 18,547,256 |
Oracle Corp. | 690,925 | 21,625,953 |
Solera Holdings, Inc. (a) | 170,810 | 8,765,969 |
| 69,498,347 |
Materials 6.3% |
Chemicals 2.2% |
Huntsman Corp. (a) | 452,407 | 7,062,073 |
The Mosaic Co. | 121,521 | 9,279,344 |
| 16,341,417 |
Containers & Packaging 1.6% |
Owens-Illinois, Inc.* (a) | 380,480 | 11,680,736 |
Metals & Mining 2.5% |
Freeport-McMoRan Copper & Gold, Inc. (a) | 157,290 | 18,888,956 |
|
Shares
| Value ($) |
| |
Telecommunication Services 1.1% |
Wireless Telecommunication Services |
American Tower Corp. "A"* | 160,070 | 8,266,015 |
Total Common Stocks (Cost $494,685,918) | 739,394,154 |
|
Securities Lending Collateral 35.7% |
Daily Assets Fund Institutional, 0.27% (b) (c) (Cost $264,201,382) | 264,201,382 | 264,201,382 |
|
Cash Equivalents 0.2% |
Central Cash Management Fund, 0.19% (b) (Cost $1,727,407) | 1,727,407 | 1,727,407 |
| % of Net Assets | Value ($) |
| |
Total Investment Portfolio (Cost $760,614,707)+ | 135.7 | 1,005,322,943 |
Other Assets and Liabilities, Net | (35.7) | (264,266,883) |
Net Assets | 100.0 | 741,056,060 |
* Non-income producing security.
+ The cost for federal income tax purposes was $763,567,179. At December 31, 2010, net unrealized appreciation for all securities based on tax cost was $241,755,764. This consisted of aggregate gross unrealized appreciation for all securities in which there was an excess of value over tax cost of $250,498,317 and aggregate gross unrealized depreciation for all securities in which there was an excess of tax cost over value of $8,742,553.
(a) All or a portion of these securities were on loan (see Notes to Financial Statements). The value of all securities loaned at December 31, 2010 amounted to $257,619,904, which is 34.8% of net assets.
(b) Affiliated fund managed by Deutsche Investment Management Americas Inc. The rate shown is the annualized seven-day yield at period end.
(c) Represents collateral held in connection with securities lending. Income earned by the Fund is net of borrower rebates.
Fair Value Measurements
Various inputs are used in determining the value of the Fund's investments. These inputs are summarized in three broad levels. Level 1 includes quoted prices in active markets for identical securities. Level 2 includes other significant observable inputs (including quoted prices for similar securities, interest rates, prepayment speeds, and credit risk). Level 3 includes significant unobservable inputs (including the Fund's own assumptions in determining the fair value of investments). The inputs or methodology used for valuing securities are not necessarily an indication of the risk associated with investing in those securities.
The following is a summary of the inputs used as of December 31, 2010 in valuing the Fund's investments. For information on the Fund's policy regarding the valuation of investments, please refer to the Security Valuation section of Note A in the accompanying Notes to Financial Statements.
Assets | Level 1 | Level 2 | Level 3 | Total |
|
Common Stocks (d) | $ 739,394,154 | $ — | $ — | $ 739,394,154 |
Short-Term Investments (d) | 265,928,789 | — | — | 265,928,789 |
Total | $ 1,005,322,943 | $ — | $ — | $ 1,005,322,943 |
There have been no significant transfers in and out of Level 1 and Level 2 fair value measurements during the year ended December 31, 2010.
(d) See Investment Portfolio for additional detailed categorizations.
The accompanying notes are an integral part of the financial statements.
Statement of Assets and Liabilities
as of December 31, 2010 |
Assets |
Investments: Investments in securities, at value (cost $494,685,918), including $257,619,904 of securities loaned | $ 739,394,154 |
Investment in Daily Assets Fund Institutional (cost $264,201,382)* | 264,201,382 |
Investment in Central Cash Management Fund (cost $1,727,407) | 1,727,407 |
Total investments, at value (cost $760,614,707) | 1,005,322,943 |
Foreign currency, at value (cost $1,221) | 1,344 |
Receivable for Fund shares sold | 540,106 |
Interest receivable | 10,846 |
Dividends receivable | 242,213 |
Foreign taxes recoverable | 21,609 |
Due from Advisor | 242 |
Other assets | 3,845 |
Total assets | 1,006,143,148 |
Liabilities |
Payable upon return of securities loaned | 264,201,382 |
Payable for Fund shares redeemed | 464,639 |
Accrued management fee | 202,542 |
Accrued distribution service fee (Class B) | 1,890 |
Other accrued expenses and payables | 216,635 |
Total liabilities | 265,087,088 |
Net assets, at value | $ 741,056,060 |
Net Assets Consist of |
Undistributed net investment income | 5,191,902 |
Net unrealized appreciation (depreciation) on: Investments | 244,708,236 |
Foreign currency | 4,323 |
Accumulated net realized gain (loss) | (166,155,788) |
Paid-in capital | 657,307,387 |
Net assets, at value | $ 741,056,060 |
Class A Net Asset Value, offering and redemption price per share ($728,888,149 ÷ 37,210,167 outstanding shares of beneficial interest, $.01 par value, unlimited number of shares authorized) | $ 19.59 |
Class B Net Asset Value, offering and redemption price per share ($12,167,911 ÷ 623,731 outstanding shares of beneficial interest, $.01 par value, unlimited number of shares authorized) | $ 19.51 |
* Represents collateral on securities loaned.
The accompanying notes are an integral part of the financial statements.
Statement of Operations
for the year ended December 31, 2010 |
Investment Income |
Income: Dividends | $ 8,829,123 |
Income distributions — Central Cash Management Fund | 11,380 |
Securities lending income, including income from Daily Assets Fund Institutional, net of borrower rebates | 178,797 |
Total income | 9,019,300 |
Expenses: Management fee | 2,618,221 |
Administration fee | 700,197 |
Services to shareholders | 13,779 |
Record keeping fee (Class B) | 10,220 |
Custodian fee | 65,859 |
Distribution service fee (Class B) | 29,332 |
Professional fees | 54,954 |
Trustees' fees and expenses | 21,391 |
Reports to shareholders | 84,105 |
Other | 34,298 |
Total expenses before expense reductions | 3,632,356 |
Expense reductions | (53,321) |
Total expenses after expense reductions | 3,579,035 |
Net investment income (loss) | 5,440,265 |
Realized and Unrealized Gain (Loss) |
Net realized gain (loss) from: Investments | 56,925,932 |
Foreign currency | 13,620 |
| 56,939,552 |
Change in net unrealized appreciation (depreciation) on: Investments | 46,075,809 |
Foreign currency | (12,815) |
| 46,062,994 |
Net gain (loss) | 103,002,546 |
Net increase (decrease) in net assets resulting from operations | $ 108,442,811 |
The accompanying notes are an integral part of the financial statements.
Statement of Changes in Net Assets
Increase (Decrease) in Net Assets | Years Ended December 31, |
2010 | 2009 |
Operations: Net investment income (loss) | $ 5,440,265 | $ 6,299,270 |
Net realized gain (loss) | 56,939,552 | (29,080,095) |
Change in net unrealized appreciation (depreciation) | 46,062,994 | 184,141,634 |
Net increase (decrease) in net assets resulting from operations | 108,442,811 | 161,360,809 |
Distributions to shareholders from: Net investment income: Class A | (6,317,623) | (7,997,037) |
Class B | (67,783) | (116,634) |
Total distributions | (6,385,406) | (8,113,671) |
Fund share transactions: Class A Proceeds from shares sold | 12,396,402 | 18,231,110 |
Net assets acquired in tax-free reorganization | — | 66,828,943 |
Reinvestment of distributions | 6,317,623 | 7,997,037 |
Cost of shares redeemed | (105,101,955) | (122,840,820) |
Net increase (decrease) in net assets from Class A share transactions | (86,387,930) | (29,783,730) |
Class B Proceeds from shares sold | 1,077,251 | 1,745,917 |
Reinvestment of distributions | 67,783 | 116,634 |
Cost of shares redeemed | (2,881,286) | (2,624,791) |
Net increase (decrease) in net assets from Class B share transactions | (1,736,252) | (762,240) |
Increase (decrease) in net assets | 13,933,223 | 122,701,168 |
Net assets at beginning of period | 727,122,837 | 604,421,669 |
Net assets at end of period (including undistributed net investment income of $5,191,902 and $6,123,423, respectively) | $ 741,056,060 | $ 727,122,837 |
Other Information |
Class A Shares outstanding at beginning of period | 42,229,316 | 43,844,542 |
Shares sold | 714,318 | 1,329,558 |
Shares issued in tax-free reorganization | — | 5,009,687 |
Shares issued to shareholders in reinvestment of distributions | 348,655 | 644,923 |
Shares redeemed | (6,082,122) | (8,599,394) |
Net increase (decrease) in Class A shares | (5,019,149) | (1,615,226) |
Shares outstanding at end of period | 37,210,167 | 42,229,316 |
Class B Shares outstanding at beginning of period | 725,636 | 777,803 |
Shares sold | 62,186 | 124,580 |
Shares issued to shareholders in reinvestment of distributions | 3,749 | 9,421 |
Shares redeemed | (167,840) | (186,168) |
Net increase (decrease) in Class B shares | (101,905) | (52,167) |
Shares outstanding at end of period | 623,731 | 725,636 |
The accompanying notes are an integral part of the financial statements.
Financial Highlights
Class A Years Ended December 31, | 2010 | 2009 | 2008 | 2007 | 2006 |
Selected Per Share Data |
Net asset value, beginning of period | $ 16.93 | $ 13.55 | $ 20.41 | $18.24 | $ 16.90 |
Income (loss) from investment operations: Net investment income (loss)a | .14d | .14 | .16 | .17d | .13c |
Net realized and unrealized gain (loss) | 2.68 | 3.43 | (6.83) | 2.12 | 1.31 |
Total from investment operations | 2.82 | 3.57 | (6.67) | 2.29 | 1.44 |
Less distributions from: Net investment income | (.16) | (.19) | (.19) | (.12) | (.10) |
Net asset value, end of period | $ 19.59 | $ 16.93 | $ 13.55 | $ 20.41 | $ 18.24 |
Total Return (%)b | 16.71 | 26.87 | (32.98) | 12.59 | 8.53c |
Ratios to Average Net Assets and Supplemental Data |
Net assets, end of period ($ millions) | 729 | 715 | 594 | 1,058 | 1,131 |
Ratio of expenses before expense reductions (%) | .51 | .51 | .50 | .53 | .52 |
Ratio of expenses after expense reductions (%) | .51 | .49 | .49 | .52 | .49 |
Ratio of net investment income (loss) (%) | .78d | .98 | .89 | .86d | .73c |
Portfolio turnover rate (%) | 42 | 76 | 21 | 30 | 16 |
a Based on average shares outstanding during the period. b Total return would have been lower had certain expenses not been reduced. c Includes non-recurring income from the Advisor recorded as a result of an administrative proceeding regarding disclosure of brokerage allocation practices in connection with sales of DWS Funds. The non-recurring income resulted in an increase in net investment income of $0.007 per share and an increase in the ratio of net investment income of 0.04%. Excluding this non-recurring income, total return would have been 0.03% lower. d Net investment income per share and ratio of net investment income include non-recurring dividend income amounting to $0.05 and $0.03 per share and 0.28% and 0.17% of average daily net assets for the years ended December 31, 2010 and 2007, respectively. |
Class B Years Ended December 31, | 2010 | 2009 | 2008 | 2007 | 2006 |
Selected Per Share Data |
Net asset value, beginning of period | $ 16.86 | $ 13.49 | $ 20.31 | $ 18.15 | $ 16.81 |
Income (loss) from investment operations: Net investment income (loss)a | .08d | .09 | .10 | .09d | .06c |
Net realized and unrealized gain (loss) | 2.67 | 3.43 | (6.81) | 2.12 | 1.31 |
Total from investment operations | 2.75 | 3.52 | (6.71) | 2.21 | 1.37 |
Less distributions from: Net investment income | (.10) | (.15) | (.11) | (.05) | (.03) |
Net asset value, end of period | $ 19.51 | $ 16.86 | $ 13.49 | $ 20.31 | $ 18.15 |
Total Return (%)b | 16.33 | 26.49 | (33.20) | 12.18 | 8.17c |
Ratios to Average Net Assets and Supplemental Data |
Net assets, end of period ($ millions) | 12 | 12 | 10 | 19 | 107 |
Ratio of expenses before expense reductions (%) | .85 | .85 | .85 | .94 | .91 |
Ratio of expenses after expense reductions (%) | .84 | .82 | .82 | .90 | .86 |
Ratio of net investment income (loss) (%) | .45d | .65 | .56 | .48d | .36c |
Portfolio turnover rate (%) | 42 | 76 | 21 | 30 | 16 |
a Based on average shares outstanding during the period. b Total return would have been lower had certain expenses not been reduced. c Includes non-recurring income from the Advisor recorded as a result of an administrative proceeding regarding disclosure of brokerage allocation practices in connection with sales of DWS Funds. The non-recurring income resulted in an increase in net investment income of $0.007 per share and an increase in the ratio of net investment income of 0.04%. Excluding this non-recurring income, total return would have been 0.03% lower. d Net investment income per share and ratio of net investment income include non-recurring dividend income amounting to $0.05 and $0.03 per share and $0.28% and 0.17% of average daily net assets for the years ended December 31, 2010 and 2007, respectively. |
Performance Summary December 31, 2010
DWS Global Opportunities VIP
All performance shown is historical, assumes reinvestment of all dividend and capital gain distributions, and does not guarantee future results. Investment return and principal value fluctuate with changing market conditions so that, when redeemed, shares may be worth more or less than their original cost. Current performance may be lower or higher than the performance data quoted. Please contact your participating insurance company for the Fund's most recent month-end performance. Performance doesn't reflect charges and fees ("contract charges") associated with the separate account that invests in the Fund or any variable life insurance policy or variable annuity contract for which the Fund is an investment option. These charges and fees will reduce returns. While all share classes have the same underlying portfolio, their performance will differ.
The gross expense ratios of the Fund, as stated in the fee table of the prospectus dated May 1, 2010 are 1.11% and 1.42% for Class A and Class B shares, respectively, and may differ from the expense ratios disclosed in the Financial Highlights tables in this report.
Fund returns during all periods shown reflect a fee waiver and/or reimbursement. Without this waiver/reimbursement, returns would have been lower.
Risk Considerations
Investing in foreign securities, particularly those of emerging markets, presents certain risks, such as currency fluctuations, political and economic changes, and market risks. Stocks of smaller companies involve greater risk than securities of larger, more-established companies. Stocks may decline in value. See the prospectus for details.
Growth of an Assumed $10,000 Investment |
[] DWS Global Opportunities VIP — Class A [] S&P® Developed SmallCap Index | The S&P® Developed SmallCap Index is an unmanaged index of small-capitalization stocks within 26 countries around the globe. Index returns assume the reinvestment of dividends net of withholding tax and, unlike fund returns, do not reflect any fees or expenses. It is not possible to invest directly into an index. |
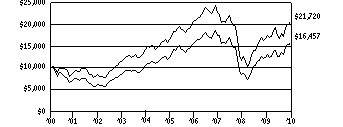 | |
Yearly periods ended December 31 | |
Comparative Results |
DWS Global Opportunities VIP | 1-Year | 3-Year | 5-Year | 10-Year |
Class A | Growth of $10,000 | $12,664 | $9,391 | $12,534 | $16,457 |
Average annual total return | 26.64% | -2.07% | 4.62% | 5.11% |
S&P Developed SmallCap Index | Growth of $10,000 | $12,442 | $9,759 | $12,666 | $21,720 |
Average annual total return | 24.42% | -.81% | 4.84% | 8.07% |
DWS Global Opportunities VIP | 1-Year | 3-Year | 5-Year | 10-Year |
Class B | Growth of $10,000 | $12,638 | $9,301 | $12,346 | $16,015 |
Average annual total return | 26.38% | -2.39% | 4.31% | 4.82% |
S&P Developed SmallCap Index | Growth of $10,000 | $12,442 | $9,759 | $12,666 | $21,720 |
Average annual total return | 24.42% | -.81% | 4.84% | 8.07% |
The growth of $10,000 is cumulative.
Information About Your Fund's Expenses
DWS Global Opportunities VIP
As an investor of the Fund, you incur two types of costs: ongoing expenses and transaction costs. Ongoing expenses include management fees, distribution and service (12b-1) fees and other Fund expenses. Examples of transaction costs include contract charges, redemption fees and account maintenance fees, which are not shown in this section. The following tables are intended to help you understand your ongoing expenses (in dollars) of investing in the Fund and to help you compare these expenses with the ongoing expenses of investing in other mutual funds. In the most recent six-month period, the Fund limited these expenses; had it not done so, expenses would have been higher. The example in the table is based on an investment of $1,000 invested at the beginning of the six-month period and held for the entire period (July 1, 2010 to December 31, 2010).
The tables illustrate your Fund's expenses in two ways:
• Actual Fund Return. This helps you estimate the actual dollar amount of ongoing expenses (but not transaction costs) paid on a $1,000 investment in the Fund using the Fund's actual return during the period. To estimate the expenses you paid over the period, simply divide your account value by $1,000 (for example, an $8,600 account value divided by $1,000 = 8.6), then multiply the result by the number in the "Expenses Paid per $1,000" line under the share class you hold.
• Hypothetical 5% Fund Return. This helps you to compare your Fund's ongoing expenses (but not transaction costs) with those of other mutual funds using the Fund's actual expense ratio and a hypothetical rate of return of 5% per year before expenses. Examples using a 5% hypothetical Fund return may be found in the shareholder reports of other mutual funds. The hypothetical account values and expenses may not be used to estimate the actual ending account balance or expenses you paid for the period.
Please note that the expenses shown in these tables are meant to highlight your ongoing expenses only and do not reflect any transaction costs. The "Expenses Paid per $1,000" line of the tables is useful in comparing ongoing expenses only and will not help you determine the relative total expense of owning different funds. If these transaction costs had been included, your costs would have been higher.
Expenses and Value of a $1,000 Investment for the six months ended December 31, 2010 |
Actual Fund Return | Class A | | Class B | |
Beginning Account Value 7/1/10 | $ 1,000.00 | | $ 1,000.00 | |
Ending Account Value 12/31/10 | $ 1,310.10 | | $ 1,308.80 | |
Expenses Paid per $1,000* | $ 6.00 | | $ 7.39 | |
Hypothetical 5% Fund Return | Class A | | Class B | |
Beginning Account Value 7/1/10 | $ 1,000.00 | | $ 1,000.00 | |
Ending Account Value 12/31/10 | $ 1,020.01 | | $ 1,018.80 | |
Expenses Paid per $1,000* | $ 5.24 | | $ 6.46 | |
* Expenses are equal to the Fund's annualized expense ratio for each share class, multiplied by the average account value over the period, multiplied by the number of days in the most recent six-month period, then divided by 365.
Annualized Expense Ratios | Class A | | Class B | |
DWS Variable Series I — DWS Global Opportunities VIP | 1.03% | | 1.27% | |
For more information, please refer to the Fund's prospectus.
These tables do not reflect charges and fees ("contract charges") associated with the separate account that invests in the Fund or any variable life insurance policy or variable annuity contract for which the Fund is an investment option.
Management Summary December 31, 2010
DWS Global Opportunities VIP
DWS Global Opportunities VIP returned 26.64% in 2010 (Class A shares, unadjusted for contract charges), outperforming the 24.42% return of its benchmark, the S&P® Developed SmallCap Index. (Past performance is no guarantee of future results.)
Our stock selection process was most effective in the information technology sector. Notable individual winners were ARM Holdings PLC, which licenses semiconductor designs to the makers of smartphones and other mobile devices, and two Chinese IT outsourcing companies, VanceInfo Technologies, Inc. and HiSoft Technology International.* Our stock picks also outperformed in the consumer staples sector, thanks in part to our investments in Diamond Foods, Inc. and SunOpta, Inc., and in financials, where our top holding was the Swiss private equity firm Partners Group Holding AG. On the negative side, we lost some ground through our underweight in materials and our stock selection in the industrials, energy and materials sectors.
On a sector basis, our bottom-up approach led us to maintain overweight positions in information technology, health care and energy, and underweights in financials, materials and utilities. Our largest sector shift during the year was to increase the Fund's weightings in the technology and consumer sectors, both of which stand to benefit in a continuing environment of global economic recovery. We funded this increase by reducing the extent of our overweight in energy and industrials.
In terms of geographical weightings, our search for "cheap growth" prompted us to keep an underweight in North America in favor of overweights in Europe and Asia. We believe that during the period, the overseas markets were a better source of growth, in the case of non-Japan Asia, and valuation, in the case of Europe and Japan.
Joseph Axtell, CFA
Portfolio Manager
The S&P Developed SmallCap Index is an unmanaged index of small-capitalization stocks within 26 countries around the globe.
Index returns assume the reinvestment of dividends net of withholding tax and, unlike fund returns, do not reflect any fees or expenses. It is not possible to invest directly into an index.
1 "Overweight" means the Fund holds a higher weighting in a given sector or security than the benchmark. "Underweight" means the Fund holds a lower weighting.
* Not held in the portfolio as of December 31, 2010.
Portfolio management market commentary is as of December 31, 2010, and may not come to pass. This information is subject to change at any time based on market and other conditions. Past performance does not guarantee future results. Current and future portfolio holdings are subject to risk.
Portfolio Summary
DWS Global Opportunities VIP
Asset Allocation (As a % of Investment Portfolio excluding Securities Lending Collateral) | 12/31/10 | 12/31/09 |
| | |
Common Stocks | 99% | 97% |
Cash Equivalents | 1% | 2% |
Participatory Notes | — | 1% |
| 100% | 100% |
Geographical Diversification (As a % of Investment Portfolio excluding Cash Equivalents and Securities Lending Collateral) | 12/31/10 | 12/31/09 |
| | |
United States | 40% | 40% |
Continental Europe | 21% | 27% |
Pacific Basin | 15% | 13% |
United Kingdom | 9% | 7% |
Japan | 8% | 8% |
Australia | 2% | 1% |
Canada | 2% | 2% |
Latin America | 1% | 1% |
Africa | — | — |
Other | 2% | 1% |
| 100% | 100% |
Sector Diversification (As a % of Investment Portfolio excluding Cash Equivalents and Securities Lending Collateral) | 12/31/10 | 12/31/09 |
| | |
Industrials | 22% | 18% |
Consumer Discretionary | 18% | 16% |
Information Technology | 15% | 16% |
Health Care | 14% | 16% |
Financials | 12% | 12% |
Energy | 8% | 10% |
Materials | 6% | 6% |
Consumer Staples | 5% | 5% |
Utilities | — | 1% |
| 100% | 100% |
Asset allocation, geographical diversification and sector diversification are subject to change.
For more complete details about the Fund's investment portfolio, see page 52 .
Following the Fund's fiscal first and third quarter-end, a complete portfolio holdings listing is filed with the SEC on Form N-Q. The form will be available on the SEC's Web site at www.sec.gov, and it also may be reviewed and copied at the SEC's Public Reference Room in Washington, D.C. Information on the operation of the SEC's Public Reference Room may be obtained by calling (800) SEC-0330. The Fund's portfolio holdings are also posted on www.dws-investments.com from time to time. Please see the Fund's current prospectus for more information.
Investment Portfolio December 31, 2010
DWS Global Opportunities VIP
|
Shares
| Value ($) |
| |
Common Stocks 99.2% |
Australia 2.2% |
Austal Ltd. | 317,365 | 1,132,857 |
Lynas Corp., Ltd.* | 1,164,743 | 2,454,077 |
(Cost $1,390,842) | 3,586,934 |
Bermuda 0.7% |
Lazard Ltd. "A" (Cost $666,344) | 27,300 | 1,078,077 |
Brazil 1.5% |
Diagnosticos da America SA | 82,396 | 1,116,066 |
Fleury SA | 81,302 | 1,305,308 |
(Cost $1,328,722) | 2,421,374 |
Canada 1.8% |
SunOpta, Inc.* | 234,000 | 1,829,880 |
Thompson Creek Metals Co., Inc.* | 68,800 | 1,012,736 |
(Cost $2,766,815) | 2,842,616 |
Channel Islands 1.2% |
Charter International PLC | 70,502 | 928,271 |
Randgold Resources Ltd. (ADR) (a) | 11,800 | 971,494 |
(Cost $1,610,895) | 1,899,765 |
China 2.3% |
Charm Communications, Inc. (ADR)* | 34,536 | 340,525 |
Mecox Lane Ltd. (ADR)* | 49,544 | 367,121 |
Minth Group Ltd. | 1,105,800 | 1,815,306 |
VanceInfo Technologies, Inc. (ADR)* | 34,175 | 1,180,404 |
(Cost $1,665,607) | 3,703,356 |
Cyprus 0.5% |
ProSafe SE (b) (Cost $681,555) | 104,343 | 830,309 |
France 1.9% |
Flamel Technologies SA (ADR)* | 169,600 | 1,160,064 |
JC Decaux SA* | 45,071 | 1,386,758 |
Meetic | 19,827 | 430,541 |
(Cost $3,646,705) | 2,977,363 |
Germany 5.2% |
Fresenius Medical Care AG & Co. KGaA | 72,504 | 4,189,568 |
M.A.X. Automation AG | 261,915 | 1,211,297 |
Rational AG | 7,284 | 1,607,928 |
United Internet AG (Registered) | 78,543 | 1,276,509 |
(Cost $2,694,731) | 8,285,302 |
Gibraltar 0.4% |
PartyGaming PLC* (Cost $887,555) | 214,906 | 688,548 |
Greece 0.2% |
Hellenic Exchanges SA (Cost $712,162) | 49,139 | 321,756 |
Hong Kong 6.6% |
Dah Sing Banking Group Ltd. | 555,740 | 946,634 |
EVA Precision Industrial Holdings Ltd. (c) | 2,625,521 | 2,563,774 |
K Wah International Holdings Ltd. | 2,552,501 | 955,612 |
Kingboard Chemical Holdings Ltd. | 290,640 | 1,740,594 |
Midland Holdings Ltd. | 1,049,268 | 861,251 |
REXLot Holdings Ltd. (c) | 14,450,000 | 1,524,419 |
Shui On Construction & Materials Ltd. | 658,000 | 761,888 |
|
Shares
| Value ($) |
| |
Wing Hang Bank Ltd. | 84,572 | 1,169,654 |
(Cost $5,527,070) | 10,523,826 |
India 0.3% |
Magma Fincorp Ltd. (Cost $467,151) | 307,555 | 493,505 |
Ireland 3.9% |
C&C Group PLC (d) | 149,879 | 677,959 |
C&C Group PLC (d) | 185,737 | 839,662 |
ICON PLC (ADR)* | 44,900 | 983,310 |
Norkom Group PLC* | 292,633 | 586,568 |
Paddy Power PLC | 39,555 | 1,622,720 |
Ryanair Holdings PLC (d) | 2,200 | 11,024 |
Ryanair Holdings PLC (d) | 312,536 | 1,574,510 |
(Cost $4,121,744) | 6,295,753 |
Italy 0.5% |
Prysmian SpA (Cost $837,686) | 46,571 | 793,091 |
Japan 8.0% |
Digital Garage, Inc.* | 647 | 1,604,463 |
Hajime Construction Co., Ltd. | 24,859 | 853,268 |
Internet Initiative Japan, Inc. | 398 | 1,129,886 |
Kenedix, Inc.* | 3,738 | 1,136,685 |
M3, Inc. | 147 | 738,373 |
MISUMI Group, Inc. | 60,600 | 1,508,650 |
Nidec Corp. | 14,811 | 1,493,463 |
Nippon Seiki Co., Ltd. | 95,000 | 1,138,333 |
Nitori Holdings Co., Ltd. | 11,600 | 1,014,358 |
Universal Entertainment Corp.* | 77,200 | 2,254,833 |
(Cost $8,219,088) | 12,872,312 |
Korea 0.8% |
S&T Dynamics Co., Ltd.* (Cost $741,138) | 60,890 | 1,225,193 |
Luxembourg 0.5% |
L'Occitane International SA* (Cost $590,029) | 300,750 | 831,891 |
Netherlands 4.3% |
Brunel International NV | 23,026 | 907,397 |
Chicago Bridge & Iron Co. NV (NY Registered Shares)* | 48,500 | 1,595,650 |
Koninklijke Vopak NV | 32,153 | 1,518,850 |
QIAGEN NV* | 62,600 | 1,224,420 |
SBM Offshore NV | 74,639 | 1,672,143 |
(Cost $3,760,925) | 6,918,460 |
Philippines 0.4% |
Cebu Air, Inc.* (Cost $792,490) | 258,830 | 669,968 |
Singapore 2.4% |
Amtek Engineering Ltd.* | 1,907,000 | 1,604,831 |
UOB-Kay Hian Holdings Ltd. | 587,000 | 809,592 |
Venture Corp., Ltd. | 198,773 | 1,434,245 |
(Cost $3,252,407) | 3,848,668 |
South Africa 0.5% |
Northam Platinum Ltd. (Cost $734,867) | 108,524 | 746,283 |
|
Shares
| Value ($) |
| |
Spain 0.9% |
Tecnicas Reunidas SA | 14,090 | 897,087 |
Telvent GIT SA (NY registered shares)* | 18,992 | 501,769 |
(Cost $1,342,398) | 1,398,856 |
Switzerland 1.1% |
Advanced Digital Broadcast Holdings SA (ADB Group) (Registered) | 5,140 | 168,200 |
Partners Group Holding AG | 8,682 | 1,647,715 |
(Cost $748,707) | 1,815,915 |
Taiwan 1.0% |
E Ink Holdings, Inc.* (Cost $1,496,706) | 754,050 | 1,528,453 |
Thailand 0.7% |
Kiatnakin Bank PCL (Cost $769,666) | 913,600 | 1,181,967 |
United Arab Emirates 0.7% |
Lamprell PLC (Cost $670,976) | 220,696 | 1,106,240 |
United Kingdom 8.6% |
Aegis Group PLC | 277,722 | 608,360 |
ARM Holdings PLC | 289,717 | 1,912,036 |
Ashmore Group PLC | 317,788 | 1,660,297 |
Babcock International Group PLC | 180,919 | 1,610,623 |
Burberry Group PLC | 51,674 | 905,549 |
Domino's Pizza UK & IRL PLC | 126,845 | 1,090,668 |
ICAP PLC | 98,470 | 821,356 |
John Wood Group PLC | 122,820 | 1,070,421 |
Michael Page International PLC | 190,557 | 1,648,890 |
Rotork PLC | 46,454 | 1,323,954 |
Serco Group PLC | 120,037 | 1,039,616 |
(Cost $8,099,191) | 13,691,770 |
United States 40.1% |
Accuray, Inc.* | 125,840 | 849,420 |
Advance Auto Parts, Inc. | 18,150 | 1,200,623 |
Aecom Technology Corp.* | 48,468 | 1,355,650 |
Aeropostale, Inc.* | 54,050 | 1,331,792 |
Affiliated Managers Group, Inc.* | 10,000 | 992,200 |
Alpha Natural Resources, Inc.* | 25,400 | 1,524,762 |
Altra Holdings, Inc.* | 27,455 | 545,256 |
BE Aerospace, Inc.* | 42,000 | 1,555,260 |
BorgWarner, Inc.* | 23,700 | 1,714,932 |
Cameron International Corp.* | 19,200 | 974,016 |
Cardtronics, Inc.* | 72,000 | 1,274,400 |
Central European Distribution Corp.* (e) | 31,300 | 716,770 |
Cliffs Natural Resources, Inc. | 17,700 | 1,380,777 |
Complete Production Services, Inc.* | 40,807 | 1,205,846 |
Deckers Outdoor Corp.* | 29,992 | 2,391,562 |
Diamond Foods, Inc. | 35,100 | 1,866,618 |
Dresser-Rand Group, Inc.* | 27,800 | 1,184,002 |
EnerNOC, Inc.* | 27,700 | 662,307 |
ExamWorks Group, Inc.* | 27,150 | 501,732 |
FleetCor Technologies, Inc.* | 8,745 | 270,395 |
FSI International, Inc.* | 193,500 | 855,270 |
FTI Consulting, Inc.* | 38,850 | 1,448,328 |
|
Shares
| Value ($) |
| |
Green Mountain Coffee Roasters, Inc.* | 39,564 | 1,300,073 |
Guess?, Inc. | 30,700 | 1,452,724 |
Harris Corp. | 23,500 | 1,064,550 |
hhgregg, Inc.* | 46,900 | 982,555 |
Huntington Bancshares, Inc. | 117,453 | 806,902 |
iGATE Corp. | 53,535 | 1,055,175 |
Itron, Inc.* | 26,900 | 1,491,605 |
Jarden Corp. | 23,400 | 722,358 |
Jefferies Group, Inc. | 56,400 | 1,501,932 |
Joy Global, Inc. | 22,075 | 1,915,006 |
Lam Research Corp.* | 20,300 | 1,051,134 |
Life Technologies Corp.* | 30,200 | 1,676,100 |
Metabolix, Inc.* | 45,800 | 557,386 |
NIC, Inc. | 94,372 | 916,352 |
Northern Oil & Gas, Inc.* | 52,400 | 1,425,804 |
NxStage Medical, Inc.* | 92,419 | 2,299,385 |
Onyx Pharmaceuticals, Inc.* | 22,453 | 827,842 |
Prosperity Bancshares, Inc. | 25,700 | 1,009,496 |
Questcor Pharmaceuticals, Inc.* | 115,704 | 1,704,320 |
Rovi Corp.* | 23,300 | 1,444,833 |
Schweitzer-Mauduit International, Inc. | 24,006 | 1,510,458 |
Stericycle, Inc.* | 17,600 | 1,424,192 |
STR Holdings, Inc.* | 39,764 | 795,280 |
SXC Health Solutions Corp.* | 24,000 | 1,028,640 |
Sycamore Networks, Inc. | 30,900 | 636,231 |
Thoratec Corp.* | 57,200 | 1,619,904 |
TiVo, Inc.* | 72,127 | 622,456 |
Ultra Petroleum Corp.* | 29,400 | 1,404,438 |
Urban Outfitters, Inc.* | 42,100 | 1,507,601 |
VIVUS, Inc.* | 80,000 | 749,600 |
Waddell & Reed Financial, Inc. "A" | 26,800 | 945,772 |
Zions Bancorp. | 34,576 | 837,778 |
(Cost $40,370,092) | 64,089,800 |
Total Common Stocks (Cost $100,594,264) | 158,667,351 |
|
Warrants 0.0% |
Hong Kong |
Kingboard Chemical Holdings Ltd. Expiration Date 10/31/2012* (Cost $0) | 39,014 | 41,409 |
|
Cash Equivalents 0.9% |
Central Cash Management Fund, 0.19% (f) (Cost $1,403,436) | 1,403,436 | 1,403,436 |
| % of Net Assets | Value ($) |
| |
Total Investment Portfolio (Cost $101,997,700)+ | 100.1 | 160,112,196 |
Other Assets and Liabilities, Net | (0.1) | (94,890) |
Net Assets | 100.0 | 160,017,306 |
* Non-income producing security.
+ The cost for federal income tax purposes was $104,651,714. At December 31, 2010, net unrealized appreciation for all securities based on tax cost was $55,460,482. This consisted of aggregate gross unrealized appreciation for all securities in which there was an excess of value over tax cost of $62,843,932 and aggregate gross unrealized depreciation for all securities in which there was an excess of tax cost over value of $7,383,450.
(a) Security is listed in country of domicile. Significant business activities of the company are in Africa.
(b) Security is listed in country of domicile. Significant business activities of the company are in Norway.
(c) Security is listed in country of domicile. Significant business activities of the company are in China.
(d) Securities with the same description are the same corporate entity but trade on different stock exchanges.
(e) Security is listed in country of domicile. Significant business activities of the company are in Poland.
(f) Affiliated fund managed by Deutsche Investment Management Americas Inc. The rate shown is the annualized seven-day yield at period end.
ADR: American Depositary Receipt
Fair Value Measurements
Various inputs are used in determining the value of the Fund's investments. These inputs are summarized in three broad levels. Level 1 includes quoted prices in active markets for identical securities. Level 2 includes other significant observable inputs (including quoted prices for similar securities, interest rates, prepayment speeds, and credit risk). Level 3 includes significant unobservable inputs (including the Fund's own assumptions in determining the fair value of investments). The inputs or methodology used for valuing securities are not necessarily an indication of the risk associated with investing in those securities.
The following is a summary of the inputs used as of December 31, 2010 in valuing the Fund's investments. For information on the Fund's policy regarding the valuation of investments, please refer to the Security Valuation section of Note A in the accompanying Notes to Financial Statements.
Assets | Level 1 | Level 2 | Level 3 | Total |
|
Common Stocks & Warrants | | | | |
Australia | $ — | $ 3,586,934 | $ — | $ 3,586,934 |
Bermuda | 1,078,077 | — | — | 1,078,077 |
Brazil | 2,421,374 | — | — | 2,421,374 |
Canada | 2,842,616 | — | — | 2,842,616 |
Channel Islands | 971,494 | 928,271 | — | 1,899,765 |
China | 1,888,050 | 1,815,306 | — | 3,703,356 |
Cyprus | — | 830,309 | — | 830,309 |
France | 1,160,064 | 1,817,299 | — | 2,977,363 |
Germany | — | 8,285,302 | — | 8,285,302 |
Gibraltar | — | 688,548 | — | 688,548 |
Greece | — | 321,756 | — | 321,756 |
Hong Kong | — | 10,565,235 | — | 10,565,235 |
India | — | 493,505 | — | 493,505 |
Ireland | 983,310 | 5,312,443 | — | 6,295,753 |
Italy | — | 793,091 | — | 793,091 |
Japan | — | 12,872,312 | — | 12,872,312 |
Korea | — | 1,225,193 | — | 1,225,193 |
Luxembourg | — | 831,891 | — | 831,891 |
Netherlands | 1,595,650 | 5,322,810 | — | 6,918,460 |
Philippines | — | 669,968 | — | 669,968 |
Singapore | — | 3,848,668 | — | 3,848,668 |
South Africa | — | 746,283 | — | 746,283 |
Spain | 501,769 | 897,087 | — | 1,398,856 |
Switzerland | — | 1,815,915 | — | 1,815,915 |
Taiwan | — | 1,528,453 | — | 1,528,453 |
Thailand | — | 1,181,967 | — | 1,181,967 |
United Arab Emirates | — | 1,106,240 | — | 1,106,240 |
United Kingdom | — | 13,691,770 | — | 13,691,770 |
United States | 64,089,800 | — | — | 64,089,800 |
Short-Term Investments (g) | 1,403,436 | — | — | 1,403,436 |
Total | $ 78,935,640 | $ 81,176,556 | $ — | $ 160,112,196 |
There have been no significant transfers in and out of Level 1 and Level 2 fair value measurements during the year ended December 31, 2010.
(g) See Investment Portfolio for additional detailed categorizations.
The accompanying notes are an integral part of the financial statements.
Statement of Assets and Liabilities
as of December 31, 2010 |
Assets |
Investments: Investments in securities, at value (cost $100,594,264) | $ 158,708,760 |
Investment in Central Cash Management Fund (cost $1,403,436) | 1,403,436 |
Total investments, at value (cost $101,997,700) | 160,112,196 |
Foreign currency, at value (cost $124,556) | 125,904 |
Receivable for investments sold | 45,967 |
Receivable for Fund shares sold | 3,742 |
Interest receivable | 332 |
Dividends receivable | 33,773 |
Foreign taxes recoverable | 36,680 |
Due from Advisor | 46 |
Other assets | 811 |
Total assets | 160,359,451 |
Liabilities |
Payable for Fund shares redeemed | 155,006 |
Accrued management fee | 102,954 |
Accrued distribution service fee (Class B) | 480 |
Deferred foreign taxes | 664 |
Other accrued expenses and payables | 83,041 |
Total liabilities | 342,145 |
Net assets, at value | $ 160,017,306 |
Net Assets Consist of |
Undistributed net investment income | 768,378 |
Net unrealized appreciation (depreciation) on: Investments
(net of deferred foreign taxes of $644) | 58,113,832 |
Foreign currency | 6,670 |
Accumulated net realized gain (loss) | (10,334,679) |
Paid-in capital | 111,463,105 |
Net assets, at value | $ 160,017,306 |
Class A Net Asset Value, offering and redemption price per share ($157,718,776 ÷ 11,043,518 outstanding shares of beneficial interest, $.01 par value, unlimited number of shares authorized) | $ 14.28 |
Class B Net Asset Value, offering and redemption price per share ($2,298,530 ÷ 163,772 outstanding shares of beneficial interest, $.01 par value, unlimited number of shares authorized) | $ 14.03 |
The accompanying notes are an integral part of the financial statements.
Statement of Operations
for the year ended December 31, 2010 |
Investment Income |
Income: Dividends (net of foreign taxes withheld of $106,757) | $ 2,011,038 |
Income distributions — Central Cash Management Fund | 6,384 |
Securities lending income, including income from Daily Assets Fund Institutional, net of borrower rebates | 78,877 |
Total income | 2,096,299 |
Expenses: Management fee | 1,278,032 |
Administration fee | 143,599 |
Services to shareholders | 5,559 |
Custodian fee | 43,249 |
Distribution service fee (Class B) | 8,866 |
Professional fees | 57,944 |
Trustees' fees and expenses | 7,645 |
Reports to shareholders | 31,043 |
Other | 35,596 |
Total expenses before expense reductions | 1,611,533 |
Expense reductions | (104,862) |
Total expenses after expense reductions | 1,506,671 |
Net investment income (loss) | 589,628 |
Realized and Unrealized Gain (Loss) |
Net realized gain (loss) from: Investments | 13,483,540 |
Foreign currency | (73,263) |
Payments by affiliates (see Note H) | 36 |
| 13,410,313 |
Change in net unrealized appreciation (depreciation) on: Investments
(net of deferred foreign taxes of $644) | 20,279,521 |
Foreign currency | 5,402 |
| 20,284,923 |
Net gain (loss) | 33,695,236 |
Net increase (decrease) in net assets resulting from operations | $ 34,284,864 |
The accompanying notes are an integral part of the financial statements.
Statement of Changes in Net Assets
Increase (Decrease) in Net Assets | Years Ended December 31, |
2010 | 2009 |
Operations: Net investment income (loss) | $ 589,628 | $ 582,620 |
Net realized gain (loss) | 13,410,313 | (7,267,367) |
Change in net unrealized appreciation (depreciation) | 20,284,923 | 55,600,054 |
Net increase (decrease) in net assets resulting from operations | 34,284,864 | 48,915,307 |
Distributions to shareholders from: Net investment income: Class A | (567,314) | (2,053,958) |
Class B | (5,306) | (80,052) |
Total distributions | (572,620) | (2,134,010) |
Fund share transactions: Class A Proceeds from shares sold | 13,029,724 | 8,747,386 |
Reinvestment of distributions | 567,314 | 2,053,958 |
Cost of shares redeemed | (27,999,087) | (33,699,813) |
Net increase (decrease) in net assets from Class A share transactions | (14,402,049) | (22,898,469) |
Class B Proceeds from shares sold | 260,167 | 692,203 |
Reinvestment of distributions | 5,306 | 80,052 |
Cost of shares redeemed | (5,280,324) | (1,476,946) |
Net increase (decrease) in net assets from Class B share transactions | (5,014,851) | (704,691) |
Increase (decrease) in net assets | 14,295,344 | 23,178,137 |
Net assets at beginning of period | 145,721,962 | 122,543,825 |
Net assets at end of period (including undistributed net investment income of $768,378 and $165,912, respectively) | $ 160,017,306 | $ 145,721,962 |
Other Information |
Class A Shares outstanding at beginning of period | 12,301,988 | 15,069,861 |
Shares sold | 1,052,936 | 905,526 |
Shares issued to shareholders in reinvestment of distributions | 46,236 | 264,685 |
Shares redeemed | (2,357,642) | (3,938,084) |
Net increase (decrease) in Class A shares | (1,258,470) | (2,767,873) |
Shares outstanding at end of period | 11,043,518 | 12,301,988 |
Class B Shares outstanding at beginning of period | 586,186 | 669,567 |
Shares sold | 22,014 | 75,308 |
Shares issued to shareholders in reinvestment of distributions | 439 | 10,492 |
Shares redeemed | (444,867) | (169,181) |
Net increase (decrease) in Class B shares | (422,414) | (83,381) |
Shares outstanding at end of period | 163,772 | 586,186 |
The accompanying notes are an integral part of the financial statements.
Financial Highlights
Class A Years Ended December 31, | 2010 | 2009 | 2008 | 2007 | 2006 |
Selected Per Share Data |
Net asset value, beginning of period | $ 11.32 | $ 7.79 | $ 18.28 | $ 18.15 | $ 15.00 |
Income (loss) from investment operations: Net investment income (loss)a | .05 | .04 | .20d | .08d | .03c |
Net realized and unrealized gain (loss) | 2.96 | 3.64 | (8.18) | 1.61 | 3.28 |
Total from investment operations | 3.01 | 3.68 | (7.98) | 1.69 | 3.31 |
Less distributions from: Net investment income | (.05) | (.15) | (.04) | (.23) | (.16) |
Net realized gains | — | — | (2.47) | (1.33) | — |
Total distributions | (.05) | (.15) | (2.51) | (1.56) | (.16) |
Net asset value, end of period | $ 14.28 | $ 11.32 | $ 7.79 | $ 18.28 | $ 18.15 |
Total Return (%) | 26.64b | 48.20b | (49.96)b | 9.33b | 22.08c |
Ratios to Average Net Assets and Supplemental Data |
Net assets, end of period ($ millions) | 158 | 139 | 117 | 310 | 331 |
Ratio of expenses before expense reductions (%) | 1.12 | 1.11 | 1.11 | 1.14 | 1.12 |
Ratio of expenses after expense reductions (%) | 1.04 | .99 | .99 | 1.12 | 1.12 |
Ratio of net investment income (loss) (%) | .42 | .47 | 1.53d | .45d | .16c |
Portfolio turnover rate (%) | 39 | 53 | 21 | 19 | 28 |
a Based on average shares outstanding during the period. b Total return would have been lower had certain expenses not been reduced. c Includes non-recurring income from the Advisor recorded as a result of an administrative proceeding regarding disclosure of brokerage allocation practices in connection with sales of DWS Funds. The non-recurring income resulted in an increase in net investment income of $0.002 per share and an increase in the ratio of net investment income of 0.01%. Excluding this non-recurring income, total return would have been 0.01% lower. d Net investment income per share and the ratio of net investment income include non-recurring dividend income amounting to $0.05 and $0.02 per share and 0.37% and 0.09% of average daily net assets for the years ended December 31, 2008 and 2007, respectively. |
Class B Years Ended December 31, | 2010 | 2009 | 2008 | 2007 | 2006 |
Selected Per Share Data |
Net asset value, beginning of period | $ 11.11 | $ 7.65 | $ 18.03 | $ 17.93 | $ 14.84 |
Income (loss) from investment operations: Net investment income (loss)a | .03 | .02 | .16e | .01e | (.00)b,d |
Net realized and unrealized gain (loss) | 2.90 | 3.57 | (8.07) | 1.61 | 3.24 |
Total from investment operations | 2.93 | 3.59 | (7.91) | 1.62 | 3.24 |
Less distributions from: Net investment income | (.01) | (.13) | — | (.19) | (.15) |
Net realized gains | — | — | (2.47) | (1.33) | — |
Total distributions | (.01) | (.13) | (2.47) | (1.52) | (.15) |
Net asset value, end of period | $ 14.03 | $ 11.11 | $ 7.65 | $ 18.03 | $ 17.93 |
Total Return (%)c | 26.38 | 47.66 | (50.16) | 8.92 | 21.88d |
Ratios to Average Net Assets and Supplemental Data |
Net assets, end of period ($ millions) | 2 | 7 | 5 | 12 | 37 |
Ratio of expenses before expense reductions (%) | 1.34 | 1.42 | 1.42 | 1.53 | 1.51 |
Ratio of expenses after expense reductions (%) | 1.26 | 1.30 | 1.30 | 1.50 | 1.31 |
Ratio of net investment income (loss) (%) | .20 | .16 | 1.21e | .07e | (.03)d |
Portfolio turnover rate (%) | 39 | 53 | 21 | 19 | 28 |
a Based on average shares outstanding during the period. b Amount is less than $.005. c Total return would have been lower had certain expenses not been reduced. d Includes non-recurring income from the Advisor recorded as a result of an administrative proceeding regarding disclosure of brokerage allocation practices in connection with sales of DWS Funds. The non-recurring income resulted in an increase in net investment income of $0.002 per share and an increase in the ratio of net investment income of 0.01%. Excluding this non-recurring income, total return would have been 0.01% lower. e Net investment income per share and the ratio of net investment income include non-recurring dividend income amounting to $0.05 and $0.02 per share and 0.37% and 0.09% of average daily net assets for the years ended December 31, 2008 and 2007, respectively. |
Performance Summary December 31, 2010
DWS International VIP
All performance shown is historical, assumes reinvestment of all dividend and capital gain distributions, and does not guarantee future results. Investment return and principal value fluctuate with changing market conditions so that, when redeemed, shares may be worth more or less than their original cost. Current performance may be lower or higher than the performance data quoted. Please contact your participating insurance company for the Fund's most recent month-end performance. Performance doesn't reflect charges and fees ("contract charges") associated with the separate account that invests in the Fund or any variable life insurance policy or variable annuity contract for which the Fund is an investment option. These charges and fees will reduce returns. While all share classes have the same underlying portfolio, their performance will differ.
The gross expense ratios of the Fund, as stated in the fee table of the prospectus dated May 1, 2010 are 0.96% and 1.24% for Class A and Class B shares, respectively, and may differ from the expense ratios disclosed in the Financial Highlights tables in this report.
Fund returns during all periods shown reflect a fee waiver and/or reimbursement. Without this waiver/reimbursement, returns would have been lower.
Risk Considerations
Investing in foreign securities, particularly those of emerging markets, presents certain risks, such as currency fluctuations, political and economic changes, and market risks. Stocks may decline in value. See the prospectus for details.
Growth of an Assumed $10,000 Investment |
[] DWS International VIP — Class A [] MSCI EAFE® Index | The Morgan Stanley Capital International (MSCI) Europe, Australasia and Far East (EAFE®) Index is an unmanaged index that tracks international stock performance in the 21 developed markets in Europe, Australasia and the Far East. The index is calculated using closing local market prices and translates into US dollars using the London close foreign exchange rates. Index returns assume the reinvestment of dividends net of withholding tax and, unlike fund returns, do not reflect any fees or expenses. It is not possible to invest directly into an index. |
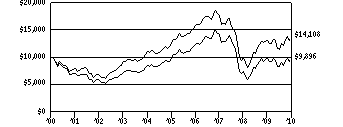 | |
Yearly periods ended December 31 | |
Comparative Results |
DWS International VIP | 1-Year | 3-Year | 5-Year | 10-Year |
Class A | Growth of $10,000 | $10,162 | $7,027 | $10,138 | $9,896 |
Average annual total return | 1.62% | -11.10% | .27% | -.10% |
MSCI EAFE® Index | Growth of $10,000 | $10,775 | $8,040 | $11,292 | $14,108 |
Average annual total return | 7.75% | -7.02% | 2.46% | 3.50% |
DWS International VIP | 1-Year | 3-Year | 5-Year | 10-Year |
Class B | Growth of $10,000 | $10,133 | $6,969 | $9,988 | $9,646 |
Average annual total return | 1.33% | -11.34% | -.02% | -.36% |
MSCI EAFE® Index | Growth of $10,000 | $10,775 | $8,040 | $11,292 | $14,108 |
Average annual total return | 7.75% | -7.02% | 2.46% | 3.50% |
The growth of $10,000 is cumulative.
Information About Your Fund's Expenses
DWS International VIP
As an investor of the Fund, you incur two types of costs: ongoing expenses and transaction costs. Ongoing expenses include management fees, distribution and service (12b-1) fees and other Fund expenses. Examples of transaction costs include contract charges, redemption fees and account maintenance fees, which are not shown in this section. The following tables are intended to help you understand your ongoing expenses (in dollars) of investing in the Fund and to help you compare these expenses with the ongoing expenses of investing in other mutual funds. The example in the table is based on an investment of $1,000 invested at the beginning of the six-month period and held for the entire period (July 1, 2010 to December 31, 2010).
The tables illustrate your Fund's expenses in two ways:
• Actual Fund Return. This helps you estimate the actual dollar amount of ongoing expenses (but not transaction costs) paid on a $1,000 investment in the Fund using the Fund's actual return during the period. To estimate the expenses you paid over the period, simply divide your account value by $1,000 (for example, an $8,600 account value divided by $1,000 = 8.6), then multiply the result by the number in the "Expenses Paid per $1,000" line under the share class you hold.
• Hypothetical 5% Fund Return. This helps you to compare your Fund's ongoing expenses (but not transaction costs) with those of other mutual funds using the Fund's actual expense ratio and a hypothetical rate of return of 5% per year before expenses. Examples using a 5% hypothetical Fund return may be found in the shareholder reports of other mutual funds. The hypothetical account values and expenses may not be used to estimate the actual ending account balance or expenses you paid for the period.
Please note that the expenses shown in these tables are meant to highlight your ongoing expenses only and do not reflect any transaction costs. The "Expenses Paid per $1,000" line of the tables is useful in comparing ongoing expenses only and will not help you determine the relative total expense of owning different funds. If these transaction costs had been included, your costs would have been higher.
Expenses and Value of a $1,000 Investment for the six months ended December 31, 2010 |
Actual Fund Return | Class A | | Class B | |
Beginning Account Value 7/1/10 | $ 1,000.00 | | $ 1,000.00 | |
Ending Account Value 12/31/10 | $ 1,208.80 | | $ 1,207.00 | |
Expenses Paid per $1,000* | $ 5.51 | | $ 7.06 | |
Hypothetical 5% Fund Return | Class A | | Class B | |
Beginning Account Value 7/1/10 | $ 1,000.00 | | $ 1,000.00 | |
Ending Account Value 12/31/10 | $ 1,020.21 | | $ 1,018.80 | |
Expenses Paid per $1,000* | $ 5.04 | | $ 6.46 | |
* Expenses are equal to the Fund's annualized expense ratio for each share class, multiplied by the average account value over the period, multiplied by the number of days in the most recent six-month period, then divided by 365.
Annualized Expense Ratios | Class A | | Class B | |
DWS Variable Series I — DWS International VIP | .99% | | 1.27% | |
For more information, please refer to the Fund's prospectus.
These tables do not reflect charges and fees ("contract charges") associated with the separate account that invests in the Fund or any variable life insurance policy or variable annuity contract for which the Fund is an investment option.
Management Summary December 31, 2010
DWS International VIP
International equities produced a modest gain in 2010 based on the 7.75% return of the the Morgan Stanley Capital International (MSCI) Europe, Australasia and Far East (EAFE) Index. While positive, this return lagged the 15.06% gain of the US market — as gauged by the Standard & Poor's 500® (S&P 500) Index — by a substantial margin. The relative performance of the foreign stocks was dampened by the progression of the European sovereign debt crisis and concerns about the impact of the rising yen on Japan's already sluggish economy.
The Class A shares of DWS International VIP returned 1.62% (unadjusted for contract charges) and underperformed the benchmark in 2010, a time in which investors were focused largely on top-down macroeconomic factors rather than company-specific fundamentals. (Past performance is no guarantee of future results.) For example, higher-quality large-cap companies with strong balance sheets and large cash reserves — in other words, the types of companies in which we invest — underperformed during the year. While there will often be times when higher-quality stocks lag the broader indices, we believe that focusing on stocks with the strongest fundamentals is the most effective way to achieve longer-term outperformance.
In terms of specific drivers of the Fund's performance, the most important sources of our shortfall in 2010 were our overweight in energy — which lagged the broader market — and our ineffective stock selection in the materials, industrials and health care sectors.1 We offset these negatives, to some extent, through our stronger results in information technology and financials.
With regard to portfolio activity, we began to take selective positions in the emerging markets in order to capitalize on the many attractive growth opportunities that the asset class has to offer. We also reduced the deviations in the Fund's country, sector and currency weightings versus the benchmark in an effort to dampen the volatility of our relative performance.
Nikolaus Poehlmann, CFA
Lead Portfolio Manager
Udo Rosendahl (until 2/1/2011)
Mark Schumann
Andreas Wendelken
Portfolio Managers
The Morgan Stanley Capital International (MSCI) Europe, Australasia and Far East (EAFE) Index is an unmanaged index that tracks international stock performance in the 21 developed markets in Europe, Australasia and the Far East. The index is calculated using closing local market prices and translates into US dollars using the London close foreign exchange rates.
The Standard & Poor's 500 (S&P 500) Index is an unmanaged, capitalization-weighted index of 500 stocks. The index is designed to measure performance of the broad domestic economy through changes in the aggregate market value of 500 stocks representing all major industries.
Index returns assume the reinvestment of dividends net of withholding tax and, unlike fund returns, do not reflect any fees or expenses. It is not possible to invest directly into an index.
1 "Overweight" means the Fund holds a higher weighting in a given sector or security than the benchmark. "Underweight" means the Fund holds a lower weighting.
Portfolio management market commentary is as of December 31, 2010, and may not come to pass. This information is subject to change at any time based on market and other conditions. Past performance does not guarantee future results. Current and future portfolio holdings are subject to risk.
Portfolio Summary
DWS International VIP
Asset Allocation (As a % of Investment Portfolio excluding Securities Lending Collateral) | 12/31/10 | 12/31/09 |
| | |
Common Stocks | 96% | 93% |
Preferred Stocks | 4% | — |
Cash Equivalents | — | 4% |
Exchange-Traded Funds | — | 3% |
| 100% | 100% |
Geographical Diversification
(As a % of Investment Portfolio excluding Cash Equivalents and Securities Lending Collateral) | 12/31/10 | 12/31/09 |
| | |
Continental Europe | 41% | 63% |
Japan | 20% | 18% |
United Kingdom | 15% | 9% |
Pacific Basin | 11% | 6% |
Australia | 8% | 4% |
Latin America | 4% | — |
Africa | 1% | — |
| 100% | 100% |
Sector Diversification (As a % of Investment Portfolio excluding Exchange-Traded Fund, Cash Equivalents and Securities Lending Collateral) | 12/31/10 | 12/31/09 |
| | |
Financials | 19% | 24% |
Industrials | 16% | 13% |
Consumer Staples | 15% | 5% |
Materials | 11% | 15% |
Energy | 10% | 13% |
Consumer Discretionary | 9% | 9% |
Telecommunication Services | 6% | 5% |
Health Care | 6% | 8% |
Information Technology | 6% | 3% |
Utilities | 2% | 5% |
| 100% | 100% |
Asset allocation, geographical diversification and sector diversification are subject to change.
For more complete details about the Fund's investment portfolio, see page 65 .
Following the Fund's fiscal first and third quarter-end, a complete portfolio holdings listing is filed with the SEC on Form N-Q. The form will be available on the SEC's Web site at www.sec.gov, and it also may be reviewed and copied at the SEC's Public Reference Room in Washington, D.C. Information on the operation of the SEC's Public Reference Room may be obtained by calling (800) SEC-0330. The Fund's portfolio holdings are also posted on www.dws-investments.com from time to time. Please see the Fund's current prospectus for more information.
Investment Portfolio December 31, 2010
DWS International VIP
|
Shares
| Value ($) |
| |
Common Stocks 95.8% |
Australia 8.2% |
Australia & New Zealand Banking Group Ltd. | 134,879 | 3,221,232 |
BHP Billiton Ltd. | 132,607 | 6,137,279 |
National Australia Bank Ltd. | 125,310 | 3,037,560 |
Newcrest Mining Ltd. | 27,592 | 1,141,261 |
Wesfarmers Ltd. | 73,691 | 2,411,878 |
Woodside Petroleum Ltd. | 66,708 | 2,903,825 |
Woolworths Ltd. | 168,602 | 4,650,873 |
(Cost $20,902,062) | 23,503,908 |
Brazil 0.7% |
Banco Santander Brasil SA (Units) (Cost $2,163,676) | 146,403 | 1,991,785 |
China 1.5% |
China Construction Bank Corp. "H" | 1,490,354 | 1,342,178 |
China National Building Material Co., Ltd. "H" | 630,603 | 1,444,104 |
Industrial & Commercial Bank of China Ltd. "H" | 2,018,366 | 1,498,298 |
(Cost $4,673,081) | 4,284,580 |
Denmark 2.4% |
A P Moller-Maersk AS "B" | 382 | 3,460,127 |
Carlsberg AS "B" | 13,939 | 1,394,963 |
Novo Nordisk AS "B" | 19,428 | 2,186,717 |
(Cost $5,428,284) | 7,041,807 |
Finland 0.8% |
Fortum Oyj | 41,036 | 1,244,938 |
Sampo Oyj "A" | 43,826 | 1,174,867 |
(Cost $2,272,480) | 2,419,805 |
France 9.1% |
Air Liquide SA | 9,723 | 1,229,643 |
BNP Paribas | 33,347 | 2,121,578 |
Compagnie Generale de Geophysique-Veritas* | 53,340 | 1,623,362 |
GDF Suez | 65,458 | 2,348,610 |
LVMH Moet Hennessy Louis Vuitton SA | 10,066 | 1,655,842 |
PPR | 9,451 | 1,502,895 |
Sanofi-Aventis | 46,220 | 2,955,397 |
Schneider Electric SA | 21,374 | 3,198,952 |
Societe Generale | 36,567 | 1,965,330 |
Technip SA | 16,316 | 1,506,592 |
Total SA | 77,220 | 4,091,447 |
Vivendi | 79,766 | 2,153,144 |
(Cost $24,846,422) | 26,352,792 |
Germany 7.9% |
Allianz SE (Registered) | 14,554 | 1,729,449 |
BASF SE | 50,896 | 4,060,262 |
Bayerische Motoren Werke (BMW) AG | 15,111 | 1,187,558 |
Daimler AG (Registered)* | 42,381 | 2,871,983 |
Deutsche Lufthansa AG (Registered)* | 63,783 | 1,393,977 |
Linde AG | 9,699 | 1,472,189 |
MAN SE | 10,828 | 1,287,406 |
|
Shares
| Value ($) |
| |
Metro AG | 22,831 | 1,643,779 |
SAP AG | 30,010 | 1,528,114 |
Siemens AG (Registered) | 37,691 | 4,666,325 |
ThyssenKrupp AG | 21,008 | 870,359 |
(Cost $18,982,348) | 22,711,401 |
Hong Kong 3.3% |
AIA Group Ltd.* | 496,827 | 1,396,623 |
BOC Hong Kong (Holdings) Ltd. | 467,321 | 1,599,261 |
Hong Kong Exchanges & Clearing Ltd. | 174,798 | 3,964,709 |
Hongkong Electric Holdings Ltd. | 406,705 | 2,563,882 |
(Cost $9,148,344) | 9,524,475 |
India 1.6% |
Infosys Technologies Ltd. | 21,645 | 1,662,814 |
ITC Ltd. | 389,302 | 1,523,602 |
Larsen & Toubro Ltd. | 32,378 | 1,432,264 |
(Cost $4,498,515) | 4,618,680 |
Italy 1.9% |
Saipem SpA | 70,516 | 3,474,261 |
UniCredit SpA | 1,013,511 | 2,096,056 |
(Cost $3,738,049) | 5,570,317 |
Japan 19.9% |
Canon, Inc. | 132,065 | 6,770,269 |
FANUC Corp. | 34,788 | 5,336,695 |
Honda Motor Co., Ltd. | 84,499 | 3,339,707 |
Kao Corp. | 118,076 | 3,179,866 |
Komatsu Ltd. | 98,212 | 2,968,853 |
Kubota Corp. | 156,905 | 1,484,630 |
Mitsubishi Corp. | 130,157 | 3,519,787 |
Mitsubishi Heavy Industries Ltd. | 769,511 | 2,888,812 |
Mitsui O.S.K Lines Ltd. | 499,397 | 3,404,211 |
NTT DoCoMo, Inc. | 2,696 | 4,707,325 |
Panasonic Corp. | 209,682 | 2,959,905 |
Seven & I Holdings Co., Ltd. | 156,982 | 4,192,889 |
Shin-Etsu Chemical Co., Ltd. | 78,197 | 4,233,348 |
Sumitomo Mitsui Financial Group, Inc. | 104,975 | 3,736,585 |
Takeda Pharmaceutical Co., Ltd. | 61,442 | 3,021,859 |
Toshiba Corp. | 313,447 | 1,706,141 |
(Cost $48,388,296) | 57,450,882 |
Mexico 0.7% |
America Movil SAB de CV Series L (Cost $2,036,853) | 734,889 | 2,106,483 |
Netherlands 5.9% |
ING Groep NV (CVA)* | 244,598 | 2,379,514 |
Koninklijke (Royal) KPN NV | 106,256 | 1,550,529 |
Koninklijke Philips Electronics NV | 60,208 | 1,844,050 |
Royal Dutch Shell PLC "A" | 270,903 | 9,032,268 |
Unilever NV (CVA) | 69,385 | 2,160,357 |
(Cost $15,691,874) | 16,966,718 |
Norway 0.9% |
DnB NOR ASA (Cost $2,187,993) | 190,147 | 2,668,569 |
Russia 1.2% |
Sberbank of Russia (Cost $1,376,791) | 979,941 | 3,338,686 |
|
Shares
| Value ($) |
| |
Singapore 2.6% |
Keppel Corp., Ltd. | 377,584 | 3,330,542 |
Oversea-Chinese Banking Corp., Ltd. | 366,991 | 2,825,317 |
Singapore Airlines Ltd. | 117,806 | 1,424,669 |
(Cost $6,774,240) | 7,580,528 |
South Africa 0.6% |
Remgro Ltd. (Cost $1,537,047) | 97,815 | 1,677,147 |
Spain 1.3% |
Telefonica SA (Cost $3,881,026) | 164,233 | 3,729,899 |
Sweden 2.6% |
Atlas Copco AB "A" | 62,478 | 1,577,731 |
Hennes & Mauritz AB "B" | 32,583 | 1,085,641 |
Swedbank AB "A"* | 114,409 | 1,595,317 |
TeliaSonera AB | 81,801 | 648,542 |
Volvo AB "B"* | 150,083 | 2,674,895 |
(Cost $6,416,955) | 7,582,126 |
Switzerland 6.4% |
Compagnie Financiere Richemont SA "A" | 53,823 | 3,166,467 |
Givaudan SA (Registered) | 1,445 | 1,560,225 |
Nestle SA (Registered) | 148,448 | 8,695,716 |
Novartis AG (Registered) | 23,786 | 1,399,677 |
Xstrata PLC | 150,227 | 3,526,164 |
(Cost $11,917,651) | 18,348,249 |
Taiwan 0.9% |
Taiwan Semiconductor Manufacturing Co., Ltd. (Cost $2,147,196) | 1,051,788 | 2,561,245 |
United Kingdom 15.4% |
AMEC PLC | 103,492 | 1,855,574 |
AstraZeneca PLC | 59,327 | 2,702,753 |
British American Tobacco PLC | 106,006 | 4,071,522 |
Diageo PLC | 261,723 | 4,835,418 |
GlaxoSmithKline PLC | 232,345 | 4,491,886 |
HSBC Holdings PLC | 627,409 | 6,369,014 |
Johnson Matthey PLC | 23,673 | 752,196 |
Legal & General Group PLC | 1,460,870 | 2,203,618 |
Lloyds Banking Group PLC* | 1,046,822 | 1,072,289 |
Reckitt Benckiser Group PLC | 43,011 | 2,363,809 |
Rio Tinto PLC | 38,762 | 2,711,363 |
|
Shares
| Value ($) |
| |
Tesco PLC | 218,671 | 1,448,952 |
Vodafone Group PLC | 2,349,805 | 6,074,214 |
WPP PLC | 282,863 | 3,481,787 |
(Cost $40,608,564) | 44,434,395 |
Total Common Stocks (Cost $239,617,747) | 276,464,477 |
|
Preferred Stocks 3.8% |
Brazil 2.2% |
Itau Unibanco Holding SA | 60,990 | 1,463,372 |
Petroleo Brasileiro SA | 94,650 | 1,598,269 |
Ultrapar Participacoes SA | 24,793 | 1,585,280 |
Vale SA "A" | 53,943 | 1,576,263 |
(Cost $6,016,853) | 6,223,184 |
Germany 0.8% |
Volkswagen AG (Cost $2,418,936) | 14,410 | 2,335,096 |
Korea 0.8% |
Samsung Electronics Co., Ltd. (Cost $2,171,594) | 4,200 | 2,401,055 |
Total Preferred Stocks (Cost $10,607,383) | 10,959,335 |
|
Participatory Note 0.5% |
Indonesia |
PT Astra International Tbk (issuer Merrill Lynch International & Co.), Expiration Date 10/13/2015* (Cost $1,487,467) | 228,174 | 1,381,453 |
|
Cash Equivalents 0.0% |
Central Cash Management Fund, 0.19% (a) (Cost $13,356) | 13,356 | 13,356 |
| % of Net Assets | Value ($) |
| |
Total Investment Portfolio (Cost $251,725,953)+ | 100.1 | 288,818,621 |
Other Assets and Liabilities, Net | (0.1) | (159,838) |
Net Assets | 100.0 | 288,658,783 |
* Non-income producing security.
+ The cost for federal income tax purposes was $252,899,809. At December 31, 2010, net unrealized appreciation for all securities based on tax cost was $35,918,812. This consisted of aggregate gross unrealized appreciation for all securities in which there was an excess of value over tax cost of $40,745,849 and aggregate gross unrealized depreciation for all securities in which there was an excess of tax cost over value of $4,827,037.
(a) Affiliated fund managed by Deutsche Investment Management Americas Inc. The rate shown is the annualized seven-day yield at period end.
CVA: Certificaten Van Aandelen
Fair Value Measurements
Various inputs are used in determining the value of the Fund's investments. These inputs are summarized in three broad levels. Level 1 includes quoted prices in active markets for identical securities. Level 2 includes other significant observable inputs (including quoted prices for similar securities, interest rates, prepayment speeds, and credit risk). Level 3 includes significant unobservable inputs (including the Fund's own assumptions in determining the fair value of investments). The inputs or methodology used for valuing securities are not necessarily an indication of the risk associated with investing in those securities.
The following is a summary of the inputs used as of December 31, 2010 in valuing the Fund's investments. For information on the Fund's policy regarding the valuation of investments, please refer to the Security Valuation section of Note A in the accompanying Notes to Financial Statements.
Assets | Level 1 | Level 2 | Level 3 | Total |
|
Common and Preferred Stocks | | | | |
Australia | $ — | $ 23,503,908 | $ — | $ 23,503,908 |
Brazil | 8,214,969 | — | — | 8,214,969 |
China | — | 4,284,580 | — | 4,284,580 |
Denmark | — | 7,041,807 | — | 7,041,807 |
Finland | — | 2,419,805 | — | 2,419,805 |
France | — | 26,352,792 | — | 26,352,792 |
Germany | — | 25,046,497 | — | 25,046,497 |
Hong Kong | — | 9,524,475 | — | 9,524,475 |
India | — | 4,618,680 | — | 4,618,680 |
Italy | — | 5,570,317 | — | 5,570,317 |
Japan | — | 57,450,882 | — | 57,450,882 |
Korea | — | 2,401,055 | — | 2,401,055 |
Mexico | 2,106,483 | — | — | 2,106,483 |
Netherlands | — | 16,966,718 | — | 16,966,718 |
Norway | — | 2,668,569 | — | 2,668,569 |
Russia | — | 3,338,686 | — | 3,338,686 |
Singapore | — | 7,580,528 | — | 7,580,528 |
South Africa | — | 1,677,147 | — | 1,677,147 |
Spain | — | 3,729,899 | — | 3,729,899 |
Sweden | — | 7,582,126 | — | 7,582,126 |
Switzerland | — | 18,348,249 | — | 18,348,249 |
Taiwan | — | 2,561,245 | — | 2,561,245 |
United Kingdom | — | 44,434,395 | — | 44,434,395 |
Participatory Note (b) | — | 1,381,453 | — | 1,381,453 |
Short-Term Investments (b) | 13,356 | — | — | 13,356 |
Total | $ 10,334,808 | $ 278,483,813 | $ — | $ 288,818,621 |
There have been no significant transfers in and out of Level 1 and Level 2 fair value measurements during the year ended December 31, 2010.
(b) See Investment Portfolio for additional detailed categorizations.
The accompanying notes are an integral part of the financial statements.
Statement of Assets and Liabilities
as of December 31, 2010 |
Assets |
Investments: Investments in securities, at value (cost $251,712,597) | $ 288,805,265 |
Investment in Central Cash Management Fund (cost $13,356) | 13,356 |
Total investments, at value (cost $251,725,953) | 288,818,621 |
Foreign currency, at value (cost $862,831) | 868,757 |
Receivable for Fund shares sold | 75,593 |
Interest receivable | 133 |
Dividends receivable | 391,955 |
Foreign taxes recoverable | 214,116 |
Other assets | 1,690 |
Total assets | 290,370,865 |
Liabilities |
Line of credit loan payable | 650,000 |
Cash overdraft | 500,000 |
Payable for Fund shares redeemed | 260,006 |
Accrued management fee | 177,572 |
Accrued distribution service fee (Class B) | 78 |
Other accrued expenses and payables | 124,426 |
Total liabilities | 1,712,082 |
Net assets, at value | $ 288,658,783 |
Net Assets Consist of |
Undistributed net investment income | 4,383,767 |
Net unrealized appreciation (depreciation) on: Investments | 37,092,668 |
Foreign currency | 27,534 |
Accumulated net realized gain (loss) | (151,238,256) |
Paid-in capital | 398,393,070 |
Net assets, at value | $ 288,658,783 |
Class A Net Asset Value, offering and redemption price per share ($288,292,676 ÷ 35,091,522 outstanding shares of beneficial interest, $.01 par value, unlimited number of shares authorized) | $ 8.22 |
Class B Net Asset Value, offering and redemption price per share ($366,107 ÷ 44,527 outstanding shares of beneficial interest, $.01 par value, unlimited number of shares authorized) | $ 8.22 |
The accompanying notes are an integral part of the financial statements.
Statement of Operations
for the year ended December 31, 2010 |
Investment Income |
Income: Dividends (net of foreign taxes withheld of $993,419) | $ 7,803,741 |
Interest | 230 |
Income distributions — Central Cash Management Fund | 25,298 |
Securities lending income, including income from Daily Assets Fund Institutional, net of borrower rebates | 320,474 |
Total income | 8,149,743 |
Expenses: Management fee | 2,410,956 |
Administration fee | 305,184 |
Services to shareholders | 17,714 |
Custodian fee | 89,837 |
Distribution service fee (Class B) | 993 |
Professional fees | 64,456 |
Trustees' fees and expenses | 13,197 |
Reports to shareholders | 77,372 |
Other | 43,906 |
Total expenses before expense reductions | 3,023,615 |
Expense reductions | (12,878) |
Total expenses after expense reductions | 3,010,737 |
Net investment income (loss) | 5,139,006 |
Realized and Unrealized Gain (Loss) |
Net realized gain (loss) from: Investments | 33,117,429 |
Foreign currency | (1,084,039) |
| 32,033,390 |
Change in net unrealized appreciation (depreciation) on: Investments | (35,517,787) |
Foreign currency | 33,833 |
| (35,483,954) |
Net gain (loss) | (3,450,564) |
Net increase (decrease) in net assets resulting from operations | $ 1,688,442 |
The accompanying notes are an integral part of the financial statements.
Statement of Changes in Net Assets
Increase (Decrease) in Net Assets | Years Ended December 31, |
2010 | 2009 |
Operations: Net investment income (loss) | $ 5,139,006 | $ 5,093,925 |
Net realized gain (loss) | 32,033,390 | (62,986,953) |
Change in net unrealized appreciation (depreciation) | (35,483,954) | 145,310,993 |
Net increase (decrease) in net assets resulting from operations | 1,688,442 | 87,417,965 |
Distributions to shareholders from: Net investment income: Class A | (6,697,099) | (13,459,468) |
Class B | (8,035) | (17,118) |
Total distributions | (6,705,134) | (13,476,586) |
Fund share transactions: Class A Proceeds from shares sold | 11,044,552 | 14,392,350 |
Reinvestment of distributions | 6,697,099 | 13,459,468 |
Cost of shares redeemed | (68,414,073) | (55,084,882) |
Net increase (decrease) in net assets from Class A share transactions | (50,672,422) | (27,233,064) |
Class B Proceeds from shares sold | 28,325 | 18,639 |
Reinvestment of distributions | 8,035 | 17,118 |
Cost of shares redeemed | (124,745) | (67,424) |
Net increase (decrease) in net assets from Class B share transactions | (88,385) | (31,667) |
Increase (decrease) in net assets | (55,777,499) | 46,676,648 |
Net assets at beginning of period | 344,436,282 | 297,759,634 |
Net assets at end of period (including undistributed net investment income of $4,383,767 and $4,263,585, respectively) | $ 288,658,783 | $ 344,436,282 |
Other Information |
Class A Shares outstanding at beginning of period | 41,648,336 | 45,605,566 |
Shares sold | 1,324,213 | 2,028,682 |
Shares issued to shareholders in reinvestment of distributions | 845,593 | 2,308,657 |
Shares redeemed | (8,726,620) | (8,294,569) |
Net increase (decrease) in Class A shares | (6,556,814) | (3,957,230) |
Shares outstanding at end of period | 35,091,522 | 41,648,336 |
Class B Shares outstanding at beginning of period | 56,405 | 60,497 |
Shares sold | 3,694 | 2,856 |
Shares issued to shareholders in reinvestment of distributions | 1,012 | 2,931 |
Shares redeemed | (16,584) | (9,879) |
Net increase (decrease) in Class B shares | (11,878) | (4,092) |
Shares outstanding at end of period | 44,527 | 56,405 |
The accompanying notes are an integral part of the financial statements.
Financial Highlights
Class A Years Ended December 31, | 2010 | 2009 | 2008 | 2007 | 2006 |
Selected Per Share Data |
Net asset value, beginning of period | $ 8.26 | $ 6.52 | $ 15.01 | $ 13.42 | $ 10.85 |
Income (loss) from investment operations: Net investment income (loss)a | .13 | .12 | .29c | .21c | .28c |
Net realized and unrealized gain (loss) | (.00)* | 1.93 | (6.46) | 1.73 | 2.51 |
Total from investment operations | .13 | 2.05 | (6.17) | 1.94 | 2.79 |
Less distributions from: Net investment income | (.17) | (.31) | (.17) | (.35) | (.22) |
Net realized gains | — | — | (2.15) | — | — |
Total distributions | (.17) | (.31) | (2.32) | (.35) | (.22) |
Net asset value, end of period | $ 8.22 | $ 8.26 | $ 6.52 | $ 15.01 | $ 13.42 |
Total Return (%) | 1.62b | 33.52 | (48.21)b,d | 14.59 | 25.91 |
Ratios to Average Net Assets and Supplemental Data |
Net assets, end of period ($ millions) | 288 | 344 | 297 | 702 | 702 |
Ratio of expenses before expense reductions (%) | .99 | .94 | 1.01 | .98 | .98 |
Ratio of expenses after expense reductions (%) | .99 | .94 | .97 | .98 | .98 |
Ratio of net investment income (loss) (%) | 1.68 | 1.69 | 2.74c | 1.48c | 2.32c |
Portfolio turnover rate (%) | 228 | 81 | 123 | 108 | 105 |
a Based on average shares outstanding during the period. b Total return would have been lower had certain expenses not been reduced. c Net investment income per share and the ratio of net investment income include non-recurring dividend income amounting to $0.09, $0.05 and $0.11 per share and 0.82%, 0.33% and 0.92% of average daily net assets for the years ended December 31, 2008, 2007 and 2006, respectively. d Includes a reimbursement from the Advisor to reimburse the effect of losses incurred as the result of certain operation errors during the period. Excluding this reimbursement, total return would have been 0.06% lower. * Amount is less than $.005. |
Class B Years Ended December 31, | 2010 | 2009 | 2008 | 2007 | 2006 |
Selected Per Share Data |
Net asset value, beginning of period | $ 8.26 | $ 6.52 | $ 14.98 | $ 13.38 | $ 10.82 |
Income (loss) from investment operations: Net investment income (loss)a | .11 | .10 | .23c | .16c | .24c |
Net realized and unrealized gain (loss) | (.00)* | 1.94 | (6.43) | 1.73 | 2.50 |
Total from investment operations | .11 | 2.04 | (6.20) | 1.89 | 2.74 |
Less distributions from: Net investment income | (.15) | (.30) | (.11) | (.29) | (.18) |
Net realized gains | — | — | (2.15) | — | — |
Total distributions | (.15) | (.30) | (2.26) | (.29) | (.18) |
Net asset value, end of period | $ 8.22 | $ 8.26 | $ 6.52 | $ 14.98 | $ 13.38 |
Total Return (%) | 1.33b | 32.89 | (48.25)b,d | 14.25b | 25.44b |
Ratios to Average Net Assets and Supplemental Data |
Net assets, end of period ($ millions) | .36 | .50 | .40 | 12 | 51 |
Ratio of expenses before expense reductions (%) | 1.26 | 1.22 | 1.33 | 1.41 | 1.37 |
Ratio of expenses after expense reductions (%) | 1.26 | 1.22 | 1.28 | 1.39 | 1.36 |
Ratio of net investment income (loss) (%) | 1.41 | 1.42 | 2.42c | 1.07c | 1.94c |
Portfolio turnover rate (%) | 228 | 81 | 123 | 108 | 105 |
a Based on average shares outstanding during the period. b Total return would have been lower had certain expenses not been reduced. c Net investment income per share and the ratio of net investment income include non-recurring dividend income amounting to $0.09, $0.05 and $0.11 per share and 0.82%, 0.33% and 0.92% of average daily net assets for the years ended December 31, 2008, 2007 and 2006, respectively. d Includes a reimbursement from the Advisor to reimburse the effect of losses incurred as the result of certain operation errors during the period. Excluding this reimbursement, total return would have been 0.06% lower. * Amount is less than $.005. |
Performance Summary December 31, 2010
DWS Health Care VIP
All performance shown is historical, assumes reinvestment of all dividend and capital gain distributions, and does not guarantee future results. Investment return and principal value fluctuate with changing market conditions so that, when redeemed, shares may be worth more or less then their original cost. Current performance may be lower or higher than the performance data quoted. Please contact your participating insurance company for the Fund's most recent month-end performance. Performance doesn't reflect charges and fees ("contract charges") associated with the separate account that invests in the Fund or any variable life insurance policy or variable annuity contract for which the Fund is an investment option. These charges and fees will reduce returns. While all share classes have the same underlying portfolio, their performance will differ.
The gross expense ratios of the Fund, as stated in the fee table of the prospectus dated May 1, 2010 are 0.96% and 1.34% for Class A and Class B shares, respectively, and may differ from the expense ratios disclosed in the Financial Highlights tables in this report.
Risk Considerations
Any fund that concentrates in a particular segment of the market will generally be more volatile than a fund that invests more broadly. Stocks may decline in value. See the prospectus for details.
Growth of an Assumed $10,000 Investment |
[] DWS Health Care VIP — Class A [] S&P 500® Index [] S&P® North American Health Care Sector Index | The Standard & Poor's® 500 (S&P 500) Index is an unmanaged, capitalization-weighted index of 500 stocks. The index is designed to measure performance of the broad domestic economy through changes in the aggregate market value of 500 stocks representing all major industries. The S&P® North American Health Care Sector Index is an unmanaged, market-capitalization weighted index of 123 stocks designed to measure the performance of companies in the health care sector. Index returns assume the reinvestment of dividends and, unlike fund returns, do not reflect any fees or expenses. It is not possible to invest directly into an index. |
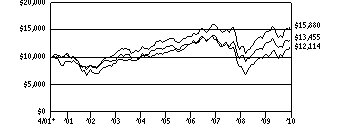 | |
Yearly periods ended December 31 | |
Comparative Results |
DWS Health Care VIP | 1-Year | 3-Year | 5-Year | Life of Fund* |
Class A | Growth of $10,000 | $10,815 | $10,149 | $12,197 | $15,880 |
Average annual total return | 8.15% | .49% | 4.05% | 4.89% |
S&P 500 Index | Growth of $10,000 | $11,506 | $9,168 | $11,199 | $12,114 |
Average annual total return | 15.06% | -2.86% | 2.29% | 2.00% |
S&P North American Health Care Sector Index | Growth of $10,000 | $10,608 | $9,929 | $11,333 | $13,455 |
Average annual total return | 6.08% | -.24% | 2.53% | 3.12% |
DWS Health Care VIP | 1-Year | 3-Year | 5-Year | Life of Class** |
Class B | Growth of $10,000 | $10,768 | $10,034 | $11,980 | $19,059 |
Average annual total return | 7.68% | .11% | 3.68% | 7.88% |
S&P 500 Index | Growth of $10,000 | $11,506 | $9,168 | $11,199 | $15,038 |
Average annual total return | 15.06% | -2.86% | 2.29% | 4.92% |
S&P North American Health Care Sector Index | Growth of $10,000 | $10,608 | $9,929 | $11,333 | $16,109 |
Average annual total return | 6.08% | -.24% | 2.53% | 5.76% |
The growth of $10,000 is cumulative.
* The Fund commenced operations on May 1, 2001. Index returns began on April 30, 2001.
** The Fund commenced offering Class B shares on July 1, 2002. Index returns began on June 30, 2002.
Information About Your Fund's Expenses
DWS Health Care VIP
As an investor of the Fund, you incur two types of costs: ongoing expenses and transaction costs. Ongoing expenses include management fees, distribution and service (12b-1) fees and other Fund expenses. Examples of transaction costs include contract charges, redemption fees and account maintenance fees, which are not shown in this section. The following tables are intended to help you understand your ongoing expenses (in dollars) of investing in the Fund and to help you compare these expenses with the ongoing expenses of investing in other mutual funds. The example in the table is based on an investment of $1,000 invested at the beginning of the six-month period and held for the entire period (July 1, 2010 to December 31, 2010).
The tables illustrate your Fund's expenses in two ways:
• Actual Fund Return. This helps you estimate the actual dollar amount of ongoing expenses (but not transaction costs) paid on a $1,000 investment in the Fund using the Fund's actual return during the period. To estimate the expenses you paid over the period, simply divide your account value by $1,000 (for example, an $8,600 account value divided by $1,000 = 8.6), then multiply the result by the number in the "Expenses Paid per $1,000" line under the share class you hold.
• Hypothetical 5% Fund Return. This helps you to compare your Fund's ongoing expenses (but not transaction costs) with those of other mutual funds using the Fund's actual expense ratio and a hypothetical rate of return of 5% per year before expenses. Examples using a 5% hypothetical Fund return may be found in the shareholder reports of other mutual funds. The hypothetical account values and expenses may not be used to estimate the actual ending account balance or expenses you paid for the period.
Please note that the expenses shown in these tables are meant to highlight your ongoing expenses only and do not reflect any transaction costs. The "Expenses Paid per $1,000" line of the tables is useful in comparing ongoing expenses only and will not help you determine the relative total expense of owning different funds. If these transaction costs had been included, your costs would have been higher.
Expenses and Value of a $1,000 Investment for the six months ended December 31, 2010 |
Actual Fund Return | Class A | | Class B | |
Beginning Account Value 7/1/10 | $ 1,000.00 | | $ 1,000.00 | |
Ending Account Value 12/31/10 | $ 1,160.70 | | $ 1,158.90 | |
Expenses Paid per $1,000* | $ 4.30 | | $ 6.20 | |
Hypothetical 5% Fund Return | Class A | | Class B | |
Beginning Account Value 7/1/10 | $ 1,000.00 | | $ 1,000.00 | |
Ending Account Value 12/31/10 | $ 1,021.22 | | $ 1,019.46 | |
Expenses Paid per $1,000* | $ 4.02 | | $ 5.80 | |
* Expenses are equal to the Fund's annualized expense ratio for each share class, multiplied by the average account value over the period, multiplied by the number of days in the most recent six-month period, then divided by 365.
Annualized Expense Ratios | Class A | | Class B | |
DWS Variable Series I — DWS Health Care VIP | .79% | | 1.14% | |
For more information, please refer to the Fund's prospectus.
These tables do not reflect charges and fees ("contract charges") associated with the separate account that invests in the Fund or any variable life insurance policy or variable annuity contract for which the Fund is an investment option.
Management Summary December 31, 2010
DWS Health Care VIP
For 2010, health care underperformed the broader market as investors continued to prefer companies leveraged to global economic recovery. Additionally, lower health care consumption (e.g., fewer medical procedures and physician visits) and pricing pressures from European Union governments' austerity programs weighed on the sector. For its most recent fiscal year ended December 31, 2010, DWS Health Care VIP returned 8.15% (Class A shares, unadjusted for contract charges). In comparison, the Standard & Poor's 500® (S&P 500) Index returned 15.06% and the S&P® North American Health Care Sector Index returned 6.08%. (Past performance is no guarantee of future results.)
Our overweight to several biotechnology stocks contributed significantly to performance during the year.1 Alexion Pharmaceuticals, Inc. appreciated meaningfully following continued strong sales of Soliris, its drug for a rare disorder in which the body destroys red blood cells, and early clinical data demonstrating the drug's potential for treatment of other disorders. Incyte Corp. shares benefited from positive clinical data for its drug under development for myelofibrosis, a life-threatening blood cancer, as well as progress regarding its oral drug for rheumatoid arthritis. The largest detractor from relative performance during the 12-month period came from the Fund's position in Roche Holding AG. Shares of Roche declined as the company experienced several setbacks in its drug pipeline. We trimmed our position in Roche during the period.
Longer term, we believe that health care stocks remain attractive based on favorable global demographic trends and the continuing emergence of new technologies.
The following person is responsible for the day-to-day management of the Fund:
Leefin Lai, CFA
Portfolio Manager
The following person serves as consultant to the Advisor:
Thomas E. Bucher, CFA
Consultant
The Standard & Poor's 500 (S&P 500) Index is an unmanaged, capitalization-weighted index of 500 stocks. The index is designed to measure performance of the broad domestic economy through changes in the aggregate market value of 500 stocks representing all major industries.
The S&P North American Health Care Sector Index is an unmanaged, market-capitalization-weighted index of 123 stocks designed to measure the performance of companies in the health care sector.
Index returns assume the reinvestment of dividends and, unlike fund returns, do not reflect any fees or expenses. It is not possible to invest directly into an index.
1 "Overweight" means the Fund holds a higher weighting in a given sector or security than the benchmark. "Underweight" means the Fund holds a lower weighting.
Portfolio management market commentary is as of December 31, 2010, and may not come to pass. This information is subject to change at any time based on market and other conditions. Past performance does not guarantee future results. Current and future portfolio holdings are subject to risk.
Portfolio Summary
DWS Health Care VIP
Asset Allocation (As a % of Investment Portfolio excluding Securities Lending Collateral) | 12/31/10 | 12/31/09 |
| | |
Common Stocks | 98% | 100% |
Cash Equivalents | 2% | — |
| 100% | 100% |
Industry Diversification (As a % of Common Stocks) | 12/31/10 | 12/31/09 |
| | |
Pharmaceuticals | 32% | 34% |
Biotechnology | 25% | 23% |
Health Care Services | 19% | 17% |
Medical Supply & Specialty | 18% | 20% |
Life Sciences Equipment | 6% | 6% |
| 100% | 100% |
Asset allocation and industry diversification are subject to change.
For more complete details about the Fund's investment portfolio, see page 77.
Following the Fund's fiscal first and third quarter-end, a complete portfolio holdings listing is filed with the SEC on Form N-Q. The form will be available on the SEC's Web site at www.sec.gov, and it also may be reviewed and copied at the SEC's Public Reference Room in Washington, D.C. Information on the operation of the SEC's Public Reference Room may be obtained by calling (800) SEC-0330. The Fund's portfolio holdings are also posted on www.dws-investments.com from time to time. Please see the Fund's current prospectus for more information.
Investment Portfolio December 31, 2010
DWS Health Care VIP
| Shares | Value ($) |
| |
Common Stocks 97.5% |
Health Care 97.5% |
Biotechnology 24.0% |
Acorda Therapeutics, Inc.* (a) | 5,300 | 144,478 |
Alexion Pharmaceuticals, Inc.* | 12,261 | 987,624 |
Allos Therapeutics, Inc.* | 21,526 | 99,235 |
AMAG Pharmaceuticals, Inc.* | 5,095 | 92,219 |
Amgen, Inc.* (a) | 26,038 | 1,429,486 |
Amylin Pharmaceuticals, Inc.* (a) | 11,727 | 172,504 |
ArQule, Inc.* (a) | 21,500 | 126,205 |
Biogen Idec, Inc.* (a) | 9,141 | 612,904 |
BioMarin Pharmaceutical, Inc.* (a) | 22,673 | 610,584 |
Celera Corp.* | 26,966 | 169,886 |
Celgene Corp.* (a) | 21,411 | 1,266,247 |
Dendreon Corp.* | 6,266 | 218,809 |
Exelixis, Inc.* (a) | 17,859 | 146,622 |
Gen-Probe, Inc.* (a) | 5,900 | 344,265 |
Genzyme Corp.* | 11,203 | 797,654 |
Gilead Sciences, Inc.* | 22,983 | 832,904 |
Halozyme Therapeutics, Inc.* (a) | 32,400 | 256,608 |
Human Genome Sciences, Inc.* (a) | 11,969 | 285,939 |
ImmunoGen, Inc.* (a) | 24,500 | 226,870 |
Immunomedics, Inc.* (a) | 29,700 | 106,326 |
Incyte Corp.* (a) | 29,112 | 482,095 |
Intercell AG* | 5,637 | 87,480 |
InterMune, Inc.* | 4,000 | 145,600 |
Myriad Genetics, Inc.* (a) | 3,761 | 85,901 |
Onyx Pharmaceuticals, Inc.* (a) | 5,261 | 193,973 |
Regeneron Pharmaceuticals, Inc.* (a) | 10,800 | 354,564 |
Savient Pharmaceuticals, Inc.* | 7,315 | 81,489 |
Theravance, Inc.* (a) | 5,042 | 126,403 |
United Therapeutics Corp.* (a) | 7,959 | 503,168 |
Vertex Pharmaceuticals, Inc.* (a) | 18,700 | 655,061 |
| 11,643,103 |
Health Care Services 18.9% |
Aetna, Inc. | 16,400 | 500,364 |
Allscripts Healthcare Solutions, Inc.* | 13,589 | 261,860 |
Cardinal Health, Inc. | 14,100 | 540,171 |
Cerner Corp.* (a) | 5,258 | 498,143 |
CIGNA Corp. | 11,300 | 414,258 |
Coventry Health Care, Inc.* | 8,500 | 224,400 |
CVS Caremark Corp. | 14,931 | 519,151 |
Express Scripts, Inc.* | 19,242 | 1,040,030 |
Fresenius Medical Care AG & Co. KGaA | 13,433 | 776,212 |
Genoptix, Inc.* | 4,603 | 87,549 |
Laboratory Corp. of America Holdings* (a) | 3,895 | 342,448 |
McKesson Corp. | 14,210 | 1,000,100 |
MedAssets, Inc.* (a) | 6,976 | 140,845 |
Medco Health Solutions, Inc.* | 13,573 | 831,618 |
Quest Diagnostics, Inc. | 5,836 | 314,969 |
Tenet Healthcare Corp.* | 21,540 | 144,103 |
UnitedHealth Group, Inc. | 34,767 | 1,255,436 |
WellPoint, Inc.* | 4,600 | 261,556 |
| 9,153,213 |
Life Sciences Tools & Services 6.1% |
Illumina, Inc.* (a) | 1,707 | 108,121 |
Life Technologies Corp.* | 17,606 | 977,133 |
| Shares | Value ($) |
| |
Mettler-Toledo International, Inc.* | 1,540 | 232,864 |
PerkinElmer, Inc. (a) | 15,490 | 399,952 |
Thermo Fisher Scientific, Inc.* | 16,598 | 918,865 |
Waters Corp.* | 4,148 | 322,341 |
| 2,959,276 |
Medical Supply & Specialty 17.7% |
Accuray, Inc.* | 11,500 | 77,625 |
American Medical Systems Holdings, Inc.* | 12,296 | 231,902 |
Baxter International, Inc. | 22,514 | 1,139,659 |
Beckman Coulter, Inc. | 714 | 53,714 |
Becton, Dickinson & Co. (a) | 8,264 | 698,473 |
BioMimetic Therapeutics, Inc.* | 5,936 | 75,387 |
C.R. Bard, Inc. | 4,526 | 415,351 |
Covidien PLC | 22,976 | 1,049,084 |
Hologic, Inc.* | 8,799 | 165,597 |
Kinetic Concepts, Inc.* (a) | 6,914 | 289,558 |
Masimo Corp. (a) | 5,400 | 156,978 |
Medtronic, Inc. | 33,449 | 1,240,623 |
Owens & Minor, Inc. (a) | 4,241 | 124,813 |
Sirona Dental Systems, Inc.* (a) | 3,711 | 155,046 |
Spectranetics Corp.* | 16,885 | 87,127 |
St. Jude Medical, Inc.* | 19,000 | 812,250 |
Stryker Corp. (a) | 10,298 | 553,003 |
Thoratec Corp.* (a) | 7,921 | 224,323 |
Varian Medical Systems, Inc.* | 2,686 | 186,086 |
Wright Medical Group, Inc.* | 5,945 | 92,326 |
Zimmer Holdings, Inc.* (a) | 13,603 | 730,209 |
| 8,559,134 |
Pharmaceuticals 30.8% |
Abbott Laboratories | 30,292 | 1,451,290 |
Allergan, Inc. | 8,500 | 583,695 |
Ardea Biosciences, Inc.* | 7,300 | 189,800 |
Auxilium Pharmaceuticals, Inc.* (a) | 11,211 | 236,552 |
Bristol-Myers Squibb Co. | 41,884 | 1,109,088 |
Cardiome Pharma Corp.* | 14,200 | 91,164 |
Cephalon, Inc.* (a) | 4,396 | 271,321 |
Eli Lilly & Co. (a) | 6,678 | 233,997 |
Forest Laboratories, Inc.* | 15,000 | 479,700 |
Impax Laboratories, Inc.* | 12,712 | 255,638 |
Inspire Pharmaceuticals, Inc.* | 22,300 | 187,320 |
Ironwood Pharmaceuticals, Inc. "A"* | 4,500 | 46,575 |
Johnson & Johnson | 28,150 | 1,741,077 |
Merck & Co., Inc. | 54,753 | 1,973,298 |
Mylan, Inc.* | 36,566 | 772,640 |
Novartis AG (Registered) | 12,139 | 714,314 |
Pfizer, Inc. | 134,911 | 2,362,292 |
Pharmasset, Inc.* (a) | 2,987 | 129,666 |
Questcor Pharmaceuticals, Inc.* (a) | 14,822 | 218,328 |
Roche Holding AG (Genusschein) | 3,522 | 516,299 |
Salix Pharmaceuticals Ltd.* (a) | 7,700 | 361,592 |
Shire PLC (ADR) (a) | 6,532 | 472,786 |
Valeant Pharmaceuticals International, Inc. | 17,054 | 482,458 |
VIVUS, Inc.* (a) | 2,999 | 28,101 |
| 14,908,991 |
Total Common Stocks (Cost $33,443,187) | 47,223,717 |
|
| Shares | Value ($) |
| |
Securities Lending Collateral 26.8% |
Daily Assets Fund Institutional, 0.27% (b) (c) (Cost $12,965,325) | 12,965,325 | 12,965,325 |
|
Cash Equivalents 2.4% |
Central Cash Management Fund, 0.19% (b) (Cost $1,171,099) | 1,171,099 | 1,171,099 |
| % of Net Assets | Value ($) |
| |
Total Investment Portfolio (Cost $47,579,611)+ | 126.7 | 61,360,141 |
Other Assets and Liabilities, Net | (26.7) | (12,949,111) |
Net Assets | 100.0 | 48,411,030 |
* Non-income producing security.
+ The cost for federal income tax purposes was $48,011,212. At December 31, 2010, net unrealized appreciation for all securities based on tax cost was $13,348,929. This consisted of aggregate gross unrealized appreciation for all securities in which there was an excess of value over tax cost of $14,541,563 and aggregate gross unrealized depreciation for all securities in which there was an excess of tax cost over value of $1,192,634.
(a) All or a portion of these securities were on loan (see Notes to Financial Statements). The value of all securities loaned at December 31, 2010 amounted to $12,570,150, which is 26.0% of net assets.
(b) Affiliated fund managed by Deutsche Investment Management Americas Inc. The rate shown is the annualized seven-day yield at period end.
(c) Represents collateral held in connection with securities lending. Income earned by the Fund is net of borrower rebates.
ADR: American Depositary Receipt
Fair Value Measurements
Various inputs are used in determining the value of the Fund's investments. These inputs are summarized in three broad levels. Level 1 includes quoted prices in active markets for identical securities. Level 2 includes other significant observable inputs (including quoted prices for similar securities, interest rates, prepayment speeds, and credit risk). Level 3 includes significant unobservable inputs (including the Fund's own assumptions in determining the fair value of investments). The inputs or methodology used for valuing securities are not necessarily an indication of the risk associated with investing in those securities.
The following is a summary of the inputs used as of December 31, 2010 in valuing the Fund's investments. For information on the Fund's policy regarding the valuation of investments, please refer to the Security Valuation section of Note A in the accompanying Notes to Financial Statements.
Assets | Level 1 | Level 2 | Level 3 | Total |
|
Common Stocks Biotechnology | $ 11,555,623 | $ 87,480 | $ — | $ 11,643,103 |
Health Care Services | 8,377,001 | 776,212 | — | 9,153,213 |
Life Sciences Tools & Specialty | 2,959,276 | — | — | 2,959,276 |
Medical Supply & Specialty | 8,559,134 | — | — | 8,559,134 |
Pharmaceuticals | 13,678,378 | 1,230,613 | — | 14,908,991 |
Short-Term Investments (d) | 14,136,424 | — | — | 14,136,424 |
Total | $ 59,265,836 | $ 2,094,305 | $ — | $ 61,360,141 |
There have been no significant transfers in and out of Level 1 and Level 2 fair value measurements during the year ended December 31, 2010.
(d) See Investment Portfolio for additional detailed categorizations.
The accompanying notes are an integral part of the financial statements.
Statement of Assets and Liabilities
as of December 31, 2010 |
Assets |
Investments: Investments in securities, at value (cost $33,443,187), including $12,570,150 of securities loaned | $ 47,223,717 |
Investment in Daily Assets Fund Institutional (cost $12,965,325)* | 12,965,325 |
Investment in Central Cash Management Fund (cost $1,171,099) | 1,171,099 |
Total investments, at value (cost $47,579,611) | 61,360,141 |
Foreign currency, at value (cost $130) | 132 |
Receivable for investments sold | 28,704 |
Receivable for Fund shares sold | 30,920 |
Interest receivable | 1,364 |
Dividends receivable | 34,946 |
Foreign taxes recoverable | 16,873 |
Other assets | 270 |
Total assets | 61,473,350 |
Liabilities |
Payable upon return of securities loaned | 12,965,325 |
Payable for Fund shares redeemed | 15,277 |
Accrued management fee | 26,793 |
Accrued distribution service fee (Class B) | 637 |
Other accrued expenses and payables | 54,288 |
Total liabilities | 13,062,320 |
Net assets, at value | $ 48,411,030 |
Net Assets Consist of |
Undistributed net investment income | 251,765 |
Net unrealized appreciation (depreciation) on: Investments | 13,780,530 |
Foreign currency | 2,439 |
Accumulated net realized gain (loss) | 1,145,472 |
Paid-in capital | 33,230,824 |
Net assets, at value | $ 48,411,030 |
Class A Net Asset Value, offering and redemption price per share ($45,390,479 ÷ 4,002,304 outstanding shares of beneficial interest, $.01 par value, unlimited number of shares authorized) | $ 11.34 |
Class B Net Asset Value, offering and redemption price per share ($3,020,551 ÷ 274,245 outstanding shares of beneficial interest, $.01 par value, unlimited number of shares authorized) | $ 11.01 |
* Represents collateral on securities loaned.
The accompanying notes are an integral part of the financial statements.
Statement of Operations
for the year ended December 31, 2010 |
Investment Income |
Income: Dividends (net of foreign taxes withheld of $15,568) | $ 680,141 |
Income distributions — Central Cash Management Fund | 1,440 |
Securities lending income, including income from Daily Assets Fund Institutional, net of borrower rebates | 18,213 |
Total income | 699,794 |
Expenses: Management fee | 328,345 |
Administration fee | 49,375 |
Services to Shareholders | 2,211 |
Record keeping fee (Class B) | 2,927 |
Custodian fee | 10,321 |
Distribution service fee (Class B) | 7,384 |
Audit and tax fees | 29,355 |
Legal fees | 17,332 |
Trustees' fees and expenses | 3,736 |
Other | 4,824 |
Total expenses | 455,810 |
Net investment income | 243,984 |
Realized and Unrealized Gain (Loss) |
Net realized gain (loss) from: Investments | 1,617,209 |
Foreign currency | 7,781 |
| 1,624,990 |
Change in net unrealized appreciation (depreciation) on: Investments | 1,802,611 |
Foreign currency | 6,567 |
| 1,809,178 |
Net gain (loss) | 3,434,168 |
Net increase (decrease) in net assets resulting from operations | $ 3,678,152 |
The accompanying notes are an integral part of the financial statements.
Statement of Changes in Net Assets
Increase (Decrease) in Net Assets | Years Ended December 31, |
2010 | 2009 |
Operations: Net investment income | $ 243,984 | $ (54,312) |
Net realized gain (loss) | 1,624,990 | 4,360,035 |
Change in net unrealized appreciation (depreciation) | 1,809,178 | 5,459,026 |
Net increase (decrease) in net assets resulting from operations | 3,678,152 | 9,764,749 |
Distributions to shareholders from: Net investment income: Class A | — | (711,488) |
Class B | — | (35,875) |
Net realized gains: Class A | (3,243,143) | (673,607) |
Class B | (203,682) | (45,473) |
Total distributions | (3,446,825) | (1,466,443) |
Fund share transactions: Class A Proceeds from shares sold | 4,393,397 | 3,080,971 |
Reinvestment of distributions | 3,243,143 | 1,385,095 |
Cost of shares redeemed | (11,708,727) | (23,233,574) |
Net increase (decrease) in net assets from Class A share transactions | (4,072,187) | (18,767,508) |
Class B Proceeds from shares sold | 286,173 | 467,768 |
Reinvestment of distributions | 203,682 | 81,348 |
Cost of shares redeemed | (570,175) | (1,479,410) |
Net increase (decrease) in net assets from Class B share transactions | (80,320) | (930,294) |
Increase (decrease) in net assets | (3,921,180) | (11,399,496) |
Net assets at beginning of period | 52,332,210 | 63,731,706 |
Net assets at end of period (including undistributed net investment income of $251,765 and $0, respectively) | $ 48,411,030 | $ 52,332,210 |
Other Information |
Class A Shares outstanding at beginning of period | 4,392,554 | 6,373,629 |
Shares sold | 401,779 | 320,687 |
Shares issued to shareholders in reinvestment of distributions | 294,563 | 164,892 |
Shares redeemed | (1,086,592) | (2,466,654) |
Net increase (decrease) in Class A shares | (390,250) | (1,981,075) |
Shares outstanding at end of period | 4,002,304 | 4,392,554 |
Class B Shares outstanding at beginning of period | 281,083 | 379,018 |
Shares sold | 27,448 | 50,217 |
Shares issued to shareholders in reinvestment of distributions | 19,000 | 9,896 |
Shares redeemed | (53,286) | (158,048) |
Net increase (decrease) in Class B shares | (6,838) | (97,935) |
Shares outstanding at end of period | 274,245 | 281,083 |
The accompanying notes are an integral part of the financial statements.
Financial Highlights
Class A Years Ended December 31, | 2010 | 2009 | 2008 | 2007 | 2006 |
Selected Per Share Data |
Net asset value, beginning of period | $ 11.21 | $ 9.45 | $ 14.68 | $ 13.77 | $ 13.02 |
Income (loss) from investment operations: Net investment income (loss)a | .06 | (.01) | .09c | .03c | (.01)b |
Net realized and unrealized gain (loss) | .83 | 2.02 | (3.08) | 1.75 | .81 |
Total from investment operations | .89 | 2.01 | (2.99) | 1.78 | .80 |
Less distributions from: Net investment income | — | (.13) | (.04) | — | — |
Net realized gains | (.76) | (.12) | (2.20) | (.87) | (.05) |
Total distributions | (.76) | (.25) | (2.24) | (.87) | (.05) |
Net asset value, end of period | $ 11.34 | $ 11.21 | $ 9.45 | $ 14.68 | $ 13.77 |
Total Return (%) | 8.15 | 22.19 | (23.20) | 13.20 | 6.17b |
Ratios to Average Net Assets and Supplemental Data |
Net assets, end of period ($ millions) | 45 | 49 | 60 | 98 | 101 |
Ratio of expenses (%) | .90 | .96 | .92 | .93 | .89 |
Ratio of net investment income (loss) (%) | .52 | (.08) | .79c | .19c | (.03)b |
Portfolio turnover rate (%) | 16 | 31 | 24 | 37 | 47 |
a Based on average shares outstanding during the period. b Includes non-recurring income from the Advisor recorded as a result of an administrative proceeding regarding disclosure of brokerage allocation practices in connection with sales of DWS Funds. The non-recurring income resulted in an increase in net investment income of $0.003 per share and an increase in the ratio of net investment income of 0.02%. Excluding this non-recurring income, total return would have been 0.02% lower. c Net investment income per share and ratio of net investment income include non-recurring dividend income amounting to $0.03 and $0.02 per share and 0.28% and 0.13% of average daily net assets for the years ended December 31, 2008 and 2007, respectively. |
Class B Years Ended December 31, | 2010 | 2009 | 2008 | 2007 | 2006 |
Selected Per Share Data |
Net asset value, beginning of period | $ 10.95 | $ 9.23 | $ 14.40 | $ 13.55 | $ 12.87 |
Income (loss) from investment operations: Net investment income (loss)a | .02 | (.04) | .05c | (.03)c | (.06)b |
Net realized and unrealized gain (loss) | .80 | 1.98 | (3.02) | 1.75 | .79 |
Total from investment operations | .82 | 1.94 | (2.97) | 1.72 | .73 |
Less distributions from: Net investment income | — | (.10) | — | — | — |
Net realized gains | (.76) | (.12) | (2.20) | (.87) | (.05) |
Total distributions | (.76) | (.22) | (2.20) | (.87) | (.05) |
Net asset value, end of period | $ 11.01 | $ 10.95 | $ 9.23 | $ 14.40 | $ 13.55 |
Total Return (%) | 7.68 | 21.80 | (23.50) | 12.88 | 5.77b |
Ratios to Average Net Assets and Supplemental Data |
Net assets, end of period ($ millions) | 3 | 3 | 3 | 5 | 21 |
Ratio of expenses (%) | 1.25 | 1.34 | 1.27 | 1.34 | 1.28 |
Ratio of net investment income (loss) (%) | .16 | (.46) | .43c | (.22)c | (.42)b |
Portfolio turnover rate (%) | 16 | 31 | 24 | 37 | 47 |
a Based on average shares outstanding during the period. b Includes non-recurring income from the Advisor recorded as a result of an administrative proceeding regarding disclosure of brokerage allocation practices in connection with sales of DWS Funds. The non-recurring income resulted in an increase in net investment income of $0.003 per share and an increase in the ratio of net investment income of 0.02%. Excluding this non-recurring income, total return would have been 0.02% lower. c Net investment income per share and ratio of net investment income include non-recurring dividend income amounting to $0.03 and $0.02 per share and 0.28% and 0.13% of average daily net assets for the year ended December 31, 2008 and 2007, respectively. |
Notes to Financial Statements
A. Organization and Significant Accounting Policies
DWS Variable Series I (the "Series") is registered under the Investment Company Act of 1940, as amended (the "1940 Act"), as an open-end, registered management investment company organized as a Massachusetts business trust. The Series consists of six diversified funds: DWS Bond VIP, DWS Growth & Income VIP, DWS Capital Growth VIP, DWS Global Opportunities VIP, DWS International VIP and DWS Health Care VIP (individually or collectively hereinafter referred to as a "Fund" or the "Funds"). The Series is intended to be the underlying investment vehicle for variable annuity contracts and variable life insurance policies to be offered by the separate accounts of certain life insurance companies ("Participating Insurance Companies").
Multiple Classes of Shares of Beneficial Interest. DWS Bond VIP offers one class of shares (Class A shares). DWS Growth & Income VIP, DWS Capital Growth VIP, DWS Global Opportunities VIP, DWS International VIP and DWS Health Care VIP each offer two classes of shares (Class A shares and Class B shares). Class B shares are subject to Rule 12b-1 distribution fees under the 1940 Act and record keeping fees equal to an annual rate of 0.25% and up to 0.15%, respectively, of the average daily net assets of the Class B shares of the applicable Fund. Class A shares are not subject to such fees.
Investment income, realized and unrealized gains and losses, and certain fund-level expenses and expense reductions, if any, are borne pro rata on the basis of relative net assets by the holders of all classes of shares, except that each class bears certain expenses unique to that class (including the applicable 12b-1 distribution fees and record keeping fees). Differences in class-level expenses may result in payment of different per share dividends by class. All shares have equal rights with respect to voting subject to class-specific arrangements.
The Series' financial statements are prepared in accordance with accounting principles generally accepted in the United States of America, which require the use of management estimates. Actual results could differ from those estimates. The policies described below are followed consistently by the Series in the preparation of the financial statements for its Funds.
Security Valuation. Investments are stated at value determined as of the close of regular trading on the New York Stock Exchange on each day the exchange is open for trading.
Various inputs are used in determining the value of each Fund's investments. These inputs are summarized in three broad levels. Level 1 includes quoted prices in active markets for identical securities. Level 2 includes other significant observable inputs (including quoted prices for similar securities, interest rates, prepayment speeds, and credit risk). Level 3 includes significant unobservable inputs (including the Fund's own assumptions in determining the fair value of investments). The inputs or methodology used for valuing securities are not necessarily an indication of the risk associated with investing in those securities.
Equity securities and exchange-traded funds ("ETFs") are valued at the most recent sale price or official closing price reported on the exchange (US or foreign) or over-the-counter market on which they trade and are categorized as Level 1 securities. Securities or ETFs for which no sales are reported are valued at the calculated mean between the most recent bid and asked quotations on the relevant market or, if a mean cannot be determined, at the most recent bid quotation. For certain international equity securities, in order to adjust for events which may occur between the close of the foreign exchanges and the close of the New York Stock Exchange, a fair valuation model may be used. This fair valuation model takes into account comparisons to the valuation of American Depository Receipts (ADRs), exchange-traded funds, futures contracts and certain indices and these securities are categorized as Level 2.
Debt securities are valued by independent pricing services approved by the Trustees of the Series. If the pricing services are unable to provide valuations, securities are valued at the most recent bid quotation or evaluated price, as applicable, obtained from one or more broker-dealers. Such services may use various pricing techniques which take into account appropriate factors such as yield, quality, coupon rate, maturity, type of issue, trading characteristics and other data, as well as broker quotes. These securities are generally categorized as Level 2.
Futures contracts are generally valued at the settlement prices established each day on the exchange on which they are traded and are categorized as Level 1.
Forward currency contracts are valued at the prevailing forward exchange rate of the underlying currencies and are categorized as Level 2.
Money market instruments purchased with an original or remaining maturity of sixty days or less, maturing at par, are valued at amortized cost, which approximates value, and are categorized as Level 2. Investments in open-end investment companies are valued at their net asset value each business day and are categorized as Level 1.
Securities and other assets for which market quotations are not readily available or for which the above valuation procedures are deemed not to reflect fair value are valued in a manner that is intended to reflect their fair value as determined in accordance with procedures approved by the Trustees and are generally categorized as Level 3. In accordance with each Fund's valuation procedures, factors used in determining value may include, but are not limited to, the type of the security; the size of the holding; the initial cost of the security; the existence of any contractual restrictions on the security's disposition; the price and extent of public trading in similar securities of the issuer or of comparable companies; quotations or evaluated prices from broker-dealers and/or pricing services; information obtained from the issuer, analysts, and/or the appropriate stock exchange (for exchange-traded securities); an analysis of the company's or issuer's financial statements; an evaluation of the forces that influence the issuer and the market(s) in which the security is purchased and sold and with respect to debt securities; the maturity, coupon, creditworthiness, currency denomination and the movement of the market in which the security is normally traded. The value determined under these procedures may differ from published values for the same securities.
Disclosure about the classification of fair value measurements is included in a table following each Fund's Investment Portfolio.
Securities Lending. Each Fund lends securities to certain financial institutions. The Fund retains beneficial ownership of the securities it has loaned and continues to receive interest and dividends paid by the issuer of securities and to participate in any changes in their market value. The Fund requires the borrowers of the securities to maintain collateral with the Fund consisting of either cash or liquid, unencumbered assets having a value at least equal to the value of the securities loaned. When the collateral falls below specified amounts, the lending agent will use its best effort to obtain additional collateral on the next business day to meet required amounts under the security lending agreement. The Fund may invest the cash collateral into a joint trading account in an affiliated money market fund pursuant to Exemptive Orders issued by the SEC. The Fund receives compensation for lending its securities either in the form of fees or by earning interest on invested cash collateral net of borrower rebates and fees paid to a lending agent. Either the Fund or the borrower may terminate the loan. There may be risks of delay and costs in recovery of securities or even loss of rights in the collateral should the borrower of the securities fail financially. The Fund is also subject to all investment risks associated with the reinvestment of any cash collateral received, including, but not limited to, interest rate, credit and liquidity risk associated with such investments. DWS Global Opportunities VIP and DWS International VIP had no securities on loan as of December 31, 2010.
Foreign Currency Translations. The books and records of the Funds are maintained in US dollars. Investment securities and other assets and liabilities denominated in a foreign currency are translated into US dollars at the prevailing exchange rates at period end. Purchases and sales of investment securities, income and expenses are translated into US dollars at the prevailing exchange rates on the respective dates of the transactions.
Net realized and unrealized gains and losses on foreign currency transactions represent net gains and losses between trade and settlement dates on securities transactions, the disposition of forward foreign currency exchange contracts and foreign currencies, and the difference between the amount of net investment income accrued and the US dollar amount actually received. That portion of both realized and unrealized gains and losses on investments that results from fluctuations in foreign currency exchange rates is not separately disclosed but is included with net realized and unrealized gain/appreciation and loss/depreciation on investments.
Mortgage Dollar Rolls. DWS Bond VIP may enter into mortgage dollar rolls in which the Fund sells to a bank or broker/dealer (the "counterparty") mortgage-backed securities for delivery in the current month and simultaneously contracts to repurchase similar, but not identical, securities on a fixed date. The counterparty receives all principal and interest payments, including prepayments, made on the security while it is the holder. The Fund receives compensation as consideration for entering into the commitment to repurchase. The compensation is paid in the form of a lower price for the security upon its repurchase, or alternatively, a fee. Mortgage dollar rolls may be renewed with a new sale and repurchase price and a cash settlement made at each renewal without physical delivery of the securities subject to the contract.
Certain risks may arise upon entering into mortgage dollar rolls from the potential inability of counterparties to meet the terms of their commitments. Additionally, the value of such securities may change adversely before the Fund is able to repurchase them. There can be no assurance that the Fund's use of the cash that it receives from a mortgage dollar roll will provide a return that exceeds its costs.
When-Issued/Delayed Securities. DWS Bond VIP may purchase securities with delivery or payment to occur at a later date beyond the normal settlement period. At the time the Fund enters into a commitment to purchase a security, the transaction is recorded and the value of the security is reflected in the net asset value. The price of such security and the date when the security will be delivered and paid for are fixed at the time the transaction is negotiated. The value of the security may vary with market fluctuations. No interest accrues to the Fund until payment takes place. At the time the Fund enters into this type of transaction it is required to segregate cash or other liquid assets at least equal to the amount of the commitment.
Certain risks may arise upon entering into when-issued or delayed delivery securities from the potential inability of counterparties to meet the terms of their contracts or if the issuer does not issue the securities due to political, economic, or other factors. Additionally, losses may arise due to changes in the value of the underlying securities.
Taxes. Each Fund is treated as a separate taxpayer as provided for in the Internal Revenue Code, as amended. It is each Fund's policy to comply with the requirements of the Internal Revenue Code, as amended, which are applicable to regulated investment companies, and to distribute all of its taxable income to the separate accounts of the Participating Insurance Companies which hold its shares.
Additionally, based on the Series' understanding of the tax rules and rates related to income, gains and transactions for the foreign jurisdictions in which each Fund invests, each Fund will provide for foreign taxes, and where appropriate, deferred foreign taxes.
At December 31, 2010, the following Funds had an approximate net tax basis capital loss carryforward which may be applied against any realized net taxable capital gains of each succeeding year until fully utilized or until the following expiration dates, whichever occurs first:
Fund | Capital Loss Carryforwards ($) | Expiration
Date | Capital Loss Carryfowards Utilized ($) | Capital Loss Carryfowards Expired ($) |
DWS Bond VIP | 37,157,000 | 12/31/2017 | 5,674,000 | — |
DWS Growth & Income VIP | 46,950,000 | 12/31/2016-12/31/2017 | 10,057,000 | — |
DWS Capital Growth VIP | 163,203,000 | 12/31/2011-12/31/2017 | 57,103,000 | 36,274,000 |
DWS Global Opportunities VIP | 9,364,000 | 12/31/2017 | 12,952,000 | — |
DWS International VIP | 150,205,000 | 12/31/2016-12/31/2017 | 26,324,000 | — |
At December 31, 2010, DWS Capital Growth VIP had a net tax basis capital loss carryforward of approximately $163,203,000, including $31,237,000 inherited from its mergers with affiliated funds in fiscal years 2005, 2006 and 2009 which may be applied against any realized net taxable capital gains of each succeeding year until fully utilized and which may be subject to certain limitations under Sections 382-384 of the Internal Revenue Code. Due to these limitations (under Sections 382-384 of the Internal Revenue Code), approximately $1,097,000 of the inherited capital loss carryforward cannot be used by the funds, and is not included in the capital loss carryforward of $163,203,000 disclosed above.
Each Fund has reviewed the tax positions for the open tax years as of December 31, 2010 and has determined that no provision for income tax is required in each Fund's financial statements. Each of the Fund's federal tax returns for the prior three fiscal years remains open subject to examination by the Internal Revenue Service.
Distribution of Income and Gains. Each Fund will declare and distribute dividends from their net investment income, if any, annually, although additional distributions may be made if necessary. Net realized gains from investment transactions, in excess of available capital loss carryforwards, would be taxable to each Fund if not distributed, and, therefore, will be distributed to shareholders at least annually.
The timing and characterization of certain income and capital gains distributions are determined annually in accordance with federal tax regulations which may differ from accounting principles generally accepted in the United States of America. These differences primarily relate to investments in foreign denominated investments, investments in forward foreign currency exchange contracts, passive foreign investment companies and certain securities sold at a loss. As a result, net investment income (loss) and net realized gain (loss) on investment transactions for a reporting period may differ significantly from distributions during such period. Accordingly, each Fund may periodically make reclassifications among certain of its capital accounts without impacting the net asset value of the Fund.
At December 31, 2010, the Funds' components of distributable earnings (accumulated losses) on a tax-basis are as follows:
Fund | Undistributed Ordinary Income ($)* | Undistributed Net Long-Term Capital Gains ($) | Capital Loss Carryforwards ($) | Net Unrealized Gain (Loss) on Investments ($) |
DWS Bond VIP | 4,878,143 | — | (37,157,000) | 10,788 |
DWS Growth & Income VIP | 1,201,576 | — | (46,950,000) | 12,920,732 |
DWS Capital Growth VIP | 5,191,902 | — | (163,203,000) | 241,755,764 |
DWS Global Opportunities VIP | 2,437,828 | — | (9,364,000) | 55,460,482 |
DWS International VIP | 4,523,867 | — | (150,205,000) | 35,918,812 |
DWS Health Care VIP | 628,235 | 1,200,334 | — | 13,348,929 |
In addition, the tax character of distributions paid to shareholders by the Funds is summarized as follows:
| Distributions from Ordinary Income ($)* Years Ended December 31, | Distributions from Long-Term Capital Gains ($) Years Ended December 31, |
Fund | 2010 | 2009 | 2010 | 2009 |
DWS Bond VIP | 6,962,542 | 11,985,798 | — | — |
DWS Growth & Income VIP | 1,624,850 | 2,003,256 | — | — |
DWS Capital Growth VIP | 6,385,406 | 8,113,671 | — | — |
DWS Global Opportunities VIP | 572,620 | 2,134,010 | — | — |
DWS International VIP | 6,705,134 | 13,476,586 | — | — |
DWS Health Care VIP | 77,482 | 724,315 | 3,369,342 | 742,128 |
* For tax purposes, short-term capital gains distributions are considered ordinary income distributions.
Expenses. Expenses of the Series arising in connection with a specific Fund are allocated to that Fund. Other Series expenses which cannot be directly attributed to a Fund are apportioned among the Funds in the Series.
Contingencies. In the normal course of business, each Fund may enter into contracts with service providers that contain general indemnification clauses. Each Fund's maximum exposure under these arrangements is unknown as this would involve future claims that may be made against each Fund that have not yet been made. However, based on experience, each Fund expects the risk of loss to be remote.
Other. For each Fund, investment transactions are accounted for on a trade date plus one basis for daily net asset value calculations. However, for financial reporting purposes, investment transactions are reported on trade date. Interest income is recorded on the accrual basis net of foreign withholding taxes. Dividend income is recorded on the ex-dividend date net of foreign withholding taxes. Certain dividends from foreign securities may be recorded subsequent to the ex-dividend date as soon as the Fund is informed of such dividends. Realized gains and losses from investment transactions are recorded on an identified cost basis. All discounts and premiums are accreted/amortized for both tax and financial reporting purposes.
B. Derivative Instruments
Futures Contracts. A futures contract is an agreement between a buyer or seller and an established futures exchange or its clearinghouse in which the buyer or seller agrees to take or make a delivery of a specific amount of a financial instrument at a specified price on a specific date (settlement date). For the year ended December 31, 2010, DWS Bond VIP and DWS Growth & Income VIP invested in futures contracts. DWS Growth & Income VIP entered into futures contracts in circumstances where portfolio management believed they offered an economic means of gaining exposure to a particular asset class or to keep cash on hand to meet shareholder redemptions or other needs while maintaining exposure to the market. DWS Bond VIP invested in interest rate futures to gain exposure to different parts of the yield curve while managing the overall duration. DWS Bond VIP also entered into currency futures contracts for non-hedging purposes to seek to enhance potential gains.
Futures contracts are valued at the most recent settlement price. Upon entering into a futures contract, the Fund is required to deposit with a financial intermediary cash or securities ("initial margin") in an amount equal to a certain percentage of the face value indicated in the futures contract. Subsequent payments ("variation margin") are made or received by the Fund dependent upon the daily fluctuations in the value and are recorded for financial reporting purposes as unrealized gains or losses by the Fund. Gains or losses are realized when the contract expires or is closed. Since all futures contracts are exchange traded, counterparty risk is minimized as the exchange's clearinghouse acts as the counterparty, and guarantees the futures against default.
Certain risks may arise upon entering into futures contracts, including the risk that an illiquid market will limit the Fund's ability to close out a futures contract prior to the settlement date and that a change in the value of a futures contract may not correlate exactly with the changes in the value of the underlying hedged security, index or currency. Risk of loss may exceed amounts recognized in the Statement of Assets and Liabilities.
A summary of the open futures contracts as of December 31, 2010, is included in a table following DWS Bond VIP and DWS Growth & Income VIP's Investment Portfolio. For the year ended December 31, 2010, DWS Bond VIP and DWS Growth & Income VIP's investment in futures contracts purchased had a total notional value generally indicative of a range from $0 to approximately $9,400,000, and $51,000 to $1,515,000, respectively, and the investment in futures contracts sold had a total notional value generally indicative of a range from approximately $26,111,000 to $43,275,000 for DWS Bond VIP.
Forward Foreign Currency Exchange Contracts. A forward foreign currency exchange contract ("forward currency contract") is a commitment to purchase or sell a foreign currency at the settlement date at a negotiated rate. Each Fund is subject to foreign exchange rate risk in its securities denominated in foreign currencies. Changes in exchange rates between foreign currencies and the US dollar may affect the US dollar value of foreign securities or the income or gains received on these securities. To reduce the effect of currency fluctuations, each Fund may enter into forward foreign currency exchange contracts. For the year ended December 31, 2010, DWS Bond VIP and DWS International VIP invested in forward foreign currency contracts to hedge its exposure to changes in foreign currency exchange rates on its foreign currency denominated securities.
Forward currency contracts are valued at the prevailing forward exchange rate of the underlying currencies and unrealized gain (loss) is recorded daily. On the settlement date of the forward currency contract, the Fund records a realized gain or loss equal to the difference between the value of the contract at the time it was opened and the value of the contract at the time it was closed. Certain risks may arise upon entering into forward currency contracts from the potential inability of counterparties to meet the terms of their contracts. The maximum counterparty credit risk to the Fund is measured by the unrealized gain on appreciated contracts. Additionally, when utilizing forward currency contracts to hedge, the Fund gives up the opportunity to profit from favorable exchange rate movements during the term of the contract.
A summary of the open forward currency contracts as of December 31, 2010, is included in a table following DWS Bond VIP's Investment Portfolio. For the year ended December 31, 2010, the investment in forward currency contracts US dollars purchased had a total contract value generally indicative of a range from approximately $113,000 to $1,361,000 and the investment in forward currency contracts US dollars sold had a total contract value generally indicative of a range from $0 to approximately $360,000.
There are no open forward currency contracts for DWS International VIP as of December 31, 2010. For the year ended December 31, 2010, the investment in forward currency contracts US dollars purchased had a total contract value generally indicative of a range from $0 to approximately $24,890,000.
The following tables summarize the value of DWS Bond VIP and DWS Growth & Income VIP's derivative instruments held as of December 31, 2010 and the related location in the accompanying Statement of Assets and Liabilities, presented by primary underlying risk exposure:
DWS Bond VIP
Asset Derivative | Forward Contracts |
Foreign Exchange Contracts (a) | $ 49,016 |
The above derivative is located in the following Statement of Assets and Liabilities account:
(a) Unrealized appreciation on open forward foreign currency exchange contracts
Liability Derivatives | Forward Contracts | Futures Contracts | Total |
Foreign Exchange Contracts (a) (b) | $ (990) | $ (23,390) | $ (24,380) |
Interest Rate Contracts (b) | $ — | 912,046 | 912,046 |
| $ (990) | $ 888,656 | $ 887,666 |
Each of the above derivatives is located in the following Statement of Assets and Liabilities accounts:
(a) Unrealized depreciation on open forward foreign currency exchange contracts
(b) Net unrealized appreciation (depreciation) on futures. Liability of Payable for daily variation margin on open futures contracts reflects unsettled variation margin.
Additionally, the amount of unrealized and realized gains and losses on derivative instruments recognized in Fund earnings during the year ended December 31, 2010 and the related location in the accompanying Statement of Operations is summarized in the following tables by primary underlying risk exposure:
Realized Gain (Loss) | Forward Contracts | Futures Contracts | Total |
Foreign Exchange Contracts (a) (b) | $ (10,064) | $ 285,798 | $ 275,734 |
Interest Rate Contracts (b) | — | (1,600,119) | (1,600,119) |
| $ (10,064) | $ (1,314,321) | $ (1,324,385) |
Each of the above derivatives is located in the following Statement of Operations accounts:
(a) Net realized gain (loss) from foreign currency (Statement of Operations includes both forward currency contracts and foreign currency transactions)
(b) Net realized gain (loss) from futures
Change in Net Unrealized Appreciation (Depreciation) | Forward Contracts | Futures Contracts | Total |
Foreign Exchange Contracts (a) (b) | $ 46,185 | $ (118,805) | $ (72,620) |
Interest Rate Contracts (b) | — | 450,865 | 450,865 |
| $ 46,185 | $ 332,060 | $ 378,245 |
Each of the above derivatives is located in the following Statement of Operations accounts:
(a) Change in net unrealized appreciation (depreciation) on foreign currency (Statement of Operations includes both forward currency contracts and foreign currency transactions)
(b) Change in net unrealized appreciation (depreciation) on futures
DWS Growth & Income VIP
Asset Derivative | Futures Contracts |
Equity Contracts (a) | $ 14,510 |
The above derivative is located in the following Statement of Assets and Liabilities account:
(a) Net unrealized appreciation (depreciation) on futures. Asset of Receivable for daily variation margin on open futures contracts reflects unsettled variation margin.
Additionally, the amount of unrealized and realized gains and losses on derivative instruments recognized in Fund earnings during the year ended December 31, 2010 and the related location in the accompanying Statement of Operations is summarized in the following tables by primary underlying risk exposure:
Realized Gain (Loss) | Futures Contracts |
Equity Contracts (a) | $ 91,175 |
The above derivative is located in the following Statement of Operations account:
(a) Net realized gain (loss) from futures
Change in Net Unrealized Appreciation (Depreciation) | Futures Contracts |
Equity Contracts (a) | $ 6,737 |
The above derivative is located in the following Statement of Operations account:
(a) Change in net unrealized appreciation (depreciation) on futures
DWS International VIP
The amount of realized gains and losses on derivative instruments recognized in Fund earnings during the year ended December 31, 2010 and the related location in the accompanying Statement of Operations is summarized in the following table by primary underlying risk exposure:
Realized Gain (Loss) | Forward Contracts |
Foreign Exchange Contracts (a) | $ (1,370,343) |
The above derivative is located in the following Statement of Operations account:
(a) Net realized gain (loss) from foreign currency (Statement of Operations includes both forward currency contracts and foreign currency transactions)
C. Purchases and Sales of Securities
During the year ended December 31, 2010, purchases and sales of investment securities (excluding short-term investments) were as follows:
Fund | Purchases ($) | Sales ($) |
DWS Bond VIP excluding US Treasury Obligations | 488,452,938 | 484,940,995 |
US Treasury Obligations | 85,194,891 | 82,519,882 |
DWS Growth & Income VIP | 139,171,485 | 153,000,110 |
DWS Capital Growth VIP | 285,882,039 | 369,248,095 |
DWS Global Opportunities VIP | 55,347,620 | 73,032,042 |
DWS International VIP | 655,754,792 | 694,152,287 |
DWS Health Care VIP | 7,933,990 | 16,178,401 |
D. Related Parties
Under the Investment Management Agreement with Deutsche Investment Management Americas Inc. ("DIMA" or the "Advisor"), an indirect, wholly owned subsidiary of Deutsche Bank AG, the Advisor directs the investments of the Funds in accordance with their investment objectives, policies and restrictions. The Advisor determines the securities, instruments and other contracts relating to investments to be purchased, sold or entered into by the Funds or, for DWS Growth & Income VIP, delegates such responsibility to the Fund's subadvisor.
Under the Investment Management Agreement with the Advisor, the Funds pay a monthly management fee, based on the average daily net assets of each Fund, computed and accrued daily and payable monthly, at the annual rates shown below:
Fund | Annual Management Fee Rate |
DWS Bond VIP first $250 million of average daily net assets | .390% |
next $750 million of average daily net assets | .365% |
over $1 billion of average daily net assets | .340% |
DWS Growth & Income VIP first $250 million of average daily net assets | .390% |
next $750 million of average daily net assets | .365% |
over $1 billion of average daily net assets | .340% |
DWS Capital Growth VIP first $250 million of average daily net assets | .390% |
next $750 million of average daily net assets | .365% |
over $1 billion of average daily net assets | .340% |
DWS Global Opportunities VIP first $500 million of average daily net assets | .890% |
next $500 million of average daily net assets | .875% |
next $1 billion of average daily net assets | .860% |
over $2 billion of average daily net assets | .845% |
DWS International VIP first $500 million of average daily net assets | .790% |
over $500 million of average daily net assets | .640% |
DWS Health Care VIP first $250 million of average daily net assets | .665% |
next $750 million of average daily net assets | .640% |
next $1.5 billion of average daily net assets | .615% |
next $2.5 billion of average daily net assets | .595% |
next $2.5 billion of average daily net assets | .565% |
next $2.5 billion of average daily net assets | .555% |
next $2.5 billion of average daily net assets | .545% |
over $12.5 billion of average daily net assets | .535% |
QS Investors, LLC ("QS Investors") acts as investment sub-advisor to DWS Growth & Income VIP. On August 1, 2010, members of the Advisor's Quantitative Strategies Group, including members of the DWS Growth & Income VIP portfolio management team, separated from the Advisor and formed QS Investors as a separate investment advisory firm unaffiliated with the Advisor. As an investment sub-advisor to DWS Growth & Income VIP, QS Investors makes investment decisions and buys and sells securities for the Fund. QS Investors is paid by the Advisor, not the Fund, for the services QS Investors provides to the Fund.
For the period from January 1, 2010 through September 30, 2010, the Advisor, the underwriter and accounting agent contractually agreed to waive a portion of their fee to the extent necessary to maintain the operating expenses of each class (excluding certain expenses such as extraordinary expenses, taxes, brokerage and interest) as follows:
Fund | Annual Rate |
DWS Global Opportunities VIP Class A | 1.06% |
DWS Global Opportunities VIP Class B | 1.46% |
In addition, for the period from October 1, 2010 through September 30, 2011, the Advisor, the underwriter and accounting agent contractually agreed to waive a portion of their fee to the extent necessary to maintain the operating expenses of each class (excluding certain expenses such as extraordinary expenses, taxes, brokerage and interest) as follows:
Fund | Annual Rate |
DWS Global Opportunities VIP Class A | 1.00% |
DWS Global Opportunities VIP Class B | 1.40% |
In addition, for the period from January 1, 2010 through April 30, 2010, the Advisor, the underwriter and accounting agent contractually agreed to waive a portion of their fee to the extent necessary to maintain the operating expenses of each class (excluding certain expenses such as extraordinary expenses, taxes, brokerage and interest) as follows:
Fund | Annual Rate |
DWS Growth & Income VIP Class A | .54% |
DWS Growth & Income VIP Class B | .87% |
DWS Capital Growth VIP Class A | .49% |
DWS Capital Growth VIP Class B | .82% |
DWS International VIP Class A | .96% |
DWS International VIP Class B | 1.29% |
In addition, for the period from January 1, 2010 through April 27, 2010, the Advisor had contractually agreed to waive 0.01% of the management fee for Growth & Income VIP.
Accordingly, for the year ended December 31, 2010, the total management fee, management fee waived and effective management fee rate are as follows:
Fund | Total Aggregated ($) | Waived ($) | Annual Effective Rate |
DWS Bond VIP | 623,165 | — | .39% |
DWS Growth & Income VIP | 381,068 | 28,777 | .36% |
DWS Capital Growth VIP | 2,618,221 | 52,169 | .37% |
DWS Global Opportunities VIP | 1,278,032 | 104,345 | .82% |
DWS International VIP | 2,410,956 | 12,024 | .79% |
DWS Health Care VIP | 328,345 | — | .665% |
In addition, for the year ended December 31, 2010, the Advisor waived record keeping expenses of Class B shares of the Fund as follows:
Fund | Waived ($) |
DWS Capital Growth VIP | 232 |
Administration Fee. Pursuant to an Administrative Services Agreement, DIMA provides most administrative services to the Series. For all services provided under the Administrative Services Agreement, each Fund pays the Advisor an annual fee ("Administration Fee") of 0.10% of each Fund's average daily net assets, computed and accrued daily and payable monthly. For the year ended December 31, 2010, the Administration Fee was as follows:
Fund | Total Aggregated ($) | Unpaid at December 31, 2010 ($) |
DWS Bond VIP | 159,786 | 13,159 |
DWS Growth & Income VIP | 97,710 | 8,441 |
DWS Capital Growth VIP | 700,197 | 62,425 |
DWS Global Opportunities VIP | 143,599 | 13,299 |
DWS International VIP | 305,184 | 24,377 |
DWS Health Care VIP | 49,375 | 4,088 |
Service Provider Fees. DWS Investments Service Company ("DISC"), an affiliate of the Advisor, is the transfer agent, dividend-paying agent and shareholder service agent for the Series. Pursuant to a sub-transfer agency agreement between DISC and DST Systems, Inc. ("DST"), DISC has delegated certain transfer agent, dividend-paying agent and shareholder service agent functions to DST. DISC compensates DST out of the shareholder servicing fee it receives from each Fund. For the year ended December 31, 2010, the amounts charged to the Funds by DISC were as follows:
Fund | Total Aggregated ($) | Waived ($) | Unpaid at December 31, 2010 ($) |
DWS Bond VIP Class A | 730 | — | 186 |
DWS Growth & Income VIP Class A | 572 | 572 | — |
DWS Growth & Income VIP Class B | 96 | — | 24 |
DWS Capital Growth VIP Class A | 814 | 814 | — |
DWS Capital Growth VIP Class B | 106 | 106 | — |
DWS Global Opportunities VIP Class A | 517 | 517 | — |
DWS Global Opportunities VIP Class B | 130 | — | 30 |
DWS International VIP Class A | 854 | 854 | — |
DWS International VIP Class B | 96 | — | 24 |
DWS Health Care VIP Class A | 243 | — | 57 |
DWS Health Care VIP Class B | 67 | — | 18 |
DWS Investments Distributors, Inc. ("DIDI"), also an affiliate of the Advisor, is the Series' Distributor. In accordance with the Master Distribution Plan, DIDI receives 12b-1 fees of 0.25% of average daily net assets of Class B shares. Pursuant to the Master Distribution Plan, DIDI remits these fees to the Participating Insurance Companies for various costs incurred or paid by these companies in connection with marketing and distribution of Class B shares. These fees are detailed in each Fund's Statement of Operations.
Typesetting and Filing Service Fees. Under an agreement with DIMA, DIMA is compensated for providing typesetting and certain regulatory filing services to the Funds. For the year ended December 31, 2010, the amount charged to the Funds by DIMA included in the Statement of Operations under "reports to shareholders" was as follows:
Fund | Total Aggregated ($) | Unpaid at December 31, 2010 ($) |
DWS Bond VIP | 13,045 | 3,334 |
DWS Growth & Income VIP | 13,057 | 2,726 |
DWS Capital Growth VIP | 11,562 | 2,182 |
DWS Global Opportunities VIP | 12,386 | 2,153 |
DWS International VIP | 13,860 | 3,470 |
DWS Health Care VIP | 12,122 | 3,201 |
Trustees' Fees and Expenses. Each Fund paid each Trustee not affiliated with the Advisor retainer fees plus specified amounts for various committee services and for the Board Chairperson.
Affiliated Cash Management Vehicles. Each Fund may invest uninvested cash balances in Central Cash Management Fund, which is managed by the Advisor. Each Fund indirectly bears its proportionate share of the expenses of the underlying money market funds. Central Cash Management Fund does not pay the Advisor an investment management fee. Central Cash Management Fund seeks a high level of current income consistent with liquidity and the preservation of capital.
E. Investing in Emerging Markets
The DWS Bond VIP, DWS Global Opportunities VIP and DWS International VIP may invest in emerging markets. Investing in emerging markets may involve special risks and considerations not typically associated with investing in developed markets. These risks include revaluation of currencies, high rates of inflation or deflation, repatriation restrictions on income and capital, and future adverse political, social and economic developments. Moreover, securities issued in these markets may be less liquid, subject to government ownership controls or delayed settlements and may have prices more volatile or less easily assessed than those of comparable securities of issuers in developed markets.
F. Ownership of the Funds
At the end of the year, the beneficial ownership in the Funds was as follows:
DWS Bond VIP: One participating insurance company was an owner of record of 10% or more of the total outstanding Class A shares of the Fund, owning 61%.
DWS Growth & Income VIP: Three participating insurance companies were owners of record of 10% or more of the total outstanding Class A shares of the Fund, each owning 35%, 26% and 15%. Two participating insurance companies were owners of record of 10% or more of the total outstanding Class B shares of the Fund, owning 86% and 11%.
DWS Capital Growth VIP: Three participating insurance companies were owners of record of 10% or more of the total outstanding Class A shares of the Fund, each owning 43%, 22% and 12%. Two participating insurance companies were owners of record of 10% or more of the total outstanding Class B shares of the Fund, each owning 82% and 17%.
DWS Global Opportunities VIP: Three participating insurance companies were owners of record of 10% or more of the total outstanding Class A shares of the Fund, each owning 47%,19% and 11%. One participating insurance company was an owner of record of 10% or more of the total outstanding Class B shares of the Fund, owning 92%.
DWS International VIP: Two participating insurance companies were owners of record of 10% or more of the total outstanding Class A shares of the Fund, each owning 41% and 13%. Three participating insurance companies were owners of record of 10% or more of the total outstanding Class B shares of the Fund, each owning 76%, 13% and 11%.
DWS Health Care VIP: Two participating insurance companies were owners of record of 10% or more of the total outstanding Class A shares of the Fund, each owning 68% and 23%. One participating insurance company was an owner of record of 10% or more of the total outstanding Class B shares of the Fund, owning 98%.
G. Line of Credit
The Series and other affiliated funds (the "Participants") share in a $450 million revolving credit facility provided by a syndication of banks. Each Fund may borrow for temporary or emergency purposes, including the meeting of redemption requests that otherwise might require the untimely disposition of securities. The Participants are charged an annual commitment fee which is allocated based on net assets, among each of the Participants. Interest is calculated at a rate per annum equal to the sum of the Federal Funds Rate plus 1.25 percent plus if LIBOR exceeds the Federal Funds Rate the amount of such excess. Each Fund may borrow up to a maximum of 33 percent of its net assets under the agreement.
At December, 31, 2010, DWS International VIP had a $650,000 outstanding loan. Interest expense incurred on the borrowing was $928 for the year ended December, 31, 2010. The average dollar amount of the borrowings was $693,750, the weighted average interest rate on these borrowings was 1.51% and the Fund had a loan outstanding for thirty two days throughout the period. The borrowings were valued at cost, which approximates fair value.
H. Payments Made by Affiliates
During the year ended December 31, 2010, the Advisor fully reimbursed DWS Bond VIP and DWS Global Opportunities VIP $7,050 and $36, respectively, for losses incurred on trades executed incorrectly. The amount reimbursed was less than 0.01% of each Fund's average net assets.
I. Acquisition of Assets
On April 24, 2009, DWS Capital Growth VIP acquired all of the net assets of DWS Janus Growth & Income VIP pursuant to a plan of reorganization approved by shareholders on April 20, 2009. The purpose of the transaction was to combine two funds managed by DWS with comparable investment objectives and strategies. The acquisition was accomplished by a tax-free exchange of 9,556,588 Class A shares of DWS Janus Growth & Income VIP for 5,009,687 Class A shares of DWS Capital Growth VIP outstanding on April 24, 2009. DWS Janus Growth & Income VIP's net assets at that date, $66,828,943, including $510,610 of net unrealized appreciation, were combined with those of DWS Capital Growth VIP. The aggregate net assets of DWS Capital Growth VIP immediately before the acquisition were $572,408,860. The combined net assets of DWS Capital Growth VIP immediately following the acquisition were $639,237,803.
J. Subsequent Events
On January 12, 2011, the Board of the following Acquired Funds approved, in principle, the merger of the Acquired Funds into the Acquiring Fund. Completion of the merger is subject to a number of conditions, including final approval by Acquired Funds Board and approval by the shareholders of the Acquired Funds at a shareholder meeting expected to be held during the month of April 2011. If shareholder approval is obtained, the mergers are expected to occur on or about May 1, 2011.
Acquired Funds | Acquiring Fund |
DWS Variable Series I — DWS Health Care VIP | DWS Variable Series I — DWS Capital Growth VIP |
DWS Variable Series II — DWS Technology VIP | DWS Variable Series I — DWS Capital Growth VIP |
On January 12, 2011, the Board of Trustees approved changes to the name and investment strategy of DWS Global Opportunities VIP. Effective on or about May 1, 2011, the name of the Fund will change from "DWS Global Opportunities VIP" to "DWS Global Small Cap Growth VIP." For a description of the new investment strategy, please see the supplement dated February 1, 2011 to the Fund's current prospectus posted on www.dws-investments.com.
Report of Independent Registered Public Accounting Firm
To the Trustees and Shareholders of DWS Variable Series I:
In our opinion, the accompanying statements of assets and liabilities, including the investment portfolios, and the related statements of operations and of changes in net assets and the financial highlights present fairly, in all material respects, the financial position of the six Funds (identified in Note A) of DWS Variable Series I (the "Series") at December 31, 2010 and the results of each of their operations, the changes in each of their net assets, and the financial highlights for each of the periods indicated therein, in conformity with accounting principles generally accepted in the United States of America. These financial statements and financial highlights (hereafter referred to as "financial statements") are the responsibility of the Series' management. Our responsibility is to express an opinion on these financial statements based on our audits. We conducted our audits of these financial statements in accordance with the standards of the Public Company Accounting Oversight Board (United States). Those standards require that we plan and perform the audit to obtain reasonable assurance about whether the financial statements are free of material misstatement. An audit includes examining, on a test basis, evidence supporting the amounts and disclosures in the financial statements, assessing the accounting principles used and significant estimates made by management, and evaluating the overall financial statement presentation. We believe that our audits, which included confirmation of securities at December 31, 2010 by correspondence with the custodians and brokers, provide a reasonable basis for our opinion.
Boston, Massachusetts
February 11, 2011 | PricewaterhouseCoopers LLP |
Tax Information (Unaudited)
DWS Health Care VIP paid distributions of $0.74 per share from net long-term capital gains during the year ended December 31, 2010, of which 100% represents 15% rate gains.
Pursuant to Section 852 of the Internal Revenue Code, DWS Health Care VIP designates approximately $1,333,000 as capital gain dividends for its year ended December 31, 2010, of which 100% represents 15% rate gains.
For corporate shareholders of DWS Growth & Income VIP, DWS Capital Growth VIP, DWS Global Opportunities VIP, DWS Health Care VIP and DWS International VIP, 100%, 100%, 34%, 100% and 3%, respectively, of the ordinary dividends (i.e., income dividends plus short-term capital gains) paid during the Funds' fiscal year ended December 31, 2010 qualified for the dividends received deduction.
DWS International VIP and DWS Global Opportunities VIP paid foreign taxes of $646,822 and $91,853, and earned $4,560,951 and $1,063,242, respectively, of foreign source income during the year ended December 31, 2010. Pursuant to Section 853 of the Internal Revenue Code, DWS International VIP and DWS Global Opportunities VIP designate $0.02 and $0.01, respectively, per share as foreign taxes paid and $0.13 and $0.10, respectively, per share as income earned from foreign sources for the year ended December 31, 2010.
Please consult a tax advisor if you have questions about federal or state income tax laws, or on how to prepare your tax returns. If you have specific questions about your account, please contact your insurance provider.
Proxy Voting
The Series' policies and procedures for voting proxies for portfolio securities and information about how the Series voted proxies related to its portfolio securities during the 12-month period ended June 30 are available on our Web site — www.dws-investments.com (click on "proxy voting"at the bottom of the page) — or on the SEC's Web site — www.sec.gov. To obtain a written copy of the Series' policies and procedures without charge, upon request, call us toll free at (800) 728-3337.
Investment Management Agreement Approval
DWS Bond VIP
The Board of Trustees, including the Independent Trustees, approved the renewal of your Fund's investment management agreement (the "Agreement") with Deutsche Investment Management Americas Inc. ("DWS") in September 2010.
In terms of the process that the Board followed prior to approving the Agreement, shareholders should know that:
• In September 2010, all of the Fund's Trustees were independent of DWS and its affiliates.
• The Trustees meet frequently to discuss fund matters. Each year, the Trustees dedicate substantial time to contract review matters. Over the course of several months, the Board's Contract Committee, in coordination with the Board's Fixed Income and Quant Oversight Committee, reviewed comprehensive materials received from DWS, independent third parties and independent counsel. These materials included an analysis of the Fund's performance, fees and expenses, and profitability compiled by the Fund's independent fee consultant. The Board also received extensive information throughout the year regarding performance of the Fund.
• The Independent Trustees regularly meet privately with their independent counsel to discuss contract review and other matters. In addition, the Independent Trustees were also advised by the Fund's independent fee consultant in the course of their review of the Fund's contractual arrangements and considered a comprehensive report prepared by the independent fee consultant in connection with their deliberations (the "IFC Report").
• In connection with reviewing the Agreement, the Board also reviewed the terms of the Fund's distribution agreement, administrative services agreement, transfer agency agreement and other material service agreements.
• Based on its evaluation of the information provided, the Contract Committee presented its findings and recommendations to the Independent Trustees as a group. The Independent Trustees reviewed the Contract Committee's findings and recommendations and presented their recommendations to the full Board.
In connection with the contract review process, the Contract Committee and the Board considered the factors discussed below, among others. The Board also considered that DWS and its predecessors have managed the Fund since its inception, and the Board believes that a long-term relationship with a capable, conscientious advisor is in the best interests of the Fund. The Board considered, generally, that shareholders chose to invest or remain invested in the Fund knowing that DWS managed the Fund, and that the Agreement was approved by the Fund's shareholders. DWS is part of Deutsche Bank, a major global banking institution that is engaged in a wide range of financial services. The Board believes that there are significant advantages to being part of a global asset management business that offers a wide range of investing expertise and resources, including hundreds of portfolio managers and analysts with research capabilities in many countries throughout the world.
While shareholders may focus primarily on fund performance and fees, the Fund's Board considers these and many other factors, including the quality and integrity of DWS's personnel and such other issues as back-office operations, fund valuations, and compliance policies and procedures.
Nature, Quality and Extent of Services. The Board considered the terms of the Agreement, including the scope of advisory services provided under the Agreement. The Board noted that, under the Agreement, DWS provides portfolio management services to the Fund and that, pursuant to a separate administrative services agreement, DWS provides administrative services to the Fund. The Board considered the experience and skills of senior management and investment personnel, the resources made available to such personnel, the ability of DWS to attract and retain high-quality personnel, and the organizational depth and stability of DWS. The Board reviewed the Fund's performance over short-term and long-term periods and compared those returns to various agreed-upon performance measures, including market indices and a peer universe compiled by the independent fee consultant using information supplied by Lipper Inc. ("Lipper"). The Board also noted that it has put into place a process of identifying "Focus Funds" (e.g., funds performing poorly relative to their benchmark or a peer universe compiled by Lipper), and receives more frequent reporting and information from DWS regarding such funds, along with DWS's remedial plans to address underperformance. The Board believes this process is an effective manner of identifying and addressing underperforming funds. Based on the information provided, the Board noted that for the one-, three- and five-year periods ended December 31, 2009, the Fund's performance (Class A shares) was in the 3rd quartile, 4th quartile and 4th quartile, respectively, of the applicable Lipper universe (the 1st quartile being the best performers and the 4th quartile being the worst performers). The Board also observed that the Fund has outperformed its benchmark in the one-year period and has underperformed its benchmark in the three- and five-year periods ended December 31, 2009.
On the basis of this evaluation and the ongoing review of investment results by the Board, the Board concluded that the nature, quality and extent of services provided by DWS historically have been and continue to be satisfactory.
Fees and Expenses. The Board considered the Fund's investment management fee schedule, operating expenses and total expense ratios, and comparative information provided by Lipper and the independent fee consultant regarding investment management fee rates paid to other investment advisors by similar funds (1st quartile being the most favorable and 4th quartile being the least favorable). With respect to management fees paid to other investment advisors by similar funds, the Board noted that the contractual fee rates paid by the Fund, which include a 0.10% fee paid to DWS under the Fund's administrative services agreement, were lower than the median (2nd quartile) of the applicable Lipper peer group (based on Lipper data provided as of December 31, 2009). The Board noted that the Fund's Class A shares total (net) operating expenses were expected to be higher than the median (3rd quartile) of the applicable Lipper expense universe (based on Lipper data provided as of December 31, 2009) ("Lipper Universe Expenses").
The information considered by the Board as part of its review of management fees included information regarding fees charged by DWS and its affiliates to similar institutional accounts and to similar funds offered primarily to European investors ("DWS Europe funds"), in each case as applicable. The Board observed that advisory fee rates for institutional accounts generally were lower than the management fees charged by similarly managed DWS US mutual funds ("DWS Funds"), but also took note of the differences in services provided to DWS Funds as compared to institutional accounts. In the case of DWS Europe funds, the Board observed that fee rates for DWS Europe funds generally were higher than for similarly managed DWS Funds, but noted that differences in the types of services provided to DWS Funds relative to DWS Europe funds made it difficult to compare such fees.
On the basis of the information provided, the Board concluded that management fees were reasonable and appropriate in light of the nature, quality and extent of services provided by DWS.
Profitability. The Board reviewed detailed information regarding revenues received by DWS under the Agreement. The Board considered the estimated costs and pre-tax profits realized by DWS from advising the DWS Funds, as well as estimates of the pre-tax profits attributable to managing the Fund in particular. The Board also received information regarding the estimated enterprise-wide profitability of DWS and its affiliates with respect to all fund services in totality and by fund. The Board reviewed DWS's methodology in allocating its costs to the management of the Fund. Based on the information provided, the Board concluded that the pre-tax profits realized by DWS in connection with the management of the Fund were not unreasonable. The Board also reviewed information regarding the profitability of certain similar investment management firms. The Board noted that while information regarding the profitability of such firms is limited (and in some cases is not necessarily prepared on a comparable basis), DWS and its affiliates' overall profitability with respect to the DWS fund complex (after taking into account distribution and other services provided to the funds by DWS and its affiliates) was lower than the overall profitability levels of many comparable firms for which such data was available.
Economies of Scale. The Board considered whether there are economies of scale with respect to the management of the Fund and whether the Fund benefits from any economies of scale. The Board noted that the Fund's management fee schedule includes fee breakpoints. The Board concluded that the Fund's fee schedule represents an appropriate sharing between the Fund and DWS of such economies of scale as may exist in the management of the Fund at current asset levels.
Other Benefits to DWS and Its Affiliates. The Board also considered the character and amount of other incidental benefits received by DWS and its affiliates, including any fees received by DWS for administrative services provided to the Fund and any fees received by an affiliate of DWS for distribution services. The Board also considered benefits to DWS related to brokerage and soft-dollar allocations, including allocating brokerage to pay for research generated by parties other than the executing broker dealers, which pertain primarily to funds investing in equity securities, along with the incidental public relations benefits to DWS related to DWS Funds advertising and cross-selling opportunities among DWS products and services. The Board concluded that management fees were reasonable in light of these fallout benefits.
Compliance. The Board considered the significant attention and resources dedicated by DWS to documenting and enhancing its compliance processes in recent years. The Board noted in particular (i) the experience and seniority of both DWS's chief compliance officer and the Fund's chief compliance officer; (ii) the large number of DWS compliance personnel; and (iii) the substantial commitment of resources by DWS and its affiliates to compliance matters.
Based on all of the information considered and the conclusions reached, the Board unanimously determined that the continuation of the Agreement is in the best interests of the Fund. In making this determination, the Board did not give particular weight to any single factor identified above. The Board considered these factors over the course of numerous meetings, certain of which were in executive session with only the Independent Trustees and their counsel present. It is possible that individual Trustees may have weighed these factors differently in reaching their individual decisions to approve the continuation of the Agreement.
DWS Growth & Income VIP
The Board of Trustees, including the Independent Trustees, approved the renewal of your Fund's investment management agreement (the "Agreement") with Deutsche Investment Management Americas Inc. ("DWS") and sub-advisory agreement (the "Sub-Advisory Agreement" and together with the Agreement, the "Agreements") between DWS and QS Investors, LLC ("QS Investors") in September 2010.
In terms of the process that the Board followed prior to approving the Agreements, shareholders should know that:
• In September 2010, all of the Fund's Trustees were independent of DWS and its affiliates.
• The Trustees meet frequently to discuss fund matters. Each year, the Trustees dedicate substantial time to contract review matters. Over the course of several months, the Board's Contract Committee, in coordination with the Board's Fixed Income and Quant Oversight Committee, reviewed comprehensive materials received from DWS, independent third parties and independent counsel. These materials included an analysis of the Fund's performance, fees and expenses, and profitability compiled by the Fund's independent fee consultant. The Board also received extensive information throughout the year regarding performance of the Fund.
• The Independent Trustees regularly meet privately with their independent counsel to discuss contract review and other matters. In addition, the Independent Trustees were also advised by the Fund's independent fee consultant in the course of their review of the Fund's contractual arrangements and considered a comprehensive report prepared by the independent fee consultant in connection with their deliberations (the "IFC Report").
• In connection with reviewing the Agreements, the Board also reviewed the terms of the Fund's Rule 12b-1 plan, distribution agreement, administrative services agreement, transfer agency agreement and other material service agreements.
• Based on its evaluation of the information provided, the Contract Committee presented its findings and recommendations to the Independent Trustees as a group. The Independent Trustees reviewed the Contract Committee's findings and recommendations and presented their recommendations to the full Board.
In connection with the contract review process, the Contract Committee and the Board considered the factors discussed below, among others. The Board also considered that DWS and its predecessors have managed the Fund since its inception, and the Board believes that a long-term relationship with a capable, conscientious advisor is in the best interests of the Fund. The Board considered, generally, that shareholders chose to invest or remain invested in the Fund knowing that DWS managed the Fund, and that the Agreement was approved by the Fund's shareholders. DWS is part of Deutsche Bank, a major global banking institution that is engaged in a wide range of financial services. The Board believes that there are significant advantages to being part of a global asset management business that offers a wide range of investing expertise and resources, including hundreds of portfolio managers and analysts with research capabilities in many countries throughout the world.
While shareholders may focus primarily on fund performance and fees, the Fund's Board considers these and many other factors, including the quality and integrity of DWS's and QS Investors' personnel and such other issues as back-office operations, fund valuations, and compliance policies and procedures. In addition, in connection with approving the continuation of the Fund's Sub-Advisory Agreement, the Board noted it had engaged in a comprehensive review of the agreement in connection with its initial approval in May 2010.
Nature, Quality and Extent of Services. The Board considered the terms of the Agreements, including the scope of advisory services provided under the Agreements. The Board noted that, under the Agreements, DWS and QS Investors provide portfolio management services to the Fund and that, pursuant to a separate administrative services agreement, DWS provides administrative services to the Fund. The Board considered the experience and skills of senior management and investment personnel, the resources made available to such personnel, the ability of DWS and QS Investors to attract and retain high-quality personnel, and the organizational depth and stability of DWS and QS Investors. The Board reviewed the Fund's performance over short-term and long-term periods and compared those returns to various agreed-upon performance measures, including market indices and a peer universe compiled by the independent fee consultant using information supplied by Lipper Inc. ("Lipper"). The Board also noted that it has put into place a process of identifying "Focus Funds" (e.g., funds performing poorly relative to their benchmark or a peer universe compiled by Lipper), and receives more frequent reporting and information from DWS regarding such funds, along with DWS's remedial plans to address underperformance. The Board believes this process is an effective manner of identifying and addressing underperforming funds. Based on the information provided, the Board noted that for the one-, three- and five-year periods ended December 31, 2009, the Fund's performance (Class A shares) was in the 1st quartile, 3rd quartile and 3rd quartile, respectively, of the applicable Lipper universe (the 1st quartile being the best performers and the 4th quartile being the worst performers). The Board also observed that the Fund has outperformed its benchmark in the one-year period and has underperformed its benchmark in the three- and five-year periods ended December 31, 2009.
On the basis of this evaluation and the ongoing review of investment results by the Board, the Board concluded that the nature, quality and extent of services provided by DWS and QS Investors historically have been and continue to be satisfactory.
Fees and Expenses. The Board considered the Fund's investment management fee schedule, sub-advisory fee schedule, operating expenses and total expense ratios, and comparative information provided by Lipper and the independent fee consultant regarding investment management fee rates paid to other investment advisors by similar funds (1st quartile being the most favorable and 4th quartile being the least favorable). With respect to management fees paid to other investment advisors by similar funds, the Board noted that the contractual fee rates paid by the Fund, which include a 0.10% fee paid to DWS under the Fund's administrative services agreement, were lower than the median (1st quartile) of the applicable Lipper peer group (based on Lipper data provided as of December 31, 2009). With respect to the sub-advisory fee paid to QS Investors, the Board noted that the fee is paid by DWS out of its fee and not directly by the Fund. The Board noted that the Fund's Class A shares total (net) operating expenses were expected to be lower than the median (1st quartile) of the applicable Lipper expense universe (based on Lipper data provided as of December 31, 2009) ("Lipper Universe Expenses"). The Board also reviewed data comparing each share class's total (net) operating expenses to the applicable Lipper Universe Expenses. The Board considered the Fund's management fee rate as compared to fees charged by DWS and certain of its affiliates for comparable mutual funds and considered differences in fund and fee structures between the DWS Funds. The Board also considered how the Fund's total (net) operating expenses compared to the total (net) operating expenses of a more customized peer group selected by Lipper (based on such factors as asset size).
The information considered by the Board as part of its review of management fees included information regarding fees charged by DWS and its affiliates to similar institutional accounts and to similar funds offered primarily to European investors ("DWS Europe funds"), in each case as applicable. The Board observed that advisory fee rates for institutional accounts generally were lower than the management fees charged by similarly managed DWS US mutual funds ("DWS Funds"), but also took note of the differences in services provided to DWS Funds as compared to institutional accounts. In the case of DWS Europe funds, the Board observed that fee rates for DWS Europe funds generally were higher than for similarly managed DWS Funds, but noted that differences in the types of services provided to DWS Funds relative to DWS Europe funds made it difficult to compare such fees.
On the basis of the information provided, the Board concluded that management fees were reasonable and appropriate in light of the nature, quality and extent of services provided by DWS and QS Investors.
Profitability. The Board reviewed detailed information regarding revenues received by DWS under the Agreement. The Board considered the estimated costs and pre-tax profits realized by DWS from advising the DWS Funds, as well as estimates of the pre-tax profits attributable to managing the Fund in particular. The Board also received information regarding the estimated enterprise-wide profitability of DWS and its affiliates with respect to all fund services in totality and by fund. The Board reviewed DWS's methodology in allocating its costs to the management of the Fund. Based on the information provided, the Board concluded that the pre-tax profits realized by DWS in connection with the management of the Fund were not unreasonable. The Board also reviewed information regarding the profitability of certain similar investment management firms. The Board noted that while information regarding the profitability of such firms is limited (and in some cases is not necessarily prepared on a comparable basis), DWS and its affiliates' overall profitability with respect to the DWS fund complex (after taking into account distribution and other services provided to the funds by DWS and its affiliates) was lower than the overall profitability levels of many comparable firms for which such data was available. The Board did not consider the profitability of QS Investors with respect to the Fund. The Board noted that DWS pays QS Investors' fee out of its management fee, and its understanding that the Fund's sub-advisory fee schedule was the product of an arm's length negotiation with DWS.
Economies of Scale. The Board considered whether there are economies of scale with respect to the management of the Fund and whether the Fund benefits from any economies of scale. The Board noted that the Fund's management fee schedule includes fee breakpoints. The Board concluded that the Fund's fee schedule represents an appropriate sharing between the Fund and DWS of such economies of scale as may exist in the management of the Fund at current asset levels.
Other Benefits to DWS and QS Investors and Their Affiliates. The Board also considered the character and amount of other incidental benefits received by DWS and QS Investors and their affiliates, including any fees received by DWS for administrative services provided to the Fund and any fees received by an affiliate of DWS for distribution services. The Board also considered benefits to DWS and QS Investors related to brokerage and soft-dollar allocations, including allocating brokerage to pay for research generated by parties other than the executing broker dealers, which pertain primarily to funds investing in equity securities, along with the incidental public relations benefits to DWS and QS Investors related to DWS Funds advertising and cross-selling opportunities among DWS products and services. The Board concluded that management fees were reasonable in light of these fallout benefits.
Compliance. The Board considered the significant attention and resources dedicated by DWS to documenting and enhancing its compliance processes in recent years. The Board noted in particular (i) the experience and seniority of both DWS's chief compliance officer and the Fund's chief compliance officer; (ii) the large number of DWS compliance personnel; and (iii) the substantial commitment of resources by DWS and its affiliates to compliance matters. The Board also considered the attention and resources dedicated by DWS to the oversight of the investment sub-advisor's compliance program and compliance with the applicable fund policies and procedures.
Based on all of the information considered and the conclusions reached, the Board unanimously determined that the continuation of the Agreements is in the best interests of the Fund. In making this determination, the Board did not give particular weight to any single factor identified above. The Board considered these factors over the course of numerous meetings, certain of which were in executive session with only the Independent Trustees and their counsel present. It is possible that individual Trustees may have weighed these factors differently in reaching their individual decisions to approve the continuation of the Agreements.
DWS Capital Growth VIP
The Board of Trustees, including the Independent Trustees, approved the renewal of your Fund's investment management agreement (the "Agreement") with Deutsche Investment Management Americas Inc. ("DWS") in September 2010.
In terms of the process that the Board followed prior to approving the Agreement, shareholders should know that:
• In September 2010, all of the Fund's Trustees were independent of DWS and its affiliates.
• The Trustees meet frequently to discuss fund matters. Each year, the Trustees dedicate substantial time to contract review matters. Over the course of several months, the Board's Contract Committee, in coordination with the Board's Equity Oversight Committee, reviewed comprehensive materials received from DWS, independent third parties and independent counsel. These materials included an analysis of the Fund's performance, fees and expenses, and profitability compiled by the Fund's independent fee consultant. The Board also received extensive information throughout the year regarding performance of the Fund.
• The Independent Trustees regularly meet privately with their independent counsel to discuss contract review and other matters. In addition, the Independent Trustees were also advised by the Fund's independent fee consultant in the course of their review of the Fund's contractual arrangements and considered a comprehensive report prepared by the independent fee consultant in connection with their deliberations (the "IFC Report").
• In connection with reviewing the Agreement, the Board also reviewed the terms of the Fund's Rule 12b-1 plan, distribution agreement, administrative services agreement, transfer agency agreement and other material service agreements.
• Based on its evaluation of the information provided, the Contract Committee presented its findings and recommendations to the Independent Trustees as a group. The Independent Trustees reviewed the Contract Committee's findings and recommendations and presented their recommendations to the full Board.
In connection with the contract review process, the Contract Committee and the Board considered the factors discussed below, among others. The Board also considered that DWS and its predecessors have managed the Fund since its inception, and the Board believes that a long-term relationship with a capable, conscientious advisor is in the best interests of the Fund. The Board considered, generally, that shareholders chose to invest or remain invested in the Fund knowing that DWS managed the Fund, and that the Agreement was approved by the Fund's shareholders. DWS is part of Deutsche Bank, a major global banking institution that is engaged in a wide range of financial services. The Board believes that there are significant advantages to being part of a global asset management business that offers a wide range of investing expertise and resources, including hundreds of portfolio managers and analysts with research capabilities in many countries throughout the world.
While shareholders may focus primarily on fund performance and fees, the Fund's Board considers these and many other factors, including the quality and integrity of DWS's personnel and such other issues as back-office operations, fund valuations, and compliance policies and procedures.
Nature, Quality and Extent of Services. The Board considered the terms of the Agreement, including the scope of advisory services provided under the Agreement. The Board noted that, under the Agreement, DWS provides portfolio management services to the Fund and that, pursuant to a separate administrative services agreement, DWS provides administrative services to the Fund. The Board considered the experience and skills of senior management and investment personnel, the resources made available to such personnel, the ability of DWS to attract and retain high-quality personnel, and the organizational depth and stability of DWS. The Board reviewed the Fund's performance over short-term and long-term periods and compared those returns to various agreed-upon performance measures, including market indices and a peer universe compiled by the independent fee consultant using information supplied by Lipper Inc. ("Lipper"). The Board also noted that it has put into place a process of identifying "Focus Funds" (e.g., funds performing poorly relative to their benchmark or a peer universe compiled by Lipper), and receives more frequent reporting and information from DWS regarding such funds, along with DWS's remedial plans to address underperformance. The Board believes this process is an effective manner of identifying and addressing underperforming funds. Based on the information provided, the Board noted that for the one-, three- and five-year periods ended December 31, 2009, the Fund's performance (Class A shares) was in the 4th quartile, 2nd quartile and 1st quartile, respectively, of the applicable Lipper universe (the 1st quartile being the best performers and the 4th quartile being the worst performers). The Board also observed that the Fund has outperformed its benchmark in the three- and five-year periods and has underperformed its benchmark in the one-year period ended December 31, 2009. The Board noted the disappointing investment performance of the Fund in recent periods and continued to discuss with senior management of DWS the factors contributing to such underperformance and actions being taken to improve performance. The Board observed that the Fund had experienced improved relative performance during the first seven months of 2010.
On the basis of this evaluation and the ongoing review of investment results by the Board, the Board concluded that the nature, quality and extent of services provided by DWS historically have been and continue to be satisfactory.
Fees and Expenses. The Board considered the Fund's investment management fee schedule, operating expenses and total expense ratios, and comparative information provided by Lipper and the independent fee consultant regarding investment management fee rates paid to other investment advisors by similar funds (1st quartile being the most favorable and 4th quartile being the least favorable). With respect to management fees paid to other investment advisors by similar funds, the Board noted that the contractual fee rates paid by the Fund, which include a 0.10% fee paid to DWS under the Fund's administrative services agreement, were lower than the median (1st quartile) of the applicable Lipper peer group (based on Lipper data provided as of December 31, 2009). The Board noted that the Fund's Class A shares total (net) operating expenses were expected to be lower than the median (1st quartile) of the applicable Lipper expense universe (based on Lipper data provided as of December 31, 2009) ("Lipper Universe Expenses"). The Board also reviewed data comparing each share class's total (net) operating expenses to the applicable Lipper Universe Expenses. The Board considered the Fund's management fee rate as compared to fees charged by DWS and certain of its affiliates for comparable mutual funds and considered differences in fund and fee structures between the DWS Funds. The Board also considered how the Fund's total (net) operating expenses compared to the total (net) operating expenses of a more customized peer group selected by Lipper (based on such factors as asset size).
The information considered by the Board as part of its review of management fees included information regarding fees charged by DWS and its affiliates to similar institutional accounts and to similar funds offered primarily to European investors ("DWS Europe funds"), in each case as applicable. The Board observed that advisory fee rates for institutional accounts generally were lower than the management fees charged by similarly managed DWS US mutual funds ("DWS Funds"), but also took note of the differences in services provided to DWS Funds as compared to institutional accounts. In the case of DWS Europe funds, the Board observed that fee rates for DWS Europe funds generally were higher than for similarly managed DWS Funds, but noted that differences in the types of services provided to DWS Funds relative to DWS Europe funds made it difficult to compare such fees.
On the basis of the information provided, the Board concluded that management fees were reasonable and appropriate in light of the nature, quality and extent of services provided by DWS.
Profitability. The Board reviewed detailed information regarding revenues received by DWS under the Agreement. The Board considered the estimated costs and pre-tax profits realized by DWS from advising the DWS Funds, as well as estimates of the pre-tax profits attributable to managing the Fund in particular. The Board also received information regarding the estimated enterprise-wide profitability of DWS and its affiliates with respect to all fund services in totality and by fund. The Board reviewed DWS's methodology in allocating its costs to the management of the Fund. Based on the information provided, the Board concluded that the pre-tax profits realized by DWS in connection with the management of the Fund were not unreasonable. The Board also reviewed information regarding the profitability of certain similar investment management firms. The Board noted that while information regarding the profitability of such firms is limited (and in some cases is not necessarily prepared on a comparable basis), DWS and its affiliates' overall profitability with respect to the DWS fund complex (after taking into account distribution and other services provided to the funds by DWS and its affiliates) was lower than the overall profitability levels of many comparable firms for which such data was available.
Economies of Scale. The Board considered whether there are economies of scale with respect to the management of the Fund and whether the Fund benefits from any economies of scale. The Board noted that the Fund's management fee schedule includes fee breakpoints. The Board concluded that the Fund's fee schedule represents an appropriate sharing between the Fund and DWS of such economies of scale as may exist in the management of the Fund at current asset levels.
Other Benefits to DWS and Its Affiliates. The Board also considered the character and amount of other incidental benefits received by DWS and its affiliates, including any fees received by DWS for administrative services provided to the Fund and any fees received by an affiliate of DWS for distribution services. The Board also considered benefits to DWS related to brokerage and soft-dollar allocations, including allocating brokerage to pay for research generated by parties other than the executing broker dealers, which pertain primarily to funds investing in equity securities, along with the incidental public relations benefits to DWS related to DWS Funds advertising and cross-selling opportunities among DWS products and services. The Board concluded that management fees were reasonable in light of these fallout benefits.
Compliance. The Board considered the significant attention and resources dedicated by DWS to documenting and enhancing its compliance processes in recent years. The Board noted in particular (i) the experience and seniority of both DWS's chief compliance officer and the Fund's chief compliance officer; (ii) the large number of DWS compliance personnel; and (iii) the substantial commitment of resources by DWS and its affiliates to compliance matters.
Based on all of the information considered and the conclusions reached, the Board unanimously determined that the continuation of the Agreement is in the best interests of the Fund. In making this determination, the Board did not give particular weight to any single factor identified above. The Board considered these factors over the course of numerous meetings, certain of which were in executive session with only the Independent Trustees and their counsel present. It is possible that individual Trustees may have weighed these factors differently in reaching their individual decisions to approve the continuation of the Agreement.
DWS Global Opportunities VIP
The Board of Trustees, including the Independent Trustees, approved the renewal of your Fund's investment management agreement (the "Agreement") with Deutsche Investment Management Americas Inc. ("DWS") in September 2010.
In terms of the process that the Board followed prior to approving the Agreement, shareholders should know that:
• In September 2010, all of the Fund's Trustees were independent of DWS and its affiliates.
• The Trustees meet frequently to discuss fund matters. Each year, the Trustees dedicate substantial time to contract review matters. Over the course of several months, the Board's Contract Committee, in coordination with the Board's Equity Oversight Committee, reviewed comprehensive materials received from DWS, independent third parties and independent counsel. These materials included an analysis of the Fund's performance, fees and expenses, and profitability compiled by the Fund's independent fee consultant. The Board also received extensive information throughout the year regarding performance of the Fund.
• The Independent Trustees regularly meet privately with their independent counsel to discuss contract review and other matters. In addition, the Independent Trustees were also advised by the Fund's independent fee consultant in the course of their review of the Fund's contractual arrangements and considered a comprehensive report prepared by the independent fee consultant in connection with their deliberations (the "IFC Report").
• In connection with reviewing the Agreement, the Board also reviewed the terms of the Fund's Rule 12b-1 plan, distribution agreement, administrative services agreement, transfer agency agreement and other material service agreements.
• Based on its evaluation of the information provided, the Contract Committee presented its findings and recommendations to the Independent Trustees as a group. The Independent Trustees reviewed the Contract Committee's findings and recommendations and presented their recommendations to the full Board.
In connection with the contract review process, the Contract Committee and the Board considered the factors discussed below, among others. The Board also considered that DWS and its predecessors have managed the Fund since its inception, and the Board believes that a long-term relationship with a capable, conscientious advisor is in the best interests of the Fund. The Board considered, generally, that shareholders chose to invest or remain invested in the Fund knowing that DWS managed the Fund, and that the Agreement was approved by the Fund's shareholders. DWS is part of Deutsche Bank, a major global banking institution that is engaged in a wide range of financial services. The Board believes that there are significant advantages to being part of a global asset management business that offers a wide range of investing expertise and resources, including hundreds of portfolio managers and analysts with research capabilities in many countries throughout the world.
While shareholders may focus primarily on fund performance and fees, the Fund's Board considers these and many other factors, including the quality and integrity of DWS's personnel and such other issues as back-office operations, fund valuations, and compliance policies and procedures.
Nature, Quality and Extent of Services. The Board considered the terms of the Agreement, including the scope of advisory services provided under the Agreement. The Board noted that, under the Agreement, DWS provides portfolio management services to the Fund and that, pursuant to a separate administrative services agreement, DWS provides administrative services to the Fund. The Board considered the experience and skills of senior management and investment personnel, the resources made available to such personnel, the ability of DWS to attract and retain high-quality personnel, and the organizational depth and stability of DWS. The Board reviewed the Fund's performance over short-term and long-term periods and compared those returns to various agreed-upon performance measures, including market indices and a peer universe compiled by the independent fee consultant using information supplied by Lipper Inc. ("Lipper"). The Board also noted that it has put into place a process of identifying "Focus Funds" (e.g., funds performing poorly relative to their benchmark or a peer universe compiled by Lipper), and receives more frequent reporting and information from DWS regarding such funds, along with DWS's remedial plans to address underperformance. The Board believes this process is an effective manner of identifying and addressing underperforming funds. Based on the information provided, the Board noted that for the one-, three- and five-year periods ended December 31, 2009, the Fund's performance (Class A shares) was in the 1st quartile, 4th quartile and 3rd quartile, respectively, of the applicable Lipper universe (the 1st quartile being the best performers and the 4th quartile being the worst performers). The Board also observed that the Fund has outperformed its benchmark in the one-year period and has underperformed its benchmark in the three- and five-year periods ended December 31, 2009. The Board observed that there were significant limitations to the usefulness of the comparative data provided by Lipper, noting that the applicable Lipper universe for the Fund included funds that pursue substantially different investment programs as compared to that pursued by the Fund. As a result, the Board gave increased weight to the Fund's performance relative to its benchmark than some of the additional comparative data.
On the basis of this evaluation and the ongoing review of investment results by the Board, the Board concluded that the nature, quality and extent of services provided by DWS historically have been and continue to be satisfactory.
Fees and Expenses. The Board considered the Fund's investment management fee schedule, operating expenses and total expense ratios, and comparative information provided by Lipper and the independent fee consultant regarding investment management fee rates paid to other investment advisors by similar funds. With respect to management fees paid to other investment advisors by similar funds, the Board noted that the contractual fee rates paid by the Fund, which include a 0.10% fee paid to DWS under the Fund's administrative services agreement, were higher than the median of the applicable Lipper peer group (based on Lipper data provided as of December 31, 2009). The Board noted that the Fund's Class A shares total (net) operating expenses were expected to be higher than the median of the applicable Lipper expense universe (based on Lipper data provided as of December 31, 2009 ("Lipper Universe Expenses"). The Board also reviewed data comparing each share class's total (net) operating expenses to the applicable Lipper Universe Expenses. The Trustees also observed that the Lipper expense universe for the Fund included funds that pursue substantially different investment programs as compared to that pursued by the Fund. The Board considered the Fund's management fee rate as compared to fees charged by DWS and certain of its affiliates for comparable mutual funds and considered differences in fund and fee structures between the DWS Funds. The Board also considered how the Fund's total (net) operating expenses compared to the total (net) operating expenses of a more customized peer group selected by Lipper (based on such factors as asset size).
The Board also noted that the expense limitations agreed to by DWS helped to ensure that the Fund's total (net) operating expenses would remain competitive.
The information considered by the Board as part of its review of management fees included information regarding fees charged by DWS and its affiliates to similar institutional accounts and to similar funds offered primarily to European investors ("DWS Europe funds"), in each case as applicable. The Board observed that advisory fee rates for institutional accounts generally were lower than the management fees charged by similarly managed DWS US mutual funds ("DWS Funds"), but also took note of the differences in services provided to DWS Funds as compared to institutional accounts. In the case of DWS Europe funds, the Board observed that fee rates for DWS Europe funds generally were higher than for similarly managed DWS Funds, but noted that differences in the types of services provided to DWS Funds relative to DWS Europe funds made it difficult to compare such fees.
On the basis of the information provided, the Board concluded that management fees were reasonable and appropriate in light of the nature, quality and extent of services provided by DWS.
Profitability. The Board reviewed detailed information regarding revenues received by DWS under the Agreement. The Board considered the estimated costs and pre-tax profits realized by DWS from advising the DWS Funds, as well as estimates of the pre-tax profits attributable to managing the Fund in particular. The Board also received information regarding the estimated enterprise-wide profitability of DWS and its affiliates with respect to all fund services in totality and by fund. The Board reviewed DWS's methodology in allocating its costs to the management of the Fund. Based on the information provided, the Board concluded that the pre-tax profits realized by DWS in connection with the management of the Fund were not unreasonable. The Board also reviewed information regarding the profitability of certain similar investment management firms. The Board noted that while information regarding the profitability of such firms is limited (and in some cases is not necessarily prepared on a comparable basis), DWS and its affiliates' overall profitability with respect to the DWS fund complex (after taking into account distribution and other services provided to the funds by DWS and its affiliates) was lower than the overall profitability levels of many comparable firms for which such data was available.
Economies of Scale. The Board considered whether there are economies of scale with respect to the management of the Fund and whether the Fund benefits from any economies of scale. The Board noted that the Fund's management fee schedule includes fee breakpoints. The Board concluded that the Fund's fee schedule represents an appropriate sharing between the Fund and DWS of such economies of scale as may exist in the management of the Fund at current asset levels.
Other Benefits to DWS and Its Affiliates. The Board also considered the character and amount of other incidental benefits received by DWS and its affiliates, including any fees received by DWS for administrative services provided to the Fund and any fees received by an affiliate of DWS for distribution services. The Board also considered benefits to DWS related to brokerage and soft-dollar allocations, including allocating brokerage to pay for research generated by parties other than the executing broker dealers, which pertain primarily to funds investing in equity securities, along with the incidental public relations benefits to DWS related to DWS Funds advertising and cross-selling opportunities among DWS products and services. The Board concluded that management fees were reasonable in light of these fallout benefits.
Compliance. The Board considered the significant attention and resources dedicated by DWS to documenting and enhancing its compliance processes in recent years. The Board noted in particular (i) the experience and seniority of both DWS's chief compliance officer and the Fund's chief compliance officer; (ii) the large number of DWS compliance personnel; and (iii) the substantial commitment of resources by DWS and its affiliates to compliance matters.
Based on all of the information considered and the conclusions reached, the Board unanimously determined that the continuation of the Agreement is in the best interests of the Fund. In making this determination, the Board did not give particular weight to any single factor identified above. The Board considered these factors over the course of numerous meetings, certain of which were in executive session with only the Independent Trustees and their counsel present. It is possible that individual Trustees may have weighed these factors differently in reaching their individual decisions to approve the continuation of the Agreement.
DWS International VIP
The Board of Trustees, including the Independent Trustees, approved the renewal of your Fund's investment management agreement (the "Agreement") with Deutsche Investment Management Americas Inc. ("DWS") in September 2010.
In terms of the process that the Board followed prior to approving the Agreement, shareholders should know that:
• In September 2010, all of the Fund's Trustees were independent of DWS and its affiliates.
• The Trustees meet frequently to discuss fund matters. Each year, the Trustees dedicate substantial time to contract review matters. Over the course of several months, the Board's Contract Committee, in coordination with the Board's Equity Oversight Committee, reviewed comprehensive materials received from DWS, independent third parties and independent counsel. These materials included an analysis of the Fund's performance, fees and expenses, and profitability compiled by the Fund's independent fee consultant. The Board also received extensive information throughout the year regarding performance of the Fund.
• The Independent Trustees regularly meet privately with their independent counsel to discuss contract review and other matters. In addition, the Independent Trustees were also advised by the Fund's independent fee consultant in the course of their review of the Fund's contractual arrangements and considered a comprehensive report prepared by the independent fee consultant in connection with their deliberations (the "IFC Report").
• In connection with reviewing the Agreement, the Board also reviewed the terms of the Fund's Rule 12b-1 plan, distribution agreement, administrative services agreement, transfer agency agreement and other material service agreements.
• Based on its evaluation of the information provided, the Contract Committee presented its findings and recommendations to the Independent Trustees as a group. The Independent Trustees reviewed the Contract Committee's findings and recommendations and presented their recommendations to the full Board.
In connection with the contract review process, the Contract Committee and the Board considered the factors discussed below, among others. The Board also considered that DWS and its predecessors have managed the Fund since its inception, and the Board believes that a long-term relationship with a capable, conscientious advisor is in the best interests of the Fund. The Board considered, generally, that shareholders chose to invest or remain invested in the Fund knowing that DWS managed the Fund, and that the Agreement was approved by the Fund's shareholders. DWS is part of Deutsche Bank, a major global banking institution that is engaged in a wide range of financial services. The Board believes that there are significant advantages to being part of a global asset management business that offers a wide range of investing expertise and resources, including hundreds of portfolio managers and analysts with research capabilities in many countries throughout the world.
While shareholders may focus primarily on fund performance and fees, the Fund's Board considers these and many other factors, including the quality and integrity of DWS's personnel and such other issues as back-office operations, fund valuations, and compliance policies and procedures.
Nature, Quality and Extent of Services. The Board considered the terms of the Agreement, including the scope of advisory services provided under the Agreement. The Board noted that, under the Agreement, DWS provides portfolio management services to the Fund and that, pursuant to a separate administrative services agreement, DWS provides administrative services to the Fund. The Board considered the experience and skills of senior management and investment personnel, the resources made available to such personnel, the ability of DWS to attract and retain high-quality personnel, and the organizational depth and stability of DWS. The Board reviewed the Fund's performance over short-term and long-term periods and compared those returns to various agreed-upon performance measures, including market indices and a peer universe compiled by the independent fee consultant using information supplied by Lipper Inc. ("Lipper"). The Board also noted that it has put into place a process of identifying "Focus Funds" (e.g., funds performing poorly relative to their benchmark or a peer universe compiled by Lipper), and receives more frequent reporting and information from DWS regarding such funds, along with DWS's remedial plans to address underperformance. The Board believes this process is an effective manner of identifying and addressing underperforming funds. Based on the information provided, the Board noted that for the one-, three- and five-year periods ended December 31, 2009, the Fund's performance (Class A shares) was in the 2nd quartile, 4th quartile and 3rd quartile, respectively, of the applicable Lipper universe (the 1st quartile being the best performers and the 4th quartile being the worst performers). The Board also observed that the Fund has outperformed its benchmark in the one-year period and has underperformed its benchmark in the three- and five-year periods ended December 31, 2009.
On the basis of this evaluation and the ongoing review of investment results by the Board, the Board concluded that the nature, quality and extent of services provided by DWS historically have been and continue to be satisfactory.
Fees and Expenses. The Board considered the Fund's investment management fee schedule, operating expenses and total expense ratios, and comparative information provided by Lipper and the independent fee consultant regarding investment management fee rates paid to other investment advisors by similar funds (1st quartile being the most favorable and 4th quartile being the least favorable). With respect to management fees paid to other investment advisors by similar funds, the Board noted that the contractual fee rates paid by the Fund, which include a 0.10% fee paid to DWS under the Fund's administrative services agreement, were lower than the median (2nd quartile) of the applicable Lipper peer group (based on Lipper data provided as of December 31, 2009). The Board noted that the Fund's Class A shares total (net) operating expenses were expected to be higher than the median (3rd quartile) of the applicable Lipper expense universe (based on Lipper data provided as of December 31, 2009) ("Lipper Universe Expenses"). The Board also reviewed data comparing each share class's total (net) operating expenses to the applicable Lipper Universe Expenses. The Board considered the Fund's management fee rate as compared to fees charged by DWS and certain of its affiliates for comparable mutual funds and considered differences in fund and fee structures between the DWS Funds. The Board also considered how the Fund's total (net) operating expenses compared to the total (net) operating expenses of a more customized peer group selected by Lipper (based on such factors as asset size).
The information considered by the Board as part of its review of management fees included information regarding fees charged by DWS and its affiliates to similar institutional accounts and to similar funds offered primarily to European investors ("DWS Europe funds"), in each case as applicable. The Board observed that advisory fee rates for institutional accounts generally were lower than the management fees charged by similarly managed DWS US mutual funds ("DWS Funds"), but also took note of the differences in services provided to DWS Funds as compared to institutional accounts. In the case of DWS Europe funds, the Board observed that fee rates for DWS Europe funds generally were higher than for similarly managed DWS Funds, but noted that differences in the types of services provided to DWS Funds relative to DWS Europe funds made it difficult to compare such fees.
On the basis of the information provided, the Board concluded that management fees were reasonable and appropriate in light of the nature, quality and extent of services provided by DWS.
Profitability. The Board reviewed detailed information regarding revenues received by DWS under the Agreement. The Board considered the estimated costs and pre-tax profits realized by DWS from advising the DWS Funds, as well as estimates of the pre-tax profits attributable to managing the Fund in particular. The Board also received information regarding the estimated enterprise-wide profitability of DWS and its affiliates with respect to all fund services in totality and by fund. The Board reviewed DWS's methodology in allocating its costs to the management of the Fund. Based on the information provided, the Board concluded that the pre-tax profits realized by DWS in connection with the management of the Fund were not unreasonable. The Board also reviewed information regarding the profitability of certain similar investment management firms. The Board noted that while information regarding the profitability of such firms is limited (and in some cases is not necessarily prepared on a comparable basis), DWS and its affiliates' overall profitability with respect to the DWS fund complex (after taking into account distribution and other services provided to the funds by DWS and its affiliates) was lower than the overall profitability levels of many comparable firms for which such data was available.
Economies of Scale. The Board considered whether there are economies of scale with respect to the management of the Fund and whether the Fund benefits from any economies of scale. The Board noted that the Fund's management fee schedule includes fee breakpoints. The Board concluded that the Fund's fee schedule represents an appropriate sharing between the Fund and DWS of such economies of scale as may exist in the management of the Fund at current asset levels.
Other Benefits to DWS and Its Affiliates. The Board also considered the character and amount of other incidental benefits received by DWS and its affiliates, including any fees received by DWS for administrative services provided to the Fund and any fees received by an affiliate of DWS for distribution services. The Board also considered benefits to DWS related to brokerage and soft-dollar allocations, including allocating brokerage to pay for research generated by parties other than the executing broker dealers, which pertain primarily to funds investing in equity securities, along with the incidental public relations benefits to DWS related to DWS Funds advertising and cross-selling opportunities among DWS products and services. The Board concluded that management fees were reasonable in light of these fallout benefits.
Compliance. The Board considered the significant attention and resources dedicated by DWS to documenting and enhancing its compliance processes in recent years. The Board noted in particular (i) the experience and seniority of both DWS's chief compliance officer and the Fund's chief compliance officer; (ii) the large number of DWS compliance personnel; and (iii) the substantial commitment of resources by DWS and its affiliates to compliance matters.
Based on all of the information considered and the conclusions reached, the Board unanimously determined that the continuation of the Agreement is in the best interests of the Fund. In making this determination, the Board did not give particular weight to any single factor identified above. The Board considered these factors over the course of numerous meetings, certain of which were in executive session with only the Independent Trustees and their counsel present. It is possible that individual Trustees may have weighed these factors differently in reaching their individual decisions to approve the continuation of the Agreement.
DWS Health Care VIP
The Board of Trustees, including the Independent Trustees, approved the renewal of your Fund's investment management agreement (the "Agreement") with Deutsche Investment Management Americas Inc. ("DWS") in September 2010.
In terms of the process that the Board followed prior to approving the Agreement, shareholders should know that:
• In September 2010, all of the Fund's Trustees were independent of DWS and its affiliates.
• The Trustees meet frequently to discuss fund matters. Each year, the Trustees dedicate substantial time to contract review matters. Over the course of several months, the Board's Contract Committee, in coordination with the Board's Equity Oversight Committee, reviewed comprehensive materials received from DWS, independent third parties and independent counsel. These materials included an analysis of the Fund's performance, fees and expenses, and profitability compiled by the Fund's independent fee consultant. The Board also received extensive information throughout the year regarding performance of the Fund.
• The Independent Trustees regularly meet privately with their independent counsel to discuss contract review and other matters. In addition, the Independent Trustees were also advised by the Fund's independent fee consultant in the course of their review of the Fund's contractual arrangements and considered a comprehensive report prepared by the independent fee consultant in connection with their deliberations (the "IFC Report").
• In connection with reviewing the Agreement, the Board also reviewed the terms of the Fund's Rule 12b-1 plan, distribution agreement, administrative services agreement, transfer agency agreement and other material service agreements.
• Based on its evaluation of the information provided, the Contract Committee presented its findings and recommendations to the Independent Trustees as a group. The Independent Trustees reviewed the Contract Committee's findings and recommendations and presented their recommendations to the full Board.
In connection with the contract review process, the Contract Committee and the Board considered the factors discussed below, among others. The Board also considered that DWS and its predecessors have managed the Fund since its inception, and the Board believes that a long-term relationship with a capable, conscientious advisor is in the best interests of the Fund. The Board considered, generally, that shareholders chose to invest or remain invested in the Fund knowing that DWS managed the Fund, and that the Agreement was approved by the Fund's shareholders. DWS is part of Deutsche Bank, a major global banking institution that is engaged in a wide range of financial services. The Board believes that there are significant advantages to being part of a global asset management business that offers a wide range of investing expertise and resources, including hundreds of portfolio managers and analysts with research capabilities in many countries throughout the world.
While shareholders may focus primarily on fund performance and fees, the Fund's Board considers these and many other factors, including the quality and integrity of DWS's personnel and such other issues as back-office operations, fund valuations, and compliance policies and procedures.
Nature, Quality and Extent of Services. The Board considered the terms of the Agreement, including the scope of advisory services provided under the Agreement. The Board noted that, under the Agreement, DWS provides portfolio management services to the Fund and that, pursuant to a separate administrative services agreement, DWS provides administrative services to the Fund. The Board considered the experience and skills of senior management and investment personnel, the resources made available to such personnel, the ability of DWS to attract and retain high-quality personnel, and the organizational depth and stability of DWS. The Board reviewed the Fund's performance over short-term and long-term periods and compared those returns to various agreed-upon performance measures, including market indices and a peer universe compiled by the independent fee consultant using information supplied by Lipper Inc. ("Lipper"). The Board also noted that it has put into place a process of identifying "Focus Funds" (e.g., funds performing poorly relative to their benchmark or a peer universe compiled by Lipper), and receives more frequent reporting and information from DWS regarding such funds, along with DWS's remedial plans to address underperformance. The Board believes this process is an effective manner of identifying and addressing underperforming funds. Based on the information provided, the Board noted that for the one-, three- and five-year periods ended December 31, 2009, the Fund's performance (Class A shares) was in the 3rd quartile, 2nd quartile and 2nd quartile, respectively, of the applicable Lipper universe (the 1st quartile being the best performers and the 4th quartile being the worst performers). The Board also observed that the Fund has outperformed its benchmark in the three- and five-year periods and has underperformed its benchmark in the one-year period ended December 31, 2009.
On the basis of this evaluation and the ongoing review of investment results by the Board, the Board concluded that the nature, quality and extent of services provided by DWS historically have been and continue to be satisfactory.
Fees and Expenses. The Board considered the Fund's investment management fee schedule, operating expenses and total expense ratios, and comparative information provided by Lipper and the independent fee consultant regarding investment management fee rates paid to other investment advisors by similar funds (1st quartile being the most favorable and 4th quartile being the least favorable). With respect to management fees paid to other investment advisors by similar funds, the Board noted that the contractual fee rates paid by the Fund, which include a 0.10% fee paid to DWS under the Fund's administrative services agreement, were lower than the median (2nd quartile) of the applicable Lipper peer group (based on Lipper data provided as of December 31, 2009). The Board noted that the Fund's Class A shares total (net) operating expenses were expected to be higher than the median (3rd quartile) of the applicable Lipper expense universe (based on Lipper data provided as of December 31, 2009) ("Lipper Universe Expenses"). The Board also reviewed data comparing each share class's total (net) operating expenses to the applicable Lipper Universe Expenses. The Board considered the Fund's management fee rate as compared to fees charged by DWS and certain of its affiliates for comparable mutual funds and considered differences in fund and fee structures between the DWS Funds. The Board also considered how the Fund's total (net) operating expenses compared to the total (net) operating expenses of a more customized peer group selected by Lipper (based on such factors as asset size).
The information considered by the Board as part of its review of management fees included information regarding fees charged by DWS and its affiliates to similar institutional accounts and to similar funds offered primarily to European investors ("DWS Europe funds"), in each case as applicable. The Board observed that advisory fee rates for institutional accounts generally were lower than the management fees charged by similarly managed DWS US mutual funds ("DWS Funds"), but also took note of the differences in services provided to DWS Funds as compared to institutional accounts. In the case of DWS Europe funds, the Board observed that fee rates for DWS Europe funds generally were higher than for similarly managed DWS Funds, but noted that differences in the types of services provided to DWS Funds relative to DWS Europe funds made it difficult to compare such fees.
On the basis of the information provided, the Board concluded that management fees were reasonable and appropriate in light of the nature, quality and extent of services provided by DWS.
Profitability. The Board reviewed detailed information regarding revenues received by DWS under the Agreement. The Board considered the estimated costs and pre-tax profits realized by DWS from advising the DWS Funds, as well as estimates of the pre-tax profits attributable to managing the Fund in particular. The Board also received information regarding the estimated enterprise-wide profitability of DWS and its affiliates with respect to all fund services in totality and by fund. The Board reviewed DWS's methodology in allocating its costs to the management of the Fund. Based on the information provided, the Board concluded that the pre-tax profits realized by DWS in connection with the management of the Fund were not unreasonable. The Board also reviewed information regarding the profitability of certain similar investment management firms. The Board noted that while information regarding the profitability of such firms is limited (and in some cases is not necessarily prepared on a comparable basis), DWS and its affiliates' overall profitability with respect to the DWS fund complex (after taking into account distribution and other services provided to the funds by DWS and its affiliates) was lower than the overall profitability levels of many comparable firms for which such data was available.
Economies of Scale. The Board considered whether there are economies of scale with respect to the management of the Fund and whether the Fund benefits from any economies of scale. The Board noted that the Fund's management fee schedule includes fee breakpoints. The Board concluded that the Fund's fee schedule represents an appropriate sharing between the Fund and DWS of such economies of scale as may exist in the management of the Fund at current asset levels.
Other Benefits to DWS and Its Affiliates. The Board also considered the character and amount of other incidental benefits received by DWS and its affiliates, including any fees received by DWS for administrative services provided to the Fund and any fees received by an affiliate of DWS for distribution services. The Board also considered benefits to DWS related to brokerage and soft-dollar allocations, including allocating brokerage to pay for research generated by parties other than the executing broker dealers, which pertain primarily to funds investing in equity securities, along with the incidental public relations benefits to DWS related to DWS Funds advertising and cross-selling opportunities among DWS products and services. The Board concluded that management fees were reasonable in light of these fallout benefits.
Compliance. The Board considered the significant attention and resources dedicated by DWS to documenting and enhancing its compliance processes in recent years. The Board noted in particular (i) the experience and seniority of both DWS's chief compliance officer and the Fund's chief compliance officer; (ii) the large number of DWS compliance personnel; and (iii) the substantial commitment of resources by DWS and its affiliates to compliance matters.
Based on all of the information considered and the conclusions reached, the Board unanimously determined that the continuation of the Agreement is in the best interests of the Fund. In making this determination, the Board did not give particular weight to any single factor identified above. The Board considered these factors over the course of numerous meetings, certain of which were in executive session with only the Independent Trustees and their counsel present. It is possible that individual Trustees may have weighed these factors differently in reaching their individual decisions to approve the continuation of the Agreement.
Summary of Management Fee Evaluation by Independent Fee Consultant
October 3, 2010
Pursuant to an Order entered into by Deutsche Investment Management Americas and affiliates (collectively, "DeAM") with the Attorney General of New York, I, Thomas H. Mack, have been appointed the Independent Fee Consultant for the DWS Funds (formerly the DWS Scudder Funds). My duties include preparing an annual written evaluation of the management fees DeAM charges the Funds, considering among other factors the management fees charged by other mutual fund companies for like services, management fees DeAM charges other clients for like services, DeAM's costs of supplying services under the management agreements and related profit margins, possible economies of scale if a Fund grows larger, and the nature and quality of DeAM's services, including fund performance. This report summarizes my evaluation for 2010, including my qualifications, the evaluation process for each of the DWS Funds, consideration of certain complex-level factors, and my conclusions. I served in substantially the same capacity in 2007, 2008, and 2009.
Qualifications
For more than 35 years I have served in various professional capacities within the investment management business. I have held investment analysis and advisory positions, including securities analyst, portfolio strategist and director of investment policy with a large investment firm. I have also performed business management functions, including business development, financial management and marketing research and analysis.
Since 1991, I have been an independent consultant within the asset management industry. I have provided services to over 125 client organizations, including investment managers, mutual fund boards, product distributors and related organizations. Over the past ten years I have completed a number of assignments for mutual fund boards, specifically including assisting boards with management contract renewal.
I hold a Master of Business Administration degree, with highest honors, from Harvard University and Master of Science and Bachelor of Science (highest honors) degrees from the University of California at Berkeley. I am an independent director and audit committee financial expert for two closed-end mutual funds and have served in various leadership and financial oversight capacities with non-profit organizations.
Evaluation of Fees for each DWS Fund
My work focused primarily on evaluating, fund-by-fund, the fees charged to each of the 118 publicly offered Fund portfolios in the DWS Fund family. For each Fund, I considered each of the key factors mentioned above, as well as any other relevant information. In doing so I worked closely with the Funds' Independent Directors in their annual contract renewal process, as well as in their approval of contracts for several new funds (documented separately).
In evaluating each Fund's fees, I reviewed comprehensive materials provided by or on behalf of DeAM, including expense information prepared by Lipper Analytical, comparative performance information, profitability data, manager histories, and other materials. I also accessed certain additional information from the Lipper and Morningstar databases and drew on my industry knowledge and experience.
To facilitate evaluating this considerable body of information, I prepared for each Fund a document summarizing the key data elements in each area as well as additional analytics discussed below. This made it possible to consider each key data element in the context of the others.
In the course of contract renewal, DeAM agreed to implement a number of fee and expense adjustments requested by the Independent Directors which will favorably impact future fees and expenses, and my evaluation includes the effects of these changes.
Fees and Expenses Compared with Other Funds
The competitive fee and expense evaluation for each fund focused on two primary comparisons:
The Fund's contractual management fee (the advisory fee plus the administration fee where applicable) compared with those of a group of typically 12-15 funds in the same Lipper investment category (e.g. Large Capitalization Growth) having similar distribution arrangements and being of similar size.
The Fund's total expenses compared with a broader universe of funds from the same Lipper investment category and having similar distribution arrangements.
These two comparisons provide a view of not only the level of the fee compared with funds of similar scale but also the total expense the Fund bears for all the services it receives, in comparison with the investment choices available in the Fund's investment category and distribution channel. The principal figure-of-merit used in these comparisons was the subject Fund's percentile ranking against peers.
DeAM's Fees for Similar Services to Others
DeAM provided management fee schedules for all of its US domiciled fund and non-fund investment management accounts in any of the investment categories where there is a DWS Fund. These similar products included the other DWS Funds, non-fund pooled accounts, institutional accounts and sub-advisory accounts. Using this information, I calculated for each Fund the fee that would be charged to each similar product, at the subject Fund's asset level.
Evaluating information regarding non-fund products is difficult because there are varying levels of services required for different types of accounts, with mutual funds generally requiring considerably more regulatory and administrative types of service as well as having more frequent cash flows than other types of accounts. Also, while mutual fund fees for similar fund products can be expected to be similar, there will be some differences due to different pricing conditions in different distribution channels (e.g. retail funds versus those used in variable insurance products), differences in underlying investment processes and other factors.
Costs and Profit Margins
DeAM provided a detailed profitability analysis for each Fund. After making some adjustments so that the presentation would be more comparable to the available industry figures, I reviewed profit margins from investment management alone, from investment management plus other fund services (excluding distribution) provided to the Funds by DeAM (principally shareholder services), and DeAM profits from all sources, including distribution. A later section comments on overall profitability.
Economies of Scale
Economies of scale — an expected decline in management cost per dollar of fund assets as fund assets grow — are very rarely quantified and documented because of inherent difficulties in collecting and analyzing relevant data. However, in virtually every investment category that I reviewed, larger funds tend to have lower fees and lower total expenses than smaller funds. To see how each DWS Fund compares with this industry observation, I reviewed:
The trend in Fund assets over the last five years and the accompanying trend in total expenses. This shows if the Fund has grown and, if so, whether total expense (management fees as well as other expenses) have declined as a percent of assets.
Whether the Fund has break-points in its management fee schedule, the extent of the fee reduction built into the schedule and the asset levels where the breaks take effect, and in the case of a sub-advised Fund how the Fund's break-points compare with those of the sub-advisory fee schedule.
How the Fund's contractual fee schedule compares with trends in the industry data. To accomplish this, I constructed a chart showing how actual latest-fiscal-year contractual fees of the Fund and of other similar funds relate to average fund assets, with the subject Fund's contractual fee schedule superimposed.
Quality of Service — Performance
The quality-of-service evaluation focused on investment performance, which is the principal result of the investment management service. Each Fund's performance was reviewed over the past 1, 3, 5 and 10 years, as applicable, and compared with that of other funds in the same investment category and with a suitable market index.
In addition, I calculated and reviewed risk-adjusted returns relative to an index of similar mutual funds' returns and a suitable market index. The risk-adjusted returns analysis provides a way of determining the extent to which the Fund's return comparisons are mainly the product of investment value-added (or lack thereof) or alternatively taking considerably more or less risk than is typical in its investment category.
I also received and considered the history of portfolio manager changes for each Fund, as this provided an important context for evaluating the performance results.
Complex-Level Considerations
While this evaluation was conducted mainly at the individual fund level, there are some issues relating to the reasonableness of fees that can alternatively be considered across the whole fund complex:
I reviewed DeAM's profitability analysis for all DWS Funds, with a view toward determining if the allocation procedures used were reasonable and how profit levels compared with public data for other investment managers.
I considered whether DeAM and affiliates receive any significant ancillary or "fall-out" benefits that should be considered in interpreting the direct profitability results. These would be situations where serving as the investment manager of the Funds is beneficial to another part of the Deutsche Bank organization.
I considered how aggregated DWS Fund expenses had varied over the years, by asset class and in the context of trends in asset levels.
I reviewed the structure of the DeAM organization, trends in staffing levels, and information on compensation of investment management and other professionals compared with industry data.
Findings
Based on the process and analysis discussed above, which included reviewing a wide range of information from management and external data sources and considering among other factors the fees DeAM charges other clients, the fees charged by other fund managers, DeAM's costs and profits associated with managing the Funds, economies of scale, possible fall-out benefits, and the nature and quality of services provided, in my opinion the management fees charged the DWS Funds are reasonable.

Thomas H. Mack
Board Members and Officers
The following table presents certain information regarding the Board Members and Officers of the Trust as of December 31, 2010. Each Board Member's year of birth is set forth in parentheses after his or her name. Unless otherwise noted, (i) each Board Member has engaged in the principal occupation(s) noted in the table for at least the most recent five years, although not necessarily in the same capacity; and (ii) the address of each Independent Board Member is c/o Paul K. Freeman, Independent Chairman, DWS Funds, PO Box 101833, Denver, CO 80250-1833. Except as otherwise noted below, the term of office for each Board Member is until the election and qualification of a successor, or until such Board Member sooner dies, resigns, is removed or as otherwise provided in the governing documents of the fund. Because the fund does not hold an annual meeting of shareholders, each Board Member will hold office for an indeterminate period. The Board Members may also serve in similar capacities with other funds in the fund complex. The Length of Time Served represents the year in which the Board Member joined the board of one or more DWS funds now overseen by the Board.
Independent Board Members |
Name, Year of Birth, Position with the Fund and Length of Time Served1 | Business Experience and Directorships During the Past Five Years | Number of Funds in DWS Fund Complex Overseen |
Paul K. Freeman (1950) Chairperson since 2009 Board Member since 1993 | Consultant, World Bank/Inter-American Development Bank; Executive and Governing Council of the Independent Directors Council (education committees); formerly, Project Leader, International Institute for Applied Systems Analysis (1998-2001); Chief Executive Officer, The Eric Group, Inc. (environmental insurance) (1986-1998) | 122 |
John W. Ballantine (1946) Board Member since 1999 | Retired; formerly, Executive Vice President and Chief Risk Management Officer, First Chicago NBD Corporation/The First National Bank of Chicago (1996-1998); Executive Vice President and Head of International Banking (1995-1996). Directorships: Healthways, Inc. (provider of disease and care management services); Portland General Electric (utility company); Stockwell Capital Investments PLC (private equity). Former Directorships: First Oak Brook Bancshares, Inc. and Oak Brook Bank; Prisma Energy International | 122 |
Henry P. Becton, Jr. (1943) Board Member since 1990 | Vice Chair and former President, WGBH Educational Foundation. Directorships: Association of Public Television Stations; Lead Director, Becton Dickinson and Company3 (medical technology company); Lead Director, Belo Corporation3 (media company); Public Radio International; Public Radio Exchange (PRX); The PBS Foundation. Former Directorships: Boston Museum of Science; American Public Television; Concord Academy; New England Aquarium; Mass. Corporation for Educational Telecommunications; Committee for Economic Development; Public Broadcasting Service | 122 |
Dawn-Marie Driscoll (1946) Board Member since 1987 | President, Driscoll Associates (consulting firm); Executive Fellow, Center for Business Ethics, Bentley University; formerly, Partner, Palmer & Dodge (1988-1990); Vice President of Corporate Affairs and General Counsel, Filene's (1978-1988). Directorships: Trustee of 22 open-end mutual funds managed by Sun Capital Advisers, Inc. (since 2007); Director of ICI Mutual Insurance Company (since 2007); Advisory Board, Center for Business Ethics, Bentley University; Trustee, Southwest Florida Community Foundation (charitable organization). Former Directorships: Investment Company Institute (audit, executive, nominating committees) and Independent Directors Council (governance, executive committees) | 122 |
Keith R. Fox (1954) Board Member since 1996 | Managing General Partner, Exeter Capital Partners (a series of private investment funds). Directorships: Progressive International Corporation (kitchen goods importer and distributor); BoxTop Media Inc. (advertising); The Kennel Shop (retailer); former Chairman, National Association of Small Business Investment Companies | 122 |
Kenneth C. Froewiss (1945) Board Member since 2001 | Adjunct Professor of Finance, NYU Stern School of Business (September 2009-present; Clinical Professor from 1997-September 2009); Member, Finance Committee, Association for Asian Studies (2002-present); Director, Mitsui Sumitomo Insurance Group (US) (2004-present); prior thereto, Managing Director, J.P. Morgan (investment banking firm) (until 1996) | 122 |
Richard J. Herring (1946) Board Member since 1990 | Jacob Safra Professor of International Banking and Professor, Finance Department, The Wharton School, University of Pennsylvania (since July 1972); Co-Director, Wharton Financial Institutions Center (since July 2000); Co-Chair, U.S. Shadow Financial Regulatory Committee; Executive Director, Financial Economists Roundtable; Director, Japan Equity Fund, Inc. (since September 2007), Thai Capital Fund, Inc. (since September 2007), Singapore Fund, Inc. (since September 2007); Independent Director of Barclays Bank Delaware (since September 2010). Formerly, Vice Dean and Director, Wharton Undergraduate Division (July 1995-June 2000); Director, Lauder Institute of International Management Studies (July 2000-June 2006) | 122 |
William McClayton (1944) Board Member since 2004+ | Private equity investor (since October 2009); previously, Managing Director, Diamond Management & Technology Consultants, Inc. (global consulting firm) (2001-2009); Directorship: Board of Managers, YMCA of Metropolitan Chicago; formerly: Senior Partner, Arthur Andersen LLP (accounting) (1966-2001); Trustee, Ravinia Festival | 122 |
Rebecca W. Rimel (1951) Board Member since 1995 | President and Chief Executive Officer, The Pew Charitable Trusts (charitable organization) (1994 to present); Trustee, Thomas Jefferson Foundation (charitable organization) (1994 to present); Trustee, Executive Committee, Philadelphia Chamber of Commerce (2001-2007); Director, CardioNet, Inc.2 (2009-present) (health care). Formerly, Executive Vice President, The Glenmede Trust Company (investment trust and wealth management) (1983-2004); Board Member, Investor Education (charitable organization) (2004-2005); Director, Viasys Health Care2 (January 2007-June 2007); Trustee, Pro Publica (charitable organization) (2007-2010) | 122 |
William N. Searcy, Jr. (1946) Board Member since 1993 | Private investor since October 2003; Trustee of 22 open-end mutual funds managed by Sun Capital Advisers, Inc. (since October 1998). Formerly, Pension & Savings Trust Officer, Sprint Corporation2 (telecommunications) (November 1989-September 2003) | 122 |
Jean Gleason Stromberg (1943) Board Member since 1997 | Retired. Formerly, Consultant (1997-2001); Director, Financial Markets US Government Accountability Office (1996-1997); Partner, Fulbright & Jaworski, L.L.P. (law firm) (1978-1996). Directorships: The William and Flora Hewlett Foundation. Former Directorships: Service Source, Inc., Mutual Fund Directors Forum (2002-2004), American Bar Retirement Association (funding vehicle for retirement plans) (1987-1990 and 1994-1996) | 122 |
Robert H. Wadsworth (1940) Board Member since 1999 | President, Robert H. Wadsworth & Associates, Inc. (consulting firm) (1983 to present); Director, The Phoenix Boys Choir Association | 125 |
Officers4 |
Name, Year of Birth, Position with the Fund and Length of Time Served5 | Principal Occupation(s) During Past 5 Years and Other Directorships Held |
Michael G. Clark6 (1965) President, 2006-present | Managing Director3, Deutsche Asset Management (2006-present); President of DWS family of funds; Director, ICI Mutual Insurance Company (since October 2007); formerly, Director of Fund Board Relations (2004-2006) and Director of Product Development (2000-2004), Merrill Lynch Investment Managers; Senior Vice President Operations, Merrill Lynch Asset Management (1999-2000) |
Ingo Gefeke7 (1967) Executive Vice President since 2010 | Managing Director3, Deutsche Asset Management; Global Head of Distribution and Product Management, DWS Global Head of Trading and Securities Lending. Member of the Board of Directors of DWS Investment GmbH Frankfurt (since July 2009) and DWS Holding & Service GmbH Frankfurt (since January 2010); formerly, Global Chief Administrative Officer, Deutsche Asset Management (2004-2009); Global Chief Operating Officer, Global Transaction Banking, Deutsche Bank AG, New York (2001-2004); Chief Operating Officer, Global Banking Division Americas, Deutsche Bank AG, New York (1999-2001); Central Management, Global Banking Services, Deutsche Bank AG, Frankfurt (1998-1999); Relationship Management, Deutsche Bank AG, Tokyo, Japan (1997-1998) |
John Millette8 (1962) Vice President and Secretary, 1999-present | Director3, Deutsche Asset Management |
Paul H. Schubert6 (1963) Chief Financial Officer, 2004-present Treasurer, 2005-present | Managing Director3, Deutsche Asset Management (since July 2004); formerly, Executive Director, Head of Mutual Fund Services and Treasurer for UBS Family of Funds (1998-2004); Vice President and Director of Mutual Fund Finance at UBS Global Asset Management (1994-1998) |
Caroline Pearson8 (1962) Chief Legal Officer, April 2010-present | Managing Director3, Deutsche Asset Management; formerly, Assistant Secretary for DWS family of funds (1997-2010) |
Rita Rubin9 (1970) Assistant Secretary, 2009-present | Vice President and Counsel, Deutsche Asset Management (since October 2007); formerly, Vice President, Morgan Stanley Investment Management (2004-2007) |
Paul Antosca8 (1957) Assistant Treasurer, 2007-present | Director3, Deutsche Asset Management (since 2006); Vice President, The Manufacturers Life Insurance Company (U.S.A.) (1990-2006) |
Jack Clark8 (1967) Assistant Treasurer, 2007-present | Director3, Deutsche Asset Management (since 2007); formerly, Vice President, State Street Corporation (2002-2007) |
Diane Kenneally8 (1966) Assistant Treasurer, 2007-present | Director3, Deutsche Asset Management |
John Caruso9 (1965) Anti-Money Laundering Compliance Officer, 2010-present | Managing Director3, Deutsche Asset Management |
Name, Year of Birth, Position with the Fund and Length of Time Served5 | Principal Occupation(s) During Past 5 Years and Other Directorships Held |
Robert Kloby9 (1962) Chief Compliance Officer, 2006-present | Managing Director3, Deutsche Asset Management |
1 The length of time served represents the year in which the Board Member joined the board of one or more DWS funds currently overseen by the Board.
2 A publicly held company with securities registered pursuant to Section 12 of the Securities Exchange Act of 1934.
3 Executive title, not a board directorship.
4 As a result of their respective positions held with the Advisor, these individuals are considered "interested persons" of the Advisor within the meaning of the 1940 Act. Interested persons receive no compensation from the fund.
5 The length of time served represents the year in which the officer was first elected in such capacity for one or more DWS funds.
6 Address: 100 Plaza One, Jersey City, NJ 07311.
7 Effective January 11, 2011, Mr. Gefeke, Executive Vice President, resigned as an officer of the fund.
The mailing address of Mr. Gefeke is 345 Park Avenue, New York, New York 10154. Mr. Gefeke was an interested Board Member of certain DWS funds by virtue of his positions with Deutsche Asset Management. As an interested person, Mr. Gefeke received no compensation from the fund.
8 Address: One Beacon Street, Boston, MA 02108.
9 Address: 60 Wall Street, New York, New York 10005.
The fund's Statement of Additional Information ("SAI") includes additional information about the Board Members. The SAI is available, without charge, upon request. If you would like to request a copy of the SAI, you may do so by calling the following toll-free number: (800) 728-3337.
DWS Investments is part of Deutsche Bank's Asset Management division and, within the US, represents the retail asset management activities of Deutsche Bank AG, Deutsche Bank Trust Company Americas, Deutsche Investment Management Americas Inc. and DWS Trust Company.
The views expressed in this report reflect those of the portfolio managers only through the end of the period of the report as stated on the cover. The managers' views are subject to change at any time based on market and other conditions and should not be construed as a recommendation.
This information must be preceded or accompanied by a current prospectus.
Portfolio changes should not be considered recommendations for action by individual investors.
DWS Investments Distributors, Inc.
222 South Riverside Plaza
Chicago, IL 60606
(800) 621-1148
VS1-2 (R-20592-1 2/11)

DECEMBER 31, 2010
ANNUAL REPORT
DWS VARIABLE SERIES II
DWS Alternative Asset Allocation Plus VIP DWS Balanced VIP DWS Blue Chip VIP DWS Core Fixed Income VIP DWS Diversified International Equity VIP DWS Dreman Small Mid Cap Value VIP DWS Global Thematic VIP DWS Government & Agency Securities VIP DWS High Income VIP DWS Large Cap Value VIP DWS Mid Cap Growth VIP DWS Money Market VIP DWS Small Cap Growth VIP DWS Strategic Income VIP DWS Strategic Value VIP DWS Technology VIP DWS Turner Mid Cap Growth VIP |
Contents
Performance Summary, Information About Your Fund's Expenses, Management Summary, Portfolio Summary, Investment Portfolio, Statement of Assets and Liabilities, Statement of Operations, Statement of Changes in Net Assets and Financial Highlights for:
4 DWS Alternative Asset Allocation Plus VIP 15 DWS Balanced VIP 45 DWS Blue Chip VIP 61 DWS Core Fixed Income VIP 76 DWS Diversified International Equity VIP 96 DWS Dreman Small Mid Cap Value VIP 109 DWS Global Thematic VIP 123 DWS Government & Agency Securities VIP 137 DWS High Income VIP 162 DWS Large Cap Value VIP 174 DWS Mid Cap Growth VIP 187 DWS Money Market VIP 200 DWS Small Cap Growth VIP 213 DWS Strategic Income VIP 246 DWS Strategic Value VIP 259 DWS Technology VIP 271 DWS Turner Mid Cap Growth VIP 284 Notes to Financial Statements 307 Report of Independent Registered Public Accounting Firm 308 Tax Information 309 Proxy Voting 310 Investment Management Agreement Approval 347 Summary of Management Fee Evaluation by Independent Fee Consultant 349 Summary of Administrative Fee Evaluation by Independent Fee Consultant 350 Board Members and Officers |
This report must be preceded or accompanied by a prospectus. To obtain an additional prospectus or summary prospectus, if available, call (800) 728-3337 or your financial representative. We advise you to consider the Fund's objectives, risks, charges and expenses carefully before investing. The summary prospectus and prospectus contain this and other important information about the Fund. Please read the prospectus carefully before you invest.
Investments in variable insurance portfolios (VIPs) involve risk. Stocks may decline in value. Bond investments are subject to interest-rate and credit risks. When interest rates rise, bond prices generally fall. Credit risk refers to the ability of an issuer to make timely payments of principal and interest. Investing in derivatives entails special risks relating to liquidity, leverage and credit that may reduce returns and/or increased volatility. Investing in foreign securities, particularly those of emerging markets, presents certain risks, such as currency fluctuations, political and economic changes, and market risks. There are additional risks associated with investing in commodities, high-yield bonds, aggressive growth stocks, non-diversified/ concentrated funds and small- and mid-cap stocks which are more fully explained in the prospectuses. Please read the prospectus for more information.
DWS Investments is part of Deutsche Bank's Asset Management division and, within the US, represents the retail asset management activities of Deutsche Bank AG, Deutsche Bank Trust Company Americas, Deutsche Investment Management Americas Inc. and DWS Trust Company.
NOT FDIC/NCUA INSURED NO BANK GUARANTEE MAY LOSE VALUE NOT A DEPOSIT
NOT INSURED BY ANY FEDERAL GOVERNMENT AGENCY
Performance Summary December 31, 2010
DWS Alternative Asset Allocation Plus VIP
All performance shown is historical, assumes reinvestment of all dividend and capital gain distributions and does not guarantee future results. Investment return and principal value fluctuate with changing market conditions so that, when redeemed, shares may be worth more or less than their original cost. Current performance may be lower or higher than the performance data quoted. Please contact your participating insurance company for the Fund's most recent month-end performance. Performance doesn't reflect charges and fees ("contract charges") associated with the separate account that invests in the Fund or any variable life insurance policy or variable annuity contract for which the Fund is an investment option. These charges and fees will reduce returns. While all share classes have the same underlying portfolio, their performance will differ.
The gross expense ratios of the Fund, as stated in the fee table of the prospectus dated May 1, 2010 are 5.09% and 5.32% for Class A and Class B shares, respectively, and may differ from the expense ratios disclosed in the Financial Highlights tables in this report.
Risk Considerations
Although allocation among different asset categories generally limits risk, the investment advisor may favor an asset category that underperforms other assets or markets as a whole. The Fund expects to invest in underlying funds that emphasize alternatives or non-traditional asset categories or investment strategies, and as a result, it is subject to the risk factors of those underlying funds. Some of those risks include stock market risk, credit and interest rate risk, volatility in commodity prices and high-yield debt securities, short sales risk and the political, general economic, liquidity and currency risks of foreign investments, which may be particularly significant for emerging markets. The Fund may use derivatives, including as part of its global alpha strategy. The Fund also expects to have direct and indirect exposure to derivatives, which may be more volatile and less liquid than traditional securities. The Fund could suffer losses on its derivative positions. See the prospectus for additional risks and specific details regarding the Fund's risk profile.
Fund returns shown for all periods reflect a fee waiver and/or expense reimbursement. Without this waiver/reimbursement, returns would have been lower.
Growth of an Assumed $10,000 Investment in DWS Alternative Asset Allocation Plus VIP from 2/2/09 to 12/31/10 |
[] DWS Asset Allocation Plus VIP — Class A [] MSCI World Index [] Barclays Capital US Aggregate Bond Index [] S&P 500® Index [] Blended Index | The Morgan Stanley Capital International (MSCI) World Index is an unmanaged, capitalization-weighted measure of global stock markets including the US, Canada, Europe, Australia and the Far East. The index is calculated using closing local market prices and translates into US dollars using the London close foreign exchange rates. The Barclays Capital US Aggregate Bond Index is an unmanaged, market-value-weighted measure of Treasury issues, agency issues, corporate bond issues and mortgage securities. The Standard & Poor's 500® (S&P 500) Index is an unmanaged, capitalization-weighted index of 500 stocks. The index is designed to measure performance of the broad domestic economy through changes in the aggregate market value of 500 stocks representing all major industries. The Blended Index is calculated using the performance of two unmanaged indices, representative of stocks (the Morgan Stanley Capital International (MSCI) World Index (70%)) and bonds (the Barclays Capital US Aggregate Bond Index (30%)). These results are summed to produce the aggregate benchmark. Equity index returns assume reinvestment of dividends and, unlike fund returns, do not reflect any fees or expenses. Fixed income index returns, unlike fund returns, do not reflect any fees or expenses. It is not possible to invest directly into an index. |
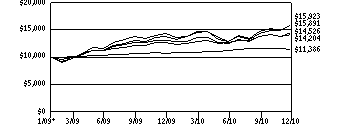 | |
| |
* The Fund commenced offering Class A shares on February 2, 2009. Index returns began on January 31, 2009.
Comparative Results |
DWS Alternative Asset Allocation Plus VIP | 1-Year | Life of Fund* |
Class A | Growth of $10,000 | $11,246 | $14,204 |
Average annual total return | 12.46% | 20.10% |
MSCI World Index | Growth of $10,000 | $11,176 | $15,923 |
Average annual total return | 11.76% | 27.47% |
Barclays Capital US Aggregate Bond Index | Growth of $10,000 | $10,654 | $11,386 |
Average annual total return | 6.54% | 7.01% |
S&P 500 Index | Growth of $10,000 | $11,506 | $15,891 |
Average annual total return | 15.06% | 27.33% |
Blended Index | Growth of $10,000 | $11,069 | $14,526 |
Average annual total return | 10.69% | 21.51% |
DWS Alternative Asset Allocation Plus VIP | 1-Year | Life of Class** |
Class B | Growth of $10,000 | $11,215 | $13,010 |
Average annual total return | 12.15% | 17.63% |
MSCI World Index | Growth of $10,000 | $11,176 | $13,599 |
Average annual total return | 11.76% | 21.43% |
Barclays Capital US Aggregate Bond Index | Growth of $10,000 | $10,654 | $11,138 |
Average annual total return | 6.54% | 7.05% |
S&P 500 Index | Growth of $10,000 | $11,506 | $14,133 |
Average annual total return | 15.06% | 24.42% |
Blended Index | Growth of $10,000 | $11,069 | $12,880 |
Average annual total return | 10.69% | 17.33% |
The growth of $10,000 is cumulative.
* The Fund commenced offering Class A shares on February 2, 2009. Index returns began on January 31, 2009.
** The Fund commenced offering Class B shares on May 18, 2009. Index returns began on May 31, 2009.
Information About Your Fund's Expenses
DWS Alternative Asset Allocation Plus VIP
As an investor of the Fund, you incur two types of costs: ongoing expenses and transaction costs. Ongoing expenses include management fees, distribution and service (12b-1) fees and other Fund expenses. Examples of transaction costs include contract charges, redemption fees and account maintenance fees, which are not shown in this section. The following tables are intended to help you understand your ongoing expenses (in dollars) of investing in the Fund and to help you compare these expenses with the ongoing expenses of investing in other mutual funds. In addition to the ongoing expenses which the Fund bears directly, the Fund's shareholders indirectly bear the expense of the Underlying Funds in which the Fund invests. These expenses are not included in the Fund's annualized expense ratios used to calculate the expense estimate in the tables. In the most recent six-month period, the Fund limited the ongoing expenses the Fund bears directly; had it not done so, expenses would have been higher. The examples in the table are based on an investment of $1,000 invested at the beginning of the six-month period and held for the entire period (July 1, 2010 to December 31, 2010).
The tables illustrate your Fund's expenses in two ways:
• Actual Fund Return. This helps you estimate the actual dollar amount of ongoing expenses (but not transaction costs) paid on a $1,000 investment in the Fund using the Fund's actual return during the period. To estimate the expenses you paid over the period, simply divide your account value by $1,000 (for example, an $8,600 account value divided by $1,000 = 8.6), then multiply the result by the number in the "Expenses Paid per $1,000" line under the share class you hold.
• Hypothetical 5% Fund Return. This helps you to compare your Fund's ongoing expenses (but not transaction costs) with those of other mutual funds using the Fund's actual expense ratio and a hypothetical rate of return of 5% per year before expenses. Examples using a 5% hypothetical Fund return may be found in the shareholder reports of other mutual funds. The hypothetical account values and expenses may not be used to estimate the actual ending account balance or expenses you paid for the period.
Please note that the expenses shown in these tables are meant to highlight your ongoing expenses only and do not reflect any transaction costs. The "Expenses Paid per $1,000" line of the tables is useful in comparing ongoing expenses only and will not help you determine the relative total expense of owning different funds. If these transaction costs had been included, your costs would have been higher.
Expenses and Value of a $1,000 Investment for the six months ended December 31, 2010 |
Actual Fund Return | Class A | Class B |
Beginning Account Value 7/1/10 | $ 1,000.00 | $ 1,000.00 |
Ending Account Value 12/31/10 | $ 1,128.80 | $ 1,127.00 |
Expenses Paid per $1,000* | $ 1.13 | $ 2.47 |
Hypothetical 5% Fund Return | Class A | Class B |
Beginning Account Value 7/1/10 | $ 1,000.00 | $ 1,000.00 |
Ending Account Value 12/31/10 | $ 1,024.15 | $ 1,022.89 |
Expenses Paid per $1,000* | $ 1.07 | $ 2.35 |
* Expenses are equal to the Fund's annualized expense ratio for each share class, multiplied by the average account value over the period, multiplied by the number of days in the most recent six-month period, then divided by 365.
Annualized Expense Ratios** | Class A | Class B |
DWS Variable Series II — DWS Alternative Asset Allocation Plus VIP | .21% | .46% |
** The Fund invests in other funds and indirectly bears its proportionate share of fees and expenses incurred by the Underlying Funds in which the Fund is invested. These ratios do not include these indirect fees and expenses.
For more information, please refer to the Fund's prospectus.
These tables do not reflect charges and fees ("contract charges") associated with the separate account that invests in the Fund or any variable life insurance policy or variable annuity contract for which the Fund is an investment option.
Management Summary December 31, 2010
DWS Alternative Asset Allocation Plus VIP
DWS Alternative Asset Allocation Plus VIP invests in ten DWS mutual funds plus four exchange-traded funds that together provide diversified exposure to alternative asset classes.1 The Fund returned 12.46% (Class A shares, unadjusted for contract charges) during 2010, while its blended benchmark returned 10.69%.
We define the alternative allocations in terms of three segments: absolute return, real return and nontraditional. The real return allocation, which holds investments whose returns should outpace the rate of inflation over time, benefited from the strong performance of DWS Gold & Precious Metals Fund, DWS Enhanced Commodity Strategy Fund and DWS RREEF Global Real Estate Securities Fund. The nontraditional allocation, which invests in funds that provide diversification but that may not yet be held in traditional portfolios, also added value.2 All five components of this allocation generated a positive return, with our three equity investments — DWS Emerging Markets Equity Fund, iShares MSCI EAFE Small Cap Index Fund and WisdomTree Emerging Markets SmallCap Dividend Fund — all providing excellent performance in the rising market. Our two bond investments within this allocation — DWS Emerging Markets Fixed Income Fund and SPDR Barclays Capital International Treasury Bond Fund — also gained ground, but lagged the return of the overall portfolio due to bonds' more muted performance in 2010.
The weakest returns came from the absolute return segment, which seeks to generate positive returns independent of market direction. Our investment in DWS Disciplined Market Neutral Fund, which holds roughly equal weightings in both long and short investments, typically does not keep pace with the broader market when stocks perform as well as they did during the past year. Nevertheless, we believe the fund remains an important part of the Fund's diversification.
As we move into 2011, we remain committed to providing our investors with a one-stop, professionally managed way to gain exposure to the alternative asset classes. We believe our multifaceted role as managers — selecting asset classes, determine the weightings for each asset class and deciding on the appropriate timing of portfolio reallocations — can add significant value for our investors over time.
Robert Wang
Inna Okounkova
Thomas Picciochi
Portfolio Managers, QS Investors, LLC
Subadvisor to the Fund
The Blended Index is calculated using the performance of two unmanaged indices, representative of stocks (the Morgan Stanley Capital International (MSCI) World Index (70%)) and bonds (the Barclays Capital US Aggregate Bond Index (30%)). These results are summed to produce the aggregate benchmark.
The iShares MSCI EAFE Small Cap Index Fund seeks to provide investment results that correspond generally to the price and yield performance, before fees and expenses, as represented by the MSCI EAFE Small Cap Index.
The WisdomTree Emerging Markets SmallCap Dividend Fund seeks investment results that correspond to the price and yield performance, before fees and expenses, of the WisdomTree Emerging Markets SmallCap Dividend Index.
The SPDR Barclays Capital International Treasury Bond Fund tracks the Barclays Capital Global Treasury Ex-US Capped Index. The international bond ETF invests at least 80% of securities that are in the underlying index as well as derivatives such as swaps and options. Some of the regions represented in the bond ETF are Japan, Germany, France, Italy and Greece.
Equity index returns assume reinvestment of dividends and, unlike fund returns, do not reflect any fees or expenses. Fixed income index returns, unlike fund returns, do not reflect any fees or expenses. It is not possible to invest directly into an index.
1 An exchange-traded fund (ETF) is a security that tracks an index, a commodity or a basket of assets like an index fund, but trades like a stock on an exchange.
2 Diversification neither assures a profit nor guarantees against a loss.
Portfolio Summary
DWS Alternative Asset Allocation Plus VIP
Asset Allocation (As a % of Investment Portfolio) | 12/31/10 | 12/31/09 |
| | |
Fixed Income — Bond Funds | 42% | 30% |
Equity — Equity Funds | 31% | 65% |
Market Neutral Fund | 18% | — |
Fixed Income — Money Market Fund | 4% | — |
Equity — Exchange-Traded Funds | 3% | 3% |
Fixed Income — Exchange-Traded Fund | 2% | 2% |
| 100% | 100% |
Asset allocation is subject to change.
For more complete details about the Fund's investment portfolio, see page 10.
Following the Fund's fiscal first and third quarter-end, a complete portfolio holdings listing is filed with the SEC on Form N-Q. The form will be available on the SEC's Web site at www.sec.gov, and it also may be reviewed and copied at the SEC's Public Reference Room in Washington, D.C. Information on the operation of the SEC's Public Reference Room may be obtained by calling (800) SEC-0330. The Fund's portfolio holdings are also posted on www.dws-investments.com from time to time. Please see the Fund's current prospectus for more information.
Investment Portfolio December 31, 2010
DWS Alternative Asset Allocation Plus VIP
|
Shares
| Value ($) |
| |
Equity — Equity Funds 31.0% |
DWS Emerging Markets Equity Fund "Institutional" | 116,267 | 2,199,763 |
DWS Gold & Precious Metals Fund "Institutional" | 56,634 | 1,346,767 |
DWS RREEF Global Infrastructure Fund "Institutional" | 140,736 | 1,325,736 |
DWS RREEF Global Real Estate Securities Fund "Institutional" | 506,169 | 3,796,269 |
Total Equity — Equity Funds (Cost $7,892,103) | 8,668,535 |
|
Equity — Exchange-Traded Funds 2.7% |
iShares MSCI EAFE Small Cap Index Fund | 9,056 | 382,254 |
Vanguard FTSE All World ex-US Small-Cap Fund | 2,479 | 246,958 |
WisdomTree Emerging Markets SmallCap Dividend Fund | 2,319 | 126,385 |
Total Equity — Exchange-Traded Funds (Cost $652,941) | 755,597 |
|
Fixed Income — Bond Funds 42.2% |
DWS Emerging Markets Fixed Income Fund "Institutional" | 270,908 | 2,942,058 |
DWS Enhanced Commodity Strategy Fund "Institutional"* | 803,146 | 3,541,873 |
|
Shares
| Value ($) |
| |
DWS Floating Rate Plus Fund "Institutional" | 141,702 | 1,331,995 |
DWS Global Inflation Plus Fund "Institutional" | 386,409 | 3,972,283 |
Total Fixed Income — Bond Funds (Cost $11,035,168) | 11,788,209 |
|
Fixed Income — Money Market Fund 3.8% |
Central Cash Management Fund (Cost $1,072,672) | 1,072,672 | 1,072,672 |
|
Fixed Income — Exchange-Traded Fund 1.7% |
SPDR Barclays Capital International Treasury Bond (Cost $474,388) | 8,229 | 481,068 |
|
Market Neutral Fund 17.9% |
DWS Disciplined Market Neutral Fund "Institutional" (Cost $5,027,517) | 528,646 | 4,985,131 |
| % of Net Assets | Value ($) |
| |
Total Investment Portfolio (Cost $26,154,789)+ | 99.3 | 27,751,212 |
Other Assets and Liabilities, Net | 0.7 | 190,789 |
Net Assets | 100.0 | 27,942,001 |
* Non-income producing security.
+ The cost for federal income tax purposes was $26,172,268. At December 31, 2010, net unrealized appreciation for all securities based on tax cost was $1,578,944. This consisted of aggregate gross unrealized appreciation for all securities in which there was an excess of value over tax cost of $1,638,809 and aggregate gross unrealized depreciation for all securities in which there was an excess of tax cost over value of $59,865.
EAFE: Europe, Australasia and Far East
FTSE: Financial Times and the London Stock Exchange
MSCI: Morgan Stanley Capital International
SPDR: Standard & Poor's Depositary Receipt
Fair Value Measurements
Various inputs are used in determining the value of the Fund's investments. These inputs are summarized in three broad levels. Level 1 includes quoted prices in active markets for identical securities. Level 2 includes other significant observable inputs (including quoted prices for similar securities, interest rates, prepayment speeds, and credit risk). Level 3 includes significant unobservable inputs (including the Fund's own assumptions in determining the fair value of investments). The inputs or methodology used for valuing securities are not necessarily an indication of the risk associated with investing in those securities.
The following is a summary of the inputs used as of December 31, 2010 in valuing the Fund's investments. For information on the Fund's policy regarding the valuation of investments, please refer to the Security Valuation section of Note A in the accompanying Notes to Financial Statements.
Assets | Level 1 | Level 2 | Level 3 | Total |
|
Equity Funds | $ 8,668,535 | $ — | $ — | $ 8,668,535 |
Exchange-Traded Funds (a) | 1,236,665 | — | — | 1,236,665 |
Bond Funds | 11,788,209 | — | — | 11,788,209 |
Money Market Fund | 1,072,672 | — | — | 1,072,672 |
Market Netural Fund | 4,985,131 | — | — | 4,985,131 |
Total | $ 27,751,212 | $ — | $ — | $ 27,751,212 |
There have been no significant transfers between Level 1 and Level 2 fair value measurements during the year ended December 31, 2010.
(a) See Investment Portfolio for additional detailed categorizations.
The accompanying notes are an integral part of the financial statements.
Statement of Assets and Liabilities
as of December 31, 2010 |
Assets |
Investments: Investments in Underlying Affiliated Funds, at value (cost $23,954,788) | $ 25,441,875 |
Investments in Underlying Non-affiliated Funds, at value (cost $1,127,329) | 1,236,665 |
Investment in Central Cash Management Fund, at value (cost $1,072,672) | 1,072,672 |
Total investments, at value (cost $26,154,789) | 27,751,212 |
Receivable for Fund shares sold | 237,032 |
Dividends receivable | 3,012 |
Due from Advisor | 5,574 |
Other assets | 191 |
Total assets | 27,997,021 |
Liabilities |
Accrued expenses and other liabilities | 55,020 |
Total liabilities | 55,020 |
Net assets, at value | $ 27,942,001 |
Net Assets Consist of |
Undistributed net investment income | 426,034 |
Net unrealized appreciation (depreciation) on investments | 1,596,423 |
Accumulated net realized gain (loss) | 81,658 |
Paid-in capital | 25,837,886 |
Net assets, at value | $ 27,942,001 |
Class A Net Asset Value, offering and redemption price per share ($5,020,913 ÷ 362,411 outstanding shares of beneficial interest, no par value, unlimited number of shares authorized) | $ 13.85 |
Class B Net Asset Value, offering and redemption price per share ($22,921,088 ÷ 1,656,043 outstanding shares of beneficial interest, no par value, unlimited number of shares authorized) | $ 13.84 |
The accompanying notes are an integral part of the financial statements.
Statement of Operations
for the year ended December 31, 2010 |
Investment Income |
Income: Income distributions from Underlying Affiliated Funds | $ 463,325 |
Dividends | 22,190 |
Income distributions — Central Cash Management Fund | 610 |
Total income | 486,125 |
Expenses: Management fee | 31,017 |
Administration fee | 13,080 |
Services to shareholders | 383 |
Distribution service fee (Class B) | 25,810 |
Custodian fee | 6,941 |
Legal fees | 11,534 |
Audit and tax fees | 43,862 |
Trustees' fees and expenses | 3,085 |
Reports to shareholders | 13,174 |
Total expenses before expense reductions | 148,886 |
Expense reductions | (95,476) |
Total expenses after expense reductions | 53,410 |
Net investment income (loss) | 432,715 |
Realized and Unrealized Gain (Loss) |
Net realized gain (loss) from: Sale of Underlying Affiliated Funds | (6,421) |
Sale of Underlying Non-affiliated Funds | 1,845 |
Capital gain distributions from Underlying Affiliated Funds | 99,137 |
| 94,561 |
Change in net unrealized appreciation (depreciation) on investments | 1,382,244 |
Net gain (loss) | 1,476,805 |
Net increase (decrease) in net assets resulting from operations | $ 1,909,520 |
The accompanying notes are an integral part of the financial statements.
Statement of Changes in Net Assets
Increase (Decrease) in Net Assets | Year Ended December 31, 2010 | Period Ended December 31, 2009* |
Operations: Net investment income | $ 432,715 | $ 97,525 |
Net realized gain (loss) | 94,561 | 93,568 |
Change in net unrealized appreciation (depreciation) | 1,382,244 | 214,179 |
Net increase (decrease) in net assets resulting from operations | 1,909,520 | 405,272 |
Distributions to shareholders from: Net investment income: Class A | (29,328) | — |
Class B | (74,563) | — |
Net realized gains: Class A | (23,912) | — |
Class B | (82,873) | — |
Total distributions | (210,676) | — |
Fund share transactions: Class A Proceeds from shares sold | 3,888,928 | 1,288,284 |
Reinvestment of distributions | 53,240 | — |
Payments for shares redeemed | (529,532) | (300,310) |
Net increase (decrease) in net assets from Class A share transactions | 3,412,636 | 987,974 |
Class B Proceeds from shares sold | 19,061,697 | 6,723,581 |
Reinvestment of distributions | 157,436 | — |
Payments for shares redeemed | (1,070,014) | (3,636,425) |
Net increase (decrease) in net assets from Class B share transactions | 18,149,119 | 3,087,156 |
Increase (decrease) in net assets | 23,260,599 | 4,075,130 |
Net assets at beginning of period | 4,681,402 | 201,000 |
Net assets at end of period (including undistributed net investment income of $426,034 and $97,525, respectively) | $ 27,942,001 | $ 4,681,402 |
Other Information |
Class A Shares outstanding at beginning of period | 101,099 | — |
Shares sold | 298,581 | 105,838 |
Shares issued to shareholders in reinvestment of distributions | 4,172 | — |
Shares redeemed | (41,441) | (24,739) |
Net increase (decrease) in Class A shares | 261,312 | 81,099 |
Initial capital | — | 20,000 |
Shares outstanding at end of period | 362,411 | 101,099 |
Class B Shares outstanding at beginning of period | 270,064 | — |
Shares sold | 1,454,814 | 560,919 |
Shares issued to shareholders in reinvestment of distributions | 12,329 | — |
Shares redeemed | (81,164) | (290,947) |
Net increase (decrease) in Class B shares | 1,385,979 | 269,972 |
Initial capital | — | 92 |
Shares outstanding at end of period | 1,656,043 | 270,064 |
* For the period from February 2, 2009 (commencement of operations) to December 31, 2009 for Class A shares and from May 18, 2009 (commencement of operations) to December 31, 2009 for Class B shares.
The accompanying notes are an integral part of the financial statements.
Financial Highlights
Class A Years Ended December 31, | 2010 | 2009a |
Selected Per Share Data |
Net asset value, beginning of period | $ 12.63 | $ 10.00 |
Income (loss) from investment operations: Net investment incomeb | .46 | .57 |
Net realized and unrealized gain (loss) | 1.09 | 2.06 |
Total from investment operations | 1.55 | 2.63 |
Less distributions from: Net investment income | (.18) | — |
Net realized gains | (.15) | — |
Total distributions | (.33) | — |
Net asset value, end of period | $ 13.85 | $ 12.63 |
Total Return (%)c,d | 12.46 | 26.30** |
Ratios to Average Net Assets and Supplemental Data |
Net assets, end of period ($ millions) | 5 | 1 |
Ratio of expenses before expense reductions (%)e | .94 | 11.67* |
Ratio of expenses after expense reductions (%)e | .21 | .21* |
Ratio of net investment income (%) | 3.51 | 5.39* |
Portfolio turnover rate (%) | 6 | 155** |
a For the period from February 2, 2009 (commencement of operations of Class A shares) to December 31, 2009. b Based on average shares outstanding during the period. c Total return would have been lower had certain expenses not been reduced. d Total return would have been lower if the Advisor had not reduced some Underlying Funds' expenses. e The Fund invests in other Funds and indirectly bears its proportionate share of fees and expenses incurred by the Underlying Funds and non-affiliated funds in which the Fund is invested. This ratio does not include these indirect fees and expenses. * Annualized ** Not annualized |
Class B Years Ended December 31, | 2010 | 2009a |
Selected Per Share Data |
Net asset value, beginning of period | $ 12.61 | $ 10.87 |
Income (loss) from investment operations: Net investment incomeb | .42 | .35 |
Net realized and unrealized gain (loss) | 1.09 | 1.39 |
Total from investment operations | 1.51 | 1.74 |
Less distributions from: Net investment income | (.13) | — |
Net realized gains | (.15) | — |
Total distributions | (.28) | — |
Net asset value, end of period | $ 13.84 | $ 12.61 |
Total Return (%)c,d | 12.15 | 16.01** |
Ratios to Average Net Assets and Supplemental Data |
Net assets, end of period ($ millions) | 23 | 3 |
Ratio of expenses before expense reductions (%)e | 1.19 | 5.37* |
Ratio of expenses after expense reductions (%)e | .46 | .61* |
Ratio of net investment income (%) | 3.26 | 4.66* |
Portfolio turnover rate (%) | 6 | 155** |
a For the period from May 18, 2009 (commencement of operations of Class B shares) to December 31, 2009. b Based on average shares outstanding during the period. c Total return would have been lower had certain expenses not been reduced. d Total return would have been lower if the Advisor had not reduced some Underlying Funds' expenses. e The Fund invests in other Funds and indirectly bears its proportionate share of fees and expenses incurred by the Underlying Funds and non-affiliated funds in which the Fund is invested. This ratio does not include these indirect fees and expenses. * Annualized ** Not annualized |
Performance Summary December 31, 2010
DWS Balanced VIP
All performance shown is historical, assumes reinvestment of all dividend and capital gain distributions and does not guarantee future results. Investment return and principal value fluctuate with changing market conditions so that, when redeemed, shares may be worth more or less than their original cost. Current performance may be lower or higher than the performance data quoted. Please contact your participating insurance company for the Fund's most recent month-end performance. Performance doesn't reflect charges and fees ("contract charges") associated with the separate account that invests in the Fund or any variable life insurance policy or variable annuity contract for which the Fund is an investment option. These charges and fees will reduce returns.
The gross expense ratio of the Fund, as stated in the fee table of the prospectus dated May 1, 2010 is 0.62% for Class A shares and may differ from the expense ratio disclosed in the Financial Highlights table in this report.
Risk Considerations
Although allocation among different asset categories generally limits risk, the investment advisor may favor an asset category that underperforms other assets or markets as a whole. Bond investments are subject to interest-rate and credit risks. When interest rates rise, bond prices generally fall. Credit risk refers to the ability of an issuer to make timely payments of principal and interest. The Fund may use derivatives, including as part of its global alpha strategy. Investing in derivatives entails special risks relating to liquidity, leverage and credit that may reduce returns and/or increase volatility. Stocks may decline in value. See the prospectus for details.
Fund returns for the 3-year, 5-year and 10-year periods shown reflect a fee waiver and/or expense reimbursement. Without this waiver/reimbursement, returns would have been lower.
Growth of an Assumed $10,000 Investment in DWS Balanced VIP |
[] DWS Balanced VIP — Class A [] Russell 1000® Index [] Barclays Capital US Aggregate Bond Index | |
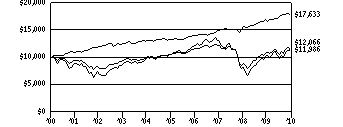 | | The Russell 1000® Index is an unmanaged index that measures the performance of the 1,000 largest companies in the Russell 3000 Index, which represents approximately 92% of the total market capitalization of the Russell 3000 Index. The Barclays Capital US Aggregate Bond Index is an unmanaged, market-value-weighted measure of Treasury issues, agency issues, corporate bond issues and mortgage securities. Index returns assume reinvestment of dividends and, unlike fund returns, do not reflect any fees or expenses. It is not possible to invest directly into an index. |
Yearly periods ended December 31 | |
Comparative Results |
DWS Balanced VIP | 1-Year | 3-Year | 5-Year | 10-Year |
Class A | Growth of $10,000 | $11,122 | $9,976 | $11,531 | $12,066 |
Average annual total return | 11.22% | -0.08% | 2.89% | 1.90% |
Russell 1000 Index | Growth of $10,000 | $11,610 | $9,305 | $11,364 | $11,986 |
Average annual total return | 16.10% | -2.37% | 2.59% | 1.83% |
Barclays Capital US Aggregate Bond Index | Growth of $10,000 | $10,654 | $11,877 | $13,255 | $17,633 |
Average annual total return | 6.54% | 5.90% | 5.80% | 5.84% |
The growth of $10,000 is cumulative.
Information About Your Fund's Expenses
DWS Balanced VIP
As an investor of the Fund, you incur two types of costs: ongoing expenses and transaction costs. Ongoing expenses include management fees and other Fund expenses. Examples of transaction costs include contract charges, redemption fees and account maintenance fees, which are not shown in this section. The following tables are intended to help you understand your ongoing expenses (in dollars) of investing in the Fund and to help you compare these expenses with the ongoing expenses of investing in other mutual funds. The example in the table is based on an investment of $1,000 invested at the beginning of the six-month period and held for the entire period (July 1, 2010 to December 31, 2010).
The tables illustrate your Fund's expenses in two ways:
• Actual Fund Return. This helps you estimate the actual dollar amount of ongoing expenses (but not transaction costs) paid on a $1,000 investment in the Fund using the Fund's actual return during the period. To estimate the expenses you paid over the period, simply divide your account value by $1,000 (for example, an $8,600 account value divided by $1,000 = 8.6), then multiply the result by the number in the "Expenses Paid per $1,000" line under the share class you hold.
• Hypothetical 5% Fund Return. This helps you to compare your Fund's ongoing expenses (but not transaction costs) with those of other mutual funds using the Fund's actual expense ratio and a hypothetical rate of return of 5% per year before expenses. Examples using a 5% hypothetical Fund return may be found in the shareholder reports of other mutual funds. The hypothetical account values and expenses may not be used to estimate the actual ending account balance or expenses you paid for the period.
Please note that the expenses shown in these tables are meant to highlight your ongoing expenses only and do not reflect any transaction costs. The "Expenses Paid per $1,000" line of the tables is useful in comparing ongoing expenses only and will not help you determine the relative total expense of owning different funds. If these transaction costs had been included, your costs would have been higher.
Expenses and Value of a $1,000 Investment for the six months ended December 31, 2010 |
Actual Fund Return | Class A | |
Beginning Account Value 7/1/10 | $ 1,000.00 | |
Ending Account Value 12/31/10 | $ 1,146.00 | |
Expenses Paid per $1,000* | $ 3.68 | |
Hypothetical 5% Fund Return | Class A | |
Beginning Account Value 7/1/10 | $ 1,000.00 | |
Ending Account Value 12/31/10 | $ 1,021.78 | |
Expenses Paid per $1,000* | $ 3.47 | |
* Expenses are equal to the Fund's annualized expense ratio, multiplied by the average account value over the period, multiplied by the number of days in the most recent six-month period, then divided by 365.
Annualized Expense Ratio | Class A | |
DWS Variable Series II — DWS Balanced VIP | .68% | |
For more information, please refer to the Fund's prospectus.
These tables do not reflect charges and fees ("contract charges") associated with the separate account that invests in the Fund or any variable life insurance policy or variable annuity contract for which the Fund is an investment option.
Management Summary December 31, 2010
DWS Balanced VIP
The global equity and fixed-income markets both finished 2010 with strong returns, providing a tailwind for DWS Balanced VIP. For the 12 months ended December 31, 2010, the Fund returned 11.22% (Class A shares, unadjusted for contract charges). The Russell 1000® Index, the Fund's equity benchmark, returned 16.10%, and the Barclays Capital US Aggregate Bond Index, the Fund's bond benchmark, returned 6.54%.
The Fund uses several different investment strategies which include investments in five exchange-traded funds, or ETFs.1 In a reflection of the favorable market environment, all of these investment strategies produced a positive absolute return. We also measure each of the Fund's underlying investments in terms of their relative performance or, in other words, how well they performed in relation to their respective benchmarks. The Fund's shortfall versus the benchmark reflects the collective underperformance of several underlying investment strategies.
We made several shifts to the Fund's positioning during the second half of the year. One of the most significant changes was the liquidation of the quantitative small-cap core sleeve and the addition of the iShares Russell 2000® Value Index Fund. Additionally, we slightly increased the Fund's exposure to large-cap and international equities, and we reduced its exposure to small-cap equities. On the fixed-income side, we augmented the Fund's diversification by reducing exposure to global inflation-linked bonds and cash and increasing our allocation to emerging-market bonds and international developed market bonds. We achieved this via investments in two ETFs — iShares JPMorgan USD Emerging Markets Bond Fund and SPDR Barclays Capital International Treasury Bond.
We believe DWS Balanced VIP, by virtue of its extensive diversification, continues to offer investors a compelling way to gain exposure to a wide range of asset classes within the global financial markets. We will continue to review asset allocation and manager allocation periodically, and we are always looking for opportunities to expand our universe and increase diversification among managers and investment styles.
Robert Wang
Inna Okounkova
Thomas Picciochi
Portfolio Managers, QS Investors, LLC
Subadvisor to the Fund
The Russell 1000 Index is an unmanaged index that measures the performance of the 1,000 largest companies in the Russell 3000® Index, which represents approximately 92% of the total market capitalization of the Russell 3000 Index.
The Barclays Capital US Aggregate Bond Index is an unmanaged, market-value-weighted measure of Treasury issues, corporate bond issues and mortgage securities.
The iShares Russell 2000 Value Index Fund seeks investment results that correspond generally to the price and yield performance, before fees and expenses, of the small capitalization sector of the US equity market as represented by the Russell 2000 Value Index. The index represents approximate 50% of the Russell 2000 Index.
The iShares JPMorgan USD Emerging Markets Bond Fund seeks investment results that correspond generally to the price and yield performance, before fees and expenses, of the JPMorgan EMBI Global Core Index.
The SPDR Barclays Capital International Treasury Bond ETF tracks the Barclays Global Treasury Ex-US Capped index. The international bond ETF invests at least 80% of securities that are in the underlying index as well as derivatives such as swaps and options. Some of the regions represented in the bond ETF are Japan, Germany, France, Italy and Greece.
Index returns assume reinvestment of dividends and, unlike fund returns, do not reflect any fees or expenses. It is not possible to invest directly into an index.
1 An exchange-traded fund (ETF) is a security that tracks an index, a commodity or a basket of assets like an index fund, but trades like a stock on an exchange.
Portfolio Summary
DWS Balanced VIP
Asset Allocation (As a % of Investment Portfolio excluding Securities Lending Collateral) | 12/31/10 | 12/31/09 |
| | |
Common Stocks | 55% | 54% |
Government & Agency Obligations | 9% | 13% |
Fixed Income — Exchange-Traded Funds | 7% | 3% |
Mortgage-Backed Securities Pass-Throughs | 7% | 8% |
Corporate Bonds | 7% | 8% |
Cash Equivalents | 6% | 10% |
Equity — Exchange-Traded Funds | 5% | 3% |
Commercial Mortgage-Backed Securities | 2% | 1% |
Municipal Bonds and Notes | 1% | 0% |
Preferred Stocks | 1% | 0% |
| 100% | 100% |
Sector Diversification (As a % of Equities, Corporate Bonds, Senior Bank Loans and Preferred Securities) | 12/31/10 | 12/31/09 |
| | |
Information Technology | 16% | 15% |
Energy | 14% | 10% |
Financials | 13% | 16% |
Consumer Discretionary | 12% | 11% |
Industrials | 11% | 11% |
Health Care | 10% | 13% |
Consumer Staples | 9% | 9% |
Materials | 6% | 6% |
Telecommunication Services | 5% | 5% |
Utilities | 4% | 4% |
| 100% | 100% |
Asset allocation and sector diversification exclude derivatives and are subject to change.
For more complete details about the Fund's investment portfolio, see page 20 .
Following the Fund's fiscal first and third quarter-end, a complete portfolio holdings listing is filed with the SEC on Form N-Q. The form will be available on the SEC's Web site at www.sec.gov, and it also may be reviewed and copied at the SEC's Public Reference Room in Washington, D.C. Information on the operation of the SEC's Public Reference Room may be obtained by calling (800) SEC-0330. The Fund's portfolio holdings are also posted on www.dws-investments.com from time to time. Please see the Fund's current prospectus for more information.
Investment Portfolio December 31, 2010
DWS Balanced VIP
|
Shares
| Value ($) |
| |
Common Stocks 56.4% |
Consumer Discretionary 6.6% |
Auto Components 0.8% |
Autoliv, Inc. (a) | 7,100 | 560,474 |
BorgWarner, Inc.* (a) | 22,292 | 1,613,049 |
Minth Group Ltd. | 86,306 | 141,682 |
Nippon Seiki Co., Ltd. | 8,273 | 99,131 |
S&T Dynamics Co., Ltd.* | 5,003 | 100,667 |
| 2,515,003 |
Automobiles 0.3% |
Bayerische Motoren Werke (BMW) AG | 1,656 | 130,143 |
Daimler AG (Registered)* | 4,530 | 306,979 |
Honda Motor Co., Ltd. | 9,032 | 356,978 |
PT Astra International Tbk | 24,185 | 146,285 |
| 940,385 |
Distributors 0.5% |
Genuine Parts Co. | 27,420 | 1,407,743 |
Diversified Consumer Services 0.3% |
H&R Block, Inc. (a) | 67,779 | 807,248 |
Hotels Restaurants & Leisure 1.2% |
Carnival Corp. (Units) | 19,047 | 878,257 |
Darden Restaurants, Inc. (a) | 17,590 | 816,880 |
Domino's Pizza UK & IRL PLC | 10,134 | 87,137 |
Marriott International, Inc. "A" (a) | 24,919 | 1,035,135 |
McDonald's Corp. | 6,220 | 477,447 |
Paddy Power PLC | 3,364 | 138,006 |
PartyGaming PLC* (a) | 16,776 | 53,749 |
REXLot Holdings Ltd. | 1,209,877 | 127,637 |
Trump Entertainment Resorts, Inc.* | 2 | 37 |
| 3,614,285 |
Household Durables 0.1% |
Advanced Digital Broadcast Holdings SA (Registered) | 414 | 13,547 |
Hajime Construction Co., Ltd. | 1,994 | 68,443 |
Jarden Corp. | 1,794 | 55,381 |
Panasonic Corp. | 22,414 | 316,400 |
| 453,771 |
Internet & Catalog Retail 0.0% |
Mecox Lane Ltd. (ADR)* (a) | 4,052 | 30,025 |
Leisure Equipment & Products 0.1% |
Universal Entertainment Corp.* | 6,095 | 178,021 |
Media 1.0% |
Aegis Group PLC | 24,682 | 54,067 |
Charm Communications, Inc. (ADR)* | 2,894 | 28,535 |
Dex One Corp.* | 245 | 1,828 |
JC Decaux SA* | 3,633 | 111,781 |
News Corp. "A" | 63,987 | 931,651 |
Scripps Networks Interactive "A" | 23,130 | 1,196,977 |
SuperMedia, Inc.* | 43 | 375 |
Vertis Holdings, Inc.* | 1,645 | 0 |
Vivendi | 8,527 | 230,171 |
WPP PLC | 30,237 | 372,190 |
| 2,927,575 |
|
Shares
| Value ($) |
| |
Multiline Retail 0.6% |
Dollar General Corp.* (a) | 11,960 | 366,813 |
Kohl's Corp.* | 14,560 | 791,190 |
Nordstrom, Inc. (a) | 15,950 | 675,961 |
PPR | 1,010 | 160,610 |
| 1,994,574 |
Specialty Retail 0.8% |
Advance Auto Parts, Inc. (a) | 1,704 | 112,719 |
Aeropostale, Inc.* | 4,348 | 107,135 |
Dick's Sporting Goods, Inc.* (a) | 15,840 | 594,000 |
Guess?, Inc. (a) | 2,421 | 114,562 |
Hennes & Mauritz AB "B" | 3,513 | 117,050 |
hhgregg, Inc.* (a) | 3,764 | 78,856 |
L'Occitane International SA* | 23,750 | 65,694 |
Limited Brands, Inc. (a) | 37,290 | 1,145,922 |
Nitori Holdings Co., Ltd. | 1,345 | 117,613 |
Urban Outfitters, Inc.* | 3,227 | 115,559 |
| 2,569,110 |
Textiles, Apparel & Luxury Goods 0.9% |
Burberry Group PLC | 4,298 | 75,319 |
Compagnie Financiere Richemont SA "A" | 5,753 | 338,456 |
Deckers Outdoor Corp.* (a) | 2,398 | 191,217 |
LVMH Moet Hennessy Louis Vuitton SA | 1,076 | 177,000 |
NIKE, Inc. "B" (a) | 14,970 | 1,278,737 |
VF Corp. | 8,644 | 744,940 |
| 2,805,669 |
Consumer Staples 5.2% |
Beverages 0.9% |
C&C Group PLC | 29,374 | 132,791 |
Carlsberg AS "B" | 1,490 | 149,114 |
Central European Distribution Corp.* | 2,600 | 59,540 |
Diageo PLC | 27,977 | 516,884 |
PepsiCo, Inc. | 28,067 | 1,833,617 |
| 2,691,946 |
Food & Staples Retailing 1.5% |
CVS Caremark Corp. | 32,169 | 1,118,516 |
Kroger Co. | 38,618 | 863,499 |
Metro AG | 2,441 | 175,746 |
Seven & I Holdings Co., Ltd. | 16,781 | 448,210 |
Sysco Corp. | 23,420 | 688,548 |
Tesco PLC | 23,968 | 158,816 |
Wal-Mart Stores, Inc. | 8,735 | 471,079 |
Wesfarmers Ltd. | 7,877 | 257,811 |
Woolworths Ltd. | 18,023 | 497,163 |
| 4,679,388 |
Food Products 1.1% |
Diamond Foods, Inc. (a) | 2,779 | 147,787 |
General Mills, Inc. | 16,139 | 574,387 |
Green Mountain Coffee Roasters, Inc.* (a) | 3,078 | 101,143 |
Kellogg Co. | 13,681 | 698,826 |
Mead Johnson Nutrition Co. | 9,888 | 615,528 |
Nestle SA (Registered) | 16,271 | 953,115 |
SunOpta, Inc.* | 18,642 | 145,780 |
|
Shares
| Value ($) |
| |
Unilever NV (CVA) | 7,417 | 230,934 |
| 3,467,500 |
Household Products 0.5% |
Church & Dwight Co., Inc. (a) | 8,968 | 618,971 |
Colgate-Palmolive Co. (a) | 7,750 | 622,868 |
Reckitt Benckiser Group PLC | 4,598 | 252,698 |
| 1,494,537 |
Personal Products 0.1% |
Kao Corp. | 12,622 | 339,919 |
Tobacco 1.1% |
Altria Group, Inc. | 55,285 | 1,361,117 |
British American Tobacco PLC | 11,332 | 435,244 |
ITC Ltd. | 41,615 | 162,867 |
Philip Morris International, Inc. | 23,311 | 1,364,393 |
| 3,323,621 |
Energy 7.5% |
Energy Equipment & Services 2.3% |
AMEC PLC | 11,344 | 203,394 |
Cameron International Corp.* | 1,614 | 81,878 |
Compagnie Generale de Geophysique-Veritas* | 5,847 | 177,949 |
Complete Production Services, Inc.* (a) | 3,289 | 97,190 |
Dresser-Rand Group, Inc.* | 2,152 | 91,654 |
Ensco PLC (ADR) | 20,744 | 1,107,315 |
John Wood Group PLC | 10,565 | 92,078 |
Lamprell PLC | 17,323 | 86,832 |
National Oilwell Varco, Inc. | 17,589 | 1,182,860 |
Noble Corp. | 29,144 | 1,042,481 |
ProSafe SE | 9,053 | 72,039 |
Saipem SpA | 7,538 | 371,390 |
SBM Offshore NV | 5,980 | 133,970 |
Schlumberger Ltd. | 14,350 | 1,198,225 |
Technip SA | 1,788 | 165,101 |
Tecnicas Reunidas SA | 1,121 | 71,372 |
Transocean Ltd.* | 13,310 | 925,178 |
| 7,100,906 |
Oil, Gas & Consumable Fuels 5.2% |
Alpha Natural Resources, Inc.* | 22,852 | 1,371,806 |
Anadarko Petroleum Corp. | 15,650 | 1,191,904 |
Canadian Natural Resources Ltd. | 21,451 | 952,853 |
Chevron Corp. | 16,064 | 1,465,840 |
ConocoPhillips | 16,454 | 1,120,517 |
EOG Resources, Inc. (a) | 7,880 | 720,311 |
Exxon Mobil Corp. | 34,248 | 2,504,214 |
Marathon Oil Corp. | 38,003 | 1,407,251 |
Nexen, Inc. | 32,026 | 733,395 |
Northern Oil & Gas, Inc.* | 4,213 | 114,636 |
Occidental Petroleum Corp. | 11,760 | 1,153,656 |
Royal Dutch Shell PLC "A" | 29,694 | 990,038 |
Suncor Energy, Inc. | 39,678 | 1,519,271 |
Total SA | 8,254 | 437,332 |
Ultra Petroleum Corp.* (a) | 2,332 | 111,400 |
Woodside Petroleum Ltd. | 7,131 | 310,415 |
| 16,104,839 |
Financials 6.2% |
Capital Markets 1.2% |
Affiliated Managers Group, Inc.* (a) | 897 | 89,000 |
Ashmore Group PLC | 26,439 | 138,132 |
Charles Schwab Corp. | 31,680 | 542,045 |
ICAP PLC | 7,881 | 65,737 |
|
Shares
| Value ($) |
| |
Jefferies Group, Inc. (a) | 4,571 | 121,726 |
Lazard Ltd. "A" | 1,564 | 61,762 |
Morgan Stanley | 29,250 | 795,893 |
Partners Group Holding AG | 697 | 132,280 |
T. Rowe Price Group, Inc. (a) | 24,010 | 1,549,605 |
UOB-Kay Hian Holdings Ltd. | 47,752 | 65,860 |
Waddell & Reed Financial, Inc. "A" | 2,242 | 79,120 |
| 3,641,160 |
Commercial Banks 1.5% |
Australia & New Zealand Banking Group Ltd. | 14,418 | 344,336 |
Banco Santander Brasil SA (Units) | 15,650 | 212,915 |
BNP Paribas | 3,655 | 232,536 |
BOC Hong Kong (Holdings) Ltd. | 49,954 | 170,952 |
China Construction Bank Corp. "H" | 159,312 | 143,473 |
Dah Sing Banking Group Ltd. | 44,966 | 76,594 |
DnB NOR ASA | 20,326 | 285,260 |
HSBC Holdings PLC | 67,067 | 680,817 |
Huntington Bancshares, Inc. | 9,478 | 65,114 |
Industrial & Commercial Bank of China Ltd. "H" | 215,754 | 160,161 |
Lloyds Banking Group PLC* | 111,900 | 114,622 |
National Australia Bank Ltd. | 13,395 | 324,700 |
Oversea-Chinese Banking Corp., Ltd. | 39,230 | 302,016 |
Prosperity Bancshares, Inc. | 1,972 | 77,460 |
Sberbank of Russia | 104,751 | 356,889 |
Societe Generale | 4,008 | 215,414 |
Sumitomo Mitsui Financial Group, Inc. | 11,221 | 399,412 |
Swedbank AB "A"* | 12,540 | 174,858 |
UniCredit SpA | 111,097 | 229,761 |
Wing Hang Bank Ltd. | 6,818 | 94,295 |
Zions Bancorp. | 2,784 | 67,456 |
| 4,729,041 |
Consumer Finance 0.0% |
Kiatnakin Bank PCL | 81,536 | 105,487 |
Magma Fincorp Ltd. | 26,821 | 43,037 |
| 148,524 |
Diversified Financial Services 0.7% |
Hellenic Exchanges SA | 3,394 | 22,223 |
Hong Kong Exchanges & Clearing Ltd. | 18,685 | 423,807 |
ING Groep NV (CVA)* | 26,371 | 256,544 |
JPMorgan Chase & Co. | 28,724 | 1,218,472 |
Remgro Ltd. | 10,456 | 179,280 |
| 2,100,326 |
Insurance 2.7% |
AIA Group Ltd.* | 53,108 | 149,291 |
Allianz SE (Registered) | 1,595 | 189,534 |
Assurant, Inc. | 24,273 | 934,996 |
Fidelity National Financial, Inc. "A" | 47,478 | 649,499 |
HCC Insurance Holdings, Inc. | 23,434 | 678,180 |
Legal & General Group PLC | 160,135 | 241,552 |
Lincoln National Corp. | 42,889 | 1,192,743 |
MetLife, Inc. | 40,898 | 1,817,507 |
PartnerRe Ltd. | 16,288 | 1,308,741 |
Prudential Financial, Inc. | 18,587 | 1,091,243 |
Sampo Oyj "A" | 4,685 | 125,593 |
| 8,378,879 |
Real Estate Management & Development 0.1% |
K Wah International Holdings Ltd. | 164,519 | 61,593 |
Kenedix, Inc.* | 296 | 90,010 |
|
Shares
| Value ($) |
| |
Midland Holdings Ltd. | 84,184 | 69,099 |
| 220,702 |
Health Care 5.9% |
Biotechnology 1.0% |
Amgen, Inc.* (a) | 8,780 | 482,022 |
Celgene Corp.* (a) | 29,060 | 1,718,608 |
Gilead Sciences, Inc.* | 21,560 | 781,334 |
Metabolix, Inc.* | 3,675 | 44,725 |
Onyx Pharmaceuticals, Inc.* | 1,809 | 66,698 |
| 3,093,387 |
Health Care Equipment & Supplies 1.2% |
Accuray, Inc.* | 9,933 | 67,048 |
Baxter International, Inc. | 23,015 | 1,165,019 |
Becton, Dickinson & Co. | 10,498 | 887,291 |
Edwards Lifesciences Corp.* (a) | 8,107 | 655,370 |
NxStage Medical, Inc.* (a) | 6,901 | 171,697 |
Thoratec Corp.* (a) | 21,871 | 619,387 |
| 3,565,812 |
Health Care Providers & Services 1.6% |
Diagnosticos da America SA | 6,593 | 89,303 |
ExamWorks Group, Inc.* (a) | 2,193 | 40,527 |
Express Scripts, Inc.* | 26,630 | 1,439,351 |
Fleury SA | 6,502 | 104,390 |
Fresenius Medical Care AG & Co. KGaA | 5,826 | 336,649 |
McKesson Corp. | 31,628 | 2,225,979 |
WellPoint, Inc.* | 12,296 | 699,151 |
| 4,935,350 |
Health Care Technology 0.1% |
M3, Inc. | 13 | 65,298 |
SXC Health Solutions Corp.* | 1,972 | 84,520 |
| 149,818 |
Life Sciences Tools & Services 0.3% |
ICON PLC (ADR)* (a) | 3,675 | 80,483 |
Life Technologies Corp.* | 2,421 | 134,365 |
QIAGEN NV* | 5,288 | 103,430 |
Thermo Fisher Scientific, Inc.* | 13,189 | 730,143 |
| 1,048,421 |
Pharmaceuticals 1.7% |
AstraZeneca PLC | 6,342 | 288,922 |
Flamel Technologies SA (ADR)* | 12,637 | 86,437 |
GlaxoSmithKline PLC | 24,837 | 480,169 |
Johnson & Johnson | 10,584 | 654,620 |
Merck & Co., Inc. | 34,630 | 1,248,065 |
Novartis AG (Registered) | 2,607 | 153,408 |
Novo Nordisk AS "B" | 2,077 | 233,777 |
Questcor Pharmaceuticals, Inc.* (a) | 9,198 | 135,487 |
Sanofi-Aventis | 5,066 | 323,930 |
Takeda Pharmaceutical Co., Ltd. | 6,568 | 323,029 |
Teva Pharmaceutical Industries Ltd. (ADR) | 24,006 | 1,251,433 |
VIVUS, Inc.* | 6,883 | 64,494 |
| 5,243,771 |
Industrials 6.8% |
Aerospace & Defense 1.5% |
BE Aerospace, Inc.* (a) | 3,317 | 122,829 |
Northrop Grumman Corp. | 13,614 | 881,915 |
Raytheon Co. | 18,216 | 844,129 |
TransDigm Group, Inc.* | 9,920 | 714,339 |
United Technologies Corp. | 25,213 | 1,984,767 |
| 4,547,979 |
|
Shares
| Value ($) |
| |
Airlines 0.2% |
Cebu Air, Inc.* | 20,540 | 53,167 |
Deutsche Lufthansa AG (Registered)* | 6,877 | 150,297 |
Ryanair Holdings PLC (ADR) (a) | 3,317 | 102,031 |
Singapore Airlines Ltd. | 12,701 | 153,597 |
| 459,092 |
Building Products 0.0% |
Congoleum Corp.* | 190,000 | 0 |
Commercial Services & Supplies 0.4% |
Babcock International Group PLC | 14,308 | 127,377 |
EnerNOC, Inc.* (a) | 2,242 | 53,606 |
Quad Graphics, Inc.* | 38 | 1,568 |
Serco Group PLC | 9,554 | 82,745 |
Stericycle, Inc.* (a) | 9,985 | 807,986 |
| 1,073,282 |
Construction & Engineering 0.1% |
Aecom Technology Corp.* (a) | 3,764 | 105,279 |
Chicago Bridge & Iron Co. NV (NY Registered Shares)* | 4,034 | 132,718 |
Larsen & Toubro Ltd. | 3,461 | 153,100 |
Shui On Construction & Materials Ltd. | 51,981 | 60,188 |
| 451,285 |
Electrical Equipment 1.1% |
AMETEK, Inc. | 41,550 | 1,630,837 |
Nidec Corp. | 1,189 | 119,892 |
Prysmian SpA | 3,522 | 59,979 |
Roper Industries, Inc. | 16,430 | 1,255,745 |
Schneider Electric SA | 2,285 | 341,986 |
| 3,408,439 |
Industrial Conglomerates 0.3% |
Keppel Corp., Ltd. | 40,631 | 358,393 |
Koninklijke Philips Electronics NV | 6,436 | 197,122 |
Siemens AG (Registered) | 4,029 | 498,809 |
| 1,054,324 |
Machinery 2.2% |
Altra Holdings, Inc.* | 2,203 | 43,752 |
Amtek Engineering Ltd.* | 153,000 | 128,757 |
Atlas Copco AB "A" | 6,736 | 170,101 |
Austal Ltd. | 25,202 | 89,960 |
Charter International PLC | 5,747 | 75,668 |
Dover Corp. | 20,402 | 1,192,497 |
EVA Precision Industrial Holdings Ltd. | 203,716 | 198,925 |
FANUC Corp. | 3,719 | 570,518 |
Joy Global, Inc. (a) | 1,704 | 147,822 |
Komatsu Ltd. | 10,589 | 320,095 |
Kubota Corp. | 17,198 | 162,727 |
MAN SE | 1,187 | 141,130 |
Mitsubishi Heavy Industries Ltd. | 82,257 | 308,800 |
Navistar International Corp.* | 19,427 | 1,125,018 |
Parker Hannifin Corp. | 17,890 | 1,543,907 |
Rational AG | 628 | 138,630 |
Rotork PLC | 3,646 | 103,912 |
Volvo AB "B"* | 16,451 | 293,202 |
| 6,755,421 |
Marine 0.2% |
A P Moller-Maersk AS "B" | 41 | 371,375 |
Mitsui O.S.K Lines Ltd. | 53,383 | 363,893 |
| 735,268 |
|
Shares
| Value ($) |
| |
Professional Services 0.1% |
Brunel International NV | 1,947 | 76,726 |
FTI Consulting, Inc.* (a) | 2,959 | 110,312 |
Michael Page International PLC | 15,237 | 131,846 |
| 318,884 |
Road & Rail 0.5% |
Norfolk Southern Corp. | 23,040 | 1,447,373 |
Trading Companies & Distributors 0.2% |
MISUMI Group, Inc. | 5,468 | 136,127 |
Mitsubishi Corp. | 13,913 | 376,244 |
| 512,371 |
Transportation Infrastructure 0.0% |
Koninklijke Vopak NV | 2,580 | 121,875 |
Information Technology 9.5% |
Communications Equipment 1.4% |
Brocade Communications Systems, Inc.* | 79,295 | 419,470 |
Cisco Systems, Inc.* | 131,841 | 2,667,143 |
Harris Corp. | 1,882 | 85,255 |
QUALCOMM, Inc. | 23,840 | 1,179,842 |
Sycamore Networks, Inc. | 2,510 | 51,681 |
| 4,403,391 |
Computers & Peripherals 2.3% |
Apple, Inc.* | 11,670 | 3,764,275 |
EMC Corp.* | 58,340 | 1,335,986 |
Hewlett-Packard Co. | 43,023 | 1,811,268 |
Toshiba Corp. | 33,506 | 182,379 |
| 7,093,908 |
Electronic Equipment, Instruments & Components 0.2% |
E Ink Holdings, Inc.* | 60,785 | 123,210 |
Itron, Inc.* (a) | 2,242 | 124,319 |
Kingboard Chemical Holdings Ltd. | 21,062 | 126,137 |
Venture Corp., Ltd. | 15,763 | 113,738 |
| 487,404 |
Internet Software & Services 0.8% |
Akamai Technologies, Inc.* | 15,750 | 741,037 |
Google, Inc. "A"* | 2,405 | 1,428,498 |
Internet Initiative Japan, Inc. | 33 | 93,684 |
Meetic | 1,741 | 37,806 |
NIC, Inc. (a) | 7,597 | 73,767 |
United Internet AG (Registered) | 6,095 | 99,058 |
| 2,473,850 |
IT Services 1.1% |
Accenture PLC "A" | 10,410 | 504,781 |
Automatic Data Processing, Inc. | 16,098 | 745,015 |
Cardtronics, Inc.* | 5,647 | 99,952 |
Digital Garage, Inc.* | 51 | 126,472 |
FleetCor Technologies, Inc.* | 715 | 22,108 |
iGATE Corp. (a) | 4,253 | 83,827 |
Infosys Technologies Ltd. | 2,314 | 177,766 |
International Business Machines Corp. | 5,490 | 805,712 |
Telvent GIT SA* | 2,540 | 67,107 |
VeriFone Systems, Inc.* (a) | 12,117 | 467,232 |
Visa, Inc. "A" | 3,410 | 239,996 |
| 3,339,968 |
Office Electronics 0.2% |
Canon, Inc. | 14,117 | 723,703 |
Semiconductors & Semiconductor Equipment 0.9% |
ARM Holdings PLC | 22,115 | 145,951 |
FSI International, Inc.* (a) | 15,326 | 67,741 |
|
Shares
| Value ($) |
| |
Intel Corp. | 103,992 | 2,186,952 |
Lam Research Corp.* | 1,614 | 83,573 |
Taiwan Semiconductor Manufacturing Co., Ltd. | 113,397 | 276,137 |
| 2,760,354 |
Software 2.6% |
Adobe Systems, Inc.* | 11,180 | 344,120 |
Check Point Software Technologies Ltd.* (a) | 13,600 | 629,136 |
Concur Technologies, Inc.* (a) | 16,820 | 873,463 |
Microsoft Corp. | 104,984 | 2,931,153 |
Norkom Group PLC* | 27,634 | 55,391 |
Oracle Corp. | 62,100 | 1,943,730 |
Rovi Corp.* | 1,794 | 111,246 |
SAP AG | 3,208 | 163,352 |
Solera Holdings, Inc. | 15,360 | 788,275 |
TiVo, Inc.* (a) | 6,079 | 52,462 |
VanceInfo Technologies, Inc. (ADR)* (a) | 2,733 | 94,398 |
| 7,986,726 |
Materials 3.7% |
Chemicals 1.7% |
Air Liquide SA | 1,039 | 131,400 |
Air Products & Chemicals, Inc. | 14,167 | 1,288,489 |
BASF SE | 5,441 | 434,059 |
Givaudan SA (Registered) | 154 | 166,280 |
Huntsman Corp. | 40,830 | 637,356 |
Johnson Matthey PLC | 2,531 | 80,421 |
Linde AG | 1,046 | 158,770 |
Praxair, Inc. | 9,802 | 935,797 |
Shin-Etsu Chemical Co., Ltd. | 8,359 | 452,531 |
STR Holdings, Inc.* (a) | 3,154 | 63,080 |
The Mosaic Co. | 10,956 | 836,600 |
| 5,184,783 |
Construction Materials 0.1% |
China National Building Material Co., Ltd. "H" | 67,409 | 154,369 |
Containers & Packaging 0.7% |
Owens-Illinois, Inc.* (a) | 33,630 | 1,032,441 |
Sonoco Products Co. | 32,657 | 1,099,561 |
| 2,132,002 |
Metals & Mining 1.2% |
BHP Billiton Ltd. | 14,175 | 656,043 |
Cliffs Natural Resources, Inc. | 1,498 | 116,859 |
Freeport-McMoRan Copper & Gold, Inc. | 14,190 | 1,704,077 |
Lynas Corp., Ltd.* | 94,986 | 200,132 |
Newcrest Mining Ltd. | 2,950 | 122,018 |
Northam Platinum Ltd. | 8,616 | 59,249 |
Randgold Resources Ltd. (ADR) (a) | 987 | 81,260 |
Rio Tinto PLC | 4,144 | 289,869 |
Thompson Creek Metals Co., Inc.* | 5,468 | 80,489 |
ThyssenKrupp AG | 2,303 | 95,413 |
Xstrata PLC | 16,059 | 376,941 |
| 3,782,350 |
Paper & Forest Products 0.0% |
Schweitzer-Mauduit International, Inc. | 1,921 | 120,870 |
Telecommunication Services 2.7% |
Diversified Telecommunication Services 1.7% |
AT&T, Inc. | 51,276 | 1,506,489 |
BCE, Inc. | 9,410 | 333,678 |
|
Shares
| Value ($) |
| |
CenturyLink, Inc. (a) | 40,575 | 1,873,348 |
Koninklijke (Royal) KPN NV | 11,647 | 169,958 |
Telefonica SA | 17,556 | 398,715 |
TeliaSonera AB | 8,744 | 69,325 |
Verizon Communications, Inc. | 26,558 | 950,245 |
| 5,301,758 |
Wireless Telecommunication Services 1.0% |
America Movil SAB de CV "L" | 79,231 | 227,107 |
American Tower Corp. "A"* | 14,480 | 747,747 |
NTT DoCoMo, Inc. | 288 | 502,859 |
Vodafone Group PLC | 251,183 | 649,305 |
Vodafone Group PLC (ADR) | 37,055 | 979,364 |
| 3,106,382 |
Utilities 2.3% |
Electric Utilities 1.8% |
Allegheny Energy, Inc. | 31,296 | 758,615 |
American Electric Power Co., Inc. | 23,442 | 843,443 |
Duke Energy Corp. | 40,980 | 729,854 |
Entergy Corp. | 11,165 | 790,817 |
Exelon Corp. | 9,736 | 405,407 |
FirstEnergy Corp. | 20,855 | 772,052 |
Fortum Oyj | 4,424 | 134,214 |
HongKong Electric Holdings Ltd. | 43,475 | 274,068 |
Southern Co. | 20,943 | 800,651 |
| 5,509,121 |
Multi-Utilities 0.5% |
GDF Suez | 7,057 | 253,202 |
PG&E Corp. | 27,726 | 1,326,412 |
| 1,579,614 |
Total Common Stocks (Cost $139,202,524) | 173,727,402 |
|
Preferred Stocks 0.4% |
Consumer Discretionary 0.1% |
Volkswagen AG | 1,540 | 249,552 |
Energy 0.1% |
Petroleo Brasileiro SA | 10,118 | 170,853 |
Ultrapar Participacoes SA | 2,650 | 169,443 |
| 340,296 |
Financials 0.0% |
Itau Unibanco Holding SA | 6,520 | 156,438 |
Information Technology 0.1% |
Samsung Electronics Co., Ltd. | 460 | 262,973 |
Materials 0.1% |
Vale SA "A" | 5,766 | 168,488 |
Total Preferred Stocks (Cost $1,140,028) | 1,177,747 |
|
Warrants 0.0% |
Consumer Discretionary 0.0% |
Reader's Digest Association, Inc., Expiration Date 2/19/2014* | 80 | 2 |
Information Technology 0.0% |
Kingboard Chemical Holdings Ltd., Expiration Date 10/31/2012* | 3,400 | 3,609 |
Materials 0.0% |
Hercules Trust II, Expiration Date 3/31/2029* | 170 | 1,934 |
Total Warrants (Cost $30,284) | 5,545 |
| Principal Amount ($) (b) | Value ($) |
| |
Corporate Bonds 6.8% |
Consumer Discretionary 1.2% |
AMC Entertainment, Inc.: |
| 8.0%, 3/1/2014 | | 35,000 | 35,350 |
| 8.75%, 6/1/2019 | | 35,000 | 37,362 |
Ameristar Casinos, Inc., 9.25%, 6/1/2014 | | 25,000 | 26,750 |
Asbury Automotive Group, Inc., 7.625%, 3/15/2017 | | 35,000 | 35,350 |
Avis Budget Car Rental LLC, 144A, 8.25%, 1/15/2019 | | 15,000 | 15,150 |
CanWest MediaWorks LP, 144A, 9.25%, 8/1/2015** | | 25,000 | 4,250 |
Carrols Corp., 9.0%, 1/15/2013 | | 15,000 | 15,038 |
CBS Corp., 5.9%, 10/15/2040 | | 270,000 | 260,085 |
DineEquity, Inc., 144A, 9.5%, 10/30/2018 | | 10,000 | 10,600 |
DIRECTV Holdings LLC: |
| 6.0%, 8/15/2040 | | 530,000 | 532,083 |
| 6.35%, 3/15/2040 | | 51,000 | 53,650 |
DISH DBS Corp.: |
| 6.625%, 10/1/2014 | | 40,000 | 41,500 |
| 7.125%, 2/1/2016 | | 35,000 | 36,138 |
Expedia, Inc., 7.456%, 8/15/2018 | | 550,000 | 627,000 |
Fontainebleau Las Vegas Holdings LLC, 144A, 11.0%, 6/15/2015** | | 25,000 | 88 |
Goodyear Tire & Rubber Co., 10.5%, 5/15/2016 | | 10,000 | 11,400 |
Great Canadian Gaming Corp., 144A, 7.25%, 2/15/2015 | | 30,000 | 30,675 |
Home Depot, Inc.: |
| 5.4%, 9/15/2040 | | 125,000 | 121,390 |
| 5.875%, 12/16/2036 | | 50,000 | 52,007 |
Lowe's Companies, Inc., 3.75%, 4/15/2021 | | 200,000 | 193,362 |
Mediacom Broadband LLC, 8.5%, 10/15/2015 | | 20,000 | 20,100 |
NBC Universal, Inc., 144A, 5.95%, 4/1/2041 | | 247,000 | 246,975 |
Norcraft Holdings LP, 9.75%, 9/1/2012 | | 36,000 | 36,225 |
Penske Automotive Group, Inc., 7.75%, 12/15/2016 | | 50,000 | 51,000 |
Sabre Holdings Corp., 8.35%, 3/15/2016 | | 25,000 | 24,000 |
Sears Holdings Corp., 144A, 6.625%, 10/15/2018 | | 10,000 | 9,325 |
TCI Communications, Inc., 8.75%, 8/1/2015 | | 135,000 | 166,170 |
Time Warner, Inc.: |
| 5.875%, 11/15/2016 | | 147,000 | 165,921 |
| 6.2%, 3/15/2040 | | 175,000 | 186,034 |
| 7.625%, 4/15/2031 | | 175,000 | 212,745 |
Travelport LLC, 4.921%***, 9/1/2014 | | 20,000 | 17,700 |
Unitymedia Hessen GmbH & Co., KG, 144A, 8.125%, 12/1/2017 | | 100,000 | 104,500 |
Vertis, Inc., 13.5%, 4/1/2014 (PIK)** | | 42,609 | 1,278 |
Young Broadcasting, Inc., 8.75%, 1/15/2014** | | 130,000 | 1 |
| Principal Amount ($) (b) | Value ($) |
| |
Yum! Brands, Inc.: |
| 3.875%, 11/1/2020 (a) | | 210,000 | 200,610 |
| 5.3%, 9/15/2019 | | 65,000 | 68,846 |
| 3,650,658 |
Consumer Staples 0.7% |
Anheuser-Busch InBev Worldwide, Inc., 144A, 7.75%, 1/15/2019 | | 500,000 | 622,174 |
CVS Caremark Corp.: |
| 6.125%, 9/15/2039 | | 275,000 | 293,826 |
| 6.25%, 6/1/2027 | | 300,000 | 329,912 |
General Nutrition Centers, Inc., 5.75%***, 3/15/2014 (PIK) | | 15,000 | 14,850 |
Kraft Foods, Inc., 5.375%, 2/10/2020 | | 600,000 | 645,761 |
Kroger Co., 5.4%, 7/15/2040 | | 110,000 | 104,260 |
North Atlantic Trading Co., 144A, 10.0%, 3/1/2012 | | 108,750 | 102,225 |
SUPERVALU, Inc., 8.0%, 5/1/2016 | | 10,000 | 9,575 |
| 2,122,583 |
Energy 0.9% |
Belden & Blake Corp., 8.75%, 7/15/2012 | | 130,000 | 124,150 |
BreitBurn Energy Partners LP, 144A, 8.625%, 10/15/2020 | | 10,000 | 10,050 |
Bristow Group, Inc., 7.5%, 9/15/2017 | | 30,000 | 31,650 |
Chaparral Energy, Inc., 8.5%, 12/1/2015 | | 40,000 | 40,700 |
DCP Midstream LLC, 144A, 9.75%, 3/15/2019 | | 200,000 | 258,464 |
El Paso Corp., 7.25%, 6/1/2018 | | 20,000 | 21,410 |
Enterprise Products Operating LLC, 6.125%, 10/15/2039 | | 230,000 | 239,386 |
Kinder Morgan Energy Partners LP: | |
| 6.5%, 9/1/2039 | | 50,000 | 51,652 |
| 7.3%, 8/15/2033 | | 360,000 | 400,717 |
Linn Energy LLC, 11.75%, 5/15/2017 | | 35,000 | 40,075 |
Newfield Exploration Co., 7.125%, 5/15/2018 | | 40,000 | 42,100 |
ONEOK Partners LP, 6.15%, 10/1/2016 | | 201,000 | 225,896 |
OPTI Canada, Inc., 7.875%, 12/15/2014 | | 10,000 | 7,063 |
Petrohawk Energy Corp., 7.875%, 6/1/2015 | | 15,000 | 15,619 |
Plains All American Pipeline LP, 8.75%, 5/1/2019 | | 600,000 | 744,597 |
Plains Exploration & Production Co., 7.0%, 3/15/2017 | | 15,000 | 15,412 |
Stone Energy Corp., 6.75%, 12/15/2014 | | 25,000 | 24,375 |
Weatherford International Ltd., 5.125%, 9/15/2020 | | 300,000 | 298,510 |
Williams Partners LP, 4.125%, 11/15/2020 | | 253,000 | 239,639 |
| 2,831,465 |
| Principal Amount ($) (b) | Value ($) |
| |
Financials 2.2% |
Algoma Acquisition Corp., 144A, 9.875%, 6/15/2015 | | 20,000 | 18,000 |
Ally Financial, Inc., 144A, 7.5%, 9/15/2020 | | 60,000 | 62,925 |
American Express Co., 7.0%, 3/19/2018 | | 390,000 | 454,261 |
Ashton Woods USA LLC, 144A, Step-up Coupon, 0% to 6/30/2012, 11.0% to 6/30/2015 | | 36,400 | 20,202 |
Bank of America Corp., Series L, 7.625%, 6/1/2019 | | 410,000 | 472,088 |
Calpine Construction Finance Co., LP, 144A, 8.0%, 6/1/2016 | | 30,000 | 31,875 |
CIT Group, Inc., 7.0%, 5/1/2015 | | 65,355 | 65,518 |
Citigroup, Inc., 5.375%, 8/9/2020 (a) | | 500,000 | 519,504 |
Fifth Third Bancorp., 5.45%, 1/15/2017 | | 429,000 | 438,508 |
Ford Motor Credit Co., LLC, 9.875%, 8/10/2011 | | 60,000 | 62,456 |
General Electric Capital Corp., Series A, 5.25%, 10/19/2012 | | 550,000 | 587,831 |
Hartford Financial Services Group, Inc., 5.95%, 10/15/2036 | | 150,000 | 141,515 |
iPayment, Inc., 9.75%, 5/15/2014 | | 25,000 | 23,500 |
JPMorgan Chase & Co., 2.6%, 1/15/2016 | | 700,000 | 679,190 |
KeyBank NA, 5.7%, 11/1/2017 | | 250,000 | 254,588 |
Lincoln National Corp., 8.75%, 7/1/2019 | | 190,000 | 237,661 |
MetLife, Inc.: |
| 6.75%, 6/1/2016 | | 113,000 | 131,076 |
| 7.717%, 2/15/2019 | | 250,000 | 306,933 |
Morgan Stanley: |
| 3.45%, 11/2/2015 | | 45,000 | 43,873 |
| Series F, 6.625%, 4/1/2018 | | 225,000 | 244,073 |
Navios Maritime Acquisition Corp., 144A, 8.625%, 11/1/2017 | | 10,000 | 10,225 |
Nielsen Finance LLC, 144A, 7.75%, 10/15/2018 | | 10,000 | 10,350 |
PNC Bank NA, 6.875%, 4/1/2018 | | 300,000 | 342,918 |
Prudential Financial, Inc.: |
| Series B, 5.1%, 9/20/2014 | | 100,000 | 107,417 |
| 6.2%, 1/15/2015 | | 100,000 | 110,281 |
| 7.375%, 6/15/2019 | | 30,000 | 35,371 |
Rainbow National Services LLC, 144A, 10.375%, 9/1/2014 | | 4,000 | 4,150 |
Reynolds Group Issuer, Inc., 144A, 9.0%, 4/15/2019 | | 100,000 | 103,625 |
Santander US Debt SA Unipersonal, 144A, 2.991%, 10/7/2013 | | 500,000 | 485,735 |
The Goldman Sachs Group, Inc., 6.15%, 4/1/2018 | | 400,000 | 440,477 |
Travelers Companies, Inc., 5.35%, 11/1/2040 | | 120,000 | 118,231 |
| Principal Amount ($) (b) | Value ($) |
| |
Tropicana Entertainment LLC, 9.625%, 12/15/2014** | | 75,000 | 38 |
UCI Holdco, Inc., 9.25%***, 12/15/2013 (PIK) | | 42,024 | 41,919 |
WMG Acquisition Corp., 9.5%, 6/15/2016 | | 20,000 | 21,450 |
| 6,627,764 |
Health Care 0.5% |
DaVita, Inc.: |
| 6.375%, 11/1/2018 | | 10,000 | 9,950 |
| 6.625%, 11/1/2020 | | 10,000 | 9,900 |
Express Scripts, Inc.: |
| 6.25%, 6/15/2014 | | 250,000 | 279,490 |
| 7.25%, 6/15/2019 | | 320,000 | 378,759 |
HCA, Inc.: |
| 8.5%, 4/15/2019 | | 10,000 | 10,950 |
| 9.125%, 11/15/2014 | | 35,000 | 36,706 |
| 9.625%, 11/15/2016 (PIK) | | 42,000 | 44,993 |
IASIS Healthcare LLC, 8.75%, 6/15/2014 | | 30,000 | 30,788 |
Laboratory Corp. of America Holdings, 4.625%, 11/15/2020 | | 180,000 | 178,376 |
Medco Health Solutions, Inc., 7.125%, 3/15/2018 | | 425,000 | 498,736 |
The Cooper Companies, Inc., 7.125%, 2/15/2015 | | 45,000 | 46,350 |
| 1,524,998 |
Industrials 0.2% |
Actuant Corp., 6.875%, 6/15/2017 | | 20,000 | 20,450 |
ARAMARK Corp., 8.5%, 2/1/2015 | | 10,000 | 10,450 |
BE Aerospace, Inc., 8.5%, 7/1/2018 | | 50,000 | 54,750 |
Belden, Inc., 7.0%, 3/15/2017 | | 25,000 | 25,312 |
Cenveo Corp., 144A, 10.5%, 8/15/2016 | | 10,000 | 9,825 |
Congoleum Corp., 9.0%, 12/31/2017 (PIK) | | 62,700 | 43,225 |
Corrections Corp. of America, 7.75%, 6/1/2017 | | 10,000 | 10,613 |
CSX Corp.: |
| 6.15%, 5/1/2037 | | 150,000 | 161,274 |
| 6.25%, 3/15/2018 | | 190,000 | 217,961 |
Great Lakes Dredge & Dock Co., 7.75%, 12/15/2013 | | 20,000 | 20,175 |
K. Hovnanian Enterprises, Inc., 8.875%, 4/1/2012 | | 25,000 | 24,500 |
Kansas City Southern de Mexico SA de CV, 7.375%, 6/1/2014 | | 20,000 | 20,900 |
Navios Maritime Holdings, Inc., 9.5%, 12/15/2014 | | 35,000 | 36,400 |
Owens Corning, Inc., 9.0%, 6/15/2019 | | 10,000 | 11,732 |
United Rentals North America, Inc., 10.875%, 6/15/2016 | | 35,000 | 39,987 |
| 707,554 |
Information Technology 0.2% |
Alcatel-Lucent USA, Inc., 6.45%, 3/15/2029 | | 30,000 | 23,700 |
eBay, Inc., 1.625%, 10/15/2015 | | 500,000 | 479,763 |
| Principal Amount ($) (b) | Value ($) |
| |
MasTec, Inc., 7.625%, 2/1/2017 | | 35,000 | 34,825 |
SunGard Data Systems, Inc., 10.25%, 8/15/2015 | | 70,000 | 73,588 |
Vangent, Inc., 9.625%, 2/15/2015 | | 15,000 | 13,575 |
| 625,451 |
Materials 0.3% |
Appleton Papers, Inc., 144A, 11.25%, 12/15/2015 | | 15,000 | 12,000 |
CPG International I, Inc., 10.5%, 7/1/2013 | | 50,000 | 51,000 |
Crown Americas LLC, 7.625%, 5/15/2017 | | 10,000 | 10,750 |
Domtar Corp., 10.75%, 6/1/2017 | | 20,000 | 25,200 |
Dow Chemical Co., 4.25%, 11/15/2020 | | 185,000 | 177,211 |
Exopack Holding Corp., 11.25%, 2/1/2014 | | 80,000 | 83,000 |
GEO Specialty Chemicals, Inc.: |
| 144A, 7.5%, 3/31/2015 (PIK) | | 209,283 | 179,983 |
| 10.0%, 3/31/2015 | | 206,080 | 187,533 |
Georgia-Pacific LLC, 144A, 7.125%, 1/15/2017 | | 15,000 | 15,975 |
Graphic Packaging International, Inc., 9.5%, 6/15/2017 | | 30,000 | 32,738 |
Millar Western Forest Products Ltd., 7.75%, 11/15/2013 | | 15,000 | 14,213 |
NewMarket Corp., 7.125%, 12/15/2016 | | 65,000 | 66,462 |
Owens-Brockway Glass Container, Inc., 7.375%, 5/15/2016 | | 10,000 | 10,625 |
Radnor Holdings Corp., 11.0%, 3/15/2010** | | 40,000 | 4 |
Silgan Holdings, Inc., 7.25%, 8/15/2016 | | 20,000 | 21,300 |
Wolverine Tube, Inc., 15.0%, 3/31/2012 (PIK)** | | 43,120 | 23,285 |
| 911,279 |
Telecommunication Services 0.4% |
American Tower Corp.: |
| 5.05%, 9/1/2020 | | 350,000 | 344,202 |
| 7.25%, 5/15/2019 | | 175,000 | 197,756 |
AT&T Mobility LLC, 6.5%, 12/15/2011 | | 275,000 | 290,207 |
Cincinnati Bell, Inc., 8.375%, 10/15/2020 | | 20,000 | 19,200 |
Cricket Communications, Inc., 10.0%, 7/15/2015 | | 50,000 | 53,563 |
ERC Ireland Preferred Equity Ltd., 144A, 8.05%***, 2/15/2017 (PIK) | EUR | 108,497 | 13,007 |
Intelsat Corp., 9.25%, 6/15/2016 | | 110,000 | 118,800 |
Intelsat Subsidiary Holding Co. SA, 8.875%, 1/15/2015 | | 60,000 | 61,650 |
iPCS, Inc., 2.412%***, 5/1/2013 | | 10,000 | 9,625 |
Telesat Canada, 11.0%, 11/1/2015 | | 70,000 | 78,575 |
West Corp., 144A, 8.625%, 10/1/2018 | | 10,000 | 10,600 |
| Principal Amount ($) (b) | Value ($) |
| |
Windstream Corp.: |
| 7.0%, 3/15/2019 | | 25,000 | 24,625 |
| 8.625%, 8/1/2016 | | 10,000 | 10,525 |
| 1,232,335 |
Utilities 0.2% |
AES Corp.: |
| 8.0%, 10/15/2017 | | 35,000 | 37,013 |
| 8.0%, 6/1/2020 | | 30,000 | 31,800 |
DTE Energy Co., 7.625%, 5/15/2014 | | 81,000 | 93,362 |
FirstEnergy Solutions Corp., 6.8%, 8/15/2039 | | 234,000 | 226,793 |
Mirant North America LLC, 7.375%, 12/31/2013 | | 20,000 | 20,377 |
NRG Energy, Inc.: |
| 7.375%, 2/1/2016 | | 50,000 | 51,250 |
| 7.375%, 1/15/2017 | | 60,000 | 61,800 |
Sempra Energy, 6.5%, 6/1/2016 | | 135,000 | 156,723 |
| 679,118 |
Total Corporate Bonds (Cost $20,453,751) | 20,913,205 |
|
Asset-Backed 0.3% |
Automobile Receivables 0.1% |
Ford Credit Auto Owner Trust, "B", Series 2007-B, 5.69%, 11/15/2012 | 379,000 | 395,663 |
Credit Card Receivables 0.2% |
Citibank Omni Master Trust, "A8", Series 2009-A8, 144A, 2.36%***, 5/16/2016 | 500,000 | 506,197 |
Total Asset-Backed (Cost $885,529) | 901,860 |
|
Mortgage-Backed Securities Pass-Throughs 7.4% |
Federal Home Loan Mortgage Corp.: | |
| 4.0%, 8/1/2039 | | 1,732,457 | 1,723,050 |
| 6.0%, 3/1/2038 | | 38,000 | 41,082 |
Federal National Mortgage Association: | |
| 3.274%***, 8/1/2037 | | 166,007 | 173,882 |
| 3.5%, 7/1/2025 (c) | | 3,350,000 | 3,374,078 |
| 4.0%, with various maturities from 5/1/2039 until 9/1/2040 (c) | | 4,964,684 | 4,943,524 |
| 4.5%, 9/1/2035 | | 50,883 | 52,447 |
| 5.5%, with various maturities from 4/1/2035 until 4/1/2038 (c) | | 5,785,220 | 6,198,399 |
| 6.0%, with various maturities from 1/1/2024 until 8/1/2037 (c) | | 3,091,323 | 3,370,800 |
| 6.5%, with various maturities from 5/1/2017 until 1/1/2038 (c) | | 553,536 | 614,569 |
| 8.0%, 9/1/2015 | | 68,510 | 74,278 |
| Principal Amount ($) (b) | Value ($) |
| |
Government National Mortgage Association: | |
| 4.5%, 7/1/2039 (c) | | 750,000 | 778,770 |
| 5.0%, 5/1/2038 (c) | | 750,000 | 797,402 |
| 5.5%, 5/1/2036 (c) | | 750,000 | 810,527 |
Total Mortgage-Backed Securities Pass-Throughs (Cost $22,807,624) | 22,952,808 |
|
Commercial Mortgage-Backed Securities 1.8% |
Banc of America Commercial Mortgage, Inc., "A4", Series 2007-4, 5.742%***, 2/10/2051 | | 750,000 | 798,887 |
Bear Stearns Commercial Mortgage Securities, Inc., "A4", Series 2007-PW18, 5.7%, 6/13/2050 | | 862,000 | 898,150 |
Greenwich Capital Commercial Funding Corp., "A4", Series 2006-GG7, 5.883%***, 7/10/2038 | | 425,000 | 463,674 |
JPMorgan Chase Commercial Mortgage Securities Corp.: | |
| "A4", Series 2006-LDP7, 5.872%***, 4/15/2045 | | 315,000 | 344,487 |
| "A4", Series 2007-LD12, 5.882%, 2/15/2051 | | 625,000 | 661,722 |
LB-UBS Commercial Mortgage Trust: | |
| "A2", Series 2005-C2, 4.821%, 4/15/2030 | | 17,711 | 17,718 |
| "A4", Series 2006-C1, 5.156%, 2/15/2031 | | 1,250,000 | 1,335,222 |
| "A3", Series 2006-C7, 5.347%, 11/15/2038 | | 700,000 | 740,082 |
| "A4", Series 2007-C6, 5.858%, 7/15/2040 | | 300,000 | 315,201 |
Total Commercial Mortgage-Backed Securities (Cost $5,188,170) | 5,575,143 |
|
Collateralized Mortgage Obligations 0.3% |
FDIC Structured Sale Guaranteed Notes, "1A", Series 2010-S1, 144A, 0.811%***, 2/25/2048 | | 582,444 | 583,358 |
Federal Home Loan Mortgage Corp., "H", Series 2278, 6.5%, 1/15/2031 | | 5,440 | 5,956 |
NCUA Guaranteed Notes, "1A", Series 2010-R1, 0.715%***, 10/7/2020 | | 388,217 | 387,732 |
Total Collateralized Mortgage Obligations (Cost $977,260) | 977,046 |
|
Government & Agency Obligations 9.4% |
Sovereign Bonds 2.6% |
Federal Republic of Germany — Inflation Linked Note, 2.25%, 4/15/2013 | EUR | 214,842 | 304,764 |
Government of Canada — Inflation Linked Bond, 4.0%, 12/1/2031 | CAD | 269,751 | 419,738 |
| Principal Amount ($) (b) | Value ($) |
| |
Government of France — Inflation Linked Bonds: | |
| 1.0%, 7/25/2017 | EUR | 242,906 | 331,908 |
| 2.25%, 7/25/2020 | EUR | 510,081 | 736,840 |
| 3.15%, 7/25/2032 | EUR | 543,526 | 917,436 |
Government of Japan — Inflation Linked Bond, Series 9, 1.1%, 9/10/2016 | JPY | 41,664,000 | 515,989 |
Government of Sweden, Series 3105, 3.5%, 12/1/2015 | SEK | 2,650,000 | 533,164 |
Republic of Italy — Inflation Linked Bond, 2.1%, 9/15/2017 | EUR | 152,842 | 199,267 |
Republic of Poland, 6.375%, 7/15/2019 | | 100,000 | 112,021 |
State of Qatar, 144A, 6.4%, 1/20/2040 | | 100,000 | 108,500 |
United Kingdom Treasury — Inflation Linked Bonds: | |
| 1.125%, 11/22/2037 | GBP | 413,068 | 729,668 |
| 1.875%, 11/22/2022 | GBP | 532,462 | 947,438 |
| 2.0%, 1/26/2035 | GBP | 225,000 | 591,574 |
| 2.5%, 8/16/2013 | GBP | 120,000 | 521,807 |
| 2.5%, 7/26/2016 | GBP | 112,000 | 547,516 |
| 2.5%, 4/16/2020 | GBP | 91,000 | 453,099 |
| 7,970,729 |
US Treasury Obligations 6.8% |
US Treasury Bill, 0.185%****, 3/17/2011 (d) | | 188,000 | 187,958 |
US Treasury Bonds: |
| 4.75%, 2/15/2037 | | 1,500,000 | 1,612,032 |
| 5.375%, 2/15/2031 | | 1,500,000 | 1,751,016 |
US Treasury Inflation-Indexed Bonds: | |
| 2.375%, 1/15/2025 | | 794,754 | 884,412 |
| 3.625%, 4/15/2028 | | 845,113 | 1,090,921 |
| 3.875%, 4/15/2029 | | 159,643 | 214,109 |
US Treasury Inflation-Indexed Notes: | |
| 1.875%, 7/15/2015 | | 185,523 | 200,973 |
| 2.375%, 1/15/2017 | | 732,031 | 815,757 |
| 2.5%, 7/15/2016 | | 481,908 | 540,867 |
| 3.375%, 1/15/2012 | | 538,244 | 562,676 |
US Treasury Notes: |
| 1.75%, 1/31/2014 | | 8,000,000 | 8,167,504 |
| 3.125%, 5/15/2019 | | 500,000 | 505,273 |
| 3.625%, 2/15/2020 | | 2,750,000 | 2,853,983 |
| 4.5%, 11/15/2015 | | 1,500,000 | 1,679,413 |
| 21,066,894 |
Total Government & Agency Obligations (Cost $27,802,685) | 29,037,623 |
|
Loan Participations and Assignments 0.0% |
Senior Loans*** |
Hawker Beechcraft Acquisition Co., LLC: |
| Term Loan, 2.261%, 3/26/2014 | | 22,288 | 19,602 |
| Letter of Credit, 2.289%, 3/26/2014 | | 1,336 | 1,175 |
IASIS Healthcare LLC, Term Loan, 5.538%, 6/13/2014 (PIK) | | 91,366 | 88,145 |
Total Loan Participations and Assignments (Cost $113,854) | 108,922 |
| Principal Amount ($) (b) | Value ($) |
| |
Municipal Bonds and Notes 0.5% |
California, University Revenues, Build America Bonds, 5.946%, 5/15/2045 | 125,000 | 116,633 |
Chicago, IL, Transit Authority, Sales Tax Receipts Revenue, Build America Bonds, Series B, 6.2%, 12/1/2040 (e) | 185,000 | 170,342 |
Kentucky, Asset/Liability Commission, General Fund Revenue, 3.165%, 4/1/2018 | 500,000 | 488,680 |
Louisville & Jefferson County, KY, Metropolitan Sewer District & Drain System, Build America Bonds, 6.25%, 5/15/2043 | 150,000 | 151,029 |
Pennsylvania, State General Obligation, First Series, 5.25%, 2/1/2014, INS: NATL | 240,000 | 269,162 |
Virginia, College Building Authority, Educational Facilities Revenue, 21st Century College, Series B, 5.0%, 2/1/2014 | 365,000 | 405,895 |
Total Municipal Bonds and Notes (Cost $1,639,001) | 1,601,741 |
|
Preferred Securities 0.1% |
Financials 0.1% |
Farm Credit Bank of Texas, Series 1, 7.561%, 12/15/2013 (f) | 218,000 | 225,035 |
Materials 0.0% |
Hercules, Inc., 6.5%, 6/30/2029 | 40,000 | 31,000 |
Total Preferred Securities (Cost $244,655) | 256,035 |
|
Units
| Value ($) |
| |
Other Investments 0.0% |
Consumer Discretionary |
AOT Bedding Super Holdings LLC* (Cost $2,000) | 2 | 2,000 |
|
Shares
| Value ($) |
| |
Exchange-Traded Funds 12.7% |
iShares JPMorgan USD Emerging Markets Bond Fund | 41,986 | 4,495,861 |
iShares Russell 2000 Value Index Fund | 90,940 | 6,464,925 |
SPDR Barclays Capital International Treasury Bond | 79,818 | 4,666,160 |
Vanguard Emerging Markets Fund | 198,166 | 9,541,693 |
Vanguard Total Bond Market Fund | 172,600 | 13,854,602 |
Total Exchange-Traded Funds (Cost $33,133,216) | 39,023,241 |
|
Securities Lending Collateral 6.8% |
Daily Assets Fund Institutional, 0.27% (g) (h) (Cost $20,930,886) | 20,930,886 | 20,930,886 |
|
Cash Equivalents 6.4% |
Central Cash Management Fund, 0.19% (g) (Cost $19,630,591) | 19,630,591 | 19,630,591 |
| % of Net Assets | Value ($) |
| |
Total Investment Portfolio (Cost $294,182,058)+ | 109.3 | 336,821,795 |
Other Assets and Liabilities, Net | (9.3) | (28,549,600) |
Net Assets | 100.0 | 308,272,195 |
* Non-income producing security.
** Non-income producing security. Issuer has defaulted on the payment of principal or the interest or has filed for bankruptcy. The following table represents bonds that are in default:
Security | Coupon | Maturity Date | Principal Amount ($) | Acquisition Cost ($) | Value ($) |
CanWest MediaWorks LP | 9.25% | 8/1/2015 | 25,000 | USD | 25,000 | 4,250 |
Fontainebleau Las Vegas Holdings LLC | 11.0% | 6/15/2015 | 25,000 | USD | 25,000 | 88 |
Radnor Holdings Corp. | 11.0% | 3/15/2010 | 40,000 | USD | 25,775 | 4 |
Tropicana Entertainment LLC | 9.625% | 12/15/2014 | 75,000 | USD | 55,245 | 38 |
Vertis, Inc. | 13.5% | 4/1/2014 | 42,609 | USD | 17,309 | 1,278 |
Wolverine Tube, Inc. | 15.0% | 3/31/2012 | 43,120 | USD | 43,120 | 23,285 |
Young Broadcasting, Inc. | 8.75% | 1/15/2014 | 130,000 | USD | 111,175 | 1 |
| | | | 302,624 | 28,944 |
*** These securities are shown at their current rate as of December 31, 2010. Floating rate securities' yields vary with a designated market index or market rate, such as the coupon-equivalent of the US Treasury bill rate.
**** Annualized yield at time of purchase; not a coupon rate.
+ The cost for federal income tax purposes was $297,261,185. At December 31, 2010, net unrealized appreciation for all securities based on tax cost was $39,560,610. This consisted of aggregate gross unrealized appreciation for all securities in which there was an excess of value over tax cost of $46,622,458 and aggregate gross unrealized depreciation for all securities in which there was an excess of tax cost over value of $7,061,848.
(a) All or a portion of these securities were on loan (see Notes to Financial Statements). The value of all securities loaned at December 31, 2010 amounted to $20,273,579, which is 6.6% of net assets.
(b) Principal amount stated in US dollars unless otherwise noted.
(c) When-issued or delayed delivery security included.
(d) At December 31, 2010, this security has been pledged, in whole or in part, to cover initial margin requirements for open futures contracts.
(e) Taxable issue.
(f) Date shown is call date; not a maturity date for the perpetual preferred securities.
(g) Affiliated fund managed by Deutsche Investment Management Americas Inc. The rate shown is the annualized seven-day yield at period end.
(h) Represents collateral held in connection with securities lending. Income earned by the Fund is net of borrower rebates.
144A: Security exempt from registration under Rule 144A of the Securities Act of 1933. These securities may be resold in transactions exempt from registration, normally to qualified institutional buyers.
ADR: American Depositary Receipt
CVA: Certificaten Van Aandelen
FDIC: Federal Deposit Insurance Corp.
INS: Insured
NATL: National Public Finance Guarantee Corp.
PIK: Denotes that all or a portion of the income is paid in-kind.
SPDR: Standard & Poor's Depositary Receipt
Included in the portfolio are investments in mortgage or asset-backed securities which are interests in separate pools of mortgages or assets. Effective maturities of these investments may be shorter than stated maturities due to prepayments. Some separate investments in the Federal National Mortgage Association issues which have similar coupon rates have been aggregated for presentation purposes in this investment portfolio.
At December 31, 2010, open futures contracts purchased were as follows:
Futures | Currency | Expiration Date | Contracts | Notional Value ($) | Unrealized Appreciation/
(Depreciation) ($) |
10 Year Australian Treasury Bond | AUD | 3/15/2011 | 135 | 14,263,722 | 106,442 |
10 Year US Treasury Note | USD | 3/22/2011 | 190 | 22,883,125 | (619,876) |
2 Year US Treasury Note | USD | 3/31/2011 | 296 | 64,796,250 | 46,626 |
DAX Index | EUR | 3/18/2011 | 5 | 1,157,069 | (21,631) |
Federal Republic of Germany Euro-Schatz | EUR | 3/8/2011 | 19 | 2,767,604 | (3,082) |
FTSE 100 Index | GBP | 3/18/2011 | 23 | 2,113,187 | 20,440 |
Hang Seng Index | HKD | 1/28/2011 | 2 | 296,161 | 3,975 |
IBEX 35 Index | EUR | 1/21/2011 | 3 | 392,511 | (10,011) |
S&P 500 E-Mini Index | USD | 3/18/2011 | 22 | 1,378,300 | 18,810 |
TOPIX Index | JPY | 3/11/2011 | 13 | 1,434,659 | 27,109 |
United Kingdom Long Gilt Bond | GBP | 3/29/2011 | 39 | 7,265,574 | (20,286) |
Total net unrealized depreciation | (451,484) |
At December 31, 2010, open futures contracts sold were as follows:
Futures | Currency | Expiration Date | Contracts | Notional Value ($) | Unrealized Appreciation/
(Depreciation) ($) |
10 Year Canadian Government Bond | CAD | 3/22/2011 | 75 | 9,244,695 | (38,137) |
10 Year Japanese Government Bond | JPY | 3/10/2011 | 25 | 43,296,588 | (185,124) |
10 Year US Treasury Note | USD | 3/22/2011 | 46 | 5,540,125 | 141,906 |
30 Year US Treasury Bond | USD | 3/22/2011 | 20 | 2,442,500 | 100,625 |
AEX Index | EUR | 1/21/2011 | 8 | 758,591 | (6,200) |
ASX SPI 200 Index | AUD | 3/17/2011 | 10 | 1,209,461 | 11,251 |
CAC 40 Index | EUR | 1/21/2011 | 11 | 559,970 | 13,450 |
DJ Euro Stoxx 50 Index | EUR | 3/18/2011 | 43 | 1,605,457 | 40,797 |
Federal Republic of Germany Euro-Bund | EUR | 3/8/2011 | 170 | 28,466,796 | 184,919 |
FTSE MIB Index | EUR | 3/18/2011 | 7 | 944,998 | 25,958 |
Russell 2000 E-Mini Index | USD | 3/18/2011 | 4 | 312,920 | (3,460) |
S&P TSE 60 Index | CAD | 3/17/2011 | 3 | 462,899 | (7,640) |
Ultra Long-Term US Treasury Bond | USD | 3/22/2011 | 5 | 635,469 | 17,461 |
Total net unrealized appreciation | 295,806 |
As of December 31, 2010, the Fund had the following open forward foreign currency exchange contracts:
Contracts to Deliver | | In Exchange For | | Settlement Date | | Unrealized Appreciation ($) | Counterparty |
USD | 2,039,377 | | JPY | 171,066,000 | | 1/25/2011 | | 68,229 | UBS AG |
USD | 6,964,033 | | CAD | 7,014,000 | | 1/25/2011 | | 86,748 | UBS AG |
USD | 5,657,268 | | SEK | 38,571,000 | | 1/25/2011 | | 72,772 | UBS AG |
USD | 13,515,110 | | AUD | 13,690,000 | | 1/25/2011 | | 439,420 | UBS AG |
USD | 5,303,999 | | NOK | 31,449,000 | | 1/25/2011 | | 78,876 | UBS AG |
GBP | 3,926,000 | | USD | 6,134,120 | | 1/25/2011 | | 14,340 | UBS AG |
Total unrealized appreciation | | | | 760,385 |
Contracts to Deliver | | In Exchange For | | Settlement Date | | Unrealized Depreciation ($) | Counterparty |
EUR | 8,600 | | USD | 11,386 | | 1/20/2011 | | (105) | JPMorgan Chase Securities, Inc. |
EUR | 681,000 | | USD | 908,241 | | 1/25/2011 | | (1,740) | UBS AG |
CHF | 9,665,000 | | USD | 10,065,140 | | 1/25/2011 | | (275,076) | UBS AG |
NZD | 11,904,000 | | USD | 8,855,028 | | 1/25/2011 | | (400,816) | UBS AG |
Total unrealized depreciation | | | | (677,737) |
Currency Abbreviations |
AUD Australian Dollar CAD Canadian Dollar CHF Swiss Franc EUR Euro GBP British Pound HKD Hong Kong Dollar JPY Japanese Yen NOK Norwegian Krone NZD New Zealand Dollar SEK Swedish Krona USD United States Dollar |
For information on the Fund's policy and additional disclosures regarding futures contracts and forward foreign currency exchange contracts, please refer to Note B in the accompanying Notes to Financial Statements.
Fair Value Measurements
Various inputs are used in determining the value of the Fund's investments. These inputs are summarized in three broad levels. Level 1 includes quoted prices in active markets for identical securities. Level 2 includes other significant observable inputs (including quoted prices for similar securities, interest rates, prepayment speeds, and credit risk). Level 3 includes significant unobservable inputs (including the Fund's own assumptions in determining the fair value of investments). The inputs or methodology used for valuing securities are not necessarily an indication of the risk associated with investing in those securities.
The following is a summary of the inputs used as of December 31, 2010 in valuing the Fund's investments. For information on the Fund's policy regarding the valuation of investments, please refer to the Security Valuation section of Note A in the accompanying Notes to Financial Statements.
Assets | Level 1 | Level 2 | Level 3 | Total |
|
Common Stocks and/or Other Equity Investments (i) Consumer Discretionary | $ 16,158,616 | $ 4,334,308 | $ 39 | $ 20,492,963 |
Consumer Staples | 11,285,599 | 4,711,312 | — | 15,996,911 |
Energy | 20,434,131 | 3,111,910 | — | 23,546,041 |
Financials | 12,709,915 | 6,665,155 | — | 19,375,070 |
Health Care | 15,727,947 | 2,308,612 | — | 18,036,559 |
Industrials | 14,248,430 | 6,637,163 | 0 | 20,885,593 |
Information Technology | 26,824,520 | 2,711,366 | — | 29,535,886 |
Materials | 8,165,367 | 3,377,495 | 1,934 | 11,544,796 |
Telecommunication Services | 6,617,978 | 1,790,162 | — | 8,408,140 |
Utilities | 6,427,251 | 661,484 | — | 7,088,735 |
Fixed Income Investments (i) Corporate Bonds | — | 20,498,209 | 414,996 | 20,913,205 |
Asset Backed | — | 901,860 | — | 901,860 |
Mortgage-Backed Securities Pass-Throughs | — | 22,952,808 | — | 22,952,808 |
Commercial Mortgage-Backed Securities | — | 5,575,143 | — | 5,575,143 |
Collateralized Mortgage Obligations | — | 977,046 | — | 977,046 |
Government & Agency Obligations | — | 28,849,665 | — | 28,849,665 |
Loan Participations and Assignments | — | 108,922 | — | 108,922 |
Municipal Bonds and Notes | — | 1,601,741 | — | 1,601,741 |
Preferred Securities | — | 256,035 | — | 256,035 |
Other Investments | — | — | 2,000 | 2,000 |
Exchange-Traded Funds | 39,023,241 | — | — | 39,023,241 |
Short-Term Investments (i) | 40,561,477 | 187,958 | — | 40,749,435 |
Derivatives (j) | — | 760,385 | — | 760,385 |
Total | $ 218,184,472 | $ 118,978,739 | $ 418,969 | $ 337,582,180 |
Liabilities | | | | |
Derivatives (j) | $ (155,678) | $ (677,737) | $ — | $ (833,415) |
Total | $ (155,678) | $ (677,737) | $ — | $ (833,415) |
There have been no significant transfers between Level 1 and Level 2 fair value measurements during the year ended December 31, 2010.
(i) See Investment Portfolio for additional detailed categorizations.
(j) Derivatives include unrealized appreciation (depreciation) on open futures contracts and forward foreign currency exchange contracts.
Level 3 Reconciliation
The following is a reconciliation of the Fund's Level 3 investments for which significant unobservable inputs were used in determining value:
| Common Stocks and/or Other Equity Investments | Corporate Bonds | Other Investments | Total |
Consumer Discretionary | Industrials | Financials | Materials |
Balance as of December 31, 2009 | $ 0 | $ — | $ 278,682 | $ 0 | $ 383,110 | $ — | $ 661,792 |
Realized gains (loss) | (8,344) | — | 107,337 | — | — | — | 98,993 |
Change in unrealized appreciation (depreciation) | 8,342 | 0 | (37,791) | 1,934 | 33,279 | — | 5,764 |
Amortization premium/discount | — | — | — | — | 5,349 | — | 5,349 |
Net purchases (sales) | 41 | — | (348,228) | — | — | 2,000 | (346,187) |
Transfers into Level 3 | — | — | — | — | 4,178 (k) | — | 4,178 |
Transfers (out) of Level 3 | — | — | — | — | (10,920) (l) | — | (10,920) |
Balance as of December 31, 2010 | $ 39 | $ 0 | $ — | $ 1,934 | $ 414,996 | $ 2,000 | $ 418,969 |
Net change in unrealized appreciation (depreciation) from investments still held as of December 31, 2010 | $ (2) | $ 0 | $ — | $ 1,934 | $ 33,279 | $ — | $ 35,211 |
Transfers between price levels are recognized at the beginning of the reporting period.
(k) The investment was transferred from Level 2 to Level 3 because of the lack of observable market data due to a decrease in market activity.
(l) The investment was transferred from Level 3 to Level 2 as a result of the availability of a pricing source supported by observable inputs.
The accompanying notes are an integral part of the financial statements.
Statement of Assets and Liabilities
as of December 31, 2010 |
Assets |
Investments: Investments in unaffiliated securities, at value (cost $253,620,581) — including $20,273,579 of securities loaned | $ 296,260,318 |
Investment in Daily Assets Fund Institutional (cost $20,930,886)* | 20,930,886 |
Investment in Central Cash Management Fund (cost $19,630,591) | 19,630,591 |
Total investments, at value (cost $294,182,058) | 336,821,795 |
Cash | 131,748 |
Foreign currency, at value (cost $192,052) | 209,917 |
Deposits with broker for open futures contracts | 5,279,599 |
Receivable for investments sold | 3,698 |
Receivable for Fund shares sold | 2,493 |
Dividends receivable | 249,181 |
Interest receivable | 712,583 |
Unrealized appreciation on open forward foreign currency exchange contracts | 760,385 |
Foreign taxes recoverable | 53,154 |
Other assets | 1,722 |
Total assets | 344,226,275 |
Liabilities |
Payable upon return of securities loaned | 20,930,886 |
Payable for investments purchased | 203,348 |
Payable for when-issued and delayed delivery securities purchased | 13,171,613 |
Payable for Fund shares redeemed | 160,169 |
Payable for variation margin on open futures contracts | 467,763 |
Unrealized depreciation on open forward foreign currency exchange contracts | 677,737 |
Accrued management fee | 106,819 |
Deferred foreign taxes payable | 5,598 |
Other accrued expenses and payables | 230,147 |
Total liabilities | 35,954,080 |
Net assets, at value | $ 308,272,195 |
Net Assets Consist of |
Undistributed net investment income | 4,323,414 |
Net unrealized appreciation (depreciation) on: Investments (net of deferred foreign taxes of $5,598) | 42,634,139 |
Futures | (155,678) |
Foreign currency | 80,115 |
Accumulated net realized gain (loss) | (54,154,043) |
Paid-in capital | 315,544,248 |
Net assets, at value | $ 308,272,195 |
Class A Net Asset Value, offering and redemption price per share ($308,272,195 ÷ 13,930,205 outstanding shares of beneficial interest, no par value, unlimited number of shares authorized) | $ 22.13 |
* Represents collateral on securities loaned.
The accompanying notes are an integral part of the financial statements.
Statement of Operations
for the year ended December 31, 2010 |
Investment Income |
Income: Dividends (net of foreign taxes withheld of $105,864) | $ 4,481,983 |
Interest | 3,237,650 |
Income distributions — Central Cash Management Fund | 63,397 |
Securities lending income, including income from Daily Assets Fund Institutional, net of borrower rebates | 49,944 |
Total income | 7,832,974 |
Expenses: Management fee | 1,124,396 |
Administration fee | 307,796 |
Services to shareholders | 5,088 |
Custodian fee | 287,824 |
Professional fees | 99,564 |
Trustees' fees and expenses | 12,524 |
Reports to shareholders | 62,119 |
Other | 116,154 |
Total expenses | 2,015,465 |
Net investment income (loss) | 5,817,509 |
Realized and Unrealized Gain (Loss) |
Net realized gain (loss) from: Investments (net of deferred foreign taxes of $325) | 19,036,432 |
Futures | (325,572) |
Foreign currency | (47,856) |
| 18,663,004 |
Change in net unrealized appreciation (depreciation) on: Investments (net of deferred foreign taxes of $5,598) | 7,992,264 |
Futures | 94,474 |
Foreign currency | (135,693) |
| 7,951,045 |
Net gain (loss) | 26,614,049 |
Net increase (decrease) in net assets resulting from operations | $ 32,431,558 |
The accompanying notes are an integral part of the financial statements.
Statement of Changes in Net Assets
Increase (Decrease) in Net Assets | Years Ended December 31, |
2010 | 2009 |
Operations: Net investment income (loss) | $ 5,817,509 | $ 7,279,172 |
Net realized gain (loss) | 18,663,004 | (21,287,397) |
Change in net unrealized appreciation (depreciation) | 7,951,045 | 77,797,202 |
Net increase (decrease) in net assets resulting from operations | 32,431,558 | 63,788,977 |
Distributions to shareholders from: Net investment income: Class A | (9,827,154) | (11,680,702) |
Total distributions | (9,827,154) | (11,680,702) |
Fund share transactions: Class A Proceeds from shares sold | 4,966,734 | 6,740,726 |
Shares issued to shareholders in reinvestment of distributions | 9,827,154 | 11,680,702 |
Payments for shares redeemed | (48,195,061) | (58,626,337) |
Shares converted* | — | 39,887 |
Net increase (decrease) in net assets from Class A share transactions | (33,401,173) | (40,165,022) |
Class B Payments for shares redeemed | — | (307) |
Shares converted* | — | (39,887) |
Net increase (decrease) in net assets from Class B share transactions | — | (40,194) |
Increase (decrease) in net assets | (10,796,769) | 11,903,059 |
Net assets at beginning of period | 319,068,964 | 307,165,905 |
Net assets at end of period (including undistributed net investment income of $4,323,414 and $9,339,818, respectively) | $ 308,272,195 | $ 319,068,964 |
Other Information |
Class A Shares outstanding at beginning of period | 15,551,177 | 17,697,143 |
Shares sold | 238,427 | 369,933 |
Shares issued to shareholders in reinvestment of distributions | 467,070 | 740,222 |
Shares redeemed | (2,326,469) | (3,258,791) |
Shares converted* | — | 2,670 |
Net increase (decrease) in Class A shares | (1,620,972) | (2,145,966) |
Shares outstanding at end of period | 13,930,205 | 15,551,177 |
Class B Shares outstanding at beginning of period | — | 2,694 |
Shares redeemed | — | (19) |
Shares converted* | — | (2,675) |
Net increase (decrease) in Class B shares | — | (2,694) |
Shares outstanding at end of period | — | — |
* On March 6, 2009, Class B shares converted into Class A shares.
The accompanying notes are an integral part of the financial statements.
Financial Highlights
Class A Years Ended December 31, | 2010 | 2009 | 2008 | 2007 | 2006 |
Selected Per Share Data |
Net asset value, beginning of period | $ 20.52 | $ 17.35 | $ 24.81 | $ 24.46 | $ 22.75 |
Income (loss) from investment operations: Net investment incomea | .39 | .44 | .61 | .74 | .69c |
Net realized and unrealized gain (loss) | 1.88 | 3.43 | (7.20) | .42 | 1.60 |
Total from investment operations | 2.27 | 3.87 | (6.59) | 1.16 | 2.29 |
Less distributions from: Net investment income | (.66) | (.70) | (.87) | (.81) | (.58) |
Net asset value, end of period | $ 22.13 | $ 20.52 | $ 17.35 | $ 24.81 | $ 24.46 |
Total Return (%) | 11.22 | 23.43 | (27.33)b | 4.84b | 10.24b,c |
Ratios to Average Net Assets and Supplemental Data |
Net assets, end of period ($ millions) | 308 | 319 | 307 | 528 | 600 |
Ratio of expenses before expense reductions (%) | .65 | .60 | .64 | .52 | .55 |
Ratio of expenses after expense reductions (%) | .65 | .60 | .62 | .51 | .51 |
Ratio of net investment income (%) | 1.89 | 2.40 | 2.83 | 3.00 | 2.99c |
Portfolio turnover rate (%) | 203 | 207 | 263 | 199 | 108 |
a Based on average shares outstanding during the period. b Total return would have been lower had certain expenses not been reduced. c Includes non-recurring income from the Advisor recorded as a result of an administrative proceeding regarding disclosure of brokerage allocation practices in connection with sales of DWS Funds. The non-recurring income resulted in an increase in net investment income of $0.024 per share and an increase in the ratio of net investment income of 0.10%. Excluding this non-recurring income, total return would have been 0.10% lower. |
Performance Summary December 31, 2010
DWS Blue Chip VIP
All performance shown is historical, assumes reinvestment of all dividend and capital gain distributions and does not guarantee future results. Investment return and principal value fluctuate with changing market conditions so that, when redeemed, shares may be worth more or less than their original cost. Current performance may be lower or higher than the performance data quoted. Please contact your participating insurance company for the Fund's most recent month-end performance. Performance doesn't reflect charges and fees ("contract charges") associated with the separate account that invests in the Fund or any variable life insurance policy or variable annuity contract for which the Fund is an investment option. These charges and fees will reduce returns. While all share classes have the same underlying portfolio, their performance will differ.
The gross expense ratios of the Fund, as stated in the fee table of the prospectus dated May 1, 2010 are 0.75% and 1.02% for Class A and Class B shares, respectively, and may differ from the expense ratios disclosed in the Financial Highlights tables in this report.
Risk Considerations
Any fund that focuses in a particular segment of the market will generally be more volatile than a fund that invests more broadly. Stocks may decline in value. See the prospectus for details.
Fund returns shown during the 3-year, 5-year and 10-year/Life of Class periods reflect a fee waiver and/or expense reimbursement. Without this waiver/reimbursement, returns would have been lower.
Growth of an Assumed $10,000 Investment in DWS Blue Chip VIP |
[] DWS Blue Chip VIP — Class A [] Russell 1000® Index | The Russell 1000® Index is an unmanaged index that measures the performance of the 1,000 largest companies in the Russell 3000® Index, which measures the performance of the 3,000 largest US companies based on total market capitalization. The Russell 1000 Index represents approximately 92% of the total market capitalization of the Russell 3000 Index. Index returns assume reinvestment of dividends and, unlike fund returns, do not reflect any fees or expenses. It is not possible to invest directly into an index. |
 | |
Yearly periods ended December 31 | |
Comparative Results |
DWS Blue Chip VIP | 1-Year | 3-Year | 5-Year | 10-Year |
Class A | Growth of $10,000 | $11,377 | $9,375 | $11,221 | $11,957 |
Average annual total return | 13.77% | -2.13% | 2.33% | 1.80% |
Russell 1000 Index | Growth of $10,000 | $11,610 | $9,305 | $11,364 | $11,986 |
Average annual total return | 16.10% | -2.37% | 2.59% | 1.83% |
DWS Blue Chip VIP | 1-Year | 3-Year | 5-Year | Life of Class* |
Class B | Growth of $10,000 | $11,355 | $9,323 | $11,077 | $16,186 |
Average annual total return | 13.55% | -2.31% | 2.07% | 5.83% |
Russell 1000 Index | Growth of $10,000 | $11,610 | $9,305 | $11,364 | $15,703 |
Average annual total return | 16.10% | -2.37% | 2.59% | 5.45% |
The growth of $10,000 is cumulative.
* The Fund commenced offering Class B shares on July 1, 2002. Index returns began on June 30, 2002.
Information About Your Fund's Expenses
DWS Blue Chip VIP
As an investor of the Fund, you incur two types of costs: ongoing expenses and transaction costs. Ongoing expenses include management fees, distribution and service (12b-1) fees and other Fund expenses. Examples of transaction costs include contract charges, redemption fees and account maintenance fees, which are not shown in this section. The following tables are intended to help you understand your ongoing expenses (in dollars) of investing in the Fund and to help you compare these expenses with the ongoing expenses of investing in other mutual funds. The example in the table is based on an investment of $1,000 invested at the beginning of the six-month period and held for the entire period (July 1, 2010 to December 31, 2010).
The tables illustrate your Fund's expenses in two ways:
• Actual Fund Return. This helps you estimate the actual dollar amount of ongoing expenses (but not transaction costs) paid on a $1,000 investment in the Fund using the Fund's actual return during the period. To estimate the expenses you paid over the period, simply divide your account value by $1,000 (for example, an $8,600 account value divided by $1,000 = 8.6), then multiply the result by the number in the "Expenses Paid per $1,000" line under the share class you hold.
• Hypothetical 5% Fund Return. This helps you to compare your Fund's ongoing expenses (but not transaction costs) with those of other mutual funds using the Fund's actual expense ratio and a hypothetical rate of return of 5% per year before expenses. Examples using a 5% hypothetical Fund return may be found in the shareholder reports of other mutual funds. The hypothetical account values and expenses may not be used to estimate the actual ending account balance or expenses you paid for the period.
Please note that the expenses shown in these tables are meant to highlight your ongoing expenses only and do not reflect any transaction costs. The "Expenses Paid per $1,000" line of the tables is useful in comparing ongoing expenses only and will not help you determine the relative total expense of owning different funds. If these transaction costs had been included, your costs would have been higher.
Expenses and Value of a $1,000 Investment for the six months ended December 31, 2010 |
Actual Fund Return | Class A | | Class B | |
Beginning Account Value 7/1/10 | $ 1,000.00 | | $ 1,000.00 | |
Ending Account Value 12/31/10 | $ 1,218.50 | | $ 1,216.40 | |
Expenses Paid per $1,000* | $ 4.14 | | $ 5.59 | |
Hypothetical 5% Fund Return | Class A | | Class B | |
Beginning Account Value 7/1/10 | $ 1,000.00 | | $ 1,000.00 | |
Ending Account Value 12/31/10 | $ 1,021.48 | | $ 1,020.16 | |
Expenses Paid per $1,000* | $ 3.77 | | $ 5.09 | |
* Expenses are equal to the Fund's annualized expense ratio for each share class, multiplied by the average account value over the period, multiplied by the number of days in the most recent six-month period, then divided by 365.
Annualized Expense Ratios | Class A | | Class B | |
DWS Variable Series II — DWS Blue Chip VIP | .74% | | 1.00% | |
For more information, please refer to the Fund's prospectus.
These tables do not reflect charges and fees ("contract charges") associated with the separate account that invests in the Fund or any variable life insurance policy or variable annuity contract for which the Fund is an investment option.
Management Summary December 31, 2010
DWS Blue Chip VIP
US equities performed very well during 2010, as investors were cheered by gradually improving economic data and surprisingly strong corporate profits. The Russell 1000® Index — the Fund's benchmark — gained 16.10% on the year, building on its 28.43% rally of 2009. The Class A shares of the Fund, while also producing a positive return of 13.77%, fell short of the benchmark.
Our approach to managing the Fund is disciplined and dynamic — disciplined in the sense that we use a quantitative approach that measures numerous factors related to growth, value, quality and market sentiment, and dynamic in that we can choose to give different weightings to these factors based on a rigorous analysis of the past that seeks to determine which periods are most like now. The past year was a highly rotational year for style performance, with leadership changing several times — from growth to market sentiment, then to quality and then back to market sentiment. The Fund's growth and market sentiment factors performed relatively well over the full year, whereas the value and quality factors were mostly weak. We started the year with healthy weightings to market sentiment and growth, which added value early in the year. However, our relatively large weighting toward value throughout the year more than offset this and proved to be the biggest drag on relative performance.
From a sector perspective, our stock selection process was least effective in the technology segment, where our overweight positions in Microsoft Corp., Computer Sciences Corp. and the disk-drive maker Western Digital Corp.* weighed on performance.1 The industrials sector was an additional area of underperformance, due in part to our overweights in Raytheon Co. and the truck manufacturer Oshkosh Corp. Our stock picks also fell short in the utilities and consumer staples sectors. On the plus side, we outperformed the benchmark by a wide margin in the energy sector. We generated strong performance by moving to overweight positions in stocks that plummeted sharply in the wake of the Gulf oil spill and then staged rebounds from undervalued levels, such as Transocean Ltd., Anadarko Petroleum Corp.* and National Oilwell Varco, Inc. We also performed very well within financials, thanks in part to our overweight positions in Berkshire Hathaway, Inc. and ACE Ltd.
Robert Wang
Russell Shtern, CFA
Portfolio Managers, QS Investors, LLC
Subadvisor to the Fund
The Russell 1000 Index is an unmanaged index that measures the performance of the 1,000 largest companies in the Russell 3000® Index which measures the performance of the 3,000 largest US companies based on total market capitalization. The Russell 1000 Index represents approximately 92% of the total market capitalization of the Russell 3000 Index.
Index returns assume reinvestment of dividends and, unlike fund returns, do not reflect any fees or expenses. It is not possible to invest directly into an index.
1 "Overweight" means the Fund holds a higher weighting in a given sector or security than the benchmark. "Underweight" means the Fund holds a lower weighting.
* Not held in the Fund as of December 31, 2010.
Portfolio Summary
DWS Blue Chip VIP
Asset Allocation (As a % of Investment Portfolio excluding Securities Lending Collateral) | 12/31/10 | 12/31/09 |
| | |
Common Stocks | 99% | 99% |
Cash Equivalents* | 1% | 1% |
| 100% | 100% |
Sector Diversification (As a % of Common Stocks) | 12/31/10 | 12/31/09 |
| | |
Information Technology | 19% | 19% |
Financials | 17% | 11% |
Health Care | 14% | 14% |
Industrials | 12% | 13% |
Energy | 11% | 9% |
Consumer Discretionary | 11% | 12% |
Consumer Staples | 7% | 11% |
Materials | 5% | 5% |
Telecommunication Services | 2% | 4% |
Utilities | 2% | 2% |
| 100% | 100% |
* In order to keep cash on hand to meet shareholder redemptions or other needs while maintaining exposure to the market, the Fund invests in futures contracts.
Asset allocation and sector diversification are subject to change.
For more complete details about the Fund's investment portfolio, see page 50.
Following the Fund's fiscal first and third quarter-end, a complete portfolio holdings listing is filed with the SEC on Form N-Q. The form will be available on the SEC's Web site at www.sec.gov, and it also may be reviewed and copied at the SEC's Public Reference Room in Washington, D.C. Information on the operation of the SEC's Public Reference Room may be obtained by calling (800) SEC-0330. The Fund's portfolio holdings are also posted on www.dws-investments.com from time to time. Please see the Fund's current prospectus for more information.
Investment Portfolio December 31, 2010
DWS Blue Chip VIP
|
Shares
| Value ($) |
| |
Common Stocks 98.8% |
Consumer Discretionary 10.4% |
Auto Components 0.1% |
Goodyear Tire & Rubber Co.* | 6,700 | 79,395 |
Diversified Consumer Services 0.5% |
Apollo Group, Inc. "A"* | 3,400 | 134,266 |
Career Education Corp.* (a) | 9,800 | 203,154 |
Coinstar, Inc.* | 1,700 | 95,948 |
DeVry, Inc. | 1,600 | 76,768 |
Sotheby's | 1,700 | 76,500 |
| 586,636 |
Hotels Restaurants & Leisure 1.0% |
Chipotle Mexican Grill, Inc.* (a) | 600 | 127,596 |
McDonald's Corp. | 3,600 | 276,336 |
Panera Bread Co. "A"* | 1,500 | 151,815 |
Starbucks Corp. | 16,200 | 520,506 |
| 1,076,253 |
Household Durables 0.2% |
Garmin Ltd. (a) | 6,700 | 207,633 |
Internet & Catalog Retail 1.0% |
Liberty Media Corp. — Interactive "A"* | 35,100 | 553,527 |
Priceline.com, Inc.* | 1,400 | 559,370 |
| 1,112,897 |
Media 2.8% |
CBS Corp. "B" | 9,100 | 173,355 |
Comcast Corp. "A" (a) | 54,500 | 1,197,365 |
Liberty Media-Starz "A"* | 1,900 | 126,312 |
McGraw-Hill Companies, Inc. | 4,700 | 171,127 |
News Corp. "A" | 9,800 | 142,688 |
Time Warner, Inc. | 21,233 | 683,066 |
Walt Disney Co. (a) | 13,900 | 521,389 |
| 3,015,302 |
Multiline Retail 0.8% |
Dillard's, Inc. "A" (a) | 17,500 | 663,950 |
Kohl's Corp.* | 4,600 | 249,964 |
| 913,914 |
Specialty Retail 2.6% |
Advance Auto Parts, Inc. | 7,600 | 502,740 |
American Eagle Outfitters, Inc. | 10,200 | 149,226 |
AnnTaylor Stores Corp.* | 2,900 | 79,431 |
Barnes & Noble, Inc. (a) | 8,400 | 118,860 |
Chico's FAS, Inc. | 6,200 | 74,586 |
Guess?, Inc. | 2,400 | 113,568 |
Rent-A-Center, Inc. | 3,900 | 125,892 |
Ross Stores, Inc. | 2,700 | 170,775 |
The Gap, Inc. | 39,300 | 870,102 |
TJX Companies, Inc. | 14,100 | 625,899 |
| 2,831,079 |
Textiles, Apparel & Luxury Goods 1.4% |
Coach, Inc. | 7,200 | 398,232 |
Deckers Outdoor Corp.* | 2,200 | 175,428 |
NIKE, Inc. "B" (a) | 4,600 | 392,932 |
VF Corp. | 6,000 | 517,080 |
| 1,483,672 |
|
Shares
| Value ($) |
| |
Consumer Staples 6.9% |
Beverages 0.2% |
Molson Coors Brewing Co. "B" | 4,300 | 215,817 |
Food & Staples Retailing 1.4% |
Wal-Mart Stores, Inc. | 26,700 | 1,439,931 |
Whole Foods Market, Inc.* (a) | 900 | 45,531 |
| 1,485,462 |
Food Products 2.7% |
Archer-Daniels-Midland Co. | 15,600 | 469,248 |
Corn Products International, Inc. | 4,800 | 220,800 |
Fresh Del Monte Produce, Inc. | 6,200 | 154,690 |
H.J. Heinz Co. | 6,000 | 296,760 |
Hormel Foods Corp. | 2,300 | 117,898 |
The Hershey Co. | 15,700 | 740,255 |
Tyson Foods, Inc. "A" (a) | 51,600 | 888,552 |
Unilever PLC (ADR) | 2,900 | 89,552 |
| 2,977,755 |
Household Products 0.6% |
Kimberly-Clark Corp. | 2,400 | 151,296 |
Procter & Gamble Co. | 7,900 | 508,207 |
| 659,503 |
Personal Products 0.4% |
Estee Lauder Companies, Inc. "A" | 1,200 | 96,840 |
Herbalife Ltd. | 5,600 | 382,872 |
| 479,712 |
Tobacco 1.6% |
Lorillard, Inc. | 8,900 | 730,334 |
Philip Morris International, Inc. | 16,400 | 959,892 |
| 1,690,226 |
Energy 11.2% |
Energy Equipment & Services 3.4% |
Complete Production Services, Inc.* | 11,100 | 328,005 |
Diamond Offshore Drilling, Inc. | 3,200 | 213,984 |
FMC Technologies, Inc.* | 1,300 | 115,583 |
Helmerich & Payne, Inc. | 2,000 | 96,960 |
Nabors Industries Ltd.* | 12,200 | 286,212 |
National Oilwell Varco, Inc. | 16,400 | 1,102,900 |
Noble Corp. (a) | 4,900 | 175,273 |
Oceaneering International, Inc.* (a) | 2,100 | 154,623 |
Oil States International, Inc.* | 10,800 | 692,172 |
Transocean Ltd.* (a) | 7,500 | 521,325 |
| 3,687,037 |
Oil, Gas & Consumable Fuels 7.8% |
Chevron Corp. | 13,000 | 1,186,250 |
Cimarex Energy Co. | 1,500 | 132,795 |
CNOOC Ltd. (ADR) | 400 | 95,348 |
Devon Energy Corp. | 13,100 | 1,028,481 |
Exxon Mobil Corp. | 30,000 | 2,193,600 |
Hess Corp. | 9,000 | 688,860 |
Murphy Oil Corp. | 10,300 | 767,865 |
Newfield Exploration Co.* | 2,800 | 201,908 |
Noble Energy, Inc. | 4,100 | 352,928 |
Occidental Petroleum Corp. | 6,700 | 657,270 |
Valero Energy Corp. | 48,700 | 1,125,944 |
| 8,431,249 |
|
Shares
| Value ($) |
| |
Financials 17.2% |
Capital Markets 1.8% |
Ameriprise Financial, Inc. | 2,900 | 166,895 |
BlackRock, Inc. | 1,900 | 362,102 |
Janus Capital Group, Inc. | 5,800 | 75,226 |
Legg Mason, Inc. | 4,800 | 174,096 |
State Street Corp. | 5,400 | 250,236 |
T. Rowe Price Group, Inc. (a) | 4,800 | 309,792 |
The Goldman Sachs Group, Inc. | 3,600 | 605,376 |
| 1,943,723 |
Commercial Banks 4.0% |
CIT Group, Inc.* | 8,800 | 414,480 |
Fifth Third Bancorp. (a) | 50,600 | 742,808 |
Huntington Bancshares, Inc. | 36,200 | 248,694 |
KeyCorp (a) | 45,600 | 403,560 |
M&T Bank Corp. (a) | 1,800 | 156,690 |
PNC Financial Services Group, Inc. | 9,900 | 601,128 |
SunTrust Banks, Inc. | 38,500 | 1,136,135 |
Wells Fargo & Co. | 22,100 | 684,879 |
| 4,388,374 |
Consumer Finance 2.4% |
Capital One Financial Corp. (a) | 40,900 | 1,740,704 |
Discover Financial Services | 46,200 | 856,086 |
| 2,596,790 |
Diversified Financial Services 2.7% |
Bank of America Corp. | 30,900 | 412,206 |
Citigroup, Inc.* | 75,300 | 356,169 |
CME Group, Inc. | 800 | 257,400 |
JPMorgan Chase & Co. | 38,700 | 1,641,654 |
PHH Corp.* | 7,500 | 173,625 |
The NASDAQ OMX Group, Inc.* (a) | 5,300 | 125,663 |
| 2,966,717 |
Insurance 5.8% |
ACE Ltd. | 21,900 | 1,363,275 |
Aflac, Inc. | 5,400 | 304,722 |
Allied World Assurance Co. Holdings Ltd. | 5,400 | 320,976 |
Arch Capital Group Ltd.* | 2,000 | 176,100 |
Aspen Insurance Holdings Ltd. | 4,200 | 120,204 |
Assurant, Inc. | 3,400 | 130,968 |
Axis Capital Holdings Ltd. | 3,200 | 114,816 |
Berkshire Hathaway, Inc. "A"* | 2 | 240,900 |
Berkshire Hathaway, Inc. "B"* | 2,240 | 179,446 |
Chubb Corp. | 16,300 | 972,132 |
Everest Re Group Ltd. | 2,000 | 169,640 |
Hartford Financial Services Group, Inc. | 10,100 | 267,549 |
Platinum Underwriters Holdings Ltd. | 2,400 | 107,928 |
The Travelers Companies, Inc. | 33,100 | 1,844,001 |
| 6,312,657 |
Real Estate Investment Trusts 0.5% |
HCP, Inc. (REIT) | 5,500 | 202,345 |
Public Storage (REIT) | 1,700 | 172,414 |
SL Green Realty Corp. (REIT) | 1,600 | 108,016 |
| 482,775 |
Health Care 13.5% |
Biotechnology 1.7% |
Biogen Idec, Inc.* | 8,100 | 543,105 |
Celgene Corp.* | 5,700 | 337,098 |
Cephalon, Inc.* (a) | 16,700 | 1,030,724 |
| 1,910,927 |
|
Shares
| Value ($) |
| |
Health Care Providers & Services 8.1% |
Aetna, Inc. | 20,800 | 634,608 |
AmerisourceBergen Corp. | 43,800 | 1,494,456 |
Cardinal Health, Inc. | 45,700 | 1,750,767 |
Coventry Health Care, Inc.* | 28,400 | 749,760 |
Health Net, Inc.* | 5,100 | 139,179 |
Humana, Inc.* | 16,600 | 908,684 |
UnitedHealth Group, Inc. | 51,400 | 1,856,054 |
WellPoint, Inc.* | 21,600 | 1,228,176 |
| 8,761,684 |
Pharmaceuticals 3.7% |
Eli Lilly & Co. | 38,000 | 1,331,520 |
Endo Pharmaceuticals Holdings, Inc.* | 13,700 | 489,227 |
Forest Laboratories, Inc.* | 57,700 | 1,845,246 |
Medicis Pharmaceutical Corp. "A" | 4,200 | 112,518 |
Par Pharmaceutical Companies, Inc.* | 6,300 | 242,613 |
| 4,021,124 |
Industrials 11.5% |
Aerospace & Defense 3.1% |
General Dynamics Corp. | 9,500 | 674,120 |
Honeywell International, Inc. | 7,500 | 398,700 |
Northrop Grumman Corp. (a) | 25,600 | 1,658,368 |
Raytheon Co. | 13,300 | 616,322 |
| 3,347,510 |
Air Freight & Logistics 1.6% |
FedEx Corp. | 4,700 | 437,147 |
United Parcel Service, Inc. "B" | 18,100 | 1,313,698 |
| 1,750,845 |
Airlines 0.2% |
Alaska Air Group, Inc.* | 2,900 | 164,401 |
Commercial Services & Supplies 0.4% |
Cintas Corp. | 4,800 | 134,208 |
R.R. Donnelley & Sons Co. | 16,600 | 290,002 |
| 424,210 |
Construction & Engineering 0.4% |
EMCOR Group, Inc.* | 10,200 | 295,596 |
KBR, Inc. | 5,200 | 158,444 |
| 454,040 |
Electrical Equipment 0.2% |
Rockwell Automation, Inc. | 2,300 | 164,933 |
Industrial Conglomerates 1.1% |
3M Co. | 14,200 | 1,225,460 |
Machinery 2.0% |
Danaher Corp. | 8,200 | 386,794 |
Dover Corp. | 3,100 | 181,195 |
Eaton Corp. | 5,200 | 527,852 |
Ingersoll-Rand PLC | 7,200 | 339,048 |
Oshkosh Corp.* | 12,200 | 429,928 |
Parker Hannifin Corp. | 1,900 | 163,970 |
Trinity Industries, Inc. (a) | 6,500 | 172,965 |
| 2,201,752 |
Professional Services 0.3% |
Manpower, Inc. | 4,600 | 288,696 |
Road & Rail 1.6% |
Norfolk Southern Corp. | 13,200 | 829,224 |
Ryder System, Inc. | 18,100 | 952,784 |
| 1,782,008 |
|
Shares
| Value ($) |
| |
Trading Companies & Distributors 0.6% |
W.W. Grainger, Inc. (a) | 4,900 | 676,739 |
Information Technology 18.7% |
Communications Equipment 1.6% |
F5 Networks, Inc.* | 4,500 | 585,720 |
Nokia Corp. (ADR) (a) | 34,100 | 351,912 |
Research In Motion Ltd.* | 10,900 | 633,617 |
Tellabs, Inc. | 20,600 | 139,668 |
| 1,710,917 |
Computers & Peripherals 0.7% |
Dell, Inc.* | 8,800 | 119,240 |
Lexmark International, Inc. "A"* | 16,800 | 584,976 |
| 704,216 |
Electronic Equipment, Instruments & Components 3.9% |
Anixter International, Inc. | 1,800 | 107,514 |
Arrow Electronics, Inc.* | 21,600 | 739,800 |
Avnet, Inc.* | 18,400 | 607,752 |
FLIR Systems, Inc.* | 2,600 | 77,350 |
Ingram Micro, Inc. "A"* | 24,900 | 475,341 |
Jabil Circuit, Inc. | 12,800 | 257,152 |
Power-One, Inc.* (a) | 11,500 | 117,300 |
Tech Data Corp.* | 11,600 | 510,632 |
Tyco Electronics Ltd. | 27,700 | 980,580 |
Vishay Intertechnology, Inc.* (a) | 28,000 | 411,040 |
| 4,284,461 |
Internet Software & Services 0.8% |
AOL, Inc.* | 15,000 | 355,650 |
IAC/InterActiveCorp.* (a) | 17,700 | 507,990 |
| 863,640 |
IT Services 5.4% |
Automatic Data Processing, Inc. | 13,000 | 601,640 |
Cognizant Technology Solutions Corp. "A"* | 3,900 | 285,831 |
Computer Sciences Corp. | 28,300 | 1,403,680 |
International Business Machines Corp. | 20,400 | 2,993,904 |
Western Union Co. (a) | 31,900 | 592,383 |
| 5,877,438 |
Semiconductors & Semiconductor Equipment 3.4% |
Altera Corp. (a) | 10,500 | 373,590 |
Analog Devices, Inc. | 8,800 | 331,496 |
Fairchild Semiconductor International, Inc.* (a) | 8,500 | 132,685 |
Intel Corp. | 94,500 | 1,987,335 |
Lam Research Corp.* | 3,000 | 155,340 |
Marvell Technology Group Ltd.* | 19,500 | 361,725 |
Maxim Integrated Products, Inc. | 7,100 | 167,702 |
Micron Technology, Inc.* (a) | 25,900 | 207,718 |
| 3,717,591 |
Software 2.9% |
Activision Blizzard, Inc. | 32,400 | 403,056 |
Microsoft Corp. | 97,900 | 2,733,368 |
| 3,136,424 |
|
Shares
| Value ($) |
| |
Materials 5.3% |
Chemicals 2.4% |
Ashland, Inc. | 6,700 | 340,762 |
Cytec Industries, Inc. | 1,600 | 84,896 |
E.I. du Pont de Nemours & Co. | 21,500 | 1,072,420 |
Lubrizol Corp. | 8,800 | 940,544 |
Potash Corp. of Saskatchewan, Inc. (a) | 1,000 | 154,830 |
| 2,593,452 |
Metals & Mining 2.6% |
Barrick Gold Corp. | 7,400 | 393,532 |
Freeport-McMoRan Copper & Gold, Inc. | 11,200 | 1,345,008 |
Newmont Mining Corp. | 18,500 | 1,136,455 |
| 2,874,995 |
Paper & Forest Products 0.3% |
Domtar Corp. | 2,200 | 167,024 |
MeadWestvaco Corp. | 4,900 | 128,184 |
| 295,208 |
Telecommunication Services 2.5% |
Diversified Telecommunication Services 2.2% |
AT&T, Inc. | 16,700 | 490,646 |
Verizon Communications, Inc. | 51,700 | 1,849,826 |
| 2,340,472 |
Wireless Telecommunication Services 0.3% |
Vodafone Group PLC (ADR) | 14,300 | 377,949 |
Utilities 1.6% |
Electric Utilities 0.8% |
Duke Energy Corp. | 34,700 | 618,007 |
Exelon Corp. | 7,600 | 316,464 |
| 934,471 |
Independent Power Producers & Energy Traders 0.6% |
NRG Energy, Inc.* (a) | 34,108 | 666,470 |
Multi-Utilities 0.2% |
Ameren Corp. | 6,800 | 191,692 |
Total Common Stocks (Cost $91,736,793) | 107,368,303 |
|
Securities Lending Collateral 12.0% |
Daily Assets Fund Institutional, 0.27% (b) (c) (Cost $13,084,837) | 13,084,837 | 13,084,837 |
|
Cash Equivalents 1.0% |
Central Cash Management Fund, 0.19% (b) (Cost $1,081,171) | 1,081,171 | 1,081,171 |
| % of Net Assets | Value ($) |
| |
Total Investment Portfolio (Cost $105,902,801)+ | 111.8 | 121,534,311 |
Other Assets and Liabilities, Net | (11.8) | (12,874,612) |
Net Assets | 100.0 | 108,659,699 |
* Non-income producing security.
+ The cost for federal income tax purposes was $106,855,572. At December 31, 2010, net unrealized appreciation for all securities based on tax cost was $14,678,739. This consisted of aggregate gross unrealized appreciation for all securities in which there was an excess of value over tax cost of $16,161,936 and aggregate gross unrealized depreciation for all securities in which there was an excess of tax cost over value of $1,483,197.
(a) All or a portion of these securities were on loan (see Notes to Financial Statements). The value of all securities loaned at December 31, 2010 amounted to $12,717,748, which is 11.7% of net assets.
(b) Affiliated fund managed by Deutsche Investment Management Americas Inc. The rate shown is the annualized seven-day yield at period end.
(c) Represents collateral held in connection with securities lending. Income earned by the Fund is net of borrower rebates.
ADR: American Depositary Receipt
REIT: Real Estate Investment Trust
At December 31, 2010, open futures contracts purchased were as follows:
Futures | Currency | Expiration Date | Contracts | Notional Value ($) | Unrealized Appreciation ($) |
S&P 500 E-Mini Index | USD | 3/18/2011 | 17 | 1,065,050 | 15,218 |
Currency Abbreviation |
USD United States Dollar |
Fair Value Measurements
Various inputs are used in determining the value of the Fund's investments. These inputs are summarized in three broad levels. Level 1 includes quoted prices in active markets for identical securities. Level 2 includes other significant observable inputs (including quoted prices for similar securities, interest rates, prepayment speeds, and credit risk). Level 3 includes significant unobservable inputs (including the Fund's own assumptions in determining the fair value of investments). The inputs or methodology used for valuing securities are not necessarily an indication of the risk associated with investing in those securities.
The following is a summary of the inputs used as of December 31, 2010 in valuing the Fund's investments. For information on the Fund's policy regarding the valuation of investments, please refer to the Security Valuation section of Note A in the accompanying Notes to Financial Statements.
Assets | Level 1 | Level 2 | Level 3 | Total |
|
Common Stocks (d) | $ 107,368,303 | $ — | $ — | $ 107,368,303 |
Short-Term Investments (d) | 14,166,008 | — | — | 14,166,008 |
Derivatives (e) | 15,218 | — | — | 15,218 |
Total | $ 121,549,529 | $ — | $ — | $ 121,549,529 |
There have been no significant transfers between Level 1 and Level 2 fair value measurements during the year ended December 31, 2010.
(d) See Investment Portfolio for additional detailed categorizations.
(e) Derivatives include unrealized appreciation (depreciation) on open futures contracts.
The accompanying notes are an integral part of the financial statements.
Statement of Assets and Liabilities
as of December 31, 2010 |
Assets |
Investments: Investments in unaffiliated securities, at value (cost $91,736,793) — including $12,717,748 of securities loaned | $ 107,368,303 |
Investment in Daily Assets Fund Institutional (cost $13,084,837)* | 13,084,837 |
Investment in Central Cash Management Fund (cost $1,081,171) | 1,081,171 |
Total investments, at value (cost $105,902,801) | 121,534,311 |
Deposit with brokers for open futures contracts | 128,868 |
Foreign currency, at value (cost $2,134) | 2,233 |
Receivable for Fund shares sold | 145,708 |
Receivable for variation margin on open futures contracts | 15,218 |
Dividends receivable | 76,948 |
Interest receivable | 2,889 |
Other assets | 587 |
Total assets | 121,906,762 |
Liabilities |
Payable upon return of securities loaned | 13,084,837 |
Payable for Fund shares redeemed | 35,395 |
Accrued management fee | 46,929 |
Other accrued expenses and payables | 79,902 |
Total liabilities | 13,247,063 |
Net assets, at value | $ 108,659,699 |
Net Assets Consist of |
Undistributed net investment income | 1,146,935 |
Net unrealized appreciation (depreciation) on: Investments | 15,631,510 |
Futures | 15,218 |
Foreign currency | 99 |
Accumulated net realized gain (loss) | (49,691,433) |
Paid-in capital | 141,557,370 |
Net assets, at value | $ 108,659,699 |
Class A Net Asset Value, offering and redemption price per share ($108,493,126 ÷ 10,190,728 outstanding shares of beneficial interest, no par value, unlimited number of shares authorized) | $ 10.65 |
Class B Net Asset Value, offering and redemption price per share ($166,573 ÷ 15,598 outstanding shares of beneficial interest, no par value, unlimited number of shares authorized) | $ 10.68 |
* Represents collateral on securities loaned.
The accompanying notes are an integral part of the financial statements.
Statement of Operations
for the year ended December 31, 2010 |
Investment Income |
Income: Dividends (net of foreign taxes withheld of $521) | $ 1,948,786 |
Interest | 205 |
Income distributions — Central Cash Management Fund | 1,546 |
Securities lending income, including income from Daily Assets Fund Institutional, net of borrower rebates | 74,190 |
Total income | 2,024,727 |
Expenses: Management fee | 580,643 |
Administration fee | 105,571 |
Services to shareholders | 2,584 |
Distribution service fee (Class B) | 399 |
Custodian fee | 19,378 |
Legal fees | 10,001 |
Audit and tax fees | 53,129 |
Trustees' fees and expenses | 6,320 |
Reports to shareholders | 12,605 |
Other | 8,322 |
Total expenses | 798,952 |
Net investment income (loss) | 1,225,775 |
Realized and Unrealized Gain (Loss) |
Net realized gain (loss) from: Investments | 11,523,479 |
Futures | 130,929 |
Foreign currency | (60) |
| 11,654,348 |
Change in net unrealized appreciation (depreciation) on: Investments | 520,926 |
Futures | 7,705 |
Foreign currency | 142 |
| 528,773 |
Net gain (loss) | 12,183,121 |
Net increase (decrease) in net assets resulting from operations | $ 13,408,896 |
The accompanying notes are an integral part of the financial statements.
Statement of Changes in Net Assets
Increase (Decrease) in Net Assets | Years Ended December 31, |
2010 | 2009 |
Operations: Net investment income (loss) | $ 1,225,775 | $ 1,559,434 |
Net realized gain (loss) | 11,654,348 | (19,218,958) |
Change in net unrealized appreciation (depreciation) | 528,773 | 46,824,414 |
Net increase (decrease) in net assets resulting from operations | 13,408,896 | 29,164,890 |
Distributions to shareholders from: Net investment income: Class A | (1,575,913) | (2,044,479) |
Class B | (1,920) | (2,260) |
Total distributions | (1,577,833) | (2,046,739) |
Fund share transactions: Class A Proceeds from shares sold | 4,447,701 | 5,027,733 |
Reinvestment of distributions | 1,575,913 | 2,044,479 |
Payments for shares redeemed | (20,221,768) | (29,505,512) |
Net increase (decrease) in net assets from Class A share transactions | (14,198,154) | (22,433,300) |
Class B Proceeds from shares sold | 1,931 | 267 |
Reinvestment of distributions | 1,920 | 2,260 |
Payments for shares redeemed | (19,529) | (12,442) |
Net increase (decrease) in net assets from Class B share transactions | (15,678) | (9,915) |
Increase (decrease) in net assets | (2,382,769) | 4,674,936 |
Net assets at beginning of period | 111,042,468 | 106,367,532 |
Net assets at end of period (including undistributed net investment income of $1,146,935 and $1,493,480, respectively) | $ 108,659,699 | $ 111,042,468 |
Other Information |
Class A Shares outstanding at beginning of period | 11,688,302 | 14,644,836 |
Shares sold | 457,619 | 630,574 |
Shares issued to shareholders in reinvestment of distributions | 153,448 | 313,090 |
Shares redeemed | (2,108,641) | (3,900,198) |
Net increase (decrease) in Class A shares | (1,497,574) | (2,956,534) |
Shares outstanding at end of period | 10,190,728 | 11,688,302 |
Class B Shares outstanding at beginning of period | 17,241 | 18,379 |
Shares sold | 199 | 34 |
Shares issued to shareholders in reinvestment of distributions | 186 | 344 |
Shares redeemed | (2,028) | (1,516) |
Net increase (decrease) in Class B shares | (1,643) | (1,138) |
Shares outstanding at end of period | 15,598 | 17,241 |
The accompanying notes are an integral part of the financial statements.
Financial Highlights
Class A Years Ended December 31, | 2010 | 2009 | 2008 | 2007 | 2006 |
Selected Per Share Data |
Net asset value, beginning of period | $ 9.49 | $ 7.25 | $ 14.65 | $ 16.17 | $ 14.88 |
Income (loss) from investment operations: Net investment incomea | .11 | .12 | .12 | .17 | .17c |
Net realized and unrealized gain (loss) | 1.19 | 2.27 | (4.97) | .36 | 2.07 |
Total from investment operations | 1.30 | 2.39 | (4.85) | .53 | 2.24 |
Less distributions from: Net investment income | (.14) | (.15) | (.21) | (.18) | (.14) |
Net realized gains | — | — | (2.34) | (1.87) | (.81) |
Total distributions | (.14) | (.15) | (2.55) | (2.05) | (.95) |
Net asset value, end of period | $ 10.65 | $ 9.49 | $ 7.25 | $ 14.65 | $ 16.17 |
Total Return (%) | 13.77 | 33.97 | (38.49)b | 3.50 | 15.65c |
Ratios to Average Net Assets and Supplemental Data |
Net assets, end of period ($ millions) | 108 | 111 | 106 | 242 | 314 |
Ratio of expenses before expense reductions (%) | .76 | .75 | .76 | .71 | .71 |
Ratio of expenses after expense reductions (%) | .76 | .75 | .76 | .71 | .71 |
Ratio of net investment income (%) | 1.16 | 1.54 | 1.12 | 1.13 | 1.12c |
Portfolio turnover rate (%) | 146 | 82 | 127 | 275 | 226 |
a Based on average shares outstanding during the period. b Total return would have been lower had certain expenses not been reduced. c Includes non-recurring income from the Advisor recorded as a result of an administrative proceeding regarding disclosure of brokerage allocation practices in connection with sales of DWS Funds. The non-recurring income resulted in an increase in net investment income of $0.003 per share and an increase in the ratio of net investment income of 0.02%. Excluding this non-recurring income, total return would have been 0.02% lower. |
Class B Years Ended December 31, | 2010 | 2009 | 2008 | 2007 | 2006 |
Selected Per Share Data |
Net asset value, beginning of period | $ 9.51 | $ 7.26 | $ 14.61 | $ 16.12 | $ 14.83 |
Income (loss) from investment operations: Net investment incomea | .09 | .10 | .04 | .11 | .11c |
Net realized and unrealized gain (loss) | 1.19 | 2.27 | (4.89) | .36 | 2.07 |
Total from investment operations | 1.28 | 2.37 | (4.85) | .47 | 2.18 |
Less distributions from: Net investment income | (.11) | (.12) | (.16) | (.11) | (.08) |
Net realized gains | — | — | (2.34) | (1.87) | (.81) |
Total distributions | (.11) | (.12) | (2.50) | (1.98) | (.89) |
Net asset value, end of period | $ 10.68 | $ 9.51 | $ 7.26 | $ 14.61 | $ 16.12 |
Total Return (%) | 13.55 | 33.46 | (38.48)b | 3.15 | 15.19c |
Ratios to Average Net Assets and Supplemental Data |
Net assets, end of period ($ millions) | .17 | .16 | .13 | 11 | 46 |
Ratio of expenses before expense reductions (%) | 1.02 | 1.02 | 1.22 | 1.09 | 1.09 |
Ratio of expenses after expense reductions (%) | 1.02 | 1.02 | 1.21 | 1.09 | 1.09 |
Ratio of net investment income (%) | .90 | 1.27 | .67 | .75 | .74c |
Portfolio turnover rate (%) | 146 | 82 | 127 | 275 | 226 |
a Based on average shares outstanding during the period. b Total return would have been lower had certain expenses not been reduced. c Includes non-recurring income from the Advisor recorded as a result of an administrative proceeding regarding disclosure of brokerage allocation practices in connection with sales of DWS Funds. The non-recurring income resulted in an increase in net investment income of $0.003 per share and an increase in the ratio of net investment income of 0.02%. Excluding this non-recurring income, total return would have been 0.02% lower. |
Performance Summary December 31, 2010
DWS Core Fixed Income VIP
All performance shown is historical, assumes reinvestment of all dividend and capital gain distributions and does not guarantee future results. Investment return and principal value fluctuate with changing market conditions so that, when redeemed, shares may be worth more or less than their original cost. Current performance may be lower or higher than the performance data quoted. Please contact your participating insurance company for the Fund's most recent month-end performance. Performance doesn't reflect charges and fees ("contract charges") associated with the separate account that invests in the Fund or any variable life insurance policy or variable annuity contract for which the Fund is an investment option. These charges and fees will reduce returns.
The gross expense ratios of the Fund, as stated in the fee table of the prospectus dated May 1, 2010 is 0.59% for Class A shares, and may differ from the expense ratios disclosed in the Financial Highlights tables in this report.
Risk Considerations
Bond investments are subject to interest-rate and credit risks. When interest rates rise, bond prices generally fall. Credit risk refers to the ability of an issuer to make timely payments of principal and interest. In the current market environment, mortgage backed securities are experiencing increased volatility. See the prospectus for details.
Fund returns shown for the 3-year, 5-year and 10-year periods reflect a fee waiver and/or expense reimbursement. Without this waiver/reimbursement, returns would have been lower.
Growth of an Assumed $10,000 Investment in DWS Core Fixed Income VIP |
[] DWS Core Fixed Income VIP — Class A [] Barclays Capital US Aggregate Bond Index | Barclays Capital US Aggregate Bond Index is an unmanaged index representing domestic taxable investment-grade bonds, with index components for government and corporate securities, mortgage pass-through securities, and asset-backed securities with average maturities of one year or more. Index returns, unlike fund returns, do not reflect any fees or expenses. It is not possible to invest directly into an index. |
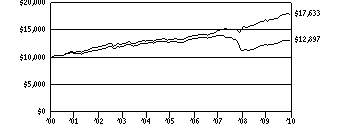 | |
Yearly periods ended December 31 | |
Comparative Results |
DWS Core Fixed Income VIP | 1-Year | 3-Year | 5-Year | 10-Year |
Class A | Growth of $10,000 | $10,651 | $9,256 | $10,053 | $12,897 |
Average annual total return | 6.51% | -2.54% | 0.10% | 2.58% |
Barclays Capital US Aggregate Bond Index | Growth of $10,000 | $10,654 | $11,877 | $13,255 | $17,633 |
Average annual total return | 6.54% | 5.90% | 5.80% | 5.84% |
The growth of $10,000 is cumulative.
Information About Your Fund's Expenses
DWS Core Fixed Income VIP
As an investor of the Fund, you incur two types of costs: ongoing expenses and transaction costs. Ongoing expenses include management fees, and other Fund expenses. Examples of transaction costs include contract charges, redemption fees and account maintenance fees, which are not shown in this section. The following tables are intended to help you understand your ongoing expenses (in dollars) of investing in the Fund and to help you compare these expenses with the ongoing expenses of investing in other mutual funds. The example in the table is based on an investment of $1,000 invested at the beginning of the six-month period and held for the entire period (July 1, 2010 to December 31, 2010).
• Actual Fund Return. This helps you estimate the actual dollar amount of ongoing expenses (but not transaction costs) paid on a $1,000 investment in the Fund using the Fund's actual return during the period. To estimate the expenses you paid over the period, simply divide your account value by $1,000 (for example, an $8,600 account value divided by $1,000 = 8.6), then multiply the result by the number in the "Expenses Paid per $1,000" line under the share class you hold.
• Hypothetical 5% Fund Return. This helps you to compare your Fund's ongoing expenses (but not transaction costs) with those of other mutual funds using the Fund's actual expense ratio and a hypothetical rate of return of 5% per year before expenses. Examples using a 5% hypothetical Fund return may be found in the shareholder reports of other mutual funds. The hypothetical account values and expenses may not be used to estimate the actual ending account balance or expenses you paid for the period.
Please note that the expenses shown in these tables are meant to highlight your ongoing expenses only and do not reflect any transaction costs. The "Expenses Paid per $1,000" line of the tables is useful in comparing ongoing expenses only and will not help you determine the relative total expense of owning different funds. If these transaction costs had been included, your costs would have been higher.
Expenses and Value of a $1,000 Investment for the six months ended December 31, 2010 |
Actual Fund Return | Class A | |
Beginning Account Value 7/1/10 | $ 1,000.00 | |
Ending Account Value 12/31/10 | $ 1,011.60 | |
Expenses Paid per $1,000* | $ 3.50 | |
Hypothetical 5% Fund Return | Class A | |
Beginning Account Value 7/1/10 | $ 1,000.00 | |
Ending Account Value 12/31/10 | $ 1,021.73 | |
Expenses Paid per $1,000* | $ 3.52 | |
* Expenses are equal to the Fund's annualized expense ratio, multiplied by the average account value over the period, multiplied by the number of days in the most recent six-month period, then divided by 365.
Annualized Expense Ratio | Class A | |
DWS Variable Series II — DWS Core Fixed Income VIP | .69% | |
For more information, please refer to the Fund's prospectus.
These tables do not reflect charges and fees ("contract charges") associated with the separate account that invests in the Fund or any variable life insurance policy or variable annuity contract for which the Fund is an investment option.
Management Summary December 31, 2010
DWS Core Fixed Income VIP
During the 12-month period ended December 31, 2010, the US Federal Reserve Board (the Fed) maintained the benchmark federal funds rate at near-zero levels and engaged in bond purchases designed to lower longer-term interest rates as it sought to stimulate economic growth.1 Treasury yields fell for most of the year, before rising in the fourth quarter as market participants reacted to better economic data and the extension of Bush-era tax cuts. For the year, credit-sensitive sectors outperformed as investors sought yield in an environment of low interest rates. Corporate bonds benefited as corporate profits and balance sheets displayed strength throughout the period, with below-investment-grade issues leading returns. Among other credit sectors, commercial mortgage-backed securities were standout performers, despite an ongoing soft leasing environment in many markets.2
During the 12-month period, the Fund provided a total return of 6.51% (Class A shares, unadjusted for contract charges), compared with the 6.54% return of its benchmark, the Barclays Capital US Aggregate Bond Index.
The Fund's performance versus the benchmark continued to be driven principally by exposure to more credit-sensitive fixed-income sectors. Our overweighting of investment-grade corporate bonds was the leading contributor to returns, while a modest position in high-yield corporates added to performance as well.3 On the downside, our underweighting early in the period of commercial mortgage-backed securities constrained returns. The Fund's positioning with respect to overall duration and interest rate exposure was essentially a neutral factor for performance. We are maintaining a somewhat conservative stance with respect to overall interest rate exposure as we monitor the impact of Fed bond purchases on inflation expectations and rates. In addition, we are closely watching economic data, which increasingly appear to indicate that the recovery is taking hold, a trend that would bode well for continued outperformance by credit-oriented sectors. Corporate balance sheets on the whole are in excellent condition and we are maintaining our overweighting of investment-grade corporate bonds. Our small high-yield position is being maintained as well, although we will not hesitate to move out of this sector if tighter spreads versus investment-grade issues change our risk/reward analysis.4
Kenneth R. Bowling, CFA
John Brennan
Jamie Guenther, CFA
Bruce Harley, CFA, CEBS
J. Kevin Horsley, CFA, CPA
J. Richard Robben, CFA
David Vignolo, CFA
Stephen Willer, CFA
Portfolio Managers
Barclays Capital US Aggregate Bond Index is an unmanaged index representing domestic taxable investment-grade bonds, with index components for government and corporate securities, mortgage pass-through securities, and asset-backed securities with average maturities of one year or more.
Index returns assume reinvestment of dividends and, unlike fund returns, do not reflect any fees or expenses. It is not possible to invest directly into an index.
1 The federal funds rate is the interest rate, set by the US Federal Reserve Board, at which banks lend money to each other, usually on an overnight basis.
2 Commercial mortgage-backed securities (CMBS) are secured by loans on a commercial property.
3 "Overweight" means the Fund holds a higher weighting in a given sector or security than the benchmark. "Underweight" means the Fund holds a lower weighting.
4 "Spread" refers to the excess yield various bond sectors offer over Treasuries with similar maturities. When spreads widen, yield differences are increasing between bonds in the two sectors being compared. When spreads narrow, the opposite is true.
Portfolio Summary
DWS Core Fixed Income VIP
Asset Allocation (As a % of Net Assets) | 12/31/10 | 12/31/09 |
| | |
Mortgage-Backed Securities Pass-Throughs | 30% | 39% |
Government & Agency Obligations | 27% | 19% |
Corporate Bonds | 23% | 22% |
Commercial Mortgage-Backed Securities | 7% | 4% |
Municipal Bonds and Notes | 7% | 6% |
Cash Equivalents and Other Assets and Liabilities, net | 3% | 5% |
Collateralized Mortgage Obligations | 2% | 4% |
Asset-Backed | 1% | 1% |
| 100% | 100% |
Quality (Excludes Cash Equivalents and Securities Lending Collateral) | 12/31/10 | 12/31/09 |
| | |
US Government and Agencies | 59% | 50% |
AAA | 3% | 23% |
AA | 7% | 5% |
A | 13% | 10% |
BBB | 15% | 11% |
BB | 2% | — |
Not Rated | 1% | 1% |
| 100% | 100% |
Interest Rate Sensitivity | 12/31/10 | 12/31/09 |
| | |
Effective Maturity | 7.0 years | 6.8 years |
Effective Duration | 5.0 years | 4.5 years |
Asset allocation and Interest Rate Sensitivity are subject to change.
Effective maturity is the weighted average of the bonds held by the Fund taking into consideration any maturity shortening features.
Effective duration is an approximate measure of the Fund's sensitivity to interest rate changes taking into consideration any maturity shortening features.
The quality ratings represent the lower of Moody's Investors Service, Inc. ("Moody's") or Standard & Poor's Corporation ("S&P") credit ratings. The ratings of Moody's and S&P represent their opinions as to the quality of the securities they rate. Ratings are relative and subjective and are not absolute standards of quality. The Fund's credit quality does not remove market risk and is subject to change.
For more complete details about the Fund's investment portfolio, see page 66.
Following the Fund's fiscal first and third quarter-end, a complete portfolio holdings listing is filed with the SEC on Form N-Q. The form will be available on the SEC's Web site at www.sec.gov, and it also may be reviewed and copied at the SEC's Public Reference Room in Washington, D.C. Information on the operation of the SEC's Public Reference Room may be obtained by calling (800) SEC-0330. The Fund's portfolio holdings are also posted on www.dws-investments.com from time to time. Please see the Fund's current prospectus for more information.
Investment Portfolio December 31, 2010
DWS Core Fixed Income VIP
| Principal Amount ($) | Value ($) |
| |
Corporate Bonds 29.4% |
Consumer Discretionary 4.0% |
AMC Entertainment, Inc., 8.75%, 6/1/2019 | 143,000 | 152,652 |
CBS Corp., 5.9%, 10/15/2040 | 380,000 | 366,045 |
Comcast Cable Holdings LLC, 10.125%, 4/15/2022 | 180,000 | 244,106 |
DIRECTV Holdings LLC: |
| 3.125%, 2/15/2016 | 200,000 | 197,333 |
| 6.35%, 3/15/2040 | 312,000 | 328,215 |
Home Depot, Inc.: |
| 5.4%, 9/15/2040 | 175,000 | 169,946 |
| 5.875%, 12/16/2036 | 75,000 | 78,011 |
Lowe's Companies, Inc., 3.75%, 4/15/2021 | 300,000 | 290,043 |
MGM Resorts International, 144A, 9.0%, 3/15/2020 | 500,000 | 550,000 |
NBC Universal, Inc., 144A, 5.95%, 4/1/2041 | 172,000 | 171,982 |
Time Warner, Inc.: |
| 6.2%, 3/15/2040 | 250,000 | 265,763 |
| 7.625%, 4/15/2031 | 250,000 | 303,921 |
Yum! Brands, Inc.: |
| 3.875%, 11/1/2020 | 300,000 | 286,586 |
| 5.3%, 9/15/2019 | 100,000 | 105,917 |
| 3,510,520 |
Consumer Staples 3.0% |
Anheuser-Busch InBev Worldwide, Inc., 144A, 7.75%, 1/15/2019 | 400,000 | 497,739 |
CVS Caremark Corp., 6.125%, 9/15/2039 | 825,000 | 881,478 |
Kellogg Co., 4.0%, 12/15/2020 | 200,000 | 197,251 |
Kraft Foods, Inc., 5.375%, 2/10/2020 | 825,000 | 887,922 |
Kroger Co., 5.4%, 7/15/2040 | 150,000 | 142,172 |
| 2,606,562 |
Energy 4.2% |
DCP Midstream LLC, 144A, 9.75%, 3/15/2019 | 530,000 | 684,930 |
Enterprise Products Operating LLC, 4.6%, 8/1/2012 | 500,000 | 524,768 |
Kinder Morgan Energy Partners LP, 6.5%, 9/1/2039 | 300,000 | 309,910 |
ONEOK Partners LP, 6.15%, 10/1/2016 | 321,000 | 360,760 |
Plains All American Pipeline LP, 8.75%, 5/1/2019 | 750,000 | 930,746 |
Weatherford International Ltd., 5.125%, 9/15/2020 | 550,000 | 547,268 |
Williams Partners LP, 4.125%, 11/15/2020 | 360,000 | 340,988 |
| 3,699,370 |
Financials 11.5% |
American Express Co., 7.0%, 3/19/2018 | 700,000 | 815,341 |
Bank of America Corp.: |
| 5.625%, 7/1/2020 | 410,000 | 417,992 |
| 5.65%, 5/1/2018 | 865,000 | 883,833 |
| 6.5%, 8/1/2016 | 80,000 | 86,807 |
Citigroup, Inc., 5.375%, 8/9/2020 | 800,000 | 831,206 |
| Principal Amount ($) | Value ($) |
| |
Fifth Third Bancorp., 5.45%, 1/15/2017 | 390,000 | 398,644 |
Ford Motor Credit Co., LLC, 8.0%, 6/1/2014 | 1,000,000 | 1,101,707 |
General Electric Capital Corp., Series A, 5.625%, 5/1/2018 | 600,000 | 654,308 |
Hartford Financial Services Group, Inc., 5.95%, 10/15/2036 | 270,000 | 254,727 |
JPMorgan Chase & Co., 5.125%, 9/15/2014 | 1,000,000 | 1,064,071 |
KeyBank NA, 5.7%, 11/1/2017 | 300,000 | 305,505 |
Lincoln National Corp., 8.75%, 7/1/2019 | 350,000 | 437,797 |
MetLife, Inc., 7.717%, 2/15/2019 | 395,000 | 484,954 |
Morgan Stanley, Series F, 6.0%, 4/28/2015 | 490,000 | 530,671 |
National Rural Utilities Cooperative Finance Corp., 10.375%, 11/1/2018 | 200,000 | 275,885 |
PNC Funding Corp., 5.25%, 11/15/2015 | 450,000 | 481,587 |
Prudential Financial, Inc.: |
| Series B, 5.1%, 9/20/2014 | 130,000 | 139,642 |
| 6.2%, 1/15/2015 | 90,000 | 99,253 |
| 7.375%, 6/15/2019 | 50,000 | 58,952 |
The Goldman Sachs Group, Inc., 6.0%, 6/15/2020 | 550,000 | 594,365 |
Travelers Companies, Inc., 5.35%, 11/1/2040 | 185,000 | 182,273 |
| 10,099,520 |
Health Care 1.9% |
Express Scripts, Inc.: |
| 6.25%, 6/15/2014 | 205,000 | 229,182 |
| 7.25%, 6/15/2019 | 405,000 | 479,367 |
Laboratory Corp. of America Holdings, 4.625%, 11/15/2020 | 275,000 | 272,520 |
Medco Health Solutions, Inc.: |
| 4.125%, 9/15/2020 | 125,000 | 120,866 |
| 7.125%, 3/15/2018 | 500,000 | 586,748 |
| 1,688,683 |
Industrials 0.8% |
CSX Corp.: |
| 6.15%, 5/1/2037 | 250,000 | 268,791 |
| 6.25%, 3/15/2018 | 380,000 | 435,921 |
| 704,712 |
Materials 1.5% |
ArcelorMittal, 6.125%, 6/1/2018 | 500,000 | 532,744 |
Corporacion Nacional del Cobre de Chile, 144A, 3.75%, 11/4/2020 | 550,000 | 521,144 |
Dow Chemical Co., 4.25%, 11/15/2020 | 285,000 | 273,001 |
| 1,326,889 |
Telecommunication Services 1.6% |
American Tower Corp.: |
| 5.05%, 9/1/2020 | 550,000 | 540,889 |
| 7.25%, 5/15/2019 | 250,000 | 282,508 |
Frontier Communications Corp., 7.875%, 4/15/2015 | 500,000 | 546,250 |
| 1,369,647 |
| Principal Amount ($) | Value ($) |
| |
Utilities 0.9% |
DTE Energy Co., 7.625%, 5/15/2014 | 148,000 | 170,588 |
FirstEnergy Solutions Corp., 6.8%, 8/15/2039 | 292,000 | 283,007 |
Sempra Energy, 6.5%, 6/1/2016 | 290,000 | 336,664 |
| 790,259 |
Total Corporate Bonds (Cost $24,622,597) | 25,796,162 |
|
Mortgage-Backed Securities Pass-Throughs 38.0% |
Federal Home Loan Mortgage Corp.: | |
| 4.0%, 8/1/2039 | 1,276,547 | 1,269,616 |
| 6.0%, with various maturities from 12/1/2034 until 3/1/2038 | 788,217 | 857,877 |
Federal National Mortgage Association: | |
| 3.274%*, 8/1/2037 | 201,551 | 211,112 |
| 3.5%, 7/1/2025 (a) | 4,675,000 | 4,708,602 |
| 4.0%, with various maturities from 9/1/2039 until 9/1/2040 (a) | 5,361,893 | 5,336,903 |
| 4.5%, 10/1/2033 | 412,900 | 426,755 |
| 5.0%, 8/1/2040 | 295,592 | 310,648 |
| 5.152%*, 9/1/2038 | 161,891 | 171,859 |
| 5.5%, with various maturities from 12/1/2032 until 9/1/2036 (a) | 10,439,727 | 11,183,444 |
| 6.0%, with various maturities from 4/1/2024 until 8/1/2035 (a) | 4,208,503 | 4,586,910 |
| 6.5%, with various maturities from 3/1/2017 until 4/1/2037 | 1,050,961 | 1,169,493 |
| 8.0%, 9/1/2015 | 12,340 | 13,379 |
Government National Mortgage Association: | |
| 4.5%, 6/1/2039 (a) | 1,000,000 | 1,038,359 |
| 5.0%, 4/1/2038 (a) | 1,000,000 | 1,063,203 |
| 5.5%, 3/1/2036 (a) | 1,000,000 | 1,080,703 |
Total Mortgage-Backed Securities Pass-Throughs (Cost $33,044,315) | 33,428,863 |
|
Asset-Backed 1.4% |
Credit Card Receivables |
Citibank Omni Master Trust, "A8", Series 2009-A8, 144A, 2.36%*, 5/16/2016 (Cost $1,215,844) | 1,200,000 | 1,214,872 |
|
Commercial Mortgage-Backed Securities 9.2% |
Banc of America Commercial Mortgage, Inc.: | |
| "A2", Series 2007-2, 5.634%, 4/10/2049 | 325,000 | 336,967 |
| "A4", Series 2007-4, 5.742%*, 2/10/2051 | 750,000 | 798,887 |
Bear Stearns Commercial Mortgage Securities, Inc., "A4", Series 2007-PW18, 5.7%, 6/13/2050 | 1,923,000 | 2,003,645 |
Citigroup/Deutsche Bank Commercial Mortgage Trust, "A4", Series 2006-CD2, 5.347%*, 1/15/2046 | 250,000 | 268,300 |
Greenwich Capital Commercial Funding Corp., "A4", Series 2006-GG7, 5.883%*, 7/10/2038 | 525,000 | 572,774 |
| Principal Amount ($) | Value ($) |
| |
JPMorgan Chase Commercial Mortgage Securities Corp.: | |
| "A4", Series 2006-LDP7, 5.872%*, 4/15/2045 | 600,000 | 656,165 |
| "A4", Series 2007-LD12, 5.882%, 2/15/2051 | 925,000 | 979,348 |
LB-UBS Commercial Mortgage Trust: | |
| "A3", Series 2006-C7, 5.347%, 11/15/2038 | 400,000 | 422,904 |
| "A4", Series 2007-C6, 5.858%, 7/15/2040 | 1,000,000 | 1,050,670 |
Merrill Lynch Mortgage Trust, "ASB", Series 2007-C1, 5.826%*, 6/12/2050 | 900,000 | 967,442 |
Total Commercial Mortgage-Backed Securities (Cost $7,455,238) | 8,057,102 |
|
Collateralized Mortgage Obligations 2.4% |
FDIC Structured Sale Guaranteed Notes, "1A", Series 2010-S1, 144A, 0.811%*, 2/25/2048 | 702,680 | 703,783 |
Federal National Mortgage Association, "QD", Series 2005-29, 5.0%, 8/25/2033 | 435,000 | 465,656 |
MASTR Alternative Loans Trust, "5A1", Series 2005-1, 5.5%, 1/25/2020 | 319,006 | 327,165 |
NCUA Guaranteed Notes, "1A", Series 2010-R1, 0.716%*, 10/7/2020 | 582,325 | 581,598 |
Total Collateralized Mortgage Obligations (Cost $2,041,517) | 2,078,202 |
|
Government & Agency Obligations 33.8% |
Sovereign Bonds 0.6% |
Republic of Poland, 6.375%, 7/15/2019 | 500,000 | 560,105 |
US Treasury Obligations 33.2% |
US Treasury Bill, 0.185%**, 3/17/2011 (b) | 320,000 | 319,929 |
US Treasury Bonds: |
| 4.75%, 2/15/2037 | 2,000,000 | 2,149,376 |
| 5.375%, 2/15/2031 (c) | 2,500,000 | 2,918,360 |
US Treasury Notes: |
| 1.75%, 1/31/2014 (c) | 18,700,000 | 19,091,540 |
| 3.625%, 2/15/2020 | 4,500,000 | 4,670,154 |
| 29,149,359 |
Total Government & Agency Obligations (Cost $29,710,921) | 29,709,464 |
|
Municipal Bonds and Notes 8.1% |
California, University Revenues, Build America Bonds, 5.946%, 5/15/2045 | 180,000 | 167,951 |
Chicago, IL, Transit Authority, Sales Tax Receipts Revenue, Build America Bonds, Series B, 6.2%, 12/1/2040 (d) | 265,000 | 244,004 |
Glendale, AZ, Municipal Property Corp., Excise Tax Revenue, Series B, 6.157%, 7/1/2033, INS: AGMC | 420,000 | 401,898 |
| Principal Amount ($) | Value ($) |
| |
Jicarilla, NM, Sales & Special Tax Revenue, Apache Nation Revenue, 144A, 5.2%, 12/1/2013 | 575,000 | 569,330 |
Kentucky, Asset/Liability Commission, General Fund Revenue, 3.165%, 4/1/2018 | 775,000 | 757,454 |
Louisville & Jefferson County, KY, Metropolitan Sewer District & Drain Systems, Build America Bonds, 6.25%, 5/15/2043 | 200,000 | 201,372 |
Miami-Dade County, FL, Educational Facilities Authority Revenue, University of Miami, Series B, 6.1%, 4/1/2015 | 825,000 | 876,628 |
Michigan, Western Michigan University Revenue, 4.41%, 11/15/2014, INS: AMBAC (d) | 620,000 | 630,187 |
Nashville & Davidson County, TN, Metropolitan Government, Convention Center Authority Revenue, Build America Bonds, Series A2, 7.431%, 7/1/2043 | 250,000 | 266,540 |
New Jersey, Economic Development Authority Revenue, Series B, 6.5%, 11/1/2014, INS: AGC | 585,000 | 667,403 |
New Jersey, State Educational Facilities Authority Revenue, NJ City University, Series F, 6.85%, 7/1/2036, INS: AGC | 395,000 | 428,220 |
Newark, NJ, Pension Obligation, 5.853%, 4/1/2022, INS: AGMC | 865,000 | 857,751 |
| Principal Amount ($) | Value ($) |
| |
Pennsylvania, State General Obligation, First Series, 5.25%, 2/1/2014, INS: NATL | 385,000 | 431,781 |
Virginia, College Building Authority, Educational Facilities Revenue, 21st Century College, Series B, 5.0%, 2/1/2014 | 570,000 | 633,864 |
Total Municipal Bonds and Notes (Cost $7,054,531) | 7,134,383 |
|
Shares
| Value ($) |
| |
Securities Lending Collateral 21.0% |
Daily Assets Fund Institutional, 0.27% (e) (f) (Cost $18,449,851) | 18,449,851 | 18,449,851 |
|
Cash Equivalents 3.2% |
Central Cash Management Fund, 0.19% (e) (Cost $2,798,238) | 2,798,238 | 2,798,238 |
| % of Net Assets | Value ($) |
| |
Total Investment Portfolio (Cost $126,393,052)+ | 146.5 | 128,667,137 |
Other Assets and Liabilities, Net | (46.5) | (40,818,885) |
Net Assets | 100.0 | 87,848,252 |
* These securities are shown at their current rate as of December 31, 2010. Floating rate securities' yields vary with a designated market index or market rate, such as the coupon-equivalent of the US Treasury bill rate.
** Annualized yield at time of purchase; not a coupon rate.
+ The cost for federal income tax purposes was $126,399,437. At December 31, 2010, net unrealized appreciation for all securities based on tax cost was $2,267,700. This consisted of aggregate gross unrealized appreciation for all securities in which there was an excess of value over tax cost of $3,032,557 and aggregate gross unrealized depreciation for all securities in which there was an excess of tax cost over value of $764,857.
(a) Delayed delivery security included.
(b) At December 31, 2010, this security has been pledged, in whole or in part, to cover initial margin requirements for futures closed December 31, 2010.
(c) All or a portion of these securities were on loan (see Notes to Financial Statements). The value of all securities loaned at December 31, 2010 amounted to $17,977,097, which is 20.5% of net assets.
(d) Taxable issue.
(e) Affiliated fund managed by Deutsche Investment Management Americas Inc. The rate shown is the annualized seven-day yield at period end.
(f) Represents collateral held in connection with securities lending. Income earned by the Fund is net of borrower rebates.
144A: Security exempt from registration under Rule 144A of the Securities Act of 1933. These securities may be resold in transactions exempt from registration, normally to qualified institutional buyers.
AGC: Assured Guaranty Corp.
AGMC: Assured Guaranty Municipal Corp.
AMBAC: Ambac Financial Group, Inc.
FDIC: Federal Deposit Insurance Corp.
INS: Insured
NATL: National Public Finance Guarantee Corp.
Included in the portfolio are investments in mortgage or asset-backed securities which are interests in separate pools of mortgages or assets. Effective maturities of these investments may be shorter than stated maturities due to prepayments. Some separate investments in the Federal Home Loan Mortgage Corp. and Federal National Mortgage Association issues which have similar coupon rates have been aggregated for presentation purposes in the investment portfolio.
At December 31, 2010, open futures contracts sold were as follows:
Securities | Currency | Expiration Date | Contracts | Notional
Value ($) | Unrealized
Appreciation ($) |
10 Year US Treasury Note | USD | 3/22/2011 | 114 | 13,729,875 | 434,891 |
30 Year US Treasury Bond | USD | 3/22/2011 | 40 | 4,885,000 | 182,500 |
Total unrealized appreciation | $ 617,391 |
Currency Abbreviation |
USD United States Dollar |
For information on the Fund's policy and additional disclosures regarding futures contracts, please refer to Note B in the accompanying Notes to Financial Statements.
Fair Value Measurements
Various inputs are used in determining the value of the Fund's investments. These inputs are summarized in three broad levels. Level 1 includes quoted prices in active markets for identical securities. Level 2 includes other significant observable inputs (including quoted prices for similar securities, interest rates, prepayment speeds, and credit risk). Level 3 includes significant unobservable inputs (including the Fund's own assumptions in determining the fair value of investments). The inputs or methodology used for valuing securities are not necessarily an indication of the risk associated with investing in those securities.
The following is a summary of the inputs used as of December 31, 2010 in valuing the Fund's investments. For information on the Fund's policy regarding the valuation of investments, please refer to the Security Valuation section of Note A in the accompanying Notes to Financial Statements.
Assets | Level 1 | Level 2 | Level 3 | Total |
|
Fixed Income (g) | | | | |
Corporate Bonds | $ — | $ 25,796,162 | $ — | $ 25,796,162 |
Mortgage-Backed Securities Pass-Throughs | — | 33,428,863 | — | 33,428,863 |
Asset-Backed | — | 1,214,872 | — | 1,214,872 |
Commercial Mortgage-Backed Securities | — | 8,057,102 | — | 8,057,102 |
Collateralized Mortgage Obligations | — | 2,078,202 | — | 2,078,202 |
Government & Agency Obligations | — | 29,389,535 | — | 29,389,535 |
Municipal Bonds and Notes | — | 7,134,383 | — | 7,134,383 |
Short-Term Investments (g) | 21,248,089 | 319,929 | — | 21,568,018 |
Derivatives (h) | 617,391 | — | — | 617,391 |
Total | $ 21,865,480 | $ 107,419,048 | $ — | $ 129,284,528 |
There have been no significant transfers between Level 1 and Level 2 fair value measurements during the year ended December 31, 2010.
(g) See Investment Portfolio for additional detailed categorizations.
(h) Derivatives include unrealized appreciation (depreciation) on open futures contracts.
The accompanying notes are an integral part of the financial statements.
Statement of Assets and Liabilities
as of December 31, 2010 |
Assets |
Investments: Investments in unaffiliated securities, at value (cost $105,144,963) — including $17,977,097 of securities loaned | $ 107,419,048 |
Investment in Daily Assets Fund Institutional (cost $18,449,851)* | 18,449,851 |
Investment in Central Cash Management Fund (cost $2,798,238) | 2,798,238 |
Total investments, at value (cost $126,393,052) | 128,667,137 |
Cash | 25,746 |
Receivable for Fund shares sold | 16,068 |
Interest receivable | 890,390 |
Other assets | 608 |
Total assets | 129,599,949 |
Liabilities |
Payable upon return of securities loaned | 18,449,851 |
Payable for investments purchased — delayed delivery securities | 23,054,042 |
Payable for daily variation margin on open futures contracts | 96,654 |
Payable for Fund shares redeemed | 37,396 |
Accrued management fee | 41,520 |
Other accrued expenses and payables | 72,234 |
Total liabilities | 41,751,697 |
Net assets, at value | $ 87,848,252 |
Net Assets Consist of |
Undistributed net investment income | 2,279,173 |
Net unrealized appreciation (depreciation) on: Investments | 2,274,085 |
Futures | 617,391 |
Accumulated net realized gain (loss) | (54,331,570) |
Paid-in capital | 137,009,173 |
Net assets, at value | $ 87,848,252 |
Class A Net Asset Value, offering and redemption price per share ($87,848,252 ÷ 10,037,687 outstanding shares of beneficial interest, no par value, 24,742,586 shares authorized) | $ 8.75 |
* Represents collateral on securities loaned.
The accompanying notes are an integral part of the financial statements.
Statement of Operations
for the year ended December 31, 2010 |
Investment Income |
Income: Interest | $ 3,181,169 |
Income distributions — Central Cash Management Fund | 36,587 |
Securities lending income, including income from Daily Assets Fund Institutional, net of borrower rebates | 6,363 |
Total income | 3,224,119 |
Expenses: Management fee | 482,684 |
Administration fee | 96,537 |
Services to shareholders | 2,357 |
Distribution service fee (Class B) | 14 |
Record keeping fees (Class B) | 799 |
Custodian fee | 11,701 |
Legal fees | 9,744 |
Audit and tax fees | 48,504 |
Trustees' fees and expenses | 5,860 |
Reports to shareholders | 23,774 |
Other | 14,233 |
Total expenses before expense reductions | 696,207 |
Expense reductions | (809) |
Total expenses after expense reductions | 695,398 |
Net investment income (loss) | 2,528,721 |
Realized and Unrealized Gain (Loss) |
Net realized gain (loss) from: Investments | 4,576,974 |
Futures | (504,977) |
| 4,071,997 |
Change in net unrealized appreciation (depreciation) on: Investments | (992,270) |
Futures | 534,420 |
| (457,850) |
Net gain (loss) | 3,614,147 |
Net increase (decrease) in net assets resulting from operations | $ 6,142,868 |
The accompanying notes are an integral part of the financial statements.
Statement of Changes in Net Assets
Increase (Decrease) in Net Assets | Years Ended December 31, |
2010 | 2009 |
Operations: Net investment income (loss) | $ 2,528,721 | $ 5,563,396 |
Net realized gain (loss) | 4,071,997 | (34,052,154) |
Change in net unrealized appreciation (depreciation) | (457,850) | 38,146,016 |
Net increase (decrease) in net assets resulting from operations | 6,142,868 | 9,657,258 |
Distributions to shareholders from: Net investment income: Class A | (5,749,285) | (8,879,629) |
Class B | — | (2,500,347) |
Total distributions | (5,749,285) | (11,379,976) |
Fund share transactions: Class A Proceeds from shares sold | 26,314,018 | 10,272,493 |
Shares converted* | 53,582 | — |
Reinvestment of distributions | 5,749,285 | 8,879,629 |
Payments for shares redeemed | (38,312,024) | (33,814,458) |
Net increase (decrease) in net assets from Class A share transactions | (6,195,139) | (14,662,336) |
Class B Proceeds from shares sold | 785 | 2,365,047 |
Shares converted* | (53,582) | — |
Reinvestment of distributions | — | 2,500,347 |
Payments for shares redeemed | (78) | (36,868,329) |
Net increase (decrease) in net assets from Class B share transactions | (52,875) | (32,002,935) |
Increase (decrease) in net assets | (5,854,431) | (48,387,989) |
Net assets at beginning of period | 93,702,683 | 142,090,672 |
Net assets at end of period (including undistributed net investment income of $2,279,173 and $5,499,737, respectively) | $ 87,848,252 | $ 93,702,683 |
Other Information |
Class A Shares outstanding at beginning of period | 10,676,602 | 12,351,718 |
Shares sold | 3,026,894 | 1,188,797 |
Shares converted* | 5,994 | — |
Shares issued to shareholders in reinvestment of distributions | 681,204 | 1,088,190 |
Shares redeemed | (4,353,007) | (3,952,103) |
Net increase (decrease) in Class A shares | (638,915) | (1,675,116) |
Shares outstanding at end of period | 10,037,687 | 10,676,602 |
Class B Shares outstanding at beginning of period | 5,948 | 3,628,194 |
Shares sold | 89 | 275,459 |
Shares converted* | (6,028) | — |
Shares issued to shareholders in reinvestment of distributions | (9) | 305,666 |
Shares redeemed | — | (4,203,371) |
Net increase (decrease) in Class B shares | (5,948) | (3,622,246) |
Shares outstanding at end of period | — | 5,948 |
* On February 5, 2010, Class B shares converted into Class A shares.
The accompanying notes are an integral part of the financial statements.
Financial Highlights
Class A Years Ended December 31, | 2010 | 2009 | 2008 | 2007 | 2006 |
Selected Per Share Date |
Net asset value, beginning of period | $ 8.77 | $ 8.90 | $ 11.82 | $ 11.86 | $ 11.81 |
Income (loss) from investment operations: Net investment incomea | .23 | .39 | .57 | .56 | .53 |
Net realized and unrealized gain (loss) | .32 | .24 | (2.72) | (.08) | (.05) |
Total from investment operations | .55 | .63 | (2.15) | .48 | .48 |
Less distributions from: Net investment income | (.57) | (.76) | (.77) | (.52) | (.43) |
Net realized gains | — | — | — | — | (.00)* |
Total distributions | (.57) | (.76) | (.77) | (.52) | (.43) |
Net asset value, end of period | $ 8.75 | $ 8.77 | $ 8.90 | $ 11.82 | $ 11.86 |
Total Return (%) | 6.51 | 7.72c | (19.33)b | 4.17 | 4.26 |
Ratios to Average Net Assets and Supplemental Data |
Net assets, end of period ($ millions) | 88 | 94 | 110 | 186 | 277 |
Ratio of expenses before expense reductions (%) | .72 | .59 | .70 | .66 | .68 |
Ratio of expenses after expense reductions (%) | .72 | .59 | .70 | .66 | .68 |
Ratio of net investment income (%) | 2.62 | 4.50 | 5.36 | 4.78 | 4.56 |
Portfolio turnover rate (%) | 356 | 222 | 215 | 209 | 198 |
a Based on average shares outstanding during the period. b Total returns would have been lower had certain expenses not been reduced. c Includes a reimbursement from the Advisor to reimburse the effect of losses incurred as the result of certain operation errors during the period. Excluding this reimbursement, total return would have been 0.02% lower. * Amount is less than $.005. |
Performance Summary December 31, 2010
DWS Diversified International Equity VIP
All performance shown is historical, assumes reinvestment of all dividend and capital gain distributions and does not guarantee future results. Investment return and principal value fluctuate with changing market conditions so that, when redeemed, shares may be worth more or less than their original cost. Current performance may be lower or higher than the performance data quoted. Please contact your participating insurance company for the Fund's most recent month-end performance. Performance doesn't reflect charges and fees ("contract charges") associated with the separate account that invests in the Fund or any variable life insurance policy or variable annuity contract for which the Fund is an investment option. These charges and fees will reduce returns.
The gross expense ratio of the Fund, as stated in the fee table of the prospectus dated May 1, 2010 is 0.96% for Class A shares and may differ from the expense ratio disclosed in the Financial Highlights table in this report.
Risk Considerations
Investing in foreign securities, particularly those of emerging markets, presents certain risks, such as currency fluctuations, political and economic changes, and market risks. Stocks may decline in value. See the prospectus for details.
Fund returns for the 3-year, 5-year and 10-year periods shown reflect a fee waiver and/or expense reimbursement. Without this waiver/reimbursement, returns would have been lower.
Growth of an Assumed $10,000 Investment in DWS Diversified International Equity VIP |
[] DWS Diversified International Equity VIP — Class A [] MSCI EAFE® Index | The Morgan Stanley Capital International (MSCI) EAFE® Index is an unmanaged, free float-adjusted, market capitalization index that tracks international stock performance in the 21 developed markets of Europe, Australasia and the Far East. The MSCI indices are calculated using closing local market prices and translates into US dollars using the London close foreign exchange rates. Index returns assume reinvestment of dividends and, unlike fund returns, do not reflect any fees or expenses. It is not possible to invest directly into an index. |
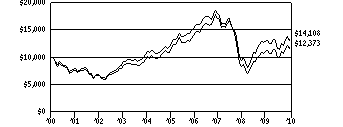 | |
Yearly periods ended December 31 | |
Comparative Results |
DWS Diversified International Equity VIP | 1-Year | 3-Year | 5-Year | 10-Year |
Class A | Growth of $10,000 | $11,093 | $7,346 | $10,765 | $12,373 |
Average annual total return | 10.93% | -9.77% | 1.48% | 2.15% |
MSCI EAFE Index | Growth of $10,000 | $10,775 | $8,040 | $11,292 | $14,108 |
Average annual total return | 7.75% | -7.02% | 2.46% | 3.50% |
The growth of $10,000 is cumulative.
Information About Your Fund's Expenses
DWS Diversified International Equity VIP
As an investor of the Fund, you incur two types of costs: ongoing expenses and transaction costs. Ongoing expenses include management fees and other Fund expenses. Examples of transaction costs include contract charges, redemption fees and account maintenance fees, which are not shown in this section. The following tables are intended to help you understand your ongoing expenses (in dollars) of investing in the Fund and to help you compare these expenses with the ongoing expenses of investing in other mutual funds. The example in the table is based on an investment of $1,000 invested at the beginning of the six-month period and held for the entire period (July 1, 2010 to December 31, 2010).
The tables illustrate your Fund's expenses in two ways:
• Actual Fund Return. This helps you estimate the actual dollar amount of ongoing expenses (but not transaction costs) paid on a $1,000 investment in the Fund using the Fund's actual return during the period. To estimate the expenses you paid over the period, simply divide your account value by $1,000 (for example, an $8,600 account value divided by $1,000 = 8.6), then multiply the result by the number in the "Expenses Paid per $1,000" line under the share class you hold.
• Hypothetical 5% Fund Return. This helps you to compare your Fund's ongoing expenses (but not transaction costs) with those of other mutual funds using the Fund's actual expense ratio and a hypothetical rate of return of 5% per year before expenses. Examples using a 5% hypothetical Fund return may be found in the shareholder reports of other mutual funds. The hypothetical account values and expenses may not be used to estimate the actual ending account balance or expenses you paid for the period.
Please note that the expenses shown in these tables are meant to highlight your ongoing expenses only and do not reflect any transaction costs. The "Expenses Paid per $1,000" line of the tables is useful in comparing ongoing expenses only and will not help you determine the relative total expense of owning different funds. If these transaction costs had been included, your costs would have been higher.
Expenses and Value of a $1,000 Investment for the six months ended December 31, 2010 |
Actual Fund Return | Class A | |
Beginning Account Value 7/1/10 | $ 1,000.00 | |
Ending Account Value 12/31/10 | $ 1,245.00 | |
Expenses Paid per $1,000* | $ 5.21 | |
Hypothetical 5% Fund Return | Class A | |
Beginning Account Value 7/1/10 | $ 1,000.00 | |
Ending Account Value 12/31/10 | $ 1,020.57 | |
Expenses Paid per $1,000* | $ 4.69 | |
* Expenses are equal to the Fund's annualized expense ratio, multiplied by the average account value over the period, multiplied by the number of days in the most recent six-month period, then divided by 365.
Annualized Expense Ratio | Class A | |
DWS Variable Series II — DWS Diversified International Equity VIP | .92% | |
For more information, please refer to the Fund's prospectus.
These tables do not reflect charges and fees ("contract charges") associated with the separate account that invests in the Fund or any variable life insurance policy or variable annuity contract for which the Fund is an investment option.
Management Summary December 31, 2010
DWS Diversified International Equity VIP
International equities withstood both the European debt crisis and the sluggish growth in Japan to finish 2010 with a gain of 7.75%, as measured by the MSCI EAFE Index. The Class A shares of the Fund returned 10.93% (unadjusted for contract charges), comfortably outpacing the benchmark.
In managing the Fund, we use a top-down approach based on the principle that country and sector, rather than stock selection, are the primary drivers of return. We divide the universe of international stocks into "risk units" according to sector and country: "UK Financials," for example. We assign these units weights to maximize diversification potential, and we rebalance the portfolio on a quarterly basis to maintain diversification.
The Fund's underweight in the financial sector made a substantial contribution to its return.1 Our overall weighting in financials was less than 40% of the benchmark weight, which added substantial value at a time in which financials were one of the worst-performing sectors in the index. The primary reason for the sector's shortfall was the concern about European banks' exposure to the poor-performing debt of the region's smaller economies. Accordingly, our underweights in the financial sectors of Spain, France and Italy boosted our return.
Our position in the emerging markets also made a positive contribution to the Fund's return. The Fund is invested in two exchanged-traded funds, or ETFs — Vanguard Emerging Markets and iShares MSCI Emerging Markets Index — that together provide the Fund with diversified emerging-markets exposure.2 The MCSI Emerging Markets Index returned 18.88% during 2010, well ahead of the MSCI EAFE Index.
The Fund's largest detractors were generally its underweights in the most economically sensitive sectors of the market, such as the materials, industrials and consumer discretionary sectors. Among risk units, the largest negative contributions came from our underweights in UK materials, Japan industrials and Australia materials.
We believe our proprietary investment process makes this a unique product within the universe of international investments. For investors looking for a way to diversify their domestic portfolios, DWS Diversified International Equity VIP offers a compelling combination of extensive diversification, low turnover and an approach that looks beyond market capitalization to structure a more optimized portfolio.
Robert Wang
Russell Shtern, CFA
Portfolio Managers, QS Investors, LLC
Subadvisor to the Fund
The Morgan Stanley Capital International (MSCI) EAFE Index is an unmanaged, free float-adjusted, market capitalization index that tracks international stock performance in the 21 developed markets of Europe, Australasia and the Far East. The index is calculated using closing local market prices and translates into US dollars using the London close foreign exchange rates.
The Vanguard Emerging Markets invests in stocks of companies located in emerging markets around the world, such as Brazil, Russia, China, Korea and Taiwan. The fund seeks to closely track the return of the MSCI Emerging Markets Index over the long term.
The iShares MSCI Emerging Markets Index seeks to provide investment results that correspond generally to the price and yield performance, before fees and expenses, of publicly traded securities in emerging markets, as represented by the MSCI Emerging Markets Index.
The Morgan Stanley Capital International (MSCI) Emerging Markets Index is an unmanaged, capitalization-weighted index of companies in a universe of 26 emerging markets. The index is calculated using closing local market prices and translates into US dollars using the London close foreign exchange rates.
Index returns assume reinvested dividends and, unlike fund returns, do not reflect any fees or expenses. It is not possible to invest directly into an index.
1 "Overweight" means the Fund holds a higher weighting in a given sector or security than the benchmark. "Underweight" means the Fund holds a lower weighting.
2 An exchange-traded fund (ETF) is a security that tracks an index, a commodity or a basket of assets like an index fund, but trades like a stock on an exchange.
Portfolio Summary
DWS Diversified International Equity VIP
Asset Allocation (As a % of Investment Portfolio excluding Securities Lending Collateral) | 12/31/10 | 12/31/09 |
| | |
Common Stocks | 87% | 87% |
Exchange-Traded Funds | 9% | 9% |
Cash Equivalents* | 3% | 3% |
Preferred Stocks | 1% | 1% |
Government & Agency Obligations | — | 0% |
| 100% | 100% |
Sector Diversification (As a % of Common Stocks, Preferred Stocks and Rights) | 12/31/10 | 12/31/09 |
| | |
Telecommunication Services | 16% | 15% |
Consumer Staples | 12% | 14% |
Materials | 11% | 9% |
Industrials | 11% | 9% |
Financials | 10% | 10% |
Health Care | 9% | 13% |
Energy | 9% | 6% |
Utilities | 8% | 9% |
Consumer Discretionary | 8% | 9% |
Information Technology | 6% | 6% |
| 100% | 100% |
Geographical Diversification (As a % of Investment Portfolio excluding Cash Equivalents and Securities Lending Collateral) | 12/31/10 | 12/31/09 |
| | |
Continental Europe | 49% | 53% |
Japan | 21% | 16% |
Emerging Markets | 10% | 9% |
United Kingdom | 7% | 7% |
Canada | 5% | 5% |
Australia | 4% | 6% |
Asia (excluding Japan) | 4% | 4% |
Other | — | 0% |
| 100% | 100% |
* In order to keep cash on hand to meet shareholder redemptions or other needs while maintaining exposure to the market, the Fund invests in futures contracts.
Asset allocation, sector and geographical diversifications are subject to change.
For more complete details about the Fund's investment portfolio, see page 81.
Following the Fund's fiscal first and third quarter-end, a complete portfolio holdings listing is filed with the SEC on Form N-Q. The form will be available on the SEC's Web site at www.sec.gov, and it also may be reviewed and copied at the SEC's Public Reference Room in Washington, D.C. Information on the operation of the SEC's Public Reference Room may be obtained by calling (800) SEC-0330. The Fund's portfolio holdings are also posted on www.dws-investments.com from time to time. Please see the Fund's current prospectus for more information.
Investment Portfolio December 31, 2010
DWS Diversified International Equity VIP
|
Shares
| Value ($) |
| |
Common Stocks 86.4% |
Australia 4.3% |
Asciano Ltd.* | 17,279 | 28,188 |
Australia & New Zealand Banking Group Ltd. | 2,823 | 67,420 |
BHP Billiton Ltd. | 9,579 | 443,332 |
Brambles Ltd. | 13,105 | 95,435 |
Coca-Cola Amatil Ltd. | 3,584 | 39,810 |
Cochlear Ltd. | 862 | 70,894 |
Commonwealth Bank of Australia | 1,574 | 81,734 |
Crown Ltd. | 9,187 | 77,521 |
CSL Ltd. | 8,694 | 322,699 |
Fairfax Media Ltd. | 54,011 | 77,339 |
Foster's Group Ltd. | 10,776 | 62,603 |
Leighton Holdings Ltd. | 1,643 | 51,725 |
National Australia Bank Ltd. | 2,600 | 63,025 |
Newcrest Mining Ltd. | 1,579 | 65,311 |
Origin Energy Ltd. | 8,027 | 136,779 |
Paladin Energy Ltd.* | 7,326 | 36,941 |
Qantas Airways Ltd.* | 18,444 | 47,916 |
QBE Insurance Group Ltd. | 2,063 | 38,297 |
Rio Tinto Ltd. | 900 | 78,677 |
Santos Ltd. | 9,683 | 130,235 |
Sonic Healthcare Ltd. | 5,537 | 65,694 |
TABCORP Holdings Ltd. | 15,130 | 110,027 |
Tatts Group Ltd. | 24,689 | 65,150 |
Telstra Corp., Ltd. | 144,475 | 412,276 |
Toll Holdings Ltd. | 7,945 | 46,563 |
Transurban Group (Units) | 14,907 | 78,064 |
Wesfarmers Ltd. | 5,593 | 183,057 |
Westfield Group (REIT) (Units) | 3,912 | 38,331 |
Westfield Retail Trust (REIT)* | 3,912 | 10,283 |
Westpac Banking Corp. | 2,569 | 58,358 |
Woodside Petroleum Ltd. | 5,329 | 231,973 |
Woolworths Ltd. | 6,442 | 177,702 |
WorleyParsons Ltd. | 2,509 | 68,620 |
(Cost $2,231,498) | 3,561,979 |
Austria 0.5% |
Erste Group Bank AG | 3,997 | 187,838 |
Immofinanz AG* | 21,500 | 91,676 |
Raiffeisen Bank International AG | 1,267 | 69,401 |
Vienna Insurance Group AG Wiener Versicherung Gruppe | 1,323 | 68,751 |
(Cost $249,456) | 417,666 |
Belgium 1.3% |
Ageas | 27,095 | 61,914 |
Anheuser-Busch InBev NV | 6,331 | 362,093 |
Compagnie Nationale a Portefeuille | 907 | 44,360 |
Delhaize Group | 1,198 | 88,481 |
Dexia SA* | 9,616 | 33,409 |
Groupe Bruxelles Lambert SA | 588 | 49,447 |
KBC Groep NV* | 1,952 | 66,516 |
Solvay SA | 1,904 | 202,909 |
Umicore | 3,759 | 195,501 |
(Cost $778,860) | 1,104,630 |
Bermuda 0.2% |
Seadrill Ltd. (Cost $63,651) | 4,800 | 162,369 |
|
Shares
| Value ($) |
| |
Canada 4.9% |
Agnico-Eagle Mines Ltd. | 700 | 53,927 |
Bank of Montreal | 700 | 40,467 |
Bank of Nova Scotia | 1,100 | 63,170 |
Barrick Gold Corp. | 2,600 | 138,904 |
BCE, Inc. | 4,300 | 152,833 |
Bombardier, Inc. "B" | 8,400 | 42,325 |
Canadian Imperial Bank of Commerce | 400 | 31,512 |
Canadian National Railway Co. | 3,100 | 206,864 |
Canadian Natural Resources Ltd. | 2,800 | 124,892 |
Canadian Pacific Railway Ltd. | 1,200 | 77,989 |
Canadian Tire Corp., Ltd. "A" | 1,000 | 68,581 |
Canadian Utilities Ltd. "A" | 2,800 | 153,193 |
CGI Group, Inc. "A"* | 4,600 | 79,574 |
EnCana Corp. | 1,500 | 43,885 |
Fortis, Inc. | 5,800 | 198,214 |
George Weston Ltd. | 800 | 67,746 |
Gildan Activewear, Inc.* | 900 | 25,661 |
Goldcorp, Inc. | 1,800 | 83,057 |
Imperial Oil Ltd. | 2,100 | 85,707 |
Kinross Gold Corp. | 2,300 | 43,742 |
Loblaw Companies Ltd. | 2,100 | 85,263 |
Magna International, Inc. "A" | 1,906 | 99,508 |
Manulife Financial Corp. | 2,800 | 48,295 |
Metro, Inc. "A" | 1,700 | 77,280 |
Open Text Corp.* | 700 | 32,195 |
Potash Corp. of Saskatchewan, Inc. | 700 | 108,748 |
Research In Motion Ltd.* | 7,100 | 414,661 |
Rogers Communications, Inc. "B" (a) | 5,000 | 173,992 |
Royal Bank of Canada | 1,400 | 73,668 |
Saputo, Inc. | 2,200 | 87,575 |
Shaw Communications, Inc. "B" | 3,800 | 81,595 |
Shoppers Drug Mart Corp. | 2,900 | 115,294 |
SNC-Lavalin Group, Inc. | 1,200 | 72,135 |
Suncor Energy, Inc. | 3,520 | 135,518 |
Teck Resources Ltd. "B" | 1,500 | 93,216 |
Telus Corp. | 1,700 | 73,946 |
Thomson Reuters Corp. (b) | 3,000 | 112,360 |
Thomson Reuters Corp. (b) | 1,158 | 43,159 |
Tim Hortons, Inc. | 2,400 | 99,205 |
Toronto-Dominion Bank | 1,000 | 74,676 |
TransAlta Corp. | 8,100 | 172,297 |
Viterra, Inc.* | 4,900 | 45,733 |
(Cost $2,788,578) | 4,102,562 |
Cyprus 0.0% |
Bank of Cyprus Public Co., Ltd. (Cost $60,706) | 11,062 | 38,138 |
Denmark 2.2% |
A P Moller-Maersk AS "A" | 10 | 88,121 |
A P Moller-Maersk AS "B" | 25 | 226,448 |
Carlsberg AS "B" | 5,037 | 504,084 |
Coloplast AS "B" | 299 | 40,638 |
Danske Bank AS* | 12,075 | 309,525 |
DSV AS | 3,456 | 76,339 |
Novo Nordisk AS "B" | 3,809 | 428,722 |
Tryg AS | 621 | 28,673 |
Vestas Wind Systems AS* | 3,931 | 124,142 |
|
Shares
| Value ($) |
| |
William Demant Holding AS* | 427 | 31,543 |
(Cost $1,278,483) | 1,858,235 |
Finland 3.1% |
Fortum Oyj | 22,604 | 685,753 |
Kone Oyj "B" | 3,962 | 220,119 |
Metso Corp. | 3,040 | 169,715 |
Nokia Oyj | 37,878 | 392,071 |
Outokumpu Oyj | 4,027 | 74,775 |
Pohjola Bank PLC | 5,199 | 62,309 |
Rautaruukki Oyj | 2,774 | 64,975 |
Sampo Oyj "A" | 9,439 | 253,037 |
Stora Enso Oyj "R" | 19,919 | 204,757 |
UPM-Kymmene Oyj | 16,621 | 293,846 |
Wartsila Corp. | 1,893 | 144,496 |
(Cost $1,735,409) | 2,565,853 |
France 7.2% |
Air Liquide SA | 2,497 | 315,789 |
Alcatel-Lucent* | 27,533 | 80,207 |
Atos Origin SA* | 697 | 37,107 |
AXA SA | 3,081 | 51,258 |
BNP Paribas | 1,550 | 98,613 |
Bouygues SA | 1,062 | 45,775 |
Cap Gemini | 1,723 | 80,425 |
Carrefour SA | 6,517 | 268,662 |
Casino Guichard-Perrachon SA | 996 | 97,093 |
Compagnie de Saint-Gobain | 1,739 | 89,467 |
Compagnie Generale de Geophysique-Veritas* | 1,118 | 34,026 |
Credit Agricole SA | 3,149 | 39,993 |
DANONE SA | 6,358 | 399,491 |
Dassault Systemes SA | 1,112 | 83,838 |
Electricite de France | 964 | 39,541 |
Essilor International SA | 3,351 | 215,725 |
France Telecom SA | 50,588 | 1,054,234 |
GDF Suez | 6,014 | 215,780 |
Iliad SA | 426 | 46,338 |
L'Oreal SA | 2,731 | 303,195 |
Lafarge SA | 1,526 | 95,679 |
LVMH Moet Hennessy Louis Vuitton SA | 420 | 69,089 |
Pernod Ricard SA | 2,240 | 210,610 |
Sanofi-Aventis | 13,946 | 891,735 |
Schneider Electric SA | 627 | 93,840 |
Societe Generale | 1,401 | 75,298 |
Suez Environnement Co. | 1,869 | 38,587 |
Technip SA | 213 | 19,668 |
Total SA | 10,370 | 549,447 |
Unibail-Rodamco SE (REIT) | 265 | 52,410 |
Vallourec SA | 689 | 72,368 |
Veolia Environnement | 2,122 | 62,015 |
Vinci SA | 1,171 | 63,656 |
Vivendi | 3,089 | 83,382 |
(Cost $5,022,648) | 5,974,341 |
Germany 4.9% |
Allianz SE (Registered) | 1,458 | 173,254 |
BASF SE | 2,590 | 206,619 |
Bayer AG | 2,784 | 205,730 |
Bayerische Motoren Werke (BMW) AG | 649 | 51,004 |
Beiersdorf AG | 3,770 | 209,184 |
Daimler AG (Registered)* | 1,906 | 129,162 |
Deutsche Boerse AG | 688 | 47,619 |
|
Shares
| Value ($) |
| |
Deutsche Post AG (Registered) | 3,555 | 60,295 |
Deutsche Telekom AG (Registered) | 81,553 | 1,053,208 |
E.ON AG | 6,205 | 190,309 |
HeidelbergCement AG | 833 | 52,233 |
Henkel AG & Co. KGaA | 4,251 | 219,399 |
Infineon Technologies AG* | 8,199 | 76,227 |
K+S AG | 629 | 47,406 |
Linde AG | 769 | 116,725 |
MAN SE | 245 | 29,130 |
Merck KGaA | 430 | 34,415 |
Metro AG | 4,361 | 313,982 |
Muenchener Rueckversicherungs- Gesellschaft AG (Registered) | 598 | 90,704 |
RWE AG | 1,021 | 68,116 |
SAP AG | 5,623 | 286,324 |
Siemens AG (Registered) | 2,260 | 279,799 |
Suedzucker AG | 3,769 | 100,244 |
ThyssenKrupp AG | 1,086 | 44,993 |
(Cost $2,921,913) | 4,086,081 |
Greece 0.3% |
Alpha Bank AE* | 9,054 | 45,976 |
EFG Eurobank Ergasias* | 4,435 | 22,224 |
National Bank of Greece SA* | 18,976 | 153,414 |
Piraeus Bank SA* | 7,558 | 36,864 |
(Cost $428,467) | 258,478 |
Hong Kong 2.2% |
Cheung Kong (Holdings) Ltd. | 5,000 | 77,064 |
Cheung Kong Infrastructure Holdings Ltd. | 7,000 | 32,060 |
CLP Holdings Ltd. | 19,500 | 158,804 |
Esprit Holdings Ltd. | 18,495 | 87,802 |
Genting Singapore PLC* | 116,000 | 197,951 |
Hang Seng Bank Ltd. | 2,200 | 36,116 |
Hong Kong & China Gas Co., Ltd. | 51,500 | 122,310 |
Hong Kong Exchanges & Clearing Ltd. | 3,500 | 79,386 |
HongKong Electric Holdings Ltd. | 17,500 | 110,320 |
Hutchison Whampoa Ltd. | 26,000 | 268,269 |
Li & Fung Ltd. | 26,000 | 152,030 |
MTR Corp., Ltd. | 28,500 | 103,766 |
Noble Group Ltd. | 29,363 | 49,649 |
NWS Holdings Ltd. | 30,000 | 45,466 |
Shangri-La Asia Ltd. | 24,000 | 65,150 |
SJM Holdings Ltd. | 16,000 | 25,401 |
Sun Hung Kai Properties Ltd. | 5,000 | 82,724 |
Swire Pacific Ltd. "A" | 3,500 | 57,547 |
Yue Yuen Industrial (Holdings) Ltd. | 14,500 | 52,047 |
(Cost $1,126,048) | 1,803,862 |
Ireland 0.7% |
CRH PLC (b) | 20,956 | 434,054 |
CRH PLC (b) | 1,456 | 30,449 |
Experian PLC | 6,430 | 80,000 |
(Cost $437,178) | 544,503 |
Italy 3.7% |
A2A SpA | 20,926 | 28,791 |
Assicurazioni Generali SpA | 3,242 | 61,622 |
Atlantia SpA | 5,502 | 112,337 |
Enel SpA | 46,072 | 230,142 |
Eni SpA | 20,641 | 451,027 |
Fiat SpA | 12,889 | 265,393 |
Finmeccanica SpA | 12,332 | 140,217 |
Intesa Sanpaolo | 25,029 | 67,876 |
|
Shares
| Value ($) |
| |
Luxottica Group SpA | 2,649 | 80,626 |
Mediaset SpA | 10,870 | 65,803 |
Prysmian SpA | 6,182 | 105,278 |
Saipem SpA | 2,103 | 103,613 |
Snam Rete Gas SpA | 9,753 | 48,499 |
Telecom Italia SpA | 552,428 | 714,199 |
Telecom Italia SpA (RSP) | 372,172 | 404,058 |
Terna — Rete Elettrica Nationale SpA | 14,939 | 63,103 |
UBI Banca — Unione di Banche Italiane ScpA | 3,919 | 34,330 |
UniCredit SpA | 41,574 | 85,980 |
(Cost $2,699,436) | 3,062,894 |
Japan 20.1% |
AEON Co., Ltd. | 11,300 | 141,313 |
Ajinomoto Co., Inc. | 11,000 | 114,568 |
Alfresa Holdings Corp. | 1,000 | 44,374 |
Asahi Breweries Ltd. | 7,000 | 135,513 |
Asahi Glass Co., Ltd. | 8,000 | 93,400 |
Asahi Kasei Corp. | 14,000 | 91,320 |
Astellas Pharma, Inc. | 5,900 | 224,755 |
Canon, Inc. | 6,200 | 317,841 |
Central Japan Railway Co. | 5 | 41,861 |
Chubu Electric Power Co., Inc. | 8,600 | 211,388 |
Chugai Pharmaceutical Co., Ltd. | 3,700 | 67,859 |
Chugoku Electric Power Co., Inc. | 3,500 | 71,127 |
Cosmo Oil Co., Ltd. | 43,000 | 140,754 |
Dai-ichi Life Insurance Co., Ltd. | 47 | 76,280 |
Daiichi Sankyo Co., Ltd. | 9,500 | 207,835 |
Daikin Industries Ltd. | 1,100 | 38,978 |
Daiwa House Industry Co., Ltd. | 3,000 | 36,766 |
Daiwa Securities Group, Inc. | 10,000 | 51,423 |
Denso Corp. | 1,100 | 37,930 |
East Japan Railway Co. | 926 | 60,196 |
Eisai Co., Ltd. (a) | 3,700 | 133,913 |
Electric Power Development Co., Ltd. | 2,600 | 81,558 |
FamilyMart Co., Ltd. | 1,400 | 52,743 |
FANUC Corp. | 900 | 138,066 |
FUJIFILM Holdings Corp. | 2,300 | 83,088 |
Fujitsu Ltd. | 13,000 | 90,394 |
Hisamitsu Pharmaceutical Co., Inc. | 900 | 37,898 |
Hitachi Ltd. | 18,000 | 96,042 |
Hokkaido Electric Power Co., Inc. | 2,400 | 49,068 |
Hokuriku Electric Power Co. | 2,800 | 68,793 |
Honda Motor Co., Ltd. | 2,900 | 114,619 |
HOYA | 2,100 | 50,957 |
Idemitsu Kosan Co., Ltd. | 1,500 | 159,151 |
INPEX Corp. | 102 | 596,635 |
ITOCHU Corp. | 6,000 | 60,680 |
Japan Petroleum Exploration Co., Ltd. | 2,300 | 87,453 |
Japan Prime Realty Investment Corp. (REIT) | 10 | 30,790 |
Japan Retail Fund Investment Corp. (REIT) | 20 | 38,352 |
Japan Tobacco, Inc. | 73 | 269,810 |
JFE Holdings, Inc. | 5,300 | 184,414 |
JX Holdings, Inc. | 106,320 | 720,011 |
Kansai Electric Power Co., Inc. | 9,900 | 244,348 |
Kao Corp. | 7,800 | 210,059 |
KDDI Corp. | 69 | 398,341 |
Keyence Corp. | 200 | 57,822 |
Kikkoman Corp. | 4,000 | 44,753 |
|
Shares
| Value ($) |
| |
Kirin Holdings Co., Ltd. | 14,000 | 196,265 |
Kobe Steel Ltd. | 33,000 | 83,641 |
Komatsu Ltd. | 4,200 | 126,962 |
Kubota Corp. | 10,000 | 94,620 |
Kuraray Co., Ltd. | 6,000 | 85,941 |
Kyocera Corp. | 800 | 81,591 |
Kyowa Hakko Kirin Co., Ltd. | 5,000 | 51,447 |
Kyushu Electric Power Co., Inc. | 4,800 | 107,579 |
Lawson, Inc. | 900 | 44,503 |
MEIJI Holdings Co., Ltd. | 1,200 | 54,215 |
Miraca Holdings, Inc. | 1,000 | 40,261 |
Mitsubishi Chemical Holdings Corp. | 12,000 | 81,380 |
Mitsubishi Corp. | 6,300 | 170,369 |
Mitsubishi Electric Corp. | 11,000 | 115,331 |
Mitsubishi Estate Co., Ltd. | 5,000 | 92,668 |
Mitsubishi Heavy Industries Ltd. | 18,000 | 67,574 |
Mitsubishi Materials Corp.* | 29,000 | 92,404 |
Mitsubishi Tanabe Pharma Corp. | 3,000 | 50,656 |
Mitsubishi UFJ Financial Group, Inc. | 51,400 | 277,722 |
Mitsui & Co., Ltd. | 5,000 | 82,495 |
Mitsui Fudosan Co., Ltd. | 3,000 | 59,759 |
Mitsui O.S.K Lines Ltd. | 7,000 | 47,717 |
Mizuho Financial Group, Inc. | 88,000 | 165,702 |
MS&AD Insurance Group Holdings, Inc. | 2,400 | 60,114 |
Murata Manufacturing Co., Ltd. | 1,300 | 91,029 |
NEC Corp. | 26,000 | 78,070 |
Nidec Corp. | 500 | 50,417 |
Nintendo Co., Ltd. | 500 | 146,692 |
Nippon Steel Corp. | 58,000 | 208,407 |
Nippon Telegraph & Telephone Corp. | 12,109 | 553,990 |
Nishi-Nippon City Bank Ltd. | 13,000 | 39,521 |
Nissan Motor Co., Ltd. | 6,000 | 57,065 |
Nisshin Seifun Group, Inc. | 4,000 | 50,755 |
Nissin Foods Holdings Co., Ltd. | 1,100 | 39,414 |
Nitto Denko Corp. | 1,900 | 89,405 |
NKSJ Holdings, Inc.* | 12,000 | 88,289 |
Nomura Holdings, Inc. | 12,000 | 76,048 |
Nomura Real Estate Office Fund, Inc. (REIT) | 7 | 50,506 |
NTT DoCoMo, Inc. | 354 | 618,098 |
OJI Paper Co., Ltd. | 11,000 | 53,224 |
Olympus Corp. | 3,500 | 105,835 |
Ono Pharmaceutical Co., Ltd. | 1,500 | 70,003 |
Oriental Land Co., Ltd. | 700 | 64,821 |
ORIX Corp. | 260 | 25,562 |
Osaka Gas Co., Ltd. | 30,000 | 116,371 |
Panasonic Corp. | 4,600 | 64,934 |
Resona Holdings, Inc. (a) | 2,600 | 15,595 |
Ricoh Co., Ltd. | 4,000 | 58,556 |
ROHM Co., Ltd. | 1,100 | 71,796 |
Santen Pharmaceutical Co., Ltd. | 1,300 | 45,151 |
Sapporo Hokuyo Holdings, Inc. | 10,400 | 48,644 |
Sapporo Holdings Ltd. | 7,000 | 31,715 |
Seven & I Holdings Co., Ltd. | 12,000 | 320,512 |
Sharp Corp. | 3,000 | 30,896 |
Shikoku Electric Power Co., Inc. | 2,400 | 70,587 |
Shin-Etsu Chemical Co., Ltd. | 4,100 | 221,962 |
Shionogi & Co., Ltd. | 5,000 | 98,446 |
Shiseido Co., Ltd. | 5,000 | 109,169 |
Showa Shell Sekiyu KK | 14,800 | 135,502 |
SOFTBANK Corp. | 17,300 | 598,557 |
Sony Corp. | 2,100 | 75,629 |
Sumitomo Chemical Co., Ltd. | 14,000 | 68,912 |
|
Shares
| Value ($) |
| |
Sumitomo Corp. | 5,300 | 74,925 |
Sumitomo Electric Industries Ltd. | 6,500 | 90,214 |
Sumitomo Metal Industries Ltd. | 26,000 | 63,987 |
Sumitomo Metal Mining Co., Ltd. | 4,000 | 69,812 |
Sumitomo Mitsui Financial Group, Inc. | 5,700 | 202,892 |
Sumitomo Realty & Development Co., Ltd. | 2,000 | 47,715 |
Sumitomo Trust & Banking Co., Ltd. | 9,000 | 56,720 |
Suzuken Co., Ltd. | 1,300 | 39,690 |
Sysmex Corp. | 1,100 | 76,235 |
T&D Holdings, Inc. | 1,800 | 45,599 |
Taisho Pharmaceutical Co., Ltd. | 2,000 | 43,759 |
Takeda Pharmaceutical Co., Ltd. | 10,200 | 501,659 |
TDK Corp. | 1,200 | 83,399 |
Terumo Corp. | 2,300 | 129,328 |
Tohoku Electric Power Co., Inc. | 5,600 | 124,836 |
Tokio Marine Holdings, Inc. | 2,200 | 65,711 |
Tokyo Electric Power Co., Inc. | 21,600 | 527,510 |
Tokyo Electron Ltd. | 900 | 56,898 |
Tokyo Gas Co., Ltd. | 31,000 | 137,415 |
TonenGeneral Sekiyu KK | 19,000 | 207,743 |
Toray Industries, Inc. | 10,000 | 59,696 |
Toshiba Corp. | 25,000 | 136,079 |
Toyo Suisan Kaisha Ltd. | 2,000 | 44,482 |
Toyota Motor Corp. | 4,600 | 181,144 |
Tsumura & Co. | 1,500 | 48,553 |
Unicharm Corp. | 1,500 | 59,585 |
UNY Co., Ltd. | 5,600 | 56,576 |
Yakult Honsha Co., Ltd. | 1,700 | 48,948 |
Yamaguchi Financial Group, Inc. | 3,000 | 30,368 |
(Cost $13,501,410) | 16,687,718 |
Luxembourg 0.5% |
ArcelorMittal | 6,320 | 239,681 |
Millicom International Cellular SA (SDR) | 943 | 90,465 |
Tenaris SA | 4,211 | 103,183 |
(Cost $232,092) | 433,329 |
Macau 0.2% |
Sands China Ltd.* | 32,000 | 70,811 |
Wynn Macau Ltd. | 30,000 | 67,003 |
(Cost $91,291) | 137,814 |
Netherlands 5.2% |
AEGON NV* | 13,839 | 84,624 |
Akzo Nobel NV | 4,125 | 256,236 |
ASML Holding NV | 11,111 | 429,097 |
Heineken Holding NV | 913 | 39,682 |
Heineken NV | 3,364 | 164,933 |
ING Groep NV (CVA)* | 22,591 | 219,771 |
Koninklijke (Royal) KPN NV | 73,369 | 1,070,630 |
Koninklijke Ahold NV | 14,948 | 197,273 |
Koninklijke DSM NV | 2,400 | 136,639 |
Koninklijke Philips Electronics NV | 8,829 | 270,415 |
Randstad Holding NV* | 1,215 | 64,132 |
Reed Elsevier NV | 17,980 | 222,415 |
Royal Dutch Shell PLC "A" | 3,949 | 131,665 |
Royal Dutch Shell PLC "B" | 3,179 | 104,827 |
TNT NV | 4,235 | 111,770 |
Unilever NV (CVA) | 21,114 | 657,401 |
Wolters Kluwer NV | 9,269 | 203,133 |
(Cost $3,155,279) | 4,364,643 |
|
Shares
| Value ($) |
| |
Norway 2.7% |
Aker Solutions ASA | 3,600 | 61,310 |
DnB NOR ASA | 24,684 | 346,421 |
Norsk Hydro ASA | 35,480 | 259,456 |
Orkla ASA | 33,980 | 330,413 |
Renewable Energy Corp. ASA* | 6,626 | 20,237 |
Statoil ASA | 17,400 | 413,572 |
Telenor ASA | 25,300 | 411,353 |
Yara International ASA | 7,642 | 442,069 |
(Cost $1,356,007) | 2,284,831 |
Portugal 0.3% |
EDP — Energias de Portugal SA (Cost $266,681) | 79,204 | 263,648 |
Singapore 1.7% |
CapitaLand Ltd. | 20,000 | 57,817 |
DBS Group Holdings Ltd. | 10,000 | 111,583 |
Fraser & Neave Ltd. | 15,000 | 74,921 |
Jardine Cycle & Carriage Ltd. | 2,000 | 57,038 |
Keppel Corp., Ltd. | 14,000 | 123,489 |
Oversea-Chinese Banking Corp., Ltd. | 14,000 | 107,780 |
SembCorp Industries Ltd. | 19,000 | 76,098 |
Singapore Airlines Ltd. | 6,000 | 71,532 |
Singapore Exchange Ltd. | 7,000 | 45,927 |
Singapore Press Holdings Ltd. | 37,000 | 114,747 |
Singapore Technologies Engineering Ltd. | 15,000 | 39,974 |
Singapore Telecommunications Ltd. | 167,000 | 396,891 |
United Overseas Bank Ltd. | 7,000 | 99,271 |
(Cost $773,177) | 1,377,068 |
Spain 3.8% |
Abertis Infraestructuras SA | 5,893 | 106,010 |
ACS, Actividades de Construccion y Servicios SA (a) | 2,437 | 114,277 |
Banco Bilbao Vizcaya Argentaria SA | 9,332 | 94,405 |
Banco Santander SA | 14,432 | 153,345 |
EDP Renovaveis SA* | 11,598 | 67,217 |
Enagas | 2,258 | 44,983 |
Ferrovial SA | 9,049 | 89,992 |
Gas Natural SDG SA | 2,049 | 31,759 |
Gestevision Telecinco SA | 3,887 | 42,760 |
Iberdrola Renovables | 11,066 | 39,296 |
Iberdrola SA | 31,585 | 243,338 |
Iberia Lineas Aereas de Espana SA* | 8,829 | 37,697 |
Industria de Diseno Textil SA | 4,356 | 326,437 |
Red Electrica Corporacion SA | 1,144 | 53,788 |
Repsol YPF SA | 22,674 | 632,404 |
Telefonica SA | 45,620 | 1,036,077 |
Zardoya Otis SA | 3,050 | 42,985 |
(Cost $2,508,005) | 3,156,770 |
Sweden 3.1% |
AB SKF "B" | 2,358 | 67,923 |
Assa Abloy AB "B" | 2,544 | 71,733 |
Atlas Copco AB "A" | 3,215 | 81,187 |
Boliden AB | 7,309 | 148,741 |
Electrolux AB "B" | 3,335 | 94,669 |
Hennes & Mauritz AB "B" | 11,314 | 376,974 |
Holmen AB "B" | 2,160 | 71,148 |
Husqvarna AB "B" | 7,799 | 65,087 |
Nordea Bank AB | 12,273 | 133,467 |
Sandvik AB | 5,637 | 109,770 |
Skandinaviska Enskilda Banken AB "A" | 6,486 | 54,090 |
|
Shares
| Value ($) |
| |
Skanska AB "B" | 3,667 | 72,717 |
SSAB AB "A" | 5,874 | 98,701 |
Svenska Cellulosa AB "B" | 18,870 | 297,735 |
Svenska Handelsbanken AB "A" | 2,807 | 89,680 |
Tele2 AB "B" | 4,023 | 84,051 |
Telefonaktiebolaget LM Ericsson "B" | 28,799 | 333,484 |
TeliaSonera AB | 21,657 | 171,703 |
Volvo AB "B"* | 7,507 | 133,796 |
(Cost $1,485,950) | 2,556,656 |
Switzerland 6.6% |
ABB Ltd. (Registered)* | 11,048 | 246,740 |
Adecco SA (Registered) | 824 | 53,911 |
Aryzta AG* | 543 | 25,085 |
Compagnie Financiere Richemont SA "A" | 4,125 | 242,678 |
Credit Suisse Group AG (Registered) | 1,994 | 80,455 |
Geberit AG (Registered) | 332 | 76,769 |
Givaudan SA (Registered) | 102 | 110,133 |
Holcim Ltd. (Registered) | 2,786 | 210,546 |
Lonza Group AG (Registered) | 466 | 37,382 |
Nestle SA (Registered) | 19,171 | 1,122,990 |
Novartis AG (Registered) | 9,930 | 584,327 |
Roche Holding AG (Genusschein) | 3,411 | 500,027 |
Sika AG | 27 | 59,255 |
Sonova Holding AG (Registered) | 289 | 37,430 |
STMicroelectronics NV | 7,073 | 73,146 |
Swatch Group AG (Bearer) | 301 | 134,189 |
Swiss Reinsurance Co., Ltd. (Registered) | 1,091 | 59,420 |
Swisscom AG (Registered) | 2,760 | 1,214,110 |
Syngenta AG (Registered) | 861 | 252,195 |
UBS AG (Registered)* | 7,534 | 123,650 |
Wolseley PLC* | 2,345 | 74,804 |
Xstrata PLC | 2,858 | 67,084 |
Zurich Financial Services AG | 398 | 103,083 |
(Cost $3,299,178) | 5,489,409 |
United Kingdom 6.7% |
Anglo American PLC | 3,286 | 170,884 |
ARM Holdings PLC | 29,996 | 197,964 |
AstraZeneca PLC | 8,391 | 382,268 |
Autonomy Corp. PLC* | 5,572 | 130,744 |
BAE Systems PLC | 18,633 | 95,867 |
Barclays PLC | 8,467 | 34,540 |
BG Group PLC | 5,435 | 109,819 |
BHP Billiton PLC | 4,437 | 176,471 |
BP PLC | 25,484 | 184,973 |
British American Tobacco PLC | 2,268 | 87,110 |
British Sky Broadcasting Group PLC | 4,941 | 56,698 |
BT Group PLC | 57,356 | 161,678 |
Cable & Wireless Communications PLC | 24,059 | 18,204 |
Capita Group PLC | 5,549 | 60,257 |
Centrica PLC | 28,642 | 148,078 |
Compass Group PLC | 11,814 | 107,016 |
Diageo PLC | 2,849 | 52,636 |
GlaxoSmithKline PLC | 27,730 | 536,099 |
HSBC Holdings PLC | 12,924 | 131,195 |
Imperial Tobacco Group PLC | 881 | 27,032 |
Inmarsat PLC | 5,084 | 53,385 |
International Power PLC | 9,966 | 67,994 |
|
Shares
| Value ($) |
| |
Kingfisher PLC | 14,696 | 60,352 |
Lloyds Banking Group PLC* | 35,330 | 36,190 |
Marks & Spencer Group PLC | 8,450 | 48,613 |
National Grid PLC | 13,726 | 118,343 |
Next PLC | 1,325 | 40,800 |
Pearson PLC | 4,110 | 64,592 |
Reed Elsevier PLC | 7,134 | 60,229 |
Rio Tinto PLC | 2,348 | 164,240 |
Rolls-Royce Group PLC* | 12,478 | 121,201 |
SABMiller PLC | 1,731 | 60,898 |
Scottish & Southern Energy PLC | 5,665 | 108,196 |
Severn Trent PLC | 2,133 | 49,152 |
Shire PLC | 4,174 | 100,413 |
Smith & Nephew PLC | 6,163 | 65,003 |
Smiths Group PLC | 3,914 | 75,974 |
Standard Chartered PLC | 1,687 | 45,384 |
Tesco PLC | 11,554 | 76,559 |
The Sage Group PLC | 36,069 | 153,747 |
Unilever PLC | 1,529 | 46,795 |
United Utilities Group PLC | 6,323 | 58,360 |
Vodafone Group PLC | 342,837 | 886,229 |
William Morrison Supermarkets PLC | 8,072 | 33,678 |
WPP PLC | 7,538 | 92,786 |
(Cost $3,894,272) | 5,558,646 |
Total Common Stocks (Cost $52,385,673) | 71,852,123 |
|
Preferred Stocks 0.6% |
Germany |
Fresenius SE | 632 | 54,108 |
Henkel AG & Co. KGaA | 5,783 | 359,427 |
Volkswagen AG | 396 | 64,171 |
Total Preferred Stocks (Cost $216,838) | 477,706 |
|
Exchange-Traded Funds 9.6% |
Emerging Markets |
iShares MSCI Emerging Markets Index (a) | 83,800 | 3,990,556 |
Vanguard Emerging Markets (a) | 82,600 | 3,977,190 |
Total Exchange-Traded Funds (Cost $5,469,338) | 7,967,746 |
|
Securities Lending Collateral 7.9% |
Daily Assets Fund Institutional, 0.27% (c) (d) (Cost $6,610,195) | 6,610,195 | 6,610,195 |
|
Cash Equivalents 3.2% |
Central Cash Management Fund, 0.19% (c) (Cost $2,661,762) | 2,661,762 | 2,661,762 |
| % of Net Assets | Value ($) |
| |
Total Investment Portfolio (Cost $67,343,806)+ | 107.7 | 89,569,532 |
Other Assets and Liabilities, Net | (7.7) | (6,397,099) |
Net Assets | 100.0 | 83,172,433 |
* Non-income producing security.
+ The cost for federal income tax purposes was $67,805,906. At December 31, 2010, net unrealized appreciation for all securities based on tax cost was $21,763,626. This consisted of aggregate gross unrealized appreciation for all securities in which there was an excess of value over tax cost of $22,921,273 and aggregate gross unrealized depreciation for all securities in which there was an excess of tax cost over value of $1,157,647.
(a) All or a portion of these securities were on loan (see Notes to Financial Statements). The value of all securities loaned at December 31, 2010 amounted to $6,491,313, which is 7.8% of net assets.
(b) Securities with the same description are the same corporate entity but trade on different stock exchanges.
(c) Affiliated fund managed by Deutsche Investment Management Americas Inc. The rate shown is the annualized seven-day yield at period end.
(d) Represents collateral held in connection with securities lending. Income earned by the Fund is net of borrower rebates.
CVA: Certificaten Van Aandelen
MSCI: Morgan Stanley Capital International
REIT: Real Estate Investment Trust
RSP: Risparmio (Convertible Savings Shares)
SDR: Swedish Depositary Receipt
At December 31, 2010, open futures contracts purchased were as follows:
Futures | Currency | Expiration Date | Contracts | Notional Value ($) | Unrealized Appreciation (Depreciation) ($) |
ASX SPI 200 Index | AUD | 3/17/2011 | 2 | 241,892 | (3,375) |
DJ Euro Stoxx 50 Index | EUR | 3/18/2011 | 42 | 1,568,121 | (38,726) |
FTSE 100 Index | GBP | 3/18/2011 | 3 | 275,633 | 1,684 |
Nikkei 225 Index | USD | 3/10/2011 | 13 | 664,950 | (450) |
S&P TSX 60 Index | CAD | 3/17/2011 | 1 | 154,300 | 1,840 |
Total net unrealized depreciation | (39,027) |
Currency Abbreviations |
AUD Australian Dollar CAD Canadian Dollar EUR Euro GBP British Pound USD United States Dollar |
For information on the Fund's policy and additional disclosures regarding futures contracts, please refer to Note B in the accompanying Notes to Financial Statements.
Fair Value Measurements
Various inputs are used in determining the value of the Fund's investments. These inputs are summarized in three broad levels. Level 1 includes quoted prices in active markets for identical securities. Level 2 includes other significant observable inputs (including quoted prices for similar securities, interest rates, prepayment speeds, and credit risk). Level 3 includes significant unobservable inputs (including the Fund's own assumptions in determining the fair value of investments). The inputs or methodology used for valuing securities are not necessarily an indication of the risk associated with investing in those securities.
The following is a summary of the inputs used as of December 31, 2010 in valuing the Fund's investments. For information on the Fund's policy regarding the valuation of investments, please refer to the Security Valuation section of Note A in the accompanying Notes to Financial Statements.
Assets | Level 1 | Level 2 | Level 3 | Total |
|
Common and Preferred Stocks | | | | |
Australia | $ — | $ 3,561,979 | $ — | $ 3,561,979 |
Austria | — | 417,666 | — | 417,666 |
Belgium | — | 1,104,630 | — | 1,104,630 |
Bermuda | — | 162,369 | — | 162,369 |
Canada | 4,102,562 | — | — | 4,102,562 |
Cyprus | — | 38,138 | — | 38,138 |
Denmark | — | 1,858,235 | — | 1,858,235 |
Finland | — | 2,565,853 | — | 2,565,853 |
France | — | 5,974,341 | — | 5,974,341 |
Germany | — | 4,563,787 | — | 4,563,787 |
Greece | — | 258,478 | — | 258,478 |
Hong Kong | — | 1,803,862 | — | 1,803,862 |
Ireland | — | 544,503 | — | 544,503 |
Italy | — | 3,062,894 | — | 3,062,894 |
Japan | — | 16,687,718 | — | 16,687,718 |
Luxembourg | — | 433,329 | — | 433,329 |
Macau | — | 137,814 | — | 137,814 |
Netherlands | — | 4,364,643 | — | 4,364,643 |
Norway | — | 2,284,831 | — | 2,284,831 |
Portugal | — | 263,648 | — | 263,648 |
Singapore | — | 1,377,068 | — | 1,377,068 |
Spain | — | 3,156,770 | — | 3,156,770 |
Sweden | — | 2,556,656 | — | 2,556,656 |
Switzerland | — | 5,489,409 | — | 5,489,409 |
United Kingdom | — | 5,558,646 | — | 5,558,646 |
Exchange-Traded Funds | 7,967,746 | — | — | 7,967,746 |
Short-Term Investments (e) | 9,271,957 | — | — | 9,271,957 |
Total | $ 21,342,265 | $ 68,227,267 | $ — | $ 89,569,532 |
Liabilities | | | | |
Derivatives (f) | $ (39,027) | $ — | $ — | $ (39,027) |
Total | $ (39,027) | $ — | $ — | $ (39,027) |
There have been no significant transfers between Level 1 and Level 2 fair value measurements during the year ended December 31, 2010.
(e) See Investment Portfolio for additional detailed categorizations.
(f) Derivatives include unrealized appreciation (depreciation) on open futures contracts.
The accompanying notes are an integral part of the financial statements.
Statement of Assets and Liabilities
as of December 31, 2010 |
Assets |
Investments: Investments in unaffiliated securities, at value (cost $58,071,849) — including $6,491,313 of securities loaned | $ 80,297,575 |
Investment in Daily Assets Fund Institutional (cost $6,610,195)* | 6,610,195 |
Investment in Central Cash Management Fund (cost $2,661,762) | 2,661,762 |
Total investments, at value (cost $67,343,806) | 89,569,532 |
Foreign currency, at value (cost $87,151) | 88,902 |
Deposits with broker for open futures contracts | 281,548 |
Receivable for investments sold | 1,245 |
Receivable for Fund shares sold | 14,646 |
Dividends receivable | 70,486 |
Interest receivable | 1,119 |
Foreign taxes recoverable | 10,924 |
Other assets | 459 |
Total assets | 90,038,861 |
Liabilities |
Payable upon return of securities loaned | 6,610,195 |
Payable for Fund shares redeemed | 60,107 |
Payable for daily variation margin on open futures contracts | 39,027 |
Accrued management fee | 55,970 |
Other accrued expenses and payables | 101,129 |
Total liabilities | 6,866,428 |
Net assets, at value | $ 83,172,433 |
Net Assets Consist of |
Undistributed net investment income | 1,336,930 |
Net unrealized appreciation (depreciation) on: Investments | 22,225,726 |
Futures | (39,027) |
Foreign currency | 2,382 |
Accumulated net realized gain (loss) | (69,565,313) |
Paid-in capital | 129,211,735 |
Net assets, at value | $ 83,172,433 |
Class A Net Asset Value, offering and redemption price per share ($83,172,433 ÷ 10,297,508 outstanding shares of beneficial interest, no par value, unlimited number of shares authorized) | $ 8.08 |
* Represents collateral on securities loaned.
The accompanying notes are an integral part of the financial statements.
Statement of Operations
for the year ended December 31, 2010 |
Investment Income |
Income: Dividends (net of foreign taxes withheld of $330,003) | $ 2,216,179 |
Interest | 585 |
Income distributions — Central Cash Management Fund | 1,903 |
Securities lending income, including income from Daily Assets Fund Institutional, net of borrower rebates | 94,036 |
Total income | 2,312,703 |
Expenses: Management fee | 519,737 |
Administration fee | 79,960 |
Services to shareholders | 2,094 |
Custodian fee | 68,980 |
Legal fees | 8,349 |
Audit and tax fees | 60,810 |
Trustees' fees and expenses | 5,193 |
Reports to shareholders | 11,959 |
Other | 35,847 |
Total expenses | 792,929 |
Net investment income (loss) | 1,519,774 |
Realized and Unrealized Gain (Loss) |
Net realized gain (loss) from: Investments | 2,946,085 |
Futures | 139,952 |
Foreign currency | (29,672) |
| 3,056,365 |
Change in net unrealized appreciation (depreciation) on: Investments | 3,584,528 |
Futures | (169,560) |
Foreign currency | (17,721) |
| 3,397,247 |
Net gain (loss) | 6,453,612 |
Net increase (decrease) in net assets resulting from operations | $ 7,973,386 |
The accompanying notes are an integral part of the financial statements.
Statement of Changes in Net Assets
Increase (Decrease) in Net Assets | Years Ended December 31, |
2010 | 2009 |
Operations: Net investment income (loss) | $ 1,519,774 | $ 1,533,993 |
Net realized gain (loss) | 3,056,365 | (23,604,083) |
Change in net unrealized appreciation (depreciation) | 3,397,247 | 41,842,935 |
Net increase (decrease) in net assets resulting from operations | 7,973,386 | 19,772,845 |
Distributions to shareholders from: Net investment income: Class A | (1,843,687) | (5,187,036) |
Total distributions | (1,843,687) | (5,187,036) |
Fund share transactions: Class A Proceeds from shares sold | 3,841,591 | 1,865,488 |
Reinvestment of distributions | 1,843,687 | 5,187,036 |
Payments for shares redeemed | (14,779,706) | (26,149,949) |
Shares converted* | — | 72,862 |
Net increase (decrease) in net assets from Class A share transactions | (9,094,428) | (19,024,563) |
Class B Payments for shares redeemed | — | (294) |
Shares converted* | — | (72,862) |
Net increase (decrease) in net assets from Class B share transactions | — | (73,156) |
Increase (decrease) in net assets | (2,964,729) | (4,511,910) |
Net assets at beginning of period | 86,137,162 | 90,649,072 |
Net assets at end of period (including undistributed net investment income of $1,336,930 and $1,659,097, respectively) | $ 83,172,433 | $ 86,137,162 |
Other Information |
Class A Shares outstanding at beginning of period | 11,562,525 | 14,554,587 |
Shares sold | 508,055 | 283,708 |
Shares issued to shareholders in reinvestment of distributions | 252,215 | 1,027,136 |
Shares redeemed | (2,025,287) | (4,318,475) |
Shares converted* | — | 15,569 |
Net increase (decrease) in Class A shares | (1,265,017) | (2,992,062) |
Shares outstanding at end of period | 10,297,508 | 11,562,525 |
Class B Shares outstanding at beginning of period | — | 15,672 |
Shares issued to shareholders in reinvestment of distributions | — | — |
Shares redeemed | — | (53) |
Shares converted* | — | (15,619) |
Net increase (decrease) in Class B shares | — | (15,672) |
Shares outstanding at end of period | — | — |
* On March 6, 2009, Class B shares converted into Class A shares.
The accompanying notes are an integral part of the financial statements.
Financial Highlights
Class A Years Ended December 31, | 2010 | 2009 | 2008 | 2007 | 2006 |
Selected Per Share Data |
Net asset value, beginning of period | $ 7.45 | $ 6.22 | $ 16.76 | $ 16.31 | $ 13.25 |
Income (loss) from investment operations: Net investment incomea | .14 | .12 | .33d | .25 | .24b |
Net realized and unrealized gain (loss) | .66 | 1.51 | (6.67) | 2.24 | 3.11 |
Total from investment operations | .80 | 1.63 | (6.34) | 2.49 | 3.35 |
Less distributions from: Net investment income | (.17) | (.40) | (.13) | (.46) | (.29) |
Net realized gains | — | — | (4.07) | (1.58) | — |
Total distributions | (.17) | (.40) | (4.20) | (2.04) | (.29) |
Net asset value, end of period | $ 8.08 | $ 7.45 | $ 6.22 | $ 16.76 | $ 16.31 |
Total Return (%) | 10.93 | 29.36 | (48.81)c,e | 16.71 | 25.56 |
Ratios to Average Net Assets and Supplemental Data |
Net assets, end of period ($ millions) | 83 | 86 | 91 | 236 | 223 |
Ratio of expenses before expense reductions (%) | .99 | .94 | 1.02 | .93 | .88 |
Ratio of expenses after expense reductions (%) | .99 | .94 | 1.01 | .93 | .88 |
Ratio of net investment income (%) | 1.90 | 1.89 | 3.04d | 1.53 | 1.65b |
Portfolio turnover rate (%) | 14 | 139 | 132 | 117 | 122 |
a Based on average shares outstanding during the period. b Net investment income per share and the ratio of net investment income without non-recurring dividend income amounting to $0.20 per share and 1.39% of average daily net assets, respectively. c Total return would have been lower had certain expenses not been reimbursed. d Net investment income per share and ratio of net investment income include non-recurring dividend income amounting to $0.16 per share and 1.49% of average daily net assets, respectively. e Includes a reimbursement from the Advisor to reimburse the effect of losses incurred as the result of certain operation errors during the period. Excluding this reimbursement, total return would have been 0.14% lower. |
Performance Summary December 31, 2010
DWS Dreman Small Mid Cap Value VIP
All performance shown is historical, assumes reinvestment of all dividend and capital gain distributions and does not guarantee future results. Investment return and principal value fluctuate with changing market conditions so that, when redeemed, shares may be worth more or less than their original cost. Current performance may be lower or higher than the performance data quoted. Please contact your participating insurance company for the Fund's most recent month-end performance. Performance doesn't reflect charges and fees ("contract charges") associated with the separate account that invests in the Fund or any variable life insurance policy or variable annuity contract for which the Fund is an investment option. These charges and fees will reduce returns. While all share classes have the same underlying portfolio, their performance will differ.
The gross expense ratios of the Fund, as stated in the fee table of the prospectus dated May 1, 2010 are 0.79% and 1.14% for Class A and Class B shares, respectively, and may differ from the expense ratios disclosed in the Financial Highlights tables in this report.
Risk Considerations
Any Fund that focuses in a particular segment of the market will generally be more volatile than a fund that invests more broadly. Stocks of small and medium-sized companies involve greater risk than securities of larger, more-established companies. Any decline in value of a Fund security that is out on loan by the Fund will adversely affect performance. Financial failure of the borrower may mean a delay in recovery or loss of rights in the collateral. Stocks may decline in value. See the prospectus for details.
Fund returns shown for the 3-year, 5-year and 10-year/Life of Class periods reflect a fee waiver and/or expense reimbursement. Without this waiver/reimbursement, returns would have been lower.
Growth of an Assumed $10,000 Investment in DWS Dreman Small Mid Cap Value VIP |
[] DWS Dreman Small Mid Cap Value VIP — Class A [] Russell 2500™ Value Index | The Russell 2500™ Value Index is an unmanaged Index of those securities in the Russell 3000® Index with lower price-to-book ratios and lower forecasted growth values. Index returns assume reinvestment of dividends and, unlike fund returns, do not reflect any fees or expenses. It is not possible to invest directly into an index. |
 | |
Yearly periods ended December 31 | |
Comparative Results |
DWS Dreman Small Mid Cap Value VIP | 1-Year | 3-Year | 5-Year | 10-Year |
Class A | Growth of $10,000 | $12,307 | $10,628 | $13,698 | $28,196 |
Average annual total return | 23.07% | 2.05% | 6.50% | 10.92% |
Russell 2500 Value Index | Growth of $10,000 | $12,482 | $10,839 | $12,079 | $22,678 |
Average annual total return | 24.82% | 2.72% | 3.85% | 8.53% |
DWS Dreman Small Mid Cap Value VIP | 1-Year | 3-Year | 5-Year | Life of Class* |
Class B | Growth of $10,000 | $12,266 | $10,518 | $13,454 | $22,074 |
Average annual total return | 22.66% | 1.70% | 6.11% | 9.76% |
Russell 2500 Value Index | Growth of $10,000 | $12,482 | $10,839 | $12,079 | $19,734 |
Average annual total return | 24.82% | 2.72% | 3.85% | 8.33% |
The growth of $10,000 is cumulative.
* The Fund commenced offering Class B shares on July 1, 2002. Index returns began on June 30, 2002.
Information About Your Fund's Expenses
DWS Dreman Small Mid Cap Value VIP
As an investor of the Fund, you incur two types of costs: ongoing expenses and transaction costs. Ongoing expenses include management fees, distribution and service (12b-1) fees and other Fund expenses. Examples of transaction costs include contract charges, redemption fees and account maintenance fees, which are not shown in this section. The following tables are intended to help you understand your ongoing expenses (in dollars) of investing in the Fund and to help you compare these expenses with the ongoing expenses of investing in other mutual funds. The example in the table is based on an investment of $1,000 invested at the beginning of the six-month period and held for the entire period (July 1, 2010 to December 31, 2010).
The tables illustrate your Fund's expenses in two ways:
• Actual Fund Return. This helps you estimate the actual dollar amount of ongoing expenses (but not transaction costs) paid on a $1,000 investment in the Fund using the Fund's actual return during the period. To estimate the expenses you paid over the period, simply divide your account value by $1,000 (for example, an $8,600 account value divided by $1,000 = 8.6), then multiply the result by the number in the "Expenses Paid per $1,000" line under the share class you hold.
• Hypothetical 5% Fund Return. This helps you to compare your Fund's ongoing expenses (but not transaction costs) with those of other mutual funds using the Fund's actual expense ratio and a hypothetical rate of return of 5% per year before expenses. Examples using a 5% hypothetical Fund return may be found in the shareholder reports of other mutual funds. The hypothetical account values and expenses may not be used to estimate the actual ending account balance or expenses you paid for the period.
Please note that the expenses shown in these tables are meant to highlight your ongoing expenses only and do not reflect any transaction costs. The "Expenses Paid per $1,000" line of the tables is useful in comparing ongoing expenses only and will not help you determine the relative total expense of owning different funds. If these transaction costs had been included, your costs would have been higher.
Expenses and Value of a $1,000 Investment for the six months ended December 31, 2010 |
Actual Fund Return | Class A | | Class B | |
Beginning Account Value 7/1/10 | $ 1,000.00 | | $ 1,000.00 | |
Ending Account Value 12/31/10 | $ 1,279.90 | | $ 1,277.50 | |
Expenses Paid per $1,000* | $ 4.65 | | $ 6.72 | |
Hypothetical 5% Fund Return | Class A | | Class B | |
Beginning Account Value 7/1/10 | $ 1,000.00 | | $ 1,000.00 | |
Ending Account Value 12/31/10 | $ 1,021.12 | | $ 1,019.31 | |
Expenses Paid per $1,000* | $ 4.13 | | $ 5.96 | |
* Expenses are equal to the Fund's annualized expense ratio for each share class, multiplied by the average account value over the period, multiplied by the number of days in the most recent six-month period, then divided by 365.
Annualized Expense Ratios | Class A | | Class B | |
DWS Variable Series II — DWS Dreman Small Mid Cap Value VIP | .81% | | 1.17% | |
For more information, please refer to the Fund's prospectus.
These tables do not reflect charges and fees ("contract charges") associated with the separate account that invests in the Fund or any variable life insurance policy or variable annuity contract for which the Fund is an investment option.
Management Summary December 31, 2010
DWS Dreman Small Mid Cap Value VIP
Small- and mid-cap stocks performed very well in 2010, reflecting an environment of positive investor sentiment and gradually improving economic growth. The Class A shares of the Fund returned 23.07% for the year (unadjusted for contract charges), but lagged the 24.82% return of the fund's benchmark, the Russell 2500™ Value Index. Although the Fund underperformed, we are gratified that it largely kept pace with the index at a time in which the market's best performers were generally the type of richly valued, momentum-driven stocks that we seek to avoid.
We believe it is important to note that our value-focused approach has contributed to strong outperformance for the Fund over the long term, as it has outpaced the benchmark during both the 5- and 10-year periods ended December 31, 2010.
Our bottom-up stock selection process worked well in the information technology, materials and financial sectors during 2010, but we underperformed in the consumer discretionary segment. Our top individual performer in 2010 was CBL & Associates Properties, Inc., a real estate investment trust whose focus on retail properties positioned it to benefit from the improvement in consumer spending. Endo Pharmaceuticals Holdings, Inc., Pan American Silver Corp.* and Forest Oil Corp. also added significant value for the Fund. On the negative side, our leading detractors were ITT Educational Services, Inc.* and Alliant Techsystems, Inc.
We retain a reasonably optimistic outlook as we enter the new year. While the broader market is nowhere near as inexpensive as it was 12-18 months ago, there are still plenty of opportunities for bottom-up stock pickers. We continue to focus on companies with valuations that do not fully reflect their strong fundamentals, which in our view provide a margin of safety in the event of a market downturn.1 We believe this disciplined, value-based approach — together with our conscious decision to avoid chasing overvalued stocks when they rally — has been the key to our success over the past decade.
David N. Dreman
Lead Portfolio Manager
E. Clifton Hoover, Jr., CFA
Mark Roach
Portfolio Managers
Dreman Value Management, L.L.C., Subadvisor to the Fund
The Russell 2500 Value Index is an unmanaged index of those securities in the Russell 3000® Index with lower price-to-book ratio and lower forecasted growth values.
Index returns assume reinvestment of dividends and, unlike fund returns, do not reflect any fees or expenses. It is not possible to invest directly into an index.
1 "Valuation" refers to the price investors pay for a given security. An asset can be undervalued, meaning that it trades for less than its intrinsic value, or overvalued, which means that it trades at a more expensive price than its underlying worth.
* Not held in the Fund as of December 31, 2010.
Portfolio Summary
DWS Dreman Small Mid Cap Value VIP
Asset Allocation (As a % of Investment Portfolio excluding Securities Lending Collateral) | 12/31/10 | 12/31/09 |
| | |
Common Stocks | 98% | 100% |
Closed-End Investment Company | 1% | — |
Cash Equivalents | 1% | 0% |
| 100% | 100% |
Sector Diversification (As a % of Common Stocks) | 12/31/10 | 12/31/09 |
| | |
Financials | 19% | 15% |
Information Technology | 14% | 15% |
Industrials | 13% | 16% |
Energy | 11% | 9% |
Health Care | 11% | 9% |
Consumer Discretionary | 11% | 14% |
Materials | 9% | 6% |
Utilities | 6% | 7% |
Consumer Staples | 6% | 8% |
Telecommunications Services | — | 1% |
| 100% | 100% |
Asset allocation and sector diversification are subject to change.
For more complete details about the Fund's investment portfolio, see page 101.
Following the Fund's fiscal first and third quarter-end, a complete portfolio holdings listing is filed with the SEC on Form N-Q. The form will be available on the SEC's Web site at www.sec.gov, and it also may be reviewed and copied at the SEC's Public Reference Room in Washington, D.C. Information on the operation of the SEC's Public Reference Room may be obtained by calling (800) SEC-0330. The Fund's portfolio holdings are also posted on www.dws-investments.com from time to time. Please see the Fund's current prospectus for more information.
Investment Portfolio December 31, 2010
DWS Dreman Small Mid Cap Value VIP
| Shares | Value ($) |
| |
Common Stocks 97.8% |
Consumer Discretionary 11.0% |
Auto Components 0.6% |
Cooper Tire & Rubber Co. (a) | 70,654 | 1,666,021 |
Diversified Consumer Services 1.1% |
Regis Corp. (a) | 187,925 | 3,119,555 |
Hotels Restaurants & Leisure 3.3% |
Brinker International, Inc. (a) | 192,550 | 4,020,444 |
International Speedway Corp. "A" (a) | 113,475 | 2,969,641 |
LIFE TIME FITNESS, Inc.* (a) | 48,596 | 1,991,950 |
| 8,982,035 |
Leisure Equipment & Products 1.2% |
Mattel, Inc. | 131,425 | 3,342,138 |
Multiline Retail 1.0% |
Big Lots, Inc.* (a) | 91,179 | 2,777,312 |
Specialty Retail 1.2% |
Aaron's, Inc. (a) | 153,987 | 3,139,795 |
Textiles, Apparel & Luxury Goods 2.6% |
Hanesbrands, Inc.* (a) | 129,900 | 3,299,460 |
The Jones Group, Inc. | 239,790 | 3,726,337 |
| 7,025,797 |
Consumer Staples 5.7% |
Beverages 1.6% |
Constellation Brands, Inc. "A"* (a) | 195,975 | 4,340,846 |
Food Products 2.7% |
Del Monte Foods Co. (a) | 214,750 | 4,037,300 |
Ralcorp Holdings, Inc.* (a) | 53,300 | 3,465,033 |
| 7,502,333 |
Household Products 1.4% |
Energizer Holdings, Inc.* | 50,975 | 3,716,078 |
Energy 11.2% |
Energy Equipment & Services 5.9% |
Atwood Oceanics, Inc.* (a) | 90,490 | 3,381,612 |
Cal Dive International, Inc.* | 481,725 | 2,731,381 |
McDermott International, Inc.* | 126,125 | 2,609,526 |
Superior Energy Services, Inc.* (a) | 111,975 | 3,918,005 |
Tidewater, Inc. (a) | 65,875 | 3,546,710 |
| 16,187,234 |
Oil, Gas & Consumable Fuels 5.3% |
Arch Coal, Inc. (a) | 123,000 | 4,312,380 |
Forest Oil Corp.* (a) | 102,800 | 3,903,316 |
Frontline Ltd. (a) | 113,375 | 2,876,324 |
Newfield Exploration Co.* | 46,915 | 3,383,040 |
| 14,475,060 |
Financials 17.5% |
Capital Markets 1.3% |
Raymond James Financial, Inc. (a) | 104,600 | 3,420,420 |
Commercial Banks 2.2% |
Bank of Hawaii Corp. (a) | 60,100 | 2,837,321 |
BOK Financial Corp. (a) | 61,025 | 3,258,735 |
| 6,096,056 |
Insurance 6.3% |
Allied World Assurance Co. Holdings Ltd. (a) | 62,450 | 3,712,028 |
Argo Group International Holdings Ltd. | 104,813 | 3,925,247 |
| Shares | Value ($) |
| |
Axis Capital Holdings Ltd. | 93,800 | 3,365,544 |
Endurance Specialty Holdings Ltd. (a) | 60,075 | 2,767,655 |
Everest Re Group Ltd. | 40,225 | 3,411,885 |
| 17,182,359 |
Real Estate Investment Trusts 7.7% |
CBL & Associates Properties, Inc. (REIT) (a) | 225,500 | 3,946,250 |
CommonWealth REIT (REIT) (a) | 126,756 | 3,233,545 |
Hospitality Properties Trust (REIT) | 146,750 | 3,381,120 |
Medical Properties Trust, Inc. (REIT) (a) | 341,500 | 3,698,445 |
MFA Financial, Inc. (REIT) | 411,975 | 3,361,716 |
Weingarten Realty Investors (REIT) (a) | 149,400 | 3,549,744 |
| 21,170,820 |
Health Care 11.2% |
Biotechnology 1.2% |
Cephalon, Inc.* | 52,450 | 3,237,214 |
Health Care Equipment & Supplies 3.8% |
Alere, Inc.* (a) | 107,275 | 3,926,265 |
Beckman Coulter, Inc. (a) | 47,700 | 3,588,471 |
Teleflex, Inc. (a) | 54,200 | 2,916,502 |
| 10,431,238 |
Health Care Providers & Services 3.7% |
Healthspring, Inc.* (a) | 125,175 | 3,320,893 |
LifePoint Hospitals, Inc.* (a) | 88,825 | 3,264,319 |
Owens & Minor, Inc. | 114,350 | 3,365,320 |
| 9,950,532 |
Life Sciences Tools & Services 1.2% |
Charles River Laboratories International, Inc.* (a) | 93,375 | 3,318,547 |
Pharmaceuticals 1.3% |
Endo Pharmaceuticals Holdings, Inc.* (a) | 100,625 | 3,593,319 |
Industrials 12.4% |
Aerospace & Defense 2.4% |
Alliant Techsystems, Inc.* | 45,250 | 3,367,958 |
Spirit AeroSystems Holdings, Inc. "A"* | 155,000 | 3,225,550 |
| 6,593,508 |
Commercial Services & Supplies 2.1% |
Pitney Bowes, Inc. (a) | 124,950 | 3,021,291 |
The Brink's Co. | 101,475 | 2,727,648 |
| 5,748,939 |
Construction & Engineering 1.2% |
Tutor Perini Corp. | 155,900 | 3,337,819 |
Electrical Equipment 2.9% |
GrafTech International Ltd.* | 183,925 | 3,649,072 |
Hubbell, Inc. "B" (a) | 69,050 | 4,151,976 |
| 7,801,048 |
Machinery 2.6% |
Crane Co. | 89,925 | 3,693,219 |
Joy Global, Inc. | 39,385 | 3,416,649 |
| 7,109,868 |
Trading Companies & Distributors 1.2% |
Textainer Group Holdings Ltd. (a) | 118,450 | 3,374,641 |
Information Technology 14.3% |
Communications Equipment 2.0% |
Arris Group, Inc.* (a) | 260,450 | 2,922,249 |
| Shares | Value ($) |
| |
CommScope, Inc.* (a) | 85,450 | 2,667,749 |
| 5,589,998 |
Computers & Peripherals 1.6% |
NCR Corp.* | 89,728 | 1,379,119 |
Synaptics, Inc.* (a) | 103,375 | 3,037,158 |
| 4,416,277 |
Electronic Equipment, Instruments & Components 2.9% |
Arrow Electronics, Inc.* | 119,375 | 4,088,594 |
Jabil Circuit, Inc. (a) | 196,500 | 3,947,685 |
| 8,036,279 |
IT Services 3.1% |
Amdocs Ltd.* | 114,125 | 3,135,014 |
DST Systems, Inc. | 77,050 | 3,417,167 |
Jack Henry & Associates, Inc. (a) | 69,381 | 2,022,456 |
| 8,574,637 |
Semiconductors & Semiconductor Equipment 2.6% |
Microsemi Corp.* | 156,150 | 3,575,835 |
Teradyne, Inc.* (a) | 245,425 | 3,445,767 |
| 7,021,602 |
Software 2.1% |
Net 1 UEPS Technologies, Inc.* | 156,665 | 1,920,713 |
Synopsys, Inc.* | 138,575 | 3,729,053 |
| 5,649,766 |
Materials 8.5% |
Chemicals 3.0% |
CF Industries Holdings, Inc. | 34,200 | 4,622,130 |
Lubrizol Corp. (a) | 32,900 | 3,516,352 |
| 8,138,482 |
Containers & Packaging 1.1% |
Owens-Illinois, Inc.* | 98,125 | 3,012,438 |
Metals & Mining 4.4% |
Coeur d'Alene Mines Corp.* (a) | 194,375 | 5,310,325 |
IAMGOLD Corp. (a) | 188,575 | 3,356,635 |
Reliance Steel & Aluminum Co. (a) | 68,800 | 3,515,680 |
| 12,182,640 |
| Shares | Value ($) |
| |
Utilities 6.0% |
Electric Utilities 2.5% |
Allegheny Energy, Inc. | 142,100 | 3,444,504 |
Portland General Electric Co. | 150,350 | 3,262,595 |
| 6,707,099 |
Gas Utilities 1.0% |
AGL Resources, Inc. | 78,575 | 2,816,914 |
Independent Power Producers & Energy Traders 1.2% |
Constellation Energy Group, Inc. | 109,825 | 3,363,940 |
Multi-Utilities 1.3% |
Ameren Corp. (a) | 121,650 | 3,429,313 |
Total Common Stocks (Cost $206,930,389) | 267,579,917 |
|
Closed-End Investment Company 1.2% |
Financials |
Apollo Investment Corp. (Cost $3,305,969) | 302,775 | 3,351,719 |
|
Securities Lending Collateral 35.9% |
Daily Assets Fund Institutional, 0.27% (b) (c) (Cost $98,280,070) | 98,280,070 | 98,280,070 |
|
Cash Equivalents 0.6% |
Central Cash Management Fund, 0.19% (b) (Cost $1,698,867) | 1,698,867 | 1,698,867 |
| % of Net Assets | Value ($) |
| |
Total Investment Portfolio (Cost $310,215,295)+ | 135.5 | 370,910,573 |
Other Assets and Liabilities, Net | (35.5) | (97,205,361) |
Net Assets | 100.0 | 273,705,212 |
* Non-income producing security.
+ The cost for federal income tax purposes was $311,177,875. At December 31, 2010, net unrealized appreciation for all securities based on tax cost was $59,732,698. This consisted of aggregate gross unrealized appreciation for all securities in which there was an excess of value over tax cost of $69,554,187 and aggregate gross unrealized depreciation for all securities in which there was an excess of tax cost over value of $9,821,489.
(a) All or a portion of these securities were on loan (see Notes to Financial Statements). The value of all securities loaned at December 31, 2010 amounted to $95,671,560, which is 35.0% of net assets.
(b) Affiliated fund managed by Deutsche Investment Management Americas Inc. The rate shown is the annualized seven-day yield at period end.
(c) Represents collateral held in connection with securities lending. Income earned by the Fund is net of borrower rebates.
REIT: Real Estate Investment Trust
Fair Value Measurements
Various inputs are used in determining the value of the Fund's investments. These inputs are summarized in three broad levels. Level 1 includes quoted prices in active markets for identical securities. Level 2 includes other significant observable inputs (including quoted prices for similar securities, interest rates, prepayment speeds, and credit risk). Level 3 includes significant unobservable inputs (including the Fund's own assumptions in determining the fair value of investments). The inputs or methodology used for valuing securities are not necessarily an indication of the risk associated with investing in those securities.
The following is a summary of the inputs used as of December 31, 2010 in valuing the Fund's investments. For information on the Fund's policy regarding the valuation of investments, please refer to the Security Valuation section of Note A in the accompanying Notes to Financial Statements.
Assets | Level 1 | Level 2 | Level 3 | Total |
|
Common Stocks (d) | $ 267,579,917 | $ — | $ — | $ 267,579,917 |
Closed-End Investment Company | 3,351,719 | — | — | 3,351,719 |
Short-Term Investments (d) | 99,978,937 | — | — | 99,978,937 |
Total | $ 370,910,573 | $ — | $ — | $ 370,910,573 |
There have been no significant transfers between Level 1 and Level 2 fair value measurements during the year ended December 31, 2010.
(d) See Investment Portfolio for additional detailed categorizations.
The accompanying notes are an integral part of the financial statements.
Statement of Assets and Liabilities
as of December 31, 2010 |
Assets |
Investments: Investments in unaffiliated securities, at value (cost $210,236,358) — including $95,671,560 of securities loaned | $ 270,931,636 |
Investment in Daily Assets Fund Institutional (cost $98,280,070)* | 98,280,070 |
Investment in Central Cash Management Fund (cost $1,698,867) | 1,698,867 |
Total investments, at value (cost $310,215,295) | 370,910,573 |
Cash | 18,356 |
Receivable for investments sold | 1,419,033 |
Receivable for Fund shares sold | 291,039 |
Dividends receivable | 398,083 |
Interest receivable | 9,566 |
Other assets | 1,379 |
Total assets | 373,048,029 |
Liabilities |
Payable upon return of securities loaned | 98,280,070 |
Payable for investments purchased | 528,674 |
Payable for Fund shares redeemed | 245,511 |
Accrued management fee | 162,677 |
Accrued expenses and payables | 125,885 |
Total liabilities | 99,342,817 |
Net assets, at value | $ 273,705,212 |
Net Assets Consist of: |
Undistributed net investment income | 2,636,612 |
Net unrealized appreciation (depreciation) on investments | 60,695,278 |
Accumulated net realized gain (loss) | (104,463,786) |
Paid-in capital | 314,837,108 |
Net assets, at value | $ 273,705,212 |
Class A Net Asset Value, offering and redemption price per share ($247,497,040 ÷ 20,271,172 outstanding shares of beneficial interest, no par value, unlimited number of shares authorized) | $ 12.21 |
Class B Net Asset Value, offering and redemption price per share ($26,208,172 ÷ 2,147,844 outstanding shares of beneficial interest, no par value, unlimited number of shares authorized) | $ 12.20 |
* Represents collateral on securities loaned.
The accompanying notes are an integral part of the financial statements.
Statement of Operations
for the year ended December 31, 2010 |
Investment Income |
Income: Dividends (net of foreign taxes witheld of $18) | $ 4,702,210 |
Income distributions — Central Cash Management Fund | 13,649 |
Securities lending income, including income from Daily Assets Fund Institutional, net of borrower rebates | 274,403 |
Total income | 4,990,262 |
Expenses: Management fee | 1,653,319 |
Administration fee | 254,770 |
Services to shareholders | 8,397 |
Distribution service fee (Class B) | 59,943 |
Record keeping fees (Class B) | 24,599 |
Custodian fee | 13,570 |
Professional fees | 67,753 |
Trustees fees and expenses | 10,622 |
Reports to shareholders | 58,443 |
Other | 12,400 |
Total expenses | 2,163,816 |
Net investment income (loss) | 2,826,446 |
Realized and Unrealized Gain (Loss) |
Net realized gain (loss) from investments | 30,809,807 |
Change in net unrealized appreciation (depreciation) on investments | 18,581,828 |
Net gain (loss) | 49,391,635 |
Net increase (decrease) in net assets resulting from operations | $ 52,218,081 |
The accompanying notes are an integral part of the financial statements.
Statement of Changes in Net Assets
Increase (Decrease) in Net Assets | Years Ended December 31, |
2010 | 2009 |
Operations: Net investment income (loss) | $ 2,826,446 | $ 4,311,793 |
Net realized gain (loss) | 30,809,807 | (70,986,842) |
Change in net unrealized appreciation (depreciation) | 18,581,828 | 125,626,581 |
Net increase (decrease) in net assets resulting from operations | 52,218,081 | 58,951,532 |
Distributions to shareholders from: Net investment income: Class A | (3,068,046) | (4,046,857) |
Class B | (217,515) | (395,321) |
Total distributions | (3,285,561) | (4,442,178) |
Fund share transactions: Class A Proceeds from shares sold | 28,003,012 | 23,798,898 |
Reinvestment of distributions | 3,068,046 | 4,046,857 |
Payments for shares redeemed | (62,437,627) | (65,465,868) |
Net increase (decrease) in net assets from Class A share transactions | (31,366,569) | (37,620,113) |
Class B Proceeds from shares sold | 3,472,987 | 3,195,894 |
Reinvestment of distributions | 217,515 | 395,321 |
Payments for shares redeemed | (5,804,013) | (9,987,772) |
Net increase (decrease) in net assets from Class B share transactions | (2,113,511) | (6,396,557) |
Increase (decrease) in net assets | 15,452,440 | 10,492,684 |
Net assets at beginning of period | 258,252,772 | 247,760,088 |
Net assets at end of period (including undistributed net investment income of $2,636,612 and $3,095,726, respectively) | $ 273,705,212 | $ 258,252,772 |
Other Information |
Class A Shares outstanding at beginning of period | 23,383,684 | 28,178,465 |
Shares sold | 2,611,387 | 2,960,168 |
Shares issued to shareholders in reinvestment of distributions | 271,509 | 624,515 |
Shares redeemed | (5,995,408) | (8,379,464) |
Net increase (decrease) in Class A shares | (3,112,512) | (4,794,781) |
Shares outstanding at end of period | 20,271,172 | 23,383,684 |
Class B Shares outstanding at beginning of period | 2,341,698 | 3,073,371 |
Shares sold | 327,236 | 387,629 |
Shares issued to shareholders in reinvestment of distributions | 19,214 | 60,912 |
Shares redeemed | (540,304) | (1,180,214) |
Net increase (decrease) in Class B shares | (193,854) | (731,673) |
Shares outstanding at end of period | 2,147,844 | 2,341,698 |
The accompanying notes are an integral part of the financial statements.
Financial Highlights
Class A Years Ended December 31, | 2010 | 2009 | 2008 | 2007 | 2006 |
Selected Per Share Data |
Net asset value, beginning of period | $ 10.04 | $ 7.93 | $ 20.12 | $ 22.93 | $ 19.98 |
Income (loss) from investment operations: Net investment incomea | .12 | .16 | .13 | .18 | .15 |
Net realized and unrealized gain (loss) | 2.19 | 2.11 | (4.92) | .54 | 4.69 |
Total from investment operations | 2.31 | 2.27 | (4.79) | .72 | 4.84 |
Less distributions from: Net investment income | (.14) | (.16) | (.29) | (.23) | (.18) |
Net realized gains | — | — | (7.11) | (3.30) | (1.71) |
Total distributions | (.14) | (.16) | (7.40) | (3.53) | (1.89) |
Net asset value, end of period | $ 12.21 | $ 10.04 | $ 7.93 | $ 20.12 | $ 22.93 |
Total Return (%) | 23.07 | 29.70 | (33.42)b | 3.06 | 25.06 |
Ratios to Average Net Assets and Supplemental Data |
Net assets, end of period ($ millions) | 247 | 235 | 223 | 468 | 562 |
Ratio of expenses before expense reductions (%) | .82 | .79 | .83 | .78 | .79 |
Ratio of expenses after expense reductions (%) | .82 | .79 | .82 | .78 | .79 |
Ratio of net investment income (%) | 1.14 | 1.92 | 1.13 | .85 | .71 |
Portfolio turnover rate (%) | 38 | 72 | 49 | 110 | 52 |
a Based on average shares outstanding during the period. b Total return would have been lower had certain expenses not been reduced. |
Class B Years Ended December 31, | 2010 | 2009 | 2008 | 2007 | 2006 |
Selected Per Share Data |
Net asset value, beginning of period | $ 10.03 | $ 7.92 | $ 20.08 | $ 22.88 | $ 19.93 |
Income (loss) from investment operations: Net investment incomea | .08 | .13 | .09 | .10 | .07 |
Net realized and unrealized gain (loss) | 2.19 | 2.12 | (4.92) | .54 | 4.67 |
Total from investment operations | 2.27 | 2.25 | (4.83) | .64 | 4.74 |
Less distributions from: Net investment income | (.10) | (.14) | (.22) | (.14) | (.08) |
Net realized gains | — | — | (7.11) | (3.30) | (1.71) |
Total distributions | (.10) | (.14) | (7.33) | (3.44) | (1.79) |
Net asset value, end of period | $ 12.20 | $ 10.03 | $ 7.92 | $ 20.08 | $ 22.88 |
Total Return (%) | 22.66 | 29.28 | (33.67)b | 2.67 | 24.59 |
Ratios to Average Net Assets and Supplemental Data |
Net assets, end of period ($ millions) | 26 | 23 | 24 | 34 | 90 |
Ratio of expenses before expense reductions (%) | 1.17 | 1.14 | 1.18 | 1.16 | 1.17 |
Ratio of expenses after expense reductions (%) | 1.17 | 1.14 | 1.17 | 1.16 | 1.17 |
Ratio of net investment income (%) | .79 | 1.57 | .78 | .47 | .33 |
Portfolio turnover rate (%) | 38 | 72 | 49 | 110 | 52 |
a Based on average shares outstanding during the period. b Total return would have been lower had certain expenses not been reduced. |
Performance Summary December 31, 2010
DWS Global Thematic VIP
All performance shown is historical, assumes reinvestment of all dividend and capital gain distributions and does not guarantee future results. Investment return and principal value fluctuate with changing market conditions so that, when redeemed, shares may be worth more or less than their original cost. Current performance may be lower or higher than the performance data quoted. Please contact your participating insurance company for the Fund's most recent month-end performance. Performance doesn't reflect charges and fees ("contract charges") associated with the separate account that invests in the Fund or any variable life insurance policy or variable annuity contract for which the Fund is an investment option. These charges and fees will reduce returns. While all share classes have the same underlying portfolio, their performance will differ.
The gross expense ratios of the Fund, as stated in the fee table of the prospectus dated May 1, 2010 are 1.39% and 1.74% for Class A and Class B shares, respectively, and may differ from the expense ratios disclosed in the Financial Highlights tables in this report.
Risk Considerations
Investing in derivatives entails special risks relating to liquidity, leverage and credit that may reduce returns and/or increase volatility. Investing in foreign securities, particularly those of emerging markets, presents certain risks, such as currency fluctuations, political and economic changes, and market risks. Any decline in value of a Fund security that is out on loan by the Fund will adversely affect performance. Financial failure of the borrower may mean a delay in recovery or loss of rights in the collateral. Stocks may decline in value. See the prospectus for details.
Fund returns shown for all periods reflect a fee waiver and/or expense reimbursement. Without this waiver/reimbursement, returns would have been lower.
Growth of an Assumed $10,000 Investment in DWS Global Thematic VIP |
[] DWS Global Thematic VIP — Class A [] MSCI World Index | The Morgan Stanley Capital International (MSCI) World Index is an unmanaged, capitalization-weighted measure of global stock markets including the US, Canada, Europe, Australia and the Far East. The index is calculated using closing local market prices and translates into US dollars using the London close foreign exchange rates. Index returns assume reinvestment of dividends and, unlike fund returns, do not reflect any fees or expenses. It is not possible to invest directly into an index. |
 | |
Yearly periods ended December 31 | |
Comparative Results |
DWS Global Thematic VIP | 1-Year | 3-Year | 5-Year | 10-Year |
Class A | Growth of $10,000 | $11,365 | $8,541 | $11,815 | $15,326 |
Average annual total return | 13.65% | -5.12% | 3.39% | 4.36% |
MSCI World Index | Growth of $10,000 | $11,176 | $8,613 | $11,276 | $12,562 |
Average annual total return | 11.76% | -4.85% | 2.43% | 2.31% |
DWS Global Thematic VIP | 1-Year | 3-Year | 5-Year | Life of Class* |
Class B | Growth of $10,000 | $11,324 | $8,455 | $11,603 | $18,809 |
Average annual total return | 13.24% | -5.44% | 3.02% | 7.71% |
MSCI World Index | Growth of $10,000 | $11,176 | $8,613 | $11,276 | $16,563 |
Average annual total return | 11.76% | -4.85% | 2.43% | 6.12% |
The growth of $10,000 is cumulative.
* The Fund commenced offering Class B shares on July 1, 2002. Index returns began on June 30, 2002.
Information About Your Fund's Expenses
DWS Global Thematic VIP
As an investor of the Fund, you incur two types of costs: ongoing expenses and transaction costs. Ongoing expenses include management fees, distribution and service (12b-1) fees and other Fund expenses. Examples of transaction costs include contract charges, redemption fees and account maintenance fees, which are not shown in this section. The following tables are intended to help you understand your ongoing expenses (in dollars) of investing in the Fund and to help you compare these expenses with the ongoing expenses of investing in other mutual funds. In the most recent six-month period, the Fund limited these expenses; had it not done so, expenses would have been higher. The example in the table is based on an investment of $1,000 invested at the beginning of the six-month period and held for the entire period (July 1, 2010 to December 31, 2010).
The tables illustrate your Fund's expenses in two ways:
• Actual Fund Return. This helps you estimate the actual dollar amount of ongoing expenses (but not transaction costs) paid on a $1,000 investment in the Fund using the Fund's actual return during the period. To estimate the expenses you paid over the period, simply divide your account value by $1,000 (for example, an $8,600 account value divided by $1,000 = 8.6), then multiply the result by the number in the "Expenses Paid per $1,000" line under the share class you hold.
• Hypothetical 5% Fund Return. This helps you to compare your Fund's ongoing expenses (but not transaction costs) with those of other mutual funds using the Fund's actual expense ratio and a hypothetical rate of return of 5% per year before expenses. Examples using a 5% hypothetical Fund return may be found in the shareholder reports of other mutual funds. The hypothetical account values and expenses may not be used to estimate the actual ending account balance or expenses you paid for the period.
Please note that the expenses shown in these tables are meant to highlight your ongoing expenses only and do not reflect any transaction costs. The "Expenses Paid per $1,000" line of the tables is useful in comparing ongoing expenses only and will not help you determine the relative total expense of owning different funds. If these transaction costs had been included, your costs would have been higher.
Expenses and Value of a $1,000 Investment for the six months ended December 31, 2010 |
Actual Fund Return | Class A | | Class B | |
Beginning Account Value 7/1/10 | $ 1,000.00 | | $ 1,000.00 | |
Ending Account Value 12/31/10 | $ 1,245.60 | | $ 1,243.60 | |
Expenses Paid per $1,000* | $ 5.94 | | $ 7.92 | |
Hypothetical 5% Fund Return | Class A | | Class B | |
Beginning Account Value 7/1/10 | $ 1,000.00 | | $ 1,000.00 | |
Ending Account Value 12/31/10 | $ 1,019.91 | | $ 1,018.15 | |
Expenses Paid per $1,000* | $ 5.35 | | $ 7.12 | |
* Expenses are equal to the Fund's annualized expense ratio for each share class, multiplied by the average account value over the period, multiplied by the number of days in the most recent six-month period, then divided by 365.
Annualized Expense Ratios | Class A | | Class B | |
DWS Variable Series II — DWS Global Thematic VIP | 1.05% | | 1.40% | |
For more information, please refer to the Fund's prospectus.
These tables do not reflect charges and fees ("contract charges") associated with the separate account that invests in the Fund or any variable life insurance policy or variable annuity contract for which the Fund is an investment option.
Management Summary December 31, 2010
DWS Global Thematic VIP
The Fund's Class A shares returned 13.65% during 2010, outpacing the 11.76% return of the MSCI World Index. The Fund also has outperformed its benchmark during the 5- and 10-year periods ended December 31, 2010.
In managing the Fund, we strive to identify the themes that we believe will be the important long-term drivers of the global business environment, then we use intensive fundamental research and a wide array of quantitative tools to invest in companies that can benefit as these themes unfold. All 13 of the Fund's themes produced positive absolute returns during 2010. On a relative basis, nine themes outperformed the broader market while just three lagged.
Three of our best-performing themes of 2010 were those with heavy exposure to the emerging markets: Large Units, which invests in companies that are benefiting from the growth of middle classes and consumerism in emerging-markets countries; Global Agribusiness, where we seek companies that stand to benefit from the rapidly changing dietary needs of a growing global population; and Indian Ocean, which seeks to capitalize on the need for China and India to secure agricultural and energy supply routes in the region. Also performing very well was our theme Disequilibria, in which we hunt for situations where investors do not fully understand the capacity of an industry or a company to adapt to a structural change. Many industries experienced significant changes in the wake of the global recession of 2008-2009, creating abundant opportunities to capitalize on companies that were able to benefit from industry flux.
The smallest gain came from our theme Personalized Medicine, which is invested entirely in health care stocks — a sector that underperformed amid the momentum-driven market environment. We remain enthusiastic on the long-term prospects of this theme despite its recent underperformance, and we continue to add to the Fund's holdings in this area.
While we believe there is a good case for global equities as we move into 2011, we continue to spend time analyzing the potential adverse outcomes of various economic scenarios. Our investment framework remains guided by our well-researched themes and the core principle that investment management is a marathon and not a sprint.
Oliver Kratz, PhD
Portfolio Manager, Global Thematic Partners, LLC
Subadvisor to the Fund
The Morgan Stanley Capital International (MSCI) World Index is an unmanaged, capitalization-weighted measure of global stock markets including the US, Canada, Europe, Australia and the Far East. The index is calculated using closing local market prices and translates into US dollars using the London close foreign exchange rates.
Index returns assume reinvestment of dividends and, unlike fund returns, do not reflect any fees of expenses. It is not possible to invest directly into an index.
Portfolio Summary
DWS Global Thematic VIP
Asset Allocation (As a % of Investment Portfolio excluding Securities Lending Collateral) | 12/31/10 | 12/31/09 |
| | |
Common Stocks | 94% | 95% |
Participatory Notes | 3% | 2% |
Cash Equivalents | 2% | 1% |
Preferred Stocks | 1% | — |
Exchange-Traded Funds | — | 2% |
| 100% | 100% |
Sector Diversification (As a % of Investment Portfolio excluding Exchange-Traded Funds, Cash Equivalents and Securities Lending Collateral) | 12/31/10 | 12/31/09 |
| | |
Financials | 21% | 23% |
Information Technology | 14% | 11% |
Health Care | 12% | 14% |
Consumer Staples | 11% | 11% |
Industrials | 11% | 14% |
Materials | 9% | 2% |
Telecommunication Services | 7% | 6% |
Consumer Discretionary | 6% | 8% |
Energy | 5% | 9% |
Utilities | 4% | 2% |
| 100% | 100% |
Geographical Diversification (As a % of Investment Portfolio excluding Cash Equivalents and Securities Lending Collateral) | 12/31/10 | 12/31/09 |
| | |
United States | 32% | 44% |
Continental Europe | 23% | 23% |
Japan | 9% | 9% |
Latin America | 8% | 5% |
Asia (excluding Japan) | 8% | 5% |
United Kingdom | 8% | 7% |
Africa | 4% | 2% |
Middle East | 4% | 3% |
Bermuda | 1% | 1% |
Other | 3% | 1% |
| 100% | 100% |
Asset allocation, sector and geographical diversification are subject to change.
For more complete details about the Fund's investment portfolio, see page 114.
Following the Fund's fiscal first and third quarter-end, a complete portfolio holdings listing is filed with the SEC on Form N-Q. The form will be available on the SEC's Web site at www.sec.gov, and it also may be reviewed and copied at the SEC's Public Reference Room in Washington, D.C. Information on the operation of the SEC's Public Reference Room may be obtained by calling (800) SEC-0330. The Fund's portfolio holdings are also posted on www.dws-investments.com from time to time. Please see the Fund's current prospectus for more information.
Investment Portfolio December 31, 2010
DWS Global Thematic VIP
|
Shares
| Value ($) |
| |
Common Stocks 95.6% |
Austria 3.4% |
Erste Group Bank AG | 40,781 | 1,916,496 |
Raiffeisen Bank International AG | 6,427 | 352,042 |
Wienerberger AG* | 10,111 | 193,193 |
(Cost $1,834,682) | 2,461,731 |
Bahrain 0.3% |
Aluminium Bahrain 144A (GDR)* (Cost $262,586) | 21,937 | 245,694 |
Bermuda 0.6% |
Lazard Ltd. "A" (Cost $323,175) | 11,956 | 472,143 |
Brazil 4.5% |
All America Latina Logistica | 41,745 | 377,342 |
Banco Bradesco SA (ADR) (Preferred) | 16,875 | 342,394 |
Banco Santander Brasil SA (ADR) | 32,906 | 447,522 |
Brasil Telecom SA (ADR) | 4,401 | 96,514 |
Petroleo Brasileiro SA (ADR) | 18,094 | 684,677 |
Santos Brasil Participacoes SA (Units) | 34,497 | 477,684 |
SLC Agricola SA | 63,320 | 839,453 |
(Cost $2,784,368) | 3,265,586 |
Cayman Islands 0.3% |
Herbalife Ltd. (Cost $153,889) | 3,749 | 256,319 |
China 2.1% |
Bank of China Ltd. "H" | 938,871 | 496,444 |
China Metal Recycling Holdings Ltd. | 199,352 | 211,078 |
Li Ning Co., Ltd. | 89,245 | 189,448 |
Mindray Medical International Ltd. (ADR) (a) | 23,089 | 609,550 |
(Cost $1,632,015) | 1,506,520 |
Denmark 1.2% |
Vestas Wind Systems AS* (Cost $875,294) | 27,897 | 880,998 |
Egypt 0.5% |
Orascom Telecom Holding SAE (GDR) REG S* (Cost $185,988) | 96,576 | 352,502 |
France 0.8% |
Carrefour SA (Cost $747,206) | 14,437 | 595,163 |
Germany 6.3% |
Axel Springer AG | 3,028 | 493,655 |
Deutsche Lufthansa AG (Registered)* | 18,558 | 405,585 |
Deutsche Post AG (Registered) | 42,056 | 713,297 |
E.ON AG | 67,902 | 2,082,574 |
HeidelbergCement AG | 14,027 | 879,566 |
(Cost $4,117,461) | 4,574,677 |
Greece 0.3% |
Hellenic Exchanges SA (Cost $230,675) | 31,318 | 205,066 |
Hong Kong 1.3% |
China Mobile Ltd. (ADR) | 6,721 | 333,496 |
Esprit Holdings Ltd. | 116,286 | 552,048 |
Yingde Gases* (b) | 69,766 | 61,483 |
(Cost $1,019,783) | 947,027 |
|
Shares
| Value ($) |
| |
India 0.2% |
Deccan Chronicle Holdings Ltd. (Cost $240,432) | 67,247 | 164,828 |
Indonesia 1.9% |
PT Semen Gresik (Persero) Tbk | 377,454 | 395,662 |
PT Telekomunikasi Indonesia Tbk (ADR) | 26,780 | 954,707 |
(Cost $1,244,304) | 1,350,369 |
Israel 1.7% |
NICE Systems Ltd. (ADR)* | 5,989 | 209,016 |
Teva Pharmaceutical Industries Ltd. (ADR) | 19,106 | 995,996 |
(Cost $1,141,082) | 1,205,012 |
Italy 1.0% |
Parmalat SpA | 165,995 | 454,527 |
UniCredit SpA | 124,822 | 258,146 |
(Cost $791,529) | 712,673 |
Japan 9.3% |
FANUC Corp. | 3,300 | 506,241 |
Fujitsu Ltd. | 74,000 | 514,552 |
Hitachi Ltd. | 110,000 | 586,922 |
INPEX Corp. | 171 | 1,000,241 |
Kirin Holdings Co., Ltd. | 37,000 | 518,701 |
Mitsubishi UFJ Financial Group, Inc. | 66,200 | 357,689 |
Mizuho Financial Group, Inc. | 196,800 | 370,569 |
Nomura Holdings, Inc. | 104,514 | 662,339 |
Seven & I Holdings Co., Ltd. | 13,000 | 347,222 |
Sumitomo Mitsui Financial Group, Inc. | 11,000 | 391,545 |
Takeda Pharmaceutical Co., Ltd. | 6,000 | 295,094 |
Toyota Motor Corp. | 24,000 | 945,101 |
Yamada Denki Co., Ltd. | 4,020 | 274,124 |
(Cost $5,930,147) | 6,770,340 |
Kazakhstan 0.1% |
Kazakhstan Kagazy PLC 144A (GDR)* (Cost $916,872) | 181,200 | 45,300 |
Korea 3.1% |
KT&G Corp.* | 15,968 | 920,365 |
Samsung Electronics Co., Ltd. | 1,571 | 1,312,832 |
(Cost $1,940,032) | 2,233,197 |
Malaysia 0.4% |
Axiata Group Bhd.* (Cost $214,993) | 185,900 | 286,203 |
Mexico 0.7% |
Grupo Aeroportuario del Sureste SAB de CV (ADR) (a) (Cost $379,121) | 8,482 | 478,809 |
Netherlands 2.5% |
QIAGEN NV* | 32,654 | 638,694 |
Unilever NV (CVA) | 11,806 | 367,589 |
VimpelCom Ltd. (ADR) (c) | 53,834 | 809,663 |
(Cost $1,699,907) | 1,815,946 |
Norway 0.2% |
Statoil Fuel & Retail ASA* (Cost $129,742) | 19,358 | 176,926 |
|
Shares
| Value ($) |
| |
Panama 1.5% |
Copa Holdings SA "A" (Cost $841,944) | 18,635 | 1,096,483 |
Puerto Rico 1.4% |
Popular, Inc.* (Cost $920,104) | 316,838 | 994,871 |
Russia 1.1% |
Aeroflot-Russian Airlines | 107,905 | 280,553 |
Gazprom (ADR) | 15,660 | 395,415 |
Sistema JSFC (GDR) (REG S) | 5,253 | 130,957 |
(Cost $736,335) | 806,925 |
South Africa 3.7% |
Aquarius Platinum Ltd. | 43,863 | 240,721 |
MTN Group Ltd. | 37,788 | 771,076 |
Murray & Roberts Holdings Ltd. | 47,792 | 291,431 |
Standard Bank Group Ltd. | 68,349 | 1,115,892 |
Tiger Brands Ltd. | 9,361 | 275,153 |
(Cost $2,311,096) | 2,694,273 |
Spain 1.1% |
Telefonica SA (Cost $794,722) | 34,493 | 783,371 |
Sweden 2.8% |
Telefonaktiebolaget LM Ericsson "B" (Cost $1,861,198) | 174,404 | 2,019,548 |
Switzerland 2.2% |
EFG International AG | 17,204 | 235,630 |
Roche Holding AG (Genusschein) | 6,133 | 899,052 |
Syngenta AG (Registered) | 1,600 | 468,654 |
(Cost $1,496,506) | 1,603,336 |
Thailand 0.1% |
Seamico Securities PCL (Foreign Registered)* (Cost $153,906) | 1,403,300 | 84,724 |
United Kingdom 7.4% |
African Minerals Ltd.* (d) | 19,586 | 128,559 |
Anglo American PLC | 13,249 | 688,998 |
BAE Systems PLC | 54,188 | 278,799 |
Barratt Developments PLC* | 331,333 | 457,949 |
Diageo PLC | 57,956 | 1,070,756 |
GlaxoSmithKline PLC | 35,913 | 694,300 |
Imperial Tobacco Group PLC | 21,678 | 665,147 |
Tesco PLC | 109,726 | 727,063 |
Vodafone Group PLC | 255,016 | 659,213 |
(Cost $4,884,794) | 5,370,784 |
United States 31.6% |
Abbott Laboratories | 18,197 | 871,818 |
Advanced Micro Devices, Inc.* | 102,758 | 840,560 |
Air Products & Chemicals, Inc. | 4,995 | 454,295 |
Apache Corp. | 3,790 | 451,882 |
Bank of America Corp. | 112,710 | 1,503,551 |
Calpine Corp.* | 39,059 | 521,047 |
Cisco Systems, Inc.* | 44,299 | 896,169 |
Electronic Arts, Inc.* | 26,791 | 438,837 |
EMC Corp.* | 21,348 | 488,869 |
General Dynamics Corp. | 12,234 | 868,125 |
General Electric Co. | 45,728 | 836,365 |
General Motors Co.* | 10,233 | 377,188 |
GSI Commerce, Inc.* | 14,323 | 332,294 |
Harris Corp. | 12,034 | 545,140 |
JPMorgan Chase & Co. | 41,332 | 1,753,303 |
Kinetic Concepts, Inc.* | 13,074 | 547,539 |
Laboratory Corp. of America Holdings* | 13,043 | 1,146,741 |
|
Shares
| Value ($) |
| |
Life Technologies Corp.* | 20,262 | 1,124,541 |
MasterCard, Inc. "A" | 4,650 | 1,042,111 |
Medco Health Solutions, Inc.* | 19,659 | 1,204,507 |
Monsanto Co. | 5,794 | 403,494 |
Morgan Stanley | 46,133 | 1,255,279 |
New York Times Co. "A"* (a) | 37,641 | 368,882 |
Owens-Illinois, Inc.* | 21,550 | 661,585 |
Rock-Tenn Co. "A" | 2,966 | 160,016 |
Schweitzer-Mauduit International, Inc. | 8,692 | 546,901 |
The NASDAQ OMX Group, Inc.* | 29,036 | 688,444 |
Wal-Mart Stores, Inc. | 21,281 | 1,147,684 |
Williams Companies, Inc. | 24,851 | 614,317 |
World Fuel Services Corp. | 7,879 | 284,905 |
Yahoo!, Inc.* | 35,219 | 585,693 |
(Cost $20,218,099) | 22,962,082 |
Total Common Stocks (Cost $63,013,987) | 69,419,426 |
|
Preferred Stocks 0.5% |
Germany 0.3% |
Porsche Automobil Holding SE (Cost $135,727) | 2,664 | 212,334 |
Russia 0.2% |
Surgutneftegas (Cost $132,021) | 281,496 | 140,748 |
Total Preferred Stocks (Cost $267,748) | 353,082 |
|
Participatory Notes 2.9% |
Jordan 0.2% |
Arab Bank PLC (issuer HSBC Bank PLC), Expiration Date 4/12/2013* (Cost $183,726) | 11,543 | 162,756 |
Nigeria 0.9% |
Bank of Nigeria (issuer HSBC Bank PLC), Expiration Date 11/15/2013* | 2,922,113 | 263,952 |
Guaranty Trust Bank PLC (issuer Morgan Stanley BV), Expiration Date 3/18/2011* | 2,479,865 | 289,752 |
Zenith Bank Ltd. (issuer Morgan Stanley BV), Expiration Date 3/18/2011* | 1,015,714 | 100,302 |
(Cost $601,105) | 654,006 |
Pakistan 0.5% |
National Bank of Pakistan (issuer Merrill Lynch International & Co.), Expiration Date 2/25/2015* (Cost $347,029) | 398,560 | 356,611 |
Saudi Arabia 1.3% |
Saudi Basic Industrial Corp. (issuer HSBC Bank PLC), Expiration Date 3/26/2012* | 13,086 | 365,511 |
Yanbu National Petrochemicals Co. (issuer HSBC Bank PLC), Expiration Date 1/7/2013 | 47,967 | 608,821 |
(Cost $888,354) | 974,332 |
Total Participatory Notes (Cost $2,020,214) | 2,147,705 |
|
Securities Lending Collateral 1.3% |
Daily Assets Fund Institutional, 0.27% (e) (f) (Cost $960,500) | 960,500 | 960,500 |
|
Shares
| Value ($) |
| |
Cash Equivalents 2.2% |
Central Cash Management Fund, 0.19% (e) (Cost $1,583,896) | 1,583,896 | 1,583,896 |
| % of Net Assets | Value ($) |
| |
Total Investment Portfolio (Cost $67,846,345)+ | 102.5 | 74,464,609 |
Other Assets and Liabilities, Net | (2.5) | (1,846,982) |
Net Assets | 100.0 | 72,617,627 |
* Non-income producing security.
+ The cost for federal income tax purposes was $68,246,019. At December 31, 2010, net unrealized appreciation for all securities based on tax cost was $6,218,590. This consisted of aggregate gross unrealized appreciation for all securities in which there was an excess of value over tax cost of $8,508,835 and aggregate gross unrealized depreciation for all securities in which there was an excess of tax cost over value of $2,290,245.
(a) All or a portion of these securities were on loan (see Notes to Financial Statements). The value of all securities loaned at December 31, 2010 amounted to $932,405, which is 1.3% of net assets.
(b) Security is listed in country of domicile. Significant business activities of company are in China.
(c) Security is listed in country of domicile. Significant business activities of company are in Eastern Europe and South Asia.
(d) Security is listed in country of domicile. Significant business activities of company are in Africa.
(e) Affiliated fund managed by Deutsche Investment Management Americas Inc. The rate shown is the annualized seven-day yield at period end.
(f) Represents collateral held in connection with securities lending. Income earned by the Fund is net of borrower rebates.
144A: Security exempt from registration under Rule 144A of the Securities Act of 1933. These securities may be resold in transactions exempt from registration, normally to qualified institutional buyers.
ADR: American Depositary Receipt
CVA: Certificaten Van Aandelen
GDR: Global Depositary Receipt
REG S: Securities sold under Regulation S may not be offered, sold or delivered within the United States or to, or for the account or benefit of, US persons, except pursuant to an exemption from, or in a transaction not subject to, the registration requirements of the Securities Act of 1933.
Fair Value Measurements
Various inputs are used in determining the value of the Fund's investments. These inputs are summarized in three broad levels. Level 1 includes quoted prices in active markets for identical securities. Level 2 includes other significant observable inputs (including quoted prices for similar securities, interest rates, prepayment speeds, and credit risk). Level 3 includes significant unobservable inputs (including the Fund's own assumptions in determining the fair value of investments). The inputs or methodology used for valuing securities are not necessarily an indication of the risk associated with investing in those securities.
The following is a summary of the inputs used as of December 31, 2010 in valuing the Fund's investments. For information on the Fund's policy regarding the valuation of investments, please refer to the Security Valuation section of Note A in the accompanying Notes to Financial Statements.
Assets | Level 1 | Level 2 | Level 3 | Total |
|
Common Stocks & Preferred Stocks (g) | | | | |
Austria | $ — | $ 2,461,731 | $ — | $ 2,461,731 |
Bahrain | — | 245,694 | — | 245,694 |
Bermuda | 472,143 | — | — | 472,143 |
Brazil | 3,265,586 | — | — | 3,265,586 |
Cayman Islands | 256,319 | — | — | 256,319 |
China | 609,550 | 896,970 | — | 1,506,520 |
Denmark | — | 880,998 | — | 880,998 |
Egypt | — | 352,502 | — | 352,502 |
France | — | 595,163 | — | 595,163 |
Germany | — | 4,787,011 | — | 4,787,011 |
Greece | — | 205,066 | — | 205,066 |
Hong Kong | 333,496 | 613,531 | — | 947,027 |
India | — | 164,828 | — | 164,828 |
Indonesia | 954,707 | 395,662 | — | 1,350,369 |
Israel | 1,205,012 | — | — | 1,205,012 |
Italy | — | 712,673 | — | 712,673 |
Japan | — | 6,770,340 | — | 6,770,340 |
Kazakhstan | — | 45,300 | — | 45,300 |
Korea | — | 2,233,197 | — | 2,233,197 |
Malaysia | — | 286,203 | — | 286,203 |
Mexico | 478,809 | — | — | 478,809 |
Netherlands | 809,663 | 1,006,283 | — | 1,815,946 |
Norway | — | 176,926 | — | 176,926 |
Panama | 1,096,483 | — | — | 1,096,483 |
Puerto Rico | 994,871 | — | — | 994,871 |
Russia | — | 947,673 | — | 947,673 |
South Africa | — | 2,694,273 | — | 2,694,273 |
Spain | — | 783,371 | — | 783,371 |
Sweden | — | 2,019,548 | — | 2,019,548 |
Switzerland | — | 1,603,336 | — | 1,603,336 |
Thailand | — | 84,724 | — | 84,724 |
United Kingdom | — | 5,370,784 | — | 5,370,784 |
United States | 22,962,082 | — | — | 22,962,082 |
Participatory Notes (g) | — | 2,147,705 | — | 2,147,705 |
Short-Term Investments (g) | 2,544,396 | — | — | 2,544,396 |
Total | $ 35,983,117 | $ 38,481,492 | $ — | $ 74,464,609 |
There have been no significant transfers between Level 1 and Level 2 fair value measurements during the year ended December 31, 2010.
(g) See Investment Portfolio for additional detailed categorizations.
The accompanying notes are an integral part of the financial statements.
Statement of Assets and Liabilities
as of December 31, 2010 |
Assets |
Investments: Investments in unaffiliated securities, at value (cost $65,301,949) — including $932,405 of securities loaned | $ 71,920,213 |
Investment in Daily Assets Fund Institutional (cost $960,500)* | 960,500 |
Investment in Central Cash Management Fund (cost $1,583,896) | 1,583,896 |
Total investments, at value (cost $67,846,345) | 74,464,609 |
Foreign currency, at value (cost $129,430) | 129,932 |
Receivable for investments sold | 421,035 |
Receivable for Fund shares sold | 92 |
Dividends receivable | 66,283 |
Interest receivable | 1,147 |
Foreign taxes recoverable | 15,438 |
Due from Advisor | 6,316 |
Other assets | 325 |
Total assets | 75,105,177 |
Liabilities |
Payable for investments purchased | 1,362,763 |
Payable for Fund shares redeemed | 33,107 |
Payable upon return of securities loaned | 960,500 |
Accrued expenses and payables | 131,180 |
Total liabilities | 2,487,550 |
Net assets, at value | $ 72,617,627 |
Net Assets Consist of |
Undistributed net investment income | 361,169 |
Net unrealized appreciation (depreciation) on: Investments | 6,618,264 |
Foreign currency | 2,108 |
Accumulated net realized gain (loss) | (53,454,008) |
Paid-in capital | 119,090,094 |
Net assets, at value | $ 72,617,627 |
Class A Net Asset Value, offering and redemption price per share ($67,788,512 ÷ 7,301,949 outstanding shares of beneficial interest, no par value, unlimited number of shares authorized) | $ 9.28 |
Class B Net Asset Value, offering and redemption price per share ($4,829,115 ÷ 519,624 outstanding shares of beneficial interest, no par value, unlimited number of shares authorized) | $ 9.29 |
* Represents collateral on securities loaned.
The accompanying notes are an integral part of the financial statements.
Statement of Operations
for the year ended December 31, 2010 |
Investment Income |
Income: Dividends (net of foreign taxes withheld of $75,539) | $ 1,226,438 |
Income distributions — Central Cash Management Fund | 2,453 |
Securities lending income, including income from Daily Assets Fund Institutional, net of borrower rebates | 23,173 |
Total income | 1,252,064 |
Expenses: Management fee | 626,939 |
Administration fee | 68,518 |
Services to shareholders | 3,860 |
Distribution service fee (Class B) | 11,552 |
Record keeping fees (Class B) | 4,575 |
Custodian fee | 142,829 |
Legal fees | 9,737 |
Audit and tax fees | 65,395 |
Trustees' fees and expenses | 5,102 |
Reports to shareholders | 10,208 |
Other | 34,743 |
Total expenses before expense reductions | 983,458 |
Expense reductions | (245,517) |
Total expenses after expense reductions | 737,941 |
Net investment income (loss) | 514,123 |
Realized and Unrealized Gain (Loss) |
Net realized gain (loss) from: Investments (net of foreign taxes of $41,882) | 7,284,942 |
Foreign currency | (78,627) |
| 7,206,315 |
Change in net unrealized appreciation (depreciation) on: Investments | 897,676 |
Foreign currency | 1,793 |
| 899,469 |
Net gain (loss) | 8,105,784 |
Net increase (decrease) in net assets resulting from operations | $ 8,619,907 |
The accompanying notes are an integral part of the financial statements.
Statement of Changes in Net Assets
Increase (Decrease) in Net Assets | Years Ended December 31, |
2010 | 2009 |
Operations: Net investment income (loss) | $ 514,123 | $ 748,747 |
Net realized gain (loss) | 7,206,315 | (3,218,906) |
Change in net unrealized appreciation (depreciation) | 899,469 | 24,610,274 |
Net increase (decrease) in net assets resulting from operations | 8,619,907 | 22,140,115 |
Distributions to shareholders from: Net investment income: Class A | (621,927) | (911,359) |
Class B | (28,358) | (54,811) |
Total distributions | (650,285) | (966,170) |
Fund share transactions: Class A Proceeds from shares sold | 5,854,566 | 5,051,406 |
Reinvestment of distributions | 621,927 | 911,359 |
Payments for shares redeemed | (12,215,497) | (18,301,405) |
Net increase (decrease) in net assets from Class A share transactions | (5,739,004) | (12,338,640) |
Class B Proceeds from shares sold | 308,827 | 438,509 |
Reinvestment of distributions | 28,358 | 54,811 |
Payments for shares redeemed | (1,123,823) | (1,021,786) |
Net increase (decrease) in net assets from Class B share transactions | (786,638) | (528,466) |
Increase (decrease) in net assets | 1,443,980 | 8,306,839 |
Net assets at beginning of period | 71,173,647 | 62,866,808 |
Net assets at end of period (including undistributed net investment income of $361,169 and $607,015, respectively) | $ 72,617,627 | $ 71,173,647 |
Other Information |
Class A Shares outstanding at beginning of period | 8,018,621 | 10,056,541 |
Shares sold | 692,269 | 725,805 |
Shares issued to shareholders in reinvestment of distributions | 72,065 | 174,256 |
Shares redeemed | (1,481,006) | (2,937,981) |
Net increase (decrease) in Class A shares | (716,672) | (2,037,920) |
Shares outstanding at end of period | 7,301,949 | 8,018,621 |
Class B Shares outstanding at beginning of period | 617,302 | 702,064 |
Shares sold | 36,659 | 66,888 |
Shares issued to shareholders in reinvestment of distributions | 3,275 | 10,440 |
Shares redeemed | (137,612) | (162,090) |
Net increase (decrease) in Class B shares | (97,678) | (84,762) |
Shares outstanding at end of period | 519,624 | 617,302 |
The accompanying notes are an integral part of the financial statements.
Financial Highlights
Class A Years Ended December 31, | 2010 | 2009 | 2008 | 2007 | 2006 |
Selected Per Share Data |
Net asset value, beginning of period | $ 8.24 | $ 5.84 | $ 15.66 | $ 17.39 | $ 14.44 |
Income (loss) from investment operations: Net investment incomea | .06 | .08 | .11 | .14 | .15c |
Net realized and unrealized gain (loss) | 1.06 | 2.42 | (5.83) | .88 | 4.02 |
Total from investment operations | 1.12 | 2.50 | (5.72) | 1.02 | 4.17 |
Less distributions from: Net investment income | (.08) | (.10) | (.19) | (.11) | (.09) |
Net realized gains | — | — | (3.91) | (2.64) | (1.13) |
Total distributions | (.08) | (.10) | (4.10) | (2.75) | (1.22) |
Net asset value, end of period | $ 9.28 | $ 8.24 | $ 5.84 | $ 15.66 | $ 17.39 |
Total Return (%)b | 13.65 | 43.82 | (47.75) | 6.29 | 30.14c |
Ratios to Average Net Assets and Supplemental Data |
Net assets, end of period ($ millions) | 68 | 66 | 59 | 151 | 143 |
Ratio of expenses before expense reductions (%) | 1.41 | 1.38 | 1.47 | 1.44 | 1.38 |
Ratio of expenses after expense reductions (%) | 1.05 | 1.04 | 1.09 | 1.11 | 1.04 |
Ratio of net investment income (%) | .77 | 1.23 | 1.09 | .82 | .92c |
Portfolio turnover rate (%) | 165 | 190 | 229 | 191 | 136 |
a Based on average shares outstanding during the period. b Total return would have been lower had certain expenses not been reduced. c Includes non-recurring income from the Advisor recorded as a result of an administrative proceeding regarding disclosure of brokerage allocation practices in connection with sales of DWS Funds. The non-recurring income resulted in an increase in net investment income of $0.004 per share and an increase in the ratio of net investment income of 0.03%. Excluding this non-recurring income, total return would have been 0.02% lower. |
Class B Years Ended December 31, | 2010 | 2009 | 2008 | 2007 | 2006 |
Selected Per Share Data |
Net asset value, beginning of period | $ 8.25 | $ 5.85 | $ 15.66 | $ 17.38 | $ 14.43 |
Income (loss) from investment operations: Net investment incomea | .04 | .06 | .07 | .07 | .09c |
Net realized and unrealized gain (loss) | 1.05 | 2.42 | (5.83) | .90 | 4.02 |
Total from investment operations | 1.09 | 2.48 | (5.76) | .97 | 4.11 |
Less distributions from: Net investment income | (.05) | (.08) | (.14) | (.05) | (.03) |
Net realized gains | — | — | (3.91) | (2.64) | (1.13) |
Total distributions | (.05) | (.08) | (4.05) | (2.69) | (1.16) |
Net asset value, end of period | $ 9.29 | $ 8.25 | $ 5.85 | $ 15.66 | $ 17.38 |
Total Return (%)b | 13.24 | 43.23 | (47.87) | 5.84 | 29.65c |
Ratios to Average Net Assets and Supplemental Data |
Net assets, end of period ($ millions) | 5 | 5 | 4 | 10 | 25 |
Ratio of expenses before expense reductions (%) | 1.76 | 1.73 | 1.82 | 1.81 | 1.76 |
Ratio of expenses after expense reductions (%) | 1.40 | 1.39 | 1.45 | 1.47 | 1.43 |
Ratio of net investment income (%) | .42 | .88 | .73 | .46 | .53c |
Portfolio turnover rate (%) | 165 | 190 | 229 | 191 | 136 |
a Based on average shares outstanding during the period. b Total return would have been lower had certain expenses not been reduced. c Includes non-recurring income from the Advisor recorded as a result of an administrative proceeding regarding disclosure of brokerage allocation practices in connection with sales of DWS Funds. The non-recurring income resulted in an increase in net investment income of $0.004 per share and an increase in the ratio of net investment income of 0.03%. Excluding this non-recurring income, total return would have been 0.02% lower. |
Performance Summary December 31, 2010
DWS Government & Agency Securities VIP
All performance shown is historical, assumes reinvestment of all dividend and capital gain distributions and does not guarantee future results. Investment return and principal value fluctuate with changing market conditions so that, when redeemed, shares may be worth more or less than their original cost. Current performance may be lower or higher than the performance data quoted. Please contact your participating insurance company for the Fund's most recent month-end performance. Performance doesn't reflect charges and fees ("contract charges") associated with the separate account that invests in the Fund or any variable life insurance policy or variable annuity contract for which the Fund is an investment option. These charges and fees will reduce returns. While all share classes have the same underlying portfolio, their performance will differ.
The gross expense ratios of the Fund, as stated in the fee table of the prospectus dated May 1, 2010 are 0.58% and 0.92% for Class A and Class B shares, respectively, and may differ from the expense ratios disclosed in the Financial Highlights tables in this report.
Risk Considerations
Bond investments are subject to interest-rate and credit risks. When interest rates rise, bond prices generally fall. Credit risk refers to the ability of an issuer to make timely payments of principal and interest. In the current market environment, mortgage backed securities are experiencing increased volatility. The "full faith and credit" guarantee of the US government applies to the timely repayment of interest, and does not eliminate market risk. See the prospectus for details.
Fund returns shown for the 3-year, 5-year and 10-year/Life of Class periods reflect a fee waiver and/or expense reimbursement. Without this waiver/reimbursement, returns would have been lower.
Growth of an Assumed $10,000 Investment in DWS Government & Agency Securities VIP |
[] DWS Government & Agency Securities VIP — Class A [] Barclays Capital GNMA Index | The Barclays Capital GNMA Index is an unmanaged, market-value-weighted measure of all fixed-rate securities backed by mortgage pools of the Government National Mortgage Association. Index returns, unlike fund returns, do not reflect any fees or expenses. It is not possible to invest directly into an index. |
 | |
Yearly periods ended December 31 | |
Comparative Results |
DWS Government & Agency Securities VIP | 1-Year | 3-Year | 5-Year | 10-Year |
Class A | Growth of $10,000 | $10,661 | $12,091 | $13,344 | $16,865 |
Average annual total return | 6.61% | 6.53% | 5.94% | 5.37% |
Barclays Capital GNMA Index | Growth of $10,000 | $10,667 | $12,125 | $13,568 | $17,679 |
Average annual total return | 6.67% | 6.63% | 6.29% | 5.86% |
DWS Government & Agency Securities VIP | 1-Year | 3-Year | 5-Year | Life of Class* |
Class B | Growth of $10,000 | $10,624 | $11,968 | $13,090 | $14,610 |
Average annual total return | 6.24% | 6.17% | 5.53% | 4.56% |
Barclays Capital GNMA Index | Growth of $10,000 | $10,667 | $12,125 | $13,568 | $15,655 |
Average annual total return | 6.67% | 6.63% | 6.29% | 5.41% |
The growth of $10,000 is cumulative.
* The Fund commenced offering Class B shares on July 1, 2002. Index returns began on June 30, 2002.
Information About Your Fund's Expenses
DWS Government & Agency Securities VIP
As an investor of the Fund, you incur two types of costs: ongoing expenses and transaction costs. Ongoing expenses include management fees, distribution and service (12b-1) fees and other Fund expenses. Examples of transaction costs include contract charges, redemption fees and account maintenance fees, which are not shown in this section. The following tables are intended to help you understand your ongoing expenses (in dollars) of investing in the Fund and to help you compare these expenses with the ongoing expenses of investing in other mutual funds. The example in the table is based on an investment of $1,000 invested at the beginning of the six-month period and held for the entire period (July 1, 2010 to December 31, 2010).
The tables illustrate your Fund's expenses in two ways:
• Actual Fund Return. This helps you estimate the actual dollar amount of ongoing expenses (but not transaction costs) paid on a $1,000 investment in the Fund using the Fund's actual return during the period. To estimate the expenses you paid over the period, simply divide your account value by $1,000 (for example, an $8,600 account value divided by $1,000 = 8.6), then multiply the result by the number in the "Expenses Paid per $1,000" line under the share class you hold.
• Hypothetical 5% Fund Return. This helps you to compare your Fund's ongoing expenses (but not transaction costs) with those of other mutual funds using the Fund's actual expense ratio and a hypothetical rate of return of 5% per year before expenses. Examples using a 5% hypothetical Fund return may be found in the shareholder reports of other mutual funds. The hypothetical account values and expenses may not be used to estimate the actual ending account balance or expenses you paid for the period.
Please note that the expenses shown in these tables are meant to highlight your ongoing expenses only and do not reflect any transaction costs. The "Expenses Paid per $1,000" line of the tables is useful in comparing ongoing expenses only and will not help you determine the relative total expense of owning different funds. If these transaction costs had been included, your costs would have been higher.
Expenses and Value of a $1,000 Investment for the six months ended December 31, 2010 |
Actual Fund Return | Class A | | Class B | |
Beginning Account Value 7/1/10 | $ 1,000.00 | | $ 1,000.00 | |
Ending Account Value 12/31/10 | $ 1,001.50 | | $ 999.20 | |
Expenses Paid per $1,000* | $ 3.13 | | $ 4.89 | |
Hypothetical 5% Fund Return | Class A | | Class B | |
Beginning Account Value 7/1/10 | $ 1,000.00 | | $ 1,000.00 | |
Ending Account Value 12/31/10 | $ 1,022.08 | | $ 1,020.32 | |
Expenses Paid per $1,000* | $ 3.16 | | $ 4.94 | |
* Expenses are equal to the Fund's annualized expense ratio for each share class, multiplied by the average account value over the period, multiplied by the number of days in the most recent six-month period, then divided by 365.
Annualized Expense Ratios | Class A | | Class B | |
DWS Variable Series II — DWS Government & Agency Securities VIP | .62% | | .97% | |
For more information, please refer to the Fund's prospectus.
These tables do not reflect charges and fees ("contract charges") associated with the separate account that invests in the Fund or any variable life insurance policy or variable annuity contract for which the Fund is an investment option.
Management Summary December 31, 2010
DWS Government & Agency Securities VIP
During the 12-month period, the US Federal Reserve Board (the Fed) maintained the benchmark federal funds rate at near-zero levels and engaged in bond purchases designed to lower longer-term interest rates as it sought to stimulate economic growth.1 Treasury yields fell for most of the year, before rising in the fourth quarter as market participants reacted to better economic data and the extension of Bush-era tax cuts. For the year, credit-sensitive sectors such as corporate bonds outperformed as investors sought yield in an environment of extraordinarily low interest rates. GNMAs, for which repayment of principal is backed by the full faith and credit of the US government, also provided attractive returns for the full period, helped by a declining rate environment and modest prepayments on underlying mortgages.
During the 12-month period ended December 31, 2010, the Fund provided a total return of 6.61% (Class A shares, unadjusted for contract charges), compared with the 6.67% return of its benchmark, the Barclays Capital GNMA Index.
During the year, investors tried to balance the potential impact of very low interest rates on mortgage prepayments against the implications of a tighter lending climate following the financial crisis and downturn in housing prices. The Fund held certain specified pools of seasoned and low-balance mortgages with favorable prepayment characteristics that held up well in the uncertain environment for mortgage-backed securities. We also had significant exposure to longer-duration mortgages, which performed well as interest rates continued to decline for most of the period. The Fund's exposure to higher-interest-rate mortgages was less favorable for relative performance. These issues trade at a premium, and trading in them was particularly impacted by proposals that emerged to enable underwater homeowners to prepay mortgages at par and refinance at lower rates. With refinancing continuing to be difficult for many homeowners, given underwater mortgages and tightened lending standards, we remain comfortable with our overall focus on generating income by holding bonds with higher coupons and steady cash flows. We will continue to closely monitor the refinancing environment and various policy proposals with the potential to increase prepayments. With 30-year mortgage rates still near historically low levels, we will continue to look for opportunities to add floating-rate issues where we can find attractive pricing and other ways to position the Fund ahead of an eventual rise in interest rates.
William Chepolis, CFA
Co-Manager
Ohn Choe, CFA
John D. Ryan
Portfolio Managers
The Barclays Capital GNMA Index is an unmanaged, market-value-weighted measure of all fixed-rate securities backed by mortgage pools of the Government National Mortgage Association.
Index returns, unlike fund returns, do not reflect any fees or expenses. It is not possible to invest directly into an index.
1 The federal funds rate is the interest rate, set by the US Federal Reserve, at which banks lend money to each other, usually on an overnight basis.
Portfolio Summary
DWS Government & Agency Securities VIP
Asset Allocation (As a % of Investment Portfolio) | 12/31/10 | 12/31/09 |
| | |
Mortgage-Backed Securities Pass-Throughs | 69% | 70% |
Collateralized Mortgage Obligation | 15% | 16% |
Government & Agency Obligations | 14% | 10% |
Cash Equivalents | 2% | 4% |
| 100% | 100% |
Coupons* | 12/31/10 | 12/31/09 |
| | |
Less than 4.5% | 4% | 18% |
4.5%-5.49% | 50% | 29% |
5.5%-6.49% | 40% | 42% |
6.5%-7.49% | 4% | 6% |
7.5% and Greater | 2% | 5% |
| 100% | 100% |
Interest Rate Sensitivity | 12/31/10 | 12/31/09 |
| | |
Effective Maturity | 5.9 years | 5.7 years |
Effective Duration | 5.0 years | 4.6 years |
* Excludes Cash Equivalents, Securities Lending Collateral and US Treasury Bills.
Asset allocation, coupons and interest rate sensitivity are subject to change.
Effective maturity is the weighted average of the bonds held by the Fund taking into consideration any maturity shortening features.
Effective duration is an approximate measure of the Fund's sensitivity to interest rate changes taking into consideration any maturity shortening features.
For more complete details about the Fund's investment portfolio, see page 128.
Following the Fund's fiscal first and third quarter-end, a complete portfolio holdings listing is filed with the SEC on Form N-Q. The form will be available on the SEC's Web site at www.sec.gov, and it also may be reviewed and copied at the SEC's Public Reference Room in Washington, D.C. Information on the operation of the SEC's Public Reference Room may be obtained by calling (800) SEC-0330. The Fund's portfolio holdings are also posted on www.dws-investments.com from time to time. Please see the Fund's current prospectus for more information.
Investment Portfolio December 31, 2010
DWS Government & Agency Securities VIP
| Principal Amount ($) | Value ($) |
| |
Mortgage-Backed Securities Pass-Throughs 83.3% |
Federal Home Loan Mortgage Corp.: |
| 5.0%, 9/1/2036 (a) | 15,000,000 | 15,732,421 |
| 7.0%, with various maturities from 6/1/2032 until 8/1/2035 | 263,476 | 290,117 |
Federal National Mortgage Association: | |
| 4.5%, 12/1/2038 (a) | 10,000,000 | 10,266,406 |
| 5.0%, with various maturities from 10/1/2033 until 4/1/2036 (a) | 14,422,091 | 15,164,163 |
Government National Mortgage Association: | |
| 4.5%, with various maturities from 2/15/2039 until 10/15/2040 (a) | 3,438,403 | 3,584,194 |
| 5.0%, with various maturities from 12/15/2032 until 7/15/2040 (a) | 11,397,116 | 12,327,983 |
| 5.5%, with various maturities from 3/15/2029 until 3/20/2040 (a) | 46,206,832 | 49,986,154 |
| 6.0%, with various maturities from 7/15/2014 until 7/20/2039 (a) | 17,397,268 | 19,165,837 |
| 6.5%, with various maturities from 4/15/2031 until 2/15/2039 | 4,575,400 | 5,110,697 |
| 7.0%, with various maturities from 10/15/2026 until 2/20/2039 | 2,685,289 | 3,011,685 |
| 7.5%, with various maturities from 4/15/2026 until 1/15/2037 | 1,095,618 | 1,242,032 |
Total Mortgage-Backed Securities Pass-Throughs (Cost $130,051,803) | 135,881,689 |
|
Collateralized Mortgage Obligations 18.2% |
Fannie Mae Benchmark Remic, "ZA", Series 2007-B2, 5.5%, 6/25/2037 | 1,704,216 | 1,790,925 |
Federal Home Loan Mortgage Corp.: | |
| "OA", Series 3179, Principal Only, Zero Coupon, 7/15/2036 | 904,810 | 784,239 |
| "FO", Series 2418, 1.16%*, 2/15/2032 | 529,262 | 539,639 |
| "FA", Series 2419, 1.26%*, 2/15/2032 | 442,297 | 452,259 |
| "FA", Series 2436, 1.26%*, 3/15/2032 | 441,110 | 450,889 |
| "NI", Series 3657, Interest Only, 4.5%, 8/15/2027 | 2,467,460 | 271,639 |
| "ZK", Series 3382, 5.0%, 7/15/2037 | 1,166,312 | 1,201,332 |
| "22", Series 243, Interest Only, 5.325%**, 6/15/2021 | 2,429,666 | 301,574 |
| "PI", Series 2535, Interest Only, 6.0%, 9/15/2032 | 1,075,492 | 82,363 |
| "S17", Series 244, Interest Only, 6.19%**, 12/15/2036 | 3,774,462 | 480,009 |
| "WS", Series 2877, Interest Only, 6.34%**, 10/15/2034 | 1,106,464 | 94,741 |
| "A", Series 172, Interest Only, 6.5%, 1/1/2024 | 50,339 | 9,913 |
| "ST", Series 2411, Interest Only, 8.49%**, 6/15/2021 | 2,413,469 | 379,237 |
| Principal Amount ($) | Value ($) |
| |
Federal National Mortgage Association: | |
| "FA", Series G92-53, 1.031%*, 9/25/2022 | 1,291,456 | 1,307,589 |
| "OF", Series 2001-60, 1.211%*, 10/25/2031 | 223,599 | 227,868 |
| "FB", Series 2002-30, 1.261%*, 8/25/2031 | 485,528 | 496,408 |
| "FG", Series 2002-66, 1.261%*, 9/25/2032 | 753,586 | 770,257 |
| "25", Series 351, Interest Only, 4.5%, 5/1/2019 | 510,823 | 54,370 |
| "HI", Series 2009-77, Interest Only, 4.5%, 9/25/2027 | 2,152,932 | 234,077 |
| "20", Series 334, Interest Only, 5.0%, 3/1/2018 | 373,251 | 38,881 |
| "21", Series 334, Interest Only, 5.0%, 3/1/2018 | 248,750 | 26,378 |
| ''23", Series 339, Interest Only, 5.0%, 7/1/2018 | 522,209 | 55,150 |
| "ZA", Series 2008-24, 5.0%, 4/25/2038 | 602,220 | 618,402 |
| "PI", Series 2009-14, Interest Only, 5.5%, 3/25/2024 | 1,843,156 | 226,232 |
| "ZQ", Series G93-39, 6.5%, 12/25/2023 | 457,372 | 502,399 |
| "SA", Series G92-57, IOette, 82.35%**, 10/25/2022 | 71,607 | 146,159 |
Government National Mortgage Association: | |
| "FB", Series 2001-28, 0.761%*, 6/16/2031 | 491,847 | 496,021 |
| "HI", Series 2010-H06, Interest Only, 1.15%**, 4/20/2060 | 1,022,799 | 49,913 |
| "BI", Series 2010-H01, Interest Only, 1.596%**, 1/20/2060 | 1,988,409 | 147,938 |
| "HI", Series 2010-H21, Interest Only, 1.785%**, 10/20/2060 | 2,048,263 | 166,589 |
| "FI", Series 2009-H01, Interest Only, 1.796%**, 11/20/2059 | 1,998,548 | 153,688 |
| "JY", Series 2010-20, 4.0%, 12/20/2033 | 1,786,472 | 1,647,685 |
| "LI", Series 2009-104, Interest Only, 4.5%, 12/16/2018 | 587,403 | 63,474 |
| "NI", Series 2010-44, Interest Only, 4.5%, 10/20/2037 | 963,539 | 140,720 |
| "CI", Series 2010-87, Interest Only, 4.5%, 11/20/2038 | 1,251,588 | 374,586 |
| "VB", Series 2010-26, 5.0%, 1/20/2024 | 600,000 | 641,071 |
| "KE", Series 2004-19, 5.0%, 3/16/2034 | 500,000 | 520,213 |
| "ZM", Series 2004-24, 5.0%, 4/20/2034 | 2,091,969 | 2,212,195 |
| "Z", Series 2004-61, 5.0%, 8/16/2034 | 1,028,732 | 1,030,343 |
| "LE", Series 2004-87, 5.0%, 10/20/2034 | 1,000,000 | 1,050,448 |
| "ZB", Series 2005-15, 5.0%, 2/16/2035 | 1,471,630 | 1,553,900 |
| "GZ", Series 2005-24, 5.0%, 3/20/2035 | 446,319 | 421,792 |
| "ZA", Series 2005-75, 5.0%, 10/16/2035 | 502,101 | 505,910 |
| Principal Amount ($) | Value ($) |
| |
| "CK", Series 2007-31, 5.0%, 5/16/2037 | 1,000,000 | 1,063,979 |
| "MZ", Series 2009-98, 5.0%, 10/16/2039 | 900,949 | 918,669 |
| "AI", Series 2008-46, Interest Only, 5.5%, 5/16/2023 | 563,141 | 70,675 |
| "AI", Series 2008-51, Interest Only, 5.5%, 5/16/2023 | 1,178,100 | 142,207 |
| "GI", Series 2003-19, Interest Only, 5.5%, 3/16/2033 | 1,090,909 | 223,861 |
| "ZA", Series 2006-7, 5.5%, 2/20/2036 | 2,216,333 | 2,382,304 |
| "IB", Series 2010-130, Interest Only, 5.5%, 2/20/2038 | 2,858,860 | 169,796 |
| "NZ", Series 2009-65, 5.5%, 8/20/2039 | 357,202 | 377,085 |
| "KZ", Series 2009-78, 5.5%, 9/16/2039 | 327,726 | 334,509 |
| "DI", Series 2009-10, Interest Only, 6.0%, 4/16/2038 | 577,014 | 86,183 |
| "PY", Series 2009-122, 6.0%, 12/20/2039 | 650,888 | 701,828 |
| "SJ", Series 2004-22, Interest Only, 6.339%**, 4/20/2034 | 590,550 | 4,362 |
| "SA", Series 2006-47, Interest Only, 6.539%**, 8/16/2036 | 400,205 | 65,259 |
| "SM", Series 2004-49, Interest Only, 6.889%**, 1/20/2034 | 1,154,062 | 129,137 |
| "IC", Series 1997-4, Interest Only, 7.5%, 3/16/2027 | 922,676 | 217,810 |
| "SA", Series 1999-30, Interest Only, 7.739%**, 4/16/2029 | 698,263 | 71,332 |
Total Collateralized Mortgage Obligations (Cost $27,327,105) | 29,678,411 |
|
| Principal Amount ($) | Value ($) |
| |
Government & Agency Obligations 17.0% |
Other Government Related 2.3% |
Citibank NA, FDIC Guaranteed, 0.316%*, 5/7/2012 | 2,800,000 | 2,802,274 |
JPMorgan Chase & Co.: |
| FDIC Guaranteed, 0.532%*, 6/15/2012 | 537,000 | 538,852 |
| Series 3, FDIC Guaranteed, 0.553%*, 12/26/2012 | 463,000 | 465,349 |
| 3,806,475 |
US Government Sponsored Agency 12.5% |
Federal Home Loan Bank, 5.0%, 11/17/2017 | 18,000,000 | 20,407,428 |
US Treasury Obligations 2.2% |
US Treasury Bill, 0.185%***, 3/17/2011 (b) | 1,045,000 | 1,044,767 |
US Treasury Note, 0.875%, 2/29/2012 | 2,500,000 | 2,514,550 |
| 3,559,317 |
Total Government & Agency Obligations (Cost $27,820,256) | 27,773,220 |
|
Shares
| Value ($) |
| |
Cash Equivalents 2.5% |
Central Cash Management Fund, 0.19% (c) (Cost $3,978,480) | 3,978,480 | 3,978,480 |
| % of Net Assets | Value ($) |
| |
Total Investment Portfolio (Cost $189,177,644)+ | 121.0 | 197,311,800 |
Other Assets and Liabilities, Net | (21.0) | (34,184,750) |
Net Assets | 100.0 | 163,127,050 |
* These securities are shown at their current rate as of December 31, 2010. Floating rate securities' yields vary with a designated market index or market rate, such as the coupon-equivalent of the US Treasury bill rate.
** These securities are shown at their current rate as of December 31, 2010.
*** Annualized yield at time of purchase; not a coupon rate.
+ The cost for federal income tax purposes was $189,177,684. At December 31, 2010, net unrealized appreciation for all securities based on tax cost was $8,134,116. This consisted of aggregate gross unrealized appreciation for all securities in which there was an excess of value over tax cost of $8,765,237 and aggregate gross unrealized depreciation for all securities in which there was an excess of tax cost over value of $631,121.
(a) When-issued or delayed delivery securities included.
(b) At December 31, 2010, this security has been pledged, in whole or in part, to cover initial margin requirements for open futures contracts.
(c) Affiliated fund managed by Deutsche Investment Management Americas Inc. The rate shown is the annualized seven-day yield at period end.
FDIC: Federal Deposit Insurance Corp.
Interest Only: Interest Only (IO) bonds represent the "interest only" portion of payments on a pool of underlying mortgages or mortgage-backed securities. IO securities are subject to prepayment risk of the pool of underlying mortgages.
IOettes: These securities represent the right to receive interest payments on an underlying pool of mortgages with similar features as those associated with IO securities. Unlike IO's, a nominal amount of principal is assigned to an IOette which is small in relation to the interest flow that constitutes almost all of the IOette cash flow. The effective yield of this security is lower than the stated interest rate.
Principal Only: Principal Only (PO) bonds represent the "principal only" portion of payments on a pool of underlying mortgages or mortgage-backed securities.
Included in the portfolio are investments in mortgage or asset-backed securities which are interests in separate pools of mortgages or assets. Effective maturities of these investments may be shorter than stated maturities due to prepayments. Some separate investments in the Federal Home Loan Mortgage Corp., Federal National Mortgage Association and Government National Mortgage Association issues which have similar coupon rates have been aggregated for presentation purposes in this investment portfolio.
At December 31, 2010, open futures contracts purchased were as follows:
Futures | Currency | Expiration Date | Contracts | Notional Value ($) | Unrealized Depreciation ($) |
Ultra Long Term US Treasury Bond | USD | 3/22/2011 | 18 | 2,287,688 | (64,828) |
At December 31, 2010, open futures contracts sold were as follows:
Futures | Currency | Expiration Date | Contracts | Notional Value ($) | Unrealized Depreciation ($) |
10 Year US Treasury Note | USD | 3/22/2011 | 119 | 14,332,063 | (80,855) |
Currency Abbreviation |
USD United States Dollar |
At December 31, 2010, open interest rate swap contracts were as follows:
Effective/
Expiration Dates | Notional Amount ($) | Cash Flows Paid by the Fund | Cash Flows Received by the Fund | Value ($) | Upfront Payments Paid/ (Received) ($) | Unrealized Depreciation ($) |
10/28/2010
10/28/2025 | 320,0001 | Floating — LIBOR | Floating — 4.138%++ | (10,086) | — | (10,086) |
11/1/2010
11/1/2025 | 540,0002 | Floating — LIBOR | Floating — 4.292%++ | (48,753) | — | (48,753) |
11/12/2010
11/12/2025 | 640,0001 | Floating — LIBOR | Floating — 4.285%++ | (18,640) | — | (18,640) |
11/15/2010
11/15/2025 | 640,0002 | Floating — LIBOR | Floating — 4.585%++ | (53,840) | — | (53,840) |
11/16/2010
11/16/2025 | 320,0001 | Floating — LIBOR | Floating — 4.584%++ | (6,437) | — | (6,437) |
11/19/2010
11/19/2025 | 320,0002 | Floating — LIBOR | Floating — 4.784%++ | (25,396) | — | (25,396) |
11/23/2010
11/23/2025 | 150,0001 | Floating — LIBOR | Floating — 4.834%++ | (1,981) | — | (1,981) |
Total unrealized depreciation | (165,133) |
++ These interest rate swaps are shown at their current rate as of December 31, 2010.
At December 31, 2010, open total return swap contracts were as follows:
Effective/
Expiration Date | Notional Amount ($) | Fixed Cash Flows Paid | Reference Entity | Value ($) | Upfront Payments Paid/ (Received) ($) | Unrealized Appreciation ($) |
5/28/2010
6/1/2012 | 6,900,0003 | 0.45% | Citi Global Interest Rate Strategy Index | 11,198 | 4,600 | 6,598 |
Counterparties:
1 Morgan Stanley
2 Barclays Capital Securities, Inc.
3 Citigroup, Inc.
LIBOR: London InterBank Offered Rate
For information on the Fund's policy and additional disclosures regarding futures contracts, interest rate swap contracts and total return swap contracts, please refer to the Derivatives section of Note B in the accompanying Notes to Financial Statements.
Fair Value Measurements
Various inputs are used in determining the value of the Fund's investments. These inputs are summarized in three broad levels. Level 1 includes quoted prices in active markets for identical securities. Level 2 includes other significant observable inputs (including quoted prices for similar securities, interest rates, prepayment speeds, and credit risk). Level 3 includes significant unobservable inputs (including the Fund's own assumptions in determining the fair value of investments). The inputs or methodology used for valuing securities are not necessarily an indication of the risk associated with investing in those securities.
The following is a summary of the inputs used as of December 31, 2010 in valuing the Fund's investments. For information on the Fund's policy regarding the valuation of investments, please refer to the Security Valuation section of Note A in the accompanying Notes to Financial Statements.
Assets | Level 1 | Level 2 | Level 3 | Total |
|
Fixed-Income Investments (d) Mortgage-Backed Securities Pass-Throughs | $ — | $ 135,881,689 | $ — | $ 135,881,689 |
Collateralized Mortgage Obligations | — | 29,160,283 | 518,128 | 29,678,411 |
Government & Agency Obligations | — | 26,728,453 | — | 26,728,453 |
Short-Term Investments | 3,978,480 | 1,044,767 | — | 5,023,247 |
Derivatives (e) | — | 6,598 | — | 6,598 |
Total | $ 3,978,480 | $ 192,821,790 | $ 518,128 | $ 197,318,398 |
Liabilities | | | | |
Derivatives (e) | $ (145,683) | $ (165,133) | $ — | $ (310,816) |
Total | $ (145,683) | $ (165,133) | $ — | $ (310,816) |
There have been no significant transfers between Level 1 and Level 2 fair value measurements during the year ended December 31, 2010.
(d) See Investment Portfolio for additional detailed categorizations.
(e) Derivatives include unrealized appreciation (depreciation) on open futures contracts, interest rate swap contracts and total return swap contracts.
Level 3 Reconciliation
The following is a reconciliation of the Fund's Level 3 investments for which significant unobservable inputs were used in determining value:
| Collateralized Mortgage Obligations | Government & Agency Obligations | Total |
Balance as of December 31, 2009 | $ 135,301 | $ 523,600 | $ 658,901 |
Realized gains (loss) | (2,253) | — | (2,253) |
Change in unrealized appreciation (depreciation) | 44,476 | 36,400 | 80,876 |
Amortization premium/discount | (30,311) | — | (30,311) |
Net purchases (sales) | 370,915 | (560,000) | (189,085) |
Transfers into Level 3 | — | — | — |
Transfers (out) of Level 3 | — | — | — |
Balance as of December 31, 2010 | $ 518,218 | $ — | $ 518,218 |
Net change in unrealized appreciation (depreciation) from investments still held as of December 31, 2010 | $ 44,476 | $ — | $ 44,476 |
Transfers between price levels are recognized at the beginning of the reporting period.
The accompanying notes are an integral part of the financial statements.
Statement of Assets and Liabilities
as of December 31, 2010 |
Assets |
Investments Investments in unaffiliated securities, at value (cost $185,199,164) | $ 193,333,320 |
Investment in Central Cash Management Fund (cost $3,978,480) | 3,978,480 |
Total investments, at value (cost $189,177,644) | 197,311,800 |
Cash | 11,209 |
Receivable for when-issued and delayed delivery securities sold | 62,105,877 |
Receivable for Fund shares sold | 82 |
Unrealized appreciation on open swap contracts | 6,598 |
Upfront payments paid on open swap contracts | 4,600 |
Interest receivable | 663,286 |
Other assets | 1,039 |
Total assets | 260,104,491 |
Liabilities |
Payable for when-issued and delayed delivery securities purchased | 96,492,907 |
Payable for Fund shares redeemed | 122,653 |
Payable for daily variation margin on open futures contracts | 22,421 |
Unrealized depreciation on open swap contracts | 165,133 |
Accrued management fee | 64,314 |
Other accrued expenses and payables | 110,013 |
Total liabilities | 96,977,441 |
Net assets, at value | $ 163,127,050 |
Net Assets Consist of |
Undistributed net investment income | 6,521,765 |
Net unrealized appreciation (depreciation) on: Investments | 8,134,156 |
Futures | (145,683) |
Swap contracts | (158,535) |
Accumulated net realized gain (loss) | 2,570,629 |
Paid-in capital | 146,204,718 |
Net assets, at value | $ 163,127,050 |
Class A Net Asset Value, offering and redemption price per share ($157,270,905 ÷ 12,120,178 outstanding shares of beneficial interest, no par value, unlimited number of shares authorized) | $ 12.98 |
Class B Net Asset Value, offering and redemption price per share ($5,856,145 ÷ 452,192 outstanding shares of beneficial interest, no par value, unlimited number of shares authorized) | $ 12.95 |
The accompanying notes are an integral part of the financial statements.
Statement of Operations
for the year ended December 31, 2010 |
Investment Income |
Income: Interest | $ 7,879,825 |
Income distributions — Central Cash Management Fund | 11,105 |
Total income | 7,890,930 |
Expenses: Management fee | 789,612 |
Administration fee | 175,469 |
Services to shareholders | 2,747 |
Distribution service fee (Class B) | 15,782 |
Record keeping fees (Class B) | 6,123 |
Custodian fee | 19,184 |
Legal fees | 10,450 |
Audit and tax fees | 67,125 |
Trustees' fees and expenses | 8,731 |
Reports to shareholders | 21,188 |
Other | 30,423 |
Total expenses | 1,146,834 |
Net investment income | 6,744,096 |
Realized and Unrealized Gain (Loss) |
Net realized gain (loss) from: Investments | 2,806,212 |
Futures | 950,817 |
Written options | 87,625 |
Swap contracts | (659,466) |
| 3,185,188 |
Change in net unrealized appreciation (depreciation) on: Investments | 1,027,186 |
Futures | 475,938 |
Swap contracts | (95,677) |
| 1,407,447 |
Net gain (loss) | 4,592,635 |
Net increase (decrease) in net assets resulting from operations | $ 11,336,731 |
The accompanying notes are an integral part of the financial statements.
Statement of Changes in Net Assets
Increase (Decrease) in Net Assets | Years Ended December 31, |
2010 | 2009 |
Operations: Net investment income | $ 6,744,096 | $ 8,168,646 |
Net realized gain (loss) | 3,185,188 | 2,256,128 |
Change in net unrealized appreciation (depreciation) | 1,407,447 | 5,187,713 |
Net increase (decrease) in net assets resulting from operations | 11,336,731 | 15,612,487 |
Distributions to shareholders from: Net investment income: Class A | (7,785,441) | (9,576,836) |
Class B | (277,185) | (337,035) |
Total distributions | (8,062,626) | (9,913,871) |
Fund share transactions: Class A Proceeds from shares sold | 38,574,553 | 23,250,916 |
Reinvestment of distributions | 7,785,441 | 9,576,836 |
Payments for shares redeemed | (61,339,038) | (80,587,867) |
Net increase (decrease) in net assets from Class A share transactions | (14,979,044) | (47,760,115) |
Class B Proceeds from shares sold | 653,336 | 1,821,403 |
Reinvestment of distributions | 277,185 | 337,035 |
Payments for shares redeemed | (1,704,050) | (3,752,537) |
Net increase (decrease) in net assets from Class B share transactions | (773,529) | (1,594,099) |
Increase (decrease) in net assets | (12,478,468) | (43,655,598) |
Net assets at beginning of period | 175,605,518 | 219,261,116 |
Net assets at end of period (including undistributed net investment income of $6,521,765 and $7,761,196, respectively) | $ 163,127,050 | $ 175,605,518 |
Other Information |
Class A Shares outstanding at beginning of period | 13,231,519 | 17,044,556 |
Shares sold | 2,996,102 | 1,856,164 |
Shares issued to shareholders in reinvestment of distributions | 623,833 | 788,217 |
Shares redeemed | (4,731,276) | (6,457,418) |
Net increase (decrease) in Class A shares | (1,111,341) | (3,813,037) |
Shares outstanding at end of period | 12,120,178 | 13,231,519 |
Class B Shares outstanding at beginning of period | 510,999 | 639,523 |
Shares sold | 50,683 | 144,579 |
Shares issued to shareholders in reinvestment of distributions | 22,193 | 27,739 |
Shares redeemed | (131,683) | (300,842) |
Net increase (decrease) in Class B shares | (58,807) | (128,524) |
Shares outstanding at end of period | 452,192 | 510,999 |
The accompanying notes are an integral part of the financial statements.
Financial Highlights
Class A Years Ended December 31, | 2010 | 2009 | 2008 | 2007 | 2006 |
Selected Per Share Data |
Net asset value, beginning of period | $ 12.78 | $ 12.40 | $ 12.38 | $ 12.28 | $ 12.26 |
Income (loss) from investment operations: Net investment incomea | .50 | .52 | .56 | .58 | .55 |
Net realized and unrealized gain (loss) | .32 | .45 | .04 | .12 | (.06) |
Total from investment operations | .82 | .97 | .60 | .70 | .49 |
Less distributions from: Net investment income | (.62) | (.59) | (.58) | (.60) | (.47) |
Net asset value, end of period | $ 12.98 | $ 12.78 | $ 12.40 | $ 12.38 | $ 12.28 |
Total Return (%) | 6.61 | 8.08 | 4.93b | 5.95b | 4.16 |
Ratios to Average Net Assets and Supplemental Data |
Net assets, end of period ($ millions) | 157 | 169 | 211 | 199 | 211 |
Ratio of expenses before expense reductions (%) | .64 | .58 | .66 | .66 | .67 |
Ratio of expenses after expense reductions (%) | .64 | .58 | .65 | .63 | .67 |
Ratio of net investment income (%) | 3.86 | 4.16 | 4.58 | 4.77 | 4.56 |
Portfolio turnover rate (%) | 423 | 390 | 543 | 465 | 241 |
a Based on average shares outstanding during the period. b Total return would have been lower had certain expenses not been reduced. |
Class B Years Ended December 31, | 2010 | 2009 | 2008 | 2007 | 2006 |
Selected Per Share Data |
Net asset value, beginning of period | $ 12.75 | $ 12.37 | $ 12.35 | $ 12.25 | $ 12.23 |
Income (loss) from investment operations: Net investment incomea | .46 | .48 | .52 | .53 | .50 |
Net realized and unrealized gain (loss) | .31 | .45 | .03 | .12 | (.06) |
Total from investment operations | .77 | .93 | .55 | .65 | .44 |
Less distributions from: Net investment income | (.57) | (.55) | (.53) | (.55) | (.42) |
Net asset value, end of period | $ 12.95 | $ 12.75 | $ 12.37 | $ 12.35 | $ 12.25 |
Total Return (%) | 6.24 | 7.70 | 4.60b | 5.43b | 3.74 |
Ratios to Average Net Assets and Supplemental Data |
Net assets, end of period ($ millions) | 6 | 7 | 8 | 5 | 33 |
Ratio of expenses before expense reductions (%) | .99 | .92 | 1.00 | 1.04 | 1.07 |
Ratio of expenses after expense reductions (%) | .99 | .92 | 1.00 | 1.01 | 1.07 |
Ratio of net investment income (%) | 3.51 | 3.81 | 4.24 | 4.39 | 4.16 |
Portfolio turnover rate (%) | 423 | 390 | 543 | 465 | 241 |
a Based on average shares outstanding during the period. b Total return would have been lower had certain expenses not been reduced. |
Performance Summary December 31, 2010
DWS High Income VIP
All performance shown is historical, assumes reinvestment of all dividend and capital gain distributions and does not guarantee future results. Investment return and principal value fluctuate with changing market conditions so that, when redeemed, shares may be worth more or less than their original cost. Current performance may be lower or higher than the performance data quoted. Please contact your participating insurance company for the Fund's most recent month-end performance. Performance doesn't reflect charges and fees ("contract charges") associated with the separate account that invests in the Fund or any variable life insurance policy or variable annuity contract for which the Fund is an investment option. These charges and fees will reduce returns. While all share classes have the same underlying portfolio, their performance will differ.
The gross expense ratios of the Fund, as stated in the fee table of the prospectus dated May 1, 2010 are 0.67% and 0.94% for Class A and Class B shares, respectively, and may differ from the expense ratios disclosed in the Financial Highlights tables in this report.
Risk Considerations
Bond investments are subject to interest-rate and credit risks. When interest rates rise, bond prices generally fall. Credit risk refers to the ability of an issuer to make timely payments of principal and interest. Investments in lower-quality and non-rated securities present greater risk of loss than investments in higher-quality securities. See the prospectus for details.
Fund returns shown for the 3-year, 5-year and 10-year/life of class periods reflect a fee waiver and/or expense reimbursement. Without this waiver/reimbursement, returns would have been lower.
Growth of an Assumed $10,000 Investment in DWS High Income VIP |
[] DWS High Income VIP — Class A [] Credit Suisse High Yield Index | The Credit Suisse High Yield Index is an unmanaged, trader-priced portfolio constructed to mirror the global high-yield debt market. Index returns, unlike fund returns, do not reflect any fees or expenses. It is not possible to invest directly into an index. |
 | |
Yearly periods ended December 31 | |
Comparative Results |
DWS High Income VIP | 1-Year | 3-Year | 5-Year | 10-Year |
Class A | Growth of $10,000 | $11,400 | $12,138 | $13,538 | $20,159 |
Average annual total return | 14.00% | 6.67% | 6.25% | 7.26% |
Credit Suisse High Yield Index | Growth of $10,000 | $11,442 | $13,028 | $14,966 | $23,912 |
Average annual total return | 14.42% | 9.22% | 8.40% | 9.11% |
DWS High Income VIP | 1-Year | 3-Year | 5-Year | Life of Class* |
Class B | Growth of $10,000 | $11,364 | $12,040 | $13,329 | $19,657 |
Average annual total return | 13.64% | 6.38% | 5.92% | 8.28% |
Credit Suisse High Yield Index | Growth of $10,000 | $11,442 | $13,028 | $14,966 | $22,564 |
Average annual total return | 14.42% | 9.22% | 8.40% | 10.04% |
The growth of $10,000 is cumulative.
* The Fund commenced offering Class B shares on July 1, 2002. Index returns began on June 30, 2002.
Information About Your Fund's Expenses
DWS High Income VIP
As an investor of the Fund, you incur two types of costs: ongoing expenses and transaction costs. Ongoing expenses include management fees, distribution and service (12b-1) fees and other Fund expenses. Examples of transaction costs include contract charges, redemption fees and account maintenance fees, which are not shown in this section. The following tables are intended to help you understand your ongoing expenses (in dollars) of investing in the Fund and to help you compare these expenses with the ongoing expenses of investing in other mutual funds. The example in the table is based on an investment of $1,000 invested at the beginning of the six-month period and held for the entire period (July 1, 2010 to December 31, 2010).
The tables illustrate your Fund's expenses in two ways:
• Actual Fund Return. This helps you estimate the actual dollar amount of ongoing expenses (but not transaction costs) paid on a $1,000 investment in the Fund using the Fund's actual return during the period. To estimate the expenses you paid over the period, simply divide your account value by $1,000 (for example, an $8,600 account value divided by $1,000 = 8.6), then multiply the result by the number in the "Expenses Paid per $1,000" line under the share class you hold.
• Hypothetical 5% Fund Return. This helps you to compare your Fund's ongoing expenses (but not transaction costs) with those of other mutual funds using the Fund's actual expense ratio and a hypothetical rate of return of 5% per year before expenses. Examples using a 5% hypothetical Fund return may be found in the shareholder reports of other mutual funds. The hypothetical account values and expenses may not be used to estimate the actual ending account balance or expenses you paid for the period.
Please note that the expenses shown in these tables are meant to highlight your ongoing expenses only and do not reflect any transaction costs. The "Expenses Paid per $1,000" line of the tables is useful in comparing ongoing expenses only and will not help you determine the relative total expense of owning different funds. If these transaction costs had been included, your costs would have been higher.
Expenses and Value of a $1,000 Investment for the six months ended December 31, 2010 |
Actual Fund Return | Class A | | Class B | |
Beginning Account Value 7/1/10 | $ 1,000.00 | | $ 1,000.00 | |
Ending Account Value 12/31/10 | $ 1,098.70 | | $ 1,098.30 | |
Expenses Paid per $1,000* | $ 3.65 | | $ 5.02 | |
Hypothetical 5% Fund Return | Class A | | Class B | |
Beginning Account Value 7/1/10 | $ 1,000.00 | | $ 1,000.00 | |
Ending Account Value 12/31/10 | $ 1,021.73 | | $ 1,020.42 | |
Expenses Paid per $1,000* | $ 3.52 | | $ 4.84 | |
* Expenses are equal to the Fund's annualized expense ratio for each share class, multiplied by the average account value over the period, multiplied by the number of days in the most recent six-month period, then divided by 365.
Annualized Expense Ratios | Class A | | Class B | |
DWS Variable Series II — DWS High Income VIP | .69% | | .95% | |
For more information, please refer to the Fund's prospectus.
These tables do not reflect charges and fees ("contract charges") associated with the separate account that invests in the Fund or any variable life insurance policy or variable annuity contract for which the Fund is an investment option.
Management Summary December 31, 2010
DWS High Income VIP
High-yield bonds — as gauged by the Fund's benchmark, the Credit Suisse High Yield Index — returned 14.42% in 2010 and outperformed the broader fixed-income market, as measured by the 6.54% return of the Barclays Capital US Aggregate Bond Index. High-yield bonds were energized by an environment of low government bond yields, improving balance sheets for high-yield companies and a steep decline in the default rate. The Class A shares of the Fund returned 14.00% (unadjusted for contract charges), underperforming the benchmark.
The Fund's underperformance was partially the result of our overweights in certain lower-volatility issuers such as NRG Energy, Inc. and HCA, Inc., as well as our underweights in higher-volatility issuers such as CIT Group, Inc., Realogy Corp.* and Residential Capital.*1 These detractors demonstrate that our risk management process can sometimes cause us to miss some winners. However, we believe a focus on risk and reward — rather than trying to chase short-term performance in the hottest areas of the market — remains the most prudent strategy.
The largest contributor to the Fund's performance was the Fund's exposure to bonds issued by Ford Motor Co. Ford benefited from rising sales, increased market share and declining debt, all of which set the stage of an upgrade to its credit quality rating.2 Our security selection in the chemicals sector, were key contributors included Hexion Specialty Chemicals,* Huntsman International LLC and Ashland, Inc., proved helpful to performance.
We maintain an upbeat outlook on high-yield bonds. Many positive factors remain in place, including accommodative monetary policy, new fiscal stimulus, strong corporate balance sheets and the high cash balances of large-cap corporations. The market is also benefiting from increased merger and acquisition activity, a receptive new issue environment, and a lower-than-expected default rate.
Given the supportive factors that characterize the current market backdrop, we believe the combination of attractive yields and a low single-digit default rate indicate a potentially favorable risk/return trade-off for high-yield bonds. However, bottom-up credit research and security selection will be more important than ever, given the substantial impact that individual defaults can have on performance in a low-default environment.
Gary Russell, CFA
Portfolio Manager
The Credit Suisse High Yield Index is an unmanaged, trader-priced portfolio constructed to mirror the global high-yield debt market.
The Barclays Capital US Aggregate Bond Index is an unmanaged, market-value-weighted measure of Treasury issues, agency issues, corporate bond issues and mortgage securities.
Index returns, unlike fund returns, do not reflect any fees or expenses. It is not possible to invest directly into an index.
1 "Overweight" means the Fund holds a higher weighting in a given sector or security than the benchmark. "Underweight" means the Fund holds a lower weighting.
2 Credit quality is a measure of a bond issuer's ability to repay interest and principal in a timely manner. Rating agencies assign letter designations such as AAA, AA and so forth. The lower the rating, the higher the probability of default. The fund's credit quality does not remove market risk and is subject to change.
* Not held in the portfolio as of December 31, 2010.
Portfolio Summary
DWS High Income VIP
Asset Allocation (As a % of Investment Portfolio excluding Securities Lending Collateral) | 12/31/10 | 12/31/09 |
| | |
Corporate Bonds | 87% | 91% |
Cash Equivalents | 8% | 0% |
Loan Participations and Assignments | 4% | 8% |
Preferred Securities | 1% | 1% |
| 100% | 100% |
Sector Diversification (As a % of Investment Portfolio excluding Cash Equivalents and Securities Lending Collateral) | 12/31/10 | 12/31/09 |
| | |
Consumer Discretionary | 20% | 18% |
Financials | 19% | 17% |
Materials | 12% | 14% |
Energy | 12% | 11% |
Telecommunication Services | 11% | 11% |
Industrials | 10% | 8% |
Health Care | 5% | 7% |
Information Technology | 4% | 3% |
Consumer Staples | 4% | 3% |
Utilities | 3% | 8% |
| 100% | 100% |
Quality (As a % of Investment Portfolio excluding Cash Equivalents and Securities Lending Collateral) | 12/31/10 | 12/31/09 |
| | |
A | — | 1% |
BBB | — | 7% |
BB | 15% | 35% |
B | 54% | 37% |
CCC | 26% | 14% |
D | 1% | 3% |
Not Rated | 4% | 3% |
| 100% | 100% |
Interest Rate Sensitivity | 12/31/10 | 12/31/09 |
| | |
Effective Maturity | 5.5 years | 4.8 years |
Effective Duration | 3.5 years | 3.7 years |
Asset allocation, sector diversification and interest rate sensitivity are subject to change.
The quality ratings represent the lower of Moody's Investors Service, Inc. ("Moody's") or Standard & Poor's Corporation ("S&P") credit ratings. The ratings of Moody's and S&P represent their opinions as to the quality of the securities they rate. Ratings are relative and subjective and are not absolute standards of quality. The Fund's credit quality does not remove market risk and is subject to change.
Effective maturity is the weighted average of the bonds held by the Fund taking into consideration any maturity shortening features.
Effective duration is an approximate measure of the Fund's sensitivity to interest rate changes taking into consideration any maturity shortening features.
For more complete details about the Fund's investment portfolio, see page 142 .
Following the Fund's fiscal first and third quarter-end, a complete portfolio holdings listing is filed with the SEC on Form N-Q. The form will be available on the SEC's Web site at www.sec.gov, and it also may be reviewed and copied at the SEC's Public Reference Room in Washington, D.C. Information on the operation of the SEC's Public Reference Room may be obtained by calling (800) SEC-0330. The Fund's portfolio holdings are also posted on www.dws-investments.com from time to time. Please see the Fund's current prospectus for more information.
Investment Portfolio December 31, 2010
DWS High Income VIP
| Principal Amount ($) (a) | Value ($) |
| |
Corporate Bonds 85.6% |
Consumer Discretionary 16.6% |
AMC Entertainment, Inc.: |
| 8.0%, 3/1/2014 | | 590,000 | 595,900 |
| 8.75%, 6/1/2019 | | 765,000 | 816,638 |
American Achievement Corp., 144A, 10.875%, 4/15/2016 | | 570,000 | 584,250 |
Ameristar Casinos, Inc., 9.25%, 6/1/2014 | | 395,000 | 422,650 |
Asbury Automotive Group, Inc.: |
| 7.625%, 3/15/2017 | | 590,000 | 595,900 |
| 144A, 8.375%, 11/15/2020 | | 460,000 | 474,950 |
Ashtead Holdings PLC, 144A, 8.625%, 8/1/2015 | | 380,000 | 393,775 |
Avis Budget Car Rental LLC: |
| 144A, 8.25%, 1/15/2019 | | 535,000 | 540,350 |
| 9.625%, 3/15/2018 | | 260,000 | 280,150 |
Beazer Homes USA, Inc., 144A, 9.125%, 5/15/2019 | | 285,000 | 270,750 |
Bon-Ton Department Stores, Inc., 10.25%, 3/15/2014 | | 155,000 | 158,100 |
Brunswick Corp., 144A, 11.25%, 11/1/2016 | | 295,000 | 351,050 |
Cablevision Systems Corp.: |
| 7.75%, 4/15/2018 | | 65,000 | 68,088 |
| 8.0%, 4/15/2020 | | 65,000 | 69,550 |
CanWest MediaWorks LP, 144A, 9.25%, 8/1/2015** | | 340,000 | 57,800 |
Carrols Corp., 9.0%, 1/15/2013 | | 225,000 | 225,563 |
CCO Holdings LLC: |
| 7.25%, 10/30/2017 | | 520,000 | 527,800 |
| 7.875%, 4/30/2018 | | 225,000 | 232,875 |
| 8.125%, 4/30/2020 | | 150,000 | 157,875 |
Cequel Communications Holdings I LLC, 144A, 8.625%, 11/15/2017 | | 1,280,000 | 1,337,600 |
Clear Channel Worldwide Holdings, Inc.: | |
| Series A, 9.25%, 12/15/2017 | | 100,000 | 108,750 |
| Series B, 9.25%, 12/15/2017 | | 150,000 | 164,250 |
CSC Holdings LLC: |
| 8.5%, 4/15/2014 | | 500,000 | 549,375 |
| 8.5%, 6/15/2015 | | 430,000 | 466,550 |
DineEquity, Inc., 144A, 9.5%, 10/30/2018 | | 455,000 | 482,300 |
DISH DBS Corp., 7.125%, 2/1/2016 | | 465,000 | 480,113 |
Fontainebleau Las Vegas Holdings LLC, 144A, 11.0%, 6/15/2015** | | 490,000 | 1,715 |
Gannett Co., Inc.: |
| 8.75%, 11/15/2014 | | 145,000 | 162,038 |
| 9.375%, 11/15/2017 | | 295,000 | 328,925 |
Goodyear Tire & Rubber Co., 10.5%, 5/15/2016 | | 225,000 | 256,500 |
Great Canadian Gaming Corp., 144A, 7.25%, 2/15/2015 | | 505,000 | 516,362 |
| Principal Amount ($) (a) | Value ($) |
| |
Group 1 Automotive, Inc., 144A, 3.0%, 3/15/2020 | | 375,000 | 466,406 |
Harrah's Operating Co., Inc.: |
| 10.0%, 12/15/2018 | | 790,000 | 720,875 |
| 11.25%, 6/1/2017 | | 1,415,000 | 1,591,875 |
| 144A, 12.75%, 4/15/2018 | | 295,000 | 296,475 |
Hertz Corp.: |
| 144A, 7.5%, 10/15/2018 | | 905,000 | 938,937 |
| 8.875%, 1/1/2014 | | 645,000 | 659,512 |
Lear Corp.: |
| 7.875%, 3/15/2018 | | 235,000 | 251,450 |
| 8.125%, 3/15/2020 | | 230,000 | 250,125 |
Macy's Retail Holdings, Inc., 8.375%, 7/15/2015 | | 85,000 | 99,450 |
Mediacom Broadband LLC, 8.5%, 10/15/2015 | | 635,000 | 638,175 |
Mediacom LLC, 9.125%, 8/15/2019 | | 560,000 | 571,200 |
MGM Resorts International: |
| 144A, 9.0%, 3/15/2020 | | 145,000 | 159,500 |
| 144A, 10.0%, 11/1/2016 | | 105,000 | 107,888 |
| 10.375%, 5/15/2014 | | 340,000 | 381,650 |
| 11.125%, 11/15/2017 | | 455,000 | 523,250 |
Michaels Stores, Inc., Step-up Coupon, 0% to 11/1/2011, 13.0% to 11/1/2016 | | 150,000 | 148,500 |
Neiman Marcus Group, Inc., 10.375%, 10/15/2015 | | 155,000 | 163,719 |
Norcraft Companies LP, 10.5%, 12/15/2015 | | 1,260,000 | 1,338,750 |
Norcraft Holdings LP, 9.75%, 9/1/2012 | | 630,000 | 633,937 |
Penske Automotive Group, Inc., 7.75%, 12/15/2016 | | 1,085,000 | 1,106,700 |
PETCO Animal Supplies, Inc., 144A, 9.25%, 12/1/2018 | | 315,000 | 331,931 |
Phillips-Van Heusen Corp., 7.375%, 5/15/2020 | | 160,000 | 170,000 |
Regal Entertainment Group, 9.125%, 8/15/2018 | | 140,000 | 149,100 |
Sabre Holdings Corp., 8.35%, 3/15/2016 | | 515,000 | 494,400 |
Sears Holdings Corp., 144A, 6.625%, 10/15/2018 | | 345,000 | 321,713 |
Seminole Indian Tribe of Florida: |
| 144A, 7.75%, 10/1/2017 | | 200,000 | 206,500 |
| 144A, 7.804%, 10/1/2020 | | 450,000 | 438,525 |
Simmons Bedding Co., 144A, 11.25%, 7/15/2015 | | 315,000 | 340,200 |
Sirius XM Radio, Inc., 144A, 8.75%, 4/1/2015 | | 340,000 | 368,050 |
Sonic Automotive, Inc.: |
| 5.0%, 10/1/2029 | | 155,000 | 192,588 |
| Series B, 9.0%, 3/15/2018 | | 565,000 | 594,662 |
Standard Pacific Corp.: |
| 8.375%, 5/15/2018 | | 100,000 | 100,000 |
| 10.75%, 9/15/2016 | | 440,000 | 507,100 |
Toys "R" Us, Inc., 7.375%, 10/15/2018 | | 695,000 | 681,100 |
Toys "R" Us-Delaware, Inc., 144A, 7.375%, 9/1/2016 | | 200,000 | 210,000 |
| Principal Amount ($) (a) | Value ($) |
| |
Travelport LLC: |
| 4.921%***, 9/1/2014 | | 390,000 | 345,150 |
| 9.0%, 3/1/2016 | | 390,000 | 377,813 |
| 9.875%, 9/1/2014 | | 275,000 | 267,781 |
Unitymedia GmbH, 144A, 9.625%, 12/1/2019 | EUR | 550,000 | 808,461 |
Unitymedia Hessen GmbH & Co., KG, 144A, 8.125%, 12/1/2017 | | 945,000 | 987,525 |
Univision Communications, Inc., 144A, 7.875%, 11/1/2020 | | 140,000 | 147,000 |
UPC Holding BV: |
| 144A, 8.0%, 11/1/2016 | EUR | 405,000 | 562,850 |
| 144A, 8.375%, 8/15/2020 | EUR | 210,000 | 290,445 |
Vertis, Inc., 13.5%, 4/1/2014 (PIK)** | | 258,716 | 7,761 |
Visant Corp., 144A, 10.0%, 10/1/2017 | | 460,000 | 488,750 |
Wynn Las Vegas LLC, 7.75%, 8/15/2020 | | 280,000 | 303,100 |
Young Broadcasting, Inc., 8.75%, 1/15/2014** | | 2,040,000 | 20 |
| 32,419,391 |
Consumer Staples 3.6% |
B&G Foods, Inc., 7.625%, 1/15/2018 | | 170,000 | 178,925 |
Dole Food Co., Inc., 144A, 8.0%, 10/1/2016 | | 215,000 | 226,825 |
FAGE Dairy Industry SA, 144A, 9.875%, 2/1/2020 | | 555,000 | 555,000 |
General Nutrition Centers, Inc., 5.75%***, 3/15/2014 (PIK) | | 280,000 | 277,200 |
NBTY, Inc., 144A, 9.0%, 10/1/2018 | | 140,000 | 149,450 |
North Atlantic Trading Co., 144A, 10.0%, 3/1/2012 | | 2,081,750 | 1,956,845 |
Rite Aid Corp.: |
| 7.5%, 3/1/2017 | | 295,000 | 283,569 |
| 8.0%, 8/15/2020 | | 580,000 | 603,925 |
Smithfield Foods, Inc., 7.75%, 7/1/2017 | | 1,880,000 | 1,955,200 |
Stater Bros. Holdings, Inc., 144A, 7.375%, 11/15/2018 | | 180,000 | 184,500 |
SUPERVALU, Inc., 8.0%, 5/1/2016 | | 210,000 | 201,075 |
Tops Holding Corp., 10.125%, 10/15/2015 | | 330,000 | 339,075 |
| 6,911,589 |
Energy 10.6% |
Allis-Chalmers Energy, Inc., 9.0%, 1/15/2014 | | 300,000 | 304,500 |
Arch Coal, Inc., 7.25%, 10/1/2020 | | 110,000 | 116,050 |
Belden & Blake Corp., 8.75%, 7/15/2012 | | 2,050,000 | 1,957,750 |
Berry Petroleum Co., 6.75%, 11/1/2020 | | 535,000 | 537,675 |
BreitBurn Energy Partners LP, 144A, 8.625%, 10/15/2020 | | 300,000 | 301,500 |
Bristow Group, Inc., 7.5%, 9/15/2017 | | 485,000 | 511,675 |
Chaparral Energy, Inc., 8.5%, 12/1/2015 | | 1,370,000 | 1,393,975 |
| Principal Amount ($) (a) | Value ($) |
| |
Chesapeake Energy Corp.: |
| 6.625%, 8/15/2020 | | 365,000 | 359,525 |
| 6.875%, 8/15/2018 | | 185,000 | 187,775 |
| 6.875%, 11/15/2020 | | 510,000 | 516,375 |
| 7.25%, 12/15/2018 | | 620,000 | 641,700 |
| 9.5%, 2/15/2015 | | 260,000 | 293,150 |
Cloud Peak Energy Resources LLC: | |
| 8.25%, 12/15/2017 | | 145,000 | 155,694 |
| 8.5%, 12/15/2019 | | 150,000 | 164,250 |
CONSOL Energy, Inc.: |
| 144A, 8.0%, 4/1/2017 | | 655,000 | 697,575 |
| 144A, 8.25%, 4/1/2020 | | 250,000 | 270,000 |
Continental Resources, Inc.: |
| 144A, 7.125%, 4/1/2021 | | 175,000 | 183,750 |
| 7.375%, 10/1/2020 | | 195,000 | 206,700 |
| 8.25%, 10/1/2019 | | 105,000 | 116,550 |
Crosstex Energy LP, 8.875%, 2/15/2018 | | 365,000 | 391,006 |
Dynegy Holdings, Inc., 7.75%, 6/1/2019 | | 330,000 | 220,275 |
Energy Transfer Equity LP, 7.5%, 10/15/2020 | | 215,000 | 221,450 |
Frontier Oil Corp., 6.875%, 11/15/2018 | | 315,000 | 321,300 |
Genesis Energy LP, 144A, 7.875%, 12/15/2018 | | 365,000 | 363,175 |
Global Geophysical Services, Inc., 10.5%, 5/1/2017 | | 775,000 | 771,125 |
Harvest Operations Corp., 144A, 6.875%, 10/1/2017 | | 140,000 | 144,200 |
Holly Corp., 9.875%, 6/15/2017 | | 545,000 | 594,050 |
Holly Energy Partners LP, 144A, 8.25%, 3/15/2018 | | 330,000 | 344,850 |
Inergy LP, 144A, 7.0%, 10/1/2018 | | 350,000 | 352,625 |
Linn Energy LLC: |
| 144A, 7.75%, 2/1/2021 | | 335,000 | 343,375 |
| 144A, 8.625%, 4/15/2020 | | 305,000 | 328,638 |
| 11.75%, 5/15/2017 | | 650,000 | 744,250 |
Newfield Exploration Co., 7.125%, 5/15/2018 | | 640,000 | 673,600 |
Offshore Group Investments Ltd., 144A, 11.5%, 8/1/2015 | | 275,000 | 298,375 |
OPTI Canada, Inc., 7.875%, 12/15/2014 | | 690,000 | 487,312 |
Petrohawk Energy Corp.: |
| 7.25%, 8/15/2018 | | 280,000 | 282,800 |
| 7.875%, 6/1/2015 | | 220,000 | 229,075 |
| 10.5%, 8/1/2014 | | 380,000 | 433,200 |
Plains Exploration & Production Co.: | |
| 7.0%, 3/15/2017 | | 220,000 | 226,050 |
| 7.625%, 6/1/2018 | | 720,000 | 757,800 |
| 8.625%, 10/15/2019 | | 400,000 | 438,000 |
Range Resources Corp., 6.75%, 8/1/2020 | | 105,000 | 108,281 |
Regency Energy Partners LP, 6.875%, 12/1/2018 | | 205,000 | 207,563 |
Sabine Pass LNG LP: |
| 7.25%, 11/30/2013 | | 930,000 | 904,425 |
| 7.5%, 11/30/2016 | | 100,000 | 93,750 |
SandRidge Energy, Inc., 8.625%, 4/1/2015 (PIK) | | 140,000 | 143,325 |
| Principal Amount ($) (a) | Value ($) |
| |
Southwestern Energy Co., 7.5%, 2/1/2018 | | 585,000 | 659,587 |
Stone Energy Corp.: |
| 6.75%, 12/15/2014 | | 590,000 | 575,250 |
| 8.625%, 2/1/2017 | | 125,000 | 126,875 |
| 20,701,756 |
Financials 14.9% |
Abengoa Finance SAU, 144A, 8.875%, 11/1/2017 | | 775,000 | 716,875 |
Algoma Acquisition Corp., 144A, 9.875%, 6/15/2015 | | 830,000 | 747,000 |
Ally Financial, Inc.: |
| 144A, 6.25%, 12/1/2017 | | 555,000 | 555,000 |
| 7.0%, 2/1/2012 | | 565,000 | 584,775 |
| 144A, 7.5%, 9/15/2020 | | 705,000 | 739,369 |
| 8.0%, 3/15/2020 | | 685,000 | 748,362 |
| 8.0%, 11/1/2031 | | 215,000 | 231,663 |
Antero Resources Finance Corp., 9.375%, 12/1/2017 | | 70,000 | 73,238 |
Ardagh Packaging Finance PLC: | |
| 144A, 7.375%, 10/15/2017 | | 215,000 | 221,719 |
| 144A, 7.375%, 10/15/2017 | EUR | 140,000 | 188,485 |
Ashton Woods USA LLC, 144A, Step-up Coupon, 0% to 6/30/2012, 11.0% to 6/30/2015 | | 712,400 | 395,382 |
AWAS Aviation Capital Ltd., 144A, 7.0%, 10/15/2016 | | 600,000 | 594,750 |
Blue Acquisition Sub, Inc., 144A, 9.875%, 10/15/2018 (b) | | 165,000 | 175,725 |
Calpine Construction Finance Co., LP, 144A, 8.0%, 6/1/2016 | | 570,000 | 605,625 |
Case New Holland, Inc., 7.75%, 9/1/2013 | | 290,000 | 311,750 |
CIT Group, Inc.: |
| 7.0%, 5/1/2013 | | 430,000 | 438,600 |
| 7.0%, 5/1/2015 | | 623,195 | 624,753 |
| 7.0%, 5/1/2017 | | 2,085,000 | 2,090,212 |
Dunkin Finance Corp., 144A, 9.625%, 12/1/2018 | | 245,000 | 247,450 |
DuPont Fabros Technology LP, (REIT), 8.5%, 12/15/2017 | | 435,000 | 465,450 |
E*TRADE Financial Corp.: |
| 7.375%, 9/15/2013 | | 995,000 | 990,025 |
| 12.5%, 11/30/2017 (PIK) | | 632,000 | 742,600 |
Express LLC, 8.75%, 3/1/2018 | | 260,000 | 276,250 |
FCE Bank PLC, 9.375%, 1/17/2014 | EUR | 700,000 | 1,040,644 |
Fibria Overseas Finance Ltd., 144A, 7.5%, 5/4/2020 | | 257,000 | 269,850 |
Ford Motor Credit Co., LLC: |
| 6.625%, 8/15/2017 | | 355,000 | 373,102 |
| 8.125%, 1/15/2020 | | 100,000 | 116,341 |
Fresenius US Finance II, Inc., 144A, 9.0%, 7/15/2015 | | 420,000 | 480,900 |
GenOn Escrow Corp., 144A, 9.5%, 10/15/2018 | | 140,000 | 139,125 |
Giraffe Acquisition Corp., 144A, 9.125%, 12/1/2018 | | 330,000 | 344,025 |
Hellas Telecommunications Finance SCA, 144A, 8.985%, 7/15/2015 (PIK)* | EUR | 322,107 | 258 |
| Principal Amount ($) (a) | Value ($) |
| |
Hexion US Finance Corp., 8.875%, 2/1/2018 | | 2,000,000 | 2,137,500 |
Inmarsat Finance PLC, 144A, 7.375%, 12/1/2017 | | 670,000 | 703,500 |
International Lease Finance Corp.: | |
| 144A, 8.625%, 9/15/2015 | | 235,000 | 252,625 |
| 144A, 8.75%, 3/15/2017 | | 465,000 | 498,712 |
iPayment, Inc., 9.75%, 5/15/2014 | | 475,000 | 446,500 |
National Money Mart Co., 10.375%, 12/15/2016 | | 790,000 | 853,200 |
Navios Maritime Acquisition Corp., 144A, 8.625%, 11/1/2017 | | 150,000 | 153,375 |
Nielsen Finance LLC: |
| Step-up Coupon, 0% to 8/1/2011, 12.5% to 8/1/2016 | | 505,000 | 530,250 |
| 144A, 7.75%, 10/15/2018 | | 150,000 | 155,250 |
| 11.5%, 5/1/2016 | | 150,000 | 173,250 |
Nuveen Investments, Inc., 10.5%, 11/15/2015 | | 700,000 | 715,750 |
OMEGA Healthcare Investors, Inc., 144A, (REIT), 6.75%, 10/15/2022 | | 305,000 | 302,331 |
Pinafore LLC, 144A, 9.0%, 10/1/2018 | | 230,000 | 248,400 |
Pinnacle Foods Finance LLC: |
| 8.25%, 9/1/2017 | | 425,000 | 434,562 |
| 9.25%, 4/1/2015 | | 695,000 | 723,669 |
Reynolds Group Issuer, Inc.: |
| 144A, 7.125%, 4/15/2019 | | 415,000 | 422,263 |
| 144A, 7.75%, 10/15/2016 | | 550,000 | 581,625 |
| 144A, 8.5%, 5/15/2018 | | 610,000 | 613,050 |
| 144A, 9.0%, 4/15/2019 | | 590,000 | 611,387 |
Roadhouse Financing, Inc., 144A, 10.75%, 10/15/2017 | | 230,000 | 248,400 |
SLM Corp., 8.0%, 3/25/2020 | | 135,000 | 136,877 |
Susser Holdings LLC, 8.5%, 5/15/2016 | | 175,000 | 187,688 |
Tropicana Entertainment LLC, 9.625%, 12/15/2014** | | 1,220,000 | 622 |
UCI Holdco, Inc., 9.25%***, 12/15/2013 (PIK) | | 769,696 | 767,772 |
Virgin Media Finance PLC, Series 1, 9.5%, 8/15/2016 | | 1,135,000 | 1,282,550 |
WMG Acquisition Corp., 9.5%, 6/15/2016 | | 375,000 | 402,188 |
| 29,112,599 |
Health Care 3.9% |
Community Health Systems, Inc., 8.875%, 7/15/2015 | | 435,000 | 456,750 |
DaVita, Inc.: |
| 6.375%, 11/1/2018 | | 130,000 | 129,350 |
| 6.625%, 11/1/2020 | | 130,000 | 128,700 |
Hanger Orthopedic Group, Inc., 7.125%, 11/15/2018 | | 140,000 | 139,650 |
HCA Holdings, Inc., 144A, 7.75%, 5/15/2021 (b) | | 605,000 | 605,000 |
HCA, Inc.: |
| 9.25%, 11/15/2016 | | 2,040,000 | 2,176,425 |
| 9.625%, 11/15/2016 (PIK) | | 809,000 | 866,641 |
IASIS Healthcare LLC, 8.75%, 6/15/2014 | | 525,000 | 538,781 |
Mylan, Inc., 144A, 7.875%, 7/15/2020 | | 95,000 | 102,363 |
| Principal Amount ($) (a) | Value ($) |
| |
The Cooper Companies, Inc., 7.125%, 2/15/2015 | | 840,000 | 865,200 |
Valeant Pharmaceuticals International: | |
| 144A, 6.75%, 10/1/2017 | | 245,000 | 243,775 |
| 144A, 7.0%, 10/1/2020 | | 385,000 | 380,187 |
Vanguard Health Holding Co. II, LLC: | |
| 8.0%, 2/1/2018 | | 285,000 | 292,125 |
| 144A, 8.0%, 2/1/2018 | | 305,000 | 311,100 |
Warner Chilcott Co., LLC, 144A, 7.75%, 9/15/2018 | | 420,000 | 424,200 |
| 7,660,247 |
Industrials 8.8% |
Accuride Corp., 144A, 9.5%, 8/1/2018 | | 405,000 | 438,413 |
Actuant Corp., 6.875%, 6/15/2017 | | 300,000 | 306,750 |
AMGH Merger Sub, Inc., 144A, 9.25%, 11/1/2018 | | 190,000 | 199,500 |
ARAMARK Corp., 8.5%, 2/1/2015 | | 560,000 | 585,200 |
Armored Autogroup, Inc., 144A, 9.25%, 11/1/2018 | | 610,000 | 605,425 |
ArvinMeritor, Inc., 8.125%, 9/15/2015 | | 280,000 | 292,950 |
BE Aerospace, Inc.: |
| 6.875%, 10/1/2020 | | 210,000 | 216,825 |
| 8.5%, 7/1/2018 | | 300,000 | 328,500 |
Belden, Inc., 7.0%, 3/15/2017 | | 420,000 | 425,250 |
Briggs & Stratton Corp., 6.875%, 12/15/2020 | | 195,000 | 198,900 |
Cenveo Corp., 8.875%, 2/1/2018 | | 1,055,000 | 1,020,712 |
CHC Helicopter SA, 144A, 9.25%, 10/15/2020 | | 390,000 | 403,650 |
Congoleum Corp., 9.0%, 12/31/2017 (PIK) | | 396,000 | 272,998 |
Corrections Corp. of America, 7.75%, 6/1/2017 | | 35,000 | 37,144 |
Delta Air Lines, Inc., 144A, 9.5%, 9/15/2014 | | 99,000 | 107,786 |
DynCorp International, Inc., 144A, 10.375%, 7/1/2017 | | 490,000 | 502,250 |
FTI Consulting, Inc., 144A, 6.75%, 10/1/2020 | | 195,000 | 193,538 |
Garda World Security Corp., 144A, 9.75%, 3/15/2017 | | 375,000 | 402,188 |
Great Lakes Dredge & Dock Co., 7.75%, 12/15/2013 | | 300,000 | 302,625 |
Interline Brands, Inc., 144A, 7.0%, 11/15/2018 | | 295,000 | 299,425 |
K. Hovnanian Enterprises, Inc.: |
| 8.875%, 4/1/2012 | | 435,000 | 426,300 |
| 10.625%, 10/15/2016 | | 365,000 | 374,125 |
Kansas City Southern de Mexico SA de CV: | |
| 7.375%, 6/1/2014 | | 1,045,000 | 1,092,025 |
| 8.0%, 2/1/2018 | | 715,000 | 773,987 |
Kansas City Southern Railway Co., 8.0%, 6/1/2015 | | 655,000 | 704,125 |
Navios Maritime Holdings, Inc., 9.5%, 12/15/2014 | | 680,000 | 707,200 |
Ply Gem Industries, Inc., 13.125%, 7/15/2014 | | 515,000 | 547,187 |
| Principal Amount ($) (a) | Value ($) |
| |
RailAmerica, Inc., 9.25%, 7/1/2017 | | 304,000 | 334,020 |
RBS Global, Inc. & Rexnord Corp.: | |
| 8.5%, 5/1/2018 | | 715,000 | 759,687 |
| 11.75%, 8/1/2016 | | 120,000 | 128,700 |
Rearden G Holdings EINS GmbH, 144A, 7.875%, 3/30/2020 | | 135,000 | 142,425 |
Sitel LLC, 144A, 11.5%, 4/1/2018 | | 565,000 | 466,125 |
Spirit AeroSystems, Inc.: |
| 144A, 6.75%, 12/15/2020 | | 205,000 | 205,513 |
| 7.5%, 10/1/2017 | | 215,000 | 223,600 |
SPX Corp., 144A, 6.875%, 9/1/2017 | | 130,000 | 138,125 |
Titan International, Inc., 144A, 7.875%, 10/1/2017 | | 945,000 | 996,975 |
Triumph Group, Inc., 8.0%, 11/15/2017 | | 75,000 | 78,000 |
Tutor Perini Corp., 144A, 7.625%, 11/1/2018 | | 325,000 | 326,625 |
United Rentals North America, Inc.: | |
| 9.25%, 12/15/2019 | | 830,000 | 923,375 |
| 10.875%, 6/15/2016 | | 390,000 | 445,575 |
USG Corp., 144A, 9.75%, 8/1/2014 | | 220,000 | 232,100 |
| 17,165,823 |
Information Technology 4.1% |
Alcatel-Lucent USA, Inc., 6.45%, 3/15/2029 | | 570,000 | 450,300 |
Allen Systems Group, Inc., 144A, 10.5%, 11/15/2016 | | 210,000 | 211,575 |
Amkor Technology, Inc., 7.375%, 5/1/2018 | | 250,000 | 260,000 |
Aspect Software, Inc., 144A, 10.625%, 5/15/2017 | | 350,000 | 359,188 |
CDW LLC, 11.0%, 10/12/2015 | | 440,000 | 456,500 |
Fidelity National Information Services, Inc.: | |
| 144A, 7.625%, 7/15/2017 | | 95,000 | 99,988 |
| 144A, 7.875%, 7/15/2020 | | 130,000 | 137,475 |
First Data Corp., 144A, 8.875%, 8/15/2020 (b) | | 495,000 | 522,225 |
Freescale Semiconductor, Inc., 144A, 9.25%, 4/15/2018 | | 1,520,000 | 1,672,000 |
InterXion Holding NV, 144A, 9.5%, 2/12/2017 | EUR | 210,000 | 294,654 |
Jabil Circuit, Inc., 7.75%, 7/15/2016 | | 145,000 | 162,763 |
MasTec, Inc., 7.625%, 2/1/2017 | | 610,000 | 606,950 |
SunGard Data Systems, Inc.: |
| 144A, 7.375%, 11/15/2018 | | 140,000 | 140,700 |
| 10.25%, 8/15/2015 | | 1,790,000 | 1,881,737 |
| 10.625%, 5/15/2015 | | 365,000 | 402,412 |
Vangent, Inc., 9.625%, 2/15/2015 | | 350,000 | 316,750 |
| 7,975,217 |
Materials 10.9% |
Appleton Papers, Inc., 144A, 11.25%, 12/15/2015 | | 237,000 | 189,600 |
Ashland, Inc., 9.125%, 6/1/2017 | | 260,000 | 299,650 |
| Principal Amount ($) (a) | Value ($) |
| |
Berry Plastics Corp.: |
| 8.25%, 11/15/2015 | | 660,000 | 699,600 |
| 9.5%, 5/15/2018 | | 390,000 | 390,975 |
| 144A, 9.75%, 1/15/2021 | | 460,000 | 455,400 |
Boise Paper Holdings LLC, 8.0%, 4/1/2020 | | 170,000 | 181,900 |
BWAY Parent Co., Inc., 144A, 10.125%, 11/1/2015 (PIK) | | 230,000 | 232,300 |
Celanese US Holdings LLC, 144A, 6.625%, 10/15/2018 | | 200,000 | 206,500 |
Clearwater Paper Corp., 144A, 7.125%, 11/1/2018 | | 390,000 | 402,675 |
Clondalkin Acquisition BV, 144A, 2.302%***, 12/15/2013 | | 265,000 | 253,738 |
CPG International I, Inc., 10.5%, 7/1/2013 | | 880,000 | 897,600 |
Crown Americas LLC, 7.625%, 5/15/2017 | | 40,000 | 43,000 |
Crown European Holdings SA, 144A, 7.125%, 8/15/2018 | EUR | 125,000 | 174,137 |
Domtar Corp., 10.75%, 6/1/2017 | | 380,000 | 478,800 |
Essar Steel Algoma, Inc., 144A, 9.375%, 3/15/2015 | | 1,410,000 | 1,418,812 |
Exopack Holding Corp., 11.25%, 2/1/2014 | | 1,415,000 | 1,468,062 |
FMG Resources August 2006 Pty Ltd., 144A, 7.0%, 11/1/2015 | | 140,000 | 143,500 |
GEO Specialty Chemicals, Inc.: | |
| 144A, 7.5%, 3/31/2015 (PIK) | | 1,297,793 | 1,116,102 |
| 10.0%, 3/31/2015 | | 1,277,440 | 1,162,470 |
Graphic Packaging International, Inc.: | |
| 7.875%, 10/1/2018 | | 70,000 | 73,325 |
| 9.5%, 6/15/2017 | | 810,000 | 883,912 |
Hexcel Corp., 6.75%, 2/1/2015 | | 1,425,000 | 1,453,500 |
Huntsman International LLC: |
| 8.625%, 3/15/2020 | | 330,000 | 358,875 |
| 144A, 8.625%, 3/15/2021 | | 140,000 | 151,200 |
Ineos Finance PLC: |
| 144A, 9.0%, 5/15/2015 | | 325,000 | 345,719 |
| 144A, 9.25%, 5/15/2015 | EUR | 120,000 | 169,977 |
Koppers, Inc., 7.875%, 12/1/2019 | | 440,000 | 471,900 |
Lumena Resources Corp., 144A, 12.0%, 10/27/2014 | | 1,120,000 | 1,041,600 |
Lyondell Chemical Co., 144A, 8.0%, 11/1/2017 | | 323,000 | 357,319 |
Millar Western Forest Products Ltd., 7.75%, 11/15/2013 | | 200,000 | 189,500 |
Momentive Performance Materials, Inc.: | |
| 144A, 9.0%, 1/15/2021 | | 385,000 | 406,175 |
| 144A, 9.5%, 1/15/2021 | EUR | 385,000 | 535,054 |
NewMarket Corp., 7.125%, 12/15/2016 | | 1,005,000 | 1,027,612 |
OI European Group BV, 144A, 6.75%, 9/15/2020 | EUR | 130,000 | 175,022 |
Radnor Holdings Corp., 11.0%, 3/15/2010** | | 265,000 | 27 |
| Principal Amount ($) (a) | Value ($) |
| |
Rain CII Carbon LLC, 144A, 8.0%, 12/1/2018 | | 270,000 | 276,750 |
Silgan Holdings, Inc., 7.25%, 8/15/2016 | | 415,000 | 441,975 |
Solo Cup Co., 10.5%, 11/1/2013 | | 210,000 | 219,450 |
Texas Industries, Inc., 144A, 9.25%, 8/15/2020 | | 465,000 | 494,063 |
United States Steel Corp., 7.375%, 4/1/2020 | | 480,000 | 492,000 |
Viskase Companies, Inc., 144A, 9.875%, 1/15/2018 | | 940,000 | 979,950 |
Wolverine Tube, Inc., 15.0%, 3/31/2012 (PIK)** | | 830,088 | 448,248 |
| 21,207,974 |
Telecommunication Services 9.7% |
Buccaneer Merger Sub, Inc., 144A, 9.125%, 1/15/2019 | | 130,000 | 134,225 |
Cincinnati Bell, Inc.: |
| 8.25%, 10/15/2017 | | 720,000 | 712,800 |
| 8.375%, 10/15/2020 | | 1,030,000 | 988,800 |
| 8.75%, 3/15/2018 | | 350,000 | 328,125 |
Clearwire Communications LLC, 144A, 12.0%, 12/1/2015 | | 240,000 | 259,200 |
Cricket Communications, Inc.: |
| 144A, 7.75%, 10/15/2020 | | 1,455,000 | 1,385,887 |
| 10.0%, 7/15/2015 (b) | | 380,000 | 407,075 |
Crown Castle International Corp., 9.0%, 1/15/2015 | | 775,000 | 854,437 |
Digicel Group Ltd., 144A, 10.5%, 4/15/2018 | | 495,000 | 544,500 |
Digicel Ltd., 144A, 8.25%, 9/1/2017 | | 1,090,000 | 1,117,250 |
ERC Ireland Preferred Equity Ltd., 144A, 8.05%***, 2/15/2017 (PIK) | EUR | 638,816 | 76,584 |
Frontier Communications Corp.: | |
| 7.875%, 4/15/2015 | | 65,000 | 71,013 |
| 8.25%, 4/15/2017 | | 395,000 | 433,512 |
| 8.5%, 4/15/2020 | | 525,000 | 573,562 |
| 8.75%, 4/15/2022 | | 70,000 | 76,300 |
Grupo Iusacell Celular SA de CV, 10.0%, 3/31/2012** | | 278,182 | 102,927 |
Hughes Network Systems LLC, 9.5%, 4/15/2014 | | 1,105,000 | 1,139,531 |
Intelsat Corp., 9.25%, 6/15/2016 | | 1,735,000 | 1,873,800 |
Intelsat Jackson Holdings SA: |
| 144A, 7.25%, 10/15/2020 | | 695,000 | 701,950 |
| 11.25%, 6/15/2016 | | 65,000 | 70,038 |
Intelsat Luxembourg SA, 11.5%, 2/4/2017 (PIK) | | 765,000 | 845,325 |
Intelsat Subsidiary Holding Co. SA: | |
| Series B, 144A, 8.875%, 1/15/2015 | | 165,000 | 168,713 |
| 8.875%, 1/15/2015 | | 960,000 | 986,400 |
MetroPCS Wireless, Inc.: |
| 6.625%, 11/15/2020 | | 480,000 | 457,200 |
| 7.875%, 9/1/2018 | | 135,000 | 140,063 |
Pacnet Ltd., 144A, 9.25%, 11/9/2015 | | 225,000 | 231,190 |
Sprint Nextel Corp., 8.375%, 8/15/2017 | | 590,000 | 632,775 |
| Principal Amount ($) (a) | Value ($) |
| |
Telesat Canada, 11.0%, 11/1/2015 | | 1,545,000 | 1,734,261 |
West Corp.: |
| 144A, 7.875%, 1/15/2019 | | 285,000 | 289,988 |
| 144A, 8.625%, 10/1/2018 | | 75,000 | 79,500 |
Windstream Corp.: |
| 7.0%, 3/15/2019 | | 430,000 | 423,550 |
| 7.875%, 11/1/2017 | | 845,000 | 888,306 |
| 8.125%, 9/1/2018 | | 180,000 | 189,000 |
| 8.625%, 8/1/2016 | | 70,000 | 73,675 |
| 18,991,462 |
Utilities 2.5% |
AES Corp.: |
| 8.0%, 10/15/2017 | | 415,000 | 438,863 |
| 8.0%, 6/1/2020 | | 525,000 | 556,500 |
Calpine Corp.: |
| 144A, 7.5%, 2/15/2021 | | 485,000 | 477,725 |
| 144A, 7.875%, 7/31/2020 | | 560,000 | 567,000 |
Edison Mission Energy, 7.0%, 5/15/2017 | | 1,220,000 | 966,850 |
Ferrellgas LP, 144A, 6.5%, 5/1/2021 | | 120,000 | 117,000 |
GenOn Energy, Inc., 7.875%, 6/15/2017 | | 150,000 | 145,500 |
NRG Energy, Inc.: |
| 7.375%, 1/15/2017 | | 990,000 | 1,019,700 |
| 144A, 8.25%, 9/1/2020 | | 490,000 | 502,250 |
| 4,791,388 |
Total Corporate Bonds (Cost $166,048,582) | 166,937,446 |
|
Loan Participations and Assignments 4.3% |
Senior Loans*** |
Alliance Mortgage Cycle Loan, Term Loan A, 9.5%, 6/1/2010** | | 700,000 | 0 |
Buffets, Inc.: |
| Letter of Credit, First Lien, 7.539%, 4/22/2015 (PIK) | | 94,092 | 71,980 |
| Term Loan B, 12.0%, 4/21/2015 (PIK) | | 379,251 | 356,307 |
Burger King Corp., New Term Loan B, 6.25%, 10/19/2016 | | 475,000 | 482,880 |
Clear Channel Communication, Term Loan B, 3.911%, 1/28/2016 | | 580,000 | 505,760 |
Dunkin' Brands, Inc., Term Loan B, 5.75%, 11/23/2017 | | 360,000 | 364,851 |
Hawker Beechcraft Acquisition Co., LLC: | |
| Term Loan, 2.261%, 3/26/2014 | | 1,014,352 | 892,112 |
| Letter of Credit, 2.289%, 3/26/2014 | | 60,643 | 53,335 |
IASIS Healthcare LLC, Term Loan, 5.538%, 6/13/2014 (PIK) | | 681,580 | 657,554 |
Kabel Deutschland GmbH, Term Loan, 8.272%, 11/19/2014 (PIK) | EUR | 1,699,736 | 2,265,246 |
Nuveen Investments, Inc., First Lien, Term Loan, 3.303%, 11/13/2014 | | 590,000 | 565,049 |
| Principal Amount ($) (a) | Value ($) |
| |
Pinafore LLC, Term Loan B, 6.25%, 9/29/2016 | | 606,772 | 616,065 |
Roundy's Supermarkets, Inc., Second Lien, Term Loan, 10.0%, 4/18/2016 | | 325,000 | 330,486 |
Tribune Co., Term Loan B, LIBOR plus 3.0%, 6/4/2014** | | 1,009,426 | 705,589 |
US Foodservice, Inc., Term Loan B, 2.76%, 7/3/2014 | | 465,179 | 427,732 |
Total Loan Participations and Assignments (Cost $9,217,474) | 8,294,946 |
|
Preferred Security 0.5% |
Materials |
Hercules, Inc., 6.5%, 6/30/2029 (Cost $733,742) | 1,135,000 | 879,625 |
|
Units
| Value ($) |
| |
Other Investments 0.0% |
Consumer Discretionary |
AOT Bedding Super Holdings LLC* (Cost $31,000) | 31 | 31,000 |
|
Shares
| Value ($) |
| |
Common Stocks 0.1% |
Consumer Discretionary 0.1% |
Buffets Restaurants Holdings, Inc.* | 18,256 | 63,896 |
Dex One Corp.* | 3,884 | 28,975 |
SuperMedia, Inc.* | 726 | 6,323 |
Trump Entertainment Resorts, Inc.* | 45 | 821 |
Vertis Holdings, Inc.* | 9,993 | 0 |
| 100,015 |
Industrials 0.0% |
Congoleum Corp.* | 1,200,000 | 1 |
Quad Graphics, Inc.* | 649 | 26,778 |
| 26,779 |
Materials 0.0% |
GEO Specialty Chemicals, Inc.* | 24,225 | 20,591 |
GEO Specialty Chemicals, Inc. 144A* | 2,206 | 1,875 |
| 22,466 |
Total Common Stocks (Cost $2,406,514) | 149,260 |
|
Warrants 0.0% |
Consumer Discretionary 0.0% |
Reader's Digest Association, Inc., Expiration Date 2/19/2014* | 1,115 | 33 |
Materials 0.0% |
Hercules Trust II, Expiration Date 3/31/2029* | 1,100 | 12,514 |
Total Warrants (Cost $244,286) | 12,547 |
|
|
Shares
| Value ($) |
| |
Preferred Stock 0.2% |
Financials |
Ally Financial, Inc. Series G, 144A, 7.0% (Cost $402,862) | 440 | 415,869 |
|
Securities Lending Collateral 0.7% |
Daily Assets Fund Institutional, 0.27% (c) (d) (Cost $1,419,848) | 1,419,848 | 1,419,848 |
|
|
Shares
| Value ($) |
| |
Cash Equivalents 7.9% |
Central Cash Management Fund, 0.19% (c) (Cost $15,421,844) | 15,421,844 | 15,421,844 |
| % of Net Assets | Value ($) |
| |
Total Investment Portfolio (Cost $195,926,152)+ | 99.3 | 193,562,385 |
Other Assets and Liabilities, Net | 0.7 | 1,455,541 |
Net Assets | 100.0 | 195,017,926 |
* Non-income producing security.
** Non-income producing security. Issuer has defaulted on the payment of principal or interest or has filed for bankruptcy. The following table represents bonds and senior loans that are in default:
Securities | Coupon | Maturity Date | Principal Amount ($) | Acquisition Cost ($) | Value ($) |
Alliance Mortgage Cycle Loan | 9.5% | 6/1/2010 | 700,000 | USD | 700,000 | 0 |
CanWest MediaWorks LP | 9.25% | 8/1/2015 | 340,000 | USD | 340,000 | 57,800 |
Fontainebleau Las Vegas Holdings LLC | 11.0% | 6/15/2015 | 490,000 | USD | 495,963 | 1,715 |
Grupo Iusacell Celular SA de CV | 10.0% | 3/31/2012 | 278,182 | USD | 264,717 | 102,927 |
Radnor Holdings Corp. | 11.0% | 3/15/2010 | 265,000 | USD | 234,313 | 27 |
Tribune Co. | LIBOR plus 3.0% | 6/4/2014 | 1,009,426 | USD | 905,407 | 705,589 |
Tropicana Entertainment LLC | 9.625% | 12/15/2014 | 1,220,000 | USD | 959,601 | 622 |
Vertis, Inc. | 13.5% | 4/1/2014 | 258,716 | USD | 105,102 | 7,761 |
Wolverine Tube, Inc. | 15.0% | 3/31/2012 | 830,088 | USD | 830,088 | 448,248 |
Young Broadcasting, Inc. | 8.75% | 1/15/2014 | 2,040,000 | USD | 1,981,498 | 20 |
| | | | 6,816,689 | 1,324,709 |
*** These securities are shown at their current rate as of December 31, 2010. Floating rate securities' yields vary with a designated market index or market rate, such as the coupon-equivalent of the US Treasury bill rate.
+ The cost for federal income tax purposes was $195,945,391. At December 31, 2010, net unrealized depreciation for all securities based on tax cost was $2,383,006. This consisted of aggregate gross unrealized appreciation for all securities in which there was an excess of value over tax cost of $9,065,576 and aggregate gross unrealized depreciation for all securities in which there was an excess of tax cost over value of $11,448,582.
(a) Principal amount stated in US dollars unless otherwise noted.
(b) All or a portion of these securities were on loan (see Notes to Financial Statements). The value of all securities loaned at December 31, 2010 amounted to $1,366,721, which is 0.7% of net assets.
(c) Affiliated fund managed by Deutsche Investment Management Americas Inc. The rate shown is the annualized seven-day yield at period end.
(d) Represents collateral held in connection with securities lending. Income earned by the Fund is net of borrower rebates.
144A: Security exempt from registration under Rule 144A of the Securities Act of 1933. These securities may be resold in transactions exempt from registration, normally to qualified institutional buyers.
LIBOR: London InterBank Offered Rate
PIK: Denotes that all or a portion of the income is paid in kind.
REIT: Real Estate Investment Trust
At December 31, 2010, open credit default swap contracts sold were as follows:
Effective/
Expiration Date | Notional Amount ($) (e) | Fixed Cash Flows Received | Underlying Debt Obligation/Quality Rating (f) | Value ($) | Upfront Payments Paid/ (Received) ($) | Unrealized Appreciation ($) |
6/21/2010
9/20/2013 | 380,0001 | 5.0% | Ford Motor Co.,
6.5%, 8/1/2018, B | 38,123 | 4,658 | 33,465 |
6/21/2010
9/20/2013 | 1,230,0002 | 5.0% | Ford Motor Co.,
6.5%, 8/1/2018, B | 127,393 | (56,319) | 183,712 |
6/21/2010
9/20/2015 | 560,0003 | 5.0% | Ford Motor Co.,
6.5%, 8/1/2018, B | 63,225 | (9,982) | 73,207 |
6/21/2010
9/20/2015 | 175,0004 | 5.0% | Ford Motor Co.,
6.5%, 8/1/2018, B | 19,758 | (16,625) | 36,383 |
6/21/2010
9/20/2015 | 320,0005 | 5.0% | Ford Motor Co.,
6.5%, 8/1/2018, B | 32,103 | (9,200) | 41,303 |
6/21/2010
9/20/2015 | 100,0002 | 5.0% | Ford Motor Co.,
6.5%, 8/1/2018, B | 11,290 | (6,896) | 18,186 |
Total unrealized appreciation | 386,256 |
(e) The maximum potential amount of future undiscounted payments that the Fund could be required to make under a credit default swap contract would be the notional amount of the contract. These potential amounts would be partially offset by any recovery values of the referenced debt obligation or net amounts received from the settlement of buy protection credit default swap contracts entered into by the Fund for the same referenced debt obligation.
(f) The quality ratings represent the lower of Moody's Investors Service, Inc. ("Moody's") or Standard & Poor's Corporation ("S&P") credit ratings.
Counterparties:
1 Citigroup, Inc.
2 The Goldman Sachs & Co.
3 Bank of America
4 JPMorgan Chase Securities, Inc.
5 Credit Suisse
At December 31, 2010, the Fund had the following open forward foreign currency exchange contracts:
Contracts to Deliver | | In Exchange For | | Settlement Date | | Unrealized Appreciation ($) | Counterparty |
USD | 120,274 | | EUR | 91,900 | | 1/20/2011 | | 2,528 | JP Morgan Chase Securities, Inc. |
Contracts to Deliver | | In Exchange For | | Settlement Date | | Unrealized Depreciation ($) | Counterparty |
EUR | 4,957,900 | | USD | 6,564,051 | | 1/20/2011 | | (60,959) | JPMorgan Chase Securities, Inc. |
Currency Abbreviations |
EUR Euro USD United States Dollar |
For information on the Fund's policy and additional disclosures regarding credit default swap contracts and forward foreign currency exchange contracts, please refer to Note A in the accompanying Notes to Financial Statements.
Fair Value Measurements
Various inputs are used in determining the value of the Fund's investments. These inputs are summarized in three broad levels. Level 1 includes quoted prices in active markets for identical securities. Level 2 includes other significant observable inputs (including quoted prices for similar securities, interest rates, prepayment speeds, and credit risk). Level 3 includes significant unobservable inputs (including the Fund's own assumptions in determining the fair value of investments). The inputs or methodology used for valuing securities are not necessarily an indication of the risk associated with investing in those securities.
The following is a summary of the inputs used as of December 31, 2010 in valuing the Fund's investments. For information on the Fund's policy regarding the valuation of investments, please refer to the Security Valuation section of Note A in the accompanying Notes to Financial Statements.
Assets | Level 1 | Level 2 | Level 3 | Total |
|
Fixed Income Investments (g) | | | | |
Corporate Bonds | $ — | $ 164,153,007 | $ 2,784,439 | $ 166,937,446 |
Loan Participations and Assignments | — | 8,294,946 | 0 | 8,294,946 |
Preferred Security | — | 879,625 | — | 879,625 |
Other Investments | — | — | 31,000 | 31,000 |
Common Stocks (g) | 125,972 | — | 23,288 | 149,260 |
Warrants (g) | — | — | 12,547 | 12,547 |
Preferred Stock | — | 415,869 | — | 415,869 |
Short-Term Investments (g) | 16,841,692 | — | — | 16,841,692 |
Derivatives (h) | — | 388,784 | — | 388,784 |
Total | $ 16,967,664 | $ 174,132,231 | $ 2,851,274 | $ 193,951,169 |
Liabilities | | | | |
Derivatives (h) | $ — | $ (60,959) | $ — | $ (60,959) |
Total | $ — | $ (60,959) | $ — | $ (60,959) |
There have been no significant transfers between Level 1 and Level 2 fair value measurements during the year ended December 31, 2010.
(g) See Investment Portfolio for additional detailed categorizations.
(h) Derivatives include unrealized appreciation (depreciation) on open credit default swap contracts and forward foreign currency exchange contracts.
Level 3 Reconciliation
The following is a reconciliation of the Fund's Level 3 investments for which significant unobservable inputs were used in determining value:
| Corporate Bonds | Loan Participations and Assignments | Other Investments | Common Stocks | Convertible Preferred Stocks | Warrants | Total |
Balance as of December 31, 2009 | $ 2,525,906 | $ 1,393,416 | $ — | $ 22,466 | $ 0 | $ 5,989 | $ 3,947,777 |
Realized gains (loss) | — | 98,158 | — | — | (46,019) | — | 52,139 |
Change in unrealized appreciation (depreciation) | 233,232 | 38,370 | 0 | (89) | 46,019 | 6,558 | 324,090 |
Amortization premium/discount | 16,050 | 11,724 | — | — | — | — | 27,774 |
Net purchases (sales) | 165,230 | (1,541,668) | 31,000 | 911 | 0 | 0 | (1,344,527) |
Transfers into Level 3 | 57,741 (i) | — | — | — | — | — | 57,741 |
Transfers (out) of Level 3 | (213,720) (j) | — | — | — | — | — | (213,720) |
Balance as of December 31, 2010 | $ 2,784,439 | $ 0 | $ 31,000 | $ 23,288 | $ — | $ 12,547 | $ 2,851,274 |
Net change in unrealized appreciation (depreciation) from investments still held as of December 31, 2010 | $ (710,006) | $ 0 | $ 0 | $ (89) | $ — | $ 6,558 | $ (690,530) |
Transfers between price levels are recognized at the beginning of the reporting period.
(i) The investment was transferred from Level 2 to Level 3 because of the lack of observable market data due to a decrease in market activity.
(j) The investment was transferred from Level 3 to Level 2 as a result of the availability of a pricing source supported by observable inputs.
The accompanying notes are an integral part of the financial statements.
Statement of Assets and Liabilities
as of December 31, 2010 |
Assets |
Investments: Investments in unaffiliated securities, at value (cost $179,084,460) — including $1,366,721 of securities loaned | $ 176,720,693 |
Investment in Daily Assets Fund Institutional (cost $1,419,848)* | 1,419,848 |
Investment in Central Cash Management Fund (cost $15,421,844) | 15,421,844 |
Total investments, at value (cost $195,926,152) | 193,562,385 |
Cash | 75,291 |
Deposits from broker for open swap contracts | 110,000 |
Foreign currency, at value (cost $132) | 134 |
Receivable for investments sold | 368,304 |
Receivable for Fund shares sold | 43,905 |
Unrealized appreciation on open swap contracts | 386,256 |
Upfront payments paid on swaps | 4,658 |
Unrealized appreciation on open forward foreign currency exchange contracts | 2,528 |
Interest receivable | 3,600,397 |
Foreign taxes recoverable | 3,198 |
Other assets | 1,102 |
Total assets | 198,158,158 |
Liabilities |
Payable for investments purchased | 1,180,462 |
Payable upon return of deposit | 110,000 |
Payable for Fund shares redeemed | 46,874 |
Payable upon return of securities loaned | 1,419,848 |
Upfront payments received on open swap contracts | 99,022 |
Unrealized depreciation on open forward foreign currency exchange contracts | 60,959 |
Accrued management fee | 79,351 |
Other accrued expenses and payables | 143,716 |
Total liabilities | 3,140,232 |
Net assets, at value | $ 195,017,926 |
Net Assets Consist of |
Undistributed net investment income | 15,993,708 |
Net unrealized appreciation (depreciation) on: Investments | (2,363,767) |
Swap contracts | 386,256 |
Foreign currency | (58,348) |
Accumulated net realized gain (loss) | (53,315,448) |
Paid-in capital | 234,375,525 |
Net assets, at value | $ 195,017,926 |
Class A Net Asset Value, offering and redemption price per share ($194,873,758 ÷ 28,235,548 outstanding shares of beneficial interest, no par value, unlimited number of shares authorized) | $ 6.90 |
Class B Net Asset Value, offering and redemption price per share ($144,168 ÷ 20,802 outstanding shares of beneficial interest, no par value, unlimited number of shares authorized) | $ 6.93 |
* Represents collateral on securities loaned.
The accompanying notes are an integral part of the financial statements.
Statement of Operations
for the year ended December 31, 2010 |
Investment Income |
Interest (net of foreign taxes withheld of $1,461) | $ 16,276,745 |
Income distributions — Central Cash Management Fund | 20,610 |
Securities lending income, including income from Daily Assets Fund Institutional, net of borrower rebates | 12,213 |
Total income | 16,309,568 |
Expenses: Management fee | 946,284 |
Administration fee | 189,257 |
Services to shareholders | 7,017 |
Distribution service fee (Class B) | 367 |
Custodian fee | 48,519 |
Legal fees | 54,464 |
Audit and tax fees | 74,597 |
Trustees' fees and expenses | 9,300 |
Reports to shareholders | 11,655 |
Other | 25,049 |
Total expenses | 1,366,509 |
Net investment income (loss) | 14,943,059 |
Realized and Unrealized Gain (Loss) |
Net realized gain (loss) from: Investments | 797,934 |
Swap contracts | 1,020,868 |
Foreign currency | 1,101,998 |
| 2,920,800 |
Change in net unrealized appreciation (depreciation) on: Investments | 6,596,217 |
Swap contracts | 386,256 |
Foreign currency | (30,720) |
| 6,951,753 |
Net gain (loss) | 9,872,553 |
Net increase (decrease) in net assets resulting from operations | $ 24,815,612 |
The accompanying notes are an integral part of the financial statements.
Statement of Changes in Net Assets
Increase (Decrease) in Net Assets | Years Ended December 31, |
2010 | 2009 |
Operations: Net investment income | $ 14,943,059 | $ 15,506,352 |
Net realized gain (loss) | 2,920,800 | (10,439,947) |
Change in net unrealized appreciation (depreciation) | 6,951,753 | 54,537,371 |
Net increase (decrease) in net assets resulting from operations | 24,815,612 | 59,603,776 |
Distributions to shareholders from: Net investment income: Class A | (15,325,538) | (18,645,480) |
Class B | (11,524) | (15,950) |
Total distributions | (15,337,062) | (18,661,430) |
Fund share transactions: Class A Proceeds from shares sold | 73,550,670 | 36,369,714 |
Reinvestment of distributions | 15,325,538 | 18,645,480 |
Payments for shares redeemed | (100,347,223) | (52,798,244) |
Net increase (decrease) in net assets from Class A share transactions | (11,471,015) | 2,216,950 |
Class B Proceeds from shares sold | 2,173 | 2,036 |
Reinvestment of distributions | 11,524 | 15,950 |
Payments for shares redeemed | (27,277) | (32,524) |
Net increase (decrease) in net assets from Class B share transactions | (13,580) | (14,538) |
Increase (decrease) in net assets | (2,006,045) | 43,144,758 |
Net assets at beginning of period | 197,023,971 | 153,879,213 |
Net assets at end of period (including undistributed net investment income of $15,993,708 and $15,102,955, respectively) | $ 195,017,926 | $ 197,023,971 |
Other Information |
Class A Shares outstanding at beginning of period | 30,057,940 | 29,000,230 |
Shares sold | 11,151,687 | 6,555,256 |
Shares issued to shareholders in reinvestment of distributions | 2,379,742 | 3,844,429 |
Shares redeemed | (15,353,821) | (9,341,975) |
Net increase (decrease) in Class A shares | (1,822,392) | 1,057,710 |
Shares outstanding at end of period | 28,235,548 | 30,057,940 |
Class B Shares outstanding at beginning of period | 22,888 | 25,274 |
Shares sold | 319 | 379 |
Shares issued to shareholders in reinvestment of distributions | 1,778 | 3,268 |
Shares redeemed | (4,183) | (6,033) |
Net increase (decrease) in Class B shares | (2,086) | (2,386) |
Shares outstanding at end of period | 20,802 | 22,888 |
The accompanying notes are an integral part of the financial statements.
Financial Highlights
Class A Years Ended December 31, | 2010 | 2009 | 2008 | 2007 | 2006 |
Selected Per Share Data |
Net asset value, beginning of period | $ 6.55 | $ 5.30 | $ 7.81 | $ 8.38 | $ 8.23 |
Income (loss) from investment operations: Net investment incomea | .52 | .51 | .57 | .63 | .62 |
Net realized and unrealized gain (loss) | .36 | 1.40 | (2.29) | (.54) | .19 |
Total from investment operations | .88 | 1.91 | (1.72) | .09 | .81 |
Less distributions from: Net investment income | (.53) | (.66) | (.79) | (.66) | (.66) |
Net asset value, end of period | $ 6.90 | $ 6.55 | $ 5.30 | $ 7.81 | $ 8.38 |
Total Return (%) | 14.00 | 39.99 | (23.94)b | .96 | 10.47 |
Ratios to Average Net Assets and Supplemental Data |
Net assets, end of period ($ millions) | 195 | 197 | 154 | 248 | 322 |
Ratio of expenses before expense reductions (%) | .72 | .67 | .80 | .69 | .71 |
Ratio of expenses after expense reductions (%) | .72 | .67 | .79 | .69 | .71 |
Ratio of net investment income (%) | 7.90 | 8.81 | 8.42 | 7.84 | 7.73 |
Portfolio turnover rate (%) | 93 | 66 | 38 | 61 | 93 |
a Based on average shares outstanding during the period. b Total return would have been lower had certain expenses not been reduced. |
Class B Years Ended December 31, | 2010 | 2009 | 2008 | 2007 | 2006 |
Selected Per Share Data |
Net asset value, beginning of period | $ 6.58 | $ 5.31 | $ 7.81 | $ 8.38 | $ 8.22 |
Income (loss) from investment operations: Net investment incomea | .50 | .49 | .53 | .60 | .59 |
Net realized and unrealized gain (loss) | .36 | 1.42 | (2.27) | (.54) | .20 |
Total from investment operations | .86 | 1.91 | (1.74) | .06 | .79 |
Less distributions from: Net investment income | (.51) | (.64) | (.76) | (.63) | (.63) |
Net asset value, end of period | $ 6.93 | $ 6.58 | $ 5.31 | $ 7.81 | $ 8.38 |
Total Return (%) | 13.64 | 39.64 | (24.13)b | .54 | 10.11 |
Ratios to Average Net Assets and Supplemental Data |
Net assets, end of period ($ millions) | .1 | .2 | .1 | 10 | 53 |
Ratio of expenses before expense reductions (%) | .99 | .94 | 1.25 | 1.08 | 1.10 |
Ratio of expenses after expense reductions (%) | .99 | .94 | 1.23 | 1.08 | 1.10 |
Ratio of net investment income (%) | 7.63 | 8.54 | 7.98 | 7.45 | 7.34 |
Portfolio turnover rate (%) | 93 | 66 | 38 | 61 | 93 |
a Based on average shares outstanding during the period. b Total return would have been lower had certain expenses not been reduced. |
Performance Summary December 31, 2010
DWS Large Cap Value VIP
All performance shown is historical, assumes reinvestment of all dividend and capital gain distributions and does not guarantee future results. Investment return and principal value fluctuate with changing market conditions so that, when redeemed, shares may be worth more or less than their original cost. Current performance may be lower or higher than the performance data quoted. Please contact your participating insurance company for the Fund's most recent month-end performance. Performance doesn't reflect charges and fees ("contract charges") associated with the separate account that invests in the Fund or any variable life insurance policy or variable annuity contract for which the Fund is an investment option. These charges and fees will reduce returns. While all share classes have the same underlying portfolio, their performance will differ.
The gross expense ratios of the Fund, as stated in the fee table of the prospectus dated May 1, 2010 are 0.76% and 1.06% for Class A and Class B shares, respectively, and may differ from the expense ratios disclosed in the Financial Highlights tables in this report.
Risk Considerations
Stocks may decline in value. See the prospectus for details.
Fund returns shown for the 3-year, 5-year and 10-year/Life of Class periods reflect a fee waiver and/or expense reimbursement. Without this waiver/reimbursement, returns would have been lower.
Growth of an Assumed $10,000 Investment in DWS Large Cap Value VIP |
[] DWS Large Cap Value VIP — Class A [] Russell 1000® Value Index | The Russell 1000® Value Index is an unmanaged index that consists of those stocks in the Russell 1000 Index with less-than-average growth orientation. Russell 1000® Index is an unmanaged price-only index of the 1,000 largest capitalized companies that are domiciled in the US and whose common stocks are traded. Index returns assume reinvestment of dividends and, unlike fund returns, do not reflect any fees or expenses. It is not possible to invest directly into an index. |
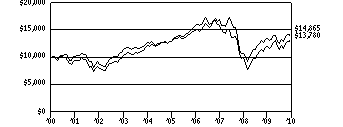 | |
Yearly periods ended December 31 | |
Comparative Results |
DWS Large Cap Value VIP | 1-Year | 3-Year | 5-Year | 10-Year |
Class A | Growth of $10,000 | $11,077 | $8,833 | $11,534 | $14,865 |
Average annual total return | 10.77% | -4.05% | 2.90% | 4.04% |
Russell 1000 Value Index | Growth of $10,000 | $11,551 | $8,731 | $10,654 | $13,780 |
Average annual total return | 15.51% | -4.42% | 1.28% | 3.26% |
DWS Large Cap Value VIP | 1-Year | 3-Year | 5-Year | Life of Class* |
Class B | Growth of $10,000 | $11,053 | $8,744 | $11,335 | $14,675 |
Average annual total return | 10.53% | -4.38% | 2.54% | 4.62% |
Russell 1000 Value Index | Growth of $10,000 | $11,551 | $8,731 | $10,654 | $15,327 |
Average annual total return | 15.51% | -4.42% | 1.28% | 5.15% |
The growth of $10,000 is cumulative.
* The Fund commenced offering Class B shares on July 1, 2002. Index returns began on June 30, 2002.
Information About Your Fund's Expenses
DWS Large Cap Value VIP
As an investor of the Fund, you incur two types of costs: ongoing expenses and transaction costs. Ongoing expenses include management fees, distribution and service (12b-1) fees and other Fund expenses. Examples of transaction costs include contract charges, redemption fees and account maintenance fees, which are not shown in this section. The following tables are intended to help you understand your ongoing expenses (in dollars) of investing in the Fund and to help you compare these expenses with the ongoing expenses of investing in other mutual funds. The example in the table is based on an investment of $1,000 invested at the beginning of the six-month period and held for the entire period (July 1, 2010 to December 31, 2010).
The tables illustrate your Fund's expenses in two ways:
• Actual Fund Return. This helps you estimate the actual dollar amount of ongoing expenses (but not transaction costs) paid on a $1,000 investment in the Fund using the Fund's actual return during the period. To estimate the expenses you paid over the period, simply divide your account value by $1,000 (for example, an $8,600 account value divided by $1,000 = 8.6), then multiply the result by the number in the "Expenses Paid per $1,000" line under the share class you hold.
• Hypothetical 5% Fund Return. This helps you to compare your Fund's ongoing expenses (but not transaction costs) with those of other mutual funds using the Fund's actual expense ratio and a hypothetical rate of return of 5% per year before expenses. Examples using a 5% hypothetical Fund return may be found in the shareholder reports of other mutual funds. The hypothetical account values and expenses may not be used to estimate the actual ending account balance or expenses you paid for the period.
Please note that the expenses shown in these tables are meant to highlight your ongoing expenses only and do not reflect any transaction costs. The "Expenses Paid per $1,000" line of the tables is useful in comparing ongoing expenses only and will not help you determine the relative total expense of owning different funds. If these transaction costs had been included, your costs would have been higher.
Expenses and Value of a $1,000 Investment for the six months ended December 31, 2010 |
Actual Fund Return | Class A | | Class B | |
Beginning Account Value 7/1/10 | $ 1,000.00 | | $ 1,000.00 | |
Ending Account Value 12/31/10 | $ 1,194.30 | | $ 1,192.90 | |
Expenses Paid per $1,000* | $ 4.48 | | $ 6.08 | |
Hypothetical 5% Fund Return | Class A | | Class B | |
Beginning Account Value 7/1/10 | $ 1,000.00 | | $ 1,000.00 | |
Ending Account Value 12/31/10 | $ 1,021.12 | | $ 1,019.66 | |
Expenses Paid per $1,000* | $ 4.13 | | $ 5.60 | |
* Expenses are equal to the Fund's annualized expense ratio for each share class, multiplied by the average account value over the period, multiplied by the number of days in the most recent six-month period, then divided by 365.
Annualized Expense Ratios | Class A | | Class B | |
DWS Variable Series II — DWS Large Cap Value VIP | .81% | | 1.10% | |
For more information, please refer to the Fund's prospectus.
These tables do not reflect charges and fees ("contract charges") associated with the separate account that invests in the Fund or any variable life insurance policy or variable annuity contract for which the Fund is an investment option.
Management Summary December 31, 2010
DWS Large Cap Value VIP
The DWS Large Cap Value VIP delivered a total return of 10.77% in 2010 (Class A shares, unadjusted for contract charges) but underperformed the 15.51% return of the benchmark, the Russell 1000® Value Index. While we added quite a bit of value through our sector allocations — specifically, our underweight in financials and overweight in energy — this was more than offset by the underperformance of our individual stock picks.1
Although the Fund (Class A shares) lagged the Russell 1000 Value Index during the past year, it has outpaced the benchmark by a comfortable margin over the 3-, 5- and 10-year periods ended December 31, 2010.
An important reason for the Fund's underperformance was our preference for high-dividend-paying stocks with stable cash flows and our corresponding underweight in the higher-risk cyclical areas of the market. This positioning was based on our view that the economic recovery was largely the result of short-term, unsustainable fiscal and monetary stimuli rather than a sustainable, longer-term improvement in final demand. Expecting that this would ultimately result in a lower-growth, lower-return market environment, we shifted assets out of cyclical deep-value stocks into less cyclical stable-value stocks during the early part of the year. Unfortunately, cyclical higher-beta stocks, in fact, strongly outperformed the market by a substantial margin during the past 12 months.2
Although our defensive approach hurt performance in 2010, we believe it remains appropriate given our ongoing caution regarding the broader market. Additionally, it positions the Fund in the areas of the market with the most attractive valuations.3 Many cyclical stocks staged substantial rallies in the fourth quarter, leaving them vulnerable to potential disappointments. Conversely, many stocks that lagged during the recent run-up offer much more reasonable valuations. These types of out-of-favor, undervalued stocks are typically characterized by more muted investor expectations, meaning that they are both less vulnerable to disappointments and more likely to have upside potential. We therefore remain consistent in our strategy as we await the potential return to compelling performance for the market's most attractively valued companies.
Thomas Schuessler, PhD.
Lead Portfolio Manager
Volker Dosch
Oliver Pfeil, PhD.
Portfolio Managers
The Russell 1000® Value Index is an unmanaged index that consists of those stocks in the Russell 1000 Index with less-than-average growth orientation. Russell 1000® Index is an unmanaged price-only index of the 1,000 largest capitalized companies that are domiciled in the US and whose common stocks are traded.
Index returns assume reinvestment of dividends and, unlike fund returns, do not reflect any fees or expenses. It is not possible to invest directly into an index.
1 "Overweight" means the Fund holds a higher weighting in a given sector or security than the benchmark. "Underweight" means the Fund holds a lower weighting.
2 Beta is a measure of volatility, or systematic risk, of a security or a portfolio in comparison to the market as a whole.
3 "Valuation" refers to the price investors pay for a given security. An asset can be undervalued, meaning that it trades for less than its intrinsic value, or overvalued, which means that it trades at a more expensive price than its underlying worth.
Portfolio Summary
DWS Large Cap Value VIP
Asset Allocation (As a % of Investment Portfolio excluding Securities Lending Collateral) | 12/31/10 | 12/31/09 |
| | |
Common Stocks | 98% | 99% |
Cash Equivalents | 2% | 1% |
| 100% | 100% |
Sector Diversification (As a % of Common Stocks) | 12/31/10 | 12/31/09 |
| | |
Energy | 18% | 15% |
Financials | 13% | 15% |
Health Care | 12% | 13% |
Consumer Staples | 12% | 12% |
Utilities | 10% | 11% |
Telecommunication Services | 9% | 11% |
Information Technology | 8% | 2% |
Consumer Discretionary | 7% | 5% |
Industrials | 6% | 10% |
Materials | 5% | 6% |
| 100% | 100% |
Asset allocation and sector diversification are subject to change.
For more complete details about the Fund's investment portfolio, see page 167.
Following the Fund's fiscal first and third quarter-end, a complete portfolio holdings listing is filed with the SEC on Form N-Q. The form will be available on the SEC's Web site at www.sec.gov, and it also may be reviewed and copied at the SEC's Public Reference Room in Washington, D.C. Information on the operation of the SEC's Public Reference Room may be obtained by calling (800) SEC-0330. The Fund's portfolio holdings are also posted on www.dws-investments.com from time to time. Please see the Fund's current prospectus for more information.
Investment Portfolio December 31, 2010
DWS Large Cap Value VIP
|
Shares
| Value ($) |
| |
Common Stocks 97.8% |
Consumer Discretionary 7.2% |
Distributors 2.1% |
Genuine Parts Co. | 84,678 | 4,347,369 |
Diversified Consumer Services 1.3% |
H&R Block, Inc. (a) | 217,813 | 2,594,153 |
Hotels Restaurants & Leisure 1.3% |
Carnival Corp. (Units) | 59,867 | 2,760,467 |
Media 1.4% |
News Corp. "A" | 197,872 | 2,881,016 |
Textiles, Apparel & Luxury Goods 1.1% |
VF Corp. (a) | 26,538 | 2,287,045 |
Consumer Staples 11.5% |
Beverages 1.4% |
PepsiCo, Inc. | 42,128 | 2,752,222 |
Food & Staples Retailing 3.1% |
CVS Caremark Corp. | 103,849 | 3,610,830 |
Kroger Co. | 123,703 | 2,765,999 |
| 6,376,829 |
Food Products 2.9% |
General Mills, Inc. | 50,103 | 1,783,166 |
Kellogg Co. | 43,279 | 2,210,692 |
Mead Johnson Nutrition Co. | 32,885 | 2,047,091 |
| 6,040,949 |
Tobacco 4.1% |
Altria Group, Inc. | 172,422 | 4,245,030 |
Philip Morris International, Inc. | 73,171 | 4,282,698 |
| 8,527,728 |
Energy 17.6% |
Energy Equipment & Services 4.7% |
Ensco PLC (ADR) | 64,045 | 3,418,722 |
Noble Corp. | 90,557 | 3,239,224 |
Transocean Ltd.* (a) | 44,883 | 3,119,817 |
| 9,777,763 |
Oil, Gas & Consumable Fuels 12.9% |
Canadian Natural Resources Ltd. | 69,548 | 3,089,322 |
Chevron Corp. | 49,457 | 4,512,951 |
ConocoPhillips | 51,156 | 3,483,723 |
Exxon Mobil Corp. | 50,290 | 3,677,205 |
Marathon Oil Corp. (a) | 119,795 | 4,436,009 |
Nexen, Inc. | 104,342 | 2,389,432 |
Suncor Energy, Inc. | 131,220 | 5,024,414 |
| 26,613,056 |
Financials 12.6% |
Diversified Financial Services 1.8% |
JPMorgan Chase & Co. | 85,723 | 3,636,370 |
Insurance 10.8% |
Assurant, Inc. | 74,334 | 2,863,346 |
Fidelity National Financial, Inc. "A" (a) | 148,069 | 2,025,584 |
HCC Insurance Holdings, Inc. | 73,331 | 2,122,199 |
Lincoln National Corp. (a) | 133,833 | 3,721,896 |
MetLife, Inc. | 95,678 | 4,251,930 |
|
Shares
| Value ($) |
| |
PartnerRe Ltd. (a) | 50,697 | 4,073,504 |
Prudential Financial, Inc. | 57,640 | 3,384,044 |
| 22,442,503 |
Health Care 12.0% |
Health Care Equipment & Supplies 3.1% |
Baxter International, Inc. | 72,472 | 3,668,533 |
Becton, Dickinson & Co. (a) | 32,656 | 2,760,085 |
| 6,428,618 |
Health Care Providers & Services 3.0% |
McKesson Corp. | 56,640 | 3,986,323 |
WellPoint, Inc.* | 38,719 | 2,201,562 |
| 6,187,885 |
Life Sciences Tools & Services 1.1% |
Thermo Fisher Scientific, Inc.* | 40,838 | 2,260,792 |
Pharmaceuticals 4.8% |
Johnson & Johnson | 32,793 | 2,028,247 |
Merck & Co., Inc. | 106,108 | 3,824,132 |
Teva Pharmaceutical Industries Ltd. (ADR) | 77,764 | 4,053,838 |
| 9,906,217 |
Industrials 5.6% |
Aerospace & Defense 3.8% |
Northrop Grumman Corp. | 42,452 | 2,750,041 |
Raytheon Co. | 56,220 | 2,605,235 |
United Technologies Corp. | 31,674 | 2,493,377 |
| 7,848,653 |
Machinery 1.8% |
Dover Corp. (a) | 63,567 | 3,715,491 |
Information Technology 8.0% |
Communications Equipment 1.7% |
Brocade Communications Systems, Inc.* | 254,336 | 1,345,438 |
Cisco Systems, Inc.* | 104,962 | 2,123,381 |
| 3,468,819 |
Computers & Peripherals 1.6% |
Hewlett-Packard Co. | 81,776 | 3,442,769 |
IT Services 1.1% |
Automatic Data Processing, Inc. | 49,734 | 2,301,689 |
Semiconductors & Semiconductor Equipment 1.7% |
Intel Corp. | 168,322 | 3,539,812 |
Software 1.9% |
Microsoft Corp. | 138,377 | 3,863,486 |
Materials 5.1% |
Chemicals 3.4% |
Air Products & Chemicals, Inc. | 45,671 | 4,153,778 |
Praxair, Inc. (a) | 30,296 | 2,892,359 |
| 7,046,137 |
Containers & Packaging 1.7% |
Sonoco Products Co. (a) | 101,372 | 3,413,195 |
Telecommunication Services 8.5% |
Diversified Telecommunication Services 7.1% |
AT&T, Inc. | 163,617 | 4,807,068 |
BCE, Inc. | 28,303 | 1,003,624 |
|
Shares
| Value ($) |
| |
CenturyLink, Inc. (a) | 126,161 | 5,824,853 |
Verizon Communications, Inc. | 82,706 | 2,959,221 |
| 14,594,766 |
Wireless Telecommunication Services 1.4% |
Vodafone Group PLC (ADR) (a) | 113,690 | 3,004,827 |
Utilities 9.7% |
Electric Utilities 7.7% |
Allegheny Energy, Inc. | 97,123 | 2,354,262 |
American Electric Power Co., Inc. | 74,383 | 2,676,300 |
Duke Energy Corp. (a) | 130,206 | 2,318,969 |
Entergy Corp. | 34,093 | 2,414,807 |
Exelon Corp. (a) | 30,886 | 1,286,093 |
FirstEnergy Corp. (a) | 65,378 | 2,420,294 |
Southern Co. (a) | 64,406 | 2,462,241 |
| 15,932,966 |
|
Shares
| Value ($) |
| |
Multi-Utilities 2.0% |
PG&E Corp. | 87,684 | 4,194,801 |
Total Common Stocks (Cost $163,225,850) | 202,188,393 |
|
Securities Lending Collateral 18.8% |
Daily Assets Fund Institutional, 0.27% (b) (c) (Cost $38,843,948) | 38,843,948 | 38,843,948 |
|
Cash Equivalents 2.3% |
Central Cash Management Fund, 0.19% (b) (Cost $4,846,822) | 4,846,822 | 4,846,822 |
| % of Net Assets | Value ($) |
| |
Total Investment Portfolio (Cost $206,916,620)+ | 118.9 | 245,879,163 |
Other Assets and Liabilities, Net | (18.9) | (39,120,423) |
Net Assets | 100.0 | 206,758,740 |
* Non-income producing security.
+ The cost for federal income tax purposes was $209,013,049. At December 31, 2010, net unrealized appreciation for all securities based on tax cost was $36,866,114. This consisted of aggregate gross unrealized appreciation for all securities in which there was an excess of value over tax cost of $42,154,718 and aggregate gross unrealized depreciation for all securities in which there was an excess of tax cost over value of $5,288,604.
(a) All or a portion of these securities were on loan (see Notes to Financial Statements). The value of all securities loaned at December 31, 2010 amounted to $37,916,422, which is 18.3% of net assets.
(b) Affiliated fund managed by Deutsche Investment Management Americas Inc. The rate shown is the annualized seven-day yield at period end.
(c) Represents collateral held in connection with securities lending. Income earned by the Fund is net of borrower rebates.
ADR: American Depositary Receipt
Fair Value Measurements
Various inputs are used in determining the value of the Fund's investments. These inputs are summarized in three broad levels. Level 1 includes quoted prices in active markets for identical securities. Level 2 includes other significant observable inputs (including quoted prices for similar securities, interest rates, prepayment speeds, and credit risk). Level 3 includes significant unobservable inputs (including the Fund's own assumptions in determining the fair value of investments). The inputs or methodology used for valuing securities are not necessarily an indication of the risk associated with investing in those securities.
The following is a summary of the inputs used as of December 31, 2010 in valuing the Fund's investments. For information on the Fund's policy regarding the valuation of investments, please refer to the Security Valuation section of Note A in the accompanying Notes to Financial Statements.
Assets | Level 1 | Level 2 | Level 3 | Total |
|
Common Stocks (d) | $ 202,188,393 | $ — | $ — | $ 202,188,393 |
Short-Term Investments (d) | 43,690,770 | — | — | 43,690,770 |
Total | $ 245,879,163 | $ — | $ — | $ 245,879,163 |
There have been no significant transfers between Level 1 and Level 2 fair value measurements during the year ended December 31, 2010.
(d) See Investment Portfolio for additional detailed categorizations.
The accompanying notes are an integral part of the financial statements.
Statement of Assets and Liabilities
as of December 31, 2010 |
Assets |
Investments: Investments in unaffiliated securities, at value (cost $163,225,850) — including $37,916,422 of securities loaned | $ 202,188,393 |
Investment in Daily Assets Fund Institutional (cost $38,843,948)* | 38,843,948 |
Investment in Central Cash Management Fund (cost $4,846,822) | 4,846,822 |
Total investments, at value (cost $206,916,620) | 245,879,163 |
Cash | 21,120 |
Foreign currency, at value (cost $10,034) | 11,513 |
Receivable for Fund shares sold | 150,489 |
Dividends receivable | 450,987 |
Interest receivable | 7,301 |
Foreign taxes recoverable | 22,127 |
Other assets | 1,106 |
Total assets | 246,543,806 |
Liabilities |
Payable upon return of securities loaned | 38,843,948 |
Payable for investments purchased | 628,063 |
Payable for Fund shares redeemed | 114,217 |
Accrued management fee | 106,533 |
Other accrued expenses and payables | 92,305 |
Total liabilities | 39,785,066 |
Net assets, at value | $ 206,758,740 |
Net Assets Consist of |
Undistributed net investment income | 4,084,211 |
Net unrealized appreciation (depreciation) on: Investments | 38,962,543 |
Foreign currency | 6,252 |
Accumulated net realized gain (loss) | (43,182,951) |
Paid-in capital | 206,888,685 |
Net assets, at value | $ 206,758,740 |
Class A Net Asset Value, offering and redemption price per share ($205,517,002 ÷ 17,416,427 outstanding shares of beneficial interest, no par value, unlimited number of shares authorized) | $ 11.80 |
Class B Net Asset Value, offering and redemption price per share ($1,241,738 ÷ 105,172 outstanding shares of beneficial interest, no par value, unlimited number of shares authorized) | $ 11.81 |
* Represents collateral on securities loaned.
The accompanying notes are an integral part of the financial statements.
Statement of Operations
for the year ended December 31, 2010 |
Investment Income |
Income: Dividends (net of foreign taxes withheld of $40,452) | $ 5,902,166 |
Income distributions — Central Cash Management Fund | 15,586 |
Securities lending income, including income from Daily Assets Fund Institutional, net of borrower rebates | 32,223 |
Total income | 5,949,975 |
Expenses: Management fee | 1,313,548 |
Administration fee | 202,084 |
Services to shareholders | 5,403 |
Distribution service fee (Class B) | 2,177 |
Record keeping fees (Class B) | 316 |
Custodian fee | 11,677 |
Professional fees | 62,232 |
Trustees' fees and expenses | 8,477 |
Reports to shareholders | 39,446 |
Other | 5,790 |
Total expenses | 1,651,150 |
Net investment income (loss) | 4,298,825 |
Realized and Unrealized Gain (Loss) |
Net realized gain (loss) from: Investments | 7,964,499 |
Foreign currency | 1,697 |
Payment by affiliate (see Note I) | 62,550 |
| 8,028,746 |
Change in net unrealized appreciation (depreciation) on: Investments | 7,886,334 |
Foreign currency | 3,358 |
| 7,889,692 |
Net gain (loss) | 15,918,438 |
Net increase (decrease) in net assets resulting from operations | $ 20,217,263 |
The accompanying notes are an integral part of the financial statements.
Statement of Changes in Net Assets
Increase (Decrease) in Net Assets | Years Ended December 31, |
2010 | 2009 |
Operations: Net investment income (loss) | $ 4,298,825 | $ 3,970,664 |
Net realized gain (loss) | 8,028,746 | (2,868,405) |
Change in net unrealized appreciation (depreciation) | 7,889,692 | 44,336,276 |
Net increase (decrease) in net assets resulting from operations | 20,217,263 | 45,438,535 |
Distributions to shareholders from: Net investment income: Class A | (4,108,146) | (2,847,989) |
Class B | (14,019) | (9,025) |
Total distributions | $ (4,122,165) | $ (2,857,014) |
Fund share transactions: Class A Proceeds from shares sold | 8,671,405 | 5,193,145 |
Net assets acquired in tax-free reorganization | — | 107,453,089 |
Reinvestment of distributions | 4,108,146 | 2,847,989 |
Payments for shares redeemed | (36,788,065) | (62,359,106) |
Net increase (decrease) in net assets from Class A share transactions | (24,008,514) | 53,135,117 |
Class B Proceeds from shares sold | 506,629 | 313,837 |
Net assets acquired in tax-free reorganization | — | 202,242 |
Reinvestment of distributions | 14,019 | 9,025 |
Payments for shares redeemed | (88,091) | (238,487) |
Net increase (decrease) in net assets from Class B share transactions | 432,557 | 286,617 |
Increase (decrease) in net assets | (7,480,859) | 96,003,255 |
Net assets at beginning of period | 214,239,599 | 118,236,344 |
Net assets at end of period (including undistributed net investment income of $4,084,211 and $3,905,854, respectively) | $ 206,758,740 | $ 214,239,599 |
Other Information |
Class A Shares outstanding at beginning of period | 19,667,770 | 13,220,277 |
Shares sold | 778,508 | 540,244 |
Shares issued in tax-free reorganization | — | 12,224,432 |
Shares issued to shareholders in reinvestment of distributions | 366,145 | 355,554 |
Shares redeemed | (3,395,996) | (6,672,737) |
Net increase (decrease) in Class A shares | (2,251,343) | 6,447,493 |
Shares outstanding at end of period | 17,416,427 | 19,667,770 |
Class B Shares outstanding at beginning of period | 66,594 | 32,776 |
Shares sold | 45,434 | 32,526 |
Shares issued in tax-free reorganization | — | 22,957 |
Shares issued to shareholders in reinvestment of distributions | 1,246 | 1,124 |
Shares redeemed | (8,102) | (22,789) |
Net increase (decrease) in Class B shares | 38,578 | 33,818 |
Shares outstanding at end of period | 105,172 | 66,594 |
The accompanying notes are an integral part of the financial statements.
Financial Highlights
Class A Years Ended December 31, | 2010 | 2009 | 2008 | 2007 | 2006 |
Selected Per Share Data |
Net asset value, beginning of period | $ 10.86 | $ 8.92 | $ 19.21 | $ 17.96 | $ 15.81 |
Income (loss) from investment operations: Net investment income (loss)a | .23 | .21 | .21 | .26 | .29c |
Net realized and unrealized gain (loss) | .93 | 1.97 | (5.68) | 1.98 | 2.12 |
Total from investment operations | 1.16 | 2.18 | (5.47) | 2.24 | 2.41 |
Less distributions from: Net investment income | (.22) | (.24) | (.34) | (.32) | (.26) |
Net realized gains | — | — | (4.48) | (.67) | — |
Total distributions | (.22) | (.24) | (4.82) | (.99) | (.26) |
Net asset value, end of period | $ 11.80 | $ 10.86 | $ 8.92 | $ 19.21 | $ 17.96 |
Total Return (%) | 10.77 | 25.37 | (36.40)b | 13.15b,d | 15.41c |
Ratios to Average Net Assets and Supplemental Data |
Net assets, end of period ($ millions) | 206 | 214 | 118 | 229 | 275 |
Ratio of expenses before expense reductions (%) | .82 | .76 | .87 | .83 | .83 |
Ratio of expenses after expense reductions (%) | .82 | .76 | .86 | .82 | .83 |
Ratio of net investment income (loss) (%) | 2.13 | 2.22 | 1.59 | 1.43 | 1.73c |
Portfolio turnover rate (%) | 32 | 76 | 97 | 103 | 76 |
a Based on average shares outstanding during the period. b Total return would have been lower had certain expenses not been reduced. c Includes non-recurring income from the Advisor recorded as a result of an administrative proceeding regarding disclosure of brokerage allocation practices in connection with sales of DWS Funds. The non-recurring income resulted in an increase in net investment income of $0.008 per share and an increase in the ratio of net investment income of 0.04%. Excluding this non-recurring income, total return would have been 0.04% lower. d Includes a reimbursement from the Advisor to reimburse the effect of losses incurred as the result of certain operation errors during the period. Excluding this reimbursement, total return would have been 0.04% lower. |
Class B Years Ended December 31, | 2010 | 2009 | 2008 | 2007 | 2006 |
Selected Per Share Data |
Net asset value, beginning of period | $ 10.86 | $ 8.92 | $ 19.20 | $ 17.94 | $ 15.79 |
Income (loss) from investment operations: Net investment income (loss)a | .20 | .19 | .12 | .19 | .23c |
Net realized and unrealized gain (loss) | .93 | 1.96 | (5.64) | 1.99 | 2.11 |
Total from investment operations | 1.13 | 2.15 | (5.52) | 2.18 | 2.34 |
Less distributions from: Net investment income | (.18) | (.21) | (.28) | (.25) | (.19) |
Net realized gains | — | — | (4.48) | (.67) | — |
Total distributions | (.18) | (.21) | (4.76) | (.92) | (.19) |
Net asset value, end of period | $ 11.81 | $ 10.86 | $ 8.92 | $ 19.20 | $ 17.94 |
Total Return (%) | 10.53 | 24.86 | (36.64)b | 12.77b,d | 14.96c |
Ratios to Average Net Assets and Supplemental Data |
Net assets, end of period ($ millions) | 1 | 1 | .29 | 8 | 40 |
Ratio of expenses before expense reductions (%) | 1.11 | 1.06 | 1.28 | 1.21 | 1.21 |
Ratio of expenses after expense reductions (%) | 1.11 | 1.06 | 1.26 | 1.20 | 1.21 |
Ratio of net investment income (loss) (%) | 1.84 | 1.92 | 1.20 | 1.06 | 1.35c |
Portfolio turnover rate (%) | 32 | 76 | 97 | 103 | 76 |
a Based on average shares outstanding during the period. b Total return would have been lower had certain expenses not been reduced. c Includes non-recurring income from the Advisor recorded as a result of an administrative proceeding regarding disclosure of brokerage allocation practices in connection with sales of DWS Funds. The non-recurring income resulted in an increase in net investment income of $0.008 per share and an increase in the ratio of net investment income of 0.04%. Excluding this non-recurring income, total return would have been 0.04% lower. d Includes a reimbursement from the Advisor to reimburse the effect of losses incurred as the result of certain operation errors during the period. Excluding this reimbursement, total return would have been 0.04% lower. |
Performance Summary December 31, 2010
DWS Mid Cap Growth VIP
All performance shown is historical, assumes reinvestment of all dividend and capital gain distributions and does not guarantee future results. Investment return and principal value fluctuate with changing market conditions so that, when redeemed, shares may be worth more or less than their original cost. Current performance may be lower or higher than the performance data quoted. Please contact your participating insurance company for the Fund's most recent month-end performance. Performance doesn't reflect charges and fees ("contract charges") associated with the separate account that invests in the Fund or any variable life insurance policy or variable annuity contract for which the Fund is an investment option. These charges and fees will reduce returns.
The gross expense ratio of the Fund, as stated in the fee table of the prospectus dated May 1, 2010 is 1.17% for Class A shares and may differ from the expense ratio disclosed in the Financial Highlights table in this report.
Risk Considerations
Stocks of medium-sized companies involve greater risk than securities of larger, more-established companies. Stocks may decline in value. See the prospectus for details.
Fund returns shown for all periods reflect a fee waiver and/or expense reimbursement. Without this waiver/reimbursement, returns would have been lower.
Growth of an Assumed $10,000 Investment in DWS Mid Cap Growth VIP |
[] DWS Mid Cap Growth VIP — Class A [] Russell Midcap® Growth Index | The Russell Midcap® Growth Index is an unmanaged index that measures the performance of those Russell Midcap companies with higher price-to-book ratios and higher forecasted growth values. The stocks are also members of the Russell 1000® Growth Index. Index returns assume reinvestment of dividends and, unlike fund returns, do not reflect any fees or expenses. It is not possible to invest directly into an index. |
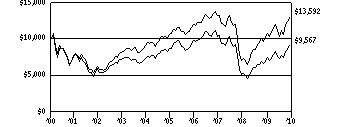 | |
Yearly periods ended December 31 | |
Comparative Results |
DWS Mid Cap Growth VIP | 1-Year | 3-Year | 5-Year | 10-Year |
Class A | Growth of $10,000 | $12,795 | $9,148 | $10,998 | $9,567 |
Average annual total return | 27.95% | -2.93% | 1.92% | -0.44% |
Russell Midcap Growth Index | Growth of $10,000 | $12,638 | $10,294 | $12,692 | $13,592 |
Average annual total return | 26.38% | 0.97% | 4.88% | 3.12% |
The growth of $10,000 is cumulative.
Information About Your Fund's Expenses
DWS Mid Cap Growth VIP
As an investor of the Fund, you incur two types of costs: ongoing expenses and transaction costs. Ongoing expenses include management fees and other Fund expenses. Examples of transaction costs include contract charges, redemption fees and account maintenance fees, which are not shown in this section. The following tables are intended to help you understand your ongoing expenses (in dollars) of investing in the Fund and to help you compare these expenses with the ongoing expenses of investing in other mutual funds. In the most recent six-month period, the Fund limited these expenses; had it not done so, expenses would have been higher. The example in the table is based on an investment of $1,000 invested at the beginning of the six-month period and held for the entire period (July 1, 2010 to December 31, 2010).
The tables illustrate your Fund's expenses in two ways:
• Actual Fund Return. This helps you estimate the actual dollar amount of ongoing expenses (but not transaction costs) paid on a $1,000 investment in the Fund using the Fund's actual return during the period. To estimate the expenses you paid over the period, simply divide your account value by $1,000 (for example, an $8,600 account value divided by $1,000 = 8.6), then multiply the result by the number in the "Expenses Paid per $1,000" line under the share class you hold.
• Hypothetical 5% Fund Return. This helps you to compare your Fund's ongoing expenses (but not transaction costs) with those of other mutual funds using the Fund's actual expense ratio and a hypothetical rate of return of 5% per year before expenses. Examples using a 5% hypothetical Fund return may be found in the shareholder reports of other mutual funds. The hypothetical account values and expenses may not be used to estimate the actual ending account balance or expenses you paid for the period.
Please note that the expenses shown in these tables are meant to highlight your ongoing expenses only and do not reflect any transaction costs. The "Expenses Paid per $1,000" line of the tables is useful in comparing ongoing expenses only and will not help you determine the relative total expense of owning different funds. If these transaction costs had been included, your costs would have been higher.
Expenses and Value of a $1,000 Investment for the six months ended December 31, 2010 |
Actual Fund Return | Class A | |
Beginning Account Value 7/1/10 | $ 1,000.00 | |
Ending Account Value 12/31/10 | $ 1,314.70 | |
Expenses Paid per $1,000* | $ 5.83 | |
Hypothetical 5% Fund Return | Class A | |
Beginning Account Value 7/1/10 | $ 1,000.00 | |
Ending Account Value 12/31/10 | $ 1,020.16 | |
Expenses Paid per $1,000* | $ 5.09 | |
* Expenses are equal to the Fund's annualized expense ratio, multiplied by the average account value over the period, multiplied by the number of days in the most recent six-month period, then divided by 365.
Annualized Expense Ratio | Class A | |
DWS Variable Series II — DWS Mid Cap Growth VIP | 1.00% | |
For more information, please refer to the Fund's prospectus.
These tables do not reflect charges and fees ("contract charges") associated with the separate account that invests in the Fund of any variable life insurance policy or variable annuity contract for which the Fund is an investment option.
Management Summary December 31, 2010
DWS Mid Cap Growth VIP
The year 2010 began on an optimistic note with a few bright spots in the economy — improving consumer confidence, the government reports showing strong fourth-quarter 2009 gross domestic product (GDP) growth and a six-year high in manufacturing activity — partially offset by growing concerns about the health of the European financial system.1 By May 2010, the US stock market had entered a period of significant volatility amid regulatory uncertainty (health care and financial reform) and fears of a possible double-dip recession. The market then staged a rebound during the last four months of the year amid increasing confidence that the US Federal Reserve Board's (the Fed's) second round of quantitative easing measures would support asset prices, along with evidence that the US economy was on a path to faster growth in 2011.
For the 12 months ended December 31, 2010, the Fund returned 27.95% (Class A shares, unadjusted for contract charges), compared with the 26.38% return of the Russell Midcap® Growth Index. These strong returns belie the elevated level of investor risk aversion that impacted the global equity markets during much of the summer months as high unemployment, European debt problems, a possible economic "hard landing" within China and some slippage for US economic indicators temporarily dampened enthusiasm for stocks.
The Fund's outperformance of the benchmark came primarily from favorable stock selection. During the period, stock selection was positive within the health care, information technology and consumer staples sectors. Other contributions to returns came from an overweight to energy and an underweight to telecom services.2 Stock selection in energy and consumer discretionary detracted from performance. In addition, underweight positions in materials, information technology and consumer discretionary weighed on returns.
Joseph Axtell, CFA
Rafaelina M. Lee
Portfolio Managers
The Russell Midcap Growth Index is an unmanaged index that measures the performance of those Russell Midcap companies with higher price-to-book ratios and higher forecasted growth values. The stocks are also members of the Russell 1000® Growth Index.
Index returns assume reinvestment of dividends and, unlike fund returns, do not reflect any fees or expenses. It is not possible to invest directly into an index.
1 Gross domestic product is the value of goods and services produced in an economy.
2 "Overweight" means the Fund holds a higher weighting in a given sector than the benchmark index. "Underweight" means the Fund holds a lower weighting.
Portfolio Summary
DWS Mid Cap Growth VIP
Asset Allocation (As a % of Investment Portfolio excluding Securities Lending Collateral) | 12/31/10 | 12/31/09 |
| | |
Common Stocks | 96% | 98% |
Cash Equivalents | 4% | 2% |
| 100% | 100% |
Sector Diversification (As a % of Common Stocks) | 12/31/10 | 12/31/09 |
| | |
Information Technology | 21% | 22% |
Consumer Discretionary | 19% | 18% |
Industrials | 14% | 14% |
Health Care | 14% | 12% |
Energy | 12% | 12% |
Financials | 8% | 9% |
Materials | 6% | 8% |
Consumer Staples | 4% | 3% |
Telecommunication Services | 2% | 2% |
| 100% | 100% |
Asset allocation and sector diversification are subject to change.
For more complete details about the Fund's investment portfolio, see page 179.
Following the Fund's fiscal first and third quarter-end, a complete portfolio holdings listing is filed with the SEC on Form N-Q. The form will be available on the SEC's Web site at www.sec.gov, and it also may be reviewed and copied at the SEC's Public Reference Room in Washington, D.C. Information on the operation of the SEC's Public Reference Room may be obtained by calling (800) SEC-0330. The Fund's portfolio holdings are also posted on www.dws-investments.com from time to time. Please see the Fund's current prospectus for more information.
Investment Portfolio December 31, 2010
DWS Mid Cap Growth VIP
|
Shares
| Value ($) |
| |
Common Stocks 96.6% |
Consumer Discretionary 18.1% |
Auto Components 2.8% |
BorgWarner, Inc.* | 5,556 | 402,032 |
Gentex Corp. | 11,572 | 342,068 |
| 744,100 |
Hotels Restaurants & Leisure 2.5% |
Darden Restaurants, Inc. | 8,015 | 372,217 |
Panera Bread Co. "A"* (a) | 3,000 | 303,630 |
| 675,847 |
Household Durables 1.0% |
Jarden Corp. | 8,300 | 256,221 |
Internet & Catalog Retail 1.3% |
Priceline.com, Inc.* | 850 | 339,618 |
Specialty Retail 7.4% |
Advance Auto Parts, Inc. | 5,500 | 363,825 |
Children's Place Retail Stores, Inc.* | 7,300 | 362,372 |
Guess?, Inc. | 8,900 | 421,148 |
Tiffany & Co. (a) | 6,600 | 410,982 |
Urban Outfitters, Inc.* (a) | 11,500 | 411,815 |
| 1,970,142 |
Textiles, Apparel & Luxury Goods 3.1% |
Deckers Outdoor Corp.* | 6,654 | 530,590 |
Hanesbrands, Inc.* | 11,286 | 286,664 |
| 817,254 |
Consumer Staples 3.7% |
Food Products 1.2% |
Diamond Foods, Inc. (a) | 5,800 | 308,444 |
Household Products 1.0% |
Church & Dwight Co., Inc. | 3,962 | 273,457 |
Personal Products 1.5% |
Herbalife Ltd. | 6,053 | 413,844 |
Energy 11.1% |
Energy Equipment & Services 6.7% |
Cameron International Corp.* | 3,713 | 188,360 |
Complete Production Services, Inc.* | 9,387 | 277,386 |
Core Laboratories NV (a) | 2,486 | 221,378 |
Dresser-Rand Group, Inc.* | 5,050 | 215,080 |
FMC Technologies, Inc.* | 4,880 | 433,881 |
McDermott International, Inc.* | 14,000 | 289,660 |
National Oilwell Varco, Inc. | 2,272 | 152,792 |
| 1,778,537 |
Oil, Gas & Consumable Fuels 4.4% |
Alpha Natural Resources, Inc.* | 3,776 | 226,673 |
Concho Resources, Inc.* | 2,916 | 255,646 |
Pioneer Natural Resources Co. | 2,080 | 180,586 |
Ultra Petroleum Corp.* (a) | 4,830 | 230,729 |
Whiting Petroleum Corp.* | 2,442 | 286,178 |
| 1,179,812 |
Financials 8.1% |
Capital Markets 4.7% |
Affiliated Managers Group, Inc.* (a) | 1,800 | 178,596 |
Invesco Ltd. | 5,700 | 137,142 |
Jefferies Group, Inc. | 8,900 | 237,007 |
Lazard Ltd. "A" | 4,854 | 191,684 |
|
Shares
| Value ($) |
| |
Och-Ziff Capital Management Group "A" (Limited Partnership) | 18,720 | 291,658 |
TD Ameritrade Holding Corp. (a) | 10,891 | 206,820 |
| 1,242,907 |
Commercial Banks 1.4% |
Huntington Bancshares, Inc. | 19,766 | 135,792 |
Prosperity Bancshares, Inc. | 4,400 | 172,832 |
Zions Bancorp. | 2,881 | 69,807 |
| 378,431 |
Diversified Financial Services 1.3% |
Portfolio Recovery Associates, Inc.* (a) | 4,800 | 360,960 |
Insurance 0.7% |
W.R. Berkley Corp. | 6,500 | 177,970 |
Health Care 13.5% |
Biotechnology 2.7% |
Alexion Pharmaceuticals, Inc.* (a) | 2,483 | 200,005 |
Human Genome Sciences, Inc.* (a) | 6,800 | 162,452 |
Onyx Pharmaceuticals, Inc.* | 3,763 | 138,742 |
Regeneron Pharmaceuticals, Inc.* | 6,300 | 206,829 |
| 708,028 |
Health Care Equipment & Supplies 1.9% |
Kinetic Concepts, Inc.* | 6,700 | 280,596 |
Thoratec Corp.* | 7,800 | 220,896 |
| 501,492 |
Health Care Providers & Services 3.3% |
AmerisourceBergen Corp. | 8,900 | 303,668 |
Fresenius Medical Care AG & Co. KGaA (ADR) | 5,230 | 301,719 |
Laboratory Corp. of America Holdings* (a) | 3,200 | 281,344 |
| 886,731 |
Health Care Technology 1.7% |
Cerner Corp.* (a) | 1,599 | 151,489 |
SXC Health Solutions Corp.* | 7,233 | 310,006 |
| 461,495 |
Life Sciences Tools & Services 2.4% |
ICON PLC (ADR)* | 5,824 | 127,546 |
Life Technologies Corp.* | 5,500 | 305,250 |
QIAGEN NV* (a) | 10,213 | 199,664 |
| 632,460 |
Pharmaceuticals 1.5% |
Questcor Pharmaceuticals, Inc.* | 27,486 | 404,869 |
Industrials 13.9% |
Aerospace & Defense 1.3% |
BE Aerospace, Inc.* | 9,400 | 348,082 |
Commercial Services & Supplies 1.1% |
Stericycle, Inc.* (a) | 3,500 | 283,220 |
Construction & Engineering 0.4% |
Aecom Technology Corp.* | 3,712 | 103,825 |
Electrical Equipment 2.9% |
AMETEK, Inc. | 7,446 | 292,255 |
Babcock & Wilcox Co.* | 4,950 | 126,671 |
General Cable Corp.* | 10,200 | 357,918 |
| 776,844 |
|
Shares
| Value ($) |
| |
Machinery 4.6% |
Flowserve Corp. | 1,801 | 214,715 |
Gardner Denver, Inc. | 4,560 | 313,819 |
Joy Global, Inc. | 4,000 | 347,000 |
Terex Corp.* (a) | 11,175 | 346,872 |
| 1,222,406 |
Professional Services 1.7% |
FTI Consulting, Inc.* (a) | 5,082 | 189,457 |
Robert Half International, Inc. | 8,930 | 273,258 |
| 462,715 |
Road & Rail 1.9% |
Genesee & Wyoming, Inc. "A"* | 4,960 | 262,632 |
Kansas City Southern* | 4,945 | 236,668 |
| 499,300 |
Information Technology 20.6% |
Communications Equipment 2.5% |
F5 Networks, Inc.* | 2,484 | 323,317 |
Harris Corp. (a) | 2,700 | 122,310 |
Juniper Networks, Inc.* | 6,166 | 227,649 |
| 673,276 |
Computers & Peripherals 2.0% |
NetApp, Inc.* | 5,350 | 294,036 |
SanDisk Corp.* | 4,728 | 235,738 |
| 529,774 |
Electronic Equipment, Instruments & Components 0.8% |
Itron, Inc.* | 3,850 | 213,482 |
Internet Software & Services 1.0% |
Equinix, Inc.* (a) | 3,356 | 272,709 |
IT Services 1.3% |
Cognizant Technology Solutions Corp. "A"* | 4,610 | 337,867 |
Semiconductors & Semiconductor Equipment 6.7% |
Analog Devices, Inc. | 3,500 | 131,845 |
ARM Holdings PLC (ADR) | 11,965 | 248,274 |
ASML Holding NV (NY Registered Shares) (a) | 3,669 | 140,669 |
Broadcom Corp. "A" | 3,682 | 160,351 |
Cavium Networks, Inc.* (a) | 6,741 | 254,001 |
First Solar, Inc.* (a) | 1,679 | 218,505 |
Marvell Technology Group Ltd.* | 13,728 | 254,654 |
Netlogic Microsystems, Inc.* | 4,200 | 131,922 |
Novellus Systems, Inc.* | 7,405 | 239,330 |
| 1,779,551 |
|
Shares
| Value ($) |
| |
Software 6.3% |
BMC Software, Inc.* | 2,621 | 123,554 |
Check Point Software Technologies Ltd.* | 2,905 | 134,385 |
Concur Technologies, Inc.* | 5,913 | 307,062 |
MICROS Systems, Inc.* | 2,868 | 125,791 |
Red Hat, Inc.* | 6,789 | 309,918 |
Rovi Corp.* (a) | 4,832 | 299,632 |
Salesforce.com, Inc.* (a) | 2,705 | 357,060 |
| 1,657,402 |
Materials 5.4% |
Chemicals 1.1% |
Scotts Miracle-Gro Co. "A" | 2,100 | 106,617 |
Solutia, Inc.* | 7,452 | 171,992 |
| 278,609 |
Containers & Packaging 0.8% |
Crown Holdings, Inc.* | 6,589 | 219,941 |
Metals & Mining 2.6% |
Cliffs Natural Resources, Inc. | 3,000 | 234,030 |
Kinross Gold Corp. | 10,400 | 197,184 |
Thompson Creek Metals Co., Inc.* | 18,099 | 266,417 |
| 697,631 |
Paper & Forest Products 0.9% |
Schweitzer-Mauduit International, Inc. | 3,968 | 249,667 |
Telecommunication Services 2.2% |
Wireless Telecommunication Services |
American Tower Corp. "A"* | 6,078 | 313,868 |
MetroPCS Communications, Inc.* (a) | 21,176 | 267,453 |
| 581,321 |
Total Common Stocks (Cost $17,324,405) | 25,700,241 |
|
Securities Lending Collateral 20.0% |
Daily Assets Fund Institutional, 0.27% (b) (c) (Cost $5,310,295) | 5,310,295 | 5,310,295 |
|
Cash Equivalents 3.9% |
Central Cash Management Fund, 0.19% (b) (Cost $1,025,897) | 1,025,897 | 1,025,897 |
| % of Net Assets | Value ($) |
| |
Total Investment Portfolio (Cost $23,660,597)+ | 120.5 | 32,036,433 |
Other Assets and Liabilities, Net | (20.5) | (5,439,897) |
Net Assets | 100.0 | 26,596,536 |
* Non-income producing security.
+ The cost for federal income tax purposes was $23,757,711. At December 31, 2010, net unrealized appreciation for all securities based on tax cost was $8,278,722. This consisted of aggregate gross unrealized appreciation for all securities in which there was an excess of value over tax cost of $8,520,038 and aggregate gross unrealized depreciation for all securities in which there was an excess of tax cost over value of $241,316.
(a) All or a portion of these securities were on loan (see Notes to Financial Statements). The value of all securities loaned at December 31, 2010 amounted to $5,167,474, which is 19.4% of net assets.
(b) Affiliated fund managed by Deutsche Investment Management Americas Inc. The rate shown is the annualized seven-day yield at period end.
(c) Represents collateral held in connection with securities lending. Income earned by the Fund is net of borrower rebates.
ADR: American Depositary Receipt
Fair Value Measurements
Various inputs are used in determining the value of the Fund's investments. These inputs are summarized in three broad levels. Level 1 includes quoted prices in active markets for identical securities. Level 2 includes other significant observable inputs (including quoted prices for similar securities, interest rates, prepayment speeds, and credit risk). Level 3 includes significant unobservable inputs (including the Fund's own assumptions in determining the fair value of investments). The inputs or methodology used for valuing securities are not necessarily an indication of the risk associated with investing in those securities.
The following is a summary of the inputs used as of December 31, 2010 in valuing the Fund's investments. For information on the Fund's policy regarding the valuation of investments, please refer to the Security Valuation section of Note A in the accompanying Notes to Financial Statements.
Assets | Level 1 | Level 2 | Level 3 | Total |
|
Common Stocks (d) | $ 25,700,241 | $ — | $ — | $ 25,700,241 |
Short-Term Investments (d) | 6,336,192 | — | — | 6,336,192 |
Total | $ 32,036,433 | $ — | $ — | $ 32,036,433 |
There have been no significant transfers between Level 1 and Level 2 fair value measurements during the year ended December 31, 2010.
(d) See Investment Portfolio for additional detailed categorizations.
The accompanying notes are an integral part of the financial statements.
Statement of Assets and Liabilities
as of December 31, 2010 |
Assets |
Investments: Investments in unaffiliated securities, at value (cost $17,324,405) — including $5,167,474 of securities loaned | $ 25,700,241 |
Investment in Daily Assets Fund Institutional (cost $5,310,295)* | 5,310,295 |
Investment in Central Cash Management Fund (cost $1,025,897) | 1,025,897 |
Total investments, at value (cost $23,660,597) | 32,036,433 |
Dividends receivable | 3,385 |
Interest receivable | 815 |
Foreign taxes recoverable | 319 |
Other assets | 124 |
Total assets | 32,041,076 |
Liabilities |
Payable upon return of securities loaned | 5,310,295 |
Payable for Fund shares redeemed | 50,783 |
Accrued management fee | 20,245 |
Other accrued expenses and payables | 63,217 |
Total liabilities | 5,444,540 |
Net assets, at value | $ 26,596,536 |
Net Assets Consist of |
Net unrealized appreciation (depreciation) on investments | 8,375,836 |
Accumulated net realized gain (loss) | (25,844,555) |
Paid-in capital | 44,065,255 |
Net assets, at value | $ 26,596,536 |
Class A Net Asset Value, offering and redemption price per share ($26,596,536 ÷ 2,135,742 outstanding shares of beneficial interest, no par value, unlimited number of shares authorized) | $ 12.45 |
* Represents collateral on securities loaned.
Statement of Operations
for the year ended December 31, 2010 |
Investment Income |
Dividends (net of foreign taxes withheld of $1,411) | $ 141,436 |
Income distributions — Central Cash Management Fund | 1,047 |
Securities lending income, including income from Daily Assets Fund Institutional, net of borrower rebates | 8,700 |
Total income | 151,183 |
Expenses: Management fee | 149,048 |
Administration fee | 22,413 |
Services to shareholders | 887 |
Custodian fee | 9,826 |
Legal fees | 9,140 |
Audit and tax fees | 46,898 |
Trustees' fees and expenses | 3,099 |
Reports to shareholders | 13,510 |
Other | 3,824 |
Total expenses before expense reductions | 258,645 |
Expense reductions | (24,596) |
Total expenses after expense reductions | 234,049 |
Net investment income (loss) | (82,866) |
Realized and Unrealized Gain (Loss) |
Net realized gain (loss) from investments | 2,083,999 |
Change in net unrealized appreciation (depreciation) on investments | 3,665,748 |
Net gain (loss) | 5,749,747 |
Net increase (decrease) in net assets resulting from operations | $ 5,666,881 |
The accompanying notes are an integral part of the financial statements.
Statement of Changes in Net Assets
Increase (Decrease) in Net Assets | Years Ended December 31, |
2010 | 2009 |
Operations: Net investment income (loss) | $ (82,866) | $ (40,620) |
Net realized gain (loss) | 2,083,999 | (3,073,291) |
Change in net unrealized appreciation (depreciation) | 3,665,748 | 10,072,701 |
Net increase (decrease) in net assets resulting from operations | 5,666,881 | 6,958,790 |
Fund share transactions: Class A Proceeds from shares sold | 3,568,315 | 2,976,222 |
Payments for shares redeemed | (5,044,677) | (5,876,870) |
Shares converted* | — | 17,354 |
Net increase (decrease) in net assets from Class A share transactions | (1,476,362) | (2,883,294) |
Class B Payments for shares redeemed | — | (64) |
Shares converted* | — | (17,354) |
Net increase (decrease) in net assets from Class B share transactions | — | (17,418) |
Increase (decrease) in net assets | 4,190,519 | 4,058,078 |
Net assets at beginning of period | 22,406,017 | 18,347,939 |
Net assets at end of period (including net investment income and accumulated net investment loss of $0 and $4,978, respectively) | $ 26,596,536 | $ 22,406,017 |
Other Information |
Class A Shares outstanding at beginning of period | 2,302,964 | 2,694,618 |
Shares sold | 322,729 | 374,687 |
Shares redeemed | (489,951) | (769,440) |
Shares converted* | — | 3,099 |
Net increase (decrease) in Class A shares | (167,222) | (391,654) |
Shares outstanding at end of period | 2,135,742 | 2,302,964 |
Class B Shares outstanding at beginning of period | — | 3,171 |
Shares redeemed | — | (10) |
Shares converted* | — | (3,161) |
Net increase (decrease) in Class B shares | — | (3,171) |
Shares outstanding at end of period | — | — |
* On March 6, 2009, Class B shares converted into Class A shares.
The accompanying notes are an integral part of the financial statements.
Financial Highlights
Class A Years Ended December 31, | 2010 | 2009 | 2008 | 2007 | 2006 |
Selected Per Share Data |
Net asset value, beginning of period | $ 9.73 | $ 6.80 | $ 13.61 | $ 12.56 | $ 11.32 |
Income (loss) from investment operations: Net investment income (loss)a | (.04) | (.02) | (.02) | (.05) | (.06)c |
Net realized and unrealized gain (loss) | 2.76 | 2.95 | (6.79) | 1.10 | 1.30 |
Total from investment operations | 2.72 | 2.93 | (6.81) | 1.05 | 1.24 |
Net asset value, end of period | $ 12.45 | $ 9.73 | $ 6.80 | $ 13.61 | $ 12.56 |
Total Return (%)b | 27.95 | 43.09 | (50.04) | 8.36 | 10.95c |
Ratios to Average Net Assets and Supplemental Data |
Net assets, end of period ($ millions) | 27 | 22 | 18 | 51 | 53 |
Ratio of expenses before expense reductions (%) | 1.15 | 1.17 | 1.17 | 1.05 | 1.03 |
Ratio of expenses after expense reductions (%) | 1.04 | .92 | 1.02 | .90 | .93 |
Ratio of net investment income (loss) (%) | (.37) | (.21) | (.19) | (.38) | (.51)c |
Portfolio turnover rate (%) | 57 | 89 | 82 | 68 | 46 |
a Based on average shares outstanding during the period. b Total return would have been lower had certain expenses not been reduced. c Includes non-recurring income from the Advisor recorded as a result of an administrative proceeding regarding disclosure of brokerage allocation practices in connection with sales of DWS Funds. The non-recurring income resulted in an increase in net investment income of $0.003 per share and an increase in the ratio of net investment income of 0.03%. Excluding this non-recurring income, total return would have been 0.03% lower. |
Performance Summary December 31, 2010
DWS Money Market VIP
All performance shown is historical, assumes reinvestment of all dividend and capital gain distributions and does not guarantee future results. Investment return and principal value fluctuate with changing market conditions so that, when redeemed, shares may be worth more or less than their original cost. Current performance may be lower or higher than the performance data quoted. Please contact your participating insurance company for the Fund's most recent month-end performance. Performance doesn't reflect charges and fees ("contract charges") associated with the separate account that invests in the Fund or any variable life insurance policy or variable annuity contract for which the Fund is an investment option. These charges and fees will reduce returns. The yield quotation more closely reflects the current earnings of the Fund than the total return quotation.
Risk Considerations
An investment in this Fund is not insured or guaranteed by the Federal Deposit Insurance Corporation (FDIC) or by any other government agency. Although the Fund seeks to preserve the value of your investment at $1.00 per share, it is possible to lose money by investing in the Fund. The share price of money market funds can fall below the $1.00 share price. You should not rely on or expect the Advisor to enter into support agreements or take other actions to maintain the Fund's $1.00 share price. The credit quality of the Fund's holdings can change rapidly in certain markets, and the default of a single holding could have an adverse impact on the Fund's share price. The Fund's share price can also be negatively affected during periods of high redemption pressures and/or illiquid markets. The actions of a few large investors in the Fund may have a significant adverse effect on the share price of the Fund. See the prospectus for specific details regarding the Fund's risk profile.
Fund's Class A Shares Yield | 7-day current yield |
December 31, 2010 | 0.01%* |
December 31, 2009 | 0.02% |
* The investment advisor has agreed to waive fees/reimburse expenses. This waiver may be changed or terminated at anytime without notice. Without such fee waivers/expense reimbursements, the 7-day current yield would have been -0.14% as of December 31, 2010.
Yields are historical, will fluctuate and do not guarantee future performance. The 7-day current yield refers to the income paid by the Fund over a 7-day period expressed as an annual percentage rate of the Fund's shares outstanding.
Information About Your Fund's Expenses
DWS Money Market VIP
As an investor of the Fund, you incur two types of costs: ongoing expenses and transaction costs. Ongoing expenses include management fees and other Fund expenses. Examples of transaction costs include contract charges, redemption fees and account maintenance fees, which are not shown in this section. The following tables are intended to help you understand your ongoing expenses (in dollars) of investing in the Fund and to help you compare these expenses with the ongoing expenses of investing in other mutual funds. In the most recent six-month period the Fund limited these expenses; had it not done so, expenses would have been higher. The example in the table is based on an investment of $1,000 invested at the beginning of the six-month period and held for the entire period (July 1, 2010 to December 31, 2010).
The tables illustrate your Fund's expenses in two ways:
• Actual Fund Return. This helps you estimate the actual dollar amount of ongoing expenses (but not transaction costs) paid on a $1,000 investment in the Fund using the Fund's actual return during the period. To estimate the expenses you paid over the period, simply divide your account value by $1,000 (for example, an $8,600 account value divided by $1,000 = 8.6), then multiply the result by the number in the "Expenses Paid per $1,000" line under the share class you hold.
• Hypothetical 5% Fund Return. This helps you to compare your Fund's ongoing expenses (but not transaction costs) with those of other mutual funds using the Fund's actual expense ratio and a hypothetical rate of return of 5% per year before expenses. Examples using a 5% hypothetical Fund return may be found in the shareholder reports of other mutual funds. The hypothetical account values and expenses may not be used to estimate the actual ending account balance or expenses you paid for the period.
Please note that the expenses shown in these tables are meant to highlight your ongoing expenses only and do not reflect any transaction costs. The "Expenses Paid per $1,000" line of the tables is useful in comparing ongoing expenses only and will not help you determine the relative total expense of owning different funds. If these transaction costs had been included, your costs would have been higher.
Expenses and Value of a $1,000 Investment for the six months ended December 31, 2010 |
Actual Fund Return | Class A | |
Beginning Account Value 7/1/10 | $ 1,000.00 | |
Ending Account Value 12/31/10 | $ 1,000.10 | |
Expenses Paid per $1,000* | $ 1.87 | |
Hypothetical 5% Fund Return | Class A | |
Beginning Account Value 7/1/10 | $ 1,000.00 | |
Ending Account Value 12/31/10 | $ 1,023.34 | |
Expenses Paid per $1,000* | $ 1.89 | |
* Expenses are equal to the Fund's annualized expense ratio, multiplied by the average account value over the period, multiplied by the number of days in the most recent six-month period, then divided by 365.
Annualized Expense Ratio | Class A | |
DWS Variable Series II — DWS Money Market VIP | .37% | |
For more information, please refer to the Fund's prospectus.
These tables do not reflect charges and fees ("contract charges") associated with the separate account that invests in the Fund or any variable life insurance policy or variable annuity contract for which the Fund is an investment option.
Management Summary December 31, 2010
DWS Money Market VIP
At the start of 2010, the money market yield curve began to change configuration as — for the first time in 12 months — short-term money market rates rose somewhat.1 The slight increase in rates came in response to several market dynamics, including Congress's raising of the nation's debt ceiling and political and budgetary concerns within peripheral countries in the Eurozone.2 By mid-June, the crisis in Europe had eased somewhat as the European Central Bank and the International Monetary Fund collaborated in order to offer loans and liquidity facilities to banks in fiscally troubled countries such as Greece, Spain and Italy. In September, investors responded positively to US Federal Reserve Board (the Fed) Chairman Bernanke's statement that the Fed would take additional steps in the form of "quantitative easing" to prop up the US economy as needed. By the close of the year, the Treasury yield curve began to steepen — as fixed-income issues sold off — in response to improved economic data and investor anxiety over possible inflationary pressures.
During the 12-month period ended December 31, 2010, the Fund provided a total return of 0.01% (Class A shares, unadjusted for contract charges), compared with the 0.01% average return for the 102 funds in the Lipper Money Market Variable Annuity Funds category for the same period, according to Lipper Inc.
We were able to maintain a competitive yield for the Fund during the period. (All performance is historical and does not guarantee future results. Yields fluctuate and are not guaranteed.) Over the period, we continued to hold a large percentage of fixed-rate, short-maturity investments. The Fund also held a percentage in floating-rate securities (whose yields adjust periodically in response to changes in interest rates) to track any increases in LIBOR rate levels.3 Lastly, any investments the Fund has made in slightly longer maturities have been in Treasury, agency and top-quality corporate money market securities. The Fund holds a significant amount of its short-term liquidity in overnight and 7-day investments.
A group of investment professionals is responsible for the day-to-day management of the Fund. These investment professionals have a broad range of experience managing money market funds.
The Lipper Money Market Variable Annuity Funds category includes funds that invest in high-quality financial instruments rated in the top two grades with dollar-weighted average maturities of less than 90 days, and that intend to keep a constant net asset value. It is not possible to invest directly in a Lipper category. For the 1-, 3-, 5- and 10-year periods, this category's average return was 0.01% (102 funds), 0.81% (99 funds), 2.34% (96 funds) and 2.11% (76 funds), respectively, as of 12/31/10.
1 The yield curve is a graphical representation of how yields on bonds of different maturities compare. Normally, yield curves slant up, as bonds with longer maturities typically offer higher yields than short-term bonds.
2 The Eurozone refers to a currency union among the European Union member states that have adopted the euro as their sole currency.
3 LIBOR, or the London Interbank Offered Rate, is the most widely used benchmark or reference rate for short-term interest rates. LIBOR is the rate of interest at which banks borrow funds from other banks, in large volume, in the international market.
Portfolio Summary
DWS Money Market VIP
Asset Allocation (As a % of Investment Portfolio) | 12/31/10 | 12/31/09 |
| | |
Commercial Paper | 31% | 33% |
Short-Term Notes | 21% | 21% |
Repurchase Agreements | 20% | 13% |
Government & Agency Obligations | 14% | 10% |
Certificates of Deposit and Bank Notes | 14% | 22% |
Supranational | — | 1% |
| 100% | 100% |
Weighted Average Maturity* | | |
| | |
DWS Variable Series II — DWS Money Market VIP | 51 days | 48 days |
First Tier Retail Money Fund Average | 39 days | 47 days |
* The Fund is compared to its respective iMoneyNet Category: First Tier Retail Money Fund Average — Category includes a widely recognized composite of money market funds that invest in only first tier (highest rating) securities. Portfolio Holdings of First Tier funds include US Treasury, US Other, Repos, Time Deposits, Domestic Bank Obligations, Foreign Bank Obligations, First Tier Commercial Paper, Floating Rate Notes and Asset Backed Commercial Paper.
Weighted average maturity, also known as effective maturity, is the weighted average of the bonds held by the Fund taking into consideration any maturity shortening features.
Asset allocation and weighted average maturity are subject to change.
For more complete details about the Fund's investment portfolio, see page 192.
Following the Fund's fiscal first and third quarter-end, a complete portfolio holdings listing is filed with the SEC on Form N-Q. In addition, each month, information about the Fund and its portfolio holdings is filed with the SEC on Form N-MFP. The SEC delays the public availability of the information filed on Form N-MFP for 60 days after the end of the reporting period included in the filing. These forms will be available on the SEC's Web site at www.sec.gov, and they may also be reviewed and copied at the SEC's Public Reference Room in Washington, D.C. Information on the operation of the SEC's Public Reference Room may be obtained by calling (800) SEC-0330. The Fund's portfolio holdings are also posted on www.dws-investments.com from time to time. Please see the Fund's current prospectus for more information.
Investment Portfolio December 31, 2010
DWS Money Market VIP
| Principal Amount ($) | Value ($) |
| |
Certificates of Deposit and Bank Notes 14.0% |
Abbey National Treasury Services PLC, 0.46%, 2/2/2011 | 2,000,000 | 2,000,000 |
Banco Bilbao Vizcaya Argentaria SA, 0.5%, 2/14/2011 | 750,000 | 750,000 |
Bank of Tokyo-Mitsubishi UFJ Ltd., 0.38%, 5/16/2011 | 2,000,000 | 2,000,000 |
BNP Paribas: |
| 0.41%, 3/17/2011 | 800,000 | 800,017 |
| 0.55%, 5/13/2011 | 750,000 | 750,109 |
| 0.63%, 1/27/2011 | 1,500,000 | 1,500,000 |
Credit Agricole SA, 0.3%, 1/19/2011 | 2,000,000 | 2,000,000 |
Dexia Credit Local, 144A, 2.375%, 9/23/2011 | 665,000 | 673,485 |
International Finance Corp., 3.0%, 11/15/2011 | 500,000 | 511,262 |
KBC Bank NV: |
| 0.4%, 1/18/2011 | 1,000,000 | 1,000,000 |
| 0.4%, 1/19/2011 | 1,000,000 | 1,000,000 |
Kommuninvest I Sverige, 0.55%, 4/19/2011 | 1,000,000 | 1,000,623 |
Landeskreditbank Baden- Wuerttemberg Foerderbank, 2.5%, 2/14/2011 | 1,500,000 | 1,503,785 |
Mizuho Corporate Bank Ltd., 0.3%, 3/7/2011 | 2,000,000 | 2,000,000 |
Natixis, 0.3%, 1/20/2011 | 3,000,000 | 3,000,000 |
Nordea Bank Finland PLC: |
| 0.26%, 1/12/2011 | 1,500,000 | 1,499,999 |
| 0.27%, 1/12/2011 | 2,000,000 | 2,000,000 |
| 0.44%, 6/30/2011 | 1,000,000 | 1,000,149 |
Skandinaviska Enskilda Banken AB: |
| 0.29%, 1/4/2011 | 1,000,000 | 1,000,000 |
| 0.3%, 2/4/2011 | 1,000,000 | 1,000,000 |
Societe Generale, 0.41%, 4/26/2011 | 900,000 | 900,000 |
Sumitomo Mitsui Banking Corp.: |
| 0.3%, 1/31/2011 | 1,000,000 | 1,000,000 |
| 0.3%, 3/3/2011 | 2,000,000 | 2,000,000 |
Total Certificates of Deposit and Bank Notes (Cost $30,889,429) | 30,889,429 |
|
Commercial Paper 30.7% |
Issued at Discount** |
Abbey National North America LLC: |
| 0.455%, 2/1/2011 | 2,000,000 | 1,999,216 |
| 0.46%, 2/16/2011 | 1,000,000 | 999,412 |
| 0.9%, 1/19/2011 | 2,000,000 | 1,999,100 |
Argento Variable Funding: |
| 144A, 0.32%, 2/4/2011 | 1,750,000 | 1,749,471 |
| 144A, 0.33%, 1/28/2011 | 1,500,000 | 1,499,629 |
| 144A, 0.36%, 2/9/2011 | 1,500,000 | 1,499,415 |
| 144A, 0.37%, 2/24/2011 | 700,000 | 699,612 |
ASB Finance Ltd., 0.501%, 2/9/2011 | 1,200,000 | 1,199,350 |
| Principal Amount ($) | Value ($) |
| |
Banco Bilbao Vizcaya Argentaria SA: | |
| 0.49%, 2/4/2011 | 1,200,000 | 1,199,445 |
| 0.5%, 2/16/2011 | 700,000 | 699,553 |
| 0.5%, 2/18/2011 | 600,000 | 599,600 |
BNZ International Funding Ltd., 144A, 0.52%, 1/21/2011 | 2,500,000 | 2,499,278 |
Caisse D'Amortissement de la Dette Sociale: | |
| 0.25%, 2/7/2011 | 750,000 | 749,807 |
| 0.26%, 2/22/2011 | 800,000 | 799,700 |
| 0.26%, 3/15/2011 | 1,200,000 | 1,199,367 |
Cancara Asset Securitisation LLC: |
| 144A, 0.3%, 1/10/2011 | 2,000,000 | 1,999,850 |
| 144A, 0.3%, 1/18/2011 | 2,000,000 | 1,999,717 |
Google, Inc., 0.4%, 9/16/2011 | 800,000 | 797,707 |
Grampian Funding LLC: |
| 144A, 0.3%, 2/11/2011 | 1,000,000 | 999,658 |
| 144A, 0.34%, 1/10/2011 | 1,000,000 | 999,915 |
| 144A, 0.36%, 2/3/2011 | 1,250,000 | 1,249,588 |
| 144A, 0.36%, 2/11/2011 | 1,500,000 | 1,499,385 |
| 144A, 0.37%, 2/17/2011 | 1,150,000 | 1,149,445 |
| 144A, 0.37%, 3/1/2011 | 1,500,000 | 1,499,090 |
Johnson & Johnson: |
| 144A, 0.18%, 1/18/2011 | 800,000 | 799,932 |
| 144A, 0.22%, 4/7/2011 | 1,750,000 | 1,748,973 |
Kells Funding LLC: |
| 144A, 0.3%, 3/18/2011 | 1,200,000 | 1,199,240 |
| 144A, 0.31%, 3/21/2011 | 2,000,000 | 1,998,639 |
Kreditanstalt fuer Wiederaufbau: |
| 144A, 0.23%, 2/15/2011 | 800,000 | 799,770 |
| 144A, 0.245%, 2/24/2011 | 800,000 | 799,706 |
Nieuw Amsterdam Receivables Corp., 144A, 0.27%, 1/6/2011 | 1,000,000 | 999,963 |
NRW.Bank: |
| 0.27%, 1/4/2011 | 1,150,000 | 1,149,974 |
| 0.32%, 3/8/2011 | 1,350,000 | 1,349,208 |
| 0.42%, 3/31/2011 | 2,400,000 | 2,397,508 |
| 0.43%, 3/31/2011 | 750,000 | 749,203 |
Oesterreichische Kontrollbank AG, 0.245%, 2/28/2011 | 800,000 | 799,684 |
PepsiCo, Inc, 0.18%, 2/11/2011 | 2,300,000 | 2,299,529 |
Regency Markets No. 1 LLC, 144A, 0.27%, 1/20/2011 | 2,375,000 | 2,374,662 |
Romulus Funding Corp., 144A, 0.36%, 1/13/2011 | 2,000,000 | 1,999,760 |
Santander Central Hispano Finance Delaware, Inc., 0.5%, 3/11/2011 | 1,350,000 | 1,348,706 |
Shell International Finance BV: |
| 0.4%, 5/2/2011 | 800,000 | 798,924 |
| 0.5%, 2/4/2011 | 800,000 | 799,622 |
Societe de Prise de Participation de l'Etat, 144A, 0.24%, 2/24/2011 | 800,000 | 799,712 |
Societe Generale North America, Inc., 0.33%, 2/1/2011 | 1,000,000 | 999,716 |
Standard Chartered Bank: |
| 0.3%, 2/22/2011 | 1,200,000 | 1,199,480 |
| 0.33%, 1/13/2011 | 2,000,000 | 1,999,780 |
| Principal Amount ($) | Value ($) |
| |
Straight-A Funding LLC, 144A, 0.25%, 3/10/2011 | 1,200,000 | 1,199,433 |
Swedbank AB, 0.31%, 1/5/2011 | 1,150,000 | 1,149,960 |
Toyota Motor Credit Corp., 0.25%, 1/13/2011 | 2,000,000 | 1,999,833 |
Victory Receivables Corp., 144A, 0.29%, 1/31/2011 | 2,200,000 | 2,199,468 |
Total Commercial Paper (Cost $67,546,695) | 67,546,695 |
|
Short Term Notes* 21.3% |
Abbey National Treasury Services PLC: |
| 0.439%, 3/7/2011 | 1,000,000 | 1,000,000 |
| 0.59%, 11/2/2011 | 1,000,000 | 1,000,000 |
Australia & New Zealand Banking Group Ltd., 144A, 0.43%, 1/20/2012 | 1,200,000 | 1,200,000 |
Bank of Nova Scotia: |
| 0.37%, 9/12/2011 | 800,000 | 800,000 |
| 0.45%, 12/8/2011 | 800,000 | 800,000 |
Barclays Bank PLC: |
| 0.58%, 7/19/2011 | 2,000,000 | 2,000,000 |
| 0.66%, 4/21/2011 | 2,200,000 | 2,200,000 |
BNP Paribas, 0.538%, 4/26/2011 | 1,800,000 | 1,800,000 |
Canadian Imperial Bank of Commerce: | |
| 0.28%, 5/12/2011 | 1,400,000 | 1,400,000 |
| 0.29%, 4/26/2011 | 1,000,000 | 1,000,000 |
| 0.46%, 4/26/2011 | 2,000,000 | 2,000,000 |
Commonwealth Bank of Australia, 144A, 0.323%, 1/3/2011 | 1,380,000 | 1,380,000 |
DnB NOR Bank ASA, 144A, 0.295%, 4/26/2011 | 1,500,000 | 1,500,000 |
Intesa Sanpaolo SpA, 0.37%, 10/27/2011 | 1,000,000 | 1,000,000 |
JPMorgan Chase Bank NA, 0.26%, 5/31/2011 | 1,300,000 | 1,300,000 |
Kells Funding LLC, 144A, 0.4%, 12/1/2011 | 1,000,000 | 1,000,000 |
National Australia Bank Ltd.: |
| 144A, 0.29%, 1/27/2011 | 1,000,000 | 1,000,000 |
| 0.322%, 6/10/2011 | 1,500,000 | 1,500,000 |
Nordea Bank Finland PLC: |
| 0.589%, 10/14/2011 | 2,000,000 | 2,004,577 |
| 0.589%, 10/20/2011 | 2,000,000 | 2,004,688 |
Rabobank Nederland NV: |
| 0.262%, 3/11/2011 | 1,800,000 | 1,800,000 |
| 144A, 1.79%, 4/7/2011 | 4,000,000 | 4,000,000 |
Royal Bank of Canada: |
| 0.26%, 2/24/2011 | 675,000 | 675,000 |
| 0.41%, 8/12/2011 | 1,200,000 | 1,200,000 |
Societe Generale: |
| 0.42%, 4/21/2011 | 900,000 | 900,000 |
| 0.42%, 5/19/2011 | 2,200,000 | 2,200,000 |
Toronto-Dominion Bank, 0.265%, 2/4/2011 | 1,500,000 | 1,500,000 |
Westpac Banking Corp.: |
| 0.289%, 4/14/2011 | 1,800,000 | 1,800,000 |
| 0.3%, 1/10/2011 | 1,300,000 | 1,300,000 |
| 0.307%, 6/1/2011 | 2,000,000 | 2,000,000 |
| 0.46%, 1/10/2012 | 1,500,000 | 1,500,000 |
Total Short Term Notes (Cost $46,764,265) | 46,764,265 |
|
| Principal Amount ($) | Value ($) |
| |
Government & Agency Obligations 14.2% |
Foreign Government Obligations 0.4% |
Kingdom of Denmark, 2.75%, 11/15/2011 | 1,000,000 | 1,020,058 |
Other Government Related (a) 1.0% |
European Investment Bank: |
| 0.23%, 2/16/2011 | 800,000 | 799,765 |
| 2.625%, 5/16/2011 | 750,000 | 756,392 |
| 2.625%, 11/15/2011 | 600,000 | 611,562 |
| 2,167,719 |
US Government Sponsored Agencies 5.4% |
Federal Farm Credit Bank, 0.241%*, 11/2/2011 | 750,000 | 749,969 |
Federal Home Loan Bank: |
| 0.24%, 10/28/2011 | 1,800,000 | 1,799,054 |
| 0.25%, 10/28/2011 | 750,000 | 749,949 |
| 0.269%**, 9/12/2011 | 2,500,000 | 2,495,237 |
| 0.4%, 1/4/2011 | 700,000 | 699,999 |
| 0.43%, 2/22/2011 | 800,000 | 800,002 |
| 0.54%, 5/24/2011 | 1,100,000 | 1,100,034 |
Federal National Mortgage Association: | |
| 0.161%*, 7/27/2011 | 1,200,000 | 1,199,551 |
| 0.284%**, 1/18/2011 | 1,500,000 | 1,499,787 |
| 4.68%, 6/15/2011 | 750,000 | 764,946 |
| 11,858,528 |
US Treasury Obligations 7.4% |
US Treasury Bills: |
| 0.16%**, 3/10/2011 | 2,000,000 | 1,999,396 |
| 0.217%**, 10/20/2011 | 1,000,000 | 998,236 |
US Treasury Notes: |
| 1.0%, 9/30/2011 | 2,000,000 | 2,010,794 |
| 1.0%, 10/31/2011 | 1,000,000 | 1,006,244 |
| 1.125%, 6/30/2011 | 2,500,000 | 2,508,627 |
| 1.125%, 12/15/2011 | 1,200,000 | 1,209,364 |
| 4.5%, 2/28/2011 | 650,000 | 654,239 |
| 4.625%, 8/31/2011 | 1,800,000 | 1,851,794 |
| 4.625%, 10/31/2011 | 1,000,000 | 1,035,746 |
| 4.75%, 3/31/2011 | 2,300,000 | 2,325,601 |
| 5.125%, 6/30/2011 | 650,000 | 665,784 |
| 16,265,825 |
Total Government & Agency Obligations (Cost $31,312,130) | 31,312,130 |
|
Repurchase Agreements 20.5% |
Banc of America Securities LLC, 0.25%, dated 12/31/2010, to be repurchased at $20,526,652 on 1/3/2011 (b) | 20,526,224 | 20,526,224 |
JPMorgan Securities, Inc., 0.17%, dated 12/31/2010, to be repurchased at $14,447,499 on 1/3/2011 (c) | 14,447,294 | 14,447,294 |
JPMorgan Securities, Inc., 0.20%, dated 12/31/2010, to be repurchased at $8,000,133 on 1/3/2011 (d) | 8,000,000 | 8,000,000 |
The Goldman Sachs & Co., 0.17%, dated 12/31/2010, to be repurchased at $2,000,028 on 1/3/2011 (e) | 2,000,000 | 2,000,000 |
Total Repurchase Agreements (Cost $44,973,518) | 44,973,518 |
| % of Net Assets | Value ($) |
| |
Total Investment Portfolio (Cost $221,486,037)+ | 100.7 | 221,486,037 |
Other Assets and Liabilities, Net | (0.7) | (1,569,492) |
Net Assets | 100.0 | 219,916,545 |
* These securities are shown at their current rate as of December 31, 2010. Floating rate securities' yields vary with a designated market index or market rate, such as the coupon-equivalent of the US Treasury bill rate.
** Annualized yield at time of purchase; not a coupon rate.
+ The cost for federal income tax purposes was $221,486,037.
(a) Government-backed debt issued by financial companies or government sponsored enterprises.
(b) Collateralized by $16,238,000 Federal National Mortgage Association, with various coupon rates from 5.0-7.25%, with various maturity dates of 5/11/2017-5/15/2030 with a value of $20,937,401.
(c) Collateralized by $23,120,000 US Treasury STRIPS, maturing on 5/15/2022 with a value of $14,737,612.
(d) Collateralized by $8,197,133 Federal National Mortgage Association, 1.75%, maturing on 8/25/2020 with a value of $8,172,037.
(e) Collateralized by $1,977,493 Federal Home Loan Mortgage Corp., with various coupon rates from 1.875-4.07%, with various maturity dates of 9/1/2015-6/1/2032 with a value of $2,040,000.
144A: Security exempt from registration under Rule 144A of the Securities Act of 1933. These securities may be resold in transactions exempt from registration, normally to qualified institutional buyers.
STRIPS: Separate Trading of Registered Interest and Principal Securities
Fair Value Measurements
Various inputs are used in determining the value of the Fund's investments. These inputs are summarized in three broad levels. Level 1 includes quoted prices in active markets for identical securities. Level 2 includes other significant observable inputs (including quoted prices for similar securities, interest rates, prepayment speeds, and credit risk). Level 3 includes significant unobservable inputs (including the Fund's own assumptions in determining the fair value of investments). The inputs or methodology used for valuing securities are not necessarily an indication of the risk associated with investing in those securities. Securities held by a money market fund are reflected as Level 2 because the securities are valued at amortized cost (which approximates fair value) and, accordingly, the inputs used to determine value are not quoted prices in an active market.
The following is a summary of the inputs used as of December 31, 2010 in valuing the Fund's investments. For information on the Fund's policy regarding the valuation of investments, please refer to the Security Valuation section of Note A in the accompanying Notes to Financial Statements.
Assets | Level 1 | Level 2 | Level 3 | Total |
|
Investments in Securities (f) | $ — | $ 176,512,519 | $ — | $ 176,512,519 |
Repurchase Agreements | — | 44,973,518 | — | 44,973,518 |
Total | $ — | $ 221,486,037 | $ — | $ 221,486,037 |
There have been no transfers between Level 1 and Level 2 fair value measurements during the year ended December 31, 2010.
(f) See Investment Portfolio for additional detailed categorizations.
The accompanying notes are an integral part of the financial statements.
Statement of Assets and Liabilities
as of December 31, 2010 |
Assets |
Investments: Investment in unaffiliated securities, valued at amortized cost | $ 176,512,519 |
Repurchase agreements, valued at amortized cost | 44,973,518 |
Total investments, valued at amortized cost | 221,486,037 |
Cash | 14 |
Receivable for Fund shares sold | 60,705 |
Due from Advisor | 15,381 |
Interest receivable | 197,386 |
Other assets | 1,349 |
Total assets | 221,760,872 |
Liabilities |
Payable for Fund shares redeemed | 1,754,575 |
Distributions payable | 1,007 |
Other accrued expenses and payables | 88,745 |
Total liabilities | 1,844,327 |
Net assets, at value | $ 219,916,545 |
Net Assets Consist of |
Distributions in excess of net investment income | (1,007) |
Paid-in capital | 219,917,552 |
Net assets, at value | $ 219,916,545 |
Class A Net Asset Value, offering and redemption price per share ($219,916,545 ÷ 220,001,268 outstanding shares of beneficial interest, no par value, unlimited number of shares authorized) | $ 1.00 |
The accompanying notes are an integral part of the financial statements.
Statement of Operations
for the year ended December 31, 2010 |
Investment Income |
Income: Interest | $ 862,229 |
Expenses: Management fee | 704,427 |
Administration fee | 247,168 |
Services to shareholders | 1,924 |
Custodian fee | 27,571 |
Professional fees | 64,438 |
Trustees' fee and expenses | 10,980 |
Reports to shareholders | 60,076 |
Other | 13,636 |
Total expenses | 1,130,220 |
Expense reductions | (292,806) |
Total expenses after expense reductions | 837,414 |
Net investment income | 24,815 |
Net realized gain (loss) | 1,201 |
Net increase (decrease) in net assets resulting from operations | $ 26,016 |
The accompanying notes are an integral part of the financial statements.
Statement of Changes in Net Assets
Increase (Decrease) in Net Assets | Years Ended December 31, |
2010 | 2009 |
Operations: Net investment income | $ 24,815 | $ 1,242,942 |
Net realized gain (loss) | 1,201 | 23,268 |
Net increase (decrease) in net assets resulting from operations | 26,016 | 1,266,210 |
Distributions to shareholders from: Net investment income Class A | (24,815) | (1,233,793) |
Class B | — | (37) |
Total distributions | $ (24,815) | $ (1,233,830) |
Fund share transactions: Class A Proceeds from shares sold | 111,590,276 | 102,195,146 |
Shares converted* | — | 41,096 |
Reinvestment of distributions | 26,864 | 1,523,848 |
Payments for shares redeemed | (161,340,354) | (231,903,870) |
Net increase (decrease) in net assets from Class A share transactions | (49,723,214) | (128,143,780) |
Class B Proceeds from shares sold | — | 50 |
Shares converted* | — | (41,096) |
Reinvestment of distributions | — | 58 |
Payments for shares redeemed | — | (49) |
Net increase (decrease) in net assets from Class B share transactions | — | (41,037) |
Increase (decrease) in net assets | (49,722,013) | (128,152,437) |
Net assets at beginning of period | 269,638,558 | 397,790,995 |
Net assets at end of period (including distributions in excess of net investment income of $1,007 and $16,402, respectively) | $ 219,916,545 | $ 269,638,558 |
Other Information |
Class A Shares outstanding at beginning of period | 269,724,482 | 397,868,262 |
Shares sold | 111,590,276 | 102,195,146 |
Shares converted* | — | 41,096 |
Shares issued to shareholders in reinvestment of distributions | 26,864 | 1,523,848 |
Shares redeemed | (161,340,354) | (231,903,870) |
Net increase (decrease) in Class A shares | (49,723,214) | (128,143,780) |
Shares outstanding at end of period | 220,001,268 | 269,724,482 |
Class B Shares outstanding at beginning of period | — | 41,037 |
Shares sold | — | 50 |
Shares converted* | — | (41,096) |
Shares issued to shareholders in reinvestment of distributions | — | 58 |
Shares redeemed | — | (49) |
Net increase (decrease) in Class B shares | — | (41,037) |
Shares outstanding at end of period | — | — |
* On February 3, 2009, Class B shares converted into Class A shares.
The accompanying notes are an integral part of the financial statements.
Financial Highlights
Class A Years Ended December 31, | 2010 | 2009 | 2008 | 2007 | 2006 |
Selected Per Share Data |
Net asset value, beginning of period | $ 1.000 | $ 1.000 | $ 1.000 | $ 1.000 | $ 1.000 |
Income from investment operations: Net investment income | .000* | .003 | .026 | .049 | .046 |
Total from investment operations | .000* | .003 | .026 | .049 | .046 |
Less distributions from: Net investment income | .000* | (.003) | (.026) | (.049) | (.046) |
Net asset value, end of period | $ 1.000 | $ 1.000 | $ 1.000 | $ 1.000 | $ 1.000 |
Total Return (%) | .01a | .34 | 2.64a | 5.00a | 4.65a |
Ratios to Average Net Assets and Supplemental Data |
Net assets, end of period ($ millions) | 220 | 270 | 398 | 355 | 294 |
Ratio of expenses before expense reductions (%) | .46 | .43 | .52 | .46 | .52 |
Ratio of expenses after expense reductions (%) | .34 | .43 | .50 | .45 | .51 |
Ratio of net investment income (%) | .01 | .37 | 2.56 | 4.88 | 4.58 |
a Total return would have been lower had certain expenses not been reduced. * Amount is less than $.0005. |
Performance Summary December 31, 2010
DWS Small Cap Growth VIP
All performance shown is historical, assumes reinvestment of all dividend and capital gain distributions and does not guarantee future results. Investment return and principal value fluctuate with changing market conditions so that, when redeemed, shares may be worth more or less than their original cost. Current performance may be lower or higher than the performance data quoted. Please contact your participating insurance company for the Fund's most recent month-end performance. Performance doesn't reflect charges and fees ("contract charges") associated with the separate account that invests in the Fund or any variable life insurance policy or variable annuity contract for which the Fund is an investment option. These charges and fees will reduce returns.
The gross expense ratio of the Fund, as stated in the fee table of the prospectus dated May 1, 2010 is 0.77% for Class A shares and may differ from the expense ratio disclosed in the Financial Highlights table in this report.
Risk Considerations
Stocks of smaller companies involve greater risk than securities of larger, more-established companies. Stocks may decline in value. See the prospectus for details.
Fund returns shown for the 3-year, 5-year and 10-year periods reflect a fee waiver and/or expense reimbursement. Without this waiver/reimbursement, returns would have been lower.
Growth of an Assumed $10,000 Investment in DWS Small Cap Growth VIP |
[] DWS Small Cap Growth VIP — Class A [] Russell 2000® Growth Index | The Russell 2000® Growth Index is an unmanaged, capitalization-weighted measure of 2,000 of the smallest capitalized US companies with a greater-than-average growth orientation and whose common stocks trade on the NYSE, NYSE Alternext US (formerly known as "Amex") and Nasdaq. Index returns assume reinvestment of dividends and, unlike fund returns, do not reflect any fees or expenses. It is not possible to invest directly into an index. |
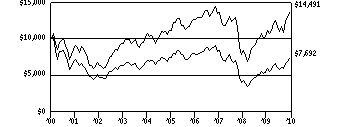 | |
Yearly periods ended December 31 | |
Comparative Results |
DWS Small Cap Growth VIP | 1-Year | 3-Year | 5-Year | 10-Year |
Class A | Growth of $10,000 | $12,944 | $9,190 | $10,274 | $7,692 |
Average annual total return | 29.44% | -2.77% | 0.54% | -2.59% |
Russell 2000 Growth Index | Growth of $10,000 | $12,909 | $10,668 | $12,944 | $14,491 |
Average annual total return | 29.09% | 2.18% | 5.30% | 3.78% |
The growth of $10,000 is cumulative.
Information About Your Fund's Expenses
DWS Small Cap Growth VIP
As an investor of the Fund, you incur two types of costs: ongoing expenses and transaction costs. Ongoing expenses include management fees and other Fund expenses. Examples of transaction costs include contract charges, redemption fees and account maintenance fees, which are not shown in this section. The following tables are intended to help you understand your ongoing expenses (in dollars) of investing in the Fund and to help you compare these expenses with the ongoing expenses of investing in other mutual funds. The example in the table is based on an investment of $1,000 invested at the beginning of the six-month period and held for the entire period (July 1, 2010 to December 31, 2010).
The tables illustrate your Fund's expenses in two ways:
• Actual Fund Return. This helps you estimate the actual dollar amount of ongoing expenses (but not transaction costs) paid on a $1,000 investment in the Fund using the Fund's actual return during the period. To estimate the expenses you paid over the period, simply divide your account value by $1,000 (for example, an $8,600 account value divided by $1,000 = 8.6), then multiply the result by the number in the "Expenses Paid per $1,000" line under the share class you hold.
• Hypothetical 5% Fund Return. This helps you to compare your Fund's ongoing expenses (but not transaction costs) with those of other mutual funds using the Fund's actual expense ratio and a hypothetical rate of return of 5% per year before expenses. Examples using a 5% hypothetical Fund return may be found in the shareholder reports of other mutual funds. The hypothetical account values and expenses may not be used to estimate the actual ending account balance or expenses you paid for the period.
Please note that the expenses shown in these tables are meant to highlight your ongoing expenses only and do not reflect any transaction costs. The "Expenses Paid per $1,000" line of the tables is useful in comparing ongoing expenses only and will not help you determine the relative total expense of owning different funds. If these transaction costs had been included, your costs would have been higher.
Expenses and Value of a $1,000 Investment for the six months ended December 31, 2010 |
Actual Fund Return | Class A | |
Beginning Account Value 7/1/10 | $ 1,000.00 | |
Ending Account Value 12/31/10 | $ 1,333.00 | |
Expenses Paid per $1,000* | $ 4.06 | |
Hypothetical 5% Fund Return | Class A | |
Beginning Account Value 7/1/10 | $ 1,000.00 | |
Ending Account Value 12/31/10 | $ 1,021.73 | |
Expenses Paid per $1,000* | $ 3.52 | |
* Expenses are equal to the Fund's annualized expense ratio, multiplied by the average account value over the period, multiplied by the number of days in the most recent six-month period, then divided by 365.
Annualized Expense Ratio | Class A | |
DWS Variable Series II — DWS Small Cap Growth VIP | .69% | |
For more information, please refer to the Fund's prospectus.
These tables do not reflect charges and fees ("contract charges") associated with the separate account that invests in the Fund or any variable life insurance policy or variable annuity contract for which the Fund is an investment option.
Management Summary December 31, 2010
DWS Small Cap Growth VIP
The year 2010 began on an optimistic note with a few bright spots in the economy — improving consumer confidence, the government's report showing strong fourth-quarter 2009 gross domestic product GDP growth and a six-year high in manufacturing activity — partially offset by growing concerns about the health of the European financial system.1 By May 2010, the US stock market had entered a period of significant volatility amid regulatory uncertainty (health care and financial reform) and fears of a possible double-dip recession. The market then staged a rebound during the last four months of the year amid increasing confidence that the US Federal Reserve Board's (the Fed's) second round of quantitative easing measures would support asset prices, along with evidence that the US economy was on a path to faster growth in 2011.
For the 12 months ended December 31, 2010, the Fund returned 29.44% (Class A shares, unadjusted for contract charges), compared with the 29.09% return of the Russell 2000® Growth Index. These strong returns belie the elevated level of investor risk aversion that impacted the global equity markets during much of the summer months as high unemployment, European debt problems, a possible economic "hard landing" within China and some slippage for US economic indicators temporarily dampened enthusiasm for stocks.
The Fund's outperformance of the benchmark came primarily from favorable stock selection. During the period, stock selection was positive within the health care, information technology and consumer staples sectors. Other contributions to return came from an overweight to energy and an underweight to telecom services.2 Stock selection in energy and consumer discretionary detracted from performance. In addition, underweight positions in materials, information technology and consumer discretionary weighed on returns.
We continue to maintain a long-term perspective, investing in quality small-cap growth stocks. Effective on or about May 1, 2011, the name of the Fund will be changed to DWS Small Mid Cap Growth VIP. The Fund's investment objective will also change to long-term capital appreciation. For a description of the new investment objective, please see the supplement dated January 19, 2011 to the Fund's current prospectus posted on www.dws-investments.com.
Joseph Axtell, CFA
Rafaelina M. Lee
Portfolio Managers
The Russell 2000 Growth Index is an unmanaged, capitalization-weighted measure of 2,000 of the smallest capitalized US companies with a greater-than-average growth orientation and whose common stocks trade on the NYSE, NYSE Alternext US (formerly known as "Amex") and Nasdaq.
Index returns assume reinvestment of dividends and, unlike funds returns, do not reflect any fees or expenses. It is not possible to invest directly into an index.
1 Gross domestic product is the value of goods and services produced in an economy.
2 "Overweight" means that a Fund holds a higher weighting in a given sector compared with its benchmark index. "Underweight" means that a Fund holds a lower weighting in a given sector.
Portfolio Summary
DWS Small Cap Growth VIP
Asset Allocation (As a % of Investment Portfolio excluding Securities Lending Collateral) | 12/31/10 | 12/31/09 |
| | |
Common Stocks | 97% | 98% |
Cash Equivalents | 3% | 2% |
| 100% | 100% |
Sector Diversification (As a % of Common Stocks) | 12/31/10 | 12/31/09 |
| | |
Information Technology | 25% | 24% |
Health Care | 20% | 17% |
Consumer Discretionary | 16% | 16% |
Industrials | 16% | 19% |
Energy | 9% | 9% |
Financials | 6% | 7% |
Materials | 5% | 2% |
Consumer Staples | 3% | 5% |
Telecommunication Services | — | 1% |
| 100% | 100% |
Asset allocation and sector diversification are subject to change.
For more complete details about the Fund's investment portfolio, see page 205.
Following the Fund's fiscal first and third quarter-end, a complete portfolio holdings listing is filed with the SEC on Form N-Q. The form will be available on the SEC's Web site at www.sec.gov, and it also may be reviewed and copied at the SEC's Public Reference Room in Washington, D.C. Information on the operation of the SEC's Public Reference Room may be obtained by calling (800) SEC-0330. The Fund's portfolio holdings are also posted on www.dws-investments.com from time to time. Please see the Fund's current prospectus for more information.
Investment Portfolio December 31, 2010
DWS Small Cap Growth VIP
| Shares | Value ($) |
| |
Common Stocks 97.6% |
Consumer Discretionary 15.9% |
Auto Components 0.9% |
Gentex Corp. | 27,633 | 816,831 |
Diversified Consumer Services 0.6% |
Capella Education Co.* (a) | 7,900 | 525,982 |
Hotels Restaurants & Leisure 1.4% |
Buffalo Wild Wings, Inc.* | 18,902 | 828,853 |
Red Robin Gourmet Burgers, Inc.* (a) | 18,900 | 405,783 |
| 1,234,636 |
Internet & Catalog Retail 0.2% |
Mecox Lane Ltd. (ADR)* (a) | 22,883 | 169,563 |
Media 1.4% |
Cinemark Holdings, Inc. | 70,334 | 1,212,558 |
Specialty Retail 8.5% |
Advance Auto Parts, Inc. | 19,700 | 1,303,155 |
Children's Place Retail Stores, Inc.* | 23,300 | 1,156,612 |
DSW, Inc. "A"* (a) | 39,161 | 1,531,195 |
Guess?, Inc. | 31,500 | 1,490,580 |
hhgregg, Inc.* (a) | 44,600 | 934,370 |
Urban Outfitters, Inc.* | 31,821 | 1,139,510 |
| 7,555,422 |
Textiles, Apparel & Luxury Goods 2.9% |
Carter's, Inc.* (a) | 22,600 | 666,926 |
Deckers Outdoor Corp.* (a) | 12,448 | 992,604 |
True Religion Apparel, Inc.* (a) | 39,109 | 870,566 |
| 2,530,096 |
Consumer Staples 3.1% |
Food Products |
Diamond Foods, Inc. (a) | 24,355 | 1,295,199 |
Green Mountain Coffee Roasters, Inc.* (a) | 43,050 | 1,414,623 |
| 2,709,822 |
Energy 8.4% |
Energy Equipment & Services 2.4% |
Complete Production Services, Inc.* | 26,075 | 770,516 |
Dril-Quip, Inc.* | 17,678 | 1,373,934 |
| 2,144,450 |
Oil, Gas & Consumable Fuels 6.0% |
Carrizo Oil & Gas, Inc.* (a) | 36,299 | 1,251,952 |
Clean Energy Fuels Corp.* | 27,300 | 377,832 |
Cloud Peak Energy, Inc.* | 22,911 | 532,223 |
Concho Resources, Inc.* | 11,469 | 1,005,487 |
Northern Oil & Gas, Inc.* | 44,689 | 1,215,988 |
Rosetta Resources, Inc.* | 24,500 | 922,180 |
| 5,305,662 |
Financials 5.7% |
Capital Markets 1.3% |
Stifel Financial Corp.* (a) | 17,900 | 1,110,516 |
Commercial Banks 0.9% |
Prosperity Bancshares, Inc. | 21,100 | 828,808 |
Consumer Finance 1.9% |
Dollar Financial Corp.* (a) | 56,842 | 1,627,386 |
| Shares | Value ($) |
| |
Diversified Financial Services 1.6% |
Portfolio Recovery Associates, Inc.* (a) | 19,268 | 1,448,954 |
Health Care 19.6% |
Biotechnology 5.6% |
Alexion Pharmaceuticals, Inc.* | 10,651 | 857,938 |
Halozyme Therapeutics, Inc.* | 106,100 | 840,312 |
Human Genome Sciences, Inc.* | 20,000 | 477,800 |
ImmunoGen, Inc.* (a) | 65,600 | 607,456 |
Onyx Pharmaceuticals, Inc.* | 12,559 | 463,051 |
Regeneron Pharmaceuticals, Inc.* | 31,600 | 1,037,428 |
United Therapeutics Corp.* | 10,600 | 670,132 |
| 4,954,117 |
Health Care Equipment & Supplies 3.4% |
Accuray, Inc.* | 88,274 | 595,850 |
Kinetic Concepts, Inc.* | 23,700 | 992,556 |
NxStage Medical, Inc.* | 19,107 | 475,382 |
Thoratec Corp.* (a) | 32,500 | 920,400 |
| 2,984,188 |
Health Care Providers & Services 2.4% |
ExamWorks Group, Inc.* | 27,635 | 510,695 |
Gentiva Health Services, Inc.* | 31,400 | 835,240 |
Universal American Financial Corp. | 40,107 | 820,188 |
| 2,166,123 |
Health Care Technology 1.9% |
SXC Health Solutions Corp.* | 40,470 | 1,734,544 |
Life Sciences Tools & Services 1.2% |
ICON PLC (ADR)* | 27,058 | 592,570 |
QIAGEN NV* (a) | 22,367 | 437,275 |
| 1,029,845 |
Pharmaceuticals 5.1% |
Auxilium Pharmaceuticals, Inc.* | 20,048 | 423,013 |
Flamel Technologies SA (ADR)* (a) | 55,700 | 380,988 |
Par Pharmaceutical Companies, Inc.* | 25,900 | 997,409 |
Questcor Pharmaceuticals, Inc.* (a) | 146,192 | 2,153,408 |
VIVUS, Inc.* (a) | 56,355 | 528,046 |
| 4,482,864 |
Industrials 15.7% |
Aerospace & Defense 2.6% |
AAR Corp.* | 39,331 | 1,080,423 |
BE Aerospace, Inc.* | 33,200 | 1,229,396 |
| 2,309,819 |
Commercial Services & Supplies 0.9% |
EnerNOC, Inc.* (a) | 34,100 | 815,331 |
Construction & Engineering 0.6% |
MYR Group, Inc.* | 23,600 | 495,600 |
Electrical Equipment 1.4% |
General Cable Corp.* (a) | 34,893 | 1,224,395 |
Machinery 6.1% |
Altra Holdings, Inc.* | 15,383 | 305,506 |
Ampco-Pittsburgh Corp. | 21,334 | 598,419 |
Badger Meter, Inc. (a) | 15,702 | 694,343 |
Columbus McKinnon Corp.* | 28,675 | 582,676 |
RBC Bearings, Inc.* | 32,677 | 1,277,017 |
Sauer-Danfoss, Inc.* | 24,876 | 702,747 |
Terex Corp.* | 39,400 | 1,222,976 |
| 5,383,684 |
| Shares | Value ($) |
| |
Professional Services 2.1% |
FTI Consulting, Inc.* (a) | 17,924 | 668,207 |
TrueBlue, Inc.* | 68,240 | 1,227,637 |
| 1,895,844 |
Road & Rail 1.2% |
Genesee & Wyoming, Inc. "A"* | 19,456 | 1,030,195 |
Trading Companies & Distributors 0.8% |
United Rentals, Inc.* (a) | 30,937 | 703,817 |
Information Technology 24.2% |
Communications Equipment 3.5% |
Aruba Networks, Inc.* | 15,850 | 330,948 |
Comverse Technology, Inc.* | 64,655 | 469,395 |
Polycom, Inc.* | 24,371 | 949,982 |
Riverbed Technology, Inc.* (a) | 29,190 | 1,026,612 |
Sycamore Networks, Inc. | 16,900 | 347,971 |
| 3,124,908 |
Electronic Equipment, Instruments &
Components 0.8% |
Itron, Inc.* | 12,482 | 692,127 |
Internet Software & Services 3.5% |
Digital River, Inc.* | 29,245 | 1,006,613 |
GSI Commerce, Inc.* | 35,526 | 824,203 |
MercadoLibre, Inc.* | 12,509 | 833,725 |
NIC, Inc. | 45,100 | 437,921 |
| 3,102,462 |
IT Services 6.9% |
Cardtronics, Inc.* | 42,700 | 755,790 |
FleetCor Technologies, Inc.* | 19,144 | 591,932 |
Forrester Research, Inc. | 40,300 | 1,422,187 |
iGATE Corp. (a) | 67,043 | 1,321,418 |
iSoftStone Holdings Ltd. (ADR)* | 25,781 | 468,441 |
Syntel, Inc. | 18,437 | 881,104 |
Telvent GIT SA* (a) | 25,117 | 663,591 |
| 6,104,463 |
Semiconductors & Semiconductor Equipment 3.5% |
Atheros Communications* | 12,405 | 445,588 |
Cavium Networks, Inc.* (a) | 31,533 | 1,188,163 |
Netlogic Microsystems, Inc.* (a) | 23,500 | 738,135 |
Novellus Systems, Inc.* | 21,144 | 683,374 |
| 3,055,260 |
| Shares | Value ($) |
| |
Software 6.0% |
CommVault Systems, Inc.* | 24,732 | 707,830 |
Concur Technologies, Inc.* (a) | 26,337 | 1,367,681 |
NICE Systems Ltd. (ADR)* | 23,649 | 825,350 |
QLIK Technologies, Inc.* | 18,888 | 487,499 |
Sourcefire, Inc.* | 15,400 | 399,322 |
Taleo Corp. "A"* | 30,930 | 855,215 |
TiVo, Inc.* | 30,084 | 259,625 |
VanceInfo Technologies, Inc. (ADR)* | 12,021 | 415,205 |
| 5,317,727 |
Materials 5.0% |
Chemicals 1.8% |
Solutia, Inc.* | 42,631 | 983,924 |
STR Holdings, Inc.* (a) | 32,210 | 644,200 |
| 1,628,124 |
Metals & Mining 2.3% |
Molycorp, Inc.* (a) | 14,006 | 698,899 |
Randgold Resources Ltd. (ADR) (a) | 3,100 | 255,223 |
Thompson Creek Metals Co., Inc.* | 73,000 | 1,074,560 |
| 2,028,682 |
Paper & Forest Products 0.9% |
Schweitzer-Mauduit International, Inc. (a) | 12,681 | 797,889 |
Total Common Stocks (Cost $58,328,703) | 86,282,694 |
|
Securities Lending Collateral 24.8% |
Daily Assets Fund Institutional, 0.27% (b) (c) (Cost $21,950,973) | 21,950,973 | 21,950,973 |
|
Cash Equivalents 2.9% |
Central Cash Management Fund, 0.19% (b) (Cost $2,532,069) | 2,532,069 | 2,532,069 |
| % of Net Assets | Value ($) |
| |
Total Investment Portfolio (Cost $82,811,745)+ | 125.3 | 110,765,736 |
Other Assets and Liabilities, Net | (25.3) | (22,336,473) |
Net Assets | 100.0 | 88,429,263 |
* Non-income producing security.
+ The cost for federal income tax purposes was $83,216,134. At December 31, 2010, net unrealized appreciation for all securities based on tax cost was $27,549,602. This consisted of aggregate gross unrealized appreciation for all securities in which there was an excess of value over tax cost of $28,627,462 and aggregate gross unrealized depreciation for all securities in which there was an excess of tax cost over value of $1,077,860.
(a) All or a portion of these securities were on loan (see Notes to Financial Statements). The value of all securities loaned at December 31, 2010 amounted to $21,144,795, which is 23.9% of net assets.
(b) Affiliated fund managed by Deutsche Investment Management Americas Inc. The rate shown is the annualized seven-day yield at period end.
(c) Represents collateral held in connection with securities lending. Income earned by the Fund is net of borrower rebates.
ADR: American Depositary Receipt
Fair Value Measurements
Various inputs are used in determining the value of the Fund's investments. These inputs are summarized in three broad levels. Level 1 includes quoted prices in active markets for identical securities. Level 2 includes other significant observable inputs (including quoted prices for similar securities, interest rates, prepayment speeds, and credit risk). Level 3 includes significant unobservable inputs (including the Fund's own assumptions in determining the fair value of investments). The inputs or methodology used for valuing securities are not necessarily an indication of the risk associated with investing in those securities.
The following is a summary of the inputs used as of December 31, 2010 in valuing the Fund's investments. For information on the Fund's policy regarding the valuation of investments, please refer to the Security Valuation section of Note A in the accompanying Notes to Financial Statements.
Assets | Level 1 | Level 2 | Level 3 | Total |
|
Common Stocks (d) | $ 86,282,694 | $ — | $ — | $ 86,282,694 |
Short-Term Investments (d) | 24,483,042 | — | — | 24,483,042 |
Total | $ 110,765,736 | $ — | $ — | $ 110,765,736 |
There have been no significant transfers between Level 1 and Level 2 fair value measurements during the year ended December 31, 2010.
(d) See Investment Portfolio for additional detailed categorizations.
The accompanying notes are an integral part of the financial statements.
Statement of Assets and Liabilities
as of December 31, 2010 |
Assets |
Investments: Investments in unaffiliated securities, at value (cost $58,328,703) — including $21,144,795 of securities loaned | $ 86,282,694 |
Investment in Daily Assets Fund Institutional (cost $21,950,973)* | 21,950,973 |
Investment in Central Cash Management Fund (cost $2,532,069) | 2,532,069 |
Total investments, at value (cost $82,811,745) | 110,765,736 |
Cash | 10,000 |
Receivable for Fund shares sold | 105 |
Dividends receivable | 2,288 |
Interest receivable | 6,480 |
Other assets | 439 |
Total assets | 110,785,048 |
Liabilities |
Payable upon return of securities loaned | 21,950,973 |
Payable for Fund shares redeemed | 272,959 |
Accrued management fee | 42,627 |
Other accrued expenses and payables | 89,226 |
Total liabilities | 22,355,785 |
Net assets, at value | $ 88,429,263 |
Net Assets Consist of |
Undistributed net investment income | 516,412 |
Net unrealized appreciation (depreciation) on investments | 27,953,991 |
Accumulated net realized gain (loss) | (42,803,640) |
Paid-in capital | 102,762,500 |
Net assets, at value | $ 88,429,263 |
Class A Net Asset Value, offering and redemption price per share ($88,429,263 ÷ 6,384,947 outstanding shares of beneficial interest, no par value, unlimited number of shares authorized) | $ 13.85 |
* Represents collateral on securities loaned.
The accompanying notes are an integral part of the financial statements.
Statement of Operations
for the year ended December 31, 2010 |
Investment Income |
Income: Dividends (net of foreign taxes withheld of $1,244) | $ 442,311 |
Income distributions — Central Cash Management Fund | 3,293 |
Securities lending income, including income from Daily Assets Fund Institutional, net of borrower rebates | 78,166 |
Total income | 523,770 |
Expenses: Management fee | 434,077 |
Administration fee | 78,923 |
Services to shareholders | 4,365 |
Custodian fee and other | 10,831 |
Legal fees | 8,644 |
Audit and tax fees | 58,410 |
Trustees' fees and expenses | 5,538 |
Reports to shareholders | 10,959 |
Total expenses | 611,747 |
Net investment income (loss) | (87,977) |
Realized and Unrealized Gain (Loss) |
Net realized gain (loss) from investments | 11,959,891 |
Change in net unrealized appreciation (depreciation) on investments | 8,823,086 |
Net gain (loss) | 20,782,977 |
Net increase (decrease) in net assets resulting from operations | $ 20,695,000 |
The accompanying notes are an integral part of the financial statements.
Statement of Changes in Net Assets
Increase (Decrease) in Net Assets | Years Ended December 31, |
2010 | 2009 |
Operations: Net investment income (loss) | $ (87,977) | $ (146,790) |
Net realized gain (loss) | 11,959,891 | (20,542,495) |
Change in net unrealized appreciation (depreciation) | 8,823,086 | 44,155,860 |
Net increase (decrease) in net assets resulting from operations | 20,695,000 | 23,466,575 |
Fund share transactions: Class A Proceeds from shares sold | 6,051,148 | 3,738,488 |
Payments for shares redeemed | (17,902,129) | (17,049,742) |
Shares converted* | — | 10,873 |
Net increase (decrease) in net assets from Class A share transactions | (11,850,981) | (13,300,381) |
Class B Proceeds from shares sold | — | 244 |
Payments for shares redeemed | — | (33) |
Shares converted* | — | (10,873) |
Net increase (decrease) in net assets from Class B share transactions | — | (10,662) |
Increase (decrease) in net assets | 8,844,019 | 10,155,532 |
Net assets at beginning of period | 79,585,244 | 69,429,712 |
Net assets at end of period (including undistributed net investment income of $516,412 and accumulated net investment loss of $14,597, respectively) | $ 88,429,263 | $ 79,585,244 |
Other Information |
Class A Shares outstanding at beginning of period | 7,439,067 | 9,122,504 |
Shares sold | 517,480 | 442,413 |
Shares redeemed | (1,571,600) | (2,127,728) |
Shares converted* | — | 1,878 |
Net increase (decrease) in Class A shares | (1,054,120) | (1,683,437) |
Shares outstanding at end of period | 6,384,947 | 7,439,067 |
Class B Shares outstanding at beginning of period | — | 1,867 |
Shares sold | — | 38 |
Shares redeemed | — | (5) |
Shares converted* | — | (1,900) |
Net increase (decrease) in Class B shares | — | (1,867) |
Shares outstanding at end of period | — | — |
* On March 6, 2009, Class B shares converted into Class A shares.
The accompanying notes are an integral part of the financial statements.
Financial Highlights
Class A Years Ended December 31, | 2010 | 2009 | 2008 | 2007 | 2006 |
Selected Per Share Data |
Net asset value, beginning of period | $ 10.70 | $ 7.61 | $ 15.07 | $ 14.19 | $ 13.48 |
Income (loss) from investment operations: Net investment income (loss)a | (.01) | (.02) | (.01) | (.01) | (.04)c |
Net realized and unrealized gain (loss) | 3.16 | 3.11 | (7.45) | .89 | .75 |
Total from investment operations | 3.15 | 3.09 | (7.46) | .88 | .71 |
Net asset value, end of period | $ 13.85 | $ 10.70 | $ 7.61 | $ 15.07 | $ 14.19 |
Total Return (%) | 29.44 | 40.60 | (49.50)b | 6.20b | 5.27b,c |
Ratios to Average Net Assets and Supplemental Data |
Net assets, end of period ($ millions) | 88 | 80 | 69 | 174 | 208 |
Ratio of expenses before expense reductions (%) | .78 | .77 | .88 | .75 | .73 |
Ratio of expenses after expense reductions (%) | .78 | .77 | .85 | .72 | .72 |
Ratio of net investment income (loss) (%) | (.12) | (.22) | (.04) | (.09) | (.32)c |
Portfolio turnover rate (%) | 64 | 93 | 67 | 67 | 73 |
a Based on average shares outstanding during the period. b Total return would have been lower had certain expenses not been reduced. c Includes non-recurring income from the Advisor recorded as a result of an administrative proceeding regarding disclosure of brokerage allocation practices in connection with sales of DWS Funds. The non-recurring income resulted in an increase in net investment income of $0.008 per share and an increase in the ratio of net investment income of 0.06%. Excluding this non-recurring income, total return would have been 0.06% lower. |
Performance Summary December 31, 2010
DWS Strategic Income VIP
All performance shown is historical, assumes reinvestment of all dividend and capital gain distributions and does not guarantee future results. Investment return and principal value fluctuate with changing market conditions so that, when redeemed, shares may be worth more or less than their original cost. Current performance may be lower or higher than the performance data quoted. Please contact your participating insurance company for the Fund's most recent month-end performance. Performance doesn't reflect charges and fees ("contract charges") associated with the separate account that invests in the Fund or any variable life insurance policy or variable annuity contract for which the Fund is an investment option. These charges and fees will reduce returns.
The gross expense ratio of the Fund, as stated in the fee table of the prospectus dated May 1, 2010 is 0.86% for Class A shares and may differ from the expense ratio disclosed in the Financial Highlights table in this report.
Risk Considerations
Bond investments are subject to interest-rate and credit risks. When interest rates rise, bond prices generally fall. Credit risk refers to the ability of an issuer to make timely payments of principal and interest. Investments in lower-quality and non-rated securities present greater risk of loss than investments in higher-quality securities. The Fund may use derivatives, including as part of its global alpha strategy. Investing in derivatives entails special risks relating to liquidity, leverage and credit that may reduce returns and/or increase volatility. Investing in foreign securities, particularly those of emerging markets, presents certain risks, such as currency fluctuations, political and economic changes, and market risks. See the prospectus for details.
Fund returns for all periods shown reflect a fee waiver and/or expense reimbursement. Without this waiver/reimbursement, returns would have been lower.
Growth of an Assumed $10,000 Investment in DWS Strategic Income VIP |
[] DWS Strategic Income VIP — Class A [] Barclays Capital US Government/Credit Index [] Blended Index | The Barclays Capital US Government/Credit Index is an unmanaged index comprising intermediate- and long-term government and investment-grade corporate debt securities. The Blended Index consists of the Credit Suisse High Yield Index (35%), Barclays Capital US Government/Credit Index (35%), JPMorgan Emerging Markets Bond Index Global Diversified (15%) and Citigroup Non US Hedged World Government Bond Index ("WGBI") (15%). The Advisor believes this blended benchmark, which is a secondary benchmark, more accurately reflects typical portfolio asset allocations and represents the overall investment process. Index returns, unlike fund returns, do not reflect any fees or expenses. It is not possible to invest directly into an index. |
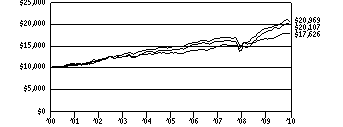 | |
Yearly periods ended December 31 | |
Comparative Results |
DWS Strategic Income VIP | 1-Year | 3-Year | 5-Year | 10-Year |
Class A | Growth of $10,000 | $11,005 | $12,460 | $14,317 | $20,107 |
Average annual total return | 10.05% | 7.61% | 7.44% | 7.23% |
Barclays Capital US Government/Credit Index | Growth of $10,000 | $10,659 | $11,777 | $13,105 | $17,626 |
Average annual total return | 6.59% | 5.60% | 5.56% | 5.83% |
Blended Index | Growth of $10,000 | $10,954 | $12,399 | $14,000 | $20,969 |
Average annual total return | 9.54% | 7.43% | 6.96% | 7.69% |
The growth of $10,000 is cumulative.
Information About Your Fund's Expenses
DWS Strategic Income VIP
As an investor of the Fund, you incur two types of costs: ongoing expenses and transaction costs. Ongoing expenses include management fees and other Fund expenses. Examples of transaction costs include contract charges, redemption fees and account maintenance fees, which are not shown in this section. The following tables are intended to help you understand your ongoing expenses (in dollars) of investing in the Fund and to help you compare these expenses with the ongoing expenses of investing in other mutual funds. In the most recent six-month period, the Fund limited these expenses; had it not done so, expenses would have been higher. The example in the table is based on an investment of $1,000 invested at the beginning of the six-month period and held for the entire period (July 1, 2010 to December 31, 2010).
The tables illustrate your Fund's expenses in two ways:
• Actual Fund Return. This helps you estimate the actual dollar amount of ongoing expenses (but not transaction costs) paid on a $1,000 investment in the Fund using the Fund's actual return during the period. To estimate the expenses you paid over the period, simply divide your account value by $1,000 (for example, an $8,600 account value divided by $1,000 = 8.6), then multiply the result by the number in the "Expenses Paid per $1,000" line under the share class you hold.
• Hypothetical 5% Fund Return. This helps you to compare your Fund's ongoing expenses (but not transaction costs) with those of other mutual funds using the Fund's actual expense ratio and a hypothetical rate of return of 5% per year before expenses. Examples using a 5% hypothetical Fund return may be found in the shareholder reports of other mutual funds. The hypothetical account values and expenses may not be used to estimate the actual ending account balance or expenses you paid for the period.
Please note that the expenses shown in these tables are meant to highlight your ongoing expenses only and do not reflect any transaction costs. The "Expenses Paid per $1,000" line of the tables is useful in comparing ongoing expenses only and will not help you determine the relative total expense of owning different funds. If these transaction costs had been included, your costs would have been higher.
Expenses and Value of a $1,000 Investment for the six months ended December 31, 2010 |
Actual Fund Return | Class A | |
Beginning Account Value 7/1/10 | $ 1,000.00 | |
Ending Account Value 12/31/10 | $ 1,051.90 | |
Expenses Paid per $1,000* | $ 4.29 | |
Hypothetical 5% Fund Return | Class A | |
Beginning Account Value 7/1/10 | $ 1,000.00 | |
Ending Account Value 12/31/10 | $ 1,021.02 | |
Expenses Paid per $1,000* | $ 4.23 | |
* Expenses are equal to the Fund's annualized expense ratio, multiplied by the average account value over the period, multiplied by the number of days in the most recent six-month period, then divided by 365.
Annualized Expense Ratio | Class A | |
DWS Variable Series II — DWS Strategic Income VIP | .83% | |
For more information, please refer to the Fund's prospectus.
These tables do not reflect charges and fees ("contract charges") associated with the separate account that invests in the Fund or any variable life insurance policy or variable annuity contract for which the Fund is an investment option.
Management Summary December 31, 2010
DWS Strategic Income VIP
The Class A shares of the Fund returned 10.05% (unadjusted for contract charges) during the 12-month period ended December 31, 2010. This compares with returns of 9.54% for the Fund's blended benchmark and 6.59% for the Barclays Capital US Government/Credit Index.
The primary positive factor in the Fund's performance was its overweight in high-yield bonds, which outpaced the broader market by a wide margin.1 We continued to add to this market segment throughout the year, bringing the Fund's weighting in high yield from about 45% at the beginning of 2010 to approximately 55% at year end. Given the outperformance of high-yield bonds, this decision proved helpful to performance. The Fund's weighting in domestic investment-grade bonds also delivered a positive return, thanks to the solid performance of our positions in corporate bonds and mortgage-backed securities.2 On the negative side, our relative performance in the Fund's domestic segment was held back somewhat by our smaller-than-normal position in commercial mortgage-backed securities.3
Turning our attention to the Fund's overseas allocation, our position in emerging-markets debt produced a strong absolute return, which seeks to generate positive returns independent of market direction, but had only a modest impact on performance due to our small average weighting of about 6% to 8% of assets. The Fund's position in non-US developed-market bonds was a modest detractor. While we generated positive performance through our investments in euro-denominated corporate debt, our positions in Greece and Spain weighed significantly on performance during the first half of the year. Our currency positioning and global tactical asset allocation overlay strategy were also modest detractors from performance.4
We believe the year ahead will prove challenging for government bonds, given the extremely low absolute yields in the developed markets. In such an environment, we would expect to see continued outperformance from the "spread sectors" such as high-yield and investment-grade corporate bonds.5 Accordingly, about 80% of the Fund is now invested in these areas — up from about 60% at the start of the year. This allocation includes not just domestic corporates, but also bonds issued by corporations domiciled in Europe, Asia and the emerging markets.
As always, our investment process remains focused on using credit research to identify the most compelling investment opportunities for the Fund. At a time in which government bonds are offering paltry yields, we believe our global, multi-asset-class approach provides us with the best chance to strike this favorable balance over time.
Gary Russell, CFA
William Chepolis, CFA
John D. Ryan
Portfolio Managers, Deutsche Investment Management Americas Inc.
Thomas Picciochi
Robert Wang
Portfolio Managers, QS Investors, LLC
Subadvisor to the Fund
The Blended Index consists of the Credit Suisse High Yield Index (35%), Barclays Capital US Government/Credit Index (35%), JPMorgan Emerging Markets Bond Index Global Diversified (15%) and Citigroup Non US Hedged WBGI (15%). The Advisor believes this blended benchmark, which is a secondary benchmark, more accurately reflects typical portfolio asset allocations and represents the overall investment process.
The Barclays Capital US Government/Credit Index is an unmanaged index comprising intermediate- and long-term government and investment-grade corporate debt securities.
Index returns, unlike fund returns, do not reflect any fees or expenses. It is not possible to invest directly into an index.
1 "Overweight" means the Fund holds a higher weighting in a given sector or security than the benchmark. "Underweight" means the Fund holds a lower weighting.
2 Mortgage-backed securities (MBS) are secured by loans on residential property.
3 Commercial mortgage-backed securities (CMBS) are secured by loans on a commercial property.
4 The global tactical asset allocation (GTAA) strategy is a total return strategy designed to add value by benefiting from global market inefficiencies. The strategy combines diverse macro investment views to determine the positions, using a disciplined, risk-managed process. The result is a collection of long and short investment positions within global markets designed to generate excess returns that have little correlation to major markets. These positions are then implemented through futures and forward contracts.
5 "Spread sectors" refers to all segments of the bond market other than government bonds. They are named as such because they are priced on the yield spread, or difference in yield, relative to Treasuries.
Portfolio Summary
DWS Strategic Income VIP
Asset Allocation (As a % of Investment Portfolio excluding Securities Lending Collateral) | 12/31/10 | 12/31/09 |
| | |
Corporate Bonds | 62% | 62% |
Government & Agency Obligations | 17% | 18% |
Cash Equivalents | 5% | 8% |
Mortgage-Backed Securities Pass-Throughs | 5% | 4% |
Loan Participations and Assignments | 4% | 3% |
Collateralized Mortgage Obligations | 3% | 2% |
Commercial Mortgage-Backed Securities | 3% | 1% |
Preferred Securities | 1% | 1% |
Asset Backed | — | 1% |
| 100% | 100% |
Quality (Excludes Cash Equivalents and Securities Lending Collateral) | 12/31/10 | 12/31/09 |
| | |
AAA | 20% | 13% |
AA | 2% | 9% |
A | 5% | 7% |
BBB | 16% | 15% |
BB | 16% | 20% |
B | 28% | 23% |
CCC | 11% | 9% |
Below CCC | — | 2% |
Not Rated | 2% | 2% |
| 100% | 100% |
Interest Rate Sensitivity | 12/31/10 | 12/31/09 |
| | |
Effective Maturity | 7.2 years | 6.6 years |
Effective Duration | 4.7 years | 3.7 years |
Asset allocation and interest rate sensitivity are subject to change.
The quality ratings represent the lower of Moody's Investors Service, Inc. ("Moody's") or Standard & Poor's Corporation ("S&P") credit ratings. The ratings of Moody's and S&P represent their opinions as to the quality of the securities they rate. Ratings are relative and subjective and are not absolute standards of quality. The Fund's credit quality does not remove market risk and is subject to change.
Effective maturity is the weighted average of the bonds held by the Fund taking into consideration any maturity shortening features.
Effective duration is an approximate measure of the Fund's sensitivity to interest rate changes taking into consideration any maturity shortening features.
For more complete details about the Fund's investment portfolio, see page 218.
Following the Fund's fiscal first and third quarter-end, a complete portfolio holdings listing is filed with the SEC on Form N-Q. The form will be available on the SEC's Web site at www.sec.gov, and it also may be reviewed and copied at the SEC's Public Reference Room in Washington, D.C. Information on the operation of the SEC's Public Reference Room may be obtained by calling (800) SEC-0330. The Fund's portfolio holdings are also posted on www.dws-investments.com from time to time. Please see the Fund's current prospectus for more information.
Investment Portfolio December 31, 2010
DWS Strategic Income VIP
| Principal Amount ($) (a) | Value ($) |
| |
Corporate Bonds 64.0% |
Consumer Discretionary 7.9% |
AMC Entertainment, Inc., 8.0%, 3/1/2014 | | 105,000 | 106,050 |
American Achievement Corp., 144A, 10.875%, 4/15/2016 | | 110,000 | 112,750 |
Ameristar Casinos, Inc., 9.25%, 6/1/2014 | | 115,000 | 123,050 |
Asbury Automotive Group, Inc.: |
| 7.625%, 3/15/2017 | | 65,000 | 65,650 |
| 144A, 8.375%, 11/15/2020 | | 80,000 | 82,600 |
Ashtead Holdings PLC, 144A, 8.625%, 8/1/2015 | | 120,000 | 124,350 |
Avis Budget Car Rental LLC: |
| 144A, 8.25%, 1/15/2019 | | 95,000 | 95,950 |
| 9.625%, 3/15/2018 | | 45,000 | 48,488 |
Beazer Homes USA, Inc., 144A, 9.125%, 5/15/2019 | | 50,000 | 47,500 |
Bon-Ton Department Stores, Inc., 10.25%, 3/15/2014 | | 30,000 | 30,600 |
Brunswick Corp., 144A, 11.25%, 11/1/2016 | | 45,000 | 53,550 |
Cablevision Systems Corp.: |
| 7.75%, 4/15/2018 | | 10,000 | 10,475 |
| 144A, 8.0%, 12/15/2018 | | 95,000 | 97,850 |
| 8.0%, 4/15/2020 | | 10,000 | 10,700 |
CanWest MediaWorks LP, 144A, 9.25%, 8/1/2015** | | 50,000 | 8,500 |
Carnival Corp., 6.65%, 1/15/2028 | | 285,000 | 292,317 |
Carrols Corp., 9.0%, 1/15/2013 | | 30,000 | 30,075 |
CCO Holdings LLC: |
| 7.25%, 10/30/2017 | | 90,000 | 91,350 |
| 7.875%, 4/30/2018 | | 40,000 | 41,400 |
| 8.125%, 4/30/2020 | | 25,000 | 26,313 |
Cequel Communications Holdings I LLC, 144A, 8.625%, 11/15/2017 | | 215,000 | 224,675 |
Clear Channel Worldwide Holdings, Inc.: | |
| Series A, 9.25%, 12/15/2017 | | 15,000 | 16,313 |
| Series B, 9.25%, 12/15/2017 | | 25,000 | 27,375 |
DineEquity, Inc., 144A, 9.5%, 10/30/2018 | | 150,000 | 159,000 |
DISH DBS Corp.: |
| 6.625%, 10/1/2014 | | 65,000 | 67,437 |
| 7.125%, 2/1/2016 | | 155,000 | 160,037 |
Fontainebleau Las Vegas Holdings LLC, 144A, 11.0%, 6/15/2015** | | 65,000 | 228 |
Ford Motor Co., 7.45%, 7/16/2031 | | 65,000 | 69,631 |
General Electric Co., 144A, 4.375%, 4/1/2021 | | 145,000 | 140,738 |
Goodyear Tire & Rubber Co., 10.5%, 5/15/2016 | | 25,000 | 28,500 |
Great Canadian Gaming Corp., 144A, 7.25%, 2/15/2015 | | 55,000 | 56,237 |
Group 1 Automotive, Inc., 144A, 3.0%, 3/15/2020 | | 65,000 | 80,844 |
| Principal Amount ($) (a) | Value ($) |
| |
Harrah's Operating Co., Inc.: |
| 10.0%, 12/15/2018 | | 135,000 | 123,187 |
| 11.25%, 6/1/2017 | | 240,000 | 270,000 |
| 144A, 12.75%, 4/15/2018 | | 55,000 | 55,275 |
Hertz Corp.: |
| 144A, 7.5%, 10/15/2018 | | 155,000 | 160,812 |
| 8.875%, 1/1/2014 | | 183,000 | 187,117 |
Hyundai Motor Manufacturing Czech, 144A, 4.5%, 4/15/2015 | | 145,000 | 148,787 |
Lear Corp.: |
| 7.875%, 3/15/2018 | | 40,000 | 42,800 |
| 8.125%, 3/15/2020 | | 40,000 | 43,500 |
Limited Brands, Inc., 7.0%, 5/1/2020 | | 20,000 | 21,100 |
Macy's Retail Holdings, Inc., 8.375%, 7/15/2015 | | 10,000 | 11,700 |
Mediacom Broadband LLC, 8.5%, 10/15/2015 | | 110,000 | 110,550 |
Mediacom LLC, 9.125%, 8/15/2019 | | 30,000 | 30,600 |
MGM Resorts International: |
| 144A, 9.0%, 3/15/2020 | | 65,000 | 71,500 |
| 144A, 10.0%, 11/1/2016 | | 15,000 | 15,413 |
| 10.375%, 5/15/2014 | | 45,000 | 50,512 |
| 11.125%, 11/15/2017 | | 50,000 | 57,500 |
Michaels Stores, Inc., Step-up Coupon, 0% to 11/1/2011, 13.0% to 11/1/2016 | | 25,000 | 24,750 |
Neiman Marcus Group, Inc., 10.375%, 10/15/2015 | | 25,000 | 26,406 |
Norcraft Holdings LP, 9.75%, 9/1/2012 | | 71,000 | 71,444 |
Penske Automotive Group, Inc., 7.75%, 12/15/2016 | | 175,000 | 178,500 |
PETCO Animal Supplies, Inc., 144A, 9.25%, 12/1/2018 | | 60,000 | 63,225 |
Phillips-Van Heusen Corp., 7.375%, 5/15/2020 | | 25,000 | 26,563 |
Regal Entertainment Group, 9.125%, 8/15/2018 | | 25,000 | 26,625 |
Sabre Holdings Corp., 8.35%, 3/15/2016 | | 160,000 | 153,600 |
Sears Holdings Corp., 144A, 6.625%, 10/15/2018 | | 60,000 | 55,950 |
Seminole Indian Tribe of Florida: |
| 144A, 7.75%, 10/1/2017 | | 40,000 | 41,300 |
| 144A, 7.804%, 10/1/2020 | | 70,000 | 68,215 |
Simmons Bedding Co., 144A, 11.25%, 7/15/2015 | | 50,000 | 54,000 |
Sirius XM Radio, Inc., 144A, 8.75%, 4/1/2015 | | 55,000 | 59,537 |
Sonic Automotive, Inc.: |
| 5.0%, 10/1/2029 | | 25,000 | 31,063 |
| Series B, 9.0%, 3/15/2018 | | 95,000 | 99,987 |
Standard Pacific Corp.: |
| 8.375%, 5/15/2018 | | 10,000 | 10,000 |
| 144A, 8.375%, 5/15/2018 | | 65,000 | 65,000 |
| 10.75%, 9/15/2016 | | 80,000 | 92,200 |
Toys "R" Us-Delaware, Inc., 144A, 7.375%, 9/1/2016 | | 35,000 | 36,750 |
| Principal Amount ($) (a) | Value ($) |
| |
Travelport LLC: |
| 4.921%***, 9/1/2014 | | 45,000 | 39,825 |
| 9.0%, 3/1/2016 | | 65,000 | 62,969 |
| 9.875%, 9/1/2014 | | 45,000 | 43,819 |
Unitymedia Hessen GmbH & Co., KG, 144A, 8.125%, 12/1/2017 | | 200,000 | 209,000 |
Univision Communications, Inc., 144A, 7.875%, 11/1/2020 | | 25,000 | 26,250 |
UPC Holding BV, 144A, 8.0%, 11/1/2016 | EUR | 100,000 | 138,975 |
Vertis, Inc., 13.5%, 4/1/2014 (PIK)** | | 24,348 | 730 |
Visant Corp., 144A, 10.0%, 10/1/2017 | | 80,000 | 85,000 |
Wyndham Worldwide Corp., 5.75%, 2/1/2018 | | 210,000 | 213,536 |
Wynn Las Vegas LLC, 7.75%, 8/15/2020 | | 50,000 | 54,125 |
Young Broadcasting, Inc., 8.75%, 1/15/2014** | | 275,000 | 3 |
| 5,990,233 |
Consumer Staples 2.2% |
Alliance One International, Inc., 10.0%, 7/15/2016 | | 25,000 | 25,625 |
Altria Group, Inc., 9.95%, 11/10/2038 | | 145,000 | 204,324 |
B&G Foods, Inc., 7.625%, 1/15/2018 | | 25,000 | 26,313 |
Central Garden & Pet Co., 8.25%, 3/1/2018 | | 35,000 | 35,437 |
Darling International, Inc., 144A, 8.5%, 12/15/2018 | | 80,000 | 83,400 |
Dole Food Co., Inc., 144A, 8.0%, 10/1/2016 | | 35,000 | 36,925 |
FAGE Dairy Industry SA, 144A, 9.875%, 2/1/2020 | | 85,000 | 85,000 |
General Nutrition Centers, Inc., 5.75%***, 3/15/2014 (PIK) | | 40,000 | 39,600 |
NBTY, Inc., 144A, 9.0%, 10/1/2018 | | 25,000 | 26,688 |
North Atlantic Trading Co., 144A, 10.0%, 3/1/2012 | | 223,000 | 209,620 |
Pilgrim's Pride Corp., 144A, 7.875%, 12/15/2018 | | 60,000 | 59,700 |
Reynolds American, Inc., 6.75%, 6/15/2017 | | 200,000 | 223,543 |
Rite Aid Corp.: |
| 7.5%, 3/1/2017 | | 60,000 | 57,675 |
| 8.0%, 8/15/2020 | | 100,000 | 104,125 |
Smithfield Foods, Inc.: |
| 7.75%, 7/1/2017 | | 220,000 | 228,800 |
| 144A, 10.0%, 7/15/2014 | | 85,000 | 97,962 |
Stater Bros. Holdings, Inc., 144A, 7.375%, 11/15/2018 | | 30,000 | 30,750 |
SUPERVALU, Inc., 8.0%, 5/1/2016 | | 35,000 | 33,513 |
TreeHouse Foods, Inc., 7.75%, 3/1/2018 | | 25,000 | 27,094 |
| 1,636,094 |
Energy 7.4% |
Allis-Chalmers Energy, Inc., 9.0%, 1/15/2014 | | 55,000 | 55,825 |
Anadarko Petroleum Corp., 6.375%, 9/15/2017 | | 215,000 | 234,201 |
| Principal Amount ($) (a) | Value ($) |
| |
Arch Coal, Inc., 7.25%, 10/1/2020 | | 20,000 | 21,100 |
Atlas Energy Operating Co., LLC, 12.125%, 8/1/2017 | | 55,000 | 69,575 |
Belden & Blake Corp., 8.75%, 7/15/2012 | | 310,000 | 296,050 |
Berry Petroleum Co., 6.75%, 11/1/2020 | | 90,000 | 90,450 |
Bill Barrett Corp., 9.875%, 7/15/2016 | | 40,000 | 43,900 |
BreitBurn Energy Partners LP, 144A, 8.625%, 10/15/2020 | | 50,000 | 50,250 |
Bristow Group, Inc., 7.5%, 9/15/2017 | | 70,000 | 73,850 |
Chaparral Energy, Inc., 8.5%, 12/1/2015 | | 230,000 | 234,025 |
Chesapeake Energy Corp.: |
| 6.625%, 8/15/2020 | | 60,000 | 59,100 |
| 6.875%, 8/15/2018 | | 30,000 | 30,450 |
| 6.875%, 11/15/2020 | | 75,000 | 75,937 |
| 7.25%, 12/15/2018 | | 100,000 | 103,500 |
| 9.5%, 2/15/2015 | | 185,000 | 208,587 |
CITGO Petroleum Corp., 144A, 11.5%, 7/1/2017 | | 105,000 | 117,600 |
Colorado Interstate Gas Co., 6.8%, 11/15/2015 | | 30,000 | 34,561 |
CONSOL Energy, Inc.: |
| 144A, 8.0%, 4/1/2017 | | 115,000 | 122,475 |
| 144A, 8.25%, 4/1/2020 | | 60,000 | 64,800 |
Continental Resources, Inc.: |
| 144A, 7.125%, 4/1/2021 | | 30,000 | 31,500 |
| 7.375%, 10/1/2020 | | 35,000 | 37,100 |
| 8.25%, 10/1/2019 | | 20,000 | 22,200 |
Crosstex Energy LP, 8.875%, 2/15/2018 | | 55,000 | 58,919 |
El Paso Corp.: |
| 7.25%, 6/1/2018 | | 55,000 | 58,878 |
| 9.625%, 5/15/2012 | | 132,000 | 140,681 |
El Paso Pipeline Partners Operating Co., LLC, 6.5%, 4/1/2020 | | 155,000 | 162,625 |
Energy Transfer Equity LP, 7.5%, 10/15/2020 | | 35,000 | 36,050 |
Frontier Oil Corp., 6.875%, 11/15/2018 | | 55,000 | 56,100 |
Genesis Energy LP, 144A, 7.875%, 12/15/2018 | | 65,000 | 64,675 |
Global Geophysical Services, Inc., 10.5%, 5/1/2017 | | 130,000 | 129,350 |
Harvest Operations Corp., 144A, 6.875%, 10/1/2017 | | 25,000 | 25,750 |
Holly Energy Partners LP, 144A, 8.25%, 3/15/2018 | | 55,000 | 57,475 |
Inergy LP, 144A, 7.0%, 10/1/2018 | | 60,000 | 60,450 |
KCS Energy, Inc., 7.125%, 4/1/2012 | | 240,000 | 240,600 |
Linn Energy LLC: |
| 144A, 7.75%, 2/1/2021 | | 60,000 | 61,500 |
| 144A, 8.625%, 4/15/2020 | | 55,000 | 59,263 |
| 11.75%, 5/15/2017 | | 75,000 | 85,875 |
Newfield Exploration Co., 7.125%, 5/15/2018 | | 90,000 | 94,725 |
Nexen, Inc., 5.875%, 3/10/2035 | | 75,000 | 69,738 |
Niska Gas Storage US LLC, 144A, 8.875%, 3/15/2018 | | 55,000 | 58,850 |
OPTI Canada, Inc., 7.875%, 12/15/2014 | | 125,000 | 88,281 |
| Principal Amount ($) (a) | Value ($) |
| |
Petrohawk Energy Corp.: |
| 7.25%, 8/15/2018 | | 50,000 | 50,500 |
| 7.875%, 6/1/2015 | | 30,000 | 31,238 |
Plains Exploration & Production Co.: | |
| 7.0%, 3/15/2017 | | 60,000 | 61,650 |
| 7.625%, 6/1/2018 | | 110,000 | 115,775 |
| 8.625%, 10/15/2019 | | 55,000 | 60,225 |
Quicksilver Resources, Inc., 11.75%, 1/1/2016 | | 15,000 | 17,475 |
Range Resources Corp., 6.75%, 8/1/2020 | | 20,000 | 20,625 |
Regency Energy Partners LP: |
| 6.875%, 12/1/2018 | | 35,000 | 35,438 |
| 9.375%, 6/1/2016 | | 115,000 | 126,212 |
Reliance Holdings USA, Inc., 144A, 4.5%, 10/19/2020 | | 250,000 | 238,538 |
Sabine Pass LNG LP: |
| 7.25%, 11/30/2013 | | 115,000 | 111,837 |
| 7.5%, 11/30/2016 | | 100,000 | 93,750 |
SandRidge Energy, Inc., 8.625%, 4/1/2015 (PIK) | | 25,000 | 25,594 |
Southwestern Energy Co., 7.5%, 2/1/2018 | | 85,000 | 95,837 |
Stone Energy Corp.: |
| 6.75%, 12/15/2014 | | 95,000 | 92,625 |
| 8.625%, 2/1/2017 | | 25,000 | 25,375 |
Transocean, Inc., 6.5%, 11/15/2020 | | 360,000 | 382,218 |
Valero Energy Corp., 6.125%, 2/1/2020 | | 160,000 | 169,931 |
Williams Partners LP, 4.125%, 11/15/2020 | | 190,000 | 179,966 |
| 5,621,630 |
Financials 16.7% |
Algoma Acquisition Corp., 144A, 9.875%, 6/15/2015 | | 125,000 | 112,500 |
Ally Financial, Inc.: |
| 144A, 6.25%, 12/1/2017 | | 95,000 | 95,000 |
| 6.875%, 9/15/2011 | | 297,000 | 305,167 |
| 7.0%, 2/1/2012 | | 185,000 | 191,475 |
| 7.25%, 3/2/2011 | | 455,000 | 457,275 |
| 144A, 7.5%, 9/15/2020 | | 120,000 | 125,850 |
| 8.0%, 3/15/2020 | | 115,000 | 125,637 |
| 8.0%, 11/1/2031 | | 75,000 | 80,813 |
| 8.3%, 2/12/2015 | | 35,000 | 38,500 |
American International Group, Inc., Series G, 5.6%, 10/18/2016 | | 290,000 | 298,757 |
Antero Resources Finance Corp., 9.375%, 12/1/2017 | | 10,000 | 10,463 |
Ashton Woods USA LLC, 144A, Step-up Coupon, 0% to 6/30/2012, 11.0% to 6/30/2015 | | 75,400 | 41,847 |
Barclays Bank PLC: |
| 5.125%, 1/8/2020 | | 145,000 | 148,082 |
| 5.14%, 10/14/2020 | | 185,000 | 166,453 |
BBVA Bancomer SA, 144A, 7.25%, 4/22/2020 | | 115,000 | 121,647 |
Blue Acquisition Sub, Inc., 144A, 9.875%, 10/15/2018 | | 30,000 | 31,950 |
BP Capital Markets PLC, 4.5%, 10/1/2020 | | 120,000 | 119,711 |
Bumble Bee Acquisition Corp., 144A, 9.0%, 12/15/2017 | | 130,000 | 135,200 |
| Principal Amount ($) (a) | Value ($) |
| |
Calpine Construction Finance Co., LP, 144A, 8.0%, 6/1/2016 | | 120,000 | 127,500 |
Case New Holland, Inc., 7.75%, 9/1/2013 | | 45,000 | 48,375 |
CIT Group, Inc.: |
| 7.0%, 5/1/2013 | | 80,000 | 81,600 |
| 7.0%, 5/1/2015 | | 105,970 | 106,235 |
| 7.0%, 5/1/2017 | | 355,000 | 355,887 |
Citigroup Funding, Inc., 5.0%, 4/7/2013 | | 295,000 | 295,000 |
Credit Agricole SA, 144A, 3.5%, 4/13/2015 | | 171,000 | 172,136 |
Discover Bank, 7.0%, 4/15/2020 | | 145,000 | 155,881 |
Dunkin Finance Corp., 144A, 9.625%, 12/1/2018 | | 45,000 | 45,450 |
E*TRADE Financial Corp., 7.375%, 9/15/2013 | | 120,000 | 119,400 |
Express LLC, 8.75%, 3/1/2018 | | 45,000 | 47,813 |
FCE Bank PLC, 9.375%, 1/17/2014 | EUR | 100,000 | 148,663 |
Ford Motor Credit Co., LLC: |
| 7.25%, 10/25/2011 | | 60,000 | 62,013 |
| 7.375%, 2/1/2011 | | 45,000 | 45,135 |
| 7.5%, 8/1/2012 | | 500,000 | 531,604 |
| 9.875%, 8/10/2011 | | 145,000 | 150,936 |
GE Capital European Funding, 4.25%, 3/1/2017 | EUR | 290,000 | 393,485 |
GenOn Escrow Corp., 144A, 9.5%, 10/15/2018 | | 25,000 | 24,844 |
Giraffe Acquisition Corp., 144A, 9.125%, 12/1/2018 | | 55,000 | 57,338 |
Hartford Financial Services Group, Inc., 5.5%, 3/30/2020 | | 290,000 | 294,181 |
Hellas Telecommunications Finance SCA, 144A, 8.985%, 7/15/2015 (PIK)* | EUR | 109,187 | 88 |
Hexion US Finance Corp., 8.875%, 2/1/2018 | | 340,000 | 363,375 |
Hospitality Properties Trust, (REIT), 7.875%, 8/15/2014 | | 200,000 | 221,218 |
Host Hotels & Resorts LP, (REIT), 6.875%, 11/1/2014 | | 165,000 | 169,950 |
HSBC Finance Corp., 144A, 6.676%, 1/15/2021 | | 120,000 | 121,234 |
Hutchison Whampoa Finance 09 Ltd., 4.75%, 11/14/2016 | EUR | 150,000 | 208,874 |
Intergas Finance BV, REG S, 6.875%, 11/4/2011 | | 275,000 | 285,312 |
International Finance Corp., 5.75%, 3/16/2015 | AUD | 285,000 | 289,497 |
International Lease Finance Corp.: | |
| 144A, 8.625%, 9/15/2015 | | 40,000 | 43,000 |
| 144A, 8.75%, 3/15/2017 | | 180,000 | 193,050 |
iPayment, Inc., 9.75%, 5/15/2014 | | 45,000 | 42,300 |
Lincoln National Corp., 7.0%, 6/15/2040 | | 290,000 | 315,367 |
Lloyds TSB Bank PLC, 144A, 6.5%, 9/14/2020 | | 290,000 | 266,809 |
Manulife Financial Corp., 4.9%, 9/17/2020 | | 290,000 | 275,987 |
Morgan Stanley, 3.45%, 11/2/2015 | | 220,000 | 214,490 |
| Principal Amount ($) (a) | Value ($) |
| |
Navios Maritime Acquisition Corp., 144A, 8.625%, 11/1/2017 | | 25,000 | 25,563 |
Nielsen Finance LLC: |
| Step-up Coupon, 0% to 8/1/2011, 12.5% to 8/1/2016 | | 45,000 | 47,250 |
| 144A, 7.75%, 10/15/2018 | | 25,000 | 25,875 |
| 11.5%, 5/1/2016 | | 20,000 | 23,100 |
Nomura Holdings, Inc., 6.7%, 3/4/2020 | | 90,000 | 96,326 |
Nuveen Investments, Inc., 10.5%, 11/15/2015 | | 130,000 | 132,925 |
OMEGA Healthcare Investors, Inc., 144A, (REIT), 6.75%, 10/15/2022 | | 55,000 | 54,519 |
Pacific Life Global Funding, 144A, 3.32%***, 2/6/2016 | | 386,000 | 382,580 |
Pinafore LLC, 144A, 9.0%, 10/1/2018 | | 40,000 | 43,200 |
Pinnacle Foods Finance LLC: |
| 8.25%, 9/1/2017 | | 70,000 | 71,575 |
| 9.25%, 4/1/2015 | | 35,000 | 36,444 |
PNC Bank NA, 6.875%, 4/1/2018 | | 180,000 | 205,751 |
Prudential Financial, Inc., 4.5%, 11/15/2020 | | 135,000 | 132,023 |
Qtel International Finance Ltd., 144A, 4.75%, 2/16/2021 | | 200,000 | 190,814 |
Rainbow National Services LLC, 144A, 10.375%, 9/1/2014 | | 13,000 | 13,488 |
Reynolds Group Issuer, Inc.: |
| 144A, 7.125%, 4/15/2019 | | 100,000 | 101,750 |
| 144A, 8.5%, 5/15/2018 | | 195,000 | 195,975 |
| 144A, 9.0%, 4/15/2019 | | 105,000 | 108,806 |
Roadhouse Financing, Inc., 144A, 10.75%, 10/15/2017 | | 40,000 | 43,200 |
Santander US Debt SA Unipersonal, 144A, 3.724%, 1/20/2015 | | 145,000 | 137,382 |
SLM Corp., 8.0%, 3/25/2020 | | 25,000 | 25,348 |
Societe Generale, 144A, 3.5%, 1/15/2016 | | 290,000 | 285,645 |
Sprint Capital Corp.: |
| 7.625%, 1/30/2011 | | 50,000 | 50,125 |
| 8.375%, 3/15/2012 | | 135,000 | 142,762 |
Susser Holdings LLC, 8.5%, 5/15/2016 | | 30,000 | 32,175 |
Telecom Italia Capital SA, 4.95%, 9/30/2014 | | 174,000 | 178,270 |
Toys "R" Us Property Co. I, LLC, 10.75%, 7/15/2017 | | 50,000 | 57,000 |
Tropicana Entertainment LLC, 9.625%, 12/15/2014** | | 150,000 | 77 |
UCI Holdco, Inc., 9.25%***, 12/15/2013 (PIK) | | 83,525 | 83,316 |
Ventas Realty LP, (REIT), 3.125%, 11/30/2015 | | 95,000 | 91,531 |
Virgin Media Finance PLC, Series 1, 9.5%, 8/15/2016 | | 300,000 | 339,000 |
Virgin Media Secured Finance PLC, 6.5%, 1/15/2018 | | 375,000 | 394,687 |
WMG Acquisition Corp., 9.5%, 6/15/2016 | | 45,000 | 48,263 |
| 12,677,099 |
| Principal Amount ($) (a) | Value ($) |
| |
Health Care 3.8% |
Celgene Corp., 3.95%, 10/15/2020 | | 170,000 | 161,625 |
Community Health Systems, Inc., 8.875%, 7/15/2015 | | 80,000 | 84,000 |
DaVita, Inc.: |
| 6.375%, 11/1/2018 | | 20,000 | 19,900 |
| 6.625%, 11/1/2020 | | 20,000 | 19,800 |
Genzyme Corp., 5.0%, 6/15/2020 | | 155,000 | 162,729 |
Hanger Orthopedic Group, Inc., 7.125%, 11/15/2018 | | 25,000 | 24,937 |
HCA Holdings, Inc., 144A, 7.75%, 5/15/2021 | | 105,000 | 105,000 |
HCA, Inc.: |
| 7.875%, 2/15/2020 | | 365,000 | 390,550 |
| 8.5%, 4/15/2019 | | 45,000 | 49,275 |
| 9.125%, 11/15/2014 | | 155,000 | 162,556 |
| 9.25%, 11/15/2016 | | 310,000 | 330,731 |
| 9.625%, 11/15/2016 (PIK) | | 152,000 | 162,830 |
IASIS Healthcare LLC, 8.75%, 6/15/2014 | | 95,000 | 97,494 |
Laboratory Corp. of America Holdings, 4.625%, 11/15/2020 | | 215,000 | 213,061 |
Life Technologies Corp., 6.0%, 3/1/2020 | | 215,000 | 230,294 |
Mylan, Inc., 144A, 7.875%, 7/15/2020 | | 15,000 | 16,163 |
The Cooper Companies, Inc., 7.125%, 2/15/2015 | | 95,000 | 97,850 |
Valeant Pharmaceuticals International: | |
| 144A, 6.75%, 10/1/2017 | | 40,000 | 39,800 |
| 144A, 7.0%, 10/1/2020 | | 65,000 | 64,187 |
Vanguard Health Holding Co. II, LLC: | |
| 8.0%, 2/1/2018 | | 55,000 | 56,375 |
| 144A, 8.0%, 2/1/2018 | | 45,000 | 45,900 |
Warner Chilcott Co., LLC, 144A, 7.75%, 9/15/2018 | | 75,000 | 75,750 |
Watson Pharmaceuticals, Inc., 6.125%, 8/15/2019 | | 220,000 | 243,615 |
| 2,854,422 |
Industrials 4.6% |
Accuride Corp., 144A, 9.5%, 8/1/2018 | | 75,000 | 81,187 |
Actuant Corp., 6.875%, 6/15/2017 | | 40,000 | 40,900 |
AMGH Merger Sub, Inc., 144A, 9.25%, 11/1/2018 | | 30,000 | 31,500 |
ARAMARK Corp., 8.5%, 2/1/2015 | | 20,000 | 20,900 |
Armored Autogroup, Inc., 144A, 9.25%, 11/1/2018 | | 105,000 | 104,212 |
ArvinMeritor, Inc.: |
| 8.125%, 9/15/2015 | | 55,000 | 57,544 |
| 10.625%, 3/15/2018 | | 60,000 | 67,500 |
BE Aerospace, Inc.: |
| 6.875%, 10/1/2020 | | 35,000 | 36,138 |
| 8.5%, 7/1/2018 | | 105,000 | 114,975 |
Belden, Inc.: |
| 7.0%, 3/15/2017 | | 45,000 | 45,563 |
| 9.25%, 6/15/2019 | | 40,000 | 43,850 |
Bombardier, Inc., 144A, 7.75%, 3/15/2020 | | 55,000 | 59,262 |
| Principal Amount ($) (a) | Value ($) |
| |
Briggs & Stratton Corp., 6.875%, 12/15/2020 | | 35,000 | 35,700 |
Cenveo Corp.: |
| 8.875%, 2/1/2018 | | 100,000 | 96,750 |
| 144A, 10.5%, 8/15/2016 | | 55,000 | 54,038 |
Clean Harbors, Inc., 7.625%, 8/15/2016 | | 32,000 | 34,000 |
Congoleum Corp., 9.0%, 12/31/2017 (PIK) | | 41,250 | 28,437 |
Corrections Corp. of America, 7.75%, 6/1/2017 | | 30,000 | 31,838 |
DynCorp International, Inc., 144A, 10.375%, 7/1/2017 | | 85,000 | 87,125 |
FTI Consulting, Inc., 144A, 6.75%, 10/1/2020 | | 145,000 | 143,912 |
Garda World Security Corp., 144A, 9.75%, 3/15/2017 | | 60,000 | 64,350 |
Great Lakes Dredge & Dock Co., 7.75%, 12/15/2013 | | 50,000 | 50,438 |
Hutchison Whampoa International 09/19 Ltd., 144A, 5.75%, 9/11/2019 | | 225,000 | 240,956 |
Interline Brands, Inc., 144A, 7.0%, 11/15/2018 | | 50,000 | 50,750 |
K. Hovnanian Enterprises, Inc., 8.875%, 4/1/2012 | | 55,000 | 53,900 |
Kansas City Southern de Mexico SA de CV: | |
| 7.375%, 6/1/2014 | | 115,000 | 120,175 |
| 8.0%, 2/1/2018 | | 105,000 | 113,662 |
Kansas City Southern Railway Co., 8.0%, 6/1/2015 | | 100,000 | 107,500 |
Masco Corp., 7.125%, 3/15/2020 | | 145,000 | 151,689 |
Navios Maritime Holdings, Inc., 9.5%, 12/15/2014 | | 75,000 | 78,000 |
Oshkosh Corp.: |
| 8.25%, 3/1/2017 | | 10,000 | 10,875 |
| 8.5%, 3/1/2020 | | 25,000 | 27,438 |
Owens Corning, Inc., 9.0%, 6/15/2019 | | 217,000 | 254,583 |
Ply Gem Industries, Inc., 13.125%, 7/15/2014 | | 95,000 | 100,937 |
RailAmerica, Inc., 9.25%, 7/1/2017 | | 36,000 | 39,555 |
RBS Global & Rexnord Corp., 8.5%, 5/1/2018 | | 120,000 | 127,500 |
Sitel LLC, 144A, 11.5%, 4/1/2018 | | 95,000 | 78,375 |
Spirit AeroSystems Holdings, Inc., 144A, 6.75%, 12/15/2020 | | 75,000 | 75,187 |
SPX Corp., 144A, 6.875%, 9/1/2017 | | 20,000 | 21,250 |
Textron, Inc., 7.25%, 10/1/2019 | | 145,000 | 166,163 |
Titan International, Inc., 144A, 7.875%, 10/1/2017 | | 160,000 | 168,800 |
TransDigm, Inc., 144A, 7.75%, 12/15/2018 | | 65,000 | 67,275 |
Tutor Perini Corp., 144A, 7.625%, 11/1/2018 | | 55,000 | 55,275 |
USG Corp., 144A, 9.75%, 8/1/2014 | | 45,000 | 47,475 |
| 3,487,439 |
| Principal Amount ($) (a) | Value ($) |
| |
Information Technology 2.5% |
Alcatel-Lucent USA, Inc., 6.45%, 3/15/2029 | | 70,000 | 55,300 |
Allen Systems Group, Inc., 144A, 10.5%, 11/15/2016 | | 35,000 | 35,263 |
Amkor Technology, Inc., 7.375%, 5/1/2018 | | 45,000 | 46,800 |
Aspect Software, Inc., 144A, 10.625%, 5/15/2017 | | 60,000 | 61,575 |
CDW LLC, 11.0%, 10/12/2015 | | 155,000 | 160,812 |
Equinix, Inc., 8.125%, 3/1/2018 | | 120,000 | 125,400 |
Fidelity National Information Services, Inc.: | |
| 144A, 7.625%, 7/15/2017 | | 20,000 | 21,050 |
| 144A, 7.875%, 7/15/2020 | | 25,000 | 26,438 |
First Data Corp., 144A, 8.875%, 8/15/2020 | | 85,000 | 89,675 |
Freescale Semiconductor, Inc., 144A, 9.25%, 4/15/2018 | | 265,000 | 291,500 |
Jabil Circuit, Inc., 7.75%, 7/15/2016 | | 30,000 | 33,675 |
L-3 Communications Corp.: |
| 5.875%, 1/15/2015 | | 105,000 | 106,969 |
| Series B, 6.375%, 10/15/2015 | | 80,000 | 82,400 |
MasTec, Inc., 7.625%, 2/1/2017 | | 65,000 | 64,675 |
NXP BV, 3.039%***, 10/15/2013 | | 150,000 | 147,750 |
SunGard Data Systems, Inc.: |
| 144A, 7.375%, 11/15/2018 | | 25,000 | 25,125 |
| 10.25%, 8/15/2015 | | 225,000 | 236,531 |
Unisys Corp., 144A, 12.75%, 10/15/2014 | | 80,000 | 94,600 |
Vangent, Inc., 9.625%, 2/15/2015 | | 35,000 | 31,675 |
Western Union Co., 6.2%, 6/21/2040 | | 145,000 | 143,446 |
| 1,880,659 |
Materials 8.1% |
Agrium, Inc., 6.125%, 1/15/2041 | | 290,000 | 307,140 |
Albemarle Corp., 4.5%, 12/15/2020 | | 100,000 | 98,422 |
Appleton Papers, Inc., 144A, 11.25%, 12/15/2015 | | 25,000 | 20,000 |
ArcelorMittal, 6.125%, 6/1/2018 | | 250,000 | 266,372 |
Ashland, Inc., 9.125%, 6/1/2017 | | 55,000 | 63,387 |
Ball Corp.: |
| 7.125%, 9/1/2016 | | 30,000 | 32,325 |
| 7.375%, 9/1/2019 | | 25,000 | 26,875 |
Berry Plastics Corp.: |
| 9.5%, 5/15/2018 | | 65,000 | 65,162 |
| 144A, 9.75%, 1/15/2021 | | 80,000 | 79,200 |
Boise Paper Holdings LLC, 8.0%, 4/1/2020 | | 30,000 | 32,100 |
BWAY Parent Co., Inc., 144A, 10.125%, 11/1/2015 (PIK) | | 40,000 | 40,400 |
Celanese US Holdings LLC, 144A, 6.625%, 10/15/2018 | | 35,000 | 36,138 |
Clearwater Paper Corp., 144A, 7.125%, 11/1/2018 | | 65,000 | 67,112 |
Cliffs Natural Resources, Inc., 6.25%, 10/1/2040 | | 290,000 | 282,325 |
Clondalkin Acquisition BV, 144A, 2.302%***, 12/15/2013 | | 75,000 | 71,812 |
| Principal Amount ($) (a) | Value ($) |
| |
Corporacion Nacional del Cobre de Chile, 144A, 3.75%, 11/4/2020 | | 130,000 | 123,180 |
CPG International I, Inc., 10.5%, 7/1/2013 | | 130,000 | 132,600 |
Crown Americas LLC, 7.625%, 5/15/2017 | | 30,000 | 32,250 |
Crown European Holdings SA, 144A, 7.125%, 8/15/2018 | EUR | 50,000 | 69,655 |
Dow Chemical Co.: |
| 8.55%, 5/15/2019 | | 290,000 | 363,442 |
| 9.4%, 5/15/2039 | | 145,000 | 210,457 |
Essar Steel Algoma, Inc., 144A, 9.375%, 3/15/2015 | | 240,000 | 241,500 |
Exopack Holding Corp., 11.25%, 2/1/2014 | | 160,000 | 166,000 |
FMG Resources August 2006 Pty Ltd., 144A, 7.0%, 11/1/2015 | | 25,000 | 25,625 |
GEO Specialty Chemicals, Inc.: |
| 144A, 7.5%, 3/31/2015 (PIK) | | 120,175 | 103,350 |
| 10.0%, 3/31/2015 | | 119,040 | 108,326 |
Georgia-Pacific LLC: |
| 144A, 5.4%, 11/1/2020 | | 145,000 | 143,358 |
| 144A, 7.125%, 1/15/2017 | | 35,000 | 37,275 |
| 144A, 8.25%, 5/1/2016 | | 65,000 | 73,369 |
Graphic Packaging International, Inc.: | |
| 7.875%, 10/1/2018 | | 10,000 | 10,475 |
| 9.5%, 6/15/2017 | | 130,000 | 141,862 |
Greif, Inc., 7.75%, 8/1/2019 | | 195,000 | 213,525 |
Hexcel Corp., 6.75%,
2/1/2015 | | 280,000 | 285,600 |
Huntsman International LLC: |
| 8.625%, 3/15/2020 | | 60,000 | 65,250 |
| 144A, 8.625%, 3/15/2021 | | 25,000 | 27,000 |
International Paper Co., 7.95%, 6/15/2018 | | 145,000 | 172,545 |
Lyondell Chemical Co., 144A, 8.0%, 11/1/2017 | | 100,000 | 110,625 |
Millar Western Forest Products Ltd., 7.75%, 11/15/2013 | | 35,000 | 33,163 |
Momentive Performance Materials, Inc., 144A, 9.0%, 1/15/2021 | | 230,000 | 242,650 |
Nalco Co., 144A, 6.625%, 1/15/2019 | | 45,000 | 46,013 |
NewMarket Corp., 7.125%, 12/15/2016 | | 110,000 | 112,475 |
Novelis, Inc.: |
| 144A, 8.375%, 12/15/2017 | | 140,000 | 144,900 |
| 144A, 8.75%, 12/15/2020 | | 110,000 | 114,125 |
Owens-Brockway Glass Container, Inc., 7.375%, 5/15/2016 | | 110,000 | 116,875 |
Radnor Holdings Corp., 11.0%, 3/15/2010** | | 25,000 | 3 |
Rain CII Carbon LLC, 144A, 8.0%, 12/1/2018 | | 45,000 | 46,125 |
Silgan Holdings, Inc., 7.25%, 8/15/2016 | | 50,000 | 53,250 |
Solo Cup Co., 10.5%, 11/1/2013 | | 170,000 | 177,650 |
Teck Resources Ltd., 4.5%, 1/15/2021 | | 310,000 | 315,181 |
Texas Industries, Inc., 144A, 9.25%, 8/15/2020 | | 75,000 | 79,687 |
| Principal Amount ($) (a) | Value ($) |
| |
United States Steel Corp., 7.375%, 4/1/2020 | | 80,000 | 82,000 |
Viskase Companies, Inc., 144A, 9.875%, 1/15/2018 | | 145,000 | 151,163 |
Wolverine Tube, Inc., 15.0%, 3/31/2012 (PIK)** | | 91,631 | 49,481 |
| 6,110,780 |
Telecommunication Services 7.1% |
American Tower Corp., 4.5%, 1/15/2018 | | 270,000 | 267,642 |
Buccaneer Merger Sub, Inc., 144A, 9.125%, 1/15/2019 | | 25,000 | 25,813 |
CC Holdings GS V LLC, 144A, 7.75%, 5/1/2017 | | 350,000 | 382,375 |
Cincinnati Bell, Inc.: |
| 8.375%, 10/15/2020 | | 180,000 | 172,800 |
| 8.75%, 3/15/2018 | | 170,000 | 159,375 |
Clearwire Communications LLC: | |
| 144A, 12.0%, 12/1/2015 | | 20,000 | 21,550 |
| 144A, 12.0%, 12/1/2017 | | 60,000 | 62,100 |
Cricket Communications, Inc.: |
| 144A, 7.75%, 10/15/2020 | | 250,000 | 238,125 |
| 10.0%, 7/15/2015 | | 100,000 | 107,125 |
Crown Castle International Corp., 9.0%, 1/15/2015 | | 195,000 | 214,987 |
Digicel Group Ltd., 144A, 10.5%, 4/15/2018 | | 100,000 | 110,000 |
Digicel Ltd., 144A, 8.25%, 9/1/2017 | | 300,000 | 307,500 |
ERC Ireland Preferred Equity Ltd., 144A, 8.05%***, 2/15/2017 (PIK) | EUR | 78,745 | 9,538 |
Frontier Communications
Corp.: | |
| 6.25%, 1/15/2013 | | 36,000 | 37,980 |
| 7.875%, 4/15/2015 | | 10,000 | 10,925 |
| 8.25%, 4/15/2017 | | 70,000 | 76,825 |
| 8.5%, 4/15/2020 | | 90,000 | 98,325 |
| 8.75%, 4/15/2022 | | 10,000 | 10,900 |
Grupo Iusacell Celular SA de CV, 10.0%, 3/31/2012** | | 29,280 | 10,834 |
Hughes Network Systems LLC, 9.5%, 4/15/2014 | | 150,000 | 154,687 |
Intelsat Corp., 9.25%, 6/15/2016 | | 380,000 | 410,400 |
Intelsat Jackson Holdings SA: |
| 144A, 7.25%, 10/15/2020 | | 120,000 | 121,200 |
| 11.25%, 6/15/2016 | | 60,000 | 64,650 |
Intelsat Luxembourg SA, 11.5%, 2/4/2017 (PIK) | | 200,000 | 221,000 |
Intelsat Subsidiary Holding Co. SA, 8.875%, 1/15/2015 | | 195,000 | 200,362 |
iPCS, Inc., 2.412%***, 5/1/2013 | | 35,000 | 33,687 |
MetroPCS Wireless, Inc.: |
| 6.625%, 11/15/2020 | | 90,000 | 85,725 |
| 7.875%, 9/1/2018 | | 25,000 | 25,938 |
Nextel Communications, Inc., Series E, 6.875%, 10/31/2013 | | 60,000 | 60,150 |
Qwest Communications International, Inc.: | |
| 144A, 7.125%, 4/1/2018 | | 55,000 | 56,925 |
| 8.0%, 10/1/2015 | | 60,000 | 64,500 |
Qwest Corp., 7.5%, 10/1/2014 | | 285,000 | 319,200 |
| Principal Amount ($) (a) | Value ($) |
| |
SBA Telecommunications, Inc.: |
| 8.0%, 8/15/2016 | | 35,000 | 37,887 |
| 8.25%, 8/15/2019 | | 25,000 | 27,313 |
Sprint Nextel Corp., 8.375%, 8/15/2017 (b) | | 115,000 | 123,337 |
Telefonica Emisiones SAU, 6.421%, 6/20/2016 | | 290,000 | 316,968 |
Telesat Canada, 11.0%, 11/1/2015 | | 180,000 | 202,050 |
Verizon Communications, Inc., 8.95%, 3/1/2039 | | 110,000 | 156,760 |
West Corp.: |
| 144A, 7.875%, 1/15/2019 | | 50,000 | 50,875 |
| 144A, 8.625%, 10/1/2018 | | 15,000 | 15,900 |
Windstream Corp.: |
| 7.0%, 3/15/2019 | | 60,000 | 59,100 |
| 7.875%, 11/1/2017 | | 135,000 | 141,919 |
| 8.125%, 9/1/2018 | | 70,000 | 73,500 |
| 8.625%, 8/1/2016 | | 10,000 | 10,525 |
| 5,359,277 |
Utilities 3.7% |
AES Corp.: |
| 8.0%, 10/15/2017 | | 10,000 | 10,575 |
| 8.0%, 6/1/2020 | | 175,000 | 185,500 |
Calpine Corp.: |
| 144A, 7.5%, 2/15/2021 | | 80,000 | 78,800 |
| 144A, 7.875%, 7/31/2020 | | 95,000 | 96,187 |
Edison Mission Energy, 7.0%, 5/15/2017 | | 65,000 | 51,513 |
Ferrellgas LP, 144A, 6.5%, 5/1/2021 | | 20,000 | 19,500 |
Korea Gas Corp., 144A, 4.25%, 11/2/2020 | | 185,000 | 175,520 |
Mirant Americas Generation LLC, 8.3%, 5/1/2011 | | 230,000 | 233,450 |
Mirant North America LLC, 7.375%, 12/31/2013 | | 60,000 | 61,130 |
NRG Energy, Inc.: |
| 7.25%, 2/1/2014 | | 390,000 | 397,800 |
| 7.375%, 2/1/2016 | | 660,000 | 676,500 |
| 7.375%, 1/15/2017 | | 90,000 | 92,700 |
| 144A, 8.25%, 9/1/2020 | | 85,000 | 87,125 |
Oncor Electric Delivery Co., 144A, 5.25%, 9/30/2040 | | 130,000 | 124,871 |
RRI Energy, Inc., 7.875%, 6/15/2017 | | 25,000 | 24,250 |
San Diego Gas & Electric Co., 6.0%, 6/1/2026 | | 180,000 | 207,521 |
Suburban Propane Partners LP, 7.375%, 3/15/2020 | | 15,000 | 16,013 |
Toledo Edison Co., 7.25%, 5/1/2020 | | 230,000 | 271,872 |
| 2,810,827 |
Total Corporate Bonds (Cost $47,107,385) | 48,428,460 |
|
Mortgage-Backed Securities Pass-Throughs 5.5% |
Federal National Mortgage Association, 4.0%, 10/1/2023 (c) | | 1,000,000 | 1,029,610 |
Government National Mortgage Association, 4.5%, 7/1/2039 (c) | | 3,000,000 | 3,115,078 |
Total Mortgage-Backed Securities Pass-Throughs (Cost $4,088,477) | 4,144,688 |
| Principal Amount ($) (a) | Value ($) |
| |
Commercial Mortgage-Backed Securities 3.1% |
Citigroup Commercial Mortgage Trust, "AMP3", Series 2006-C5, 144A, 5.501%, 10/15/2049 | | 127,595 | 113,277 |
Credit Suisse Mortgage Capital Certificates Trust, "A2", Series 2007-C1, 5.268%, 2/15/2040 | | 814,000 | 826,456 |
CS First Boston Mortgage Securities Corp., "H", Series 2002-CKP1, 144A, 7.191%***, 12/15/2035 | | 290,000 | 286,115 |
JPMorgan Chase Commercial Mortgage Securities Corp.: | |
| "F", Series 2004-LN2, 144A, 5.452%***, 7/15/2041 | | 500,000 | 322,735 |
| "A4", Series 2006-LDP7, 5.872%***, 4/15/2045 | | 140,000 | 153,105 |
LB-UBS Commercial Mortgage Trust, "A3", Series 2006-C7, 5.347%, 11/15/2038 | | 440,000 | 465,194 |
Wachovia Bank Commercial Mortgage Trust, "A4", Series 2005-C22, 5.27%***, 12/15/2044 | | 140,000 | 150,078 |
Total Commercial Mortgage-Backed Securities (Cost $2,338,559) | 2,316,960 |
|
Collateralized Mortgage Obligations 3.5% |
Banc of America Mortgage Securities, "2A2", Series 2004-A, 3.493%***, 2/25/2034 | | 197,420 | 181,352 |
Bear Stearns Adjustable Rate Mortgage Trust, "2A1", Series 2005-11, 3.436%***, 12/25/2035 | | 258,663 | 247,466 |
Citicorp Mortgage Securities, Inc., "1A7", Series 2006-4, 6.0%, 8/25/2036 | | 60,243 | 60,157 |
Countrywide Home Loans, "2A5", Series 2004-13, 5.75%, 8/25/2034 | | 180,689 | 164,321 |
Federal National Mortgage Association, "BI", Series 2010-13, Interest Only, 5.0%, 12/25/2038 | | 445,564 | 63,930 |
Government National Mortgage Association, "XA", Series 2009-118, 5.0%, 12/20/2039 | | 347,329 | 344,906 |
JPMorgan Mortgage Trust, "2A1", Series 2006-A2, 5.72%***, 4/25/2036 | | 711,435 | 655,719 |
Merrill Lynch Mortgage Investors Trust: | |
| "2A1A", Series 2005-A9, 2.7%***, 12/25/2035 | | 119,270 | 119,090 |
| "2A", Series 2003-A6, 3.19%***, 10/25/2033 | | 130,698 | 127,749 |
Morgan Stanley Mortgage Loan Trust, "5A5", Series 2005-4, 5.5%, 8/25/2035 | | 133,860 | 130,053 |
Vericrest Opportunity Loan Transferee, "M", Series 2010-NPL1, 144A, 6.0%, 5/25/2039 | | 149,454 | 146,521 |
| Principal Amount ($) (a) | Value ($) |
| |
Washington Mutual Mortgage Pass-Through Certificates Trust, "1A1", Series 2005-AR12, 2.721%***, 10/25/2035 | | 119,151 | 114,132 |
Wells Fargo Mortgage-Backed Securities Trust: | |
| "A3", Series 2005-4, 5.0%, 4/25/2035 | | 115,095 | 114,565 |
| "A19", Series 2006-11, 6.0%, 9/25/2036 | | 124,533 | 124,412 |
Total Collateralized Mortgage Obligations (Cost $2,503,586) | 2,594,373 |
|
Government & Agency Obligations 17.2% |
Other Government Related (d) 5.3% |
Citibank NA, FDIC Guaranteed, 0.316%***, 5/7/2012 | | 650,000 | 650,528 |
International Bank for Reconstruction & Development, 5.25%***, 4/9/2025 | | 290,000 | 284,461 |
JPMorgan Chase & Co., Series 3, FDIC Guaranteed, 0.553%***, 12/26/2012 | | 232,000 | 233,177 |
Kreditanstalt fuer Wiederaufbau, 1.35%, 1/20/2014 | JPY | 185,000,000 | 2,347,476 |
Pemex Project Funding Master Trust, 5.75%, 3/1/2018 | | 460,000 | 491,826 |
| 4,007,468 |
Sovereign Bonds 7.0% |
Federative Republic of Brazil: |
| 8.875%, 10/14/2019 | | 295,000 | 389,400 |
| 12.5%, 1/5/2016 | BRL | 250,000 | 174,398 |
Government of Canada, 4.5%, 6/1/2015 | CAD | 350,000 | 384,461 |
Republic of Argentina, 5.83%, 12/31/2033 | ARS | 375 | 176 |
Republic of El Salvador, 144A, 7.65%, 6/15/2035 | | 156,000 | 164,970 |
Republic of Lithuania: |
| 144A, 5.125%, 9/14/2017 | | 205,000 | 201,965 |
| 144A, 7.375%, 2/11/2020 | | 195,000 | 215,404 |
Republic of Panama, 9.375%, 1/16/2023 | | 500,000 | 688,750 |
Republic of Peru, 7.35%, 7/21/2025 | | 285,000 | 346,703 |
Republic of Poland, 6.375%, 7/15/2019 | | 345,000 | 386,473 |
Republic of South Africa, 6.875%, 5/27/2019 | | 220,000 | 257,675 |
Republic of Uruguay: |
| 7.625%, 3/21/2036 | | 60,000 | 71,250 |
| 9.25%, 5/17/2017 | | 105,000 | 135,450 |
Republic of Venezuela, 9.25%, 9/15/2027 | | 150,000 | 111,750 |
Russian Federation, REG S, 7.5%, 3/31/2030 | | 478,731 | 553,652 |
United Kingdom Treasury Bond, 3.75%, 9/7/2019 | GBP | 750,000 | 1,206,322 |
| 5,288,799 |
US Government Sponsored Agency 0.1% |
Federal Home Loan Mortgage Corp., 1.125%, 12/15/2011 | | 100,000 | 100,695 |
| Principal Amount ($) (a) | Value ($) |
| |
US Treasury Obligations 4.8% |
US Treasury Bill, 0.185%****, 3/17/2011 (e) | | 99,000 | 98,978 |
US Treasury Bond, 4.375%, 5/15/2040 | | 551,000 | 553,667 |
US Treasury Notes: |
| 0.875%, 2/29/2012 | | 2,250,000 | 2,263,095 |
| 2.625%, 11/15/2020 | | 759,000 | 715,950 |
| 3,631,690 |
Total Government & Agency Obligations (Cost $12,104,046) | 13,028,652 |
|
Loan Participations and Assignments 3.7% |
Senior Loans*** 3.2% |
Buffets, Inc.: |
| Letter of Credit, First Lien, 7.539%, 4/22/2015 (PIK) | | 11,948 | 9,141 |
| Term Loan B, 12.0%, 4/21/2015 (PIK) | | 69,862 | 65,636 |
Burger King Corp., New Term Loan B, 6.25%, 10/19/2016 | | 85,000 | 86,410 |
Charter Communications Operating LLC: | |
| Replacement Term Loan, 2.27%, 3/6/2014 | | 18,104 | 17,904 |
| Term Loan, 3.56%, 9/6/2016 | | 208,149 | 205,287 |
| New Term Loan, 7.25%, 3/6/2014 | | 94,108 | 97,945 |
Clear Channel Communication, Term Loan B, LIBOR plus 3.65%, 1/28/2016 | | 110,000 | 95,920 |
Dunkin' Brands, Inc., Term Loan B, 5.75%, 11/23/2017 | | 70,000 | 70,943 |
Ford Motor Co., Term Loan B1, 3.02%, 12/16/2013 | | 183,850 | 183,803 |
Hawker Beechcraft Acquisition Co., LLC: | |
| Term Loan, 2.261%, 3/26/2014 | | 165,210 | 145,300 |
| Letter of Credit, 2.289%, 3/26/2014 | | 9,903 | 8,709 |
IASIS Healthcare LLC, Term Loan, 5.538%, 6/13/2014 (PIK) | | 109,416 | 105,559 |
Kabel Deutschland GmbH, Term Loan, 8.272%, 11/19/2014 (PIK) | EUR | 93,849 | 126,321 |
Momentive Specialty Chemicals, Inc.: | |
| Term Loan C1, 2.563%, 5/6/2013 | | 114,379 | 112,556 |
| Term Loan C2, 2.563%, 5/6/2013 | | 58,987 | 58,046 |
Nuveen Investments, Inc., First Lien, Term Loan, 3.303%, 11/13/2014 | | 115,000 | 110,137 |
OSI Restaurant Partners LLC: |
| Term Loan, 2.563%, 6/14/2013 | | 11,007 | 10,537 |
| Term Loan B, 2.625%, 6/14/2014 | | 113,924 | 109,062 |
Pinafore LLC, Term Loan B, 6.25%, 9/29/2016 | | 522,909 | 530,918 |
Roundy's Supermarkets, Inc., Second Lien, Term Loan, LIBOR plus 8.0%, 4/18/2016 | | 65,000 | 66,097 |
| Principal Amount ($) (a) | Value ($) |
| |
Syniverse Technologies, Inc., Term Loan B, LIBOR plus 3.75%, 12/21/2017 | | 50,000 | 50,641 |
Tribune Co., Term Loan B, LIBOR plus 3.0%, 6/4/2014** | | 88,875 | 62,124 |
US Foodservice, Inc., Term Loan B, 2.76%, 7/3/2014 | | 84,346 | 77,556 |
VML US Finance LLC: |
| Delayed Draw Term Loan B, 4.8%, 5/25/2012 | | 18,154 | 18,177 |
| Term Loan B, 4.8%, 5/27/2013 | | 31,429 | 31,469 |
| 2,456,198 |
Sovereign Loans 0.5% |
BOM Capital PLC, 144A, 6.699%, 3/11/2015 | | 205,000 | 211,150 |
VTB Bank, 144A, 6.875%, 5/29/2018 | | 145,000 | 153,337 |
| 364,487 |
Total Loan Participations and Assignments (Cost $2,735,317) | 2,820,685 |
|
Preferred Securities 0.7% |
Financials 0.6% |
Capital One Capital VI, 8.875%, 5/15/2040 | | 330,000 | 343,613 |
USB Capital XIII Trust, 6.625%, 12/15/2039 | | 145,000 | 148,107 |
| 491,720 |
Materials 0.1% |
Hercules, Inc., 6.5%, 6/30/2029 | | 95,000 | 73,625 |
Total Preferred Securities (Cost $526,972) | 565,345 |
|
Units
| Value ($) |
| |
Other Investments 0.0% |
Consumer Discretionary |
AOT Bedding Super Holdings LLC* (Cost $4,000) | 4 | 4,000 |
|
Shares
| Value ($) |
| |
Common Stocks 0.0% |
Consumer Discretionary 0.0% |
Buffets Restaurants Holdings, Inc.* | 2,318 | 8,113 |
Dex One Corp.* | 540 | 4,029 |
SuperMedia, Inc.* | 99 | 862 |
Trump Entertainment Resorts, Inc.* | 6 | 109 |
Vertis Holdings, Inc.* | 940 | 0 |
| 13,113 |
|
Shares
| Value ($) |
| |
Industrials 0.0% |
Congoleum Corp.* | 125,000 | 0 |
Quad Graphics, Inc.* | 69 | 2,847 |
| 2,847 |
Materials 0.0% |
GEO Specialty Chemicals, Inc.* | 2,058 | 1,749 |
Total Common Stocks (Cost $279,466) | 17,709 |
|
Preferred Stock 0.1% |
Financials |
Ally Financial, Inc., Series G, 144A, 7.0% (Cost $100,132) | | 110 | 103,967 |
|
Warrants 0.0% |
Consumer Discretionary 0.0% |
Reader's Digest Association, Inc., Expiration Date 2/19/2014* | 159 | 5 |
Materials 0.0% |
Hercules Trust II, Expiration Date 3/31/2029* | 85 | 967 |
Total Warrants (Cost $17,432) | 972 |
|
Contracts
| Value ($) |
| |
Call Options Purchased 0.0% |
Floating Rate — LIBOR, Effective Date 5/16/2011, Expiration Date 5/16/2012, Cap Rate 3.0% (Cost $54,460) | 14,000,000 | 467 |
|
Shares
| Value ($) |
| |
Securities Lending Collateral 0.2% |
Daily Assets Fund Institutional, 0.27% (f) (g) (Cost $122,734) | 122,734 | 122,734 |
|
Cash Equivalents 5.6% |
Central Cash Management Fund, 0.19% (f) (Cost $4,269,126) | 4,269,126 | 4,269,126 |
| % of Net Assets | Value ($) |
| |
Total Investment Portfolio (Cost $76,251,692)+ | 103.6 | 78,418,138 |
Other Assets and Liabilities, Net | (3.6) | (2,711,284) |
Net Assets | 100.0 | 75,706,854 |
* Non-income producing security.
** Non-income producing security. Issuer has defaulted on the payment of principal or interest or has filed for bankruptcy. The following table represents bonds and senior loans that are in default:
Securities | Coupon | Maturity Date | Principal Amount ($) | Acquisition Cost ($) | Value ($) |
CanWest MediaWorks LP | 9.25% | 8/1/2015 | 50,000 | USD | 50,000 | 8,500 |
Fontainebleau Las Vegas Holdings LLC | 11.0% | 6/15/2015 | 65,000 | USD | 65,225 | 228 |
Grupo Iusacell Celular SA de CV | 10.0% | 3/31/2012 | 29,280 | USD | 27,863 | 10,834 |
Radnor Holdings Corp. | 11.0% | 3/15/2010 | 25,000 | USD | 15,888 | 3 |
Tribune Co. | LIBOR plus 3.0% | 6/4/2014 | 88,875 | USD | 88,819 | 62,124 |
Tropicana Entertainment LLC | 9.625% | 12/15/2014 | 150,000 | USD | 122,979 | 77 |
Vertis, Inc. | 13.5% | 4/1/2014 | 24,348 | USD | 9,890 | 730 |
Wolverine Tube, Inc. | 15.0% | 3/31/2012 | 91,631 | USD | 91,631 | 49,481 |
Young Broadcasting, Inc. | 8.75% | 1/15/2014 | 275,000 | USD | 224,631 | 3 |
| | | | 696,926 | 131,980 |
*** These securities are shown at their current rate as of December 31, 2010. Floating rate securities' yields vary with a designated market index or market rate, such as the coupon-equivalent of the US Treasury bill rate.
**** Annualized yield at time of purchase; not a coupon rate.
+ The cost for federal income tax purposes was $76,320,197. At December 31, 2010, net unrealized appreciation for all securities based on tax cost was $2,097,941. This consisted of aggregate gross unrealized appreciation for all securities in which there was an excess of value over tax cost of $3,741,864 and aggregate gross unrealized depreciation for all securities in which there was an excess of tax cost over value of $1,643,923.
(a) Principal amount stated in US dollars unless otherwise noted.
(b) All or a portion of these securities were on loan (see Notes to Financial Statements). The value of all securities loaned at December 31, 2010 amounted to $116,902, which is 0.2% of net assets.
(c) Delayed delivery security included.
(d) Government-backed debt issued by financial companies or government sponsored enterprises.
(e) At December 31, 2010, this security has been pledged, in whole or in part, to cover initial margin requirements for open futures contracts.
(f) Affiliated fund managed by Deutsche Investment Management Americas Inc. The rate shown is the annualized seven-day yield at period end.
(g) Represents collateral held in connection with securities lending. Income earned by the Fund is net of borrower rebates.
144A: Security exempt from registration under Rule 144A of the Securities Act of 1933. These securities may be resold in transactions exempt from registration, normally to qualified institutional buyers.
FDIC: Federal Deposit Insurance Corp.
Interest Only: Interest Only (IO) bonds represent the "interest only" portion of payments on a pool of underlying mortgages or mortgage-backed securities. IO securities are subject to prepayment risk of the pool of underlying mortgages.
PIK: Denotes that all or a portion of the income is paid in-kind.
REG S: Securities sold under Regulation S may not be offered, sold or delivered within the United States or to, or for the account or benefit of, US persons, except pursuant to an exemption from, or in a transaction not subject to, the registration requirements of the Securities Act of 1933.
REIT: Real Estate Investment Trust
At December 31, 2010, open futures contracts purchased were as follows:
Futures | Currency | Expiration Date | Contracts | Notional Value ($) | Unrealized Appreciation/ (Depreciation) ($) |
10 Year Australian Treasury Bond | AUD | 3/15/2011 | 34 | 3,592,345 | 26,808 |
10 Year US Treasury Note | USD | 3/22/2011 | 47 | 5,660,563 | (153,853) |
2 Year US Treasury Note | USD | 3/31/2011 | 74 | 16,199,063 | 11,578 |
DAX Index | EUR | 3/18/2011 | 1 | 231,414 | (4,326) |
Federal Republic of Germany Euro-Bund | EUR | 3/8/2011 | 7 | 1,172,162 | 10,009 |
Federal Republic of Germany Euro-Schatz | EUR | 3/8/2011 | 5 | 728,317 | (811) |
FTSE 100 Index | GBP | 3/18/2011 | 6 | 551,266 | 5,332 |
Hang Seng Index | HKD | 1/28/2011 | 1 | 148,080 | 1,988 |
IBEX 35 Index | EUR | 1/21/2011 | 1 | 130,837 | (3,337) |
S&P 500 E-Mini Index | USD | 3/18/2011 | 6 | 375,900 | 5,130 |
TOPIX Index | JPY | 3/11/2011 | 3 | 331,075 | 6,577 |
United Kingdom Long Gilt Bond | GBP | 3/29/2011 | 16 | 2,980,748 | (5,477) |
Total net unrealized depreciation | (100,382) |
At December 31, 2010, open futures contracts sold were as follows:
Futures | Currency | Expiration Date | Contracts | Notional Value ($) | Unrealized Appreciation/ (Depreciation) ($) |
10 Year Canadian Government Bond | CAD | 3/22/2011 | 19 | 2,341,989 | (9,848) |
10 Year Japanese Government Bond | JPY | 3/10/2011 | 6 | 10,391,181 | (50,690) |
AEX Index | EUR | 1/21/2011 | 2 | 189,648 | (1,550) |
ASX SPI 200 Index | AUD | 3/17/2011 | 3 | 362,838 | 3,375 |
CAC 40 Index | EUR | 1/21/2011 | 3 | 152,719 | 3,668 |
DJ Euro Stoxx 50 Index | EUR | 3/18/2011 | 11 | 410,698 | 10,437 |
Federal Republic of Germany Euro-Bund | EUR | 3/8/2011 | 42 | 7,032,973 | 45,686 |
FTSE MIB Index | EUR | 3/18/2011 | 2 | 269,999 | 7,416 |
Russell 2000 E-Mini Index | USD | 3/18/2011 | 1 | 78,230 | (865) |
S&P TSX 60 Index | CAD | 3/17/2011 | 1 | 154,300 | (2,547) |
Total net unrealized appreciation | 5,082 |
At December 31, 2010, open written interest rate option contracts were as follows:
Effective/
Expiration Date | Cash Flows Paid | Contract Amount | Strike Rate (%) | Value ($) | Premiums Received ($) | Unrealized Depreciation ($) |
Call Option
5/16/2011
5/16/2012 | 30-year USD Swap Rate — 10-year USD Swap Rate | 29,000,000 | 0.6 | (35,163) | 30,740 | (4,423) |
At December 31, 2010, open credit default swap contracts sold were as follows:
Effective/
Expiration Date | Notional Amount ($) (i) | Fixed Cash Flows Received | Underlying Debt Obligation/Quality Rating (h) | Value ($) | Upfront Payments Paid/ (Received) ($) | Unrealized Appreciation/ (Depreciation) ($) |
9/21/2009
12/20/2014 | 290,0001 | 1.0% | Berkshire Hathaway Finance Corp.,
4.625%, 10/15/2013, AA | (1,114) | (7,340) | 6,226 |
6/21/2010
9/20/2013 | 70,0002 | 5.0% | Ford Motor Co.,
6.5%, 8/1/2018, B | 7,023 | 858 | 6,165 |
6/21/2010
9/20/2015 | 90,0003 | 5.0% | Ford Motor Co.,
6.5%, 8/1/2018, B | 10,162 | (1,604) | 11,766 |
3/22/2010
6/20/2015 | 290,0004 | 1.0% | Freeport-McMoRan Copper & Gold, Inc.,
8.375%, 4/1/2017, BBB- | (138) | (1,646) | 1,508 |
9/20/2010
12/20/2015 | 1,630,0005 | 1.0% | Markit iTraxx SovX
Western Europe | (78,525) | (50,148) | (28,377) |
Total net unrealized depreciation | (2,712) |
(h) The quality ratings represent the lower of Moody's Investors Service, Inc. ("Moody's") or Standard & Poor's Corporation ("S&P") credit ratings and are unaudited.
(i) The maximum potential amount of future undiscounted payments that the Fund could be required to make under a credit default swap contract would be the notional amount of the contract. These potential amounts would be partially offset by any recovery values of the referenced debt obligation or net amounts received from the settlement of buy protection credit default swap contracts entered into by the Fund for the same referenced debt obligation.
At December 31, 2010, open interest rate swaps contracts were as follows:
Effective/ Expiration Date | Notional Amount ($) | Cash Flows Paid by the Fund | Cash Flows Received by the Fund | Value ($) | Upfront Payments Paid ($) | Unrealized Depreciation ($) |
10/27/2010 10/27/2020 | 1,500,0004 | Fixed — 4.12% | Floating — LIBOR | (109,121) | 525 | (109,646) |
11/24/2010
11/24/2020 | 1,300,0006 | Fixed — 3.96% | Floating — LIBOR | (71,822) | 591 | (72,413) |
10/28/2010
10/28/2025 | 140,0004 | Fixed — 4.138% | Floating — LIBOR | (4,412) | — | (4,412) |
11/1/2010
11/1/2025 | 240,0006 | Fixed — 4.292% | Floating — LIBOR | (21,668) | — | (21,668) |
11/12/2010
11/12/2025 | 280,0004 | Fixed — 4.285% | Floating — LIBOR | (8,155) | — | (8,155) |
11/15/2010
11/15/2025 | 280,0006 | Fixed — 4.585% | Floating — LIBOR | (23,555) | — | (23,555) |
11/16/2010
11/16/2025 | 140,0004 | Fixed — 4.584% | Floating — LIBOR | (2,817) | — | (2,817) |
11/19/2010
11/19/2025 | 140,0006 | Fixed — 4.784% | Floating — LIBOR | (11,110) | — | (11,110) |
11/23/2010
11/23/2025 | 70,0004 | Fixed — 4.834% | Floating — LIBOR | (924) | — | (924) |
Total unrealized depreciation | (254,700) |
At December 31, 2010, open total return swap contracts were as follows:
Effective/
Expiration Date | Notional
Amount ($) | Fixed Cash Flows Paid | Reference Entity | Value ($) | Upfront Payment Paid ($) | Unrealized Appreciation ($) |
5/28/2010
6/1/2012 | 2,800,0002 | 0.45% | Global Interest Rate Strategy Index | 4,545 | 1,867 | 2,678 |
Counterparties:
1 JPMorgan Chase Securities, Inc.
2 Citigroup, Inc.
3 Bank of America
4 Morgan Stanley
5 The Goldman Sachs & Co.
6 Barclays Bank PLC
LIBOR: London InterBank Offered Rate
At December 31, 2010, the Fund had the following open forward foreign currency exchange contracts:
Contracts to Deliver | | In Exchange For | | Settlement Date | | Unrealized Appreciation ($) | Counterparty |
EUR | 1,510,000 | | USD | 2,091,391 | | 1/14/2011 | | 69,078 | UBS AG |
USD | 1,740,512 | | CAD | 1,753,000 | | 1/25/2011 | | 21,681 | Bank of New York Mellon Corp. |
USD | 1,325,283 | | NOK | 7,858,000 | | 1/25/2011 | | 19,708 | Bank of New York Mellon Corp. |
USD | 3,376,310 | | AUD | 3,420,000 | | 1/25/2011 | | 109,775 | UBS AG |
USD | 1,413,474 | | SEK | 9,637,000 | | 1/25/2011 | | 18,182 | HSBC Bank USA |
USD | 509,540 | | JPY | 42,741,000 | | 1/25/2011 | | 17,047 | Royal Bank of Scotland PLC |
GBP | 981,000 | | USD | 1,532,749 | | 1/25/2011 | | 3,583 | Royal Bank of Scotland PLC |
Total unrealized appreciation | | | | 259,054 |
Contracts to Deliver | | In Exchange For | | Settlement Date | | Unrealized Depreciation ($) | Counterparty |
CAD | 236,000 | | USD | 235,609 | | 1/14/2011 | | (1,604) | Credit Suisse |
EUR | 200,000 | | USD | 262,132 | | 1/14/2011 | | (5,724) | Morgan Stanley |
EUR | 368,900 | | USD | 488,408 | | 1/20/2011 | | (4,535) | JPMorgan Chase Securities, Inc. |
EUR | 170,000 | | USD | 226,727 | | 1/25/2011 | | (434) | Royal Bank of Scotland PLC |
NZD | 2,974,000 | | USD | 2,212,269 | | 1/25/2011 | | (100,137) | UBS AG |
CHF | 2,415,000 | | USD | 2,514,983 | | 1/25/2011 | | (68,734) | HSBC Bank USA |
GBP | 925,000 | | USD | 1,440,234 | | 2/22/2011 | | (1,967) | Morgan Stanley |
JPY | 195,000,000 | | USD | 2,325,665 | | 2/22/2011 | | (79,250) | Morgan Stanley |
Total unrealized depreciation | | | | (262,385) |
Currency Abbreviations |
ARS Argentine Peso AUD Australian Dollar BRL Brazilian Real CAD Canadian Dollar CHF Swiss Franc EUR Euro GBP British Pound HKD Hong Kong Dollar JPY Japanese Yen NOK Norwegian Krone NZD New Zealand Dollar SEK Swedish Krona USD United States Dollar |
For information on the Fund's policy and additional disclosures regarding option contracts, futures contracts, interest rate swap contracts, credit default swap contracts, total return swap contracts and forward foreign currency exchange contracts, please refer to Note B in the accompanying Notes to Financial Statements.
Fair Value Measurements
Various inputs are used in determining the value of the Fund's investments. These inputs are summarized in three broad levels. Level 1 includes quoted prices in active markets for identical securities. Level 2 includes other significant observable inputs (including quoted prices for similar securities, interest rates, prepayment speeds, and credit risk). Level 3 includes significant unobservable inputs (including the Fund's own assumptions in determining the fair value of investments). The inputs or methodology used for valuing securities are not necessarily an indication of the risk associated with investing in those securities.
The following is a summary of the inputs used as of December 31, 2010 in valuing the Fund's investments. For information on the Fund's policy regarding the valuation of investments, please refer to the Security Valuation section of Note A in the accompanying Notes to Financial Statements.
Assets | Level 1 | Level 2 | Level 3 | Total |
|
Fixed Income Investments (j) | | | | |
Corporate Bonds | $ — | $ 47,884,841 | $ 543,619 | $ 48,428,460 |
Mortgage-Backed Securities Pass-Throughs | — | 4,144,688 | — | 4,144,688 |
Commercial Mortgage-Backed Securities | — | 2,316,960 | — | 2,316,960 |
Collateralized Mortgage Obligations | — | 2,594,373 | — | 2,594,373 |
Government & Agency Obligations | — | 12,645,213 | 284,461 | 12,929,674 |
Loan Participations and Assignments | — | 2,820,685 | — | 2,820,685 |
Preferred Securities | — | 565,345 | — | 565,345 |
Common Stocks | 15,851 | — | 1,858 | 17,709 |
Preferred Stock | — | 103,967 | — | 103,967 |
Warrants | — | — | 972 | 972 |
Other Investments | — | — | 4,000 | 4,000 |
Short-Term Investments | 4,391,860 | 98,978 | — | 4,490,838 |
Derivatives (k) | — | 287,397 | 467 | 287,864 |
Total | $ 4,407,711 | $ 73,462,447 | $ 835,377 | $ 78,705,535 |
Liabilities | | | | |
Derivatives (k) | $ (95,300) | $ (545,462) | $ (35,163) | $ (675,925) |
Total | $ (95,300) | $ (545,462) | $ (35,163) | $ (675,925) |
There have been no significant transfers between Level 1 and Level 2 fair value measurements during the year ended December 31, 2010.
(j) See Investment Portfolio for additional detailed categorizations.
(k) Derivatives include value of open options purchased, unrealized appreciation (depreciation) on open futures contracts, credit default swap contracts, interest rate swap contracts, total return swap contracts, forward foreign currency exchange contracts and written options, at value.
Level 3 Reconciliation
The following is a reconciliation of the Fund's Level 3 investments for which significant unobservable inputs were used in determining value:
| Corporate Bonds | Asset-Backed | Government & Agency Obligations | Loan Participations and Assignments | Common
Stocks |
Balance as of December 31, 2009 | $ 1,399,392 | $ 600,572 | $ — | $ 72,237 | $ 1,749 |
Total realized gain (loss) | — | 57,024 | — | 3,736 | — |
Change in unrealized appreciation (depreciation) | 141,636 | (25,710) | (5,539) | 7,898 | (12) |
Amortization premium/ discount | 16,809 | — | — | 407 | — |
Net purchases (sales) | (1,000,000) | (631,886) | 290,000 | (84,278) | 121 |
Transfers into Level 3 | 8,402 (l) | — | — | — | — |
Transfers (out) of Level 3 | (22,620) (m) | — | — | — | — |
Balance as of December 31, 2010 | $ 543,619 | $ — | $ 284,461 | $ — | $ 1,858 |
Net change in unrealized appreciation (depreciation) from investments still held as of December 31, 2010 | $ (59,208) | $ — | $ (5,539) | $ — | $ (12) |
| Warrants | Convertible Preferred Stocks | Call Options Purchased | Other Investments | Total | Written Options |
Balance as of December 31, 2009 | $ 625 | $ 0 | $ — | $ — | $ 2,074,575 | $ — |
Total realized gain (loss) | — | (4,191) | — | — | 56,569 | — |
Change in unrealized appreciation (depreciation) | 347 | 4,191 | (53,993) | 0 | 68,818 | (4,423) |
Amortization premium/ discount | — | — | — | — | 17,216 | — |
Net purchases (sales) | — | 0 | 54,460 | 4,000 | (1,367,583) | (30,740) |
Transfers into Level 3 | — | — | — | — | 8,402 | — |
Transfers (out) of Level 3 | — | — | — | — | (22,620) | — |
Balance as of December 31, 2010 | $ 972 | $ — | $ 467 | $ 4,000 | $ 835,377 | $ (35,163) |
Net change in unrealized appreciation (depreciation) from investments still held as of December 31, 2010 | $ 972 | $ — | $ (53,993) | $ 0 | $ (117,780) | $ (4,423) |
Transfers between price levels are recognized at the beginning of the reporting period.
(l) The investment was transferred from Level 2 to Level 3 because of the lack of observable market data due to a decrease in market activity.
(m) The investment was transferred from Level 3 to Level 2 as a result of the availability of a pricing source supported by observable inputs.
The accompanying notes are an integral part of the financial statements.
Statement of Assets and Liabilities
as of December 31, 2010 |
Assets |
Investments: Investments in unaffiliated securities, at value (cost $71,859,832) — including $116,902 of securities loaned | $ 74,026,278 |
Investment in Daily Assets Fund Institutional (cost $122,734)* | 122,734 |
Investment in Central Cash Management Fund (cost $4,269,126) | 4,269,126 |
Total investments, at value (cost $76,251,692) | 78,418,138 |
Cash | 185,479 |
Foreign currency, at value (cost $122,513) | 124,704 |
Deposit with brokers for open futures contracts | 918,646 |
Receivable for investments sold | 104,426 |
Interest receivable | 1,081,310 |
Upfront payments paid on swaps | 3,841 |
Unrealized appreciation on open swap contracts | 28,343 |
Unrealized appreciation on open forward foreign currency exchange contracts | 259,054 |
Foreign taxes recoverable | 4,684 |
Other assets | 447 |
Total assets | 81,129,072 |
Liabilities |
Payable for investments purchased | 280,508 |
Payable for investments purchased — delayed delivery securities | 4,097,602 |
Payable upon return of securities loaned | 122,734 |
Payable for daily variation margin on open futures contracts | 86,632 |
Payable for Fund shares redeemed | 64,777 |
Options written, at value (premiums received $30,740) | 35,163 |
Upfront payments received on swaps | 60,738 |
Unrealized depreciation on open swap contracts | 283,077 |
Unrealized depreciation on open forward foreign currency exchange contracts | 262,385 |
Accrued management fee | 19,509 |
Other accrued expenses and payables | 109,093 |
Total liabilities | 5,422,218 |
Net assets, at value | $ 75,706,854 |
Net Assets Consist of |
Undistributed net investment income | 4,058,018 |
Net unrealized appreciation (depreciation) on: Investments | 2,166,446 |
Swap contracts | (254,734) |
Written options | (4,423) |
Futures | (95,300) |
Foreign currency | 8,924 |
Accumulated net realized gain (loss) | (944,838) |
Paid-in capital | 70,772,761 |
Net assets, at value | $ 75,706,854 |
Class A Net Asset Value, offering and redemption price per share ($75,706,854 ÷ 6,329,747 outstanding shares of beneficial interest, no par value, unlimited number of shares authorized) | $ 11.96 |
* Represents collateral on securities loaned.
The accompanying notes are an integral part of the financial statements.
Statement of Operations
for the year ended December 31, 2010 |
Investment Income |
Income: Interest (net of foreign taxes withheld of $164) | $ 4,821,293 |
Income distributions — Central Cash Management Fund | 10,113 |
Securities lending income, including income from Daily Assets Fund Institutional, net of borrower rebates | 2,499 |
Total income | 4,833,905 |
Expenses: Management fee | 410,735 |
Administration fee | 74,679 |
Services to shareholders | 1,730 |
Custodian fee | 70,329 |
Legal fees | 17,266 |
Audit and tax fees | 66,284 |
Trustees' fees and expenses | 5,347 |
Reports to shareholders | 17,398 |
Other | 42,290 |
Total expenses before expense reductions | 706,058 |
Expense reductions | (67,414) |
Total expenses after expense reductions | 638,644 |
Net investment income (loss) | 4,195,261 |
Realized and Unrealized Gain (Loss) |
Net realized gain (loss) from: Investments | 1,957,117 |
Swap contracts | (37,558) |
Futures | 59,063 |
Foreign currency | 404,118 |
| 2,382,740 |
Change in net unrealized appreciation (depreciation) on: Investments | 1,121,385 |
Swap contracts | (309,862) |
Written options | (4,423) |
Futures | (1,691) |
Foreign currency | (282,893) |
| 522,516 |
Net gain (loss) | 2,905,256 |
Net increase (decrease) in net assets resulting from operations | $ 7,100,517 |
The accompanying notes are an integral part of the financial statements.
Statement of Changes in Net Assets
Increase (Decrease) in Net Assets | Years Ended December 31, |
2010 | 2009 |
Operations: Net investment income | $ 4,195,261 | $ 4,244,300 |
Net realized gain (loss) | 2,382,740 | 564,606 |
Change in net unrealized appreciation (depreciation) | 522,516 | 9,572,764 |
Net increase (decrease) in net assets resulting from operations | 7,100,517 | 14,381,670 |
Distributions to shareholders from: Net investment income: Class A | (4,806,010) | (3,708,667) |
Fund share transactions: Class A Proceeds from shares sold | 11,245,997 | 9,943,530 |
Shares converted* | — | 44,195 |
Reinvestment of distributions | 4,806,010 | 3,708,667 |
Payments for shares redeemed | (16,514,815) | (23,212,559) |
Net increase (decrease) in net assets from Class A share transactions | (462,808) | (9,516,167) |
Class B Shares converted* | — | (44,195) |
Payments for shares redeemed | — | (151) |
Net increase (decrease) in net assets from Class B share transactions | — | (44,346) |
Increase (decrease) in net assets | 1,831,699 | 1,112,490 |
Net assets at beginning of period | 73,875,155 | 72,762,665 |
Net assets at end of period (including undistributed net investment income of $4,058,018 and $4,333,267, respectively) | $ 75,706,854 | $ 73,875,155 |
Other Information |
Class A Shares outstanding at beginning of period | 6,362,456 | 7,250,530 |
Shares sold | 957,272 | 943,043 |
Shares converted* | — | 4,547 |
Shares issued to shareholders in reinvestment of distributions | 420,473 | 392,867 |
Shares redeemed | (1,410,454) | (2,228,531) |
Net increase (decrease) in Class A shares | (32,709) | (888,074) |
Shares outstanding at end of period | 6,329,747 | 6,362,456 |
Class B Shares outstanding at beginning of period | — | 4,594 |
Shares converted* | — | (4,579) |
Shares redeemed | — | (15) |
Net increase (decrease) in Class B shares | — | (4,594) |
Shares outstanding at end of period | — | — |
* On March 6, 2009, Class B shares converted into Class A shares.
The accompanying notes are an integral part of the financial statements.
Financial Highlights
Class A Years Ended December 31, | 2010 | 2009 | 2008 | 2007 | 2006 |
Selected Per Share Data |
Net asset value, beginning of period | $ 11.61 | $ 10.03 | $ 11.70 | $ 11.80 | $ 11.50 |
Income (loss) from investment operations: Net investment incomea | .66 | .63 | .55 | .63 | .62 |
Net realized and unrealized gain (loss) | .47 | 1.50 | (1.38) | (.01) | .36 |
Total from investment operations | 1.13 | 2.13 | (.83) | .62 | .98 |
Less distributions from: Net investment income | (.78) | (.55) | (.69) | (.72) | (.57) |
Net realized gains | — | — | (.15) | — | (.11) |
Total distributions | (.78) | (.55) | (.84) | (.72) | (.68) |
Net asset value, end of period | $ 11.96 | $ 11.61 | $ 10.03 | $ 11.70 | $ 11.80 |
Total Return (%) | 10.05b | 22.73b | (7.75)b | 5.43b | 8.98 |
Ratios to Average Net Assets and Supplemental Data |
Net assets, end of period ($ millions) | 76 | 74 | 73 | 100 | 86 |
Ratio of expenses before expense reductions (%) | .95 | .86 | .89 | .84 | .85 |
Ratio of expenses after expense reductions (%) | .86 | .80 | .87 | .83 | .85 |
Ratio of net investment income (%) | 5.62 | 5.96 | 5.06 | 5.50 | 5.47 |
Portfolio turnover rate (%) | 167 | 370 | 234 | 147 | 143 |
a Based on average shares outstanding during the period. b Total return would have been lower had certain expenses not been reduced. |
Performance Summary December 31, 2010
DWS Strategic Value VIP
All performance shown is historical, assumes reinvestment of all dividend and capital gain distributions and does not guarantee future results. Investment return and principal value fluctuate with changing market conditions so that, when redeemed, shares may be worth more or less than their original cost. Current performance may be lower or higher than the performance data quoted. Please contact your participating insurance company for the Fund's most recent month-end performance. Performance doesn't reflect charges and fees ("contract charges") associated with the separate account that invests in the Fund or any variable life insurance policy or variable annuity contract for which the Fund is an investment option. These charges and fees will reduce returns. While all share classes have the same underlying portfolio, their performance will differ.
The gross expense ratios of the Fund, as stated in the fee table of the prospectus dated May 1, 2010 are 0.80% and 1.11% for Class A and Class B shares, respectively, and may differ from the expense ratios disclosed in the Financial Highlights tables in this report.
Risk Considerations
Investing in derivatives entails special risks relating to liquidity, leverage and credit that may reduce returns and/or increase volatility. Stocks may decline in value. See the prospectus for details.
Fund returns for all periods shown reflect a fee waiver and/or expense reimbursement. Without this waiver/reimbursement, returns would have been lower.
Growth of an Assumed $10,000 Investment in DWS Strategic Value VIP |
[] DWS Strategic Value VIP — Class A [] S&P 500® Index | The Standard & Poor's 500® (S&P 500) Index is an unmanaged, capitalization-weighted index of 500 stocks. The index is designed to measure performance of the broad domestic economy through changes in the aggregate market value of 500 stocks representing all major industries. Index returns assume reinvestment of dividends and, unlike fund returns, do not reflect any fees or expenses. It is not possible to invest directly into an index. |
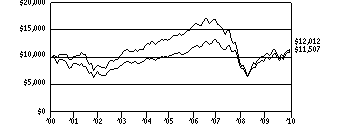 | |
Yearly periods ended December 31 | |
Comparative Results |
DWS Strategic Value VIP | 1-Year | 3-Year | 5-Year | 10-Year |
Class A | Growth of $10,000 | $11,252 | $7,617 | $8,875 | $12,012 |
Average annual total return | 12.52% | -8.68% | -2.36% | 1.85% |
S&P 500 Index | Growth of $10,000 | $11,506 | $9,168 | $11,199 | $11,507 |
Average annual total return | 15.06% | -2.86% | 2.29% | 1.41% |
DWS Strategic Value VIP | 1-Year | 3-Year | 5-Year | Life of Class* |
Class B | Growth of $10,000 | $11,213 | $7,543 | $8,721 | $12,809 |
Average annual total return | 12.13% | -8.97% | -2.70% | 2.95% |
S&P 500 Index | Growth of $10,000 | $11,506 | $9,168 | $11,199 | $15,038 |
Average annual total return | 15.06% | -2.86% | 2.29% | 4.92% |
The growth of $10,000 is cumulative.
* The Fund commenced offering Class B shares on July 1, 2002. Index returns began on June 30, 2002.
Information About Your Fund's Expenses
DWS Strategic Value VIP
As an investor of the Fund, you incur two types of costs: ongoing expenses and transaction costs. Ongoing expenses include management fees, distribution and service (12b-1) fees and other Fund expenses. Examples of transaction costs include contract charges, redemption fees and account maintenance fees, which are not shown in this section. The following tables are intended to help you understand your ongoing expenses (in dollars) of investing in the Fund and to help you compare these expenses with the ongoing expenses of investing in other mutual funds. The example in the table is based on an investment of $1,000 invested at the beginning of the six-month period and held for the entire period (July 1, 2010 to December 31, 2010).
The tables illustrate your Fund's expenses in two ways:
• Actual Fund Return. This helps you estimate the actual dollar amount of ongoing expenses (but not transaction costs) paid on a $1,000 investment in the Fund using the Fund's actual return during the period. To estimate the expenses you paid over the period, simply divide your account value by $1,000 (for example, an $8,600 account value divided by $1,000 = 8.6), then multiply the result by the number in the "Expenses Paid per $1,000" line under the share class you hold.
• Hypothetical 5% Fund Return. This helps you to compare your Fund's ongoing expenses (but not transaction costs) with those of other mutual funds using the Fund's actual expense ratio and a hypothetical rate of return of 5% per year before expenses. Examples using a 5% hypothetical Fund return may be found in the shareholder reports of other mutual funds. The hypothetical account values and expenses may not be used to estimate the actual ending account balance or expenses you paid for the period.
Please note that the expenses shown in these tables are meant to highlight your ongoing expenses only and do not reflect any transaction costs. The "Expenses Paid per $1,000" line of the tables is useful in comparing ongoing expenses only and will not help you determine the relative total expense of owning different funds. If these transaction costs had been included, your costs would have been higher.
Expenses and Value of a $1,000 Investment for the six months ended December 31, 2010 |
Actual Fund Return | Class A | | Class B | |
Beginning Account Value 7/1/10 | $ 1,000.00 | | $ 1,000.00 | |
Ending Account Value 12/31/10 | $ 1,226.20 | | $ 1,223.70 | |
Expenses Paid per $1,000* | $ 4.71 | | $ 6.56 | |
Hypothetical 5% Fund Return | Class A | | Class B | |
Beginning Account Value 7/1/10 | $ 1,000.00 | | $ 1,000.00 | |
Ending Account Value 12/31/10 | $ 1,020.97 | | $ 1,019.31 | |
Expenses Paid per $1,000* | $ 4.28 | | $ 5.96 | |
* Expenses are equal to the Fund's annualized expense ratio for each share class, multiplied by the average account value over the period, multiplied by the number of days in the most recent six-month period, then divided by 365.
Annualized Expense Ratios | Class A | | Class B | |
DWS Variable Series II — DWS Strategic Value VIP | .84% | | 1.17% | |
For more information, please refer to the Fund's prospectus.
These tables do not reflect charges and fees ("contract charges") associated with the separate account that invests in the Fund or any variable life insurance policy or variable annuity contract for which the Fund is an investment option.
Management Summary December 31, 2010
DWS Strategic Value VIP
The US equity market performed well during the past year, gaining 15.06% as measured by the Fund's benchmark, the Standard & Poor's 500® (S&P 500) Index. The Class A shares of the Fund returned 12.52% (unadjusted for contract charges).
The most important factor in the Fund's underperformance was the pro-cyclical bias we held throughout the year. By "pro-cyclical," we mean that we tilted the Fund toward the areas of the market most likely to benefit from an improving economy. This approach worked well during the first three months of the Fund's fiscal year, and again in the fourth quarter rally. However, our pro-cyclical tilt proved to be a significant negative in the April-August 2010 interval, during which elevated concerns about the possibility of a "double-dip" recession weighed heavily on the more economically sensitive areas of the market. Unfortunately, this more than offset the outperformance we generated during the other parts of the year. Other important factors in our underperformance included our underweight in the consumer discretionary sector and our relatively conservative positioning in technology.1
On the plus side, we added value in the energy sector, thanks to both an overweight position and strong stock selection. Our stock selection in the health care, consumer staples and industrials sectors also was additive to performance.
We are disappointed that the Fund failed to keep pace with the benchmark during the past year, but we remain confident in its positioning as we head into 2011. We are focused on owning stocks with high free cash flow, a metric that has correlated with outperformance for individual stocks over time. Free cash flow strength opens the door for a variety of positive developments, including increased dividends, share buybacks and the potential to be acquired at a premium by a competitor. While high free cash flows did not necessarily lead to outperformance for individual stocks during the past year, we believe that the best time to add exposure to a time-tested investment style is when it is out of favor.
In the wake of a financial shock as large as what we experienced in 2008-2009, the process of recovery is bound to be uneven. The result, inevitably, is periodic instability such as what we witnessed in the April-August 2010 time frame.
Thomas Schuessler, PhD
Volker Dosch
Oliver Pfeil, PhD
Portfolio Managers
The Standard & Poor's 500 (S&P 500) Index is an unmanaged, capitalization-weighted index of 500 stocks. The index is designed to measure performance of the broad domestic economy through changes in the aggregate market value of 500 stocks representing all major industries.
Index returns assume reinvestment of dividends and, unlike fund returns, do not reflect any fees or expenses. It is not possible to invest directly into an index.
1 "Overweight" means the Fund holds a higher weighting in a given sector or security than the benchmark. "Underweight" means the Fund holds a lower weighting.
Portfolio Summary
DWS Strategic Value VIP
Asset Allocation (As a % of Investment Portfolio excluding Securities Lending Collateral) | 12/31/10 | 12/31/09 |
| | |
Common Stocks | 98% | 98% |
Cash Equivalents | 2% | 2% |
| 100% | 100% |
Sector Diversification (As a % of Common Stocks) | 12/31/10 | 12/31/09 |
| | |
Energy | 22% | 13% |
Financials | 16% | 16% |
Information Technology | 15% | 15% |
Industrials | 11% | 12% |
Consumer Discretionary | 10% | 7% |
Health Care | 9% | 14% |
Consumer Staples | 7% | 12% |
Telecommunication Services | 4% | 6% |
Materials | 3% | 4% |
Utilities | 3% | 1% |
| 100% | 100% |
Asset allocation and sector diversification are subject to change.
For more complete details about the Fund's investment portfolio, see page 251.
Following the Fund's fiscal first and third quarter-end, a complete portfolio holdings listing is filed with the SEC on Form N-Q. The form will be available on the SEC's Web site at www.sec.gov, and it also may be reviewed and copied at the SEC's Public Reference Room in Washington, D.C. Information on the operation of the SEC's Public Reference Room may be obtained by calling (800) SEC-0330. The Fund's portfolio holdings are also posted on www.dws-investments.com from time to time. Please see the Fund's current prospectus for more information.
Investment Portfolio December 31, 2010
DWS Strategic Value VIP
| Shares | Value ($) |
| |
Common Stocks 98.3% |
Consumer Discretionary 10.0% |
Automobiles 1.0% |
General Motors Co.* | 73,980 | 2,726,903 |
Hotels Restaurants & Leisure 2.2% |
McDonald's Corp. | 62,115 | 4,767,947 |
MGM Resorts International* (a) | 80,000 | 1,188,000 |
| 5,955,947 |
Household Durables 0.4% |
Newell Rubbermaid, Inc. | 60,000 | 1,090,800 |
Leisure Equipment & Products 0.8% |
Mattel, Inc. | 87,213 | 2,217,826 |
Media 1.6% |
Time Warner, Inc. | 131,875 | 4,242,419 |
Multiline Retail 1.5% |
Target Corp. | 64,560 | 3,881,993 |
Specialty Retail 1.1% |
Bed Bath & Beyond, Inc.* | 30,000 | 1,474,500 |
Lowe's Companies, Inc. | 55,829 | 1,400,191 |
| 2,874,691 |
Textiles, Apparel & Luxury Goods 1.4% |
VF Corp. (a) | 43,799 | 3,774,598 |
Consumer Staples 7.0% |
Beverages 1.5% |
PepsiCo, Inc. | 61,068 | 3,989,572 |
Food & Staples Retailing 2.0% |
CVS Caremark Corp. | 88,016 | 3,060,316 |
Safeway, Inc. (a) | 108,536 | 2,440,975 |
| 5,501,291 |
Tobacco 3.5% |
Altria Group, Inc. | 205,453 | 5,058,253 |
Philip Morris International, Inc. | 73,109 | 4,279,070 |
| 9,337,323 |
Energy 21.4% |
Energy Equipment & Services 5.6% |
Ensco PLC (ADR) | 73,117 | 3,902,985 |
National Oilwell Varco, Inc. | 43,893 | 2,951,804 |
Transocean Ltd.* (a) | 58,269 | 4,050,278 |
Weatherford International Ltd.* (a) | 181,327 | 4,134,256 |
| 15,039,323 |
Oil, Gas & Consumable Fuels 15.8% |
Apache Corp. | 48,056 | 5,729,717 |
Chevron Corp. | 65,658 | 5,991,292 |
ConocoPhillips | 114,579 | 7,802,830 |
Exxon Mobil Corp. | 43,803 | 3,202,875 |
Hess Corp. | 80,468 | 6,159,021 |
Marathon Oil Corp. | 131,664 | 4,875,518 |
Nexen, Inc. | 97,451 | 2,231,628 |
Occidental Petroleum Corp. | 29,367 | 2,880,903 |
Williams Companies, Inc. | 135,158 | 3,341,106 |
| 42,214,890 |
Financials 15.3% |
Capital Markets 1.8% |
Janus Capital Group, Inc. | 80,000 | 1,037,600 |
Legg Mason, Inc. | 30,000 | 1,088,100 |
| Shares | Value ($) |
| |
The Goldman Sachs Group, Inc. | 16,213 | 2,726,378 |
| 4,852,078 |
Commercial Banks 3.0% |
Royal Bank of Canada | 50,000 | 2,618,000 |
Wells Fargo & Co. | 172,565 | 5,347,789 |
| 7,965,789 |
Consumer Finance 1.0% |
Capital One Financial Corp. (a) | 63,978 | 2,722,904 |
Diversified Financial Services 5.6% |
Citigroup, Inc.* | 1,057,545 | 5,002,188 |
JPMorgan Chase & Co. | 233,319 | 9,897,392 |
| 14,899,580 |
Insurance 3.9% |
Hartford Financial Services Group, Inc. (a) | 154,087 | 4,081,765 |
Lincoln National Corp. | 130,684 | 3,634,322 |
MetLife, Inc. | 61,167 | 2,718,261 |
| 10,434,348 |
Thrifts & Mortgage Finance 0.0% |
Washington Mutual, Inc.* | 1,394,944 | 78,954 |
Health Care 8.9% |
Biotechnology 0.9% |
Amgen, Inc.* | 43,291 | 2,376,676 |
Health Care Providers & Services 3.5% |
Aetna, Inc. | 99,770 | 3,043,983 |
UnitedHealth Group, Inc. | 83,959 | 3,031,759 |
WellPoint, Inc.* | 58,337 | 3,317,042 |
| 9,392,784 |
Life Sciences Tools & Services 1.1% |
Thermo Fisher Scientific, Inc.* | 51,917 | 2,874,125 |
Pharmaceuticals 3.4% |
Abbott Laboratories | 52,809 | 2,530,079 |
Mylan, Inc.* | 174,984 | 3,697,412 |
Novartis AG (ADR) (a) | 48,184 | 2,840,447 |
| 9,067,938 |
Industrials 10.4% |
Aerospace & Defense 5.4% |
Honeywell International, Inc. | 76,520 | 4,067,803 |
ITT Corp. (a) | 58,665 | 3,057,033 |
United Technologies Corp. | 94,868 | 7,468,009 |
| 14,592,845 |
Construction & Engineering 0.9% |
URS Corp.* | 58,652 | 2,440,510 |
Industrial Conglomerates 1.5% |
General Electric Co. | 226,206 | 4,137,308 |
Machinery 1.6% |
Deere & Co. | 50,053 | 4,156,902 |
Road & Rail 1.0% |
CSX Corp. | 41,068 | 2,653,403 |
Information Technology 14.8% |
Communications Equipment 1.0% |
Cisco Systems, Inc.* | 135,000 | 2,731,050 |
Computers & Peripherals 3.4% |
Hewlett-Packard Co. | 179,144 | 7,541,962 |
Lexmark International, Inc. "A"* | 45,000 | 1,566,900 |
| 9,108,862 |
| Shares | Value ($) |
| |
Electronic Equipment, Instruments & Components 0.5% |
Corning, Inc. | 70,000 | 1,352,400 |
IT Services 2.5% |
Accenture PLC "A" | 102,451 | 4,967,849 |
Computer Sciences Corp. | 33,254 | 1,649,398 |
| 6,617,247 |
Office Electronics 1.6% |
Xerox Corp. | 373,129 | 4,298,447 |
Semiconductors & Semiconductor Equipment 1.0% |
Micron Technology, Inc.* (a) | 331,290 | 2,656,946 |
Software 4.8% |
BMC Software, Inc.* | 65,869 | 3,105,065 |
Microsoft Corp. | 354,564 | 9,899,427 |
| 13,004,492 |
Materials 3.4% |
Metals & Mining |
Agnico-Eagle Mines Ltd. (a) | 21,894 | 1,679,270 |
BHP Billiton Ltd. (ADR) (a) | 20,000 | 1,858,400 |
Freeport-McMoRan Copper & Gold, Inc. | 23,244 | 2,791,372 |
Kinross Gold Corp. | 146,385 | 2,775,459 |
| 9,104,501 |
Telecommunication Services 4.5% |
Diversified Telecommunication Services 2.8% |
AT&T, Inc. | 146,263 | 4,297,207 |
CenturyLink, Inc. (a) | 65,928 | 3,043,896 |
| 7,341,103 |
| Shares | Value ($) |
| |
Wireless Telecommunication Services 1.7% |
Vodafone Group PLC (ADR) (a) | 175,281 | 4,632,677 |
Utilities 2.6% |
Electric Utilities 0.6% |
FirstEnergy Corp. (a) | 43,893 | 1,624,919 |
Multi-Utilities 2.0% |
PG&E Corp. | 58,501 | 2,798,688 |
Sempra Energy | 48,382 | 2,539,087 |
| 5,337,775 |
Total Common Stocks (Cost $225,572,465) | 263,304,139 |
|
Securities Lending Collateral 14.9% |
Daily Assets Fund Institutional, 0.27% (b) (c) (Cost $39,865,520) | 39,865,520 | 39,865,520 |
|
Cash Equivalents 2.1% |
Central Cash Management Fund, 0.19% (b) (Cost $5,724,962) | 5,724,962 | 5,724,962 |
| % of Net Assets | Value ($) |
| |
Total Investment Portfolio (Cost $271,162,947)+ | 115.3 | 308,894,621 |
Other Assets and Liabilities, Net | (15.3) | (40,966,695) |
Net Assets | 100.0 | 267,927,926 |
* Non-income producing security.
+ The cost for federal income tax purposes was $272,059,584. At December 31, 2010, net unrealized appreciation for all securities based on tax cost was $36,835,037. This consisted of aggregate gross unrealized appreciation for all securities in which there was an excess of value over tax cost of $50,605,721 and aggregate gross unrealized depreciation for all securities in which there was an excess of tax cost over value of $13,770,684.
(a) All or a portion of these securities were on loan (see Notes to Financial Statements). The value of all securities loaned at December 31, 2010 amounted to $38,874,375, which is 14.5% of net assets.
(b) Affiliated fund managed by Deutsche Investment Management Americas Inc. The rate shown is the annualized seven-day yield at period end.
(c) Represents collateral held in connection with securities lending. Income earned by the Fund is net of borrower rebates.
ADR: American Depositary Receipt
Fair Value Measurements
Various inputs are used in determining the value of the Fund's investments. These inputs are summarized in three broad levels. Level 1 includes quoted prices in active markets for identical securities. Level 2 includes other significant observable inputs (including quoted prices for similar securities, interest rates, prepayment speeds, and credit risk). Level 3 includes significant unobservable inputs (including the Fund's own assumptions in determining the fair value of investments). The inputs or methodology used for valuing securities are not necessarily an indication of the risk associated with investing in those securities.
The following is a summary of the inputs used as of December 31, 2010 in valuing the Fund's investments. For information on the Fund's policy regarding the valuation of investments, please refer to the Security Valuation section of Note A in the accompanying Notes to Financial Statements.
Assets | Level 1 | Level 2 | Level 3 | Total |
|
Common Stocks (d) | $ 263,304,139 | $ — | $ — | $ 263,304,139 |
Short-Term Investments (d) | 45,590,482 | — | — | 45,590,482 |
Total | $ 308,894,621 | $ — | $ — | $ 308,894,621 |
There have been no significant transfers between Level 1 and Level 2 fair value measurements during the year ended December 31, 2010.
(d) See Investment Portfolio for additional detailed categorizations.
The accompanying notes are an integral part of the financial statements.
Statement of Assets and Liabilities
as of December 31, 2010 |
Assets |
Investments: Investments in unaffiliated securities, at value (cost $225,572,465) — including $38,874,375 of securities loaned | $ 263,304,139 |
Investment in Daily Assets Fund Institutional (cost $39,865,520)* | 39,865,520 |
Investment in Central Cash Management Fund (cost $5,724,962) | 5,724,962 |
Total investments at value (cost $271,162,947) | 308,894,621 |
Receivable for Fund shares sold | 803 |
Dividends receivable | 426,895 |
Interest receivable | 2,761 |
Foreign taxes recoverable | 2,107 |
Other assets | 1,438 |
Total assets | 309,328,625 |
Liabilities |
Payable upon return of securities loaned | 39,865,520 |
Payable for Fund shares redeemed | 154,974 |
Payable for investments purchased | 1,085,769 |
Accrued management fee | 149,132 |
Other accrued expenses and payables | 145,304 |
Total liabilities | 41,400,699 |
Net assets, at value | $ 267,927,926 |
Net Assets Consist of |
Undistributed net investment income | 3,522,893 |
Net unrealized appreciation (depreciation) on: Investments | 37,731,674 |
Foreign currency | 64 |
Accumulated net realized gain (loss) | (141,564,092) |
Paid-in capital | 368,237,387 |
Net assets, at value | $ 267,927,926 |
Class A Net Asset Value, offering and redemption price per share ($266,068,810 ÷ 32,742,109 outstanding shares of beneficial interest, no par value, unlimited number of shares authorized) | $ 8.13 |
Class B Net Asset Value, offering and redemption price per share ($1,859,116 ÷ 228,157 outstanding shares of beneficial interest, no par value, unlimited number of shares authorized) | $ 8.15 |
The accompanying notes are an integral part of the financial statements.
Statement of Operations
for the year ended December 31, 2010 |
Investment Income |
Income: Dividends (net of foreign taxes withheld of $43,360) | $ 5,932,680 |
Income distributions — Central Cash Management Fund | 19,988 |
Securities lending income, including income from Daily Assets Fund Institutional, net of borrower rebates | 32,898 |
Total income | 5,985,566 |
Expenses: Management fee | 1,756,021 |
Administration fee | 264,774 |
Services to shareholders | 20,135 |
Distribution service fee (Class B) | 4,271 |
Record keeping fees (Class B) | 940 |
Custodian fee | 17,404 |
Professional fees | 65,688 |
Trustees' fees and expenses | 9,696 |
Reports to shareholders | 69,429 |
Other | 13,801 |
Total expenses before expense reductions | 2,222,159 |
Expense reductions | (36,423) |
Total expenses after expense reductions | 2,185,736 |
Net investment income (loss) | 3,799,830 |
Realized and Unrealized Gain (Loss) |
Net realized gain (loss) from: Investments | 17,969,063 |
Foreign currency | 351 |
Payments by Affiliates (see Note I) | 289,394 |
| 18,258,808 |
Change in net unrealized appreciation (depreciation) on: Investments | 8,466,003 |
Foreign currency | 64 |
| 8,466,067 |
Net gain (loss) | 26,724,875 |
Net increase (decrease) in net assets resulting from operations | $ 30,524,705 |
* Represents collateral on securities loaned.
The accompanying notes are an integral part of the financial statements.
Statement of Changes in Net Assets
Increase (Decrease) in Net Assets | Years Ended December 31, |
2010 | 2009 |
Operations: Net investment income (loss) | $ 3,799,830 | $ 5,183,044 |
Net realized gain (loss) | 18,258,808 | (11,128,319) |
Change in net unrealized appreciation (depreciation) | 8,466,067 | 65,208,508 |
Net increase (decrease) in net assets resulting from operations | 30,524,705 | 59,263,233 |
Distributions to shareholders from: Net investment income: Class A | (5,244,990) | (12,778,810) |
Class B | (28,738) | (81,600) |
Total distributions | (5,273,728) | (12,860,410) |
Fund share transactions: Class A Proceeds from shares sold | 4,504,378 | 5,209,923 |
Reinvestment of distributions | 5,244,990 | 12,778,810 |
Payments for shares redeemed | (50,438,746) | (90,662,545) |
Net increase (decrease) in net assets from Class A share transactions | (40,689,378) | (72,673,812) |
Class B Proceeds from shares sold | 431,727 | 544,525 |
Reinvestment of distributions | 28,738 | 81,600 |
Payments for shares redeemed | (713,355) | (1,038,519) |
Net increase (decrease) in net assets from Class B share transactions | (252,890) | (412,394) |
Increase (decrease) in net assets | (15,691,291) | (26,683,383) |
Net assets at beginning of period | 283,619,217 | 310,302,600 |
Net assets at end of period (including undistributed net investment income of $3,522,893 and $4,996,440, respectively) | $ 267,927,926 | $ 283,619,217 |
Other Information |
Class A Shares outstanding at beginning of period | 38,269,626 | 49,642,073 |
Shares sold | 610,579 | 874,127 |
Shares issued to shareholders in reinvestment of distributions | 674,163 | 2,576,373 |
Shares redeemed | (6,812,259) | (14,822,947) |
Net increase (decrease) in Class A shares | (5,527,517) | (11,372,447) |
Shares outstanding at end of period | 32,742,109 | 38,269,626 |
Class B Shares outstanding at beginning of period | 265,888 | 327,546 |
Shares sold | 56,800 | 86,408 |
Shares issued to shareholders in reinvestment of distributions | 3,675 | 16,352 |
Shares redeemed | (98,206) | (164,418) |
Net increase (decrease) in Class B shares | (37,731) | (61,658) |
Shares outstanding at end of period | 228,157 | 265,888 |
The accompanying notes are an integral part of the financial statements.
Financial Highlights
Class A Years Ended December 31, | 2010 | 2009 | 2008 | 2007 | 2006 |
Selected Per Share Data |
Net asset value, beginning of period | $ 7.36 | $ 6.21 | $ 14.40 | $ 15.02 | $ 13.41 |
Income (loss) from investment operations: Net investment income (loss)a | .11 | .12 | .22 | .29 | .27 |
Net realized and unrealized gain (loss) | .81 | 1.31 | (5.80) | (.56) | 2.21 |
Total from investment operations | .92 | 1.43 | (5.58) | (.27) | 2.48 |
Less distributions from: Net investment income | (.15) | (.28) | (.36) | (.22) | (.28) |
Net realized gains | — | — | (2.25) | (.13) | (.59) |
Total distributions | (.15) | (.28) | (2.61) | (.35) | (.87) |
Net asset value, end of period | $ 8.13 | $ 7.36 | $ 6.21 | $ 14.40 | $ 15.02 |
Total Return (%) | 12.52b | 25.30b | (45.98)b | (1.86) | 18.74 |
Ratios to Average Net Assets and Supplemental Data |
Net assets, end of period ($ millions) | 266 | 282 | 308 | 792 | 992 |
Ratio of expenses before expense reductions (%) | .84 | .80 | .81 | .78 | .77 |
Ratio of expenses after expense reductions(%) | .82 | .76 | .80 | .78 | .77 |
Ratio of net investment income (%) | 1.44 | 1.89 | 2.21 | 1.94 | 1.87 |
Portfolio turnover rate (%) | 87 | 91 | 28 | 27 | 20 |
a Based on average shares outstanding during the period. b Total return would have been lower had certain expenses not been reduced. |
Class B Years Ended December 31, | 2010 | 2009 | 2008 | 2007 | 2006 |
Selected Per Share Data |
Net asset value, beginning of period | $ 7.38 | $ 6.22 | $ 14.41 | $ 15.02 | $ 13.39 |
Income (loss) from investment operations: Net investment income (loss)a | .08 | .10 | .16 | .24 | .22 |
Net realized and unrealized gain (loss) | .81 | 1.32 | (5.79) | (.56) | 2.19 |
Total from investment operations | .89 | 1.42 | (5.63) | (.32) | 2.41 |
Less distributions from: Net investment income | (.12) | (.26) | (.31) | (.16) | (.19) |
Net realized gains | — | — | (2.25) | (.13) | (.59) |
Total distributions | (.12) | (.26) | (2.56) | (.29) | (.78) |
Net asset value, end of period | $ 8.15 | $ 7.38 | $ 6.22 | $ 14.41 | $ 15.02 |
Total Return (%)b | 12.13 | 24.94 | (46.16) | (2.19) | 18.21 |
Ratios to Average Net Assets and Supplemental Data |
Net assets, end of period ($ millions) | 2 | 2 | 2 | 37 | 191 |
Ratio of expenses before expense reduction (%) | 1.15 | 1.11 | 1.21 | 1.15 | 1.16 |
Ratio of expenses after expense reduction (%) | 1.14 | 1.08 | 1.17 | 1.13 | 1.16 |
Ratio of net investment income (%) | 1.12 | 1.57 | 1.84 | 1.59 | 1.48 |
Portfolio turnover rate (%) | 87 | 91 | 28 | 27 | 20 |
a Based on average shares outstanding during the period. b Total return would have been lower had certain expenses not been reduced. |
Performance Summary December 31, 2010
DWS Technology VIP
All performance shown is historical, assumes reinvestment of all dividend and capital gain distributions and does not guarantee future results. Investment return and principal value fluctuate with changing market conditions so that, when redeemed, shares may be worth more or less than their original cost. Current performance may be lower or higher than the performance data quoted. Please contact your participating insurance company for the Fund's most recent month-end performance. Performance doesn't reflect charges and fees ("contract charges") associated with the separate account that invests in the Fund or any variable life insurance policy or variable annuity contract for which the Fund is an investment option. These charges and fees will reduce returns. While all share classes have the same underlying portfolio, their performance will differ.
The gross expense ratios of the Fund, as stated in the fee table of the prospectus dated May 1, 2010 are 0.84% and 1.18% for Class A and Class B shares, respectively, and may differ from the expense ratios disclosed in the Financial Highlights tables in this report.
Risk Considerations
Any Fund that concentrates in a particular segment of the market will generally be more volatile than a fund that invests more broadly. This Fund is non-diversified and can take larger positions in fewer issues, increasing its potential risk. Stocks may decline in value. See the prospectus for details.
Fund returns shown during the 3-year, 5-year and 10-year periods reflect a fee waiver and/or expense reimbursement for Class A shares. Without this waiver/reimbursement, returns would have been lower.
Growth of an Assumed $10,000 Investment in DWS Technology VIP |
[] DWS Technology VIP — Class A [] Russell 1000® Growth Index [] S&P® North American Technology Sector Index | The Russell 1000® Growth Index is an unmanaged index that consists of those stocks in the Russell 1000 Index with higher price-to-book ratios and higher forecasted growth values. The S&P North American Technology Sector Index is the technology subindex of the S&P North American Sector Indices. The S&P North American Technology Sector Index family is designed as equity benchmarks for US-traded technology-related securities. Index returns assume reinvestment of dividends and, unlike fund returns, do not reflect any fees or expenses. It is not possible to invest directly into an index. |
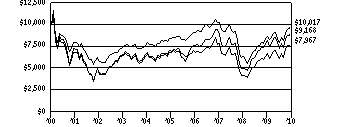 | |
Yearly periods ended December 31 | |
Comparative Results |
DWS Technology VIP | 1-Year | 3-Year | 5-Year | 10-Year |
Class A | Growth of $10,000 | $11,866 | $10,237 | $11,789 | $7,967 |
Average annual total return | 18.66% | 0.79% | 3.35% | -2.25% |
Russell 1000 Growth Index | Growth of $10,000 | $11,671 | $9,858 | $12,023 | $10,017 |
Average annual total return | 16.71% | -0.47% | 3.75% | 0.02% |
S&P North American Technology Sector Index | Growth of $10,000 | $11,265 | $10,417 | $13,276 | $9,168 |
Average annual total return | 12.65% | 1.37% | 5.83% | -0.86% |
DWS Technology VIP | 1-Year | 3-Year | 5-Year | Life of Class* |
Class B | Growth of $10,000 | $11,769 | $10,104 | $11,553 | $16,857 |
Average annual total return | 17.96% | 0.35% | 2.93% | 6.34% |
Russell 1000 Growth Index | Growth of $10,000 | $11,671 | $9,858 | $12,023 | $15,890 |
Average annual total return | 16.71% | -0.47% | 3.75% | 5.60% |
S&P North American Technology Sector Index | Growth of $10,000 | $11,265 | $10,417 | $13,276 | $19,158 |
Average annual total return | 12.65% | 1.37% | 5.83% | 7.94% |
The growth of $10,000 is cumulative.
* The Fund commenced offering Class B shares on July 1, 2002. Index returns began on June 30, 2002.
Information About Your Fund's Expenses
DWS Technology VIP
As an investor of the Fund, you incur two types of costs: ongoing expenses and transaction costs. Ongoing expenses include management fees, distribution and service (12b-1) fees and other Fund expenses. Examples of transaction costs include contract charges, redemption fees and account maintenance fees, which are not shown in this section. The following tables are intended to help you understand your ongoing expenses (in dollars) of investing in the Fund and to help you compare these expenses with the ongoing expenses of investing in other mutual funds. The example in the table is based on an investment of $1,000 invested at the beginning of the six-month period and held for the entire period (July 1, 2010 to December 31, 2010).
The tables illustrate your Fund's expenses in two ways:
• Actual Fund Return. This helps you estimate the actual dollar amount of ongoing expenses (but not transaction costs) paid on a $1,000 investment in the Fund using the Fund's actual return during the period. To estimate the expenses you paid over the period, simply divide your account value by $1,000 (for example, an $8,600 account value divided by $1,000 = 8.6), then multiply the result by the number in the "Expenses Paid per $1,000" line under the share class you hold.
• Hypothetical 5% Fund Return. This helps you to compare your Fund's ongoing expenses (but not transaction costs) with those of other mutual funds using the Fund's actual expense ratio and a hypothetical rate of return of 5% per year before expenses. Examples using a 5% hypothetical Fund return may be found in the shareholder reports of other mutual funds. The hypothetical account values and expenses may not be used to estimate the actual ending account balance or expenses you paid for the period.
Please note that the expenses shown in these tables are meant to highlight your ongoing expenses only and do not reflect any transaction costs. The "Expenses Paid per $1,000" line of the tables is useful in comparing ongoing expenses only and will not help you determine the relative total expense of owning different funds. If these transaction costs had been included, your costs would have been higher.
Expenses and Value of a $1,000 Investment for the six months ended December 31, 2010 |
Actual Fund Return | Class A | | Class B | |
Beginning Account Value 7/1/10 | $ 1,000.00 | | $ 1,000.00 | |
Ending Account Value 12/31/10 | $ 1,300.10 | | $ 1,297.60 | |
Expenses Paid per $1,000* | $ 5.45 | | $ 7.76 | |
Hypothetical 5% Fund Return | Class A | | Class B | |
Beginning Account Value 7/1/10 | $ 1,000.00 | | $ 1,000.00 | |
Ending Account Value 12/31/10 | $ 1,020.47 | | $ 1,018.45 | |
Expenses Paid per $1,000* | $ 4.79 | | $ 6.82 | |
* Expenses are equal to the Fund's annualized expense ratio for each share class, multiplied by the average account value over the period, multiplied by the number of days in the most recent six-month period, then divided by 365.
Annualized Expense Ratios | Class A | | Class B | |
DWS Variable Series II — DWS Technology VIP | .94% | | 1.34% | |
For more information, please refer to the Fund's prospectus.
These tables do not reflect charges and fees ("contract charges") associated with the separate account that invests in the Fund or any variable life insurance policy or variable annuity contract for which the Fund is an investment option.
Management Summary December 31, 2010
DWS Technology VIP
Technology stocks produced double-digit returns during 2010 — as measured by the 12.65% gain of the Fund's benchmark, the S&P® North American Technology Sector Index — but underperformed the 15.06% return of the Standard & Poor's 500® (S&P 500) Index. The Class A shares of the Fund returned 18.66% (unadjusted for contract charges), outperforming the benchmark by a wide margin.
The Fund's strong performance was largely attributable to the effectiveness of our individual stock selection. Of the many stocks that stood out as winners, the largest contributor was Isilon Systems, Inc.,* a vendor of data storage systems suitable for very large files. The stock performed well due to the effectiveness of the company's new sales strategy, rising demand for its storage products and takeover speculation. Also among the Fund's top contributors were LogMeIn, Inc.,* Apple Inc., Ariba, Inc. and F5 Networks, Inc.
On the negative side, our performance was hurt by an overweight position in Hewlett-Packard Co.1 The stock lagged the broader sector by a wide margin due to the forced departure of esteemed CEO Mark Hurd and the Board's unexpected choice of former SAP CEO Leo Apotheker as his replacement. Other detractors of note included Comverse Technology, Inc. and Google, Inc.
We believe the tech sector continues to present a mix of defensive and offensive characteristics, making it attractive at a time of an uncertain economic outlook. The tech sector also provides investors with the opportunity to take part in a number of compelling longer-term themes. For instance, we favor companies participating in technological trends with significant potential impact on the overall economy, such as cloud computing, mobile data, business analytics and online advertising. Many companies related to these themes are likely to become potential targets for further merger and acquisition (M&A) activity, creating opportunities for bottom-up investors.
Frederic L. Fayolle, CFA
Lead Portfolio Manager
Clark Chang
Walter Holick
Portfolio Managers
The S&P North American Technology Sector Index is an unmanaged, capitalization-weighted index based on a universe of technology-related stocks.
The Standard & Poor's 500 (S&P 500) Index is an unmanaged, capitalization-weighted index of 500 stocks. The index is designed to measure performance of the broad domestic economy through changes in the aggregate market value of 500 stocks representing all major industries.
Index returns assume reinvestment of dividends and, unlike fund returns, do not reflect any fees or expenses. It is not possible to invest directly into an index.
1 "Overweight" means the Fund holds a higher weighting in a given sector or security than the benchmark. "Underweight" means the Fund holds a lower weighting.
* Not held in the portfolio as of December 31, 2010.
Portfolio Summary
DWS Technology VIP
Asset Allocation (As a % of Investment Portfolio excluding Securities Lending Collateral) | 12/31/10 | 12/31/09 |
| | |
Common Stocks | 99% | 98% |
Cash Equivalents | 1% | 2% |
| 100% | 100% |
Sector Diversification (As a % of Common Stocks) | 12/31/10 | 12/31/09 |
| | |
Information Technology: | | |
Computers & Peripherals | 22% | 25% |
Software | 18% | 18% |
Communications Equipment | 17% | 17% |
Semiconductors & Semiconductor Equipment | 16% | 16% |
Internet Software & Services | 14% | 14% |
IT Services | 9% | 7% |
Electronic Equipment, Instruments & Components | 1% | 2% |
Consumer Discretionary: | | |
Hotel Restaurants & Leisure | 0% | — |
Internet & Catalog Retail | 3% | 1% |
| 100% | 100% |
Asset allocation and sector diversification are subject to change.
For more complete details about the Fund's investment portfolio, see page 264.
Following the Fund's fiscal first and third quarter-end, a complete portfolio holdings listing is filed with the SEC on Form N-Q. The form will be available on the SEC's Web site at www.sec.gov, and it also may be reviewed and copied at the SEC's Public Reference Room in Washington, D.C. Information on the operation of the SEC's Public Reference Room may be obtained by calling (800) SEC-0330. The Fund's portfolio holdings are also posted on www.dws-investments.com from time to time. Please see the Fund's current prospectus for more information.
Investment Portfolio December 31, 2010
DWS Technology VIP
|
Shares
| Value ($) |
| |
Common Stocks 99.3% |
Consumer Discretionary 3.1% |
Hotels Restaurants & Leisure 0.3% |
Ctrip.com International Ltd. (ADR)* | 6,070 | 245,532 |
Internet & Catalog Retail 2.8% |
Amazon.com, Inc.* | 7,210 | 1,297,800 |
Priceline.com, Inc.* | 1,950 | 779,122 |
| 2,076,922 |
Information Technology 96.2% |
Communications Equipment 17.2% |
Acme Packet, Inc.* | 7,523 | 399,923 |
Aviat Networks, Inc.* | 2,463 | 12,487 |
Cisco Systems, Inc.* | 183,760 | 3,717,465 |
Comverse Technology, Inc.* | 126,644 | 919,435 |
F5 Networks, Inc.* | 8,850 | 1,151,916 |
Juniper Networks, Inc.* (a) | 29,800 | 1,100,216 |
Motorola, Inc.* | 59,350 | 538,304 |
Polycom, Inc.* (a) | 23,810 | 928,114 |
QUALCOMM, Inc. | 77,996 | 3,860,022 |
Research In Motion Ltd.* | 6,460 | 375,520 |
| 13,003,402 |
Computers & Peripherals 22.2% |
Apple, Inc.* | 29,370 | 9,473,587 |
EMC Corp.* (a) | 93,957 | 2,151,615 |
Gemalto NV | 7,700 | 327,670 |
Hewlett-Packard Co. | 90,770 | 3,821,417 |
QLogic Corp.* | 3,660 | 62,293 |
SanDisk Corp.* | 17,290 | 862,079 |
Xyratex Ltd.* | 7,848 | 128,001 |
| 16,826,662 |
Electronic Equipment, Instruments & Components 1.0% | |
Corning, Inc. | 39,250 | 758,310 |
Internet Software & Services 13.6% |
Akamai Technologies, Inc.* | 6,720 | 316,176 |
Digital River, Inc.* | 16,620 | 572,060 |
eBay, Inc.* | 10,450 | 290,824 |
Equinix, Inc.* | 2,710 | 220,215 |
Google, Inc. "A"* | 9,450 | 5,613,017 |
LogMeIn, Inc.* (a) | 24,313 | 1,078,038 |
Open Text Corp.* (a) | 3,400 | 156,604 |
QuinStreet, Inc.* (a) | 27,888 | 535,728 |
Telecity Group PLC* | 40,505 | 297,064 |
Tencent Holdings Ltd. | 18,080 | 397,756 |
VistaPrint NV* (a) | 3,030 | 139,380 |
Yahoo!, Inc.* (a) | 41,070 | 682,994 |
| 10,299,856 |
IT Services 8.9% |
Accenture PLC "A" | 9,820 | 476,172 |
Amdocs Ltd.* | 8,580 | 235,693 |
Cognizant Technology Solutions Corp. "A"* | 25,390 | 1,860,833 |
Fiserv, Inc.* | 10,400 | 609,024 |
FleetCor Technologies, Inc.* | 4,920 | 152,126 |
International Business Machines Corp. | 12,740 | 1,869,722 |
iSoftStone Holdings Ltd. (ADR)* | 4,530 | 82,310 |
|
Shares
| Value ($) |
| |
MasterCard, Inc. "A" | 960 | 215,146 |
Teradata Corp.* | 22,861 | 940,959 |
Visa, Inc. "A" (a) | 4,610 | 324,452 |
| 6,766,437 |
Semiconductors & Semiconductor Equipment 15.7% | |
Aixtron SE (a) | 10,660 | 393,643 |
Altera Corp. (a) | 11,660 | 414,863 |
Applied Materials, Inc. | 24,000 | 337,200 |
ASML Holding NV (NY Registered Shares) (a) | 14,190 | 544,044 |
Avago Technologies Ltd. | 17,129 | 487,663 |
Broadcom Corp. "A" | 20,310 | 884,500 |
Cavium Networks, Inc.* (a) | 7,010 | 264,137 |
Cirrus Logic, Inc.* | 21,400 | 341,972 |
Inphi Corp.* | 1,940 | 38,975 |
Integrated Device Technology, Inc.* | 74,600 | 496,836 |
Intel Corp. | 152,879 | 3,215,045 |
KLA-Tencor Corp. | 12,740 | 492,273 |
Marvell Technology Group Ltd.* | 17,900 | 332,045 |
MaxLinear, Inc. "A"* (a) | 22,300 | 239,948 |
Microchip Technology, Inc. (a) | 8,270 | 282,917 |
Microsemi Corp.* | 14,290 | 327,241 |
Netlogic Microsystems, Inc.* | 13,880 | 435,971 |
Novellus Systems, Inc.* (a) | 16,910 | 546,531 |
NXP Semiconductors NV* | 10,220 | 213,905 |
Texas Instruments, Inc. (a) | 49,900 | 1,621,750 |
| 11,911,459 |
Software 17.6% |
Activision Blizzard, Inc. | 36,210 | 450,452 |
Adobe Systems, Inc.* | 20,990 | 646,072 |
ANSYS, Inc.* | 5,160 | 268,681 |
Ariba, Inc.* | 55,660 | 1,307,453 |
BMC Software, Inc.* | 19,040 | 897,546 |
Check Point Software Technologies Ltd.* | 11,080 | 512,561 |
Citrix Systems, Inc.* | 4,770 | 326,316 |
Informatica Corp.* (a) | 20,790 | 915,384 |
Longtop Financial Technologies Ltd. (ADR)* | 4,900 | 177,282 |
Microsoft Corp. | 127,410 | 3,557,287 |
Oracle Corp. | 87,010 | 2,723,413 |
QLIK Technologies, Inc.* | 7,958 | 205,396 |
RealD, Inc.* | 976 | 25,298 |
Rovi Corp.* (a) | 3,150 | 195,332 |
Salesforce.com, Inc.* (a) | 1,560 | 205,920 |
Symantec Corp.* | 18,560 | 310,694 |
Taleo Corp. "A"* | 10,890 | 301,109 |
VanceInfo Technologies, Inc. (ADR)* | 8,160 | 281,846 |
| 13,308,042 |
Total Common Stocks (Cost $42,878,738) | 75,196,622 |
|
Securities Lending Collateral 12.3% |
Daily Assets Fund Institutional, 0.27% (b) (c) (Cost $9,321,665) | 9,321,665 | 9,321,665 |
|
|
Shares
| Value ($) |
| |
Cash Equivalents 0.9% |
Central Cash Management Fund, 0.19% (b) (Cost $675,065) | 675,065 | 675,065 |
| % of Net Assets | Value ($) |
| |
Total Investment Portfolio (Cost $52,875,468)+ | 112.5 | 85,193,352 |
Other Assets and Liabilities, Net | (12.5) | (9,493,284) |
Net Assets | 100.0 | 75,700,068 |
* Non-income producing security.
+ The cost for federal income tax purposes was $56,197,483. At December 31, 2010, net unrealized appreciation for all securities based on tax cost was $28,995,869. This consisted of aggregate gross unrealized appreciation for all securities in which there was an excess of value over tax cost of $32,698,880 and aggregate gross unrealized depreciation for all securities in which there was an excess of tax cost over value of $3,703,011.
(a) All or a portion of these securities were on loan (see Notes to Financial Statements). The value of all securities loaned at December 31, 2010 amounted to $9,072,813, which is 12.0% of net assets.
(b) Affiliated fund managed by Deutsche Investment Management Americas Inc. The rate shown is the annualized seven-day yield at period end.
(c) Represents collateral held in connection with securities lending. Income earned by the Fund is net of borrower rebates.
ADR: American Depositary Receipt
Fair Value Measurements
Various inputs are used in determining the value of the Fund's investments. These inputs are summarized in three broad levels. Level 1 includes quoted prices in active markets for identical securities. Level 2 includes other significant observable inputs (including quoted prices for similar securities, interest rates, prepayment speeds, and credit risk). Level 3 includes significant unobservable inputs (including the Fund's own assumptions in determining the fair value of investments). The inputs or methodology used for valuing securities are not necessarily an indication of the risk associated with investing in those securities.
The following is a summary of the inputs used as of December 31, 2010 in valuing the Fund's investments. For information on the Fund's policy regarding the valuation of investments, please refer to the Security Valuation section of Note A in the accompanying Notes to Financial Statements.
Assets | Level 1 | Level 2 | Level 3 | Total |
|
Common Stocks (d) |
Consumer Discretionary | $ 2,322,454 | $ — | $ — | $ 2,322,454 |
Information Technology | 71,458,035 | 1,416,133 | — | 72,874,168 |
Short-Term Investments (d) | 9,996,730 | — | — | 9,996,730 |
Total | $ 83,777,219 | $ 1,416,133 | $ — | $ 85,193,352 |
There have been no significant transfers between Level 1 and Level 2 fair value measurements during the year ended December 31, 2010.
(d) See Investment Portfolio for additional detailed categorizations.
The accompanying notes are an integral part of the financial statements.
Statement of Assets and Liabilities
as of December 31, 2010 |
Assets |
Investments: Investments in unaffiliated securities, at value (cost $42,878,738) — including $9,072,813 of securities loaned | $ 75,196,622 |
Investment in Daily Assets Fund Institutional (cost $9,321,665)* | 9,321,665 |
Investment in Central Cash Management Fund (cost $675,065) | 675,065 |
Total investments, at value (cost $52,875,468) | 85,193,352 |
Cash | 3,103 |
Foreign currency, at value (cost $9,181) | 9,138 |
Receivable for Fund shares sold | 128 |
Interest receivable | 4,770 |
Other assets | 406 |
Total assets | 85,210,897 |
Liabilities |
Payable upon return of securities loaned | 9,321,665 |
Payable for Fund shares redeemed | 72,412 |
Accrued management fee | 42,305 |
Other accrued expenses and payables | 74,447 |
Total liabilities | 9,510,829 |
Net assets, at value | $ 75,700,068 |
Net Assets Consist of |
Distributions in excess of net investment income | (79) |
Net unrealized appreciation (depreciation) on: Investments | 32,317,884 |
Foreign currency | (43) |
Accumulated net realized gain (loss) | (108,783,810) |
Paid-in capital | 152,166,116 |
Net assets, at value | $ 75,700,068 |
Class A Net Asset Value, offering and redemption price per share ($75,572,811 ÷ 6,893,997 outstanding shares of beneficial interest, no par value, unlimited number of shares authorized) | $ 10.96 |
Class B Net Asset Value, offering and redemption price per share ($127,257 ÷ 11,963 outstanding shares of beneficial interest, no par value, unlimited number of shares authorized) | $ 10.64 |
* Represents collateral on securities loaned.
The accompanying notes are an integral part of the financial statements.
Statement of Operations
for the year ended December 31, 2010 |
Investment Income |
Income: Dividends (net of foreign taxes withheld of $607) | $ 442,108 |
Income distributions — Central Cash Management Fund | 974 |
Securities lending income, including income from Daily Assets Fund Institutional, net of borrower rebates | 29,747 |
Total income | 472,829 |
Expenses: Management fee | 484,850 |
Administration fee | 72,910 |
Services to shareholders | 2,813 |
Distribution service fee (Class B) | 2,449 |
Record keeping fees (Class B) | 962 |
Custodian fee | 10,843 |
Legal fees | 9,743 |
Audit and tax fees | 52,788 |
Trustees' fees and expenses | 5,376 |
Reports to shareholders | 24,990 |
Other | 17,141 |
Total expenses | 684,865 |
Net investment income (loss) | (212,036) |
Realized and Unrealized Gain (Loss) |
Net realized gain (loss) from: Investments | 7,855,733 |
Foreign currency | 3,739 |
Payments by affiliate (see Note I) | 1,507 |
| 7,860,979 |
Change in net unrealized appreciation (depreciation) on: Investments | 4,413,329 |
Foreign currency | (5,229) |
| 4,408,100 |
Net gain (loss) | 12,269,079 |
Net increase (decrease) in net assets resulting from operations | $ 12,057,043 |
The accompanying notes are an integral part of the financial statements.
Statement of Changes in Net Assets
Increase (Decrease) in Net Assets | Years Ended December 31, |
2010 | 2009 |
Operations: Net investment income (loss) | $ (212,036) | $ 43,997 |
Net realized gain (loss) | 7,860,979 | (13,132,543) |
Net unrealized appreciation (depreciation) | 4,408,100 | 45,141,538 |
Net increase (decrease) in net assets resulting from operations | 12,057,043 | 32,052,992 |
Distributions to shareholders from: Net investment income: Class A | (30,198) | — |
Fund share transactions: Class A Proceeds from shares sold | 4,885,683 | 8,267,890 |
Reinvestment of distributions | 30,198 | — |
Payments for shares redeemed | (19,283,343) | (20,829,816) |
Net increase (decrease) in net assets from Class A share transactions | (14,367,462) | (12,561,926) |
Class B Proceeds from shares sold | 154,027 | 696,779 |
Payments for shares redeemed | (2,934,016) | (561,458) |
Net increase (decrease) in net assets from Class B share transactions | (2,779,989) | 135,321 |
Increase (decrease) in net assets | (5,120,606) | 19,626,387 |
Net assets at beginning of period | 80,820,674 | 61,194,287 |
Net assets at end of period (including distributions in excess of net investment income and undistributed net investment income of $79 and $24,841, respectively) | $ 75,700,068 | $ 80,820,674 |
Other Information |
Class A Shares outstanding at beginning of period | 8,447,123 | 10,336,451 |
Shares sold | 509,793 | 1,071,894 |
Shares issued to shareholders in reinvestment of distributions | 3,065 | — |
Shares redeemed | (2,065,984) | (2,961,222) |
Net increase (decrease) in Class A shares | (1,553,126) | (1,889,328) |
Shares outstanding at end of period | 6,893,997 | 8,447,123 |
Class B Shares outstanding at beginning of period | 309,078 | 290,168 |
Shares sold | 17,099 | 100,046 |
Shares redeemed | (314,214) | (81,136) |
Net increase (decrease) in Class B shares | (297,115) | 18,910 |
Shares outstanding at end of period | 11,963 | 309,078 |
The accompanying notes are an integral part of the financial statements.
Financial Highlights
Class A Years Ended December 31, | 2010 | 2009 | 2008 | 2007 | 2006 |
Selected Per Share Data |
Net asset value, beginning of period | $ 9.24 | $ 5.76 | $ 10.71 | $ 9.37 | $ 9.30 |
Income (loss) from investment operations: Net investment income (loss)a | (.03) | .01 | (.00)* | (.02) | (.01)c |
Net realized and unrealized gain (loss) | 1.75 | 3.47 | (4.95) | 1.36 | .08 |
Total from investment operations | 1.72 | 3.48 | (4.95) | 1.34 | .07 |
Less distributions from: Net investment income | (.00)* | — | — | — | — |
Net asset value, end of period | $ 10.96 | $ 9.24 | $ 5.76 | $ 10.71 | $ 9.37 |
Total Return (%) | 18.66 | 60.42 | (46.22)b | 14.30 | .75c |
Ratios to Average Net Assets and Supplemental Data |
Net assets, end of period ($ millions) | 76 | 78 | 60 | 153 | 165 |
Ratio of expenses before expense reductions (%) | .93 | .84 | 1.01 | .91 | .89 |
Ratio of expenses after expense reductions (%) | .93 | .84 | 1.00 | .91 | .89 |
Ratio of net investment income (loss) (%) | (.29) | .08 | (.01) | (.15) | (.12)c |
Portfolio turnover rate (%) | 23 | 45 | 71 | 91 | 49 |
a Based on average shares outstanding during the period. b Total return would have been lower had certain expenses not been reduced. c Includes non-recurring income from the Advisor recorded as a result of an administrative proceeding regarding disclosure of brokerage allocation practices in connection with sales of DWS Funds. The non-recurring income resulted in an increase in net investment income of $0.017 per share and an increase in the ratio of net investment income of 0.18%. Excluding this non-recurring income, total return would have been 0.19% lower. * Amount is less than $0.005. |
Class B Years Ended December 31, | 2010 | 2009 | 2008 | 2007 | 2006 |
Selected Per Share Data |
Net asset value, beginning of period | $ 9.02 | $ 5.64 | $ 10.53 | $ 9.25 | $ 9.21 |
Income (loss) from investment operations: Net investment income (loss)a | (.06) | (.02) | (.03) | (.05) | (.04)c |
Net realized and unrealized gain (loss) | 1.68 | 3.40 | (4.86) | 1.33 | .08 |
Total from investment operations | 1.62 | 3.38 | (4.89) | 1.28 | .04 |
Net asset value, end of period | $ 10.64 | $ 9.02 | $ 5.64 | $ 10.53 | $ 9.25 |
Total Return (%) | 17.96 | 59.93 | (46.44)b | 13.84 | .43c |
Ratios to Average Net Assets and Supplemental Data |
Net assets, end of period ($ millions) | .1 | 3 | 2 | 3 | 14 |
Ratio of expenses before expense reductions (%) | 1.29 | 1.18 | 1.35 | 1.29 | 1.28 |
Ratio of expenses after expense reductions (%) | 1.29 | 1.18 | 1.35 | 1.29 | 1.28 |
Ratio of net investment income (loss) (%) | (.64) | (.27) | (.35) | (.53) | (.51)c |
Portfolio turnover rate (%) | 23 | 45 | 71 | 91 | 49 |
a Based on average shares outstanding during the period. b Total return would have been lower had certain expenses not been reduced. c Includes non-recurring income from the Advisor recorded as a result of an administrative proceeding regarding disclosure of brokerage allocation practices in connection with sales of DWS Funds. The non-recurring income resulted in an increase in net investment income of $0.017 per share and an increase in the ratio of net investment income of 0.18%. Excluding this non-recurring income, total return would have been 0.19% lower. |
Performance Summary December 31, 2010
DWS Turner Mid Cap Growth VIP
All performance shown is historical, assumes reinvestment of all dividend and capital gain distributions and does not guarantee future results. Investment return and principal value fluctuate with changing market conditions so that, when redeemed, shares may be worth more or less than their original cost. Current performance may be lower or higher than the performance data quoted. Please contact your participating insurance company for the Fund's most recent month-end performance. Performance doesn't reflect charges and fees ("contract charges") associated with the separate account that invests in the Fund or any variable life insurance policy or variable annuity contract for which the Fund is an investment option. These charges and fees will reduce returns.
The gross expense ratio of the Fund, as stated in the fee table of the prospectus dated May 1, 2010 is 0.89% for Class A shares and may differ from the expense ratio disclosed in the Financial Highlights table in this report.
Risk Considerations
Stocks of medium-sized companies involve greater risk than securities of larger, more-established companies. Stocks may decline in value. See the prospectus for details.
Fund returns for all periods shown reflect a fee waiver and/or expense reimbursement. Without this waiver/reimbursement, returns would have been lower.
Growth of an Assumed $10,000 Investment in DWS Turner Mid Cap Growth VIP from 5/1/2001 to 12/31/2010 |
[] DWS Turner Mid Cap Growth VIP — Class A [] Russell Midcap® Growth Index | The Russell Midcap® Growth Index is an unmanaged index that measures the performance of those Russell Midcap companies with higher price-to-book ratios and higher forecasted growth values. The stocks are also members of the Russell 1000 Growth Index. Index returns assume reinvestment of dividends and, unlike fund returns, do not reflect any fees or expenses. It is not possible to invest directly in an index. |
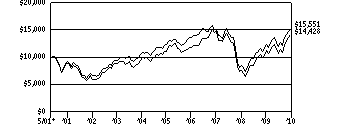 | |
Yearly periods ended December 31 | |
Comparative Results |
DWS Turner Mid Cap Growth VIP | 1-Year | 3-Year | 5-Year | Life of Fund* |
Class A | Growth of $10,000 | $12,900 | $9,774 | $13,092 | $14,428 |
Average annual total return | 29.00% | -0.76% | 5.54% | 3.86% |
Russell Midcap Growth Index | Growth of $10,000 | $12,638 | $10,294 | $12,692 | $15,551 |
Average annual total return | 26.38% | 0.97% | 4.88% | 4.67% |
The growth of $10,000 is cumulative.
* The Fund commenced operations on May 1, 2001. Index returns began on April 30, 2001.
Information About Your Fund's Expenses
DWS Turner Mid Cap Growth VIP
As an investor of the Fund, you incur two types of costs: ongoing expenses and transaction costs. Ongoing expenses include management fees and other Fund expenses. Examples of transaction costs include contract charges, redemption fees and account maintenance fees, which are not shown in this section. The following tables are intended to help you understand your ongoing expenses (in dollars) of investing in the Fund and to help you compare these expenses with the ongoing expenses of investing in other mutual funds. In the most recent six-month period, the Fund limited these expenses; had it not done so, expenses would have been higher. The example in the table is based on an investment of $1,000 invested at the beginning of the six-month period and held for the entire period (July 1, 2010 to December 31, 2010).
The tables illustrate your Fund's expenses in two ways:
• Actual Fund Return. This helps you estimate the actual dollar amount of ongoing expenses (but not transaction costs) paid on a $1,000 investment in the Fund using the Fund's actual return during the period. To estimate the expenses you paid over the period, simply divide your account value by $1,000 (for example, an $8,600 account value divided by $1,000 = 8.6), then multiply the result by the number in the "Expenses Paid per $1,000" line under the share class you hold.
• Hypothetical 5% Fund Return. This helps you to compare your Fund's ongoing expenses (but not transaction costs) with those of other mutual funds using the Fund's actual expense ratio and a hypothetical rate of return of 5% per year before expenses. Examples using a 5% hypothetical Fund return may be found in the shareholder reports of other mutual funds. The hypothetical account values and expenses may not be used to estimate the actual ending account balance or expenses you paid for the period.
Please note that the expenses shown in these tables are meant to highlight your ongoing expenses only and do not reflect any transaction costs. The "Expenses Paid per $1,000" line of the tables is useful in comparing ongoing expenses only and will not help you determine the relative total expense of owning different funds. If these transaction costs had been included, your costs would have been higher.
Expenses and Value of a $1,000 Investment for the six months ended December 31, 2010 |
Actual Fund Return | Class A | |
Beginning Account Value 7/1/10 | $ 1,000.00 | |
Ending Account Value 12/31/10 | $ 1,348.50 | |
Expenses Paid per $1,000* | $ 5.68 | |
Hypothetical 5% Fund Return | Class A | |
Beginning Account Value 7/1/10 | $ 1,000.00 | |
Ending Account Value 12/31/10 | $ 1,020.37 | |
Expenses Paid per $1,000* | $ 4.89 | |
* Expenses are equal to the Fund's annualized expense ratio, multiplied by the average account value over the period, multiplied by the number of days in the most recent six-month period, then divided by 365.
Annualized Expense Ratio | Class A | |
DWS Variable Series II — DWS Turner Mid Cap Growth VIP | .96% | |
For more information, please refer to the Fund's prospectus.
These tables do not reflect charges and fees ("contract charges") associated with the separate account that invests in the Fund or any variable life insurance policy or variable annuity contract for which the Fund is an investment option.
Management Summary December 31, 2010
DWS Turner Mid Cap Growth VIP
Both DWS Turner Mid Cap Growth VIP and the stock market capped 2010 with a strong finish, propelled by a strengthening global economy, robust earnings and a growing bullish sentiment among investors. The Standard & Poor's 500® (S&P 500) Index finished the year with a healthy gain of 15.06%. This is the index's second yearly gain in a row and its fourth over the past five years. The year, although strong, was not without its challenges as investors had to deal with the May 6th "flash crash", financial reform and continued concerns over the health of many European economies. On the other hand, the US Federal Reserve Board (the Fed) continued to be active in the market, with round two of the quantitative easing effort initiated later in the year, and corporate earnings continued to post strong gains.
For 2010, small-cap stocks outpaced both mid- and large-cap stocks. The Russell 2000® Index posted a gain of 26.85% versus 16.10% for the Russell 1000® Index. Growth stocks outperformed value stocks across the market-cap spectrum for the year as investors became more optimistic over the economic rebound and sought out companies with stronger earnings prospects.
With improving economic conditions and a favorable backdrop for companies looking to grow their earnings, the performance of the Fund was strong, with Class A shares returning 29.00%, outpacing the 26.38% return for the Fund's benchmark, the Russell Midcap® Growth Index, as of December 31, 2010 (unadjusted for contract charges). Seven of the nine portfolio sectors outperformed the benchmark, with outperformance largely attributed to strength in the technology sector due to good stock selection.
The technology and financial services sectors contributed the most to relative gains, while the health care sector and producer durables, a Turner Custom Sector, were the lead detractors. A sustained pickup in corporate spending aided the technology sector as our holdings in F5 Networks, Inc., Salesforce.com, Inc. and Cypress Semiconductor Corp. generated strong double-digit returns. Within financial services, the life/health insurance and real estate development industries led the way. Health care was among the worst-performing sectors as unanswered health care reform questions continued to linger over the industry. Electronic production equipment, electrical products and industrial machinery companies detracted.
As before, the Fund emphasizes three types of growth stocks. One, it holds classic growth stocks in industries such as biotechnology and wireless communications that we think have high-return potential for fundamental reasons. Two, it holds stocks of companies gaining market share in their businesses. And three, it holds cyclical stocks in industries such as metals, heavy equipment, bioagriculture, retailing and chemicals that historically have tended to do well as the economy improves.
Christopher K. McHugh
Lead Manager, Turner Investment Partners, Inc.
Subadvisor to the Fund
Tara Hedlund, CFA
Jason Schrotberger, CFA
Portfolio Managers
The Standard & Poor's 500 (S&P 500) Index is an unmanaged, capitalization-weighted index of 500 stocks. The index is designed to measure performance of the broad domestic economy through changes in the aggregate market value of 500 stocks representing all major industries.
The Russell 1000 Index is an unmanaged index that measures the performance of the 1,000 largest companies in the Russell 3000® Index, which represents approximately 92% of the total market capitalization of the Russell 3000 Index.
The Russell Midcap Growth Index is an unmanaged index that measures the performance of those Russell Midcap companies with higher price-to-book ratios and higher forecasted growth values.
Index returns assume reinvestment of dividends and, unlike fund returns, do not reflect any fees or expenses. It is not possible to invest directly in an index.
Portfolio Summary
DWS Turner Mid Cap Growth VIP
Asset Allocation (As a % of Investment Portfolio excluding Securities Lending Collateral) | 12/31/10 | 12/31/09 |
| | |
Common Stocks | 99% | 99% |
Cash Equivalents | 1% | 1% |
| 100% | 100% |
Sector Diversification (As a % of Common Stocks) | 12/31/10 | 12/31/09 |
| | |
Information Technology | 28% | 27% |
Consumer Discretionary | 18% | 16% |
Health Care | 12% | 15% |
Industrials | 11% | 10% |
Financials | 10% | 10% |
Materials | 8% | 6% |
Energy | 6% | 7% |
Consumer Staples | 4% | 7% |
Telecommunication Services | 2% | 1% |
Utilities | 1% | 1% |
| 100% | 100% |
Asset allocation and sector diversification are subject to change.
For more complete details about the Fund's investment portfolio, see page 276.
Following the Fund's fiscal first and third quarter-end, a complete portfolio holdings listing is filed with the SEC on Form N-Q. The form will be available on the SEC's Web site at www.sec.gov, and it also may be reviewed and copied at the SEC's Public Reference Room in Washington, D.C. Information on the operation of the SEC's Public Reference Room may be obtained by calling (800) SEC-0330. The Fund's portfolio holdings are also posted on www.dws-investments.com from time to time. Please see the Fund's current prospectus for more information.
Investment Portfolio December 31, 2010
DWS Turner Mid Cap Growth VIP
| Shares | Value ($) |
| |
Common Stocks 98.8% |
Consumer Discretionary 17.6% |
Auto Components 1.2% |
BorgWarner, Inc.* (a) | 10,260 | 742,414 |
Hotels Restaurants & Leisure 6.5% |
Darden Restaurants, Inc. | 7,510 | 348,764 |
Royal Caribbean Cruises Ltd.* | 12,510 | 587,970 |
Starwood Hotels & Resorts Worldwide, Inc. (a) | 23,700 | 1,440,486 |
WMS Industries, Inc.* | 16,775 | 758,901 |
Wynn Resorts Ltd. | 6,660 | 691,575 |
| 3,827,696 |
Internet & Catalog Retail 1.2% |
Priceline.com, Inc.* | 1,770 | 707,203 |
Media 1.3% |
Interpublic Group of Companies, Inc.* | 75,190 | 798,518 |
Multiline Retail 1.5% |
Nordstrom, Inc. (a) | 20,850 | 883,623 |
Specialty Retail 3.7% |
Abercrombie & Fitch Co. "A" (a) | 13,290 | 765,903 |
Dick's Sporting Goods, Inc.* | 14,010 | 525,375 |
Guess?, Inc. | 18,850 | 891,982 |
| 2,183,260 |
Textiles, Apparel & Luxury Goods 2.2% |
Coach, Inc. | 23,230 | 1,284,851 |
Consumer Staples 3.8% |
Beverages 0.5% |
Hansen Natural Corp.* | 6,020 | 314,726 |
Food & Staples Retailing 1.2% |
Whole Foods Market, Inc.* | 13,890 | 702,695 |
Food Products 2.1% |
Green Mountain Coffee Roasters, Inc.* | 15,560 | 511,302 |
Mead Johnson Nutrition Co. | 11,210 | 697,822 |
| 1,209,124 |
Energy 6.3% |
Energy Equipment & Services 1.0% |
Cameron International Corp.* | 11,800 | 598,614 |
Oil, Gas & Consumable Fuels 5.3% |
Alpha Natural Resources, Inc.* | 10,860 | 651,926 |
Cimarex Energy Co. | 7,810 | 691,419 |
Concho Resources, Inc.* | 9,200 | 806,564 |
QEP Resources, Inc. | 12,800 | 464,768 |
Whiting Petroleum Corp.* | 4,190 | 491,026 |
| 3,105,703 |
Financials 9.5% |
Capital Markets 3.4% |
Invesco Ltd. | 27,690 | 666,221 |
T. Rowe Price Group, Inc. (a) | 20,340 | 1,312,744 |
| 1,978,965 |
Commercial Banks 0.9% |
M&T Bank Corp. | 6,290 | 547,545 |
Consumer Finance 0.7% |
Discover Financial Services | 23,040 | 426,931 |
| Shares | Value ($) |
| |
Diversified Financial Services 2.1% |
IntercontinentalExchange, Inc.* | 6,140 | 731,581 |
MSCI, Inc. "A"* | 12,530 | 488,169 |
| 1,219,750 |
Insurance 1.3% |
Aon Corp. | 8,820 | 405,808 |
Unum Group | 16,060 | 388,973 |
| 794,781 |
Real Estate Management & Development 1.1% | |
CB Richard Ellis Group, Inc. "A"* | 32,550 | 666,624 |
Health Care 11.7% |
Biotechnology 2.7% |
Alexion Pharmaceuticals, Inc.* (a) | 9,880 | 795,834 |
Onyx Pharmaceuticals, Inc.* | 7,680 | 283,161 |
United Therapeutics Corp.* | 8,340 | 527,255 |
| 1,606,250 |
Health Care Equipment & Supplies 1.8% |
Intuitive Surgical, Inc.* | 1,790 | 461,372 |
Varian Medical Systems, Inc.* | 8,400 | 581,952 |
| 1,043,324 |
Health Care Providers & Services 4.2% |
AMERIGROUP Corp.* | 8,610 | 378,151 |
AmerisourceBergen Corp. | 19,480 | 664,658 |
Emergency Medical Services Corp. "A"* | 5,550 | 358,586 |
Laboratory Corp. of America Holdings* | 3,960 | 348,163 |
Universal Health Services, Inc. "B" | 17,110 | 742,916 |
| 2,492,474 |
Life Sciences Tools & Services 0.9% |
Charles River Laboratories International, Inc.* | 6,550 | 232,787 |
Illumina, Inc.* | 4,670 | 295,798 |
| 528,585 |
Pharmaceuticals 2.1% |
Hospira, Inc.* | 9,020 | 502,324 |
Valeant Pharmaceuticals International, Inc. | 12,560 | 355,322 |
Watson Pharmaceuticals, Inc.* | 7,620 | 393,573 |
| 1,251,219 |
Industrials 10.6% |
Aerospace & Defense 1.2% |
Goodrich Corp. | 8,480 | 746,834 |
Airlines 1.4% |
United Continental Holdings, Inc.* | 33,936 | 808,355 |
Machinery 4.5% |
Cummins, Inc. | 10,330 | 1,136,403 |
Joy Global, Inc. | 11,890 | 1,031,458 |
Parker Hannifin Corp. | 5,810 | 501,403 |
| 2,669,264 |
Professional Services 0.8% |
Manpower, Inc. | 7,200 | 451,872 |
Road & Rail 0.8% |
Canadian Pacific Railway Ltd. | 7,240 | 469,224 |
| Shares | Value ($) |
| |
Trading Companies & Distributors 1.9% |
Fastenal Co. (a) | 13,390 | 802,195 |
WESCO International, Inc.* | 5,760 | 304,128 |
| 1,106,323 |
Information Technology 28.1% |
Communications Equipment 6.3% |
Acme Packet, Inc.* | 8,270 | 439,633 |
Aruba Networks, Inc.* | 28,110 | 586,937 |
F5 Networks, Inc.* | 12,600 | 1,640,016 |
Finisar Corp.* | 13,120 | 389,533 |
Juniper Networks, Inc.* | 11,990 | 442,671 |
Riverbed Technology, Inc.* | 5,950 | 209,261 |
| 3,708,051 |
Computers & Peripherals 3.4% |
NetApp, Inc.* (a) | 18,210 | 1,000,821 |
SanDisk Corp.* | 20,230 | 1,008,668 |
| 2,009,489 |
Electronic Equipment, Instruments & Components 0.6% | |
Aeroflex Holding Corp.* | 20,500 | 337,225 |
Internet Software & Services 2.7% |
Akamai Technologies, Inc.* | 7,620 | 358,521 |
LogMeIn, Inc.* | 9,350 | 414,579 |
MercadoLibre, Inc.* (a) | 4,270 | 284,596 |
OpenTable, Inc.* | 1,650 | 116,292 |
VeriSign, Inc. | 12,300 | 401,841 |
| 1,575,829 |
IT Services 0.9% |
VeriFone Systems, Inc.* | 13,290 | 512,462 |
Semiconductors & Semiconductor Equipment 10.5% | |
ASML Holding NV (NY Registered Shares) (a) | 20,810 | 797,855 |
Atheros Communications* | 22,530 | 809,278 |
Broadcom Corp. "A" | 17,150 | 746,883 |
Cree, Inc.* | 4,730 | 311,660 |
Cypress Semiconductor Corp.* | 50,140 | 931,601 |
First Solar, Inc.* (a) | 1,550 | 201,717 |
Lam Research Corp.* | 15,670 | 811,393 |
Netlogic Microsystems, Inc.* | 22,230 | 698,244 |
Varian Semiconductor Equipment Associates, Inc.* | 24,730 | 914,268 |
| 6,222,899 |
| Shares | Value ($) |
| |
Software 3.7% |
Fortinet, Inc.* | 11,110 | 359,408 |
Salesforce.com, Inc.* | 9,790 | 1,292,280 |
SuccessFactors, Inc.* | 19,030 | 551,109 |
| 2,202,797 |
Materials 8.3% |
Chemicals 2.7% |
CF Industries Holdings, Inc. | 7,300 | 986,595 |
LyondellBasell Industries NV* | 17,390 | 598,216 |
| 1,584,811 |
Metals & Mining 5.6% |
Cliffs Natural Resources, Inc. (a) | 10,920 | 851,869 |
Silver Wheaton Corp.* | 10,820 | 422,413 |
United States Steel Corp. (a) | 13,690 | 799,770 |
Walter Energy, Inc. | 9,770 | 1,248,997 |
| 3,323,049 |
Telecommunication Services 2.3% |
Wireless Telecommunication Services |
Crown Castle International Corp.* | 19,260 | 844,166 |
NII Holdings, Inc.* | 11,200 | 500,192 |
| 1,344,358 |
Utilities 0.6% |
Gas Utilities |
Questar Corp. | 21,780 | 379,190 |
Total Common Stocks (Cost $36,798,115) | 58,366,907 |
|
Securities Lending Collateral 16.1% |
Daily Assets Fund Institutional, 0.27% (b) (c) (Cost $9,501,633) | 9,501,633 | 9,501,633 |
|
Cash Equivalents 1.2% |
Central Cash Management Fund, 0.19% (b) (Cost $682,786) | 682,786 | 682,786 |
| % of Net Assets | Value ($) |
| |
Total Investment Portfolio (Cost $46,982,534)+ | 116.1 | 68,551,326 |
Other Assets and Liabilities, Net | (16.1) | (9,506,407) |
Net Assets | 100.0 | 59,044,919 |
* Non-income producing security.
+ The cost for federal income tax purposes was $47,461,113. At December 31, 2010, net unrealized appreciation for all securities based on tax cost was $21,090,213. This consisted of aggregate gross unrealized appreciation for all securities in which there was an excess of value over tax cost of $21,587,307 and aggregate gross unrealized depreciation for all securities in which there was an excess of tax cost over value of $497,094.
(a) All or a portion of these securities were on loan (see Notes to Financial Statements). The value of all securities loaned at December 31, 2010 amounted to $9,276,096, which is 15.7% of net assets.
(b) Affiliated fund managed by Deutsche Investment Management Americas Inc. The rate shown is the annualized seven-day yield at period end.
(c) Represents collateral held in connection with securities lending. Income earned by the Fund is net of borrower rebates.
Fair Value Measurements
Various inputs are used in determining the value of the Fund's investments. These inputs are summarized in three broad levels. Level 1 includes quoted prices in active markets for identical securities. Level 2 includes other significant observable inputs (including quoted prices for similar securities, interest rates, prepayment speeds, and credit risk). Level 3 includes significant unobservable inputs (including the Fund's own assumptions in determining the fair value of investments). The inputs or methodology used for valuing securities are not necessarily an indication of the risk associated with investing in those securities.
The following is a summary of the inputs used as of December 31, 2010 in valuing the Fund's investments. For information on the Fund's policy regarding the valuation of investments, please refer to the Security Valuation section of Note A in the accompanying Notes to Financial Statements.
Assets | Level 1 | Level 2 | Level 3 | Total |
|
Common Stocks (d) | $ 58,366,907 | $ — | $ — | $ 58,366,907 |
Short-Term Investments (d) | 10,184,419 | — | — | 10,184,419 |
Total | $ 68,551,326 | $ — | $ — | $ 68,551,326 |
There have been no significant transfers between Level 1 and Level 2 fair value measurements during the year ended December 31, 2010.
(d) See Investment Portfolio for additional detailed categorizations.
The accompanying notes are an integral part of the financial statements.
Statement of Assets and Liabilities
as of December 31, 2010 |
Assets |
Investments: Investments in unaffiliated securities, at value (cost $36,798,115) — including $9,276,096 of securities loaned | $ 58,366,907 |
Investment in Daily Assets Fund Institutional (cost $9,501,633)* | 9,501,633 |
Investment in Central Cash Management Fund (cost $682,786) | 682,786 |
Total investments, at value (cost $46,982,534) | 68,551,326 |
Cash | 10,000 |
Receivable for investments sold | 312,238 |
Dividends receivable | 12,654 |
Interest receivable | 740 |
Other assets | 286 |
Total assets | 68,887,244 |
Liabilities |
Payable upon return of securities loaned | 9,501,633 |
Payable for investments purchased | 155,357 |
Payable for Fund shares redeemed | 83,068 |
Accrued management fee | 40,161 |
Other accrued expenses and payables | 62,106 |
Total liabilities | 9,842,325 |
Net assets, at value | $ 59,044,919 |
Net Assets Consist of |
Net unrealized appreciation (depreciation) on: Investments | 21,568,792 |
Foreign currency | 10 |
Accumulated net realized gain (loss) | (16,197,182) |
Paid-in capital | 53,673,299 |
Net assets, at value | $ 59,044,919 |
Class A Net Asset Value, offering and redemption price per share ($59,044,919 ÷ 6,033,131 outstanding shares of beneficial interest, no par value, unlimited number of shares authorized) | $ 9.79 |
* Represents collateral on securities loaned.
The accompanying notes are an integral part of the financial statements.
Statement of Operations
for the year ended December 31, 2010 |
Investment Income |
Income: Dividends (net of foreign taxes withheld of $3,538) | $ 408,183 |
Income distributions — Central Cash Management Fund | 2,018 |
Securities lending income, including income from Daily Assets Fund Institutional, net of borrower rebates | 1,716 |
Total income | 411,917 |
Expenses: Management fee | 368,747 |
Administration fee | 51,573 |
Services to shareholders | 1,911 |
Custodian fee | 12,628 |
Legal fees | 7,226 |
Audit and tax fees | 46,905 |
Trustees' fees and expenses | 3,784 |
Reports to shareholders | 13,380 |
Other | 3,465 |
Total expenses before expense reductions | 509,619 |
Expense reductions | (679) |
Total expenses after expense reductions | 508,940 |
Net investment income (loss) | (97,023) |
Realized and Unrealized Gain (Loss) |
Net realized gain (loss) from investments: Investments | 6,420,921 |
Foreign currency | 35 |
| 6,420,956 |
Change in net unrealized appreciation (depreciation) on: Investments | 7,106,878 |
Foreign currency | 10 |
| 7,106,888 |
Net gain (loss) | 13,527,844 |
Net increase (decrease) in net assets resulting from operations | $ 13,430,821 |
The accompanying notes are an integral part of the financial statements.
Statement of Changes in Net Assets
Increase (Decrease) in Net Assets | Years Ended December 31, |
2010 | 2009 |
Operations: Net investment income (loss) | $ (97,023) | $ 10,140 |
Net realized gain (loss) | 6,420,956 | (5,079,785) |
Change in net unrealized appreciation (depreciation) | 7,106,888 | 23,095,058 |
Net increase (decrease) in net assets resulting from operations | 13,430,821 | 18,025,413 |
Distributions to shareholders from: Net investment income: Class A | (7,813) | — |
Total distributions | (7,813) | — |
Fund share transactions: Class A Proceeds from shares sold | 4,327,117 | 3,565,715 |
Shares issued to shareholders in reinvestment of distributions | 7,813 | — |
Payments for shares redeemed | (9,376,315) | (19,620,216) |
Shares converted* | — | 5,097 |
Net increase (decrease) in net assets from Class A share transactions | (5,041,385) | (16,049,404) |
Class B Payments for shares redeemed | — | (21) |
Shares converted* | — | (5,097) |
Net increase (decrease) in net assets from Class B share transactions | — | (5,118) |
Increase (decrease) in net assets | 8,381,623 | 1,970,891 |
Net assets at beginning of period | 50,663,296 | 48,692,405 |
Net assets at end of period (including undistributed net investment income of $0 and $4,590, respectively) | $ 59,044,919 | $ 50,663,296 |
Other Information |
Class A Shares outstanding at beginning of period | 6,675,631 | 9,629,198 |
Shares sold | 522,352 | 533,210 |
Shares issued to shareholders in reinvestment of distributions | 906 | — |
Shares redeemed | (1,165,758) | (3,488,014) |
Shares converted* | — | 1,237 |
Net increase (decrease) in Class A shares | (642,500) | (2,953,567) |
Shares outstanding at end of period | 6,033,131 | 6,675,631 |
Class B Shares outstanding at beginning of period | — | 1,306 |
Shares redeemed | — | (5) |
Shares converted* | — | (1,301) |
Net increase (decrease) in Class B shares | — | (1,306) |
Shares outstanding at end of period | — | — |
* On March 6, 2009, Class B shares converted into Class A shares.
The accompanying notes are an integral part of the financial statements.
Financial Highlights
Class A Years Ended December 31, | 2010 | 2009 | 2008 | 2007 | 2006 |
Selected Per Share Data |
Net asset value, beginning of period | $ 7.59 | $ 5.06 | $ 12.55 | $ 10.92 | $ 11.02 |
Income (loss) from investment operations: Net investment income (loss)a | (.02) | .00* | (.01) | (.04) | (.01) |
Net realized and unrealized gain (loss) | 2.22 | 2.53 | (5.28) | 2.64 | .77 |
Total from investment operations | 2.20 | 2.53 | (5.29) | 2.60 | .76 |
Less distributions from: Net investment income | (.00)* | — | — | — | — |
Net realized gains | — | — | (2.20) | (.97) | (.86) |
Tax return of capital | — | — | (.00)* | — | — |
Total distributions | (.00)* | — | (2.20) | (.97) | (.86) |
Net asset value, end of period | $ 9.79 | $ 7.59 | $ 5.06 | $ 12.55 | $ 10.92 |
Total Return (%) | 29.00b | 50.00 | (49.49)b | 25.75 | 6.52 |
Ratios to Average Net Assets and Supplemental Data |
Net assets, end of period ($ millions) | 59 | 51 | 49 | 129 | 117 |
Ratio of expenses before expense reductions (%) | .99 | .89 | 1.03 | .95 | .97 |
Ratio of expenses after expense reductions (%) | .99 | .89 | 1.00 | .95 | .97 |
Ratio of net investment income (loss) (%) | (.19) | .02 | (.14) | (.36) | (.06) |
Portfolio turnover rate (%) | 96 | 86 | 156 | 133 | 148 |
a Based on average shares outstanding during the period. b Total return would have been lower had certain expenses not been reduced. * Amount is less than $.005. |
Notes to Financial Statements
A. Organization and Significant Accounting Policies
DWS Variable Series II (the "Trust") is registered under the Investment Company Act of 1940, as amended (the "1940 Act"), as an open-end management investment company organized as a Massachusetts business trust. The Trust offers seventeen funds (hereinafter referred to individually as "Fund" or collectively as "Funds"), including DWS Alternative Asset Allocation Plus VIP that invests primarily in existing affiliated DWS Funds ("Underlying Funds") and exchange-traded funds ("ETFs"). Each Underlying Fund's accounting policies and investment holdings are outlined in the Underlying Fund's financial statements and are available upon request. Each Fund (except DWS Technology VIP) is classified as a diversified open-end management investment company. DWS Technology VIP is classified as a non-diversified, open-end management investment company.
Multiple Classes of Shares of Beneficial Interest. Certain Funds of the Trust offer two classes of shares (Class A shares and Class B shares). Effective February 5, 2010, Class B shares of DWS Core Fixed Income VIP were converted into the Class A shares of the same Fund. Sales of Class B shares are subject to record keeping fees up to 0.15% and Rule 12b-1 fees under the 1940 Act equal to an annual rate of 0.25%, of the average daily net assets of the Class B shares of the applicable Fund. Class A shares are not subject to such fees.
Investment income, realized and unrealized gains and losses, and certain fund-level expenses and expense reductions, if any, are borne pro rata on the basis of relative net assets by the holders of all classes of shares except that each class bears certain expenses unique to that class (including the applicable Rule 12b-1 fee and record keeping fees). Differences in class-level expenses may result in payment of different per share dividends by class. All shares have equal rights with respect to voting subject to class-specific arrangements.
The Trust's financial statements are prepared in accordance with accounting principles generally accepted in the United States of America which require the use of management estimates. Actual results could differ from those estimates. The policies described below are followed consistently by the Trust in the preparation of its financial statements.
Security Valuation. Investments are stated at value determined as of the close of regular trading on the New York Stock Exchange on each day the exchange is open for trading.
Various inputs are used in determining the value of the Funds' investments. These inputs are summarized in three broad levels. Level 1 includes quoted prices in active markets for identical securities. Level 2 includes other significant observable inputs (including quoted prices for similar securities, interest rates, prepayment speeds, and credit risk). Level 3 includes significant unobservable inputs (including the Funds' own assumptions in determining the fair value of investments). The inputs or methodology used for valuing securities are not necessarily an indication of the risk associated with investing in those securities.
DWS Money Market VIP values all securities utilizing the amortized cost method permitted in accordance with Rule 2a-7 under the 1940 Act and certain conditions therein. Under this method, which does not take into account unrealized capital gains or losses on securities, an instrument is initially valued at its cost and thereafter assumes a constant accretion/amortization rate to maturity of any discount or premium. Securities held by a money market fund are reflected as Level 2 because the securities are valued at amortized cost (which approximates fair value) and, accordingly, the inputs used to determine value are not quoted prices in an active market.
Equity securities and ETFs are valued at the most recent sale price or official closing price reported on the exchange (US or foreign) or over-the-counter market on which they trade and are categorized as Level 1 securities. Securities or ETFs for which no sales are reported are valued at the calculated mean between the most recent bid and asked quotations on the relevant market or, if a mean cannot be determined, at the most recent bid quotation. For certain international equity securities, in order to adjust for events which may occur between the close of the foreign exchanges and the close of the New York Stock Exchange, a fair valuation model may be used. This fair valuation model takes into account comparisons to the valuation of American Depository Receipts (ADRs), exchange-traded funds, futures contracts and certain indices and these securities are categorized as Level 2.
Debt securities are valued by independent pricing services approved by the Funds' Board. If the pricing services are unable to provide valuations, securities are valued at the most recent bid quotation or evaluated price, as applicable, obtained from one or more broker-dealers. Such services may use various pricing techniques which take into account appropriate factors such as yield, quality, coupon rate, maturity, type of issue, trading characteristics and other data, as well as broker quotes. These securities are generally categorized as Level 2.
Futures contracts are generally valued at the settlement prices established each day on the exchange on which they are traded and are categorized as Level 1.
Forward currency contracts are valued at the prevailing forward exchange rate of the underlying currencies and are categorized as Level 2.
Swap contracts are valued daily based upon prices supplied by a Board approved pricing vendor, if available, and otherwise are valued at the price provided by the broker-dealer. Swap contracts are generally categorized as Level 2.
Exchange-traded options are valued at the last sale price or, in the absence of a sale, the mean between the closing bid and asked prices or at the most recent asked price (bid for purchased options) if no bid or asked price are available. Exchange-traded options are categorized as Level 1. Over-the-counter written or purchased options are valued based upon a price provided by the broker-dealer with which the option, was traded and are generally categorized as Level 3.
Money market instruments purchased with an original or remaining maturity of sixty days or less, maturing at par, are valued at amortized cost, which approximates value, and are categorized as Level 2. Investments in open-end investment companies are valued at their net asset value each business day and are categorized as Level 1.
Investments in the Underlying Funds are valued at the net asset value per share of each class of the Underlying Funds and are categorized as Level 1.
Securities and other assets for which market quotations are not readily available or for which the above valuation procedures are deemed not to reflect fair value are valued in a manner that is intended to reflect their fair value as determined in accordance with procedures approved by the Board and are generally categorized as Level 3. In accordance with each Fund's valuation procedures, factors used in determining value may include, but are not limited to, the type of the security; the size of the holding; the initial cost of the security; the existence of any contractual restrictions on the security's disposition; the price and extent of public trading in similar securities of the issuer or of comparable companies; quotations or evaluated prices from broker-dealers and/or pricing services; information obtained from the issuer, analysts, and/or the appropriate stock exchange (for exchange-traded securities); an analysis of the company's or issuer's financial statements; an evaluation of the forces that influence the issuer and the market(s) in which the security is purchased and sold and with respect to debt securities; the maturity, coupon, creditworthiness, currency denomination and the movement of the market in which the security is normally traded. The value determined under these procedures may differ from published values for the same securities.
Disclosure about the classification of fair value measurements is included in a table following the Funds' Investment Portfolio.
Foreign Currency Translations. The books and records of the Trust are maintained in US dollars. Investment securities and other assets and liabilities denominated in a foreign currency are translated into US dollars at the prevailing exchange rates at period end. Purchases and sales of investment securities, income and expenses are translated into US dollars at the prevailing exchange rates on the respective dates of the transactions.
Net realized and unrealized gains and losses on foreign currency transactions represent net gains and losses between trade and settlement dates on securities transactions, the disposition of forward foreign currency exchange contracts and foreign currencies, and the difference between the amount of net investment income accrued and the US dollar amount actually received. That portion of both realized and unrealized gains and losses on investments that results from fluctuations in foreign currency exchange rates is not separately disclosed but is included with net realized and unrealized gain/appreciation and loss/depreciation on investments.
Repurchase Agreements. Each Fund may enter into repurchase agreements with certain banks and broker/dealers whereby each Fund, through its custodian or sub-custodian bank, receives delivery of the underlying securities, the amount of which at the time of purchase and each subsequent business day is required to be maintained at such a level that the value is equal to at least the principal amount of the repurchase price plus accrued interest. The custodian bank holds the collateral in a separate account until the agreement matures. If the value of the securities falls below the principal amount of the repurchase agreement plus accrued interest, the financial institution deposits additional collateral by the following business day. If the financial institution either fails to deposit the required additional collateral or fails to repurchase the securities as agreed, the Fund has the right to sell the securities and recover any resulting loss from the financial institution. If the financial institution enters into bankruptcy, the Fund's claim on the collateral may be subject to legal proceedings.
Securities Lending. Each Fund, except DWS Money Market VIP and DWS Alternative Asset Allocation Plus VIP, lends securities to certain financial institutions. The Fund retains beneficial ownership of the securities it has loaned and continues to receive interest and dividends paid by the issuer of securities and to participate in any changes in their market value. The Fund requires the borrowers of the securities to maintain collateral with the Fund consisting of either cash or liquid, unencumbered assets having a value at least equal to the value of the securities loaned. When the collateral falls below specified amounts, the lending agent will use its best effort to obtain additional collateral on the next business day to meet required amounts under the security lending agreement. The Fund may invest the cash collateral into a joint trading account in an affiliated money market fund pursuant to Exemptive Orders issued by the SEC. The Fund receives compensation for lending its securities either in the form of fees or by earning interest on invested cash collateral net of borrower rebates and fees paid to a lending agent. Either the Fund or the borrower may terminate the loan. There may be risks of delay and costs in recovery of securities or even loss of rights in the collateral should the borrower of the securities fail financially. The Fund is also subject to all investment risks associated with the reinvestment of any cash collateral received, including, but not limited to, interest rate, credit and liquidity risk associated with such investments. DWS Government & Agency Securities VIP had no securities on loan as of December 31, 2010.
Loan Participations and Assignments. DWS Balanced VIP, DWS High Income VIP and DWS Strategic Income VIP invest in Loan Participations and Assignments. Loan Participations and Assignments are portions of loans originated by banks and sold in pieces to investors. These US dollar-denominated fixed and floating rate loans ("Loans") in which the Fund invests, are arranged between the borrower and one or more financial institutions ("Lenders"). These Loans may take the form of Senior Loans, which are corporate obligations often issued in connection with recapitalizations, acquisitions, leveraged buy-outs and refinancings, and Sovereign Loans, which are debt instruments between a foreign sovereign entity and one or more financial institutions. The Fund invests in such Loans in the form of participations in Loans ("Participations") or assignments of all or a portion of Loans from third parties ("Assignments"). Participations typically result in the Fund having a contractual relationship only with the Lender, not with the borrower. The Fund has the right to receive payments of principal, interest and any fees to which it is entitled from the Lender selling the Participation and only upon receipt by the Lender of the payments from the borrower. In connection with purchasing Participations, the Fund generally has no right to enforce compliance by the borrower with the terms of the loan agreement relating to the Loan, or any rights of set-off against the borrower, and the Fund will not benefit directly from any collateral supporting the Loan in which it has purchased the Participation. As a result, the Fund assumes the credit risk of both the borrower and the Lender that is selling the Participation. Assignments typically result in the Fund having a direct contractual relationship with the borrower, and the Fund may enforce compliance by the borrower with the terms of the loan agreement. All Loan Participations and Assignments involve interest rate risk, liquidity risk and credit risk, including the potential default or insolvency of the borrower.
Participatory Notes. DWS Global Thematic VIP invests in Participatory Notes (P-Notes). P-Notes are promissory notes designed to offer a return linked to the performance of a particular underlying equity security or market. P-Notes are issued by banks or broker-dealers and allow the Fund to gain exposure to local shares in foreign markets. Investments in P-Notes involve the same risks associated with a direct investment in the underlying foreign companies or foreign markets that they seek to replicate. Although each participation note is structured with a defined maturity date, early redemption may be possible. Risks associated with participation notes include the possible failure of a counterparty to perform in accordance with the terms of the agreement and potential delays or an inability to redeem before maturity under certain market conditions.
Mortgage Dollar Rolls. DWS Balanced VIP, DWS Core Fixed Income VIP and DWS Government & Agency Securities VIP may enter into mortgage dollar rolls in which the Fund sells to a bank or broker/dealer (the "counterparty") mortgage-backed securities for delivery in the current month and simultaneously contracts to repurchase similar, but not identical, securities on a fixed date. The counterparty receives all principal and interest payments, including prepayments, made on the security while it is the holder. The Fund receives compensation as consideration for entering into the commitment to repurchase. The compensation is paid in the form of a lower price for the security upon its repurchase, or alternatively, a fee. Mortgage dollar rolls may be renewed with a new sale and repurchase price and a cash settlement made at each renewal without physical delivery of the securities subject to the contract.
Certain risks may arise upon entering into mortgage dollar rolls from the potential inability of counterparties to meet the terms of their commitments. Additionally, the value of such securities may change adversely before the Fund is able to repurchase them. There can be no assurance that the Fund's use of the cash that it receives from a mortgage dollar roll will provide a return that exceeds its costs.
When-Issued/Delayed Delivery Securities. DWS Balanced VIP, DWS Core Fixed Income VIP, DWS Government & Agency Securities VIP, DWS High Income VIP and DWS Strategic Income VIP may purchase securities with delivery or payment to occur at a later date beyond the normal settlement period. At the time the Fund enters into a commitment to purchase a security, the transaction is recorded and the value of the security is reflected in the net asset value. The price of such security and the date when the security will be delivered and paid for are fixed at the time the transaction is negotiated. The value of the security may vary with market fluctuations. No interest accrues to the Fund until payment takes place. At the time the Fund enters into this type of transaction it is required to segregate cash or other liquid assets at least equal to the amount of the commitment.
Certain risks may arise upon entering into when-issued or delayed delivery securities from the potential inability of counterparties to meet the terms of their contracts or if the issuer does not issue the securities due to political, economic, or other factors. Additionally, losses may arise due to changes in the value of the underlying securities.
Taxes. Each Fund's policy is to comply with the requirements of the Internal Revenue Code, as amended, which are applicable to regulated investment companies and to distribute all of its taxable income to its shareholders.
Additionally, based on the Funds' understanding of the tax rules and rates related to income, gains and transactions for the foreign jurisdictions in which they invest, the Funds will provide for foreign taxes, and where appropriate, deferred foreign taxes.
At December 31, 2010, the following Funds had an approximate net tax basis capital loss carryforward which may be applied against any realized net taxable capital gains of each succeeding year until fully utilized or until the following expiration dates, whichever occurs first:
Fund | Capital Loss Carryforward ($) | Expiration
Date | Capital Loss Carryforward Utilized ($) | Capital Loss Carryforward Expired ($) |
DWS Balanced VIP | 6,483,000 | 12/31/2016 | 16,309,000 | — |
| 45,045,000 | 12/31/2017 | | |
DWS Blue Chip VIP | 15,813,000 | 12/31/2016 | 10,865,000 | — |
| 32,910,000 | 12/31/2017 | | |
DWS Core Fixed Income VIP | 5,512,000 | 12/31/2016 | 4,494,000 | — |
| 48,195,000 | 12/31/2017 | | |
DWS Diversified International Equity VIP | 30,075,000 | 12/31/2016 | 2,858,000 | — |
| 39,164,000 | 12/31/2017 | | |
DWS Dreman Small Mid Cap Value VIP | 10,090,000 | 12/31/2016 | 30,517,000 | — |
| 93,411,000 | 12/31/2017 | | |
DWS Global Thematic VIP | 35,242,000 | 12/31/2016 | 6,786,000 | — |
| 17,811,000 | 12/31/2017 | | |
DWS Government & Agency Securities VIP | — | — | 1,158,000 | — |
DWS High Income VIP | 13,877,000 | 12/31/2011 | 1,517,000 | 53,591,000 |
| 3,844,000 | 12/31/2014 | | |
| 858,000 | 12/31/2015 | | |
| 17,300,000 | 12/31/2016 | | |
| 17,232,000 | 12/31/2017 | | |
DWS Large Cap Value VIP | 29,003,000 | 12/31/2016 | 7,651,000 | — |
| 12,084,000 | 12/31/2017 | | |
DWS Mid Cap Growth VIP | 18,281,000 | 12/31/2011 | 1,874,000 | — |
| 935,000 | 12/31/2016 | | |
| 6,533,000 | 12/31/2017 | | |
DWS Small Cap Growth VIP | 8,113,000 | 12/31/2016 | 10,901,000 | 55,922,000 |
| 34,287,000 | 12/31/2017 | | |
DWS Strategic Income VIP | 543,000 | 12/31/2017 | 2,458,000 | — |
DWS Strategic Value VIP | 52,455,000 | 12/31/2016 | 15,988,000 | — |
| 88,212,000 | 12/31/2017 | | |
DWS Technology VIP | 71,516,000 | 12/31/2011 | 6,205,000 | 87,294,000 |
| 13,148,000 | 12/31/2016 | | |
| 20,753,000 | 12/31/2017 | | |
DWS Turner Mid Cap Growth VIP | 800,000 | 12/31/2016 | 5,953,000 | — |
| 14,919,000 | 12/31/2017 | | |
In addition, included in DWS Large Cap Value VIP's net tax basis capital loss carryforward of approximately $41,087,000 is $19,469,000 inherited from its merger with DWS Davis Venture Value VIP in fiscal year 2009, which may be applied against any realized net taxable capital gains of each succeeding year until fully utilized or until the above expiration dates, whichever occurs first, subject to certain limitations under Sections 381-384 of the Internal Revenue Code.
In addition, from November 1, 2010 through December 31, 2010, the following Funds incurred net realized capital losses. As permitted by tax regulations, the Funds intend to elect to defer these losses and treat them as arising in the fiscal year ended December 31, 2011.
Fund | |
DWS Global Thematic VIP | $ 43,000 |
DWS High Income VIP | 185,000 |
DWS Strategic Income VIP | 472,000 |
The Funds have reviewed the tax positions for the open tax years as of December 31, 2010 and have determined that no provision for income tax is required in the Funds' financial statements. The Funds' federal tax returns for the prior three fiscal years and for the two fiscal years of DWS Alternative Asset Allocation Plus VIP remain open subject to examination by the Internal Revenue Service.
Distribution of Income and Gains. Distributions of net investment income, if any, for each Fund, except DWS Money Market VIP, are made annually. Net realized gains from investment transactions, in excess of available capital loss carryforwards, would be taxable to each Fund if not distributed and, therefore, will be distributed to shareholders at least annually. Net investment income of DWS Money Market VIP is declared as a daily dividend and is distributed to shareholders monthly. DWS Money Market VIP may take into account capital gains and losses in its daily dividend declarations. Each Fund may also make additional distributions for tax purposes if necessary.
The timing and characterization of certain income and capital gains distributions are determined annually in accordance with federal tax regulations which may differ from accounting principles generally accepted in the United States of America. These differences primarily relate to net operating losses, investments in foreign denominated investments, investments in forward currency contracts, investments in futures contracts, investments in swap contracts, income received from Passive Foreign Investment Companies and Real Estate Investment Trusts and certain securities sold at a loss. As a result, net investment income (loss) and net realized gain (loss) on investment transactions for a reporting period may differ significantly from distributions during such period. Accordingly, each Fund may periodically make reclassifications among certain of its capital accounts without impacting the net asset value of the Fund.
At December 31, 2010, the Funds' components of distributable earnings on a tax basis were as follows:
Fund | Undistributed Ordinary Income ($)* | Undistributed Net Long-Term Capital gains | Capital Loss Carryforwards ($) | Unrealized Appreciation (Depreciation) on Investments ($) |
DWS Alternative Asset Allocation Plus VIP | 426,034 | 99,137 | — | 1,578,944 |
DWS Balanced VIP | 4,560,940 | — | (51,528,000) | 39,560,610 |
DWS Blue Chip VIP | 1,146,935 | — | (48,723,000) | 14,678,739 |
DWS Core Fixed Income VIP | 2,279,173 | — | (53,707,000) | 2,267,700 |
DWS Diversified International Equity VIP | 1,473,946 | — | (69,239,000) | 21,763,626 |
DWS Dreman Small Mid Cap Value VIP | 2,636,612 | — | (103,501,000) | 59,732,698 |
DWS Global Thematic VIP | 363,173 | — | (53,053,000) | 6,218,590 |
DWS Government & Agency Securities VIP | 7,707,477 | 1,262,738 | — | 8,134,116 |
DWS High Income VIP | 16,310,534 | — | (53,111,000) | (2,383,006) |
DWS Large Cap Value VIP | 4,084,211 | — | (41,087,000) | 36,866,114 |
DWS Mid Cap Growth VIP | — | — | (25,749,000) | 8,278,722 |
DWS Small Cap Growth VIP | 516,412 | — | (42,400,000) | 27,549,602 |
DWS Strategic Income VIP | 4,050,541 | — | (543,000) | 2,097,941 |
DWS Strategic Value VIP | 3,522,893 | — | (140,667,000) | 36,835,037 |
DWS Technology VIP | — | — | (105,417,000) | 28,995,869 |
DWS Turner Mid Cap Growth VIP | — | — | (15,719,000) | 21,090,213 |
In addition, the tax character of distributions paid by the Funds is summarized as follows:
| Distributions from Ordinary Income ($)* |
| Years Ended December 31, |
Fund | 2010 | 2009 |
DWS Alternative Asset Allocation Plus VIP | 210,676 | — |
DWS Balanced VIP | 9,827,154 | 11,680,702 |
DWS Blue Chip VIP | 1,577,833 | 2,046,739 |
DWS Core Fixed Income VIP | 5,749,285 | 11,379,976 |
DWS Diversified International Equity VIP | 1,843,687 | 5,187,036 |
DWS Dreman Small Mid Cap Value VIP | 3,285,561 | 4,442,178 |
DWS Global Thematic VIP | 650,285 | 966,170 |
DWS Government & Agency Securities VIP | 8,062,626 | 9,913,871 |
DWS High Income VIP | 15,337,062 | 18,661,430 |
DWS Large Cap Value VIP | 4,122,165 | 2,857,014 |
DWS Money Market VIP | 24,815 | 1,233,830 |
DWS Strategic Income VIP | 4,806,010 | 3,708,667 |
DWS Strategic Value VIP | 5,273,728 | 12,860,410 |
DWS Technology VIP | 30,198 | — |
DWS Turner Mid Cap Growth VIP | 7,813 | — |
* For tax purposes, short-term capital gain distributions are considered ordinary income distributions.
Expenses. Expenses of the Trust arising in connection with a specific fund are allocated to that fund. Other Trust expenses which cannot be directly attributed to a fund are apportioned among the funds in the Trust.
Contingencies. In the normal course of business, each Fund may enter into contracts with service providers that contain general indemnification clauses. The Funds' maximum exposure under these arrangements is unknown as this would involve future claims that may be made against the Funds that have not yet been made. However, based on experience, the Funds expect the risk of loss to be remote.
Real Estate Investment Trusts. DWS Balanced VIP and DWS Dreman Small Mid Cap Value VIP periodically recharacterize distributions received from a Real Estate Investment Trust ("REIT") investment based on information provided by the REIT into the following categories: ordinary income, long-term and short-term capital gains, and return of capital. If information is not available timely from a REIT, the recharacterization will be estimated for financial reporting purposes and a recharacterization will be made to the accounting records in the following year when such information becomes available. Distributions received from REITs in excess of income are recorded as either a reduction of cost of investments or realized gains. The Fund distinguishes between dividends on a tax basis and a financial reporting basis and only distributions in excess of tax basis earnings and profits are reported in the financial statements as a return of capital.
Other. Investment transactions are accounted for on a trade date plus one basis for daily net asset value calculations. However, for financial reporting purposes, investment transactions are reported on trade date. Interest income is recorded on the accrual basis. Dividend income is recorded on the ex-dividend date net of foreign withholding taxes. Certain dividends from foreign securities may be recorded subsequent to the ex-dividend date as soon as the Fund is informed of such dividends. Realized gains and losses from investment transactions are recorded on an identified cost basis. All discounts and premiums are accreted/amortized for both tax and financial reporting purposes for each Fund, with the exception of securities in default of principal. Distributions of income and capital gains from the Underlying Funds are recorded on the ex-dividend date.
B. Derivative Instruments
Interest Rate Swap Contracts. For the year ended December 31, 2010, DWS Government & Agency Securities VIP and DWS Strategic Income VIP entered into interest rate swap transactions to gain exposure to different parts of the yield curve while managing overall duration. The use of interest rate swaps is a highly specialized activity that involves investment techniques and risks different from those associated with ordinary portfolio security transactions. In an interest rate swap, the Fund agrees to pay to the other party to the interest rate swap (which is known as the "counterparty") a fixed rate payment in exchange for the counterparty agreeing to pay to the Fund a variable rate payment, or the Fund agrees to receive from the counterparty a fixed rate payment in exchange for the counterparty agreeing to receive from the Fund a variable rate payment. The payment obligations are based on the notional amount of the swap. Certain risks may arise when entering into swap transactions including counterparty default, liquidity or unfavorable changes in interest rates. In connection with these agreements, securities and or cash may be identified as collateral in accordance with the terms of the swap agreements to provide assets of value and recourse in the event of default. The maximum counterparty credit risk is the net present value of the cash flows to be received from or paid to the counterparty over the term of the interest rate swap contract, to the extent that this amount is beneficial to the Fund, in addition to any related collateral posted to the counterparty by the Fund. This risk may be partially reduced by a master netting arrangement between the Fund and the counterparty. The value of the swap is adjusted daily and the change in value, if any, is recorded as unrealized appreciation or depreciation in the Statement of Assets and Liabilities. An upfront payment made by the Fund is recorded as an asset in the Statement of Assets and Liabilities. An upfront payment received by the Fund is recorded as a liability in the Statement of Assets and Liabilities. Payments received or made at the end of the measurement period are recorded as realized gain or loss in the Statement of Operations.
A summary of the open interest rate swap contracts as of December 31, 2010 is included in a table following the Investment Portfolio for DWS Government & Agency Securities VIP and DWS Strategic Income VIP. For the year ended December 31, 2010, DWS Government & Agency Securities VIP's investment in interest rate swap contracts had a total notional amount generally indicative of a range from approximately $2,930,000 to $12,800,000 and DWS Strategic Income VIP's investment in interest rate swap contracts had a total notional amount generally indicative of a range from approximately $3,600,000 to $4,850,000.
Credit Default Swap Contracts. A credit default swap is a contract between a buyer and a seller of protection against pre-defined credit events for the reference entity. For the year ended December 31, 2010, DWS High Income VIP and DWS Strategic Income VIP bought or sold credit default swap contracts to gain exposure to an underlying issuer's credit quality characteristics without directly investing in that issuer, or to hedge the risk of default on Fund securities. As a seller in the credit default swap contract, the Fund is required to pay the par (or other agreed-upon) value of the referenced entity to the counterparty with the occurrence of a credit event by a third party, such as a US or foreign corporate issuer, on the reference entity, which would likely result in a loss to the Fund. In return, the Fund receives from the counterparty a periodic stream of payments over the term of the contract provided that no credit event has occurred. If no credit event occurs, the Fund keeps the stream of payments with no payment obligations. The Fund may also buy credit default swap contracts in order to hedge against the risk of a credit event on debt securities, in which case the Fund functions as the counterparty referenced above. This involves the risk that the contract may expire worthless. It also involves counterparty risk that the seller may fail to satisfy its payment obligations to the Fund with the occurrence of a credit event. When the Fund sells a credit default swap contract it will cover its commitment. This may be achieved by, among other methods, maintaining cash or liquid assets equal to the aggregate notional value of the reference entities for all outstanding credit default swap contracts sold by the Fund.
The value of the credit default swap is adjusted daily and the change in value, if any, is recorded daily as unrealized appreciation or depreciation in the Statement of Assets and Liabilities. An upfront payment made by the Fund is recorded as an asset in the Statement of Assets and Liabilities. An upfront payment received by the Fund is recorded as a liability in the Statement of Assets and Liabilities. Under the terms of the credit default swap contracts, the Fund receives or makes quarterly payments based on a specified interest rate on a fixed notional amount. These payments are recorded as a realized gain or loss in the Statement of Operations. Payments received or made as a result of a credit event or termination of the contract are recognized, net of a proportional amount of the upfront payment, as realized gains or losses in the Statement of Operations.
A summary of the open credit default swap contracts as of December 31, 2010 is included in a table following the Investment Portfolio for DWS High Income VIP and DWS Strategic Income VIP. For the year ended December 31, 2010, DWS Strategic Income VIP's investment in credit default swap contracts purchased had a total notional value generally indicative of a range from $0 to approximately $4,000,000. DWS High Income VIP's investment in credit default swap contracts sold had a total notional value generally indicative of a range from $0 to approximately $17,275,000 and DWS Strategic Income VIP's investment in credit default swap contracts sold had a total notional value generally indicative of a range from approximately $580,000 to $2,370,000.
Total Return Swap Contracts. Total return swaps involve commitments to pay interest in exchange for a market-linked return based on a notional amount. For the year ended December 31, 2010, DWS Strategic Income VIP and DWS Government & Agency Securities VIP entered into total return swap transactions to enhance potential gain. To the extent the total return of the reference security or index underlying the total return swap exceeds or falls short of the offsetting interest rate obligation, the Fund will receive a payment or make a payment to the counterparty, respectively. Certain risks may arise when entering into swap transactions including counterparty default, liquidity or unfavorable changes in the value of underlying reference security or index. The value of the swap is adjusted daily and the change in value, if any, is recorded as unrealized appreciation or depreciation in the Statement of Assets and Liabilities. An upfront payment made by the Fund is recorded as an asset in the Statement of Assets and Liabilities. An upfront payment received by the Fund is recorded as a liability in the Statement of Assets and Liabilities. Payments received or made at the end of each measurement period are recorded as realized gain or loss in the Statement of Operations.
A summary of the open total return swap contracts as of December 31, 2010 is included in a table following the Investment Portfolio for DWS Government & Agency Securities VIP and DWS Strategic Income VIP. For the year ended December 31, 2010, DWS Government & Agency Securities VIP's investment in total return swap contracts had a total notional amount generally indicative of a range from approximately $6,900,000 to $9,000,000 and DWS Strategic Income VIP's investment in total return swap contracts had a total notional amount generally indicative of a range from approximately $2,800,000 to $3,000,000.
Options. An option contract is a contract in which the writer (seller) of the option grants the buyer of the option, upon payment of a premium, the right to purchase from (call option), or sell to (put option), the writer a designated instrument at a specified price within a specified period of time. Certain options, including options on indices and interest rate options, will require cash settlement by the Fund if the option is exercised. Interest rate options are comprised of multiple European style options that have periodic exercise dates within the terms of the contract. For the year ended December 31, 2010, DWS Global Thematic VIP and DWS Government & Agency Securities VIP entered into option contracts in order to enhance potential gain. For the year ended December 31, 2010, DWS Strategic Income VIP entered into option contracts in order to hedge against potential adverse interest rate movements of portfolio assets.
The liability representing the Fund's obligation under an exchange-traded written option or investment in a purchased option is valued at the last sale price or, in the absence of a sale, the mean between the closing bid and asked prices or at the most recent asked price (bid for purchased options) if no bid and asked price are available. Over-the-counter written or purchased options are valued using dealer-supplied quotations. Gain or loss is recognized when the option contract expires, exercised or is closed.
If the Fund writes a covered call option, the Fund foregoes, in exchange for the premium, the opportunity to profit during the option period from an increase in the market value of the underlying security above the exercise price. If the Fund writes a put option it accepts the risk of a decline in the value of the underlying security below the exercise price. Over-the-counter options have the risk of the potential inability of counterparties to meet the terms of their contracts. The Fund's maximum exposure to purchased options is limited to the premium initially paid. In addition, certain risks may arise upon entering into option contracts including the risk that an illiquid secondary market will limit the Fund's ability to close out an option contract prior to the expiration date and that a change in the value of the option contract may not correlate exactly with changes in the value of the securities or currencies hedged.
A summary of the open option contracts as of December 31, 2010 is included in the Investment Portfolio for DWS Strategic Income VIP. For the year ended December 31, 2010, DWS Strategic Income VIP's investment in written option contracts had a total value generally indicative of a range from $0 to approximately $53,000 and in purchased option contracts had a total value generally indicative of a range from $0 to approximately $59,000.
There are no open option contracts as of December 31, 2010 for DWS Global Thematic VIP and DWS Government & Agency Securities VIP. During the year ended December 31, 2010, DWS Global Thematic VIP's investment in purchased option contracts had a total value generally indicative of a range from $0 to approximately $1,000 and DWS Government & Agency Securities VIP's investment in written option contracts had a total value generally indicative of a range from $0 to approximately $197,000 and in purchased option contracts had a total value generally indicative of a range from $0 to approximately $49,000.
Futures Contracts. A futures contract is an agreement between a buyer or seller and an established futures exchange or its clearinghouse in which the buyer or seller agrees to take or make a delivery of a specific amount of a financial instrument at a specified price on a specific date (settlement date). For the year ended December 31, 2010, DWS Balanced VIP, DWS Core Fixed Income VIP, DWS Government & Agency Securities VIP and DWS Strategic Income VIP entered into interest rate futures to gain exposure to different parts of the yield curve while managing overall duration. In addition, DWS Balanced VIP and DWS Strategic Income VIP seek to enhance returns by employing a global tactical asset allocation overlay strategy. DWS Balanced VIP and DWS Strategic Income VIP enter into futures contracts on fixed-income securities and equities, including on financial indices, and security indices and on currency as part of its global tactical asset allocation overlay strategy. For the year ended December 31, 2010, as part of this strategy, DWS Balanced VIP and DWS Strategic Income VIP used futures contracts to attempt to take advantage of short-term and medium-term inefficiencies within the global equity and bond markets. For the year ended December 31, 2010, DWS Blue Chip VIP and DWS Diversified International Equity VIP entered into futures contracts to keep cash on hand to meet shareholder redemptions or other needs while maintaining exposure to the market. DWS Diversified International Equity VIP also entered into futures contracts as a means of gaining exposure to a particular asset class.
Futures contracts are valued at the most recent settlement price. Upon entering into a futures contract, the Fund is required to deposit with a financial intermediary cash or securities ("initial margin") in an amount equal to a certain percentage of the face value indicated in the futures contract. Subsequent payments ("variation margin") are made or received by the Fund dependent upon the daily fluctuations in the value and are recorded for financial reporting purposes as unrealized gains or losses by the Fund. Gains or losses are realized when the contract expires or is closed. Since all futures contracts are exchange-traded, counterparty risk is minimized as the exchange's clearinghouse acts as the counterparty, and guarantees the futures against default.
Certain risks may arise upon entering into futures contracts, including the risk that an illiquid market will limit the Fund's ability to close out a futures contract prior to the settlement date and that a change in the value of a futures contract may not correlate exactly with the changes in the value of the underlying hedged security, index or currency. Risk of loss may exceed amounts recognized in the Statement of Assets and Liabilities.
A summary of the open futures contracts as of December 31, 2010 is included in a table following the Investment Portfolio for DWS Balanced VIP, DWS Blue Chip VIP, DWS Core Fixed Income VIP, DWS Diversified International Equity VIP, DWS Government & Agency Securities VIP and DWS Strategic Income VIP. For the year ended December 31, 2010, DWS Balanced VIP's investment in futures contracts purchased had a total notional value generally indicative of a range from approximately $67,752,000 to $118,748,000, DWS Blue Chip VIP's investment in futures contracts purchased had a total notional value generally indicative of a range from approximately $359,000 to $1,806,000, DWS Diversified International Equity VIP's investment in futures contracts purchased had a total notional value generally indicative of a range from approximately $676,000 to $2,958,000, DWS Government & Agency Securities VIP's investment in futures contracts purchased had a total notional value generally indicative of a range from $0 to approximately $33,947,000 and DWS Strategic Income VIP's investment in futures contracts purchased had a total notional value generally indicative of a range from approximately $19,962,000 to $32,102,000. DWS Balanced VIP's investment in futures contracts sold had a total notional value generally indicative of a range from approximately $60,075,000 to $95,480,000, DWS Core Fixed Income VIP's investment in futures contracts sold had a total notional value generally indicative of a range from $0 to approximately $25,611,000, DWS Government & Agency Securities VIP's investment in futures contracts sold had a total notional value generally indicative of a range from approximately $14,332,000 to $49,098,000 and DWS Strategic Income VIP's investment in futures contracts sold had a total notional value generally indicative of a range from approximately $13,614,000 to $21,729,000.
Forward Foreign Currency Exchange Contracts. A forward foreign currency exchange contract ("forward currency contract") is a commitment to purchase or sell a foreign currency at the settlement date at a negotiated rate. For the year ended December 31, 2010, DWS Balanced VIP, DWS High Income VIP and DWS Strategic Income VIP entered into forward currency contracts in order to hedge its exposure to changes in foreign currency exchange rates on its foreign currency denominated portfolio holdings and to facilitate transactions in foreign currency denominated securities. In addition, DWS Balanced VIP and DWS Strategic Income VIP seek to enhance returns by employing a global tactical asset allocation overlay strategy. For the year ended December 31, 2010, as part of this strategy, DWS Balanced VIP and DWS Strategic Income VIP used forward currency contracts to gain exposure to changes in the value of foreign currencies, and to attempt to take advantage of short-term and medium-term inefficiencies within the currency markets.
Forward currency contracts are valued at the prevailing forward exchange rate of the underlying currencies and unrealized gain (loss) is recorded daily. On the settlement date of the forward currency contract, the Fund records a realized gain or loss equal to the difference between the value of the contract at the time it was opened and the value of the contract at the time it was closed. Certain risks may arise upon entering into forward currency contracts from the potential inability of counterparties to meet the terms of their contracts. The maximum counterparty credit risk to the Fund is measured by the unrealized gain on appreciated contracts. Additionally, when utilizing forward currency contracts to hedge, the Fund gives up the opportunity to profit from favorable exchange rate movements during the term of the contract.
A summary of the open forward currency contracts as of December 31, 2010 is included in a table following the Investment Portfolio for DWS Balanced VIP, DWS High Income VIP and DWS Strategic Income VIP. For the year ended December 31, 2010, DWS Balanced VIP's investment in forward currency contracts US dollars purchased had a total contract value generally indicative of a range from approximately $15,249,000 to $33,339,000, DWS High Income VIP's investment in forward currency contracts US dollars purchased had a total contract value generally indicative of a range from approximately $6,564,000 to $13,966,000 and DWS Strategic Income VIP's investment in forward currency contracts US dollars purchased had a total contract value generally indicative of a range from approximately $12,029,000 to $20,192,000. DWS Balanced VIP's investment in forward currency contracts US dollars sold had a total contract value generally indicative of a range from approximately $13,605,000 to $33,480,000, DWS High Income VIP's investment in forward currency contracts US dollars sold had a total contract value generally indicative of a range from $0 to approximately $210,000 and DWS Strategic Income VIP's investment in forward currency contracts US dollars sold had a total contract value generally indicative of a range from approximately $3,370,000 to $8,365,000.
DWS Balanced VIP
The following tables summarize the value of the Fund's derivative instruments held as of December 31, 2010 and the related location in the accompanying Statement of Assets and Liabilities, presented by primary underlying risk exposure:
Asset Derivative | Forward Contracts |
Foreign Exchange Contracts (a) | $ 760,385 |
The above derivative is located in the following Statement of Assets and Liabilities account:
(a) Unrealized appreciation on open forward foreign currency exchange contracts
Liability Derivatives | Forward Contracts | Futures Contracts | Total |
Equity Contracts (a) | $ — | $ 112,848 | $ 112,848 |
Interest Rate Contracts (a) | — | (268,526) | (268,526) |
Foreign Exchange Contracts (b) | (677,737) | — | (677,737) |
| $ (677,737) | $ (155,678) | $ (833,415) |
Each of the above derivatives is located in the following Statement of Assets and Liabilities accounts:
(a) Net unrealized appreciation (depreciation) on futures. Liability of payable for daily variation margin on open futures contracts reflects unsettled variation margin
(b) Unrealized depreciation on open forward foreign currency exchange contracts
Additionally, the amount of unrealized and realized gains and losses on derivative instruments recognized in Fund earnings during the year ended December 31, 2010 and the related location in the accompanying Statement of Operations is summarized in the following tables by primary underlying risk exposure:
Realized Gain (Loss) | Forward Contracts | Futures Contracts | Total |
Equity Contracts (a) | $ — | $ (1,379,315) | $ (1,379,315) |
Interest Rate Contracts (a) | — | 1,053,743 | 1,053,743 |
Foreign Exchange Contracts (b) | 171,662 | — | 171,662 |
| $ 171,662 | $ (325,572) | $ (153,910) |
Each of the above derivatives is located in the following Statement of Operations accounts:
(a) Net realized gain (loss) from futures
(b) Net realized gain (loss) from foreign currency (Statement of Operations includes both forward currency contracts and foreign currency transactions)
Change in Net Unrealized Appreciation (Depreciation) | Forward Contracts | Futures Contracts | Total |
Equity Contracts (a) | $ — | $ 26,819 | $ 26,819 |
Interest Rate Contracts (a) | — | 67,655 | 67,655 |
Foreign Exchange Contracts (b) | (60,489) | — | (60,489) |
| $ (60,489) | $ 94,474 | $ 33,985 |
Each of the above derivatives is located in the following Statement of Operations accounts:
(a) Change in net unrealized appreciation (depreciation) on futures
(b) Change in net unrealized appreciation (depreciation) on foreign currency (Statement of Operations includes both forward currency contracts and foreign currency transactions)
DWS Blue Chip VIP
The following table summarizes the value of the Fund's derivative instruments held as of December 31, 2010 and the related location in the accompanying Statement of Assets and Liabilities, presented by primary underlying risk exposure:
Asset Derivative | Futures Contracts |
Equity Contracts (a) | $ 15,218 |
The above derivative is located in the following Statement of Assets and Liabilities account:
(a) Net unrealized appreciation (depreciation) on futures. Asset of receivable for daily variation margin on open futures contracts reflects unsettled variation margin.
Additionally, the amount of unrealized and realized gains and losses on derivative instruments recognized in Fund earnings during the year ended December 31, 2010 and the related location in the accompanying Statement of Operations is summarized in the following tables by primary underlying risk exposure:
Realized Gain (Loss) | Futures Contracts |
Equity Contracts (a) | $ 130,929 |
The above derivative is located in the following Statement of Operations account:
(a) Net realized gain (loss) from futures
Change in Net Unrealized Appreciation (Depreciation) | Futures Contracts |
Equity Contracts (a) | $ 7,705 |
The above derivative is located in the following Statement of Operations account:
(a) Change in net unrealized appreciation (depreciation) on futures
DWS Core Fixed Income VIP
The following table summarizes the value of the Fund's derivative instruments held as of December 31, 2010 and the related location in the accompanying Statement of Assets and Liabilities, presented by primary underlying risk exposure:
Asset Derivative | Futures Contracts |
Interest Rate Contracts (a) | $ 617,391 |
The above derivative is located in the following Statement of Assets and Liabilities account:
(a) Net unrealized appreciation (depreciation) on futures. Liability of payable for daily variation margin on open futures contracts reflects unsettled variation margin.
Additionally, the amount of unrealized and realized gains and losses on derivative instruments recognized in Fund earnings during the year ended December 31, 2010 and the related location in the accompanying Statement of Operations is summarized in the following tables by primary underlying risk exposure:
Realized Gain (Loss) | Futures Contracts |
Interest Rate Contracts (a) | $ (504,977) |
The above derivative is located in the following Statement of Operations account:
(a) Net realized gain (loss) from futures
Change in Net Unrealized Appreciation (Depreciation) | Futures Contracts |
Interest Rate Contracts (a) | $ 534,420 |
The above derivative is located in the following Statement of Operations account:
(a) Change in net unrealized appreciation (depreciation) on futures
DWS Diversified International Equity VIP
The following table summarizes the value of the Fund's derivative instruments held as of December 31, 2010 and the related location in the accompanying Statement of Assets and Liabilities, presented by primary underlying risk exposure:
Liability Derivative | Futures Contracts |
Equity Contracts (a) | $ (39,027) |
The above derivative is located in the following Statement of Assets and Liabilities account:
(a) Net unrealized appreciation (depreciation) on futures. Liability of payable for daily variation margin on open futures contracts reflects unsettled variation margin.
Additionally, the amount of unrealized and realized gains and losses on derivative instruments recognized in Fund earnings during the year ended December 31, 2010 and the related location in the accompanying Statement of Operations is summarized in the following tables by primary underlying risk exposure:
Realized Gain (Loss) | Futures Contracts |
Equity Contracts (a) | $ 139,952 |
The above derivative is located in the following Statement of Operations account:
(a) Net realized gain (loss) from futures
Change in Net Unrealized Appreciation (Depreciation) | Futures Contracts |
Equity Contracts (a) | $ (169,560) |
The above derivative is located in the following Statement of Operations account:
(a) Change in net unrealized appreciation (depreciation) on futures
DWS Global Thematic VIP
The following tables summarize the amount of unrealized and realized gains and losses on derivative instruments recognized in Fund earnings during the year ended December 31, 2010 and the related location in the accompanying Statement of Operations, presented by primary underlying risk exposure:
Realized Gain (Loss) | Purchased Options |
Equity Contracts (a) | $ (212,772) |
The above derivative is located in the following Statement of Operations account:
(a) Net realized gain (loss) from investments (includes purchased options)
Change in Net Unrealized Appreciation (Depreciation) | Purchased Options |
Equity Contracts (a) | $ 212,262 |
The above derivative is located in the following Statement of Operations account:
(a) Change in net unrealized appreciation (depreciation) on investments (includes purchased options)
DWS Government & Agency Securities VIP
The following tables summarize the value of the Fund's derivative instruments held as of December 31, 2010 and the related location in the accompanying Statement of Assets and Liabilities, presented by primary underlying risk exposure:
Asset Derivative | Swap Contracts |
Interest Rate Contracts (a) | $ 6,598 |
The above derivative is located in the following Statement of Assets and Liabilities account:
(a) Unrealized appreciation on open swap contracts
Liability Derivative | Futures Contracts | Swap Contracts | Total |
Interest Rate Contracts (a) | $ (145,683) | $ (165,133) | $ (310,816) |
Each of the above derivatives is located in the following Statement of Assets and Liabilities accounts:
(a) Net unrealized appreciation (depreciation) on futures and unrealized depreciation on open swap contracts. Liability of payable for daily variation margin on open futures contracts reflects unsettled variation margin.
Additionally, the amount of unrealized and realized gains and losses on derivative instruments recognized in Fund earnings during the year ended December 31, 2010 and the related location in the accompanying Statement of Operations is summarized in the following tables by primary underlying risk exposure:
Realized Gain (Loss) | Purchased Options | Written Options | Swap Contracts | Futures Contracts | Total |
Interest Rate Contracts (a) | $ (323,210) | $ 87,625 | $ (659,466) | $ 950,817 | $ 55,766 |
Each of the above derivatives is located in the following Statement of Operations accounts:
(a) Net realized gain (loss) from investments (includes purchased options), written options, swap contracts and futures, respectively
Change in Net Unrealized Appreciation (Depreciation) | Swap Contracts | Futures Contracts | Total |
Interest Rate Contracts (a) | $ (95,677) | $ 475,938 | $ 380,261 |
Each of the above derivatives is located in the following Statement of Operations accounts:
(a) Change in net unrealized appreciation (depreciation) on swap contracts and futures, respectively
DWS High Income VIP
The following table summarizes the value of the Fund's derivative instruments held as of December 31, 2010 and the related location in the accompanying Statement of Assets and Liabilities, presented by primary underlying risk exposure:
Asset Derivatives | Forward Contracts | Swap Contracts | Total |
Credit Contracts (a) | $ — | $ 386,256 | $ 386,256 |
Foreign Exchange Contracts (b) | 2,528 | — | 2,528 |
| $ 2,528 | $ 386,256 | $ 388,784 |
Each of the above derivatives is located in the following Statement of Assets and Liabilities accounts:
(a) Unrealized appreciation on open swap contracts
(b) Unrealized appreciation on open forward foreign currency exchange contracts
Liability Derivative | Forward Contracts |
Foreign Exchange Contracts (a) | $ (60,959) |
The above derivative is located in the following Statement of Assets and Liabilities account:
(a) Unrealized depreciation on open forward foreign currency exchange contracts
Additionally, the amount of unrealized and realized gains and losses on derivative instruments recognized in Fund earnings during the year ended December 31, 2010 and the related location in the accompanying Statement of Operations is summarized in the following tables by primary underlying risk exposure:
Realized Gain (Loss) | Forward Contracts | Swap Contracts | Total |
Credit Contracts (a) | $ — | $ 1,020,868 | $ 1,020,868 |
Foreign Exchange Contracts (b) | 1,453,531 | — | 1,453,531 |
| $ 1,453,531 | $ 1,020,868 | $ 2,474,399 |
Each of the above derivatives is located in the following Statement of Operations accounts:
(a) Net realized gain (loss) from swap contracts
(b) Net realized gain (loss) from foreign currency (Statement of Operations includes both forward currency contracts and foreign currency transactions)
Change in Net Unrealized Appreciation (Depreciation) | Forward Contracts | Swap Contracts | Total |
Credit Contracts (a) | $ — | $ 386,256 | $ 386,256 |
Foreign Exchange Contracts (b) | (34,981) | — | (34,981) |
| $ (34,981) | $ 386,256 | $ 351,275 |
Each of the above derivatives is located in the following Statement of Operations accounts:
(a) Change in net unrealized appreciation (depreciation) on swap contracts
(b) Change in net unrealized appreciation (depreciation) on foreign currency (Statement of Operations includes both forward currency contracts and foreign currency transactions)
DWS Strategic Income VIP
The following tables summarize the value of the Fund's derivative instruments held as of December 31, 2010 and the related location in the accompanying Statement of Assets and Liabilities, presented by primary underlying risk exposure:
Asset Derivatives | Purchased Options | Forward Contracts | Swap Contracts | Total |
Interest Rate Contracts (a) | $ 467 | $ — | $ 2,678 | $ 3,145 |
Credit Contracts (a) | — | — | 25,665 | 25,665 |
Foreign Exchange Contracts (b) | — | 259,054 | — | 259,054 |
| $ 467 | $ 259,054 | $ 28,343 | $ 287,864 |
Each of the above derivatives is located in the following Statement of Assets and Liabilities accounts:
(a) Investments in securities, at value (includes purchased options) and unrealized appreciation on open swap contracts
(b) Unrealized appreciation on open forward foreign currency exchange contracts
Liability Derivatives | Written Options | Forward Contracts | Swap Contracts | Futures Contracts | Total |
Equity Contracts (a) | $ — | $ — | $ — | $ 31,298 | $ 31,298 |
Interest Rate Contracts (a) | (35,163) | — | (254,700) | (126,598) | (416,461) |
Credit Contracts (a) | — | — | (28,377) | — | (28,377) |
Foreign Exchange Contracts (b) | — | (262,385) | — | — | (262,385) |
| $ (35,163) | $ (262,385) | $ (283,077) | $ (95,300) | $ (675,925) |
Each of the above derivatives is located in the following Statement of Assets and Liabilities accounts:
(a) Options written, at value, net unrealized appreciation (depreciation) on futures and unrealized depreciation on open swap contracts. Liability of payable for daily variation margin on open futures contracts reflects unsettled variation margin.
(b) Unrealized depreciation on open forward foreign currency exchange contracts
Additionally, the amount of unrealized and realized gains and losses on derivative instruments recognized in Fund earnings during the year ended December 31, 2010 and the related location in the accompanying Statement of Operations is summarized in the following tables by primary underlying risk exposure:
Realized Gain (Loss) | Purchased Options | Forward Contracts | Swap Contracts | Futures Contracts | Total |
Equity Contracts (a) | $ — | $ — | $ — | $ (421,417) | $ (421,417) |
Interest Rate Contracts (a) | 38,962 | — | 94,915 | 480,480 | 614,357 |
Credit Contracts (a) | — | — | (132,473) | — | (132,473) |
Foreign Exchange Contracts (b) | — | 434,022 | — | — | 434,022 |
| $ 38,962 | $ 434,022 | $ (37,558) | $ 59,063 | $ 494,489 |
Each of the above derivatives is located in the following Statement of Operations accounts:
(a) Net realized gain (loss) from investments (includes purchased options), swap contracts and futures, respectively
(b) Net realized gain (loss) from foreign currency (Statement of Operations includes both forward currency contracts and foreign currency transactions)
Change in Net Unrealized Appreciation (Depreciation) | Purchased Options | Written Options | Forward Contracts | Swap Contracts | Futures Contracts | Total |
Equity Contracts (a) | $ — | $ — | $ — | $ — | $ 19,172 | $ 19,172 |
Interest Rate Contracts (a) | (57,941) | (4,423) | — | (308,385) | (20,863) | (391,612) |
Credit contracts (a) | — | — | — | (1,477) | — | (1,477) |
Foreign Exchange Contracts (b) | — | — | (279,489) | — | — | (279,489) |
| $ (57,941) | $ (4,423) | $ (279,489) | $ (309,862) | $ (1,691) | $ (653,406) |
Each of the above derivatives is located in the following Statement of Operations accounts:
(a) Change in net unrealized appreciation (depreciation) on investments (includes purchased options), written options, swap contracts and futures, respectively
(b) Change in net unrealized appreciation (depreciation) on foreign currency (Statement of Operations includes both forward currency contracts and foreign currency transactions)
C. Purchases and Sales of Securities
During the year ended December 31, 2010, purchases and sales of investment transactions (excluding short-term investments) were as follows:
Fund | Purchases ($) | Sales ($) |
DWS Alternative Asset Allocation Plus VIP Underlying Affiliated Funds | 20,924,087 | 733,000 |
Underlying Non-affiliated Funds | 988,703 | 54,941 |
DWS Balanced VIP excluding US Treasury Obligations | 501,453,180 | 520,652,361 |
US Treasury Obligations | 71,576,766 | 77,346,084 |
DWS Blue Chip VIP | 151,115,169 | 165,670,571 |
DWS Core Fixed Income VIP excluding US Treasury Obligations | 255,494,334 | 250,517,214 |
US Treasury Obligations | 97,533,517 | 86,987,776 |
DWS Diversified International Equity VIP | 10,585,084 | 20,213,690 |
DWS Dreman Small Mid Cap Value VIP | 93,395,395 | 129,147,757 |
DWS Global Thematic VIP | 110,185,987 | 116,147,618 |
DWS Government & Agency Securities VIP | 814,547,329 | 814,973,550 |
DWS High Income VIP | 165,760,238 | 191,044,642 |
DWS Large Cap Value VIP | 61,553,310 | 87,416,345 |
DWS Mid Cap Growth VIP | 12,373,056 | 14,480,595 |
DWS Small Cap Growth VIP | 49,541,542 | 62,144,300 |
DWS Strategic Income VIP excluding US Treasury Obligations | 83,860,216 | 81,802,651 |
US Treasury Obligations | 38,991,537 | 36,504,796 |
DWS Strategic Value VIP | 218,849,807 | 258,849,951 |
DWS Technology VIP | 16,212,693 | 32,717,685 |
DWS Turner Mid Cap Growth VIP | 48,107,657 | 53,568,971 |
For the year ended December 31, 2010, transactions for written options on futures were as follows for DWS Government & Agency Securities VIP:
| Number of Contracts | Premiums |
Outstanding, beginning of period | — | $ — |
Options written | 636 | 202,702 |
Options closed | (120) | (65,361) |
Options exercised | (256) | (105,437) |
Options expired | (260) | (31,904) |
Outstanding, end of period | — | $ — |
For the year ended December 31, 2010, transactions for written options on interest rate swaps were as follows for DWS Strategic Income VIP:
| Contract Amount | Premiums |
Outstanding, beginning of period | — | $ — |
Options written | 29,000,000 | 30,740 |
Outstanding, end of period | 29,000,000 | $ 30,740 |
D. Related Parties
Management Agreement. Under the Investment Management Agreement with Deutsche Investment Management Americas Inc. ("DIMA" or the "Advisor"), an indirect, wholly owned subsidiary of Deutsche Bank AG, the Advisor directs the investments of each Fund in accordance with its investment objectives, policies and restrictions. The Advisor determines the securities, instruments and other contracts relating to investments to be purchased, sold or entered into by each Fund or delegates such responsibility to each Fund's subadvisor.
Under the Investment Management Agreement with the Advisor, the fees are equivalent to the annual rates shown below of each Fund's average daily net assets, computed and accrued daily and payable monthly:
Fund | Annual Management Fee Rate |
DWS Alternative Asset Allocation Plus VIP on assets invested in other DWS Funds on assets invested in all other assets not considered DWS Funds | .200% 1.200% |
DWS Balanced VIP $0-$250 million | .370% |
next $750 million | .345% |
over $1 billion | .310% |
DWS Blue Chip VIP $0-$250 million | .550% |
next $750 million | .520% |
next $1.5 billion | .500% |
next $2.5 billion | .480% |
next $2.5 billion | .450% |
next $2.5 billion | .430% |
next $2.5 billion | .410% |
over $12.5 billion | .390% |
DWS Core Fixed Income VIP $0-$250 million | .500% |
next $750 million | .470% |
next $1.5 billion | .450% |
next $2.5 billion | .430% |
next $2.5 billion | .400% |
next $2.5 billion | .380% |
next $2.5 billion | .360% |
over $12.5 billion | .340% |
DWS Diversified International Equity VIP $0-$1.5 billion | .650% |
next $1.75 billion | .635% |
next $1.75 billion | .620% |
over $5 billion | .605% |
DWS Dreman Small Mid Cap Value VIP $0-$250 million | .650% |
next $750 million | .620% |
next $1.5 billion | .600% |
next $2.5 billion | .580% |
next $2.5 billion | .550% |
next $2.5 billion | .540% |
next $2.5 billion | .530% |
over $12.5 billion | .520% |
DWS Global Thematic VIP $0-$250 million | .915% |
next $500 million | .865% |
next $750 million | .815% |
next $1.5 billion | .765% |
over $3 billion | .715% |
DWS Government & Agency Securities VIP $0-$250 million | .450% |
next $750 million | .430% |
next $1.5 billion | .410% |
next $2.5 billion | .400% |
next $2.5 billion | .380% |
next $2.5 billion | .360% |
next $2.5 billion | .340% |
over $12.5 billion | .320% |
DWS High Income VIP $0-$250 million | .500% |
next $750 million | .470% |
next $1.5 billion | .450% |
next $2.5 billion | .430% |
next $2.5 billion | .400% |
next $2.5 billion | .380% |
next $2.5 billion | .360% |
over $12.5 billion | .340% |
DWS Large Cap Value VIP $0-$250 million | .650% |
next $750 million | .625% |
next $1.5 billion | .600% |
next $2.5 billion | .575% |
next $2.5 billion | .550% |
next $2.5 billion | .525% |
next $2.5 billion | .500% |
over $12.5 billion | .475% |
DWS Mid Cap Growth VIP $0-$250 million | .665% |
next $750 million | .635% |
next $1.5 billion | .615% |
next $2.5 billion | .595% |
next $2.5 billion | .565% |
next $2.5 billion | .555% |
next $2.5 billion | .545% |
over $12.5 billion | .535% |
DWS Money Market VIP $0-$500 million | .285% |
next $500 million | .270% |
next $1.0 billion | .255% |
over $2.0 billion | .240% |
DWS Small Cap Growth VIP $0-$250 million | .550% |
next $750 million | .525% |
over $1 billion | .500% |
DWS Strategic Income VIP $0-$250 million | .550% |
next $750 million | .520% |
next $1.5 billion | .500% |
next $2.5 billion | .480% |
next $2.5 billion | .450% |
next $2.5 billion | .430% |
next $2.5 billion | .410% |
over $12.5 billion | .390% |
DWS Strategic Value VIP $0-$250 million | .665% |
next $750 million | .635% |
next $1.5 billion | .615% |
next $2.5 billion | .595% |
next $2.5 billion | .565% |
next $2.5 billion | .555% |
next $2.5 billion | .545% |
over $12.5 billion | .535% |
DWS Technology VIP $0-$250 million | .665% |
next $750 million | .635% |
next $1.5 billion | .615% |
next $2.5 billion | .595% |
next $2.5 billion | .565% |
next $2.5 billion | .555% |
next $2.5 billion | .545% |
over $12.5 billion | .535% |
DWS Turner Mid Cap Growth VIP $0-$250 million | .715% |
next $250 million | .700% |
next $500 million | .685% |
over $1 billion | .670% |
QS Investors, LLC ("QS Investors") acts as an investment sub-advisor to DWS Alternative Asset Allocation Plus VIP, DWS Balanced VIP, DWS Blue Chip VIP, DWS Diversified International Equity VIP and DWS Strategic Income VIP. On August 1, 2010, members of the Advisor's Quantitative Strategies Group, including some members of the Funds' portfolio management teams, separated from the Advisor and formed QS Investors as a separate investment advisory firm unaffiliated with the Advisor (the "Separation"). As an investment sub-advisor to DWS Blue Chip VIP and DWS Diversified International Equity VIP, QS Investors makes investment decisions and buys and sells securities for the Funds. As an investment sub-advisor to DWS Alternative Asset Allocation Plus VIP, QS Investors renders strategic asset allocation services to the Fund. As an investment sub-advisor to DWS Balanced VIP, QS Investors renders strategic asset allocation services to the Fund and manages the assets attributable to the Fund's Global Tactical Asset Allocation ("GTAA") overlay strategy. As an investment sub-advisor to DWS Strategic Income VIP, QS Investors manages the assets attributable only to the Fund's GTAA overlay strategy. QS Investors is paid by the Advisor, not the Funds, for the services QS Investors provides to the Funds.
Global Thematic Partners, LLC ("GTP") acts as investment sub-advisor to DWS Global Thematic VIP. On July 1, 2010, members of the Advisor's Global Equity Team, including members of the DWS Global Thematic VIP portfolio management team, separated from the Advisor and formed GTP as a separate investment advisory firm unaffiliated with the Advisor (the "Separation"). As an investment sub-advisor to DWS Global Thematic VIP, GTP makes investment decisions and buys and sells securities for the Fund. GTP is paid by the Advisor, not the Fund, for the services GTP provides to the Fund.
Deutsche Asset Management International GmbH ("DeAMi") serves as subadvisor to DWS Large Cap Value VIP and a portion of DWS Balanced VIP's large cap value allocation of the portfolio. DeAMi is paid by the Advisor for its services.
Dreman Value Management, L.L.C. ("DVM") serves as subadvisor to DWS Dreman Small Mid Cap Value VIP and is paid by the Advisor for its services.
Turner Investment Partners, Inc. serves as subadvisor to DWS Turner Mid Cap Growth VIP and is paid by the Advisor for its services.
For the year ended December 31, 2010, the Advisor has agreed to waive 0.15% of the monthly management fee based on average daily net assets for DWS Alternative Asset Allocation Plus VIP.
For the period from January 1, 2010 through September 30, 2010, the Advisor had contractually agreed to waive its fee and/or reimburse certain operating expenses to the extent necessary to maintain the operating expenses (excluding certain expenses such as extraordinary expenses, taxes, brokerage and interest expense) of each class as follows:
Fund | Annual Rate |
DWS Global Thematic VIP Class A | 1.06% |
Class B | 1.46% |
DWS High Income VIP Class B | 1.25% |
DWS Large Cap Value VIP Class A | .88% |
Class B | 1.28% |
DWS Mid Cap Growth VIP Class A | 1.09% |
DWS Strategic Income VIP Class A | .87% |
DWS Turner Mid Cap Growth VIP Class A | 1.01% |
For the period from January 1, 2010 through April 30, 2011, the Advisor had contractually agreed to waive its fee and/or reimburse certain operating expenses to the extent necessary to maintain the operating expenses (excluding certain expenses such as extraordinary expenses, taxes, brokerage, interest expense and Underlying Funds) of each class as follows:
Fund | Annual Rate |
DWS Alternative Asset Allocation Plus VIP Class A | .21% |
Class B | .61% |
For the period from January 1, 2010 through April 30, 2010, the Advisor had contractually agreed to waive its fee and/or reimburse certain operating expenses to the extent necessary to maintain the operating expenses (excluding certain expenses such as extraordinary expenses, taxes, brokerage and interest expense) of each class as follows:
Fund | Annual Rate |
DWS Money Market VIP Class A | .44% |
DWS Strategic Value VIP Class A | .78% |
Class B | 1.11% |
For the period from May 1, 2010 through January 31, 2011, the Advisor has contractually agreed to waive its fee and/or reimburse certain operating expenses to the extent necessary to maintain the operating expenses (excluding certain expenses such as extraordinary expenses, taxes, brokerage and interest expense) of the class as follows:
Fund | Annual Rate |
DWS Money Market VIP Class A | .51% |
For the period from May 1, 2011 through September 30, 2011, the Advisor has contractually agreed to waive its fee and/or reimburse certain operating expenses to the extent necessary to maintain the operating expenses (excluding certain expenses such as extraordinary expenses, taxes, brokerage, interest expense and Underlying Funds) of each class as follows:
Fund | Annual Rate |
DWS Alternative Asset Allocation Plus VIP Class A | .35% |
Class B | .75% |
For the period from October 1, 2010 through September 30, 2011, the Advisor has contractually agreed to waive its fee and/or reimburse certain operating expenses to the extent necessary to maintain the operating expenses (excluding certain expenses such as extraordinary expenses, taxes, brokerage and interest expense) of each class as follows:
Fund | Annual Rate |
DWS Core Fixed Income VIP Class A | .71% |
DWS Global Thematic VIP Class A | 1.03% |
Class B | 1.43% |
DWS Mid Cap Growth VIP Class A | .97% |
DWS Strategic Income VIP Class A | .78% |
DWS Turner Mid Cap Growth VIP Class A | .97% |
For the period from January 1, 2010 through February 5, 2010, the Advisor had voluntarily agreed to waive its fee and/or reimburse certain operating expenses to the extent necessary to maintain the operating expenses (excluding certain expenses such as extraordinary expenses, taxes, brokerage and interest expense) of the class as follows:
Fund | Annual Rate |
DWS Core Fixed Income VIP Class B | 1.07% |
In addition, the Advisor has agreed to voluntarily waive additional expenses for DWS Money Market VIP. The waiver may be changed or terminated at any time without notice. Under this arrangement, the Advisor waived certain expenses of the Fund.
Accordingly, for the year ended December 31, 2010, the total management fees, management fees waived and effective management fee rates were as follows:
Fund | Total Aggregated ($) | Waived ($) | Annual Effective Rate |
DWS Alternative Asset Allocation Plus VIP | 31,017 | 31,017 | .00% |
DWS Balanced VIP | 1,124,396 | — | .37% |
DWS Blue Chip VIP | 580,643 | — | .55% |
DWS Core Fixed Income VIP | 482,684 | — | .50% |
DWS Diversified International Equity VIP | 519,737 | — | .65% |
DWS Dreman Small Mid Cap Value VIP | 1,653,319 | — | .65% |
DWS Global Thematic VIP | 626,939 | 245,154 | .56% |
DWS Government & Agency Securities VIP | 789,612 | — | .45% |
DWS High Income VIP | 946,284 | — | .50% |
DWS Large Cap Value VIP | 1,313,548 | — | .65% |
DWS Mid Cap Growth VIP | 149,048 | 24,596 | .56% |
DWS Money Market VIP | 704,427 | 292,096 | .17% |
DWS Small Cap Growth VIP | 434,077 | — | .55% |
DWS Strategic Income VIP | 410,735 | 67,252 | .46% |
DWS Strategic Value VIP | 1,756,021 | 35,990 | .65% |
DWS Technology VIP | 484,850 | — | .665% |
DWS Turner Mid Cap Growth VIP | 368,747 | 559 | .71% |
In addition, for the year ended December 31, 2010, the Advisor waived $51,328 and $809 of other expenses for DWS Alternative Asset Allocation Plus VIP and DWS Core Fixed Income VIP, respectively.
DWS Alternative Asset Allocation Plus VIP indirectly bears its proportionate share of fees and expenses incurred by the Underlying Funds in which it is invested.
Administration Fee. Pursuant to an Administrative Services Agreement, DIMA provides most administrative services to the Funds. For all services provided under the Administrative Services Agreement, the Funds pay DIMA an annual fee ("Administration Fee") of 0.10% of the Funds' average daily net assets, computed and accrued daily and payable monthly. For the year ended December 31, 2010, the Administration Fee was as follows:
Fund | Total Aggregated ($) | Waived ($) | Unpaid at December 31, 2010 ($) |
DWS Alternative Asset Allocation Plus VIP | 13,080 | 13,080 | — |
DWS Balanced VIP | 307,796 | — | 26,033 |
DWS Blue Chip VIP | 105,571 | — | 9,119 |
DWS Core Fixed Income VIP | 96,537 | — | 7,487 |
DWS Diversified International Equity VIP | 79,960 | — | 6,963 |
DWS Dreman Small Mid Cap Value VIP | 254,770 | — | 23,011 |
DWS Global Thematic VIP | 68,518 | — | 6,051 |
DWS Government & Agency Securities VIP | 175,469 | — | 13,991 |
DWS High Income VIP | 189,257 | — | 15,979 |
DWS Large Cap Value VIP | 202,084 | — | 17,334 |
DWS Mid Cap Growth VIP | 22,413 | — | 2,228 |
DWS Money Market VIP | 247,168 | — | 19,561 |
DWS Small Cap Growth VIP | 78,923 | — | 7,452 |
DWS Strategic Income VIP | 74,679 | — | 6,418 |
DWS Strategic Value VIP | 264,774 | — | 22,475 |
DWS Technology VIP | 72,910 | — | 6,462 |
DWS Turner Mid Cap Growth VIP | 51,573 | — | 4,967 |
Service Provider Fees. DWS Investments Service Company ("DISC"), an affiliate of the Advisor, is the transfer agent, dividend-paying agent and shareholder service agent for each Fund. Pursuant to a sub-transfer agency agreement between DISC and DST Systems, Inc. ("DST"), DISC has delegated certain transfer agent, dividend-paying agent and shareholder service agent functions to DST. DISC compensates DST out of the shareholder servicing fee it receives from each Fund. For the year ended December 31, 2010 and for the period ended February 5, 2010 for DWS Core Fixed Income VIP for Class B shares, the amounts charged to each Fund by DISC were as follows:
Fund | Total Aggregated ($) | Waived ($) | Unpaid at December 31, 2010 ($) |
DWS Alternative Asset Allocation Plus VIP Class A | 51 | 51 | — |
DWS Alternative Asset Allocation Plus VIP Class B | 53 | — | 12 |
DWS Balanced VIP Class A | 517 | — | 129 |
DWS Blue Chip VIP Class A | 223 | — | 59 |
DWS Blue Chip VIP Class B | 24 | — | 6 |
DWS Core Fixed Income VIP Class A | 74 | — | 33 |
DWS Core Fixed Income VIP Class B | 60 | — | 10 |
DWS Diversified International Equity VIP Class A | 138 | — | 34 |
DWS Dreman Small Mid Cap Value VIP Class A | 678 | — | 168 |
DWS Dreman Small Mid Cap Value VIP Class B | 390 | — | 102 |
DWS Global Thematic VIP Class A | 363 | 363 | — |
DWS Global Thematic VIP Class B | 83 | — | 18 |
DWS Government & Agency Securities VIP Class A | 325 | — | 77 |
DWS Government & Agency Securities VIP Class B | 56 | — | 12 |
DWS High Income VIP Class A | 307 | — | 71 |
DWS High Income VIP Class B | 24 | — | 6 |
DWS Large Cap Value VIP Class A | 279 | — | 71 |
DWS Large Cap Value VIP Class B | 47 | — | 12 |
DWS Mid Cap Growth VIP Class A | — | — | — |
DWS Money Market VIP Class A | 710 | 710 | — |
DWS Small Cap Growth VIP Class A | 336 | — | 92 |
DWS Strategic Income VIP Class A | 162 | 162 | — |
DWS Strategic Value VIP Class A | 433 | 433 | — |
DWS Strategic Value VIP Class B | 197 | — | 48 |
DWS Technology VIP Class A | 134 | — | 35 |
DWS Technology VIP Class B | 107 | — | 24 |
DWS Turner Mid Cap Growth VIP Class A | 120 | 120 | — |
Distribution Service Agreement. Under the Funds' Class B 12b-1 plans, DWS Investments Distributors, Inc. ("DIDI") received a fee ("Distribution Service Fee") of 0.25% of average daily net assets of Class B shares. For the year ended December 31, 2010 and for the period ended February 5, 2010 for DWS Core Fixed Income VIP, the Distribution Service Fee was as follows:
Fund | Total Aggregated ($) | Unpaid at December 31, 2010 ($) |
DWS Alternative Asset Allocation Plus VIP | 25,810 | 4,472 |
DWS Blue Chip VIP | 399 | 277 |
DWS Core Fixed Income VIP | 14 | — |
DWS Dreman Small Mid Cap Value VIP | 59,943 | 5,482 |
DWS Global Thematic VIP | 11,552 | 1,002 |
DWS Government & Agency Securities VIP | 15,782 | 1,330 |
DWS High Income VIP | 367 | 31 |
DWS Large Cap Value VIP | 2,177 | 235 |
DWS Strategic Value VIP | 4,271 | 393 |
DWS Technology VIP | 2,449 | 31 |
Typesetting and Filing Service Fees. Under an agreement with DIMA, DIMA is compensated for providing typesetting and certain regulatory filing services to each Fund. For the year ended December 31, 2010, the amount charged to each Fund by DIMA included in the Statement of Operations under "reports to shareholders" was as follows:
Fund | Amount ($) | Unpaid at December 31, 2010 ($) |
DWS Alternative Asset Allocation Plus VIP | 13,134 | 2,147 |
DWS Balanced VIP | 10,742 | 3,844 |
DWS Blue Chip VIP | 12,605 | 3,200 |
DWS Core Fixed Income VIP | 11,979 | 3,064 |
DWS Diversified International Equity VIP | 11,959 | 2,922 |
DWS Dreman Small Mid Cap Value VIP | 12,427 | 3,129 |
DWS Global Thematic VIP | 10,208 | 1,734 |
DWS Government & Agency Securities VIP | 12,898 | 3,141 |
DWS High Income VIP | 11,655 | 2,493 |
DWS Large Cap Value VIP | 11,866 | 2,924 |
DWS Mid Cap Growth VIP | 11,630 | 3,135 |
DWS Money Market VIP | 10,874 | 1,873 |
DWS Small Cap Growth VIP | 10,959 | 3,135 |
DWS Strategic Income VIP | 11,019 | 3,562 |
DWS Strategic Value VIP | 13,417 | 4,180 |
DWS Technology VIP | 11,852 | 2,738 |
DWS Turner Mid Cap Growth VIP | 11,771 | 3,031 |
Trustees' Fees and Expenses. The Funds paid each Trustee not affiliated with the Advisor retainer fees plus specified amounts for various committee services and for the Board Chairperson.
Affiliated Cash Management Vehicles. The Funds may invest uninvested cash balances in Central Cash Management Fund, which is managed by the Advisor. The Funds indirectly bear their proportionate share of the expenses of the underlying money market funds. Central Cash Management Fund does not pay the Advisor an investment management fee. Central Cash Management Fund seeks a high level of current income consistent with liquidity and the preservation of capital.
E. Investing in High Yield Securities
The Funds' performance could be hurt if a security declines in credit quality or goes into default, or if an issuer does not make timely payments of interest or principal. Because the issuers of high-yield debt securities or junk bonds (debt securities rated below the fourth-highest category) may be in uncertain financial health, the prices of their debt securities can be more vulnerable to bad economic news, or even the expectation of bad news, than investment-grade debt securities. Because the Funds may invest in securities not paying current interest or in securities already in default, these risks may be more pronounced.
F. Investing in Emerging Markets
Investing in emerging markets may involve special risks and considerations not typically associated with investing in developed markets. These risks include revaluation of currencies, high rates of inflation or deflation, repatriation restrictions on income and capital, and future adverse political, social and economic developments. Moreover, securities issued in these markets may be less liquid, subject to government ownership controls or delayed settlements, and may have prices that are more volatile or less easily assessed than those of comparable securities of issuers in developed markets.
G. Ownership of the Funds
At December 31, 2010, the beneficial ownership in each Fund was as follows:
DWS Alternative Asset Allocation Plus VIP: One Participating Insurance Company was the owner of record of 10% or more of the total outstanding Class A shares of the Fund, owning 98%. Two Participating Insurance Companies were owners of record of 10% or more of the total outstanding Class B shares of the Fund, owning 83% and 17%.
DWS Balanced VIP: Three Participating Insurance Companies were owners of record of 10% or more of the total outstanding Class A shares of the Fund, each owning 45%, 22% and 15%.
DWS Blue Chip VIP: Two Participating Insurance Companies were owners of record of 10% or more of the total outstanding Class A shares of the Fund, each owning 53% and 39%. One Participating Insurance Company was the owner of record of 10% or more of the total outstanding Class B shares of the Fund, owning 100%.
DWS Core Fixed Income VIP: Three Participating Insurance Companies were owners of record of 10% or more of the total outstanding Class A shares of the Fund, each owning 44%, 41% and 13%.
DWS Diversified International Equity VIP: Three Participating Insurance Companies were owners of record of 10% or more of the total outstanding Class A shares of the Fund, each owning 42%, 29% and 28%.
DWS Dreman Small Mid Cap Value VIP: Three Participating Insurance Companies were owners of record of 10% or more of the total outstanding Class A shares of the Fund, each owning 39%, 26% and 15%. Three Participating Insurance Companies were owners of record of 10% or more of the total outstanding Class B shares of the Fund, each owning 41%, 19% and 11%.
DWS Global Thematic VIP: Two Participating Insurance Companies were owners of record of 10% or more of the total outstanding Class A shares of the Fund, each owning 57% and 33%. One Participating Insurance Company was the owner of record of 10% or more of the total outstanding Class B shares of the Fund, owning 98%.
DWS Government & Agency Securities VIP: Three Participating Insurance Companies were owners of record of 10% or more of the total outstanding Class A shares of the Fund, each owning 40%, 38% and 16%. One Participating Insurance Company was the owner of record of 10% or more of the total outstanding Class B shares of the Fund, owning 96%.
DWS High Income VIP: Three Participating Insurance Companies were owners of record of 10% or more of the total outstanding Class A shares of the Fund, each owning 34%, 32% and 28%. One Participating Insurance Company was the owner of record of 10% or more of the total outstanding Class B shares of the Fund, owning 100%.
DWS Large Cap Value VIP: Three Participating Insurance Companies were owners of record of 10% or more of the total outstanding Class A shares of the Fund, each owning 53%, 30% and 10%. Two Participating Insurance Companies were owners of record of 10% or more of the total outstanding Class B shares of the Fund, each owning 86% and 14%.
DWS Mid Cap Growth VIP: Two Participating Insurance Companies were owners of record of 10% or more of the total outstanding Class A shares of the Fund, each owning 63% and 35%.
DWS Money Market VIP: Three Participating Insurance Companies were owners of record of 10% or more of the total outstanding Class A shares of the Fund, each owning 28%, 20% and 15%.
DWS Small Cap Growth VIP: Three Participating Insurance Companies were owners of record of 10% or more of the total outstanding Class A shares of the Fund, each owning 42%, 28% and 25%.
DWS Strategic Income VIP: Two Participating Insurance Companies were owners of record of 10% or more of the total outstanding Class A shares of the Fund, each owning 59% and 39%.
DWS Strategic Value VIP: Two Participating Insurance Companies were owners of record of 10% or more of the total outstanding Class A shares of the Fund, each owning 56% and 30%. Five Participating Insurance Companies were owners of record of 10% or more of the total outstanding Class B shares of the Fund, each owning 26%, 25%, 15%, 11% and 11%.
DWS Technology VIP: Two Participating Insurance Companies were owners of record of 10% or more of the total outstanding Class A shares of the Fund, each owning 57% and 37%. Two Participating Insurance Companies were owners of record of 10% or more of the total outstanding Class B shares of the Fund, owning 79% and 12%.
DWS Turner Mid Cap Growth VIP: Two Participating Insurance Companies were owners of record of 10% or more of the total outstanding Class A shares of the Fund, each owning 75% and 25%.
H. Line of Credit
The Trust and other affiliated funds (the "Participants") share in a $450 million revolving credit facility provided by a syndication of banks. The Funds may borrow for temporary or emergency purposes, including the meeting of redemption requests that otherwise might require the untimely disposition of securities. The Participants are charged an annual commitment fee which is allocated based on net assets, among each of the Participants. Interest is calculated at a rate per annum equal to the sum of the Federal Funds Rate plus 1.25 percent plus if LIBOR exceeds the Federal Funds Rate the amount of such excess. The facility borrowing limit for each Fund as a percentage of net assets is as follows:
Fund | Facility Borrowing Limit |
DWS Balanced VIP | 33% |
DWS Blue Chip VIP | 33% |
DWS Core Fixed Income VIP | 33% |
DWS Diversified International Equity VIP | 33% |
DWS Dreman Small Mid Cap Value VIP | 33% |
DWS Global Thematic VIP | 33% |
DWS Government & Agency Securities VIP | 33% |
DWS High Income VIP | 33% |
DWS Large Cap Value VIP | 33% |
DWS Mid Cap Growth VIP | 33% |
DWS Money Market VIP | 33% |
DWS Small Cap Growth VIP | 33% |
DWS Strategic Income VIP | 33% |
DWS Strategic Value VIP | 33% |
DWS Technology VIP | 20% |
DWS Turner Mid Cap Growth VIP | 33% |
I. Payments by Affiliates
During the year ended December 31, 2010, the Advisor agreed to reimburse DWS Large Cap Value VIP, DWS Strategic Value VIP and DWS Technology VIP $62,550, $289,394 and $1,507, respectively, for losses incurred on trades executed incorrectly. The amounts of the reimbursement are 0.03%, 0.11% and 0.00%, respectively, of the Funds' average net assets.
J. Acquisition of Assets
On April 24, 2009, DWS Large Cap Value VIP acquired all of the net assets of DWS Davis Venture Value VIP pursuant to a plan of reorganization approved by shareholders on November 21, 2008. The primary reason for the acquisition was to consolidate Funds managed by the Advisor with comparable investment objectives. The acquisition was accomplished by a tax-free exchange of 17,064,120 Class A shares and 32,154 Class B shares of DWS Davis Venture Value VIP for 12,224,432 Class A shares and 22,957 Class B shares of DWS Large Cap Value VIP, respectively, outstanding on April 24, 2009. DWS Davis Venture Value VIP's net assets at that date, $107,655,331, including $5,676,099 of net unrealized appreciation, were combined with those of DWS Large Cap Value VIP. The aggregate net assets of the Fund immediately before the acquisition were $106,678,067. The combined net assets of the Fund immediately following the acquisition were $214,333,398.
K. Subsequent Events
On January 12, 2011, the Board of the following Acquired Funds approved, in principle, the mergers of each Acquired Fund into the Acquiring Fund. Completion of each merger is subject to a number of conditions. The merger of DWS Technology VIP is subject to approval by shareholders of the Fund at a shareholder meeting expected to be held in April 2011. The mergers are expected to be completed on or about May 1, 2011.
Acquired Funds | Acquiring Funds |
DWS Variable Series II — DWS Mid Cap Growth VIP | DWS Variable Series II — DWS Small Cap Growth VIP |
DWS Variable Series II — DWS Strategic Value VIP | DWS Variable Series II — DWS Large Cap Value VIP |
DWS Variable Series II — DWS Technology VIP | DWS Variable Series I — DWS Capital Growth VIP |
DWS Variable Series II — DWS Turner Mid Cap Growth VIP | DWS Variable Series II — DWS Small Cap Growth VIP |
In addition, on January 12, 2011, the Board approved changes to the name and strategy of DWS Small Cap Growth VIP. Effective on or about May 1, 2011, DWS Small Cap Growth VIP's investment objective will change from maximum appreciation of investors capital to long-term capital appreciation. In connection with the implementation of the new investment objective, the name will change from DWS Small Cap Growth VIP to DWS Small Mid Cap Growth VIP. In addition, the Russell 2500 Growth Index will replace the Russell 2000 Growth Index as the benchmark index because the Advisor believes that it better reflects the new investment strategy. For a description of the new investment objective, please see the supplement dated January 19, 2011 to DWS Small Cap Growth VIP's current prospectus posted on www.dws-investments.com.
Report of Independent Registered Public Accounting Firm
To the Board of Trustees and Shareholders of DWS Variable Series II:
We have audited the accompanying statements of assets and liabilities of DWS Variable Series II (the "Trust"), comprising the DWS Alternative Asset Allocation Plus VIP, DWS Balanced VIP, DWS Blue Chip VIP, DWS Core Fixed Income VIP, DWS Diversified International Equity VIP (formerly DWS International Select Equity VIP), DWS Dreman Small Mid Cap Value VIP, DWS Global Thematic VIP, DWS Government & Agency Securities VIP, DWS High Income VIP, DWS Large Cap Value VIP, DWS Mid Cap Growth VIP, DWS Money Market VIP, DWS Small Cap Growth VIP, DWS Strategic Income VIP, DWS Strategic Value VIP (formerly DWS Dreman High Return Equity VIP), DWS Technology VIP and DWS Turner Mid Cap Growth VIP, including the investment portfolios, as of December 31, 2010, and the related statements of operations, the statements of changes in net assets and the financial highlights for each of the periods indicated therein. These financial statements and financial highlights are the responsibility of the Trust's management. Our responsibility is to express an opinion on these financial statements and financial highlights based on our audits.
We conducted our audits in accordance with the standards of the Public Company Accounting Oversight Board (United States). Those standards require that we plan and perform the audit to obtain reasonable assurance about whether the financial statements and financial highlights are free of material misstatement. We were not engaged to perform an audit of the Trust's internal control over financial reporting. Our audits included consideration of internal control over financial reporting as a basis for designing audit procedures that are appropriate in the circumstances, but not for the purpose of expressing an opinion on the effectiveness of the Trust's internal control over financial reporting. Accordingly, we express no such opinion. An audit also includes examining, on a test basis, evidence supporting the amounts and disclosures in the financial statements and financial highlights, assessing the accounting principles used and significant estimates made by management, and evaluating the overall financial statement presentation. Our procedures included confirmation of securities owned as of December 31, 2010, by correspondence with the custodian and brokers or by other appropriate auditing procedures where replies from brokers were not received. We believe that our audits provide a reasonable basis for our opinion.
In our opinion, the financial statements and financial highlights referred to above present fairly, in all material respects, the financial position of the aforementioned funds of the DWS Variable Series II at December 31, 2010, the results of their operations, the changes in their net assets and the financial highlights for each of the periods indicated therein, in conformity with U.S. generally accepted accounting principles.
Boston, Massachusetts
February 14, 2011 | |  |
Tax Information (Unaudited)
The following Funds designated as capital gain dividends for their year ended December 31, 2010:
Fund | Capital Gain ($) | % Representing 15% Rate Gains |
DWS Alternative Asset Allocation Plus VIP | 109,000 | 100 |
DWS Government & Agency Securities VIP | 1,388,000 | 100 |
For corporate shareholders, the following percentage of income dividends paid during the following Funds' fiscal year ended December 31, 2010 qualified for the dividends received deduction:
Fund | Dividends Received % |
DWS Alternative Asset Allocation Plus VIP | 8 |
DWS Balanced VIP | 22 |
DWS Blue Chip VIP | 100 |
DWS Diversified International Equity VIP | 4 |
DWS Dreman Small Mid Cap Value VIP | 100 |
DWS Global Thematic VIP | 59 |
DWS Large Cap Value VIP | 100 |
DWS Strategic Value VIP | 100 |
DWS Technology VIP | 100 |
DWS Turner Mid Cap Growth VIP | 100 |
DWS Diversified International Equity VIP paid foreign taxes of $274,450 and earned $1,655,652 of foreign source income during the year ended December 31, 2010. Pursuant to Section 853 of the Internal Revenue Code, the Fund designates $0.03 per share as foreign taxes paid and $0.16 per share as income earned from foreign sources for the year ended December 31, 2010.
DWS Global Thematic VIP paid foreign taxes of $117,000 and earned $347,000 of foreign source income during the year ended December 31, 2010. Pursuant to Section 853 of the International Revenue Code, the Fund designates $0.02 per share as foreign taxes paid and $0.04 per share as income earned from foreign sources for the year ended December 31, 2010.
Please consult a tax advisor if you have questions about federal or state income tax laws, or on how to prepare your tax returns. If you have specific questions about your account, please contact your insurance provider.
Proxy Voting
The Trust's policies and procedures for voting proxies for portfolio securities and information about how the Trust voted proxies related to its portfolio securities during the 12-month period ended June 30 are available on our Web site — www.dws-investments.com (click on "proxy voting" at the bottom of the page) — or on the SEC's Web site — www.sec.gov. To obtain a written copy of the Trust's policies and procedures without charge, upon request, call us toll free at (800) 728-3337.
Investment Management Agreement Approval
DWS Alternative Asset Allocation Plus VIP
The Board of Trustees, including the Independent Trustees, approved the renewal of your Fund's investment management agreement (the "Agreement") with Deutsche Investment Management Americas Inc. ("DWS"), sub-advisory agreements (each a "Sub-Advisory Agreement") between DWS and RREEF America L.L.C. ("RREEF"), an affiliate of DWS, and DWS and QS Investors, LLC ("QS Investors") and sub-sub-advisory agreements (the "Sub-Sub-Advisory Agreements," and together with the Agreement and Sub-Advisory Agreements, the "Agreements") between RREEF and each of Deutsche Alternatives Asset Management (Global) Limited, Deutsche Asset Management (Hond Kong) Limited and Deutsche Investments Australia Limted (the "Sub-Sub-Advisors"), all affiliates of DWS, in September 2010.
In terms of the process that the Board followed prior to approving the Agreements, shareholders should know that:
• In September 2010, all but one of the Fund's Trustees were independent of DWS and its affiliates.
• The Trustees meet frequently to discuss fund matters. Each year, the Trustees dedicate substantial time to contract review matters. Over the course of several months, the Board's Contract Committee, in coordination with the Board's Fixed Income and Quant Oversight Committee, reviewed comprehensive materials received from DWS, independent third parties and independent counsel. These materials included an analysis of the Fund's fees and expenses, and profitability compiled by the Fund's independent fee consultant. The Board also received extensive information throughout the year regarding performance of the Fund.
• The Independent Trustees regularly meet privately with their independent counsel to discuss contract review and other matters. In addition, the Independent Trustees were also advised by the Fund's independent fee consultant in the course of their review of the Fund's contractual arrangements and considered a comprehensive report prepared by the independent fee consultant in connection with their deliberations (the "IFC Report").
• In connection with reviewing the Agreements, the Board also reviewed the terms of the Fund's Rule 12b-1 plan, distribution agreement, administrative services agreement, transfer agency agreement and other material service agreements.
• Based on its evaluation of the information provided, the Contract Committee presented its findings and recommendations to the Independent Trustees as a group. The Independent Trustees reviewed the Contract Committee's findings and recommendations and presented their recommendations to the full Board.
In connection with the contract review process, the Contract Committee and the Board considered the factors discussed below, among others. The Board also considered that DWS and its predecessors have managed the Fund since its inception, and the Board believes that a long-term relationship with a capable, conscientious advisor is in the best interests of the Fund. The Board considered, generally, that shareholders chose to invest or remain invested in the Fund knowing that DWS managed the Fund. DWS, RREEF and the Sub-Sub-Advisors are part of Deutsche Bank, a major global banking institution that is engaged in a wide range of financial services. The Board believes that there are significant advantages to being part of a global asset management business that offers a wide range of investing expertise and resources, including hundreds of portfolio managers and analysts with research capabilities in many countries throughout the world.
While shareholders may focus primarily on fund performance and fees, the Fund's Board considers these and many other factors, including the quality and integrity of DWS's, QS Investors', RREEF's and the Sub-Sub-Advisors' personnel and such other issues as back-office operations, fund valuations, and compliance policies and procedures. In addition, in connection with approving the continuation of the Fund's Sub-Advisory Agreement with QS Investors, the Board noted it had engaged in a comprehensive review of the agreement in connection with its initial approval in May 2010.
Nature, Quality and Extent of Services. The Board considered the terms of the Agreements, including the scope of advisory services provided under the Agreements. The Board noted that, under the Agreements, DWS, QS Investors, RREEF and the Sub-Sub-Advisors provide portfolio management services to the Fund and that, pursuant to a separate administrative services agreement, DWS provides administrative services to the Fund. The Board considered the experience and skills of senior management and investment personnel, the resources made available to such personnel, the ability of DWS to attract and retain high-quality personnel, and the organizational depth and stability of DWS. The Board did not consider comparative performance information due to the Fund's limited operating history. The Board also noted that it has put into place a process of identifying "Focus Funds" (e.g., funds performing poorly relative to their benchmark or a peer universe compiled by Lipper Inc.), and receives more frequent reporting and information from DWS regarding such funds, along with DWS's remedial plans to address underperformance. The Board believes this process is an effective manner of identifying and addressing underperforming funds.
On the basis of this evaluation and the ongoing review of investment results by the Board, the Board concluded that the nature, quality and extent of services provided by DWS, QS Investors, RREEF and the Sub-Sub-Advisors historically have been and continue to be satisfactory.
Fees and Expenses. The Board considered the Fund's investment management fee schedule, sub-advisory fee schedules, sub-sub-advisory fee schedules, operating expenses, and total expense ratios and comparative information provided by Lipper and the independent fee consultant regarding investment management fee rates paid to other investment advisors by similar funds (1st quartile being the most favorable and 4th quartile being the least favorable). With respect to management fees paid to other investment advisors by similar funds, the Board noted that the contractual fee rates paid by the Fund, which include a 0.10% fee paid to DWS under the Fund's administrative services agreement, were higher than the median (3rd quartile) of the applicable Lipper peer group (based on Lipper data provided as of December 31, 2009). With respect to the sub-advisory fees paid to QS Investors and RREEF, the Board noted that the fees are paid by DWS out of its fee and not directly by the Fund. With respect to the sub-sub-advisory fees paid to the Sub-Sub-Advisors, the Board noted that the fees are paid by RREEF out of its fee and not directly by the Fund. The Board noted that the Fund's Class A shares total (net) operating expenses were expected to be higher than the median (4th quartile) of the applicable Lipper expense universe (based on Lipper data provided as of December 31, 2009, and analyzing Lipper expense universe Class A expenses less any applicable 12b-1 fees) ("Lipper Universe Expenses"). The Board also reviewed data comparing each share class's total (net) operating expenses to the applicable Lipper Universe Expenses. The Board considered the Fund's management fee rate as compared to fees charged by DWS and certain of its affiliates for comparable mutual funds and considered differences in fund and fee structures between the DWS Funds. The Board also considered how the Fund's total (net) operating expenses compared to the total (net) operating expenses of a more customized peer group selected by Lipper (based on such factors as asset size). The Board also noted that the expense limitations agreed to by DWS helped to ensure that the Fund's total (net) operating expenses would remain competitive.
The information considered by the Board as part of its review of management fees included information regarding fees charged by DWS and its affiliates to similar institutional accounts and to similar funds offered primarily to European investors ("DWS Europe funds"), in each case as applicable. The Board observed that advisory fee rates for institutional accounts generally were lower than the management fees charged by similarly managed DWS US mutual funds ("DWS Funds"), but also took note of the differences in services provided to DWS Funds as compared to institutional accounts. In the case of DWS Europe funds, the Board observed that fee rates for DWS Europe funds generally were higher than for similarly managed DWS Funds, but noted that differences in the types of services provided to DWS Funds relative to DWS Europe funds made it difficult to compare such fees.
On the basis of the information provided, the Board concluded that management fees were reasonable and appropriate in light of the nature, quality and extent of services provided by DWS, QS Investors, RREEF and the Sub-Sub-Advisors.
Profitability. The Board reviewed detailed information regarding revenues received by DWS from advising the DWS Funds along with the estimated costs and pre-tax profits realized by DWS from advising the DWS Funds. The Board also received information regarding the estimated enterprise-wide profitability of DWS and its affiliates with respect to all fund services in totality. The Board did not receive profitability information with respect to the Fund, but did receive such information with respect to the funds in which the Fund invests. The Board also reviewed information regarding the profitability of certain similar investment management firms. The Board noted that while information regarding the profitability of such firms is limited (and in some cases is not necessarily prepared on a comparable basis), DWS and its affiliates' overall profitability with respect to the DWS fund complex (after taking into account distribution and other services provided to the funds by DWS and its affiliates) was lower than the overall profitability levels of many comparable firms for which such data was available. The Board did not consider the profitability of QS Investors with respect to the Fund. The Board noted that DWS pays QS Investors' fee out of its management fee, and its understanding that the Fund's sub-advisory fee schedule was the product of an arm's length negotiation with DWS.
Economies of Scale. The Board considered whether there are economies of scale with respect to the management of the Fund and whether the Fund benefits from any economies of scale. In this regard, the Board noted that while the Fund's current investment management fee schedule does not include breakpoints, the Board intends to consider implementation of one or more breakpoints once the Fund reaches an efficient operating size. The Board concluded that the Fund's fee schedule represents an appropriate sharing between the Fund and DWS of such economies of scale as may exist in the management of the Fund at current asset levels.
Other Benefits to DWS and QS Investors and Their Affiliates. The Board also considered the character and amount of other incidental benefits received by DWS and QS Investors and their affiliates, including any fees received by DWS for administrative services provided to the Fund and any fees received by an affiliate of DWS for distribution services. The Board also considered benefits to DWS and QS Investors related to brokerage and soft-dollar allocations, including allocating brokerage to pay for research generated by parties other than the executing broker dealers, which pertain primarily to funds investing in equity securities, along with the incidental public relations benefits to DWS and QS Investors related to DWS Funds advertising and cross-selling opportunities among DWS products and services. The Board concluded that management fees were reasonable in light of these fallout benefits.
Compliance. The Board considered the significant attention and resources dedicated by DWS to documenting and enhancing its compliance processes in recent years. The Board noted in particular (i) the experience and seniority of both DWS's chief compliance officer and the Fund's chief compliance officer; (ii) the large number of DWS compliance personnel; and (iii) the substantial commitment of resources by DWS and its affiliates to compliance matters. The Board also considered the attention and resources dedicated by DWS to the oversight of QS Investors' compliance program and compliance with the applicable fund policies and procedures.
Based on all of the information considered and the conclusions reached, the Board unanimously (including the Independent Trustees) determined that the continuation of the Agreements is in the best interests of the Fund. In making this determination, the Board did not give particular weight to any single factor identified above. The Board considered these factors over the course of numerous meetings, certain of which were in executive session with only the Independent Trustees and their counsel present. It is possible that individual Trustees may have weighed these factors differently in reaching their individual decisions to approve the continuation of the Agreements.
DWS Balanced VIP
The Board of Trustees, including the Independent Trustees, approved the renewal of your Fund's investment management agreement (the "Agreement") with Deutsche Investment Management Americas Inc. ("DWS") and sub-advisory agreements (the "Sub-Advisory Agreements" and together with the Agreement, the "Agreements") between DWS and Deutsche Asset Management International GmbH ("DeAMi"), an affiliate of DWS, and DWS and QS Investors, LLC ("QS Investors") in September 2010.
In terms of the process that the Board followed prior to approving the Agreements, shareholders should know that:
• In September 2010, all but one of the Fund's Trustees were independent of DWS and its affiliates.
• The Trustees meet frequently to discuss fund matters. Each year, the Trustees dedicate substantial time to contract review matters. Over the course of several months, the Board's Contract Committee, in coordination with the Board's Fixed Income and Quant Oversight Committee, reviewed comprehensive materials received from DWS, independent third parties and independent counsel. These materials included an analysis of the Fund's performance, fees and expenses, and profitability compiled by the Fund's independent fee consultant. The Board also received extensive information throughout the year regarding performance of the Fund.
• The Independent Trustees regularly meet privately with their independent counsel to discuss contract review and other matters. In addition, the Independent Trustees were also advised by the Fund's independent fee consultant in the course of their review of the Fund's contractual arrangements and considered a comprehensive report prepared by the independent fee consultant in connection with their deliberations (the "IFC Report").
• In connection with reviewing the Agreements, the Board also reviewed the terms of the Fund's distribution agreement, administrative services agreement, transfer agency agreement and other material service agreements.
• Based on its evaluation of the information provided, the Contract Committee presented its findings and recommendations to the Independent Trustees as a group. The Independent Trustees reviewed the Contract Committee's findings and recommendations and presented their recommendations to the full Board.
In connection with the contract review process, the Contract Committee and the Board considered the factors discussed below, among others. The Board also considered that DWS and its predecessors have managed the Fund since its inception, and the Board believes that a long-term relationship with a capable, conscientious advisor is in the best interests of the Fund. The Board considered, generally, that shareholders chose to invest or remain invested in the Fund knowing that DWS managed the Fund, and that the Agreement was approved by the Fund's shareholders. DWS and DeAMi are part of Deutsche Bank, a major global banking institution that is engaged in a wide range of financial services. The Board believes that there are significant advantages to being part of a global asset management business that offers a wide range of investing expertise and resources, including hundreds of portfolio managers and analysts with research capabilities in many countries throughout the world.
While shareholders may focus primarily on fund performance and fees, the Fund's Board considers these and many other factors, including the quality and integrity of DWS's, DeAMi's and QS Investors' personnel and such other issues as back-office operations, fund valuations, and compliance policies and procedures. In addition, in connection with approving the continuation of the Fund's Sub-Advisory Agreement with QS Investors, the Board noted it had engaged in a comprehensive review of the agreement in connection with its initial approval in May 2010.
Nature, Quality and Extent of Services. The Board considered the terms of the Agreements, including the scope of advisory services provided under the Agreements. The Board noted that, under the Agreements, DWS, DeAMi and QS Investors provide portfolio management services to the Fund and that, pursuant to a separate administrative services agreement, DWS provides administrative services to the Fund. The Board considered the experience and skills of senior management and investment personnel, the resources made available to such personnel, the ability of DWS to attract and retain high-quality personnel, and the organizational depth and stability of DWS. The Board reviewed the Fund's performance over short-term and long-term periods and compared those returns to various agreed-upon performance measures, including market indices and a peer universe compiled by the independent fee consultant using information supplied by Lipper Inc. ("Lipper"). The Board also noted that it has put into place a process of identifying "Focus Funds" (e.g., funds performing poorly relative to their benchmark or a peer universe compiled by Lipper), and receives more frequent reporting and information from DWS regarding such funds, along with DWS's remedial plans to address underperformance. The Board believes this process is an effective manner of identifying and addressing underperforming funds. Based on the information provided, the Board noted that for the one-, three- and five-year periods ended December 31, 2009, the Fund's performance (Class A shares) was in the 2nd quartile, 4th quartile and 4th quartile, respectively, of the applicable Lipper universe (the 1st quartile being the best performers and the 4th quartile being the worst performers). The Board also observed that the Fund has outperformed its benchmark in the one-year period and has underperformed its benchmark in the three- and five-year periods ended December 31, 2009.
On the basis of this evaluation and the ongoing review of investment results by the Board, the Board concluded that the nature, quality and extent of services provided by DWS, DeAMi and QS Investors historically have been and continue to be satisfactory.
Fees and Expenses. The Board considered the Fund's investment management fee schedule, sub-advisory fee schedules, operating expenses, and total expense ratios, and comparative information provided by Lipper and the independent fee consultant regarding investment management fee rates paid to other investment advisors by similar funds (1st quartile being the most favorable and 4th quartile being the least favorable). With respect to management fees paid to other investment advisors by similar funds, the Board noted that the contractual fee rates paid by the Fund, which include the 0.10% fee paid to DWS under the Fund's administrative services agreement, were lower than the median (1st quartile) of the applicable Lipper peer group (based on Lipper data provided as of December 31, 2009). With respect to the sub-advisory fees paid to DeAMi and QS Investors, the Board noted that the fees are paid by DWS out of its fee and not directly by the Fund. The Board noted that the Fund's Class A shares total (net) operating expenses were expected to be lower than the median (2nd quartile) of the applicable Lipper expense universe (based on Lipper data provided as of December 31, 2009, and analyzing Lipper expense universe Class A expenses less any applicable 12b-1 fees) ("Lipper Universe Expenses"). The Board considered the Fund's management fee rate as compared to fees charged by DWS and certain of its affiliates for comparable mutual funds and considered differences in fund and fee structures between the DWS Funds. The Board also considered how the Fund's total (net) operating expenses compared to the total (net) operating expenses of a more customized peer group selected by Lipper (based on such factors as asset size).
The information considered by the Board as part of its review of management fees included information regarding fees charged by DWS and its affiliates to similar institutional accounts and to similar funds offered primarily to European investors ("DWS Europe funds"), in each case as applicable. The Board observed that advisory fee rates for institutional accounts generally were lower than the management fees charged by similarly managed DWS US mutual funds ("DWS Funds"), but also took note of the differences in services provided to DWS Funds as compared to institutional accounts. In the case of DWS Europe funds, the Board observed that fee rates for DWS Europe funds generally were higher than for similarly managed DWS Funds, but noted that differences in the types of services provided to DWS Funds relative to DWS Europe funds made it difficult to compare such fees.
On the basis of the information provided, the Board concluded that management fees were reasonable and appropriate in light of the nature, quality and extent of services provided by DWS, DeAMi and QS Investors.
Profitability. The Board reviewed detailed information regarding revenues received by DWS under the Agreement. The Board considered the estimated costs and pre-tax profits realized by DWS from advising the DWS Funds, as well as estimates of the pre-tax profits attributable to managing the Fund in particular. The Board also received information regarding the estimated enterprise-wide profitability of DWS and its affiliates with respect to all fund services in totality and by fund. The Board reviewed DWS's methodology in allocating its costs to the management of the Fund. Based on the information provided, the Board concluded that the pre-tax profits realized by DWS in connection with the management of the Fund were not unreasonable. The Board also reviewed information regarding the profitability of certain similar investment management firms. The Board noted that while information regarding the profitability of such firms is limited (and in some cases is not necessarily prepared on a comparable basis), DWS and its affiliates' overall profitability with respect to the DWS fund complex (after taking into account distribution and other services provided to the funds by DWS and its affiliates) was lower than the overall profitability levels of many comparable firms for which such data was available. The Board did not consider the profitability of QS Investors with respect to the Fund. The Board noted that DWS pays QS Investors' fee out of its management fee, and its understanding that the Fund's sub-advisory fee schedule was the product of an arm's length negotiation with DWS.
Economies of Scale. The Board considered whether there are economies of scale with respect to the management of the Fund and whether the Fund benefits from any economies of scale. The Board noted that the Fund's management fee schedule includes fee breakpoints. The Board concluded that the Fund's fee schedule represents an appropriate sharing between the Fund and DWS of such economies of scale as may exist in the management of the Fund at current asset levels.
Other Benefits to DWS and QS Investors and Their Affiliates. The Board also considered the character and amount of other incidental benefits received by DWS and QS Investors and their affiliates, including any fees received by DWS for administrative services provided to the Fund and any fees received by an affiliate of DWS for distribution services. The Board also considered benefits to DWS and QS Investors related to brokerage and soft-dollar allocations, including allocating brokerage to pay for research generated by parties other than the executing broker dealers, which pertain primarily to funds investing in equity securities, along with the incidental public relations benefits to DWS and QS Investors related to DWS Funds advertising and cross-selling opportunities among DWS products and services. The Board concluded that management fees were reasonable in light of these fallout benefits.
Compliance. The Board considered the significant attention and resources dedicated by DWS to documenting and enhancing its compliance processes in recent years. The Board noted in particular (i) the experience and seniority of both DWS's chief compliance officer and the Fund's chief compliance officer; (ii) the large number of DWS compliance personnel; and (iii) the substantial commitment of resources by DWS and its affiliates to compliance matters. The Board also considered the attention and resources dedicated by DWS to the oversight of QS Investors' compliance program and compliance with the applicable fund policies and procedures.
Based on all of the information considered and the conclusions reached, the Board unanimously (including the Independent Trustees) determined that the continuation of the Agreements is in the best interests of the Fund. In making this determination, the Board did not give particular weight to any single factor identified above. The Board considered these factors over the course of numerous meetings, certain of which were in executive session with only the Independent Trustees and their counsel present. It is possible that individual Trustees may have weighed these factors differently in reaching their individual decisions to approve the continuation of the Agreements.
DWS Blue Chip VIP
The Board of Trustees, including the Independent Trustees, approved the renewal of your Fund's investment management agreement (the "Agreement") with Deutsche Investment Management Americas Inc. ("DWS") and sub-advisory agreement (the "Sub-Advisory Agreement" and together with the Agreement the "Agreements") between DWS and QS Investors, LLC ("QS Investors") in September 2010.
In terms of the process that the Board followed prior to approving the Agreements, shareholders should know that:
• In September 2010, all but one of the Fund's Trustees were independent of DWS and its affiliates.
• The Trustees meet frequently to discuss fund matters. Each year, the Trustees dedicate substantial time to contract review matters. Over the course of several months, the Board's Contract Committee, in coordination with the Board's Fixed Income and Quant Oversight Committee, reviewed comprehensive materials received from DWS, independent third parties and independent counsel. These materials included an analysis of the Fund's performance, fees and expenses, and profitability compiled by the Fund's independent fee consultant. The Board also received extensive information throughout the year regarding performance of the Fund.
• The Independent Trustees regularly meet privately with their independent counsel to discuss contract review and other matters. In addition, the Independent Trustees were also advised by the Fund's independent fee consultant in the course of their review of the Fund's contractual arrangements and considered a comprehensive report prepared by the independent fee consultant in connection with their deliberations (the "IFC Report").
• In connection with reviewing the Agreements, the Board also reviewed the terms of the Fund's Rule 12b-1 plan, distribution agreement, administrative services agreement, transfer agency agreement and other material service agreements.
• Based on its evaluation of the information provided, the Contract Committee presented its findings and recommendations to the Independent Trustees as a group. The Independent Trustees reviewed the Contract Committee's findings and recommendations and presented their recommendations to the full Board.
In connection with the contract review process, the Contract Committee and the Board considered the factors discussed below, among others. The Board also considered that DWS and its predecessors have managed the Fund since its inception, and the Board believes that a long-term relationship with a capable, conscientious advisor is in the best interests of the Fund. The Board considered, generally, that shareholders chose to invest or remain invested in the Fund knowing that DWS managed the Fund, and that the Agreement was approved by the Fund's shareholders. DWS is part of Deutsche Bank, a major global banking institution that is engaged in a wide range of financial services. The Board believes that there are significant advantages to being part of a global asset management business that offers a wide range of investing expertise and resources, including hundreds of portfolio managers and analysts with research capabilities in many countries throughout the world.
While shareholders may focus primarily on fund performance and fees, the Fund's Board considers these and many other factors, including the quality and integrity of DWS's and QS Investors' personnel and such other issues as back-office operations, fund valuations, and compliance policies and procedures. In addition, in connection with approving the continuation of the Fund's Sub-Advisory Agreement, the Board noted it had engaged in a comprehensive review of the agreement in connection with its initial approval in May 2010.
Nature, Quality and Extent of Services. The Board considered the terms of the Agreements, including the scope of advisory services provided under the Agreements. The Board noted that, under the Agreements, DWS and QS Investors provide portfolio management services to the Fund and that, pursuant to a separate administrative services agreement, DWS provides administrative services to the Fund. The Board considered the experience and skills of senior management and investment personnel, the resources made available to such personnel, the ability of DWS to attract and retain high-quality personnel, and the organizational depth and stability of DWS. The Board reviewed the Fund's performance over short-term and long-term periods and compared those returns to various agreed-upon performance measures, including market indices and a peer universe compiled by the independent fee consultant using information supplied by Lipper Inc. ("Lipper"). The Board also noted that it has put into place a process of identifying "Focus Funds" (e.g., funds performing poorly relative to their benchmark or a peer universe compiled by Lipper), and receives more frequent reporting and information from DWS regarding such funds, along with DWS's remedial plans to address underperformance. The Board believes this process is an effective manner of identifying and addressing underperforming funds. Based on the information provided, the Board noted that for the one-, three- and five-year periods ended December 31, 2009, the Fund's performance (Class A shares) was in the 2nd quartile of the applicable Lipper universe (the 1st quartile being the best performers and the 4th quartile being the worst performers). The Board also observed that the Fund has outperformed its benchmark in the one-, three- and five-year periods ended December 31, 2009.
On the basis of this evaluation and the ongoing review of investment results by the Board, the Board concluded that the nature, quality and extent of services provided by DWS and QS Investors historically have been and continue to be satisfactory.
Fees and Expenses. The Board considered the Fund's investment management fee schedule, sub-advisory fee schedule, operating expenses, and total expense ratios, and comparative information provided by Lipper and the independent fee consultant regarding investment management fee rates paid to other investment advisors by similar funds (1st quartile being the most favorable and 4th quartile being the least favorable). With respect to management fees paid to other investment advisors by similar funds, the Board noted that the contractual fee rates paid by the Fund, which include the 0.10% fee paid to DWS under the Fund's administrative services agreement, were lower than the median (2nd quartile) of the applicable Lipper peer group (based on Lipper data provided as of December 31, 2009). With respect to the sub-advisory fee paid to QS Investors, the Board noted that the fee is paid by DWS out of its fee and not directly by the Fund. The Board noted that the Fund's Class A shares total (net) operating expenses were expected to be lower than the median (2nd quartile) of the applicable Lipper expense universe (based on Lipper data provided as of December 31, 2009, and analyzing Lipper expense universe Class A expenses less any applicable 12b-1 fees) ("Lipper Universe Expenses"). The Board also reviewed data comparing each share class's total (net) operating expenses to the applicable Lipper Universe Expenses. The Board considered the Fund's management fee rate as compared to fees charged by DWS and certain of its affiliates for comparable mutual funds and considered differences in fund and fee structures between the DWS Funds. The Board also considered how the Fund's total (net) operating expenses compared to the total (net) operating expenses of a more customized peer group selected by Lipper (based on such factors as asset size).
The information considered by the Board as part of its review of management fees included information regarding fees charged by DWS and its affiliates to similar institutional accounts and to similar funds offered primarily to European investors ("DWS Europe funds"), in each case as applicable. The Board observed that advisory fee rates for institutional accounts generally were lower than the management fees charged by similarly managed DWS US mutual funds ("DWS Funds"), but also took note of the differences in services provided to DWS Funds as compared to institutional accounts. In the case of DWS Europe funds, the Board observed that fee rates for DWS Europe funds generally were higher than for similarly managed DWS Funds, but noted that differences in the types of services provided to DWS Funds relative to DWS Europe funds made it difficult to compare such fees.
On the basis of the information provided, the Board concluded that management fees were reasonable and appropriate in light of the nature, quality and extent of services provided by DWS and QS Investors.
Profitability. The Board reviewed detailed information regarding revenues received by DWS under the Agreement. The Board considered the estimated costs and pre-tax profits realized by DWS from advising the DWS Funds, as well as estimates of the pre-tax profits attributable to managing the Fund in particular. The Board also received information regarding the estimated enterprise-wide profitability of DWS and its affiliates with respect to all fund services in totality and by fund. The Board reviewed DWS's methodology in allocating its costs to the management of the Fund. Based on the information provided, the Board concluded that the pre-tax profits realized by DWS in connection with the management of the Fund were not unreasonable. The Board also reviewed information regarding the profitability of certain similar investment management firms. The Board noted that while information regarding the profitability of such firms is limited (and in some cases is not necessarily prepared on a comparable basis), DWS and its affiliates' overall profitability with respect to the DWS fund complex (after taking into account distribution and other services provided to the funds by DWS and its affiliates) was lower than the overall profitability levels of many comparable firms for which such data was available. The Board did not consider the profitability of QS Investors with respect to the Fund. The Board noted that DWS pays QS Investors' fee out of its management fee, and its understanding that the Fund's sub-advisory fee schedule was the product of an arm's length negotiation with DWS.
Economies of Scale. The Board considered whether there are economies of scale with respect to the management of the Fund and whether the Fund benefits from any economies of scale. The Board noted that the Fund's management fee schedule includes fee breakpoints. The Board concluded that the Fund's fee schedule represents an appropriate sharing between the Fund and DWS of such economies of scale as may exist in the management of the Fund at current asset levels.
Other Benefits to DWS and QS Investors and Their Affiliates. The Board also considered the character and amount of other incidental benefits received by DWS and QS Investors and their affiliates, including any fees received by DWS for administrative services provided to the Fund and any fees received by an affiliate of DWS for distribution services. The Board also considered benefits to DWS and QS Investors related to brokerage and soft-dollar allocations, including allocating brokerage to pay for research generated by parties other than the executing broker dealers, which pertain primarily to funds investing in equity securities, along with the incidental public relations benefits to DWS and QS Investors related to DWS Funds advertising and cross-selling opportunities among DWS products and services. The Board concluded that management fees were reasonable in light of these fallout benefits.
Compliance. The Board considered the significant attention and resources dedicated by DWS to documenting and enhancing its compliance processes in recent years. The Board noted in particular (i) the experience and seniority of both DWS's chief compliance officer and the Fund's chief compliance officer; (ii) the large number of DWS compliance personnel; and (iii) the substantial commitment of resources by DWS and its affiliates to compliance matters. The Board also considered the attention and resources dedicated by DWS to the oversight of the investment sub-advisor's compliance program and compliance with the applicable fund policies and procedures.
Based on all of the information considered and the conclusions reached, the Board unanimously (including the Independent Trustees) determined that the continuation of the Agreements is in the best interests of the Fund. In making this determination, the Board did not give particular weight to any single factor identified above. The Board considered these factors over the course of numerous meetings, certain of which were in executive session with only the Independent Trustees and their counsel present. It is possible that individual Trustees may have weighed these factors differently in reaching their individual decisions to approve the continuation of the Agreements.
DWS Core Fixed Income VIP
The Board of Trustees, including the Independent Trustees, approved the renewal of your Fund's investment management agreement (the "Agreement") with Deutsche Investment Management Americas Inc. ("DWS") in September 2010.
In terms of the process that the Board followed prior to approving the Agreement, shareholders should know that:
• In September 2010, all but one of the Fund's Trustees were independent of DWS and its affiliates.
• The Trustees meet frequently to discuss fund matters. Each year, the Trustees dedicate substantial time to contract review matters. Over the course of several months, the Board's Contract Committee, in coordination with the Board's Fixed Income and Quant Oversight Committee, reviewed comprehensive materials received from DWS, independent third parties and independent counsel. These materials included an analysis of the Fund's performance, fees and expenses, and profitability compiled by the Fund's independent fee consultant. The Board also received extensive information throughout the year regarding performance of the Fund.
• The Independent Trustees regularly meet privately with their independent counsel to discuss contract review and other matters. In addition, the Independent Trustees were also advised by the Fund's independent fee consultant in the course of their review of the Fund's contractual arrangements and considered a comprehensive report prepared by the independent fee consultant in connection with their deliberations (the "IFC Report").
• In connection with reviewing the Agreement, the Board also reviewed the terms of the Fund's distribution agreement, administrative services agreement, transfer agency agreement and other material service agreements.
• Based on its evaluation of the information provided, the Contract Committee presented its findings and recommendations to the Independent Trustees as a group. The Independent Trustees reviewed the Contract Committee's findings and recommendations and presented their recommendations to the full Board.
In connection with the contract review process, the Contract Committee and the Board considered the factors discussed below, among others. The Board also considered that DWS and its predecessors have managed the Fund since its inception, and the Board believes that a long-term relationship with a capable, conscientious advisor is in the best interests of the Fund. The Board considered, generally, that shareholders chose to invest or remain invested in the Fund knowing that DWS managed the Fund, and that the Agreement was approved by the Fund's shareholders. DWS is part of Deutsche Bank, a major global banking institution that is engaged in a wide range of financial services. The Board believes that there are significant advantages to being part of a global asset management business that offers a wide range of investing expertise and resources, including hundreds of portfolio managers and analysts with research capabilities in many countries throughout the world.
While shareholders may focus primarily on fund performance and fees, the Fund's Board considers these and many other factors, including the quality and integrity of DWS's personnel and such other issues as back-office operations, fund valuations, and compliance policies and procedures.
Nature, Quality and Extent of Services. The Board considered the terms of the Agreement, including the scope of advisory services provided under the Agreement. The Board noted that, under the Agreement, DWS provides portfolio management services to the Fund and that, pursuant to a separate administrative services agreement, DWS provides administrative services to the Fund. The Board considered the experience and skills of senior management and investment personnel, the resources made available to such personnel, the ability of DWS to attract and retain high-quality personnel, and the organizational depth and stability of DWS. The Board reviewed the Fund's performance over short-term and long-term periods and compared those returns to various agreed-upon performance measures, including market indices and a peer universe compiled by the independent fee consultant using information supplied by Lipper Inc. ("Lipper"). The Board also noted that it has put into place a process of identifying "Focus Funds" (e.g., funds performing poorly relative to their benchmark or a peer universe compiled by Lipper), and receives more frequent reporting and information from DWS regarding such funds, along with DWS's remedial plans to address underperformance. The Board believes this process is an effective manner of identifying and addressing underperforming funds. Based on the information provided, the Board noted that for the one-, three- and five-year periods ended December 31, 2009, the Fund's performance (Class A shares) was in the 4th quartile of the applicable Lipper universe (the 1st quartile being the best performers and the 4th quartile being the worst performers). The Board also observed that the Fund has outperformed its benchmark in the one-year period and has underperformed its benchmark in the three- and five-year periods ended December 31, 2009. The Board noted the disappointing investment performance of the Fund in recent periods and continued to discuss with senior management of DWS the factors contributing to such underperformance and actions being taken to improve performance. The Board recognized that DWS has made significant changes in its investment personnel and processes in recent years in an effort to improve long-term performance.
On the basis of this evaluation and the ongoing review of investment results by the Board, the Board concluded that the nature, quality and extent of services provided by DWS historically have been and continue to be satisfactory.
Fees and Expenses. The Board considered the Fund's investment management fee schedule, operating expenses, and total expense ratios, and comparative information provided by Lipper and the independent fee consultant regarding investment management fee rates paid to other investment advisors by similar funds (1st quartile being the most favorable and 4th quartile being the least favorable). With respect to management fees paid to other investment advisors by similar funds, the Board noted that the contractual fee rates paid by the Fund, which include the 0.10% fee paid to DWS under the Fund's administrative services agreement, were higher than the median (3rd quartile) of the applicable Lipper peer group (based on Lipper data provided as of December 31, 2009). The Board noted that the Fund's Class A shares total (net) operating expenses were expected to be higher than the median (3rd quartile) of the applicable Lipper expense universe (based on Lipper data provided as of December 31, 2009, and analyzing Lipper expense universe Class A expenses less any applicable 12b-1 fees) ("Lipper Universe Expenses"). The Board considered the Fund's management fee rate as compared to fees charged by DWS and certain of its affiliates for comparable mutual funds and considered differences in fund and fee structures between the DWS Funds. The Board also considered how the Fund's total (net) operating expenses compared to the total (net) operating expenses of a more customized peer group selected by Lipper (based on such factors as asset size). The Board also noted that the expense limitation agreed to by DWS helped to ensure that the Fund's total (net) operating expenses would remain competitive.
The information considered by the Board as part of its review of management fees included information regarding fees charged by DWS and its affiliates to similar institutional accounts and to similar funds offered primarily to European investors ("DWS Europe funds"), in each case as applicable. The Board observed that advisory fee rates for institutional accounts generally were lower than the management fees charged by similarly managed DWS US mutual funds ("DWS Funds"), but also took note of the differences in services provided to DWS Funds as compared to institutional accounts. In the case of DWS Europe funds, the Board observed that fee rates for DWS Europe funds generally were higher than for similarly managed DWS Funds, but noted that differences in the types of services provided to DWS Funds relative to DWS Europe funds made it difficult to compare such fees.
On the basis of the information provided, the Board concluded that management fees were reasonable and appropriate in light of the nature, quality and extent of services provided by DWS.
Profitability. The Board reviewed detailed information regarding revenues received by DWS under the Agreement. The Board considered the estimated costs and pre-tax profits realized by DWS from advising the DWS Funds, as well as estimates of the pre-tax profits attributable to managing the Fund in particular. The Board also received information regarding the estimated enterprise-wide profitability of DWS and its affiliates with respect to all fund services in totality and by fund. The Board reviewed DWS's methodology in allocating its costs to the management of the Fund. Based on the information provided, the Board concluded that the pre-tax profits realized by DWS in connection with the management of the Fund were not unreasonable. The Board also reviewed information regarding the profitability of certain similar investment management firms. The Board noted that while information regarding the profitability of such firms is limited (and in some cases is not necessarily prepared on a comparable basis), DWS and its affiliates' overall profitability with respect to the DWS fund complex (after taking into account distribution and other services provided to the funds by DWS and its affiliates) was lower than the overall profitability levels of many comparable firms for which such data was available.
Economies of Scale. The Board considered whether there are economies of scale with respect to the management of the Fund and whether the Fund benefits from any economies of scale. The Board noted that the Fund's management fee schedule includes fee breakpoints. The Board concluded that the Fund's fee schedule represents an appropriate sharing between the Fund and DWS of such economies of scale as may exist in the management of the Fund at current asset levels.
Other Benefits to DWS and Its Affiliates. The Board also considered the character and amount of other incidental benefits received by DWS and its affiliates, including any fees received by DWS for administrative services provided to the Fund and any fees received by an affiliate of DWS for distribution services. The Board also considered benefits to DWS related to brokerage and soft-dollar allocations, including allocating brokerage to pay for research generated by parties other than the executing broker dealers, which pertain primarily to funds investing in equity securities, along with the incidental public relations benefits to DWS related to DWS Funds advertising and cross-selling opportunities among DWS products and services. The Board concluded that management fees were reasonable in light of these fallout benefits.
Compliance. The Board considered the significant attention and resources dedicated by DWS to documenting and enhancing its compliance processes in recent years. The Board noted in particular (i) the experience and seniority of both DWS's chief compliance officer and the Fund's chief compliance officer; (ii) the large number of DWS compliance personnel; and (iii) the substantial commitment of resources by DWS and its affiliates to compliance matters.
Based on all of the information considered and the conclusions reached, the Board unanimously (including the Independent Trustees) determined that the continuation of the Agreement is in the best interests of the Fund. In making this determination, the Board did not give particular weight to any single factor identified above. The Board considered these factors over the course of numerous meetings, certain of which were in executive session with only the Independent Trustees and their counsel present. It is possible that individual Trustees may have weighed these factors differently in reaching their individual decisions to approve the continuation of the Agreement.
DWS Diversified International Equity VIP
The Board of Trustees, including the Independent Trustees, approved the renewal of your Fund's investment management agreement (the "Agreement") with Deutsche Investment Management Americas Inc. ("DWS") and sub-advisory agreement (the "Sub-Advisory Agreement" and together with the Agreement the "Agreements") between DWS and QS Investors, LLC ("QS Investors") in September 2010.
In terms of the process that the Board followed prior to approving the Agreements, shareholders should know that:
• In September 2010, all but one of the Fund's Trustees were independent of DWS and its affiliates.
• The Trustees meet frequently to discuss fund matters. Each year, the Trustees dedicate substantial time to contract review matters. Over the course of several months, the Board's Contract Committee, in coordination with the Board's Fixed Income and Quant Oversight Committee, reviewed comprehensive materials received from DWS, independent third parties and independent counsel. These materials included an analysis of the Fund's performance, fees and expenses, and profitability compiled by the Fund's independent fee consultant. The Board also received extensive information throughout the year regarding performance of the Fund.
• The Independent Trustees regularly meet privately with their independent counsel to discuss contract review and other matters. In addition, the Independent Trustees were also advised by the Fund's independent fee consultant in the course of their review of the Fund's contractual arrangements and considered a comprehensive report prepared by the independent fee consultant in connection with their deliberations (the "IFC Report").
• In connection with reviewing the Agreements, the Board also reviewed the terms of the Fund's distribution agreement, administrative services agreement, transfer agency agreement and other material service agreements.
• Based on its evaluation of the information provided, the Contract Committee presented its findings and recommendations to the Independent Trustees as a group. The Independent Trustees reviewed the Contract Committee's findings and recommendations and presented their recommendations to the full Board.
In connection with the contract review process, the Contract Committee and the Board considered the factors discussed below, among others. The Board also considered that DWS and its predecessors have managed the Fund since its inception, and the Board believes that a long-term relationship with a capable, conscientious advisor is in the best interests of the Fund. The Board considered, generally, that shareholders chose to invest or remain invested in the Fund knowing that DWS managed the Fund, and that the Agreement was approved by the Fund's shareholders. DWS is part of Deutsche Bank, a major global banking institution that is engaged in a wide range of financial services. The Board believes that there are significant advantages to being part of a global asset management business that offers a wide range of investing expertise and resources, including hundreds of portfolio managers and analysts with research capabilities in many countries throughout the world.
While shareholders may focus primarily on fund performance and fees, the Fund's Board considers these and many other factors, including the quality and integrity of DWS's and QS Investors' personnel and such other issues as back-office operations, fund valuations, and compliance policies and procedures. In addition, in connection with approving the continuation of the Fund's Sub-Advisory Agreement, the Board noted it had engaged in a comprehensive review of the agreement in connection with its initial approval in May 2010.
Nature, Quality and Extent of Services. The Board considered the terms of the Agreements, including the scope of advisory services provided under the Agreements. The Board noted that, under the Agreements, DWS and QS Investors provide portfolio management services to the Fund and that, pursuant to a separate administrative services agreement, DWS provides administrative services to the Fund. The Board considered the experience and skills of senior management and investment personnel, the resources made available to such personnel, the ability of DWS to attract and retain high-quality personnel, and the organizational depth and stability of DWS. The Board reviewed the Fund's performance over short-term and long-term periods and compared those returns to various agreed-upon performance measures, including market indices and a peer universe compiled by the independent fee consultant using information supplied by Lipper Inc. ("Lipper"). The Board also noted that it has put into place a process of identifying "Focus Funds" (e.g., funds performing poorly relative to their benchmark or a peer universe compiled by Lipper), and receives more frequent reporting and information from DWS regarding such funds, along with DWS's remedial plans to address underperformance. The Board believes this process is an effective manner of identifying and addressing underperforming funds. Based on the information provided, the Board noted that for the one-, three- and five-year periods ended December 31, 2009, the Fund's performance (Class A shares) was in the 3rd quartile, 4th quartile and 4th quartile, respectively, of the applicable Lipper universe (the 1st quartile being the best performers and the 4th quartile being the worst performers). The Board also observed that the Fund has underperformed its benchmark in the one-, three- and five-year periods ended December 31, 2009. The Board noted the disappointing investment performance of the Fund in recent periods and continued to discuss with senior management of DWS and QS Investors the factors contributing to such underperformance and actions being taken to improve performance. The Board recognized that DWS has made significant changes in its investment personnel and processes in recent years in an effort to improve long-term performance.
On the basis of this evaluation and the ongoing review of investment results by the Board, the Board concluded that the nature, quality and extent of services provided by DWS and QS Investors historically have been and continue to be satisfactory.
Fees and Expenses. The Board considered the Fund's investment management fee schedule, sub-advisory fee schedule, operating expenses, and total expense ratios, and comparative information provided by Lipper and the independent fee consultant regarding investment management fee rates paid to other investment advisors by similar funds (1st quartile being the most favorable and 4th quartile being the least favorable). With respect to management fees paid to other investment advisors by similar funds, the Board noted that the contractual fee rates paid by the Fund, which include the 0.10% fee paid to DWS under the Fund's administrative services agreement, were lower than the median (1st quartile) of the applicable Lipper peer group (based on Lipper data provided as of December 31, 2009). With respect to the sub-advisory fee paid to QS Investors, the Board noted that the fee is paid by DWS out of its fee and not directly by the Fund. The Board noted that the Fund's Class A shares total (net) operating expenses were expected to be higher than the median (3rd quartile) of the applicable Lipper expense universe (based on Lipper data provided as of December 31, 2009, and analyzing Lipper expense universe Class A expenses less any applicable 12b-1 fees) ("Lipper Universe Expenses"). The Board considered the Fund's management fee rate as compared to fees charged by DWS and certain of its affiliates for comparable mutual funds and considered differences in fund and fee structures between the DWS Funds. The Board also considered how the Fund's total (net) operating expenses compared to the total (net) operating expenses of a more customized peer group selected by Lipper (based on such factors as asset size).
The information considered by the Board as part of its review of management fees included information regarding fees charged by DWS and its affiliates to similar institutional accounts and to similar funds offered primarily to European investors ("DWS Europe funds"), in each case as applicable. The Board observed that advisory fee rates for institutional accounts generally were lower than the management fees charged by similarly managed DWS US mutual funds ("DWS Funds"), but also took note of the differences in services provided to DWS Funds as compared to institutional accounts. In the case of DWS Europe funds, the Board observed that fee rates for DWS Europe funds generally were higher than for similarly managed DWS Funds, but noted that differences in the types of services provided to DWS Funds relative to DWS Europe funds made it difficult to compare such fees.
On the basis of the information provided, the Board concluded that management fees were reasonable and appropriate in light of the nature, quality and extent of services provided by DWS and QS Investors.
Profitability. The Board reviewed detailed information regarding revenues received by DWS under the Agreement. The Board considered the estimated costs and pre-tax profits realized by DWS from advising the DWS Funds, as well as estimates of the pre-tax profits attributable to managing the Fund in particular. The Board also received information regarding the estimated enterprise-wide profitability of DWS and its affiliates with respect to all fund services in totality and by fund. The Board reviewed DWS's methodology in allocating its costs to the management of the Fund. Based on the information provided, the Board concluded that the pre-tax profits realized by DWS in connection with the management of the Fund were not unreasonable. The Board also reviewed information regarding the profitability of certain similar investment management firms. The Board noted that while information regarding the profitability of such firms is limited (and in some cases is not necessarily prepared on a comparable basis), DWS and its affiliates' overall profitability with respect to the DWS fund complex (after taking into account distribution and other services provided to the funds by DWS and its affiliates) was lower than the overall profitability levels of many comparable firms for which such data was available. The Board did not consider the profitability of QS Investors with respect to the Fund. The Board noted that DWS pays QS Investors' fee out of its management fee, and its understanding that the Fund's sub-advisory fee schedule was the product of an arm's length negotiation with DWS.
Economies of Scale. The Board considered whether there are economies of scale with respect to the management of the Fund and whether the Fund benefits from any economies of scale. The Board noted that the Fund's management fee schedule includes fee breakpoints. The Board concluded that the Fund's fee schedule represents an appropriate sharing between the Fund and DWS of such economies of scale as may exist in the management of the Fund at current asset levels.
Other Benefits to DWS and QS Investors and Their Affiliates. The Board also considered the character and amount of other incidental benefits received by DWS and QS Investors and their affiliates, including any fees received by DWS for administrative services provided to the Fund and any fees received by an affiliate of DWS for distribution services. The Board also considered benefits to DWS and QS Investors related to brokerage and soft-dollar allocations, including allocating brokerage to pay for research generated by parties other than the executing broker dealers, which pertain primarily to funds investing in equity securities, along with the incidental public relations benefits to DWS and QS Investors related to DWS Funds advertising and cross-selling opportunities among DWS products and services. The Board concluded that management fees were reasonable in light of these fallout benefits.
Compliance. The Board considered the significant attention and resources dedicated by DWS to documenting and enhancing its compliance processes in recent years. The Board noted in particular (i) the experience and seniority of both DWS's chief compliance officer and the Fund's chief compliance officer; (ii) the large number of DWS compliance personnel; and (iii) the substantial commitment of resources by DWS and its affiliates to compliance matters. The Board also considered the attention and resources dedicated by DWS to the oversight of the investment sub-advisor's compliance program and compliance with the applicable fund policies and procedures.
Based on all of the information considered and the conclusions reached, the Board unanimously (including the Independent Trustees) determined that the continuation of the Agreements is in the best interests of the Fund. In making this determination, the Board did not give particular weight to any single factor identified above. The Board considered these factors over the course of numerous meetings, certain of which were in executive session with only the Independent Trustees and their counsel present. It is possible that individual Trustees may have weighed these factors differently in reaching their individual decisions to approve the continuation of the Agreements.
DWS Dreman Small Mid Cap Value VIP
The Board of Trustees, including the Independent Trustees, approved the renewal of your Fund's investment management agreement (the "Agreement") with Deutsche Investment Management Americas Inc. ("DWS") and sub-advisory agreement (the "Sub-Advisory Agreement" and together with the Agreement, the "Agreements") between DWS and Dreman Value Management L.L.C. ("DVM") in September 2010.
In terms of the process that the Board followed prior to approving the Agreements, shareholders should know that:
• In September 2010, all but one of the Fund's Trustees were independent of DWS and its affiliates.
• The Trustees meet frequently to discuss fund matters. Each year, the Trustees dedicate substantial time to contract review matters. Over the course of several months, the Board's Contract Committee, in coordination with the Board's Equity Oversight Committee, reviewed comprehensive materials received from DWS, independent third parties and independent counsel. These materials included an analysis of the Fund's performance, fees and expenses, and profitability compiled by the Fund's independent fee consultant. The Board also received extensive information throughout the year regarding performance of the Fund.
• The Independent Trustees regularly meet privately with their independent counsel to discuss contract review and other matters. In addition, the Independent Trustees were also advised by the Fund's independent fee consultant in the course of their review of the Fund's contractual arrangements and considered a comprehensive report prepared by the independent fee consultant in connection with their deliberations (the "IFC Report").
• In connection with reviewing the Agreements, the Board also reviewed the terms of the Fund's Rule 12b-1 plan, distribution agreement, administrative services agreement, transfer agency agreement and other material service agreements.
• Based on its evaluation of the information provided, the Contract Committee presented its findings and recommendations to the Independent Trustees as a group. The Independent Trustees reviewed the Contract Committee's findings and recommendations and presented their recommendations to the full Board.
In connection with the contract review process, the Contract Committee and the Board considered the factors discussed below, among others. The Board also considered that DWS and its predecessors have managed the Fund since its inception, and the Board believes that a long-term relationship with a capable, conscientious advisor is in the best interests of the Fund. The Board considered, generally, that shareholders chose to invest or remain invested in the Fund knowing that DWS managed the Fund, and that the Agreement was approved by the Fund's shareholders. DWS is part of Deutsche Bank, a major global banking institution that is engaged in a wide range of financial services. The Board believes that there are significant advantages to being part of a global asset management business that offers a wide range of investing expertise and resources, including hundreds of portfolio managers and analysts with research capabilities in many countries throughout the world.
While shareholders may focus primarily on fund performance and fees, the Fund's Board considers these and many other factors, including the quality and integrity of DWS's and DVM's personnel and such other issues as back-office operations, fund valuations, and compliance policies and procedures.
Nature, Quality and Extent of Services. The Board considered the terms of the Agreements, including the scope of advisory services provided under the Agreements. The Board noted that, under the Agreements, DWS and DVM provide portfolio management services to the Fund and that, pursuant to a separate administrative services agreement, DWS provides administrative services to the Fund. The Board considered the experience and skills of senior management and investment personnel, the resources made available to such personnel, the ability of DWS to attract and retain high-quality personnel, and the organizational depth and stability of DWS. The Board reviewed the Fund's performance over short-term and long-term periods and compared those returns to various agreed-upon performance measures, including market indices and a peer universe compiled by the independent fee consultant using information supplied by Lipper Inc. ("Lipper"). The Board also noted that it has put into place a process of identifying "Focus Funds" (e.g., funds performing poorly relative to their benchmark or a peer universe compiled by Lipper), and receives more frequent reporting and information from DWS regarding such funds, along with DWS's remedial plans to address underperformance. The Board believes this process is an effective manner of identifying and addressing underperforming funds. Based on the information provided, the Board noted that for the one-, three- and five-year periods ended December 31, 2009, the Fund's performance (Class A shares) was in the 2nd quartile, 1st quartile and 1st quartile, respectively, of the applicable Lipper universe (the 1st quartile being the best performers and the 4th quartile being the worst performers). The Board also observed that the Fund has outperformed its benchmark in the one-, three- and five-year periods ended December 31, 2009.
On the basis of this evaluation and the ongoing review of investment results by the Board, the Board concluded that the nature, quality and extent of services provided by DWS and DVM historically have been and continue to be satisfactory.
Fees and Expenses. The Board considered the Fund's investment management fee schedule, sub-advisory fee schedule, operating expenses, and total expense ratios, and comparative information provided by Lipper and the independent fee consultant regarding investment management fee rates paid to other investment advisors by similar funds (1st quartile being the most favorable and 4th quartile being the least favorable). With respect to management fees paid to other investment advisors by similar funds, the Board noted that the contractual fee rates paid by the Fund, which include the 0.10% fee paid to DWS under the Fund's administrative services agreement, were lower than the median (1st quartile) of the applicable Lipper peer group (based on Lipper data provided as of December 31, 2009). With respect to the sub-advisory fee paid to DVM, the Board noted that the fee is paid by DWS out of its fee and not directly by the Fund. The Board noted that the Fund's Class A shares total (net) operating expenses were expected to be lower than the median (1st quartile) of the applicable Lipper expense universe (based on Lipper data provided as of December 31, 2009, and analyzing Lipper expense universe Class A expenses less any applicable 12b-1 fees) ("Lipper Universe Expenses"). The Board also reviewed data comparing each share class's total (net) operating expenses to the applicable Lipper Universe Expenses. The Board considered the Fund's management fee rate as compared to fees charged by DWS and certain of its affiliates for comparable mutual funds and considered differences in fund and fee structures between the DWS Funds. The Board also considered how the Fund's total (net) operating expenses compared to the total (net) operating expenses of a more customized peer group selected by Lipper (based on such factors as asset size).
The information considered by the Board as part of its review of management fees included information regarding fees charged by DWS and its affiliates to similar institutional accounts and to similar funds offered primarily to European investors ("DWS Europe funds"), in each case as applicable. The Board observed that advisory fee rates for institutional accounts generally were lower than the management fees charged by similarly managed DWS US mutual funds ("DWS Funds"), but also took note of the differences in services provided to DWS Funds as compared to institutional accounts. In the case of DWS Europe funds, the Board observed that fee rates for DWS Europe funds generally were higher than for similarly managed DWS Funds, but noted that differences in the types of services provided to DWS Funds relative to DWS Europe funds made it difficult to compare such fees.
On the basis of the information provided, the Board concluded that management fees were reasonable and appropriate in light of the nature, quality and extent of services provided by DWS and DVM.
Profitability. The Board reviewed detailed information regarding revenues received by DWS under the Agreement. The Board considered the estimated costs and pre-tax profits realized by DWS from advising the DWS Funds, as well as estimates of the pre-tax profits attributable to managing the Fund in particular. The Board also received information regarding the estimated enterprise-wide profitability of DWS and its affiliates with respect to all fund services in totality and by fund. The Board reviewed DWS's methodology in allocating its costs to the management of the Fund. Based on the information provided, the Board concluded that the pre-tax profits realized by DWS in connection with the management of the Fund were not unreasonable. The Board also reviewed information regarding the profitability of certain similar investment management firms. The Board noted that while information regarding the profitability of such firms is limited (and in some cases is not necessarily prepared on a comparable basis), DWS and its affiliates' overall profitability with respect to the DWS fund complex (after taking into account distribution and other services provided to the funds by DWS and its affiliates) was lower than the overall profitability levels of many comparable firms for which such data was available. The Board did not consider the profitability of DVM with respect to the Fund. The Board noted that DWS pays DVM's fee out of its management fee, and its understanding that the Fund's sub-advisory fee schedule was the product of an arm's length negotiation with DWS.
Economies of Scale. The Board considered whether there are economies of scale with respect to the management of the Fund and whether the Fund benefits from any economies of scale. The Board noted that the Fund's management fee schedule includes fee breakpoints. The Board concluded that the Fund's fee schedule represents an appropriate sharing between the Fund and DWS of such economies of scale as may exist in the management of the Fund at current asset levels.
Other Benefits to DWS and DVM and Their Affiliates. The Board also considered the character and amount of other incidental benefits received by DWS and DVM and their affiliates, including any fees received by DWS for administrative services provided to the Fund and any fees received by an affiliate of DWS for distribution services. The Board also considered the incidental public relations benefits to DWS and DVM related to DWS Funds advertising and cross-selling opportunities among DWS products and services. The Board concluded that management fees were reasonable in light of these fallout benefits.
Compliance. The Board considered the significant attention and resources dedicated by DWS to documenting and enhancing its compliance processes in recent years. The Board noted in particular (i) the experience and seniority of both DWS's chief compliance officer and the Fund's chief compliance officer; (ii) the large number of DWS compliance personnel; and (iii) the substantial commitment of resources by DWS and its affiliates to compliance matters. The Board also considered the attention and resources dedicated by DWS to the oversight of the investment sub-advisor's compliance program and compliance with the applicable fund policies and procedures.
Based on all of the information considered and the conclusions reached, the Board unanimously (including the Independent Trustees) determined that the continuation of the Agreements is in the best interests of the Fund. In making this determination, the Board did not give particular weight to any single factor identified above. The Board considered these factors over the course of numerous meetings, certain of which were in executive session with only the Independent Trustees and their counsel present. It is possible that individual Trustees may have weighed these factors differently in reaching their individual decisions to approve the continuation of the Agreements.
DWS Global Thematic VIP
The Board of Trustees, including the Independent Trustees, approved the renewal of your Fund's investment management agreement (the "Agreement") with Deutsche Investment Management Americas Inc. ("DWS") and sub-advisory agreement (the "Sub-Advisory Agreement" and together with the Agreement the "Agreements") between DWS and Global Thematic Partners, LLC ("Global Thematic") in September 2010.
In terms of the process that the Board followed prior to approving the Agreements, shareholders should know that:
• In September 2010, all but one of the Fund's Trustees were independent of DWS and its affiliates.
• The Trustees meet frequently to discuss fund matters. Each year, the Trustees dedicate substantial time to contract review matters. Over the course of several months, the Board's Contract Committee, in coordination with the Board's Equity Oversight Committee, reviewed comprehensive materials received from DWS, independent third parties and independent counsel. These materials included an analysis of the Fund's performance, fees and expenses, and profitability compiled by the Fund's independent fee consultant. The Board also received extensive information throughout the year regarding performance of the Fund.
• The Independent Trustees regularly meet privately with their independent counsel to discuss contract review and other matters. In addition, the Independent Trustees were also advised by the Fund's independent fee consultant in the course of their review of the Fund's contractual arrangements and considered a comprehensive report prepared by the independent fee consultant in connection with their deliberations (the "IFC Report").
• In connection with reviewing the Agreements, the Board also reviewed the terms of the Fund's Rule 12b-1 plan, distribution agreement, administrative services agreement, transfer agency agreement and other material service agreements.
• Based on its evaluation of the information provided, the Contract Committee presented its findings and recommendations to the Independent Trustees as a group. The Independent Trustees reviewed the Contract Committee's findings and recommendations and presented their recommendations to the full Board.
In connection with the contract review process, the Contract Committee and the Board considered the factors discussed below, among others. The Board also considered that DWS and its predecessors have managed the Fund since its inception, and the Board believes that a long-term relationship with a capable, conscientious advisor is in the best interests of the Fund. The Board considered, generally, that shareholders chose to invest or remain invested in the Fund knowing that DWS managed the Fund, and that the Agreement was approved by the Fund's shareholders. DWS is part of Deutsche Bank, a major global banking institution that is engaged in a wide range of financial services. The Board believes that there are significant advantages to being part of a global asset management business that offers a wide range of investing expertise and resources, including hundreds of portfolio managers and analysts with research capabilities in many countries throughout the world.
While shareholders may focus primarily on fund performance and fees, the Fund's Board considers these and many other factors, including the quality and integrity of DWS's and Global Thematic's personnel and such other issues as back-office operations, fund valuations, and compliance policies and procedures. In addition, in connection with approving the continuation of the Fund's Sub-Advisory Agreement, the Board noted it had engaged in a comprehensive review of the agreement in connection with its initial approval in May 2010.
Nature, Quality and Extent of Services. The Board considered the terms of the Agreements, including the scope of advisory services provided under the Agreements. The Board noted that, under the Agreements, DWS and Global Thematic provide portfolio management services to the Fund and that, pursuant to a separate administrative services agreement, DWS provides administrative services to the Fund. The Board considered the experience and skills of senior management and investment personnel, the resources made available to such personnel, the ability of DWS to attract and retain high-quality personnel, and the organizational depth and stability of DWS. The Board reviewed the Fund's performance over short-term and long-term periods and compared those returns to various agreed-upon performance measures, including market indices and a peer universe compiled by the independent fee consultant using information supplied by Lipper Inc. ("Lipper"). The Board also noted that it has put into place a process of identifying "Focus Funds" (e.g., funds performing poorly relative to their benchmark or a peer universe compiled by Lipper), and receives more frequent reporting and information from DWS regarding such funds, along with DWS's remedial plans to address underperformance. The Board believes this process is an effective manner of identifying and addressing underperforming funds. Based on the information provided, the Board noted that for the one-, three- and five-year periods ended December 31, 2009, the Fund's performance (Class A shares) was in the 1st quartile, 4th quartile and 1st quartile, respectively, of the applicable Lipper universe (the 1st quartile being the best performers and the 4th quartile being the worst performers). The Board also observed that the Fund has outperformed its benchmark in the one- and five-year periods and has underperformed its benchmark in the three-year period ended December 31, 2009.
On the basis of this evaluation and the ongoing review of investment results by the Board, the Board concluded that the nature, quality and extent of services provided by DWS and Global Thematic historically have been and continue to be satisfactory.
Fees and Expenses. The Board considered the Fund's investment management fee schedule, sub-advisory fee schedule, operating expenses, and total expense ratios, and comparative information provided by Lipper and the independent fee consultant regarding investment management fee rates paid to other investment advisors by similar funds (1st quartile being the most favorable and 4th quartile being the least favorable). With respect to management fees paid to other investment advisors by similar funds, the Board noted that the contractual fee rates paid by the Fund, which include the 0.10% fee paid to DWS under the Fund's administrative services agreement, were higher than the median (4th quartile) of the applicable Lipper peer group (based on Lipper data provided as of December 31, 2009). With respect to the sub-advisory fee paid to Global Thematic, the Board noted that the fee is paid by DWS out of its fee and not directly by the Fund. The Board noted that the Fund's Class A shares total (net) operating expenses were expected to be higher than the median (4th quartile) of the applicable Lipper expense universe (based on Lipper data provided as of December 31, 2009, and analyzing Lipper expense universe Class A expenses less any applicable 12b-1 fees) ("Lipper Universe Expenses"). The Board also reviewed data comparing each share class's total (net) operating expenses to the applicable Lipper Universe Expenses. The Board considered the Fund's management fee rate as compared to fees charged by DWS and certain of its affiliates for comparable mutual funds and considered differences in fund and fee structures between the DWS Funds. The Board also considered how the Fund's total (net) operating expenses compared to the total (net) operating expenses of a more customized peer group selected by Lipper (based on such factors as asset size). The Board also noted that the expense limitations agreed to by DWS helped to ensure that the Fund's total (net) operating expenses would remain competitive.
The information considered by the Board as part of its review of management fees included information regarding fees charged by DWS and its affiliates to similar institutional accounts and to similar funds offered primarily to European investors ("DWS Europe funds"), in each case as applicable. The Board observed that advisory fee rates for institutional accounts generally were lower than the management fees charged by similarly managed DWS US mutual funds ("DWS Funds"), but also took note of the differences in services provided to DWS Funds as compared to institutional accounts. In the case of DWS Europe funds, the Board observed that fee rates for DWS Europe funds generally were higher than for similarly managed DWS Funds, but noted that differences in the types of services provided to DWS Funds relative to DWS Europe funds made it difficult to compare such fees.
On the basis of the information provided, the Board concluded that management fees were reasonable and appropriate in light of the nature, quality and extent of services provided by DWS and Global Thematic.
Profitability. The Board reviewed detailed information regarding revenues received by DWS under the Agreement. The Board considered the estimated costs and pre-tax profits realized by DWS from advising the DWS Funds, as well as estimates of the pre-tax profits attributable to managing the Fund in particular. The Board also received information regarding the estimated enterprise-wide profitability of DWS and its affiliates with respect to all fund services in totality and by fund. The Board reviewed DWS's methodology in allocating its costs to the management of the Fund. Based on the information provided, the Board concluded that the pre-tax profits realized by DWS in connection with the management of the Fund were not unreasonable. The Board also reviewed information regarding the profitability of certain similar investment management firms. The Board noted that while information regarding the profitability of such firms is limited (and in some cases is not necessarily prepared on a comparable basis), DWS and its affiliates' overall profitability with respect to the DWS fund complex (after taking into account distribution and other services provided to the funds by DWS and its affiliates) was lower than the overall profitability levels of many comparable firms for which such data was available. The Board did not consider the profitability of Global Thematic with respect to the Fund. The Board noted that DWS pays Global Thematic's fee out of its management fee, and its understanding that the Fund's sub-advisory fee schedule was the product of an arm's length negotiation with DWS.
Economies of Scale. The Board considered whether there are economies of scale with respect to the management of the Fund and whether the Fund benefits from any economies of scale. The Board noted that the Fund's management fee schedule includes fee breakpoints. The Board concluded that the Fund's fee schedule represents an appropriate sharing between the Fund and DWS of such economies of scale as may exist in the management of the Fund at current asset levels.
Other Benefits to DWS and Global Thematic and Their Affiliates. The Board also considered the character and amount of other incidental benefits received by DWS and Global Thematic and their affiliates, including any fees received by DWS for administrative services provided to the Fund and any fees received by an affiliate of DWS for distribution services. The Board also considered benefits to DWS and Global Thematic related to brokerage and soft-dollar allocations, including allocating brokerage to pay for research generated by parties other than the executing broker dealers, which pertain primarily to funds investing in equity securities, along with the incidental public relations benefits to DWS and Global Thematic related to DWS Funds advertising and cross-selling opportunities among DWS products and services. The Board concluded that management fees were reasonable in light of these fallout benefits.
Compliance. The Board considered the significant attention and resources dedicated by DWS to documenting and enhancing its compliance processes in recent years. The Board noted in particular (i) the experience and seniority of both DWS's chief compliance officer and the Fund's chief compliance officer; (ii) the large number of DWS compliance personnel; and (iii) the substantial commitment of resources by DWS and its affiliates to compliance matters. The Board also considered the attention and resources dedicated by DWS to the oversight of the investment sub-advisor's compliance program and compliance with the applicable fund policies and procedures.
Based on all of the information considered and the conclusions reached, the Board unanimously (including the Independent Trustees) determined that the continuation of the Agreements is in the best interests of the Fund. In making this determination, the Board did not give particular weight to any single factor identified above. The Board considered these factors over the course of numerous meetings, certain of which were in executive session with only the Independent Trustees and their counsel present. It is possible that individual Trustees may have weighed these factors differently in reaching their individual decisions to approve the continuation of the Agreements.
DWS Government & Agency Securities VIP
The Board of Trustees, including the Independent Trustees, approved the renewal of your Fund's investment management agreement (the "Agreement") with Deutsche Investment Management Americas Inc. ("DWS") in September 2010.
In terms of the process that the Board followed prior to approving the Agreement, shareholders should know that:
• In September 2010, all but one of the Fund's Trustees were independent of DWS and its affiliates.
• The Trustees meet frequently to discuss fund matters. Each year, the Trustees dedicate substantial time to contract review matters. Over the course of several months, the Board's Contract Committee, in coordination with the Board's Fixed Income and Quant Oversight Committee, reviewed comprehensive materials received from DWS, independent third parties and independent counsel. These materials included an analysis of the Fund's performance, fees and expenses, and profitability compiled by the Fund's independent fee consultant. The Board also received extensive information throughout the year regarding performance of the Fund.
• The Independent Trustees regularly meet privately with their independent counsel to discuss contract review and other matters. In addition, the Independent Trustees were also advised by the Fund's independent fee consultant in the course of their review of the Fund's contractual arrangements and considered a comprehensive report prepared by the independent fee consultant in connection with their deliberations (the "IFC Report").
• In connection with reviewing the Agreement, the Board also reviewed the terms of the Fund's Rule 12b-1 plan, distribution agreement, administrative services agreement, transfer agency agreement and other material service agreements.
• Based on its evaluation of the information provided, the Contract Committee presented its findings and recommendations to the Independent Trustees as a group. The Independent Trustees reviewed the Contract Committee's findings and recommendations and presented their recommendations to the full Board.
In connection with the contract review process, the Contract Committee and the Board considered the factors discussed below, among others. The Board also considered that DWS and its predecessors have managed the Fund since its inception, and the Board believes that a long-term relationship with a capable, conscientious advisor is in the best interests of the Fund. The Board considered, generally, that shareholders chose to invest or remain invested in the Fund knowing that DWS managed the Fund, and that the Agreement was approved by the Fund's shareholders. DWS is part of Deutsche Bank, a major global banking institution that is engaged in a wide range of financial services. The Board believes that there are significant advantages to being part of a global asset management business that offers a wide range of investing expertise and resources, including hundreds of portfolio managers and analysts with research capabilities in many countries throughout the world.
While shareholders may focus primarily on fund performance and fees, the Fund's Board considers these and many other factors, including the quality and integrity of DWS's personnel and such other issues as back-office operations, fund valuations, and compliance policies and procedures.
Nature, Quality and Extent of Services. The Board considered the terms of the Agreement, including the scope of advisory services provided under the Agreement. The Board noted that, under the Agreement, DWS provides portfolio management services to the Fund and that, pursuant to a separate administrative services agreement, DWS provides administrative services to the Fund. The Board considered the experience and skills of senior management and investment personnel, the resources made available to such personnel, the ability of DWS to attract and retain high-quality personnel, and the organizational depth and stability of DWS. The Board reviewed the Fund's performance over short-term and long-term periods and compared those returns to various agreed-upon performance measures, including market indices and a peer universe compiled by the independent fee consultant using information supplied by Lipper Inc. ("Lipper"). The Board also noted that it has put into place a process of identifying "Focus Funds" (e.g., funds performing poorly relative to their benchmark or a peer universe compiled by Lipper), and receives more frequent reporting and information from DWS regarding such funds, along with DWS's remedial plans to address underperformance. The Board believes this process is an effective manner of identifying and addressing underperforming funds. Based on the information provided, the Board noted that for the one-, three- and five-year periods ended December 31, 2009, the Fund's performance (Class A shares) was in the 1st quartile of the applicable Lipper universe (the 1st quartile being the best performers and the 4th quartile being the worst performers). The Board also observed that the Fund has outperformed its benchmark in the one-year period and has underperformed its benchmark in the three- and five-year periods ended December 31, 2009.
On the basis of this evaluation and the ongoing review of investment results by the Board, the Board concluded that the nature, quality and extent of services provided by DWS historically have been and continue to be satisfactory.
Fees and Expenses. The Board considered the Fund's investment management fee schedule, operating expenses, and total expense ratios, and comparative information provided by Lipper and the independent fee consultant regarding investment management fee rates paid to other investment advisors by similar funds (1st quartile being the most favorable and 4th quartile being the least favorable). With respect to management fees paid to other investment advisors by similar funds, the Board noted that the contractual fee rates paid by the Fund, which include the 0.10% fee paid to DWS under the Fund's administrative services agreement, were at the median (2nd quartile) of the applicable Lipper peer group (based on Lipper data provided as of December 31, 2009). The Board noted that the Fund's Class A shares total (net) operating expenses were expected to be higher than the median (3rd quartile) of the applicable Lipper expense universe (based on Lipper data provided as of December 31, 2009, and analyzing Lipper expense universe Class A expenses less any applicable 12b-1 fees) ("Lipper Universe Expenses"). The Board also reviewed data comparing each share class's total (net) operating expenses to the applicable Lipper Universe Expenses. The Board considered the Fund's management fee rate as compared to fees charged by DWS and certain of its affiliates for comparable mutual funds and considered differences in fund and fee structures between the DWS Funds. The Board also considered how the Fund's total (net) operating expenses compared to the total (net) operating expenses of a more customized peer group selected by Lipper (based on such factors as asset size).
The information considered by the Board as part of its review of management fees included information regarding fees charged by DWS and its affiliates to similar institutional accounts and to similar funds offered primarily to European investors ("DWS Europe funds"), in each case as applicable. The Board observed that advisory fee rates for institutional accounts generally were lower than the management fees charged by similarly managed DWS US mutual funds ("DWS Funds"), but also took note of the differences in services provided to DWS Funds as compared to institutional accounts. In the case of DWS Europe funds, the Board observed that fee rates for DWS Europe funds generally were higher than for similarly managed DWS Funds, but noted that differences in the types of services provided to DWS Funds relative to DWS Europe funds made it difficult to compare such fees.
On the basis of the information provided, the Board concluded that management fees were reasonable and appropriate in light of the nature, quality and extent of services provided by DWS.
Profitability. The Board reviewed detailed information regarding revenues received by DWS under the Agreement. The Board considered the estimated costs and pre-tax profits realized by DWS from advising the DWS Funds, as well as estimates of the pre-tax profits attributable to managing the Fund in particular. The Board also received information regarding the estimated enterprise-wide profitability of DWS and its affiliates with respect to all fund services in totality and by fund. The Board reviewed DWS's methodology in allocating its costs to the management of the Fund. Based on the information provided, the Board concluded that the pre-tax profits realized by DWS in connection with the management of the Fund were not unreasonable. The Board also reviewed information regarding the profitability of certain similar investment management firms. The Board noted that while information regarding the profitability of such firms is limited (and in some cases is not necessarily prepared on a comparable basis), DWS and its affiliates' overall profitability with respect to the DWS fund complex (after taking into account distribution and other services provided to the funds by DWS and its affiliates) was lower than the overall profitability levels of many comparable firms for which such data was available.
Economies of Scale. The Board considered whether there are economies of scale with respect to the management of the Fund and whether the Fund benefits from any economies of scale. The Board noted that the Fund's management fee schedule includes fee breakpoints. The Board concluded that the Fund's fee schedule represents an appropriate sharing between the Fund and DWS of such economies of scale as may exist in the management of the Fund at current asset levels.
Other Benefits to DWS and Its Affiliates. The Board also considered the character and amount of other incidental benefits received by DWS and its affiliates, including any fees received by DWS for administrative services provided to the Fund and any fees received by an affiliate of DWS for distribution services. The Board also considered benefits to DWS related to brokerage and soft-dollar allocations, including allocating brokerage to pay for research generated by parties other than the executing broker dealers, which pertain primarily to funds investing in equity securities, along with the incidental public relations benefits to DWS related to DWS Funds advertising and cross-selling opportunities among DWS products and services. The Board concluded that management fees were reasonable in light of these fallout benefits.
Compliance. The Board considered the significant attention and resources dedicated by DWS to documenting and enhancing its compliance processes in recent years. The Board noted in particular (i) the experience and seniority of both DWS's chief compliance officer and the Fund's chief compliance officer; (ii) the large number of DWS compliance personnel; and (iii) the substantial commitment of resources by DWS and its affiliates to compliance matters.
Based on all of the information considered and the conclusions reached, the Board unanimously (including the Independent Trustees) determined that the continuation of the Agreement is in the best interests of the Fund. In making this determination, the Board did not give particular weight to any single factor identified above. The Board considered these factors over the course of numerous meetings, certain of which were in executive session with only the Independent Trustees and their counsel present. It is possible that individual Trustees may have weighed these factors differently in reaching their individual decisions to approve the continuation of the Agreement.
DWS High Income VIP
The Board of Trustees, including the Independent Trustees, approved the renewal of your Fund's investment management agreement (the "Agreement") with Deutsche Investment Management Americas Inc. ("DWS") in September 2010.
In terms of the process that the Board followed prior to approving the Agreement, shareholders should know that:
• In September 2010, all but one of the Fund's Trustees were independent of DWS and its affiliates.
• The Trustees meet frequently to discuss fund matters. Each year, the Trustees dedicate substantial time to contract review matters. Over the course of several months, the Board's Contract Committee, in coordination with the Board's Fixed Income and Quant Oversight Committee, reviewed comprehensive materials received from DWS, independent third parties and independent counsel. These materials included an analysis of the Fund's performance, fees and expenses, and profitability compiled by the Fund's independent fee consultant. The Board also received extensive information throughout the year regarding performance of the Fund.
• The Independent Trustees regularly meet privately with their independent counsel to discuss contract review and other matters. In addition, the Independent Trustees were also advised by the Fund's independent fee consultant in the course of their review of the Fund's contractual arrangements and considered a comprehensive report prepared by the independent fee consultant in connection with their deliberations (the "IFC Report").
• In connection with reviewing the Agreement, the Board also reviewed the terms of the Fund's Rule 12b-1 plan, distribution agreement, administrative services agreement, transfer agency agreement and other material service agreements.
• Based on its evaluation of the information provided, the Contract Committee presented its findings and recommendations to the Independent Trustees as a group. The Independent Trustees reviewed the Contract Committee's findings and recommendations and presented their recommendations to the full Board.
In connection with the contract review process, the Contract Committee and the Board considered the factors discussed below, among others. The Board also considered that DWS and its predecessors have managed the Fund since its inception, and the Board believes that a long-term relationship with a capable, conscientious advisor is in the best interests of the Fund. The Board considered, generally, that shareholders chose to invest or remain invested in the Fund knowing that DWS managed the Fund, and that the Agreement was approved by the Fund's shareholders. DWS is part of Deutsche Bank, a major global banking institution that is engaged in a wide range of financial services. The Board believes that there are significant advantages to being part of a global asset management business that offers a wide range of investing expertise and resources, including hundreds of portfolio managers and analysts with research capabilities in many countries throughout the world.
While shareholders may focus primarily on fund performance and fees, the Fund's Board considers these and many other factors, including the quality and integrity of DWS's personnel and such other issues as back-office operations, fund valuations, and compliance policies and procedures.
Nature, Quality and Extent of Services. The Board considered the terms of the Agreement, including the scope of advisory services provided under the Agreement. The Board noted that, under the Agreement, DWS provides portfolio management services to the Fund and that, pursuant to a separate administrative services agreement, DWS provides administrative services to the Fund. The Board considered the experience and skills of senior management and investment personnel, the resources made available to such personnel, the ability of DWS to attract and retain high-quality personnel, and the organizational depth and stability of DWS. The Board reviewed the Fund's performance over short-term and long-term periods and compared those returns to various agreed-upon performance measures, including market indices and a peer universe compiled by the independent fee consultant using information supplied by Lipper Inc. ("Lipper"). The Board also noted that it has put into place a process of identifying "Focus Funds" (e.g., funds performing poorly relative to their benchmark or a peer universe compiled by Lipper), and receives more frequent reporting and information from DWS regarding such funds, along with DWS's remedial plans to address underperformance. The Board believes this process is an effective manner of identifying and addressing underperforming funds. Based on the information provided, the Board noted that for the one-, three- and five-year periods ended December 31, 2009, the Fund's performance (Class A shares) was in the 3rd quartile, 4th quartile and 3rd quartile, respectively, of the applicable Lipper universe (the 1st quartile being the best performers and the 4th quartile being the worst performers). The Board also observed that the Fund has underperformed its benchmark in the one-, three- and five-year periods ended December 31, 2009.
On the basis of this evaluation and the ongoing review of investment results by the Board, the Board concluded that the nature, quality and extent of services provided by DWS historically have been and continue to be satisfactory.
Fees and Expenses. The Board considered the Fund's investment management fee schedule, operating expenses, and total expense ratios, and comparative information provided by Lipper and the independent fee consultant regarding investment management fee rates paid to other investment advisors by similar funds (1st quartile being the most favorable and 4th quartile being the least favorable). With respect to management fees paid to other investment advisors by similar funds, the Board noted that the contractual fee rates paid by the Fund, which include the 0.10% fee paid to DWS under the Fund's administrative services agreement, were lower than the median (1st quartile) of the applicable Lipper peer group (based on Lipper data provided as of December 31, 2009). The Board noted that the Fund's Class A shares total (net) operating expenses were expected to be lower than the median (2nd quartile) of the applicable Lipper expense universe (based on Lipper data provided as of December 31, 2009, and analyzing Lipper expense universe Class A expenses less any applicable 12b-1 fees) ("Lipper Universe Expenses"). The Board also reviewed data comparing each share class's total (net) operating expenses to the applicable Lipper Universe Expenses. The Board considered the Fund's management fee rate as compared to fees charged by DWS and certain of its affiliates for comparable mutual funds and considered differences in fund and fee structures between the DWS Funds. The Board also considered how the Fund's total (net) operating expenses compared to the total (net) operating expenses of a more customized peer group selected by Lipper (based on such factors as asset size).
The information considered by the Board as part of its review of management fees included information regarding fees charged by DWS and its affiliates to similar institutional accounts and to similar funds offered primarily to European investors ("DWS Europe funds"), in each case as applicable. The Board observed that advisory fee rates for institutional accounts generally were lower than the management fees charged by similarly managed DWS US mutual funds ("DWS Funds"), but also took note of the differences in services provided to DWS Funds as compared to institutional accounts. In the case of DWS Europe funds, the Board observed that fee rates for DWS Europe funds generally were higher than for similarly managed DWS Funds, but noted that differences in the types of services provided to DWS Funds relative to DWS Europe funds made it difficult to compare such fees.
On the basis of the information provided, the Board concluded that management fees were reasonable and appropriate in light of the nature, quality and extent of services provided by DWS.
Profitability. The Board reviewed detailed information regarding revenues received by DWS under the Agreement. The Board considered the estimated costs and pre-tax profits realized by DWS from advising the DWS Funds, as well as estimates of the pre-tax profits attributable to managing the Fund in particular. The Board also received information regarding the estimated enterprise-wide profitability of DWS and its affiliates with respect to all fund services in totality and by fund. The Board reviewed DWS's methodology in allocating its costs to the management of the Fund. Based on the information provided, the Board concluded that the pre-tax profits realized by DWS in connection with the management of the Fund were not unreasonable. The Board also reviewed information regarding the profitability of certain similar investment management firms. The Board noted that while information regarding the profitability of such firms is limited (and in some cases is not necessarily prepared on a comparable basis), DWS and its affiliates' overall profitability with respect to the DWS fund complex (after taking into account distribution and other services provided to the funds by DWS and its affiliates) was lower than the overall profitability levels of many comparable firms for which such data was available.
Economies of Scale. The Board considered whether there are economies of scale with respect to the management of the Fund and whether the Fund benefits from any economies of scale. The Board noted that the Fund's management fee schedule includes fee breakpoints. The Board concluded that the Fund's fee schedule represents an appropriate sharing between the Fund and DWS of such economies of scale as may exist in the management of the Fund at current asset levels.
Other Benefits to DWS and Its Affiliates. The Board also considered the character and amount of other incidental benefits received by DWS and its affiliates, including any fees received by DWS for administrative services provided to the Fund and any fees received by an affiliate of DWS for distribution services. The Board also considered benefits to DWS related to brokerage and soft-dollar allocations, including allocating brokerage to pay for research generated by parties other than the executing broker dealers, which pertain primarily to funds investing in equity securities, along with the incidental public relations benefits to DWS related to DWS Funds advertising and cross-selling opportunities among DWS products and services. The Board concluded that management fees were reasonable in light of these fallout benefits.
Compliance. The Board considered the significant attention and resources dedicated by DWS to documenting and enhancing its compliance processes in recent years. The Board noted in particular (i) the experience and seniority of both DWS's chief compliance officer and the Fund's chief compliance officer; (ii) the large number of DWS compliance personnel; and (iii) the substantial commitment of resources by DWS and its affiliates to compliance matters.
Based on all of the information considered and the conclusions reached, the Board unanimously (including the Independent Trustees) determined that the continuation of the Agreement is in the best interests of the Fund. In making this determination, the Board did not give particular weight to any single factor identified above. The Board considered these factors over the course of numerous meetings, certain of which were in executive session with only the Independent Trustees and their counsel present. It is possible that individual Trustees may have weighed these factors differently in reaching their individual decisions to approve the continuation of the Agreement.
DWS Large Cap Value VIP
The Board of Trustees, including the Independent Trustees, approved the renewal of your Fund's investment management agreement (the "Agreement") with Deutsche Investment Management Americas Inc. ("DWS") and sub-advisory agreement (the "Sub-Advisory Agreement" and together with the Agreement, the "Agreements") between DWS and Deutsche Asset Management International GmbH ("DeAMi"), an affiliate of DWS, in September 2010.
In terms of the process that the Board followed prior to approving the Agreements, shareholders should know that:
• In September 2010, all but one of the Fund's Trustees were independent of DWS and its affiliates.
• The Trustees meet frequently to discuss fund matters. Each year, the Trustees dedicate substantial time to contract review matters. Over the course of several months, the Board's Contract Committee, in coordination with the Board's Equity Oversight Committee, reviewed comprehensive materials received from DWS, independent third parties and independent counsel. These materials included an analysis of the Fund's performance, fees and expenses, and profitability compiled by the Fund's independent fee consultant. The Board also received extensive information throughout the year regarding performance of the Fund.
• The Independent Trustees regularly meet privately with their independent counsel to discuss contract review and other matters. In addition, the Independent Trustees were also advised by the Fund's independent fee consultant in the course of their review of the Fund's contractual arrangements and considered a comprehensive report prepared by the independent fee consultant in connection with their deliberations (the "IFC Report").
• In connection with reviewing the Agreements, the Board also reviewed the terms of the Fund's Rule 12b-1 plan, distribution agreement, administrative services agreement, transfer agency agreement and other material service agreements.
• Based on its evaluation of the information provided, the Contract Committee presented its findings and recommendations to the Independent Trustees as a group. The Independent Trustees reviewed the Contract Committee's findings and recommendations and presented their recommendations to the full Board.
In connection with the contract review process, the Contract Committee and the Board considered the factors discussed below, among others. The Board also considered that DWS and its predecessors have managed the Fund since its inception, and the Board believes that a long-term relationship with a capable, conscientious advisor is in the best interests of the Fund. The Board considered, generally, that shareholders chose to invest or remain invested in the Fund knowing that DWS managed the Fund, and that the Agreement was approved by the Fund's shareholders. DWS and DeAMi are part of Deutsche Bank, a major global banking institution that is engaged in a wide range of financial services. The Board believes that there are significant advantages to being part of a global asset management business that offers a wide range of investing expertise and resources, including hundreds of portfolio managers and analysts with research capabilities in many countries throughout the world.
While shareholders may focus primarily on fund performance and fees, the Fund's Board considers these and many other factors, including the quality and integrity of DWS's and DeAMi's personnel and such other issues as back-office operations, fund valuations, and compliance policies and procedures.
Nature, Quality and Extent of Services. The Board considered the terms of the Agreements, including the scope of advisory services provided under the Agreements. The Board noted that, under the Agreements, DWS and DeAMi provide portfolio management services to the Fund and that, pursuant to a separate administrative services agreement, DWS provides administrative services to the Fund. The Board considered the experience and skills of senior management and investment personnel, the resources made available to such personnel, the ability of DWS to attract and retain high-quality personnel, and the organizational depth and stability of DWS. The Board reviewed the Fund's performance over short-term and long-term periods and compared those returns to various agreed-upon performance measures, including market indices and a peer universe compiled by the independent fee consultant using information supplied by Lipper Inc. ("Lipper"). The Board also noted that it has put into place a process of identifying "Focus Funds" (e.g., funds performing poorly relative to their benchmark or a peer universe compiled by Lipper), and receives more frequent reporting and information from DWS regarding such funds, along with DWS's remedial plans to address underperformance. The Board believes this process is an effective manner of identifying and addressing underperforming funds. Based on the information provided, the Board noted that for the one-, three- and five-year periods ended December 31, 2009, the Fund's performance (Class A shares) was in the 2nd quartile, 1st quartile and 1st quartile, respectively, of the applicable Lipper universe (the 1st quartile being the best performers and the 4th quartile being the worst performers). The Board also observed that the Fund has outperformed its benchmark in the one-, three- and five-year periods ended December 31, 2009.
On the basis of this evaluation and the ongoing review of investment results by the Board, the Board concluded that the nature, quality and extent of services provided by DWS and DeAMi historically have been and continue to be satisfactory.
Fees and Expenses. The Board considered the Fund's investment management fee schedule, sub-advisory fee schedule, operating expenses, and total expense ratios, and comparative information provided by Lipper and the independent fee consultant regarding investment management fee rates paid to other investment advisors by similar funds (1st quartile being the most favorable and 4th quartile being the least favorable). With respect to management fees paid to other investment advisors by similar funds, the Board noted that the contractual fee rates paid by the Fund, which include the 0.10% fee paid to DWS under the Fund's administrative services agreement, were at the median (2nd quartile) of the applicable Lipper peer group (based on Lipper data provided as of December 31, 2009). With respect to the sub-advisory fee paid to DeAMi, the Board noted that the fee is paid by DWS out of its fee and not directly by the Fund. The Board noted that the Fund's Class A shares total (net) operating expenses were expected to be higher than the median (3rd quartile) of the applicable Lipper expense universe (based on Lipper data provided as of December 31, 2009, and analyzing Lipper expense universe Class A expenses less any applicable 12b-1 fees) ("Lipper Universe Expenses"). The Board also reviewed data comparing each share class's total (net) operating expenses to the applicable Lipper Universe Expenses. The Board considered the Fund's management fee rate as compared to fees charged by DWS and certain of its affiliates for comparable mutual funds and considered differences in fund and fee structures between the DWS Funds. The Board also considered how the Fund's total (net) operating expenses compared to the total (net) operating expenses of a more customized peer group selected by Lipper (based on such factors as asset size).
The information considered by the Board as part of its review of management fees included information regarding fees charged by DWS and its affiliates to similar institutional accounts and to similar funds offered primarily to European investors ("DWS Europe funds"), in each case as applicable. The Board observed that advisory fee rates for institutional accounts generally were lower than the management fees charged by similarly managed DWS US mutual funds ("DWS Funds"), but also took note of the differences in services provided to DWS Funds as compared to institutional accounts. In the case of DWS Europe funds, the Board observed that fee rates for DWS Europe funds generally were higher than for similarly managed DWS Funds, but noted that differences in the types of services provided to DWS Funds relative to DWS Europe funds made it difficult to compare such fees.
On the basis of the information provided, the Board concluded that management fees were reasonable and appropriate in light of the nature, quality and extent of services provided by DWS and DeAMi.
Profitability. The Board reviewed detailed information regarding revenues received by DWS under the Agreement. The Board considered the estimated costs and pre-tax profits realized by DWS from advising the DWS Funds, as well as estimates of the pre-tax profits attributable to managing the Fund in particular. The Board also received information regarding the estimated enterprise-wide profitability of DWS and its affiliates with respect to all fund services in totality and by fund. The Board reviewed DWS's methodology in allocating its costs to the management of the Fund. Based on the information provided, the Board concluded that the pre-tax profits realized by DWS in connection with the management of the Fund were not unreasonable. The Board also reviewed information regarding the profitability of certain similar investment management firms. The Board noted that while information regarding the profitability of such firms is limited (and in some cases is not necessarily prepared on a comparable basis), DWS and its affiliates' overall profitability with respect to the DWS fund complex (after taking into account distribution and other services provided to the funds by DWS and its affiliates) was lower than the overall profitability levels of many comparable firms for which such data was available.
Economies of Scale. The Board considered whether there are economies of scale with respect to the management of the Fund and whether the Fund benefits from any economies of scale. The Board noted that the Fund's management fee schedule includes fee breakpoints. The Board concluded that the Fund's fee schedule represents an appropriate sharing between the Fund and DWS of such economies of scale as may exist in the management of the Fund at current asset levels.
Other Benefits to DWS and Its Affiliates. The Board also considered the character and amount of other incidental benefits received by DWS and its affiliates, including any fees received by DWS for administrative services provided to the Fund and any fees received by an affiliate of DWS for distribution services. The Board also considered benefits to DWS related to brokerage and soft-dollar allocations, including allocating brokerage to pay for research generated by parties other than the executing broker dealers, which pertain primarily to funds investing in equity securities, along with the incidental public relations benefits to DWS related to DWS Funds advertising and cross-selling opportunities among DWS products and services. The Board concluded that management fees were reasonable in light of these fallout benefits.
Compliance. The Board considered the significant attention and resources dedicated by DWS to documenting and enhancing its compliance processes in recent years. The Board noted in particular (i) the experience and seniority of both DWS's chief compliance officer and the Fund's chief compliance officer; (ii) the large number of DWS compliance personnel; and (iii) the substantial commitment of resources by DWS and its affiliates to compliance matters.
Based on all of the information considered and the conclusions reached, the Board unanimously (including the Independent Trustees) determined that the continuation of the Agreements is in the best interests of the Fund. In making this determination, the Board did not give particular weight to any single factor identified above. The Board considered these factors over the course of numerous meetings, certain of which were in executive session with only the Independent Trustees and their counsel present. It is possible that individual Trustees may have weighed these factors differently in reaching their individual decisions to approve the continuation of the Agreements.
DWS Mid Cap Growth VIP
The Board of Trustees, including the Independent Trustees, approved the renewal of your Fund's investment management agreement (the "Agreement") with Deutsche Investment Management Americas Inc. ("DWS") in September 2010.
In terms of the process that the Board followed prior to approving the Agreement, shareholders should know that:
• In September 2010, all but one of the Fund's Trustees were independent of DWS and its affiliates.
• The Trustees meet frequently to discuss fund matters. Each year, the Trustees dedicate substantial time to contract review matters. Over the course of several months, the Board's Contract Committee, in coordination with the Board's Equity Oversight Committee, reviewed comprehensive materials received from DWS, independent third parties and independent counsel. These materials included an analysis of the Fund's performance, fees and expenses, and profitability compiled by the Fund's independent fee consultant. The Board also received extensive information throughout the year regarding performance of the Fund.
• The Independent Trustees regularly meet privately with their independent counsel to discuss contract review and other matters. In addition, the Independent Trustees were also advised by the Fund's independent fee consultant in the course of their review of the Fund's contractual arrangements and considered a comprehensive report prepared by the independent fee consultant in connection with their deliberations (the "IFC Report").
• In connection with reviewing the Agreement, the Board also reviewed the terms of the Fund's distribution agreement, administrative services agreement, transfer agency agreement and other material service agreements.
• Based on its evaluation of the information provided, the Contract Committee presented its findings and recommendations to the Independent Trustees as a group. The Independent Trustees reviewed the Contract Committee's findings and recommendations and presented their recommendations to the full Board.
In connection with the contract review process, the Contract Committee and the Board considered the factors discussed below, among others. The Board also considered that DWS and its predecessors have managed the Fund since its inception, and the Board believes that a long-term relationship with a capable, conscientious advisor is in the best interests of the Fund. The Board considered, generally, that shareholders chose to invest or remain invested in the Fund knowing that DWS managed the Fund, and that the Agreement was approved by the Fund's shareholders. DWS is part of Deutsche Bank, a major global banking institution that is engaged in a wide range of financial services. The Board believes that there are significant advantages to being part of a global asset management business that offers a wide range of investing expertise and resources, including hundreds of portfolio managers and analysts with research capabilities in many countries throughout the world.
While shareholders may focus primarily on fund performance and fees, the Fund's Board considers these and many other factors, including the quality and integrity of DWS's personnel and such other issues as back-office operations, fund valuations, and compliance policies and procedures.
Nature, Quality and Extent of Services. The Board considered the terms of the Agreement, including the scope of advisory services provided under the Agreement. The Board noted that, under the Agreement, DWS provides portfolio management services to the Fund and that, pursuant to a separate administrative services agreement, DWS provides administrative services to the Fund. The Board considered the experience and skills of senior management and investment personnel, the resources made available to such personnel, the ability of DWS to attract and retain high-quality personnel, and the organizational depth and stability of DWS. The Board reviewed the Fund's performance over short-term and long-term periods and compared those returns to various agreed-upon performance measures, including market indices and a peer universe compiled by the independent fee consultant using information supplied by Lipper Inc. ("Lipper"). The Board also noted that it has put into place a process of identifying "Focus Funds" (e.g., funds performing poorly relative to their benchmark or a peer universe compiled by Lipper), and receives more frequent reporting and information from DWS regarding such funds, along with DWS's remedial plans to address underperformance. The Board believes this process is an effective manner of identifying and addressing underperforming funds. Based on the information provided, the Board noted that for the one-, three- and five-year periods ended December 31, 2009, the Fund's performance (Class A shares) was in the 2nd quartile, 4th quartile and 4th quartile, respectively, of the applicable Lipper universe (the 1st quartile being the best performers and the 4th quartile being the worst performers). The Board also observed that the Fund has underperformed its benchmark in the one-, three- and five-year periods ended December 31, 2009.
On the basis of this evaluation and the ongoing review of investment results by the Board, the Board concluded that the nature, quality and extent of services provided by DWS historically have been and continue to be satisfactory.
Fees and Expenses. The Board considered the Fund's investment management fee schedule, operating expenses, and total expense ratios, and comparative information provided by Lipper and the independent fee consultant regarding investment management fee rates paid to other investment advisors by similar funds (1st quartile being the most favorable and 4th quartile being the least favorable). With respect to management fees paid to other investment advisors by similar funds, the Board noted that the contractual fee rates paid by the Fund, which include the 0.10% fee paid to DWS under the Fund's administrative services agreement, were at the median (2nd quartile) of the applicable Lipper peer group (based on Lipper data provided as of December 31, 2009). The Board noted that the Fund's Class A shares total (net) operating expenses were expected to be higher than the median (4th quartile) of the applicable Lipper expense universe (based on Lipper data provided as of December 31, 2009, and analyzing Lipper expense universe Class A expenses less any applicable 12b-1 fees) ("Lipper Universe Expenses"). The Board considered the Fund's management fee rate as compared to fees charged by DWS and certain of its affiliates for comparable mutual funds and considered differences in fund and fee structures between the DWS Funds. The Board also considered how the Fund's total (net) operating expenses compared to the total (net) operating expenses of a more customized peer group selected by Lipper (based on such factors as asset size). The Board also noted that the expense limitation agreed to by DWS helped to ensure that the Fund's total (net) operating expenses would remain competitive.
The information considered by the Board as part of its review of management fees included information regarding fees charged by DWS and its affiliates to similar institutional accounts and to similar funds offered primarily to European investors ("DWS Europe funds"), in each case as applicable. The Board observed that advisory fee rates for institutional accounts generally were lower than the management fees charged by similarly managed DWS US mutual funds ("DWS Funds"), but also took note of the differences in services provided to DWS Funds as compared to institutional accounts. In the case of DWS Europe funds, the Board observed that fee rates for DWS Europe funds generally were higher than for similarly managed DWS Funds, but noted that differences in the types of services provided to DWS Funds relative to DWS Europe funds made it difficult to compare such fees.
On the basis of the information provided, the Board concluded that management fees were reasonable and appropriate in light of the nature, quality and extent of services provided by DWS.
Profitability. The Board reviewed detailed information regarding revenues received by DWS under the Agreement. The Board considered the estimated costs and pre-tax profits realized by DWS from advising the DWS Funds, as well as estimates of the pre-tax profits attributable to managing the Fund in particular. The Board also received information regarding the estimated enterprise-wide profitability of DWS and its affiliates with respect to all fund services in totality and by fund. The Board reviewed DWS's methodology in allocating its costs to the management of the Fund. Based on the information provided, the Board concluded that the pre-tax profits realized by DWS in connection with the management of the Fund were not unreasonable. The Board also reviewed information regarding the profitability of certain similar investment management firms. The Board noted that while information regarding the profitability of such firms is limited (and in some cases is not necessarily prepared on a comparable basis), DWS and its affiliates' overall profitability with respect to the DWS fund complex (after taking into account distribution and other services provided to the funds by DWS and its affiliates) was lower than the overall profitability levels of many comparable firms for which such data was available.
Economies of Scale. The Board considered whether there are economies of scale with respect to the management of the Fund and whether the Fund benefits from any economies of scale. The Board noted that the Fund's management fee schedule includes fee breakpoints. The Board concluded that the Fund's fee schedule represents an appropriate sharing between the Fund and DWS of such economies of scale as may exist in the management of the Fund at current asset levels.
Other Benefits to DWS and Its Affiliates. The Board also considered the character and amount of other incidental benefits received by DWS and its affiliates, including any fees received by DWS for administrative services provided to the Fund and any fees received by an affiliate of DWS for distribution services. The Board also considered benefits to DWS related to brokerage and soft-dollar allocations, including allocating brokerage to pay for research generated by parties other than the executing broker dealers, which pertain primarily to funds investing in equity securities, along with the incidental public relations benefits to DWS related to DWS Funds advertising and cross-selling opportunities among DWS products and services. The Board concluded that management fees were reasonable in light of these fallout benefits.
Compliance. The Board considered the significant attention and resources dedicated by DWS to documenting and enhancing its compliance processes in recent years. The Board noted in particular (i) the experience and seniority of both DWS's chief compliance officer and the Fund's chief compliance officer; (ii) the large number of DWS compliance personnel; and (iii) the substantial commitment of resources by DWS and its affiliates to compliance matters.
Based on all of the information considered and the conclusions reached, the Board unanimously (including the Independent Trustees) determined that the continuation of the Agreement is in the best interests of the Fund. In making this determination, the Board did not give particular weight to any single factor identified above. The Board considered these factors over the course of numerous meetings, certain of which were in executive session with only the Independent Trustees and their counsel present. It is possible that individual Trustees may have weighed these factors differently in reaching their individual decisions to approve the continuation of the Agreement.
DWS Money Market VIP
The Board of Trustees, including the Independent Trustees, approved the renewal of your Fund's investment management agreement (the "Agreement") with Deutsche Investment Management Americas Inc. ("DWS") in September 2010.
In terms of the process that the Board followed prior to approving the Agreement, shareholders should know that:
• In September 2010, all but one of the Fund's Trustees were independent of DWS and its affiliates.
• The Trustees meet frequently to discuss fund matters. Each year, the Trustees dedicate substantial time to contract review matters. Over the course of several months, the Board's Contract Committee, in coordination with the Board's Fixed Income and Quant Oversight Committee, reviewed comprehensive materials received from DWS, independent third parties and independent counsel. These materials included an analysis of the Fund's performance, fees and expenses, and profitability compiled by the Fund's independent fee consultant. The Board also received extensive information throughout the year regarding performance of the Fund.
• The Independent Trustees regularly meet privately with their independent counsel to discuss contract review and other matters. In addition, the Independent Trustees were also advised by the Fund's independent fee consultant in the course of their review of the Fund's contractual arrangements and considered a comprehensive report prepared by the independent fee consultant in connection with their deliberations (the "IFC Report").
• In connection with reviewing the Agreement, the Board also reviewed the terms of the Fund's distribution agreement, administrative services agreement, transfer agency agreement and other material service agreements.
• Based on its evaluation of the information provided, the Contract Committee presented its findings and recommendations to the Independent Trustees as a group. The Independent Trustees reviewed the Contract Committee's findings and recommendations and presented their recommendations to the full Board.
In connection with the contract review process, the Contract Committee and the Board considered the factors discussed below, among others. The Board also considered that DWS and its predecessors have managed the Fund since its inception, and the Board believes that a long-term relationship with a capable, conscientious advisor is in the best interests of the Fund. The Board considered, generally, that shareholders chose to invest or remain invested in the Fund knowing that DWS managed the Fund, and that the Agreement was approved by the Fund's shareholders. DWS is part of Deutsche Bank, a major global banking institution that is engaged in a wide range of financial services. The Board believes that there are significant advantages to being part of a global asset management business that offers a wide range of investing expertise and resources, including hundreds of portfolio managers and analysts with research capabilities in many countries throughout the world.
While shareholders may focus primarily on fund performance and fees, the Fund's Board considers these and many other factors, including the quality and integrity of DWS's personnel and such other issues as back-office operations, fund valuations, and compliance policies and procedures.
Nature, Quality and Extent of Services. The Board considered the terms of the Agreement, including the scope of advisory services provided under the Agreement. The Board noted that, under the Agreement, DWS provides portfolio management services to the Fund and that, pursuant to a separate administrative services agreement, DWS provides administrative services to the Fund. The Board considered the experience and skills of senior management and investment personnel, the resources made available to such personnel, the ability of DWS to attract and retain high-quality personnel, and the organizational depth and stability of DWS. The Board reviewed the Fund's performance over short-term and long-term periods and compared those returns to various agreed-upon performance measures, including a peer universe compiled by the independent fee consultant using information supplied by Lipper Inc. ("Lipper"). The Board also noted that it has put into place a process of identifying "Focus Funds" (e.g., funds performing poorly relative to their benchmark or a peer universe compiled by iMoneyNet, Inc.), and receives more frequent reporting and information from DWS regarding such funds, along with DWS's remedial plans to address underperformance. The Board believes this process is an effective manner of identifying and addressing underperforming funds. Based on the information provided, the Board noted that for the one-, three- and five-year periods ended December 31, 2009, the Fund's gross performance (Class A shares) was in the 1st quartile of the applicable Lipper universe (the 1st quartile being the best performers and the 4th quartile being the worst performers).
On the basis of this evaluation and the ongoing review of investment results by the Board, the Board concluded that the nature, quality and extent of services provided by DWS historically have been and continue to be satisfactory.
Fees and Expenses. The Board considered the Fund's investment management fee schedule, operating expenses, and total expense ratios, and comparative information provided by Lipper and the independent fee consultant regarding investment management fee rates paid to other investment advisors by similar funds (1st quartile being the most favorable and 4th quartile being the least favorable). With respect to management fees paid to other investment advisors by similar funds, the Board noted that the contractual fee rates paid by the Fund, which include the 0.10% fee paid to DWS under the Fund's administrative services agreement, were lower than the median (2nd quartile) of the applicable Lipper peer group (based on Lipper data provided as of December 31, 2009). The Board noted that the Fund's Class A shares total (net) operating expenses were expected to be lower than the median (2nd quartile) of the applicable Lipper expense universe (based on Lipper data provided as of December 31, 2009, and analyzing Lipper expense universe Class A expenses less any applicable 12b-1 fees) ("Lipper Universe Expenses"). The Board considered the Fund's management fee rate as compared to fees charged by DWS and certain of its affiliates for comparable mutual funds and considered differences in fund and fee structures between DWS Funds. The Board also considered how the Fund's total (net) operating expenses compared to the total (net) operating expenses of a more customized peer group selected by Lipper (based on such factors as asset size). The Board also noted that the expense limitation agreed to by DWS helped to ensure that the Fund's total (net) operating expenses would remain competitive.
The information considered by the Board as part of its review of management fees included information regarding fees charged by DWS and its affiliates to similar institutional accounts and to similar funds offered primarily to European investors ("DWS Europe funds"), in each case as applicable. The Board observed that advisory fee rates for institutional accounts generally were lower than the management fees charged by similarly managed DWS US mutual funds ("DWS Funds"), but also took note of the differences in services provided to DWS Funds as compared to institutional accounts. In the case of DWS Europe funds, the Board observed that fee rates for DWS Europe funds generally were higher than for similarly managed DWS Funds, but noted that differences in the types of services provided to DWS Funds relative to DWS Europe funds made it difficult to compare such fees.
On the basis of the information provided, the Board concluded that management fees were reasonable and appropriate in light of the nature, quality and extent of services provided by DWS.
Profitability. The Board reviewed detailed information regarding revenues received by DWS under the Agreement. The Board considered the estimated costs and pre-tax profits realized by DWS from advising the DWS Funds, as well as estimates of the pre-tax profits attributable to managing the Fund in particular. The Board also received information regarding the estimated enterprise-wide profitability of DWS and its affiliates with respect to all fund services in totality and by fund. The Board reviewed DWS's methodology in allocating its costs to the management of the Fund. Based on the information provided, the Board concluded that the pre-tax profits realized by DWS in connection with the management of the Fund were not unreasonable. The Board also reviewed information regarding the profitability of certain similar investment management firms. The Board noted that while information regarding the profitability of such firms is limited (and in some cases is not necessarily prepared on a comparable basis), DWS and its affiliates' overall profitability with respect to the DWS fund complex (after taking into account distribution and other services provided to the funds by DWS and its affiliates) was lower than the overall profitability levels of many comparable firms for which such data was available.
Economies of Scale. The Board considered whether there are economies of scale with respect to the management of the Fund and whether the Fund benefits from any economies of scale. The Board noted that the Fund's management fee schedule includes fee breakpoints. The Board concluded that the Fund's fee schedule represents an appropriate sharing between the Fund and DWS of such economies of scale as may exist in the management of the Fund at current asset levels.
Other Benefits to DWS and Its Affiliates. The Board also considered the character and amount of other incidental benefits received by DWS and its affiliates, including any fees received by DWS for administrative services provided to the Fund and any fees received by an affiliate of DWS for distribution services. The Board also considered benefits to DWS related to brokerage and soft-dollar allocations, including allocating brokerage to pay for research generated by parties other than the executing broker dealers, which pertain primarily to funds investing in equity securities, along with the incidental public relations benefits to DWS related to DWS Funds advertising and cross-selling opportunities among DWS products and services. The Board concluded that management fees were reasonable in light of these fallout benefits.
Compliance. The Board considered the significant attention and resources dedicated by DWS to documenting and enhancing its compliance processes in recent years. The Board noted in particular (i) the experience and seniority of both DWS's chief compliance officer and the Fund's chief compliance officer; (ii) the large number of DWS compliance personnel; and (iii) the substantial commitment of resources by DWS and its affiliates to compliance matters.
Based on all of the information considered and the conclusions reached, the Board unanimously (including the Independent Trustees) determined that the continuation of the Agreement is in the best interests of the Fund. In making this determination, the Board did not give particular weight to any single factor identified above. The Board considered these factors over the course of numerous meetings, certain of which were in executive session with only the Independent Trustees and their counsel present. It is possible that individual Trustees may have weighed these factors differently in reaching their individual decisions to approve the continuation of the Agreement.
DWS Small Cap Growth VIP
The Board of Trustees, including the Independent Trustees, approved the renewal of your Fund's investment management agreement (the "Agreement") with Deutsche Investment Management Americas Inc. ("DWS") in September 2010.
In terms of the process that the Board followed prior to approving the Agreement, shareholders should know that:
• In September 2010, all but one of the Fund's Trustees were independent of DWS and its affiliates.
• The Trustees meet frequently to discuss fund matters. Each year, the Trustees dedicate substantial time to contract review matters. Over the course of several months, the Board's Contract Committee, in coordination with the Board's Equity Oversight Committee, reviewed comprehensive materials received from DWS, independent third parties and independent counsel. These materials included an analysis of the Fund's performance, fees and expenses, and profitability compiled by the Fund's independent fee consultant. The Board also received extensive information throughout the year regarding performance of the Fund.
• The Independent Trustees regularly meet privately with their independent counsel to discuss contract review and other matters. In addition, the Independent Trustees were also advised by the Fund's independent fee consultant in the course of their review of the Fund's contractual arrangements and considered a comprehensive report prepared by the independent fee consultant in connection with their deliberations (the "IFC Report").
• In connection with reviewing the Agreement, the Board also reviewed the terms of the Fund's distribution agreement, administrative services agreement, transfer agency agreement and other material service agreements.
• Based on its evaluation of the information provided, the Contract Committee presented its findings and recommendations to the Independent Trustees as a group. The Independent Trustees reviewed the Contract Committee's findings and recommendations and presented their recommendations to the full Board.
In connection with the contract review process, the Contract Committee and the Board considered the factors discussed below, among others. The Board also considered that DWS and its predecessors have managed the Fund since its inception, and the Board believes that a long-term relationship with a capable, conscientious advisor is in the best interests of the Fund. The Board considered, generally, that shareholders chose to invest or remain invested in the Fund knowing that DWS managed the Fund, and that the Agreement was approved by the Fund's shareholders. DWS is part of Deutsche Bank, a major global banking institution that is engaged in a wide range of financial services. The Board believes that there are significant advantages to being part of a global asset management business that offers a wide range of investing expertise and resources, including hundreds of portfolio managers and analysts with research capabilities in many countries throughout the world.
While shareholders may focus primarily on fund performance and fees, the Fund's Board considers these and many other factors, including the quality and integrity of DWS's personnel and such other issues as back-office operations, fund valuations, and compliance policies and procedures.
Nature, Quality and Extent of Services. The Board considered the terms of the Agreement, including the scope of advisory services provided under the Agreement. The Board noted that, under the Agreement, DWS provides portfolio management services to the Fund and that, pursuant to a separate administrative services agreement, DWS provides administrative services to the Fund. The Board considered the experience and skills of senior management and investment personnel, the resources made available to such personnel, the ability of DWS to attract and retain high-quality personnel, and the organizational depth and stability of DWS. The Board reviewed the Fund's performance over short-term and long-term periods and compared those returns to various agreed-upon performance measures, including market indices and a peer universe compiled by the independent fee consultant using information supplied by Lipper Inc. ("Lipper"). The Board also noted that it has put into place a process of identifying "Focus Funds" (e.g., funds performing poorly relative to their benchmark or a peer universe compiled by Lipper), and receives more frequent reporting and information from DWS regarding such funds, along with DWS's remedial plans to address underperformance. The Board believes this process is an effective manner of identifying and addressing underperforming funds. Based on the information provided, the Board noted that for the one-, three- and five-year periods ended December 31, 2009, the Fund's performance (Class A shares) was in the 1st quartile, 4th quartile and 4th quartile, respectively, of the applicable Lipper universe (the 1st quartile being the best performers and the 4th quartile being the worst performers). The Board also observed that the Fund has outperformed its benchmark in the one-year period and has underperformed its benchmark in the three- and five-year periods ended December 31, 2009.
On the basis of this evaluation and the ongoing review of investment results by the Board, the Board concluded that the nature, quality and extent of services provided by DWS historically have been and continue to be satisfactory.
Fees and Expenses. The Board considered the Fund's investment management fee schedule, operating expenses, and total expense ratios, and comparative information provided by Lipper and the independent fee consultant regarding investment management fee rates paid to other investment advisors by similar funds (1st quartile being the most favorable and 4th quartile being the least favorable). With respect to management fees paid to other investment advisors by similar funds, the Board noted that the contractual fee rates paid by the Fund, which include the 0.10% fee paid to DWS under the Fund's administrative services agreement, were lower than the median (1st quartile) of the applicable Lipper peer group (based on Lipper data provided as of December 31, 2009). The Board noted that the Fund's Class A shares total (net) operating expenses were expected to be lower than the median (1st quartile) of the applicable Lipper expense universe (based on Lipper data provided as of December 31, 2009, and analyzing Lipper expense universe Class A expenses less any applicable 12b-1 fees) ("Lipper Universe Expenses"). The Board considered the Fund's management fee rate as compared to fees charged by DWS and certain of its affiliates for comparable mutual funds and considered differences in fund and fee structures between the DWS Funds. The Board also considered how the Fund's total (net) operating expenses compared to the total (net) operating expenses of a more customized peer group selected by Lipper (based on such factors as asset size).
The information considered by the Board as part of its review of management fees included information regarding fees charged by DWS and its affiliates to similar institutional accounts and to similar funds offered primarily to European investors ("DWS Europe funds"), in each case as applicable. The Board observed that advisory fee rates for institutional accounts generally were lower than the management fees charged by similarly managed DWS US mutual funds ("DWS Funds"), but also took note of the differences in services provided to DWS Funds as compared to institutional accounts. In the case of DWS Europe funds, the Board observed that fee rates for DWS Europe funds generally were higher than for similarly managed DWS Funds, but noted that differences in the types of services provided to DWS Funds relative to DWS Europe funds made it difficult to compare such fees.
On the basis of the information provided, the Board concluded that management fees were reasonable and appropriate in light of the nature, quality and extent of services provided by DWS.
Profitability. The Board reviewed detailed information regarding revenues received by DWS under the Agreement. The Board considered the estimated costs and pre-tax profits realized by DWS from advising the DWS Funds, as well as estimates of the pre-tax profits attributable to managing the Fund in particular. The Board also received information regarding the estimated enterprise-wide profitability of DWS and its affiliates with respect to all fund services in totality and by fund. The Board reviewed DWS's methodology in allocating its costs to the management of the Fund. Based on the information provided, the Board concluded that the pre-tax profits realized by DWS in connection with the management of the Fund were not unreasonable. The Board also reviewed information regarding the profitability of certain similar investment management firms. The Board noted that while information regarding the profitability of such firms is limited (and in some cases is not necessarily prepared on a comparable basis), DWS and its affiliates' overall profitability with respect to the DWS fund complex (after taking into account distribution and other services provided to the funds by DWS and its affiliates) was lower than the overall profitability levels of many comparable firms for which such data was available.
Economies of Scale. The Board considered whether there are economies of scale with respect to the management of the Fund and whether the Fund benefits from any economies of scale. The Board noted that the Fund's management fee schedule includes fee breakpoints. The Board concluded that the Fund's fee schedule represents an appropriate sharing between the Fund and DWS of such economies of scale as may exist in the management of the Fund at current asset levels.
Other Benefits to DWS and Its Affiliates. The Board also considered the character and amount of other incidental benefits received by DWS and its affiliates, including any fees received by DWS for administrative services provided to the Fund and any fees received by an affiliate of DWS for distribution services. The Board also considered benefits to DWS related to brokerage and soft-dollar allocations, including allocating brokerage to pay for research generated by parties other than the executing broker dealers, which pertain primarily to funds investing in equity securities, along with the incidental public relations benefits to DWS related to DWS Funds advertising and cross-selling opportunities among DWS products and services. The Board concluded that management fees were reasonable in light of these fallout benefits.
Compliance. The Board considered the significant attention and resources dedicated by DWS to documenting and enhancing its compliance processes in recent years. The Board noted in particular (i) the experience and seniority of both DWS's chief compliance officer and the Fund's chief compliance officer; (ii) the large number of DWS compliance personnel; and (iii) the substantial commitment of resources by DWS and its affiliates to compliance matters.
Based on all of the information considered and the conclusions reached, the Board unanimously (including the Independent Trustees) determined that the continuation of the Agreement is in the best interests of the Fund. In making this determination, the Board did not give particular weight to any single factor identified above. The Board considered these factors over the course of numerous meetings, certain of which were in executive session with only the Independent Trustees and their counsel present. It is possible that individual Trustees may have weighed these factors differently in reaching their individual decisions to approve the continuation of the Agreement.
DWS Strategic Income VIP
The Board of Trustees, including the Independent Trustees, approved the renewal of your Fund's investment management agreement (the "Agreement") with Deutsche Investment Management Americas Inc. ("DWS") and sub-advisory agreement (the "Sub-Advisory Agreement" and together with the Agreement the "Agreements") between DWS and QS Investors, LLC ("QS Investors") in September 2010.
In terms of the process that the Board followed prior to approving the Agreements, shareholders should know that:
• In September 2010, all but one of the Fund's Trustees were independent of DWS and its affiliates.
• The Trustees meet frequently to discuss fund matters. Each year, the Trustees dedicate substantial time to contract review matters. Over the course of several months, the Board's Contract Committee, in coordination with the Board's Fixed Income and Quant Oversight Committee, reviewed comprehensive materials received from DWS, independent third parties and independent counsel. These materials included an analysis of the Fund's performance, fees and expenses, and profitability compiled by the Fund's independent fee consultant. The Board also received extensive information throughout the year regarding performance of the Fund.
• The Independent Trustees regularly meet privately with their independent counsel to discuss contract review and other matters. In addition, the Independent Trustees were also advised by the Fund's independent fee consultant in the course of their review of the Fund's contractual arrangements and considered a comprehensive report prepared by the independent fee consultant in connection with their deliberations (the "IFC Report").
• In connection with reviewing the Agreements, the Board also reviewed the terms of the Fund's distribution agreement, administrative services agreement, transfer agency agreement and other material service agreements.
• Based on its evaluation of the information provided, the Contract Committee presented its findings and recommendations to the Independent Trustees as a group. The Independent Trustees reviewed the Contract Committee's findings and recommendations and presented their recommendations to the full Board.
In connection with the contract review process, the Contract Committee and the Board considered the factors discussed below, among others. The Board also considered that DWS and its predecessors have managed the Fund since its inception, and the Board believes that a long-term relationship with a capable, conscientious advisor is in the best interests of the Fund. The Board considered, generally, that shareholders chose to invest or remain invested in the Fund knowing that DWS managed the Fund, and that the Agreement was approved by the Fund's shareholders. DWS is part of Deutsche Bank, a major global banking institution that is engaged in a wide range of financial services. The Board believes that there are significant advantages to being part of a global asset management business that offers a wide range of investing expertise and resources, including hundreds of portfolio managers and analysts with research capabilities in many countries throughout the world.
While shareholders may focus primarily on fund performance and fees, the Fund's Board considers these and many other factors, including the quality and integrity of DWS's and QS Investors' personnel and such other issues as back-office operations, fund valuations, and compliance policies and procedures. In addition, in connection with approving the continuation of the Fund's Sub-Advisory Agreement, the Board noted it had engaged in a comprehensive review of the agreement in connection with its initial approval in May 2010.
Nature, Quality and Extent of Services. The Board considered the terms of the Agreements, including the scope of advisory services provided under the Agreements. The Board noted that, under the Agreements, DWS and QS Investors provide portfolio management services to the Fund and that, pursuant to a separate administrative services agreement, DWS provides administrative services to the Fund. The Board considered the experience and skills of senior management and investment personnel, the resources made available to such personnel, the ability of DWS to attract and retain high-quality personnel, and the organizational depth and stability of DWS. The Board reviewed the Fund's performance over short-term and long-term periods and compared those returns to various agreed-upon performance measures, including market indices and a peer universe compiled by the independent fee consultant using information supplied by Lipper Inc. ("Lipper"). The Board also noted that it has put into place a process of identifying "Focus Funds" (e.g., funds performing poorly relative to their benchmark or a peer universe compiled by Lipper), and receives more frequent reporting and information from DWS regarding such funds, along with DWS's remedial plans to address underperformance. The Board believes this process is an effective manner of identifying and addressing underperforming funds. Based on the information provided, the Board noted that for the one-, three- and five-year periods ended December 31, 2009, the Fund's performance (Class A shares) was in the 2nd quartile, 1st quartile and 1st quartile, respectively, of the applicable Lipper universe (the 1st quartile being the best performers and the 4th quartile being the worst performers). The Board also observed that the Fund has outperformed its benchmark in the one-year period and has underperformed its benchmark in the three- and five-year periods ended December 31, 2009.
On the basis of this evaluation and the ongoing review of investment results by the Board, the Board concluded that the nature, quality and extent of services provided by DWS and QS Investors historically have been and continue to be satisfactory.
Fees and Expenses. The Board considered the Fund's investment management fee schedule, sub-advisory fee schedule, operating expenses, and total expense ratios, and comparative information provided by Lipper and the independent fee consultant regarding investment management fee rates paid to other investment advisors by similar funds (1st quartile being the most favorable and 4th quartile being the least favorable). With respect to management fees paid to other investment advisors by similar funds, the Board noted that the contractual fee rates paid by the Fund, which include the 0.10% fee paid to DWS under the Fund's administrative services agreement, were at the median (2nd quartile) of the applicable Lipper peer group (based on Lipper data provided as of December 31, 2009). With respect to the sub-advisory fee paid to QS Investors, the Board noted that the fee is paid by DWS out of its fee and not directly by the Fund. The Board noted that the Fund's Class A shares total (net) operating expenses were expected to be higher than the median (4th quartile) of the applicable Lipper expense universe (based on Lipper data provided as of December 31, 2009, and analyzing Lipper expense universe Class A expenses less any applicable 12b-1 fees) ("Lipper Universe Expenses"). The Board considered the Fund's management fee rate as compared to fees charged by DWS and certain of its affiliates for comparable mutual funds and considered differences in fund and fee structures between the DWS Funds. The Board also considered how the Fund's total (net) operating expenses compared to the total (net) operating expenses of a more customized peer group selected by Lipper (based on such factors as asset size). The Board also noted that the expense limitation agreed to by DWS helped to ensure that the Fund's total (net) operating expenses would remain competitive.
The information considered by the Board as part of its review of management fees included information regarding fees charged by DWS and its affiliates to similar institutional accounts and to similar funds offered primarily to European investors ("DWS Europe funds"), in each case as applicable. The Board observed that advisory fee rates for institutional accounts generally were lower than the management fees charged by similarly managed DWS US mutual funds ("DWS Funds"), but also took note of the differences in services provided to DWS Funds as compared to institutional accounts. In the case of DWS Europe funds, the Board observed that fee rates for DWS Europe funds generally were higher than for similarly managed DWS Funds, but noted that differences in the types of services provided to DWS Funds relative to DWS Europe funds made it difficult to compare such fees.
On the basis of the information provided, the Board concluded that management fees were reasonable and appropriate in light of the nature, quality and extent of services provided by DWS and QS Investors.
Profitability. The Board reviewed detailed information regarding revenues received by DWS under the Agreement. The Board considered the estimated costs and pre-tax profits realized by DWS from advising the DWS Funds, as well as estimates of the pre-tax profits attributable to managing the Fund in particular. The Board also received information regarding the estimated enterprise-wide profitability of DWS and its affiliates with respect to all fund services in totality and by fund. The Board reviewed DWS's methodology in allocating its costs to the management of the Fund. Based on the information provided, the Board concluded that the pre-tax profits realized by DWS in connection with the management of the Fund were not unreasonable. The Board also reviewed information regarding the profitability of certain similar investment management firms. The Board noted that while information regarding the profitability of such firms is limited (and in some cases is not necessarily prepared on a comparable basis), DWS and its affiliates' overall profitability with respect to the DWS fund complex (after taking into account distribution and other services provided to the funds by DWS and its affiliates) was lower than the overall profitability levels of many comparable firms for which such data was available. The Board did not consider the profitability of QS Investors with respect to the Fund. The Board noted that DWS pays QS Investors' fee out of its management fee, and its understanding that the Fund's sub-advisory fee schedule was the product of an arm's length negotiation with DWS.
Economies of Scale. The Board considered whether there are economies of scale with respect to the management of the Fund and whether the Fund benefits from any economies of scale. The Board noted that the Fund's management fee schedule includes fee breakpoints. The Board concluded that the Fund's fee schedule represents an appropriate sharing between the Fund and DWS of such economies of scale as may exist in the management of the Fund at current asset levels.
Other Benefits to DWS and QS Investors and Their Affiliates. The Board also considered the character and amount of other incidental benefits received by DWS and QS Investors and their affiliates, including any fees received by DWS for administrative services provided to the Fund and any fees received by an affiliate of DWS for distribution services. The Board also considered benefits to DWS and QS Investors related to brokerage and soft-dollar allocations, including allocating brokerage to pay for research generated by parties other than the executing broker dealers, which pertain primarily to funds investing in equity securities, along with the incidental public relations benefits to DWS and QS Investors related to DWS Funds advertising and cross-selling opportunities among DWS products and services. The Board concluded that management fees were reasonable in light of these fallout benefits.
Compliance. The Board considered the significant attention and resources dedicated by DWS to documenting and enhancing its compliance processes in recent years. The Board noted in particular (i) the experience and seniority of both DWS's chief compliance officer and the Fund's chief compliance officer; (ii) the large number of DWS compliance personnel; and (iii) the substantial commitment of resources by DWS and its affiliates to compliance matters. The Board also considered the attention and resources dedicated by DWS to the oversight of the investment sub-advisor's compliance program and compliance with the applicable fund policies and procedures.
Based on all of the information considered and the conclusions reached, the Board unanimously (including the Independent Trustees) determined that the continuation of the Agreements is in the best interests of the Fund. In making this determination, the Board did not give particular weight to any single factor identified above. The Board considered these factors over the course of numerous meetings, certain of which were in executive session with only the Independent Trustees and their counsel present. It is possible that individual Trustees may have weighed these factors differently in reaching their individual decisions to approve the continuation of the Agreements.
DWS Strategic Value VIP
The Board of Trustees, including the Independent Trustees, approved the renewal of your Fund's investment management agreement (the "Agreement") with Deutsche Investment Management Americas Inc. ("DWS") in September 2010.
In terms of the process that the Board followed prior to approving the Agreement, shareholders should know that:
• In September 2010, all but one of the Fund's Trustees were independent of DWS and its affiliates.
• The Trustees meet frequently to discuss fund matters. Each year, the Trustees dedicate substantial time to contract review matters. Over the course of several months, the Board's Contract Committee, in coordination with the Board's Equity Oversight Committee, reviewed comprehensive materials received from DWS, independent third parties and independent counsel. These materials included an analysis of the Fund's performance, fees and expenses, and profitability compiled by the Fund's independent fee consultant. The Board also received extensive information throughout the year regarding performance of the Fund.
• The Independent Trustees regularly meet privately with their independent counsel to discuss contract review and other matters. In addition, the Independent Trustees were also advised by the Fund's independent fee consultant in the course of their review of the Fund's contractual arrangements and considered a comprehensive report prepared by the independent fee consultant in connection with their deliberations (the "IFC Report").
• In connection with reviewing the Agreement, the Board also reviewed the terms of the Fund's Rule 12b-1 plan, distribution agreement, administrative services agreement, transfer agency agreement and other material service agreements.
• Based on its evaluation of the information provided, the Contract Committee presented its findings and recommendations to the Independent Trustees as a group. The Independent Trustees reviewed the Contract Committee's findings and recommendations and presented their recommendations to the full Board.
In connection with the contract review process, the Contract Committee and the Board considered the factors discussed below, among others. The Board also considered that DWS and its predecessors have managed the Fund since its inception, and the Board believes that a long-term relationship with a capable, conscientious advisor is in the best interests of the Fund. The Board considered, generally, that shareholders chose to invest or remain invested in the Fund knowing that DWS managed the Fund, and that the Agreement was approved by the Fund's shareholders. DWS is part of Deutsche Bank, a major global banking institution that is engaged in a wide range of financial services. The Board believes that there are significant advantages to being part of a global asset management business that offers a wide range of investing expertise and resources, including hundreds of portfolio managers and analysts with research capabilities in many countries throughout the world.
While shareholders may focus primarily on fund performance and fees, the Fund's Board considers these and many other factors, including the quality and integrity of DWS's personnel and such other issues as back-office operations, fund valuations, and compliance policies and procedures.
Nature, Quality and Extent of Services. The Board considered the terms of the Agreement, including the scope of advisory services provided under the Agreement. The Board noted that, under the Agreement, DWS provides portfolio management services to the Fund and that, pursuant to a separate administrative services agreement, DWS provides administrative services to the Fund. The Board considered the experience and skills of senior management and investment personnel, the resources made available to such personnel, the ability of DWS to attract and retain high-quality personnel, and the organizational depth and stability of DWS. The Board reviewed the Fund's performance over short-term and long-term periods and compared those returns to various agreed-upon performance measures, including market indices and a peer universe compiled by the independent fee consultant using information supplied by Lipper Inc. ("Lipper"). The Board also noted that it has put into place a process of identifying "Focus Funds" (e.g., funds performing poorly relative to their benchmark or a peer universe compiled by Lipper), and receives more frequent reporting and information from DWS regarding such funds, along with DWS's remedial plans to address underperformance. The Board believes this process is an effective manner of identifying and addressing underperforming funds. Based on the information provided, the Board noted that for the one, three- and five-year periods ended December 31, 2009, the Fund's performance (Class A shares) was in the 2nd quartile, 4th quartile and 4th quartile, respectively, of the applicable Lipper universe (the 1st quartile being the best performers and the 4th quartile being the worst performers). The Board also observed that the Fund has underperformed its benchmark in the one-, three- and five-year periods ended December 31, 2009.
On the basis of this evaluation and the ongoing review of investment results by the Board, the Board concluded that the nature, quality and extent of services provided by DWS historically have been and continue to be satisfactory.
Fees and Expenses. The Board considered the Fund's investment management fee schedule, operating expenses, and total expense ratios, and comparative information provided by Lipper and the independent fee consultant regarding investment management fee rates paid to other investment advisors by similar funds (1st quartile being the most favorable and 4th quartile being the least favorable). With respect to management fees paid to other investment advisors by similar funds, the Board noted that the contractual fee rates paid by the Fund, which include the 0.10% fee paid to DWS under the Fund's administrative services agreement, were higher than the median (3rd quartile) of the applicable Lipper peer group (based on Lipper data provided as of December 31, 2009). The Board noted that the Fund's Class A shares total (net) operating expenses were expected to be higher than the median (3rd quartile) of the applicable Lipper expense universe (based on Lipper data provided as of December 31, 2009, and analyzing Lipper expense universe Class A expenses less any applicable 12b-1 fees) ("Lipper Universe Expenses"). The Board also reviewed data comparing each share class's total (net) operating expenses to the applicable Lipper Universe Expenses. The Board considered the Fund's management fee rate as compared to fees charged by DWS and certain of its affiliates for comparable mutual funds and considered differences in fund and fee structures between the DWS Funds. The Board also considered how the Fund's total (net) operating expenses compared to the total (net) operating expenses of a more customized peer group selected by Lipper (based on such factors as asset size).
The information considered by the Board as part of its review of management fees included information regarding fees charged by DWS and its affiliates to similar institutional accounts and to similar funds offered primarily to European investors ("DWS Europe funds"), in each case as applicable. The Board observed that advisory fee rates for institutional accounts generally were lower than the management fees charged by similarly managed DWS US mutual funds ("DWS Funds"), but also took note of the differences in services provided to DWS Funds as compared to institutional accounts. In the case of DWS Europe funds, the Board observed that fee rates for DWS Europe funds generally were higher than for similarly managed DWS Funds, but noted that differences in the types of services provided to DWS Funds relative to DWS Europe funds made it difficult to compare such fees.
On the basis of the information provided, the Board concluded that management fees were reasonable and appropriate in light of the nature, quality and extent of services provided by DWS.
Profitability. The Board reviewed detailed information regarding revenues received by DWS under the Agreement. The Board considered the estimated costs and pre-tax profits realized by DWS from advising the DWS Funds, as well as estimates of the pre-tax profits attributable to managing the Fund in particular. The Board also received information regarding the estimated enterprise-wide profitability of DWS and its affiliates with respect to all fund services in totality and by fund. The Board reviewed DWS's methodology in allocating its costs to the management of the Fund. Based on the information provided, the Board concluded that the pre-tax profits realized by DWS in connection with the management of the Fund were not unreasonable. The Board also reviewed information regarding the profitability of certain similar investment management firms. The Board noted that while information regarding the profitability of such firms is limited (and in some cases is not necessarily prepared on a comparable basis), DWS and its affiliates' overall profitability with respect to the DWS fund complex (after taking into account distribution and other services provided to the funds by DWS and its affiliates) was lower than the overall profitability levels of many comparable firms for which such data was available.
Economies of Scale. The Board considered whether there are economies of scale with respect to the management of the Fund and whether the Fund benefits from any economies of scale. The Board noted that the Fund's management fee schedule includes fee breakpoints. The Board concluded that the Fund's fee schedule represents an appropriate sharing between the Fund and DWS of such economies of scale as may exist in the management of the Fund at current asset levels.
Other Benefits to DWS and Its Affiliates. The Board also considered the character and amount of other incidental benefits received by DWS and its affiliates, including any fees received by DWS for administrative services provided to the Fund and any fees received by an affiliate of DWS for distribution services. The Board also considered benefits to DWS related to brokerage and soft-dollar allocations, including allocating brokerage to pay for research generated by parties other than the executing broker dealers, which pertain primarily to funds investing in equity securities, along with the incidental public relations benefits to DWS related to DWS Funds advertising and cross-selling opportunities among DWS products and services. The Board concluded that management fees were reasonable in light of these fallout benefits.
Compliance. The Board considered the significant attention and resources dedicated by DWS to documenting and enhancing its compliance processes in recent years. The Board noted in particular (i) the experience and seniority of both DWS's chief compliance officer and the Fund's chief compliance officer; (ii) the large number of DWS compliance personnel; and (iii) the substantial commitment of resources by DWS and its affiliates to compliance matters.
Based on all of the information considered and the conclusions reached, the Board unanimously (including the Independent Trustees) determined that the continuation of the Agreement is in the best interests of the Fund. In making this determination, the Board did not give particular weight to any single factor identified above. The Board considered these factors over the course of numerous meetings, certain of which were in executive session with only the Independent Trustees and their counsel present. It is possible that individual Trustees may have weighed these factors differently in reaching their individual decisions to approve the continuation of the Agreement.
DWS Technology VIP
The Board of Trustees, including the Independent Trustees, approved the renewal of your Fund's investment management agreement (the "Agreement") with Deutsche Investment Management Americas Inc. ("DWS") in September 2010.
In terms of the process that the Board followed prior to approving the Agreement, shareholders should know that:
• In September 2010, all but one of the Fund's Trustees were independent of DWS and its affiliates.
• The Trustees meet frequently to discuss fund matters. Each year, the Trustees dedicate substantial time to contract review matters. Over the course of several months, the Board's Contract Committee, in coordination with the Board's Equity Oversight Committee, reviewed comprehensive materials received from DWS, independent third parties and independent counsel. These materials included an analysis of the Fund's performance, fees and expenses, and profitability compiled by the Fund's independent fee consultant. The Board also received extensive information throughout the year regarding performance of the Fund.
• The Independent Trustees regularly meet privately with their independent counsel to discuss contract review and other matters. In addition, the Independent Trustees were also advised by the Fund's independent fee consultant in the course of their review of the Fund's contractual arrangements and considered a comprehensive report prepared by the independent fee consultant in connection with their deliberations (the "IFC Report").
• In connection with reviewing the Agreement, the Board also reviewed the terms of the Fund's Rule 12b-1 plan, distribution agreement, administrative services agreement, transfer agency agreement and other material service agreements.
• Based on its evaluation of the information provided, the Contract Committee presented its findings and recommendations to the Independent Trustees as a group. The Independent Trustees reviewed the Contract Committee's findings and recommendations and presented their recommendations to the full Board.
In connection with the contract review process, the Contract Committee and the Board considered the factors discussed below, among others. The Board also considered that DWS and its predecessors have managed the Fund since its inception, and the Board believes that a long-term relationship with a capable, conscientious advisor is in the best interests of the Fund. The Board considered, generally, that shareholders chose to invest or remain invested in the Fund knowing that DWS managed the Fund, and that the Agreement was approved by the Fund's shareholders. DWS is part of Deutsche Bank, a major global banking institution that is engaged in a wide range of financial services. The Board believes that there are significant advantages to being part of a global asset management business that offers a wide range of investing expertise and resources, including hundreds of portfolio managers and analysts with research capabilities in many countries throughout the world.
While shareholders may focus primarily on fund performance and fees, the Fund's Board considers these and many other factors, including the quality and integrity of DWS's personnel and such other issues as back-office operations, fund valuations, and compliance policies and procedures.
Nature, Quality and Extent of Services. The Board considered the terms of the Agreement, including the scope of advisory services provided under the Agreement. The Board noted that, under the Agreement, DWS provides portfolio management services to the Fund and that, pursuant to a separate administrative services agreement, DWS provides administrative services to the Fund. The Board considered the experience and skills of senior management and investment personnel, the resources made available to such personnel, the ability of DWS to attract and retain high-quality personnel, and the organizational depth and stability of DWS. The Board reviewed the Fund's performance over short-term and long-term periods and compared those returns to various agreed-upon performance measures, including market indices and a peer universe compiled by the independent fee consultant using information supplied by Lipper Inc. ("Lipper"). The Board also noted that it has put into place a process of identifying "Focus Funds" (e.g., funds performing poorly relative to their benchmark or a peer universe compiled by Lipper), and receives more frequent reporting and information from DWS regarding such funds, along with DWS's remedial plans to address underperformance. The Board believes this process is an effective manner of identifying and addressing underperforming funds. Based on the information provided, the Board noted that for the one-, three- and five-year periods ended December 31, 2009, the Fund's performance (Class A shares) was in the 2nd quartile, 3rd quartile and 4th quartile, respectively, of the applicable Lipper universe (the 1st quartile being the best performers and the 4th quartile being the worst performers). The Board also observed that the Fund has underperformed its benchmark in the one-, three- and five-year periods ended December 31, 2009.
On the basis of this evaluation and the ongoing review of investment results by the Board, the Board concluded that the nature, quality and extent of services provided by DWS historically have been and continue to be satisfactory.
Fees and Expenses. The Board considered the Fund's investment management fee schedule, operating expenses, and total expense ratios, and comparative information provided by Lipper and the independent fee consultant regarding investment management fee rates paid to other investment advisors by similar funds (1st quartile being the most favorable and 4th quartile being the least favorable). With respect to management fees paid to other investment advisors by similar funds, the Board noted that the contractual fee rates paid by the Fund, which include the 0.10% fee paid to DWS under the Fund's administrative services agreement, were at the median (2nd quartile) of the applicable Lipper peer group (based on Lipper data provided as of December 31, 2009). The Board noted that the Fund's Class A shares total (net) operating expenses were expected to be lower than the median (1st quartile) of the applicable Lipper expense universe (based on Lipper data provided as of December 31, 2009, and analyzing Lipper expense universe Class A expenses less any applicable 12b-1 fees) ("Lipper Universe Expenses"). The Board also reviewed data comparing the each share class's total (net) operating expenses to the applicable Lipper Universe Expenses. The Board considered the Fund's management fee rate as compared to fees charged by DWS and certain of its affiliates for comparable mutual funds and considered differences in fund and fee structures between the DWS Funds. The Board also considered how the Fund's total (net) operating expenses compared to the total (net) operating expenses of a more customized peer group selected by Lipper (based on such factors as asset size).
The information considered by the Board as part of its review of management fees included information regarding fees charged by DWS and its affiliates to similar institutional accounts and to similar funds offered primarily to European investors ("DWS Europe funds"), in each case as applicable. The Board observed that advisory fee rates for institutional accounts generally were lower than the management fees charged by similarly managed DWS US mutual funds ("DWS Funds"), but also took note of the differences in services provided to DWS Funds as compared to institutional accounts. In the case of DWS Europe funds, the Board observed that fee rates for DWS Europe funds generally were higher than for similarly managed DWS Funds, but noted that differences in the types of services provided to DWS Funds relative to DWS Europe funds made it difficult to compare such fees.
On the basis of the information provided, the Board concluded that management fees were reasonable and appropriate in light of the nature, quality and extent of services provided by DWS.
Profitability. The Board reviewed detailed information regarding revenues received by DWS under the Agreement. The Board considered the estimated costs and pre-tax profits realized by DWS from advising the DWS Funds, as well as estimates of the pre-tax profits attributable to managing the Fund in particular. The Board also received information regarding the estimated enterprise-wide profitability of DWS and its affiliates with respect to all fund services in totality and by fund. The Board reviewed DWS's methodology in allocating its costs to the management of the Fund. Based on the information provided, the Board concluded that the pre-tax profits realized by DWS in connection with the management of the Fund were not unreasonable. The Board also reviewed information regarding the profitability of certain similar investment management firms. The Board noted that while information regarding the profitability of such firms is limited (and in some cases is not necessarily prepared on a comparable basis), DWS and its affiliates' overall profitability with respect to the DWS fund complex (after taking into account distribution and other services provided to the funds by DWS and its affiliates) was lower than the overall profitability levels of many comparable firms for which such data was available.
Economies of Scale. The Board considered whether there are economies of scale with respect to the management of the Fund and whether the Fund benefits from any economies of scale. The Board noted that the Fund's management fee schedule includes fee breakpoints. The Board concluded that the Fund's fee schedule represents an appropriate sharing between the Fund and DWS of such economies of scale as may exist in the management of the Fund at current asset levels.
Other Benefits to DWS and Its Affiliates. The Board also considered the character and amount of other incidental benefits received by DWS and its affiliates, including any fees received by DWS for administrative services provided to the Fund and any fees received by an affiliate of DWS for distribution services. The Board also considered benefits to DWS related to brokerage and soft-dollar allocations, including allocating brokerage to pay for research generated by parties other than the executing broker dealers, which pertain primarily to funds investing in equity securities, along with the incidental public relations benefits to DWS related to DWS Funds advertising and cross-selling opportunities among DWS products and services. The Board concluded that management fees were reasonable in light of these fallout benefits.
Compliance. The Board considered the significant attention and resources dedicated by DWS to documenting and enhancing its compliance processes in recent years. The Board noted in particular (i) the experience and seniority of both DWS's chief compliance officer and the Fund's chief compliance officer; (ii) the large number of DWS compliance personnel; and (iii) the substantial commitment of resources by DWS and its affiliates to compliance matters.
Based on all of the information considered and the conclusions reached, the Board unanimously (including the Independent Trustees) determined that the continuation of the Agreement is in the best interests of the Fund. In making this determination, the Board did not give particular weight to any single factor identified above. The Board considered these factors over the course of numerous meetings, certain of which were in executive session with only the Independent Trustees and their counsel present. It is possible that individual Trustees may have weighed these factors differently in reaching their individual decisions to approve the continuation of the Agreement.
DWS Turner Mid Cap Growth VIP
The Board of Trustees, including the Independent Trustees, approved the renewal of your Fund's investment management agreement (the "Agreement") with Deutsche Investment Management Americas Inc. ("DWS") and sub-advisory agreement (the "Sub-Advisory Agreement" and together with the Agreement, the "Agreements") between DWS and Turner Investment Partners, Inc. ("Turner") in September 2010.
In terms of the process that the Board followed prior to approving the Agreements, shareholders should know that:
• In September 2010, all but one of the Fund's Trustees were independent of DWS and its affiliates.
• The Trustees meet frequently to discuss fund matters. Each year, the Trustees dedicate substantial time to contract review matters. Over the course of several months, the Board's Contract Committee, in coordination with the Board's Equity Oversight Committee, reviewed comprehensive materials received from DWS, independent third parties and independent counsel. These materials included an analysis of the Fund's performance, fees and expenses, and profitability compiled by the Fund's independent fee consultant. The Board also received extensive information throughout the year regarding performance of the Fund.
• The Independent Trustees regularly meet privately with their independent counsel to discuss contract review and other matters. In addition, the Independent Trustees were also advised by the Fund's independent fee consultant in the course of their review of the Fund's contractual arrangements and considered a comprehensive report prepared by the independent fee consultant in connection with their deliberations (the "IFC Report").
• In connection with reviewing the Agreements, the Board also reviewed the terms of the Fund's distribution agreement, administrative services agreement, transfer agency agreement and other material service agreements.
• Based on its evaluation of the information provided, the Contract Committee presented its findings and recommendations to the Independent Trustees as a group. The Independent Trustees reviewed the Contract Committee's findings and recommendations and presented their recommendations to the full Board.
In connection with the contract review process, the Contract Committee and the Board considered the factors discussed below, among others. The Board also considered that DWS and its predecessors have managed the Fund since its inception, and the Board believes that a long-term relationship with a capable, conscientious advisor is in the best interests of the Fund. The Board considered, generally, that shareholders chose to invest or remain invested in the Fund knowing that DWS managed the Fund, and that the Agreement was approved by the Fund's shareholders. DWS is part of Deutsche Bank, a major global banking institution that is engaged in a wide range of financial services. The Board believes that there are significant advantages to being part of a global asset management business that offers a wide range of investing expertise and resources, including hundreds of portfolio managers and analysts with research capabilities in many countries throughout the world.
While shareholders may focus primarily on fund performance and fees, the Fund's Board considers these and many other factors, including the quality and integrity of DWS's and Turner's personnel and such other issues as back-office operations, fund valuations, and compliance policies and procedures.
Nature, Quality and Extent of Services. The Board considered the terms of the Agreements, including the scope of advisory services provided under the Agreements. The Board noted that, under the Agreements, DWS and Turner provide portfolio management services to the Fund and that, pursuant to a separate administrative services agreement, DWS provides administrative services to the Fund. The Board considered the experience and skills of senior management and investment personnel, the resources made available to such personnel, the ability of DWS to attract and retain high-quality personnel, and the organizational depth and stability of DWS. The Board reviewed the Fund's performance over short-term and long-term periods and compared those returns to various agreed-upon performance measures, including market indices and a peer universe compiled by the independent fee consultant using information supplied by Lipper Inc. ("Lipper"). The Board also noted that it has put into place a process of identifying "Focus Funds" (e.g., funds performing poorly relative to their benchmark or a peer universe compiled by Lipper), and receives more frequent reporting and information from DWS regarding such funds, along with DWS's remedial plans to address underperformance. The Board believes this process is an effective manner of identifying and addressing underperforming funds. Based on the information provided, the Board noted that for the one-, three- and five-year periods ended December 31, 2009, the Fund's performance (Class A shares) was in the 1st quartile, 2nd quartile and 3rd quartile, respectively, of the applicable Lipper universe (the 1st quartile being the best performers and the 4th quartile being the worst performers). The Board also observed that the Fund has outperformed its benchmark in the one-, three- and five-year periods ended December 31, 2009.
On the basis of this evaluation and the ongoing review of investment results by the Board, the Board concluded that the nature, quality and extent of services provided by DWS and Turner historically have been and continue to be satisfactory.
Fees and Expenses. The Board considered the Fund's investment management fee schedule, sub-advisory fee schedule, operating expenses, and total expense ratios, and comparative information provided by Lipper and the independent fee consultant regarding investment management fee rates paid to other investment advisors by similar funds (1st quartile being the most favorable and 4th quartile being the least favorable). With respect to management fees paid to other investment advisors by similar funds, the Board noted that the contractual fee rates paid by the Fund, which include the 0.10% fee paid to DWS under the Fund's administrative services agreement, were higher than the median (3rd quartile) of the applicable Lipper peer group (based on Lipper data provided as of December 31, 2009). With respect to the sub-advisory fee paid to Turner, the Board noted that the fee is paid by DWS out of its fee and not directly by the Fund. The Board noted that the Fund's Class A shares total (net) operating expenses were expected to be higher than the median (3rd quartile) of the applicable Lipper expense universe (based on Lipper data provided as of December 31, 2009, and analyzing Lipper expense universe Class A expenses less any applicable 12b-1 fees) ("Lipper Universe Expenses"). The Board considered the Fund's management fee rate as compared to fees charged by DWS and certain of its affiliates for comparable mutual funds and considered differences in fund and fee structures between the DWS Funds. The Board also considered how the Fund's total (net) operating expenses compared to the total (net) operating expenses of a more customized peer group selected by Lipper (based on such factors as asset size). The Board also noted that the expense limitation agreed to by DWS helped to ensure that the Fund's total (net) operating expenses would remain competitive.
The information considered by the Board as part of its review of management fees included information regarding fees charged by DWS and its affiliates to similar institutional accounts and to similar funds offered primarily to European investors ("DWS Europe funds"), in each case as applicable. The Board observed that advisory fee rates for institutional accounts generally were lower than the management fees charged by similarly managed DWS US mutual funds ("DWS Funds"), but also took note of the differences in services provided to DWS Funds as compared to institutional accounts. In the case of DWS Europe funds, the Board observed that fee rates for DWS Europe funds generally were higher than for similarly managed DWS Funds, but noted that differences in the types of services provided to DWS Funds relative to DWS Europe funds made it difficult to compare such fees.
On the basis of the information provided, the Board concluded that management fees were reasonable and appropriate in light of the nature, quality and extent of services provided by DWS and Turner.
Profitability. The Board reviewed detailed information regarding revenues received by DWS under the Agreement. The Board considered the estimated costs and pre-tax profits realized by DWS from advising the DWS Funds, as well as estimates of the pre-tax profits attributable to managing the Fund in particular. The Board also received information regarding the estimated enterprise-wide profitability of DWS and its affiliates with respect to all fund services in totality and by fund. The Board reviewed DWS's methodology in allocating its costs to the management of the Fund. Based on the information provided, the Board concluded that the pre-tax profits realized by DWS in connection with the management of the Fund were not unreasonable. The Board also reviewed information regarding the profitability of certain similar investment management firms. The Board noted that while information regarding the profitability of such firms is limited (and in some cases is not necessarily prepared on a comparable basis), DWS and its affiliates' overall profitability with respect to the DWS fund complex (after taking into account distribution and other services provided to the funds by DWS and its affiliates) was lower than the overall profitability levels of many comparable firms for which such data was available. The Board did not consider the profitability of Turner with respect to the Fund. The Board noted that DWS pays Turner's fee out of its management fee, and its understanding that the Fund's sub-advisory fee schedule was the product of an arm's length negotiation with DWS.
Economies of Scale. The Board considered whether there are economies of scale with respect to the management of the Fund and whether the Fund benefits from any economies of scale. The Board noted that the Fund's management fee schedule includes fee breakpoints. The Board concluded that the Fund's fee schedule represents an appropriate sharing between the Fund and DWS of such economies of scale as may exist in the management of the Fund at current asset levels.
Other Benefits to DWS and Turner and Their Affiliates. The Board also considered the character and amount of other incidental benefits received by DWS and Turner and their affiliates, including any fees received by DWS for administrative services provided to the Fund and any fees received by an affiliate of DWS for distribution services. The Board also considered benefits to DWS and Turner related to brokerage and soft-dollar allocations, including allocating brokerage to pay for research generated by parties other than the executing broker dealers, which pertain primarily to funds investing in equity securities, along with the incidental public relations benefits to DWS and Turner related to DWS Funds advertising and cross-selling opportunities among DWS products and services. The Board concluded that management fees were reasonable in light of these fallout benefits.
Compliance. The Board considered the significant attention and resources dedicated by DWS to documenting and enhancing its compliance processes in recent years. The Board noted in particular (i) the experience and seniority of both DWS's chief compliance officer and the Fund's chief compliance officer; (ii) the large number of DWS compliance personnel; and (iii) the substantial commitment of resources by DWS and its affiliates to compliance matters. The Board also considered the attention and resources dedicated by DWS to the oversight of the investment sub-advisor's compliance program and compliance with the applicable fund policies and procedures.
Based on all of the information considered and the conclusions reached, the Board unanimously (including the Independent Trustees) determined that the continuation of the Agreements is in the best interests of the Fund. In making this determination, the Board did not give particular weight to any single factor identified above. The Board considered these factors over the course of numerous meetings, certain of which were in executive session with only the Independent Trustees and their counsel present. It is possible that individual Trustees may have weighed these factors differently in reaching their individual decisions to approve the continuation of the Agreements.
Summary of Management Fee Evaluation by Independent Fee Consultant
October 3, 2010
Pursuant to an Order entered into by Deutsche Investment Management Americas and affiliates (collectively, "DeAM") with the Attorney General of New York, I, Thomas H. Mack, have been appointed the Independent Fee Consultant for the DWS Funds (formerly the DWS Scudder Funds). My duties include preparing an annual written evaluation of the management fees DeAM charges the Funds, considering among other factors the management fees charged by other mutual fund companies for like services, management fees DeAM charges other clients for like services, DeAM's costs of supplying services under the management agreements and related profit margins, possible economies of scale if a Fund grows larger, and the nature and quality of DeAM's services, including fund performance. This report summarizes my evaluation for 2010, including my qualifications, the evaluation process for each of the DWS Funds, consideration of certain complex-level factors, and my conclusions. I served in substantially the same capacity in 2007, 2008, and 2009.
Qualifications
For more than 35 years I have served in various professional capacities within the investment management business. I have held investment analysis and advisory positions, including securities analyst, portfolio strategist and director of investment policy with a large investment firm. I have also performed business management functions, including business development, financial management and marketing research and analysis.
Since 1991, I have been an independent consultant within the asset management industry. I have provided services to over 125 client organizations, including investment managers, mutual fund boards, product distributors and related organizations. Over the past ten years I have completed a number of assignments for mutual fund boards, specifically including assisting boards with management contract renewal.
I hold a Master of Business Administration degree, with highest honors, from Harvard University and Master of Science and Bachelor of Science (highest honors) degrees from the University of California at Berkeley. I am an independent director and audit committee financial expert for two closed-end mutual funds and have served in various leadership and financial oversight capacities with non-profit organizations.
Evaluation of Fees for each DWS Fund
My work focused primarily on evaluating, fund-by-fund, the fees charged to each of the 118 publicly offered Fund portfolios in the DWS Fund family. For each Fund, I considered each of the key factors mentioned above, as well as any other relevant information. In doing so I worked closely with the Funds' Independent Directors in their annual contract renewal process, as well as in their approval of contracts for several new funds (documented separately).
In evaluating each Fund's fees, I reviewed comprehensive materials provided by or on behalf of DeAM, including expense information prepared by Lipper Analytical, comparative performance information, profitability data, manager histories, and other materials. I also accessed certain additional information from the Lipper and Morningstar databases and drew on my industry knowledge and experience.
To facilitate evaluating this considerable body of information, I prepared for each Fund a document summarizing the key data elements in each area as well as additional analytics discussed below. This made it possible to consider each key data element in the context of the others.
In the course of contract renewal, DeAM agreed to implement a number of fee and expense adjustments requested by the Independent Directors which will favorably impact future fees and expenses, and my evaluation includes the effects of these changes.
Fees and Expenses Compared with Other Funds
The competitive fee and expense evaluation for each fund focused on two primary comparisons:
The Fund's contractual management fee (the advisory fee plus the administration fee where applicable) compared with those of a group of typically 12-15 funds in the same Lipper investment category (e.g. Large Capitalization Growth) having similar distribution arrangements and being of similar size.
The Fund's total expenses compared with a broader universe of funds from the same Lipper investment category and having similar distribution arrangements.
These two comparisons provide a view of not only the level of the fee compared with funds of similar scale but also the total expense the Fund bears for all the services it receives, in comparison with the investment choices available in the Fund's investment category and distribution channel. The principal figure-of-merit used in these comparisons was the subject Fund's percentile ranking against peers.
DeAM's Fees for Similar Services to Others
DeAM provided management fee schedules for all of its US domiciled fund and non-fund investment management accounts in any of the investment categories where there is a DWS Fund. These similar products included the other DWS Funds, non-fund pooled accounts, institutional accounts and sub-advisory accounts. Using this information, I calculated for each Fund the fee that would be charged to each similar product, at the subject Fund's asset level.
Evaluating information regarding non-fund products is difficult because there are varying levels of services required for different types of accounts, with mutual funds generally requiring considerably more regulatory and administrative types of service as well as having more frequent cash flows than other types of accounts. Also, while mutual fund fees for similar fund products can be expected to be similar, there will be some differences due to different pricing conditions in different distribution channels (e.g. retail funds versus those used in variable insurance products), differences in underlying investment processes and other factors.
Costs and Profit Margins
DeAM provided a detailed profitability analysis for each Fund. After making some adjustments so that the presentation would be more comparable to the available industry figures, I reviewed profit margins from investment management alone, from investment management plus other fund services (excluding distribution) provided to the Funds by DeAM (principally shareholder services), and DeAM profits from all sources, including distribution. A later section comments on overall profitability.
Economies of Scale
Economies of scale — an expected decline in management cost per dollar of fund assets as fund assets grow — are very rarely quantified and documented because of inherent difficulties in collecting and analyzing relevant data. However, in virtually every investment category that I reviewed, larger funds tend to have lower fees and lower total expenses than smaller funds. To see how each DWS Fund compares with this industry observation, I reviewed:
The trend in Fund assets over the last five years and the accompanying trend in total expenses. This shows if the Fund has grown and, if so, whether total expense (management fees as well as other expenses) have declined as a percent of assets.
Whether the Fund has break-points in its management fee schedule, the extent of the fee reduction built into the schedule and the asset levels where the breaks take effect, and in the case of a sub-advised Fund how the Fund's break-points compare with those of the sub-advisory fee schedule.
How the Fund's contractual fee schedule compares with trends in the industry data. To accomplish this, I constructed a chart showing how actual latest-fiscal-year contractual fees of the Fund and of other similar funds relate to average fund assets, with the subject Fund's contractual fee schedule superimposed.
Quality of Service — Performance
The quality-of-service evaluation focused on investment performance, which is the principal result of the investment management service. Each Fund's performance was reviewed over the past 1, 3, 5 and 10 years, as applicable, and compared with that of other funds in the same investment category and with a suitable market index.
In addition, I calculated and reviewed risk-adjusted returns relative to an index of similar mutual funds' returns and a suitable market index. The risk-adjusted returns analysis provides a way of determining the extent to which the Fund's return comparisons are mainly the product of investment value-added (or lack thereof) or alternatively taking considerably more or less risk than is typical in its investment category.
I also received and considered the history of portfolio manager changes for each Fund, as this provided an important context for evaluating the performance results.
Complex-Level Considerations
While this evaluation was conducted mainly at the individual fund level, there are some issues relating to the reasonableness of fees that can alternatively be considered across the whole fund complex:
I reviewed DeAM's profitability analysis for all DWS Funds, with a view toward determining if the allocation procedures used were reasonable and how profit levels compared with public data for other investment managers.
I considered whether DeAM and affiliates receive any significant ancillary or "fall-out" benefits that should be considered in interpreting the direct profitability results. These would be situations where serving as the investment manager of the Funds is beneficial to another part of the Deutsche Bank organization.
I considered how aggregated DWS Fund expenses had varied over the years, by asset class and in the context of trends in asset levels.
I reviewed the structure of the DeAM organization, trends in staffing levels, and information on compensation of investment management and other professionals compared with industry data.
Findings
Based on the process and analysis discussed above, which included reviewing a wide range of information from management and external data sources and considering among other factors the fees DeAM charges other clients, the fees charged by other fund managers, DeAM's costs and profits associated with managing the Funds, economies of scale, possible fall-out benefits, and the nature and quality of services provided, in my opinion the management fees charged the DWS Funds are reasonable.

Thomas H. Mack
Summary of Administrative Fee Evaluation by Independent Fee Consultant
DWS Money Market VIP
October 4, 2010
Pursuant to an Order entered into by Deutsche Asset Management (DeAM) with the Attorney General of New York, I, Thomas H. Mack, have been appointed the Independent Fee Consultant for the DWS Funds and have as part of my duties evaluated the reasonableness of a proposed pass-through to the funds of certain reporting costs associated with new regulations for money funds. My evaluation considered the following:
• My recently completed annual evaluation (please see my summary report of October 3, 2010), concluding that the prospective fees and expenses of all the DWS-sponsored money funds are reasonable.
• The fact that in my opinion the services DWS would provide under the combination of the Advisory and proposed Administration Agreements continues to be comparable with those typically provided to competitive funds under their management agreements.
• Management's analysis showing that the maximum total expense ratio impact of this change on any fund share class would be 1.3 basis points, which in my opinion is not material to my conclusions about the reasonableness of expenses.
Based on the foregoing considerations, in my opinion the proposed fees and expenses for the affected DWS-sponsored money funds are reasonable.

Thomas H. Mack
Board Members and Officers
The following table presents certain information regarding the Board Members and Officers of the Trust as of December 31, 2010. Each Board Member's year of birth is set forth in parentheses after his or her name. Unless otherwise noted, (i) each Board Member has engaged in the principal occupation(s) noted in the table for at least the most recent five years, although not necessarily in the same capacity; and (ii) the address of each Independent Board Member is c/o Paul K. Freeman, Independent Chairman, DWS Funds, PO Box 101833, Denver, CO 80250-1833. Except as otherwise noted below, the term of office for each Board Member is until the election and qualification of a successor, or until such Board Member sooner dies, resigns, is removed or as otherwise provided in the governing documents of the fund. Because the fund does not hold an annual meeting of shareholders, each Board Member will hold office for an indeterminate period. The Board Members may also serve in similar capacities with other funds in the fund complex. The Length of Time Served represents the year in which the Board Member joined the board of one or more DWS funds now overseen by the Board.
Independent Board Members |
Name, Year of Birth, Position with the Fund and Length of Time Served1 | Business Experience and Directorships During the Past Five Years | Number of Funds in DWS Fund Complex Overseen |
Paul K. Freeman (1950) Chairperson since 2009 Board Member since 1993 | Consultant, World Bank/Inter-American Development Bank; Executive and Governing Council of the Independent Directors Council (education committees); formerly, Project Leader, International Institute for Applied Systems Analysis (1998-2001); Chief Executive Officer, The Eric Group, Inc. (environmental insurance) (1986-1998) | 122 |
John W. Ballantine (1946) Board Member since 1999 | Retired; formerly, Executive Vice President and Chief Risk Management Officer, First Chicago NBD Corporation/The First National Bank of Chicago (1996-1998); Executive Vice President and Head of International Banking (1995-1996). Directorships: Healthways, Inc. (provider of disease and care management services); Portland General Electric (utility company); Stockwell Capital Investments PLC (private equity). Former Directorships: First Oak Brook Bancshares, Inc. and Oak Brook Bank; Prisma Energy International | 122 |
Henry P. Becton, Jr. (1943) Board Member since 1990 | Vice Chair and former President, WGBH Educational Foundation. Directorships: Association of Public Television Stations; Lead Director, Becton Dickinson and Company3 (medical technology company); Lead Director, Belo Corporation3 (media company); Public Radio International; Public Radio Exchange (PRX); The PBS Foundation. Former Directorships: Boston Museum of Science; American Public Television; Concord Academy; New England Aquarium; Mass. Corporation for Educational Telecommunications; Committee for Economic Development; Public Broadcasting Service | 122 |
Dawn-Marie Driscoll (1946) Board Member since 1987 | President, Driscoll Associates (consulting firm); Executive Fellow, Center for Business Ethics, Bentley University; formerly, Partner, Palmer & Dodge (1988-1990); Vice President of Corporate Affairs and General Counsel, Filene's (1978-1988). Directorships: Trustee of 22 open-end mutual funds managed by Sun Capital Advisers, Inc. (since 2007); Director of ICI Mutual Insurance Company (since 2007); Advisory Board, Center for Business Ethics, Bentley University; Trustee, Southwest Florida Community Foundation (charitable organization). Former Directorships: Investment Company Institute (audit, executive, nominating committees) and Independent Directors Council (governance, executive committees) | 122 |
Keith R. Fox (1954) Board Member since 1996 | Managing General Partner, Exeter Capital Partners (a series of private investment funds). Directorships: Progressive International Corporation (kitchen goods importer and distributor); BoxTop Media Inc. (advertising); The Kennel Shop (retailer); former Chairman, National Association of Small Business Investment Companies | 122 |
Kenneth C. Froewiss (1945) Board Member since 2001 | Adjunct Professor of Finance, NYU Stern School of Business (September 2009-present; Clinical Professor from 1997-September 2009); Member, Finance Committee, Association for Asian Studies (2002-present); Director, Mitsui Sumitomo Insurance Group (US) (2004-present); prior thereto, Managing Director, J.P. Morgan (investment banking firm) (until 1996) | 122 |
Richard J. Herring (1946) Board Member since 1990 | Jacob Safra Professor of International Banking and Professor, Finance Department, The Wharton School, University of Pennsylvania (since July 1972); Co-Director, Wharton Financial Institutions Center (since July 2000); Co-Chair, U.S. Shadow Financial Regulatory Committee; Executive Director, Financial Economists Roundtable; Director, Japan Equity Fund, Inc. (since September 2007), Thai Capital Fund, Inc. (since September 2007), Singapore Fund, Inc. (since September 2007); Independent Director of Barclays Bank Delaware (since September 2010). Formerly, Vice Dean and Director, Wharton Undergraduate Division (July 1995-June 2000); Director, Lauder Institute of International Management Studies (July 2000-June 2006) | 122 |
William McClayton (1944) Board Member since 2004+ | Private equity investor (since October 2009); previously, Managing Director, Diamond Management & Technology Consultants, Inc. (global consulting firm) (2001-2009); Directorship: Board of Managers, YMCA of Metropolitan Chicago; formerly: Senior Partner, Arthur Andersen LLP (accounting) (1966-2001); Trustee, Ravinia Festival | 122 |
Rebecca W. Rimel (1951) Board Member since 1995 | President and Chief Executive Officer, The Pew Charitable Trusts (charitable organization) (1994 to present); Trustee, Thomas Jefferson Foundation (charitable organization) (1994 to present); Trustee, Executive Committee, Philadelphia Chamber of Commerce (2001-2007); Director, CardioNet, Inc.2 (2009-present) (health care). Formerly, Executive Vice President, The Glenmede Trust Company (investment trust and wealth management) (1983-2004); Board Member, Investor Education (charitable organization) (2004-2005); Director, Viasys Health Care2 (January 2007-June 2007); Trustee, Pro Publica (charitable organization) (2007-2010) | 122 |
William N. Searcy, Jr. (1946) Board Member since 1993 | Private investor since October 2003; Trustee of 22 open-end mutual funds managed by Sun Capital Advisers, Inc. (since October 1998). Formerly, Pension & Savings Trust Officer, Sprint Corporation2 (telecommunications) (November 1989-September 2003) | 122 |
Jean Gleason Stromberg (1943) Board Member since 1997 | Retired. Formerly, Consultant (1997-2001); Director, Financial Markets US Government Accountability Office (1996-1997); Partner, Fulbright & Jaworski, L.L.P. (law firm) (1978-1996). Directorships: The William and Flora Hewlett Foundation. Former Directorships: Service Source, Inc., Mutual Fund Directors Forum (2002-2004), American Bar Retirement Association (funding vehicle for retirement plans) (1987-1990 and 1994-1996) | 122 |
Robert H. Wadsworth (1940) Board Member since 1999 | President, Robert H. Wadsworth & Associates, Inc. (consulting firm) (1983 to present); Director, The Phoenix Boys Choir Association | 125 |
Interested Board Member and Officer4 |
Name, Year of Birth, Position with the Trust/
Corporation and Length of Time Served1,5 | Business Experience and Directorships During the Past Five Years | Number of Funds in DWS Fund Complex Overseen |
Ingo Gefeke7 (1967) Board Member since 2010 Executive Vice President since 2010 | Managing Director3, Deutsche Asset Management; Global Head of Distribution and Product Management, DWS Global Head of Trading and Securities Lending. Member of the Board of Directors of DWS Investment GmbH Frankfurt (since July 2009) and DWS Holding & Service GmbH Frankfurt (since January 2010); formerly, Global Chief Administrative Officer, Deutsche Asset Management (2004-2009); Global Chief Operating Officer, Global Transaction Banking, Deutsche Bank AG, New York (2001-2004); Chief Operating Officer, Global Banking Division Americas, Deutsche Bank AG, New York (1999-2001); Central Management, Global Banking Services, Deutsche Bank AG, Frankfurt (1998-1999); Relationship Management, Deutsche Bank AG, Tokyo, Japan (1997-1998) | 55 |
Officers4 |
Name, Year of Birth, Position with the Fund and Length of Time Served5 | Principal Occupation(s) During Past 5 Years and Other Directorships Held |
Michael G. Clark6 (1965) President, 2006-present | Managing Director3, Deutsche Asset Management (2006-present); President of DWS family of funds; Director, ICI Mutual Insurance Company (since October 2007); formerly, Director of Fund Board Relations (2004-2006) and Director of Product Development (2000-2004), Merrill Lynch Investment Managers; Senior Vice President Operations, Merrill Lynch Asset Management (1999-2000) |
John Millette8 (1962) Vice President and Secretary, 1999-present | Director3, Deutsche Asset Management |
Paul H. Schubert6 (1963) Chief Financial Officer, 2004-present Treasurer, 2005-present | Managing Director3, Deutsche Asset Management (since July 2004); formerly, Executive Director, Head of Mutual Fund Services and Treasurer for UBS Family of Funds (1998-2004); Vice President and Director of Mutual Fund Finance at UBS Global Asset Management (1994-1998) |
Caroline Pearson8 (1962) Chief Legal Officer, April 2010-present | Managing Director3, Deutsche Asset Management; formerly, Assistant Secretary for DWS family of funds (1997-2010) |
Rita Rubin9 (1970) Assistant Secretary, 2009-present | Vice President and Counsel, Deutsche Asset Management (since October 2007); formerly, Vice President, Morgan Stanley Investment Management (2004-2007) |
Paul Antosca8 (1957) Assistant Treasurer, 2007-present | Director3, Deutsche Asset Management (since 2006); Vice President, The Manufacturers Life Insurance Company (U.S.A.) (1990-2006) |
Jack Clark8 (1967) Assistant Treasurer, 2007-present | Director3, Deutsche Asset Management (since 2007); formerly, Vice President, State Street Corporation (2002-2007) |
Diane Kenneally8 (1966) Assistant Treasurer, 2007-present | Director3, Deutsche Asset Management |
John Caruso9 (1965) Anti-Money Laundering Compliance Officer, 2010-present | Managing Director3, Deutsche Asset Management |
Robert Kloby9 (1962) Chief Compliance Officer, 2006-present | Managing Director3, Deutsche Asset Management |
1 The length of time served represents the year in which the Board Member joined the board of one or more DWS funds currently overseen by the Board.
2 A publicly held company with securities registered pursuant to Section 12 of the Securities Exchange Act of 1934.
3 Executive title, not a board directorship.
4 As a result of their respective positions held with the Advisor, these individuals are considered "interested persons" of the Advisor within the meaning of the 1940 Act. Interested persons receive no compensation from the fund.
5 The length of time served represents the year in which the officer was first elected in such capacity for one or more DWS funds.
6 Address: 100 Plaza One, Jersey City, NJ 07311.
7 Effective January 11, 2011, Mr. Gefeke, an interested Board Member and Executive Vice President, resigned from the fund's Board and as an officer.
The mailing address of Mr. Gefeke is 345 Park Avenue, New York, New York 10154. Mr. Gefeke was an interested Board Member of certain DWS funds by virtue of his positions with Deutsche Asset Management. As an interested person, Mr. Gefeke received no compensation from the fund.
8 Address: One Beacon Street, Boston, MA 02108.
9 Address: 60 Wall Street, New York, New York 10005.
The fund's Statement of Additional Information ("SAI") includes additional information about the Board Members. The SAI is available, without charge, upon request. If you would like to request a copy of the SAI, you may do so by calling the following toll-free number: (800) 728-3337.
Notes
Notes
DWS Investments is part of Deutsche Bank's Asset Management division and, within the US, represents the retail asset management activities of Deutsche Bank AG, Deutsche Bank Trust Company Americas, Deutsche Investment Management Americas Inc. and DWS Trust Company.
The views expressed in this report reflect those of the portfolio managers only through the end of the period of the report as stated on the cover. The managers' views are subject to change at any time based on market and other conditions and should not be construed as a recommendation.
This information must be preceded or accompanied by a current prospectus.
Portfolio changes should not be considered recommendations for action by individual investors.
DWS Investment Distributors, Inc.
222 South Riverside Plaza
Chicago, IL 60606
(800) 621-1148
VS2-1 (R-20593-1 2/11)
Portfolio management market commentary is as of December 31, 2010, and may not come to pass. This information is subject to change at any time based on market and other conditions. Past performance does not guarantee future results. Current and future portfolio holdings are subject to risk.
DWS VARIABLE SERIES I
PART C: OTHER INFORMATION
Item 15. Indemnification
A policy of insurance covering Deutsche Investment Management Americas Inc., the Registrant’s investment adviser (the “Adviser”), its subsidiaries, including DWS Investments Distributors, Inc., and all of the registered investment companies advised by the Adviser insures the Registrant’s trustees and officers and others against liability arising by reason of an alleged breach of duty caused by any negligent act, error or accidental omission in the scope of their duties.
Article IV, Sections 4.1-4.3 of Registrant’s Amended and Restated Declaration of Trust provides as follows:
Section 4.1. No Personal Liability of Shareholders, Trustees, Etc. Generally. No Shareholder or former Shareholder shall be subject to any personal liability whatsoever to any Person in connection with Trust Property or the acts, obligations or affairs of the Trust. No Trustee, former Trustee, officer, employee or agent of the Trust shall be subject to any personal liability whatsoever to any Person, other than to the Trust or its Shareholders (as set forth in Section 4.2 below), in connection with Trust Property or the acts, obligations or affairs of the Trust; and all such Persons shall look solely to the Trust Property for satisfaction of claims of any nature arising in connection with the affairs of the Trust. The Trust shall indemnify and hold each Shareholder or former Shareholder harmless from and against all claims and liabilities to which such Shareholder may become subject solely by reason of his being or having been a Shareholder, and shall reimburse such Shareholder for all legal and other expenses reasonably incurred by him in connection with any such claim or liability. The indemnification and reimbursement required by the preceding sentence shall be made only out of the assets of the one or more Series of which the Shareholder who is entitled to indemnification or reimbursement was a Shareholder at the time the act or event occurred which gave rise to the claim against or liability of said Shareholder. The rights accruing to a Shareholder under this Section 4.1 shall not impair any other right to which such Shareholder may be lawfully entitled, nor shall anything herein contained restrict the right of the Trust to indemnify or reimburse a Shareholder in any appropriate situation even though not specifically provided herein.
Section 4.2. Non-Liability of Trustees, Etc. to Trust or Shareholders. No Trustee, former Trustee, officer or employee of the Trust shall be liable to the Trust or to any Shareholder for any action or failure to act except for his or her own bad faith, willful misfeasance, gross negligence or reckless disregard of his or her duties involved in the conduct of his office. Without limiting the foregoing, a Trustee shall not be responsible for or liable in any event for any neglect or wrongdoing of any officer, employee, investment adviser, subadviser, principal underwriter, custodian or other agent of the Trust, nor shall any Trustee be responsible or liable for the act or omission of any other Trustee, except in the case of such Trustee’s own willful misfeasance, bad faith, gross negligence or reckless disregard of the duties involved in the conduct of his office.
Section 4.3. Mandatory Indemnification. (a) Subject to the exceptions and limitations contained in paragraph (b) below:
| | (i) | every person who is, or has been, a Trustee or officer of the Trust (for purposes of this Section, “Trustee or officer” shall include persons who serve at the Trust’s request as directors, officers or trustees of another organization in which the Trust has any interest as a shareholder, creditor or otherwise), shall be indemnified by the Trust to the fullest extent permitted by law against all liability and against all expenses reasonably incurred or paid by him in connection with any claim, action, suit or proceeding in which he becomes involved as a party or otherwise by virtue of his being or having been a Trustee or officer, and against amounts paid or incurred by him in the settlement thereof; |
| | (ii) | the words “claim,” “action,” “suit” or “proceeding” shall apply to all claims, actions, suits or proceedings (civil, criminal, administrative or other, including appeals), actual or threatened; and the words “liability” and “expenses” shall include without limitation, attorneys’ fees, costs, judgments, amounts paid in settlement, fines, penalties and other liabilities. |
| | (b) | No indemnification shall be provided hereunder to a Trustee or officer: |
| | (i) | against any liability to the Trust or the Shareholders by reason of a final adjudication by a court or other body before which a proceeding was brought that he engaged in willful misfeasance, bad faith, gross negligence or reckless disregard of the duties involved in the conduct of his office; |
| | (ii) | with respect to any matter as to which he shall have been finally adjudicated not to have acted in good faith in the reasonable belief that his action was in the best interest of the Trust; or |
| | (iii) | in the event of a settlement or other disposition not involving a final adjudication (as provided in paragraph (b)(i) or (b)(ii)) (whether by compromise payment, pursuant to a consent decree or otherwise) resulting in a payment by a Trustee or officer, unless there has been a determination that such Trustee or officer acted in good faith in the reasonable belief that his action was in the best interests of the Trust and is not liable to the Trust or its Shareholders by reason of willful misfeasance, bad faith, gross negligence or reckless disregard of the duties involved in the conduct of his office: |
| | (A) | by the court or other body approving the settlement or other disposition; or |
| | (B) | a reasonable determination, based upon a review of readily available facts (as opposed to a full trial-type inquiry), by: |
| | (x) | a vote of a majority of the Disinterested Trustees acting on the matter (provided that a majority of the Disinterested Trustees then in office act on the matter); or |
| | (y) | written opinion of legal counsel chosen by a majority of the Trustees and determined by them in their reasonable judgment to be independent. |
| | (c) | The rights of indemnification herein provided to any Trustee or officer shall be severable from those of any other Trustee or officer, shall not affect any other rights to which any Trustee or officer may now or hereafter be entitled, shall continue as to a person who has ceased to be such Trustee or officer and shall inure to the benefit of the heirs, executors, administrators and assigns of such a person. Nothing contained herein shall affect any rights to indemnification to which any Trustee or officer or any other person may be entitled by contract or otherwise under law. |
| | (d) | Expenses of preparation and presentation of a defense to any claim, action, suit or proceeding subject to a claim for indemnification described in paragraph (a) of this Section 4.3 shall be advanced by the Trust prior to final disposition thereof upon receipt of an undertaking by or on behalf of the recipient to repay such amount if it is ultimately determined that he or she is not entitled to indemnification under this Section 4.3, provided that either: |
| | (i) | such undertaking is secured by a surety bond or some other appropriate security or the Trust shall be insured against losses arising out of any such advances; or |
| | (ii) | a majority of the Disinterested Trustees acting on the matter (provided that a majority of the Disinterested Trustees act on the matter) or independent legal counsel in a written opinion shall determine, based upon a review of the readily available facts (as opposed to a full trial-type inquiry), that there is reason to believe that the recipient ultimately will be found entitled to indemnification. |
As used in this Section 4.3, a “Disinterested Trustee” is one who is not (i) an Interested Person of the Trust (including anyone who has been exempted from being an Interested Person by any rule, regulation or order of the Commission), or (ii) involved in the claim, action, suit or proceeding.
In making any determination under this Section 4.3 as to whether a Trustee or officer engaged in conduct for which indemnification is not provided as described herein, or as to whether there is reason to believe that a Trustee or officer ultimately will be found entitled to indemnification, the Disinterested Trustees or independent legal counsel making the determination shall afford the Trustee or officer a rebuttable presumption that the Trustee or officer has not engaged in willful misfeasance, bad faith, gross negligence or reckless disregard of the duties involved in the conduct of the Trustee’s or officer’s office and has acted in good faith in the reasonable belief that the Trustee’s or officer’s action was in the best interest of the Trust or Series and its Shareholders. Any determination pursuant to this Section 4.3 shall not prevent the recovery from any Trustee or officer of any amount paid to such Trustee or officer in accordance with this Section as indemnification if such Trustee or officer is subsequently adjudicated by a court of competent jurisdiction not to have acted in good faith in the reasonable belief that such Trustee’s or officer’s action was in the best interests of the Trust or to have been liable to the Trust or its Shareholders by reason of willful misfeasance, bad faith, gross negligence or reckless disregard of the duties involved in the conduct of such Trustee’s or officer’s office.
On April 5, 2002, Zurich Scudder Investments, Inc. (“Scudder”), the Registrant’s investment adviser, now known as Deutsche Investment Management Americas Inc., was acquired by Deutsche Bank AG, not including certain U.K. Operations (the “Transaction”). In connection with the trustees’ evaluation of the Transaction, Deutsche Bank agreed to indemnify, defend and hold harmless Registrant and the trustees who were not “interested persons” of Scudder, Deutsche Bank or Registrant (the “Independent Trustees”) for and against any liability and claims and expenses based upon or arising from, whether in whole or in part, or directly or indirectly, any untrue statement or alleged untrue statement of a material fact made to the Independent Trustees by Deutsche Bank in connection with the Independent Trustees’ consideration of the Transaction, or any omission or alleged omission of a material fact necessary in order to make statements made, in light of the circumstances under which they were made, not misleading.
The Adviser has agreed, subject to applicable law and regulation, to indemnify and hold harmless the Registrant against any loss, damage, liability and expense, including, without limitation, the advancement and payment, as incurred, of reasonable fees and expenses of counsel (including counsel to the Registrant and counsel to the Independent Trustees) and consultants, whether retained by the Registrant or the Independent Trustees, and other customary costs and expenses incurred by the Registrant in connection with any litigation or regulatory action related to possible improper market timing or other improper trading activity or possible improper marketing and sales activity in the Registrant (“Private Litigation and Enforcement Actions”). In the event that this indemnification is unavailable to the Registrant for any reason, then the Adviser has agreed to contribute to the amount paid or payable by the Registrant as a result of any loss, damage, liability or expense in such proportion as is appropriate to reflect the relative fault of the Adviser and the Registrant with respect to the matters which resulted in such loss, damage, liability or expense, as well as any other relevant equitable considerations; provided, that if no final determination is made in such action or proceeding as to the relative fault of the Adviser and the Registrant, then the Adviser shall pay the entire amount of such loss, damage, liability or expense.
In recognition of its undertaking to indemnify the Registrant, and in light of the rebuttable presumption generally afforded to non-interested board members of an investment company that they have not engaged in disabling conduct, the Adviser has also agreed, subject to applicable law and regulation, to indemnify and hold harmless each of the Independent Trustees against any and all loss, damage, liability and expense,
including without limitation the advancement and payment as incurred of reasonable fees and expenses of counsel and consultants, and other customary costs and expenses incurred by the Independent Trustees, arising from the matters alleged in any Private Litigation and Enforcement Actions or matters arising from or similar in subject matter to the matters alleged in the Private Litigation and Enforcement Actions (collectively, “Covered Matters”), including without limitation:
| | 1. | all reasonable legal and other expenses incurred by the Independent Trustees in connection with the Private Litigation and Enforcement Actions, and any actions that may be threatened or commenced in the future by any person (including any governmental authority), arising from or similar to the matters alleged in the Private Litigation and Enforcement Actions, including without limitation expenses related to the defense of, service as a witness in, or monitoring of such proceedings or actions; |
| | 2. | all liabilities and reasonable legal and other expenses incurred by any Independent Trustee in connection with any judgment resulting from, or settlement of, any such proceeding, action or matter; |
| | 3. | any loss or reasonable legal and other expenses incurred by any Independent Trustee as a result of the denial of, or dispute about, any insurance claim under, or actual or purported rescission or termination of, any policy of insurance arranged by the Adviser (or by a representative of the Adviser acting as such, acting as a representative of the Registrant or of the Independent Trustees or acting otherwise) for the benefit of the Independent Trustee, to the extent that such denial, dispute or rescission is based in whole or in part upon any alleged misrepresentation made in the application for such policy or any other alleged improper conduct on the part of the Adviser, any of its corporate affiliates, or any of their directors, officers or employees; |
| | 4. | any loss or reasonable legal and other expenses incurred by any Independent Trustee, whether or not such loss or expense is incurred with respect to a Covered Matter, which is otherwise covered under the terms of any specified policy of insurance, but for which the Independent Trustee is unable to obtain advancement of expenses or indemnification under that policy of insurance, due to the exhaustion of policy limits which is due in whole or in part to the Adviser or any affiliate thereof having received advancement of expenses or indemnification under that policy for or with respect to any Covered Matter; provided, that the total amount that the Adviser will be obligated to pay under this provision for all loss or expense shall not exceed the amount that the Adviser and any of its affiliates actually receive under that policy of insurance for or with respect to any and all Covered Matters; and |
| | 5. | all liabilities and reasonable legal and other expenses incurred by any Independent Trustee in connection with any proceeding or action to enforce his or her rights under the agreement, unless the Adviser prevails on the merits of any such dispute in a final, nonappealable court order. |
The Adviser is not required to pay costs or expenses or provide indemnification to or for any individual Independent Trustee (i) with respect to any particular proceeding or action as to which the board of Trustees of the Registrant has determined that such Independent Trustee ultimately would not be entitled to indemnification with respect thereto, or (ii) for any liability of the Independent Trustee to the Registrant or its shareholders to which such Independent Trustee would otherwise be subject by reason of willful misfeasance, bad faith, gross negligence, or reckless disregard of the Independent Trustee’s duties as a trustee of the Registrant as determined in a final adjudication in such proceeding or action. In addition, to the extent that the Adviser has paid costs or expenses under the agreement to any individual Independent Trustee with respect to a particular proceeding or action, and there is a final adjudication in such proceeding or action of the Independent Trustee’s liability to the Registrant or its shareholders by reason of willful misfeasance, bad faith, gross negligence, or reckless disregard of the Independent Trustee’s duties as a trustee of the Registrant, such Independent Trustee has undertaken to repay such costs or expenses to the Adviser.
Item 16. Exhibits
| | | | |
| |
| (1)(a) | | Amended and Restated Declaration of Trust dated June 2, 2008 is incorporated by reference to the Registrant’s registration statement on Form N-14 (File No. 333-156991) filed January 28, 2009. |
| |
| (1)(b) | | Amended and Restated Establishment and Designation of Series and Classes of Shares of Beneficial Interest, with $0.01 Par Value, dated January 22, 2009, is incorporated by reference to Post-Effective Amendment No. 46 to the Registrant Statement as filed on April 30, 2009. |
| |
| (2) | | Amended and Restated By-laws dated April 1, 2008 are incorporated by reference to the Registrant’s registration statement on Form N-14 (File No. 333-156991) filed January 28, 2009. |
| |
| (3) | | Not applicable. |
| |
| (4) | | Form of Agreement and Plan of Reorganization constitutes Appendix B to Part A hereof. |
| | |
| (5) | | (a) | | Articles V, VI, and VII and Sections 4.1 and 4.2 of the Amended and Restated Declaration of Trust included in response to Item 16(1) of this Part C. |
| | |
| | (b) | | Articles 8 and 9 of the Amended and Restated Bylaws of the Registrant included in response to Item 16(2) of this Part C. |
| |
| (6) | | Amended and Restated Investment Management Agreement between the Registrant and Deutsche Investment Management Americas Inc. dated June 1, 2006 is incorporated by reference to Post-Effective Amendment No. 42 to the Registration Statement as filed on April 30, 2007. |
| |
| (7) | | Master Distribution Agreement between the Registrant and DWS Investments Distributors, Inc., dated January 13, 2010, is incorporated by reference to Post-Effective Amendment No. 47 to the Registration Statement as filed on March 2, 2010. |
| |
| (8) | | Not applicable. |
| | |
| (9) | | (a) | | Master Custodian Agreement between the Registrant and State Street Bank and Trust Company dated November 17, 2008 is incorporated by reference to the Registrant’s registration statement on Form N-14 (File No. 333-156991) filed January 28, 2009. |
| | |
| | (b) | | Amended and Restated Global Custody Agreement between the Registrant and JPMorgan, dated September 29, 2008 as amended and restated October 17,2008,is incorporated by reference to Post-Effective Amendment No. 46 to the Registration Statement as filed on April 30, 2009. |
| | |
| (10) | | (a) | | Form of DWS Funds Amended and Restated Multi-Distribution System Plan, pursuant to Rule 18f-3, is incorporated by reference to Post-Effective Amendment No. 46 to the Registration Statement as filed on April 30, 2009. |
| | |
| | (b) | | Master Distribution Plan for Class B shares pursuant to Rule 12b-1, as amended September 30, 2002, is incorporated by reference to Post-Effective Amendment No. 35 to the Registration Statement filed on April 30, 2003. |
| | |
| | (c) | | Master Distribution Plan for Class B shares pursuant to Rule 12b-1 dated February 9, 1996 is incorporated by reference to Post-Effective Amendment No. 22 to the Registration Statement filed on April 30, 1997. |
| | | | |
| |
| (11) | | Opinion of Ropes & Gray LLP, including consent, is filed herein. |
| |
| (12) | | Form of Opinion and Consent of Willkie Farr & Gallagher LLP as to tax matters, is filed herein. |
| | |
| (13) | | (a) | | Amended and Restated Administrative Services Agreement dated October 1, 2008 is incorporated by reference to the Registrant’s registration statement on Form N-14 (File No. 333-156991) filed January 28, 2009. |
| | |
| | (b) | | Form of Participation Agreement, filed herein. |
| | |
| | (c) | | Letter of Indemnity to the Scudder Funds dated October 13, 2004 is incorporated by reference to Post-Effective Amendment No. 40 to the Registration Statement filed on March 2, 2006. |
| | |
| | (d) | | Letter of Indemnity to the Scudder Funds dated October 13, 2004 is incorporated by reference to Post-Effective Amendment No. 40 to the Registration Statement filed on March 2, 2006. |
| | |
| | (e) | | Letter of Indemnity to the Independent Trustees dated October 13, 2004 is incorporated by reference to Post-Effective Amendment No. 40 to the Registration Statement filed on March 2, 2006. |
| | |
| | (f) | | Agency Agreement, dated May 1 2001, between the Registrant and Scudder Investments Service Company is incorporated by reference to Post-Effective Amendment No. 42 to the Registration Statement filed on April 30, 2007. |
| | |
| | (g) | | Amendment No. 1, dated June 11, 2002, to the Agency Agreement dated May 1 2001 is incorporated by reference to Post-Effective Amendment No. 42 to the Registration Statement filed on April 30, 2007. |
| | |
| | (h) | | Agency Agreement Fee Schedule dated February 1, 2009 is incorporated by reference to Post-Effective Amendment No. 46 to the Registration Statement filed on April 30, 2009. |
| | |
| | (i) | | Form of Mutual Fund Rule 22c-2 Information Sharing Agreement between DWS Scudder Distributors, Inc. and certain financial intermediaries is filed herein. |
| | |
| | (j) | | Form of Expense Limitation Agreement between the Registrant and Deutsche Investment Management Americas Inc. is filed herein. |
| | |
| (14) | | (a) | | Consent of PricewaterhouseCoopers LLP, Independent Registered Public Accounting Firm, is filed herein. |
| | |
| | (b) | | Consent of Ernst & Young, Independent Registered Public Accounting Firm, is filed herein. |
| |
| (15) | | Not Applicable. |
| |
| (16) | | Power of Attorney is incorporated by reference to the Registrant’s registration statement on Form N-14 (File No. 333-171876) filed January 26, 2011. |
| |
| (17) | | Not Applicable. |
Item 17. Undertakings
| (1) | The undersigned Registrant agrees that prior to any public reoffering of the securities registered through the use of a prospectus which is a part of this registration statement by any person or party who is deemed to be an underwriter within the meaning of Rule 145(c) of the Securities Act of 1933, the reoffering prospectus |
| | will contain the information called for by the applicable registration form for reofferings by persons who may be deemed underwriters, in addition to the information called for by the other items of the applicable form. |
| (2) | The undersigned Registrant agrees that every prospectus that is filed under paragraph (1) above will be filed as a part of an amendment to the Registration Statement and will not be used until the amendment is effective, and that, in determining any liability under the Securities Act of 1933, each post-effective amendment shall be deemed to be a new registration statement for the securities offered therein, and the offering of the securities at that time shall be deemed to be the initial bona fide offering of them. |
SIGNATURES
As required by the Securities Act of 1933, this Registration Statement has been signed on behalf of the registrant, in the city of New York, and State of New York, on the 28th day of February 2011.
| | |
| DWS VARIABLE SERIES I |
| |
| By: | | /s/ Michael G. Clark |
| | Michael G. Clark |
As required by the Securities Act of 1933, this Registration Statement has been signed below by the following persons in the capacities indicated on February 28, 2011.
| | | | |
SIGNATURE | | TITLE | | DATE |
| | |
/s/ Michael G. Clark | | | | |
| Michael G. Clark | | President | | February 28, 2011 |
| | |
/s/ Paul H. Schubert | | | | |
| Paul H. Schubert | | Chief Financial Officer and Treasurer | | February 28, 2011 |
| | |
/s/ John W. Ballantine | | | | |
| John W. Ballantine* | | Trustee | | February 28, 2011 |
| | |
/s/ Henry P. Becton, Jr. | | | | |
| Henry P. Becton, Jr.* | | Trustee | | February 28, 2011 |
| | |
/s/ Dawn-Marie Driscoll | | | | |
| Dawn-Marie Driscoll* | | Trustee | | February 28, 2011 |
| | |
/s/ Keith R. Fox | | | | |
| Keith R. Fox* | | Trustee | | February 28, 2011 |
| | |
/s/ Paul K. Freeman | | | | |
| Paul K. Freeman* | | Chairperson and Trustee | | February 28, 2011 |
| | |
/s/ Kenneth C. Froewiss | | | | |
| Kenneth C. Froewiss* | | Trustee | | February 28, 2011 |
| | |
/s/ Richard J. Herring | | | | |
| Richard J. Herring* | | Trustee | | February 28, 2011 |
| | |
/s/ William McClayton | | | | |
| William McClayton* | | Trustee | | February 28, 2011 |
| | |
/s/ Rebecca W. Rimel | | | | |
| Rebecca W. Rimel* | | Trustee | | February 28, 2011 |
| | |
/s/ William N. Searcy, Jr. | | | | |
| William N. Searcy, Jr.* | | Trustee | | February 28, 2011 |
| | | | |
| | |
/s/ Jean Gleason Stromberg | | | | |
| Jean Gleason Stromberg* | | Trustee | | February 28, 2011 |
| | |
/s/ Robert H. Wadsworth | | | | |
| Robert H. Wadsworth* | | Trustee | | February 28, 2011 |
| | |
| *By: | | /s/ John Millette |
| | John Millette** |
| ** | Attorney-in-fact pursuant to the power of attorney that is incorporated herein by reference to the Registration Statement as Exhibit 16 on Form N-14 as filed with the Commission on January 26, 2011. |
2
INDEX OF EXHIBITS
| | |
EXHIBIT
NUMBER | | EXHIBIT TITLE |
| |
| (11) | | Opinion of Ropes & Gray LLP, including consent |
| |
| (12) | | Form of Opinion and Consent of Willkie Farr & Gallagher LLP as to tax matters |
| |
| (13)(b) | | Form of Participation Agreement |
| |
| (13)(i) | | Form of Mutual Fund Rule 22c-2 Information Sharing Agreement |
| |
| (13)(j) | | Form of Expense Limitation Agreement |
| |
| (14)(a) | | Consent of PricewaterhouseCoopers LLP, Independent Registered Public Accounting Firm |
| |
| (14)(b) | | Consent of Ernst & Young, Independent Registered Public Accounting Firm |