UNITED STATES
SECURITIES AND EXCHANGE COMMISSION
SECURITIES AND EXCHANGE COMMISSION
Washington, D.C. 20549
FORM N-CSR
CERTIFIED SHAREHOLDER REPORT OF REGISTERED
MANAGEMENT INVESTMENT COMPANIES
MANAGEMENT INVESTMENT COMPANIES
Investment Company Act File Number 811-4260
RIVERSOURCE GOVERNMENT INCOME SERIES, INC.
(Exact name of registrant as specified in charter)
50606 Ameriprise Financial Center, Minneapolis, Minnesota 55474
(Address of principal executive offices) (Zip code)
Scott R. Plummer — 5228 Ameriprise Financial Center, Minneapolis, MN 55474
(Name and address of agent for service)
Registrant’s telephone number, including area code: (612) 671-1947
Date of fiscal year end: May 31
Date of reporting period: May 31, 2011
| Item 1. | Reports to Stockholders. |
Annual Report
Annual Report

RiverSource
Short Duration U.S. Government Fund
Annual Report for the Period Ended
May 31, 2011
RiverSource Short Duration U. S. Government Fund seeks to provide shareholders with a high level of current income and safety of principal consistent with investment in U.S. government and government agency securities.
Not FDIC insured - No bank guarantee - May lose value
Table of Contents
| Your Fund at a Glance | 3 | |||
| Manager Commentary | 4 | |||
| The Fund’s Long-term Performance | 10 | |||
| Fund Expenses Example | 12 | |||
| Portfolio of Investments | 14 | |||
| Statement of Assets and Liabilities | 24 | |||
| Statement of Operations | 25 | |||
| Statement of Changes in Net Assets | 26 | |||
| Financial Highlights | 28 | |||
| Notes to Financial Statements | 35 | |||
| Report of Independent Registered Public Accounting Firm | 53 | |||
| Federal Income Tax Information | 55 | |||
| Board Members and Officers | 56 | |||
| Proxy Voting | 64 | |||
| Approval of Investment Management Services Agreement | 64 | |||
| Results of Meeting of Shareholders | 68 |
In August 2010, the Board of Directors of RiverSource Short Duration U.S. Government Fund (the Fund) approved a proposal to merge the Fund with and into Columbia Short Term Bond Fund. The proposal was approved at a meeting of shareholders held on February 15, 2011 and the merger of the Fund occurred after the close of business on June 3, 2011. For more information, see “Results of Meeting of Shareholders.”
See the Fund’s prospectus for risks associated with investing in the Fund.
2 RIVERSOURCE SHORT DURATION U.S. GOVERNMENT FUND — 2011 ANNUAL REPORT
Your Fund at a Glance
AVERAGE ANNUAL TOTAL RETURNS
| at May 31, 2011 | ||||||||||||||||||||
| Since | ||||||||||||||||||||
| Without sales charge | 1 year | 3 years | 5 years | 10 years | inception* | |||||||||||||||
Class A (inception 8/19/95) | +2.56 | % | +2.74 | % | +3.51 | % | +3.08 | % | N/A | |||||||||||
Class B (inception 3/20/95) | +1.77 | % | +1.95 | % | +2.73 | % | +2.30 | % | N/A | |||||||||||
Class C (inception 6/26/00) | +1.79 | % | +1.96 | % | +2.74 | % | +2.31 | % | N/A | |||||||||||
Class I (inception 3/4/04) | +2.97 | % | +3.13 | % | +3.86 | % | N/A | +3.04 | % | |||||||||||
Class R (inception 8/3/09) | +2.38 | % | N/A | N/A | N/A | +3.21 | % | |||||||||||||
Class R4 (inception 3/20/95) | +2.67 | % | +2.84 | % | +3.64 | % | +3.23 | % | N/A | |||||||||||
Class W (inception 12/1/06) | +2.66 | % | +2.65 | % | N/A | N/A | +3.02 | % | ||||||||||||
With sales charge | ||||||||||||||||||||
Class A (inception 8/19/95) | -0.58 | +1.67 | % | +2.91 | % | +2.76 | % | N/A | ||||||||||||
Class B (inception 3/20/95) | -3.23 | % | +0.98 | % | +2.37 | % | +2.30 | % | N/A | |||||||||||
Class C (inception 6/26/00) | +0.79 | % | +1.96 | % | +2.74 | % | +2.31 | % | N/A | |||||||||||
The “Without sales charge” returns for Class A, Class B and Class C shares do not include applicable initial or contingent deferred sales charges. If included, returns would be lower than those shown. The “With sales charge” returns for Class A, Class B and Class C shares include: the maximum initial sales charge of 3.00% for Class A shares; the applicable contingent deferred sales charge (CDSC) for Class B shares (applied as follows: first year 5%; second year 4%; third and fourth years 3%; fifth year 2%; sixth year 1%; no sales charge thereafter); and a 1% CDSC for Class C shares sold within one year after purchase. The Fund’s other share classes are not subject to sales charges and have limited eligibility. See the Fund’s prospectus for details.
| * | For classes with less than 10 years performance. |
RIVERSOURCE SHORT DURATION U.S. GOVERNMENT FUND — 2011 ANNUAL REPORT 3
Manager Commentary
Effective Oct. 1, 2010, Leonard Aplet, Gregory Liechty and Ronald Stahl took over the day-to-day management of RiverSource Short Duration U.S. Government Fund from Jason Callan, Tom Heuer and Colin Lundgren.
Dear Shareholders,
RiverSource Short Duration U.S. Government Fund (the Fund) Class A shares rose 2.56% (excluding sales charge) for the 12 months ended May 31, 2011. The Fund outperformed its benchmark, the Barclays Capital U.S. 1-3 Year Government Index (Barclays Capital Index), which gained 1.85% during the same period. The Fund also outperformed the Lipper Short U.S. Government Funds Index, representing the Fund’s peer group, which advanced 2.20% during the same 12-month period.
PORTFOLIO BREAKDOWN(1) (at May 31, 2011)
| Asset-Backed Securities | 4.3 | % | ||
| Banking | 4.2 | |||
| Commercial Mortgage-Backed Securities — Agency | 18.3 | |||
| Commercial Mortgage-Backed Securities | 0.7 | |||
| Foreign Government Obligations | 0.7 | |||
| Life Insurance | 0.5 | |||
| Non-Captive Diversified | 0.9 | |||
Residential Mortgage-Backed Securities(2) | 32.9 | |||
| Technology | 0.7 | |||
| U.S. Government Agencies | 11.4 | |||
| U.S. Government Obligations & Agencies | 22.7 | |||
| Wirelines | 0.6 | |||
Other(3) | 2.1 | |||
| (1) | Portfolio holdings include industry sectors that can be comprised of securities in several industries. Please refer to the section entitled “Portfolio of Investments” for a complete listing. No single industry exceeded 25% of portfolio assets. | |
| Percentages indicated are based upon total investments. The Fund’s composition is subject to change. | ||
| (2) | Of the 32.9%, 0.99% is due to forward commitment residential mortgage-backed securities activity. Short-term securities are held as collateral for these commitments. | |
| (3) | Cash & Cash Equivalents. |
4 RIVERSOURCE SHORT DURATION U.S. GOVERNMENT FUND — 2011 ANNUAL REPORT
Significant performance factors
The broad fixed income market churned out a respectable return during the annual period ended May 31, 2011, experiencing modest price gains amidst an environment of declining interest rates. Within the broad fixed income market, U.S. government securities generated positive returns, as U.S. Treasury rates declined during the annual period. More specifically, the yield on the three-month Treasury bill fell 0.11% to 0.05%, while the yield on the five-year Treasury fell 0.39% to 1.70%. The three-year maturity segment of the short-term end of the yield curve performed best, with yields falling 0.45% to 0.78%. During the annual period, the short-term end of the yield curve, or spectrum of maturities, flattened, meaning the differential in yields between shorter and longer term maturities narrowed. Non-Treasury sectors generally outperformed U.S. Treasuries during the annual period. In addition to the interest rate declines, the prices of non-U.S. Treasury bonds were boosted by a tightening in the spread, or difference in yield, between these securities and similar-duration U.S. Treasuries. This price appreciation was most pronounced during the annual period in the commercial mortgage-backed securities and corporate bond sectors. Within the corporate bond sector, the securities of issuers within the financials industry and lower-rated issuers
QUALITY BREAKDOWN(1) (at May 31, 2011)
| AAA bonds | 89.9 | % | ||
| AA bonds | 4.4 | |||
| A bonds | 4.8 | |||
| BBB bonds | 0.9 | |||
| Non-investment grade bonds | 0.0 | * | ||
| * | Rounds to less than 0.1%. | |
| (1) | Percentages indicated are based upon total fixed income securities. |
Ratings apply to the underlying holdings of the Fund and not the Fund itself. Whenever possible, the Standard and Poor’s rating is used to determine the credit quality of a security. Standard and Poor’s rates the creditworthiness of corporate bonds, with 15 categories, ranging from AAA (highest) to D (lowest). Ratings from AA to CCC may be modified by the addition of a plus (+) or minus (−) sign to show relative standing within the major rating categories. If Standard and Poor’s doesn’t rate a security, then Moody’s rating is used. Columbia Management Investment Advisers, LLC (the Investment Manager) rates a security using an internal rating system when Moody’s doesn’t provide a rating.
RIVERSOURCE SHORT DURATION U.S. GOVERNMENT FUND — 2011 ANNUAL REPORT 5
Manager Commentary (continued)
performed best. (Remember, there is usually an inverse relationship between bond prices and yield movements, so that bond prices rise when yields decline and vice versa.)
Monetary policy remained unchanged during the annual period. At its April 27, 2011 meeting, the Federal Reserve Board (the Fed) kept the targeted federal funds rate in a 0.00% to 0.25% range, where it has been since December 2008. At the end of May 2011, the market widely expected the Fed to hold short-term interest rates stable for the remainder of this calendar year. Formally implemented in November 2010, the second round of quantitative easing, known as QE2, wherein the Fed purchased U.S. Treasuries, kept demand for U.S. Treasury securities strong, despite heavy issuance caused by the U.S. government’s fiscal deficit. However, with QE2 scheduled to expire at the end of June 2011, the impact of the winding down of the quantitative easing program on interest rates across the yield curve remained uncertain.
The Fund’s strong performance relative to the Barclays Capital Index can be attributed primarily to its sizable allocations to agency-issued mortgage-backed securities and commercial mortgage-backed securities (CMBS). Both of these segments of the fixed income market outperformed U.S. Treasuries and other bonds issued or guaranteed by the U.S. government and thus also outperformed the Barclays Capital Index during the annual period. Within agency-issued mortgage-backed securities, the Fund’s significant allocation through most of the annual period to 30-year collateral proved particularly beneficial. Within agency-issued commercial mortgage-backed securities, GNMA (Ginnie Mae) Project Loans contributed most positively to the Fund’s results. (GNMA Project Loans are mortgages on multi-family homes or larger projects such as hospitals or nursing homes.) Positions in non-agency mortgage-backed securities and asset-backed securities, although more modest allocations within the Fund, boosted relative results as well.
The Fund also benefited during the annual period from its “barbelled” yield curve positioning. During the annual period, we reduced the Fund’s exposure to the two-year segment of the yield curve and increased its allocation to the three-year and five-year segments of the yield curve. In conjunction with this, we purchased some floating rate agency debentures, thereby creating a “barbell” position. In implementing this strategy, the
6 RIVERSOURCE SHORT DURATION U.S. GOVERNMENT FUND — 2011 ANNUAL REPORT
Fund was able both to take advantage of the steep part of the yield curve and to increase the total return potential from the five-year portion of the yield curve.
The only significant detractor from the Fund’s results during the annual period was its duration positioning. The Fund was positioned shorter than the Barclays Capital Index throughout most of the annual period, which meant less price appreciation than it otherwise would have had. In other words, it would have been more advantageous for the Fund to have a longer duration than the benchmark index when interest rates fell, for, as mentioned, there is an inverse relationship between the change in bond prices and yields, i.e. bond prices generally increase when rates decline and vice versa. However, with interest rates close to historic lows, we felt there was a higher probability of interest rates increasing than decreasing and so kept the Fund’s duration relatively short to preserve shareholder value in the event of a rise in interest rates. What occurred during the annual period instead was that bellwether U.S. Treasury yields actually continued their descent. Duration is a measure of the Fund’s sensitivity to changes in interest rates.
Changes to the Fund’s portfolio
In addition to the changes in yield curve positioning already mentioned, we prudently added to the Fund’s position in GNMA Project Loans through much of the annual period. We correctly anticipated these GNMA securities would outperform U.S. Treasury securities primarily due to their yield advantage combined with the fact that they maintain the full faith and credit guarantee of the U.S. government.
The Fund’s strong performance relative to the Barclays Capital Index can be attributed primarily to its sizable allocations to agency-issued mortgage-backed securities and commercial mortgage-backed securities (CMBS).
RIVERSOURCE SHORT DURATION U.S. GOVERNMENT FUND — 2011 ANNUAL REPORT 7
Manager Commentary (continued)
Within the agency-issued mortgage-backed security sector, we shifted some of the Fund’s exposure from pass-through mortgages to collateralized mortgage obligations (CMOs) for what we considered to be their more stable cash flow, better convexity and lower extension risk profiles. (Pass-through mortgages consist of a pool of residential mortgage loans, where homeowners’ monthly payments of principal, interest and prepayments pass from the original bank through a government agency or investment bank to investors. CMOs are a type of mortgage-backed security that creates separate pools of pass-through rates for different classes of bondholders with varying maturities, called tranches. The repayments from the pool of pass-through securities are used to retire the bonds in the order specified by the bonds’ prospectus. Convexity is a volatility measure for bonds used in conjunction with modified duration in order to measure how the bond’s price will change as interest rates changes. Extension risk is the risk that rising interest rates will slow bond repayments, causing investors owning mortgage-backed or asset-backed securities to find their principal committed for longer time periods than expected. This could cause the value of those bonds to decline. Investors also risk losing some of their reinvestment opportunity to buy new bonds paying higher rates of interest.)
We increased the Fund’s allocation to U.S. Treasury securities, while decreasing its exposure to other government-related securities, such as U.S. agency debentures, as the exposure in the Barclays Capital Index to U.S. Treasuries also increased during the annual period.
The Fund’s portfolio turnover rate for the 12-month period was 214%. A significant portion of the turnover was the result of rolling-maturity mortgage securities, processing of prepayments and opportunistic changes we made at the margin in response to valuations or market developments.
8 RIVERSOURCE SHORT DURATION U.S. GOVERNMENT FUND — 2011 ANNUAL REPORT
Our future strategy
Effective June 3, 2011, the Fund merged with the Columbia Short Term Bond Fund. The benchmark index of the Columbia Short Term Bond Fund, which seeks current income, consistent with minimal fluctuation of principal, is the Barclays Capital 1-3 Year Government/Credit Index. The Columbia Short Term Bond Fund is managed by the same team that managed the RiverSource Short Duration U.S. Government Fund.
| Leonard A. Aplet Portfolio Manager | Gregory S. Liechty Portfolio Manager | Ronald B. Stahl Portfolio Manager |
Any specific securities mentioned are for illustrative purposes only and are not a complete list of securities that have increased or decreased in value. The views expressed in this statement reflect those of the portfolio manager(s) only through the end of the period of the report as stated on the cover and do not necessarily represent the views of Columbia Management Investment Advisers, LLC (the Investment Manager) or any subadviser to the Fund or any other person in the Investment Manager or subadviser organizations. Any such views are subject to change at any time based upon market or other conditions and the Investment Manager disclaims any responsibility to update such views. These views may not be relied on as investment advice and, because investment decisions for the Fund are based on numerous factors, may not be relied on as an indication of trading intent on behalf of the Fund.
RIVERSOURCE SHORT DURATION U.S. GOVERNMENT FUND — 2011 ANNUAL REPORT 9
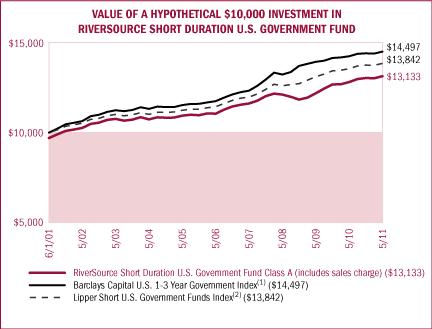
The Fund’s Long-term Performance
The chart on the facing page illustrates the total value of an assumed $10,000 investment in RiverSource Short Duration U.S. Government Fund Class A shares (from 6/1/01 to 5/31/11) as compared to the performance of the Barclays Capital U.S. 1-3 Year Government Index and the Lipper Short U.S. Government Funds Index. In comparing the Fund’s Class A shares to these indices, you should take into account the fact that the Fund’s performance reflects the maximum initial sales charge of 3.00%, while such charges are not reflected in the performance of the indices. Returns for the Fund include the reinvestment of any distributions paid during each period.
The performance information shown represents past performance and is not a guarantee of future results. The table below and the chart on the facing page do not reflect the deduction of taxes that a shareholder would pay on fund distributions or the redemption of fund shares. The investment return and principal value of your investment will fluctuate so that your shares, when redeemed, may be worth more or less than their original cost. Current performance may be lower or higher than the performance information shown. You may obtain performance information current to the most recent month-end by contacting your financial intermediary or visiting columbiamanagement.com. Also see “Past Performance” in the Fund’s current prospectus.
COMPARATIVE RESULTS
| Results at May 31, 2011 | ||||||||||||||||
| 1 year | 3 years | 5 years | 10 years | |||||||||||||
| RiverSource Short Duration U.S. Government Fund (includes sales charge) | ||||||||||||||||
| Class A Cumulative value of $10,000 | $9,942 | $10,511 | $11,540 | $13,133 | ||||||||||||
| Average annual total return | -0.58% | +1.67% | +2.91% | +2.76% | ||||||||||||
Barclays Capital U.S. 1-3 Year Government Index(1) | ||||||||||||||||
| Cumulative value of $10,000 | $10,185 | $10,966 | $12,349 | $14,497 | ||||||||||||
| Average annual total return | +1.85% | +3.12% | +4.31% | +3.79% | ||||||||||||
Lipper Short U.S. Government Funds Index(2) | ||||||||||||||||
| Cumulative value of $10,000 | $10,220 | $10,988 | $12,102 | $13,842 | ||||||||||||
| Average annual total return | +2.20% | +3.19% | +3.89% | +3.31% | ||||||||||||
Results for other share classes can be found on page 3.
10 RIVERSOURCE SHORT DURATION U.S. GOVERNMENT FUND — 2011 ANNUAL REPORT
| (1) | The Barclays Capital U.S. 1-3 Year Government Index, an unmanaged index, is made up of all publicly issued, non-convertible domestic debt of the U.S. government, or agency thereof, or any quasi-federal corporation. The index also includes corporate debt guaranteed by the U.S. government. Only notes and bonds with a minimum maturity of one year up to a maximum maturity of 2.9 years are included. The index reflects reinvestment of all distributions and changes in market prices. | |
| (2) | The Lipper Short U.S. Government Funds Index includes the 30 largest short U.S. government funds tracked by Lipper Inc. The index’s returns include net reinvested dividends. |
RIVERSOURCE SHORT DURATION U.S. GOVERNMENT FUND — 2011 ANNUAL REPORT 11
Fund Expenses Example
(Unaudited)
As a shareholder of the Fund, you incur, depending on the share class, two types of costs: (i) transaction costs, including sales charges (loads) on purchase payments; and (ii) ongoing costs, which may include management fees; distribution and service (Rule 12b-1) fees; and other Fund fees and expenses. This example is intended to help you understand your ongoing costs (in dollars) of investing in the Fund and to compare these costs with the ongoing costs of investing in other mutual funds. In addition to the ongoing expenses which the Fund bears directly, the Fund’s shareholders indirectly bear the ongoing expenses of any funds in which the Fund invests (also referred to as “acquired funds”), including affiliated and non-affiliated pooled investment vehicles (including mutual funds and exchange traded funds). The Fund’s indirect expense from investing in the acquired funds is based on the Fund’s pro rata portion of the ongoing expenses charged by acquired funds using the expense ratio of each of the acquired funds as of the acquired fund’s most recent shareholder report.
The example is based on an investment of $1,000 invested at the beginning of the period indicated and held until May 31, 2011.
Actual Expenses
The first line of the table provides information about actual account values and actual expenses for each class. You may use the information in this line, together with the amount you invested, to estimate the expenses that you paid over the period. Simply divide your account value by $1,000 (for example, an $8,600 account value divided by $1,000 = 8.6), then multiply the result by the number in the first line under the heading titled “Expenses paid during the period” to estimate the expenses you paid on your account during this period.
Hypothetical Example for Comparison Purposes
The second line of the table provides information about hypothetical account values and hypothetical expenses based on the actual expense ratio for each class and an assumed rate of return of 5% per year before expenses, which is not the actual return for the class. The hypothetical account values and expenses may not be used to estimate the actual ending account balance or expenses you paid for the period. You may use this information to compare the ongoing costs of investing in the Fund and other funds. To do so, compare this 5% hypothetical example with the 5% hypothetical examples that appear in the shareholder reports of the other funds.
Please note that the expenses shown in the table are meant to highlight your ongoing costs only and do not reflect any transactional costs, such as sales charges (loads). Therefore, the second line of the table is useful in comparing ongoing costs only, and will not help you determine the relative total costs of owning different funds. In addition, if these transactional costs were included, your costs would have been higher.
12 RIVERSOURCE SHORT DURATION U.S. GOVERNMENT FUND — 2011 ANNUAL REPORT
| Beginning | Ending | Expenses | ||||||||||||||
| Account Value | Account Value | Paid During | Annualized | |||||||||||||
| Dec. 1, 2010 | May 31, 2011 | the Period(a) | Expense Ratio | |||||||||||||
| Class A | ||||||||||||||||
Actual(b) | $ | 1,000 | $ | 1,007.70 | $ | 4.56 | .91% | |||||||||
| Hypothetical (5% return before expenses) | $ | 1,000 | $ | 1,020.39 | $ | 4.58 | .91% | |||||||||
| Class B | ||||||||||||||||
Actual(b) | $ | 1,000 | $ | 1,001.80 | $ | 8.28 | 1.66% | |||||||||
| Hypothetical (5% return before expenses) | $ | 1,000 | $ | 1,016.65 | $ | 8.35 | 1.66% | |||||||||
| Class C | ||||||||||||||||
Actual(b) | $ | 1,000 | $ | 1,004.00 | $ | 8.29 | 1.66% | |||||||||
| Hypothetical (5% return before expenses) | $ | 1,000 | $ | 1,016.65 | $ | 8.35 | 1.66% | |||||||||
| Class I | ||||||||||||||||
Actual(b) | $ | 1,000 | $ | 1,007.60 | $ | 2.55 | .51% | |||||||||
| Hypothetical (5% return before expenses) | $ | 1,000 | $ | 1,022.39 | $ | 2.57 | .51% | |||||||||
| Class R | ||||||||||||||||
Actual(b) | $ | 1,000 | $ | 1,007.60 | $ | 4.70 | .94% | |||||||||
| Hypothetical (5% return before expenses) | $ | 1,000 | $ | 1,020.24 | $ | 4.73 | .94% | |||||||||
| Class R4 | ||||||||||||||||
Actual(b) | $ | 1,000 | $ | 1,008.20 | $ | 4.06 | .81% | |||||||||
| Hypothetical (5% return before expenses) | $ | 1,000 | $ | 1,020.89 | $ | 4.08 | .81% | |||||||||
| Class W | ||||||||||||||||
Actual(b) | $ | 1,000 | $ | 1,006.50 | $ | 3.70 | .74% | |||||||||
| Hypothetical (5% return before expenses) | $ | 1,000 | $ | 1,021.24 | $ | 3.73 | .74% | |||||||||
| (a) | Expenses are equal to the annualized expense ratio for each class as indicated above, multiplied by the average account value over the period, multiplied by 182/365 (to reflect the one-half year period). | |
| (b) | Based on the actual return for the six months ended May 31, 2011: +0.77% for Class A, +0.18% for Class B, +0.40% for Class C, +0.76% for Class I, +0.76% for Class R, +0.82% for Class R4 and +0.65% for Class W. |
RIVERSOURCE SHORT DURATION U.S. GOVERNMENT FUND — 2011 ANNUAL REPORT 13
Portfolio of Investments
May 31, 2011
(Percentages represent value of investments compared to net assets)
Investments in Securities
| Bonds (87.7%) | ||||||||||
| Coupon | Principal | |||||||||
| Issuer | Rate | Amount | Value(a) | |||||||
| Foreign Local Government (0.7%) | ||||||||||
| Province of Ontario Senior Unsecured | ||||||||||
| 06-16-14 | 4.100 | % | $3,500,000 | (c) | $3,805,547 | |||||
U.S. Government Obligations & Agencies (23.0%) | ||||||||||
| Federal Farm Credit Bank | ||||||||||
| 08-22-13 | 0.215 | 6,000,000 | (h) | 6,002,394 | ||||||
| 04-21-14 | 0.226 | 6,000,000 | (h) | 5,993,736 | ||||||
| Federal Home Loan Mortgage Corp. | ||||||||||
| 01-10-13 | 0.290 | 12,000,000 | (h) | 11,999,998 | ||||||
| 01-24-13 | 0.270 | 6,000,000 | (h) | 5,998,997 | ||||||
| Federal National Mortgage Association | ||||||||||
| 02-01-13 | 0.400 | 6,000,000 | (h) | 6,005,262 | ||||||
| 03-04-14 | 0.266 | 12,000,000 | (h) | 12,000,181 | ||||||
| 10-26-15 | 1.625 | 22,000,000 | 22,032,098 | |||||||
| U.S. Treasury | ||||||||||
| 05-31-12 | 0.750 | 33,000,000 | 33,171,600 | |||||||
| 01-31-16 | 2.000 | 20,000,000 | 20,420,320 | |||||||
| U.S. Treasury Inflation-Indexed Bond | ||||||||||
| 04-15-14 | 1.250 | 5,277,950 | (e) | 5,635,149 | ||||||
| Total | 129,259,735 | |||||||||
Asset-Backed (4.3%) | ||||||||||
Access Group, Inc. Series 2005-1 Class A1 | ||||||||||
| 06-22-18 | 0.389 | 868,493 | (h) | 868,043 | ||||||
Bear Stearns Asset-Backed Securities Trust Series 2006-HE9 Class 1A1 | ||||||||||
| 11-25-36 | 0.244 | 411,720 | (h) | 403,109 | ||||||
Carrington Mortgage Loan Trust Series 2006-RFC1 Class A2 | ||||||||||
| 05-25-36 | 0.294 | 1,892,226 | (h) | 1,838,647 | ||||||
Citigroup Mortgage Loan Trust, Inc. Series 2006-WFH4 Class A2 | ||||||||||
| 11-25-36 | 0.294 | 862,814 | (h) | 849,067 | ||||||
Countrywide Asset-Backed Certificates Series 2005-SD1 Class A1C | ||||||||||
| 05-25-35 | 0.584 | 765,535 | (d)(h) | 737,385 | ||||||
Credit-Based Asset Servicing and Securitization LLC Series 2006-CB6 Class A22 | ||||||||||
| 07-25-36 | 0.284 | 37,702 | (h) | 37,645 | ||||||
Morgan Stanley ABS Capital I Series 2005-WMC5 Class M2 | ||||||||||
| 06-25-35 | 0.674 | 1,637,325 | (h) | 1,604,622 | ||||||
Morgan Stanley ABS Capital I Series 2006-WMC1 Class A2B | ||||||||||
| 12-25-35 | 0.394 | 998,251 | (h) | 961,287 | ||||||
RBSSP Resecuritization Trust CMO Series 20091-10 Class 4A1 | ||||||||||
| 07-26-36 | 0.344 | 1,857,681 | (d)(h) | 1,833,875 | ||||||
RBSSP Resecuritization Trust CMO Series 2009-10 Class 7A1 | ||||||||||
| 03-26-37 | 0.294 | 44,585 | (d)(h) | 44,486 | ||||||
RBSSP Resecuritization Trust CMO Series 2009-11 Class 2A1 | ||||||||||
| 04-26-36 | 0.344 | 3,421,826 | (d)(h) | 3,356,637 | ||||||
RBSSP Resecuritization Trust CMO Series 2009-13 Class 8A1 | ||||||||||
| 06-26-37 | 0.944 | 3,439,843 | (d)(h) | 3,401,417 | ||||||
Residential Asset Mortgage Products, Inc. Series 2004-RS8 Class AI4 | ||||||||||
| 06-25-32 | 5.060 | 1,031,744 | 1,025,796 | |||||||
Sierra Receivables Funding Co. LLC Series 2010-2A Class A | ||||||||||
| 11-20-25 | 3.840 | 1,652,191 | (d) | 1,663,475 | ||||||
Small Business Administration Series 2002-P10B Class 1 | ||||||||||
| 08-10-12 | 5.199 | 181,319 | 188,781 | |||||||
Specialty Underwriting & Residential Finance Series 2005-BC3 Class M1 | ||||||||||
| 06-25-36 | 0.644 | 4,500,000 | (h) | 4,235,909 | ||||||
Structured Asset Investment Loan Trust Series 2005-9 Class A5 | ||||||||||
| 11-25-35 | 0.424 | 751,463 | (h) | 739,841 | ||||||
Structured Asset Securities Corp. CMO Series 2006-NC1 Class A6 | ||||||||||
| 05-25-36 | 0.244 | 300,466 | (h) | 297,358 | ||||||
See accompanying Notes to Portfolio of Investments.
14 RIVERSOURCE SHORT DURATION U.S. GOVERNMENT FUND — 2011 ANNUAL REPORT
| Bonds (continued) | ||||||||||
| Coupon | Principal | |||||||||
| Issuer | Rate | Amount | Value(a) | |||||||
Asset-Backed (cont.) | ||||||||||
Structured Asset Securities Corp. Series 2007-WF2 Class A2 | ||||||||||
| 08-25-37 | 0.894 | % | $91,927 | (h) | $91,685 | |||||
| Total | 24,179,065 | |||||||||
Commercial Mortgage-Backed — Agency (18.6%)(f) | ||||||||||
| Federal Home Loan Mortgage Corp. Multifamily Structured Pass-Through Certificates CMO Series K001 Class A2 | ||||||||||
| 04-25-16 | 5.651 | 3,775,881 | 4,085,531 | |||||||
| Federal Home Loan Mortgage Corp. Multifamily Structured Pass-Through Certificates CMO Series K003 Class A1 | ||||||||||
| 07-25-13 | 2.225 | 3,746,589 | 3,788,851 | |||||||
Federal National Mortgage Association CMO Series 2010-M4 Class A1 | ||||||||||
| 06-25-20 | 2.520 | 2,626,092 | 2,656,312 | |||||||
Government National Mortgage Association CMO 2011-16 Class A | ||||||||||
| 11-16-34 | 2.210 | 6,062,111 | 6,160,525 | |||||||
Government National Mortgage Association CMO Series 2009-105 Class A | ||||||||||
| 12-16-50 | 3.456 | 6,998,530 | 7,296,282 | |||||||
Government National Mortgage Association CMO Series 2009-114 Class A | ||||||||||
| 12-16-38 | 3.103 | 6,952,737 | 7,163,764 | |||||||
Government National Mortgage Association CMO Series 2009-63 Class A | ||||||||||
| 01-16-38 | 3.400 | 4,674,861 | 4,876,140 | |||||||
Government National Mortgage Association CMO Series 2009-71 Class A | ||||||||||
| 04-16-38 | 3.304 | 6,913,639 | 7,156,697 | |||||||
Government National Mortgage Association CMO Series 2009-90 Class AC | ||||||||||
| 01-16-33 | 3.137 | 5,400,000 | 5,609,089 | |||||||
Government National Mortgage Association CMO Series 2010-13 Class A | ||||||||||
| 08-16-22 | 2.461 | 4,383,503 | 4,440,074 | |||||||
Government National Mortgage Association CMO Series 2010-141 Class A | ||||||||||
| 08-16-31 | 1.864 | 4,713,339 | 4,748,786 | |||||||
Government National Mortgage Association CMO Series 2010-159 Class A | ||||||||||
| 01-16-33 | 2.159 | 4,646,687 | 4,707,408 | |||||||
Government National Mortgage Association CMO Series 2010-161 Class AB | ||||||||||
| 05-16-35 | 2.110 | 3,957,328 | 4,007,971 | |||||||
Government National Mortgage Association CMO Series 2010-18 Class A | ||||||||||
| 12-16-50 | 3.100 | 4,892,104 | 5,071,861 | |||||||
Government National Mortgage Association CMO Series 2010-22 Class AC | ||||||||||
| 12-16-30 | 2.229 | 3,695,571 | 3,760,597 | |||||||
Government National Mortgage Association CMO Series 2010-49 Class A | ||||||||||
| 03-16-51 | 2.870 | 1,268,542 | 1,317,353 | |||||||
Government National Mortgage Association CMO Series 2010-65 Class A | ||||||||||
| 11-16-28 | 2.017 | 3,574,022 | 3,609,912 | |||||||
Government National Mortgage Association CMO Series 2010-83 Class A | ||||||||||
| 10-16-50 | 2.021 | 4,360,803 | 4,401,222 | |||||||
Government National Mortgage Association CMO Series 2011-1 Class A | ||||||||||
| 12-16-31 | 2.239 | 5,942,671 | 6,043,289 | |||||||
Government National Mortgage Association CMO Series 2011-31 Class A | ||||||||||
| 12-16-35 | 2.210 | 5,926,771 | 6,018,105 | |||||||
Government National Mortgage Association CMO Series 2011-20 Class A | ||||||||||
| 04-16-32 | 1.883 | 7,316,016 | 7,376,256 | |||||||
| Total | 104,296,025 | |||||||||
Commercial Mortgage-Backed (0.8%)(f) | ||||||||||
Bear Stearns Commercial Mortgage Securities Series 2004-PWR6 Class A4 | ||||||||||
| 11-11-41 | 4.521 | 1,575,000 | 1,600,239 | |||||||
JP Morgan Chase Commercial Mortgage Securities Corp. Series 2004-CBX Class A3 | ||||||||||
| 01-12-37 | 4.184 | 2,659,630 | 2,657,635 | |||||||
| Total | 4,257,874 | |||||||||
See accompanying Notes to Portfolio of Investments.
RIVERSOURCE SHORT DURATION U.S. GOVERNMENT FUND — 2011 ANNUAL REPORT 15
Portfolio of Investments (continued)
| Bonds (continued) | ||||||||||
| Coupon | Principal | |||||||||
| Issuer | Rate | Amount | Value(a) | |||||||
Residential Mortgage-Backed (33.3%)(f) | ||||||||||
Banc of America Funding Corp. CMO Series 2010-R4 Class 4A1 | ||||||||||
| 06-26-37 | 0.404 | % | $812,316 | (d)(h) | $791,930 | |||||
BCAP LLC Trust CMO Series 2009-RR13 Class 12A1 | ||||||||||
| 04-26-37 | 5.250 | 932,397 | (d) | 936,251 | ||||||
BCAP LLC Trust CMO Series 2010-RR6 Class 6A1 | ||||||||||
| 07-26-37 | 4.000 | 3,150,564 | (d) | 3,169,121 | ||||||
Countrywide Alternative Loan Trust CMO Series 2006-OA11 Class A3B1 | ||||||||||
| 09-25-46 | 0.374 | 44,342 | (h) | 44,102 | ||||||
Credit Suisse Mortgage Capital Certificates CMO Series 2009-12R Class 14A1 | ||||||||||
| 11-27-35 | 5.500 | 4,033,982 | (d) | 4,203,393 | ||||||
Credit Suisse Mortgage Capital Certificates CMO Series 2009-12R Class 30A1 | ||||||||||
| 12-27-36 | 5.300 | 460,482 | (d) | 467,304 | ||||||
Federal Deposit Insurance Corp. Structured Sale Guaranteed Note CMO Series 2010-S1 Class 1A | ||||||||||
| 02-25-48 | 0.701 | 4,461,511 | (d)(h) | 4,468,784 | ||||||
| Federal Home Loan Mortgage Corp. #1G2547 | ||||||||||
| 12-01-36 | 6.082 | 609,567 | (h) | 658,961 | ||||||
| Federal Home Loan Mortgage Corp. #1G2598 | ||||||||||
| 01-01-37 | 5.929 | 860,973 | (h) | 912,095 | ||||||
| Federal Home Loan Mortgage Corp. #1J0614 | ||||||||||
| 09-01-37 | 5.596 | 1,262,734 | (h) | 1,343,250 | ||||||
| Federal Home Loan Mortgage Corp. #1Q0140 | ||||||||||
| 08-01-36 | 4.807 | 276,964 | (h) | 293,016 | ||||||
| Federal Home Loan Mortgage Corp. #B10459 | ||||||||||
| 10-01-18 | 5.500 | 533,362 | 579,215 | |||||||
| Federal Home Loan Mortgage Corp. #E81240 | ||||||||||
| 06-01-15 | 7.500 | 1,271,913 | 1,380,849 | |||||||
| Federal Home Loan Mortgage Corp. #E92454 | ||||||||||
| 11-01-17 | 5.000 | 1,259,746 | 1,360,001 | |||||||
| Federal Home Loan Mortgage Corp. #E96624 | ||||||||||
| 05-01-18 | 5.000 | 562,201 | 606,943 | |||||||
| Federal Home Loan Mortgage Corp. #G10669 | ||||||||||
| 03-01-12 | 7.500 | 97,275 | 100,256 | |||||||
| Federal Home Loan Mortgage Corp. #G11243 | ||||||||||
| 04-01-17 | 6.500 | 5,623,096 | 6,121,422 | |||||||
| Federal Home Loan Mortgage Corp. #G13987 | ||||||||||
| 01-01-24 | 6.000 | 4,503,401 | 4,910,584 | |||||||
| Federal Home Loan Mortgage Corp. CMO I.O. Series 11 Class B | ||||||||||
| 01-01-20 | 8.047 | 5,122 | (i) | 1,338 | ||||||
| Federal Home Loan Mortgage Corp. CMO I.O. Series 3630 Class AI | ||||||||||
| 03-15-17 | 0.00 | 7,318,778 | (i) | 302,112 | ||||||
| Federal Home Loan Mortgage Corp. CMO Series 2597 Class DE | ||||||||||
| 02-15-33 | 4.000 | 1,587,729 | 1,643,489 | |||||||
| Federal Home Loan Mortgage Corp. CMO Series 2617 Class HD | ||||||||||
| 06-15-16 | 7.000 | 394,546 | 395,701 | |||||||
| Federal Home Loan Mortgage Corp. CMO Series 2645 Class NA | ||||||||||
| 09-15-31 | 3.500 | 4,413,010 | 4,572,425 | |||||||
| Federal Home Loan Mortgage Corp. CMO Series 3531 Class CE | ||||||||||
| 01-15-39 | 3.000 | 2,145,893 | 2,160,888 | |||||||
| Federal Home Loan Mortgage Corp. CMO Series 3683 Class JD | ||||||||||
| 12-15-23 | 4.000 | 4,794,474 | 5,044,335 | |||||||
| Federal Home Loan Mortgage Corp. CMO Series 3825 Class AB | ||||||||||
| 08-15-20 | 3.000 | 5,605,308 | 5,824,611 | |||||||
| Federal Home Loan Mortgage Corp. CMO Series 3831 Class CG | ||||||||||
| 10-15-18 | 3.000 | 5,474,310 | 5,685,293 | |||||||
| Federal Home Loan Mortgage Corp. CMO Series 3832 Class AC | ||||||||||
| 10-15-18 | 3.000 | 5,024,042 | 5,217,671 | |||||||
| Federal Home Loan Mortgage Corp. CMO Series 3856 Class EA | ||||||||||
| 10-15-18 | 3.000 | 16,750,000 | 17,398,750 | |||||||
| Federal Home Loan Mortgage Corp. CMO Series 3862 Class LA | ||||||||||
| 11-15-18 | 2.500 | 5,000,000 | 5,144,617 | |||||||
| Federal Home Loan Mortgage CMO Series 3374 Class AB | ||||||||||
| 12-15-20 | 3.500 | 5,687,138 | 5,987,865 | |||||||
| Federal National Mortgage Association #254384 | ||||||||||
| 06-01-17 | 7.000 | 155,275 | 172,301 | |||||||
See accompanying Notes to Portfolio of Investments.
16 RIVERSOURCE SHORT DURATION U.S. GOVERNMENT FUND — 2011 ANNUAL REPORT
| Bonds (continued) | ||||||||||
| Coupon | Principal | |||||||||
| Issuer | Rate | Amount | Value(a) | |||||||
Residential Mortgage-Backed (cont.) | ||||||||||
| Federal National Mortgage Association #254454 | ||||||||||
| 08-01-17 | 7.000 | % | $288,197 | $319,798 | ||||||
| Federal National Mortgage Association #254723 | ||||||||||
| 05-01-23 | 5.500 | 3,798,755 | 4,149,546 | |||||||
| Federal National Mortgage Association #254882 | ||||||||||
| 08-01-13 | 5.000 | 158,798 | 168,205 | |||||||
| Federal National Mortgage Association #254959 | ||||||||||
| 10-01-13 | 5.000 | 3,977 | 4,222 | |||||||
| Federal National Mortgage Association #255163 | ||||||||||
| 03-01-14 | 5.000 | 500,000 | 536,364 | |||||||
| Federal National Mortgage Association #255343 | ||||||||||
| 07-01-14 | 5.000 | 930,527 | 998,239 | |||||||
| Federal National Mortgage Association #255718 | ||||||||||
| 04-01-15 | 5.000 | 636,304 | 666,068 | |||||||
| Federal National Mortgage Association #313007 | ||||||||||
| 07-01-11 | 7.500 | 150 | 150 | |||||||
| Federal National Mortgage Association #508402 | ||||||||||
| 08-01-14 | 6.500 | 123,123 | 135,361 | |||||||
| Federal National Mortgage Association #545818 | ||||||||||
| 07-01-17 | 6.000 | 6,065,826 | 6,635,606 | |||||||
| Federal National Mortgage Association #545864 | ||||||||||
| 08-01-17 | 5.500 | 4,754,911 | 5,181,775 | |||||||
| Federal National Mortgage Association #545910 | ||||||||||
| 08-01-17 | 6.000 | 922,423 | 1,007,535 | |||||||
| Federal National Mortgage Association #555063 | ||||||||||
| 11-01-17 | 5.500 | 2,481,778 | 2,716,041 | |||||||
| Federal National Mortgage Association #648349 | ||||||||||
| 06-01-17 | 6.000 | 3,346,215 | 3,658,652 | |||||||
| Federal National Mortgage Association #651284 | ||||||||||
| 07-01-17 | 6.000 | 582,105 | 632,918 | |||||||
| Federal National Mortgage Association #662866 | ||||||||||
| 11-01-17 | 6.000 | 773,833 | 847,667 | |||||||
| Federal National Mortgage Association #678940 | ||||||||||
| 02-01-18 | 5.500 | 1,131,383 | 1,239,653 | |||||||
| Federal National Mortgage Association #686227 | ||||||||||
| 02-01-18 | 5.500 | 1,425,629 | 1,561,728 | |||||||
| Federal National Mortgage Association #696837 | ||||||||||
| 04-01-18 | 5.500 | 1,577,471 | 1,710,637 | |||||||
| Federal National Mortgage Association #722325 | ||||||||||
| 07-01-33 | 4.946 | 2,257,809 | (h) | 2,419,812 | ||||||
| Federal National Mortgage Association #745392 | ||||||||||
| 12-01-20 | 4.500 | 494,681 | 529,118 | |||||||
| Federal National Mortgage Association #799843 | ||||||||||
| 11-01-34 | 2.151 | 437,989 | (h) | 455,277 | ||||||
| Federal National Mortgage Association #829597 | ||||||||||
| 08-01-35 | 2.599 | 736,525 | (h) | 769,049 | ||||||
| Federal National Mortgage Association #881886 | ||||||||||
| 04-01-36 | 5.408 | 380,311 | (h) | 410,111 | ||||||
| Federal National Mortgage Association #886764 | ||||||||||
| 08-01-36 | 6.020 | 277,560 | (h) | 296,307 | ||||||
| Federal National Mortgage Association #888989 | ||||||||||
| 06-01-37 | 5.809 | 1,965,532 | (h) | 2,091,216 | ||||||
| Federal National Mortgage Association #890121 | ||||||||||
| 03-01-23 | 5.000 | 65,497 | 70,566 | |||||||
| Federal National Mortgage Association #895834 | ||||||||||
| 04-01-36 | 2.050 | 364,599 | (h) | 382,671 | ||||||
| Federal National Mortgage Association #929139 | ||||||||||
| 02-01-23 | 5.000 | 5,096,492 | 5,468,642 | |||||||
| Federal National Mortgage Association #946609 | ||||||||||
| 09-01-37 | 5.739 | 390,076 | (h) | 416,525 | ||||||
| Federal National Mortgage Association #AC4866 | ||||||||||
| 11-01-24 | 5.000 | 204,898 | 221,908 | |||||||
| Federal National Mortgage Association #MA0548 | ||||||||||
| 10-01-20 | 3.500 | 1,799,311 | 1,875,008 | |||||||
| Federal National Mortgage Association CMO I.O. Series 163 Class 2 | ||||||||||
| 07-25-22 | 20.000 | 276,726 | (i) | 41,573 | ||||||
| Federal National Mortgage Association CMO I.O. Series 36 Class 2 | ||||||||||
| 08-01-18 | 18.415 | 70 | (i) | 13 | ||||||
| 08-01-18 | 20.000 | 2,454 | (i) | 444 | ||||||
Federal National Mortgage Association CMO P.O. Series G-15 Class A | ||||||||||
| 06-25-21 | 2.490 | 15,816 | (j) | 14,841 | ||||||
Federal National Mortgage Association CMO Series 2002-97 Class CF | ||||||||||
| 03-25-31 | 5.500 | 1,036,316 | 1,046,201 | |||||||
Federal National Mortgage Association CMO Series 2003-W11 Class A1 | ||||||||||
| 06-25-33 | 3.078 | 70,547 | (h) | 73,810 | ||||||
Federal National Mortgage Association CMO Series 2004-60 Class PA | ||||||||||
| 04-25-34 | 5.500 | 1,938,371 | 2,121,519 | |||||||
See accompanying Notes to Portfolio of Investments.
RIVERSOURCE SHORT DURATION U.S. GOVERNMENT FUND — 2011 ANNUAL REPORT 17
Portfolio of Investments (continued)
| Bonds (continued) | ||||||||||
| Coupon | Principal | |||||||||
| Issuer | Rate | Amount | Value(a) | |||||||
Residential Mortgage-Backed (cont.) | ||||||||||
Federal National Mortgage Association CMO Series 2009-70 Class NL | ||||||||||
| 08-25-19 | 3.000 | % | $1,008,716 | $1,046,024 | ||||||
Federal National Mortgage Association CMO Series 2010-50 Class AB | ||||||||||
| 01-25-24 | 2.500 | 4,111,197 | 4,196,558 | |||||||
Federal National Mortgage Association CMO Series 2011-16 Class GE | ||||||||||
| 03-25-26 | 2.750 | 5,525,448 | 5,703,656 | |||||||
Federal National Mortgage Association CMO Series 2011-23 Class AB | ||||||||||
| 06-25-20 | 2.750 | 5,597,434 | 5,776,309 | |||||||
Federal National Mortgage Association CMO Series 2011-25 Class AH | ||||||||||
| 06-25-21 | 2.750 | 5,659,981 | 5,843,376 | |||||||
Federal National Mortgage Association CMO Series 2011-38 Class AH | ||||||||||
| 05-25-20 | 2.750 | 5,542,731 | 5,700,642 | |||||||
Federal National Mortgage Association CMO Series 2011-6 Class BA | ||||||||||
| 06-25-20 | 2.750 | 6,908,683 | 7,129,464 | |||||||
Goldman Sachs Agency CMO Series GS-1424 Class AD | ||||||||||
| 10-25-21 | 3.000 | 5,450,000 | (g) | 5,633,938 | ||||||
| Government National Mortgage Association #615740 | ||||||||||
| 08-15-13 | 6.000 | 190,216 | 207,673 | |||||||
| Government National Mortgage Association #781507 | ||||||||||
| 09-15-14 | 6.000 | 907,116 | 955,461 | |||||||
GSR Mortgage Loan Trust CMO Series 2005-5F Class 2A3 | ||||||||||
| 06-25-35 | 5.500 | 1,254,858 | 1,258,823 | |||||||
LVII Resecuritization Trust CMO Series 2009-3 Class A1 | ||||||||||
| 11-27-37 | 5.672 | 649,549 | (d)(h) | 652,489 | ||||||
Residential Asset Securitization Trust CMO Series 2004-A7 Class A1 | ||||||||||
| 10-25-34 | 5.500 | 785,252 | 785,514 | |||||||
| Total | 187,663,576 | |||||||||
Banking (4.3%) | ||||||||||
| BB&T Corp. Senior Unsecured | ||||||||||
| 04-28-14 | 0.973 | 737,000 | (h) | 737,865 | ||||||
| BNP Paribas Bank Guaranteed | ||||||||||
| 01-10-14 | 1.190 | 3,000,000 | (c)(h) | 3,007,924 | ||||||
| Citigroup, Inc. Senior Unsecured | ||||||||||
| 10-15-14 | 5.500 | 3,507,000 | 3,833,260 | |||||||
| Coöperatieve Centrale Raiffeisen-Boerenleenbank BA | ||||||||||
| 01-10-14 | 1.850 | 2,500,000 | (c) | 2,531,798 | ||||||
| HSBC Bank PLC Senior Unsecured | ||||||||||
| 01-17-14 | 1.076 | 3,000,000 | (c)(d)(h) | 3,016,512 | ||||||
| Lloyds TSB Bank PLC Bank Guaranteed | ||||||||||
| 01-21-16 | 4.875 | 2,500,000 | (c) | 2,604,665 | ||||||
| Morgan Stanley Senior Unsecured | ||||||||||
| 01-09-14 | 0.590 | 2,800,000 | (h) | 2,735,902 | ||||||
| Santander U.S. Debt SA Unipersonal Bank Guaranteed | ||||||||||
| 10-07-13 | 2.991 | 2,500,000 | (c)(d) | 2,512,685 | ||||||
| The Goldman Sachs Group, Inc. Senior Notes | ||||||||||
| 08-01-15 | 3.700 | 3,000,000 | 3,045,981 | |||||||
| Total | 24,026,592 | |||||||||
Life Insurance (0.5%) | ||||||||||
| MetLife Institutional Funding II Secured | ||||||||||
| 04-04-14 | 1.201 | 2,800,000 | (d)(h) | 2,807,910 | ||||||
Non-Captive Diversified (0.9%) | ||||||||||
| General Electric Capital Corp. Senior Unsecured | ||||||||||
| 09-15-14 | 0.570 | 5,000,000 | (h) | 4,924,235 | ||||||
Technology (0.7%) | ||||||||||
| Hewlett-Packard Co. Senior Unsecured | ||||||||||
| 05-30-14 | 0.654 | 1,910,000 | (h) | 1,908,310 | ||||||
| Oracle Corp. Senior Unsecured | ||||||||||
| 07-08-14 | 3.750 | 2,000,000 | 2,151,402 | |||||||
| Total | 4,059,712 | |||||||||
See accompanying Notes to Portfolio of Investments.
18 RIVERSOURCE SHORT DURATION U.S. GOVERNMENT FUND — 2011 ANNUAL REPORT
| Bonds (continued) | ||||||||||
| Coupon | Principal | |||||||||
| Issuer | Rate | Amount | Value(a) | |||||||
Wirelines (0.6%) | ||||||||||
| AT&T, Inc. Senior Unsecured | ||||||||||
| 11-15-13 | 6.700 | % | $3,000,000 | $3,376,563 | ||||||
Total Bonds | ||||||||||
| (Cost: $484,686,347) | $492,656,834 | |||||||||
| U.S. Government Agencies (11.6%) | ||||||||||
| Coupon | Principal | |||||||||
| Issuer | Rate | Amount | Value(a) | |||||||
| U.S. Government Agencies | ||||||||||
| Federal Home Loan Mortgage Corp. Discount Notes | ||||||||||
| 06-07-11 | 0.030 | % | $65,000,000 | $64,999,620 | ||||||
Total U.S. Government Agencies | ||||||||||
| (Cost: $64,999,675) | $64,999,620 | |||||||||
| Money Market Fund (2.1%) | ||||||
| Issuer | Shares | Value(a) | ||||
| Columbia Short-Term Cash Fund, 0.166% | 12,058,385 | (b) | $12,058,385 | |||
Total Money Market Fund | ||||||
| (Cost: $12,058,385) | $12,058,385 | |||||
Total Investments in Securities | ||||||
(Cost: $561,744,407)(k) | $569,714,839 | |||||
Notes to Portfolio of Investments
| CMO | — Collateralized Mortgage Obligation | |
| I.O. | — Interest Only | |
| P.O. | — Principal Only |
| (a) | Securities are valued by using policies described in Note 2 to the financial statements. | |
| (b) | Affiliated Money Market Fund — See Note 8 to the financial statements. The rate shown is the seven-day current annualized yield at May 31, 2011. | |
| (c) | Foreign security values are stated in U.S. dollars. For debt securities, principal amounts are denominated in U.S. dollar currency unless otherwise noted. At May 31, 2011, the value of foreign securities, excluding short-term securities, represented 3.11% of net assets. | |
| (d) | Represents a security sold under Rule 144A, which is exempt from registration under the Securities Act of 1933, as amended. This security may be determined to be liquid under guidelines established by the Fund’s Board of Directors. This security may be resold in transactions exempt from registration, normally to qualified institutional buyers. At May 31, 2011, the value of these securities amounted to $34,063,654 or 6.06% of net assets. | |
| (e) | Inflation-indexed bonds are securities in which the principal amount is adjusted for inflation and the semiannual interest payments equal a fixed percentage of the inflation-adjusted principal amount. |
RIVERSOURCE SHORT DURATION U.S. GOVERNMENT FUND — 2011 ANNUAL REPORT 19
Portfolio of Investments (continued)
Notes to Portfolio of Investments (continued)
| (f) | Mortgage-backed securities represent direct or indirect participations in, or are secured by and payable from, mortgage loans secured by real property, and include single- and multi-class pass-through securities and collateralized mortgage obligations. These securities may be issued or guaranteed by U.S. government agencies or instrumentalities, or by private issuers, generally originators and investors in mortgage loans, including savings associations, mortgage bankers, commercial banks, investment bankers and special purpose entities. The maturity dates shown represent the original maturity of the underlying obligation. Actual maturity may vary based upon prepayment activity on these obligations. Unless otherwise noted, the coupon rates presented are fixed rates. | |
| (g) | At May 31, 2011, the cost of securities purchased, including interest purchased, on a when-issued and/or other forward-commitment basis was $5,647,108. See Note 2 to the financial statements. | |
| (h) | Interest rate varies either based on a predetermined schedule or to reflect current market conditions; rate shown is the effective rate on May 31, 2011. | |
| (i) | Interest only represents securities that entitle holders to receive only interest payments on the underlying mortgages. The yield to maturity of an interest only security is extremely sensitive to the rate of principal payments on the underlying mortgage assets. A rapid (slow) rate of principal repayments may have an adverse (positive) effect on yield to maturity. The principal amount shown is the notional amount of the underlying mortgages. The interest rate disclosed represents yield based upon the estimated timing and amount of future cash flows at May 31, 2011. | |
| (j) | Principal only represents securities that entitle holders to receive only principal payments on the underlying mortgages. The yield to maturity of a principal only security is sensitive to the rate of principal payments on the underlying mortgage assets. A slow (rapid) rate of principal repayments may have an adverse (positive) effect on yield to maturity. Interest rate disclosed represents yield based upon the estimated timing of future cash flows at May 31, 2011. | |
| (k) | At May 31, 2011, the cost of securities for federal income tax purposes was $563,142,209 and the aggregate gross unrealized appreciation and depreciation based on that cost was: |
| Unrealized appreciation | $6,906,160 | |||
| Unrealized depreciation | (333,530 | ) | ||
| Net unrealized appreciation | $6,572,630 | |||
20 RIVERSOURCE SHORT DURATION U.S. GOVERNMENT FUND — 2011 ANNUAL REPORT
Fair Value Measurements
Generally accepted accounting principles (GAAP) require disclosure regarding the inputs and valuation techniques used to measure fair value and any changes in valuation inputs or techniques. In addition, investments shall be disclosed by major category.
The Fund categorizes its fair value measurements according to a three-level hierarchy that maximizes the use of observable inputs and minimizes the use of unobservable inputs by prioritizing that the most observable input be used when available. Observable inputs are those that market participants would use in pricing an investment based on market data obtained from sources independent of the reporting entity. Unobservable inputs are those that reflect the Fund’s assumptions about the information market participants would use in pricing an investment. An investment’s level within the fair value hierarchy is based on the lowest level of any input that is deemed significant to the asset or liability’s fair value measurement. The input levels are not necessarily an indication of the risk or liquidity associated with investments at that level. For example, certain U.S. government securities are generally high quality and liquid, however, they are reflected as Level 2 because the inputs used to determine fair value may not always be quoted prices in an active market.
Fair value inputs are summarized in the three broad levels listed below:
| • | Level 1 — Valuations based on quoted prices for investments in active markets that the Fund has the ability to access at the measurement date (including NAV for open-end mutual funds). Valuation adjustments are not applied to Level 1 investments. | |
| • | Level 2 — Valuations based on other significant observable inputs (including quoted prices for similar securities, interest rates, prepayment speeds, credit risks, etc.). | |
| • | Level 3 — Valuations based on significant unobservable inputs (including the Fund’s own assumptions and judgment in determining the fair value of investments). |
Inputs that are used in determining fair value of an investment may include price information, credit data, volatility statistics, and other factors. These inputs can be either observable or unobservable. The availability of observable inputs can vary between investments, and is affected by various factors such as the type of investment, and the volume and level of activity for that investment or similar investments in the marketplace. The inputs will be considered by the Fund Administrator, along with any other relevant factors in the calculation of an investment’s fair value. The Fund uses prices and inputs that are current as of the measurement date, which may include periods of market dislocations. During these periods, the availability of prices and inputs may be reduced for many investments. This condition could cause an investment to be reclassified between the various levels within the hierarchy.
Investments falling into the Level 3 category are primarily supported by quoted prices from brokers and dealers participating in the market for those investments. However, these may be classified as Level 3 investments due to lack of market transparency and corroboration to support these quoted prices. Additionally, valuation models may be used as the pricing source for any remaining investments classified as Level 3. These models rely on one or more significant unobservable inputs and/or significant assumptions by the Fund Administrator. Inputs used in valuations may
RIVERSOURCE SHORT DURATION U.S. GOVERNMENT FUND — 2011 ANNUAL REPORT 21
Portfolio of Investments (continued)
Fair Value Measurements (continued)
include, but are not limited to, financial statement analysis, capital account balances, discount rates and estimated cash flows, and comparable company data.
The following table is a summary of the inputs used to value the Fund’s investments as of May 31, 2011:
| Fair Value at May 31, 2011 | ||||||||||||||||
| Level 1 | Level 2 | |||||||||||||||
| Quoted Prices | Other | Level 3 | ||||||||||||||
| in Active | Significant | Significant | ||||||||||||||
| Markets for | Observable | Unobservable | ||||||||||||||
| Description(a) | Identical Assets | Inputs(b) | Inputs | Total | ||||||||||||
| Bonds | ||||||||||||||||
| Foreign Local Government | $— | $3,805,547 | $— | $3,805,547 | ||||||||||||
| U.S. Government Obligations & Agencies | 53,591,920 | 75,667,815 | — | 129,259,735 | ||||||||||||
| Asset-Backed Securities | — | 24,179,065 | — | 24,179,065 | ||||||||||||
| Commercial Mortgage-Backed Securities-Agency | — | 104,296,025 | — | 104,296,025 | ||||||||||||
| Commercial Mortgage-Backed Securities | — | 4,257,874 | — | 4,257,874 | ||||||||||||
| Residential Mortgage-Backed Securities | — | 187,663,576 | — | 187,663,576 | ||||||||||||
| Corporate Debt Securities | — | 39,195,012 | — | 39,195,012 | ||||||||||||
| Total Bonds | 53,591,920 | 439,064,914 | — | 492,656,834 | ||||||||||||
| Short-Term Securities | ||||||||||||||||
| U.S. Government Agencies | — | 64,999,620 | — | 64,999,620 | ||||||||||||
| Total Short-Term Securities | — | 64,999,620 | — | 64,999,620 | ||||||||||||
| Other | ||||||||||||||||
Affiliated Money Market Fund(c) | 12,058,385 | — | — | 12,058,385 | ||||||||||||
| Total Other | 12,058,385 | — | — | 12,058,385 | ||||||||||||
| Total | $65,650,305 | $504,064,534 | $— | $569,714,839 | ||||||||||||
| (a) | See the Portfolio of Investments for all investment classifications not indicated in the table. | |
| (b) | There were no significant transfers between Levels 1 and 2 during the period, $18,074,613 was transferred out of Level 3 into Level 2 due to changes in the observability of significant inputs. | |
| (c) | Money market fund that is a sweep investment for cash balances in the Fund at May 31, 2011. |
22 RIVERSOURCE SHORT DURATION U.S. GOVERNMENT FUND — 2011 ANNUAL REPORT
Fair Value Measurements (continued)
The following table is a reconciliation of Level 3 assets for which significant unobservable inputs were used to determine fair value.
| Residential | ||||||||||||
| Asset- | Mortgage- | |||||||||||
| Backed | Backed | |||||||||||
| Securities | Securities | Total | ||||||||||
| Balance as of May 31, 2010 | $5,284,093 | $15,421,587 | $20,705,680 | |||||||||
| Accrued discounts/premiums | 11,911 | 2,491 | 14,402 | |||||||||
| Realized gain (loss) | 1,151 | 960,406 | 961,557 | |||||||||
| Change in unrealized appreciation (depreciation)* | (4,658 | ) | (794,867 | ) | (799,525 | ) | ||||||
| Sales | (1,071,197 | ) | (1,736,304 | ) | (2,807,501 | ) | ||||||
| Purchases | — | — | — | |||||||||
| Transfers into Level 3 | — | — | — | |||||||||
| Transfers out of Level 3 | (4,221,300 | ) | (13,853,313 | ) | (18,074,613 | ) | ||||||
| Balance as of May 31, 2011 | $— | $— | $— | |||||||||
| * | Change in unrealized appreciation (depreciation) relating to securities held at May 31, 2011 was $0. |
Transfers in and/or out of Level 3 are determined based on the fair value at the beginning of the period for security positions held throughout the period.
How to find information about the Fund’s quarterly portfolio holdings
| (i) | The Fund files its complete schedule of portfolio holdings with the Securities and Exchange Commission (SEC) for the first and third quarters of each fiscal year on Form N-Q; | |
| (ii) | The Fund’s Forms N-Q are available on the SEC’s website at www.sec.gov; | |
| (iii) | The Fund’s Forms N-Q may be reviewed and copied at the SEC’s Public Reference Room in Washington, DC (information on the operations of the Public Reference Room may be obtained by calling 800.SEC.0330); and | |
| (iv) | The Fund’s complete schedule of portfolio holdings, as filed on Form N-Q, can be obtained without charge, upon request, by calling 800.345.6611. |
RIVERSOURCE SHORT DURATION U.S. GOVERNMENT FUND — 2011 ANNUAL REPORT 23
Statement of Assets and Liabilities
May 31, 2011
Assets | ||||
| Investments in securities, at value | ||||
| Unaffiliated issuers (identified cost $549,686,022) | $ | 557,656,454 | ||
| Affiliated money market fund (identified cost $12,058,385) | 12,058,385 | |||
| Total investments in securities (identified cost $561,744,407) | 569,714,839 | |||
| Cash | 148,083 | |||
| Receivable from Investment Manager | 4,432 | |||
| Capital shares receivable | 190,550 | |||
| Dividends and accrued interest receivable | 1,299,125 | |||
| Receivable for investment securities sold | 43,845,695 | |||
| Total assets | 615,202,724 | |||
Liabilities | ||||
| Dividends payable to shareholders | 1,308,753 | |||
| Capital shares payable | 639,536 | |||
| Payable for investment securities purchased | 51,305,678 | |||
| Accrued investment management services fees | 29,640 | |||
| Accrued distribution fees | 18,364 | |||
| Accrued transfer agency fees | 53,149 | |||
| Accrued administrative services fees | 4,288 | |||
| Accrued plan administration services fees | 1,004 | |||
| Other accrued expenses | 136,920 | |||
| Total liabilities | 53,497,332 | |||
| Net assets applicable to outstanding capital stock | $ | 561,705,392 | ||
Represented by | ||||
| Capital stock — $.01 par value | $ | 1,173,622 | ||
| Additional paid-in capital | 645,797,392 | |||
| Undistributed net investment income | 396,538 | |||
| Accumulated net realized gain (loss) | (93,632,592 | ) | ||
| Unrealized appreciation (depreciation) on investments | 7,970,432 | |||
| Total — representing net assets applicable to outstanding capital stock | $ | 561,705,392 | ||
| Net asset value per share | ||||||||||||
| Net assets | Shares outstanding | Net asset value per share | ||||||||||
| Class A | $ | 424,947,637 | 88,799,088 | $ | 4.79 | (1) | ||||||
| Class B | $ | 32,995,774 | 6,892,004 | $ | 4.79 | |||||||
| Class C | $ | 25,921,066 | 5,417,041 | $ | 4.79 | |||||||
| Class I | $ | 69,883,395 | 14,591,596 | $ | 4.79 | |||||||
| Class R | $ | 3,503,408 | 732,003 | $ | 4.79 | |||||||
| Class R4 | $ | 4,449,077 | 929,385 | $ | 4.79 | |||||||
| Class W | $ | 5,035 | 1,053 | $ | 4.78 | |||||||
| (1) | The maximum offering price per share for Class A is $4.94. The offering price is calculated by dividing the net asset value by 1.0 minus the maximum sales charge of 3.00%. |
The accompanying Notes to Financial Statements are an integral part of this statement.
24 RIVERSOURCE SHORT DURATION U.S. GOVERNMENT FUND — 2011 ANNUAL REPORT
Statement of Operations
Year ended May 31, 2011
Investment income | ||||
| Income: | ||||
| Interest | $ | 15,017,150 | ||
| Income distributions from affiliated money market fund | 43,255 | |||
| Income from securities lending — net | 70,725 | |||
| Total income | 15,131,130 | |||
| Expenses: | ||||
| Investment management services fees | 3,010,139 | |||
| Distribution fees | ||||
| Class A | 1,193,741 | |||
| Class B | 433,934 | |||
| Class C | 285,822 | |||
| Class R | 16,503 | |||
| Class W | 12 | |||
| Transfer agency fees | ||||
| Class A | 880,005 | |||
| Class B | 84,751 | |||
| Class C | 52,399 | |||
| Class R | 4,652 | |||
| Class R4 | 2,065 | |||
| Class W | 8 | |||
| Administrative services fees | 432,829 | |||
| Plan administration services fees | ||||
| Class R | 2,004 | |||
| Class R4 | 11,360 | |||
| Compensation of board members | 14,201 | |||
| Custodian fees | 42,987 | |||
| Printing and postage | 53,320 | |||
| Registration fees | 94,465 | |||
| Professional fees | 15,420 | |||
| Other | 249,840 | |||
| Total expenses | 6,880,457 | |||
| Expenses waived/reimbursed by the Investment Manager and its affiliates | (1,119,896 | ) | ||
| Total net expenses | 5,760,561 | |||
| Investment income (loss) — net | 9,370,569 | |||
Realized and unrealized gain (loss) — net | ||||
| Net realized gain (loss) on: | ||||
| Security transactions | 10,779,562 | |||
| Futures contracts | (2,381,079 | ) | ||
| Net realized gain (loss) on investments | 8,398,483 | |||
| Net change in unrealized appreciation (depreciation) on investments | (2,908,067 | ) | ||
| Net gain (loss) on investments | 5,490,416 | |||
| Net increase (decrease) in net assets resulting from operations | $ | 14,860,985 | ||
The accompanying Notes to Financial Statements are an integral part of this statement.
RIVERSOURCE SHORT DURATION U.S. GOVERNMENT FUND — 2011 ANNUAL REPORT 25
Statement of Changes in Net Assets
| Year ended May 31, | 2011 | 2010 | ||||||
Operations and distributions | ||||||||
| Investment income (loss) — net | $ | 9,370,569 | $ | 15,505,510 | ||||
| Net realized gain (loss) on investments | 8,398,483 | 4,201,347 | ||||||
| Net change in unrealized appreciation (depreciation) on investments | (2,908,067 | ) | 12,661,886 | |||||
| Net increase (decrease) in net assets resulting from operations | 14,860,985 | 32,368,743 | ||||||
| Distributions to shareholders from: | ||||||||
| Net investment income | ||||||||
| Class A | (8,030,637 | ) | (12,668,025 | ) | ||||
| Class B | (403,078 | ) | (1,425,001 | ) | ||||
| Class C | (265,421 | ) | (407,301 | ) | ||||
| Class I | (1,452,726 | ) | (1,538,428 | ) | ||||
| Class R | (49,522 | ) | (47,161 | ) | ||||
| Class R4 | (81,463 | ) | (104,118 | ) | ||||
| Class W | (90 | ) | (116 | ) | ||||
| Total distributions | (10,282,937 | ) | (16,190,150 | ) | ||||
The accompanying Notes to Financial Statements are an integral part of this statement.
26 RIVERSOURCE SHORT DURATION U.S. GOVERNMENT FUND — 2011 ANNUAL REPORT
| Year ended May 31, | 2011 | 2010 | ||||||
Capital share transactions | ||||||||
| Proceeds from sales | ||||||||
| Class A shares | $ | 60,239,361 | $ | 88,786,015 | ||||
| Class B shares | 4,501,369 | 7,530,462 | ||||||
| Class C shares | 6,936,507 | 7,364,078 | ||||||
| Class I shares | 6,116,063 | 31,799,700 | ||||||
| Class R shares | 1,831,729 | 952,078 | ||||||
| Class R4 shares | 1,381,261 | 2,462,644 | ||||||
| Fund merger (Note 11) | ||||||||
| Class A shares | N/A | 33,719,721 | ||||||
| Class B shares | N/A | 4,922,961 | ||||||
| Class C shares | N/A | 16,708,376 | ||||||
| Class R shares | N/A | 3,419,969 | ||||||
| Reinvestment of distributions at net asset value | ||||||||
| Class A shares | 6,285,873 | 11,449,031 | ||||||
| Class B shares | 336,165 | 1,328,133 | ||||||
| Class C shares | 175,616 | 301,069 | ||||||
| Class I shares | 1,297,202 | 1,516,948 | ||||||
| Class R shares | 10,174 | 8,199 | ||||||
| Class R4 shares | 72,626 | 103,225 | ||||||
| Conversions from Class B to Class A | ||||||||
| Class A shares | 23,031,572 | 26,046,599 | ||||||
| Class B shares | (23,031,572 | ) | (26,046,599 | ) | ||||
| Payments for redemptions | ||||||||
| Class A shares | (156,130,937 | ) | (213,595,187 | ) | ||||
| Class B shares | (16,009,254 | ) | (36,237,124 | ) | ||||
| Class C shares | (9,213,857 | ) | (9,903,018 | ) | ||||
| Class I shares | (5,571,954 | ) | (8,886,058 | ) | ||||
| Class R shares | (1,357,614 | ) | (1,415,514 | ) | ||||
| Class R4 shares | (1,750,603 | ) | (2,288,821 | ) | ||||
| Increase (decrease) in net assets from capital share transactions | (100,850,273 | ) | (59,953,113 | ) | ||||
| Proceeds from regulatory settlement (Note 10) | — | 112,925 | ||||||
| Total increase (decrease) in net assets | (96,272,225 | ) | (43,661,595 | ) | ||||
| Net assets at beginning of year | 657,977,617 | 701,639,212 | ||||||
| Net assets at end of year | $ | 561,705,392 | $ | 657,977,617 | ||||
| Undistributed (excess of distributions over) net investment income | $ | 396,538 | $ | (200,707 | ) | |||
The accompanying Notes to Financial Statements are an integral part of this statement.
RIVERSOURCE SHORT DURATION U.S. GOVERNMENT FUND — 2011 ANNUAL REPORT 27
Financial Highlights
The following tables are intended to help you understand the Fund’s financial performance. Certain information reflects financial results for a single share of a class held for the periods shown. For the periods 2008 and after, per share net investment income (loss) amounts are calculated based on average shares outstanding during the period. Total returns assume reinvestment of all dividends and distributions. Total returns do not reflect payment of sales charges, if any, and are not annualized for periods of less than one year.
| Year ended May 31, | ||||||||||||||||||||
| 2011 | 2010 | 2009 | 2008 | 2007 | ||||||||||||||||
Class A | ||||||||||||||||||||
Per share data | ||||||||||||||||||||
| Net asset value, beginning of period | $4.75 | $4.63 | $4.74 | $4.73 | $4.68 | |||||||||||||||
Income from investment operations: | ||||||||||||||||||||
| Net investment income (loss) | .07 | .11 | .14 | .19 | .19 | |||||||||||||||
| Net gains (losses) (both realized and unrealized) | .05 | .12 | (.11 | ) | .01 | .05 | �� | |||||||||||||
| Total from investment operations | .12 | .23 | .03 | .20 | .24 | |||||||||||||||
Less distributions: | ||||||||||||||||||||
| Dividends from net investment income | (.08 | ) | (.11 | ) | (.14 | ) | (.19 | ) | (.19 | ) | ||||||||||
| Proceeds from regulatory settlement | — | .00 | (a) | — | — | — | ||||||||||||||
| Net asset value, end of period | $4.79 | $4.75 | $4.63 | $4.74 | $4.73 | |||||||||||||||
Total return | 2.56% | 5.11% | (b) | .59% | 4.27% | 5.12% | ||||||||||||||
Ratios to average net assets(c) | ||||||||||||||||||||
| Gross expenses prior to expense waiver/reimbursement | 1.06% | 1.04% | 1.02% | 1.04% | 1.03% | |||||||||||||||
Net expenses after expense waiver/reimbursement(d) | .88% | .86% | .89% | .89% | (e) | .89% | ||||||||||||||
| Net investment income (loss) | 1.54% | 2.35% | 3.00% | 3.93% | 3.99% | |||||||||||||||
Supplemental data | ||||||||||||||||||||
| Net assets, end of period (in millions) | $425 | $488 | $529 | $539 | $514 | |||||||||||||||
Portfolio turnover rate(f) | 214% | 329% | 271% | 209% | 168% | |||||||||||||||
See accompanying Notes to Financial Highlights.
The accompanying Notes to Financial Statements are an integral part of this statement.
28 RIVERSOURCE SHORT DURATION U.S. GOVERNMENT FUND — 2011 ANNUAL REPORT
| Year ended May 31, | ||||||||||||||||||||
| 2011 | 2010 | 2009 | 2008 | 2007 | ||||||||||||||||
Class B | ||||||||||||||||||||
Per share data | ||||||||||||||||||||
| Net asset value, beginning of period | $4.75 | $4.63 | $4.74 | $4.73 | $4.68 | |||||||||||||||
Income from investment operations: | ||||||||||||||||||||
| Net investment income (loss) | .04 | .08 | .10 | .15 | .15 | |||||||||||||||
| Net gains (losses) (both realized and unrealized) | .05 | .12 | (.11 | ) | .01 | .05 | ||||||||||||||
| Total from investment operations | .09 | .20 | (.01 | ) | .16 | .20 | ||||||||||||||
Less distributions: | ||||||||||||||||||||
| Dividends from net investment income | (.05 | ) | (.08 | ) | (.10 | ) | (.15 | ) | (.15 | ) | ||||||||||
| Proceeds from regulatory settlement | — | .00 | (a) | — | — | — | ||||||||||||||
| Net asset value, end of period | $4.79 | $4.75 | $4.63 | $4.74 | $4.73 | |||||||||||||||
Total return | 1.77% | 4.31% | (b) | (.18% | ) | 3.48% | 4.34% | |||||||||||||
Ratios to average net assets(c) | ||||||||||||||||||||
| Gross expenses prior to expense waiver/reimbursement | 1.81% | 1.80% | 1.78% | 1.80% | 1.79% | |||||||||||||||
Net expenses after expense waiver/reimbursement(d) | 1.63% | 1.62% | 1.65% | 1.65% | (e) | 1.64% | ||||||||||||||
| Net investment income (loss) | .81% | 1.64% | 2.26% | 3.18% | 3.23% | |||||||||||||||
Supplemental data | ||||||||||||||||||||
| Net assets, end of period (in millions) | $33 | $67 | $113 | $159 | $216 | |||||||||||||||
Portfolio turnover rate(f) | 214% | 329% | 271% | 209% | 168% | |||||||||||||||
See accompanying Notes to Financial Highlights.
The accompanying Notes to Financial Statements are an integral part of this statement.
RIVERSOURCE SHORT DURATION U.S. GOVERNMENT FUND — 2011 ANNUAL REPORT 29
Financial Highlights (continued)
| Year ended May 31, | ||||||||||||||||||||
| 2011 | 2010 | 2009 | 2008 | 2007 | ||||||||||||||||
Class C | ||||||||||||||||||||
Per share data | ||||||||||||||||||||
| Net asset value, beginning of period | $4.75 | $4.63 | $4.74 | $4.73 | $4.68 | |||||||||||||||
Income from investment operations: | ||||||||||||||||||||
| Net investment income (loss) | .04 | .07 | .10 | .15 | .15 | |||||||||||||||
| Net gains (losses) (both realized and unrealized) | .05 | .13 | (.11 | ) | .02 | .05 | ||||||||||||||
| Total from investment operations | .09 | .20 | (.01 | ) | .17 | .20 | ||||||||||||||
Less distributions: | ||||||||||||||||||||
| Dividends from net investment income | (.05 | ) | (.08 | ) | (.10 | ) | (.16 | ) | (.15 | ) | ||||||||||
| Proceeds from regulatory settlement | — | .00 | (a) | — | — | — | ||||||||||||||
| Net asset value, end of period | $4.79 | $4.75 | $4.63 | $4.74 | $4.73 | |||||||||||||||
Total return | 1.79% | 4.31% | (b) | (.17% | ) | 3.49% | 4.34% | |||||||||||||
Ratios to average net assets(c) | ||||||||||||||||||||
| Gross expenses prior to expense waiver/reimbursement | 1.81% | 1.80% | 1.78% | 1.80% | 1.80% | |||||||||||||||
Net expenses after expense waiver/reimbursement(d) | 1.63% | 1.62% | 1.65% | 1.65% | (e) | 1.64% | ||||||||||||||
| Net investment income (loss) | .78% | 1.51% | 2.21% | 3.18% | 3.24% | |||||||||||||||
Supplemental data | ||||||||||||||||||||
| Net assets, end of period (in millions) | $26 | $28 | $13 | $10 | $10 | |||||||||||||||
Portfolio turnover rate(f) | 214% | 329% | 271% | 209% | 168% | |||||||||||||||
See accompanying Notes to Financial Highlights.
The accompanying Notes to Financial Statements are an integral part of this statement.
30 RIVERSOURCE SHORT DURATION U.S. GOVERNMENT FUND — 2011 ANNUAL REPORT
| Year ended May 31, | ||||||||||||||||||||
| 2011 | 2010 | 2009 | 2008 | 2007 | ||||||||||||||||
Class I | ||||||||||||||||||||
Per share data | ||||||||||||||||||||
| Net asset value, beginning of period | $4.75 | $4.64 | $4.74 | $4.74 | $4.69 | |||||||||||||||
Income from investment operations: | ||||||||||||||||||||
| Net investment income (loss) | .09 | .13 | .16 | .20 | .20 | |||||||||||||||
| Net gains (losses) (both realized and unrealized) | .05 | .11 | (.11 | ) | .01 | .05 | ||||||||||||||
| Total from investment operations | .14 | .24 | .05 | .21 | .25 | |||||||||||||||
Less distributions: | ||||||||||||||||||||
| Dividends from net investment income | (.10 | ) | (.13 | ) | (.15 | ) | (.21 | ) | (.20 | ) | ||||||||||
| Proceeds from regulatory settlement | — | .00 | (a) | — | — | — | ||||||||||||||
| Net asset value, end of period | $4.79 | $4.75 | $4.64 | $4.74 | $4.74 | |||||||||||||||
Total return | 2.97% | 5.28% | (b) | 1.18% | 4.45% | 5.50% | ||||||||||||||
Ratios to average net assets(c) | ||||||||||||||||||||
| Gross expenses prior to expense waiver/reimbursement | .63% | .60% | .60% | .60% | .59% | |||||||||||||||
Net expenses after expense waiver/reimbursement(d) | .48% | .48% | .51% | .51% | (e) | .54% | ||||||||||||||
| Net investment income (loss) | 1.92% | 2.67% | 3.49% | 4.23% | 4.37% | |||||||||||||||
Supplemental data | ||||||||||||||||||||
| Net assets, end of period (in millions) | $70 | $68 | $42 | $93 | $55 | |||||||||||||||
Portfolio turnover rate(f) | 214% | 329% | 271% | 209% | 168% | |||||||||||||||
See accompanying Notes to Financial Highlights.
The accompanying Notes to Financial Statements are an integral part of this statement.
RIVERSOURCE SHORT DURATION U.S. GOVERNMENT FUND — 2011 ANNUAL REPORT 31
Financial Highlights (continued)
| Year ended May 31, | ||||||||
| 2011 | 2010(g) | |||||||
Class R | ||||||||
Per share data | ||||||||
| Net asset value, beginning of period | $4.75 | $4.66 | ||||||
Income from investment operations: | ||||||||
| Net investment income (loss) | .06 | .07 | ||||||
| Net gains (losses) (both realized and unrealized) | .05 | .09 | ||||||
| Total from investment operations | .11 | .16 | ||||||
Less distributions: | ||||||||
| Dividends from net investment income | (.07 | ) | (.07 | ) | ||||
| Proceeds from regulatory settlement | — | .00 | (a) | |||||
| Net asset value, end of period | $4.79 | $4.75 | ||||||
Total return | 2.38% | 3.47% | (b) | |||||
Ratios to average net assets(c) | ||||||||
| Gross expenses prior to expense waiver/reimbursement | 1.33% | 1.40% | (h) | |||||
Net expenses after expense waiver/reimbursement(d) | 1.06% | 1.28% | (h) | |||||
| Net investment income (loss) | 1.34% | 1.76% | (h) | |||||
Supplemental data | ||||||||
| Net assets, end of period (in millions) | $4 | $3 | ||||||
Portfolio turnover rate(f) | 214% | 329% | ||||||
See accompanying Notes to Financial Highlights.
The accompanying Notes to Financial Statements are an integral part of this statement.
32 RIVERSOURCE SHORT DURATION U.S. GOVERNMENT FUND — 2011 ANNUAL REPORT
| Year ended May 31, | ||||||||||||||||||||
| 2011 | 2010 | 2009 | 2008 | 2007 | ||||||||||||||||
Class R4 | ||||||||||||||||||||
Per share data | ||||||||||||||||||||
| Net asset value, beginning of period | $4.75 | $4.64 | $4.74 | $4.73 | $4.68 | |||||||||||||||
Income from investment operations: | ||||||||||||||||||||
| Net investment income (loss) | .08 | .11 | .15 | .19 | .19 | |||||||||||||||
| Net gains (losses) (both realized and unrealized) | .05 | .12 | (.11 | ) | .02 | .05 | ||||||||||||||
| Total from investment operations | .13 | .23 | .04 | .21 | .24 | |||||||||||||||
Less distributions: | ||||||||||||||||||||
| Dividends from net investment income | (.09 | ) | (.12 | ) | (.14 | ) | (.20 | ) | (.19 | ) | ||||||||||
| Proceeds from regulatory settlement | — | .00 | (a) | — | — | — | ||||||||||||||
| Net asset value, end of period | $4.79 | $4.75 | $4.64 | $4.74 | $4.73 | |||||||||||||||
Total return | 2.67% | 4.96% | (b) | .93% | 4.41% | 5.31% | ||||||||||||||
Ratios to average net assets(c) | ||||||||||||||||||||
| Gross expenses prior to expense waiver/reimbursement | .92% | .90% | .90% | .90% | .86% | |||||||||||||||
Net expenses after expense waiver/reimbursement(d) | .77% | .78% | .76% | .76% | (e) | .72% | ||||||||||||||
| Net investment income (loss) | 1.64% | 2.43% | 3.15% | 4.06% | 4.09% | |||||||||||||||
Supplemental data | ||||||||||||||||||||
| Net assets, end of period (in millions) | $4 | $5 | $4 | $5 | $4 | |||||||||||||||
Portfolio turnover rate(f) | 214% | 329% | 271% | 209% | 168% | |||||||||||||||
See accompanying Notes to Financial Highlights.
The accompanying Notes to Financial Statements are an integral part of this statement.
RIVERSOURCE SHORT DURATION U.S. GOVERNMENT FUND — 2011 ANNUAL REPORT 33
Financial Highlights (continued)
| Year ended May 31, | ||||||||||||||||||||
| 2011 | 2010 | 2009 | 2008 | 2007(i) | ||||||||||||||||
Class W | ||||||||||||||||||||
Per share data | ||||||||||||||||||||
| Net asset value, beginning of period | $4.74 | $4.63 | $4.74 | $4.73 | $4.75 | |||||||||||||||
Income from investment operations: | ||||||||||||||||||||
| Net investment income (loss) | .08 | .11 | .14 | .18 | .08 | |||||||||||||||
| Net gains (losses) (both realized and unrealized) | .05 | .11 | (.12 | ) | .02 | (.02 | ) | |||||||||||||
| Total from investment operations | .13 | .22 | .02 | .20 | .06 | |||||||||||||||
Less distributions: | ||||||||||||||||||||
| Dividends from net investment income | (.09 | ) | (.11 | ) | (.13 | ) | (.19 | ) | (.08 | ) | ||||||||||
| Proceeds from regulatory settlement | — | .00 | (a) | — | — | — | ||||||||||||||
| Net asset value, end of period | $4.78 | $4.74 | $4.63 | $4.74 | $4.73 | |||||||||||||||
Total return | 2.66% | 4.81% | (b) | .52% | 4.21% | 1.42% | ||||||||||||||
Ratios to average net assets(c) | ||||||||||||||||||||
| Gross expenses prior to expense waiver/reimbursement | 1.07% | 1.04% | 1.04% | 1.06% | 1.00% | (h) | ||||||||||||||
Net expenses after expense waiver/reimbursement(d) | .80% | .92% | .96% | .95% | .95% | (h) | ||||||||||||||
| Net investment income (loss) | 1.60% | 2.29% | 2.95% | 3.87% | 4.02% | (h) | ||||||||||||||
Supplemental data | ||||||||||||||||||||
| Net assets, end of period (in millions) | $— | $— | $— | $— | $— | |||||||||||||||
Portfolio turnover rate(f) | 214% | 329% | 271% | 209% | 168% | |||||||||||||||
Notes to Financial Highlights
| (a) | Rounds to less than $0.01. | |
| (b) | During the year ended May 31, 2010, the Fund received proceeds from a regulatory settlement. Had the Fund not received these proceeds, the total return would have been lower by 0.02%. | |
| (c) | In addition to the fees and expenses which the Fund bears directly, the Fund indirectly bears a pro rata share of the fees and expenses of the acquired funds in which it invests. Such indirect expenses are not included in the reported expense ratios. | |
| (d) | The Investment Manager and its affiliates agreed to waive/reimburse certain fees and expenses (excluding fees and expenses of acquired funds and any reorganization costs allocated to the Fund). | |
| (e) | For the year ended May 31, 2008, the ratio of net expenses after reduction for waiver/reimbursement, if any, and after reduction for earnings and bank fee credits was 0.88% for Class A, 1.64% for Class B, 1.64% for Class C, 0.50% for Class I and 0.75% for Class R4. | |
| (f) | Includes mortgage dollar rolls. If mortgage dollar roll transactions were excluded, the portfolio turnover would have been 148%, 286% and 199% for the years ended May 31, 2011, 2010 and 2009, respectively. | |
| (g) | For the period from Aug. 3, 2009 (when shares became available) to May 31, 2010. | |
| (h) | Annualized. | |
| (i) | For the period from Dec. 1, 2006 (when shares became available) to May 31, 2007. |
The accompanying Notes to Financial Statements are an integral part of this statement.
34 RIVERSOURCE SHORT DURATION U.S. GOVERNMENT FUND — 2011 ANNUAL REPORT
Notes to Financial Statements
| 1. | ORGANIZATION |
RiverSource Short Duration U.S. Government Fund (the Fund) is a series of RiverSource Government Income Series, Inc. (the Corporation) and is registered under the Investment Company Act of 1940, as amended (the 1940 Act), as a diversified, open-end management investment company. The Corporation has 10 billion authorized shares of capital stock that can be allocated among the separate series as designated by the Corporation’s Board of Directors (the Board).
The Fund offers Class A, Class B, Class C, Class I, Class R, Class R4 and Class W shares.
Class A shares are subject to a maximum front-end sales charge of 3.00% based on the investment amount. Class A shares purchased without an initial sales charge in accounts aggregating $1 million to $50 million at the time of purchase are subject to a contingent deferred sales charge (CDSC) if the shares are sold within 18 months of purchase, charged as follows: 1.00% CDSC if redeemed within 12 months of purchase, and 0.50% CDSC if redeemed more than 12, but less than 18, months after purchase.
Class B shares may be subject to a maximum CDSC of 5.00% based upon the holding period after purchase. Class B shares will generally convert to Class A shares eight years after purchase. The Fund no longer accepts investments by new or existing investors in the Fund’s Class B shares, except in connection with the reinvestment of any dividend and/or capital gain distributions in Class B shares of the Fund and exchanges by existing Class B shareholders of certain other funds within the Columbia Family of Funds.
Class C shares are subject to a 1.00% CDSC on shares redeemed within one year of purchase.
Class I shares are not subject to sales charges and are available only to the Columbia Family of Funds.
Class R shares are not subject to sales charges and are available to qualifying institutional investors.
Class R4 shares are not subject to sales charges, however, the class was closed to new investors effective Dec. 31, 2010.
Class W shares are not subject to sales charges and are available only to investors purchasing through authorized investment programs managed by investment professionals, including discretionary managed account programs.
RIVERSOURCE SHORT DURATION U.S. GOVERNMENT FUND — 2011 ANNUAL REPORT 35
Notes to Financial Statements (continued)
At May 31, 2011, Columbia Management Investment Advisers, LLC (the Investment Manager) and/or affiliates owned 100% of Class I and Class W shares.
All classes of shares have identical voting, dividend and liquidation rights. Class specific expenses (e.g., distribution and service fees, transfer agency fees, plan administration services fees) differ among classes. Income, expenses (other than class specific expenses) and realized and unrealized gains or losses on investments are allocated to each class of shares based upon its relative net assets.
| 2. | SUMMARY OF SIGNIFICANT ACCOUNTING POLICIES |
Use of estimates
Preparing financial statements that conform to U.S. generally accepted accounting principles requires management to make estimates (e.g., on assets, liabilities and contingent assets and liabilities) that could differ from actual results.
Valuation of securities
All securities are valued at the close of business of the New York Stock Exchange (NYSE). Securities traded on national securities exchanges or included in national market systems are valued at the last quoted sales price from the primary exchange. Debt securities are generally traded in the over-the-counter market and are valued by an independent pricing service using an evaluated bid. When market quotes are not readily available, the pricing service, in determining fair values of debt securities, takes into consideration such factors as current quotations by broker/dealers, coupon, maturity, quality, type of issue, trading characteristics, and other yield and risk factors it deems relevant in determining valuations. The policy adopted by the Board generally contemplates the use of fair valuation in the event that price quotations or valuations are not readily available, price quotations or valuations from other sources are not reflective of market value and thus deemed unreliable, or a significant event has occurred in relation to a security or class of securities that is not reflected in price quotations or valuations from other sources. A fair value price is a good faith estimate of the value of a security at a given point in time.
Short-term securities maturing in more than 60 days from the valuation date are valued at the market price or approximate market value based on current interest rates. Typically, those maturing in 60 days or less that originally had maturities of more than 60 days at acquisition date are valued at amortized cost using the market value on the 61st day before maturity. Short-term securities maturing in 60 days or less at acquisition date are valued at amortized cost. Amortized cost is
36 RIVERSOURCE SHORT DURATION U.S. GOVERNMENT FUND — 2011 ANNUAL REPORT
an approximation of market value. Investments in money market funds are valued at net asset value.
Futures and options on futures are valued daily based upon the last sale price at the close of the market on the principal exchange on which they are traded.
Repurchase agreements
The Fund may enter into repurchase agreements. Generally, securities received as collateral subject to repurchase agreements are deposited with the Fund’s custodian and, pursuant to the terms of the repurchase agreement, must have an aggregate market value greater than or equal to the repurchase price plus accrued interest at all times. The market value of securities held as collateral for repurchase agreements is monitored on a daily basis to ensure the existence of the proper level of collateral.
Securities purchased on a forward-commitment basis
Delivery and payment for securities that have been purchased by the Fund on a forward-commitment basis, including when-issued securities and other forward-commitments, can take place one month or more after the transaction date. During this period, such securities are subject to market fluctuations, and they may affect the Fund’s net assets the same as owned securities. The Fund designates cash or liquid securities at least equal to the amount of its forward-commitments. At May 31, 2011, the Fund has outstanding when-issued securities of $5,647,108.
The Fund also enters into transactions to sell purchase commitments to third parties at current market values and concurrently acquires other purchase commitments for similar securities at later dates. As an inducement for the Fund to “roll over” its purchase commitments, the Fund receives negotiated amounts in the form of reductions of the purchase price of the commitment. The Fund records the incremental difference between the forward purchase and sale of each forward roll as realized gain or loss. Losses may arise due to changes in the value of the securities or if a counterparty does not perform under the terms of the agreement. If a counterparty files for bankruptcy or becomes insolvent, the Fund’s right to repurchase or sell securities may be limited. At May 31, 2011, the Fund had no outstanding mortgage dollar rolls.
Forward sale commitments
The Fund may enter into forward sale commitments to hedge its portfolio positions or to sell mortgage-backed securities it owns under delayed delivery arrangements. Proceeds of forward sale commitments are not received until the contractual settlement date. During the time a forward sale commitment is outstanding, equivalent deliverable securities, or an offsetting forward purchase
RIVERSOURCE SHORT DURATION U.S. GOVERNMENT FUND — 2011 ANNUAL REPORT 37
Notes to Financial Statements (continued)
commitment deliverable on or before the sale commitment date, are used to satisfy the commitment.
Unsettled forward sale commitments are valued at the current market value of the underlying securities, generally according to the procedures described under “Valuation of securities” above. The forward sale commitment is “marked-to-market” daily and the change in market value is recorded by the Fund as an unrealized gain or loss. If the forward sale commitment is closed through the acquisition of an offsetting purchase commitment, the Fund realizes a gain or loss. If the Fund delivers securities under the commitment, the Fund realizes a gain or a loss from the sale of the securities based upon the market price established at the date the commitment was entered into. At May 31, 2011, the Fund had no outstanding forward sale commitments.
Guarantees and indemnifications
Under the Fund’s organizational documents, its officers and directors are indemnified against certain liabilities arising out of the performance of their duties to the Fund. In addition, certain of the Fund’s contracts with its service providers contain general indemnification clauses. The Fund’s maximum exposure under these arrangements is unknown since the amount of any future claims that may be made against the Fund cannot be determined and the Fund has no historical basis for predicting the likelihood of any such claims.
Federal taxes
The Fund’s policy is to comply with Subchapter M of the Internal Revenue Code that applies to regulated investment companies and to distribute substantially all of its taxable income (which includes net short-term capital gains) to shareholders. No provision for income or excise taxes is thus required.
Management of the Fund has concluded that there are no significant uncertain tax positions that would require recognition in the financial statements. Generally, the tax authorities can examine all tax returns filed for the last three years.
Dividends to shareholders
Dividends from net investment income, declared daily and payable monthly, when available, are reinvested in additional shares of the Fund at net asset value or payable in cash. Capital gains, when available, are normally distributed along with the last income dividend of the calendar year.
Other
Security transactions are accounted for on the date securities are purchased or sold. Dividend income, if any, is recognized on the ex-dividend date and interest
38 RIVERSOURCE SHORT DURATION U.S. GOVERNMENT FUND — 2011 ANNUAL REPORT
income, including amortization of premium, market discount and original issue discount using the effective interest method, is accrued daily.
| 3. | DERIVATIVES INSTRUMENTS |
The Fund invests in certain derivative instruments as detailed below to meet its investment objectives. Derivatives are instruments whose values depend on, or are derived from, in whole or in part, the value of one or more other assets, such as securities, currencies, commodities or indices. Derivative instruments may be used to maintain cash reserves while maintaining exposure to certain other assets, to offset anticipated declines in values of investments, to facilitate trading, to reduce transaction costs and to pursue higher investment returns. The Fund may also use derivative instruments to mitigate certain investment risks, such as foreign currency exchange rate risk, interest rate risk and credit risk. Derivatives may involve various risks, including the potential inability of the counterparty to fulfill its obligation under the terms of the contract, the potential for an illiquid secondary market and the potential for market movements which may expose the Fund to gains or losses in excess of the amount shown in the Statement of Assets and Liabilities.
The Fund and any counterparty are required to maintain an agreement that requires the Fund and that counterparty to monitor (on a daily basis) the net fair value of all derivatives entered into pursuant to the contract between the Fund and such counterparty. If the net fair value of such derivatives between the Fund and that counterparty exceeds a certain threshold (as defined in the agreement), the Fund or the counterparty (as the case may be) is required to post cash and/or securities as collateral. Fair values of derivatives presented in the financial statements are not netted with the fair value of other derivatives or with any collateral amounts posted by the Fund or any counterparty.
Futures contracts
Futures contracts represent commitments for the future purchase or sale of an asset at a specified price on a specified date. The Fund bought and sold futures contracts to manage the duration and yield curve exposure of the Fund versus the benchmark and manage exposure to movements in interest rates. Upon entering into futures contracts, the Fund bears risks which may include interest rates, exchange rates or securities prices moving unexpectedly, in which case, the Fund may not achieve the anticipated benefits of the futures contracts and may realize a loss. Additional risks include counterparty credit risk, the possibility of an illiquid market, and that a change in the value of the contract or option may not correlate with changes in the value of the underlying asset.
RIVERSOURCE SHORT DURATION U.S. GOVERNMENT FUND — 2011 ANNUAL REPORT 39
Notes to Financial Statements (continued)
Upon entering into a futures contract, the Fund pledges cash or securities with the broker in an amount sufficient to meet the initial margin requirement. Subsequent payments (variation margin) are made or received by the Fund each day. The variation margin payments are equal to the daily change in the contract value and are recorded as variation margin receivable or payable and are offset in unrealized gains or losses. The Fund recognizes a realized gain or loss when the contract is closed or expires. Futures contracts involve, to varying degrees, risk of loss in excess of the variation margin disclosed in the Statement of Assets and Liabilities.
Effects of derivative transactions on the financial statements
The following tables are intended to provide additional information about the effect of derivatives on the financial statements of the Fund including: the fair value of derivatives by risk category and the location of those fair values in the Statement of Assets and Liabilities; the impact of derivative transactions on the Fund’s operations over the period including realized gains or losses and unrealized gains or losses. The derivative schedules following the Portfolio of Investments present additional information regarding derivative instruments outstanding at the end of the period, if any.
Fair values of derivative instruments at May 31, 2011
At May 31, 2011, the Fund had no outstanding derivatives.
Effect of derivative instruments in the Statement of Operations
for the year ended May 31, 2011
for the year ended May 31, 2011
| Amount of realized gain (loss) on derivatives recognized in income | ||||||
| Risk exposure category | Futures | |||||
| Interest rate contracts | $ | (2,381,079 | ) | |||
| Change in unrealized appreciation (depreciation) on derivatives recognized in income | ||||||
| Risk exposure category | Futures | |||||
| Interest rate contracts | $ | 269,303 | ||||
Volume of derivative instruments for the year ended May 31, 2011
| Contracts | ||||||
| opened | ||||||
| Futures contracts | 3,009 | |||||
40 RIVERSOURCE SHORT DURATION U.S. GOVERNMENT FUND — 2011 ANNUAL REPORT
| 4. | EXPENSES AND SALES CHARGES |
Investment management services fees
Under an Investment Management Services Agreement, the Investment Manager determines which securities will be purchased, held or sold. The management fee is an annual fee that is equal to a percentage of the Fund’s average daily net assets that declines from 0.48% to 0.25% as the Fund’s net assets increase. The management fee for the year ended May 31, 2011 was 0.48% of the Fund’s average daily net assets.
Administrative services fees
Under an Administrative Services Agreement, Columbia Management Investment Advisers, LLC serves as the Fund Administrator. The Fund pays the Fund Administrator an annual fee for administration and accounting services equal to a percentage of the Fund’s average daily net assets that declines from 0.07% to 0.04% as the Fund’s net assets increase. The fee for the year ended May 31, 2011 was 0.07% of the Fund’s average daily net assets. Prior to Jan. 1, 2011, Ameriprise Financial, Inc. served as the Fund Administrator.
Other fees
Other expenses are for, among other things, certain expenses of the Fund or the Board including: Fund boardroom and office expense, employee compensation, employee health and retirement benefits, and certain other expenses. Payment of these Fund and Board expenses is facilitated by a company providing limited administrative services to the Fund and the Board. For the year ended May 31, 2011, other expenses paid to this company were $1,077.
Compensation of board members
Under a Deferred Compensation Plan (the Plan), the board members who are not “interested persons” of the Fund as defined under the 1940 Act may defer receipt of their compensation. Deferred amounts are treated as though equivalent dollar amounts had been invested in shares of the Fund or certain other funds managed by the Investment Manager. The Fund’s liability for these amounts is adjusted for market value changes and remains in the Fund until distributed in accordance with the Plan.
Transfer agency fees
Under a Transfer Agency Agreement, Columbia Management Investment Services Corp. (the Transfer Agent) is responsible for providing transfer agency services to the Fund. The Transfer Agent has contracted with Boston Financial Data Services (BFDS) to serve as sub-transfer agent. The Transfer Agent receives monthly account-based service fees based on the number of open accounts and is reimbursed by the Fund for the fees and expenses the Transfer Agent pays to
RIVERSOURCE SHORT DURATION U.S. GOVERNMENT FUND — 2011 ANNUAL REPORT 41
Notes to Financial Statements (continued)
financial intermediaries that maintain omnibus accounts with the Fund subject to an annual limitation (that varies by class) that is a percentage of the average aggregate value of the Fund’s shares maintained in each such omnibus account (other than omnibus accounts for which American Enterprise Investment Services Inc. is the broker of record or accounts where the beneficial shareholder is a customer of Ameriprise Financial Services, Inc., which are paid a per account fee). The Transfer Agent pays the fees of BFDS for services as sub-transfer agent and is not entitled to reimbursement for such fees from the Fund. Total transfer agent fees for Class R4 shares are subject to an annual limitation of not more than 0.05% of the average daily net assets attributable to the share class. Class I does not pay transfer agent fees. The Transfer Agent also receives compensation from fees for various shareholder services and reimbursements for certain out-of-pocket expenses.
For the year ended May 31, 2011, the Fund’s effective transfer agent fee rates as a percentage of average daily net assets of each class were as follows:
| Class A | 0.18 | % | ||
| Class B | 0.20 | |||
| Class C | 0.18 | |||
| Class R | 0.14 | |||
| Class R4 | 0.05 | |||
| Class W | 0.17 |
The Fund and certain other associated investment companies (together, the Guarantors) have severally, but not jointly, guaranteed the performance and observance of all the terms and conditions of a lease entered into by Seligman Data Corp. (SDC), the former transfer agent of Seligman U.S. Government Securities Fund, which was acquired by the Fund on Aug. 28, 2009 (see Note 11), including the payment of rent by SDC (the Guaranty). The lease and the Guaranty expire in January 2019. At May 31, 2011, the Fund’s total potential future obligation over the life of the Guaranty is $83,699. The liability remaining at May 31, 2011 for non-recurring charges associated with the lease amounted to $54,807 and is included within other accrued expenses in the Statement of Assets and Liabilities.
Plan administration services fees
Under a Plan Administration Services Agreement with the Transfer Agent, the Fund pays an annual fee at a rate of 0.25% of the Fund’s average daily net assets attributable to Class R4 shares for the provision of various administrative, recordkeeping, communication and educational services.
42 RIVERSOURCE SHORT DURATION U.S. GOVERNMENT FUND — 2011 ANNUAL REPORT
Distribution fees
The Fund has an agreement with Columbia Management Investment Distributors, Inc. (the Distributor) for distribution and shareholder services. Under a Plan and Agreement of Distribution pursuant to Rule 12b-1, the Fund paid a fee at an annual rate of up to 0.25% of the Fund’s average daily net assets attributable to Class A and Class W shares, a fee at an annual rate of up to 0.50% of the Fund’s average daily net assets attributable to Class R shares (of which up to 0.25% may be used for services) and a fee at an annual rate of up to 1.00% of the Fund’s average daily net assets attributable to Class B and Class C shares. For Class B and Class C shares, of the 1.00% fee, up to 0.75% is reimbursed for distribution expenses.
The amount of distribution expenses incurred by the Distributor and not yet reimbursed (unreimbursed expense) was approximately $3,342,000 and $1,578,000 for Class B and Class C shares, respectively. These amounts are based on the most recent information available as of Jan. 31, 2011, and may be recovered from future payments under the distribution plan or CDSCs. To the extent the unreimbursed expense has been fully recovered, the distribution fee is reduced.
Sales charges
Sales charges, including front-end and CDSCs, received by the Distributor for distributing Fund shares were $267,350 for Class A, $24,210 for Class B and $3,840 for Class C for the year ended May 31, 2011.
Expenses waived/reimbursed by the Investment Manager and its affiliates
Effective Aug. 1, 2010 the Investment Manager and its affiliates have contractually agreed to waive certain fees and reimburse certain expenses until July 31, 2011, unless sooner terminated at the sole discretion of the Board, such that net expenses (excluding fees and expenses of acquired funds and any reorganization costs allocated to the Fund) will not exceed the following percentage of the class’ average daily net assets:
| Class A | 0.84 | % | ||
| Class B | 1.60 | |||
| Class C | 1.60 | |||
| Class I | 0.44 | |||
| Class R | 1.24 | |||
| Class R4 | 0.74 | |||
| Class W | 0.89 |
Prior to Aug. 1, 2010, the Investment Manager and its affiliates contractually agreed to waive certain fees and reimburse certain expenses such that net
RIVERSOURCE SHORT DURATION U.S. GOVERNMENT FUND — 2011 ANNUAL REPORT 43
Notes to Financial Statements (continued)
expenses (excluding fees and expenses of acquired funds) would not exceed the following percentage of the class’ average daily net assets:
| Class A | 0.86 | % | ||
| Class B | 1.62 | |||
| Class C | 1.62 | |||
| Class I | 0.48 | |||
| Class R | 1.28 | |||
| Class R4 | 0.78 | |||
| Class W | 0.93 |
In addition to the fees and expenses which the Fund bears directly, the Fund indirectly bears a pro rata share of the fees and expenses of the funds in which it invests (also referred to as “acquired funds”), including affiliated and non-affiliated pooled investment vehicles (including mutual funds and exchange traded funds). Because the acquired funds have varied expense and fee levels and the Fund may own different proportions of acquired funds at different times, the amount of fees and expenses incurred indirectly by the Fund will vary.
| 5. | SECURITIES TRANSACTIONS |
Cost of purchases and proceeds from sales of securities (other than short-term obligations, but including mortgage dollar rolls) aggregated $1,371,625,592 and $1,525,064,209, respectively, for the year ended May 31, 2011. Realized gains and losses are determined on an identified cost basis.
| 6. | CAPITAL SHARE TRANSACTIONS |
Transactions in shares of capital stock for the periods indicated were as follows:
| Year ended May 31, | 2011 | 2010(a) | ||||||
Class A | ||||||||
| Sold | 12,544,551 | 18,853,705 | ||||||
| Fund merger | N/A | 7,186,369 | ||||||
Converted from Class B(b) | 4,818,437 | 5,576,336 | ||||||
| Reinvested distributions | 1,315,603 | 2,438,534 | ||||||
| Redeemed | (32,681,862 | ) | (45,489,263 | ) | ||||
| Net increase (decrease) | (14,003,271 | ) | (11,434,319 | ) | ||||
44 RIVERSOURCE SHORT DURATION U.S. GOVERNMENT FUND — 2011 ANNUAL REPORT
| Year ended May 31, | 2011 | 2010(a) | ||||||
Class B | ||||||||
| Sold | 936,102 | 1,600,644 | ||||||
| Fund merger | N/A | 1,049,408 | ||||||
| Reinvested distributions | 70,352 | 283,399 | ||||||
Converted to Class A(b) | (4,828,320 | ) | (5,576,350 | ) | ||||
| Redeemed | (3,351,659 | ) | (7,723,130 | ) | ||||
| Net increase (decrease) | (7,173,525 | ) | (10,366,029 | ) | ||||
Class C | ||||||||
| Sold | 1,447,347 | 1,563,844 | ||||||
| Fund merger | N/A | 3,561,144 | ||||||
| Reinvested distributions | 36,761 | 64,062 | ||||||
| Redeemed | (1,929,354 | ) | (2,103,348 | ) | ||||
| Net increase (decrease) | (445,246 | ) | 3,085,702 | |||||
Class I | ||||||||
| Sold | 1,268,672 | 6,758,907 | ||||||
| Reinvested distributions | 271,356 | 322,307 | ||||||
| Redeemed | (1,166,452 | ) | (1,885,792 | ) | ||||
| Net increase (decrease) | 373,576 | 5,195,422 | ||||||
Class R | ||||||||
| Sold | 382,382 | 201,664 | ||||||
| Fund merger | N/A | 728,900 | ||||||
| Reinvested distributions | 2,130 | 1,739 | ||||||
| Redeemed | (284,401 | ) | (300,411 | ) | ||||
| Net increase (decrease) | 100,111 | 631,892 | ||||||
Class R4 | ||||||||
| Sold | 288,525 | 522,899 | ||||||
| Reinvested distributions | 15,195 | 21,965 | ||||||
| Redeemed | (365,854 | ) | (487,406 | ) | ||||
| Net increase (decrease) | (62,134 | ) | 57,458 | |||||
| (a) | Class R is for the period from Aug. 3, 2009 (when shares became available) to May 31, 2010. | |
| (b) | Automatic conversion of Class B shares to Class A shares based on the original purchase date. |
| 7. | LENDING OF PORTFOLIO SECURITIES |
The Fund has entered into a Master Securities Lending Agreement (the Agreement) with JPMorgan Chase Bank, National Association (JPMorgan). The Agreement authorizes JPMorgan as lending agent to lend securities to authorized borrowers in order to generate additional income on behalf of the Fund. Pursuant to the Agreement, the securities loaned are secured by cash or U.S. government securities equal to at least 100% of the market value of the loaned securities.
RIVERSOURCE SHORT DURATION U.S. GOVERNMENT FUND — 2011 ANNUAL REPORT 45
Notes to Financial Statements (continued)
Any additional collateral required to maintain those levels due to market fluctuations of the loaned securities is delivered the following business day. Cash collateral received is invested by the lending agent on behalf of the Fund into authorized investments pursuant to the Agreement. The investments made with the cash collateral are listed in the Portfolio of Investments. The values of such investments and any uninvested cash collateral are disclosed in the Statement of Assets and Liabilities along with the related obligation to return the collateral upon the return of the securities loaned. At May 31, 2011, the Fund had no securities on loan.
Risks of delay in recovery of securities or even loss of rights in the securities may occur should the borrower of the securities fail financially. Risks may also arise to the extent that the value of the securities loaned increases above the value of the collateral received. JPMorgan will indemnify the Fund from losses resulting from a borrower’s failure to return a loaned security when due. Such indemnification does not extend to losses associated with declines in the value of cash collateral investments. The Investment Manager is not responsible for any losses incurred by the Fund in connection with the securities lending program. Loans are subject to termination by the Fund or the borrower at any time, and are, therefore, not considered to be illiquid investments.
Pursuant to the Agreement, the Fund receives income for lending its securities either in the form of fees or by earning interest on invested cash collateral, net of negotiated rebates paid to borrowers and fees paid to the lending agent for services provided and any other securities lending expenses. Net income of $70,725 earned from securities lending for the year ended May 31, 2011 is included in the Statement of Operations. The Fund also continues to earn interest and dividends on the securities loaned.
| 8. | AFFILIATED MONEY MARKET FUND |
The Fund may invest its daily cash balance in Columbia Short-Term Cash Fund, a money market fund established for the exclusive use of certain funds managed by the Investment Manager and other institutional clients of the Investment Manager. The cost of the Fund’s purchases and proceeds from sales of shares of Columbia Short-Term Cash Fund aggregated $375,868,990 and $377,760,339, respectively, for the year ended May 31, 2011. The income distributions received with respect to the Fund’s investment in Columbia Short-Term Cash Fund can be found in the Statement of Operations and the Fund’s invested balance in Columbia Short-Term Cash Fund at May 31, 2011, can be found in the Portfolio of Investments.
46 RIVERSOURCE SHORT DURATION U.S. GOVERNMENT FUND — 2011 ANNUAL REPORT
| 9. | BANK BORROWINGS |
The Fund has entered into a revolving credit facility with a syndicate of banks led by JPMorgan Chase Bank, N.A. (the Administrative Agent), whereby the Fund may borrow for the temporary funding of shareholder redemptions or for other temporary or emergency purposes. The credit facility became effective on Oct. 14, 2010, replacing a prior credit facility. The credit facility agreement, as amended, which is a collective agreement between the Fund and certain other funds managed by the Investment Manager, severally and not jointly, permits collective borrowings up to $300 million. Pursuant to a March 28, 2011 amendment to the credit facility agreement, the collective borrowing amount will be increased in two stages during the third quarter of 2011 to a final collective borrowing amount of $500 million. Interest is charged to each fund based on its borrowings at a rate equal to the sum of the federal funds rate plus (i) 1.25% per annum plus (ii) if one-month LIBOR exceeds the federal funds rate, the amount of such excess. Each borrowing under the credit facility matures no later than 60 days after the date of borrowing. The Fund also pays a commitment fee equal to its pro rata share of the amount of the credit facility at a rate of 0.10% per annum.
Prior to March 28, 2011, the credit facility agreement, which was a collective agreement between the Fund and certain other funds managed by the Investment Manager, severally and not jointly, permitted collective borrowings up to $300 million. The borrowers had the right, upon written notice to the Administrative Agent, to request an increase of up to $200 million in the aggregate amount of the credit facility from new or existing lenders, provided that the aggregate amount of the credit facility at no could time exceed $500 million. The Fund also paid a commitment fee equal to its pro rata share of the amount of the credit facility at a rate of 0.10% per annum. Prior to Oct. 14, 2010, the Fund also paid an upfront fee equal to its pro rata share of 0.04% of the amount of the credit facility. The Fund had no borrowings during the year ended May 31, 2011.
| 10. | PROCEEDS FROM REGULATORY SETTLEMENT |
During the year ended May 31, 2010, as a result of a settlement of an administrative proceeding brought by the Securities and Exchange Commission against an unaffiliated third party relating to market timing and/or late trading of mutual funds, the Fund received $112,925, which represented the Fund’s portion of the proceeds from the settlement (the Fund was not a party to the proceeding). The proceeds received by the Fund were recorded as an increase to additional paid-in capital.
RIVERSOURCE SHORT DURATION U.S. GOVERNMENT FUND — 2011 ANNUAL REPORT 47
Notes to Financial Statements (continued)
| 11. | FUND MERGER |
At the close of business on Aug. 28, 2009, RiverSource Short Duration U.S. Government Fund acquired the assets and assumed the identified liabilities of Seligman U.S. Government Securities Fund. The merger was completed after shareholders of the acquired fund approved the plan on June 29, 2009.
The aggregate net assets of RiverSource Short Duration U.S. Government Fund immediately before the acquisition were $655,221,348 and the combined net assets immediately after the acquisition were $713,992,375.
The acquisition was accomplished by a tax-free exchange of 8,071,788 shares of Seligman U.S. Government Securities Fund valued at $58,771,027.
In exchange for Seligman U.S. Government Securities Fund shares, RiverSource Short Duration U.S. Government Fund issued the following number of shares:
| Shares | ||||
| Class A | 7,186,369 | |||
| Class B | 1,049,408 | |||
| Class C | 3,561,144 | |||
| Class R | 728,900 | |||
For financial reporting purposes, net assets received and shares issued by RiverSource Short Duration U.S. Government Fund were recorded at fair value; however, Seligman U.S. Government Securities Fund’s cost of investments was carried forward to align ongoing reporting of RiverSource Short Duration U.S. Government Fund’s realized and unrealized gains and losses with amounts distributable to shareholders for tax purposes.
The components of Seligman U.S. Government Securities Fund’s net assets after adjustments for any permanent book-to-tax differences at the merger date were as follows:
| Total net assets | $ | 58,771,027 | ||
| Capital stock | 62,591,453 | |||
| Excess of distributions over net investment income | (59,434 | ) | ||
| Accumulated net realized loss | (5,240,048 | ) | ||
| Unrealized appreciation | 1,479,056 |
The financial statements reflect the operations of RiverSource Short Duration U.S. Government Fund for the period prior to the merger and the combined Fund for the period subsequent to the merger. Because the combined investment portfolios have been managed as a single integrated portfolio since the merger was completed, it is not practicable to separate the amounts of revenue and earnings of Seligman U.S. Government Securities Fund that have been included
48 RIVERSOURCE SHORT DURATION U.S. GOVERNMENT FUND — 2011 ANNUAL REPORT
in the combined Fund’s Statement of Operations since the merger was completed. Assuming the merger had been completed on June 1, 2009, RiverSource Short Duration U.S. Government Fund’s pro-forma net investment income, net gain on investments, and net increase in net assets from operations for the year ended May 31, 2010 would have been $15.4 million, $4.5 million, and $32.6 million, respectively.
| 12. | FEDERAL TAX INFORMATION |
Net investment income (loss) and net realized gains (losses) may differ for financial statement and tax purposes primarily because of futures and options contracts, recognition of unrealized appreciation (depreciation) for certain derivative investments, post-October losses and losses deferred due to wash sales. The character of distributions made during the year from net investment income or net realized gains may differ from their ultimate characterization for federal income tax purposes. Also, due to the timing of dividend distributions, the fiscal year in which amounts are distributed may differ from the year that the income or realized gains were recorded by the Fund.
In the Statement of Assets and Liabilities, as a result of permanent book-to-tax differences, undistributed net investment income has been increased by $1,509,613 and accumulated net realized loss has been increased by $1,509,613.
The tax character of distributions paid for the years indicated was as follows:
| Year ended May 31, | 2011 | 2010 | ||||||
| Ordinary income | $ | 10,282,937 | $ | 16,190,150 | ||||
| Long-term capital gain | — | — | ||||||
At May 31, 2011, the components of distributable earnings on a tax basis were as follows:
| Undistributed ordinary income | $ | 1,727,410 | ||
| Undistributed accumulated long-term gain | $ | — | ||
| Accumulated realized loss | $ | (92,174,380 | ) | |
| Unrealized appreciation (depreciation) | $ | 6,490,101 |
For federal income tax purposes, the Fund had a capital loss carry-over of $90,483,670 at May 31, 2011, that if not offset by capital gains will expire as follows:
| 2013 | 2014 | 2015 | 2017 | 2018 | ||||||||||||||
| $ | 36,267,962 | $ | 22,145,044 | $ | 9,579,187 | $ | 3,846,817 | $ | 18,644,660 | |||||||||
RIVERSOURCE SHORT DURATION U.S. GOVERNMENT FUND — 2011 ANNUAL REPORT 49
Notes to Financial Statements (continued)
For the year ended May 31, 2011, $3,529,272 of capital loss carry-over was utilized. It is unlikely the Board will authorize a distribution of any net realized capital gains until the available capital loss carry-over has been offset or expires. There is no assurance that the Fund will be able to utilize all of its capital loss carry-over before it expires.
Because the measurement periods for a regulated investment company’s income are different for excise tax purposes versus income tax purposes, special rules are in place to protect the amount of earnings and profits needed to support excise tax distributions. As a result, the Fund is permitted to treat net capital losses realized between Nov. 1, 2010 and its fiscal year end (post-October loss) as occurring on the first day of the following tax year. At May 31, 2011, the Fund had a post-October loss of $1,690,710 that is treated for income tax purposes as occurring on June 1, 2011.
| 13. | SUBSEQUENT EVENTS |
Management has evaluated Fund related events and transactions that occurred during the period from the date of the Statement of Assets and Liabilities through the date of issuance of the Fund’s financial statements. There were no events or transactions that occurred during the period that materially impacted the amounts or disclosures in the Fund’s financial statements, other than as noted below.
At a shareholder meeting on Feb. 15, 2011, shareholders approved the merger of RiverSource Short Duration U.S. Government Fund into Columbia Short Term Bond Fund. As of the close of business on June 3, 2011, the Fund was merged into Columbia Short Term Bond Fund.
| 14. | INFORMATION REGARDING PENDING AND SETTLED LEGAL PROCEEDINGS |
In June 2004, an action captioned John E. Gallus et al. v. American Express Financial Corp. and American Express Financial Advisors Inc. was filed in the United States District Court for the District of Arizona. The plaintiffs allege that they are investors in several American Express Company mutual funds (branded as Columbia or RiverSource) and they purport to bring the action derivatively on behalf of those funds under the Investment Company Act of 1940. The plaintiffs allege that fees allegedly paid to the defendants by the funds for investment advisory and administrative services are excessive. The plaintiffs seek remedies including restitution and rescission of investment advisory and distribution agreements. The plaintiffs voluntarily agreed to transfer this case to the United States District Court for the District of Minnesota (the District Court). In response to defendants’ motion to dismiss the complaint, the District Court
50 RIVERSOURCE SHORT DURATION U.S. GOVERNMENT FUND — 2011 ANNUAL REPORT
dismissed one of plaintiffs’ four claims and granted plaintiffs limited discovery. Defendants moved for summary judgment in April 2007. Summary judgment was granted in the defendants’ favor on July 9, 2007. The plaintiffs filed a notice of appeal with the Eighth Circuit Court of Appeals (the Eighth Circuit) on August 8, 2007. On April 8, 2009, the Eighth Circuit reversed summary judgment and remanded to the District Court for further proceedings. On August 6, 2009, defendants filed a writ of certiorari with the U.S. Supreme Court (the Supreme Court), asking the Supreme Court to stay the District Court proceedings while the Supreme Court considers and rules in a case captioned Jones v. Harris Associates, which involves issues of law similar to those presented in the Gallus case. On March 30, 2010, the Supreme Court issued its ruling in Jones v. Harris Associates, and on April 5, 2010, the Supreme Court vacated the Eighth Circuit’s decision in the Gallus case and remanded the case to the Eighth Circuit for further consideration in light of the Supreme Court’s decision in Jones v. Harris Associates. On June 4, 2010, the Eighth Circuit remanded the Gallus case to the District Court for further consideration in light of the Supreme Court’s decision in Jones v. Harris Associates. On December 9, 2010, the District Court reinstated its July 9, 2007 summary judgment order in favor of the defendants. On January 10, 2011, plaintiffs filed a notice of appeal with the Eighth Circuit. In response to the plaintiffs’ opening appellate brief filed on March 18, 2011, the defendants filed a response brief on May 4, 2011 with the Eight Circuit. The plaintiffs filed a reply brief on May 26, 2011.
In December 2005, without admitting or denying the allegations, American Express Financial Corporation (AEFC, which is now known as Ameriprise Financial, Inc. (Ameriprise Financial)), entered into settlement agreements with the Securities and Exchange Commission (SEC) and Minnesota Department of Commerce (MDOC) related to market timing activities. As a result, AEFC was censured and ordered to cease and desist from committing or causing any violations of certain provisions of the Investment Advisers Act of 1940, the Investment Company Act of 1940, and various Minnesota laws. AEFC agreed to pay disgorgement of $10 million and civil money penalties of $7 million. AEFC also agreed to retain an independent distribution consultant to assist in developing a plan for distribution of all disgorgement and civil penalties ordered by the SEC in accordance with various undertakings detailed at www.sec.gov/litigation/admin/ia-2451.pdf. Ameriprise Financial and its affiliates have cooperated with the SEC and the MDOC in these legal proceedings, and have made regular reports to the funds’ Boards of Directors/Trustees.
Ameriprise Financial and certain of its affiliates have historically been involved in a number of legal, arbitration and regulatory proceedings, including routine litigation, class actions, and governmental actions, concerning matters arising in
RIVERSOURCE SHORT DURATION U.S. GOVERNMENT FUND — 2011 ANNUAL REPORT 51
Notes to Financial Statements (continued)
connection with the conduct of their business activities. Ameriprise Financial believes that the Funds are not currently the subject of, and that neither Ameriprise Financial nor any of its affiliates are the subject of, any pending legal, arbitration or regulatory proceedings that are likely to have a material adverse effect on the Funds or the ability of Ameriprise Financial or its affiliates to perform under their contracts with the Funds. Ameriprise Financial is required to make 10-Q, 10-K and, as necessary, 8-K filings with the Securities and Exchange Commission on legal and regulatory matters that relate to Ameriprise Financial and its affiliates. Copies of these filings may be obtained by accessing the SEC website at www.sec.gov.
There can be no assurance that these matters, or the adverse publicity associated with them, will not result in increased fund redemptions, reduced sale of fund shares or other adverse consequences to the Funds. Further, although we believe proceedings are not likely to have a material adverse effect on the Funds or the ability of Ameriprise Financial or its affiliates to perform under their contracts with the Funds, these proceedings are subject to uncertainties and, as such, we are unable to estimate the possible loss or range of loss that may result. An adverse outcome in one or more of these proceedings could result in adverse judgments, settlements, fines, penalties or other relief that could have a material adverse effect on the consolidated financial condition or results of operations of Ameriprise Financial.
52 RIVERSOURCE SHORT DURATION U.S. GOVERNMENT FUND — 2011 ANNUAL REPORT
Report of Independent Registered Public Accounting Firm
To the Board of Directors and Shareholders of
RiverSource Short Duration U.S. Government Fund:
RiverSource Short Duration U.S. Government Fund:
We have audited the accompanying statement of assets and liabilities, including the portfolio of investments, of RiverSource Short Duration U.S. Government Fund (the Fund) (one of the portfolios constituting the RiverSource Government Income Series, Inc.) as of May 31, 2011, and the related statement of operations for the year then ended, the statements of changes in net assets for each of the two years in the period then ended, and the financial highlights for each of the four years in the period then ended. These financial statements and financial highlights are the responsibility of the Fund’s management. Our responsibility is to express an opinion on these financial statements and financial highlights based on our audits. The financial highlights of the Fund for the period presented through May 31, 2007, were audited by other auditors whose report dated July 20, 2007, expressed an unqualified opinion on those financial highlights.
We conducted our audits in accordance with the standards of the Public Company Accounting Oversight Board (United States). Those standards require that we plan and perform the audit to obtain reasonable assurance about whether the financial statements and financial highlights are free of material misstatement. We were not engaged to perform an audit of the Fund’s internal control over financial reporting. Our audits included consideration of internal control over financial reporting as a basis for designing audit procedures that are appropriate in the circumstances, but not for the purpose of expressing an opinion on the effectiveness of the Fund’s internal control over financial reporting. Accordingly, we express no such opinion. An audit also includes examining, on a test basis, evidence supporting the amounts and disclosures in the financial statements and financial highlights, assessing the accounting principles used and significant estimates made by management, and evaluating the overall financial statement presentation. Our procedures included confirmation of securities owned as of May 31, 2011, by correspondence with the custodian and brokers, or by other appropriate auditing procedures where replies from brokers were not received. We believe that our audits provide a reasonable basis for our opinion.
RIVERSOURCE SHORT DURATION U.S. GOVERNMENT FUND — 2011 ANNUAL REPORT 53
Report of Independent Registered Public Accounting Firm (continued)
In our opinion, the financial statements and financial highlights referred to above present fairly, in all material respects, the financial position of RiverSource Short Duration U.S. Government Fund of the RiverSource Government Income Series, Inc. at May 31, 2011, the results of its operations for the year then ended, the changes in its net assets for each of the two years in the period then ended, and the financial highlights for each of the four years in the period then ended, in conformity with U.S. generally accepted accounting principles.

Minneapolis, Minnesota
July 22, 2011
54 RIVERSOURCE SHORT DURATION U.S. GOVERNMENT FUND — 2011 ANNUAL REPORT
Federal Income Tax Information
(Unaudited)
The Fund is required by the Internal Revenue Code of 1986 to tell its shareholders about the tax treatment of the dividends it pays during its fiscal year. The dividends listed below are reported to you on Form 1099-DIV, Dividends and Distributions. Shareholders should consult a tax advisor on how to report distributions for state and local tax purposes.
Fiscal year ended May 31, 2011
| Income distributions – the Fund designates the following tax attributes for distributions: | ||
| Qualified Dividend Income for individuals | 0.00% | |
| Dividends Received Deduction for corporations | 0.00% | |
| U.S. Government Obligations | 20.88% | |
The Fund designates as distributions of long-term gains, to the extent necessary to fully distribute such capital gains, earnings and profits distributed to shareholders on the redemption of shares.
RIVERSOURCE SHORT DURATION U.S. GOVERNMENT FUND — 2011 ANNUAL REPORT 55
Board Members and Officers
Shareholders elect the Board that oversees the funds’ operations. The Board appoints officers who are responsible for day-to-day business decisions based on policies set by the Board. The following table provides basic biographical information about the funds’ Board members, including their principal occupations during the past five years, although specific titles for individuals may have varied over the period. Under current Board policy, members may serve until the next Board meeting after he or she reaches the mandatory retirement age established by the Board, or the fifteenth anniversary of the first Board meeting they attended as a member of the Board.
On Sept. 29, 2009, Ameriprise Financial, the parent company of Columbia Management, entered into an agreement with Bank of America, N.A. (“Bank of America”) to acquire a portion of the asset management business of Columbia Management Group, LLC and certain of its affiliated companies (the “Transaction”). Following the Transaction, which became effective on May 1, 2010, various alignment activities have occurred with respect to the Fund Family. In connection with the Transaction, Mr. Edward J. Boudreau, Jr., Mr. William P. Carmichael, Mr. William A. Hawkins, Mr. R. Glenn Hilliard, Mr. John J. Nagorniak, Ms. Minor M. Shaw and Dr. Anthony M. Santomero, who were members of the Legacy Columbia Nations funds’ Board (“Nations Funds”), which includes Columbia Funds Series Trust, Columbia Funds Variable Insurance Trust I and Columbia Funds Master Investment Trust, LLC, prior to the Transaction, began service on the Board for the Legacy RiverSource funds (“RiverSource Funds”) effective June 1, 2011, which resulted in an overall increase from twelve directors/trustees to sixteen for all funds overseen by the Board.
Independent Board Members
| Number of | ||||||||
| funds in the | ||||||||
| Name, | Position held | Fund Family | Other present or | |||||
| address, | with funds and | Principal occupation | overseen by | past directorships/ trusteeships (within | ||||
| age | length of service | during past five years | Board member | past 5 years) | ||||
| Kathleen Blatz 901 S. Marquette Ave. Minneapolis, MN 55402 Age 56 | Board member since 1/06 for RiverSource Funds and since 6/11 for Nations Funds | Attorney; Chief Justice, Minnesota Supreme Court, 1998-2006 | 157 | None | ||||
| Edward J. Boudreau, Jr. 225 Franklin Street Mail Drop BX32 05228 Boston, MA 02110 Age 66 | Board member since 6/11 for RiverSource Funds and since 1/05 for Nations Funds | Managing Director, E.J. Boudreau & Associates (consulting) since 2000 | 147 | Former Trustee, BofA Funds Series Trust (11 funds) | ||||
56 RIVERSOURCE SHORT DURATION U.S. GOVERNMENT FUND — 2011 ANNUAL REPORT
Independent Board Members (continued)
| Number of | ||||||||
| funds in the | ||||||||
| Name, | Position held | Fund Family | Other present or | |||||
| address, | with funds and | Principal occupation | overseen by | past directorships/ trusteeships (within | ||||
| age | length of service | during past five years | Board member | past 5 years) | ||||
| Pamela G. Carlton 901 S. Marquette Ave. Minneapolis, MN 55402 Age 56 | Board member since 7/07 for RiverSource Funds and since 6/11 for Nations Funds | President, Springboard-Partners in Cross Cultural Leadership (consulting company) | 157 | None | ||||
| William P. Carmichael 225 Franklin Street Mail Drop BX32 05228 Boston, MA 02110 Age 67 | Board member since 6/11 for RiverSource Funds and since 1999 for Nations Funds | Retired | 147 | Director, Cobra Electronics Corporation (electronic equipment manufacturer); The Finish Line (athletic shoes and apparel); McMoRan Exploration Company (oil and gas exploration and development); former Trustee, BofA Funds Series Trust (11 funds); former Director, Spectrum Brands, Inc. (consumer products); former Director, Simmons Company (bedding) | ||||
| Patricia M. Flynn 901 S. Marquette Ave. Minneapolis, MN 55402 Age 60 | Board member since 11/04 for RiverSource Funds and since 6/11 for Nations Funds | Trustee Professor of Economics and Management, Bentley University; former Dean, McCallum Graduate School of Business, Bentley University | 157 | None | ||||
| William A. Hawkins 225 Franklin Street Mail Drop BX32 05228 Boston, MA 02110 Age 68 | Board member since 6/11 for RiverSource Funds and since 1/05 for Nations Funds | Managing Director, Overton Partners (financial consulting), since August 2010; President and Chief Executive Officer, California General Bank, N.A., January 2008-August 2010 | 147 | Trustee, BofA Funds Series Trust (11 funds) | ||||
RIVERSOURCE SHORT DURATION U.S. GOVERNMENT FUND — 2011 ANNUAL REPORT 57
Board Members and Officers (continued)
Independent Board Members (continued)
| Number of | ||||||||
| funds in the | ||||||||
| Name, | Position held | Fund Family | Other present or | |||||
| address, | with funds and | Principal occupation | overseen by | past directorships/ trusteeships (within | ||||
| age | length of service | during past five years | Board member | past 5 years) | ||||
| R. Glenn Hilliard 225 Franklin Street Mail Drop BX32 05228 Boston, MA 02110 Age 68 | Board member since 6/11 for RiverSource Funds and since 1/05 for Nations Funds | Chairman and Chief Executive Officer, Hilliard Group LLC (investing and consulting), since April 2003; Non-Executive Director & Chairman, CNO Financial Group, Inc. (formerly Conseco, Inc.) (insurance), from September 2003 to May 2011 | 147 | Chairman, BofA Fund Series Trust (11 funds); former Director, CNO Financial Group, Inc. (insurance) | ||||
| Stephen R. Lewis, Jr. 901 S. Marquette Ave. Minneapolis, MN 55402 Age 72 | Chair of the Board for RiverSource Funds since 1/07, Board member for RiverSource Funds since 1/02 and since 6/11 for Nations Funds | President Emeritus and Professor of Economics, Carleton College | 157 | Valmont Industries, Inc. (manufactures irrigation systems) | ||||
| John F. Maher 901 S. Marquette Ave. Minneapolis, MN 55402 Age 68 | Board member since 12/08 for RiverSource Funds and since 6/11 for Nations Funds | Retired President and Chief Executive Officer and former Director, Great Western Financial Corporation (financial services), 1986-1997 | 157 | None | ||||
| John J. Nagorniak 225 Franklin Street Mail Drop BX32 05228 Boston, MA 02110 Age 66 | Board member since 6/11 for RiverSource Funds and since 1/08 for Nations Funds | Retired; President and Director, Foxstone Financial, Inc. (consulting), 2000-2007; Director, Mellon Financial Corporation affiliates (investing), 2000-2007; Chairman, Franklin Portfolio Associates (investing — Mellon affiliate) 1982-2007 | 147 | Trustee, Research Foundation of CFA Institute; Director, MIT Investment Company; Trustee, MIT 401k Plan; former Trustee, BofA Funds Series Trust (11 funds) | ||||
| Catherine James Paglia 901 S. Marquette Ave. Minneapolis, MN 55402 Age 58 | Board member since 11/04 for RiverSource Funds and since 6/11 for Nations Funds | Director, Enterprise Asset Management, Inc. (private real estate and asset management company) | 157 | None | ||||
58 RIVERSOURCE SHORT DURATION U.S. GOVERNMENT FUND — 2011 ANNUAL REPORT
Independent Board Members (continued)
| Number of | ||||||||
| funds in the | ||||||||
| Name, | Position held | Fund Family | Other present or | |||||
| address, | with funds and | Principal occupation | overseen by | past directorships/ trusteeships (within | ||||
| age | length of service | during past five years | Board member | past 5 years) | ||||
| Leroy C. Richie 901 S. Marquette Ave. Minneapolis, MN 55402 Age 69 | Board member since 11/08 for RiverSource Funds and since 6/11 for Nations Funds | Counsel, Lewis & Munday, P.C. since 2004; former Vice President and General Counsel, Automotive Legal Affairs, Chrysler Corporation | 157 | Digital Ally, Inc. (digital imaging); Infinity, Inc. (oil and gas exploration and production); OGE Energy Corp. (energy and energy services) | ||||
| Minor M. Shaw 225 Franklin Street Mail Drop BX32 05228 Boston, MA 02110 Age 63 | Board member since 6/11 for RiverSource Funds and since 2003 for Nations Funds | President — Micco Corporation (real estate development) and Mickel Investment Group | 147 | Former Trustee, BofA Funds Series Trust (11 funds); Piedmont Natural Gas | ||||
| Alison Taunton-Rigby 901 S. Marquette Ave Minneapolis, MN 55402 Age 67 | Board member since 11/02 for RiverSource Funds and since 6/11 for Nations Funds | Chief Executive Officer and Director, RiboNovix, Inc. since 2003 (biotechnology); former President, Aquila Biopharmaceuticals | 157 | Idera Pharmaceuticals, Inc. (biotechnology); Healthways, Inc. (health management programs) | ||||
Interested Board Member Not Affiliated with Investment Manager*
| Number of | ||||||||
| funds in the | ||||||||
| Name, | Position held | Fund Family | Other present or | |||||
| address, | with funds and | Principal occupation | overseen by | past directorships/ trusteeships (within | ||||
| age | length of service | during past five years | Board member | past 5 years) | ||||
| Anthony M. Santomero* 225 Franklin Street Mail Drop BX32 05228 Boston, MA 02110 Age 64 | Board member since 6/11 for RiverSource Funds and since 1/08 for Nations Funds | Richard K. Mellon Professor Emeritus of Finance, The Wharton School, University of Pennsylvania, since 2002; Senior Advisor, McKinsey & Company (consulting), 2006-2008; President and Chief Executive Officer, Federal Reserve Bank of Philadelphia, 2000-2006 | 147 | Director, Renaissance Reinsurance Ltd.; Trustee, Penn Mutual Life Insurance Company; Director, Citigroup; Director, Citibank, N.A.; former Trustee, BofA Funds Series Trust (11 funds) | ||||
| * | Dr. Santomero is not an affiliated person of the investment manager or Ameriprise Financial. However, he is currently deemed by the funds to be an “interested person” (as defined in the 1940 Act) of the funds because he serves as a Director of Citigroup, Inc. and Citibank N.A., companies that may directly or through subsidiaries and affiliates engage from time-to-time in brokerage execution, principal transactions and lending relationships with the funds or accounts advised/managed by the investment manager. |
RIVERSOURCE SHORT DURATION U.S. GOVERNMENT FUND — 2011 ANNUAL REPORT 59
Board Members and Officers (continued)
Interested Board Member Affiliated with Investment Manager*
| Number of | ||||||||
| funds in the | ||||||||
| Name, | Position held | Fund Family | Other present or | |||||
| address, | with funds and | Principal occupation | overseen by | past directorships/ trusteeships (within | ||||
| age | length of service | during past five years | Board member | past 5 years) | ||||
| William F. Truscott 53600 Ameriprise Financial Center Minneapolis, MN 55474 Age 50 | Board member since 11/01 for RiverSource Funds and since 6/11 for Nations Funds; Senior Vice President since 2002 | Chairman of the Board, Columbia Management Investment Advisers, LLC (formerly RiverSource Investments, LLC) since May 2010 (previously President, Chairman of the Board and Chief Investment Officer, 2001-April 2010); Chief Executive Officer, U.S. Asset Management & President, Annuities, Ameriprise Financial, Inc. since May 2010 (previously President — U.S. Asset Management and Chief Investment Officer, 2005-April 2010 and Senior Vice President — Chief Investment Officer, 2001-2005); Director, President and Chief Executive Officer, Ameriprise Certificate Company since 2006; Director, Columbia Management Investment Distributors, Inc. (formerly RiverSource Fund Distributors, Inc.) since May 2010 (previously Chairman of the Board and Chief Executive Officer, 2008-April 2010; Chairman of the Board and Chief Executive Officer, RiverSource Distributors, Inc. since 2006 | 157 | None | ||||
| * | Interested person (as defined under the 1940 Act) by reason of being an officer, director, security holder and/or employee of the investment manager or Ameriprise Financial. |
60 RIVERSOURCE SHORT DURATION U.S. GOVERNMENT FUND — 2011 ANNUAL REPORT
The SAI has additional information about the Fund’s Board members and is available, without charge, upon request by calling 800.345.6611; contacting your financial intermediary; or visiting columbiamanagement.com.
The Board has appointed officers who are responsible for day-to-day business decisions based on policies it has established. The officers serve at the pleasure of the Board. In addition to Mr. Truscott, who is Senior Vice President, the funds’ other officers are:
| Name, | Position held | |||
| address, | with funds and | Principal occupation | ||
| age | length of service | during past five years | ||
| J. Kevin Connaughton 225 Franklin Street Boston, MA 02110 Age 47 | President and Principal Executive Officer since 5/10 for RiverSource Funds and 2009 for Nations Funds | Senior Vice President and General Manager — Mutual Fund Products, Columbia Management Investment Advisers, LLC since May 2010; Managing Director of Columbia Management Advisors, LLC, December 2004-April 2010; Senior Vice President and Chief Financial Officer, Columbia Funds, June 2008-January 2009; Treasurer, Columbia Funds, October 2003-May 2008; Treasurer, the Liberty Funds, Stein Roe Funds and Liberty All-Star Funds, December 2000-December 2006; Senior Vice President — Columbia Management Advisors, LLC, April 2003-December 2004; President, Columbia Funds, Liberty Funds and Stein Roe Funds, February 2004-October 2004 | ||
| Amy K. Johnson 5228 Ameriprise Financial Center Minneapolis, MN 55474 Age 45 | Vice President since 12/06 for RiverSource Funds and 5/10 for Nations Funds | Senior Vice President and Chief Operating Officer, Columbia Management Investment Advisers, LLC (formerly RiverSource Investments, LLC) since May 2010 (previously Chief Administrative Officer, 2009-April 2010 and Vice President — Asset Management and Trust Company Services, 2006-2009 and Vice President — Operations and Compliance, 2004-2006); Director of Product Development — Mutual Funds, Ameriprise Financial, Inc., 2001-2004 | ||
| Michael G. Clarke 225 Franklin Street Boston, MA 02110 Age 41 | Treasurer since 1/11 and Chief Financial Officer since 4/11 for RiverSource Funds and Treasurer since 3/11 and Chief Financial Officer since 2009 for Nations Funds | Vice President, Columbia Management Investment Advisers, LLC since May 2010; Managing Director of Fund Administration, Columbia Management Advisors, LLC, from September 2004 to April 2010; senior officer of Columbia Funds and affiliated funds since 2002 | ||
RIVERSOURCE SHORT DURATION U.S. GOVERNMENT FUND — 2011 ANNUAL REPORT 61
Board Members and Officers (continued)
| Name, | Position held | |||
| address, | with funds and | Principal occupation | ||
| age | length of service | during past five years | ||
| Scott R. Plummer 5228 Ameriprise Financial Center Minneapolis, MN 55474 Age 51 | Senior Vice President and Chief Legal Officer since 12/06 and Assistant Secretary since 6/11 for RiverSource Funds and Senior Vice President and Chief Legal Officer since 5/10 and Assistant Secretary since 6/11 for Nations Funds | Vice President, Chief Legal Officer and Assistant Secretary, Columbia Management Investment Advisers, LLC (formerly RiverSource Investments, LLC) since June 2005; Vice President and Lead Chief Counsel — Asset Management, Ameriprise Financial, Inc. since May 2010 (previously Vice President and Chief Counsel — Asset Management, 2005-April 2010 and Vice President — Asset Management Compliance, 2004-2005); Vice President, Chief Counsel and Assistant Secretary, Columbia Management Investment Distributors, Inc. (formerly RiverSource Fund Distributors, Inc.) since 2008; Vice President, General Counsel and Secretary, Ameriprise Certificate Company since 2005; Chief Counsel, RiverSource Distributors, Inc. since 2006 | ||
| Michael A. Jones 225 Franklin Street Boston, MA 02110 Age 52 | Senior Vice President since 5/10 for RiverSource Funds and Nations Funds | Director and President, Columbia Management Investment Advisers, LLC since May 2010; President and Director, Columbia Management Investment Distributors, Inc. since May 2010; Manager, Chairman, Chief Executive Officer and President, Columbia Management Advisors, LLC, 2007-April 2010; Chief Executive Officer, President and Director, Columbia Management Distributors, Inc., 2006-April 2010; former Co-President and Senior Managing Director, Robeco Investment Management | ||
| Colin Moore 225 Franklin Street Boston, MA 02110 Age 53 | Senior Vice President since 5/10 for RiverSource Funds and Nations Funds | Director and Chief Investment Officer, Columbia Management Investment Advisers, LLC since May 2010; Manager, Managing Director and Chief Investment Officer, Columbia Management Advisors, LLC, 2007-April 2010; Head of Equities, Columbia Management Advisors, LLC, 2002-September 2007 | ||
| Linda J. Wondrack 225 Franklin Street Boston, MA 02110 Age 46 | Senior Vice President since 4/11 and Chief Compliance Officer since 5/10 for RiverSource Funds and 2007 for Nations Funds | Vice President and Chief Compliance Officer, Columbia Management Investment Advisers, LLC since May 2010; Director (Columbia Management Group, LLC and Investment Product Group Compliance), Bank of America, June 2005-April 2010; Director of Corporate Compliance and Conflicts Officer, MFS Investment Management (investment management), August 2004-May 2005 | ||
| Stephen T. Welsh 225 Franklin Street Boston, MA 02110 Age 53 | Vice President since 4/11 for RiverSource Funds and 2006 for Nations Funds | President and Director, Columbia Management Investment Services Corp. since May 2010; President and Director, Columbia Management Services, Inc. from July 2004 to April 2010; Managing Director, Columbia Management Distributors, Inc. from August 2007 to April 2010 | ||
| Christopher O. Petersen 5228 Ameriprise Financial Center Minneapolis, MN 55474 Age 41 | Vice President and Secretary since 4/11 for RiverSource Funds and 3/11 for Nations Funds | Vice President and Chief Counsel, Ameriprise Financial since January 2010 (formerly Vice President and Group Counsel or Counsel from April 2004 to January 2010); Assistant Secretary of Legacy RiverSource Funds, January 2007-April 2011 and of the Nations Funds, May 2010-March 2011 | ||
62 RIVERSOURCE SHORT DURATION U.S. GOVERNMENT FUND — 2011 ANNUAL REPORT
| Name, | Position held | |||
| address, | with funds and | Principal occupation | ||
| age | length of service | during past five years | ||
| Paul D. Pearson 10468 Ameriprise Financial Center Minneapolis, MN 55474 Age 54 | Vice President since 4/11 and Assistant Treasurer since 1/99 for RiverSource Funds and Vice President and Assistant Treasurer since 6/11 for Nations Funds | Vice President — Investment Accounting, Columbia Management Investment Advisers, LLC, since May 2010; Vice President — Managed Assets, Investment Accounting, Ameriprise Financial Corporation, February 1998 to May 2010 | ||
| Joseph F. DiMaria 225 Franklin Street Boston, MA 02110 Age 42 | Vice President and Chief Accounting Officer since 4/11 and Vice President since 3/11 and Chief Accounting Officer since 2008 for Nations Funds | Vice President, Mutual Fund Administration, Columbia Management Investment Advisers, LLC, since May 2010; Director of Fund Administration, Columbia Management Advisors, LLC from January 2006 to April 2010; Head of Tax/Compliance and Assistant Treasurer, Columbia Management Advisors, LLC, from November 2004 to December 2005 | ||
| Paul B. Goucher 100 Park Avenue New York, NY 10017 Age 42 | Vice President since 4/11 and Assistant Secretary since 11/08 for RiverSource Funds and 5/10 for Nations Funds | Vice President and Chief Counsel of Ameriprise Financial since January 2010 (formerly Vice President and Group Counsel from November 2008 to January 2010); Director, Managing Director and General Counsel of J. & W. Seligman & Co. Incorporated (Seligman) from July 2008 to November 2008 and Managing Director and Associate General Counsel of Seligman from January 2005 to July 2008 | ||
| Michael E. DeFao 225 Franklin Street Boston, MA 02110 Age 42 | Vice President since 4/11 and Assistant Secretary since 5/10 for RiverSource Funds and 2011 for Nations Funds | Vice President and Chief Counsel, Ameriprise Financial since May 2010; Associate General Counsel, Bank of America from June 2005 to April 2010 | ||
RIVERSOURCE SHORT DURATION U.S. GOVERNMENT FUND — 2011 ANNUAL REPORT 63
Proxy Voting
The policy of the Board is to vote the proxies of the companies in which the Fund holds investments consistent with the procedures as stated in the Statement of Additional Information (SAI). You may obtain a copy of the SAI without charge by calling 800.345.6611; contacting your financial intermediary; visiting columbiamanagement.com; or searching the website of the Securities and Exchange Commission (SEC) at www.sec.gov. Information regarding how the Fund voted proxies relating to portfolio securities is filed with the SEC by August 31 for the most recent 12-month period ending June 30 of that year, and is available without charge by visiting columbiamanagement.com; or searching the website of the SEC at www.sec.gov.
Approval of Investment Management Services
Agreement
Columbia Management Investment Advisers, LLC (“Columbia Management” or the “investment manager”), a wholly-owned subsidiary of Ameriprise Financial, Inc. (“Ameriprise Financial”), serves as the investment manager to RiverSource Short Duration U.S. Government Fund (the “Fund”). Under an investment management services agreement (the “IMS Agreement”), Columbia Management provides investment advice and other services to the Fund and all funds distributed by Columbia Management Investment Distributors, Inc. (collectively, the “Funds”).
On an annual basis, the Fund’s Board of Directors (the “Board”), including the independent Board members (the “Independent Directors”), considers renewal of the IMS Agreement. Columbia Management prepared detailed reports for the Board and its Contracts Committee in March and April 2011, including reports based on analyses of data provided by independent organizations and a comprehensive response to each item of information requested by independent legal counsel to the Independent Directors (“Independent Legal Counsel”) in a letter to the investment manager, to assist the Board in making this determination. All of the materials presented in March and April were first supplied in draft form to designated representatives of the Independent Directors, i.e., Independent Legal Counsel, the Board’s Chair and the Chair of the Contracts Committee (including materials relating to the Fund’s expense cap), and the final materials were revised to reflect comments provided by these Board representatives. In addition, throughout the year, the Board (or its committees) regularly meets with portfolio management teams and reviews information prepared by Columbia Management addressing the services Columbia Management provides and Fund performance. The Board accords particular weight to the work, deliberations and conclusions of the Contracts Committee, as
64 RIVERSOURCE SHORT DURATION U.S. GOVERNMENT FUND — 2011 ANNUAL REPORT
well as its Investment Review Committee and Compliance Committee in determining whether to continue the IMS Agreement.
In August 2010, the Board approved a proposal to merge the Fund with and into Columbia Short Term Bond Fund (the “Merger”). However, since the Merger was not expected to close until after the termination date of the Fund’s current IMS Agreement, the Board, at its April 12-14, 2011 in-person Board meeting (the “April Meeting”), considered the renewal of the IMS Agreement for at least an interim period that would end upon the closing of the Merger. Thus, at the April Meeting, Independent Legal Counsel reviewed with the Independent Directors various factors relevant to the Board’s consideration of the IMS Agreement and the Board’s legal responsibilities related to such consideration. Following an analysis and discussion of the factors identified below, the Board, including all of the Independent Directors, approved renewal of the IMS Agreement.
Nature, Extent and Quality of Services Provided by Columbia Management: The Independent Directors analyzed various reports and presentations they had received detailing the services performed by Columbia Management, as well as its expertise, resources and capabilities. The Independent Directors specifically considered many developments during the past year concerning the services provided by Columbia Management, including, in particular, the continued investment in, and resources dedicated to, the Fund’s operations, most notably, the close of the acquisition by Ameriprise Financial of the long-term asset management business of Columbia Management Group, LLC (the “Columbia Transaction”) and the successful execution of various integration and other business initiatives in 2010, including implementation of complex-wide rationalized fee structures and the rebranding of the retail fund complex. The Independent Directors noted the information they received concerning Columbia Management’s ability to retain key personnel in certain targeted areas and its expectations in this regard. In that connection, the Independent Directors took into account their meetings with Columbia Management’s new Chief Investment Officer and considered the additional risk and portfolio management oversight now applied to the Funds as a result. The Independent Directors also assessed the adequacy of the current level and quality of Columbia Management’s technological resources and considered management’s commitments to enhance existing resources in this area. The Independent Directors also noted the extensive information they received on the various portfolio management changes which have been implemented since the close of the Columbia Transaction (with certain legacy Columbia Fund portfolio managers now responsible for managing various legacy RiverSource Funds).
RIVERSOURCE SHORT DURATION U.S. GOVERNMENT FUND — 2011 ANNUAL REPORT 65
Approval of Investment Management Services
Agreement (continued)
Agreement (continued)
Moreover, in connection with the Board’s evaluation of the overall package of services provided by Columbia Management, the Board considered the quality of administrative services provided to the Fund by Columbia Management. The Board also reviewed the financial condition of Columbia Management (and its affiliates) and each entity’s ability to carry out its responsibilities under the IMS Agreement. In addition, the Board discussed the acceptability of the terms of the IMS Agreement (including the relatively broad scope of services required to be performed by Columbia Management). The Board concluded that the services being performed under the IMS Agreement were of a reasonably high quality.
Based on the foregoing, and based on other information received (both oral and written, including the information on investment performance referenced below) and other considerations, the Board concluded that Columbia Management and its affiliates were in a position to continue to provide a high quality and level of services to the Fund.
Investment Performance: For purposes of evaluating the nature, extent and quality of services provided under the IMS Agreement, the Board carefully reviewed the investment performance of the Fund. In this regard, the Board considered detailed reports providing the results of analyses performed by an independent organization showing, for various periods, the performance of the Fund, the performance of a benchmark index, the percentage ranking of the Fund among its comparison group and the net assets of the Fund. The Board observed that the Fund’s investment performance met expectations. The Board also noted the impending close of Merger.
Comparative Fees, Costs of Services Provided and the Profits Realized By Columbia Management and its Affiliates from their Relationships with the Fund: The Board reviewed comparative fees and the costs of services provided under the IMS Agreement. The Board members considered detailed comparative information set forth in an annual report on fees and expenses, including, among other things, data (based on analyses conducted by an independent organization) showing a comparison of the Fund’s expenses with median expenses paid by funds in its peer group, as well as data showing the Fund’s contribution to Columbia Management’s profitability.
The Board accorded particular weight to the notion that the level of fees should reflect a rational pricing model applied consistently across the various product lines in the fund family, while assuring that the overall fees for each fund (with few defined exceptions) are generally in line with the “pricing philosophy” (i.e., that the total expense ratio of the Funds, are at, or below, the median expense
66 RIVERSOURCE SHORT DURATION U.S. GOVERNMENT FUND — 2011 ANNUAL REPORT
ratio of funds in the same comparison group). Although the Fund’s expense ratio was slightly higher than the median ratio, the Board was satisfied with the consistent and rational fee schedule applicable to the Fund and the other Funds. Based on its review, the Board concluded that the Fund’s management fee was fair and reasonable in light of the extent and quality of services that the Fund receives.
The Board also considered the profitability of Columbia Management and its affiliates in connection with Columbia Management providing investment management services to the Fund. In this regard, the Board referred to a detailed profitability report, discussing the profitability to Columbia Management and Ameriprise Financial from managing, operating and distributing the Funds, including information depicting, to the extent reasonably practicable, the expected impact of the Columbia Transaction and the integration initiatives on profitability. In this regard, the Board observed that 2010 profitability was generally in line with the reported profitability of other asset management firms. The Board also considered the indirect economic benefits flowing to Columbia Management or its affiliates in connection with managing or distributing the Funds, such as the enhanced ability to offer various other financial products to Ameriprise Financial customers, soft dollar benefits and overall reputational advantages. The Board noted that the fees paid by the Fund should permit the investment manager to offer competitive compensation to its personnel, make necessary investments in its business and earn an appropriate profit. The Board concluded that profitability levels were reasonable.
Economies of Scale to be Realized: The Board also considered the economies of scale that might be realized by Columbia Management as the Fund grows and took note of the extent to which Fund shareholders might also benefit from such growth. However, the Board observed that this factor would not be relevant given the impending close of the Merger and the elimination of the Fund.
Based on the foregoing, the Board, including all of the Independent Directors, concluded that the investment management service fees were fair and reasonable in light of the extent and quality of services provided. In reaching this conclusion, no single factor was determinative. At the April Meeting, the Board, including all of the Independent Directors, approved the renewal of the IMS Agreement.
RIVERSOURCE SHORT DURATION U.S. GOVERNMENT FUND — 2011 ANNUAL REPORT 67
Results of Meeting of Shareholders
Special Meeting of Shareholders held on Feb. 15, 2011
(Unaudited)
(Unaudited)
A brief description of the proposal(s) voted upon at the meeting and the votes cast for, against or withheld, as well as the number of abstentions and broker non-votes as to the proposal(s) is(are) set forth below. A vote is based on total dollar interest in the Fund.
Proposal 1
To approve an Agreement and Plan of Reorganization between RiverSource Short Duration U.S. Government Fund and Columbia Short Term Bond Fund.
| Dollars Voted | Dollars Voted | Broker | ||||||||||||
| “For” | “Against” | Abstentions | Non-Votes | |||||||||||
| 389,535,720.333 | 13,174,733.863 | 14,917,296.389 | 77,354,393.580 | |||||||||||
Proposal 2
To elect directors to the Board.*
| Dollars Voted | Dollars Voted | Broker | ||||||||||||||||
| “For” | “Withhold” | Abstentions | Non-Votes | |||||||||||||||
| 01 | Kathleen Blatz | 701,935,846.519 | 15,293,672.461 | 0.00 | 0.00 | |||||||||||||
| 02 | Edward J. Boudreau, Jr. | 702,236,051.833 | 14,993,467.146 | 0.00 | 0.00 | |||||||||||||
| 03 | Pamela G. Carlton | 701,753,035.705 | 15,476,483.275 | 0.00 | 0.00 | |||||||||||||
| 04 | William P. Carmichael | 700,607,641.416 | 16,621,877.564 | 0.00 | 0.00 | |||||||||||||
| 05 | Patricia M. Flynn | 702,450,962.105 | 14,778,556.874 | 0.00 | 0.00 | |||||||||||||
| 06 | William A. Hawkins | 702,262,140.096 | 14,967,378.883 | 0.00 | 0.00 | |||||||||||||
| 07 | R. Glenn Hilliard | 701,980,632.890 | 15,248,886.090 | 0.00 | 0.00 | |||||||||||||
| 08 | Stephen R. Lewis, Jr. | 702,062,404.407 | 15,167,114.572 | 0.00 | 0.00 | |||||||||||||
| 09 | John F. Maher | 701,809,574.514 | 15,419,944.466 | 0.00 | 0.00 | |||||||||||||
| 10 | John J. Nagorniak | 702,196,789.033 | 15,032,729.947 | 0.00 | 0.00 | |||||||||||||
| 11 | Catherine James Paglia | 702,073,383.794 | 15,156,135.185 | 0.00 | 0.00 | |||||||||||||
| 12 | Leroy C. Richie | 701,268,265.466 | 15,961,253.514 | 0.00 | 0.00 | |||||||||||||
| 13 | Anthony M. Santomero | 702,005,499.277 | 15,224,019.702 | 0.00 | 0.00 | |||||||||||||
| 14 | Minor M. Shaw | 701,772,012.953 | 15,457,506.027 | 0.00 | 0.00 | |||||||||||||
| 15 | Alison Taunton-Rigby | 701,986,324.628 | 15,243,194.352 | 0.00 | 0.00 | |||||||||||||
| 16 | William F. Truscott | 701,830,876.527 | 15,398,642.453 | 0.00 | 0.00 | |||||||||||||
Proposal 3
To approve the proposed amendment to the Articles of Incorporation of RiverSource Government Income Series, Inc. to increase the maximum number of board members.*
| Dollars Voted | Dollars Voted | Broker | ||||||||||||
| “For” | “Against” | Abstentions | Non-Votes | |||||||||||
| 676,787,403.541 | 27,458,387.129 | 12,983,703.560 | 24.750 | |||||||||||
| * | All dollars of RiverSource Government Income Series, Inc. are voted together as a single class for election of directors and amendments to the Articles of Incorporation. |
68 RIVERSOURCE SHORT DURATION U.S. GOVERNMENT FUND — 2011 ANNUAL REPORT
RiverSource Short Duration U.S. Government Fund
P.O. Box 8081
Boston, MA 02266-8081
columbiamanagement.com
 | This report must be accompanied or preceded by the Fund’s current prospectus. The Fund is distributed by Columbia Management Investment Distributors, Inc., member FINRA, and managed by Columbia Management Investment Advisers, LLC. ©2011 Columbia Management Investment Advisers, LLC. All rights reserved. | S-6042 AH (8/11) |
| Item 2. | Code of Ethics. |
(a) The Registrant has adopted a code of ethics that applies to the Registrant’s principal executive officer and principal financial officer.
(b) During the period covered by this report, there were not any amendments to a provision of the code of ethics adopted in 2(a) above.
(c) During the period covered by this report, there were no waivers, including any implicit waivers, from a provision of the code of ethics described in 2(a) above that relates to one or more of the items set forth in paragraph (b) of this item’s instructions.
| Item 3. | Audit Committee Financial Expert. |
The Registrant’s board of directors has determined that independent directors Pamela G. Carlton and John F. Maher, each qualify as audit committee financial experts.
| Item 4. | Principal Accountant Fees and Services |
The comparative fee information for fiscal year ended May 31, 2010 excludes fees paid by one series that was re-domiciled into another registrant on March 7, 2011.
| (a) | Audit Fees. The fees for the years ended May 31 indicated below, charged by Ernst & Young LLP for professional services rendered for the audit of the annual financial statements for RiverSource Government Income Series, Inc. were as follows: |
| 2011: $26,487 | 2010: $26,173 |
| (b) | Audit-Related Fees. The fees for the years ended May 31 indicated below, charged by Ernst & Young LLP for audit-related services rendered to the registrant related to the semiannual financial statement review, the transfer agent 17Ad-13 review, and other consultations and services required to complete the audit for RiverSource Government Income Series, Inc. were as follows: |
| 2011: $2,320 | 2010: $848 |
| The fees for the years ended May 31 indicated below, charged by Ernst & Young LLP for audit-related services rendered to the registrant’s investment adviser and any entity controlling, controlled by, or under common control with the |
| investment adviser that provides ongoing services to the registrant that were required to be pre-approved by the registrant’s audit committee related to an internal controls review were as follows: |
| 2011: $96,000 | 2010: $0 |
| (c) | Tax Fees. The fees for the years ended May 31 indicated below, charged by Ernst & Young LLP for tax compliance related services rendered to RiverSource Government Income Series, Inc. were as follows: |
| 2011: $3,515 | 2010: $3,498 |
| The fees for the years ended May 31 indicated below, charged by Ernst & Young LLP for tax services rendered to the registrant’s investment adviser and any entity controlling, controlled by, or under common control with the investment adviser that provides ongoing services to the registrant that were required to be pre-approved by the registrant’s audit committee related to tax consulting services and a subscription to a tax database were as follows: |
| 2011: $124,620 | 2010: $60,000 |
| (d) | All Other Fees. The fees for the years ended May 31 indicated below, charged by Ernst & Young LLP for additional professional services rendered to RiverSource Government Income Series, Inc. were as follows: |
| 2011: $0 | 2010: $0 |
| The fees for the years ended May 31 indicated below, charged by Ernst & Young LLP for other services rendered to the registrant’s investment adviser and any entity controlling, controlled by, or under common control with the investment adviser that provides ongoing services to the registrant that were required to be pre-approved by the registrant’s audit committee were as follows: |
| 2011: $0 | 2010: $0 |
(e) (1) Audit Committee Pre-Approval Policy. Pursuant to Sarbanes-Oxley pre-approval requirements, all services to be performed by Ernst & Young LLP for the registrant and for the registrant’s investment adviser and any entity controlling, controlled by, or under common control with the investment adviser that provides ongoing services to the registrant must be pre-approved by the registrant’s audit committee.
| (e) | (2) 100% of the services performed for items (b) through (d) above during 2011 and 2010 were pre-approved by the registrant’s audit committee. | |
| (f) | Not applicable. |
| (g) | Non-Audit Fees. The fees for the years ended May 31 indicated below, charged by Ernst & Young LLP to the registrant for non-audit fees and to the registrant’s investment adviser, and any entity controlling, controlled by, or under common control with the adviser that provides ongoing services to the registrant were as follows: |
| 2011: $1,382,665 | 2010: $2,103,121 |
| (h) | 100% of the services performed in item (g) above during 2011 and 2010 were pre-approved by the Ameriprise Financial Audit Committee and/or the Columbia Funds Audit Committee. |
| Item 5. | Audit Committee of Listed Registrants. Not applicable. |
| Item 6. | Investments. |
| (a) | The registrant’s “Schedule 1 — Investments in securities of unaffiliated issuers” (as set forth in 17 CFR 210.12-12) is included in Item 1 of this Form N-CSR. | |
| (b) | Not applicable. |
| Item 7. | Disclosure of Proxy Voting Policies and Procedures for Closed-End Management Investment Companies. Not applicable. |
| Item 8. | Portfolio Managers of Closed-End Management Investment Companies. Not applicable. |
| Item 9. | Purchases of Equity Securities by Closed-End Management Investment Company and Affiliated Purchasers. Not applicable. |
| Item 10. | Submission of Matters to a Vote of Security Holders. |
| There were no material changes to the procedures by which shareholders may recommend nominees to the registrant’s board of directors. |
| Item 11. | Controls and Procedures. |
| (a) The registrant’s principal executive officer and principal financial officer, based on their evaluation of the registrant’s disclosure controls and procedures as of a date within 90 days of the filing of this report, have concluded that such controls and procedures are adequately designed to ensure that information required to be disclosed by the registrant in Form N-CSR is accumulated and communicated to the registrant’s management, including principal executive officer and principal financial officer, or persons |
| performing similar functions, as appropriate to allow timely decisions regarding required disclosure. | ||
| (b) There was no change in the registrant’s internal controls over financial reporting that occurred during the registrant’s second fiscal quarter of the period covered by this report that has materially affected, or is reasonably likely to materially affect, the registrant’s internal control over financial reporting. |
| Item 12. | Exhibits. |
| (a)(1) Code of ethics required to be disclosed under Item 2 of Form N-CSR, is attached as Exhibit 99.CODE ETH. | ||
| (a)(2) Certifications pursuant to Rule 30a-2(a) under the Investment Company Act of 1940 (17 CFR 270.30a-2(a)) attached hereto as Exhibit99.CERT. | ||
| (a)(3) Not applicable. | ||
| (b) | Certification pursuant to Rule 30a-2(b) under the Investment Company Act of 1940 (17 CFR 270.30a-2(b)) attached hereto as Exhibit 99.906CERT. |
SIGNATURES
Pursuant to the requirements of the Securities Exchange Act of 1934 and the Investment Company Act of 1940, the Registrant has duly caused this report to be signed on its behalf by the undersigned, thereunto duly authorized.
| (Registrant) | RiverSource Government Income Series, Inc. |
| By | /s/ J. Kevin Connaughton | |||
| President and Principal Executive Officer |
Date July 22, 2011
Pursuant to the requirements of the Securities Exchange Act of 1934 and the Investment Company Act of 1940, this report has been signed below by the following persons on behalf of the Registrant and in the capacities and on the dates indicated.
| By | /s/ J. Kevin Connaughton | |||
| President and Principal Executive Officer |
Date July 22, 2011
| By | /s/ Michael G. Clarke | |||
| Treasurer and Principal Financial Officer |
Date July 22, 2011