
CommunityOne Bancorp July 29, 2014 Second Quarter 2014 Earnings Presentation
Presenters Brian Simpson Chief Executive Officer David Nielsen Chief Financial Officer Neil Machovec Chief Credit Officer 2
Forward Looking Statements & Other Information Forward Looking Statements This presentation contains certain forward-looking statements within the safe harbor rules of the federal securities laws. These statements generally relate to COB’s financial condition, results of operations, plans, objectives, future performance or business. They usually can be identified by the use of forward-looking terminology, such as “believes,” “expects,” or “are expected to,” “plans,” “projects,” “goals,” “estimates,” “may,” “should,” “could,” “would,” “intends to,” “outlook” or “anticipates,” or variations of these and similar words, or by discussions of strategies that involve risks and uncertainties. Forward looking statements are subject to risks and uncertainties, including but not limited to, those risks described in COB’s Annual Report on Form 10-K for the year ended December 31, 2013 under the section entitled “Item 1A, Risk Factors,” and in the Quarterly Reports of Form 10-Q and other reports that are filed by COB with the Securities and Exchange Commission. You are cautioned not to place undue reliance on these forward-looking statements, which are subject to numerous assumptions, risks and uncertainties, and which change over time. These forward-looking statements speak only as of the date of this presentation. Actual results may differ materially from those expressed in or implied by any forward looking statements contained in this presentation. We assume no duty to revise or update any forward-looking statements, except as required by applicable law. Non-GAAP Financial Measures In addition to the results of operations presented in accordance with Generally Accepted Accounting Principles (GAAP), COB management uses and this presentation contains or references, certain non-GAAP financial measures, such as core earnings, core noninterest expense, core noninterest expense to average assets, core noninterest income, and tangible shareholders’ equity. COB believes these non-GAAP financial measures provide information useful to investors in understanding our underlying operational performance and our business and performance trends as they facilitate comparisons with the performance of others in the financial services industry; however, these non-GAAP financial measures should not be considered an alternative to GAAP. The non-GAAP financial measures contained within this presentation should be read in conjunction with the audited financial statements and analysis as presented in COB’s Annual Report on Form 10-K as well as the unaudited financial statements and analyses as presented in COB’s Quarterly Reports on Form 10-Q. A reconciliation of non-GAAP measures to the most directly comparable GAAP measure is included within tables in the presentation or with the appendix to this presentation. 3
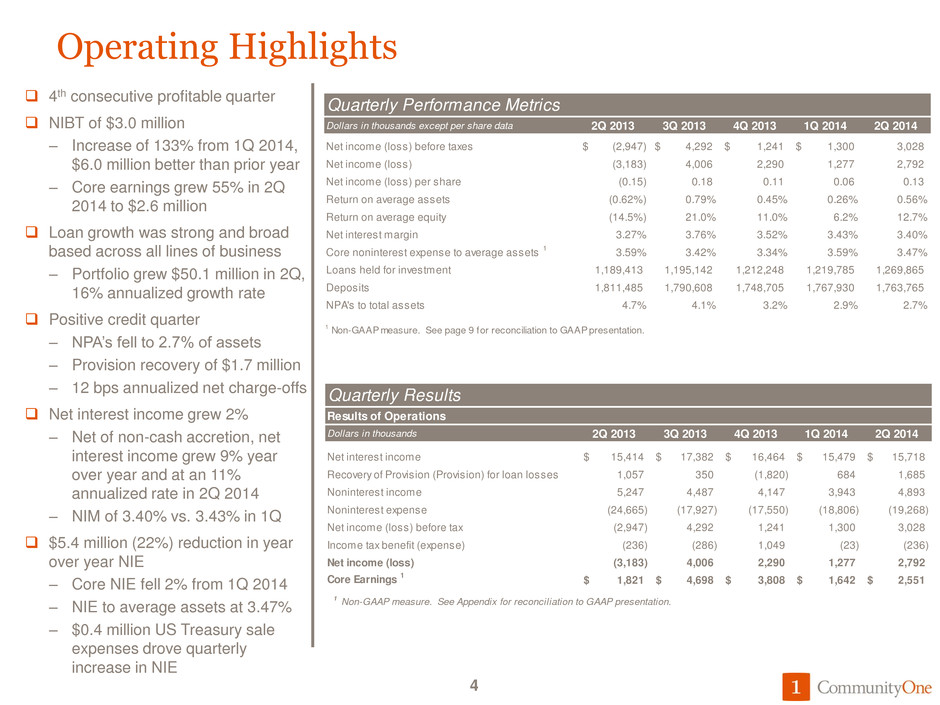
Operating Highlights 4th consecutive profitable quarter NIBT of $3.0 million – Increase of 133% from 1Q 2014, $6.0 million better than prior year – Core earnings grew 55% in 2Q 2014 to $2.6 million Loan growth was strong and broad based across all lines of business – Portfolio grew $50.1 million in 2Q, 16% annualized growth rate Positive credit quarter – NPA’s fell to 2.7% of assets – Provision recovery of $1.7 million – 12 bps annualized net charge-offs Net interest income grew 2% – Net of non-cash accretion, net interest income grew 9% year over year and at an 11% annualized rate in 2Q 2014 – NIM of 3.40% vs. 3.43% in 1Q $5.4 million (22%) reduction in year over year NIE – Core NIE fell 2% from 1Q 2014 – NIE to average assets at 3.47% – $0.4 million US Treasury sale expenses drove quarterly increase in NIE 4 Quarterly Performance Metrics Dollars in thousands except per share data 2Q 2013 3Q 2013 4Q 2013 1Q 2014 2Q 2014 Net income (loss) before taxes (2,947)$ 4,292$ 1,241$ 1,300$ 3,028 Net income (loss) (3,183) 4,006 2,290 1,277 2,792 Net income (loss) per share (0.15) 0.18 0.11 0.06 0.13 Return on average assets (0.62%) 0.79% 0.45% 0.26% 0.56% Return on average equity (14.5%) 21.0% 11.0% 6.2% 12.7% Net interest margin 3.27% 3.76% 3.52% 3.43% 3.40% Core noninterest expense to average assets 1 3.59% 3.42% 3.34% 3.59% 3.47% Loans held for investment 1,189,413 1,195,142 1,212,248 1,219,785 1,269,865 Deposits 1,811,485 1,790,608 1,748,705 1,767,930 1,763,765 NPA's to total assets 4.7% 4.1% 3.2% 2.9% 2.7% 1 Non-GAAP measure. See page 9 for reconciliation to GAAP presentation. Quart rly Results Results of Operatio Dollars in thousands 2Q 2013 3Q 2013 4Q 2013 1Q 2014 2Q 2014 N t interest income 5 14$ 17 382$ 16 464$ 15 479$ 15 18$ Recovery f Provision (Provision) for loan losses 1,057 350 (1,8 0) 684 1,685 Noninterest income 5,247 4,487 4,147 3,943 4,893 Noninterest expense (24,665) (17,927) (17,550) (18,806) (19,268) Net income (loss) before tax (2,947) 4,292 1,241 1,300 3,028 Income tax benefit (expense) (236) (286) 1,049 (23) (236) Net income (loss) (3,183) 4,006 2,290 1,277 2,792 Core Earnings 1 1,821$ 4,698$ 3,808$ 1,642$ 2,551$ 1 Non-GAAP measure. See Appendix for reconciliation to GAAP presentation.
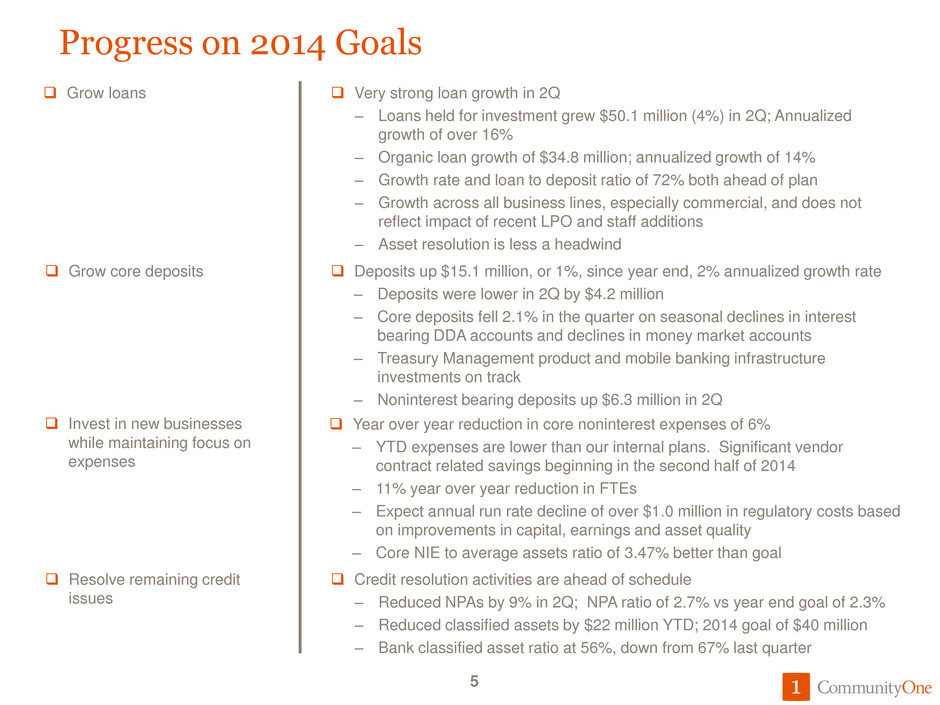
5 Very strong loan growth in 2Q – Loans held for investment grew $50.1 million (4%) in 2Q; Annualized growth of over 16% – Organic loan growth of $34.8 million; annualized growth of 14% – Growth rate and loan to deposit ratio of 72% both ahead of plan – Growth across all business lines, especially commercial, and does not reflect impact of recent LPO and staff additions – Asset resolution is less a headwind Grow loans Deposits up $15.1 million, or 1%, since year end, 2% annualized growth rate – Deposits were lower in 2Q by $4.2 million – Core deposits fell 2.1% in the quarter on seasonal declines in interest bearing DDA accounts and declines in money market accounts – Treasury Management product and mobile banking infrastructure investments on track – Noninterest bearing deposits up $6.3 million in 2Q Grow core deposits Credit resolution activities are ahead of schedule – Reduced NPAs by 9% in 2Q; NPA ratio of 2.7% vs year end goal of 2.3% – Reduced classified assets by $22 million YTD; 2014 goal of $40 million – Bank classified asset ratio at 56%, down from 67% last quarter Resolve remaining credit issues Year over year reduction in core noninterest expenses of 6% – YTD expenses are lower than our internal plans. Significant vendor contract related savings beginning in the second half of 2014 – 11% year over year reduction in FTEs – Expect annual run rate decline of over $1.0 million in regulatory costs based on improvements in capital, earnings and asset quality – Core NIE to average assets ratio of 3.47% better than goal Invest in new businesses while maintaining focus on expenses Progress on 2014 Goals 5
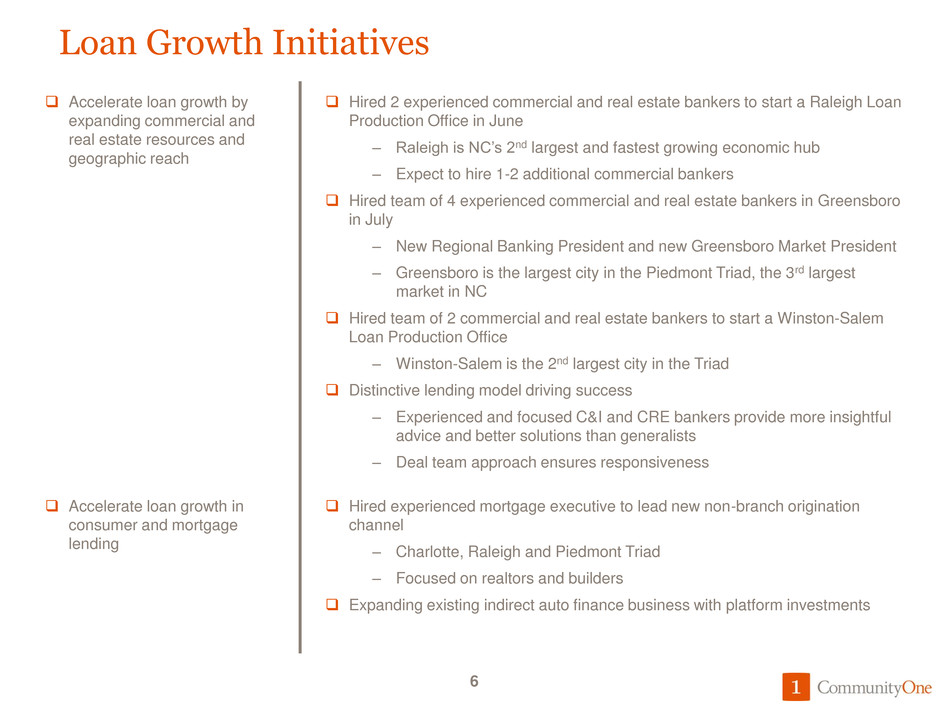
6 Hired 2 experienced commercial and real estate bankers to start a Raleigh Loan Production Office in June – Raleigh is NC’s 2nd largest and fastest growing economic hub – Expect to hire 1-2 additional commercial bankers Hired team of 4 experienced commercial and real estate bankers in Greensboro in July – New Regional Banking President and new Greensboro Market President – Greensboro is the largest city in the Piedmont Triad, the 3rd largest market in NC Hired team of 2 commercial and real estate bankers to start a Winston-Salem Loan Production Office – Winston-Salem is the 2nd largest city in the Triad Distinctive lending model driving success – Experienced and focused C&I and CRE bankers provide more insightful advice and better solutions than generalists – Deal team approach ensures responsiveness Accelerate loan growth by expanding commercial and real estate resources and geographic reach Loan Growth Initiatives 6 Hired experienced mortgage executive to lead new non-branch origination channel – Charlotte, Raleigh and Piedmont Triad – Focused on realtors and builders Expanding existing indirect auto finance business with platform investments Accelerate loan growth in consumer and mortgage lending
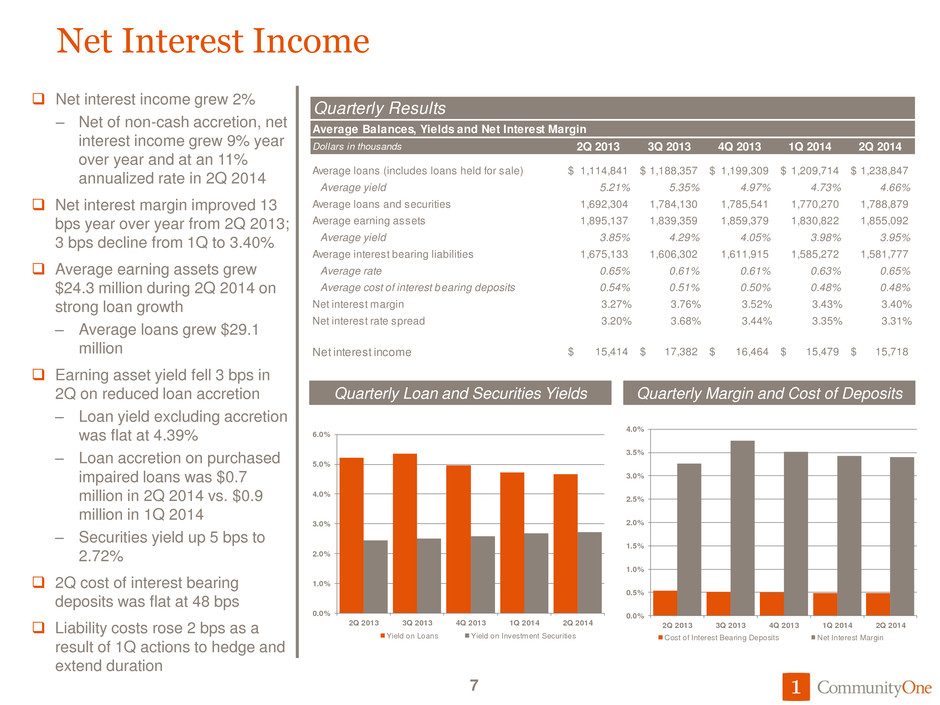
Net Interest Income Net interest income grew 2% – Net of non-cash accretion, net interest income grew 9% year over year and at an 11% annualized rate in 2Q 2014 Net interest margin improved 13 bps year over year from 2Q 2013; 3 bps decline from 1Q to 3.40% Average earning assets grew $24.3 million during 2Q 2014 on strong loan growth – Average loans grew $29.1 million Earning asset yield fell 3 bps in 2Q on reduced loan accretion – Loan yield excluding accretion was flat at 4.39% – Loan accretion on purchased impaired loans was $0.7 million in 2Q 2014 vs. $0.9 million in 1Q 2014 – Securities yield up 5 bps to 2.72% 2Q cost of interest bearing deposits was flat at 48 bps Liability costs rose 2 bps as a result of 1Q actions to hedge and extend duration 7 Quarterly Loan and Securities Yields Quarterly Margin and Cost of Deposits 0.0% 1.0% 2.0% 3.0% 4.0% 5.0% 6.0% 2Q 2013 3Q 2013 4Q 2013 1Q 2014 2Q 2014 Yield on Loans Yield on Investment Securities 0.0% 0.5% 1.0% 1.5% 2.0% 2.5% 3.0% 3.5% 4.0% 2Q 2013 3Q 2013 4Q 2013 1Q 2014 2Q 2014 Cost of Interest Bearing Deposits N t Interest Margin Quarterly Results Average Balances, Yields and Net Interest Margin Dollars in thousands 2Q 2013 3Q 2013 4Q 2013 1Q 2014 2Q 2014 Average loans (includes loans held for sale) 1,114,841$ 1,188,357$ 1,199,309$ 1,209,714$ 1,238,847$ Average yield 5.21% 5.35% 4.97% 4.73% 4.66% Average loans and securities 1,692,304 1,784,130 1,785,541 1,770,270 1,788,879 Average earning assets 1,895,137 1,839,359 1,859,379 1,830,822 1,855,092 Average yield 3.85% 4.29% 4.05% 3.98% 3.95% Average interest bearing liabilities 1,675,133 1,606,302 1,611,915 1,585,272 1,581,777 Average rate 0.65% 0.61% 0.61% 0.63% 0.65% Average cost of interest bearing deposits 0.54% 0.51% 0.50% 0.48% 0.48% Net interest margin 3.27% 3.76% 3.52% 3.43% 3.40% Net interest rate spread 3.20% 3.68% 3.44% 3.35% 3.31% Net interest income 15,414$ 17,382$ 16,464$ 15,479$ 15,718$
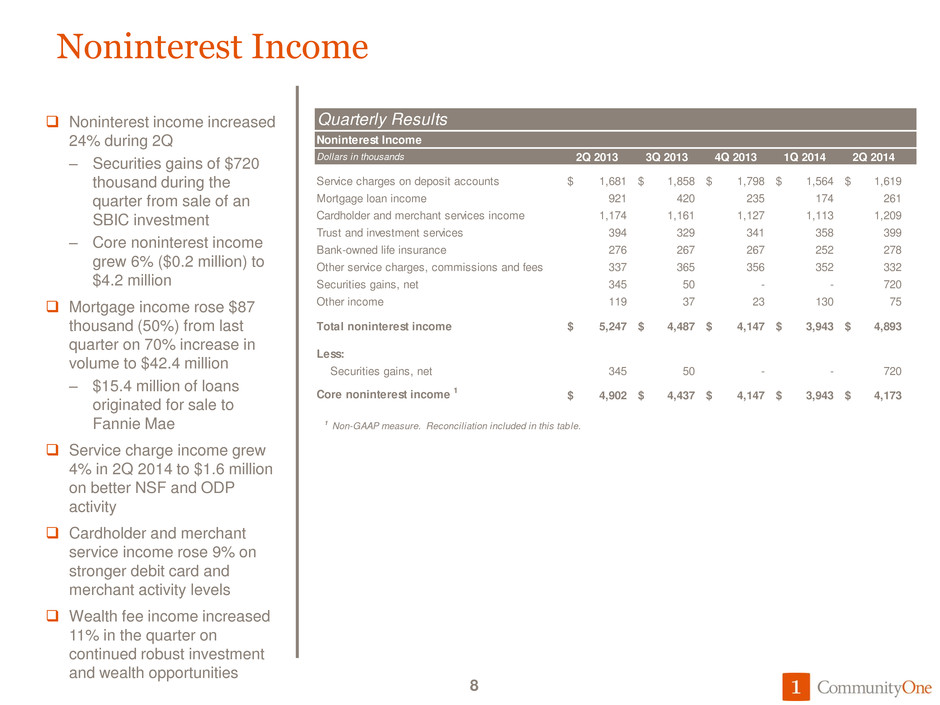
Noninterest Income Noninterest income increased 24% during 2Q – Securities gains of $720 thousand during the quarter from sale of an SBIC investment – Core noninterest income grew 6% ($0.2 million) to $4.2 million Mortgage income rose $87 thousand (50%) from last quarter on 70% increase in volume to $42.4 million – $15.4 million of loans originated for sale to Fannie Mae Service charge income grew 4% in 2Q 2014 to $1.6 million on better NSF and ODP activity Cardholder and merchant service income rose 9% on stronger debit card and merchant activity levels Wealth fee income increased 11% in the quarter on continued robust investment and wealth opportunities 8 Quarterly Results Noninterest Income Dollars in thousands 2Q 2013 3Q 2013 4Q 2013 1Q 2014 2Q 2014 Service charges on deposit accounts 1,681$ 1,858$ 1,798$ 1,564$ 1,619$ Mortgage loan income 921 420 235 174 261 Cardholder and merchant services income 1,174 1,161 1,127 1,113 1,209 Trust and investment services 394 329 341 358 399 Bank-owned life insurance 276 267 267 252 278 Other service charges, commissions and fees 337 365 356 352 332 Securities gains, net 345 50 - - 720 Other income 119 37 23 130 75 Total noninterest income 5,247$ 4,487$ 4,147$ 3,943$ 4,893$ Less: Securities gains, net 345 50 - - 720 Core noninterest income 1 4,902$ 4,437$ 4,147$ 3,943$ 4,173$ 1 Non-GAAP measure. Reconciliation included in this table.
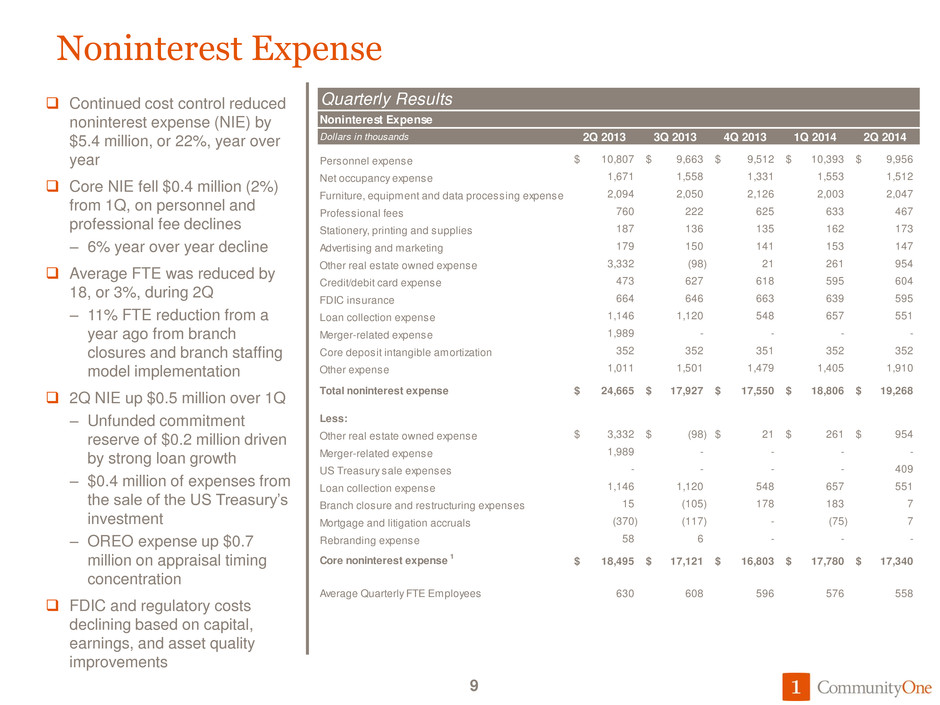
Noninterest Expense Continued cost control reduced noninterest expense (NIE) by $5.4 million, or 22%, year over year Core NIE fell $0.4 million (2%) from 1Q, on personnel and professional fee declines – 6% year over year decline Average FTE was reduced by 18, or 3%, during 2Q – 11% FTE reduction from a year ago from branch closures and branch staffing model implementation 2Q NIE up $0.5 million over 1Q – Unfunded commitment reserve of $0.2 million driven by strong loan growth – $0.4 million of expenses from the sale of the US Treasury’s investment – OREO expense up $0.7 million on appraisal timing concentration FDIC and regulatory costs declining based on capital, earnings, and asset quality improvements 9 Quarterly Results Noninterest Expense Dollars in thousands 2Q 2013 3Q 2013 4Q 2013 1Q 2014 2Q 2014 Personnel expense 10,807$ 9,663$ 9,512$ 10,393$ 9,956$ Net occupancy expense 1,671 1,558 1,331 1,553 1,512 Furniture, equipment and data processing expense 2,094 2,050 2,126 2,003 2,047 Professional fees 760 222 625 633 467 Stationery, printing and supplies 187 136 135 162 173 Advertising and marketing 179 150 141 153 147 Other real estate owned expense 3,332 (98) 21 261 954 Credit/debit card expense 473 627 618 595 604 FDIC insurance 664 646 663 639 595 Loan collection expense 1,146 1,120 548 657 551 Merger-related expense 1,989 - - - - Core deposit intangible amortization 352 352 351 352 352 Other expense 1,011 1,501 1,479 1,405 1,910 Total noninterest expense 24,665$ 17,927$ 17,550$ 18,806$ 19,268$ Less: Other real estate owned expense 3,332$ (98)$ 21$ 261$ 954$ Merger-related expense 1,989 - - - - US Treasury sale expenses - - - - 409 Loan collection expense 1,146 1,120 548 657 551 Branch closure and restructuring expenses 15 (105) 178 183 7 Mortgage and litigation accruals (370) (117) - (75) 7 Rebranding expense 58 6 - - - Core noninterest expense 1 18,495$ 17,121$ 16,803$ 17,780$ 17,340$ Average Quarterly FTE Employees 630 608 596 576 558
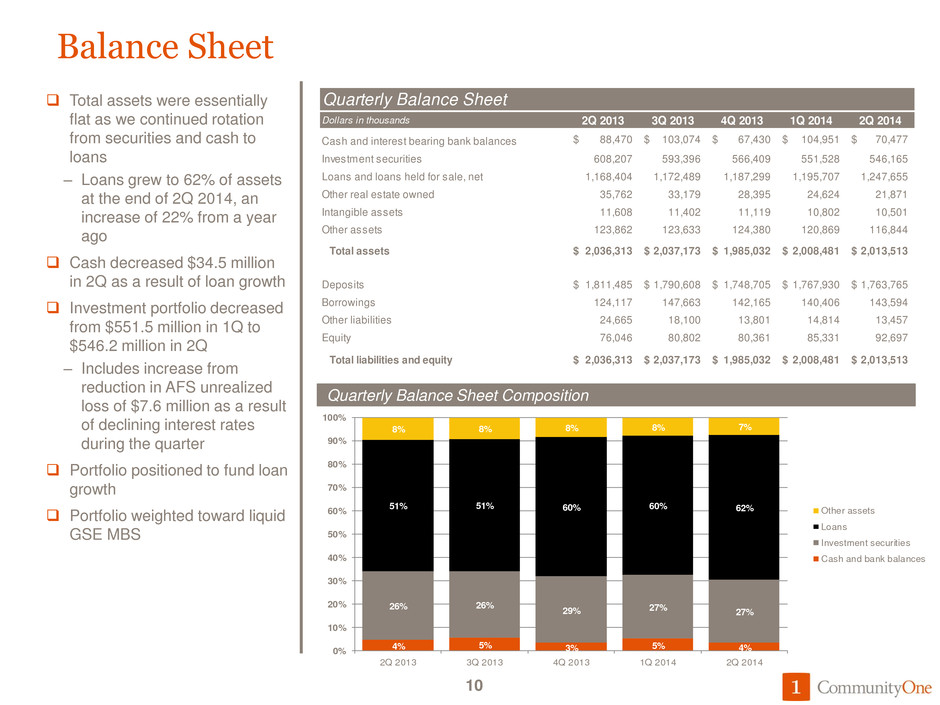
4% 5% 3% 5% 4% 26% 26% 29% 27% 27% 51% 51% 60% 60% 62% 8% 8% 8% 8% 7% 0% 10% 20% 30% 40% 50% 60% 70% 80% 90% 100% 2Q 2013 3Q 2013 4Q 2013 1Q 2014 2Q 2014 Other assets Loans Investment securities Cash and bank balances Balance Sheet Total assets were essentially flat as we continued rotation from securities and cash to loans – Loans grew to 62% of assets at the end of 2Q 2014, an increase of 22% from a year ago Cash decreased $34.5 million in 2Q as a result of loan growth Investment portfolio decreased from $551.5 million in 1Q to $546.2 million in 2Q – Includes increase from reduction in AFS unrealized loss of $7.6 million as a result of declining interest rates during the quarter Portfolio positioned to fund loan growth Portfolio weighted toward liquid GSE MBS 10 Quarterly Balance Sheet Composition Quarterly Balance Sheet Dollars in thousands 2Q 2013 3Q 2013 4Q 2013 1Q 2014 2Q 2014 Cash and interest bearing bank balances 88,470$ 103,074$ 67,430$ 104,951$ 70,477$ Investment securities 608,207 593,396 566,409 551,528 546,165 Loans and loans held for sale, net 1,168,404 1,172,489 1,187,299 1,195,707 1,247,655 Other real estate owned 35,762 33,179 28,395 24,624 21,871 Intangible assets 11,608 11,402 11,119 10,802 10,501 Other assets 123,862 123,633 124,380 120,869 116,844 Total assets 2,036,313$ 2,037,173$ 1,985,032$ 2,008,481$ 2,013,513$ Deposits 1,811,485$ 1,790,608$ 1,748,705$ 1,767,930$ 1,763,765$ Borrowings 124,117 147,663 142,165 140,406 143,594 Other liabilities 24,665 18,100 13,801 14,814 13,457 Equity 76,046 80,802 80,361 85,331 92,697 Total liabilities and equity 2,036,313$ 2,037,173$ 1,985,032$ 2,008,481$ 2,013,513$
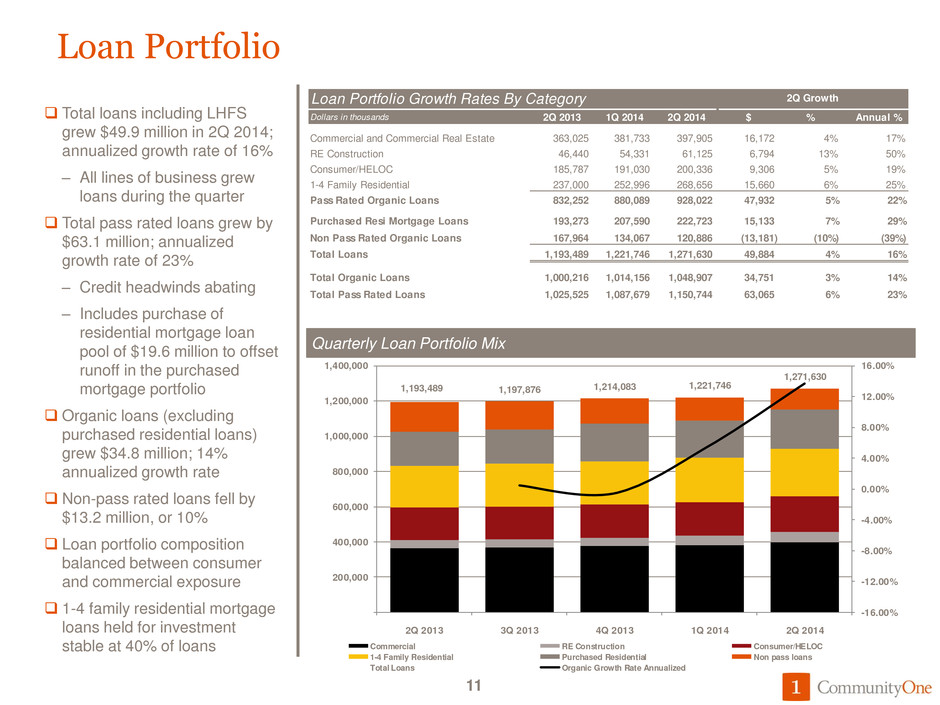
1,197,876 1,214,083 1,221,746 1,271,630 -16.00% -12.00% -8.00% -4.00% 0.00% 4.00% 8.00% 12.00% 16.00% 200,000 400,000 600,000 800,000 1,000,000 1,200,000 1,400,000 2Q 2013 3Q 2013 4Q 2013 1Q 2014 2Q 2014 Commercial RE Construction Consumer/HELOC 1-4 Family Residential Purchased Residential Non pass loans Total Loans Organic Growth Rate Annualized 1,193,489 Loan Portfolio Total loans including LHFS grew $49.9 million in 2Q 2014; annualized growth rate of 16% – All lines of business grew loans during the quarter Total pass rated loans grew by $63.1 million; annualized growth rate of 23% – Credit headwinds abating – Includes purchase of residential mortgage loan pool of $19.6 million to offset runoff in the purchased mortgage portfolio Organic loans (excluding purchased residential loans) grew $34.8 million; 14% annualized growth rate Non-pass rated loans fell by $13.2 million, or 10% Loan portfolio composition balanced between consumer and commercial exposure 1-4 family residential mortgage loans held for investment stable at 40% of loans 11 Quarterly Loan Portfolio Mix Loan Portfolio Growth Rates By Category Dollars in thousands 2Q 2013 1Q 2014 2Q 2014 $ % Annual % Commercial and Commercial Real Estate 363,025 381,733 397,905 16,172 4% 17% RE Construction 46,440 54,331 61,125 6,794 13% 50% Consumer/HELOC 185,787 191,030 200,336 9,306 5% 19% 1-4 Family Residential 237,000 252,996 268,656 15,660 6% 25% Pass Rated Organic Loans 832,252 880,089 928,022 47,932 5% 22% Purchased Resi Mortgage Loans 193,273 207,590 222,723 15,133 7% 29% Non Pass Rated Organic Loans 167,964 134,067 120,886 (13,181) (10%) (39%) Total Loans 1,193,489 1,221,746 1,271,630 49,884 4% 16% Total Organic Loans 1,000,216 1,014,156 1,048,907 34,751 3% 14% Total Pass Rated Loans 1,025,525 1,087,679 1,150,744 63,065 6% 23% 2Q Growth
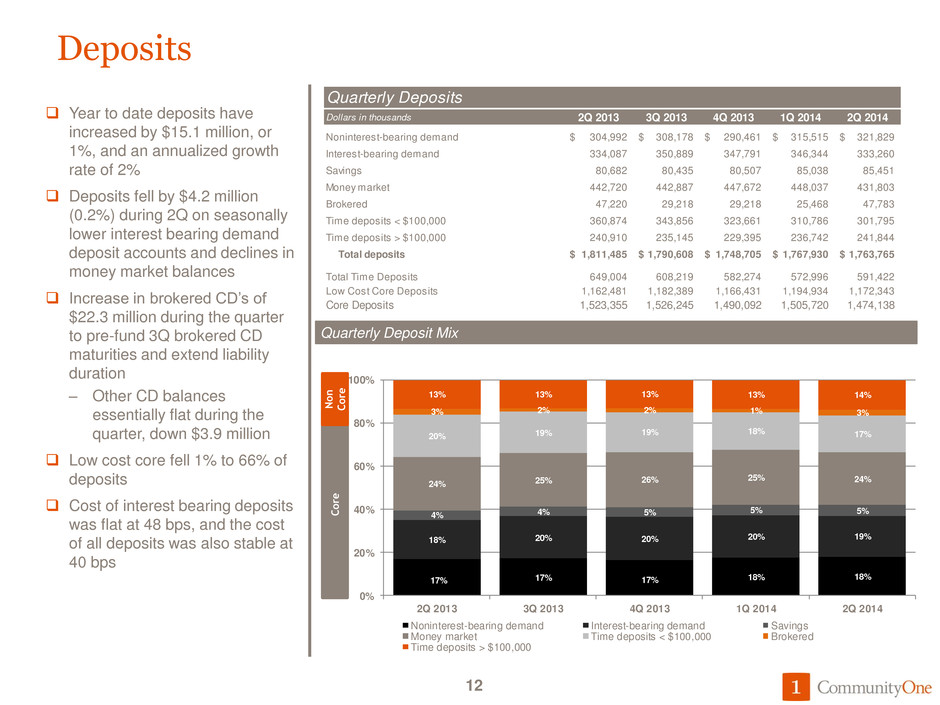
17% 17% 17% 18% 18% 18% 20% 20% 20% 19% 4% 4% 5% 5% 5% 24% 25% 26% 25% 24% 20% 19% 19% 18% 17% 3% 2% 2% 1% 3% 13% 13% 13% 13% 14% 0% 20% 40% 60% 80% 100% 2Q 2013 3Q 2013 4Q 2013 1Q 2014 2Q 2014 Noninterest-bearing demand Interest-bearing demand Savings Money market Time deposits < $100,000 Brokered Time deposits > $100,000 Deposits Year to date deposits have increased by $15.1 million, or 1%, and an annualized growth rate of 2% Deposits fell by $4.2 million (0.2%) during 2Q on seasonally lower interest bearing demand deposit accounts and declines in money market balances Increase in brokered CD’s of $22.3 million during the quarter to pre-fund 3Q brokered CD maturities and extend liability duration – Other CD balances essentially flat during the quarter, down $3.9 million Low cost core fell 1% to 66% of deposits Cost of interest bearing deposits was flat at 48 bps, and the cost of all deposits was also stable at 40 bps 12 Quarterly Deposit Mix Co re N o n Co re Quarterly Deposits Dollars in thousands 2Q 2013 3Q 2013 4Q 2013 1Q 2014 2Q 2014 Noninterest-bearing demand 304,992$ 308,178$ 290,461$ 315,515$ 321,829$ Interest-bearing demand 334,087 350,889 347,791 346,344 333,260 Savings 80,682 80,435 80,507 85,038 85,451 Money market 442,720 442,887 447,672 448,037 431,803 Brokered 47,220 29,218 29,218 25,468 47,783 Time deposits < $100,000 360,874 343,856 323,661 310,786 301,795 Time deposits > $100,000 240,910 235,145 229,395 236,742 241,844 Total deposits 1,811,485$ 1,790,608$ 1,748,705$ 1,767,930$ 1,763,765$ Total Time Deposits 649,004 608,219 582,274 572,996 591,422 Low Cost Core Deposits 1,162,481 1,182,389 1,166,431 1,194,934 1,172,343 Core Deposits 1,523,355 1,526,245 1,490,092 1,505,720 1,474,138
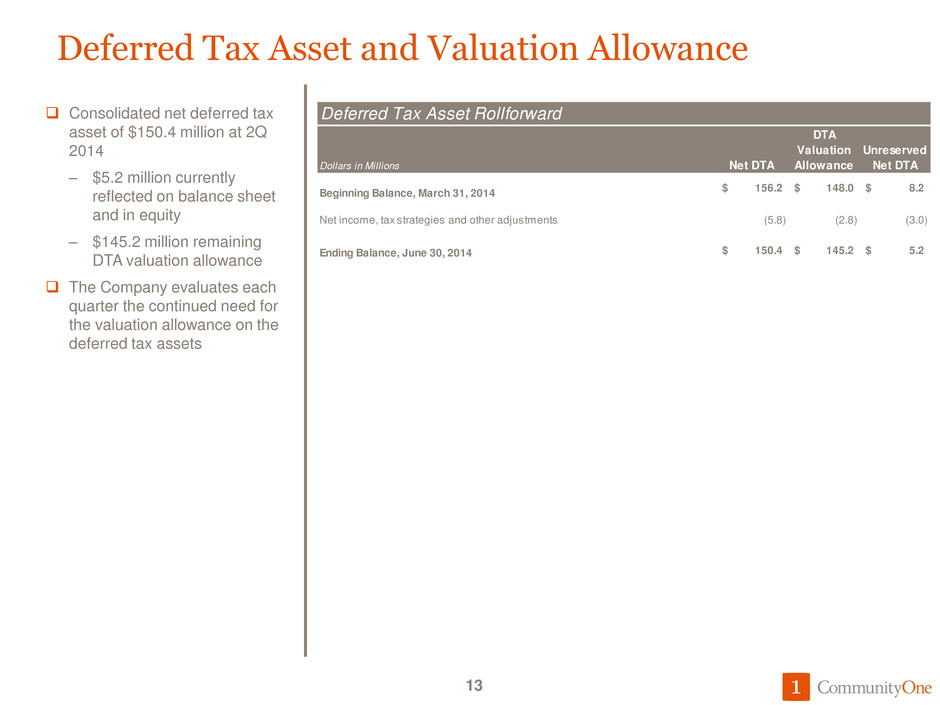
Deferred Tax Asset and Valuation Allowance Consolidated net deferred tax asset of $150.4 million at 2Q 2014 – $5.2 million currently reflected on balance sheet and in equity – $145.2 million remaining DTA valuation allowance The Company evaluates each quarter the continued need for the valuation allowance on the deferred tax assets 13 Deferred Tax Asset Rollforward Dollars in Millions Net DTA DTA Valuation Allowance Unreserved Net DTA Beginning Balance, March 31, 2014 156.2$ 148.0$ 8.2$ Net income, tax strategies and other adjustments (5.8) (2.8) (3.0) Ending Balance, June 30, 2014 150.4$ 145.2$ 5.2$
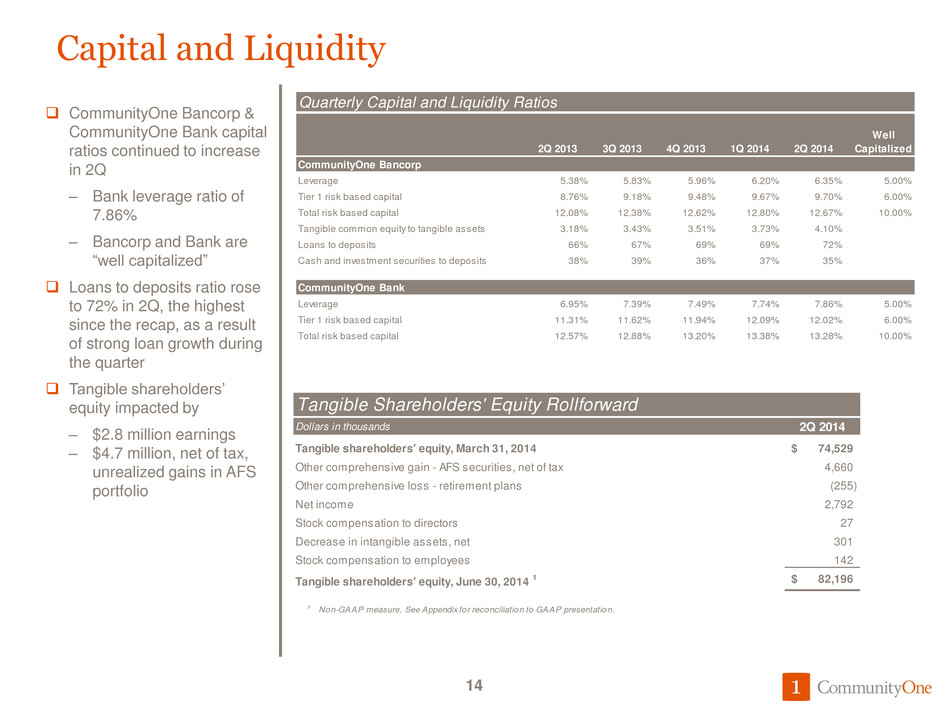
Capital and Liquidity CommunityOne Bancorp & CommunityOne Bank capital ratios continued to increase in 2Q – Bank leverage ratio of 7.86% – Bancorp and Bank are “well capitalized” Loans to deposits ratio rose to 72% in 2Q, the highest since the recap, as a result of strong loan growth during the quarter Tangible shareholders’ equity impacted by – $2.8 million earnings – $4.7 million, net of tax, unrealized gains in AFS portfolio 14 Quarterly Capital and Liquidity Ratios 2Q 2013 3Q 2013 4Q 2013 1Q 2014 2Q 2014 Well Capitalized########## ########## CommunityOne Bancorp Leverage 5.38% 5.83% 5.96% 6.20% 6.35% 5.00% Tier 1 risk based capital 8.76% 9.18% 9.48% 9.67% 9.70% 6.00% Total risk based capital 12.08% 12.38% 12.62% 12.80% 12.67% 10.00% Tangible common equity to tangible assets 3.18% 3.43% 3.51% 3.73% 4.10% Loans to deposits 66% 67% 69% 69% 72% Cash and investment securities to deposits 38% 39% 36% 37% 35% CommunityOne Bank Leverage 6.95% 7.39% 7.49% 7.74% 7.86% 5.00% Tier 1 risk based capital 11.31% 11.62% 11.94% 12.09% 12.02% 6.00% Total risk based capital 12.57% 12.88% 13.20% 13.38% 13.28% 10.00% T ngible Sharehold rs' Equi y Rollforward Dollars in thousands 2Q 2014 Tangible shareholders' equity, March 31, 2014 74,529$ Other comprehensive gain - AFS securities, net of tax 4,660 Other comprehensive loss - retirement plans (255) Net income 2,792 Stock compensation to directors 27 Decrease in intangible assets, net 301 Stock compensation to employees 142 Tangible shareholders' equity, June 30, 2014 1 82,196$ 1 Non-GAAP measure. See Appendix for reconciliation to GAAP presentation.
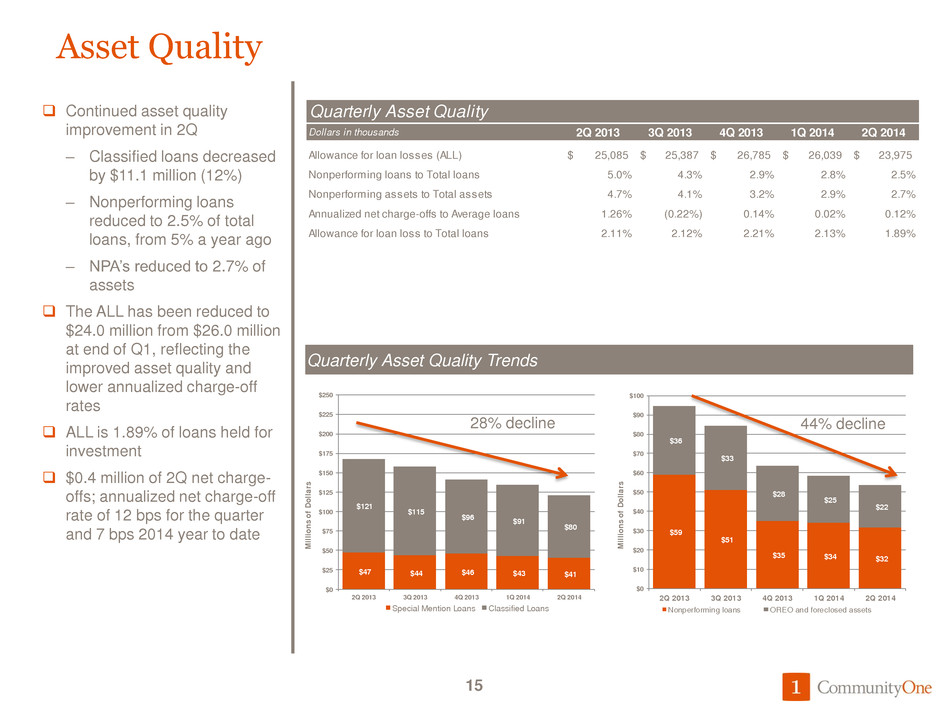
$59 $51 $35 $34 $32 $36 $33 $28 $25 $22 $0 $10 $20 $30 $40 $50 $60 $70 $80 $90 $100 2Q 2013 3Q 2013 4Q 2013 1Q 2014 2Q 2014 M ill io ns o f D ol la rs Nonperforming loans OREO and foreclosed assets $47 $44 $46 $43 $41 $121 $115 $96 $91 $80 $0 $25 $50 $75 $100 $125 $150 $175 $200 $225 $250 2Q 2013 3Q 2013 4Q 2013 1Q 2014 2Q 2014 M ill io ns o f D ol la rs Special Menti n Loans Classified Loans Asset Quality Continued asset quality improvement in 2Q – Classified loans decreased by $11.1 million (12%) – Nonperforming loans reduced to 2.5% of total loans, from 5% a year ago – NPA’s reduced to 2.7% of assets The ALL has been reduced to $24.0 million from $26.0 million at end of Q1, reflecting the improved asset quality and lower annualized charge-off rates ALL is 1.89% of loans held for investment $0.4 million of 2Q net charge- offs; annualized net charge-off rate of 12 bps for the quarter and 7 bps 2014 year to date 15 Quarterly Asset Quality Trends 28% decline 44% decline Quarterly Asset Quality Dollars in thousands 2Q 2013 3Q 2013 4Q 2013 1Q 2014 2Q 2014 Allowance for loan losses (ALL) 25,085$ 25,387$ 26,785$ 26,039$ 23,975$ Nonperforming loans to Total loans 5.0% 4.3% 2.9% 2.8% 2.5% Nonperforming assets to Total assets 4.7% 4.1% 3.2% 2.9% 2.7% Annualized net charge-offs to Average loans 1.26% (0.22%) 0.14% 0.02% 0.12% Allowance for loan loss to Total loans 2.11% 2.12% 2.21% 2.13% 1.89%
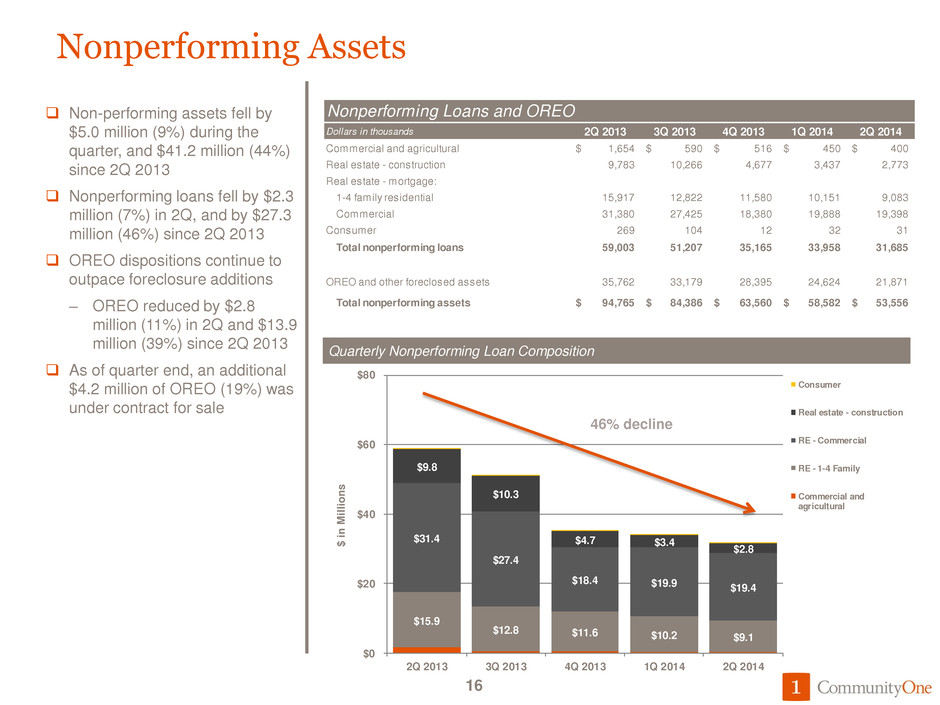
$15.9 $12.8 $11.6 $10.2 $9.1 $31.4 $27.4 $18.4 $19.9 $19.4 $9.8 $10.3 $4.7 $3.4 $2.8 $0 $20 $40 $60 $80 2Q 2013 3Q 2013 4Q 2013 1Q 2014 2Q 2014 $ i n Mi lli on s Consumer Real estate - construction RE - Commercial RE - 1-4 Family Commercial and agricultural Nonperforming Assets Non-performing assets fell by $5.0 million (9%) during the quarter, and $41.2 million (44%) since 2Q 2013 Nonperforming loans fell by $2.3 million (7%) in 2Q, and by $27.3 million (46%) since 2Q 2013 OREO dispositions continue to outpace foreclosure additions – OREO reduced by $2.8 million (11%) in 2Q and $13.9 million (39%) since 2Q 2013 As of quarter end, an additional $4.2 million of OREO (19%) was under contract for sale 16 Quarterly Nonperforming Loan Composition 46% decline Nonperforming Loans and OREO Dollars in thousands 2Q 2013 3Q 2013 4Q 2013 1Q 2014 2Q 2014 Commercial and agricultural 1,654$ 590$ 516$ 450$ 400$ Real estate - construction 9,783 10,266 4,677 3,437 2,773 Real estate - mortgage: 1-4 family residential 15,917 12,822 11,580 10,151 9,083 Commercial 31,380 27,425 18,380 19,888 19,398 Consumer 269 104 12 32 31 Total nonperforming loans 59,003 51,207 35,165 33,958 31,685 OREO and other foreclosed assets 35,762 33,179 28,395 24,624 21,871 Total nonperforming assets 94,765$ 84,386$ 63,560$ 58,582$ 53,556$
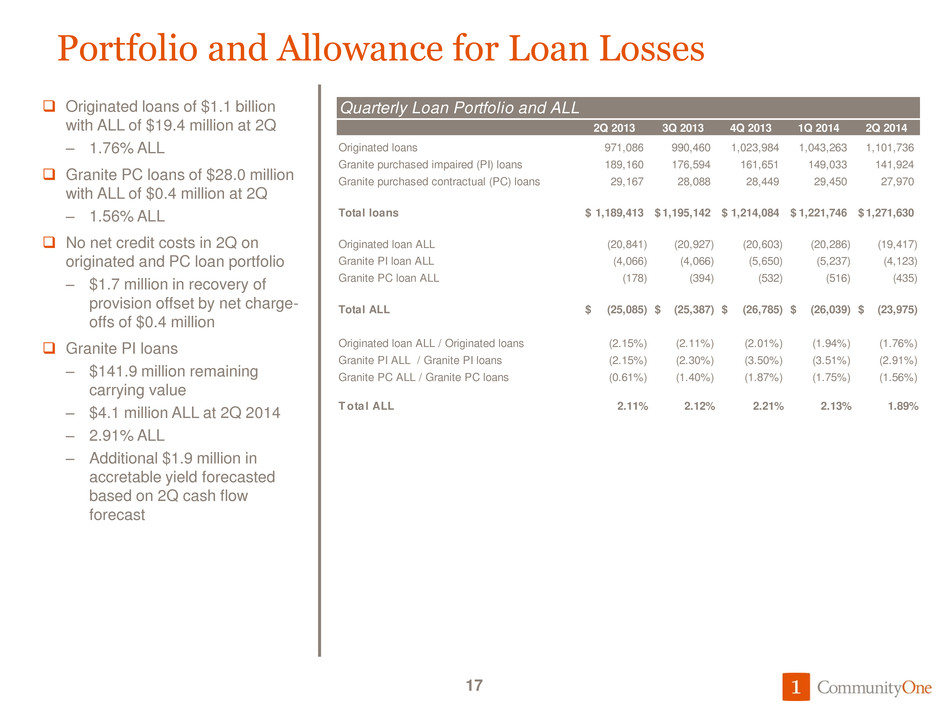
Portfolio and Allowance for Loan Losses Originated loans of $1.1 billion with ALL of $19.4 million at 2Q – 1.76% ALL Granite PC loans of $28.0 million with ALL of $0.4 million at 2Q – 1.56% ALL No net credit costs in 2Q on originated and PC loan portfolio – $1.7 million in recovery of provision offset by net charge- offs of $0.4 million Granite PI loans – $141.9 million remaining carrying value – $4.1 million ALL at 2Q 2014 – 2.91% ALL – Additional $1.9 million in accretable yield forecasted based on 2Q cash flow forecast 17 Quarterly Loan Portfolio and ALL 2Q 2013 3Q 2013 4Q 2013 1Q 2014 2Q 2014 Originated loans 971,086 990,460 1,023,984 1,043,263 1,101,736 Granite purchased impaired (PI) loans 189,160 176,594 161,651 149,033 141,924 Granite purchased contractual (PC) loans 29,167 28,088 28,449 29,450 27,970 Total loans 1,189,413$ 1,195,142$ 1,214,084$ 1,221,746$ 1,271,630$ Originated loan ALL (20,841) (20,927) (20,603) (20,286) (19,417) Granite PI loan ALL (4,066) (4,066) (5,650) (5,237) (4,123) Granite PC loan ALL (178) (394) (532) (516) (435) Total ALL (25,085)$ (25,387)$ (26,785)$ (26,039)$ (23,975)$ Originated loan ALL / Originated loans (2.15%) (2.11%) (2.01%) (1.94%) (1.76%) Granite PI ALL / Granite PI loans (2.15%) (2.30%) (3.50%) (3.51%) (2.91%) Granite PC ALL / Granite PC loans (0.61%) (1.40%) (1.87%) (1.75%) (1.56%) T ota l ALL 2.11% 2.12% 2.21% 2.13% 1.89%
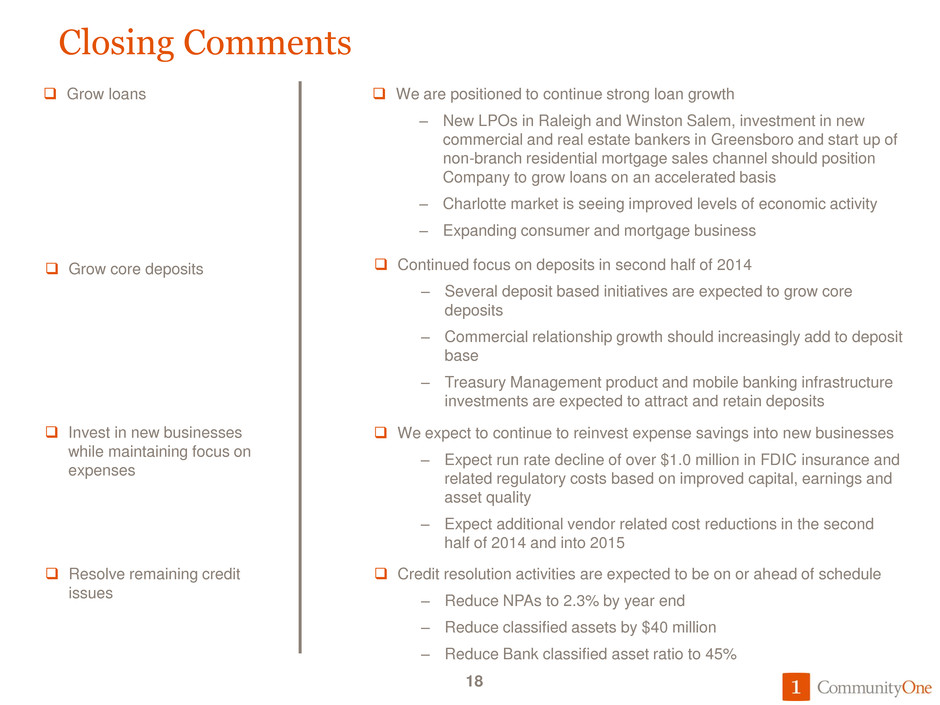
18 We are positioned to continue strong loan growth – New LPOs in Raleigh and Winston Salem, investment in new commercial and real estate bankers in Greensboro and start up of non-branch residential mortgage sales channel should position Company to grow loans on an accelerated basis – Charlotte market is seeing improved levels of economic activity – Expanding consumer and mortgage business Grow loans Continued focus on deposits in second half of 2014 – Several deposit based initiatives are expected to grow core deposits – Commercial relationship growth should increasingly add to deposit base – Treasury Management product and mobile banking infrastructure investments are expected to attract and retain deposits Grow core deposits Credit resolution activities are expected to be on or ahead of schedule – Reduce NPAs to 2.3% by year end – Reduce classified assets by $40 million – Reduce Bank classified asset ratio to 45% Resolve remaining credit issues We expect to continue to reinvest expense savings into new businesses – Expect run rate decline of over $1.0 million in FDIC insurance and related regulatory costs based on improved capital, earnings and asset quality – Expect additional vendor related cost reductions in the second half of 2014 and into 2015 Invest in new businesses while maintaining focus on expenses Closing Comments 18

Appendix 19
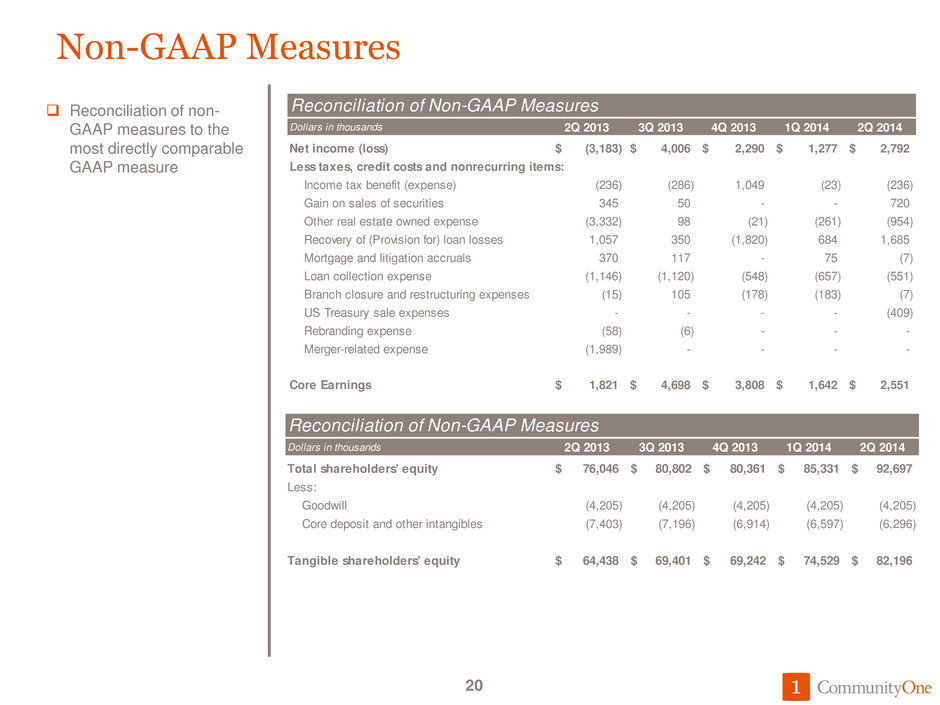
Non-GAAP Measures Reconciliation of non- GAAP measures to the most directly comparable GAAP measure 20 Reconciliation of Non-GAAP Measures Dollars in thousands 2Q 2013 3Q 2013 4Q 2013 1Q 2014 2Q 2014 Total shareholders' equity 76,046$ 80,802$ 80,361$ 85,331$ 92,697$ Less: Goodwill (4,205) (4,205) (4,205) (4,205) (4,205) Core deposit and other intangibles (7,403) (7,196) (6,914) (6,597) (6,296) Tangible shareholders' equity 64,438$ 69,401$ 69,242$ 74,529$ 82,196$ Reconciliation of Non-GAAP Measures Dollars in thousands 2Q 2013 3Q 2013 4Q 2013 1Q 2014 2Q 2014 Net income (loss) (3,183)$ 4,006$ 2,290$ 1,277$ 2,792$ Less taxes, credit costs and nonrecurring items: Income tax benefit (expense) (236) (286) 1,049 (23) (236) Gain on sales of securities 345 50 - - 720 Other real estate owned expense (3,332) 98 (21) (261) (954) Recovery of (Provision for) loan losses 1,057 350 (1,820) 684 1,685 Mortgage and litigation accruals 370 117 - 75 (7) Loan collection expense (1,146) (1,120) (548) (657) (551) Branch closure and restructuring expenses (15) 105 (178) (183) (7) US Treasury sale expenses - - - - (409) Rebranding expense (58) (6) - - - Merger-related expense (1,989) - - - - Core Earnings 1,821$ 4,698$ 3,808$ 1,642$ 2,551$


