
CommunityOne Bancorp Second Quarter 2015 Earnings Presentation July 30, 2015

Presenters Bob Reid President / Chief Executive Officer David Nielsen Chief Financial Officer Neil Machovec Chief Credit Officer 2

Forward Looking Statements & Other Information 3 Forward Looking Statements This presentation contains certain forward-looking statements within the safe harbor rules of the federal securities laws. These statements generally relate to COB’s financial condition, results of operations, plans, objectives, future performance or business. They usually can be identified by the use of forward-looking terminology, such as “believes,” “expects,” or “are expected to,” “plans,” “projects,” “goals,” “estimates,” “may,” “should,” “could,” “would,” “intends to,” “outlook” or “anticipates,” or variations of these and similar words, or by discussions of strategies that involve risks and uncertainties. Forward looking statements are subject to risks and uncertainties, including but not limited to, those risks described in COB’s Annual Report on Form 10-K for the year ended December 31, 2014 under the section entitled “Item 1A, Risk Factors,” and in the Quarterly Reports of Form 10-Q and other reports that are filed by COB with the Securities and Exchange Commission. You are cautioned not to place undue reliance on these forward-looking statements, which are subject to numerous assumptions, risks and uncertainties, and which change over time. These forward-looking statements speak only as of the date of this presentation. Actual results may differ materially from those expressed in or implied by any forward looking statements contained in this presentation. We assume no duty to revise or update any forward-looking statements, except as required by applicable law. Non-GAAP Financial Measures In addition to the results of operations presented in accordance with Generally Accepted Accounting Principles (GAAP), COB management uses and this presentation contains or references, certain non-GAAP financial measures, such as pre-credit and non-recurring (PCNR) earnings, PCNR noninterest income, PCNR noninterest expense, and tangible shareholders’ equity. COB believes these non-GAAP financial measures provide information useful to investors in understanding our underlying operational performance and our business and performance trends as they facilitate comparisons with the performance of others in the financial services industry; however, these non-GAAP financial measures should not be considered an alternative to GAAP. The non-GAAP financial measures contained within this presentation should be read in conjunction with the audited financial statements and analysis as presented in COB’s Annual Report on Form 10-K as well as the unaudited financial statements and analyses as presented in COB’s Quarterly Reports on Form 10-Q. A reconciliation of non-GAAP measures to the most directly comparable GAAP measure is included within tables in the presentation or with the appendix to this presentation.

Quarterly Operating Highlights Net income of $2.5 million, $0.10 per share – PCNR earnings of $4.0 million, up 56% over 2Q 2014 – $3.9 million pre tax net income, up 30% over 2Q 2014 Fifth consecutive quarter of double digit annualized loan growth – Portfolio grew $49.9 million, a 14% annualized growth rate – Loans to deposit ratio grew to 78% Annualized deposit growth of 11% – Branch deposit acquisition of $58.8 million from CertusBank – Noninterest-bearing deposits grew at 17% annualized rate Continued improved credit trends – NPA’s fell to 1.7% of assets – Provision recovery of $0.8 million Net interest income grew 7% over 2Q 2014 – 3.43% NIM, up 3 bps over 2Q 2014 NIE fell 7% from 2Q 2014 – PCNR NIE to average assets was 3.03% in 2Q Quarterly Results Results of Operations Dollars in thousands 2Q 2014 3Q 2014 4Q 2014 1Q 2015 2Q 2015 Net interest income 15,718$ 15,848$ 16,721$ 16,774$ 16,827$ Recovery of provision 1,685 1,679 1,323 1,137 788 Noninterest income 4,893 3,985 4,543 4,034 4,153 Noninterest expense 19,268 20,015 20,446 18,008 17,827 Net income before tax 3,028 1,497 2,141 3,937 3,941 Income tax benefit (expense) (236) 276 142,475 (1,418) (1,418) Net income 2,792 1,773 144,616 2,519 2,523 PCNR earnings 1 2,551$ 2,013$ 2,906$ 3,460$ 3,972$ 1 Non-GAAP measure. See appendix for reconciliation to GAAP presentation. 4 Quarterly Performance Metrics Dollars in thousands except per share data 2Q 2014 3Q 2014 4Q 2014 1Q 2015 2Q 2015 Net income per share - diluted 0.13$ 0.08$ 6.62$ 0.10$ 0.10$ Return on average assets 0.56% 0.35% 28.10% 0.46% 0.45% Pre-tax return on average assets 0.61% 0.30% 0.42% 0.73% 0.70% Return on average equity 12.7% 7.6% 577.0% 3.8% 3.7% et i margin 3.40% 3.38% 3. 9% 3.54% 3.43% PCNR noninterest expense to average assets 1 3.47% 3.55% 3.55% 3.15% 3.03% Loans held for investment 1,269,865$ 1,318,117$ 1,357,788$ 1,395,911$ 1,445,853$ Deposits 1,763,765 1,758,930 1,794,420 1,807,472 1,855,638 NPA's to total assets 2.7% 2.4% 2.1% 1.9% 1.7% Loans to deposits 72% 75% 76% 77% 78% Tier 1 Leverage 6.35% 6.48% 9.78% 8.47% 8.50% Tier 1 Common Equity N/A N/A N/A 11.86% 11.85% Tangible book value to tangible assets 1 4.1% 4.2% 11.7% 11.8% 11.4% 1 Non-GAAP measure. See appendix for reconciliation to GAAP presentation.

14% annualized loan growth in 2Q - 5th consecutive quarter of double digit annualized loan growth – On track with year end goal of 10-12% – Annualized organic loan growth of 21% in 2Q 2015 – Average earning assets grew at a 9% annualized rate in 2Q – Loans to deposits ratio grew to 78% vs year end goal of 80-85% Asset growth Core deposit growth ahead of plan in 2Q – Deposits grew at 11% annualized rate, including branch acquisition – Low cost core deposits grew at 8% annual rate in 2Q – Noninterest-bearing deposits grew $14.6 million, an annualized growth rate of 17%, on commercial relationship acquisition and treasury management products Continued deposit growth Completed the acquisition of deposits of the Lenoir and Granite Falls branches of CertusBank Explore M&A opportunities NIE reduced 7% year over year, ahead of plan – PCNR NIE to average assets ratio was 3.03%, ahead of 3.10% 2015 goal – First full quarter of savings from March 2015 branch closures – Run rate includes investments in Raleigh and Charleston LPOs, and additional mortgage origination personnel Monetize expense efforts Progress on 2015 Goals Noninterest income was flat year over year, trailing growth goal of 10-12% – Mortgage loan income up 20% from 2Q 2014 on 67% increase in origination volume from MLO and non-branch channel volume – Completed sale of first SBA loans in 2Q 2015, expect acceleration in 2nd half of year – Service charges down 5% year over year including impact of six branch closures in 1Q 2015 Enhanced fee income 5
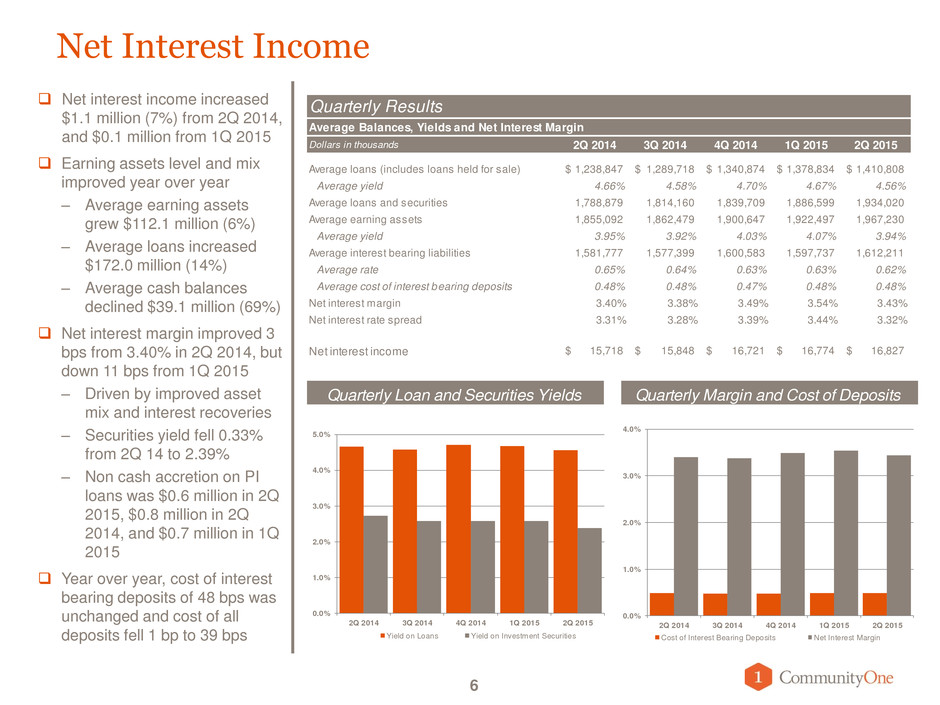
Net Interest Income Net interest income increased $1.1 million (7%) from 2Q 2014, and $0.1 million from 1Q 2015 Earning assets level and mix improved year over year – Average earning assets grew $112.1 million (6%) – Average loans increased $172.0 million (14%) – Average cash balances declined $39.1 million (69%) Net interest margin improved 3 bps from 3.40% in 2Q 2014, but down 11 bps from 1Q 2015 – Driven by improved asset mix and interest recoveries – Securities yield fell 0.33% from 2Q 14 to 2.39% – Non cash accretion on PI loans was $0.6 million in 2Q 2015, $0.8 million in 2Q 2014, and $0.7 million in 1Q 2015 Year over year, cost of interest bearing deposits of 48 bps was unchanged and cost of all deposits fell 1 bp to 39 bps 6 0.0% 1.0% 2.0% 3.0% 4.0% 5.0% 2Q 2014 3Q 2014 4Q 2014 1Q 2015 2Q 2015 Yield on Loans Yield on Investment Securities 0.0% 1.0% 2.0% 3.0% 4.0% 2Q 2014 3Q 2014 4Q 2014 1Q 2015 2Q 2015 Cost of Interest Bearing Deposits N t Interest Margin Quarterly Results Average Balances, Yields and Net Interest Margin Dollars in thousands 2Q 2014 3Q 2014 4Q 2014 1Q 2015 2Q 2015 Average loans (includes loans held for sale) 1,238,847$ 1,289,718$ 1,340,874$ 1,378,834$ 1,410,808$ Average yield 4.66% 4.58% 4.70% 4.67% 4.56% Average loans and securities 1,788,879 1,814,160 1,839,709 1,886,599 1,934,020 Average earning assets 1,855,092 1,862,479 1,900,647 1,922,497 1,967,230 Average yield 3.95% 3.92% 4.03% 4.07% 3.94% Average interest bearing liabilities 1,581,777 1,577,399 1,600,583 1,597,737 1,612,211 Average rate 0.65% 0.64% 0.63% 0.63% 0.62% Average cost of interest bearing deposits 0.48% 0.48% 0.47% 0.48% 0.48% Net interest margin 3.40% 3.38% 3.49% 3.54% 3.43% Net interest rate spread 3.31% 3.28% 3.39% 3.44% 3.32% Net interest income 15,718$ 15,848$ 16,721$ 16,774$ 16,827$ Quarterly Loan and Securities YieldsQuarterly Margin and Cost of Deposits
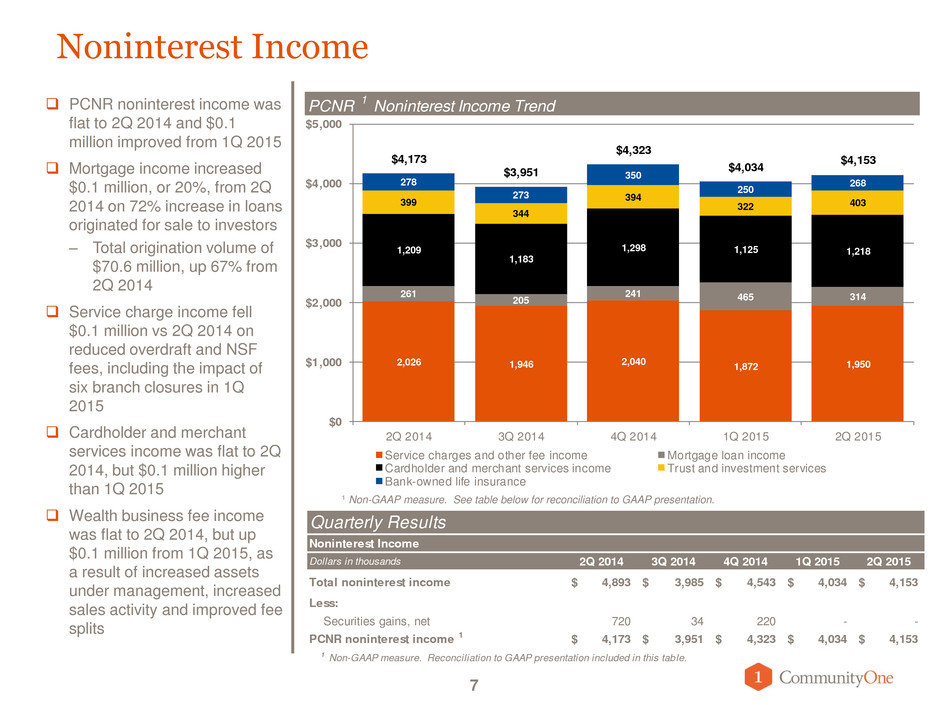
Noninterest Income PCNR noninterest income was flat to 2Q 2014 and $0.1 million improved from 1Q 2015 Mortgage income increased $0.1 million, or 20%, from 2Q 2014 on 72% increase in loans originated for sale to investors – Total origination volume of $70.6 million, up 67% from 2Q 2014 Service charge income fell $0.1 million vs 2Q 2014 on reduced overdraft and NSF fees, including the impact of six branch closures in 1Q 2015 Cardholder and merchant services income was flat to 2Q 2014, but $0.1 million higher than 1Q 2015 Wealth business fee income was flat to 2Q 2014, but up $0.1 million from 1Q 2015, as a result of increased assets under management, increased sales activity and improved fee splits 7 Quarterly Results Noninterest Income Dollars in thousands 2Q 2014 3Q 2014 4Q 2014 1Q 2015 2Q 2015 Total noninterest income 4,893$ 3,985$ 4,543$ 4,034$ 4,153$ Less: Securities gains, net 720 34 220 - - PCNR noninterest income 1 4,173$ 3,951$ 4,323$ 4,034$ 4,153$ 1 Non-GAAP measure. Reconciliation to GAAP presentation included in this table. 2,026 1,946 2,040 1,872 1,950 261 205 241 465 314 1,209 1,183 1,298 1,125 1,218 399 344 394 322 403 278 273 350 250 268 $4,173 $3,951 $4,323 $4,034 $4,153 $0 $1,000 $2,000 $3,000 $4,000 $5,000 2Q 2014 3Q 2014 4Q 2014 1Q 2015 2Q 2015 Service charges and other fee income Mortgage loan income Cardholder and merchant services income Trust and investment services Bank-owned life insurance Total PCNR 1 Noninterest Income Trend 1 Non-GAAP measure. See table below for reconciliation to GAAP presentation.
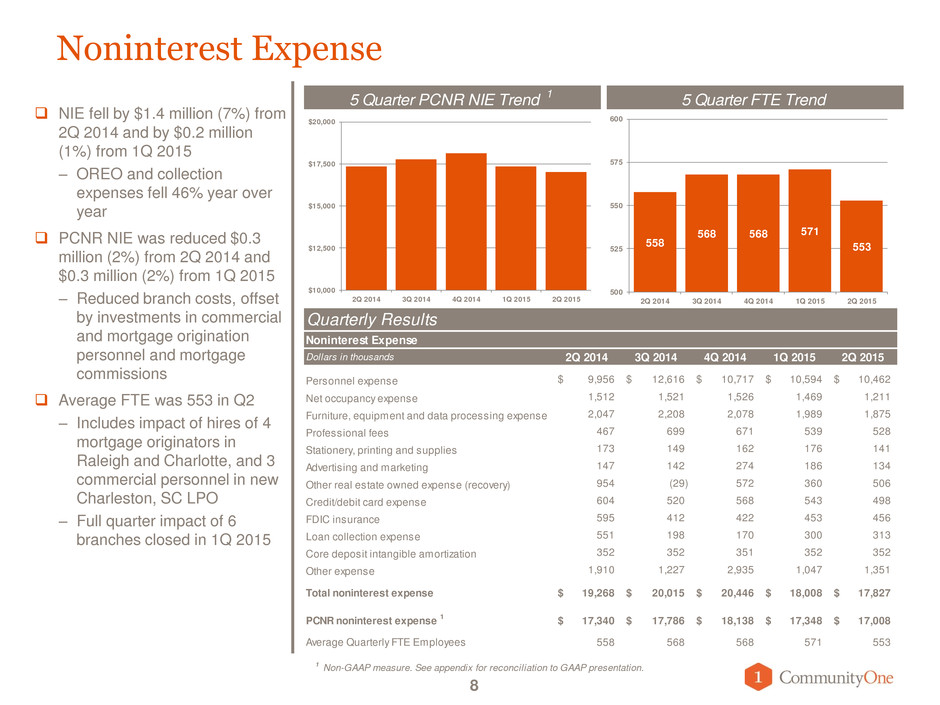
$10,000 $12,500 $15,000 $17,500 $20,000 2Q 2014 3Q 2014 4Q 2014 1Q 2015 2Q 2015 558 568 568 571 553 500 525 550 575 600 2 014 3Q 2014 4Q 2014 1Q 2015 2Q 2015 Noninterest Expense NIE fell by $1.4 million (7%) from 2Q 2014 and by $0.2 million (1%) from 1Q 2015 – OREO and collection expenses fell 46% year over year PCNR NIE was reduced $0.3 million (2%) from 2Q 2014 and $0.3 million (2%) from 1Q 2015 – Reduced branch costs, offset by investments in commercial and mortgage origination personnel and mortgage commissions Average FTE was 553 in Q2 – Includes impact of hires of 4 mortgage originators in Raleigh and Charlotte, and 3 commercial personnel in new Charleston, SC LPO – Full quarter impact of 6 branches closed in 1Q 2015 8 Quarterly Results Noninterest Expense Dollars in thousands 2Q 2014 3Q 2014 4Q 2014 1Q 2015 2Q 2015 Personnel expense 9,956$ 12,616$ 10,717$ 10,594$ 10,462$ Net occupancy expense 1,512 1,521 1,526 1,469 1,211 Furniture, equipment and data processing expense 2,047 2,208 2,078 1,989 1,875 Professional fees 467 699 671 539 528 Stationery, printing and supplies 173 149 162 176 141 Advertising and marketing 147 142 274 186 134 Other real estate owned expense (recovery) 954 (29) 572 360 506 Credit/debit card expense 604 520 568 543 498 FDIC insurance 595 412 422 453 456 Loan collection expense 551 198 170 300 313 Core deposit intangible amortization 352 352 351 352 352 Other expense 1,910 1,227 2,935 1,047 1,351 Total noninterest expense 19,268$ 20,015$ 20,446$ 18,008$ 17,827$ PCNR noninterest expense 1 17,340$ 17,786$ 18,138$ 17,348$ 17,008$ Average Quarterly FTE Employees 558 568 568 571 553 1 Non-GAAP measure. See appendix for reconciliation to GAAP presentation. 5 Quarter PCNR NIE Trend 1 5 Quarter FTE Trend
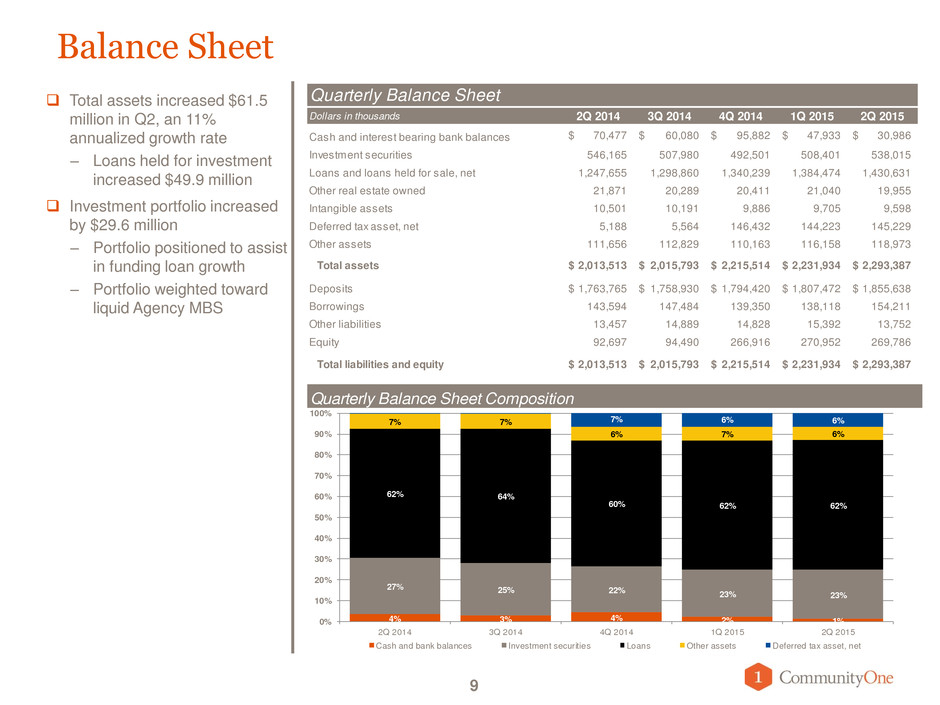
4% 3% 4% 2% 1% 27% 25% 22% 23% 23% 62% 64% 60% 62% 62% 7% 7% 6% 7% 6% 0% 0% 7% 6% 6% 0% 10% 20% 30% 40% 50% 60% 70% 80% 90% 100% 2Q 2014 3Q 2014 4Q 2014 1Q 2015 2Q 2015 Cash and bank balances Investment securities Loans Other assets Deferred tax asset, net Balance Sheet Total assets increased $61.5 million in Q2, an 11% annualized growth rate – Loans held for investment increased $49.9 million Investment portfolio increased by $29.6 million – Portfolio positioned to assist in funding loan growth – Portfolio weighted toward liquid Agency MBS 9 Quarterly Balance Sheet Dollars in thousands 2Q 2014 3Q 2014 4Q 2014 1Q 2015 2Q 2015 Cash and interest bearing bank balances 70,477$ 60,080$ 95,882$ 47,933$ 30,986$ Investment securities 546,165 507,980 492,501 508,401 538,015 Loans and loans held for sale, net 1,247,655 1,298,860 1,340,239 1,384,474 1,430,631 Other real estate owned 21,871 20,289 20,411 21,040 19,955 Intangible assets 10,501 10,191 9,886 9,705 9,598 Deferred tax asset, net 5,188 5,564 146,432 144,223 145,229 Other assets 111,656 112,829 110,163 116,158 118,973 Total assets 2,013,513$ 2,015,793$ 2,215,514$ 2,231,934$ 2,293,387$ Deposits 1,763,765$ 1,758,930$ 1,794,420$ 1,807,472$ 1,855,638$ Borrowings 143,594 147,484 139,350 138,118 154,211 Other liabilities 13,457 14,889 14,828 15,392 13,752 Equity 92,697 94,490 266,916 270,952 269,786 Total liabilities and equity 2,013,513$ 2,015,793$ 2,215,514$ 2,231,934$ 2,293,387$ Quarterly Balance Sheet Composition

Loan Growth in Core Markets 10 Four metro markets represent 72% of our organic loan portfolio, up from 70% a year ago – Strong growth in non- metro markets from share gains Experienced and growing origination teams in key growth markets driving strong year over year loan portfolio growth rates – Charlotte – 47% growth – Raleigh – 46% growth – Greensboro / WS – 9% growth Full range of lending products – Commercial, SBA, Treasury, Consumer, Auto, Mortgage, Wealth – Commercial Real Estate including Builder Finance Organic Loan Portfolio and Growth Rates by MSA 47% 46% 2% 9% 10% 0% 5% 10% 15% 20% 25% 30% 35% 40% 45% 50% $0 $50,000 $100,000 $150,000 $200,000 $250,000 $300,000 $350,000 $400,000 $450,000 Charlotte MSA Raleigh / Durham MSA Hickory MSA Greensboro / WS MSA Non Metro MSAs Loan Portfolio Metro 12 Month Growth Rate

Accelerated Loan Growth Total loans held for investment grew $49.9 million in 2Q 2015; annualized growth rate of 14% – 5th consecutive quarter of double digit annualized growth rate – All lines of business grew loans during the quarter Organic loans (excluding purchased residential loans) grew $61.7 million; 21% annualized growth rate Total pass rated loans grew by $61.9 million; annualized growth rate of 19% Non-pass rated loans fell by $11.9 million, or 13% Loan portfolio composition balanced between consumer and commercial exposure 11 Loan Portfolio Growth Rates By Category Dollars in thousands 2Q 2014 1Q 2015 2Q 2015 $ % Annualized Commercial and Commercial Real Estate 397,905$ 492,192$ 547,122$ 54,930$ 11% 45% RE Construction 61,125 75,226 64,851 (10,375) -14% -55% Consumer/HELOC 200,336 227,578 236,870 9,292 4% 16% 1-4 Family Residential 266,890 309,131 328,901 19,770 6% 26% Pass Rated Organic Loans 926,256 1,104,127 1,177,745 73,617 7% 27% Purchased Resi Mortgage Loans 222,723 201,500 189,758 (11,743) (6%) (23%) Non Pass Rated Organic Loans 120,887 90,283 78,350 (11,933) (13%) (53%) Total Loans 1,269,865$ 1,395,911$ 1,445,853$ 49,942$ 4% 14% Total Organic Loans 1,047,142$ 1,194,410$ 1,256,095$ 61,685$ 5% 21% Total Pass Rated Loans 1,148,978 1,305,628 1,367,503 61,875 5% 19% 2Q Growth 1,269,865 1,318,117 1,357,788 1,395,911 1,445,853 0% 5% 10% 15% 20% 25% $ $400,000 $800,000 $1,200,000 $1,600,000 2Q 2014 3Q 2014 4Q 2014 1Q 2015 2Q 2015 Commercial RE Construction Consumer/HELOC 1-4 Family Residential Purchased Residential Non pass loans Total Loans Organic Growth Rate Annualized Quarterly Loan Portfolio Mix

18% 18% 18% 19% 19% 19% 20% 20% 20% 20% 5% 5% 5% 5% 5% 24% 24% 24% 24% 23% 17% 17% 16% 15% 16% 14% 14% 15% 15% 15% 3% 2% 2% 2% 2% 2Q 2014 3Q 2014 4Q 2014 1Q 2015 2Q 2015 Noninterest-bearing demand Interest-bearing demand Savings Money market Time deposits < $100,000 Time deposits > $100,000 Brokered Attractive and Growing Core Deposit Franchise Deposits increased by $48.2 million, an 11% annualized growth rate, in 2Q – Includes impact of Certus Branch acquisition, offset by closure of six branches in March 2015 Low cost core deposits grew at an annualized rate of 8% in 2Q Noninterest-bearing deposits increased $14.6 million, or 4%, in 2Q, a 17% annualized growth rate – Driven by commercial relationship acquisition and improved treasury management product set Average deposits per branch has grown 17% since 2Q 2014 to $41.2 million per branch Core deposits stable at 83% of deposits 12 Co re N o n Co re Quarterly Deposits Dollars in thousands 2Q 2014 3Q 2014 4Q 2014 1Q 2015 2Q 2015 Noninterest-bearing demand 321,829$ 317,981$ 323,776$ 337,417$ 352,033$ Interest-bearing demand 333,260 349,517 358,162 364,196 363,998 Savings 85,451 85,519 86,686 89,919 92,057 Money market 431,803 423,967 437,484 426,606 433,648 Brokered 47,783 37,673 38,378 37,433 37,054 Time deposits < $100,000 301,795 294,774 285,989 277,928 290,516 Time deposits > $100,000 241,844 249,499 263,945 273,973 286,332 Total deposits 1,763,765$ 1,758,930$ 1,794,420$ 1,807,472$ 1,855,638$ Total Time Deposits 591,422$ 581,946$ 588,312$ 589,334$ 613,902$ Low Cost Core Deposits 1,172,343 1,176,984 1,206,108 1,218,138 1,241,736 Core Deposits 1,474,138 1,471,758 1,492,097 1,496,066 1,532,252 Quarterly Deposit Mix

$32 $28 $25 $20 $20 $22 $20 $20 $21 $20 $0 $10 $20 $30 $40 $50 $60 2Q 2014 3Q 2014 4Q 2014 1Q 2015 2Q 2015 M ill io ns o f D ol la rs Nonperforming loans OREO and foreclosed assets $41 $36 $40 $35 $26 $80 $73 $63 $55 $53 $0 $25 $50 $75 $100 $125 $150 $175 $200 2Q 2014 3 2014 4 2014 1 5 2 M ill io ns o f D ol la rs Special Menti Loans Classified Lo s Credit Risk Well Managed 13 35% decline 26% decline Quarterly Asset Quality Dollars in thousands 2Q 2014 3Q 2014 4Q 2014 1Q 2015 2Q 2015 Allowance for loan losses (ALL) 23,975$ 21,525$ 20,345$ 19,008$ 17,989$ Nonperforming loans to total loans 2.5% 2.2% 1.9% 1.5% 1.4% Nonperforming assets to total assets 2.7% 2.4% 2.1% 1.9% 1.7% Annualized net charge-offs (recoveries) to avg. loans 0.12% 0.24% (0.04%) 0.06% 0.07% Allowance for loan loss to total loans 1.89% 1.63% 1.50% 1.36% 1.24% Classified assets to Tier 1 + ALL 68% 62% 41% 39% 36% Continued asset quality improvement in 2Q – Classified loans decreased by $2.6 million (5%) in 2Q – Nonperforming loans reduced to 1.4% of total loans, from 2.5% a year ago – NPA’s reduced to 1.7% of assets The ALL has been reduced to $18.0 million from $19.0 million at end of 1Q, reflecting the improved asset quality and continued low annualized charge-off rates ALL is 1.24% of loans held for investment $0.2 million in net charge-offs in 2Q 2015 – C&I and construction- $0.4 million net recovery – Consumer & 1-4 residential mortgage - $0.6 million net charge-off – 2015 annualized net charge-off of 7 bps Classified Asset Ratio improved to 36% Quarterly Asset Quality Trends Criticized LoansNonperforming Assets

Nonperforming Assets and Allowance 14 Quarterly Loan Portfolio and ALL 2Q 2014 3Q 2014 4Q 2014 1Q 2015 2Q 2015 Originated loans 1,101,736$ 1,162,793$ 1,211,794$ 1,271,783$ 1,346,506$ Granite purchased impaired (PI) loans 141,924 130,665 122,842 109,262 102,115 Granite purchased contractual (PC) loans 27,970 26,927 25,948 22,437 21,593 Total loans 1,271,630$ 1,320,385$ 1,360,584$ 1,403,482$ 1,470,214$ Originated loan ALL (19,417)$ (17,184)$ (16,729)$ (15,390)$ (14,463)$ Granite PI loan ALL (4,123) (3,923) (3,237) (3,194) (3,181) Granite PC loan ALL (435) (418) (379) (424) (345) Total ALL (23,975)$ (21,525)$ (20,345)$ (19,008)$ (17,989)$ Originated loan ALL / Originated loans (1.76%) (1.48%) (1.38%) (1.21%) (1.07%) Granite PI ALL / Granite PI loans (2.91%) (3.00%) (2.64%) (2.92%) (3.12%) Granite PC ALL / Granite PC loans (1.56%) (1.55%) (1.46%) (1.89%) (1.60%) T ota l ALL 1.89% 1.63% 1.50% 1.36% 1.24% Originated loans of $1.35 billion with ALL of $14.5 million (1.07%) at 2Q Granite PC loans of $21.6 million with ALL of $0.4 million (1.6%) at 2Q Granite PI loans of $102.1 million with $3.2 million ALL (3.12%) at 2Q 2015 Non-performing assets fell by $1.8 million (4%) during the quarter, and $14.0 million (26%) since 2Q 2014 Nonperforming loans fell by $0.7 million (3%) in 2Q, and by $12.1 million (38%) since 2Q 2014 OREO decreased by $1.0 million (5%) in 2Q and decreased by $1.9 million (9%) since 2Q 2014 At the end of 2Q, $1.1 million of OREO (6%) was under contract for sale Nonperforming Loans and OREO Dollars in thousands 2Q 2014 3Q 2014 4Q 2014 1Q 2015 2Q 2015 Commercial and agricultural 400$ 351$ 608$ 515$ 469$ Real estate - construction 2,773 2,878 2,307 1,022 799 Real estate - mortgage: 1-4 family residential 9,083 8,777 8,637 8,856 9,383 Commercial 19,398 16,383 13,386 9,410 8,379 C nsumer 31 94 355 452 553 Total nonperforming loans 31,685 28,483 25,293 20,255 19,583 OREO and other foreclosed assets 21,871 20,289 20,411 21,040 19,955 Total nonperforming assets 53,556$ 48,772$ 45,704$ 41,295$ 39,538$ NPL / Total Loans Held For Investment 2.5% 2.2% 1.9% 1.5% 1.4%

Appendix 15
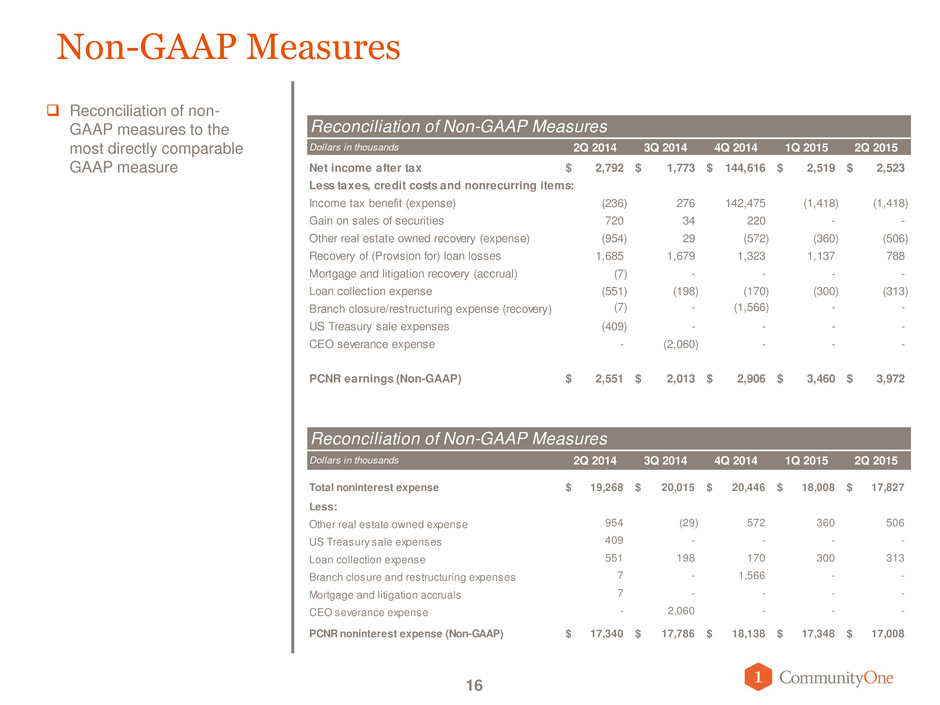
Non-GAAP Measures Reconciliation of non- GAAP measures to the most directly comparable GAAP measure 16 Reconciliation of Non-GAAP Measures Dollars in thousands 2Q 2014 3Q 2014 4Q 2014 1Q 2015 2Q 2015 Net income after tax 2,792$ 1,773$ 144,616$ 2,519$ 2,523$ Less taxes, credit costs and nonrecurring items: Income tax benefit (expense) (236) 276 142,475 (1,418) (1,418) Gain on sales of securities 720 34 220 - - Other real estate owned recovery (expense) (954) 29 (572) (360) (506) Recovery of (Provision for) loan losses 1,685 1,679 1,323 1,137 788 Mortgage and litigation recovery (accrual) (7) - - - - Loan collection expense (551) (198) (170) (300) (313) (7) - (1,566) - - US Treasury sale expenses (409) - - - - CEO severance expense - (2,060) - - - PCNR earnings (Non-GAAP) 2,551$ 2,013$ 2,906$ 3,460$ 3,972$ Branch closure/restructuring expense (recovery) econciliation of Non-GAAP Measures Dollars in thousands 2Q 2014 3Q 2014 4Q 2014 1Q 2015 2Q 2015 Total noninter st expense 19,268$ 20,015$ 20 44$ 18,008$ 17,827$ Less: Other r al estat own d xpense 954 (29) 572 360 506 US Treasury sale expenses 409 - - - - Loan collection expense 551 198 170 300 313 Branch closure and restructuring expenses 7 - 1,566 - - Mortgage and litigation accruals 7 - - - - CEO severance expense - 2,060 - - - PCNR noninterest expense (Non-GAAP) 17,340$ 17,786$ 18,138$ 17,348$ 17,008$

Non-GAAP Measures 17 Reconciliation of non- GAAP measures to the most directly comparable GAAP measure Reconciliation of Non-GAAP Measures Dollars in thousands 2Q 2014 3Q 2014 4Q 2014 1Q 2015 2Q 2015 Book Value (Shareholders' equity) 92,697$ 94,490$ 266,916$ 270,952$ 269,786$ Less: Goodwill (4,205) (4,205) (4,205) (4,205) (4,205) Core deposit and other intangibles (6,296) (5,986) (5,681) (5,500) (5,393) 82,196$ 84,299$ 257,030$ 261,247$ 260,188$ Tangible book value (Tangible shareholders' equity) (Non-GAAP) Rec nciliation of Non-GAAP Measures Dollars in thousands 2Q 2014 3Q 2014 4Q 2014 1Q 2015 2Q 2015 2,013,513$ 2,015,793$ 2,215,514$ 2,231,934$ 2,293,387$ Le s: Goodwill (4,205) (4,205) (4,205) (4,205) (4,205) Core deposit and other intangibles (6,296) (5,986) (5,681) (5,500) (5,393) 2,003,012$ 2,005,602$ 2,205,628$ 2,222,229$ 2,283,789$ Total Assets Tangible Assets (Non-GAAP)


