UNITED STATES
SECURITIES AND EXCHANGE COMMISSION
Washington, D.C. 20549
FORM 10-K
Annual Report Pursuant to Section 13 or 15(d) of the
Securities Exchange Act of 1934
| For the annual period ended December 31, 2015 | Commission File Number 0-13823 | |||

COMMUNITYONE BANCORP
(Exact name of Registrant as specified in its Charter)
| North Carolina | 56-1456589 | |
| (State of Incorporation) | (I.R.S. Employer Identification No.) | |
| 1017 E. Morehead Street | ||
| Charlotte, North Carolina | 28204 | |
| (Address of principal executive offices) | (Zip Code) | |
(336) 626-8300
(Registrant's telephone number, including area code)
Securities Registered Pursuant to Section 12(g) of the Securities Exchange Act of 1934:
| Title of each class |
| Common Stock, $0.00 par value |
______________________________________________________________
Indicate by check mark if the registrant is a well-known seasoned issuer as defined in Rule 405 of the Securities Act. Yes ¨ No ý
Indicate by check mark if the registrant is not required to file reports pursuant to Section 13 or Section 15(d) of the Exchange Act. Yes ¨ No ý
Indicate by check mark whether the Registrant (1) has filed all reports required to be filed by Section 13 or 15(d) of the Securities Exchange Act of 1934 during the preceding 12 months (or for such shorter period that the Registrant was required to file such reports), and (2) has been subject to such filing requirements for the past 90 days. Yes ý No ¨
Indicate by check mark whether the registrant (1) has submitted electronically and posted on its corporate Website, if any, every Interactive Data File required to be submitted and posted pursuant to Rule 405 of Regulation S-T (§232.405 of this chapter) during the preceding 12 months (or for such shorter period that the registrant was required to submit and post such files.) Yes ý No ¨
Indicate by check mark if disclosure of delinquent filers pursuant to Item 405 of Regulation S-K is not contained herein, and will not be contained, to the best of the Registrant’s knowledge, in definitive proxy or information statements incorporated by reference to Part III of this Form 10-K or any amendment to this Form 10-K. ¨
Indicate by check mark whether the registrant is a large accelerated filer, an accelerated filer, a non-accelerated filer or a smaller reporting company. See the definitions of “large accelerated filer,” “accelerated filer,” and “smaller reporting company” in Rule 12b-2 of the Exchange Act. (Check one)
Large accelerated filer o | Accelerated filer x | Non-accelerated filer o | Smaller reporting Company o |
| (Do not check if a smaller reporting company) | |||
Indicate by check mark whether the registrant is a shell company (as defined in Rule 12b-2 of the Exchange Act). Yes o No x
The aggregate market value of the Registrant’s common stock held by non-affiliates of the Registrant, as of June 30, 2015, was approximately $257.1 million. As of February 29, 2016 (the most recent practicable date), the Registrant had outstanding approximately 24,292,051 shares of Common Stock.
CommunityOne Bancorp and Subsidiaries
Report on Form 10-K
December 31, 2015
TABLE OF CONTENTS
| Index | Page | |
| PART I | ||
| Item 1. | ||
| Item 1A. | ||
| Item 1B. | ||
| Item 2. | ||
| Item 3. | ||
| Item 4. | ||
| PART II | ||
| Item 5. | ||
| Item 6. | ||
| Item 7. | ||
| Item 7A. | ||
| Item 8. | ||
| Item 9. | ||
| Item 9A. | ||
| Item 9B. | ||
| PART III | ||
| Item 10. | ||
| Item 11. | ||
| Item 12. | ||
| Item 13. | ||
| Item 14. | ||
| PART IV | ||
| Item 15. | ||
2
PART I
| Item 1. | BUSINESS |
General
CommunityOne Bancorp, (“COB”) or (the “Company,” also referred to as “us” or “we” and our subsidiaries on a consolidated basis), is a bank holding company headquartered in Charlotte, North Carolina and incorporated in 1984 under the laws of the State of North Carolina. Through our ownership of CommunityOne Bank, N.A. (the “Bank”), a national banking association founded in 1907 and headquartered in Asheboro, North Carolina, we offer a complete line of consumer, mortgage and business banking services, including loan, deposit, treasury management, as well as wealth management and trust services, to individuals and small and middle market businesses through financial centers located throughout central, southern and western North Carolina. Our strategy is to grow the Company organically by focusing on meeting the financial needs of customers in our market area by providing a suite of quality financial products and services through local and experienced bankers and lenders located in branches and loan production offices in our customers’ local market. We also offer the convenience of online and mobile banking capabilities. We define our market as communities located in North Carolina, as well as adjoining markets in South Carolina and Virginia.
On November 22, 2015, we entered into an Agreement and Plan of Merger (“Merger Agreement”) with Capital Bank Financial Corp., a Delaware corporation (“Capital”), under which, upon the terms and subject to the conditions set forth in the Merger Agreement, COB will merge with and into Capital (the “Merger”), with Capital as the surviving corporation in the Merger. Immediately following the Merger, the Bank will merge with and into Capital’s wholly owned bank subsidiary, with Capital’s bank subsidiary surviving the bank merger. The Merger is subject to, among other things, regulatory and shareholder approval and other customary closing conditions and is currently expected to close in the second quarter of 2016.
In July 2013, we changed our name from FNB United Corp. to CommunityOne Bancorp, and our stock symbol from FNBN to COB.
On October 21, 2011, we acquired Bank of Granite Corporation (“Granite”) and its subsidiary bank, Bank of Granite, through the merger of a wholly owned subsidiary of ours into Granite (the “Granite Merger”). Bank of Granite was merged into the Bank and Granite was dissolved on June 8, 2013. The Granite Merger was part of a recapitalization of the Company, which included, among other things, a private placement of $310 million in capital with investments from, among other investors, affiliates of each of The Carlyle Group (“Carlyle”), and Oak Hill Capital Partners (“Oak Hill Capital” and collectively, the “Anchor Investors”), and certain of our directors and officers.
Our key objectives for the Company during 2015 were to: (1) grow loans; (2) grow core deposits; (3) enhance fee income growth; (4) maintain expense discipline, and (5) explore merger and acquisition (“M&A”) opportunities that make sense strategically and financially.
Competition
We compete with other local, regional and national financial service providers, including other bank and financial holding companies, commercial banks, savings institutions, credit unions, finance companies and brokerage and insurance firms. Specifically, we face significant competition in both originating loans and attracting deposits from other commercial banks, savings associations, credit unions, and other financial services companies located both within and outside our market area. We consider ourselves to be one of the significant financial institutions in the Piedmont area of North Carolina, in terms of total assets and deposits. Nonetheless, the banking markets in North Carolina have a high number of financial institutions, some of which are significantly larger institutions than us, with greater financial resources. These financial institutions are our competitors.
Further competition is provided by banks located in adjoining counties and states, as well as other types of financial and nonfinancial institutions, such as insurance companies, finance companies, pension funds, brokerage firms and money funds. Some of our competitors are not subject to the same level of regulation and oversight that is required of banks, and thus are able to operate under lower cost structures. We also believe the financial services industry is likely to become more competitive as technological advances enable companies to provide financial services in a more efficient and convenient basis. We believe that the principal method to compete in the commercial banking industry is emphasizing relationship and personalized banking and local decision-making, as well as expanding our online and mobile capabilities, pricing services competitively and improving our cost efficiencies.
Employees
As of December 31, 2015, we had 544 full-time equivalent employees, 539 of which are located in the State of North Carolina and 5 of which are located in the State of South Carolina. We are not a party to a collective bargaining agreement and consider our relationships with our employees to be good.
3
Subsidiaries
In addition to the Bank, we own FNB United Statutory Trust I, FNB United Statutory Trust II, and Catawba Valley Capital Trust II, which were formed to facilitate the issuance of trust preferred securities. The Bank holds the stock of C1 Trustee, Inc., which holds deeds of trust for the Bank.
Access to United States Securities and Exchange Commission Filings
We make available at no cost all of our reports filed electronically with the United States Securities and Exchange Commission (“SEC”), including our Annual Report on Form 10-K, quarterly reports on Form 10-Q, and current reports on Form 8-K, as well as amendments to those reports, through our website at www.community1.com. These filings are also accessible on the SEC’s website at www.sec.gov. You may read and copy any material we file with the SEC at the SEC’s Public Reference Room at 100 F Street, NE, Washington, DC 20549. Information on the operation of the Public Reference Room may be obtained by calling the SEC at 1-800-SEC-0330.
We also will provide without charge a copy of our Annual Report on Form 10-K to any shareholder by mail. Requests should be sent to CommunityOne Bancorp, Attention: Secretary, 1017 E. Morehead Street, Suite 200, Charlotte, NC 28204.
Additionally, our corporate governance policies, including the charters of the Audit Committee, Risk Management Committee, Strategic Planning Committee, and the Compensation and Nominating Committee of our Board of Directors, as well as our Code of Business Ethics, may be found through the “Investor Relations” link on our website.
Regulation and Supervision
We are extensively regulated under federal and state law. The following describes certain aspects of that regulation and does not purport to be a complete description of all regulations that affect us or all aspects of those regulations.
To the extent statutory or regulatory provisions are described, the description is qualified in its entirety by reference to the particular statute or regulation. Any change in applicable law or regulation or in the way those laws or regulations are interpreted by regulatory agencies or courts may have a material impact on our business, operations and earnings. Proposals to change the laws and regulations governing the banking industry are frequently introduced in Congress, in state legislatures and before the various regulatory agencies. The likelihood and timing of any changes and the impact those changes might have on us is impossible to determine with any certainty.
CommunityOne Bancorp
We are a bank holding company, subject to regulation under the Bank Holding Company Act (“BHCA”) and the examination and reporting requirements of the Federal Reserve Board. Under the BHCA, a bank holding company such as COB, may not directly or indirectly acquire ownership or control of more than 5% of the voting shares or substantially all the assets of any additional bank, or merge or consolidate with another bank holding company, without the Federal Reserve Board's prior approval. COB may engage in the business of banking, managing or controlling banks or furnishing services to or performing services for its subsidiary banks, and in any activity that is considered to be so closely related to banking or managing or controlling banks, and as to be a proper incident thereto. As noted above, COB owns the Bank. We also own FNB United Statutory Trust I, FNB United Statutory Trust II, and Catawba Valley Capital Trust II, each of which were formed to facilitate the issuance of trust preferred securities.
The BHCA provides that the Federal Reserve Board may not approve any acquisition or other transaction, such as our Merger with Capital Bank, that would result in a monopoly or would be in furtherance of any combination or conspiracy to monopolize or attempt to monopolize the business of banking in any section of the United States, or the effect of which may be substantial to lessen competition or to tend to create a monopoly in any section of the country, or that in any other manner would be in restraint of trade, unless the anticompetitive effects of the proposed transaction are clearly outweighed by the public interest in meeting the convenience and needs of the community to be served. The Federal Reserve Board also is required to consider the financial and managerial resources and future prospects of the bank holding companies and banks involved in any transaction and the convenience and needs of the communities to be served. Consideration of financial resources generally focuses on capital adequacy and debt levels and consideration of convenience and needs includes the parties’ performance under the Community Reinvestment Act (“CRA”) and compliance with consumer protection laws. The Federal Reserve Board also must take into account the institution’s effectiveness in combating money laundering, and to consider the extent to which the transaction would result in greater or more concentrated risks to the stability of the United States banking or financial system.
As a bank holding company, COB is expected under Federal Reserve Board regulations to serve as a source of financial and managerial strength to its subsidiary banks. A bank holding company also is expected to commit resources, including capital and other funds, to support its subsidiary bank in circumstances where it might not do so absent such a policy.
4
CommunityOne Bank, N.A.
As a national banking association, the deposits of which are insured by the Federal Deposit Insurance Corporation (“FDIC”), the Bank is subject to regulation and examination primarily by the Office of the Comptroller of the Currency (“OCC”). The Bank also is regulated by the FDIC and the Federal Reserve Board. The federal regulators impose various requirements and restrictions on the institutions they regulate, including requirements to maintain reserves against deposits, restrictions on the types and amounts of loans that may be granted and the interest that may be charged on loans, limitations on the types of investments that may be made and the types of services that may be offered, and requirements governing capital adequacy, liquidity, earnings, dividends, risk management practices and branching.
There are certain restrictions imposed on the ability of the Bank to lend to and engage in other transactions with, COB and the Bank’s other affiliates. Under these provisions, individual transactions between the Bank and COB or any nonbank affiliate generally are limited to 10% of the Bank’s capital and surplus, and all transactions between the Bank and either COB or any nonbank affiliate are limited to 20% of the Bank’s capital and surplus. Loans and extensions of credit from the Bank to any affiliate generally are required to be secured by eligible collateral in specified amounts. In addition, any transaction between the Bank and any affiliate are required to be on arm’s length terms and conditions. The Dodd-Frank Act Wall Street Reform and Consumer Protection Act (“Dodd-Frank Act”) expanded these affiliate transaction rules to broaden the definition of affiliate and to apply to securities lending, repurchase agreements and derivatives activities that we may have with an affiliate, as well as to strengthen collateral requirements and limit Federal Reserve exemptive authority. Also, the definition of “extension of credit” for transactions with executive officers, directors and principal shareholders was expanded to include credit exposure arising from a derivative transaction, a repurchase or reverse repurchase agreement and a securities lending or borrowing transaction. These provisions have not had a material impact on COB or the Bank.
FDIC Insurance
The deposits of the Bank are insured by the FDIC up to the limits under applicable law, which currently are set at $250,000 for accounts under the same name and title. The Bank is subject to deposit insurance premium assessments. The FDIC imposes a risk-based deposit premium assessment system. Under this system, the assessment rates for an insured depository institution vary according to the level of risk incurred in its activities. To arrive at an assessment rate for a banking institution, the FDIC places it in one of four risk categories determined by reference to its capital levels and supervisory ratings. In the case of those institutions in the lowest risk category, the FDIC further determines its assessment rate based on certain specified financial ratios or, if applicable, long-term debt ratings. The assessment rate schedule can change from time to time, at the discretion of the FDIC, subject to certain limits. Under the current system, premiums are assessed quarterly. The FDIC has published guidelines on the adjustment of assessment rates for certain institutions. In addition, insured depository institutions have been required to pay a pro rata portion of the interest due on the obligations issued by the Financing Corporation to fund the closing and disposal of failed thrift institutions by the Resolution Trust Corporation.
The assessment base on which an insured depository institution’s deposit insurance premiums paid to the FDIC is now calculated based on its average consolidated total assets less its average equity. In addition, under current law, the minimum designated reserve ratio of the deposit insurance fund is required to increase from a minimum of 1.15% to 1.35% of the estimated amount of total insured deposits by September 30, 2020. The FDIC is required to offset the effect of the increased minimum reserve ratio for banks with assets of less than $10 billion.
Insurance of deposits may be terminated by the FDIC upon a finding that the institution has engaged in unsafe and unsound practices, is in an unsafe or unsound condition to continue operations or has violated any applicable law, regulation, rule, order or condition imposed by a bank’s federal regulatory agency.
Deposits and certain claims for administrative expenses and employee compensation against insured depository institutions are afforded a priority over other general unsecured claims against the institution, including federal funds and letters of credit, in the liquidation or other resolution of that institution by any receiver appointed by federal authorities. These priority creditors include the FDIC.
Dividend Restrictions
COB is a legal entity separate and distinct from its banking and other subsidiaries and has in the past relied on dividends from the Bank as its primary source of liquidity. There are limitations on the payment of dividends by the Bank to COB, as well as by COB to its shareholders. Federal law would require the Bank to obtain prior approval of the OCC to pay dividends, including under circumstances where the total of all dividends declared by the Bank in any calendar year will exceed the sum of its net income for that year and its retained net income for the preceding two calendar years, less any transfers required by the OCC or to be made to retire any preferred stock. Federal law also prohibits the Bank from paying dividends that in the aggregate would be greater than its undivided profits after deducting statutory bad debts in excess of its ALL. The Bank, however, may obtain shareholder and OCC approval to reduce its capital to allow payment of dividends after cumulative losses in an amount greater than its undivided profits.
5
In addition, the Federal Reserve Board has indicated that banking organizations should generally pay dividends to shareholders only if (i) the organization’s net income available to common shareholders over the past year has been sufficient to fully fund the dividends and (ii) the prospective rate of earnings retention appears consistent with the organization’s capital needs, asset quality and overall financial condition. COB has not declared any dividends with respect to its common stock in 2015 and does not expect to declare any dividends during 2016.
Capital
We are required under federal law to maintain certain capital levels at each of COB and the Bank. The federal banking agencies have issued substantially similar risk-based and leverage capital requirements to banking organizations they supervise. Under these requirements, COB and the Bank are required to maintain certain capital standards based on ratios of capital to assets and capital to risk weighted assets. The requirements also define the weights assigned to assets and off-balance sheet items to determine the risk weighted asset components of the risk-based capital rules. Risks such as concentration of credit risks and the risk arising from non-traditional activities, as well as the institution’s exposure to a decline in the economic value of its capital due to changes in interest rates, and an institution's ability to manage those risks are important factors that are to be taken into account by the federal banking agencies in assessing an institution’s overall capital adequacy.
Under revised capital rules applicable to community banks with assets less than $10 billion and their holding companies pursuant to the requirements of the Dodd-Frank Act and standards adopted by the Basel Committee on Banking Supervision (referred to as “Basel III”), which were effective for us January 1, 2015, banks and their holding companies must hold the following minimum capital ratios:
| • | A common equity Tier 1 (“CET 1”) risk-based capital ratio of at least 4.5%; |
| • | A Tier 1 capital ratio (CET 1 plus Additional Tier 1 capital) of at least 6%; |
| • | A total (Tier 1 plus Tier 2 capital) risk-based capital ratio of at least 8%; and |
| • | A leverage capital ratio (Tier 1 capital to average consolidated assets) of at least 4%. |
Common equity Tier 1 (CET 1) capital consists solely of common stock and related surplus, retained earnings, accumulated other comprehensive income and limited amounts of minority interests that are in the form of common stock. Additional Tier 1 capital includes non-cumulative perpetual preferred stock, and for bank holding companies with less than $15 billion in total consolidated assets, instruments such as COB’s trust preferred securities. Tier 2 capital continues to consist of instruments disqualified from Tier 1 capital, including eligible subordinated debt, other preferred stock and a limited amount of loan loss reserves. The revised capital rules provide for a number of deductions from and adjustments to CET 1, including for example, the requirement that mortgage servicing rights, deferred tax assets arising from temporary difference, that could not be realized through net operating loss carrybacks, and significant investment in non-consolidated financial entities be deducted from CET 1 to the extent that any one such category exceeds 10% of CET 1, or all such items in the aggregate, exceed 15% of CET 1. In addition, the effects of accumulated other comprehensive income or loss (“AOCI”) items included in shareholders’ equity (for example, unrealized gains and losses on marked to market securities held in available-for-sale portfolio) under generally accepted accounting principles may not be reversed for purposes of determining regulatory capital ratios, unless the Company made a one-time permanent election to continue to exclude those items. The Company and Bank made the one-time election as required in its March 30, 2015 Consolidated Reports of Condition and Income.
In addition, the revised capital rules require a capital conservation buffer of up to 2.5% above each of the capital ratio requirements (common equity tier 1, tier 1, and total risk-based capital) which must be met for a bank and its holding company to be able to pay dividends, engage in share buybacks or make discretionary bonus payments to executive management without restriction. This capital conservation buffer is being phased in over a four year period starting on January 1, 2016. When fully implemented, a banking organization would need to maintain a common equity Tier 1 capital ratio greater than 7.0%, a Tier 1 capital ratio greater than 8.5% and a total risk-based capital ratio greater than 10.5%, otherwise, it will be subject to restrictions on capital distributions and discretionary bonus payments to its executive management.
COB and the Bank have complied with the capital requirements in effect on December 31, 2015, and we believe that both COB and the Bank will comply with the fully phased in capital ratios applicable to them without having a material effect on either COB or the Bank.
Safety and Soundness Considerations
There are a number of additional obligations and restrictions imposed by law and policy on bank holding companies, such as COB, and the Bank, that are designed to reduce potential loss exposure to depositors and to the FDIC insurance fund in the event that the depository institutions become in danger of default or in default. Under current federal law, for example, the federal banking agencies, including the OCC and the FDIC, possess broad powers to take prompt corrective action to resolve problems of insured depository institutions such as the Bank. The extent of these powers depends upon whether the institution is “well capitalized,” “adequately capitalized,” “undercapitalized,” “significantly undercapitalized” or “critically undercapitalized,” as defined by the law. Under regulations issued by the federal banking agencies pursuant to the federal banking agencies’ final rule to implement Basel III and the
6
minimum leverage and risk-based capital requirements of the Dodd-Frank Act, effective January 1, 2015, a “well capitalized” institution must have a total risk based capital of at least 10.0%, a Tier 1 capital ratio of at least 8.0%, a CET 1 capital ratio of at least 6.5% and a leverage ratio of at least 5%. An “adequately capitalized” institution must have a total risk-based capital of at least 8.0%, a Tier 1 capital ratio of at least 6.0%, a CET 1 capital ratio of at least 4.5% and a leverage ratio of at least 4.0%. An “undercapitalized” institution has a total risk-based capital ratio of less than 8.0%, a Tier 1 risk-based capital ratio of less than 6.0%, a CET 1 capital ratio of less than 4.5%, or a leverage ratio of less than 4.0%; a “significantly undercapitalized” institution has a total risk-based capital ratio of less than 6.0%, a Tier 1 risk-based capital ratio of less than 4.0%, a CET 1capital ratio of at less than 3.0% or a leverage ratio of less than 3.0%; and a “critically undercapitalized” institution has a ratio of tangible equity to total assets that is equal to or less than 2.0%. The Bank currently is designated as “well capitalized.” This classification is primarily for the purpose of applying the prompt corrective action provisions of federal law and is not intended to be and should not be interpreted as a representation of overall financial condition or prospects of the institution.
The federal banking agencies’ prompt corrective action powers are broad. For example, an institution that is categorized as “undercapitalized,” “significantly undercapitalized,” or “critically undercapitalized” is required to submit an acceptable capital restoration plan to its appropriate federal banking agency and the parent bank holding company must guarantee that the institution meet its capital restoration plan, subject to certain limitations. An “undercapitalized” institution is also generally prohibited from increasing its average total assets, making acquisitions, establishing any branches or engaging in any new line of business, except under an accepted capital restoration plan or with FDIC approval. In addition, the appropriate federal banking agency may treat an “undercapitalized” institution in the same manner as it treats a “significantly undercapitalized” institution if it determines that those actions are necessary.
The federal banking agencies also have adopted guidelines prescribing safety and soundness standards relating to internal controls, risk management, information systems, internal audit systems, loan documentation, credit underwriting, interest rate exposure, asset growth and compensation, fees and benefits. These guidelines in general require appropriate systems and practices to identify and manage specified risks and exposures. The guidelines prohibit excessive compensation as an unsafe and unsound practice and characterize compensation as excessive when the amounts paid are unreasonable or disproportionate to the services performed by an executive officer or employee, director or principal shareholder. In addition, the agencies have adopted regulations that authorize but do not require an agency to order an institution that has been given notice by the agency that it is not in compliance with any of the safety and soundness standards to submit a compliance plan. If after being so notified, an institution fails to submit an acceptable compliance plan, the agency must issue an order directing action to correct the deficiency and may issue an order directing other actions of the types to which an “undercapitalized” institution is subject under the prompt corrective action provisions described above.
The enforcement powers available to the federal banking agencies are substantial and include, among other things, the ability to assess civil money penalties, to issue cease and desist or removal orders, and to initiate injunctive actions against banks and bank holding companies and any “institution affiliated party” as defined in the law. In general, these enforcement actions may be initiated for violations of laws and regulations, as well as engagement in unsafe and unsound practices. Other actions or inactions may provide the basis for enforcement actions, including filing misleading or untimely reports with regulatory authorities.
Community Reinvestment and Consumer Protection Laws
In connection with its lending activities, the Bank is subject to a number of federal laws designed to protect borrowers and promote lending to various sectors of the economy and population. These include, among other laws, the Equal Credit Opportunity Act, the Truth in Lending Act, the Home Mortgage Disclosure Act, the Real Estate Settlement Procedures Act (“RESPA”), the Fair Credit Reporting Act, the Truth in Savings Act and the CRA. Administration of many of these consumer protection rules are the responsibility of the Consumer Financial Protection Bureau (“CFPB”). The CFPB also has authority to define and prevent unfair, deceptive and abusive practices in the consumer financial area, and expanded data collecting powers for purposes of determining bank compliance with the fair lending laws. In each of these cases, because we have less than $10 billion in total assets, we are supervised in these areas by the OCC.
The regulations relating to mortgage lending and servicing pursuant to the Truth in Lending Act (“TILA”), the Equal Credit Opportunity Act and RESPA were substantially revised by the CFPB, effective January 10, 2014, to require, among other things, enhanced disclosures to consumers relating to appraisals, home ownership counseling, payments, forced placed insurance, and error resolution, certain minimum standards for the origination of residential mortgages, including a determination of the borrower’s ability to repay, enhanced training to mortgage loan officers, enhanced mitigation procedures for delinquent borrowers, and provisions that will allow borrowers to raise certain defenses to foreclosure if they receive any loan other than a “qualified mortgage,” as that term has been defined by the CFPB. Effective October 1, 2015, CFPB regulations required integrated disclosures to be provided to mortgage borrowers under RESPA and TILA. The Bank is in compliance with these regulations.
Rules developed by the federal banking agencies pursuant to federal law also require institutions to disclose their privacy policies to consumers and in some circumstances to allow consumers to prevent the disclosure of certain personal information to affiliated
7
entities and unaffiliated third parties. These regulations also impact how consumer information is conveyed to outside vendors. The Bank is in compliance with these regulations.
The CRA requires the appropriate federal banking agency, in connection with its examination of a bank, to assess the bank’s record in meeting the credit needs of the communities served by the institution, including low and moderate income neighborhoods. Furthermore, such assessment is required to be undertaken of any bank that has applied, among other things, to merge or consolidate with or acquire the assets or assume the liabilities of an insured depository institution, or to open or relocate a branch office. In the case of a bank holding company, the Federal Reserve Board is required to assess the record of each subsidiary bank of any bank holding company that applies to acquire a bank or bank holding company in connection with the application. Under the CRA, institutions are assigned a rating of “outstanding,” “satisfactory,” “needs to improve,” or “unsatisfactory.” The Bank received a “satisfactory” rating at its most recent CRA evaluation.
Anti-Money Laundering Rules
We are subject to the requirements of the Bank Secrecy Act (“BSA”), its implementing regulations and other anti-money laundering (“AML”) laws and regulations, including the USA Patriot Act of 2001. Among other things, these laws and regulations require the Bank to take steps to prevent the use of the Bank to facilitate the flow of illegal or illicit money, to report large currency transactions and to file suspicious activity reports. The Bank also is required to develop and implement a comprehensive AML compliance program. Banks must also have in place appropriate “know your customer” policies and procedures. Violations of these requirements can result in substantial civil and criminal sanctions. In addition, a provision of the USA Patriot Act of 2001 requires the federal banking agencies to consider the effectiveness of a financial institution’s AML activities when reviewing bank mergers and bank holding company acquisitions.
Incentive Compensation
Guidelines adopted by the federal banking agencies prohibit excessive compensation as an unsafe and unsound practice and describe compensation as excessive when the amounts paid are unreasonable or disproportionate to the service performed by an executive officer, employee, director or principal stockholder. The Federal Reserve Board has issued comprehensive guidance on incentive compensation policies intended to ensure that incentive compensation policies of banking organizations do not undermine the safety and soundness of such organization by encouraging excessive risk-taking. This guidance, which covers all employees that have the ability to materially affect the risk profile of an organization, either individually or as part of a group, is based upon three key principles that a banking organization’s incentive compensation should (i) provide incentives that do not encourage excessive risk-taking; (ii) be compatible with effective internal controls and risk management; and (iii) be supported by strong corporate governance, including by the organization’s board of directors. Enforcement action may be taken against a banking organization with incentive compensation arrangements posing a risk to the organization’s safety and soundness or if the organization is not taking prompt and effective measures to correct such deficiencies.
The Dodd-Frank Act
The Dodd-Frank Act significantly changed the bank regulatory structure and has affected the lending, deposit, investment, trading and operating activities of financial institutions and their holding companies including COB. Some of the changes made by the Dodd-Frank Act have been described above. In addition to those summaries, among other things, the Dodd-Frank Act created a Financial Stability Oversight Council to identify systemic risks in the financial system and gave federal regulators new authority to take control of and liquidate larger financial firms.
Significant rules and regulations have been and continue to be issued by the various federal agencies pursuant to the requirements of the Dodd-Frank Act. Those rules that have or will affect our operations include:
| • | Rules enacted by the SEC pursuant to the Dodd-Frank Act, giving shareholders a non-binding vote on executive compensation and so called “golden parachute” payments, as well as the authority to allow shareholders to nominate their own candidates using a company’s proxy materials; |
| • | Rules enacted by the federal banking agencies prohibiting excessive compensation paid to financial institution executives; |
| • | Provisions authorizing national banks and state banks to establish branches in other states to the same extent as a bank chartered by that state would be permitted to branch, thus allowing banks to enter new markets more freely; |
| • | Rules enacted by the Federal Reserve Board and enforced by the CFPB limiting interchange fees applicable to debit card transactions charged by banks with $10 billion or more in assets, which while not applicable to us, may have the practical effect of reducing the fees that we may be able to charge; |
| • | Rules issued by the CFPB to establish certain minimum standards for the origination of residential mortgages, including a determination of the borrower’s ability to repay; |
| • | Provisions that allow borrowers to raise certain defenses to foreclosure if they receive any loan other than a “qualified mortgage,” as that term has been defined by the CFPB; |
| • | Provisions that have consolidated consumer complaints into the CFPB; |
8
| • | Provisions that give the CFPB expanded data collection powers for fair lending purposes for both small business and mortgage loans, as well as expanded authority to prevent unfair, deceptive and abusive practices; and |
| • | Provisions restricting the ability of COB and the Bank to engage in short-term proprietary trading of securities, derivatives, commodity futures and options on these instruments for their own account, owning, sponsoring or having certain relationships with “covered funds,” including hedge funds and private equity funds, or investing in certain instruments that are covered by these prohibitions, subject to certain exceptions (the so-called “Volcker Rule”). |
Not all of the regulations under the Dodd-Frank Act have yet been finalized and thus we cannot predict the ultimate impact of these regulations on COB or its business, financial condition or results of operations. However, the regulations have increased and are expected to continue to increase our operating and compliance costs.
Future Legislation
Federal and state legislatures and regulatory agencies propose and adopt changes to their laws and regulations or change the manner in which existing laws or regulations are applied. We cannot predict the substance or impact of pending or future legislation or regulation or the application of those laws or regulations, although enactment of any significant proposal could affect how we operate and could significantly increase our costs, impede the efficiency of internal business processes or limit our ability to pursue business opportunities in an efficient manner, any of which could materially and adversely affect our business, financial condition and results of operations.
9
| Item 1A. | RISK FACTORS |
An investment in our common stock is subject to risks inherent in our business. The following discussion highlights the risks that management believes are material for our Company, but do not necessarily include all the risks that we may face. You should carefully consider the risk factors and uncertainties described below and elsewhere in this Annual Report on Form 10-K (“Report”) in evaluating an investment in COB’s common stock.
Risks Related to our Business and Business Strategy
We may not be able to meet our targets for organic loan, deposit and services growth.
Our business strategy includes organically growing loans and deposits through a variety of channels, including through our branches and loan production offices (“LPOs”), which we have staffed with mortgage loan officers, private bankers and commercial loan officers. We also offer loans through a non-branch based retail mortgage loan channel and a Small Business Administration (“SBA”) unit. We met our organic growth goals in 2015 but continuing to meet our growth goals for loans and deposits depends on our ability to successfully market and generate new loan and deposit volume from these channels, as well as successfully market complementary products and services, particularly treasury management services and online and mobile banking capabilities, at acceptable risk levels and upon acceptable terms, while managing the costs associated with this growth strategy. While the loan and deposit products we are offering are not new to the Bank, treasury management services and online and mobile banking services designed to support our growth strategy involve implementation and operational risks. The strategies also depend upon hiring and retaining experienced lenders in target markets who share our relationship banking philosophy. Because of a variety of factors, including the pending Merger of COB into Capital, which impacts our ability to attract and retain additional appropriate talent, the ability to have effective marketing and calling programs, continuing to successfully implement our treasury, online and mobile banking platforms containing adequate protections to mitigate risks, as well as market conditions and competition, there is no assurance that we will be able to meet our growth goals, or if we are successful, that such growth would meet profitability, cost or asset quality targets associated with the goals. An inability to grow or to effectively manage our growth could adversely affect our results of operations, financial condition and stock price.
Our decisions regarding credit risk could be incorrect, and our allowance for loan losses may be inadequate, which may adversely affect our financial condition and results of operations.
Our largest source of revenue is interest payments on loans made to Bank customers. There are certain risks inherent in making loans. Borrowers may not repay their loans according to the terms of those loans, and the collateral securing the payment of the loans may not be sufficient to assure repayment. Interest rates may change over the life of the loan, economic conditions may change and the value of the collateral affecting the loans may deteriorate. Management makes various assumptions and judgments about the collectability of the loan portfolio, including the creditworthiness of the borrowers and the value of the real estate, which is obtained from independent appraisers, and other assets serving as collateral for the repayment of the loans. However, we may be incorrect in these assumptions, in which case we may experience significant loan losses and losses on foreclosed collateral which could have a material adverse effect on our operating results.
We maintain an Allowance for Loan Losses (“ALL”) that we consider adequate to absorb losses inherent in the loan portfolio based on our assessment of all available information. In determining the size of the allowance, we rely on an analysis of the loan portfolio based on, among other things, historical loss experience, volume and types of loans, trends in classification, volume and trends in delinquencies and nonaccruals, and general economic conditions, both local and national. During the past year, as our credit performance has improved, this analysis has allowed us to reduce our ALL by $5.2 million. If management’s assumptions in undertaking this analysis are wrong, the ALL may not be sufficient to cover actual loan losses, and adjustments may be necessary to allow for different economic conditions or adverse developments in the loan portfolio. Additionally, any new deterioration in economic conditions affecting borrowers, new information regarding existing loans, identification of additional problem loans and other factors, both within and outside management’s control, may require an increase in the ALL. Material additions to the allowance would materially decrease our net income.
Banking regulators periodically review our ALL and may require us to increase the allowance or recognize further loan charge-offs based on judgments different from those of management. Any increase in the ALL or loan charge-offs as required by regulatory authorities could have adverse effects on our operating results and financial condition.
Weaknesses in the markets for residential or commercial real estate could reduce our net income and profitability.
Loans that are secured by real estate (including commercial, construction and development and consumer residential mortgage loans) as either the primary or secondary source of repayment are a large portion of the Bank's loan portfolio. These categories constitute $1.28 billion, or approximately 83% of the Bank's total loan portfolio as of December 31, 2015. These categories are generally affected by changes in economic conditions, fluctuations in interest rates and the availability of loans to potential purchasers, changes
10
in tax and other laws and acts of nature. Commercial real estate secured lending usually involves higher credit risk than that of single-family residential mortgage lending because of the larger loan balances and the fact that adverse conditions in real estate markets or the economy may impact the development and leasing of their properties and thus their cash flow. While the real estate markets in the communities we operate continue to recover from the 2009 recession, real estate in our urban markets (e.g. Charlotte) has recovered faster than real estate in our more rural markets, the impact of which is that our loan origination activity in our urban markets has increased faster than in our legacy rural markets. Any new downturn in the real estate markets in which we originate, purchase and service secured commercial, construction and development or consumer residential mortgage loans could hurt our business and future earnings both because these loans are secured by real estate and because loan demand for these type of loans would decrease.
Our mortgage business is sensitive to our success in hiring and retaining mortgage loan officers, maintaining a mix of conforming and other mortgages, as well as in changes in economic conditions, increased interest rates, and a slowdown in the housing market, any of which could impact adversely our results of operations.
Mortgage originations and sales are a significant portion of our consolidated business and maintaining or increasing our mortgage revenue is dependent upon our ability to originate loans. We expanded our mortgage origination capabilities during 2015 by hiring experienced mortgage loan officers in both our branch channel and our non-branch retail origination channel, which is targeted toward more urban markets, principally Charlotte, Raleigh and Winston-Salem. There is no assurance that we will be able to identify, hire and retain such officers, particularly given our pending Merger with Capital, and failure to do so would adversely affect our mortgage originations and consequently, our overall net income.
Furthermore, our revenue in this segment is in part reliant upon originating and selling loans that conform to the underwriting criteria of third parties, which was 42% of 2015's originations, and recording the gain on sale from such sales. Our mortgage division offers a mix of conforming and other types of mortgage loans, including jumbos and superjumbos, construction and specialized loan programs that meet the needs of our customers. While we target a percentage of loans for each loan type, there is no assurance that we will be able to maintain the mix of mortgages that meet our revenue goals. In addition, our mortgage revenue is dependent on originating both refinance and purchase money mortgages. During 2015, purchase money mortgages constituted approximately 39% of our production and that percentage is expected to continue in that range during 2016. Mortgage loan production levels are sensitive to changes in interest rates and economic conditions and changes in the housing market, as well as changes in underwriting standards, and have previously suffered from increases in interest rates or slowdowns in the housing market. Any sustained period of decreased origination activity caused by housing price pressure, underwriting standards, or increases in interest rates would adversely affect our mortgage originations, and consequently, our overall net income.
Changes in interest rates may have an adverse effect on our profitability.
Our earnings and financial condition depend to a large degree upon net interest income, which is the difference between interest earned from loans and investments and interest paid on deposits and borrowings. The narrowing of the margin between interest rates earned on loans and investments and the interest rates paid on deposits and borrowings could adversely affect our earnings and financial condition. We can neither predict with certainty nor control changes in interest rates. These changes can occur at any time and are affected by many factors, including international, national, regional and local economic conditions, competitive pressures and monetary policies of the Federal Reserve. In the unlikely event the Federal Reserve took the unprecedented step of reducing short-term interest rates below zero, the bank could experience additional narrowing of the margin between interest rates earned on loans and investments and the interest rates paid on deposits and borrowings. In addition, our customers often have the ability to prepay loans with either no penalties or penalties that are insufficient to compensate us for the lost income. If customers prepay loans at a higher rate, we may not be able to recover the lost revenues, which would affect our results of operations.
Furthermore, since 2008 interest rates have been low for an extended period of time, and any increase in rates could result in depositors redeeming time deposits or moving funds out of their existing money market or savings deposit accounts at the Bank into other interest-bearing alternatives at other financial institutions, including third party money market funds. We have ongoing policies and procedures designed to manage the risks associated with changes in market interest rates, including these prepayment and deposit run-off risks, and we model expected customer behavior based on historical experience of other interest rate cycles. Notwithstanding these policies and procedures, our customers may not react to changes in interest rates in the same manner in which they historically have reacted, resulting in a larger outflow of deposits or a higher level of loan prepayments than we expect. Such reaction could require us to increase interest rates to retain or acquire deposits, or lower loan rates to retain or attract loans. In either case, our deposit costs may increase and our loan interest income may decline, either or both of which may have an adverse effect on our financial results.
We may not be able to effectively work out nonperforming assets, which may adversely affect our results of operations and financial condition and require us to raise additional capital.
Since our recapitalization in 2011, the Bank has aggressively and materially reduced problem assets through workouts, restructurings, foreclosures and sales. The size of these problem assets is now smaller and we thus expect the pace of resolution to continue to slow. When we receive a signed contract for the sale of a loan or other real estate owned ("OREO") asset, the asset is marked down to the
11
contract price less associated selling costs, which may ultimately result in a loss to the Bank. Any decrease in the value of the underlying collateral securing Bank loans, adverse change in borrowers' performance or financial condition, or a decrease in the value of OREO, whether or not due to economic and market conditions beyond our control, could adversely affect our business, results of operations and financial condition. In addition, there can be no assurance that we will not experience increases in nonperforming assets in the future, or that the workout of our current nonperforming assets will not result in further losses. A new downturn in the market areas we serve could increase our credit risk associated with our loan portfolio, as it could have a material adverse effect on both the ability of borrowers to repay loans as well as the value of the real property or other property held as collateral for such loans, or in OREO. If credit costs are incurred over what we anticipate to resolve our remaining problem assets and reduce our credit risk to what we consider acceptable levels, we may need to raise additional capital. Factors affecting whether additional capital would be required include, among others, additional provision of loan losses, and loan charge-offs, additional write-downs in the carrying value of our OREO, changing requirements of regulators, and other risks discussed in this “Risk Factors” section. There can be no assurance that we would be able to raise capital in the amounts required and in a timely manner or at all. Any additional capital raised may be significantly dilutive to our existing shareholders and may result in the issuance of securities that have rights, preferences and privileges that are senior to our common stock.
Our ability to use net operating loss carryforwards to reduce future tax payments may be limited or restricted or may not exist at all, and if we do not sustain our profitability, we may be required to put up a valuation allowance against our deferred tax assets.
We generated significant federal and state net operating losses (“NOLs”) between 2008 and 2014. We are generally able to carry NOLs forward to reduce taxable income in future years. Our ability to use our NOLs to reduce future tax payments is dependent upon our ability to sustain profitability over the time period over which these NOLs may be used under applicable tax law. At December 31, 2015 we determined, based on all available positive and negative evidence, that it is more likely than not that future taxable income will be available during available carryforward periods to absorb all of the consolidated federal net operating loss carryforward and all of the North Carolina net economic loss carryforward. However, there is no assurance that we will be able to sustain our profitability, or accelerate it to the extent necessary to be able to use all of the NOLs we have generated, or that the conditions that led to our losses will not return. Our ability to generate sustained profitability in the amounts necessary to realize our deferred tax assets against future taxable income depends upon general economic and market conditions, interest rates, and our ability to meet our strategic plans. If we are unable to generate adequate sustained profitability, we may be required to record a new valuation allowance against some or all of our deferred tax assets, which would negatively impact our financial results.
In addition, the ability to utilize our NOLs is subject to the rules of Section 382 of the Internal Revenue Code. Section 382 generally restricts the use of NOLs after an “ownership change.” An ownership change occurs if, among other things, the shareholders (or specified groups of shareholders) who own or have owned, directly or indirectly, 5% or more of a corporation’s common stock or are otherwise treated as 5% shareholders under Section 382 and Treasury regulations promulgated thereunder because of an increase of their aggregate percentage ownership of that corporation’s stock by more than 50 percentage points over the lowest percentage of the stock owned by these shareholders over a rolling three-year period. In the event of an ownership change, Section 382 imposes an annual limitation on the amount of taxable income a corporation may offset with NOL carryforwards. This annual limitation is generally equal to the product of the value of the corporation’s stock on the date of the ownership change, multiplied by the long-term tax-exempt rate published monthly by the Internal Revenue Service. Any unused annual limitation may be carried over to later years until the applicable expiration date for the respective NOL carryforwards. Consummation of our pending Merger with Capital will result in an “ownership change” at COB within the meaning of Section 382, resulting in a limitation on the resulting entity of the amount of taxable income it may offset with COB NOLs.
The loss of any member of the executive and senior management may adversely affect us.
We have assembled an executive and senior management team that has substantial background and experience in banking and financial services in the markets we serve. We rely heavily on the experience and expertise of our management to resolve problems and deploy new capital to achieve sustainable profitability and satisfactory capital levels. We have implemented a management succession planning process where we identify successors to our management team and work to train those managers for higher roles. The loss of key management personnel could negatively impact our earnings because of their skills, customer relationships and/or the potential difficulty of promptly replacing them with their chosen successors. In the Merger, it is anticipated that the five most senior officers of the Company will cease employment with the combined company at the Merger date.
Our business could suffer if we fail to attract and retain skilled people.
Our success depends, in large part, on our ability to attract and retain competent, experienced people. Our organic growth goals in particular require that we be able to attract and retain qualified and experienced mortgage loan officers, commercial lending officers and SBA lenders who share our relationship banking philosophy and have those customer relationships that will allow us to successfully expand. Many of our competitors are pursuing the same relationship banking strategy in our markets, which increases the competition to identify and hire talented employees. Our pending Merger with Capital has and will continue to result in those competitors seeking to hire our lending and other banking officers and other employees. Our failure to successfully retain
12
experienced, qualified employees through the merger process may have an adverse effect on our ability to meet our financial goals and thus adversely affect our future results of operations.
As a community bank, we are vulnerable to the economic conditions within the relatively small region in which we operate.
We operate in a relatively small market area, which extends from the central and southern Piedmont and Sandhills of North Carolina to the mountains of western North Carolina, in addition to Charleston, S.C. Furthermore, we lend primarily to individuals and to small and medium-sized businesses in those or adjacent markets. Thus, we are exposed to greater risk than banks that lend to larger commercial enterprises or have a bigger market footprint. We manage our credit exposure through careful monitoring of our borrowers and loan concentrations and through rigorous application and review procedures. We also balance our geographic risk by purchasing portfolios of loans to borrowers outside of our market area. Nevertheless, we remain limited in our ability to diversify our economic risks. While economic conditions continue to improve in our market areas, any economic downturn in this fairly small geographic region likely will negatively affect our customers through increased unemployment, reduced demand and depressed real estate values, and adversely affect our results of operations.
We may experience significant competition in our market area, which may adversely affect our business.
The commercial banking industry within our market area is extremely competitive. We also compete with other providers of financial services, such as savings associations and savings banks, credit unions, insurance companies, consumer finance companies, brokerage firms, the mutual funds industry and commercial finance and leasing companies, some of which are subject to less extensive regulation than us with respect to the products and services they provide. Our larger competitors include large interstate financial holding companies that are among the largest in the nation and are headquartered in North Carolina. These companies have a significant presence in our market area, have greater resources than we do and may offer products and services that we do not offer. These institutions also may be able to offer the same products and services at more competitive rates and prices.
Online and mobile banking developments have the potential of disrupting our business model, thus adversely affecting our business.
We compete with a variety of institutions both inside and outside of our market area that also offer online and mobile banking services. These institutions include our traditional competition, as well as institutions that solely operate online. Changes in customer behavior over the past several years have resulted in the need to offer online and mobile banking options to our customers. While we continue to spend significant resources upgrading our online and mobile banking capabilities, changes in customer behaviors in this area could disrupt our branch based and relationship banking model, which could adversely affect our operations, and we may be unable to timely develop competitive new products and services in response to these changes.
We face significant operational risk.
We are exposed to many types of operational risk, including traditional operational risk, strategic risk, reputational risk, and legal and compliance risk. Operational risk includes the risk of fraud or theft by employees or persons outside COB, unauthorized transactions by employees or operational errors, including clerical or recordkeeping errors or those resulting from faulty or disabled computer or telecommunications systems, and breaches of the internal control system and compliance requirements. Negative public opinion can result from our actual or alleged conduct in a variety of areas, including lending practices, corporate governance and acquisitions and from actions taken by government regulators and community organizations in response to those activities. Negative public opinion can adversely affect our ability to attract and retain customers and can expose us to litigation and regulatory action. Operational risk also includes potential legal actions that could arise from an operational deficiency or as a result of noncompliance with applicable regulatory standards.
Because the nature of the banking business involves a high volume of transactions, certain errors may be repeated or compounded before they are found and corrected. Our reliance upon both automated and manual systems to record and process transactions may further increase the risk that technical flaws or employee tampering or manipulation of those systems will result in losses that are difficult to detect. We may also be subject to disruptions of our operating systems arising from events that are wholly or partially beyond our control (e.g., computer viruses or electrical or telecommunications outages), which may give rise to disruption of service to customers and to financial loss or liability. We are further exposed to the risk that our external vendors may be unable to fulfill their contractual obligations (or will be subject to the same risk of fraud or operational errors by their employees as is COB) and to the risk that our or our vendors' business continuity and data security systems prove to be inadequate.
We face heightened information security risks, including “hacking” and “identity theft,” from increasingly sophisticated cyber behaviors.
The computer systems and network infrastructure used by us and others are vulnerable to unforeseen problems. These problems may arise in our internal systems, the systems of our third party vendors or both. Our operations are dependent upon our ability to protect computer equipment against damage from fire, power loss, telecommunications failure or security breaches of our information systems, resulting in stolen, misplaced or lost data, including unauthorized disclosure of customer information and theft. Information
13
security risks have increased in recent years in part because of the increased usage of online and mobile technologies and the increased sophistication and activities of organized crime, hackers, terrorists, governmental entities, activists and other parties to attempt to gain unauthorized access to our systems, and/or those of our customers and third party service providers through viruses, malware, and other compromises, in order to gain access to customer information and engage in financial fraud and theft. We cannot be certain that all of our systems or those of our third party service providers, are free from vulnerability to attack, despite safeguards we have instituted to protect our systems and ensure those third party systems used by us are safe. In addition, we cannot be certain that the systems of our customers that interact with our systems are free from vulnerability to attack despite heightened customer education about the threats that exist and alternatives available to protect those systems. Any damage or failure or security intrusion that may cause an interruption in our operations, makes us susceptible to unauthorized access to our customer information, hacking or identity or financial theft, and could adversely affect our business and financial results, damage our reputation, cause loss of business, additional regulatory scrutiny or exposure to litigation and possible financial liability. We have purchased insurance against such losses, but any liability could exceed the amount of insurance coverage we have.
We rely on other companies to provide key components of our business infrastructure.
Third party vendors provide key components of our business infrastructure including the software supporting our core operating system, mortgage servicing, card issuance and transaction processing, internet connections and network access. While we have selected these third party vendors carefully and subject them to a comprehensive vendor management program, which includes ongoing due diligence over these vendors' financial condition and systems security, we do not directly control their actions. Any problems caused by these third parties, including those which result from their failure to provide services for any reason, their poor performance of services, their systems’ vulnerability to cyber and other risks, or other issues could adversely affect our ability to deliver products and services to our customers and otherwise to conduct our business. Replacing any of these third party vendors could also entail significant delay and expense.
Our controls and procedures could fail or be circumvented.
Management regularly reviews and updates our internal controls, disclosure controls and procedures and corporate governance policies and procedures. Any system of controls, however well designed and implemented, is based in part on certain assumptions and can only provide reasonable, but not absolute, assurance of the effectiveness of these systems and controls. Any failure or circumvention of our internal controls and procedures and any failure to comply with regulations related to internal controls and procedures could adversely affect our business, our results of operations and financial condition, as well as our reputation.
Our efforts to reduce noninterest expenses may not be achievable or, if they are, may increase operational risk.
In order to sustain and enhance our profitability, we have, among other things, implemented a program to reduce noninterest expenses, primarily through vendor management activities, branch profitability analyses and other efficiency initiatives. These efforts to reduce noninterest expenses may not be achievable. Because of the pending Capital Merger, we are unable to negotiate favorable vendor terms and we are incurring significant new expenses in connection with the Merger. Alternatively, these noninterest expense reductions may increase our operational risk.
Uncertainty in the final resolution of purchased impaired loans may create a negative impact on our profitability.
As required by applicable accounting standards, we have accounted for purchased impaired loans acquired from Granite under ASC 310-30 which requires us to periodically re-estimate the expected cash flow of these loans. Lower expected cash flow, whether due to changes in projected cash flow estimates, increases in loss estimates, or defaults, may result in impairment of the carrying value of these loans. Any such impairment must be taken in the period in which the change in cash flow estimate occurs, and such impairment will reduce our earnings and adversely affect results of operations.
Our reported financial results depend on management’s selection of accounting methods and certain assumptions and estimates.
Our accounting policies and methods are fundamental to the procedures by which we record and report our financial condition and results of operations. Our management must exercise judgment in selecting and applying many of these accounting policies and methods so they comply with GAAP and reflect management’s judgment of the most appropriate manner to report COB’s financial condition and results. In some cases, management must select the accounting policy or method to apply from two or more alternatives, any of which may be reasonable under the circumstances, yet may result in us reporting materially different results than would have been reported under a different alternative.
Certain accounting policies are critical to presenting COB’s financial condition and results. They require management to make difficult, subjective or complex judgments about matters that are uncertain. Materially different amounts could be reported under different conditions or using different assumptions or estimates. These critical accounting policies include: the ALL; the valuation of other real estate; the determination of fair value for financial instruments; purchased loan accounting; and the accounting for income taxes. Because of the uncertainty of estimates involved in these matters, we may be required to do one or more of the following: significantly increase the ALL or sustain credit losses that are significantly higher than the reserve provided or both; recognize
14
significant impairment on its financial instruments (including purchased loans) and other intangible asset balances; or significantly increase its liabilities for taxes or pension and post-retirement benefits.
Risks Related to the Merger with Capital Bank
The Company will be subject to business uncertainties and contractual restrictions while the Merger is pending.
Uncertainty about the effect of the Merger on employees and customers may have an adverse effect on the Company. These uncertainties may impair COB’s ability to attract, retain and motivate key personnel until the Merger is completed, and could cause customers and others that deal with the Company to seek to change existing business relationships with the Company. Retention of certain employees by the Company may be challenging while the Merger is pending, as certain employees may experience uncertainty about their future roles with the combined company. If key employees depart because of issues relating to the uncertainty and difficulty of integration or a desire not to remain with the combined entity, COB’s business could be harmed.
Combining the two companies may be more difficult, costly or time consuming than expected and the anticipated benefits and cost savings of the Merger may not be realized.
The Company has operated and, until the completion of the Merger, will continue to operate, independently from Capital in the ordinary course of business. The success of the Merger, including anticipated benefits and cost savings, will depend, in part, on Capital’s ability to successfully combine and integrate the businesses of the Company with Capital in a manner that permits growth opportunities and does not materially disrupt the existing customer relations nor result in decreased revenues due to loss of customers. As noted, it is anticipated that the five most senior officers of the Company will cease their employment with the combined company at the Merger date. It is possible that the integration process could result in the loss of other key employees, the disruption of either company’s ongoing businesses or inconsistencies in standards, controls, procedures and policies that adversely affect the combined company’s ability to maintain relationships with clients, customers, depositors and employees or to achieve the anticipated benefits and cost savings of the Merger. The loss of key employees could adversely affect the combined company’s ability to successfully conduct its business, which could have an adverse effect on the combined company’s financial results and the value of its stock. If Capital experiences difficulties with the integration process, the anticipated benefits of the Merger may not be realized fully, or at all, or may take longer to realize than expected. As with any merger of financial institutions, there also may be business disruptions that cause the Company or Capital Bank to lose customers or cause customers to remove their accounts from the Company and/or Capital and move their business to competing financial institutions. Integration efforts between the two companies will also divert management attention and resources. These integration matters could have an adverse effect on the Company during this transition period and on the combined company for an undetermined period after completion of the Merger. In addition, the actual cost savings of the Merger could be less than anticipated.
Regulatory approvals for the Merger may not be received, may take longer than expected or may impose conditions that are not presently anticipated or that could have an adverse effect on the combined company following the Merger.
Before the Merger may be completed, Capital must obtain approvals from the Federal Reserve Board, the FDIC and the North Carolina Commissioner of Banks. Other approvals, waivers or consents from regulators may also be required. In determining whether to grant these approvals, the regulators consider a variety of factors, including the regulatory standing of each party and the factors described under ‘‘Supervision and Regulation - CommunityOne Bancorp.’’ An adverse development in either party’s regulatory standing or these factors could result in an inability to obtain approval or delay their receipt. These regulators may impose conditions on the completion of the Merger or the bank merger or require changes to the terms of the Merger or the bank merger. Such conditions or changes could have the effect of delaying or preventing completion of the Merger or the bank merger or imposing additional costs on or limiting the revenues of the combined company following the Merger, any of which might have an adverse effect on the combined company following the Merger.
If the Merger is not completed, the Company and Capital will have incurred substantial expenses without realizing the expected benefits of the Merger.
The Company and Capital Bank each has incurred and will incur substantial expenses in connection with the negotiation and completion of the transactions contemplated by the Merger Agreement. If the Merger is not completed, the Company would have to recognize the expenses it has incurred without realizing the expected benefits of the Merger, which could materially impact the Company’s earnings and results of operations.
Because of the pending Merger, COB common stock trades at a market price relative to Capital Class A commons stock market price and will be impacted by market fluctuations in Capital Class A common stock.
Under the Merger Agreement, at the effective time of the Merger, each issued and outstanding share of COB common stock, except for treasury stock, will be converted into the right to receive either (i) $14.25 in cash or (ii) 0.43 shares of Capital Class A common stock,
15
based on the holder’s election and subject to proration. Currently, the price of COB common stock trades at a market price relative to the Capital Class A common stock. The market value of Capital Class A common stock may fluctuate while the Merger is pending due to a variety of factors, including general market and economic conditions, changes in Capital’s businesses, operations and prospects and regulatory considerations. Many of these factors are outside of the control of the Company and Capital Bank. Furthermore, upon completion of the Merger, holders of COB common stock who receive stock consideration in the Merger will become holders of Capital Class A common stock. Capital’s businesses differ from those of COB, and accordingly, the results of operations of Capital will be affected by some factors that are different from those currently affecting the results of operations of COB, which may impact the stock price.
The Merger Agreement limits COB’s ability to pursue acquisition proposals and requires COB to pay a termination fee of $14 million under limited circumstances, including circumstances relating to acquisition proposals.
The Merger Agreement prohibits the Company from initiating, soliciting, knowingly encouraging or knowingly facilitating certain third party acquisition proposals. The Merger Agreement also provides that the Company must pay a termination fee in the amount of $14 million in the event the Merger Agreement is terminated under certain circumstances, including involving the Company’s failure to abide by certain obligations not to solicit acquisition proposals and the COB board of directors withdrawing or materially and adversely changing its recommendation that COB shareholders approve the Merger proposal. These provisions might discourage a potential competing acquirer that might have an interest in acquiring all or a significant part of the Company from considering or proposing such an acquisition.
Termination of the Merger Agreement could negatively impact the Company.
If the Merger Agreement is terminated, there may be various consequences. For example, the Company’s businesses may have been impacted adversely by the failure to pursue other beneficial opportunities due to the focus of management on the Merger, without realizing any of the anticipated benefits of completing the Merger. Additionally, if the Merger Agreement is terminated, the market price of the Company’s common stock could decline to the extent that the current market price reflects a market assumption that the Merger will be completed. If the Merger Agreement is terminated under certain circumstances, COB may be required to pay Capital a termination fee of $14 million.
Risks Related to the Regulatory Environment
Our deposit insurance premiums have decreased but may increase in the future, which could have a material adverse impact on our future earnings.
The FDIC insures the deposits of the Bank to the maximum extent provided by law. The FDIC charges the Bank premiums to maintain that insurance at specified levels. The assessments imposed by the FDIC for deposit insurance at the Bank have decreased, but they may increase in the future. The Dodd-Frank Act increased the minimum target deposit insurance ratio from 1.15% of estimated insured deposits to 1.35% of estimated insured deposits, which must be met by September 30, 2020. The FDIC has issued regulations to implement these provisions and has established a higher reserve ratio of 2% as a long-term goal beyond what is required by statute. The FDIC may increase the assessment rates or impose a special assessment in the future to keep the deposit insurance fund at the statutory target level. Any increase in FDIC insurance assessment would reduce our earnings.
The implementation of capital requirements based on Basel III may require us to hold additional capital.
Under revised capital requirements implemented by the federal banking agencies (known as Basel III capital requirements) effective for community banks and their holding companies as of January 1, 2015, the leverage and risk-based capital requirements (including the prompt corrective action framework) changed, including the definition of the regulatory capital components required to be held by community banks and their holding companies (including introducing a new capital component called common equity tier 1 or CET 1 capital), the type and minimum amount of capital that must be held under each capital component, the risk weightings of certain assets against which capital must be held, and the methodology for certain off-balance sheet items, as described under “Regulation and Supervision - Capital.” The revised rules also impose a capital conservation buffer of up to 2.5% above each of the capital ratio requirements (CET 1, tier 1, and total risk-based capital) which must be met for a bank and its holding company to be able to pay dividends, engage in share buybacks or make discretionary bonus payments to executive management without restriction. The rules phase in over time beginning in 2015 and will become fully effective in 2019. The impact of these new requirements may have the effect of reducing our returns on equity, or requiring us to modify our business strategy or raise additional capital.
In addition, in the current regulatory environment, the federal banking agencies have the power to impose additional capital requirements that are more stringent than those required under these revised rules. The application of more stringent capital requirements also could result in us experiencing lower returns on equity, require us to raise additional capital or be subject to regulatory action if we are unable to comply with these requirements.
16
We face a risk of noncompliance with the Bank Secrecy Act and other anti-money laundering statutes and regulations.
The BSA, the USA Patriot Act and other laws and regulations require financial institutions such as the Bank to, among other duties, institute and maintain an effective BSA/AML program, including implementing comprehensive "know your customer" programs, monitoring suspicious financial activity and filing suspicious activity and current transaction reports. These rules are enforced by the federal banking agencies as well as by the Financial Crimes Enforcement Network of the Treasury, the U.S. Department of Justice and the Internal Revenue Service. While the Company has enhanced its BSA/AML program over the past four years to comply with law, failure to continue to maintain an effective BSA and AML program and to comply with these laws, rules and regulations would subject the Company and the Bank to liability, including regulatory fines and additional supervisory and legal actions. Such failure also could impact the timing and ability of Capital to proceed with its acquisition of the Company. Such actions and restrictions would have a material adverse effect on our reputation and would negatively impact our business, financial condition and results of operations.
The continued implementation of the requirements of the Dodd-Frank Act may result in lower revenues and higher costs.
The Dodd-Frank Act has included, among other things, the establishment of strengthened capital and prudential standards for banks and bank holding companies; the imposition of limits on interchange fees on debit card transactions; enhanced regulation of financial markets, including derivatives and securitization markets; the elimination of certain trading activities from banks; a permanent increase of the FDIC deposit insurance to $250,000; the elimination of the prohibition on paying interest on demand deposits; the creation of a Financial Stability Oversight Council to identify emerging systemic risks and improve interagency cooperation; and the creation of the CFPB, which has promulgated new consumer protection regulations relating to consumer financial products and services, particularly in the area of mortgage lending. Certain aspects of the new law, including, without limitation, the additional cost of higher deposit insurance, higher capital requirements, and the costs of compliance with enhanced disclosure, early intervention and loss mitigation, training and reporting requirements and integrated RESPA/TILA disclosures to mortgage borrowers that have been issued by the CFPB in a relatively short time frame, have had and will continue to have a significant impact on our business, and may affect our financial condition and results of operations. As additional CFPB rulemakings become effective in the coming year, particularly those that will affect our mortgage and small business loans and businesses, we expect our compliance costs to continue to be elevated, and that they may continue to affect our financial condition and results of operation.
Government regulation significantly affects our business and changes in laws and regulations and the regulatory environment could have a material adverse effect on COB and the Bank.
We are extensively regulated under federal and state banking laws and regulations that are intended primarily for the protection of depositors, federal deposit insurance funds and the banking system as a whole and not shareholders. These regulations affect our lending and deposit practices, capital structure, investment and dividend policies, and growth. In addition, we are subject to changes in federal and state laws and regulations, and governmental economic and monetary policies. We cannot predict whether any of these changes may adversely and materially affect us. The current regulatory environment for financial institutions, particularly since the enactment of the Dodd-Frank Act, entails significant potential increases in compliance requirements and associated costs, including those related to consumer credit, with a focus on mortgage lending.
Federal and state banking regulators also possess broad powers to take supervisory actions as they deem appropriate. These actions may result in higher capital requirements, higher insurance premiums and limitations on our activities that could have a material adverse effect on our business and profitability.
Risks Related to our Stock
Our ability to pay dividends is limited, leaving appreciation in the value of our common stock as the sole opportunity for returns on investment.
The holders of COB common stock are entitled to receive dividends when and if declared by the Board of Directors out of funds legally available for the payment of dividends. The ability of COB to pay dividends to its shareholders has been dependent upon the amount of dividends the Bank may pay to COB. Statutory and regulatory limitations are imposed on the payment of dividends by the Bank to COB, as well as by COB to its shareholders. Under applicable law, the Bank must obtain the prior OCC approval to pay dividends if the total of all dividends declared by the Bank in any calendar year will exceed the sum of its net income for that year and its retained net income for the preceding two calendar years, less certain transfers. Federal law also prohibits the Bank from paying dividends that in the aggregate would be greater than its undivided profits after deducting statutory bad debts in excess of its ALL. The Bank, however, may obtain shareholder and OCC approval to reduce its capital to allow payment of dividends after cumulative losses in an amount greater than its undivided profits. The Bank has not paid dividends to the Company during 2015 and does not intend to pay dividends in 2016.
17
There is a limited market for our common stock.
Although our common stock is traded on the Nasdaq Capital Market, the volume of trading has historically been limited. Our average daily trading volume of our shares during 2015 was approximately 21,500 shares. Lightly traded stock can be more volatile than stock trading in a more active public market. While we have made efforts to increase trading in our stock, we cannot predict the extent to which an active public market for our common stock will develop or be sustained. Therefore, a holder of our common stock who wishes to sell his or her shares may not be able to do so immediately or at an acceptable price.
Subsequent resales of shares of our common stock in the public market may cause the market price of our common stock to fall.
We issued a large number of shares of our common stock to our investors in the 2011 recapitalization and in a private placement consummated on December 30, 2014. During 2015, we filed an effective registration statement for the shares issued in our 2014 private placement, as well as the shares issued to Carlyle and Oak Hill Capital and other investors in the recapitalization without any of those investors having to comply with the volume and manner of sale restrictions under Rule 144 promulgated under the Securities Act. While it is not anticipated that any of these investors will sell shares due to the pending Merger, the market value of our common stock could decline as a result of sales by the investors from time to time of a substantial amount of the shares of our common stock held by them.
Carlyle and Oak Hill Capital are substantial holders of our common stock.
Each of Carlyle and Oak Hill Capital hold approximately 24% of the outstanding shares of our common stock, and each has a representative on the Board of Directors of COB and the Bank. In addition, each of Carlyle and Oak Hill Capital has preemptive rights to maintain their percentage ownership of our common stock in the event of certain issuances of securities by COB. Although each of Carlyle and Oak Hill Capital entered into certain passivity and non-affiliation commitments with the Federal Reserve Board in connection with obtaining approval of its proposed investment in COB, in pursuing their economic interests, Carlyle and Oak Hill Capital may have interests that are different from the interests of our other shareholders. Additionally, the concentration of ownership by Carlyle and Oak Hill Capital means that they will also exert considerable, ongoing influence over matters subject to shareholder approval, including the election of directors and significant corporate transactions, such as a merger, sale of assets or other business combination or sale of our business. This concentration of ownership may have the effect of delaying, deferring, or preventing a change in control, impeding a merger, consolidation, takeover or other business combination involving us, or discouraging a potential acquirer from making a tender offer or otherwise attempting to obtain control of our business, even if such a transaction would benefit other shareholders.
Risks Related to Economic Conditions and other Outside Forces
We may be subject to litigation from time to time, which could involve the expenditure of substantial resources and time to defend.
From time to time, customers and others may take legal action against us. Customer defaults have also resulted in an increase in litigation. Whether or not any claims made are valid, if such claims are not resolved in a manner favorable to us, they may result in significant expense, attention from management and possibly financial liability, as well as cause damage to our reputation, all of which could have a negative effect on our business.
Market, economic and political developments may adversely affect our industry, business and results of operations.
Our results of operations are materially impacted by conditions in the economy and in the capital markets, both of which continue to be uncertain and impacted by both world and national events, such as sluggish economic growth, elevated unemployment rates and historically low interest rates. During the past six years, the financial markets have been under significant strain, resulting in financial instability, a depressed housing and manufacturing market, significant declines in asset values, employee dislocation, geopolitical issues and political uncertainly and diminished expectations for economic growth. These strains adversely affected our operations and financial results, and led to the need for our recapitalization. We have worked hard to overcome the material challenges facing our operations during the past five years, aggressively working out our criticized and classified assets, re-engaging with our communities, and returning the Bank to a satisfactory condition. While the financial market has been recovering, and conditions have improved, particularly in our urban markets, a return to a recessionary economy could result in financial stress on our borrowers that would adversely affect our financial condition and results of operations. Factors such as consumer spending, business investment, government spending and volatility and strength of the capital markets and inflation all affect the business and economic environment in which we operate and ultimately, the profitability of our business. In an economic downturn characterized by higher unemployment, and lower household income, corporate earnings, business investment and consumer spending, the demand for our products and services could be adversely affected. More generally, any financial or economic development that may raise new concern about the stability of the financial markets generally and the strength of counterparties may result in renewed lack of confidence in the financial sector, increased volatility in the financial markets and/or reduced business activity. Economic and market developments also could result in legislative and regulatory actions that could impact our business. Any of these results or actions could materially adversely affect our business, financial condition and results of operations.
18
Unpredictable catastrophic events could have a material adverse effect on us.
The occurrence of catastrophic events such as hurricanes, tropical storms, earthquakes, pandemic disease, windstorms, floods, severe winter weather (including snow, freezing rain, ice storms and blizzards), fires and other catastrophes could adversely affect our consolidated financial condition or results of operations. Unpredictable natural and other disasters could have an adverse effect on us in that such events could materially disrupt our operations or the ability or willingness of our customers to access the financial services we offer. The incidence and severity of catastrophes are inherently unpredictable. Although we carry insurance to mitigate our exposure to certain catastrophic events, these events could nevertheless reduce our earnings and cause volatility in our financial results for any fiscal quarter or year and have a material adverse effect on our financial condition or results of operations or both.
19
| Item 1B. | UNRESOLVED STAFF COMMENTS |
There were no unresolved comments received from the SEC regarding COB’s periodic or current reports within the 180 days prior to December 31, 2015.
| Item 2. | PROPERTIES |
The principal executive and administrative offices of COB are located in an office building at 1017 E. Morehead Street, Suite 200, Charlotte, NC 28204. We also maintain administrative and loan production offices in Asheboro (2), Boone, Charlotte (2), Hickory, Greensboro, Raleigh, and Winston-Salem, North Carolina and one loan production office in Charleston, South Carolina. The Bank’s primary operations center is located in Asheboro, North Carolina.
The Bank operates 45 branches in Archdale, Asheboro (two branches), Belmont, Boone, Charlotte (two branches), China Grove, Cornelius, Ellerbe, Gastonia, Graham, Granite Falls, Greensboro (two branches), Hickory (four branches), Hillsborough, Hudson, Jamestown, Kannapolis, Laurinburg, Lenoir (two branches), Matthews, Millers Creek, Mooresville, Morganton, Mt. Holly, Newton (two branches), Ramseur, Randleman, Rockingham (two branches), Salisbury (two branches), Seagrove, Siler City, Southern Pines, Stanley, Statesville and Wilkesboro, North Carolina.
In total, 38 of our branches are owned and 7 are leased facilities, with 2 of the owned branches situated on land that is leased. Of our administrative, operational and loan production office facilities, four of the facilities are owned and seven are leased.
| Item 3. | LEGAL PROCEEDINGS |
From time to time, we are subject to various claims, lawsuits, disputes with third parties, investigations and pending actions involving various allegations against us incident to the operation of our business. On February 29, 2016, a case captioned Curtis R. Pendleton v. Robert L. Reid, et al., Case 5:16-cv-00037 (W.D.N.C.), was filed on behalf of a putative class of CommunityOne shareholders against CommunityOne, its directors, and Capital Bank Financial Corp. in the United States District Court for the Western District of North Carolina in connection with the Capital Merger. The complaint alleges, among other things, that the defendants violated Sections 14(a) and 20(a) of the Securities Exchange Act of 1934 by issuing a Registration/Joint Proxy Statement that, plaintiff alleges, is materially incomplete and misleading. The complaint seeks, among other things, an order enjoining the merger, as well as other equitable relief and/or money damages, interest, costs, fees (including attorneys' fees) and expenses. The Company believes that the claims are without merit. Other than the above, in management's opinion, there are no proceedings pending to which we are a party or to which our property is subject, which, if determined adversely to us, would be material in relation to our shareholder's equity or financial condition. In addition, no material proceedings are pending or are known to be threatened or contemplated against us by governmental authorities or other parties.
| Item 4. | MINE SAFETY DISCLOSURES |
Not applicable.
20
PART II
| Item 5. | MARKET FOR REGISTRANT’S COMMON EQUITY, RELATED SHAREHOLDER MATTERS AND ISSUER PURCHASES OF EQUITY SECURITIES |
Market Prices and Dividend Policies
COB’s common stock is traded on the Nasdaq Capital Market (“Nasdaq”) under the symbol “COB.”
The range of sale prices for the years 2015 and 2014 is set forth in the table below and is based upon information obtained from Nasdaq. As of the close of business on February 29, 2016, there were approximately 4,300 registered shareholders according to the records maintained by our transfer agent.
We have not paid dividends during the calendar periods covered by the table below. We intend to reinvest cash flow generated by operations into our business. As a bank holding company, any dividends paid to us by our Bank subsidiary are subject to various statutory limitations, as described in Item 1, "Regulation and Supervision - Dividend Restrictions" of this Report.
| Calendar Period | High | Low | Dividends Declared | |||||||||
| Quarter ended March 31, 2014 | $ | 13.00 | $ | 10.50 | $ | — | ||||||
| Quarter ended June 30, 2014 | 11.69 | 8.42 | — | |||||||||
| Quarter ended September 30, 2014 | 10.39 | 8.62 | — | |||||||||
| Quarter ended December 31, 2014 | 11.82 | 8.75 | — | |||||||||
| Quarter ended March 31, 2015 | 11.56 | 9.36 | — | |||||||||
| Quarter ended June 30, 2015 | 11.25 | 9.57 | — | |||||||||
| Quarter ended September 30, 2015 | 11.05 | 9.92 | — | |||||||||
| Quarter ended December 31, 2015 | 14.31 | 10.37 | — | |||||||||
FIVE-YEAR STOCK PERFORMANCE TABLE
Performance Graph
The following graph and table compares the cumulative total shareholder return of COB common stock for the five-year period ended December 31, 2015 with the SNL Southeast Bank Index and the Russell 3000 Stock Index, assuming an investment of $100 at the beginning of the period and the reinvestment of dividends.
21
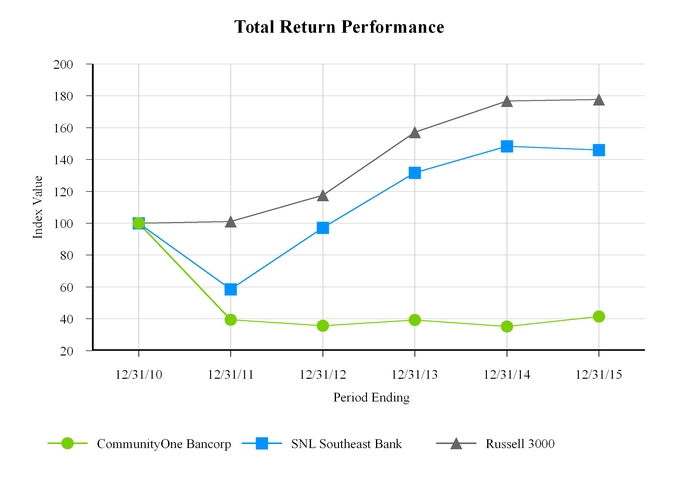
CommunityOne Bancorp
| Period Ending | ||||||||||||||||||||||||
| Index | 12/31/2010 | 12/31/2011 | 12/31/2012 | 12/31/2013 | 12/31/2014 | 12/31/2015 | ||||||||||||||||||
| CommunityOne Bancorp | $ | 100.00 | $ | 39.38 | $ | 35.69 | $ | 39.23 | $ | 35.23 | $ | 41.45 | ||||||||||||
| SNL Southeast Bank | 100.00 | 58.51 | 97.19 | 131.70 | 148.33 | 146.02 | ||||||||||||||||||
| Russell 3000 | 100.00 | 101.03 | 117.61 | 157.07 | 176.79 | 177.64 | ||||||||||||||||||
22
| Item 6. | SELECTED FINANCIAL DATA |
The tables below set forth selected consolidated financial data as of the dates or for the periods indicated. This data should be read in conjunction with Management’s Discussion and Analysis of Financial Condition and Results of Operations in Item 7 and the Consolidated Financial Statements and Notes in Item 8 of this Report.
| (dollars in thousands, except per share data) | As of and for the Year Ended December 31, | |||||||||||||||||||
| 2015 | 2014 | 2013 | 2012 | 2011 | ||||||||||||||||
| Income Statement Data | ||||||||||||||||||||
| Net interest income | $ | 68,375 | $ | 63,766 | $ | 64,433 | $ | 61,280 | $ | 39,555 | ||||||||||
| Provision for (recovery of) loan losses | (2,981 | ) | (5,371 | ) | 523 | 14,049 | 67,362 | |||||||||||||
| Noninterest income | 18,170 | 17,364 | 20,414 | 21,958 | 21,970 | |||||||||||||||
| Noninterest expense | 75,488 | 78,535 | 84,481 | 110,206 | 125,040 | |||||||||||||||
| Income (Loss) from continuing operations, before income taxes | 14,038 | 7,966 | (157 | ) | (41,017 | ) | (130,877 | ) | ||||||||||||
| Income tax expense (benefit) - continuing operations | 7,124 | (142,492 | ) | 1,326 | (1,039 | ) | 641 | |||||||||||||
| Income (Loss) from continuing operations, net of taxes | 6,914 | 150,458 | (1,483 | ) | (39,978 | ) | (131,518 | ) | ||||||||||||
| Loss from discontinued operations, net of taxes | — | — | — | (27 | ) | (5,796 | ) | |||||||||||||
| Net income (loss) | 6,914 | 150,458 | (1,483 | ) | (40,005 | ) | (137,314 | ) | ||||||||||||
| Preferred stock gain on retirement, net of accretion, and dividends | — | — | — | — | 44,592 | |||||||||||||||
| Net income (loss) to common shareholders | 6,914 | 150,458 | (1,483 | ) | (40,005 | ) | (92,722 | ) | ||||||||||||
| Period End Balances | ||||||||||||||||||||
| Assets | $ | 2,397,265 | $ | 2,215,514 | $ | 1,985,032 | $ | 2,151,565 | $ | 2,409,108 | ||||||||||
Loans held for sale (1) | 5,403 | 2,796 | 1,836 | 6,974 | 4,529 | |||||||||||||||
Loans held for investment (2) | 1,543,795 | 1,357,788 | 1,212,248 | 1,177,035 | 1,217,535 | |||||||||||||||
Allowance for loan losses (1) | 15,195 | 20,345 | 26,785 | 29,314 | 39,360 | |||||||||||||||
Goodwill and other intangible assets (1) | 9,413 | 9,886 | 11,119 | 11,700 | 12,082 | |||||||||||||||
| Deposits | 1,947,537 | 1,794,420 | 1,748,705 | 1,906,988 | 2,129,111 | |||||||||||||||
| Borrowings | 163,017 | 139,350 | 142,165 | 123,705 | 123,910 | |||||||||||||||
| Shareholders’ equity | 273,038 | 266,916 | 80,361 | 98,445 | 129,015 | |||||||||||||||
| Average Balances | ||||||||||||||||||||
| Assets | $ | 2,290,090 | $ | 2,005,948 | $ | 2,047,146 | $ | 2,291,541 | $ | 1,911,943 | ||||||||||
Loans held for sale (1) | 4,036 | 1,603 | 3,693 | 5,312 | 12,849 | |||||||||||||||
Loans held for investment (2) | 1,450,764 | 1,268,599 | 1,158,984 | 1,240,550 | 1,132,125 | |||||||||||||||
Allowance for loan losses (1) | 18,418 | 24,770 | 27,596 | 36,738 | 66,285 | |||||||||||||||
Goodwill and other intangible assets (1) | 9,532 | 10,476 | 11,412 | 12,351 | 9,250 | |||||||||||||||
| Deposits | 1,840,096 | 1,758,471 | 1,809,574 | 2,027,425 | 1,725,512 | |||||||||||||||
| Borrowings | 164,895 | 143,205 | 131,710 | 124,914 | 190,864 | |||||||||||||||
| Shareholders’ equity (deficit) | 271,821 | 91,151 | 85,576 | 114,684 | (22,809 | ) | ||||||||||||||
| Per Common Share Data | ||||||||||||||||||||
| Net income (loss) per share from continuing operations - basic | $ | 0.29 | $ | 6.89 | $ | (0.07 | ) | $ | (1.87 | ) | $ | (20.71 | ) | |||||||
| Net income (loss) per share from continuing operations - diluted | 0.29 | 6.88 | (0.07 | ) | (1.87 | ) | (20.71 | ) | ||||||||||||
| Net loss per common share from discontinued operations - basic and diluted | — | — | — | — | (1.38 | ) | ||||||||||||||
| Net income (loss) per share - basic | 0.29 | 6.89 | (0.07 | ) | (1.87 | ) | (22.09 | ) | ||||||||||||
23
| Net income (loss) per share - diluted | $ | 0.29 | $ | 6.88 | $ | (0.07 | ) | $ | (1.87 | ) | $ | (22.09 | ) | |||||||
Core net income - diluted (3) | 0.44 | 0.34 | 0.04 | (1.26 | ) | (21.84 | ) | |||||||||||||
| Book value (shareholders' equity) | 11.24 | 11.04 | 3.68 | 4.54 | 6.11 | |||||||||||||||
Tangible book value (shareholders' equity) (3) | 10.85 | 10.63 | 3.17 | 4.00 | 5.54 | |||||||||||||||
| Performance Ratios | ||||||||||||||||||||
| Return on average assets | 0.30 | % | 7.50 | % | (0.07 | )% | (1.75 | )% | (4.85 | )% | ||||||||||
Return on average tangible assets (3) | 0.30 | 7.54 | (0.07 | ) | (1.76 | ) | (4.87 | ) | ||||||||||||
| Core return on average assets | 0.47 | 0.37 | 0.04 | (1.18 | ) | (4.64 | ) | |||||||||||||
| Pre-tax return on average assets | 0.61 | 0.40 | (0.01 | ) | (1.79 | ) | (4.85 | ) | ||||||||||||
| Return on average equity | 2.54 | 165.06 | (1.73 | ) | (34.88 | ) | N/M | |||||||||||||
Return on average tangible equity (3) | 2.64 | 186.50 | (2.00 | ) | (39.09 | ) | N/M | |||||||||||||
| Net interest margin (tax equivalent) | 3.40 | 3.43 | 3.44 | 2.95 | 2.29 | |||||||||||||||
Pre-credit and non-recurring (“PCNR”) noninterest expense as a percentage of average assets (3) | 3.03 | 3.54 | 3.50 | 3.24 | 3.37 | |||||||||||||||
| Asset Quality Ratios | ||||||||||||||||||||
Allowance for loan losses to period end loans held for investment (1) (2) | 0.98 | % | 1.50 | % | 2.21 | % | 2.49 | % | 3.23 | % | ||||||||||
Net charge-offs to average loans held for investment (2) | 0.15 | 0.08 | 0.26 | 1.94 | 10.75 | |||||||||||||||
| Classified assets to Tier 1 capital and allowance for loan losses | 32.0 | 40.6 | 84.7 | 145.2 | 140.8 | |||||||||||||||
Nonperforming assets to period end total assets (4) | 1.48 | 2.06 | 3.20 | 6.63 | 8.98 | |||||||||||||||
| Capital and Liquidity Ratios | ||||||||||||||||||||
| Average equity to average assets | 11.87 | % | 4.54 | % | 4.18 | % | 5.00 | % | (1.19 | )% | ||||||||||
| CET 1 Total risk-based capital | 13.21 | 14.58 | 12.62 | 12.34 | 13.81 | |||||||||||||||
| Tier 1 risk-based capital | 11.22 | 13.33 | 9.48 | 9.26 | 11.71 | |||||||||||||||
| Leverage capital | 8.19 | 9.78 | 5.96 | 5.45 | 6.70 | |||||||||||||||
Period end loans held for investment to period end deposits (2) | 79.27 | 75.67 | 69.32 | 61.72 | 57.19 | |||||||||||||||
(1) | Excludes discontinued operations. |
(2) | Loans held for investment, net of unearned income, before allowance for loan losses. |
(3) | Refer to the “Non-GAAP Measures” section in Item 7. Management’s Discussion and Analysis of Financial Condition and Results of Operations. |
(4) | Nonperforming loans and nonperforming assets include loans past due 90 days or more that are still accruing interest. |
24
| Item 7. | MANAGEMENT’S DISCUSSION AND ANALYSIS OF FINANCIAL CONDITION AND RESULTS OF OPERATIONS |
Management’s discussion and analysis of the financial condition and results of operations of COB represents an overview of the consolidated financial conditions and results of operations of COB for each of the last three years. Certain reclassifications have been made to prior periods to place them on a basis comparable with the current period presentation. This discussion and analysis should be read in conjunction with the Consolidated Financial Statements and Notes presented in Item 8 of this Report. Results of operations for the periods included in this review are not necessarily indicative of results to be obtained during any future period.
Important Note Regarding Forward-Looking Statements
This Report contains information, including information incorporated by reference in this Report, that we believe are “forward-looking statements,” within the meaning of the safe harbor protections of the Private Securities Litigation Reform Act of 1995. These statements generally relate to COB’s financial condition, capital resources, results of operations, future plans, goals, objectives, future performance or business. They usually can be identified by the use of forward-looking terminology, such as “believes,” “expects,” or “are expected to,” “plans,” “projects,” “goals,” “estimates,” “targets,” “may,” “should,” “could,” “would,” “intends to,” “outlook” or “anticipates,” or variations of these and similar words, or by discussions of strategies that involve risks and uncertainties. You should not place undue reliance on these statements, as they are subject to risks and uncertainties, including but not limited to, those described in this Report, or the documents incorporated by referenced in it, including Item 1A “Risk Factors.” When considering these forward-looking statements, you should keep in mind these risks and uncertainties, as well as any cautionary statements we may make. Moreover, you should treat these statements as speaking only as of the date they are made and based only on information actually known to us at the time. We undertake no obligation to update publicly any forward-looking statements, whether as a result of new information, future events or otherwise.
Forward-looking statements contained in this Report are based on current expectations, estimates and projections about COB’s business, management’s beliefs and assumptions made by management based on the information available to management at the time these disclosures were prepared, including but not limited to, assumptions about general market conditions, interest rate, market and other risks. These statements are not guarantees of COB’s future performance or results and involve certain risks, uncertainties and assumptions called “Future Factors,” which are difficult to predict. Therefore, actual outcomes and results may differ materially from what is expressed or implied in the forward-looking statements. Future Factors include, without limitation:
| • | Our ability to continue to grow our business internally while controlling our costs; |
| • | Having the financial and management resources in the amount, at the times and on the terms required to support our future business; |
| • | A material delay or inability to obtain regulatory and/or shareholder approval of the Merger and meet the other conditions to the Merger; |
| • | The successful completion of the Merger and subsequent integration of the two businesses without material customer disruption or decrease in revenues; |
| • | The accuracy of our assumptions and judgments about the collectability of our loan portfolio, including the creditworthiness of our borrowers and the value of real estate and other assets, which could affect repayment of such borrowers' outstanding loans; |
| • | Material changes in the quality of our loan portfolio and the resulting credit related losses and expenses; |
| • | The accuracy of our assumptions relating to the establishment of our ALL; |
| • | Adverse changes in the value of real estate in our market areas; |
| • | Adverse changes in the housing markets, or an increase in interest rates, either of which may reduce demand for mortgages; |
| • | Changes in interest rates, spreads on earning assets and interest-bearing liabilities, the shape of the yield curve and interest rate sensitivity; |
| • | A prolonged period of low interest rates; |
| • | Declines in the value of our OREO; |
| • | The accuracy of our assumptions relating to our ability to use net operating loss carryforwards to reduce future tax payments; |
| • | The loss of one or more members of executive management and our ability to retain key lenders and other employees particularly pending the Merger with Capital Bank; |
| • | Less favorable general economic conditions, either nationally or regionally; resulting in, among other things, a reduced demand for our credit or other services and thus reduced origination volume; |
| • | Increased competitive pressures in the banking industry or in COB's markets affecting pricing or product and service offerings; |
| • | Our ability to respond to rapid technological developments and changes; |
| • | Disruptions in or manipulations of our operating systems; |
| • | Information security risks impacting us or our vendors, including “hacking” and “identity theft,” that could adversely affect our business and our reputation; |
| • | The loss or disruption of the services provided by one or more of our critical vendors; |
25
| • | Our ability to achieve our targeted reductions in costs and expenses, particularly in light of the pending Capital Bank Merger; |
| • | The impact of laws and regulatory requirements, including the Basel III capital rules, Bank Secrecy Act requirements, and regulations required by the Dodd-Frank Act; |
| • | Changes in trade, monetary and fiscal policies and laws, including interest rate policies of the Federal Reserve Board; |
| • | Changes in accounting principles and standards; and |
| • | Our success at managing the risks involved in the foregoing. |
We encourage readers of this Report to understand forward-looking statements to be strategic objectives rather than absolute targets of future performance. Forward-looking statements speak only as of the date they are made and we do not intend to update any forward-looking statements to reflect circumstances or events that occur after the date the forward-looking statements are made or to reflect the occurrence of unanticipated events.
Executive Overview
Background
We are a bank holding company headquartered in Charlotte, North Carolina and incorporated in 1984 under the laws of the State of North Carolina. Through our ownership of CommunityOne Bank, N.A., (the “Bank”), a national banking association founded in 1907 and headquartered in Asheboro, North Carolina, we offer a complete line of consumer, mortgage and business banking services, including loan, deposit and treasury management, as well as wealth management and trust services, to individual and small and middle market businesses through financial centers located throughout central, southern and western North Carolina.
Our strategy is to grow the Company organically by focusing on meeting the financial needs of customers in our market area by providing a suite of quality financial products and services through local and experienced bankers and lenders located in branches and loan production offices in our customers’ local market. We also offer the convenience of online and mobile banking capabilities. We define our market as communities located in North Carolina, as well as adjoining markets in South Carolina and Virginia.
We earn revenue primarily from interest on loans and securities investments, gains on the sale of mortgage loans, and fees charged for financial services provided to our customers. Offsetting these revenues are the cost of deposits and other funding sources, credit costs through provision for loan losses and write-downs in the value of our OREO, and other operating costs such as salaries and employee benefits, occupancy, data processing expenses and income tax expense.
On November 22, 2015, we entered into an Agreement and Plan of Merger (“Merger Agreement”) with Capital Bank Financial Corp., a Delaware corporation (“Capital”), under which, upon the terms and subject to the conditions set forth in the Merger Agreement, COB will merge with and into Capital (the “Merger”), with Capital Bank as the surviving corporation in the Merger. Immediately following the Merger, the Bank will merge with and into Capital’s wholly owned bank subsidiary, with Capital’s bank subsidiary surviving the bank merger. The Merger is subject to, among other things, regulatory and shareholder approval and other customary closing conditions and is currently expected to close in the second quarter of 2016.
2015 Goals and Results
Our five key goals for 2015 were to (1) grow loans; (2) grow core deposits; (3) enhance fee income; (4) maintain expense discipline; and (5) explore merger and acquisition (“M&A”) opportunities that make sense strategically and financially. As a result of excellent execution across our Company, we were able to substantially achieve each of these goals.
Loan growth in 2015 continued to be very strong, and we grew the loan portfolio by $186.0 million, or 14%, exceeding our full year growth goal of 10-12%. The key strategies that drove this success in 2015 were the continued success in the core metro markets of Charlotte, Greensboro and Raleigh, the addition of experienced mortgage bankers in Charlotte and Raleigh, and the opening of a new loan production office in Charleston, South Carolina. Excluding our declining purchased residential mortgage loan pool portfolio, organic loan growth was even stronger at 19% in 2015. All of our lines of business grew loans, and all categories of loans grew as well. Commercial and agricultural loans, consisting primarily of Commercial and Industrial (“C&I”) loans, grew $38.9 million during 2015, or 34%, and commercial loans overall grew $130.4 million, or 21%. This strong loan growth resulted in a December 31, 2015 loans to deposits ratio of 79%, just below our 2015 goal of 80-85%, primarily as a result of strong deposit growth during 2015.
We successfully grew deposits in 2015, especially in the fourth quarter, and total deposits increased 9% or $153.1 million from the prior year. Core deposits, which exclude larger time deposits, grew $112.3 million, or 8%, during the year. Over the course of the year, we executed several successful deposit campaigns for both time deposits and money market accounts. The combination of new commercial relationship acquisition and the success of our treasury management products were key drivers of the growth of noninterest-bearing deposits, which increased $62.6 million, or 19%, in 2015.
We continued to maintain expense discipline, even as we made investments in personnel and infrastructure. During 2015, we reduced our total noninterest expense by $3.0 million or 4%. Our pre-credit and nonrecurring noninterest expense, which excludes credit and
26
non-core nonrecurring expenses, as a percentage of average assets was 3.03% in 2015, exceeding our goal of 3.10%. Excluding non-core items, noninterest expense fell $2.0 million, or 3%, as a result of expense reduction initiatives, including the closure of six branches in the first quarter. At the same time, we continued to make investments for the future, and opened a loan production office in Charleston, South Carolina and expanded our existing lending capabilities in Charlotte and Raleigh. We added origination personnel to our non-branch based retail residential mortgage channel in 2015, focused on the Charlotte and Raleigh metro markets, and originated $77.1 million in production through this channel, an increase of 732% over 2014. In 2015, we also grew our Small Business Administration (“SBA”) lending capabilities in Charlotte and originated $7.1 million in SBA loans.
Growing our fee income also was a significant focus in 2015 and excluding non-core securities gains and a bargain purchase gain from our purchase of deposits from CertusBank, N.A., we grew noninterest income by 9% in 2015, just below our 10-12% growth objective. Mortgage and SBA loan sale income growth was especially strong at 81% in 2015, as a result of investments we have made in bankers in these businesses over the past several years.
Finally, we were active in 2015 in exploring M&A opportunities. In June, we completed the purchase of the deposits of the Lenoir and Granite Falls branches of CertusBank, N.A. As previously discussed, on November 22, 2015 we entered into a Merger Agreement with Capital which is currently expected to close in the second quarter of 2016.
Results of Operations
Our net income for 2015 was $6.9 million, compared to 2014 net income of $150.5 million that included a non-recurring $142.5 million reversal of the valuation allowance on deferred tax assets as a credit to income tax expense. Core net income, a non-GAAP measure that excludes non-core nonrecurring income and expenses, was $10.7 million in 2015, a 43% increase from $7.5 million in 2014. Diluted net income per share was $0.29 in 2015 as compared to $6.88 in 2014. Core diluted net income per share was $0.44 in 2015 as compared to $0.34 in 2014, an increase of 29%.
Net income before income taxes was $14.0 million in 2015, a $6.1 million improvement from the prior year, primarily as a result of a $4.6 million increase in net interest income and a $3.0 million reduction in noninterest expenses, partially offset by a $2.4 million decrease in recovery of provision for loan losses.
In 2015, net interest income grew 7% to $68.4 million, from $63.8 million in 2014. Our net interest margin fell 3 basis points to 3.40% in 2015 from 3.43% in 2014, as the continued low interest rate environment reduced the yield on new loans. This decrease was partially offset by improvements in the earning asset mix as we deployed funds from low-interest rate bank balances and securities into more attractively yielding loans, whose average balances grew 15% during 2015. Our average investment securities balances decreased by 1% in 2015, while our yield on those securities fell to 2.44% in 2015 from 2.64% in 2014. Noninterest income, excluding securities gains and other non-core nonrecurring items, increased $1.5 million, or 9%, in 2015, from $16.4 million in 2014 to $17.9 million in 2015. An increase in mortgage and SBA loan sales income driven by higher origination volumes, and an increase in total service charge income from increased origination activity, drove the majority of the increase year over year.
Return on average assets was 0.30% in 2015, compared to 7.50% in 2014. Core return on average assets, a non-GAAP measure that excludes non-core nonrecurring income and expenses, was 0.47% in 2015, compared to 0.37% in 2014. Return on average shareholders' equity was 2.54% in 2015, compared to 165.06% in 2014. Return ratios were elevated in 2014 by the reversal of $142.5 million of deferred tax valuation allowance in the fourth quarter of 2014.
Net Interest Income
Our largest source of revenue is net interest income. Net interest income represents the difference between interest and fees on interest-earning assets, principally loans and investments, and interest expense on interest-bearing liabilities, principally customer deposits. Net interest income is affected by changes in interest rates and spreads and changes in the average balances and mix of interest-earning assets and interest-bearing liabilities.
Table 1 sets forth for the periods indicated information with respect to COB’s average balances of assets and liabilities, as well as the total dollar amounts of interest income (taxable equivalent basis) from earning assets and interest expense on interest-bearing liabilities, resultant rates earned or paid, net interest income, net interest spread and net yield on earning assets. Net interest spread refers to the difference between the average yield on earning assets and the average rate paid on interest-bearing liabilities. Net yield on earning assets, or net interest margin, refers to net interest income divided by average earning assets and is influenced by the level and relative mix of earning assets and interest-bearing liabilities.
27
Table 1
Average Balance Sheet and Net Interest/Dividend Income Analysis
Fully Taxable Equivalent Basis
| Year Ended December 31, | |||||||||||||||||||||||||||||||||
| 2015 | 2014 | 2013 | |||||||||||||||||||||||||||||||
| (dollars in thousands) | Average Balance (3) | Income / Expense | Average Yield / Rate | Average Balance (3) | Income / Expense | Average Yield / Rate | Average Balance (3) | Income / Expense | Average Yield / Rate | ||||||||||||||||||||||||
| Interest earning assets: | |||||||||||||||||||||||||||||||||
Loans (1)(2) | $ | 1,454,800 | $ | 64,930 | 4.46 | % | $ | 1,270,202 | $ | 59,268 | 4.67 | % | $ | 1,162,677 | $ | 60,339 | 5.19 | % | |||||||||||||||
| Investment securities | 526,523 | 12,865 | 2.44 | 533,272 | 14,068 | 2.64 | 581,271 | 14,180 | 2.44 | ||||||||||||||||||||||||
| Other earning assets | 28,806 | 827 | 2.87 | 58,978 | 605 | 1.03 | 136,944 | 665 | 0.49 | ||||||||||||||||||||||||
| Total earning assets | 2,010,129 | 78,622 | 3.91 | 1,862,452 | 73,941 | 3.97 | 1,880,892 | 75,184 | 4.00 | ||||||||||||||||||||||||
| Non-earning assets: | |||||||||||||||||||||||||||||||||
| Cash and due from banks | 25,544 | 26,918 | 29,760 | ||||||||||||||||||||||||||||||
| Core deposit premiums and other intangibles | 9,532 | 10,476 | 11,412 | ||||||||||||||||||||||||||||||
| Other assets, net | 244,885 | 106,102 | 125,082 | ||||||||||||||||||||||||||||||
| Total assets | $ | 2,290,090 | $ | 2,005,948 | $ | 2,047,146 | |||||||||||||||||||||||||||
| Interest-bearing liabilities: | |||||||||||||||||||||||||||||||||
| Interest-bearing demand deposits | $ | 356,618 | $ | 945 | 0.26 | % | $ | 340,525 | $ | 1,011 | 0.30 | % | $ | 346,771 | $ | 1,058 | 0.31 | % | |||||||||||||||
| Savings deposits | 90,941 | 93 | 0.10 | 84,921 | 87 | 0.10 | 79,651 | 81 | 0.10 | ||||||||||||||||||||||||
| Money market deposits | 436,807 | 1,261 | 0.29 | 436,126 | 1,106 | 0.25 | 448,382 | 1,026 | 0.23 | ||||||||||||||||||||||||
| Time deposits | 603,694 | 4,766 | 0.79 | 581,498 | 4,704 | 0.81 | 650,392 | 5,906 | 0.91 | ||||||||||||||||||||||||
| Total interest-bearing deposits | 1,488,060 | 7,065 | 0.47 | 1,443,070 | 6,908 | 0.48 | 1,525,196 | 8,071 | 0.53 | ||||||||||||||||||||||||
| Retail repurchase agreements | 10,033 | 22 | 0.22 | 7,713 | 16 | 0.21 | 9,852 | 21 | 0.21 | ||||||||||||||||||||||||
| Federal Home Loan Bank advances | 92,758 | 1,963 | 2.12 | 73,493 | 2,020 | 2.75 | 62,499 | 1,376 | 2.20 | ||||||||||||||||||||||||
| Long-term debt | 5,374 | 77 | 1.43 | 5,297 | 76 | 1.43 | 2,657 | 31 | 1.18 | ||||||||||||||||||||||||
| Other borrowed funds | 56,730 | 1,058 | 1.86 | 56,702 | 1,070 | 1.89 | 56,702 | 1,060 | 1.87 | ||||||||||||||||||||||||
| Total interest-bearing liabilities | 1,652,955 | 10,185 | 0.62 | 1,586,275 | 10,090 | 0.64 | 1,656,906 | 10,559 | 0.64 | ||||||||||||||||||||||||
| Noninterest-bearing liabilities and shareholders’ equity: | |||||||||||||||||||||||||||||||||
| Noninterest-bearing demand deposits | 352,036 | 315,401 | 284,378 | ||||||||||||||||||||||||||||||
| Other liabilities | 13,278 | 13,121 | 20,286 | ||||||||||||||||||||||||||||||
| Shareholders’ equity | 271,821 | 91,151 | 85,576 | ||||||||||||||||||||||||||||||
| Liabilities of discontinued operations | — | — | — | ||||||||||||||||||||||||||||||
| Total liabilities and equity | $ | 2,290,090 | $ | 2,005,948 | $ | 2,047,146 | |||||||||||||||||||||||||||
Net interest income and net yield on earning assets (4) | $ | 68,437 | 3.40 | % | $ | 63,851 | 3.43 | % | $ | 64,625 | 3.44 | % | |||||||||||||||||||||
Interest rate spread (5) | 3.29 | % | 3.33 | % | 3.36 | % | |||||||||||||||||||||||||||
(1) | The fully tax equivalent basis is computed using a federal tax rate of 35%. |
(2) | Average loan balances include nonaccruing loans and loans held for sale. |
(3) | Average balances include market adjustments to fair value for securities available-for-sale and loans held for sale. |
(4) | Net yield on earning assets is computed by dividing net interest income by average earning assets. |
(5) | Earning asset yield minus interest-bearing liabilities rate. |
Net interest income (on a non-tax equivalent basis) was $68.4 million in 2015, compared to $63.8 million in 2014. This increase of $4.6 million, or 7%, resulted primarily from an 8% increase in average earning assets from 2014 to 2015, partially offset by a decrease in the net interest margin to 3.40% in 2015 from 3.43% in 2014. The positive effects of the growth in loans, whose average balances rose by $184.6 million, or 15%, during 2015, were partially offset by the impact of the continued low interest rate environment on average loan yields, which declined by 0.21% during the year.
28
In 2014, the decrease in net interest income of $0.6 million, or 1% from 2013, resulted primarily from a decrease in the net interest margin to 3.43% in 2014 from 3.44% in 2013, as well as a 1% decrease in average earning assets during the same period. The positive effects of the deployment of funds from securities and low-yielding cash equivalents into higher yielding loans, whose average balances rose by $107.5 million, or 9%, during 2014, were mostly offset by the impact of the low interest rate environment on average loan yields, which declined by 0.52% during the year.
On a taxable equivalent basis, the changes in net interest income were a $4.6 million increase in 2015 and a decrease of $0.8 million for 2014. The increase in 2015 and the decline in 2014 were the result of the factors noted previously.
In 2015, the net interest spread decreased by 4 basis points from 3.33% in 2014, to 3.29% in 2015, reflecting a decrease in the total yield on earning assets, partially offset by a smaller decrease in the rate paid on interest-bearing liabilities. The total yield on earning assets decreased by 6 basis points, from 3.97% in 2014 to 3.91% in 2015, while the average rate paid on interest-bearing liabilities, or cost of funds, declined 2 basis points from 0.64% in 2014 to 0.62% in 2015.
Changes in the net interest margin and net interest spread tend to correlate with movements in interest rates. There are variations, however, in the degree and timing of rate changes for the different types of earning assets and interest-bearing liabilities.
Table 2 analyzes net interest income on a taxable equivalent basis, as measured by rate and volume variances. The table reflects the extent to which changes in the interest income and interest expense are attributable to changes in average volume (changes in average volume multiplied by prior year rate) and changes in rate (changes in rate multiplied by prior year average volume).
Table 2
Rate and Volume Variance Analysis
| (dollars in thousands) | 2015 vs 2014 | 2014 vs 2013 | ||||||||||||||||||||||
Volume Variance | Rate Variance | Total Variance | Volume Variance | Rate Variance | Total Variance | |||||||||||||||||||
| Interest income: | ||||||||||||||||||||||||
| Loans | $ | 8,199 | $ | (2,537 | ) | $ | 5,662 | $ | 12,843 | $ | (13,914 | ) | $ | (1,071 | ) | |||||||||
| Investment securities | (172 | ) | (1,031 | ) | (1,203 | ) | (15,193 | ) | 15,081 | (112 | ) | |||||||||||||
| Other earning assets | (89 | ) | 310 | 221 | 64 | (124 | ) | (60 | ) | |||||||||||||||
| Total interest income | 7,938 | (3,258 | ) | 4,680 | (2,286 | ) | 1,043 | (1,243 | ) | |||||||||||||||
| Interest expense: | ||||||||||||||||||||||||
| Interest-bearing demand deposits | 36 | (102 | ) | (66 | ) | (17 | ) | (30 | ) | (47 | ) | |||||||||||||
| Savings deposits | 6 | — | 6 | 6 | — | 6 | ||||||||||||||||||
| Money market deposits | 1 | 154 | 155 | (37 | ) | 117 | 80 | |||||||||||||||||
| Time deposits | 176 | (114 | ) | 62 | (590 | ) | (612 | ) | (1,202 | ) | ||||||||||||||
| Retail repurchase agreements | 5 | 1 | 6 | (5 | ) | — | (5 | ) | ||||||||||||||||
| Federal Home Loan Bank advances | (466 | ) | 409 | (57 | ) | 267 | 377 | 644 | ||||||||||||||||
| Long-term debt | 1 | — | 1 | 37 | 8 | 45 | ||||||||||||||||||
| Other borrowed funds | 1 | (13 | ) | (12 | ) | — | 10 | 10 | ||||||||||||||||
| Total interest expense | (240 | ) | 335 | 95 | (339 | ) | (130 | ) | (469 | ) | ||||||||||||||
| Increase (decrease) in net interest income | $ | 8,178 | $ | (3,593 | ) | $ | 4,585 | $ | (1,947 | ) | $ | 1,173 | $ | (774 | ) | |||||||||
Provision for Loan Losses
The provision for (recovery of) loan losses is the charge against (addition to) earnings added to (subtracted from) the ALL each year to provide a level of allowance considered appropriate to absorb probable losses inherent in the loan portfolio. The amount of each year’s charge (addition) is affected by several considerations, including management’s evaluation of various risk factors in determining the adequacy of the allowance (see “Asset Quality” below), loan composition, actual loan loss experience and loan portfolio growth.
As a result of continued low loss experience and reductions in the amount of nonperforming loans, the Company recorded a recovery of loan losses of $3.0 million in 2015 and $5.4 million in 2014, compared to a provision for loan losses of $0.5 million in 2013. These changes in the level of the provision for loan losses are discussed and analyzed in detail as part of the discussions in the “Asset Quality” section.
29
Noninterest Income
Noninterest income was $18.2 million in 2015, a $0.8 million increase from 2014. The increase was primarily caused by an increase in mortgage loan income from $0.9 million in 2014 to $1.6 million in 2015, driven by a 72% increase in mortgage loan originations from 2014 and the origination of $7.1 million of SBA loans in 2015. Other service charges, commissions and fees grew by $0.4 million from 2014 to 2015 on increased mortgage loan fees on higher origination volumes. Other income in 2015 included a non-core bargain purchase gain on the CertusBank branch acquisition of $0.3 million. These increases were partially offset by securities gains, which were $0 in 2015 compared to $1.0 million in 2014. Core noninterest income, a non-GAAP measure that excludes nonrecurring items like securities gains and losses and bargain purchase gain, increased $1.5 million, or 9%, in 2015.
Noninterest income was $17.4 million in 2014, a decline of $3.0 million from 2013. The decrease was primarily caused by a decline in securities gains of $1.8 million, from $2.8 million in 2013 to $1.0 million in 2014. Core noninterest income fell $1.3 million in 2014. Loan sales income from the sale of mortgage loans to investors fell by $1.4 million in 2014 compared to 2013 as demand for mortgage refinancing decreased. Service charges on deposit accounts decreased $0.4 million in 2014, primarily as a result the reduced customer overdraft activity in 2014.
Table 3
Noninterest Income
| (dollars in thousands) | Year ended December 31, | |||||||||||
| 2015 | 2014 | 2013 | ||||||||||
| Service charges on deposit accounts | $ | 6,331 | $ | 6,351 | $ | 6,714 | ||||||
| Mortgage loan income | 1,599 | 881 | 2,319 | |||||||||
| Cardholder and merchant services income | 4,981 | 4,803 | 4,531 | |||||||||
| Trust and investment services | 1,517 | 1,495 | 1,305 | |||||||||
| Bank-owned life insurance | 1,167 | 1,153 | 1,073 | |||||||||
| Other service charges, commissions and fees | 1,753 | 1,340 | 1,315 | |||||||||
| Securities gains, net | — | 974 | 2,772 | |||||||||
| Other income | 822 | 367 | 385 | |||||||||
| Total noninterest income | 18,170 | 17,364 | 20,414 | |||||||||
| Less nonrecurring items: | ||||||||||||
| Bargain purchase gain | 316 | — | — | |||||||||
| Securities gains, net | — | 974 | 2,772 | |||||||||
| Core noninterest income (Non-GAAP) | $ | 17,854 | $ | 16,390 | $ | 17,642 | ||||||
Noninterest Expense
Noninterest expense was $75.5 million in 2015, a decline of $3.0 million, or 4%, from 2014. The decrease was attributable to 2014 executive severance expense of $2.1 million related to the severance costs for the Company's former Chief Executive Officer, $1.8 million of expenses and asset write-downs in 2014 related to the Company's decision to close six bank branches, and $0.4 million expense related to the sale by the U.S. Treasury of shares of the Company's stock. The Company also had a $0.9 million reduction in 2015 in loan collection expenses as a result of our continued reduction in nonperforming loans. These decreases were partially offset in 2015 by $2.0 million in merger-related expenses and $1.1 million in RSA acceleration expenses.
Noninterest expense was $78.5 million in 2014, a decline of $5.9 million, or 7%, from 2013, primarily on a $5.1 million reduction in OREO and loan collection costs and a $3.5 million reduction in merger-related expenses incurred in 2013. These declines were partially offset by $2.1 million of expenses related to the severance costs for the Company's former Chief Executive Officer, $1.1 million net reduction in branch closure costs from 2013 to 2014 and $0.4 million related to the sale by the Treasury of its common stock investment in the Company. Noninterest expense in 2013 also included $3.5 million in expenses related to the Granite Merger.
Core noninterest expense, which excludes merger-related expense and other non-recurring expenses, fell by 3%, or $2.0 million, to $72.4 million in 2015, compared to $74.4 million in 2014. The decrease was primarily the result of declines in occupancy, furniture, equipment and data processing expenses related to six branch closures in the first quarter of 2015, and a $0.3 million decline in professional expenses. PCNR noninterest expense, which excludes non-core noninterest expense and credit-related costs such as OREO and loan collection expenses, declined by $1.7 million, or 2% from 2014 to 2015 and by $0.7 million, or 1%, from 2013 to 2014. PCNR noninterest expense as a percent of average assets was 3.03% in 2015, improved from 3.54% in 2014.
30
Table 4
Noninterest Expense
| (dollars in thousands) | Year ended December 31, | |||||||||||
| 2015 | 2014 | 2013 | ||||||||||
| Personnel expense | $ | 43,807 | $ | 43,682 | $ | 40,661 | ||||||
| Net occupancy expense | 5,680 | 6,112 | 6,391 | |||||||||
| Furniture, equipment and data processing expense | 7,994 | 8,336 | 8,638 | |||||||||
| Professional fees | 2,128 | 2,470 | 3,100 | |||||||||
| Stationery, printing and supplies | 618 | 646 | 644 | |||||||||
| Advertising and marketing | 546 | 716 | 1,135 | |||||||||
| Credit/debit card expense | 2,048 | 2,287 | 2,143 | |||||||||
| Core deposit intangible amortization | 1,422 | 1,408 | 1,407 | |||||||||
| FDIC insurance | 1,749 | 2,068 | 2,643 | |||||||||
| Other real estate owned expense | 2,311 | 1,758 | 4,138 | |||||||||
| Loan collection expense | 669 | 1,576 | 4,333 | |||||||||
| Merger-related expense | 1,986 | — | 3,498 | |||||||||
| Other expense | 4,530 | 7,476 | 5,750 | |||||||||
| Total noninterest expense | 75,488 | 78,535 | 84,481 | |||||||||
| Less nonrecurring items: | ||||||||||||
| Merger-related expense | 1,986 | — | 3,498 | |||||||||
| RSA acceleration | 1,142 | — | — | |||||||||
| Mortgage and litigation accruals | — | (68 | ) | (487 | ) | |||||||
| Executive severance | — | 2,060 | — | |||||||||
| US Treasury sale expenses | — | 409 | — | |||||||||
| Rebranding | — | — | 616 | |||||||||
| Branch closure and restructuring expenses | — | 1,756 | 675 | |||||||||
| Core noninterest expense (Non-GAAP) | 72,360 | 74,378 | 80,179 | |||||||||
| Less credit-related: | ||||||||||||
| Other real estate owned expense | 2,311 | 1,758 | 4,138 | |||||||||
| Loan collection expense | 669 | 1,576 | 4,333 | |||||||||
| PCNR noninterest expense (Non-GAAP) | $ | 69,380 | $ | 71,044 | $ | 71,708 | ||||||
Provision for Income Taxes
Income tax expense totaled $7.1 million for the year ended 2015 compared to an income tax benefit of $142.5 million for the same period in 2014. The change resulted primarily from the reversal, during 2014, of $142.5 million of valuation allowance on the Company’s deferred tax assets as a result of consistent profitability since the third quarter of 2013, improvements in the asset quality of the loan portfolio and future earnings forecasts. COB’s income tax expense as a percentage of income before income taxes was 51% for the year ended December 31, 2015, compared to an income tax benefit of 1789% for the year ended 2014.
At September 30, 2015, we determined that it was more likely than not that future taxable income would be available during applicable carryforward periods to absorb all of the remaining North Carolina net economic loss carryforwards, and accordingly, the remaining $0.7 million deferred tax asset valuation allowance was reversed as a reduction in income tax expense.
In addition, on July 28, 2015, the State of North Carolina announced that, based on the state achieving its 2015 tax year revenue target, the corporate income tax rate would be reduced to 4% during the 2016 tax year. The rate reduction trigger resulted in a $2.3 million reduction in our deferred income tax receivable. The Company recorded the impact of this legislation as a reduction in deferred income tax receivable as of September 30, 2015 and a charge to income tax expense in the third quarter of 2015.
COB had an income tax benefit totaling $142.5 million for the year ended 2014 compared to an income tax expense of $1.3 million for the same period in 2013. The change resulted primarily from the $142.5 million valuation allowance reversal on the Company’s deferred tax assets described above. COB’s income tax benefit as a percentage of income before income taxes was 1789% for the year ended December 31, 2014, compared to an income tax expense of 844% for the same period ended 2013.
31
Management regularly evaluates the likelihood that the Company will be able to realize its deferred tax assets and the need for a valuation allowance. In 2013 and prior years management determined that sufficient evidence was not available to conclude that it was more likely than not that all of its deferred tax assets could be realized, requiring a valuation allowance for certain of its deferred tax assets. At December 31, 2014 management determined, based on all available positive and negative evidence, that it was more likely than not that future taxable income would be available during the carryforward periods to absorb all of the consolidated federal net operating loss carryforward and all of the North Carolina net economic loss carryforward. As a result of this determination, $142.5 million of valuation allowance against the Company's deferred tax assets was reversed. A number of factors played a critical role in this determination, including:
| • | Improvements in the asset quality of the loan portfolio and diminishment of credit-related losses that were the source of the Company's losses; |
| • | Implementation of strong internal controls making it unlikely that the large volume of troubled loans leading to the Company’s losses between 2008 and 2012 will reoccur; |
| • | The increased remoteness and diminished relevance of such losses; |
| • | Continued improvement of the Company’s financial metrics and six consecutive quarters of earnings; |
| • | A credible forecast of future taxable income based on management’s demonstrated forecasting accuracy; |
| • | Various cost-reduction initiatives that will have a continuing positive effect on earnings in future periods; |
| • | Availability of tax planning strategies; and |
| • | Long-dated carryforward periods. |
Upon consideration of all available objectively verifiable positive and negative evidence, the Company concluded that no valuation allowance on the Company's deferred tax assets was required at December 31, 2015.
Liquidity
Liquidity for COB refers to our continuing ability to meet deposit withdrawals, fund loan and capital expenditure commitments, maintain reserve requirements, pay operating expenses and provide funds to COB for payment of dividends, debt service and other operational requirements. Liquidity is immediately available from four major sources: (a) cash on hand and on deposit at other banks, (b) the outstanding balance of federal funds sold, (c) the market value of unpledged investment securities and (d) availability under lines of credit. At December 31, 2015, the total amount of these four items was $379.7 million, or 16% of total assets, a decrease of $79.5 million from $459.2 million, or 21% of total assets, at December 31, 2014. We could also access $294.1 million of additional borrowings as of December 31, 2015 under credit lines by pledging additional collateral.
Consistent with the general approach to liquidity, loans and other assets of COB are funded primarily by local core deposits. A stable deposit base, supplemented by FHLB advances and a modest amount of brokered time deposits, has been sufficient to meet the Bank's loan demands. During 2015, liquidity was used to grow the loan portfolio by $186.0 million. We were able to grow our loans to deposits ratio from 76% at year end 2014 to 79% at year end 2015.
Contractual Obligations
Under existing contractual obligations, we will be required to make payments in future periods. Table 5 presents aggregated information about the payments due under such contractual obligations at December 31, 2015. Benefit plan payments cover estimated amounts due through 2025.
32
Table 5
Contractual Obligations
| (dollars in thousands) | Payments Due by Period at December 31, 2015 | |||||||||||||||||||
| Less than one year | One to less than three years | Three to less than five years | Five years or longer | Total | ||||||||||||||||
| Deposits | $ | 1,682,435 | $ | 191,769 | $ | 73,085 | $ | 248 | $ | 1,947,537 | ||||||||||
| Retail repurchase agreements | 7,219 | — | — | — | 7,219 | |||||||||||||||
| Federal Home Loan Bank advances | 33,500 | 10,181 | 50,000 | — | 93,681 | |||||||||||||||
| Long-term notes payable | — | 5,415 | — | — | 5,415 | |||||||||||||||
| Trust preferred securities | — | — | — | 56,702 | 56,702 | |||||||||||||||
| Lease obligations | 2,134 | 4,162 | 3,684 | 9,492 | 19,472 | |||||||||||||||
| Estimated benefit plan payments: | ||||||||||||||||||||
| Pension | 910 | 1,820 | 1,850 | 4,970 | 9,550 | |||||||||||||||
| Other | 40 | 60 | 60 | 150 | 310 | |||||||||||||||
| Total contractual cash obligations | $ | 1,726,238 | $ | 213,407 | $ | 128,679 | $ | 71,562 | $ | 2,139,886 | ||||||||||
Commitments, Contingencies and Off-Balance Sheet Risk
In the normal course of business, various commitments are outstanding that are not reflected in the consolidated financial statements. Significant commitments at December 31, 2015 are discussed below.
Commitments by the Bank to extend credit and undisbursed advances on customer lines of credit are agreements to lend to a customer as long as there is no violation of any condition established in the contract. At December 31, 2015, total commitments to extend credit and undisbursed advances on customer lines of credit amounted to $380.9 million. Commitments generally have fixed expiration dates or other termination clauses and may require payment of a fee. Since many commitments expire without being fully drawn, the total commitment amounts do not necessarily represent future cash requirements. COB evaluates each customer’s creditworthiness on a case-by-case basis. The amount of collateral obtained, if deemed necessary, upon extension of credit is based on the credit evaluation of the borrower.
The Bank issues standby letters of credit whereby each guarantees the performance of a customer to a third party if a specified triggering event or condition occurs. The guarantees generally expire within one year and may be automatically renewed depending on the terms of the guarantee. All standby letters of credit provide for recourse against the customer on whose behalf the letter of credit was issued, and this recourse may be further secured by a pledge of assets. The maximum potential amount of undiscounted future payments related to standby letters of credit was $0.7 million at December 31, 2015 and $2.7 million at December 31, 2014.
The Bank's exposure to credit loss in the event of nonperformance by the other party to the financial instrument for commitments to extend credit is represented by the contractual notional amount of those instruments. The Bank uses the same credit policies in making commitments and conditional obligations as it does for on-balance sheet instruments. The fair value of these commitments was not considered material.
COB does not have any special purpose off-balance sheet financing.
From time to time, we are subject to various claims, lawsuits, disputes with third parties, investigations and pending actions involving various allegations against us incident to the operation of our business. On February 29, 2016, a case captioned Curtis R. Pendleton v. Robert L. Reid, et al., Case 5:16-cv-00037 (W.D.N.C.), was filed on behalf of a putative class of CommunityOne shareholders against CommunityOne, its directors, and Capital Bank Financial Corp. in the United States District Court for the Western District of North Carolina in connection with the Capital Merger. The complaint alleges, among other things, that the defendants violated Sections 14(a) and 20(a) of the Securities Exchange Act of 1934 by issuing a Registration/Joint Proxy Statement that, plaintiff alleges, is materially incomplete and misleading. The complaint seeks, among other things, an order enjoining the merger, as well as other equitable relief and/or money damages, interest, costs, fees (including attorneys' fees) and expenses. The Company believes that the claims are without merit. In management's opinion, there are no proceedings pending to which we are a party or to which our property is subject, which, if determined adversely to us, would be material in relation to our shareholder's equity or financial condition. In addition, no material proceedings are pending or are known to be threatened or contemplated against us by governmental authorities or other parties.
33
Asset/Liability Management and Interest Rate Sensitivity
One of the primary objectives of asset/liability management is to maximize the net interest margin while minimizing the earnings risk associated with changes in interest rates. One method used to manage interest rate sensitivity is to measure, over various time periods, the interest rate sensitivity positions, or gaps; however, this method addresses only the magnitude of timing differences and does not address earnings or market value. Therefore, management uses an earnings simulation model to prepare, at least quarterly, earnings projections based on a range of interest rate scenarios in order to more accurately measure interest rate risk. For additional information, see Item 7A.
Table 6 presents information about the periods in which the interest-sensitive assets and liabilities at December 31, 2015 will mature, prepay, or be subject to repricing in accordance with market rates, and the resulting interest-sensitivity gaps. This table shows the sensitivity of the balance sheet at one point in time and is not necessarily indicative of what the sensitivity will be on other dates.
Table 6
Interest Rate Sensitivity Analysis
| December 31, 2015 | ||||||||||||||||||||
| (dollars in thousands) | Rate Maturity | |||||||||||||||||||
1-90 Days | 91-180 Days | 181-365 Days | Beyond One Year | Total | ||||||||||||||||
| Earning Assets | ||||||||||||||||||||
| Investment securities | $ | 33,588 | $ | 15,045 | $ | 22,183 | $ | 467,585 | $ | 538,401 | ||||||||||
| Loans held for investment | 549,289 | 51,814 | 91,740 | 850,952 | 1,543,795 | |||||||||||||||
| Loans held for sale | 5,403 | — | — | — | 5,403 | |||||||||||||||
| Interest-bearing bank balances | 15,323 | — | — | — | 15,323 | |||||||||||||||
| Other earning assets | 5,971 | 9,884 | — | — | 15,855 | |||||||||||||||
| Total interest-earning assets | 609,574 | 76,743 | 113,923 | 1,318,537 | 2,118,777 | |||||||||||||||
| Interest-Bearing Liabilities | ||||||||||||||||||||
| Interest-bearing deposits: | ||||||||||||||||||||
| Demand deposits | 366,493 | — | — | — | 366,493 | |||||||||||||||
| Savings deposits | 95,081 | — | — | — | 95,081 | |||||||||||||||
| Money market deposits | 478,304 | — | — | — | 478,304 | |||||||||||||||
| Time deposits of $250,000 or more | 3,824 | 12,150 | 29,396 | 14,723 | 60,093 | |||||||||||||||
| Other time deposits | 78,102 | 70,742 | 161,523 | 250,870 | 561,237 | |||||||||||||||
| Retail repurchase agreements | 7,219 | — | — | — | 7,219 | |||||||||||||||
| Federal Home Loan Bank advances | 38,516 | 15 | 5,032 | 50,118 | 93,681 | |||||||||||||||
| Long-term notes payable | — | — | — | 5,415 | 5,415 | |||||||||||||||
| Trust preferred securities | 56,702 | — | — | — | 56,702 | |||||||||||||||
| Total interest-bearing liabilities | 1,124,241 | 82,907 | 195,951 | 321,126 | 1,724,225 | |||||||||||||||
| Interest sensitivity gap | $ | (514,667 | ) | $ | (6,164 | ) | $ | (82,028 | ) | $ | 997,411 | $ | 394,552 | |||||||
| Cumulative gap | $ | (514,667 | ) | $ | (520,831 | ) | $ | (602,859 | ) | $ | 394,552 | $ | 394,552 | |||||||
| Ratio of interest-sensitive assets to interest-sensitive liabilities | 54 | % | 93 | % | 58 | % | 411 | % | 123 | % | ||||||||||
COB’s balance sheet was asset-sensitive at December 31, 2015. An asset sensitive position means that in a declining rate environment, COB’s assets will reprice down faster than liabilities, resulting in a reduction in net interest income. Conversely, when interest rates rise, COB’s earnings position should improve. Included in interest-bearing liabilities subject to rate changes within 90 days are COB’s interest-bearing demand, savings and money market deposits. These types of deposits historically have not repriced coincidentally with or in the same proportion as general market interest rate indicators.
Market Risk
Market risk is the possible chance of loss from unfavorable changes in market prices and rates. These changes may result in a reduction of current and future period net interest income, which is the favorable spread earned from the excess of interest income on interest-earning assets, over interest expense on interest-bearing liabilities.
34
Our market risk arises primarily from interest rate risk inherent in our lending and deposit-taking activities. The structure of COB’s loan and deposit portfolios is such that a significant decline in interest rates may adversely impact net interest income while improving net market values. Conversely, an increase in interest rates may improve net interest income while adversely impacting net market values. We do not maintain a trading account nor are we subject to currency exchange risk or commodity price risk. Interest rate risk is monitored as part of our asset/liability management function, which is discussed in “Asset/Liability Management and Interest Rate Sensitivity” above. The use of interest rate swaps in conjunction with asset/liability management objectives used during 2015 is discussed in Note 18 to the accompanying consolidated financial statements.
Table 7 presents information about the contractual maturities, average interest rates and estimated values at current rates of financial instruments considered market risk sensitive at December 31, 2015.
Table 7
Market Risk Analysis of Financial Instruments
| (dollars in thousands) | Contractual Maturities at December 31, 2015 | ||||||||||||||||||||||||||||||||||
| 2016 | 2017 | 2018 | 2019 | 2020 | Beyond Five Years | Total | Average Interest Rate (1) | Estimated Value at Current Rates | |||||||||||||||||||||||||||
| Financial Assets | |||||||||||||||||||||||||||||||||||
Debt and equity securities: (2) | |||||||||||||||||||||||||||||||||||
| Fixed rate | $ | 2,005 | $ | 37,670 | $ | — | $ | — | $ | 21,980 | $ | 445,904 | $ | 507,559 | 2.47 | % | $ | 496,077 | |||||||||||||||||
| Variable rate | — | — | — | — | — | 39,223 | 39,223 | 2.47 | % | 39,541 | |||||||||||||||||||||||||
Loans: (3) | |||||||||||||||||||||||||||||||||||
| Fixed rate | 59,889 | 56,241 | 74,892 | 85,546 | 100,763 | 563,216 | 940,547 | 4.80 | % | 917,389 | |||||||||||||||||||||||||
| Variable rate | 83,221 | 65,528 | 54,676 | 80,013 | 55,984 | 263,826 | 603,248 | 3.62 | % | 595,836 | |||||||||||||||||||||||||
| Held for sale | 5,403 | — | — | — | — | — | 5,403 | 4.31 | % | 5,403 | |||||||||||||||||||||||||
| Interest-bearing bank balances | 15,323 | — | — | — | — | — | 15,323 | 0.28 | % | 15,323 | |||||||||||||||||||||||||
| Other earning assets | 15,855 | — | — | — | — | — | 15,855 | 5.28 | % | 15,855 | |||||||||||||||||||||||||
| Total | $ | 181,696 | $ | 159,439 | $ | 129,568 | $ | 165,559 | $ | 178,727 | $ | 1,312,169 | $ | 2,127,158 | 3.84 | % | $ | 2,085,424 | |||||||||||||||||
| Financial Liabilities | |||||||||||||||||||||||||||||||||||
| Interest-bearing demand deposits | $ | 366,493 | $ | — | $ | — | $ | — | $ | — | $ | — | $ | 366,493 | 0.26 | % | $ | 366,493 | |||||||||||||||||
| Savings deposits | 95,081 | — | — | — | — | — | 95,081 | 0.10 | % | 95,081 | |||||||||||||||||||||||||
| Money market deposits | 478,304 | — | — | — | — | — | 478,304 | 0.29 | % | 478,304 | |||||||||||||||||||||||||
| Time deposits: | |||||||||||||||||||||||||||||||||||
| Fixed rate | 355,883 | 120,361 | 71,408 | 50,861 | 22,224 | 248 | 620,985 | 0.79 | % | 619,140 | |||||||||||||||||||||||||
| Variable rate | 345 | — | — | — | — | — | 345 | 0.12 | % | 344 | |||||||||||||||||||||||||
| Retail repurchase agreements | 7,219 | — | — | — | — | — | 7,219 | 0.22 | % | 7,219 | |||||||||||||||||||||||||
| Federal Home Loan Bank advances: | |||||||||||||||||||||||||||||||||||
| Fixed rate | 5,000 | 5,000 | 5,181 | — | 40,000 | — | 55,181 | 2.89 | % | 57,690 | |||||||||||||||||||||||||
| Variable rate | 28,500 | — | — | — | 10,000 | — | 38,500 | 0.85 | % | 38,846 | |||||||||||||||||||||||||
| Long-term notes payable | — | 5,415 | — | — | — | — | 5,415 | 1.43 | % | 5,415 | |||||||||||||||||||||||||
| Trust preferred securities | — | — | — | — | — | 56,702 | 56,702 | 1.87 | % | 32,536 | |||||||||||||||||||||||||
| Total | $ | 1,336,825 | $ | 130,776 | $ | 76,589 | $ | 50,861 | $ | 72,224 | $ | 56,950 | $ | 1,724,225 | 0.61 | % | $ | 1,701,068 | |||||||||||||||||
(1) | The average interest rate related to debt securities is stated on a fully taxable equivalent basis, assuming a 35% federal income tax rate. |
(2) | Contractual maturities of debt and equity securities are based on amortized cost. |
(3) | Nonaccrual loans are included in the balance of loans. The allowance for loan losses is excluded. |
For a further discussion on market risk and how COB addresses this risk, see Item 7A of this Report.
Capital Adequacy
Under revised capital rules established by the federal banking agencies, including the Federal Reserve Board and the OCC, effective for community banks as of January 1, 2015, capital adequacy is measured by certain risk-based capital ratios, supplemented by a leverage capital ratio. The revised capital rules assess an institution's risk-based capital through three ratios: a common equity Tier 1 capital (“CET 1”) ratio, an additional Tier 1 risk-based capital ratio, and a total capital ratio, which includes Tier 2 capital. CET 1 is comprised of the sum of common stock instruments and related surplus net of treasury stock, retained earnings, accumulated other comprehensive income (“AOCI”) and certain qualifying minority interests, less certain adjustments and deductions that include AOCI (based on an irrevocable option to neutralize the AOCI). Additional Tier 1 capital is comprised of noncumulative perpetual preferred
35
stock, tier 1minority interests, grandfathered trust preferred securities, less certain intangibles; and Tier 2 capital, which may include the ALL up to a maximum of 1.25% of risk weighted assets, qualifying subordinated debt, qualifying preferred stock and hybrid capital instruments. The requirements also define the weights assigned to assets and off-balance sheet items to determine the risk weighted asset components of the risk-based capital rules.
The revised rules require a minimum CET 1 risk-based capital ratio of 4.5%, a minimum overall Tier 1 risk-based capital ratio of 6%, and a total risk-based capital ratio of 8%. In addition, the revised rules require a capital conservation buffer of up to 2.5% above each of the capital ratio requirements (CET 1, tier 1, and total risk-based capital) which must be met for a bank to be able to pay dividends, engage in share buybacks or make discretionary bonus payments to executive management without restriction. This capital conservation buffer will be phased in over a four year period starting on January 1, 2016. The revised rules also change the risk weighting of certain assets, including “high volatility” commercial real estate, past due assets, structured securities and equity holdings. When fully implemented, a banking organization would need to maintain a CET 1 capital ratio of at least 7%, a total Tier 1 capital ratio of at least 8.5% and a total risk-based capital ratio of at least 10.5% or it would be subject to restrictions on capital distributions and discretionary bonus payments to its executive management.
The leverage capital ratio, which serves as a minimum capital standard, considers Tier 1 capital only and is expressed as a percentage of average total assets for the most recent quarter, after reduction of those assets for goodwill and other disallowed intangible assets at the measurement date. Risks such as concentration of credit risks and the risk arising from non-traditional activities, as well as the institution's exposure to a decline in the economic value of its capital due to changes in interest rates, and an institution's ability to manage those risks are important factors that are to be taken into account by the federal banking agencies in assessing an institution's overall capital adequacy.
At December 31, 2015, COB and the Bank had total risk-based capital ratios of 13.21% and 13.48%, respectively, and Tier 1 risk-based capital ratios of 11.22%, and 12.53%, respectively. COB and the Bank had CET 1 risk-based capital ratios of 11.22%, and 12.53%, respectively and leverage capital ratios of 8.19% and 9.30% at December 31, 2015, respectively.
Table 8
Regulatory Capital
| (dollars in thousands) | At December 31, | ||||||||||||||||||||
| 2015 | 2014 | 2013 | |||||||||||||||||||
| Total risk-based capital | |||||||||||||||||||||
| Consolidated | $ | 221,245 | 13.21 | % | $ | 203,150 | 14.58 | % | $ | 159,146 | 12.62 | % | |||||||||
| CommunityOne Bank, N.A. | 225,510 | 13.48 | 206,474 | 14.88 | 166,152 | 13.20 | |||||||||||||||
| Tier 1 risk-based capital | |||||||||||||||||||||
| Consolidated | 187,845 | 11.22 | 185,690 | 13.33 | 119,499 | 9.48 | |||||||||||||||
| CommunityOne Bank, N.A. | 209,541 | 12.53 | 189,081 | 13.63 | 150,274 | 11.94 | |||||||||||||||
| Common Equity Tier 1 risk-based capital | |||||||||||||||||||||
| Consolidated | 187,845 | 11.22 | N/A | N/A | N/A | N/A | |||||||||||||||
| CommunityOne Bank, N.A. | 209,541 | 12.53 | N/A | N/A | N/A | N/A | |||||||||||||||
| Leverage capital | |||||||||||||||||||||
| Consolidated | 187,845 | 8.19 | 185,690 | 9.78 | 119,499 | 5.96 | |||||||||||||||
| CommunityOne Bank, N.A. | 209,541 | 9.30 | 189,081 | 9.94 | 150,274 | 7.49 | |||||||||||||||
The prompt corrective action provisions of federal law require the federal bank agencies to take prompt corrective action to resolve problems of insured depository institutions such as the Bank. The extent of these powers depends upon whether the institution is designated as well capitalized, adequately capitalized, undercapitalized, significantly undercapitalized or critically undercapitalized, as defined by the law. See Supervision and Regulation - Safety and Soundness Considerations.
As part of the 2011 recapitalization of COB, we raised $310 million in cash capital in a private placement, at a price of $16.00 per share, with investments from (1) affiliates of each of Carlyle, and Oak Hill Capital pursuant to investment agreement with each Anchor Investor, and (2) certain other investors, including certain of our directors and officers, pursuant to subscription agreements with each investor. At the same time, COB acquired Bank of Granite Corporation and its subsidiary bank, Bank of Granite, through the merger of a wholly owned subsidiary of ours into Granite Corp. (the “Granite Merger”). As consideration for the Granite Merger, each outstanding share of Granite Corp. common stock, par value $1.00 per share, other than shares held by COB, Granite Corp. or any of their respective wholly owned subsidiaries and other than shares owned in a fiduciary capacity or as a result of debts previously contracted, was converted, on a pre-reverse stock split basis, into the right to receive 3.375 shares of COB's common stock. Pursuant
36
to the Merger Agreement, we agreed to issue 1 warrant for every 4 shares owned by Granite shareholders on October 20, 2011 at a price of $16.00 per share (adjusted for the impact of the Reverse Stock Split). As a result of the Granite Merger and as a result of the Reverse Stock Split, we issued approximately 521,595 shares of COB common stock to Granite Corp. stockholders in the aggregate. Bank of Granite was merged into CommunityOne Bank, N.A. effective June 8, 2013.
On December 30, 2014, we raised $25.0 million of additional capital through the issuance of 2,367,425 shares of common stock in a private placement offering to certain “accredited investors”, at an average price of $10.56. Of this amount, $19.4 million was contributed to the Bank.
Balance Sheet Review
Total assets increased $181.8 million, or 8%, in 2015, primarily on strong loan growth of $186.0 million, and an increase in our investment securities portfolio of $45.9 million as the company deployed low yielding cash equivalents into higher yielding securities. These increases were partially offset by a decrease of $56.7 million in cash and cash equivalents to fund the higher yielding asset growth. Total deposits grew $153.1 million in 2015, most significantly in noninterest-bearing deposits, which grew $62.5 million, or 19%. The growth in deposits includes the Company's acquisition of $58.8 million in deposits from CertusBank, N.A. in June 2015. In 2014, total assets increased $230.5 million, or 12%, primarily on loan growth of $145.5 million, and an increase in our net deferred tax asset by $136.2 million as a result of the reversal of $142.5 million of valuation allowance on the Company’s deferred tax assets, as described above. These increases were partially offset by a decrease of $73.9 million in investment securities as part of our strategy to rotate out of securities and into higher yielding loans. Total deposits grew $45.7 million in 2014, primarily noninterest-bearing deposits, which grew $33.3 million, or 11%. Excluding the deferred tax asset valuation allowance reversal, total assets grew 4% in 2014.
Loans held for investment increased by $186.0 million, or 14%, during 2015 on strong and broad-based loan growth in an environment of increased demand and stable economic conditions. In addition, as a measure of the resolution and new origination activity behind this net growth, pass rated loans grew $221.7 million during 2015, or 18%. Loans held for investment grew by $145.5 million, or 12%, during 2014 in an environment of improving demand and economic conditions. Pass rated loans grew $183.8 million during 2014, or 17%.
We have deferred tax assets of $141.7 million at December 31, 2015, with no corresponding deferred tax valuation allowance, compared to deferred tax assets of $147.7 million at December 31, 2014, offset by a corresponding deferred tax valuation allowance of $1.3 million.
Investment Securities
In total, our investment securities portfolio increased $45.9 million to $538.4 million at December 31, 2015 from $492.5 million the previous year. Investment securities designated available-for-sale (“AFS”) increased $40.4 million, or 12%, to $390.4 million at December 31, 2015 from $350.0 million the previous year. Securities designated held-to-maturity (“HTM”) grew $5.5 million to $148.0 million at year end 2015 from $142.5 million the previous year. We principally invest in longer term residential mortgage-backed-GSE securities and medium and longer term commercial mortgage-backed securities. Based on our assessment of cash flows, levels of loan production, current interest rate risk strategies and the potential future direction of market interest rate changes, we did not sell any investment securities during 2015, however, during 2014 we received proceeds from sales of investments of $37.2 million and recognized net gains of $974 thousand. As a result of changes in current market rates of interest, the impact of prepayments, and the impact of reinvestment of repayment proceeds at then-current interest rates, the overall investment portfolio average yield decreased from 2.56% at December 31, 2014 to 2.34% at December 31, 2015.
Investments are carried on the consolidated balance sheets at estimated fair value for AFS securities and at amortized cost for HTM securities. Table 9 presents the amortized cost, fair value and weighted-average yield of securities by contractual maturity at December 31, 2015, 2014 and 2013. The average yields are based on the amortized cost. In some cases, the issuers may have the right to call or prepay obligations without call or prepayment penalties prior to the contractual maturity date. Rates are calculated on a fully tax-equivalent basis using a 35% federal income tax rate.
37
Table 9
Investment Securities Portfolio Analysis
December 31, 2015
| (dollars in thousands) | Within 1 Year | 1 to 5 Years | 5 to 10 Years | Over 10 Years | Total | |||||||||||||||
| Amortized Cost | ||||||||||||||||||||
| Available-for-Sale: | ||||||||||||||||||||
| Obligations of: | ||||||||||||||||||||
| U.S. government sponsored agencies | $ | 2,005 | $ | — | $ | — | $ | — | $ | 2,005 | ||||||||||
| Residential mortgage-backed securities-GSE | — | — | 1,789 | 284,268 | 286,057 | |||||||||||||||
| Residential mortgage-backed securities-Private | — | — | — | 33,235 | 33,235 | |||||||||||||||
| Commercial mortgage-backed securities-GSE | — | 21,980 | — | — | 21,980 | |||||||||||||||
| Commercial mortgage-backed securities-Private | — | — | — | 17,869 | 17,869 | |||||||||||||||
| Corporate notes | 37,669 | — | — | 37,669 | ||||||||||||||||
| Total available-for-sale securities | 2,005 | 59,649 | 1,789 | 335,372 | 398,815 | |||||||||||||||
| Held-to-Maturity: | ||||||||||||||||||||
| Residential mortgage-backed securities-GSE | — | — | — | 120,197 | 120,197 | |||||||||||||||
| Residential mortgage-backed securities-Private | — | — | — | 17,712 | 17,712 | |||||||||||||||
| Commercial mortgage-backed securities-Private | — | — | — | 10,058 | 10,058 | |||||||||||||||
| Total held-to-maturity securities | — | — | — | 147,967 | 147,967 | |||||||||||||||
| Total investment securities | $ | 2,005 | $ | 59,649 | $ | 1,789 | $ | 483,339 | $ | 546,782 | ||||||||||
| Fair Value | ||||||||||||||||||||
| Available-for-Sale: | ||||||||||||||||||||
| Obligations of: | ||||||||||||||||||||
| U.S. government sponsored agencies | $ | 2,008 | $ | — | $ | — | $ | — | $ | 2,008 | ||||||||||
| Residential mortgage-backed securities-GSE | — | — | 1,821 | 276,286 | 278,107 | |||||||||||||||
| Residential mortgage-backed securities-Private | — | — | — | 33,577 | 33,577 | |||||||||||||||
| Commercial mortgage-backed securities-GSE | — | 21,612 | — | — | 21,612 | |||||||||||||||
| Commercial mortgage-backed securities-Private | — | — | — | 17,575 | 17,575 | |||||||||||||||
| Corporate Notes | — | 37,555 | — | — | 37,555 | |||||||||||||||
| Total available-for-sale securities | 2,008 | 59,167 | 1,821 | 327,438 | 390,434 | |||||||||||||||
| Held-to-Maturity: | ||||||||||||||||||||
| Residential mortgage-backed securities-GSE | — | — | — | 117,887 | 117,887 | |||||||||||||||
| Residential mortgage-backed securities-Private | — | — | — | 17,414 | 17,414 | |||||||||||||||
| Commercial mortgage-backed securities-Private | — | — | — | 9,884 | 9,884 | |||||||||||||||
| Total held-to-maturity securities | — | — | — | 145,185 | 145,185 | |||||||||||||||
| Total investment securities | $ | 2,008 | $ | 59,167 | $ | 1,821 | $ | 472,623 | $ | 535,619 | ||||||||||
| Total average yield | 1.08 | % | 1.55 | % | 2.97 | % | 2.58 | % | 2.47 | % | ||||||||||
38
December 31, 2014
| (dollars in thousands) | Within 1 Year | 1 to 5 Years | 5 to 10 Years | Over 10 Years | Total | |||||||||||||||
| Amortized Cost | ||||||||||||||||||||
| Available-for-Sale: | ||||||||||||||||||||
| Obligations of: | ||||||||||||||||||||
| U.S. government sponsored agencies | $ | — | $ | 2,028 | $ | — | $ | — | $ | 2,028 | ||||||||||
| Residential mortgage-backed securities-GSE | — | — | 2,327 | 292,973 | 295,300 | |||||||||||||||
| Residential mortgage-backed securities-Private | — | — | — | 16,455 | 16,455 | |||||||||||||||
| Commercial mortgage-backed securities-GSE | — | — | 22,377 | — | 22,377 | |||||||||||||||
| Commercial mortgage-backed securities-Private | — | — | — | 10,365 | 10,365 | |||||||||||||||
| Corporate notes | 8,399 | — | — | — | 8,399 | |||||||||||||||
| Total available-for-sale securities | 8,399 | 2,028 | 24,704 | 319,793 | 354,924 | |||||||||||||||
| Held-to-Maturity: | ||||||||||||||||||||
| Residential mortgage-backed securities-GSE | — | — | — | 132,396 | 132,396 | |||||||||||||||
| Commercial mortgage-backed securities-Private | — | — | — | 10,065 | 10,065 | |||||||||||||||
| Total held-to-maturity securities | — | — | — | 142,461 | 142,461 | |||||||||||||||
| Total investment securities | $ | 8,399 | $ | 2,028 | $ | 24,704 | $ | 462,254 | $ | 497,385 | ||||||||||
| Fair Value | ||||||||||||||||||||
| Available-for-Sale: | ||||||||||||||||||||
| Obligations of: | ||||||||||||||||||||
| U.S. government sponsored agencies | $ | — | $ | 2,044 | $ | — | $ | — | $ | 2,044 | ||||||||||
| Residential mortgage-backed securities-GSE | — | — | 2,367 | 287,778 | 290,145 | |||||||||||||||
| Residential mortgage-backed securities-Private | — | — | — | 17,271 | 17,271 | |||||||||||||||
| Commercial mortgage-backed securities-GSE | — | — | 21,958 | — | 21,958 | |||||||||||||||
| Commercial mortgage-backed securities-Private | — | — | — | 10,215 | 10,215 | |||||||||||||||
| Corporate Notes | 8,407 | — | — | — | 8,407 | |||||||||||||||
| Total available-for-sale securities | 8,407 | 2,044 | 24,325 | 315,264 | 350,040 | |||||||||||||||
| Held-to-Maturity: | ||||||||||||||||||||
| Residential mortgage-backed securities-GSE | — | — | — | 130,877 | 130,877 | |||||||||||||||
| Commercial mortgage-backed securities-Private | — | — | — | 9,998 | 9,998 | |||||||||||||||
| Total held-to-maturity securities | — | — | — | 140,875 | 140,875 | |||||||||||||||
| Total investment securities | $ | 8,407 | $ | 2,044 | $ | 24,325 | $ | 456,139 | $ | 490,915 | ||||||||||
| Total average yield | 1.35 | % | 1.08 | % | 2.03 | % | 2.62 | % | 2.56 | % | ||||||||||
39
December 31, 2013
| (dollars in thousands) | Within 1 Year | 1 to 5 Years | 5 to 10 Years | Over 10 Years | No Stated Maturity | Total | ||||||||||||||||||
| Amortized Cost | ||||||||||||||||||||||||
| Available-for-Sale: | ||||||||||||||||||||||||
| Obligations of: | ||||||||||||||||||||||||
| U.S. government sponsored agencies | $ | — | $ | 2,051 | $ | — | $ | — | $ | — | $ | 2,051 | ||||||||||||
| Residential mortgage-backed securities-GSE | — | — | 7,773 | 356,740 | — | 364,513 | ||||||||||||||||||
| Residential mortgage-backed securities-Private | — | — | — | 19,770 | — | 19,770 | ||||||||||||||||||
| Commercial mortgage-backed securities-GSE | — | — | 22,767 | — | — | 22,767 | ||||||||||||||||||
| Commercial mortgage-backed securities-Private | — | — | — | 10,408 | — | 10,408 | ||||||||||||||||||
| Business Development Company Investment | — | — | — | — | 1,753 | 1,753 | ||||||||||||||||||
| Corporate notes | 8,404 | 8,391 | — | — | — | 16,795 | ||||||||||||||||||
| Total available-for-sale securities | 8,404 | 10,442 | 30,540 | 386,918 | 1,753 | 438,057 | ||||||||||||||||||
| Held-to-Maturity: | ||||||||||||||||||||||||
| Residential mortgage-backed securities-GSE | — | — | — | 141,724 | — | 141,724 | ||||||||||||||||||
| Commercial mortgage-backed securities-Private | — | — | — | 10,071 | — | 10,071 | ||||||||||||||||||
| Total held-to-maturity securities | — | — | — | 151,795 | — | 151,795 | ||||||||||||||||||
| Total investment securities | $ | 8,404 | $ | 10,442 | $ | 30,540 | $ | 538,713 | $ | 1,753 | $ | 589,852 | ||||||||||||
| Fair Value | ||||||||||||||||||||||||
| Available-for-Sale: | ||||||||||||||||||||||||
| Obligations of: | ||||||||||||||||||||||||
| U.S. government sponsored agencies | $ | — | $ | 2,077 | $ | — | $ | — | $ | — | $ | 2,077 | ||||||||||||
| Residential mortgage-backed securities-GSE | — | — | 8,029 | 333,118 | — | 341,147 | ||||||||||||||||||
| Residential mortgage-backed securities-Private | — | — | — | 20,752 | — | 20,752 | ||||||||||||||||||
| Commercial mortgage-backed securities-GSE | — | — | 21,439 | — | — | 21,439 | ||||||||||||||||||
| Commercial mortgage-backed securities-Private | — | — | — | 9,585 | — | 9,585 | ||||||||||||||||||
| Business Development Company investment | — | — | — | — | 2,737 | 2,737 | ||||||||||||||||||
| Corporate Notes | 8,406 | 8,471 | — | — | — | 16,877 | ||||||||||||||||||
| Total available-for-sale securities | 8,406 | 10,548 | 29,468 | 363,455 | 2,737 | 414,614 | ||||||||||||||||||
| Held-to-Maturity: | ||||||||||||||||||||||||
| Residential mortgage-backed securities-GSE | — | — | — | 131,817 | — | 131,817 | ||||||||||||||||||
| Commercial mortgage-backed securities-Private | — | — | — | 9,308 | — | 9,308 | ||||||||||||||||||
| Total held-to-maturity securities | — | — | — | 141,125 | — | 141,125 | ||||||||||||||||||
| Total investment securities | $ | 8,406 | $ | 10,548 | $ | 29,468 | $ | 504,580 | $ | 2,737 | $ | 555,739 | ||||||||||||
| Total average yield | 1.30 | % | 1.30 | % | 2.18 | % | 2.66 | % | — | % | 2.60 | % | ||||||||||||
Loans
Our primary source of revenue and largest component of earning assets is the loan portfolio. In 2015, in part as a result of strategic investments in loan origination resources, new geographies and new channels, loans increased $186.0 million, or 14%, as compared to an increase of $145.5 million, or 12%, in 2014. In 2015, we originated $254.0 million of residential mortgage loans and $7.1 million of SBA loans.
In 2014, loans increased $145.5 million, or 12%, as compared to an increase of $35.2 million, or 3%, in 2013. In 2014, we originated $147.4 million of residential mortgage loans and purchased $19.7 million of residential mortgage loans. In 2013, loan originations as a result of investments in personnel, realignment of personnel to metro markets and an improving economy, combined with loan
40
purchases, contributed to the increase in our loan portfolio. In 2013, we originated $176.1 million of residential mortgage loans and purchased $157.6 million of residential mortgage loans.
Our target portfolio is an equal balance between commercial loans and consumer loans, including residential mortgage loans. At December 31, 2015, 51.5% of the loan portfolio consisted of residential mortgage and consumer loans, decreased from 54.5% in 2014 and decreased from 56.2% in 2013. We plan to maintain the balance between consumer and commercial loans in 2016.
Table 10 sets forth the major categories of loans for each of the last five years.
Table 10
Loan Portfolio Composition
| (dollars in thousands) | December 31, | ||||||||||||||||||||||||||||||||||
| 2015 | 2014 | 2013 | 2012 | 2011 | |||||||||||||||||||||||||||||||
| Loans held for sale | $ | 5,403 | $ | 2,796 | $ | 1,836 | $ | 6,974 | $ | 4,529 | |||||||||||||||||||||||||
| Loans held for investment: | |||||||||||||||||||||||||||||||||||
| Commercial and agricultural | $ | 152,306 | 9.9 | % | $ | 113,413 | 8.3 | % | $ | 72,252 | 5.9 | % | $ | 79,704 | 6.8 | % | $ | 95,089 | 7.8 | % | |||||||||||||||
| Real estate-construction | 107,002 | 6.9 | 78,327 | 5.8 | 64,083 | 5.3 | 58,414 | 5.0 | 92,806 | 7.6 | |||||||||||||||||||||||||
| Real estate-mortgage: | |||||||||||||||||||||||||||||||||||
| 1-4 family residential | 687,555 | 44.5 | 667,602 | 49.2 | 636,107 | 52.5 | 553,538 | 47.0 | 453,725 | 37.3 | |||||||||||||||||||||||||
| Commercial | 489,112 | 31.7 | 426,328 | 31.4 | 394,924 | 32.6 | 441,836 | 37.5 | 531,383 | 43.6 | |||||||||||||||||||||||||
| Consumer | 107,820 | 7.0 | 72,118 | 5.3 | 44,882 | 3.7 | 43,543 | 3.7 | 44,532 | 3.7 | |||||||||||||||||||||||||
| Total | $ | 1,543,795 | 100.0 | % | $ | 1,357,788 | 100.0 | % | $ | 1,212,248 | 100.0 | % | $ | 1,177,035 | 100.0 | % | $ | 1,217,535 | 100.0 | % | |||||||||||||||
At December 31, 2015, loans held for sale consisted of residential mortgage loans held for sale in the secondary market, as well as commercial loans partially guaranteed by the SBA similarly held for sale in the secondary market. At December 31, 2014, 2013 and 2012, loans held for sale was comprised solely of originated residential mortgage loans held for sale into the secondary market. In 2011, loans held for sale consisted of reclassified problem loans from the held for investment portfolio that had been under contract to be sold.
The maturity distribution and interest rate sensitivity of selected loan categories at December 31, 2015 are presented in Table 11.
Table 11
Selected Loan Maturities
| December 31, 2015 | ||||||||||||||||
| (dollars in thousands) | One Year or Less | One to Five Years | Over Five Years | Total | ||||||||||||
| Commercial and agricultural | $ | 98,450 | $ | 45,970 | $ | 7,886 | $ | 152,306 | ||||||||
| Real estate-construction | 81,094 | 12,200 | 13,708 | 107,002 | ||||||||||||
| Total | $ | 179,544 | $ | 58,170 | $ | 21,594 | $ | 259,308 | ||||||||
| Sensitivity to rate changes: | ||||||||||||||||
| Fixed interest rates | $ | 31,402 | $ | 54,908 | $ | 19,168 | $ | 105,478 | ||||||||
| Variable interest rates | 148,142 | 3,262 | 2,426 | 153,830 | ||||||||||||
| Total | $ | 179,544 | $ | 58,170 | $ | 21,594 | $ | 259,308 | ||||||||
Asset Quality
Asset quality, including nonperforming assets, impaired loans and charge-off ratios, all improved in 2015 from 2014 levels as we continued to effectively resolve problem assets and the inflow of new problem assets was limited. Nonperforming assets declined by $10.3 million, or 23%, to $35.4 million at December 31, 2015. Nonperforming assets were 1.5% of total assets in 2015, reduced from 2.1% in 2014, while impaired loans declined 21% to $31.1 million. Troubled debt restructurings decreased by 8% to $17.9 million from $19.4 million at the end of 2014. Net loan charge-offs were $2.2 million in 2015 and the net charge-offs ratio increased slightly to 0.15% in 2015, compared to 0.08% in 2014. During 2015, we foreclosed on $4.5 million of net loans and transferred them to OREO, and disposed of $6.6 million in OREO through sales. As a result of our continued asset quality improvement in 2015, our ALL was reduced to $15.2 million, or 0.98% of loans held for investment, from 1.50% at the end of 2014.
41
Nonperforming assets declined by $17.9 million, or 28%, to $45.7 million at December 31, 2014. Nonperforming assets were 2.1% of total assets in 2014, reduced from 3.2% in 2013. Impaired loans declined 17% to $39.4 million and troubled debt restructurings increased 7% to $19.4 million. Net loan charge-offs were $1.1 million in 2014 and the net charge-offs ratio declined to 0.08% in 2014, compared to 0.26% in 2013. During 2014, we foreclosed on $4.4 million of net loans and transferred them to OREO, and disposed of $11.8 million in OREO through sales. As our asset quality improved in 2014, we were able to reduce our ALL to $20.3 million, or 1.50% of loans held for investment, from 2.21% at the end of 2013.
Nonperforming Assets
Nonperforming assets declined by $10.3 million, or 23%, to $35.4 million at December 31, 2015, compared to $45.7 million at December 31, 2014, as a result of continued problem asset resolution. This decline follows a $17.9 million decline in nonperforming assets during 2014, and a total decline over the two year period of $28.2 million, or 44%.
The level of nonperforming loans decreased 26%, or $6.5 million, to $18.8 million at December 31, 2015, from $25.3 million in 2014. The level of nonperforming loans also decreased 28% during 2014, as a result of asset resolution efforts. Nonperforming loans decreased from 1.9% of loans held for investment at December 31, 2014 to 1.2% of loans at December 31, 2015. During 2015 and 2014, we charged off $5.6 million and $7.7 million in loans (prior to recoveries), respectively, a 27% reduction.
OREO and repossessed assets declined by $3.8 million in 2015 to $16.6 million, a decline of 19% from $20.4 million at December 31, 2014, as a result of continued asset resolution and stabilizing demand for real estate. During 2015, we recorded net loss on sale and write-down of OREO properties of $1.8 million, compared to $0.8 million in 2014.
Nonperforming assets are comprised of nonaccrual loans, accruing loans past due 90 days or more, repossessed assets and OREO. Nonperforming loans are loans placed in nonaccrual status when, in management's opinion, the collection of all or a portion of interest becomes doubtful. Loans are returned to accrual status when the factors indicating doubtful collectability cease to exist and the loan has performed in accordance with its terms for a demonstrated period of time. OREO represents real estate acquired through foreclosure or deed in lieu of foreclosure and is generally carried at fair value, less estimated costs to sell.
Had nonaccruing loans been on accruing status, interest income would have been higher by $1.4 million in 2015, and interest income on nonaccrual loans included in the results of operations amounted to approximately $2.5 million in 2015.
Acquired Loans
Loans acquired in the Granite Merger (“Granite Purchased Loans”) include purchased impaired loans (“PI loans”) and purchased contractual (“PC loans”) revolving consumer and commercial loans. We acquired loans in the Granite Merger with an unpaid principal balance net of partial charge-offs of $383.1 million and a fair value adjustment for acquisition accounting purposes of $31.9 million. We elected to treat the Granite portfolio under ASC 310-30, with the exception of performing revolving consumer and commercial loans, which are being accounted for under ASC 310-20.
At December 31, 2015, an ALL of $2.8 million was required for the Granite PI loans, compared to a required ALL of $3.2 million at December 31, 2014. The Granite PI loans are presented on an accruing basis as of December 31, 2015 and 2014. We recorded $7.0 million of accretable yield during 2015 on the Granite Purchased Loans, compared to $9.6 million in accretable yield during 2014 on these loans. At December 31, 2015 there were $105.7 million of Granite Purchased Loans, of which $18.2 million were PC loans, $3.2 million were PI Loans with no subsequent credit deterioration and $84.3 million were PI Loans with subsequent credit deterioration. At December 31, 2015, we estimated future accretable yield on PI loans to be $15.6 million.
PI loans are segregated into pools and recorded at estimated fair value on the date of acquisition without the carryover of the related ALL. PI loans are accounted for under ASC 310-30 when the loans have evidence of credit deterioration since origination and it is probable at the date of acquisition we will not collect all contractually required principal and interest payments. Evidence of credit quality deterioration as of the date of acquisition may include statistics such as past due status, nonaccrual status and risk grade. PI loans generally meet COB's definition for nonaccrual status; however, even if the borrower is not currently making payments, COB will classify loans as accruing if COB can reasonably estimate the amount and timing of future cash flows. The difference between contractually required payments at acquisition and the cash flows expected to be collected at acquisition is referred to as the nonaccretable difference.
Periodically, we estimate the expected cash flows for each pool of the PI loans and evaluate whether the expected cash flows for each pool have changed from prior estimates. Decreases to the expected cash flows will generally result in a provision for loan losses, or a decrease in yield when there is only a timing difference in expected cash flows. Subsequent increases in cash flows result in a reversal of the provision for loan losses to the extent of prior charges, or reclassification from nonaccretable difference to accretable yield with a positive impact on future interest income. Excess of cash flows expected at acquisition over the estimated fair value is referred to as the accretable yield and is recognized into interest income over the remaining life of the loan when there is a reasonable expectation about the amount and timing of such cash flows. During 2015 we recorded an impairment reversal of $0.5 million in our PI loan pools through the provision for loan loss.
42
The following table presents our level and composition of nonperforming loans as of December 31 for the years indicated.
Table 12
Nonperforming Loans
| (dollars in thousands) | ||||||||
| 2015 | 2014 | |||||||
| Nonperforming Loans: | ||||||||
| Current, nonaccrual | $ | 7,412 | $ | 8,519 | ||||
| Delinquent 30-89 days, nonaccrual | 1,361 | 1,225 | ||||||
| Delinquent 90+ days, nonaccrual | 9,244 | 15,544 | ||||||
| Delinquent 90+ days, accruing | 817 | 5 | ||||||
| Total nonperforming loans | $ | 18,834 | $ | 25,293 | ||||
Nonperforming loans and impaired loans are overlapping sets of loans. Impaired loans are problem loans that may, or may not, have been placed into nonaccrual status. The complete repayment of principal and interest is considered probable for those impaired loans that have not been placed into a nonaccrual status, but not within contracted terms.
The following table presents the level, composition and the reserves associated with impaired loan balances.
Table 13
Impaired Loans
| December 31, 2015 | December 31, 2014 | |||||||||||||||
| (dollars in thousands) | Balance | Associated Reserves | Balance | Associated Reserves | ||||||||||||
| Impaired loans, held for sale | $ | — | $ | — | $ | — | $ | — | ||||||||
| Impaired loans, not individually reviewed for impairment | 4,903 | — | 4,967 | — | ||||||||||||
| Impaired loans, individually reviewed, with no reserves | 22,411 | — | 26,631 | — | ||||||||||||
| Impaired loans, individually reviewed, with reserves | 3,817 | 399 | 7,851 | 418 | ||||||||||||
Total impaired loans 1 | $ | 31,131 | $ | 399 | $ | 39,449 | $ | 418 | ||||||||
| Purchased impaired loans with subsequent deterioration | $ | 84,329 | $ | 2,754 | $ | 118,701 | $ | 3,237 | ||||||||
| Purchased impaired loans with no subsequent deterioration | 3,235 | — | 4,141 | — | ||||||||||||
| Total Reserves | $ | 3,153 | $ | 3,655 | ||||||||||||
| Average impaired loans, excluding purchased impaired, calculated using a simple average | $ | 35,290 | $ | 43,446 | ||||||||||||
1 Included at December 31, 2015 and December 31, 2014 were $13.1 million and $14.1 million, respectively, in performing restructured loans. |
At December 31, 2015, the bank had 3 impaired loans exceeding $1.0 million each, with no impairment. At December 31, 2014, the bank had 3 such impaired loans, with a total impairment of $18,000.
Troubled Debt Restructurings
Troubled debt restructurings generally occur when a borrower is experiencing, or is expected to experience, financial difficulties in the near-term. As a result, we work with the borrower to prevent further difficulties, and ultimately to improve the likelihood of recovery on the loan. To facilitate this process, a concessionary modification that would not otherwise be considered may be granted resulting in classification as a troubled debt restructuring. We consider all troubled debt restructurings to be impaired loans. Troubled debt restructurings can involve loans remaining on nonaccrual, moving to nonaccrual, or continuing on accruing status, depending on the individual facts and circumstances of the borrower. Generally, a nonaccrual loan that is restructured remains on nonaccrual for a period of six months to demonstrate the borrower can meet the restructured terms. However, performance prior to the restructuring, or significant events that coincide with the restructuring, are considered in assessing whether the borrower can meet the new terms and may result in the loan being returned to accrual status after a shorter performance period. If the borrower's ability to meet the revised payment schedule is not reasonably assured, the loan remains in a nonaccrual status.
43
The majority of our loan modifications relate to modifying terms on our commercial loan portfolio. Modifications may result in adjustments to interest rates, frequency of payments or maturity dates. In these cases, we do not typically forgive principal or interest as part of the loan modification. However, it is common for us to seek additional collateral or guarantor support in exchange for modified terms.
Troubled debt restructurings are a subset of impaired loans. The following table presents the level, accrual status and the reserves associated with these loan balances.
Table 14
Troubled Debt Restructurings
| (dollars in thousands) | December 31, 2015 | December 31, 2014 | ||||||||||||||||||||||
| Balance | Nonaccrual | Associated Reserves | Balance | Nonaccrual | Associated Reserves | |||||||||||||||||||
| Troubled Debt Restructurings | ||||||||||||||||||||||||
| TDRs with no impairment | $ | 14,544 | $ | 4,181 | $ | — | $ | 12,389 | $ | 5,203 | $ | — | ||||||||||||
| TDRs with impairment | 3,342 | 590 | 356 | 7,040 | 153 | 316 | ||||||||||||||||||
| Total Troubled Debt Restructurings | $ | 17,886 | $ | 4,771 | $ | 356 | $ | 19,429 | $ | 5,356 | $ | 316 | ||||||||||||
The following table presents the composition of impaired loans across loan types, along with the accrual status and the associated reserves, by type.
Table 15
Impaired Loans by Type
| (dollars in thousands) | December 31, 2015 | December 31, 2014 | ||||||||||||||||||||||
| Impaired | Nonaccrual | Associated Reserves | Impaired | Nonaccrual | Associated Reserves | |||||||||||||||||||
| Impaired Loans (composition across loan types): | ||||||||||||||||||||||||
| Commercial and agricultural | $ | 1,070 | $ | 1,054 | $ | — | $ | 645 | $ | 608 | $ | 58 | ||||||||||||
| Real estate - construction | 1,048 | 110 | — | 3,145 | 2,307 | — | ||||||||||||||||||
| Real estate - mortgage: | ||||||||||||||||||||||||
| 1 - 4 family residential | 14,403 | 9,106 | 399 | 14,421 | 8,637 | 331 | ||||||||||||||||||
| Commercial | 14,072 | 7,209 | — | 20,882 | 13,380 | 29 | ||||||||||||||||||
| Consumer | 538 | 538 | — | 356 | 356 | — | ||||||||||||||||||
| Total Impaired Loans | $ | 31,131 | $ | 18,017 | $ | 399 | $ | 39,449 | $ | 25,288 | $ | 418 | ||||||||||||
We designate loans as “Special Mention” when the borrower's financial condition or performance indicates that the loan may potentially become a problem loan. These loans are not classified as problem loans, nor are they impaired, and they have not been modified under conditions that require designation as troubled debt restructurings. At December 31, 2015 we had designated $19.1 million as Special Mention loans, of which 3% were delinquent more than 30 days. Two Special Mention loans had balances over $1.0 million and comprised approximately 31% of the total. Approximately 11% of the total Special Mention loans were categorized as land acquisition, development, and construction loans, with non-owner occupied commercial rental properties approximating another 31% of that total. These categories are generally affected by changes in economic conditions, fluctuations in interest rates and the availability of loans to potential purchasers, changes in tax and other laws and acts of nature. In particular, a worsening of economic conditions in the residential real estate market may result in Special Mention loans being individually reclassified as problem loans in the future.
Loans secured by real estate (including commercial owner occupied and non-owner occupied, construction, land development, and residential single family mortgage) are a large portion of our loan portfolio. At December 31, 2015, these categories constituted $1.28 billion, or approximately 83%, of our total loan portfolio. These categories are generally affected by changes in economic conditions, fluctuations in interest rates and the availability of loans to potential purchasers, changes in tax and other laws and acts of nature. While we do not expect deterioration in real estate markets in 2016, declines would adversely affect the value of real estate collateral of loans secured by real estate, which could adversely affect our future earnings.
44
Allowance for Loan Losses
In determining the ALL and any resulting provision to be charged against earnings, particular emphasis is placed on the results of the loan review process. Consideration is also given to a review of individual loans, historical loan loss experience, the value and adequacy of collateral, as well as the economic conditions in our market area. For loans determined to be impaired, the allowance is based on discounted cash flows using the loan’s initial effective interest rate or the fair value of the collateral for certain collateral dependent loans. This evaluation is inherently subjective as it requires material estimates, including the amounts and timing of future cash flows expected to be received on impaired loans that may be susceptible to significant change. In addition, as an integral part of its examination process, the OCC periodically reviews the Bank's ALL and may require the Bank to recognize changes to the allowance based on its judgments about information available to it at the time of its examinations. Loans are charged off when, in the opinion of management, they are deemed to be uncollectible. Recognized losses are charged against the allowance, and subsequent recoveries are added to the allowance.
Estimated credit losses should meet the criteria for accrual of a loss contingency, i.e., a provision to the ALL, set forth in GAAP. Our methodology for determining the ALL is based on the requirements of GAAP, the Interagency Policy Statement on the Allowance for Loan and Lease Losses and other regulatory and accounting pronouncements. The ALL is determined by the sum of three separate components: (i) the impaired loan component, which addresses specific reserves for impaired loans; (ii) the general reserve component, which addresses reserves for pools of homogeneous loans; and (iii) an unallocated reserve component (if any) based on management's judgment and experience. The loan pools and impaired loans are mutually exclusive; any loan that is impaired should be excluded from its homogenous pool for purposes of that pool’s reserve calculation, regardless of the level of impairment. However, COB has established a de minimis threshold for loan exposures that, if found to be impaired, will have impairment determined by applying the same general reserve rate as nonimpaired loans within the same pool.
The ALL, as a percentage of loans held for investment, totaled 0.98% at December 31, 2015 compared to 1.50% at December 31, 2014. The reduction in ALL was the result of the ongoing improvement in our asset quality due to the significant reduction in problem asset levels. Annualized net charge-offs as a percentage of the average held for sale loan portfolio were 0.15% in 2015 and 0.08% in 2014. The ratio of net loan charge-offs to ending ALL balance was 14% for the year ended December 31, 2015, compared to 5% for the year ended December 31, 2014. The recovery of provision for losses charged to operations in 2015 was $3.0 million and $5.4 million in 2014, also as a result of continued improved loan portfolio quality.
Management continually performs thorough analyses of the loan portfolio. Management believes the ALL of $15.2 million at December 31, 2015 is adequate to cover probable losses inherent in the loan portfolio; however, assessing the adequacy of the allowance is a process that requires considerable judgment. Management's judgments are based on numerous assumptions about current events that it believes to be reasonable, but which may or may not be valid. Thus, there can be no assurance that loan losses in future periods will not exceed the current allowance or that future increases in the allowance will not be required. No assurance can be given that management's ongoing evaluation of the loan portfolio in light of changing economic conditions and other relevant circumstances will not require future additions to the allowance, thus adversely affecting our operating results. Changes in the ALL are presented in Note 5 to the consolidated financial statements.
45
Table 16 presents an analysis of the changes in the ALL and of the level of nonperforming assets for each of the last five years as of December 31.
Table 16
Summary of Allowance for Loan Losses and Nonperforming Assets
| (dollars in thousands) | 2015 | 2014 | 2013 | 2012 | 2011 | |||||||||||||||
| Balance, beginning of year | $ | 20,345 | $ | 26,785 | $ | 29,314 | $ | 39,360 | $ | 93,687 | ||||||||||
| Charge-offs: | ||||||||||||||||||||
| Commercial and agricultural | 309 | 1,449 | 1,277 | 3,494 | 10,832 | |||||||||||||||
| Real estate - construction | 138 | 719 | 1,080 | 11,084 | 65,526 | |||||||||||||||
| Real estate - mortgage | 1,707 | 3,019 | 6,840 | 11,932 | 48,382 | |||||||||||||||
| Consumer | 3,450 | 2,516 | 4,147 | 4,458 | 3,684 | |||||||||||||||
| Total charge-offs | 5,604 | 7,703 | 13,344 | 30,968 | 128,424 | |||||||||||||||
| Recoveries: | ||||||||||||||||||||
| Commercial and agricultural | 1,036 | 951 | 1,623 | 991 | 855 | |||||||||||||||
| Real estate - construction | 712 | 2,110 | 2,681 | 3,237 | 2,637 | |||||||||||||||
| Real estate - mortgage | 1,042 | 2,352 | 4,314 | 1,425 | 1,722 | |||||||||||||||
| Consumer | 645 | 1,221 | 1,674 | 1,220 | 1,521 | |||||||||||||||
| Total recoveries | 3,435 | 6,634 | 10,292 | 6,873 | 6,735 | |||||||||||||||
| Net charge-offs | 2,169 | 1,069 | 3,052 | 24,095 | 121,689 | |||||||||||||||
| (Recovery) Provision charged to operations | (2,981 | ) | (5,371 | ) | 523 | 14,049 | 67,362 | |||||||||||||
| Balance, end of year | $ | 15,195 | $ | 20,345 | $ | 26,785 | $ | 29,314 | $ | 39,360 | ||||||||||
| Nonperforming assets: | ||||||||||||||||||||
| Nonaccrual loans | $ | 18,017 | $ | 25,288 | $ | 35,165 | $ | 79,242 | $ | 102,973 | ||||||||||
| Past due 90 days or more and still accruing interest | 817 | 5 | — | 227 | 3,000 | |||||||||||||||
| Total nonperforming loans | 18,834 | 25,293 | 35,165 | 79,469 | 105,973 | |||||||||||||||
| Other real estate owned | 16,251 | 20,122 | 28,353 | 62,796 | 110,009 | |||||||||||||||
| Other repossessed assets | 332 | 289 | 42 | 335 | 377 | |||||||||||||||
| Total nonperforming assets | $ | 35,417 | $ | 45,704 | $ | 63,560 | $ | 142,600 | $ | 216,359 | ||||||||||
| Accruing troubled debt restructured loans | $ | 13,115 | $ | 14,073 | $ | 12,144 | $ | 4,505 | $ | 2,922 | ||||||||||
| Asset quality ratios: | ||||||||||||||||||||
| Net loan charge-offs to average loans held for investment | 0.15 | % | 0.08 | % | 0.26 | % | 1.94 | % | 10.75 | % | ||||||||||
| Net loan charge-offs to allowance for loan losses | 14.27 | 5.25 | 11.39 | 82.20 | 309.17 | |||||||||||||||
| Allowance for loan losses to loans held for investment | 0.98 | 1.50 | 2.21 | 2.49 | 3.23 | |||||||||||||||
| Total nonperforming loans to loans held for investment | 1.22 | 1.86 | 2.90 | 6.75 | 8.70 | |||||||||||||||
Information about management's allocation of the ALL by loan category is presented in the following table.
Table 17
Allocations of Allowance for Loan Losses
| (dollars in thousands) | December 31, | |||||||||||||||||||||||||
| 2015 | 2014 | 2013 | 2012 | 2011 | ||||||||||||||||||||||
| Amount | % of total | Amount | % of total | Amount | % of total | Amount | % of total | Amount | % of total | |||||||||||||||||
| Commercial and agricultural | $ | 2,402 | 15.8 | $ | 3,915 | 19.2 | $ | 2,931 | 10.9 | $ | 3,238 | 11.1 | $ | 5,776 | 14.7 | |||||||||||
| Real estate - construction | 1,769 | 11.6 | 3,163 | 15.5 | 5,233 | 19.5 | 4,987 | 17.0 | 11,995 | 30.5 | ||||||||||||||||
| Real estate - mortgage | 7,469 | 49.2 | 10,026 | 49.3 | 16,064 | 60.0 | 18,328 | 62.5 | 19,948 | 50.7 | ||||||||||||||||
| Consumer | 3,555 | 23.4 | 3,241 | 16.0 | 2,557 | 9.6 | 2,761 | 9.4 | 1,641 | 4.1 | ||||||||||||||||
| Total allowance for loan losses | $ | 15,195 | 100.0 | $ | 20,345 | 100.0 | $ | 26,785 | 100.0 | $ | 29,314 | 100.0 | $ | 39,360 | 100.0 | |||||||||||
46
Included in the amounts above are $200 thousand, $400 thousand, $500 thousand, $200 thousand and $407 thousand for the years ended December 31, 2015, 2014, 2013, 2012 and 2011, respectively, which were originally unallocated and have been allocated to the loan categories pro rata based on the calculated reserves.
Loan Review
Management considers the asset quality of the Company to be of primary importance. A formal internal loan review function was established in 2011. Our internal loan review function examines the adequacy of and adherence to lending policies, evaluates the quality of credit analysis and underwriting, ensures the accuracy of risk ratings and proper loan accounting, and assesses collateral evaluation, lien perfection, policy exceptions, problem loan workout practices and other emerging credit risk and portfolio trends. This function reports directly to the Risk Management Committee of the Board of Directors, and is independent of the loan origination process.
Deposits
Deposit accounts have historically been the primary source of funds for the Bank and a competitive strength of the Company. Deposit accounts also provide a customer base for the sale of additional financial products and services and fee income through service charges. We set targets for growth in deposit accounts annually in an effort to increase the number of products per banking relationship. Deposits are attractive sources of funding because of their stability and generally low cost as compared with other funding sources. The level and mix of deposits is affected by various factors, including general economic conditions, the particular circumstances of local markets and the specific deposit acquisition and retention strategies employed.
In 2015, deposits increased $153.1 million, or 9.0%, to $1.95 billion from $1.79 billion at December 31, 2014, as a result of our continued focus and promotional activities to support accelerated loan growth and the purchase of $58.4 million in deposits from CertusBank in June 2015. Noninterest-bearing demand deposits increased by $62.6 million or 19%, to 19.8% of total deposits in 2015, from 18% in 2014 as a result of increased commercial relationships and investments in treasury management products. Time deposits increased 6% to $621.3 million, and fell to 32% of total deposits in 2015, from $588.3 million, or 33% of total deposits in 2014. Other interest-bearing deposits (demand, savings and money markets) increased 7% to $939.9 million from $882.3 million in 2014. Brokered certificates of deposit grew by $18.1 million to $55.8 million, or 3% of total deposits in 2015, from $37.7 million, or 2% of total deposits in 2014. Time deposits greater than $250,000 were $60.1 million at December 31, 2015, of which $3.8 million, $12.2 million, $29.4 million and $14.7 million had a remaining maturity of 3 months or less, 3 months to 6 months, 6 months to 12 months and greater than 12 months, respectively.
In 2014, deposits increased $45.7 million, or 3%, as a result of our efforts to support loan growth. Noninterest-bearing demand deposits increased by $33.3 million, to 18% of total deposits, from 17% in 2013. Time deposits increased 1% to $588.3 million, and fell to 33% of total deposits, from $582.3 million, or 33% of total deposits in 2013. Other interest-bearing deposits increased 1% to $882.3 million from $876.0 million in 2013. Time deposits greater than $250,000 were $50.0 million at December 31, 2014.
47
Table 18 shows the year end and average deposit balances for the years 2015 and 2014 and the changes during the years then ended.
Table 18
Analysis of Deposits
| 2015 | 2014 | |||||||||||||||||||||
| (dollars in thousands) | Change from Prior Year | Change from Prior Year | ||||||||||||||||||||
| Balance | Amount | % | Balance | Amount | % | |||||||||||||||||
| Year End Balances | ||||||||||||||||||||||
| Interest-bearing deposits: | ||||||||||||||||||||||
| Demand deposits | $ | 366,842 | $ | 8,680 | 2.4 | % | $ | 358,162 | $ | 10,371 | 3.0 | % | ||||||||||
| Savings deposits | 94,732 | 8,046 | 9.3 | 86,686 | 6,179 | 7.7 | ||||||||||||||||
| Money market deposits | 478,304 | 40,820 | 9.3 | 437,484 | (10,188 | ) | (2.3 | ) | ||||||||||||||
| Total | 939,878 | 57,546 | 6.5 | 882,332 | 6,362 | 0.7 | ||||||||||||||||
| Time deposits | 621,330 | 33,018 | 5.6 | 588,312 | 6,038 | 1.0 | ||||||||||||||||
| Total interest-bearing deposits | 1,561,208 | 90,564 | 6.2 | 1,470,644 | 12,400 | 0.9 | ||||||||||||||||
| Noninterest-bearing demand deposits | 386,329 | 62,553 | 19.3 | 323,776 | 33,315 | 11.5 | ||||||||||||||||
| Total deposits | $ | 1,947,537 | $ | 153,117 | 8.5 | $ | 1,794,420 | $ | 45,715 | 2.6 | ||||||||||||
| Average Balances | ||||||||||||||||||||||
| Interest-bearing deposits: | ||||||||||||||||||||||
| Demand deposits | $ | 356,618 | $ | 16,093 | 4.7 | % | $ | 340,525 | $ | (6,246 | ) | (1.8 | )% | |||||||||
| Savings deposits | 90,941 | 6,020 | 7.1 | 84,921 | 5,270 | 6.6 | ||||||||||||||||
| Money market deposits | 436,807 | 681 | 0.2 | 436,126 | (12,256 | ) | (2.7 | ) | ||||||||||||||
| Total | 884,366 | 22,794 | 2.6 | 861,572 | (13,232 | ) | (1.5 | ) | ||||||||||||||
| Time deposits | 603,694 | 22,196 | 3.8 | 581,498 | (68,894 | ) | (10.6 | ) | ||||||||||||||
| Total interest-bearing deposits | 1,488,060 | 44,990 | 3.1 | 1,443,070 | (82,126 | ) | (5.4 | ) | ||||||||||||||
| Noninterest-bearing demand deposits | 352,036 | 36,635 | 11.6 | 315,401 | 31,023 | 10.9 | ||||||||||||||||
| Total deposits | $ | 1,840,096 | $ | 81,625 | 4.6 | $ | 1,758,471 | $ | (51,103 | ) | (2.8 | ) | ||||||||||
Table 19 shows short-term borrowings for the years ended 2015, 2014 and 2013. During 2015, the Bank's short-term borrowings consisted of FHLB advances and retail repurchase agreements, while in 2014 and 2013, the Bank's only short-term borrowings consisted of retail repurchase agreements.
Table 19
Short-term Borrowings
| (dollars in thousands) | 2015 | 2014 | 2013 | |||||||||
| Balance at December 31 | $ | 35,719 | $ | 9,076 | $ | 6,917 | ||||||
| Average balance during the year | 35,555 | 7,713 | 9,852 | |||||||||
| Maximum month end balance | 62,030 | 12,217 | 13,064 | |||||||||
| Weighted average interest rate: | ||||||||||||
| At December 31 | 0.43 | % | 0.21 | % | 0.21 | % | ||||||
| During the year | 0.28 | 0.21 | 0.21 | |||||||||
Recent Accounting and Reporting Developments
See Note 1 of the Consolidated Financial Statements for a discussion of recently issued or proposed accounting pronouncements.
Effects of Inflation
Inflation affects financial institutions in ways that are different from most commercial and industrial companies, which have significant investments in fixed assets and inventories. Since the Bank is asset sensitive, inflation should have a positive impact on net interest margin. Noninterest expense, such as salaries and wages, occupancy and equipment cost, are negatively affected by inflation.
48
Non-GAAP Measures
This Report contains financial information determined by methods other than in accordance with GAAP. The Company's management, the financial services sector, bank stock analysts and regulators use these non-GAAP measures in their analysis of COB's performance. Some of these non-GAAP measures exclude intangible assets such as goodwill and core deposit premiums from the calculations of return on average assets and return on average equity. We believe presentations of financial measures excluding the impact of intangible assets provide useful supplemental information that is essential to a proper understanding of the operating results of our core businesses. In addition, certain designated net interest income amounts are presented on a taxable equivalent basis. We believe that the presentation of net interest income on a taxable equivalent basis aids in the comparability of net interest income arising from taxable and tax-exempt sources. Certain credit related and nonrecurring noninterest expense items are excluded from PCNR noninterest expense in order to enhance comparability between years and to highlight trends in noninterest expenses and noninterest income. Certain nonrecurring noninterest expenses, nonrecurring noninterest income and nonrecurring income tax expenses are excluded from core noninterest income, core noninterest expense and core net income in order to enhance comparability between years and highlight trends in these items. These disclosures should not be viewed as a substitute for results determined in accordance with GAAP, nor are they necessarily comparable to non-GAAP performance measures that may be presented by other companies.
The non-GAAP financial measures used in this Report are defined below.
• “Average tangible shareholders’ equity” is average shareholders’ equity reduced by average recorded goodwill, and average
other intangible assets.
• “Average tangible assets” are average total assets reduced by average recorded goodwill and average other intangible assets.
• “Tangible shareholders’ equity” is shareholders’ equity reduced by recorded goodwill and other intangible assets
• “Tangible assets” are total assets reduced by recorded goodwill and other intangible assets.
• “Tangible book value per common share” is defined as total equity reduced by recorded goodwill, other intangible assets and preferred stock divided by total common shares outstanding. This measure discloses changes from period-to-period in book value per share exclusive of changes in intangible assets and preferred stock. Goodwill, an intangible asset that is recorded in a purchase
business combination, has the effect of increasing total book value while not increasing the tangible assets of a company.
Companies utilizing purchase accounting in a business combination, as required by GAAP, must record goodwill related to
such transactions.
• “Core net income before tax” is defined as income (loss), before income taxes, adjusted by noninterest income items and
noninterest expense items which are nonrecurring in nature.
• “Core income tax expense” is defined as income taxes, adjusted by tax related items which are nonrecurring in nature.
• “Core net income” is defined as core net income before tax less core income tax expense.
• “Core return on average assets” is defined as annualized core net income divided by total average assets
• “Core net income per share” is defined as core net income divided by average diluted shares outstanding for the period.
• “Core noninterest income” (“NII”) is defined as total noninterest income reduced by items which are nonrecurring in
nature.
• “Core noninterest expense” (“Core NIE”) is defined as total noninterest expense reduced by noninterest expense items which
are nonrecurring in nature.
• “PCNR noninterest expense” (“PCNR NIE”) is defined as total noninterest expense reduced by credit-related and
nonrecurring noninterest expense. This measure reduces noninterest expense by items which are elevated during periods of
problem asset activity and items which are nonrecurring in nature.
49
The following reconciliation table provides a more detailed analysis of certain of these non-GAAP measures.
Table 20
Non-GAAP Measures
| (dollars in thousands, except per share data) | At and for the Year Ended December 31, | |||||||||||||||||||
| 2015 | 2014 | 2013 | 2012 | 2011 | ||||||||||||||||
| Total average shareholders’ equity | $ | 271,821 | $ | 91,151 | $ | 85,576 | $ | 114,684 | $ | (22,809 | ) | |||||||||
| Less: | ||||||||||||||||||||
| Average goodwill | (4,205 | ) | (4,205 | ) | (4,205 | ) | (4,130 | ) | (574 | ) | ||||||||||
| Average core deposit and other intangibles | (5,327 | ) | (6,271 | ) | (7,207 | ) | (8,221 | ) | (8,676 | ) | ||||||||||
| Average tangible shareholders’ equity (non-GAAP) | $ | 262,289 | $ | 80,675 | $ | 74,164 | $ | 102,333 | $ | (32,059 | ) | |||||||||
| Total average assets | $ | 2,290,090 | $ | 2,005,948 | $ | 2,047,146 | $ | 2,291,541 | $ | 1,911,943 | ||||||||||
| Less: | ||||||||||||||||||||
| Average goodwill | (4,205 | ) | (4,205 | ) | (4,205 | ) | (4,130 | ) | (574 | ) | ||||||||||
| Average core deposit and other intangibles | (5,327 | ) | (6,271 | ) | (7,207 | ) | (8,221 | ) | (8,676 | ) | ||||||||||
| Average tangible assets (non-GAAP) | $ | 2,280,558 | $ | 1,995,472 | $ | 2,035,734 | $ | 2,279,190 | $ | 1,902,693 | ||||||||||
| Total shareholders’ equity | $ | 273,038 | $ | 266,916 | $ | 80,361 | $ | 98,445 | $ | 129,015 | ||||||||||
| Less: | ||||||||||||||||||||
| Goodwill | (4,205 | ) | (4,205 | ) | (4,205 | ) | (4,205 | ) | (3,905 | ) | ||||||||||
| Core deposit and other intangibles | (5,208 | ) | (5,681 | ) | (6,914 | ) | (7,495 | ) | (8,177 | ) | ||||||||||
| Tangible shareholders’ equity (non-GAAP) | $ | 263,625 | $ | 257,030 | $ | 69,242 | $ | 86,745 | $ | 116,933 | ||||||||||
| Total assets | $ | 2,397,265 | $ | 2,215,514 | $ | 1,985,032 | $ | 2,151,565 | $ | 2,409,108 | ||||||||||
| Less: | ||||||||||||||||||||
| Goodwill | (4,205 | ) | (4,205 | ) | (4,205 | ) | (4,205 | ) | (3,905 | ) | ||||||||||
| Core deposit and other intangibles | (5,208 | ) | (5,681 | ) | (6,914 | ) | (7,495 | ) | (8,177 | ) | ||||||||||
| Tangible assets (non-GAAP) | $ | 2,387,852 | $ | 2,205,628 | $ | 1,973,913 | $ | 2,139,865 | $ | 2,397,026 | ||||||||||
| Book value per common share | $ | 11.24 | $ | 11.04 | $ | 3.68 | $ | 4.54 | $ | 6.11 | ||||||||||
| Less effect of intangible assets | (0.39 | ) | (0.41 | ) | (0.51 | ) | (0.54 | ) | (0.57 | ) | ||||||||||
| Tangible book value per common share (non-GAAP) | $ | 10.85 | $ | 10.63 | $ | 3.17 | $ | 4.00 | $ | 5.54 | ||||||||||
50
| (dollars in thousands) | For the Year Ended December 31, | |||||||||||||||||||
| 2015 | 2014 | 2013 | 2012 | 2011 | ||||||||||||||||
| Income (Loss) from continuing operations before income taxes | $ | 14,038 | $ | 7,966 | $ | (157 | ) | $ | (41,017 | ) | $ | (130,877 | ) | |||||||
| Less nonrecurring: | ||||||||||||||||||||
| US Treasury sale expenses | — | (409 | ) | — | — | — | ||||||||||||||
| Securities gain, net | — | 974 | 2,772 | 4,121 | 7,298 | |||||||||||||||
| Executive severance | — | (2,060 | ) | — | — | — | ||||||||||||||
| RSA acceleration | (1,142 | ) | — | — | — | — | ||||||||||||||
| Merger-related expense | (1,986 | ) | — | (3,498 | ) | (3,241 | ) | (1,236 | ) | |||||||||||
| Mortgage and litigation accruals | — | 68 | 487 | (1,100 | ) | — | ||||||||||||||
| Rebranding | — | — | (616 | ) | (397 | ) | — | |||||||||||||
| Branch closure and restructuring expenses | — | (1,756 | ) | (675 | ) | (96 | ) | — | ||||||||||||
| Bargain purchase gain | 316 | — | — | — | — | |||||||||||||||
| Loss on sale of loans held for sale | — | — | — | — | (1,241 | ) | ||||||||||||||
| Gain on extinguishment of debt | — | — | — | — | 1,625 | |||||||||||||||
| Net loss on fair value swap | (339 | ) | ||||||||||||||||||
| Prepayment penalty on borrowings | — | — | — | — | (1,605 | ) | ||||||||||||||
| Core net income before tax (non-GAAP) | 16,850 | 11,149 | 1,373 | (40,304 | ) | (135,379 | ) | |||||||||||||
| Income tax expense (benefit) | $ | 7,124 | $ | (142,492 | ) | $ | 1,326 | $ | (1,039 | ) | $ | 641 | ||||||||
| Less nonrecurring tax items and adjustments: | ||||||||||||||||||||
Tax effect of nonrecurring items (1) | (651 | ) | (1,051 | ) | (505 | ) | (235 | ) | 525 | |||||||||||
| DTA valuation allowance release and revaluation | 1,607 | (142,492 | ) | 1,326 | (1,039 | ) | 641 | |||||||||||||
Income tax at effective rate (2) | — | (2,629 | ) | 52 | 13,536 | 43,189 | ||||||||||||||
| Core income tax expense (non-GAAP) | 6,168 | 3,680 | 453 | (13,301 | ) | (43,714 | ) | |||||||||||||
| Core net income (non-GAAP) | $ | 10,682 | $ | 7,469 | $ | 920 | $ | (27,003 | ) | $ | (91,665 | ) | ||||||||
| Return on average assets | 0.30 | % | 7.50 | % | (0.07 | )% | (1.75 | )% | (4.85 | )% | ||||||||||
| Effect of adjustments to arrive at core net income | 0.17 | % | (7.13 | )% | 0.11 | % | 0.57 | % | 0.21 | % | ||||||||||
| Core return on average assets (non-GAAP) | 0.47 | % | 0.37 | % | 0.04 | % | (1.18 | )% | (4.64 | )% | ||||||||||
| Net income per share - diluted | $ | 0.29 | $ | 6.88 | $ | (0.07 | ) | $ | (1.87 | ) | $ | (22.09 | ) | |||||||
| Effect of adjustments to arrive at core net income | $ | 0.15 | $ | (6.54 | ) | $ | 0.11 | $ | 0.61 | $ | 0.25 | |||||||||
| Core net income per share - diluted (non-GAAP) | $ | 0.44 | $ | 0.34 | $ | 0.04 | $ | (1.26 | ) | $ | (21.84 | ) | ||||||||
(1) Tax effected at an income tax rate of 33% in 2011-2014 and 36% in 2015. Nonrecurring items in 2015 includes $1.0 million of non-deductible expenses.
(2) Projected income tax expense at 33%. In 2011-2014 all tax items resulted in changes to the DTA valuation allowance.
51
| For the Year Ended December 31, | ||||||||||||||||||||
| (dollars in thousands) | 2015 | 2014 | 2013 | 2012 | 2011 | |||||||||||||||
| Total noninterest income | $ | 18,170 | $ | 17,364 | $ | 20,414 | $ | 21,958 | $ | 21,970 | ||||||||||
| Less nonrecurring items: | ||||||||||||||||||||
| Bargain purchase gain | 316 | — | — | — | — | |||||||||||||||
| Gain on extinguishment of debt | — | — | — | — | 1,625 | |||||||||||||||
| Securities gains, net | — | 974 | 2,772 | 4,121 | 7,298 | |||||||||||||||
| Core noninterest income (non-GAAP) | $ | 17,854 | $ | 16,390 | $ | 17,642 | $ | 17,837 | $ | 13,047 | ||||||||||
| Total noninterest expense | $ | 75,488 | $ | 78,535 | $ | 84,481 | $ | 110,206 | $ | 125,040 | ||||||||||
| Less nonrecurring items: | ||||||||||||||||||||
| Branch closure and restructuring expense | — | 1,756 | 675 | 96 | — | |||||||||||||||
| Rebranding | — | — | 616 | 397 | — | |||||||||||||||
| RSA acceleration | 1,142 | — | — | — | — | |||||||||||||||
| Merger-related expense | 1,986 | — | 3,498 | 3,241 | 1,236 | |||||||||||||||
| Mortgage and litigation accrual | — | (68 | ) | (487 | ) | 1,100 | — | |||||||||||||
| Executive severance expense | — | 2,060 | — | — | — | |||||||||||||||
| Loss on sale of loans held for sale | — | — | — | — | 1,241 | |||||||||||||||
| Prepayment penalty on borrowings | — | — | — | — | 1,605 | |||||||||||||||
| U.S. Treasury sale expenses | — | 409 | — | — | — | |||||||||||||||
| Core noninterest expense (non-GAAP) | 72,360 | 74,378 | 80,179 | 105,372 | 120,958 | |||||||||||||||
| Less credit related: | ||||||||||||||||||||
| Other real estate owned expense | 2,311 | 1,758 | 4,138 | 27,883 | 51,424 | |||||||||||||||
| Loan collection expense | 669 | 1,576 | 4,333 | 3,274 | 5,032 | |||||||||||||||
| PCNR noninterest expense (non-GAAP) | $ | 69,380 | $ | 71,044 | $ | 71,708 | $ | 74,215 | $ | 64,502 | ||||||||||
Application of Critical Accounting Policies
COB's accounting policies are in accordance with GAAP and with general practice within the banking industry and are fundamental to understanding management's discussion and analysis of results of operations and financial condition. Our significant accounting policies are discussed in detail in Note 1 of the consolidated financial statements.
Material estimates that are particularly susceptible to significant change in the near term relate to the determination of the allowance for loan losses, valuation of OREO, carrying value of investment securities, business combinations, purchased loan accounting and treatment of deferred tax assets.
Allowance for Loan Losses
The ALL, which is utilized to absorb actual losses in the loan portfolio, is maintained at a level consistent with management's best estimate of probable loan losses incurred as of the balance sheet date. COB's ALL is assessed quarterly by management. This assessment includes a methodology that separates the total loan portfolio into homogeneous loan classifications for purposes of evaluating risk. The required allowance is calculated by applying a risk adjusted reserve requirement to the dollar volume of loans within a homogenous group. COB has grouped its loans into pools according to the loan segmentation regime employed on schedule RC-C of the FFIEC's Consolidated Report of Condition and Income. Management analyzes the loan portfolio including purchased contractual (“PC”) loans on an ongoing basis to evaluate current risk levels, and risk grades are adjusted accordingly. While management uses the best information available to make evaluations, future adjustments may be necessary, if economic or other conditions differ substantially from the assumptions used. See additional discussion under Asset Quality.
Valuation of Other Real Estate Owned
Other real estate owned represents properties acquired through foreclosure or deed in lieu thereof. The property is classified as held for sale and is carried at fair value based on recent appraisals, less estimated costs to sell. Declines in the fair value of properties
52
included in other real estate below carrying value are recognized by a charge to income. An increase in fair value is not recognized until the property is sold.
Carrying Value of Securities
Securities designated as available-for-sale are carried at fair value. However, the unrealized difference between amortized cost and fair value of securities available-for-sale is excluded from net income unless there is an other than temporary impairment and is reported, net of deferred taxes, as a component of shareholders' equity as accumulated other comprehensive income (loss). Securities held-to-maturity are carried at amortized cost, as the bank has the ability, and management has the positive intent, to hold these securities to maturity. Premiums and discounts on securities are amortized and accreted according to the interest method.
Purchased Loan Accounting
Purchased impaired (“PI”) loans are recorded at fair value at acquisition date. Therefore, amounts deemed uncollectible at acquisition date become part of the fair value determination and are excluded from the allowance for loan and lease losses. Following acquisition, we periodically review PI loans to determine if changes in estimated cash flows have occurred. Subsequent decreases in the amount expected to be collected result in a provision for loan losses with a corresponding increase in the allowance for loan losses, or a prospective decrease in yield when there is only a timing difference in expected cash flows. Subsequent increases in the amount expected to be collected result in a reversal of any previously recorded provision for loan losses and related allowance for loan losses, if any, or prospective adjustment to the accretable yield if no provision for loan losses had been recorded.
Treatment of Deferred Tax Assets
Management regularly evaluates the likelihood that the Company will be able to realize its deferred tax assets and the need for a valuation allowance. In 2013 and prior years management determined that sufficient evidence was not available to conclude that it was more likely than not that all of its deferred tax assets could be realized, requiring a valuation allowance for certain of its deferred tax assets. At December 31, 2014 management determined, based on all available positive and negative evidence, that it was more likely than not that future taxable income would be available during the carryforward periods to absorb all of the consolidated federal net operating loss carryforward and all but a small portion of the Bank’s North Carolina net economic loss carryforward. As a result of this determination, $142.5 million of valuation allowance against the Company's deferred tax assets was reversed. A number of factors played a critical role in this determination, including:
| • | Improvements in the asset quality of the loan portfolio and diminishment of credit-related losses that were the source of the Company's losses; |
| • | Implementation of strong internal controls making it unlikely that the large volume of troubled loans leading to the Company’s losses between 2008 and 2012 will reoccur; |
| • | The increased remoteness and diminished relevance of such losses; |
| • | Continued improvement of the Company’s financial metrics and six consecutive quarters of earnings; |
| • | A credible forecast of future taxable income based on management’s demonstrated forecasting accuracy; |
| • | Various cost-reduction initiatives that will have a continuing positive effect on earnings in future periods; |
| • | Availability of tax planning strategies; and |
| • | Long-dated carryforward periods. |
Our analysis as of December 31, 2015 continues to support the position that future taxable income will be available during the
carryforward periods to absorb all of the consolidated federal net operating loss carryforward and all of our North Carolina net economic loss carryforward. As of December 31, 2015 and December 31, 2014 net deferred income tax assets totaling $141.7 million and $146.4 million, respectively, are recorded on the Company’s balance sheet.
On July 23, 2013, the State of North Carolina lowered the North Carolina corporate income tax rate from 6.9% to 6% effective 2014
and to 5% effective 2015. On July 28, 2015, North Carolina announced that, based on the state achieving its 2015 tax year revenue
target, the rate would be reduced to 4% during the 2016 tax year. The rate will be further reduced to 3% for post-2016 tax years
provided that additional revenue growth targets are reached. The rate reduction trigger to 4% resulted in a $2.3 million reduction in deferred income tax asset in 2015. The Company recorded the impact of this legislation as a reduction in deferred income tax asset as of September 30, 2015 and a charge to income tax expense in the third quarter of 2015.
The Granite Merger resulted in an ownership change for Granite under Internal Revenue Code Section 382 and the Regulations thereunder. Accordingly, the Company was required to apply a limitation against Granite Corp.’s pre-acquisition net operating loss carryforwards and net unrealized built-in losses. During 2013 COB determined that it would be able to use only $2.9 million of the Granite net operating loss carryforwards and built in losses and reduced both its deferred tax asset and related valuation allowance by $28.3 million.
53
Summary
Management believes the accounting estimates related to the ALL, the valuation of OREO, the carrying value of securities, purchased loan accounting, and the treatment of deferred tax assets are “critical accounting estimates” because: (1) the estimates are highly susceptible to change from period to period as they require management to make assumptions concerning the changes in the types and volumes of the portfolios, the timing and amount of cash flows and anticipated economic conditions, and (2) the impact of recognizing an impairment or loan loss could have a material effect on the COB's assets reported on the balance sheet as well as its net earnings.
| Item 7A. | QUANTITATIVE AND QUALITATIVE DISCLOSURES ABOUT MARKET RISK |
The objective of COB’s asset/liability management function is long-term maximization of net interest income within COB risk guidelines. This objective is accomplished through management of our balance sheet composition, liquidity, and interest rate risk exposures arising from changing economic conditions, interest rates and customer preferences.
The goal of liquidity management is to provide adequate funds to meet changes in loan demand or unexpected deposit withdrawals. This is accomplished by maintaining liquid assets in the form of investment securities, maintaining sufficient unused borrowing capacity and achieving consistent growth in core deposits.
Management considers interest rate risk COB’s most significant market risk. Interest rate risk is the exposure to adverse changes in net interest income due to changes in interest rates. Consistency of our net interest income is largely dependent upon the effective management of interest rate risk.
To identify and manage its interest rate risk, we employ an earnings simulation model to analyze net interest income sensitivity to changing interest rates. The model is based on contractual cash flows and repricing characteristics and incorporates market-based assumptions regarding the effect of changing interest rates on the prepayment rates of certain assets and liabilities. The model also includes management projections for activity levels in each of the product lines offered by the Bank. Assumptions are inherently uncertain and the measurement of net interest income or the impact of rate fluctuations on net interest income cannot be precisely predicted. Actual results may differ from simulated results due to timing, magnitude, and frequency of interest changes as well as changes in market conditions and management strategies.
COB’s Asset/Liability Management Committee (“ALCO”), which includes senior management representatives and reports to the Board of Directors, monitors and manages interest rate risk. The banks’ current interest rate risk position is determined by measuring the anticipated change in net interest income over a 24-month horizon assuming a ramped increase or decrease in all interest rates equally over the 24 month time horizon. The following table shows COB’s estimated net interest income profile for the 12-month period beginning December 31, 2015.
| Changes in Interest Rates (basis points) | Percentage Change in Net Interest Income – 12 Months |
| +200 | 1.41% |
| +100 | 0.74% |
| -100 | -1.82% |
ALCO also monitors the sensitivity of COB’s economic value of equity (“EVE”) due to sudden and sustained changes in market rates. The EVE ratio, measured on a static basis at the current period end, is calculated by dividing the economic value of equity by the economic value of total assets. ALCO monitors the change in EVE on a percentage change basis.
The following table estimates changes in EVE for given changes in interest rates as of December 31, 2015.
| Change in Interest Rates (basis points) | Percentage Change in EVE |
| +200 | -4.42% |
| +100 | -1.63% |
| -100 | 0.76% |
We are in compliance with our internal policy on both changes in net interest income and on changes to EVE as of December 31, 2015. We consider our risks to changes in interest rates to be moderate.
54
| Item 8. | FINANCIAL STATEMENTS AND SUPPLEMENTARY DATA |
QUARTERLY FINANCIAL INFORMATION
The following table sets forth, for the periods indicated, certain of our consolidated quarterly financial information. This information is derived from our unaudited financial statements, which include, in the opinion of management, all normal recurring adjustments which management considers necessary for a fair presentation of the results for such periods. This information should be read in conjunction with our consolidated financial statements included elsewhere in this report. The results for any quarter are not necessarily indicative of results for any future period.
Quarterly Financials
| (dollars in thousands, except per share data) | 2015 | |||||||||||||||
| 4th Qtr | 3rd Qtr | 2nd Qtr | 1st Qtr | |||||||||||||
| Interest income | $ | 20,132 | $ | 19,830 | $ | 19,330 | $ | 19,268 | ||||||||
| Interest expense | 2,668 | 2,520 | 2,503 | 2,494 | ||||||||||||
| Net interest income | 17,464 | 17,310 | 16,827 | 16,774 | ||||||||||||
| Recovery of loan losses | (992 | ) | (64 | ) | (788 | ) | (1,137 | ) | ||||||||
| Net interest income after provision for loan losses | 18,456 | 17,374 | 17,615 | 17,911 | ||||||||||||
| Noninterest income | 4,982 | 5,000 | 4,154 | 4,034 | ||||||||||||
| Noninterest expense | 22,226 | 17,427 | 17,827 | 18,008 | ||||||||||||
| Income before income taxes | 1,212 | 4,947 | 3,942 | 3,937 | ||||||||||||
| Income tax expense | 857 | 3,430 | 1,419 | 1,418 | ||||||||||||
| Net income | $ | 355 | $ | 1,517 | $ | 2,523 | $ | 2,519 | ||||||||
| Net income per share - basic and diluted | $ | 0.02 | $ | 0.06 | $ | 0.10 | $ | 0.10 | ||||||||
| 2014 | ||||||||||||||||
| 4th Qtr | 3rd Qtr | 2nd Qtr | 1st Qtr | |||||||||||||
| Interest income | $ | 19,271 | $ | 18,395 | $ | 18,263 | $ | 17,927 | ||||||||
| Interest expense | 2,550 | 2,547 | 2,545 | 2,448 | ||||||||||||
| Net interest income | 16,721 | 15,848 | 15,718 | 15,479 | ||||||||||||
| Recovery of loan losses | (1,323 | ) | (1,679 | ) | (1,685 | ) | (684 | ) | ||||||||
| Net interest income after provision for loan losses | 18,044 | 17,527 | 17,403 | 16,163 | ||||||||||||
| Noninterest income | 4,543 | 3,985 | 4,893 | 3,943 | ||||||||||||
| Noninterest expense | 20,446 | 20,015 | 19,268 | 18,806 | ||||||||||||
| Income before income taxes | 2,141 | 1,497 | 3,028 | 1,300 | ||||||||||||
| Income tax expense (benefit) | (142,475 | ) | (276 | ) | 236 | 23 | ||||||||||
| Net income | $ | 144,616 | $ | 1,773 | $ | 2,792 | $ | 1,277 | ||||||||
| Net income per share - basic and diluted | $ | 6.62 | $ | 0.08 | $ | 0.13 | $ | 0.06 | ||||||||
55

Report of Independent Registered Public Accounting Firm
To the Shareholders and the Board of Directors
CommunityOne Bancorp and Subsidiaries
Charlotte, North Carolina
We have audited the accompanying consolidated balance sheets of CommunityOne Bancorp and Subsidiaries (the “Company”) as of December 31, 2015 and 2014, and the related consolidated statements of operations, comprehensive income (loss), shareholders’ equity and cash flows for each of the years in the three-year period ended December 31, 2015. These consolidated financial statements are the responsibility of the Company’s management. Our responsibility is to express an opinion on these consolidated financial statements based on our audits.
We conducted our audits in accordance with the standards of the Public Company Accounting Oversight Board (United States). Those standards require that we plan and perform the audit to obtain reasonable assurance about whether the financial statements are free of material misstatement. An audit includes examining, on a test basis, evidence supporting the amounts and disclosures in the financial statements. An audit also includes assessing the accounting principles used and significant estimates made by management, as well as evaluating the overall financial statement presentation. We believe that our audits provide a reasonable basis for our opinion.
In our opinion, the consolidated financial statements referred to above present fairly, in all material respects, the financial position of CommunityOne Bancorp and Subsidiaries as of December 31, 2015 and 2014 and the results of their operations and their cash flows for each of the years in the three-year period ended December 31, 2015, in conformity with accounting principles generally accepted in the United States of America.
We have also audited, in accordance with the standards of the Public Company Accounting Oversight Board (United States), CommunityOne Bancorp and Subsidiaries’ internal control over financial reporting as of December 31, 2015, based on criteria established in Internal Control - Integrated Framework (2013) issued by the Committee of Sponsoring Organizations of the Treadway Commission, and our report dated March 11, 2016 expressed an unqualified opinion on the effectiveness of the Company’s internal control over financial reporting.
/s/ Dixon Hughes Goodman LLP
Charlotte, North Carolina
March 11, 2016
56
REPORT OF INDEPENDENT REGISTERED PUBLIC ACCOUNTING FIRM
To the Shareholders and the Board of Directors
CommunityOne Bancorp and Subsidiaries
Charlotte, North Carolina
We have audited CommunityOne Bancorp and Subsidiaries (the “Company”)’s internal control over financial reporting as of December 31, 2015, based on criteria established in Internal Control-Integrated Framework (2013) issued by the Committee of Sponsoring Organizations of the Treadway Commission. The Company’s management is responsible for maintaining effective internal control over financial reporting and for its assessment of the effectiveness of internal control over financial reporting, included in the accompanying Management’s Annual Report on Internal Control Over Financial Reporting. Our responsibility is to express an opinion on the Company's internal control over financial reporting based on our audit.
We conducted our audit in accordance with the standards of the Public Company Accounting Oversight Board (United States). Those standards require that we plan and perform the audit to obtain reasonable assurance about whether effective internal control over financial reporting was maintained in all material respects. Our audit included obtaining an understanding of internal control over financial reporting, assessing the risk that a material weakness exists, and testing and evaluating the design and operating effectiveness of internal control based on the assessed risk. Our audit also included performing such other procedures as we considered necessary in the circumstances. We believe that our audit provides a reasonable basis for our opinion.
A company's internal control over financial reporting is a process designed to provide reasonable assurance regarding the reliability of financial reporting and the preparation of financial statements for external purposes in accordance with generally accepted accounting principles. A company's internal control over financial reporting includes those policies and procedures that (1) pertain to the maintenance of records that, in reasonable detail, accurately and fairly reflect the transactions and dispositions of the assets of the company; (2) provide reasonable assurance that transactions are recorded as necessary to permit preparation of financial statements in accordance with generally accepted accounting principles, and that receipts and expenditures of the company are being made only in accordance with authorizations of management and directors of the company; and (3) provide reasonable assurance regarding prevention or timely detection of unauthorized acquisition, use, or disposition of the company's assets that could have a material effect on the financial statements.
Because of its inherent limitations, internal control over financial reporting may not prevent or detect misstatements. Also, projections of any evaluation of effectiveness to future periods are subject to the risk that controls may become inadequate because of changes in conditions, or that the degree of compliance with the policies or procedures may deteriorate.
In our opinion, CommunityOne Bancorp and Subsidiaries maintained, in all material respects, effective internal control over financial reporting as of December 31, 2015, based on criteria established in Internal Control-Integrated Framework (2013) issued by the Committee of Sponsoring Organizations of the Treadway Commission.
We also have audited, in accordance with the standards of the Public Company Accounting Oversight Board (United States), the consolidated financial statements of CommunityOne Bancorp and Subsidiaries as of December 31, 2015, and 2014 and for each of the years in the three year period ended December 31, 2015, and our report dated March 11, 2016, expressed an unqualified opinion on those consolidated financial statements.
/s/ Dixon Hughes Goodman LLP
Charlotte, North Carolina
March 11, 2016
57
CommunityOne Bancorp and Subsidiaries
Consolidated Balance Sheets
| (in thousands, except share and per share data) | December 31, 2015 | December 31, 2014 | ||||||
| Assets | ||||||||
| Cash and due from banks | $ | 23,852 | $ | 29,202 | ||||
| Interest-bearing bank balances | 15,323 | 66,680 | ||||||
| Investment securities: | ||||||||
| Available-for-sale, at estimated fair value (amortized cost of $398,815 in 2015 and $354,924 in 2014) | 390,434 | 350,040 | ||||||
| Held-to-maturity (estimated fair value of $145,185 in 2015 and $140,875 in 2014) | 147,967 | 142,461 | ||||||
| Loans held for sale | 5,403 | 2,796 | ||||||
| Loans held for investment | 1,543,795 | 1,357,788 | ||||||
| Less: Allowance for loan losses | (15,195 | ) | (20,345 | ) | ||||
| Net loans held for investment | 1,528,600 | 1,337,443 | ||||||
| Premises and equipment, net | 44,457 | 46,782 | ||||||
| Other real estate owned and property acquired in settlement of loans | 16,583 | 20,411 | ||||||
| Core deposit premiums and other intangibles | 5,208 | 5,681 | ||||||
| Goodwill | 4,205 | 4,205 | ||||||
| Bank-owned life insurance | 40,869 | 39,946 | ||||||
| Deferred tax assets, net | 141,716 | 146,433 | ||||||
| Other assets | 32,648 | 23,434 | ||||||
| Total Assets | $ | 2,397,265 | $ | 2,215,514 | ||||
| Liabilities | ||||||||
| Deposits: | ||||||||
| Noninterest-bearing demand deposits | $ | 386,329 | $ | 323,776 | ||||
| Interest-bearing deposits: | ||||||||
| Demand, savings and money market deposits | 939,878 | 882,332 | ||||||
| Time deposits of $250 or more | 60,093 | 49,967 | ||||||
| Other time deposits | 561,237 | 538,345 | ||||||
| Total deposits | 1,947,537 | 1,794,420 | ||||||
| Retail repurchase agreements | 7,219 | 9,076 | ||||||
| Federal Home Loan Bank advances | 93,681 | 68,234 | ||||||
| Long-term notes payable | 5,415 | 5,338 | ||||||
| Junior subordinated debentures | 56,702 | 56,702 | ||||||
| Other liabilities | 13,673 | 14,828 | ||||||
| Total Liabilities | 2,124,227 | 1,948,598 | ||||||
| Shareholders' Equity | ||||||||
| Preferred stock, 10,000,000 shares authorized | ||||||||
| Series A, $10.00 par value; 51,500 shares issued and no shares outstanding in 2015 and 2014 | — | — | ||||||
| Series B, no par value; authorized 250,000 shares, no shares issued and outstanding in 2015 and 2014 | — | — | ||||||
| Common stock, no par value; authorized 2,500,000,000 shares, issued 24,292,646 in 2015 and 24,185,923 shares in 2014 | 490,075 | 487,603 | ||||||
| Accumulated deficit | (206,298 | ) | (213,212 | ) | ||||
| Accumulated other comprehensive loss | (10,739 | ) | (7,475 | ) | ||||
| Total Shareholders' Equity | 273,038 | 266,916 | ||||||
| Total Liabilities and Shareholders' Equity | $ | 2,397,265 | $ | 2,215,514 | ||||
See accompanying notes to consolidated financial statements.
58
CommunityOne Bancorp and Subsidiaries
Consolidated Statements of Operations
| (in thousands, except share and per share data) | Years Ended December 31, | |||||||||||
| 2015 | 2014 | 2013 | ||||||||||
| Interest Income | ||||||||||||
| Interest and fees on loans | $ | 64,868 | $ | 59,183 | $ | 60,147 | ||||||
| Interest and dividends on investment securities | 12,865 | 14,068 | 14,180 | |||||||||
| Other interest income | 827 | 605 | 665 | |||||||||
| Total interest income | 78,560 | 73,856 | 74,992 | |||||||||
| Interest Expense | ||||||||||||
| Deposits | 7,065 | 6,909 | 8,070 | |||||||||
| Retail repurchase agreements | 22 | 16 | 21 | |||||||||
| Federal Home Loan Bank advances | 1,963 | 2,020 | 1,376 | |||||||||
| Other borrowed funds | 1,135 | 1,145 | 1,092 | |||||||||
| Total interest expense | 10,185 | 10,090 | 10,559 | |||||||||
| Net Interest Income before Provision for Loan Losses | 68,375 | 63,766 | 64,433 | |||||||||
| Provision for (Recovery of) loan losses | (2,981 | ) | (5,371 | ) | 523 | |||||||
| Net Interest Income after Provision for Loan Losses | 71,356 | 69,137 | 63,910 | |||||||||
| Noninterest Income | ||||||||||||
| Service charges on deposit accounts | 6,331 | 6,351 | 6,714 | |||||||||
| Mortgage loan income | 1,599 | 881 | 2,319 | |||||||||
| Cardholder and merchant services income | 4,981 | 4,803 | 4,531 | |||||||||
| Trust and investment services | 1,517 | 1,495 | 1,305 | |||||||||
| Bank-owned life insurance | 1,167 | 1,153 | 1,073 | |||||||||
| Other service charges, commissions and fees | 1,753 | 1,340 | 1,315 | |||||||||
| Securities gains, net | — | 974 | 2,772 | |||||||||
| Other income | 822 | 367 | 385 | |||||||||
| Total noninterest income | 18,170 | 17,364 | 20,414 | |||||||||
| Noninterest Expense | ||||||||||||
| Personnel expense | 43,807 | 43,682 | 40,661 | |||||||||
| Net occupancy expense | 5,680 | 6,112 | 6,391 | |||||||||
| Furniture, equipment and data processing expense | 7,994 | 8,336 | 8,638 | |||||||||
| Professional fees | 2,128 | 2,470 | 3,100 | |||||||||
| Stationery, printing and supplies | 618 | 646 | 644 | |||||||||
| Advertising and marketing | 546 | 716 | 1,135 | |||||||||
| Other real estate owned expense | 2,311 | 1,758 | 4,138 | |||||||||
| Credit/debit card expense | 2,048 | 2,287 | 2,143 | |||||||||
| FDIC insurance | 1,749 | 2,068 | 2,643 | |||||||||
| Loan collection expense | 669 | 1,576 | 4,333 | |||||||||
| Merger-related expense | 1,986 | — | 3,498 | |||||||||
| Core deposit intangible amortization | 1,422 | 1,408 | 1,407 | |||||||||
| Other expense | 4,530 | 7,476 | 5,750 | |||||||||
| Total noninterest expense | 75,488 | 78,535 | 84,481 | |||||||||
| Income (Loss), before income taxes | 14,038 | 7,966 | (157 | ) | ||||||||
| Income tax expense (benefit) | 7,124 | (142,492 | ) | 1,326 | ||||||||
| Net income (loss) | $ | 6,914 | $ | 150,458 | (1,483 | ) | ||||||
| Weighted average number of shares outstanding - basic | 24,236,147 | 21,852,023 | 21,731,030 | |||||||||
| Weighted average number of shares outstanding - diluted | 24,251,604 | 21,864,320 | 21,731,030 | |||||||||
| Net income (loss) per share - basic | $ | 0.29 | $ | 6.89 | $ | (0.07 | ) | |||||
| Net income (loss) per share - diluted | 0.29 | 6.88 | (0.07 | ) | ||||||||
See accompanying notes to consolidated financial statements.
59
CommunityOne Bancorp and Subsidiaries
Consolidated Statements of Comprehensive Income (Loss)
| (dollars in thousands) | Years Ended December 31, | |||||||||||
| 2015 | 2014 | 2013 | ||||||||||
| Net income (loss) | $ | 6,914 | $ | 150,458 | $ | (1,483 | ) | |||||
| Other comprehensive income (loss): | ||||||||||||
| Unrealized holdings gains (losses) arising during the period on available-for-sale securities | (3,496 | ) | 19,530 | (26,703 | ) | |||||||
| Tax effect | 1,337 | (7,470 | ) | 10,256 | ||||||||
| Unrealized holdings gains (losses) arising during the period on available-for-sale securities, net of tax | (2,159 | ) | 12,060 | (16,447 | ) | |||||||
| Reclassification adjustment for gain on available-for-sale securities included in net income (loss) | — | (974 | ) | (2,772 | ) | |||||||
| Tax effect | — | 373 | 1,093 | |||||||||
| Reclassification adjustment for gain on available-for-sale securities included in net income (loss), net of tax | — | (601 | ) | (1,679 | ) | |||||||
| Unrealized loss on interest rate swaps | (241 | ) | (537 | ) | — | |||||||
| Tax effect | 92 | 206 | — | |||||||||
| Unrealized loss on interest rate swaps, net of tax | (149 | ) | (331 | ) | — | |||||||
| Reclassification adjustment for loss on interest rate swaps included in net income (loss) | 12 | 12 | — | |||||||||
| Tax effect | (5 | ) | (5 | ) | — | |||||||
| Reclassification adjustment for loss on interest rate swaps included in net income, net of tax | 7 | 7 | — | |||||||||
| Reclassification adjustment for net actuarial gain (amortization) on pension and post retirement liability | 622 | 382 | (302 | ) | ||||||||
| Tax effect | (238 | ) | (146 | ) | 115 | |||||||
| Net actuarial gain (amortization) on pension and post retirement liability, net of tax | 384 | 236 | (187 | ) | ||||||||
| Change in pension and post retirement liability | (2,181 | ) | (2,010 | ) | 1,690 | |||||||
| Tax effect | 834 | 769 | (659 | ) | ||||||||
| Change in pension and post-retirement liability, net of tax | (1,347 | ) | (1,241 | ) | 1,031 | |||||||
| Other comprehensive income (loss), net of tax | (3,264 | ) | 10,130 | (17,282 | ) | |||||||
| Comprehensive income (loss) | $ | 3,650 | $ | 160,588 | $ | (18,765 | ) | |||||
See accompanying notes to consolidated financial statements.
60
CommunityOne Bancorp and Subsidiaries
Consolidated Statements of Shareholders’ Equity
| Accumulated | ||||||||||||||||||||||||||||||
| (dollars in thousands, except share and per share data) | Common | Other | ||||||||||||||||||||||||||||
| Preferred Stock | Common Stock | Stock | Accumulated | Comprehensive | ||||||||||||||||||||||||||
| Shares | Amount | Shares | Amount | Warrant | Deficit | Income (Loss) | Total | |||||||||||||||||||||||
| Balance, December 31, 2012 | — | $ | — | 21,698,115 | $ | 460,955 | $ | — | $ | (362,187 | ) | $ | (323 | ) | $ | 98,445 | ||||||||||||||
| Comprehensive income (loss): | ||||||||||||||||||||||||||||||
| Net loss | — | — | — | — | — | (1,483 | ) | — | (1,483 | ) | ||||||||||||||||||||
| Other comprehensive loss, net of tax | — | — | — | — | — | — | (17,282 | ) | (17,282 | ) | ||||||||||||||||||||
| Total comprehensive loss | (18,765 | ) | ||||||||||||||||||||||||||||
| Stock options and awards: | ||||||||||||||||||||||||||||||
| Compensation expense recognized | — | — | — | 628 | — | — | — | 628 | ||||||||||||||||||||||
| Shares issued as compensation to directors | — | — | 5,001 | 53 | — | — | — | 53 | ||||||||||||||||||||||
| Restricted stock awards issued to employees | — | — | 158,302 | — | — | — | — | — | ||||||||||||||||||||||
| Balance, December 31, 2013 | — | $ | — | 21,861,418 | $ | 461,636 | $ | — | $ | (363,670 | ) | $ | (17,605 | ) | $ | 80,361 | ||||||||||||||
| Comprehensive income (loss): | ||||||||||||||||||||||||||||||
| Net income | — | — | — | — | — | 150,458 | — | 150,458 | ||||||||||||||||||||||
| Other comprehensive income, net of tax | — | — | — | — | — | — | 10,130 | 10,130 | ||||||||||||||||||||||
| Total comprehensive income | 160,588 | |||||||||||||||||||||||||||||
| Stock offering, net of issuance cost of $18 | — | — | 2,367,425 | 24,982 | — | — | — | 24,982 | ||||||||||||||||||||||
| Reclass of warrant upon expiration of down-round term | — | — | — | 56 | — | — | — | 56 | ||||||||||||||||||||||
| Stock options and awards: | ||||||||||||||||||||||||||||||
| Compensation expense recognized | — | — | — | 853 | — | — | — | 853 | ||||||||||||||||||||||
| Shares issued as compensation to directors | — | — | 7,423 | 76 | — | — | — | 76 | ||||||||||||||||||||||
| Restricted stock awards issued to employees and directors, net of cancellations | — | — | (50,343 | ) | — | — | — | — | — | |||||||||||||||||||||
| Balance, December 31, 2014 | — | $ | — | 24,185,923 | $ | 487,603 | $ | — | $ | (213,212 | ) | $ | (7,475 | ) | $ | 266,916 | ||||||||||||||
| Comprehensive income: | ||||||||||||||||||||||||||||||
| Net income | — | — | — | — | — | 6,914 | — | 6,914 | ||||||||||||||||||||||
| Other comprehensive loss, net of tax | — | — | — | — | — | — | (3,264 | ) | (3,264 | ) | ||||||||||||||||||||
| Total comprehensive income | 3,650 | |||||||||||||||||||||||||||||
| Stock options and awards: | ||||||||||||||||||||||||||||||
| Compensation expense recognized | — | — | — | 2,429 | — | — | — | 2,429 | ||||||||||||||||||||||
| Restricted stock awards issued to employees and directors, net of cancellations | — | — | 102,801 | — | — | — | — | — | ||||||||||||||||||||||
| Shares issued as compensation to directors | — | — | 3,922 | 43 | — | — | — | 43 | ||||||||||||||||||||||
| Balance, December 31, 2015 | — | $ | — | 24,292,646 | $ | 490,075 | $ | — | $ | (206,298 | ) | $ | (10,739 | ) | $ | 273,038 | ||||||||||||||
See accompanying notes to consolidated financial statements.
61
CommunityOne Bancorp and Subsidiaries
Consolidated Statements of Cash Flows
| (dollars in thousands) | Years Ended December 31, | |||||||||||
| 2015 | 2014 | 2013 | ||||||||||
| Operating Activities | ||||||||||||
| Net income (loss) | $ | 6,914 | $ | 150,458 | (1,483 | ) | ||||||
| Adjustments to reconcile net income (loss) to cash provided by (used in) operating activities: | ||||||||||||
| Depreciation and amortization of premises and equipment | 3,588 | 3,811 | 3,646 | |||||||||
| Provision for (Recovery of) loan losses | (2,981 | ) | (5,371 | ) | 523 | |||||||
| Deferred income taxes | 7,124 | (142,492 | ) | 1,326 | ||||||||
| Deferred loan fees and costs, net | (497 | ) | 324 | (251 | ) | |||||||
| Premium amortization and discount accretion of investment securities, net | 2,778 | 2,294 | 4,061 | |||||||||
| Net gain on sale of investment securities | — | (974 | ) | (2,772 | ) | |||||||
| Amortization of core deposit premiums | 1,422 | 1,408 | 1,407 | |||||||||
| Net accretion of purchase accounting adjustments | (7,146 | ) | (10,075 | ) | (16,958 | ) | ||||||
| Stock compensation expense | 2,472 | 929 | 681 | |||||||||
| Increase in cash surrender value of bank-owned life insurance, net | (923 | ) | (1,146 | ) | (1,148 | ) | ||||||
| Loans held for sale: | ||||||||||||
| Origination of loans held for sale | (100,287 | ) | (59,470 | ) | (114,104 | ) | ||||||
| Net proceeds from sale of loans held for sale | 98,530 | 59,103 | 121,080 | |||||||||
| Net gain on sale of loans held for sale | (849 | ) | (593 | ) | (1,838 | ) | ||||||
| Mortgage servicing rights capitalized | (1,088 | ) | (644 | ) | (1,131 | ) | ||||||
| Mortgage servicing rights amortization and impairment | 583 | 470 | 305 | |||||||||
| Net (gain) loss on sale of premises and equipment | (520 | ) | 59 | 538 | ||||||||
| Net loss on sales and write-downs of other real estate owned | 1,784 | 754 | 3,921 | |||||||||
| Changes in assets and liabilities: | ||||||||||||
| (Increase) Decrease in accrued interest receivable and other assets | (6,436 | ) | 2,405 | (293 | ) | |||||||
| Decrease in accrued interest payable and other liabilities | (5,066 | ) | (469 | ) | (1,997 | ) | ||||||
| Net cash provided by (used in) operating activities | (598 | ) | 781 | (4,487 | ) | |||||||
| Investing Activities | ||||||||||||
| Available-for-sale securities: | ||||||||||||
| Proceeds from sales | — | 37,239 | 177,826 | |||||||||
| Proceeds from maturities, calls and principal repayments | 57,291 | 44,970 | 72,263 | |||||||||
| Purchases | (89,071 | ) | — | (127,794 | ) | |||||||
| Held-to-maturity securities: | ||||||||||||
| Proceeds from maturities, calls and principal repayments | — | 8,935 | 3,416 | |||||||||
| Purchases | (20,394 | ) | — | (155,394 | ) | |||||||
| Net increase in loans held for investment | (184,985 | ) | (139,711 | ) | (28,776 | ) | ||||||
| Proceeds from sales of other real estate owned | 6,590 | 10,150 | 37,785 | |||||||||
| Purchases of premises and equipment | (2,280 | ) | (2,001 | ) | (3,326 | ) | ||||||
| Proceeds from sales of premises and equipment | 2,004 | 282 | 920 | |||||||||
| Net cash received for acquisition | 56,788 | — | — | |||||||||
| Net cash used in investing activities | (174,057 | ) | (40,136 | ) | (23,080 | ) | ||||||
| Financing Activities | ||||||||||||
| Net increase (decrease) in deposits | 94,358 | 45,715 | (157,810 | ) | ||||||||
| Increase (Decrease) in retail repurchase agreements | (1,857 | ) | 2,159 | (1,758 | ) | |||||||
| Increase (Decrease) in Federal Home Loan Bank advances | 25,447 | (5,049 | ) | 14,955 | ||||||||
| Issuance of common stock, net of expense | — | 24,982 | — | |||||||||
| Net cash provided by (used) in financing activities | 117,948 | 67,807 | (144,613 | ) | ||||||||
| Net (Decrease) Increase in Cash and Cash Equivalents | (56,707 | ) | 28,452 | (172,180 | ) | |||||||
| Cash and Cash Equivalents at Beginning of Period | 95,882 | 67,430 | 239,610 | |||||||||
| Cash and Cash Equivalents at End of Period | $ | 39,175 | $ | 95,882 | $ | 67,430 | ||||||
| Supplemental disclosure of cash flow information | ||||||||||||
| Cash paid during the period for: | ||||||||||||
| Interest | $ | 13,442 | $ | 9,090 | $ | 10,093 | ||||||
| Income taxes, net of refunds | 39 | — | 58 | |||||||||
| Noncash transactions: | ||||||||||||
| Foreclosed loans transferred to other real estate owned | 4,503 | 4,372 | 15,001 | |||||||||
| Loans to facilitate the sale of other real estate owned | — | 1,699 | 7,696 | |||||||||
| Transfer of fixed assets to other assets | 1,335 | 2,136 | — | |||||||||
| Unrealized securities gains (losses), net of income taxes | (2,159 | ) | 11,459 | (18,126 | ) | |||||||
| Employee benefit plan costs (income), net of income taxes | (963 | ) | (1,005 | ) | 844 | |||||||
| Unrealized loss on interest rate swap, net of income taxes | (142 | ) | (324 | ) | — | |||||||
| Reclass of warrant upon expiration of down-round term | — | (56 | ) | — | ||||||||
See accompanying notes to consolidated financial statements.
62
CommunityOne Bancorp and Subsidiaries
Notes to Consolidated Financial Statements
1. Nature of Operations and Basis of Presentation
Nature of Operations/Consolidation
CommunityOne Bancorp, (“COB” or the “Company,” also referred to as “us” or “we” and our subsidiaries on a consolidated basis), is a bank holding company headquartered in Charlotte, North Carolina and incorporated in 1984 under the laws of the State of North Carolina. Through our ownership of CommunityOne Bank, N.A., or the “Bank,” a national banking association founded in 1907 and headquartered in Asheboro, North Carolina, we offer a complete line of consumer, mortgage and business banking services, including loan, deposit, treasury management, online and mobile banking services, as well as wealth management and trust services, to individual and small and middle market businesses through financial centers located throughout central, southern and western North Carolina. Our strategy is to grow the Company organically by focusing on meeting the financial needs of customers in our market area by providing a suite of quality financial products and services through local and experienced bankers and lenders located in branches and loan production offices in our customers’ local market. We also offer the convenience of online and mobile banking capabilities. In addition to organic growth, our strategy is to grow through merger and acquisition activity in our markets, should attractive opportunities present themselves. We define our market as communities located in North Carolina, as well as adjoining markets in South Carolina and Virginia.
On November 22, 2015, we entered into an Agreement and Plan of Merger (“Merger Agreement”) with Capital Bank Financial Corp., a Delaware corporation (“Capital Bank”), under which, upon the terms and subject to the conditions set forth in the Merger Agreement, COB will merge with and into Capital Bank (“Merger”), with Capital Bank as the surviving corporation in the Merger. Immediately following the Merger, the Bank will merge with and into Capital Bank’s wholly owned bank subsidiary, with Capital Bank’s bank subsidiary surviving the bank merger. The Merger is subject to, among other things, regulatory and shareholder approval and other customary closing conditions and is currently expected to close in the second quarter of 2016.
In July 2013, we changed our name from FNB United Corp. to CommunityOne Bancorp, and our stock symbol from FNBN to COB.
Basis of Presentation
The accounting and reporting policies of COB are in accordance with U.S. generally accepted accounting principles (“GAAP”). All significant intercompany balances and transactions have been eliminated.
Use of Estimates
We have made a number of estimates and assumptions relating to the reporting of assets and liabilities, the disclosure of contingent assets and liabilities at the date of the consolidated financial statements and the reported amounts of revenue and expenses during the reporting period to prepare these consolidated financial statements in conformity with GAAP. Actual results could differ from those estimates. Material estimates subject to change in the near term include, among other items, the allowances for loan losses (“ALL”), the carrying value of other real estate owned (“OREO”), the carrying value of investment securities, the carrying value of purchased impaired loans and the valuation of deferred tax assets.
Reclassification
Certain reclassifications have been made to the prior period consolidated financial statements to place them on a comparable basis with the current period consolidated financial statements. These reclassifications have no effect on net loss or shareholders’ equity as previously reported.
Business Combinations
Business combinations are accounted for under the acquisition method of accounting in accordance with Accounting Standards Codification (“ASC”) 805, Business Combinations. Under the acquisition method, the acquiring entity in a business combination recognizes 100% of the acquired assets and assumed liabilities, regardless of the percentage owned, at their estimated fair values as of the date of acquisition. Any excess of the purchase price over the fair value of net assets and other identifiable intangible assets acquired is recorded as goodwill. To the extent the fair value of net assets acquired, including other identifiable assets, exceed the purchase price, a bargain purchase gain is recognized. Assets acquired and liabilities assumed from contingencies must also be recognized at fair value, if the fair value can be determined during the measurement period. Results of operations of an acquired business are included in the statement of operations from the date of acquisition. Acquisition-related costs, including conversion and restructuring charges, are expensed as incurred.
63
Business Segments
We report business segments in accordance with accounting guidance. Business segments are components of an enterprise about which separate financial information is available that is evaluated regularly by the chief operating decision maker in deciding how to allocate resources and assess performance. The guidelines require that a public enterprise report a measure of segment profit or loss, certain specific revenue and expense items, segment assets, information about the way that the business segments were determined and other items. We have only one business segment.
Cash and Cash Equivalents
For purposes of reporting cash flows, cash and cash equivalents include the balance sheet captions: cash and due from banks, and interest-bearing bank balances.
Investment Securities
Investment securities are categorized and accounted for as follows:
| • | Available-for-sale ("AFS") securities - Debt and equity securities not classified as either held-to-maturity securities or trading securities are reported at fair value, with unrealized gains and losses, net of related tax effect, included as an item of accumulated other comprehensive income and reported as a separate component of shareholders’ equity. |
| • | Held-to-maturity ("HTM") securities - Debt securities that COB has the positive intent and ability to hold to maturity are reported at amortized cost. |
We intend to hold securities classified as AFS securities for an indefinite period of time but may sell them prior to maturity. All other securities, which COB has the positive intent and ability to hold to maturity, are classified as HTM securities. At December 31, 2015, and December 31, 2014, we have securities with an amortized cost of $148.0 million and $142.5 million in the HTM portfolio.
A decline, which is deemed to be other than temporary, in the market value of any AFS or HTM security to a level below cost results in a reduction in carrying amount to fair value. The impairment is charged to earnings and a new cost basis for the security is established.
Our policy regarding other than temporary impairment (“OTTI”) of investment securities requires continuous monitoring of those securities. The evaluation includes an assessment of both qualitative and quantitative measures to determine whether, in management’s judgment, the investment is likely to recover its original value. If the evaluation concludes that the investment is not likely to recover its original value, the unrealized loss is reported as an OTTI, and the loss is recorded in the Consolidated Statements of Operations.
For debt securities, an impairment loss is recognized in earnings only when (1) we intend to sell the debt security; (2) it is more likely than not that we will be required to sell the security before recovery of its amortized cost basis; or (3) we do not expect to recover the entire amortized cost basis of the security. In situations where we intend to sell or when it is more likely than not that we will be required to sell the security, the entire impairment loss must be recognized in earnings. In all other situations, only the portion of the impairment loss representing the credit loss must be recognized in earnings, with the remaining portion being recognized in shareholders’ equity as a component of other comprehensive loss, net of deferred taxes.
Interest income on debt securities is adjusted using the level yield method for the amortization of premiums and accretion of discounts. The adjusted cost of the specific security is used to compute gains or losses on the disposition of securities on a trade date basis.
Loans Held for Sale
At December 31, 2015, loans held for sale consisted of residential mortgage loans held for sale in the secondary market, as well as commercial loans guaranteed by the Small Business Administration ("SBA") similarly held for sale in the secondary market. At December 31, 2014 and 2013, loans held for sale consisted solely of residential mortgage loans which had not yet been sold. The loans held for sale are carried at the aggregate lower of cost or fair value less estimated costs to sell.
Loans are generally sold without recourse. Gains or losses on loan sales are recognized at the time of sale, are determined by the difference between net sales proceeds and the carrying value of the loan sold, and are included in mortgage loan income.
Loans Held for Investment
Loans held for investment are stated at the principal amounts outstanding adjusted for purchase premiums/discounts, deferred net loan fees and costs, and unearned income. COB reports its loan portfolio by segments and classes, which are disaggregations of portfolio segments. COB's portfolio segments are: Commercial and agricultural, Real estate, and Consumer loans. The Commercial and agricultural loan and Consumer loan portfolios are not further segregated into classes. The classes within the Real estate portfolio
64
segment include Real estate - construction and Real estate mortgage, further broken into 1-4 family residential mortgage and Commercial real estate mortgage loans.
Loan fees and the incremental direct costs associated with making loans are deferred and subsequently recognized over the life of the loan as an adjustment of interest income. The premium or discount on purchased loans is amortized over the expected life of the loans and is included in interest and fees on loans.
All loan classes are considered past due when the contractual amounts due with respect to principal and interest are not received within 30 days of the contractual due date. When we cannot reasonably expect full and timely repayment of its loan, the loan is placed on nonaccrual.
All loans on which principal or interest is in default for 90 days or more are put on nonaccrual status, unless there is sufficient documentation to conclude that the loan is well secured and in the process of collection. A debt is “well-secured” if collateralized by liens on or pledges of real or personal property, including securities, that have a realizable value sufficient to discharge the debt in full; or by the guarantee of a financially responsible party. A debt is “in process of collection” if collection is proceeding in due course either through legal action, including judgment enforcement procedures, or, in appropriate circumstances, through collection efforts not involving legal action that are reasonably expected to result in repayment of the debt or its restoration to a current status.
Loans that are less than 90 days delinquent may also be placed on nonaccrual, if approved, due to deterioration in the borrower’s financial condition that could result in less than full repayment.
A nonaccrual loan may be returned to accrual status when we can reasonably expect continued timely payments until payment in full. All prior arrearage does not have to be eliminated, nor do all previously charged off amounts need to have been recovered, but the loan can still be returned to accrual status if the following conditions are met: (1) all principal and interest amounts contractually due (including arrearage) are reasonably assured of repayment within a reasonable period; and (2) there is a sustained period of repayment performance (generally a minimum of six months) by the borrower, in accordance with the contractual terms involving payments of cash or cash equivalents.
At the time a loan is placed on nonaccrual, all accrued, unpaid interest is charged off, unless it is documented that repayment of all principal and presently accrued but unpaid interest is probable. Charge-offs of accrued and unpaid interest are taken against the current year's interest income. They are not charged to the current ALL.
Cash receipts received on nonaccrual loans are generally applied against principal until the loan has been collected in full, after which time any additional cash receipts are recognized as interest income.
Charge-off of Uncollectible Loans - As soon as any loan becomes uncollectible, the loan will be charged down or charged off as follows:
| • | If unsecured, the loan must be charged off in full. |
| • | If secured, the outstanding principal balance of the loan should be charged down to the net liquidation value of the collateral. |
Loans should be considered uncollectible when:
| • | No regularly scheduled payment has been made within four months, or |
| • | The loan is unsecured, the borrower files for bankruptcy protection and there is no other (guarantor, etc.) support from an entity outside of the bankruptcy proceedings. |
Based on a variety of credit, collateral and documentation issues, loans with lesser degrees of delinquency or obvious loss may also be deemed uncollectible.
Impaired Loans - An impaired loan is one for which COB will not be repaid all principal and interest due per the terms of the original contract or within reasonably modified contracted terms. If the loan has been modified to provide relief to the borrower, the loan is deemed to be impaired if all principal and interest will not be repaid according to the original contract. All loans meeting the definition of Doubtful are considered impaired.
When a loan in any class has been determined to be impaired, the amount of the impairment is measured using the present value of expected future cash flows discounted at the loan’s effective interest rate or, as a practical expedient, the observable market price of the loan, or the fair value of the collateral if the loan is collateral dependent. When the present value of expected future cash flows is used, the effective interest rate is the original contractual interest rate of the loan adjusted for any premium or discount. When the contractual interest rate is variable, the effective interest rate of the loan changes over time. A specific reserve is established as a component of the ALL when a loan has been determined to be impaired. After three months, specific reserves are considered for charge off. Subsequent to the initial measurement of impairment, if there is a significant change to the impaired loan’s expected future cash flows, or if actual cash flows are significantly different from the cash flows previously estimated, COB recalculates the
65
impairment and appropriately adjusts the specific reserve. Similarly, if COB measures impairment based on the observable market price of an impaired loan or the fair value of the collateral of an impaired collateral-dependent loan, COB will adjust the specific reserve if there is a significant change in either of those bases.
When a loan within any class is impaired and principal and interest is in doubt when contractually due, interest income is not recognized. Cash receipts received on nonaccruing impaired loans within any class are generally applied entirely against principal until the loan has been collected in full, after which time any additional cash receipts are recognized as interest income. Cash receipts received on accruing impaired loans within any class are applied in the same manner as accruing loans that are not considered impaired.
Acquired Loans
In addition to originating loans, we also purchase loans. At acquisition, purchased loans are designated as either purchased contractual loans (“PC loans”) or purchased impaired loans (“PI loans”). PC loans are acquired loans where management believes it is probable that it will receive all principal as of the date of acquisition. These loans are accounted for under the contractual cash flow method, under ASC 310-20. Any discount or premium paid on PC loans is recorded in interest income using the effective yield method over the expected life of the loans.
PI loans are acquired loans where management believes, at acquisition date, it is probable that all principal on the acquired loans will not be received. PI loans are placed in homogeneous risk-based pools, based on such factors as purpose and/or type of loan, and are treated in the aggregate where accounting for projected cash flows is performed, as allowed under ASC 310-30. The fair value of the loan pool is the present value of expected future cash flows at the acquisition date. The difference between the expected cash flows and the fair value is known as the accretable yield which is recognized as interest income over the remaining life of each PI loan pool when there is a reasonable expectation about the timing and amount of such cash flows.
Once a PI loan pool is established the individual loans within each pool do not change. As management obtains new information related to changes in expected principal loss and expected cash flows, by pool, we record either an increase in yield when new expected cash flows increase, an allowance for loan losses when new expected cash flows decline, or a decrease in yield when there is only a timing difference in expected cash flows.
PI loans that meet the criteria for nonaccrual of interest at the time of acquisition may be considered performing upon and subsequent to acquisition, regardless of whether the customer is contractually delinquent, if the timing and expected cash flows on such loans can be reasonably estimated and if collection of the new carrying value of such loans is expected.
Loans acquired in the Granite Merger (“Granite Purchased Loans”) included PI loans and PC loans. Loans designated as PC loans included performing revolving consumer and performing revolving commercial loans on acquisition date.
At December 31, 2015 and December 31, 2014 an ALL of $2.8 million and $3.2 million, respectively, was required for the acquired Granite loans. In addition, the acquired Granite loans are recorded on an accruing basis. We recorded $7.0 million, $9.6 million and $16.0 million in accretable yield during 2015, 2014 and 2013, respectively, on the Granite loans.
Allowance for Loan Losses
COB's allowance for loan losses ("ALL"), which is utilized to absorb actual losses in the loan portfolio, is maintained at a level consistent with management's best estimate of probable loan losses to be incurred as of the balance sheet date. Management assesses COB's ALL quarterly. This assessment includes a methodology that separates the total loan portfolio into homogeneous loan classifications for purposes of evaluating risk. The required allowance is calculated by applying a risk adjusted reserve requirement to the dollar volume of loans within a homogenous group. For purposes of the ALL, we have grouped our loans into pools according to the loan segmentation regime employed on schedule RC-C of the FFIEC's Consolidated Report of Condition and Income. Major loan portfolio subgroups include: risk graded commercial loans, mortgage loans, home equity loans, retail loans and retail credit lines. Management also analyzes the loan portfolio on an ongoing basis to evaluate current risk levels, and risk grades are adjusted accordingly. While management uses the best information available to make evaluations, future adjustments may be necessary if economic or other conditions differ substantially from the assumptions used.
Historical Loss Rates: Historical loss rates are calculated by associating losses to the risk-graded pool to which they relate for each of the previous eight quarters. Then, using a look back period consisting of the twenty most recent quarters, loss factors are calculated for each risk-graded pool using a simple average.
Q&E Loss Factors: In addition to our ability to use our own historical loss data and migration between risk grades, we have a rigorous process for computing the qualitative factors that impact the ALL. The methodology incorporates various internal and external qualitative and environmental factors as described in the Interagency Policy Statement on the Allowance for Loan and Lease Losses dated December 2006. Some factors are quantifiable, such as concentration, growth, delinquency, and nonaccrual risk by loan
66
type, while other factors are qualitative in nature, such as staff competency, competition within our markets and economic and regulatory changes impacting the loans held for investment, and are determined on the basis of management observation, judgment, and experience. A committee, independent of the historical loss migration team, reviews risk factors that may impact the ALL. The factors utilized by COB for all loan classes are as follows:
| a) | Standard – Accounts for inherent uncertainty in using the past as a predictor of the future. Particularly, this factor will be used to make adjustments when historical loss data over the look back period is above or below the loss experienced over more recent periods, causing the model to over or under predict the potential losses currently in the portfolio. |
| b) | Volume – Accounts for historical growth characteristics of the portfolio over the loss recognition period. |
| c) | Terms – Measures risk derived from granting terms outside of policy and underwriting guidelines. |
| d) | Staff – Reflects staff competence in various types of lending. |
| e) | Delinquency – Reflects increased risk deriving from higher delinquency rates. |
| f) | Nonaccrual – Reflects increased risk of loans with characteristics that merit nonaccrual status. |
| g) | Migration – Accounts for the changing level of risk inherent in loans as they migrate into, or away from, more adverse risk grades. |
| h) | Concentration – Measures increased risk derived from concentration of credit exposure in particular industry segments within the portfolio. |
| i) | Production – Measures impact of efforts towards expanding credit exposure and potential risk derived from new loan production. |
| j) | Process – Measures increased risk derived from more demanding processing requirements directed towards risk mitigation. |
| k) | Economic – Impact of general and local economic factors and effect is felt uniformly across pools. |
| l) | Competition – Measures risk associated with Bank's response to competitors’ relaxed credit requirements. |
| m) | Regulatory and Legal – Measures risk from exposure to regulations, legislation, and legal code that result in increased risk of loss. |
Each pool is assigned an adjustment to the potential loss percentage by assessing its characteristics against each of the factors listed above.
Calculation and Summary: A general reserve amount for each loan pool is calculated by adding the historical loss rate to the total Q&E factors, and applying the combined percentage to the pool loan balances.
Reserves are generally divided into three allocation segments:
| 1. | Individual Reserves. These are calculated against loans evaluated individually and deemed most likely to be impaired. Management determines which loans will be considered for potential impairment review. This does not mean that an individual reserve will necessarily be calculated for each loan considered for impairment, only for those noted during this process as likely to have a loss. Loans to be considered will generally include: |
| • | All commercial loans classified substandard or worse; |
| • | Any other loan in a nonaccrual status; |
| • | Any loan, consumer or commercial, that has already been modified such that it meets the definition of Troubled Debt Restructurings (“TDR”); and |
| • | Any loan for which the customer has filed Bankruptcy when the customer does not reaffirm the debt. |
The individual reserve must be verified at least quarterly, and recalculated whenever additional relevant information becomes available. All information related to the calculation of the individual reserve, including internal or external collateral valuations, assumptions, calculations, etc. must be documented.
Individual reserve amounts are not carried indefinitely.
| • | When the amount of the actual loss becomes reasonably quantifiable the amount of the loss should be charged off against the ALL, whether or not all liquidation and recovery efforts have been completed. |
| • | If the total amount of the individual reserve that will eventually be charged off cannot yet be determined, but some portion of the individual reserve can be viewed as an imminent loss, that smaller portion can be charged off against the ALL and the individual reserve reduced by a corresponding amount. It is acceptable to retain an estimate of remaining loss as a “special reserve” only when the estimate is not reasonably quantifiable. |
67
| • | Impaired loans with a de minimis balance are not individually evaluated for individual reserve but they are included in the formula reserve calculation. |
| 2. | Formula Reserves. Formula reserves are held against loans evaluated collectively. Loans are grouped by type or by risk grade, or some combination of the two. Loss estimates are based on historical loss rates for each respective loan group. |
Formula reserves represent COB’s best estimate of losses that may be inherent, or embedded, within the group of loans, even if it is not apparent at this time which loans within any group or pool represent those embedded losses.
| 3. | Unallocated Reserves. If individual reserves represent estimated losses tied to any specific loan, and formula reserves represent estimated losses tied to a pool of loans but not yet to any specific loan, then unallocated reserves represent an estimate of losses that are expected, but are not yet tied to any loan or group of loans. Unallocated reserves are generally the smallest of the three overall reserve segments and are set based on qualitative factors. |
All information related to the calculation of the three segments including data analysis, assumptions, calculations, etc. are documented. Assigning specific individual reserve amounts, formula reserve factors, or unallocated amounts based on unsupported assumptions or conclusions is not permitted.
COB lends primarily in North Carolina. As of December 31, 2015, a substantial majority of the principal amount of the loans held for investment in its portfolio was to businesses and individuals in North Carolina. This geographic concentration subjects the loan portfolio to the general economic conditions within this area. The risks created by this concentration have been considered by management in the determination of the adequacy of the ALL. Management believes the ALL is adequate to cover estimated losses on loans at each balance sheet date.
In addition, as an integral part of the examination process, the OCC periodically reviews the Bank's ALL. The OCC may require the Bank to recognize adjustments to the allowance based on its judgment about information available to it at the time of its examination.
Other Real Estate Owned
Other real estate owned (“OREO”), represents properties acquired through foreclosure or deed in lieu thereof. The property is classified as held for sale. The property is initially carried at fair value based on recent appraisals, less estimated costs to sell. Declines in the fair value of properties included in OREO below carrying value are recognized by a charge to income.
Premises and Equipment
Premises and equipment are stated at cost less accumulated depreciation and amortization. Depreciation is computed on a straight line basis over the estimated useful lives of the assets as follows: buildings and improvements, 10 to 50 years, and furniture and equipment, 3 to 10 years. Leasehold improvements are amortized on a straight line basis over the shorter of the estimated life of the improvement or the term of the lease.
Intangible Assets
Goodwill arises from business combinations and represents the excess of the purchase price over the fair value of the net assets and other identifiable intangible assets acquired. Goodwill and other intangible assets deemed to have indefinite lives generated from purchase business combinations are not subject to amortization and are instead assessed for impairment no less than annually. Impairment exists when the carrying value of the goodwill exceeds its implied fair value. Impairment charges are included in noninterest expense in the statements of operations.
Intangible assets with estimable useful lives are amortized over such useful lives to their estimated residual values. Core deposit premium assets (“CDP”), is recognized apart from goodwill at the time of acquisition based on market valuations prepared by independent third parties. In preparing such valuations, the third parties consider variables such as deposit servicing costs, attrition rates, and market discount rates. CDP assets are amortized to expense over their useful lives, which we have estimated to range from 8 to 10 years. CDP is reviewed for impairment quarterly or earlier if events or changes in circumstances indicate that their carrying values may not be recoverable. If the recoverable amount of CDP is determined to be less than its carrying value, we would then measure the amount of impairment based on an estimate of the intangible asset's fair value at that time. If the fair value is below the carrying value, the intangible asset is reduced to such fair value and the impairment is recognized as noninterest expense in the statements of operations.
Mortgage Servicing Rights (“MSRs”)
The rights to service mortgage loans for others are included in core deposit premiums and other intangibles in the consolidated balance sheet. MSRs are recorded at fair value on an ongoing basis, with changes in fair value recorded in the results of operations. A fair value analysis of MSRs is performed on a quarterly basis.
68
Income Taxes
Income tax expense includes both a current provision based on the amounts computed for income tax return purposes and a deferred provision that results from application of the asset and liability method of accounting for deferred taxes. Under the asset and liability method, deferred tax assets and liabilities are established for the temporary differences between the financial reporting basis and the tax basis of assets and liabilities at enacted tax rates expected to be in effect when such amounts are realized or settled. The effect of a change in tax rates on deferred tax assets and liabilities is recognized in income in the period that includes the enactment date. If sufficient evidence is not available to support a determination that it is more likely than not that all or a portion of a deferred tax asset will be realized then a valuation allowance must be recorded to the extent the asset cannot be realized.
Management must consider all available evidence, both positive and negative, in applying its judgment to determine whether a valuation allowance is necessary. Evidence includes but is not limited to a history of cumulative losses, the circumstances under which such losses arose, reliable forecasts of future taxable income, availability of prudent tax planning initiatives, and length of the remaining carryforward period.
COB classifies interest and penalties related to income taxes as a component of income tax expense.
Earnings per Share (“EPS”)
As required for entities with complex capital structures, a dual presentation of basic and diluted EPS is included on the face of the statements of operations, and a reconciliation is provided in a footnote of the numerator and denominator of the basic EPS computation to the numerator and denominator of the diluted EPS computation.
Comprehensive Income
Comprehensive income is defined as the change in equity of an enterprise during a period from transactions and other events and circumstances from non-owner sources and, accordingly, includes both net income and amounts referred to as other comprehensive income. The items of other comprehensive income are included in the consolidated statement of comprehensive loss. The accumulated balance of other comprehensive loss is included in the shareholders’ equity section of the consolidated balance sheet. COB’s components of accumulated other comprehensive loss for each period presented include unrealized gains (losses) on investment securities classified as available-for-sale, interest rate swaps and the effect of the defined benefit pension and other postretirement plans for employees.
For the twelve months ended December 31, 2015, 2014 and 2013, total comprehensive income (loss) was $3.7 million, $160.6 million and $(18.8) million, respectively. The deferred income tax benefit related to the components of other comprehensive loss amounted to $2.0 million, $6.3 million and $10.8 million respectively, for the same periods as previously mentioned.
The accumulated balances related to each component of other comprehensive loss are as follows:
| (dollars in thousands) | December 31, 2015 | December 31, 2014 | December 31, 2013 | |||||||||||||||||||||
| Pre-tax | After-tax | Pre-tax | After-tax | Pre-tax | After-tax | |||||||||||||||||||
| Net unrealized securities gains (losses) | $ | (8,381 | ) | $ | (5,176 | ) | $ | (4,885 | ) | $ | (3,017 | ) | $ | (23,443 | ) | $ | (14,476 | ) | ||||||
| Interest rate swaps | (754 | ) | (466 | ) | (525 | ) | (324 | ) | — | — | ||||||||||||||
| Pension and other postretirement benefit plan adjustments | (8,255 | ) | (5,097 | ) | (6,696 | ) | (4,134 | ) | (5,068 | ) | (3,129 | ) | ||||||||||||
| Accumulated other comprehensive loss | $ | (17,390 | ) | $ | (10,739 | ) | $ | (12,106 | ) | $ | (7,475 | ) | $ | (28,511 | ) | $ | (17,605 | ) | ||||||
Employee Benefit Plans
COB has a matching retirement/savings plan, a postretirement benefit plan, and a defined benefit pension plan. The Company also had three noncontributory, nonqualified supplemental executive retirement plans (“SERPs”) covering certain employees, all of which have been terminated.
COB’s matching defined contribution retirement/savings plan permits eligible employees to make contributions to the plan up to a specified percentage of compensation as defined by the plan. A portion of the employee contributions are matched by COB based on the plan formula, which is $.50 for each dollar on the first 6% of eligible pay deferred by the employee under the plan. Additionally, commencing in 2007, COB on a discretionary basis may make an annual contribution up to a specified percentage of compensation as defined by the plan to the account of each eligible employee. COB did not make a discretionary contribution in 2015, 2014 or 2013. The matching and discretionary contributions amounted to $0.7 million in 2015, $0.6 million in 2014, and $0.5 million in 2013.
The postretirement benefit plan provides medical insurance benefits to retirees who obtained certain age and service requirements. Previously, the plan also provided life insurance benefits, however, those benefits were terminated during 2015. Postretirement
69
benefit costs, which are actuarially determined using the attribution method and recorded on an unfunded basis, are charged to current operations and credited to a liability account on the consolidated balance sheet. Effective December 31, 2006, no new employees are eligible to enter the postretirement medical and life insurance plan. Employees who had obtained certain age and service qualifications continued to accrue benefits through December 31, 2010. Benefits are based on the employee's years of service at retirement. Only employees who qualified for continued benefit accrual are eligible for benefits under this plan.
The defined benefit pension plan was frozen in 2006 and no additional employees are eligible to enter the plan. Employees who had obtained certain age and service qualifications continued to accrue benefits through December 31, 2010. Benefits are based on the employee’s compensation, years of service and age at retirement. Defined benefit pension costs, which are actuarially determined using the projected unit credit method, are charged to current operations. Pension costs of $0.4 million, $0.1 million and $0.3 million were recognized during 2015, 2014 and 2013, respectively. Annual funding contributions are made up to the maximum amounts allowable for Federal income tax purposes.
The three noncontributory, nonqualified SERPs covered certain executives and pay benefits based on factors similar to those for the defined benefit pension plan, with offsets related to amounts payable under the pension plan and social security benefits. SERP costs, which are actuarially determined using the projected unit credit method and recorded on an unfunded basis, are charged to current operations and credited to a liability account on the consolidated balance sheet. All three plans have been terminated.
See Note 13 “Employee Benefit Plans” for additional information on all benefit plans described below.
COB also offers medical, dental, life, long-term disability, and vision care to its employees and shares in the costs of these programs.
Derivatives and Financial Instruments
A derivative is a financial instrument that derives its cash flows, and therefore its value, by reference to an underlying instrument, index or referenced interest rate. COB uses derivatives primarily to manage interest rate risk related to mortgage servicing rights, and long-term debt. The fair value of derivatives in a gain or loss position is included in other assets or liabilities, respectively, on the Consolidated Statements of Operations.
COB classifies its derivative financial instruments as either a hedge of an exposure to changes in the fair value of a recorded asset or liability, or a fair value hedge, or a hedge of an exposure to changes in the cash flows of a recognized asset, liability or forecasted transaction, or a cash flow hedge. COB has master netting agreements with the derivatives dealers with which it does business, but reflects gross gains and losses on the Consolidated Statements of Operations and Balance Sheets.
COB uses the long-haul method to assess hedge effectiveness. COB documents, both at inception and over the life of the hedge, at least quarterly, its analysis of actual and expected hedge effectiveness. This analysis includes techniques such as regression analysis and hypothetical derivatives to demonstrate that the hedge has been, and is expected to be, highly effective in off-setting corresponding changes in the fair value or cash flows of the hedged item. For a qualifying fair value hedge, changes in the value of the derivatives that have been highly effective as hedges are recognized in current period earnings along with the corresponding changes in the fair value of the designated hedged item attributable to the risk being hedged. For a qualifying cash flow hedge, the portion of changes in the fair value of the derivatives that have been highly effective are recognized in other comprehensive income until the related cash flows from the hedged item are recognized in earnings.
For either fair value hedges or cash flow hedges, ineffectiveness may be recognized in noninterest income to the extent that changes in the value of the derivative instruments do not perfectly offset changes in the value of the hedged items attributable to the risk being hedged. If the hedge ceases to be highly effective, COB discontinues hedge accounting and recognizes the changes in fair value in current period earnings. If a derivative that qualifies as a fair value or cash flow hedge is terminated or the designation removed, the realized or then unrealized gain or loss is recognized into income over the original hedge period (fair value hedge) or period in which the hedged item affects earnings (cash flow hedge). Immediate recognition in earnings is required upon sale or extinguishment of the hedged item (fair value hedge) or if it is probable that the hedged cash flows will not occur (cash flow hedge).
See Note 18 for additional information related to derivatives and financial instruments.
Recent Accounting Pronouncements
Troubled Debt Restructurings - In January 2014, the FASB issued ASU No. 2014-04 Troubled Debt Restructurings by Creditors (Subtopic 310-40): “Reclassification of Residential Real Estate Collateralized Consumer Mortgage Loans upon Foreclosure” (“ASU No. 2014-04”). This pronouncement clarifies the criteria for concluding that an in substance repossession or foreclosure has occurred, and a creditor is considered to have received physical possession of residential real estate property collateralizing a consumer mortgage loan. The amendments also outline interim and annual disclosure requirements. The amendments became effective for the Company for interim and annual reporting periods beginning after December 15, 2014. These amendments did not have a material effect on the Company's financial statements.
70
Revenue from Contracts with Customers - In May 2014, the FASB issued an update (ASU No. 2014-09, Revenue from Contracts with Customers) creating FASB Topic 606, Revenue from Contracts with Customers. The guidance in this update affects any entity that either enters into contracts with customers to transfer goods or services or enters into contracts for the transfer of nonfinancial assets unless those contracts are within the scope of other standards (for example, insurance contracts or lease contracts). The core principle of the guidance is that an entity should recognize revenue to depict the transfer of promised goods or services to customers in an amount that reflects the consideration to which the entity expects to be entitled in exchange for those goods or services. The guidance provides steps to follow to achieve the core principle. An entity should disclose sufficient information to enable users of financial statements to understand the nature, amount, timing and uncertainty of revenue and cash flows arising from contracts with customers. Qualitative and quantitative information is required about contracts with customers, significant judgments and changes in judgments, and assets recognized from the costs to obtain or fulfill a contract. The amendments in this update are effective for interim and annual reporting periods beginning after December 15, 2017. We are currently evaluating the impact of adopting the new guidance on the consolidated financial statements.
Business Combinations - In September 2015, the FASB issued ASU 2015-16, "Business Combinations (Topic 805) - Simplifying the Accounting for Measurement -Period Adjustments". The amendments in ASU 2015-16 require that an acquirer recognize adjustments to provisional amounts that are identified during the measurement period in the reporting period in which the adjustment amounts are determined. The amendments in ASU 2015-16 require that the acquirer record, in the same period’s financial statements, the effect on earnings of changes in depreciation, amortization, or other income effects, if any, as a result of the change to the provisional amounts, calculated as if the accounting had been completed at the acquisition date. The amendments in ASU 2015-16 also require an entity to present separately on the face of the income statement or disclose in the notes the portion of the amount recorded in current-period earnings by line item that would have been recorded in previous reporting periods if the adjustment to the provisional amounts had been recognized as of the acquisition date. We are currently evaluating the impact of adopting the new guidance on the consolidated financial statements.
Financial Instruments - In January 2016, the Financial Accounting Standard Board (the “FASB”) issued Accounting Standards Update ("ASU") 2016-1, "Financial instruments—Overall (Subtopic 825-10)" which requires all equity investments to be measured at fair value with changes in the fair value recognized through net income (other than those accounted for under equity method of accounting or those that result in consolidation of the investee). The amendments in this Update also require an entity to present separately in other comprehensive income the portion of the total change in the fair value of a liability resulting from a change in the instrument-specific credit risk when the entity has elected to measure the liability at fair value in accordance with the fair value option for financial instruments. In addition, the amendments in this update eliminate the requirement to disclose the fair value of financial instruments measured at amortized cost for entities that are not public business entities and the requirement to disclose the method(s) and significant assumptions used to estimate the fair value that is required to be disclosed for financial instruments measured at amortized cost on the balance sheet for public business entities. For public business entities, the amendments in ASU 2016-1 are effective for fiscal years beginning after December 15, 2017, including interim periods within those fiscal years. We are currently evaluating the impact of adopting the new guidance on the consolidated financial statements.
FASB - From time to time, the Financial Accountings Standards Board (“FASB”) issues exposure drafts for proposed statements of financial accounting standards. Such exposure drafts are subject to comment from the public, to revisions by the FASB and to final issuance by the FASB as statements of financial accounting standards.
Management considers the effect of the proposed statements on the consolidated financial statements of COB and monitors the status of changes to and proposed effective dates of exposure drafts. Other accounting standards that have been issued or proposed by the FASB or other standards-setting bodies are not expected to have a material impact on COB’s financial position, results of operations or cash flows.
2. Acquisition by Capital Bank Financial Corp.
On November 22, 2015, we entered into an Agreement and Plan of Merger (“Merger Agreement”) with Capital Bank Financial Corp., a Delaware corporation (“Capital”), under which, upon the terms and subject to the conditions set forth in the Merger Agreement, COB will merge with and into Capital (the “Merger”), with Capital as the surviving corporation in the Merger. Immediately following the Merger, the Bank will merge with and into Capital’s wholly owned bank subsidiary, with Capital’s bank subsidiary surviving the bank merger. The Merger is subject to, among other things, regulatory and shareholder approval and other customary closing conditions and is currently expected to close in the second quarter of 2016.
Under the terms of the Merger Agreement, CommunityOne shareholders shall have the right to receive, at the election of each holder and subject to proration, $14.25 per share in cash or 0.43 of a share of Capital Class A common stock, with the total consideration to consist of 85% stock and 15% cash. Based on Capital’s closing price of $33.59 as of Friday, November 20, 2015, the merger consideration is valued at approximately $350 million.
71
3. Intangible Assets
Business Combinations
Unamortized Intangible Assets (Goodwill)
COB conducted an annual goodwill impairment test as of September 30, 2015, and determined there was no impairment to goodwill. The goodwill relates to the Granite acquisition. At December 31, 2015 and 2014, the gross and net balance of goodwill was $4.2 million, and there were no additions or impairment to goodwill during the years ended December 31, 2015, 2014 and 2013.
Amortized Intangible Assets
Core Deposit Premium ("CDP")
For intangible assets related to business combinations, the following is a summary of the gross carrying amount and accumulated amortization of amortized intangible assets and the carrying amount of unamortized intangible assets:
| (dollars in thousands) | As of December 31, | |||||||
| 2015 | 2014 | |||||||
| Core deposit premium related to business combinations: | ||||||||
| Carrying amount | $ | 13,546 | $ | 13,102 | ||||
| Accumulated amortization | 10,569 | 9,147 | ||||||
| Net core deposit premium | $ | 2,977 | $ | 3,955 | ||||
During the third quarter we finalized the acquisition accounting for the CertusBank, N.A. branch acquisition and recorded a bargain purchase gain in other income of $0.3 million, representing the excess of the net fair value of assets acquired and liabilities assumed over the purchase price.
Amortization of CDP intangibles totaled $1.4 million in 2015, $1.4 million in 2014 and $1.4 million in 2013.
The following table presents the estimated amortization expense for intangible assets related to business combinations for each of the five calendar years ending December 31, 2019 and the estimated amount amortizable thereafter. These estimates are subject to change in future periods to the extent management determines it is necessary to make adjustments to the carrying value or estimated useful lives of amortized intangible assets.
| (dollars in thousands) | Estimated Amortization Expense | ||
| 2016 | $ | 908 | |
| 2017 | 685 | ||
| 2018 | 685 | ||
| 2019 | 583 | ||
| 2020 | 73 | ||
| Thereafter | 43 | ||
| Total | $ | 2,977 | |
Mortgage Servicing Rights
Mortgage loans serviced for others are not included in the consolidated balance sheets. The unpaid principal balance of mortgage loans serviced for others amounted to $304.6 million and $235.0 million at December 31, 2015 and 2014, respectively, and the fair value of mortgage servicing rights was $2.2 million and $1.7 million as of the same dates.
4. Investment Securities
Our primary objective in managing the investment portfolio is to maintain a portfolio of high quality, highly liquid investments yielding competitive returns. We are required under federal regulations to maintain adequate liquidity to ensure safe and sound operations. We maintain investment balances based on a continuing assessment of cash flows, the level of loan production, current interest rate risk strategies and an assessment of the potential future direction of market interest rate changes. Investment securities differ in terms of default, interest rate, liquidity and expected rate of return risks.
72
The following table summarizes the amortized cost and estimated fair value of investment securities and presents the related gross unrealized gains and losses:
| December 31, 2015 | ||||||||||||||||
| (dollars in thousands) | Amortized Cost | Gross Unrealized Gains | Gross Unrealized Losses | Estimated Fair Value | ||||||||||||
| Available-for-Sale: | ||||||||||||||||
| Obligations of U.S. government sponsored enterprises | $ | 2,005 | $ | 3 | $ | — | $ | 2,008 | ||||||||
| Residential mortgage-backed securities-GSE | 286,057 | 339 | 8,289 | 278,107 | ||||||||||||
| Residential mortgage-backed securities-Private | 33,235 | 578 | 236 | 33,577 | ||||||||||||
| Commercial mortgage-backed securities-GSE | 21,980 | — | 368 | 21,612 | ||||||||||||
| Commercial mortgage-backed securities-Private | 17,869 | — | 294 | 17,575 | ||||||||||||
| Corporate notes | 37,669 | — | 114 | 37,555 | ||||||||||||
| Total available-for-sale | $ | 398,815 | $ | 920 | $ | 9,301 | $ | 390,434 | ||||||||
| Held-to-Maturity: | ||||||||||||||||
| Residential mortgage-backed securities-GSE | 120,197 | — | 2,310 | 117,887 | ||||||||||||
| Residential mortgage-backed securities-Private | 17,712 | — | 298 | 17,414 | ||||||||||||
| Commercial mortgage-backed securities-Private | 10,058 | — | 174 | 9,884 | ||||||||||||
| Total held-to-maturity | $ | 147,967 | $ | — | $ | 2,782 | $ | 145,185 | ||||||||
| Total investment securities | $ | 546,782 | $ | 920 | $ | 12,083 | $ | 535,619 | ||||||||
| December 31, 2014 | ||||||||||||||||
| (dollars in thousands) | Amortized Cost | Gross Unrealized Gains | Gross Unrealized Losses | Estimated Fair Value | ||||||||||||
| Available-for-Sale: | ||||||||||||||||
| Obligations of U.S. government sponsored enterprises | $ | 2,028 | $ | 16 | $ | — | $ | 2,044 | ||||||||
| Residential mortgage-backed securities-GSE | 295,300 | 438 | 5,593 | 290,145 | ||||||||||||
| Residential mortgage-backed securities-Private | 16,455 | 820 | 4 | 17,271 | ||||||||||||
| Commercial mortgage-backed securities-GSE | 22,377 | — | 419 | 21,958 | ||||||||||||
| Commercial mortgage-backed securities-Private | 10,365 | — | 150 | 10,215 | ||||||||||||
| Corporate notes | 8,399 | 8 | — | 8,407 | ||||||||||||
| Total available-for-sale | $ | 354,924 | $ | 1,282 | $ | 6,166 | $ | 350,040 | ||||||||
| Held-to-Maturity: | ||||||||||||||||
| Residential mortgage-backed securities-GSE | 132,396 | 116 | 1,635 | 130,877 | ||||||||||||
| Commercial mortgage-backed securities-Private | 10,065 | — | 67 | 9,998 | ||||||||||||
| Total held-to-maturity | $ | 142,461 | $ | 116 | $ | 1,702 | $ | 140,875 | ||||||||
| Total investment securities | $ | 497,385 | $ | 1,398 | $ | 7,868 | $ | 490,915 | ||||||||
As a member of the Federal Home Loan Bank of Atlanta (“FHLB”), the Bank is required to own capital stock in the FHLB based generally upon the balances of total assets and FHLB advances. FHLB capital stock is pledged to secure FHLB advances. This investment is carried at cost since no ready market exists for FHLB stock and there is no quoted market value. However, redemption of this stock has historically been at par value. The Bank owned a total of $6.0 million of FHLB stock at December 31, 2015 and $4.9 million at December 31, 2014. Due to the redemption provisions of FHLB stock, we estimate that fair value approximates cost and that this investment is not impaired at December 31, 2015. FHLB stock is included in other assets at its original cost basis.
As a member bank of the Federal Reserve Bank of Richmond (“FRBR”), the Bank also is required to own capital stock of the FRBR based upon a percentage of the bank's common stock and surplus. This investment is carried at cost since no ready market exists for FRBR stock and there is no quoted market value. At December 31, 2015 and December 31, 2014, the Bank owned a total of $9.9 million and $4.7 million of FRBR stock, respectively. Due to the nature of this investment in an entity of the U.S. government, we have estimated that fair value approximated the cost and that this investment was not impaired at December 31, 2015. FRBR stock is included in other assets at its original cost basis.
73
These investments recorded at cost are included in Other Assets on the Consolidated Balance Sheets, as follows:
| (dollars in thousands) | December 31, | |||||||
| 2015 | 2014 | |||||||
| Federal Home Loan Bank stock | $ | 5,971 | $ | 4,855 | ||||
| Federal Reserve Bank stock | 9,884 | 4,713 | ||||||
| Total other investments | $ | 15,855 | $ | 9,568 | ||||
Gross gains and losses recognized (by specific identification) on the sale of securities are summarized as follows:
| (dollars in thousands) | Years Ended December 31, | |||||||||||
| 2015 | 2014 | 2013 | ||||||||||
| Proceeds from sales of investment securities | $ | — | $ | 37,239 | $ | 177,826 | ||||||
| Gains on sales of investment securities available-for-sale | — | 1,392 | 2,953 | |||||||||
| Losses on sales of investment securities available-for-sale | — | (418 | ) | (181 | ) | |||||||
| Total securities gains, net | $ | — | $ | 974 | $ | 2,772 | ||||||
At December 31, 2015, $150.0 million of the investment securities portfolio was pledged to secure public deposits, $17.1 million was pledged to retail repurchase agreements and $157.7 million was pledged to others, principally the FHLB and FRBR, leaving $213.6 million available as unpledged securities collateral. At December 31, 2014, $121.9 million of the investment securities portfolio was pledged to secure public deposits, $16.8 million was pledged to retail repurchase agreement and $173.2 million was pledged to others, leaving $180.6 million available as lendable collateral.
The following tables show our investments' estimated fair value and gross unrealized losses, aggregated by investment category and length of time that the individual securities have been in a continuous unrealized loss position, at December 31, 2015 and December 31, 2014. The change in unrealized losses during the years ending December 31, 2015 and 2014 was attributed to changes in interest rates and not to changes in the credit quality of these securities. All unrealized losses on investment securities are considered by management to be temporary given the credit quality of these investment securities or the short duration of the unrealized loss, or both.
74
| Less than 12 Months | 12 Months or More | Total | ||||||||||||||||||
| (dollars in thousands) | Estimated Fair Value | Gross Unrealized Losses | Estimated Fair Value | Gross Unrealized Losses | Estimated Fair Value | Gross Unrealized Losses | ||||||||||||||
| December 31, 2015 | ||||||||||||||||||||
| Available-for-Sale: | ||||||||||||||||||||
| Residential mortgage-backed securities-GSE | $ | 137,998 | $ | 2,560 | $ | 132,148 | $ | 5,729 | $ | 270,146 | $ | 8,289 | ||||||||
| Residential mortgage-backed securities-Private | 26,265 | 231 | 636 | 5 | 26,901 | 236 | ||||||||||||||
| Commercial mortgage-backed securities-GSE | 21,612 | 368 | — | — | 21,612 | 368 | ||||||||||||||
| Corporate Notes | 30,523 | 114 | — | — | 30,523 | 114 | ||||||||||||||
| Commercial mortgage-backed securities-Private | 17,575 | 294 | — | — | 17,575 | 294 | ||||||||||||||
| Total available-for-sale | $ | 233,973 | $ | 3,567 | $ | 132,784 | $ | 5,734 | $ | 366,757 | $ | 9,301 | ||||||||
| Held-to-Maturity: | ||||||||||||||||||||
| Residential mortgage-backed securities-GSE | $ | 83,014 | $ | 1,481 | $ | 34,872 | $ | 829 | $ | 117,886 | $ | 2,310 | ||||||||
| Residential mortgage-backed securities-Private | 17,414 | 298 | — | — | 17,414 | 298 | ||||||||||||||
| Commercial mortgage-backed securities-Private | 9,884 | 174 | — | — | 9,884 | 174 | ||||||||||||||
| Total held-to-maturity | $ | 110,312 | $ | 1,953 | $ | 34,872 | $ | 829 | $ | 145,184 | $ | 2,782 | ||||||||
| Total | $ | 344,285 | $ | 5,520 | $ | 167,656 | $ | 6,563 | $ | 511,941 | $ | 12,083 | ||||||||
| December 31, 2014 | ||||||||||||||||||||
| Available-for-Sale: | ||||||||||||||||||||
| Residential mortgage-backed securities-GSE | $ | — | $ | — | $ | 245,457 | $ | 5,593 | $ | 245,457 | $ | 5,593 | ||||||||
| Residential mortgage-backed securities-Private | 1,154 | 4 | — | — | 1,154 | 4 | ||||||||||||||
| Commercial mortgage-backed securities-GSE | — | — | 21,958 | 419 | 21,958 | 419 | ||||||||||||||
| Commercial mortgage-backed securities-Private | — | — | 10,215 | 150 | 10,215 | 150 | ||||||||||||||
| Total available-for-sale | $ | 1,154 | $ | 4 | $ | 277,630 | $ | 6,162 | $ | 278,784 | $ | 6,166 | ||||||||
| Held-to-Maturity: | ||||||||||||||||||||
| Residential mortgage-backed securities-GSE | $ | — | $ | — | $ | 112,878 | $ | 1,635 | $ | 112,878 | $ | 1,635 | ||||||||
| Commercial mortgage-backed securities-Private | — | — | 9,998 | 67 | 9,998 | 67 | ||||||||||||||
| Total held-to-maturity | $ | — | $ | — | $ | 122,876 | $ | 1,702 | $ | 122,876 | $ | 1,702 | ||||||||
| Total | $ | 1,154 | $ | 4 | $ | 400,506 | $ | 7,864 | $ | 401,660 | $ | 7,868 | ||||||||
At December 31, 2015, there were 18 investment securities that had continuous unrealized losses for more than twelve months. At December 31, 2014, there were 42 investment securities that had continuous unrealized losses for more than twelve months. The unrealized losses relate to fixed-rate debt securities that have incurred fair value reductions due to higher market interest rates and, for certain securities, increased credit spreads since the respective purchase date. The unrealized losses are not likely to reverse unless and until market interest rates and credit spreads decline to the levels that existed when the securities were purchased.
Unrealized losses for all investment securities are reviewed to determine whether the losses are other than temporary. Investment securities are evaluated on at least a quarterly basis and more frequently when economic or market conditions warrant such an evaluation to determine whether a decline in their value below amortized cost is other than temporary. In conducting this assessment, COB evaluates a number of factors including, but not limited to:
| • | How much fair value has declined below amortized cost; |
| • | How long the decline in fair value has existed; |
| • | The financial condition of the issuer; |
| • | Contractual or estimated cash flows of the security; |
| • | Underlying supporting collateral; |
| • | Past events, current conditions, forecasts; |
| • | Significant rating agency changes on the issuer; and |
| • | COB’s intent and ability to hold the security for a period of time sufficient to allow for any anticipated recovery in fair value. |
COB analyzed its securities portfolio at December 31, 2015 and 2014, and considered ratings, fair value, cash flows and other factors to determine if any of the securities were other than temporarily impaired. Since none of the unrealized losses relate to the
75
marketability of the securities or the issuer’s ability to honor redemption obligations, and COB has determined that it is not more likely than not that COB will be required to sell the security before recovery of its amortized cost basis, none of the securities are deemed to be other than temporarily impaired.
The aggregate amortized cost and fair value of securities at December 31, 2015, by remaining contractual maturity, are shown in the following table. Actual expected maturities may differ from contractual maturities because issuers may have the right to call or prepay obligations.
| Available-for-Sale | Held-to-Maturity | |||||||||||||||
| (dollars in thousands) | Amortized Cost | Estimated Fair Value | Amortized Cost | Estimated Fair Value | ||||||||||||
| U.S. government sponsored agencies | ||||||||||||||||
| Due in one year or less | $ | 2,005 | $ | 2,008 | $ | — | $ | — | ||||||||
| Residential mortgage-backed securities-GSE | ||||||||||||||||
| Due after five years through 10 years | 1,789 | 1,821 | — | — | ||||||||||||
| Due after ten years | 284,268 | 276,286 | 120,197 | 117,887 | ||||||||||||
| Residential mortgage-backed securities-Private | ||||||||||||||||
| Due after ten years | 33,235 | 33,577 | 17,712 | 17,414 | ||||||||||||
| Commercial mortgage-backed securities-GSE | ||||||||||||||||
| Due after five years through 10 years | 21,980 | 21,612 | — | — | ||||||||||||
| Commercial mortgage-backed securities-Private | ||||||||||||||||
| Due after ten years | 17,869 | 17,575 | 10,058 | 9,884 | ||||||||||||
| Corporate notes | ||||||||||||||||
| Due after five years through 10 years | 37,669 | 37,555 | — | — | ||||||||||||
| Total | $ | 398,815 | $ | 390,434 | $ | 147,967 | $ | 145,185 | ||||||||
76
5. Loans and Allowance for Loan Losses
The following table presents an aging analysis of accruing and nonaccruing loans as of December 31, 2015:
| (dollars in thousands) | Accruing | |||||||||||||||||||||||||||
| 30-59 days past due | 60-89 days past due | More than 90 days past due | Nonaccrual | Total past due and nonaccrual | Current and accruing | Total Loans | ||||||||||||||||||||||
| PC and Originated Loans | ||||||||||||||||||||||||||||
| Commercial and agricultural | $ | — | $ | 1 | $ | — | $ | 1,053 | $ | 1,054 | $ | 146,257 | $ | 147,311 | ||||||||||||||
| Real estate - construction | 761 | 140 | — | 110 | 1,011 | 98,247 | 99,258 | |||||||||||||||||||||
| Real estate - mortgage: | ||||||||||||||||||||||||||||
| 1-4 family residential | 2,710 | 574 | 817 | 9,106 | 13,207 | 660,430 | 673,637 | |||||||||||||||||||||
| Commercial | 661 | 34 | — | 7,209 | 7,904 | 421,220 | 429,124 | |||||||||||||||||||||
| Consumer | 1,227 | 250 | 1 | 538 | 2,016 | 104,885 | 106,901 | |||||||||||||||||||||
| Total | $ | 5,359 | $ | 999 | $ | 818 | $ | 18,016 | $ | 25,192 | $ | 1,431,039 | $ | 1,456,231 | ||||||||||||||
| PI loans | ||||||||||||||||||||||||||||
| Commercial and agricultural | $ | 102 | $ | — | $ | 1,618 | $ | — | $ | 1,720 | $ | 3,275 | $ | 4,995 | ||||||||||||||
| Real estate - construction | — | — | 1,455 | — | 1,455 | 6,289 | 7,744 | |||||||||||||||||||||
| Real estate - mortgage: | ||||||||||||||||||||||||||||
| 1-4 family residential | 602 | 15 | 1,127 | — | 1,744 | 12,173 | 13,917 | |||||||||||||||||||||
| Commercial | 517 | 123 | 8,819 | — | 9,459 | 50,530 | 59,989 | |||||||||||||||||||||
| Consumer | 8 | — | 6 | — | 14 | 905 | 919 | |||||||||||||||||||||
| Total | $ | 1,229 | $ | 138 | $ | 13,025 | $ | — | $ | 14,392 | $ | 73,172 | $ | 87,564 | ||||||||||||||
| Total Loans | $ | 6,588 | $ | 1,137 | $ | 13,843 | $ | 18,016 | $ | 39,584 | $ | 1,504,211 | $ | 1,543,795 | ||||||||||||||
The following table presents an aging analysis of accruing and nonaccruing loans as of December 31, 2014:
| (dollars in thousands) | Accruing | |||||||||||||||||||||||||||
| 30-59 days past due | 60-89 days past due | More than 90 days past due | Nonaccrual | Total past due and nonaccrual | Current and accruing | Total Loans | ||||||||||||||||||||||
| PC and Originated Loans | ||||||||||||||||||||||||||||
| Commercial and agricultural | $ | — | $ | — | $ | — | $ | 608 | $ | 608 | $ | 105,269 | $ | 105,877 | ||||||||||||||
| Real estate - construction | 100 | — | — | 2,307 | 2,407 | 66,723 | 69,130 | |||||||||||||||||||||
| Real estate - mortgage: | ||||||||||||||||||||||||||||
| 1-4 family residential | 2,719 | 147 | — | 8,637 | 11,503 | 638,364 | 649,867 | |||||||||||||||||||||
| Commercial | 105 | 141 | — | 13,381 | 13,627 | 325,356 | 338,983 | |||||||||||||||||||||
| Consumer | 744 | 225 | 5 | 355 | 1,329 | 69,760 | 71,089 | |||||||||||||||||||||
| Total | $ | 3,668 | $ | 513 | $ | 5 | $ | 25,288 | $ | 29,474 | $ | 1,205,472 | $ | 1,234,946 | ||||||||||||||
| PI loans | ||||||||||||||||||||||||||||
| Commercial and agricultural | $ | — | $ | — | $ | 2,232 | $ | — | $ | 2,232 | $ | 5,303 | $ | 7,535 | ||||||||||||||
| Real estate - construction | — | — | 3,737 | — | 3,737 | 5,460 | 9,197 | |||||||||||||||||||||
| Real estate - mortgage: | ||||||||||||||||||||||||||||
| 1-4 family residential | 579 | 15 | 2,209 | — | 2,803 | 14,934 | 17,737 | |||||||||||||||||||||
| Commercial | 287 | 119 | 12,964 | — | 13,370 | 73,975 | 87,345 | |||||||||||||||||||||
| Consumer | 2 | — | 10 | — | 12 | 1,016 | 1,028 | |||||||||||||||||||||
| Total | $ | 868 | $ | 134 | $ | 21,152 | $ | — | $ | 22,154 | $ | 100,688 | $ | 122,842 | ||||||||||||||
| Total Loans | $ | 4,536 | $ | 647 | $ | 21,157 | $ | 25,288 | $ | 51,628 | $ | 1,306,160 | $ | 1,357,788 | ||||||||||||||
77
All PI loans are considered to be accruing for all periods presented, in accordance with ASC 310-30.
During the twelve months ended December 31, 2014, we purchased $19.7 million of performing residential mortgage loans, including premiums of $0.3 million. During the twelve months ended December 31, 2013, we purchased $157.6 million of performing residential mortgage loans, including premiums of $1.3 million. These loan purchases are accounted for as PC loans.
Risk Grades
The risk-grade categories presented in the following table, which are standard categories used by the bank regulators, are:
Pass - Loans categorized as Pass are higher quality loans that have adequate sources of repayment and little risk of collection.
Special Mention - A Special Mention loan has potential weaknesses that deserve management's close attention. If left uncorrected, these potential weaknesses may result in deterioration of the repayment prospects for the asset or in the institution's credit position at some future date. Special Mention loans are not adversely classified and do not expose an institution to sufficient risk to warrant adverse classification.
Substandard - A Substandard loan is inadequately protected by the current sound worth and paying capacity of the obligor or of the collateral pledged, if any. Loans so classified have a well-defined weakness or weaknesses that jeopardize the liquidation of the debt. They are characterized by the distinct possibility that we will sustain some loss if the deficiencies are not corrected. Loss potential, while existing in the aggregate amount of Substandard loans, does not have to exist in individual assets classified Substandard.
Doubtful - A loan classified as Doubtful has all the weaknesses inherent in one classified Substandard with the added characteristic that the weaknesses make collection or liquidation in full, on the basis of currently existing facts, conditions, and values, highly questionable and improbable. The possibility of loss is extremely high, but because of certain important and reasonable specific pending factors, which may work to the advantage of strengthening of the asset, its classification as an estimated loss is deferred until its more exact status may be determined. Pending factors include proposed merger, acquisition, or liquidation procedures, capital injection, perfecting liens on additional collateral and refinancing plans.
Loans categorized as Special Mention or worse are considered Criticized. Loans categorized as Substandard or Doubtful are considered Classified. Purchased loans acquired in the Merger are recorded at estimated fair value on the date of acquisition without the carryover of related ALL. The table below includes $27.0 million and $40.5 million in Granite Purchased Loans categorized as Substandard or Doubtful at December 31, 2015 and December 31, 2014, respectively.
The following table presents loans held for investment balances by risk grade as of December 31, 2015:
| (dollars in thousands) | Pass | Special Mention | Substandard | Doubtful | ||||||||||||||||
| (Ratings 1-5) | (Rating 6) | (Rating 7) | (Rating 8) | Total | ||||||||||||||||
| Commercial and agricultural | $ | 148,844 | $ | 672 | $ | 2,790 | $ | — | $ | 152,306 | ||||||||||
| Real estate - construction | 100,252 | 2,122 | 4,628 | — | 107,002 | |||||||||||||||
| Real estate - mortgage: | ||||||||||||||||||||
| 1-4 family residential | 669,695 | 3,508 | 14,351 | — | 687,554 | |||||||||||||||
| Commercial | 450,587 | 12,765 | 25,761 | — | 489,113 | |||||||||||||||
| Consumer | 107,008 | 4 | 553 | 255 | 107,820 | |||||||||||||||
| Total | $ | 1,476,386 | $ | 19,071 | $ | 48,083 | $ | 255 | $ | 1,543,795 | ||||||||||
78
The following table presents loans held for investment balances by risk grade as of December 31, 2014:
| (dollars in thousands) | Pass | Special Mention | Substandard | Doubtful | ||||||||||||||||
| (Ratings 1-5) | (Rating 6) | (Rating 7) | (Rating 8) | Total | ||||||||||||||||
| Commercial and agricultural | $ | 104,165 | $ | 6,318 | $ | 2,930 | $ | — | $ | 113,413 | ||||||||||
| Real estate - construction | 68,995 | 2,411 | 6,921 | — | 78,327 | |||||||||||||||
| Real estate - mortgage: | ||||||||||||||||||||
| 1-4 family residential | 646,897 | 5,363 | 15,342 | — | 667,602 | |||||||||||||||
| Commercial | 363,267 | 25,715 | 36,984 | 362 | 426,328 | |||||||||||||||
| Consumer | 71,350 | 11 | 376 | 381 | 72,118 | |||||||||||||||
| Total | $ | 1,254,674 | $ | 39,818 | $ | 62,553 | $ | 743 | $ | 1,357,788 | ||||||||||
Loans included in the preceding loan composition table are net of participations sold. Loans are increased by net loan premiums and deferred loan costs of $3.7 million at December 31, 2015 and $3.2 million at December 31, 2014.
At December 31, 2015, loans held for sale consisted of residential mortgage loans held for sale in the secondary market, as well as commercial loans similarly held for sale in the secondary market. At December 31, 2014, loans held for sale consisted of originated residential mortgage loans held for sale. In each case, the loans are valued at the lower of cost or fair market value.
Loans serviced for others are not included in the consolidated balance sheet. The unpaid principal balance of loans serviced for others amounted to $304.6 million at December 31, 2015 and $235.0 million at December 31, 2014.
Loans Pledged
To borrow from the FHLB, members must pledge collateral to secure advances and letters of credit. Acceptable collateral includes, among other types of collateral, a variety of residential, multifamily, home equity lines and second mortgages, and commercial loans. Investment securities of $113.0 million and $124.6 million and gross loans of $102.9 million and $127.2 million were pledged to collateralize FHLB advances and letters of credit at December 31, 2015 and December 31, 2014, respectively, of which there was $80.8 million and $130.8 million of credit availability for borrowing, respectively. At December 31, 2015, $44.7 million of securities and $4.1 million of loans were pledged to collateralize potential borrowings from the Federal Reserve Discount Window, of which $46.6 million was available as borrowing capacity. We could also access $294.1 million of additional borrowings from the FHLB under credit lines by pledging additional collateral.
Nonaccruing and Impaired Loans
Interest income on loans is calculated by using the interest method based on the daily outstanding balance. The recognition of interest income is discontinued when, in management's opinion, the collection of all or a portion of interest becomes doubtful. Loans are returned to accrual status when the factors indicating doubtful collectability cease to exist and the loan has performed in accordance with its terms for a demonstrated period of time. The past due status of loans is based on the contractual payment terms. Had nonaccruing loans been on accruing status, interest income would have been higher by $1.4 million, $3.7 million and $4.7 million for the twelve months ended December 31, 2015, December 31, 2014, and December 31, 2013, respectively. At December 31, 2015 and December 31, 2014, COB had certain impaired loans of $18.0 million and $25.3 million, respectively, which were on nonaccruing interest status.
79
The following table summarizes information relative to impaired loans for the dates indicated:
| December 31, 2015 | December 31, 2014 | |||||||||||||||
| (dollars in thousands) | Balance | Associated Reserves | Balance | Associated Reserves | ||||||||||||
| Impaired loans, not individually reviewed for impairment | $ | 4,903 | $ | — | $ | 4,967 | $ | — | ||||||||
| Impaired loans, individually reviewed, with no reserves | 22,411 | — | 26,631 | — | ||||||||||||
| Impaired loans, individually reviewed, with reserves | 3,817 | 399 | 7,851 | 418 | ||||||||||||
| Total impaired loans, excluding purchased impaired * | $ | 31,131 | 399 | $ | 39,449 | 418 | ||||||||||
| Purchased impaired loans with subsequent deterioration | $ | 84,329 | 2,754 | $ | 118,701 | 3,237 | ||||||||||
| Purchased impaired loans with no subsequent deterioration | 3,235 | — | 4,141 | — | ||||||||||||
| Total Reserves | $ | 3,153 | $ | 3,655 | ||||||||||||
| Average impaired loans, excluding purchased impaired, calculated using a simple average | $ | 35,290 | $ | 43,446 | ||||||||||||
| * Included at December 31, 2015 and December 31, 2014 were $13.1 million and $14.1 million, respectively, in restructured and performing loans. | ||||||||||||||||
The following table presents loans held for investment on nonaccrual status by loan class for the dates indicated:
| (dollars in thousands) | ||||||||
| December 31, 2015 | December 31, 2014 | |||||||
| Loans held for investment: | ||||||||
| Commercial and agricultural | $ | 1,053 | $ | 608 | ||||
| Real estate - construction | 110 | 2,307 | ||||||
| Real estate - mortgage: | ||||||||
| 1-4 family residential | 9,106 | 8,637 | ||||||
| Commercial | 7,209 | 13,381 | ||||||
| Consumer | 538 | 355 | ||||||
| Total nonaccrual loans | 18,016 | 25,288 | ||||||
| Loans more than 90 days delinquent, still on accrual | 817 | 5 | ||||||
| Total nonperforming loans | $ | 18,833 | $ | 25,293 | ||||
There were no loans held for sale on nonaccrual status as of December 31, 2015 or December 31, 2014.
80
The following table presents individually reviewed impaired loans and purchased impaired loans with subsequent credit deterioration, segregated by portfolio segment, and the corresponding reserve for impaired loan losses as of December 31, 2015:
| Unpaid | ||||||||||||
| (dollars in thousands) | Recorded | Principal | Related | |||||||||
| Investment | Balance | Allowance | ||||||||||
| With no related allowance recorded: | ||||||||||||
| Commercial and agricultural | $ | 399 | $ | 479 | $ | — | ||||||
| Real estate - construction | 775 | 939 | — | |||||||||
| Real estate - mortgage: | ||||||||||||
| 1-4 family residential | 7,418 | 9,406 | — | |||||||||
| Commercial | 13,820 | 19,116 | — | |||||||||
| Consumer | — | — | — | |||||||||
| Total | $ | 22,412 | $ | 29,940 | $ | — | ||||||
| With an allowance recorded: | ||||||||||||
| Commercial and agricultural | $ | — | $ | — | $ | — | ||||||
| Real estate - construction | — | — | — | |||||||||
| Real estate - mortgage: | ||||||||||||
| 1-4 family residential | 3,817 | 4,691 | 399 | |||||||||
| Commercial | — | — | — | |||||||||
| Consumer | — | — | — | |||||||||
| Total | $ | 3,817 | $ | 4,691 | $ | 399 | ||||||
| Total individually evaluated impaired loans: | ||||||||||||
| Commercial and agricultural | $ | 399 | $ | 479 | $ | — | ||||||
| Real estate - construction | 775 | 939 | — | |||||||||
| Real estate - mortgage: | ||||||||||||
| 1-4 family residential | 11,235 | 14,097 | 399 | |||||||||
| Commercial | 13,820 | 19,116 | — | |||||||||
| Consumer | — | — | — | |||||||||
| Total | $ | 26,229 | $ | 34,631 | $ | 399 | ||||||
| PI loans with subsequent credit deterioration: | ||||||||||||
| Commercial and agricultural | $ | 4,995 | $ | 3,908 | $ | 311 | ||||||
| Real estate - construction | 7,323 | 8,121 | 579 | |||||||||
| Real estate - mortgage: | ||||||||||||
| 1-4 family residential | 11,103 | 11,327 | 384 | |||||||||
| Commercial | 59,989 | 60,582 | 1,356 | |||||||||
| Consumer | 919 | 598 | 124 | |||||||||
| Total | $ | 84,329 | $ | 84,536 | $ | 2,754 | ||||||
81
The following table presents individually reviewed impaired loans, and purchased impaired loans with subsequent credit deterioration, segregated by portfolio segment, and the corresponding reserve for impaired loan losses as of December 31, 2014:
| Unpaid | ||||||||||||
| (dollars in thousands) | Recorded | Principal | Related | |||||||||
| Investment | Balance | Allowance | ||||||||||
| With no related allowance recorded: | ||||||||||||
| Commercial and agricultural | $ | — | $ | — | $ | — | ||||||
| Real estate - construction | 2,344 | 2,898 | — | |||||||||
| Real estate - mortgage: | ||||||||||||
| 1-4 family residential | 8,115 | 10,238 | — | |||||||||
| Commercial | 16,172 | 22,060 | — | |||||||||
| Consumer | — | — | — | |||||||||
| Total | $ | 26,631 | $ | 35,196 | $ | — | ||||||
| With an allowance recorded: | ||||||||||||
| Commercial and agricultural | $ | 498 | $ | 498 | $ | 58 | ||||||
| Real estate - construction | — | — | — | |||||||||
| Real estate - mortgage: | ||||||||||||
| 1-4 family residential | 3,294 | 3,676 | 331 | |||||||||
| Commercial | 4,059 | 4,228 | 29 | |||||||||
| Consumer | — | — | — | |||||||||
| Total | $ | 7,851 | $ | 8,402 | $ | 418 | ||||||
| Total individually evaluated impaired loans: | ||||||||||||
| Commercial and agricultural | $ | 498 | $ | 498 | $ | 58 | ||||||
| Real estate - construction | 2,344 | 2,898 | — | |||||||||
| Real estate - mortgage: | ||||||||||||
| 1-4 family residential | 11,409 | 13,914 | 331 | |||||||||
| Commercial | 20,231 | 26,288 | 29 | |||||||||
| Consumer | — | — | — | |||||||||
| Total | $ | 34,482 | $ | 43,598 | $ | 418 | ||||||
| PI loans with subsequent credit deterioration: | ||||||||||||
| Commercial and agricultural | $ | 7,535 | $ | 6,149 | $ | 257 | ||||||
| Real estate - construction | 8,619 | 9,855 | 507 | |||||||||
| Real estate - mortgage: | ||||||||||||
| 1-4 family residential | 14,174 | 15,278 | 199 | |||||||||
| Commercial | 87,345 | 90,830 | 2,085 | |||||||||
| Consumer | 1,028 | 667 | 189 | |||||||||
| Total | $ | 118,701 | $ | 122,779 | $ | 3,237 | ||||||
82
The following summary includes impaired loans individually reviewed as well as impaired loans held for sale. Average recorded investment and interest income recognized on impaired loans, segregated by portfolio segment, is shown in the following table for the years indicated:
| For Twelve Months Ended | For Twelve Months Ended | For Twelve Months Ended | ||||||||||||||||||||||
| December 31, 2015 | December 31, 2014 | December 31, 2013 | ||||||||||||||||||||||
| Average | Interest | Average | Interest | Average | Interest | |||||||||||||||||||
| (dollars in thousands) | Recorded | Income | Recorded | Income | Recorded | Income | ||||||||||||||||||
| Investment | Recognized | Investment | Recognized | Investment | Recognized | |||||||||||||||||||
| With no related allowance recorded: | ||||||||||||||||||||||||
| Commercial and agricultural | $ | 429 | $ | — | $ | — | $ | — | $ | 784 | $ | 8 | ||||||||||||
| Real estate - construction | 1,015 | 34 | 2,867 | 40 | 9,075 | 35 | ||||||||||||||||||
| Real estate - mortgage: | ||||||||||||||||||||||||
| 1-4 family residential | 7,828 | 106 | 8,797 | 131 | 11,920 | 100 | ||||||||||||||||||
| Commercial | 14,276 | 226 | 17,574 | 354 | 29,384 | 254 | ||||||||||||||||||
| Consumer | — | — | — | — | — | — | ||||||||||||||||||
| Total | $ | 23,548 | $ | 366 | $ | 29,238 | $ | 525 | $ | 51,163 | $ | 397 | ||||||||||||
| With an allowance recorded: | ||||||||||||||||||||||||
| Commercial and agricultural | $ | — | $ | — | $ | 535 | $ | 20 | $ | 283 | $ | 5 | ||||||||||||
| Real estate - construction | — | — | — | — | 638 | 9 | ||||||||||||||||||
| Real estate - mortgage: | ||||||||||||||||||||||||
| 1-4 family residential | 3,953 | 60 | 3,148 | 75 | 2,713 | 20 | ||||||||||||||||||
| Commercial | 958 | 52 | 4,149 | 196 | 4,127 | 4 | ||||||||||||||||||
| Consumer | — | — | — | — | 83 | 1 | ||||||||||||||||||
| Total | $ | 4,911 | $ | 112 | $ | 7,832 | $ | 291 | $ | 7,844 | $ | 39 | ||||||||||||
| Total: | ||||||||||||||||||||||||
| Commercial and agricultural | $ | 429 | $ | — | $ | 535 | $ | 20 | $ | 1,067 | $ | 13 | ||||||||||||
| Real estate - construction | 1,015 | 34 | 2,867 | 40 | 9,713 | 44 | ||||||||||||||||||
| Real estate - mortgage: | ||||||||||||||||||||||||
| 1-4 family residential | 11,781 | 166 | 11,945 | 206 | 14,633 | 120 | ||||||||||||||||||
| Commercial | 15,234 | 278 | 21,723 | 550 | 33,511 | 258 | ||||||||||||||||||
| Consumer | — | — | — | — | 83 | 1 | ||||||||||||||||||
| Total | $ | 28,459 | $ | 478 | $ | 37,070 | $ | 816 | $ | 59,007 | $ | 436 | ||||||||||||
Impaired loans also include loans for which we may elect to grant a concession, providing terms more favorable than those prevalent in the market (e.g., rate, amortization term), and formally restructure due to the weakening credit status of a borrower. Restructuring is designed to facilitate a repayment plan that minimizes the potential losses that we otherwise may have to incur. If these impaired loans are on nonaccruing status as of the date of restructuring, the loans are included in nonperforming loans. Nonaccruing restructured loans will remain as nonaccruing until the borrower can demonstrate adherence to the restructured terms for a period of no less than six months and when it is otherwise determined that continued adherence is reasonably assured. Some restructured loans continue as accruing loans after restructuring if the borrower is not past due at the time of restructuring, adequate collateral valuations support the restructured loans, and the cash flows of the underlying business appear adequate to support the restructured debt service. Not included in nonaccruing loans are loans that have been restructured that were performing as of the restructure date. At December 31, 2015, there was $17.9 million in restructured loans, of which $13.1 million were accruing and in a performing status. At December 31, 2014, there was $19.4 million in restructured loans, of which $14.1 million were accruing and in a performing status.
83
Granite Purchased Loans
Granite Purchased Loans include PI loans and PC loans. PC loans include performing revolving consumer and commercial loans on October 21, 2011, the acquisition date.
PI loans are segregated into pools and recorded at estimated fair value on the date of acquisition without the carryover of the related ALL. PI loans are accounted for under ASC 310-30 when the loans have evidence of credit deterioration since origination and it is probable at the date of acquisition we will not collect all contractually required principal and interest payments. Evidence of credit quality deterioration as of the date of acquisition may include statistics such as past due status, nonaccrual status and risk grade. PI loans generally meet our definition for nonaccrual status; however, even if the borrower is not currently making payments, we will classify loans as accruing if we can reasonably estimate the amount and timing of future cash flows. All Granite Purchased PI loans are presented on an accruing basis. The difference between contractually required payments at acquisition and the cash flows expected to be collected at acquisition is referred to as the nonaccretable difference.
Periodically, we estimate the expected cash flows for each pool of the PI loans and evaluate whether the expected cash flows for each pool have changed from prior estimates. Decreases to the expected cash flows will generally result in a provision for loan losses. Subsequent increases in cash flows result in a reversal of the provision for loan losses to the extent of prior charges, or reclassification from nonaccretable difference to accretable yield with a positive impact on future interest income. Excess of cash flows expected at acquisition over the estimated fair value is referred to as the accretable yield and is recognized into interest income over the remaining life of the loan when there is a reasonable expectation about the amount and timing of such cash flows.
We have elected to account for the Granite Purchased PI loans under ASC 310-30 and the Granite Purchased PC loans under ASC 310-20.
At December 31, 2015, and December 31, 2014, our financial statements reflected a PI loan ALL of $2.8 million and $3.2 million, respectively, and an ALL for PC loans of $0.3 million and $0.3 million, respectively.
The following tables present the balance of all Granite Purchased Loans:
| At December 31, 2015 | ||||||||||||||||
| (dollars in thousands) | Purchased Impaired | Purchased Contractual | Total Purchased Loans | Unpaid Principal Balance | ||||||||||||
| Commercial and agricultural | $ | 4,995 | $ | 238 | $ | 5,233 | $ | 4,149 | ||||||||
| Real estate - construction | 7,744 | — | 7,744 | 8,579 | ||||||||||||
| Real estate - mortgage: | ||||||||||||||||
| 1-4 family residential | 13,917 | 17,915 | 31,832 | 32,558 | ||||||||||||
| Commercial | 59,989 | — | 59,989 | 60,582 | ||||||||||||
| Consumer | 919 | — | 919 | 598 | ||||||||||||
| Total | $ | 87,564 | $ | 18,153 | $ | 105,717 | $ | 106,466 | ||||||||
| At December 31, 2014 | ||||||||||||||||
| (dollars in thousands) | Purchased Impaired | Purchased Contractual | Total Purchased Loans | Unpaid Principal Balance | ||||||||||||
| Commercial and agricultural | $ | 7,535 | $ | 4,288 | $ | 11,823 | $ | 10,508 | ||||||||
| Real estate - construction | 9,197 | — | 9,197 | 10,463 | ||||||||||||
| Real estate - mortgage: | ||||||||||||||||
| 1-4 family residential | 17,737 | 21,660 | 39,397 | 41,295 | ||||||||||||
| Commercial | 87,345 | — | 87,345 | 90,830 | ||||||||||||
| Consumer | 1,028 | — | 1,028 | 678 | ||||||||||||
| Total | $ | 122,842 | $ | 25,948 | $ | 148,790 | $ | 153,774 | ||||||||
84
The table below includes only those Granite Purchased Loans accounted for under the expected cash flow method (PI loans) for the periods indicated. These tables do not include PC loans, including Granite Purchased PC loans or purchased performing residential mortgage loans.
| For Twelve Months Ended | For Twelve Months Ended | |||||||||||||||
| December 31, 2015 | December 31, 2014 | |||||||||||||||
| Purchased Impaired | Purchased Impaired | |||||||||||||||
| (dollars in thousands) | Carrying Amount | Future Accretion | Carrying Amount | Future Accretion | ||||||||||||
| Balance, beginning of period | $ | 122,842 | $ | 24,898 | $ | 161,652 | $ | 29,989 | ||||||||
| Accretion | 6,979 | (6,979 | ) | 9,563 | (9,563 | ) | ||||||||||
| Increase (Decrease) in future accretion | — | (2,296 | ) | — | 4,472 | |||||||||||
| Reclassification of loans and adjustments | — | — | (4,180 | ) | — | |||||||||||
| Payments received | (41,002 | ) | — | (43,314 | ) | — | ||||||||||
| Foreclosed and transferred to OREO | (1,255 | ) | — | (879 | ) | — | ||||||||||
| Subtotal before allowance | 87,564 | 15,623 | 122,842 | 24,898 | ||||||||||||
| Allowance for credit losses | (2,754 | ) | — | (3,237 | ) | — | ||||||||||
| Net carrying amount, end of period | $ | 84,810 | $ | 15,623 | $ | 119,605 | $ | 24,898 | ||||||||
Allowance for Loan Losses
An analysis of the changes in the ALL is as follows:
| (dollars in thousands) | 2015 | 2014 | 2013 | ||||||||
| Balance, beginning of period | $ | 20,345 | $ | 26,785 | 29,314 | ||||||
| Provision for (recovery of) losses | (2,981 | ) | (5,371 | ) | 523 | ||||||
| Net charge-offs: | |||||||||||
| Charge-offs | (5,604 | ) | (7,703 | ) | (13,344 | ) | |||||
| Recoveries | 3,435 | 6,634 | 10,292 | ||||||||
| Net charge-offs | (2,169 | ) | (1,069 | ) | (3,052 | ) | |||||
| Balance, end of period | $ | 15,195 | $ | 20,345 | 26,785 | ||||||
| Annualized net charge-offs during the period to average loans held for investment | 0.15 | % | 0.08 | % | 0.26 | % | |||||
| Annualized net charge-offs during the period to ALL | 14.27 | 5.25 | 11.39 | ||||||||
| Allowance for loan losses to loans held for investment | 0.98 | 1.50 | 2.21 | ||||||||
During the year ended December 31, 2015, we charged off $5.6 million in loans and realized $3.4 million in recoveries, for $2.2 million of net charge-offs. The majority of the loans charged off were loans that were previously impaired and had specific reserves assigned in prior periods.
The ALL, as a percentage of loans held for investment, was 0.98% at December 31, 2015, compared to 1.50% at December 31, 2014.
85
The following table presents ALL activity by portfolio segment for the year ended December 31, 2015:
| Real Estate - Mortgage | ||||||||||||||||||||||||
| (dollars in thousands) | Commercial and Agricultural | Real Estate - Construction | 1-4 Family Residential | Commercial | Consumer | Total | ||||||||||||||||||
| ALL: | ||||||||||||||||||||||||
| Beginning balance at January 1, 2015 | $ | 3,915 | $ | 3,163 | $ | 5,847 | $ | 4,179 | $ | 3,241 | $ | 20,345 | ||||||||||||
| Charge-offs | (309 | ) | (138 | ) | (1,297 | ) | (410 | ) | (3,450 | ) | (5,604 | ) | ||||||||||||
| Recoveries | 1,036 | 712 | 555 | 487 | 645 | 3,435 | ||||||||||||||||||
| Provision (Recovery) | (2,240 | ) | (1,968 | ) | 36 | (1,928 | ) | 3,119 | (2,981 | ) | ||||||||||||||
| Ending balance at December 31, 2015 | $ | 2,402 | $ | 1,769 | $ | 5,141 | $ | 2,328 | $ | 3,555 | $ | 15,195 | ||||||||||||
The following table presents ALL activity by portfolio segment for the year ended December 31, 2014:
| Real Estate - Mortgage | ||||||||||||||||||||||||
| (dollars in thousands) | Commercial and Agricultural | Real Estate - Construction | 1-4 Family Residential | Commercial | Consumer | Total | ||||||||||||||||||
| ALL: | ||||||||||||||||||||||||
| Beginning balance at January 1, 2014 | $ | 2,931 | $ | 5,233 | $ | 8,869 | $ | 7,195 | $ | 2,557 | $ | 26,785 | ||||||||||||
| Charge-offs | (1,449 | ) | (719 | ) | (1,273 | ) | (1,746 | ) | (2,516 | ) | (7,703 | ) | ||||||||||||
| Recoveries | 951 | 2,110 | 1,187 | 1,165 | 1,221 | 6,634 | ||||||||||||||||||
| Provision (Recovery) | 1,482 | (3,461 | ) | (2,936 | ) | (2,435 | ) | 1,979 | (5,371 | ) | ||||||||||||||
| Ending balance at December 31, 2014 | $ | 3,915 | $ | 3,163 | $ | 5,847 | $ | 4,179 | $ | 3,241 | $ | 20,345 | ||||||||||||
The following table presents ALL activity by portfolio segment for the year ended December 31, 2013:
| Real Estate - Mortgage | ||||||||||||||||||||||||
| (dollars in thousands) | Commercial and Agricultural | Real Estate - Construction | 1-4 Family Residential | Commercial | Consumer | Total | ||||||||||||||||||
| ALL: | ||||||||||||||||||||||||
| Beginning balance at January 1, 2013 | $ | 3,238 | $ | 4,987 | $ | 8,701 | $ | 9,627 | $ | 2,761 | $ | 29,314 | ||||||||||||
| Charge-offs | (1,277 | ) | (1,080 | ) | (4,032 | ) | (2,808 | ) | (4,147 | ) | (13,344 | ) | ||||||||||||
| Recoveries | 1,623 | 2,681 | 1,266 | 3,048 | 1,674 | 10,292 | ||||||||||||||||||
| Provision (Recovery) | (653 | ) | (1,355 | ) | 2,934 | (2,672 | ) | 2,269 | 523 | |||||||||||||||
| Ending balance at December 31, 2013 | $ | 2,931 | $ | 5,233 | $ | 8,869 | $ | 7,195 | $ | 2,557 | $ | 26,785 | ||||||||||||
86
The following table details the recorded investment in loans related to each segment in the allowance for loan losses by portfolio segment and disaggregated on the basis of impairment evaluation methodology at December 31, 2015:
| Real Estate - Mortgage | ||||||||||||||||||||||||
| (dollars in thousands) | Commercial and Agricultural | Real Estate - Construction | 1-4 Family Residential | Commercial | Consumer | Total | ||||||||||||||||||
| ALL: | ||||||||||||||||||||||||
| Individually evaluated for impairment | $ | — | $ | — | $ | 399 | $ | — | $ | — | $ | 399 | ||||||||||||
| Collectively evaluated for impairment | 2,091 | 1,190 | 4,358 | 972 | 3,431 | 12,042 | ||||||||||||||||||
| PI loans evaluated for credit impairment | 311 | 579 | 384 | 1,356 | 124 | 2,754 | ||||||||||||||||||
| PI loans with no credit deterioration | — | — | — | — | — | — | ||||||||||||||||||
| Total ALL | $ | 2,402 | $ | 1,769 | $ | 5,141 | $ | 2,328 | $ | 3,555 | $ | 15,195 | ||||||||||||
| Loans held for investment: | ||||||||||||||||||||||||
| Individually evaluated for impairment | $ | 399 | $ | 775 | $ | 11,235 | $ | 13,820 | $ | — | $ | 26,229 | ||||||||||||
| Collectively evaluated for impairment | 146,912 | 98,483 | 662,402 | 415,304 | 106,901 | 1,430,002 | ||||||||||||||||||
| PI loans with subsequent credit deterioration | 4,995 | 7,323 | 11,103 | 59,989 | 919 | 84,329 | ||||||||||||||||||
| PI loans with no credit deterioration | — | 421 | 2,814 | — | — | 3,235 | ||||||||||||||||||
| Total loans held for investment | $ | 152,306 | $ | 107,002 | $ | 687,554 | $ | 489,113 | $ | 107,820 | $ | 1,543,795 | ||||||||||||
The following table details the recorded investment in loans related to each segment in the allowance for loan losses by portfolio segment and disaggregated on the basis of impairment evaluation methodology at December 31, 2014:
| Real Estate - Mortgage | ||||||||||||||||||||||||
| (dollars in thousands) | Commercial and Agricultural | Real Estate - Construction | 1-4 Family Residential | Commercial | Consumer | Total | ||||||||||||||||||
| ALL: | ||||||||||||||||||||||||
| Individually evaluated for impairment | $ | 58 | $ | — | $ | 331 | $ | 29 | $ | — | $ | 418 | ||||||||||||
| Collectively evaluated for impairment | 3,600 | 2,656 | 5,317 | 2,065 | 3,052 | 16,690 | ||||||||||||||||||
| PI loans evaluated for credit impairment | 257 | 507 | 199 | 2,085 | 189 | 3,237 | ||||||||||||||||||
| PI loans with no credit deterioration | — | — | — | — | — | — | ||||||||||||||||||
| Total ALL | $ | 3,915 | $ | 3,163 | $ | 5,847 | $ | 4,179 | $ | 3,241 | $ | 20,345 | ||||||||||||
| Loans held for investment: | ||||||||||||||||||||||||
| Individually evaluated for impairment | $ | 498 | $ | 2,344 | $ | 11,409 | $ | 20,231 | $ | — | $ | 34,482 | ||||||||||||
| Collectively evaluated for impairment | 105,380 | 66,786 | 638,456 | 318,752 | 71,090 | 1,200,464 | ||||||||||||||||||
| PI loans with subsequent credit deterioration | 7,535 | 8,619 | 14,174 | 87,345 | 1,028 | 118,701 | ||||||||||||||||||
| PI loans with no credit deterioration | — | 578 | 3,563 | — | — | 4,141 | ||||||||||||||||||
| Total loans held for investment | $ | 113,413 | $ | 78,327 | $ | 667,602 | $ | 426,328 | $ | 72,118 | $ | 1,357,788 | ||||||||||||
87
Troubled Debt Restructuring
The following table presents a breakdown of troubled debt restructurings that were restructured during the periods presented, segregated by portfolio segment:
| For Twelve Months Ended December 31, 2015 | For Twelve Months Ended December 31, 2014 | For Twelve Months Ended December 31, 2013 | |||||||||||||||||||||||||||||||
| Pre-Modified | Post-Modified | Pre-Modified | Post-Modified | Pre-Modified | Post-Modified | ||||||||||||||||||||||||||||
| Outstanding | Outstanding | Outstanding | Outstanding | Outstanding | Outstanding | ||||||||||||||||||||||||||||
| (dollars in thousands) | Number | Recorded | Recorded | Number | Recorded | Recorded | Number | Recorded | Recorded | ||||||||||||||||||||||||
| of Loans | Investment | Investment | of Loans | Investment | Investment | of Loans | Investment | Investment | |||||||||||||||||||||||||
| Commercial and agricultural | — | $ | — | $ | — | 2 | $ | 94 | $ | 94 | — | $ | — | $ | — | ||||||||||||||||||
| Real estate - construction | 3 | 649 | 649 | 4 | 1,607 | 1,607 | 2 | 125 | 125 | ||||||||||||||||||||||||
| Real estate - mortgage: | |||||||||||||||||||||||||||||||||
| 1-4 family residential | 5 | 754 | 754 | 11 | 1,227 | 1,303 | 12 | 3,387 | 3,451 | ||||||||||||||||||||||||
| Commercial | 4 | 728 | 728 | 8 | 3,470 | 3,386 | 5 | 5,531 | 5,238 | ||||||||||||||||||||||||
| Consumer | — | — | — | — | — | — | — | — | — | ||||||||||||||||||||||||
| Total | 12 | $ | 2,131 | $ | 2,131 | 25 | $ | 6,398 | $ | 6,390 | 19 | $ | 9,043 | $ | 8,814 | ||||||||||||||||||
During the twelve months ended December 31, 2015, we modified 12 loans that were considered to be troubled debt restructurings. We extended the terms for 5 of these loans and modified the remaining 7 loans by both extending the term and modifying the interest rate. During the twelve months ended December 31, 2014, we modified 25 loans that were considered to be troubled debt restructurings. We extended the terms for 8 of these loans and modified the remaining 17 loans in both ways.
There were no loans restructured in the twelve months prior to December 31, 2015 that went into default during the year ended December 31, 2015. There were also no loans restructured in the twelve months prior to December 31, 2014 that went into default during the year ended December 31, 2014.
In the determination of the ALL, management considers troubled debt restructurings and any subsequent defaults in these restructurings as impaired loans. The amount of the impairment is measured using the present value of expected future cash flows discounted at the loan's initial effective interest rate, the observable market price of the loan, or the fair value of the collateral if the loan is collateral dependent.
Unfunded Commitments
The reserve for unfunded commitments, which is included in other liabilities, is calculated by estimating the amount of additional funding on the commitment and multiplying that amount by either a 1% Loss Rate for lines originated since recapitalization of the Bank (10/21/2011) or the historical loss rate (including Q&E factors) for loans originated prior to recapitalization. The following describes our method for determining the estimated additional funding by commitment type:
| • | Builder Guidance Lines of Credit (Call Report Code 1a1, Risk Graded Pass) - 50% of Unfunded balance |
| • | Straight Lines of Credit - Unfunded balance of line of credit (100% utilization) |
| • | Revolving Lines of Credit - Average Utilization (for the last 12 months) less Current Utilization |
| • | Letters of Credit - 10% utilization |
The reserve for unfunded commitments was $0.8 million as of December 31, 2015 and $0.8 million at December 31, 2014.
88
6. Premises and Equipment
Premises and equipment at December 31 is summarized as follows:
| (dollars in thousands) | 2015 | 2014 | ||||||
| Land | $ | 13,235 | $ | 14,058 | ||||
| Building and improvements | 45,484 | 47,542 | ||||||
| Furniture and equipment | 32,619 | 39,641 | ||||||
| Leasehold improvements | 769 | 906 | ||||||
| Premises and equipment, gross | 92,107 | 102,147 | ||||||
| Accumulated depreciation and amortization | (47,650 | ) | (55,365 | ) | ||||
| Premises and equipment, net | $ | 44,457 | $ | 46,782 | ||||
Depreciation and amortization expense totaled $3.6 million, $3.9 million, and $3.7 million for the years ended December 31, 2015, 2014 and 2013, respectively.
7. Other Real Estate Owned and Personal Property Acquired in Settlement of Loans
OREO consists of real estate acquired through foreclosure or deed in lieu thereof. The property is classified as held for sale. The property is initially carried at fair value based on recent appraisals, less estimated costs to sell. Declines in the fair value of properties included in other real estate below carrying value are recognized by a charge to income.
Total OREO and personal property acquired in settlement of loans decreased $3.8 million from $20.4 million at December 31, 2014, to $16.6 million at December 31, 2015.
The following table summarizes real estate acquired in settlement of loans and personal property acquired in settlement of loans at the periods indicated:
| (dollars in thousands) | December 31, 2015 | December 31, 2014 | ||||||
| Real estate acquired in settlement of loans | $ | 16,251 | $ | 20,122 | ||||
| Personal property acquired in settlement of loans | 332 | 289 | ||||||
| Total property acquired in settlement of loans | $ | 16,583 | $ | 20,411 | ||||
The following table summarizes the changes in real estate acquired in settlement of loans at the periods indicated:
| For Year Ended | ||||||||
| (dollars in thousands) | December 31, 2015 | December 31, 2014 | ||||||
| Real estate acquired in settlement of loans, beginning of period | $ | 20,122 | $ | 28,353 | ||||
| Plus: New real estate acquired in settlement of loans | 4,503 | 4,372 | ||||||
| Less: Sales of real estate acquired in settlement of loans | (6,590 | ) | (11,849 | ) | ||||
| Less: Write-downs and net loss on sales charged to expense | (1,784 | ) | (754 | ) | ||||
| Real estate acquired in settlement of loans, end of period | $ | 16,251 | $ | 20,122 | ||||
At December 31, 2015, 10 assets with a net carrying amount of $2.0 million were under contract for sale and are primarily expected to close during the first quarter of 2016. Estimated losses on these sales have been recognized in the Consolidated Statements of Operations for 2015. At December 31, 2014, 12 assets with a net carrying amount of $3.4 million were under contract for sale. The sale of these assets closed during 2015, or the contracts were terminated. Estimated losses on these sales were recognized in the Consolidated Statements of Operations for 2014.
At December 31, 2015, the Company’s recorded investment in mortgage loans collateralized by residential real estate properties that
are in the process of foreclosure was $2.2 million and the Company’s OREO balance included $3.2 million of residential real estate.
89
8. Accumulated Other Comprehensive Income
The following table presents the changes in our accumulated other comprehensive income (loss), net of tax, by component for the period indicated:
| (Dollars in thousands) | Unrealized Losses on Available-For-Sale Securities | Interest Rate Swaps | Defined Benefit Plan Items | Total | ||||||||||||
| Beginning balance January 1, 2015 | $ | (3,017 | ) | $ | (324 | ) | $ | (4,134 | ) | $ | (7,475 | ) | ||||
| Other comprehensive income (loss) before reclassifications | (2,159 | ) | (149 | ) | (1,347 | ) | (3,655 | ) | ||||||||
| Amounts reclassified from accumulated other comprehensive income | — | 7 | 384 | 391 | ||||||||||||
| Net current period other comprehensive income (loss) | (2,159 | ) | (142 | ) | (963 | ) | (3,264 | ) | ||||||||
| Ending balance December 31, 2015 | $ | (5,176 | ) | $ | (466 | ) | $ | (5,097 | ) | $ | (10,739 | ) | ||||
| (Dollars in thousands) | Unrealized Gains (Losses) on Available-For-Sale Securities | Interest Rate Swaps | Defined Benefit Plan Items | Total | ||||||||||||
| Beginning balance January 1, 2014 | $ | (14,476 | ) | $ | — | $ | (3,129 | ) | $ | (17,605 | ) | |||||
| Other comprehensive income (loss) before reclassifications | 12,060 | (331 | ) | (1,241 | ) | 10,488 | ||||||||||
| Amounts reclassified from accumulated other comprehensive income | (601 | ) | 7 | 236 | (358 | ) | ||||||||||
| Net current period other comprehensive income (loss) | 11,459 | (324 | ) | (1,005 | ) | 10,130 | ||||||||||
| Ending balance December 31, 2014 | $ | (3,017 | ) | $ | (324 | ) | $ | (4,134 | ) | $ | (7,475 | ) | ||||
90
The following table shows the reclassifications out of accumulated other comprehensive income (loss) for the years ended December 31:
| (Dollars in thousands) | Amount Reclassified from AOCI | ||||||||
| 2015 | 2014 | Line Item in the Consolidated Statement of Operations | |||||||
| Available-for-sale securities: | |||||||||
| Net realized gains on sale of securities | $ | — | $ | (974 | ) | Securities gains, net | |||
| Income tax expense | — | 373 | Income tax expense | ||||||
| Total, net of tax | — | (601 | ) | ||||||
| Interest rate swaps: | |||||||||
| Swap ineffectiveness expense | 12 | 12 | Miscellaneous expense | ||||||
| Income tax benefit | (5 | ) | (5 | ) | Income tax expense | ||||
| Total, net of tax | 7 | 7 | |||||||
| Defined benefit plan items: | |||||||||
| Net actuarial (gains) losses | 622 | 382 | Personnel expense | ||||||
| Income tax (benefit) expense | (238 | ) | (146 | ) | Income tax expense | ||||
| Total, net of tax | 384 | 236 | |||||||
| Total reclassifications for the period | $ | 391 | $ | (358 | ) | ||||
9. Commitments and Contingencies
From time to time, we are subject to various claims, lawsuits, disputes with third parties, investigations and pending actions involving various allegations against us incident to the operation of our business. On February 29, 2016, a case captioned Curtis R. Pendleton v. Robert L. Reid, et al., Case 5:16-cv-00037 (W.D.N.C.), was filed on behalf of a putative class of CommunityOne shareholders against CommunityOne, its directors, and Capital Bank Financial Corp. in the United States District Court for the Western District of North Carolina in connection with the Capital Merger. The complaint alleges, among other things, that the defendants violated Sections 14(a) and 20(a) of the Securities Exchange Act of 1934 by issuing a Registration/Joint Proxy Statement that, plaintiff alleges, is materially incomplete and misleading. The complaint seeks, among other things, an order enjoining the merger, as well as other equitable relief and/or money damages, interest, costs, fees (including attorneys' fees) and expenses. The Company believes that the claims are without merit. Other than the above, in management's opinion, there are no proceedings pending to which we are a party or to which our property is subject, which, if determined adversely to us, would be material in relation to our shareholder's equity or financial condition. In addition, no material proceedings are pending or are known to be threatened or contemplated against us by governmental authorities or other parties.
COB leases certain facilities and equipment for use in its business. The lease for facilities generally runs for periods of 5 to 10 years with various renewal options, while leases for equipment generally have terms not in excess of 5 years. The majority of the leases for facilities contain rental escalation clauses tied to changes in price indices. Certain real property leases contain purchase options. Management expects that most leases will be renewed or replaced with new leases in the normal course of business.
91
Future obligations at December 31, 2015 for minimum rentals under non-cancelable operating lease commitments, primarily relating to premises, are as follows:
| (dollars in thousands) | |||
| Year ending December 31, | |||
| 2016 | $ | 2,134 | |
| 2017 | 2,193 | ||
| 2018 | 1,969 | ||
| 2019 | 1,888 | ||
| 2020 | 1,796 | ||
| Thereafter | 9,492 | ||
| Total lease commitments | $ | 19,472 | |
Net rental expense for all operating leases amounted to $2.2 million, $2.1 million, and $2.2 million for the years ended December 31, 2015, 2014 and 2013, respectively.
92
10. Income Taxes
The components of income tax expense (benefit) for the years ended December 31 are as follows:
| (dollars in thousands) | 2015 | 2014 | 2013 | |||||||||
| Current: | ||||||||||||
| Federal | $ | — | $ | — | $ | — | ||||||
| State | — | — | — | |||||||||
| Total current taxes | — | — | — | |||||||||
| Deferred | ||||||||||||
| Federal | 3,967 | 3,714 | 21,276 | |||||||||
| State | 4,457 | 537 | 14,628 | |||||||||
| Total deferred taxes | 8,424 | 4,251 | 35,904 | |||||||||
| Decrease in valuation allowance | (1,300 | ) | (146,743 | ) | (34,578 | ) | ||||||
| Total income tax (benefit) expense | $ | 7,124 | $ | (142,492 | ) | $ | 1,326 | |||||
A reconciliation of income tax expense computed at the statutory federal income tax rate to actual income tax expense (benefit) is presented in the following table as of December 31:
| (dollars in thousands) | ||||||||||||
| 2015 | 2014 | 2013 | ||||||||||
| Amount of tax computed using federal statutory tax rate of 35% in all years | $ | 4,913 | $ | 2,788 | $ | (55 | ) | |||||
| Increases (decreases) resulting from effects of: | ||||||||||||
| Non-taxable income | (39 | ) | (54 | ) | (88 | ) | ||||||
| State income taxes, net of federal benefit | 2,897 | 349 | 9,508 | |||||||||
| Valuation allowance on deferred tax assets | (1,300 | ) | (146,743 | ) | (34,578 | ) | ||||||
| Bank-owned life insurance | (408 | ) | (403 | ) | (375 | ) | ||||||
| Reduction of deferred tax assets at Granite | — | — | 28,293 | |||||||||
| Nondeductible merger costs | 351 | — | — | |||||||||
| Other | 710 | 1,571 | (1,379 | ) | ||||||||
| Total income tax (benefit) expense | $ | 7,124 | $ | (142,492 | ) | $ | 1,326 | |||||
93
The components of deferred tax assets and liabilities and the tax effect of each are as follows:
| (dollars in thousands) | December 31, 2015 | December 31, 2014 | ||||||
| Deferred tax assets: | ||||||||
| Allowance for loan losses | $ | 5,957 | $ | 8,037 | ||||
| Net operating loss | 133,524 | 137,412 | ||||||
| Compensation and benefit plans | 544 | 1,277 | ||||||
| Fair value basis on securities | 363 | 656 | ||||||
| Pension and other post-retirement benefits | 1,857 | 1,470 | ||||||
| Other real estate owned | 2,176 | 2,256 | ||||||
| Gross unrealized securities losses | 3,787 | 2,560 | ||||||
| Other | 474 | 851 | ||||||
| Subtotal deferred tax assets | 148,682 | 154,519 | ||||||
| Less: Valuation allowance | — | (1,300 | ) | |||||
| Total deferred tax assets | 148,682 | 153,219 | ||||||
| Deferred tax liabilities: | ||||||||
| Core deposit intangible | 953 | 1,513 | ||||||
| Depreciable basis of premises and equipment | 301 | 563 | ||||||
| Net deferred loan fees and costs | 1,726 | 1,306 | ||||||
| Gross unrealized securities gains | 352 | 490 | ||||||
| Fair value basis of loans | 3,186 | 2,473 | ||||||
| Other | 448 | 441 | ||||||
| Total deferred tax liabilities | 6,966 | 6,786 | ||||||
| Net deferred tax assets | $ | 141,716 | $ | 146,433 | ||||
As of December 31, 2015 and December 31, 2014, net deferred income tax assets totaling $141.7 million and $146.4 million, respectively, are recorded on COB’s balance sheet. At December 31, 2014, the Company’s gross deferred tax assets were offset by a valuation allowance of $1.3 million. During 2015 management reevaluated the continuing need for this valuation allowance in accordance with the procedures described in the “Income Taxes” section of Note 1 and as more fully described below, applied its judgment to determine that it is more likely than not that all of the Company’s deferred tax assets will be realized.
The Company’s deferred tax assets consist primarily of consolidated federal and Bank-originated North Carolina loss carryforwards from prior periods. The consolidated federal net operating loss carryforwards are $352.0 million and $355.9 million and the North Carolina net economic loss carryforwards are $368.7 million and $371.8 million at December 31, 2015 and 2014, respectively. The remaining federal and North Carolina carryforward periods range between fourteen and eighteen years and nine and thirteen years, respectively, at December 31, 2015.
Management regularly evaluates the likelihood that the Company will be able to realize its deferred tax assets and the continuing need for a valuation allowance. In 2013 and prior years management determined that sufficient evidence was not available to conclude that it was more likely than not that all of its deferred tax assets could be realized, requiring a valuation allowance for certain of its deferred tax assets. At December 31, 2014 management determined, based on all available positive and negative evidence, that it is more likely than not that future taxable income will be available during the carryforward periods to absorb all of the consolidated federal net operating loss carryforward and all but a small portion of the Bank’s North Carolina net economic loss carryforward. As a result of this determination, $142.5 million of valuation allowance against the Company's deferred tax assets was reversed. A number of factors played a critical role in this determination, including:
| • | Improvements in the asset quality of the loan portfolio and diminishment of credit-related losses that were the source of the Company's losses; |
| • | Implementation of strong internal controls making it unlikely that the large volume of troubled loans leading to the Company’s losses between 2008 and 2012 will reoccur; |
| • | The increased remoteness and diminished relevance of such losses; |
| • | Continued improvement of the Company’s financial metrics and six consecutive quarters of earnings; |
| • | A credible forecast of future taxable income based on management’s demonstrated forecasting accuracy; |
94
| • | Various cost-reduction initiatives that will have a continuing positive effect on earnings in future periods; |
| • | Availability of tax planning strategies, and |
| • | Long-dated carryforward periods. |
Accordingly, upon consideration of all available objectively verifiable positive and negative evidence, management has applied its judgment to conclude that the Company’s valuation allowance should be reduced from $1.3 million at December 31, 2014 to $0 million at December 31, 2015.
Management will continue to regularly assess the Company’s ability to realize its deferred tax assets. Changes in earnings performance and future earnings projections may, among other factors, require the Company to adjust its valuation allowance, which would impact the Company's income tax expense in the period of adjustment.
Under GAAP, COB is not required to provide a deferred tax liability for the tax effect of additions to the tax bad debt reserve accumulating through 1987. Retained earnings at December 31, 2015 include approximately $5.0 million for which no provision for federal income tax has been made. In the remote possibility that circumstances occur requiring a reduction of the reserve, such reduction could be taxable and subject to the then-current corporate income tax rate.
Federal and North Carolina income tax returns for 2012 and tax years thereafter remain subject to examination by the relevant taxing authorities as of December 31, 2015. As of December 31, 2015 and December 31, 2014, COB had no material unrecognized tax benefits or accrued interest and penalties.
The merger of COB and Granite in 2011 resulted in an ownership change for Granite under Internal Revenue Code Section 382 and the Regulations thereunder. Accordingly, the Company is required to apply a limitation against Granite Corp.’s pre-acquisition net operating loss carryforwards and net unrealized built-in losses. During 2013, COB determined that it would be able to use only $2.9 million of the Granite Corp. net operating loss carryforwards and built-in losses and reduced both its deferred tax asset and related valuation allowance by $28.3 million.
On July 23, 2013, the State of North Carolina lowered the North Carolina corporate income tax rate from 6.9% to 6% effective 2014
and to 5% effective 2015. On July 28, 2015, North Carolina announced that, based on the state achieving its 2015 tax year revenue
target, the rate would be reduced to 4% during the 2016 tax year. The rate will be further reduced to 3% for post-2016 tax years
provided that additional revenue growth targets are reached. The rate reduction trigger resulted in a $2.3 million reduction in deferred
income tax asset. The Company recorded the impact of this legislation as a reduction in deferred income tax asset as of
September 30, 2015 and a charge to income tax expense in the third quarter of 2015.
95
11. Deposits
The following table summarizes deposit composition at the dates indicated:
| (dollars in thousands) | December 31, 2015 | % of Total | December 31, 2014 | % of Total | ||||||||||
| Noninterest-bearing demand deposits | $ | 386,329 | 19.84 | % | $ | 323,776 | 18.04 | % | ||||||
| Interest-bearing demand deposits | 366,842 | 18.84 | 358,162 | 19.96 | ||||||||||
| Savings deposits | 94,732 | 4.86 | 86,349 | 4.81 | ||||||||||
| Money market deposits | 478,304 | 24.56 | 437,821 | 24.40 | ||||||||||
| Brokered deposits | 55,764 | 2.86 | 37,673 | 2.10 | ||||||||||
| Time deposits less than $250,000 | 505,473 | 25.95 | 500,672 | 27.90 | ||||||||||
| Time deposits $250,000 or more | 60,093 | 3.09 | 49,967 | 2.78 | ||||||||||
| Total deposits | $ | 1,947,537 | 100.00 | % | $ | 1,794,420 | 100.00 | % | ||||||
The aggregate amount of jumbo certificates of deposit, which includes no brokered deposits, that have minimum denominations of $250,000, was approximately $60.1 million and $50.0 million in 2015 and 2014, respectively.
At December 31, 2015 and December 31, 2014, $0.3 million and $0.4 million of overdrawn transaction deposit accounts were reclassified to loans.
The accompanying table presents the scheduled maturities of time and brokered deposits at December 31, 2015.
| (dollars in thousands) | |||
| Year ending December 31, | |||
| 2016 | $ | 356,228 | |
| 2017 | 120,361 | ||
| 2018 | 71,408 | ||
| 2019 | 50,861 | ||
| 2020 | 22,224 | ||
| Thereafter | 248 | ||
| Total time deposits | $ | 621,330 | |
Interest expense on time deposits of $250,000 or more was approximately $0.5 million in 2015, $0.4 million in 2014 and $0.4 million in 2013.
12. Short-Term Borrowings and Long-Term Debt
The following table stratifies COB’s borrowings as short-term and long-term at the periods indicated:
| December 31, | ||||||||||||||
| (dollars in thousands) | 2015 | 2014 | ||||||||||||
| Balance | Rate | Balance | Rate | |||||||||||
| Short-term borrowings: | ||||||||||||||
| Retail customer repurchase agreements | $ | 7,219 | 0.21 | % | $ | 9,076 | 0.21 | % | ||||||
| Federal Home Loan Bank advances | 28,500 | 0.49 | % | — | — | % | ||||||||
| Total short-term borrowings | $ | 35,719 | $ | 9,076 | ||||||||||
| Long-term debt: | ||||||||||||||
| Federal Home Loan Bank advances | $ | 65,181 | 1.79 | $ | 68,234 | 1.68 | ||||||||
| Long-term notes payable | 5,415 | 1.43 | 5,338 | 1.43 | ||||||||||
| Junior subordinated debt | 56,702 | 1.92 | 56,702 | 1.78 | ||||||||||
| Total long-term debt | $ | 127,298 | $ | 130,274 | ||||||||||
96
Retail Repurchase Agreements and Federal Funds Purchased
Funds are borrowed on an overnight basis through retail repurchase agreements with bank customers and federal funds purchased from other financial institutions. Retail repurchase agreement borrowings are collateralized by securities of the U.S. Treasury and U.S. Government agencies and corporations.
At December 31, 2015, the Bank had no borrowings at the Federal Reserve Bank.
Information concerning retail repurchase agreements and federal funds purchased is as follows:
| (dollars in thousands) | 2015 | 2014 | 2013 | ||||||||||
| Retail Repurchase Agreements | Retail Repurchase Agreements | Retail Repurchase Agreements | |||||||||||
| Balance at December 31 | $ | 7,219 | $ | 9,076 | $ | 6,917 | |||||||
| Average balance during the year | 10,033 | 7,713 | 9,852 | ||||||||||
| Maximum month end balance | 16,753 | 12,217 | 13,064 | ||||||||||
| Weighted average interest rate: | |||||||||||||
| At December 31 | 0.21 | % | 0.21 | % | 0.21 | % | |||||||
| During the year | 0.22 | 0.21 | 0.21 | ||||||||||
Federal Home Loan Bank (“FHLB”) Advances
At December 31, 2015, the Bank had an available borrowing capacity of $80.8 million and access to additional borrowings of $294.1 million by pledging additional collateral with the FHLB. At December 31, 2015, outstanding FHLB advances under the current line amounted to $93.7 million and were at interest rates ranging from 0.49% to 6.15%. These borrowings are secured by collateral on qualifying mortgage loans and, as required, by other qualifying collateral. At December 31, 2014, FHLB advances amounted to $68.2 million and were at interest rates ranging from 0.93% to 6.15%.
At December 31, 2015, the scheduled maturities of FHLB advances payable over the next five years and thereafter, certain of which are convertible to a variable rate at the option of the FHLB before scheduled maturity, are as follows:
| (dollars in thousands) | |||
| Twelve Months Ended December 31, | |||
| 2016 | $ | 33,500 | |
| 2017 | 5,000 | ||
| 2018 | 5,181 | ||
| 2019 | — | ||
| 2020 | 50,000 | ||
| 2021 and thereafter | — | ||
| Total FHLB advances | $ | 93,681 | |
Long-term debt included the following advances from the FHLB at the periods indicated.
| (dollars in thousands) | |||||||||||
| December 31, | |||||||||||
| Maturity | Interest Rate | 2015 | 2014 | ||||||||
| September 8, 2015 | 3.7100 | % | — | 3,000 | |||||||
| September 27, 2016 | 0.9300 | 5,000 | 5,000 | ||||||||
| September 27, 2017 | 1.4200 | 5,000 | 5,000 | ||||||||
| August 27, 2018 | 6.1500 | 181 | 234 | ||||||||
| September 27, 2018 | 1.8400 | 5,000 | 5,000 | ||||||||
| June 15, 2020 | 1.8938 | 50,000 | 50,000 | ||||||||
| $ | 65,181 | $ | 68,234 | ||||||||
97
During the second quarter of 2013 we restructured $50 million of Federal Home Loan Bank advances from fixed rate to floating rate, which we expect to further reduce interest costs. The restructured advances, per ASC 470-50 “Debt - Modifications and Extinguishments,” are not substantially different than the prior advances so there was no debt extinguishment.
Long-term Notes Payable
The amount reported as long-term notes payable consists of a note, secured by Bank stock, payable to Howe Barnes Hoefer & Arnett, Inc. (“Howe Barnes”) in connection with the settlement of legal proceedings between Howe Barnes and the Bank. The note bears an imputed interest rate of 1.43% and matures in 2017.
Junior Subordinated Deferrable Interest Debentures
COB has Junior Subordinated Deferrable Interest Debentures or Junior Subordinated Debentures outstanding. Two issues of Junior Subordinated Debentures resulted from funds invested from the sale of trust preferred securities by FNB United Statutory Trust I (“FNB Trust I”) and by FNB United Statutory Trust II (“FNB Trust II”), which are owned by COB. Two additional issues of Junior Subordinated Debentures were acquired on April 28, 2006 as a result of COB’s merger with Integrity Financial Corporation. These acquired issues resulted from funds invested from the sale of trust preferred securities by Catawba Valley Capital Trust I (“Catawba Trust I”) and by Catawba Valley Capital Trust II (“Catawba Trust II”), which were owned by Integrity and acquired by COB in the merger. COB initiated the redemption of the securities issued by Catawba Valley Trust I as of December 30, 2007 and that trust was subsequently dissolved.
COB fully and unconditionally guarantees the preferred securities issued by each trust through the combined operation of the debentures and other related documents. Obligations under these guarantees are unsecured and subordinate to senior and subordinated indebtedness of COB. The preferred securities qualify as Tier 1 and Tier 2 capital for regulatory capital purposes.
During the second quarter of 2010, COB suspended payment of interest on junior subordinated debt for liquidity purposes. The associated interest expense on junior subordinated debt has been fully accrued and is included in the Consolidated Statements of Operations. Payment of this interest was made in connection with the recapitalization in order to be able to redeem CommunityOne Bancorp preferred stock. COB again suspended payment of interest on the Junior Subordinated Debentures as of the first quarter 2012, but paid all deferred and current interest due on February 5, 2015, effective as of the quarterly payment due March 2015.
Information concerning the Junior Subordinated Debentures is as follows at the periods indicated.
| (dollars in thousands) | Commencement | ||||||||||||||||||||
| Stated | of Early | As of December 31, | |||||||||||||||||||
| Maturity | Redemption | 2015 | 2014 | ||||||||||||||||||
| Issuer | Date | Period | Principal | Unpaid Interest | Principal | Unpaid Interest | Interest Rate | ||||||||||||||
| FNB Trust I | 12/15/2035 | 12/15/2010 | $ | 20,619 | $ | 18 | $ | 20,619 | $ | 1,107 | 3 month LIBOR + 1.37% = 1.88% at 12/31/15 | ||||||||||
| FNB Trust II | 6/30/2036 | 6/30/2011 | 30,928 | — | 30,928 | 1,588 | 3 month LIBOR + 1.32% = 1.65% at 12/31/15 | ||||||||||||||
| Catawba Trust II | 12/30/2032 | 12/30/2007 | 5,155 | — | 5,155 | 608 | 3 month LIBOR + 3.35% = 3.68% at 12/31/15 | ||||||||||||||
| Total Junior Subordinated Debentures | $ | 56,702 | $ | 18 | $ | 56,702 | $ | 3,303 | |||||||||||||
13. Employee Benefit Plans
Pension Plan
COB maintains a defined benefit pension plan. In September 2006, the Board of Directors of COB approved a modified freeze to the pension plan. Effective December 31, 2006, no new employees were eligible to enter the plan. Participants who were at least age 40, had earned 10 years of vesting service as an employee of COB and remained an active employee as of December 31, 2006 qualified for a grandfathering provision. In November 2010, COB’s Board of Directors approved an additional amendment to the plan which ceased participant benefit accruals as of December 31, 2010. The retirement benefits of all other participants in the pension plan were frozen as of December 31, 2006.
98
Benefits are based on the employee's compensation, years of service and age at retirement. COB's funding policy is to contribute annually to the plan an amount which is not less than the minimum amount required by the Employee Retirement Income Security Act of 1974 and not more than the maximum amount deductible for income tax purposes.
The following table sets forth the plan’s change in benefit obligation, plan assets and the funded status of the pension plan, using a December 31 measurement date, and amounts recognized in the consolidated statements as of December 31:
| (dollars in thousands) | ||||||||
| 2015 | 2014 | |||||||
| Change in Benefit Obligation | ||||||||
| Benefit obligation at beginning of year | $ | 15,169 | $ | 13,965 | ||||
| Service cost | — | — | ||||||
| Interest cost | 729 | 711 | ||||||
| Net actuarial loss | 938 | 1,399 | ||||||
| Benefits paid | (959 | ) | (906 | ) | ||||
| Benefit obligation at end of year | $ | 15,877 | $ | 15,169 | ||||
| Change in Plan Assets | ||||||||
| Fair value of plan assets at beginning of year | $ | 12,437 | $ | 12,831 | ||||
| Actual return on plan assets | (231 | ) | 362 | |||||
| Employer contributions | 250 | 150 | ||||||
| Benefits paid | (959 | ) | (906 | ) | ||||
| Fair value of plan assets at December 31 | $ | 11,497 | $ | 12,437 | ||||
| Funded Status at End of Year | $ | (4,380 | ) | $ | (2,732 | ) | ||
| Amounts Recognized in the Consolidated Balance Sheets | ||||||||
| Other Liabilities | $ | (4,380 | ) | $ | (2,732 | ) | ||
| Amounts Recognized in Accumulated Other Comprehensive Income | ||||||||
| Net actuarial loss | $ | 8,372 | $ | 6,855 | ||||
| Net amount recognized | $ | 8,372 | $ | 6,855 | ||||
| Weighted-Average Allocation of Plan Assets at End of Year | ||||||||
| Equity securities | 52 | % | 46 | % | ||||
| Debt securities | 47 | 54 | ||||||
| Cash and cash equivalents | 1 | — | ||||||
| Fixed income funds | — | — | ||||||
| Total | 100 | % | 100 | % | ||||
| Weighted-Average Plan Assumptions at End of Year | ||||||||
| Discount rate | 4.75 | % | 4.50 | % | ||||
| Expected long-term rate of return on plan assets | 8.00 | % | 8.00 | % | ||||
| Rate of increase in compensation levels | 5.50 | % | 5.50 | % | ||||
The expected long-term rate of return on plan assets considers the portfolio as a whole and not on the sum of the returns on individual asset categories.
99
Components of net periodic pension cost (income) and other amounts recognized in other comprehensive income are as follows:
| (dollars in thousands) | 2015 | 2014 | 2013 | |||||||||
| Net Periodic Pension Cost (Income) | ||||||||||||
| Service cost | $ | — | $ | — | $ | — | ||||||
| Interest cost | 729 | 711 | 646 | |||||||||
| Expected return on plan assets | (973 | ) | (987 | ) | (958 | ) | ||||||
| Amortization of prior service cost | — | — | — | |||||||||
| Amortization of net actuarial loss | 625 | 392 | 562 | |||||||||
| Total pension cost | $ | 381 | $ | 116 | $ | 250 | ||||||
| Other Changes in Plan Assets and Benefit Obligations | ||||||||||||
| Recognized in Other Comprehensive Income: | ||||||||||||
| Net actuarial loss (gain) | $ | 1,517 | $ | 1,632 | $ | (2,089 | ) | |||||
| Amortization of prior service credit | — | — | — | |||||||||
| Total recognized in other comprehensive loss (income) | 1,517 | 1,632 | (2,089 | ) | ||||||||
| Total Recognized in Net Periodic Pension Cost and Other Comprehensive Loss | $ | 1,898 | $ | 1,748 | $ | (1,839 | ) | |||||
The estimated net loss and prior service cost that will be amortized from accumulated other comprehensive income/(loss) into net periodic pension cost over the next year are approximately $0.7 million and $0, respectively.
COB’s investment policies and strategies for the pension plan use a target allocation for equity and for debt securities based on the funding status of the plan. The investment goals attempt to maximize returns while remaining within specific risk management policies. While the risk management policies permit investment in specific debt and equity securities, a significant percentage of total plan assets are maintained in mutual funds, approximately 99.4% at December 31, 2015, to assist in investment diversification. Generally the investments are readily marketable and can be sold to fund benefit payment obligations as they become payable.
The following table provides the fair values of investments held in the pension plan by major asset category:
December 31, 2015
| (dollars in thousands) | Fair Value | Quoted Prices in Active Markets for Identical Assets (Level 1) | Significant Other Observable Inputs (Level 2) | |||||||||
| Equity securities | $ | 5,390 | $ | 5,390 | $ | — | ||||||
| Debt securities | 6,037 | 6,037 | — | |||||||||
| Other | 70 | 70 | — | |||||||||
| Total fair value of pension assets | $ | 11,497 | $ | 11,497 | $ | — | ||||||
December 31, 2014
| (dollars in thousands) | Fair Value | Quoted Prices in Active Markets for Identical Assets (Level 1) | Significant Other Observable Inputs (Level 2) | |||||||||
| Equity securities | $ | 5,668 | $ | 5,668 | $ | — | ||||||
| Debt securities | 6,726 | 6,726 | — | |||||||||
| Other | 43 | 43 | — | |||||||||
| Total fair value of pension assets | $ | 12,437 | $ | 12,437 | $ | — | ||||||
The equity securities measured at fair value consist primarily of stock mutual funds (Level 1 inputs). Debt securities include corporate bonds, bond mutual funds, U.S. government and agency securities and obligations of state and political subdivisions (Level 1 inputs). Other investments consist of money market deposits (Level 1 inputs). For further information regarding levels of input used to measure fair value, refer to Note 19.
100
In 2015, COB contributed $250 thousand to its pension plan. COB expects to contribute $100 thousand to its pension plan in 2016. However, the assets of the COB Employees' Pension Plan are less in value than the present value of the accrued benefits (vested and unvested) of the participants in the Pension Plan on a termination and projected benefit obligation basis.
The estimated benefit payments for each year ending December 31 from 2016 through 2020 are as follows: $910 thousand in 2016, $910 thousand in 2017, $910 thousand in 2018, $930 thousand in 2019 and $920 thousand in 2020. The estimated benefit payments to be paid in the aggregate for the five year period from 2021 through 2025 are $5.0 million. The estimated benefit payments are based on the same assumptions used to measure the benefit obligation at December 31, 2015 and include estimated future employee service.
Supplemental Executive Retirement Plans
COB has maintained three noncontributory, nonqualified SERPs, covering certain executive employees, all of which have now been terminated.
Annual benefits payable under the first of these SERPs were based on factors similar to those for the pension plan, with offsets related to amounts payable under the pension plan and social security benefits. SERP costs, which were actuarially determined using the projected unit credit method and recorded on an unfunded basis, are charged to current operations and credited to a liability account on the consolidated balance sheet. In 2010, the Board of Directors approved an amendment to the plan which stopped additional benefit accrual under the SERP after December 31, 2010. This action did not impact a participant's vested or accrued benefit in the plan. In September, 2012 the Board of Directors approved an amendment to terminate the Plan. The amendment provides for lump sum cash distributions of participant benefits in accordance with Internal Revenue Code Section 409A. These payments were made in 2013 and there are no further obligations under this SERP.
In connection with the acquisition by COB of Carolina Fincorp, Inc. in 2000, CommunityOne assumed the obligations of Richmond Savings Bank, Inc., SSB under its Nonqualified Supplemental Retirement Plan. There was one retired executive covered under this plan, who was entitled to a retirement benefit of $30,000 per year payable for 10 years. Benefit payments began in 2012. In September, 2012 the Board of Directors approved an amendment to terminate the Plan. The amendment provided for a lump sum cash distribution of the participant benefit in accordance with Internal Revenue Code Section 409A. These payments were made during 2013 and there are no future obligations under this SERP.
As a result of the acquisition of Integrity Financial Corporation in 2006, CommunityOne assumed the obligations of a nonqualifying deferred compensation plan for the former president of Integrity. Under the plan provisions, benefit payments began in 2006 and were expected to be payable for 10 years; however, upon this former executive's death in 2014, the remaining balance was paid during 2015, and there are no further obligations under this SERP. During 2015, 2014 and 2013, provisions of $0, $11,000 and $17,000 respectively, were expensed for future benefits to be provided under this plan. The total liability under this plan was $0 at December 31, 2015 and $18,000 at December 31, 2014, respectively, and is included in other liabilities in the accompanying consolidated balance sheets. Payments amounting to $18,000 in 2015, $71,000 in 2014 and $78,000 in 2013 were made under the provisions of this SERP.
101
The following table sets forth the change in benefit obligation, plan assets and the funded status of the three SERPs, using a December 31 measurement date, and amounts recognized in the consolidated statements as of December 31:
| (dollars in thousands) | ||||||||
| 2015 | 2014 | |||||||
| Change in Benefit Obligation | ||||||||
| Benefit obligation at beginning of year | $ | 18 | $ | 263 | ||||
| Service cost | — | — | ||||||
| Interest cost | — | 11 | ||||||
| Amendments to plan | — | — | ||||||
| Net actuarial gain | — | (185 | ) | |||||
| Benefits paid | (18 | ) | (71 | ) | ||||
| Benefit obligation at end of year | $ | — | $ | 18 | ||||
| Change in Plan Assets | ||||||||
| Employer contributions | $ | 18 | $ | 71 | ||||
| Benefits paid | (18 | ) | (71 | ) | ||||
| Fair value of plan assets at end of year | $ | — | $ | — | ||||
| Funded Status at December 31 | $ | — | $ | (18 | ) | |||
| Amounts Recognized in the Consolidated Balance Sheets | ||||||||
| Other Liabilities | $ | — | $ | 18 | ||||
| Amounts Recognized in Accumulated Other Comprehensive Loss | ||||||||
| Net actuarial gain | $ | — | $ | — | ||||
| Prior service cost | — | — | ||||||
| Net amount recognized | $ | — | $ | — | ||||
| Weighted-Average Plan Assumption at End of Year: | ||||||||
| Discount rate | — | % | — | % | ||||
Components of net periodic SERP cost and other amounts recognized in other comprehensive loss are as follows:
| (dollars in thousands) | 2015 | 2014 | 2013 | |||||||||
| Net Periodic SERP Cost | ||||||||||||
| Service cost | $ | — | $ | — | $ | — | ||||||
| Interest cost | — | 11 | 84 | |||||||||
| Amortization of prior service cost | — | — | 155 | |||||||||
| Amortization of net actuarial gain | — | — | (1,015 | ) | ||||||||
| Net periodic SERP cost (income) | $ | — | $ | 11 | $ | (776 | ) | |||||
| Other Changes in Plan Assets and Benefit Obligations | ||||||||||||
| Recognized in Other Comprehensive Income | ||||||||||||
| Net actuarial loss (gain) | $ | — | $ | — | $ | 1,002 | ||||||
| Amortization of prior service credit | — | — | (155 | ) | ||||||||
| Total recognized in other comprehensive loss (income) | — | — | 847 | |||||||||
| Total Recognized in Net Periodic SERP (Income) Cost and Other Comprehensive Income (Loss) | $ | — | $ | 11 | $ | 71 | ||||||
Since there are no future obligations under these plans, there will be no (gain) loss or prior service cost that will be amortized from accumulated other comprehensive income (loss) into net periodic SERP cost in any future periods.
102
Other Postretirement Defined Benefit Plan
COB has maintained a postretirement benefit plan, which provides medical and life insurance benefits to retirees who obtained certain age and service requirements. The medical plan is contributory, with retiree contributions adjusted whenever medical insurance rates change. The life insurance plan was noncontributory.
In conjunction with the modified freeze of the pension plan, the postretirement medical and life insurance plan was also amended. Effective December 31, 2006, no new employees are eligible to enter the postretirement medical and life insurance plan. Participants who were at least age 40, had earned 10 years of vesting service as an employee of COB and remained an active employee as of December 31, 2006 qualified for a grandfathering provision. In November 2010, COB’s Board of Directors approved an additional amendment to the plan which ceased participant benefit accruals as of December 31, 2010.
In 2015, COB's Board of Directors approved a change to eliminate the life insurance benefit, the impact of which was recorded in 2015.
The following table sets forth the plans change in benefit obligation, plan assets and the funded status of the postretirement plans, using a December 31 measurement date, and amounts recognized in the consolidated statements as of December 31:
| (dollars in thousands) | ||||||||
| 2015 | 2014 | |||||||
| Change in Benefit Obligation | ||||||||
| Benefit obligation at beginning of year | $ | 1,085 | $ | 1,138 | ||||
| Settlement distributions and curtailment | (601 | ) | — | |||||
| Interest cost | 46 | 55 | ||||||
| Net actuarial gain (loss) | 16 | (15 | ) | |||||
| Plan participant contributions | 89 | 82 | ||||||
| Benefits paid | (102 | ) | (175 | ) | ||||
| Benefit obligation at end of year | $ | 533 | $ | 1,085 | ||||
| Change in Plan Assets | ||||||||
| Employer contributions | $ | 269 | $ | 93 | ||||
| Plan participant contributions | 89 | 82 | ||||||
| Settlement distributions | (256 | ) | — | |||||
| Benefits paid | (102 | ) | (175 | ) | ||||
| Fair value of plan assets at end of year | $ | — | $ | — | ||||
| Funded Status at December 31 | $ | (533 | ) | $ | (1,085 | ) | ||
| Amounts Recognized in the Consolidated Balance Sheets | ||||||||
| Other Liabilities | $ | 533 | $ | 1,085 | ||||
| Amounts Recognized in Accumulated Other Comprehensive Loss | ||||||||
| Net actuarial loss | $ | (112 | ) | $ | (147 | ) | ||
| Prior service credit | (6 | ) | (12 | ) | ||||
| Net amount recognized | $ | (118 | ) | $ | (159 | ) | ||
| Weighted-Average Plan Assumption at End of Year: | ||||||||
| Discount rate | 4.75 | % | 4.50 | % | ||||
Increasing or decreasing the assumed medical cost trend rate by one percentage point would not have a significant effect on either the postretirement benefit obligation at December 31, 2015 or the aggregate of the service and interest cost components of net periodic postretirement benefit cost for the year ended December 31, 2015.
103
Components of net postretirement benefit cost and other amounts recognized in other comprehensive income are as follows:
| (dollars in thousands) | 2015 | 2014 | 2013 | |||||||||
| Net Periodic Postretirement Benefit Cost | ||||||||||||
| Service cost | $ | — | $ | — | $ | — | ||||||
| Interest cost | 46 | 55 | 57 | |||||||||
| Amortization of prior service credit | (3 | ) | (10 | ) | (4 | ) | ||||||
| Effect of curtailment and settlement | (368 | ) | — | — | ||||||||
| Net periodic postretirement benefit cost | $ | (325 | ) | $ | 45 | $ | 53 | |||||
| Other Changes in Plan Assets and Benefit Obligations | ||||||||||||
| Recognized in Other Comprehensive Income | ||||||||||||
| Net actuarial gain | $ | 38 | $ | (15 | ) | $ | (223 | ) | ||||
| Amortization of prior service cost | 3 | 10 | 4 | |||||||||
| Total recognized in other comprehensive (income) loss | 41 | (5 | ) | (219 | ) | |||||||
| Total Recognized in Net Periodic Postretirement Benefit Cost and Other Comprehensive (Income) Loss | $ | (284 | ) | $ | 40 | $ | (166 | ) | ||||
The estimated net (gain) loss and prior service credit that will be amortized from accumulated other comprehensive income/(loss) into net periodic postretirement benefit cost over the next year are $(9,000) and $1,000.
The postretirement defined benefit plan is an unfunded plan. Consequently, there are no plan assets or cash contribution requirements other than for the direct payment of benefits.
The estimated benefit payments for each year ending December 31 from 2016 through 2020 are as follows: $40,000 in 2016, $30,000 in 2017, $30,000 in 2018, $30,000 in 2019 and $30,000 in 2020. The estimated benefit payments to be paid in the aggregate for the five year period from 2021 through 2025 are $150,000. The estimated benefit payments are based on the same assumptions used to measure the benefit obligation at December 31, 2015 and include estimated future employee service.
Matching Retirement/Savings Plan
COB has a matching retirement/savings plan which permits eligible employees to make contributions to the plan up to a specified percentage of compensation as defined by the plan. A portion of the employee contributions are matched by COB based on the plan formula, which is $0.50 for each dollar on the first 6% of eligible pay deferred by the employee under the plan. Additionally, commencing in 2007, COB on a discretionary basis may make an annual contribution up to a specified percentage of compensation as defined by the plan to the account of each eligible employee. COB did not make a discretionary contribution in 2015, 2014 or 2013. The matching and discretionary contributions amounted to $0.7 million in 2015, $0.6 million in 2014, and $0.5 million in 2013.
104
14. CommunityOne Bancorp (Parent Company)
The parent company’s principal asset is its investment in its bank subsidiary, the Bank.
The condensed financial position as of December 31, 2015 and 2014, and the condensed results of operations and cash flows for each of the years in the three-year period ended December 31, 2015 of COB, parent company only, are presented below.
| (dollars in thousands) | ||||||||||||
| 2015 | 2014 | |||||||||||
| Condensed Balance Sheets | ||||||||||||
| Assets: | ||||||||||||
| Cash | $ | 1,195 | $ | 6,032 | ||||||||
| Investment in subsidiaries | 330,089 | 322,615 | ||||||||||
| Other assets | 4,910 | 3,678 | ||||||||||
| Total Assets | $ | 336,194 | $ | 332,325 | ||||||||
| Liabilities and shareholders’ equity: | ||||||||||||
| Accrued liabilities | $ | 6,454 | $ | 8,707 | ||||||||
| Borrowed funds | 56,702 | 56,702 | ||||||||||
| Shareholders’ equity | 273,038 | 266,916 | ||||||||||
| Total Shareholders’ Equity and Liabilities | $ | 336,194 | $ | 332,325 | ||||||||
| 2015 | 2014 | 2013 | ||||||||||
| Condensed Statements of Operations | ||||||||||||
| Noninterest income | $ | 34 | $ | 33 | $ | 31 | ||||||
| Interest expense | (1,135 | ) | (1,146 | ) | (1,092 | ) | ||||||
| Noninterest expense | (2,712 | ) | (1,011 | ) | (742 | ) | ||||||
| Loss before tax (benefit) expense | (3,813 | ) | (2,124 | ) | (1,803 | ) | ||||||
| Income tax expense (benefit) | (306 | ) | (3,180 | ) | — | |||||||
| Income (Loss) before equity in undistributed net loss of subsidiaries | (3,507 | ) | 1,056 | (1,803 | ) | |||||||
| Equity in undistributed net income (loss) of subsidiaries | 10,421 | 149,402 | 320 | |||||||||
| Net income (loss) | $ | 6,914 | $ | 150,458 | $ | (1,483 | ) | |||||
| Condensed Statements of Cash Flows | 2015 | 2014 | 2013 | |||||||||
| Cash flows from operating activities | ||||||||||||
| Net Income (Loss) | $ | 6,914 | $ | 150,458 | $ | (1,483 | ) | |||||
| Adjustments to reconcile net income (loss) to net cash provided by (used in) operating activities: | ||||||||||||
| Equity in undistributed net income (loss) of subsidiaries | (10,421 | ) | (149,402 | ) | (320 | ) | ||||||
| Other, net | (3,485 | ) | (2,095 | ) | 1,153 | |||||||
| Net cash used in operating activities | (6,992 | ) | (1,039 | ) | (650 | ) | ||||||
| Cash flows from investing activities | ||||||||||||
| Downstream cash investment in subsidiary | — | (19,400 | ) | — | ||||||||
| Net cash used in investing activities | — | (19,400 | ) | — | ||||||||
| Cash flows from financing activities | ||||||||||||
| Proceeds from issuance of common stock, net of costs | 2,155 | 24,982 | — | |||||||||
| Other | — | 852 | 681 | |||||||||
| Net cash provided by financing activities | 2,155 | 25,834 | 681 | |||||||||
| Net increase (decrease) in cash | (4,837 | ) | 5,395 | 31 | ||||||||
| Cash at beginning of period | 6,032 | 637 | 606 | |||||||||
| Cash at end of period | $ | 1,195 | $ | 6,032 | $ | 637 | ||||||
105
15. Capital Matters
COB and the Bank are required to comply with capital adequacy requirements established by the federal banking agencies. Failure to meet these minimum capital requirements can initiate certain mandatory – and possible additional discretionary – actions by regulators that, if undertaken, could have a direct material effect on COB’s and the Bank's financial statements. Under the capital adequacy guidelines, COB and the Bank must meet specific capital guidelines that involve quantitative measures of assets, liabilities, and certain off-balance sheet items as calculated under regulatory accounting practices. COB's and the Bank's capital amounts and classification are also subject to qualitative judgments by the regulators about components, risk weighting, and other factors. In addition, the prompt corrective action provisions of federal law require the federal banking agencies to take action to resolve problems of insured depository institutions such as the Bank as their capital levels decrease.
Under revised capital rules established by the federal banking agencies, including the Federal Reserve Board and the OCC, effective for community banks as of January 1, 2015, capital adequacy is measured by certain risk-based capital ratios, supplemented by a leverage capital ratio. The revised capital rules assess an institution's risk-based capital through three ratios: a common equity Tier 1 capital (“CET 1”) ratio, an additional Tier 1 risk-based capital ratio, and a total capital ratio, which includes Tier 2 capital. CET 1 is comprised of the sum of common stock instruments and related surplus net of treasury stock, retained earnings, accumulated other comprehensive income (“AOCI”) and certain qualifying minority interests, less certain adjustments and deductions that include AOCI (based on an irrevocable option to neutralize the AOCI). Additional Tier 1 capital is comprised of noncumulative perpetual preferred stock, tier 1minority interests, grandfathered trust preferred securities, less certain intangibles; and Tier 2 capital, which may include the ALL up to a maximum of 1.25% of risk weighted assets, qualifying subordinated debt, qualifying preferred stock and hybrid capital instruments. The requirements also define the weights assigned to assets and off-balance sheet items to determine the risk weighted asset components of the risk-based capital rules.
The revised rules require a minimum CET 1 risk-based capital ratio of 4.5%, a minimum overall Tier 1 risk-based capital ratio of 6%, and a total risk-based capital ratio of 8%. In addition, the revised rules require a capital conservation buffer of up to 2.5% above each of the capital ratio requirements (CET 1, tier 1, and total risk-based capital) which must be met for a bank to be able to pay dividends, engage in share buybacks or make discretionary bonus payments to executive management without restriction. This capital conservation buffer will be phased in over a four year period starting on January 1, 2016. The revised rules also change the risk weighting of certain assets, including “high volatility” commercial real estate, past due assets, structured securities and equity holdings. When fully implemented, a banking organization would need to maintain a CET 1 capital ratio of at least 7%, a total Tier 1 capital ratio of at least 8.5% and a total risk-based capital ratio of at least 10.5% or it would be subject to restrictions on capital distributions and discretionary bonus payments to its executive management.
The leverage capital ratio, which serves as a minimum capital standard, considers Tier 1 capital only and is expressed as a percentage of average total assets for the most recent quarter, after reduction of those assets for goodwill and other disallowed intangible assets at the measurement date. Risks such as concentration of credit risks and the risk arising from non-traditional activities, as well as the institution's exposure to a decline in the economic value of its capital due to changes in interest rates, and an institution's ability to manage those risks are important factors that are to be taken into account by the federal banking agencies in assessing an institution's overall capital adequacy.
Quantitative measures established by regulation to ensure capital adequacy require each bank to maintain minimum amounts and ratios (set forth in the accompanying table) , a common equity Tier 1 capital (“CET 1”) ratio, an additional Tier 1 risk-based capital ratio, and a total capital ratio, which includes Tier 2 capital, and a leverage capital ratio, which is the percentage of Tier 1 capital to average total assets for the most recent quarter, after reduction of those assets for goodwill and other disallowed intangible assets at the measurement date. The minimum capital requirements to be characterized as “well-capitalized” and “adequately capitalized,” as defined by the prompt corrective action provision of federal law and CommunityOne’s capital ratios as of December 31, 2015 are noted in the following table. At December 31, 2015, the Bank was designated as “well capitalized.”
106
| Minimum Regulatory Requirement to be Well Capitalized | |||||||||||||||||||||||||
| (dollars in thousands) | Actual | For Capital Adequacy Purposes | Under Prompt Corrective Action Provisions | ||||||||||||||||||||||
| Amount | Ratio | Amount | Ratio | Amount | Ratio | ||||||||||||||||||||
| December 31, 2015 | |||||||||||||||||||||||||
| Total Capital (to Risk Weighted Assets) | |||||||||||||||||||||||||
| Consolidated | $ | 221,245 | 13.21 | % | $ | 133,986 | 8.00 | % | N/A | ||||||||||||||||
| CommunityOne Bank, N.A. | 225,510 | 13.48 | 133,839 | 8.00 | $ | 167,299 | 10.00 | % | |||||||||||||||||
| Tier 1 Capital (to Risk Weighted Assets) | |||||||||||||||||||||||||
| Consolidated | 187,845 | 11.22 | 66,968 | N/A | N/A | ||||||||||||||||||||
| CommunityOne Bank, N.A. | 209,541 | 12.53 | 66,893 | 4.00 | 99,944 | 6.00 | |||||||||||||||||||
| CET 1 (to Risk Weighted Assets) | |||||||||||||||||||||||||
| Consolidated | 187,845 | 11.22 | 66,968 | N/A | N/A | ||||||||||||||||||||
| CommunityOne Bank, N.A. | 209,541 | 12.53 | 75,255 | 4.50 | 116,601 | 7.00 | |||||||||||||||||||
| Tier 1 Capital (to Average Assets) | |||||||||||||||||||||||||
| Consolidated | 187,845 | 8.19 | $ | 91,744 | N/A | N/A | |||||||||||||||||||
| CommunityOne Bank, N.A. | 209,541 | 9.30 | 90,125 | 4.00 | 112,656 | 5.00 | |||||||||||||||||||
| December 31, 2014 | |||||||||||||||||||||||||
| Total Capital (to Risk Weighted Assets) | |||||||||||||||||||||||||
| Consolidated | $ | 203,150 | 14.58 | % | $ | 110,982 | 8.00 | % | N/A | ||||||||||||||||
| CommunityOne Bank, N.A. | 206,474 | 14.88 | 111,013 | 8.00 | 138,767 | 10.00 | |||||||||||||||||||
| Tier 1 Capital (to Risk Weighted Assets) | |||||||||||||||||||||||||
| Consolidated | 185,690 | 13.33 | 55,491 | N/A | N/A | ||||||||||||||||||||
| CommunityOne Bank, N.A. | 189,081 | 13.63 | 55,507 | 4.00 | 83,260 | 6.00 | |||||||||||||||||||
| Tier 1 Capital (to Average Assets) | |||||||||||||||||||||||||
| Consolidated | 185,690 | 9.78 | 75,937 | N/A | N/A | ||||||||||||||||||||
| CommunityOne Bank, N.A. | 189,081 | 9.94 | 76,068 | 4.00 | 95,085 | 5.00 | |||||||||||||||||||
16. Shareholders’ Equity
Earnings per Share
Basic net income (loss) per share, or basic earnings (loss) per share (“EPS”), is computed by dividing net income (loss) to common shareholders by the weighted average number of common shares outstanding for the period. Diluted EPS reflects the potential dilution that could occur if COB’s potential common stock, which consists of dilutive stock options and a common stock warrant were issued. As required for entities with complex capital structures, a dual presentation of basic and diluted EPS is included on the face of the income statement. During 2015, the Company had 24,236,147 weighted average basic shares outstanding and 24,251,604 weighted average diluted shares outstanding.
Due to a net loss for the twelve month period ended December 31, 2013, all stock options and the common stock warrant were considered antidilutive and thus are not included in this calculation for those years. For the periods ended December 31, 2015, December 31, 2014 and December 31, 2013, there were 22,112, 22,127 and 22,738 antidilutive shares, respectively. Of the antidilutive shares, the number of shares relating to stock options were 40 at December 31, 2015, 55 at December 31, 2014, and 666 at December 31, 2013. Average antidilutive shares relating to the common stock warrant were 22,072 for each of the three years. During the periods for which the exercise price exceeded the average market price for the period, the stock options and common stock warrant were omitted from the calculation of diluted earnings per share for their respective periods.
During the years ended December 31, 2015, 2014 and 2013, COB had no preferred stock outstanding.
Common Stock Issuance
On December 30, 2014, we raised $25.0 million of additional capital, net of costs, through the issuance of 2,367,425 shares of common stock in a private placement offering to certain “accredited investors,” at an average price of $10.56. Of this amount, $19.4 million was contributed to the Bank.
107
Stock Based Compensation
For the years ended December 31, 2015, 2014 and 2013, COB had five share-based compensation plans in effect. The compensation expense charged against income for those plans was $2,429,000, $853,000, and $628,000, respectively, and the related income tax benefit was $929,000, $326,000 and $250,000, respectively.
On June 21, 2012, COB shareholders approved the FNB 2012 Incentive Plan. The 2012 Incentive Plan, which was intended to replace the 2003 plan, provides for the grant of stock options, restricted stock and other stock-based awards, as well as cash-based performance awards. An amended and restated Incentive Plan was approved by the shareholders on June 20, 2013. As amended, a total of 1,800,000 shares have been authorized for issuance under the 2012 Incentive Plan, and the maximum number of shares of COB common stock with respect to which an employee may be granted awards under the 2012 Incentive Plan during any calendar year period is 100,000 shares.
During 2015, a total of 106,247 shares of long-term restricted stock were granted to certain employees and directors, while during 2014 and 2013 a total of 223,503 shares and 158,302 shares, respectively, of such restricted stock were granted to employees and directors. All awards were made pursuant to the 2012 Incentive Plan. With the U.S. Treasury sale of its shares in May 2014 and in compliance with the U.S. Treasury’s TARP regulations, the Company cancelled 269,946 shares of restricted stock awards granted to certain senior executives.
COB adopted stock compensation plans in 1993 and 2003 that allow for the granting of incentive and nonqualified stock options to key employees and directors. The 2003 stock compensation plan also allows for the granting of restricted stock. Under terms of both the 1993 and 2003 plans, options are granted at prices equal to the fair market value of the common stock on the date of grant. Options become exercisable after one year in equal, cumulative installments over a five-year period. No option shall expire later than ten years from the date of grant. No further grants can be made under the 1993 stock compensation plan after March 10, 2003. Based on the stock options outstanding at December 31, 2015, no shares of common stock have been reserved for issuance under the 1993 stock compensation plan. No shares of common stock have been reserved for issuance under the 2003 stock compensation plan. At December 31, 2015, there were 11,450 shares available under the 2003 plan for the granting of additional options or stock awards.
With the completion of the Granite Merger, each outstanding option to purchase shares of Granite Corp. common stock, whether or not exercisable, was converted into options to purchase COB common stock. After adjusting for the Reverse Stock Split and rounding up to the nearest whole share, there were 78 stock options assumed from Granite Corp. All of those options expired during 2014, and none remain exercisable at December 31, 2015.
COB assumed three stock compensation plans in its acquisition of Integrity Financial Corporation in 2006. Qualified and nonqualified stock options are outstanding under these plans for grants issued from 1997 to 2004 to key employees and directors at a price equal to fair market value on the date of grant. No additional grants will be made under these plans. Based on the stock options outstanding at December 31, 2015, no shares of common stock have been reserved for issuance under these stock compensation plans.
The fair market value of each option award is estimated on the date of grant using either a Monte Carlo option pricing model or the Black-Scholes option pricing model, depending on the vesting terms. The risk-free interest rate is based on a U.S. Treasury instrument with a life that is similar to the expected life of the option grant. Expected volatility is based on the historical volatility of the COB’s common stock over approximately the previous 6 years, except for the options granted in 2013 and 2014, which are based on the historical volatility of COB's common stock since July 1, 2012. The expected life of the options has historically been considered to be approximately 6 years. The expected dividend yield is zero, based upon the current yield in effect at the date of grant, as the Company has not declared a dividend since 2009. There were 283,857 options granted during 2015, with a volatility of 30% and a risk-free rate ranging between 1.82% and 2.32%. There were 255,227 options granted to employees during 2014, with a volatility ranging between 30% and 40% and a risk-free rate ranging between 2.14% and 2.59%. There were 54,060 stock options granted in 2013 with a volatility of 29.60% and a risk-free rate of 2.60%.
108
The following is a summary of stock option activity:
| For the Years Ended December 31, | |||||||||||||||||||||
| 2015 | 2014 | 2013 | |||||||||||||||||||
| Shares | Weighted Average Exercise Price | Shares | Weighted Average Exercise Price | Shares | Weighted Average Exercise Price | ||||||||||||||||
| Outstanding at beginning of year | 303,272 | $ | 14.33 | 52,812 | $ | 30.75 | 1,125 | $ | 1,963.29 | ||||||||||||
| Granted | 283,857 | 14.84 | 255,227 | 15.20 | 54,060 | 7.86 | |||||||||||||||
| Exercised | (296 | ) | 8.40 | — | — | — | — | ||||||||||||||
| Forfeited or expired | (4,519 | ) | 17.39 | (4,767 | ) | 242.98 | (2,373 | ) | 425.40 | ||||||||||||
| Outstanding at end of year | 582,314 | 14.56 | 303,272 | 14.33 | 52,812 | 30.75 | |||||||||||||||
| Options exercisable at end of year | 68,023 | 13.45 | 12,712 | 15.02 | 666 | 1,823.23 | |||||||||||||||
At December 31, 2015, information concerning stock options outstanding and exercisable is as follows:
| Options Outstanding | Options Exercisable | |||||||||||||||||
| Range of Exercise Prices | Shares | Weighted Average Remaining Contractual Life (Years) | Weighted Average Exercise Price | Number Exercisable | Weighted Average Remaining Contractual Life (Years) | Weighted Average Exercise Price | ||||||||||||
| $1.00 - $7.99 | 47,419 | 7.29 | $ | 7.86 | 23,588 | 7.29 | $ | 7.86 | ||||||||||
| $8.00 - $15.99 | 96,067 | 8.99 | 10.58 | 7,832 | 8.37 | 9.92 | ||||||||||||
| $16.00 - $16.99 | 438,788 | 9.17 | 16.00 | 36,563 | 8.75 | 16.00 | ||||||||||||
| $1,590.00 - $1,800.00 | 40 | 1.37 | 1,668.75 | 40 | 1.72 | 1,668.75 | ||||||||||||
During 2015, the intrinsic value of options exercised was $1,000, while in 2014 and 2013, there was no intrinsic value of options exercised, and the grant-date fair value of options vested was $235,000 in 2015, 46,000 in 2014 and zero in 2013. There were 296 options exercised in 2015.
The following is a summary of non-vested restricted stock activity:
| For the Years Ended December 31, | ||||||||||||||
| 2015 | 2014 | |||||||||||||
| Shares | Weighted Average Grant Date Fair Value | Shares | Weighted Average Grant Date Fair Value | |||||||||||
| Non-vested at beginning of year | 187,133 | $ | 8.19 | 268,361 | $ | 10.14 | ||||||||
| Granted | 106,247 | 10.95 | 223,503 | 7.60 | ||||||||||
| Vested | (214,845 | ) | 8.90 | (31,516 | ) | 10.25 | ||||||||
| Cancelled | — | — | (267,937 | ) | 9.38 | |||||||||
| Forfeited or expired | (6,409 | ) | 9.13 | (5,278 | ) | 9.49 | ||||||||
| Unvested at end of year | 72,126 | $ | 10.05 | 187,133 | $ | 8.19 | ||||||||
The fair value of restricted stock vested in 2015, 2014 and 2013 was $2.9 million, $323,000, and $0 respectively.
During 2015, a total of 106,247 shares of restricted stock were granted by the COB Board of Directors to the top five officers, six of the seven non-executive directors and a larger group of employees. The awards to the top officers and directors constituted restricted stock, some of which were time vesting only, with 1/3 of the stock vesting on each of the first, second and third anniversary of the date of grant and a portion of which also require COB common stock to reach a certain stock price target. The awards to the larger group of employees vest over time, with 1/4 of the stock vesting on each of the first, second, third and fourth anniversary of the date of the grant. During 2014, a total of 223,503 shares of restricted stock were granted by the COB Board of Directors to the top six officers, eight of the nine non-executive directors and a larger group of employees. The awards to the top officers and directors constituted restricted stock, some of which were time vesting only, with 1/3 of the stock vesting on each of the first, second and third anniversary of the date of grant and a portion of which also require COB common stock to reach a certain stock price target. The awards to the larger group of employees vest over time, with 1/4 of the stock vesting on each of the first, second, third and fourth anniversary of the date of the grant. During 2013, a total of 158,302 shares were granted to similar groups of top officers, directors and other employees.
109
The awards to the top officers constituted long-term restricted stock, some of which were time vesting only, with 2/3 of the stock vesting on the second anniversary of the date of grant and the final 1/3 vesting on the third anniversary of the date of grant, and a portion of which also require COB common stock to reach a certain stock price target. The awards to the directors constituted restricted stock, some of which were time vesting only, with 1/3 of the stock vesting on the first anniversary of the date of grant, the second 1/3 vesting on the second anniversary of the date of grant, and the final 1/3 vesting on the third anniversary of the date of grant, and a portion of which also require COB common stock to reach a certain stock price target. The awards to the larger group of employees vest over time, with 1/4 of the stock vesting on each of the first, second, third and fourth anniversary of the date of the grant. With the U.S. Treasury sale of its shares in May 2014 and in compliance with the U.S. Treasury TARP regulations, the Company cancelled 267,937 shares of restricted stock awards granted to certain senior executives. As provided in amendments to the employments agreements entered into by each of the Named Executive Officers ("NEO") with the company in connection with the Merger Agreement with Capital Bank, and for tax planning purposes with respect to Section 28G and 4999 of the Internal Revenue Code, all the unvested restricted stock held by each NEO, except 1,835 shares granted to Ms. DeSimone, vested as of December 30, 2015.
As of December 31, 2015, unrecognized compensation cost related to non-vested share-based compensation arrangements granted under COB’s stock benefit plans totaled $0.7 million, which will be fully recognized during 2016 upon the successful completion of the Merger with Capital.
COB funds the option shares and restricted stock from authorized but unissued shares. COB does not typically purchase shares to fulfill the obligations of the stock benefit plans. COB’s policy does allow option holders under certain plans to exercise options with seasoned shares.
17. Off-Balance Sheet Arrangements
In the normal course of business, various commitments are outstanding that are not reflected in the consolidated financial statements. Significant commitments at December 31, 2015 are discussed below.
Commitments by the Bank to extend credit and undisbursed advances on customer lines of credit are agreements to lend to a customer as long as there is no violation of any condition established in the contract. At December 31, 2015, total commitments to extend credit and undisbursed advances on customer lines of credit amounted to $380.9 million. Commitments generally have fixed expiration dates or other termination clauses and may require payment of a fee. Since many commitments expire without being fully drawn, the total commitment amounts do not necessarily represent future cash requirements. COB evaluates each customer’s creditworthiness on a case-by-case basis. The amount of collateral obtained, if deemed necessary, upon extension of credit is based on the credit evaluation of the borrower.
The Bank issues standby letters of credit whereby each guarantees the performance of a customer to a third party if a specified triggering event or condition occurs. The guarantees generally expire within one year and may be automatically renewed depending on the terms of the guarantee. All standby letters of credit provide for recourse against the customer on whose behalf the letter of credit was issued, and this recourse may be further secured by a pledge of assets. The maximum potential amount of undiscounted future payments related to standby letters of credit was $0.7 million at December 31, 2015 and $2.7 million at December 31, 2014.
The Bank's exposure to credit loss in the event of nonperformance by the other party to the financial instrument for commitments to extend is represented by the contractual notional amount of those instruments. The Bank uses the same credit policies in making commitments and conditional obligations as they do for on-balance sheet instruments. The fair value of these commitments was not considered material.
COB does not have any special purpose entities or other similar forms of off-balance sheet financing.
18. Derivatives and Financial Instruments
A derivative is a financial instrument that derives its cash flows, and therefore its value, by reference to an underlying instrument, index or referenced interest rate. These instruments include interest rate swaps, caps, floors, collars, options or other financial instruments designed to hedge exposures to interest rate risk or for speculative purposes.
Accounting guidance requires an entity to recognize all derivatives as either assets or liabilities in the balance sheet, and measure those instruments at fair value. Changes in the fair value of those derivatives are reported in current earnings or other comprehensive income depending on the purpose for which the derivative is held and whether the derivative qualifies for hedge accounting.
In connection with its asset / liability management objectives, the Company during the first quarter of 2014 entered into two interest rate swaps on $40 million of FHLB advances, each swap having a $20 million notional amount, that convert the floating rate cash flow exposure on the FHLB advances to a fixed rate cash flow. The first swap converted a floating rate FHLB advance paying three month LIBOR plus 140 basis points to a fixed rate of 3.55%. The second swap converted a floating rate FHLB advance paying three month LIBOR plus 138 basis points to a fixed rate of 3.33%. As structured, the receive-variable, pay-fixed swaps are cash flow hedges
110
that were highly effective during 2014 and 2015. The differences in cash flows in each period between the fixed rate interest payments that the Company makes and the variable rate interest payments received is currently reported in earnings. These interest rate swaps mature on June 15, 2020. The cash flows on interest rate swaps are included in the Consolidated Statements of Cash Flows as interest paid.
Mortgage banking derivatives used in the ordinary course of business consist of mandatory forward sales contracts or forward contracts and rate lock loan commitments. The fair value of our derivative instruments is primarily measured by obtaining pricing from broker-dealers recognized to be market participants.
The table below provides data about the amount of gains and losses related to derivative instruments designated as hedges included in the “Accumulated other comprehensive loss” section of “Shareholders’ Equity” on the COB’s Consolidated Balance Sheets.
| Gain (Loss), Net of Tax Recognized in Accumulated Other Comprehensive Loss (Effective Portion) | ||||||||
| As of | ||||||||
| (dollars in thousands) | December 31, 2015 | December 31, 2014 | ||||||
| Derivatives designated as hedging instruments: | ||||||||
| Interest rate swap contracts - FHLB advances | $ | (466 | ) | $ | (324 | ) | ||
During 2012, we began originating residential mortgage loans for sale in the secondary market. We have established guidelines in originating, selling loans to Fannie Mae, and retaining or selling the loan servicing rights. The commitments to borrowers to originate residential mortgage loans and the forward sales commitments to investors are freestanding derivative instruments. As such, they do not qualify for hedge accounting treatment, and the fair value adjustments for these instruments is recorded through the Consolidated Statements of Operations in mortgage loan income. The fair market value of mortgage banking derivatives at December 31, 2015 was recorded in the consolidated balance sheet in Other Assets.
| Gain (Loss) Recognized | ||||||||||||
| For Twelve Months Ended | ||||||||||||
| (dollars in thousands) | December 31, 2015 | December 31, 2014 | December 31, 2013 | |||||||||
| Derivatives not designated as hedging instruments: | ||||||||||||
| Mortgage loan rate lock commitments | $ | (1 | ) | $ | 2 | 4 | ||||||
| Mortgage loan forward sales | (1 | ) | 17 | (218 | ) | |||||||
| Total | $ | (2 | ) | $ | 19 | $ | (214 | ) | ||||
19. Fair Values of Assets and Liabilities
We use fair value measurements to record fair value adjustments to certain assets and liabilities and to determine fair value disclosures. Securities available-for-sale, derivative assets and liabilities, certain FHLB advances hedged by interest rate swaps designated as cash flow hedges, performing mortgage loans held for sale, and mortgage servicing rights are recorded at fair value on a recurring basis. Additionally, from time to time, we may be required to record at fair value other assets and liabilities on a nonrecurring basis, such as nonperforming loans held for sale, loans held for investment, impaired loans and certain other assets and liabilities. These nonrecurring fair value adjustments typically involve application of lower of cost or market accounting or write-downs of individual assets or liabilities.
Fair Value Hierarchy
We group assets and liabilities at fair value in three levels, based on the markets in which the assets and liabilities are traded and the reliability of the assumptions used to determine fair value. These levels are:
Level 1: Valuation is based upon quoted prices for identical instruments traded in active markets.
Level 2: Valuation is based upon quoted prices for similar instruments in active markets, quoted prices for identical or similar instruments in markets that are not active, and model-based valuation techniques for which all significant assumptions are observable in the market.
111
Level 3: Valuation is generated from model-based techniques that use at least one significant assumption not observable in the market. These unobservable assumptions reflect estimates of assumptions that market participants would use in pricing the asset or liability. Valuation techniques include use of option pricing models, discounted cash flow models and similar techniques.
The following is a description of valuation methodologies used for assets and liabilities recorded at fair value:
Investment Securities
Investment securities classified as available-for-sale are recorded at fair value on a recurring basis. Investment securities classified as held-to-maturity are recorded at amortized cost. Fair value measurement is based upon quoted prices, if available. If quoted prices are not available, fair values are measured using independent pricing models or other model-based valuation techniques such as the present value of future cash flows, adjusted for the security's credit rating, prepayment assumptions and other factors such as credit loss assumptions. Level 1 securities include those traded on an active exchange, such as the New York Stock Exchange, U.S. Treasury securities that are traded by dealers or brokers in active over-the-counter markets and money market funds. Level 2 securities include mortgage-backed securities issued by government sponsored entities, municipal bonds and corporate debt securities. Securities classified as Level 3 may include asset-backed securities in less liquid markets.
Liquidity is a significant factor in the determination of the fair values of available-for-sale debt securities. Market price quotes may not be readily available for some positions, or positions within a market sector where trading activity has slowed significantly or ceased. Some of these instruments are valued using a discounted cash flow model, which estimates the fair value of the securities using internal credit risk, interest rate and prepayment risk models that incorporate management's best estimate of current key assumptions such as default rates, loss severity and prepayment rates. Principal and interest cash flows are discounted using an observable discount rate for similar instruments with adjustments that management believes a market participant would consider in determining fair value for the specific security. Underlying assets are valued using external pricing services, where available, or matrix pricing based on the vintages and ratings. Situations of illiquidity generally are triggered by the market's perception of credit uncertainty regarding a single company or a specific market sector. In these instances, fair value is determined based on limited available market information and other factors, principally from reviewing the issuer's financial statements and changes in credit ratings made by one or more ratings agencies.
Loans Held for Sale
Loans held for sale are carried at the lower of cost or fair value less estimated costs to sell. Once sold, the loans are beyond the reach of COB in all respects and the purchasing investor has all rights of ownership, including the ability to pledge or exchange the loans. Most of the loans sold are without recourse. Gains or losses on loan sales are recognized at the time of sale, are determined by the difference between net sales proceeds and the carrying value of the loan sold, and are included in Consolidated Statements of Operations. Since loans held for sale are carried at the lower of cost or fair value, the fair value of loans held for sale is based on contractual agreements with independent third party buyers. As such, we classify loans held for sale subjected to nonrecurring fair value adjustments as Level 2.
Loans Held for Investment
We do not record loans held for investment at fair value on a recurring basis. However, from time to time, a loan is considered impaired and the related impairment is charged against the allowance or a specific allowance is established. Loans for which it is probable that payment of interest and principal will not be made in accordance with the contractual terms of the loan agreement are considered impaired. Once a loan is identified as impaired, management determines the fair value of the loan to quantify impairment, should such exist. The fair value of impaired loans is estimated using one of several methods, including collateral net liquidation value, market value of similar debt, enterprise value, and discounted cash flows. Those impaired loans not requiring a specific allowance represent loans for which the fair value of the expected repayments or collateral meet or exceed the recorded investments in such loans. At December 31, 2015 and December 31, 2014, substantially all of the total impaired loans were evaluated based on the fair value of the collateral. Impaired loans where an allowance is established based on the fair value of collateral require classification in the fair value hierarchy. We record impaired loans as nonrecurring Level 3.
Other Real Estate Owned
OREO is adjusted to fair value upon transfer of the loans to OREO. Subsequently, OREO is carried at the lower of carrying value or fair value less estimated costs to sell. Fair value is based upon independent market prices, appraised values of the collateral or management's estimation of the value of the collateral. Given the lack of observable market prices for identical properties, we record OREO as nonrecurring Level 3.
Interest Rate Locks and Forward Loan Sale Commitments
We enter into interest rate lock commitments and commitments to sell mortgages. The fair value of interest rate lock commitments is based on servicing rate premium, origination income net of origination costs, fall out rates and changes in loan pricing between the commitment date and the balance sheet date. We record interest rate lock commitments as recurring level 3, and based on their immaterial value, has excluded them from the fair value table.
112
Interest Rate Swaps
We enter into interest rate swaps to hedge the variability of interest cash flow payments on certain FHLB advances. Changes in fair value of these cash flow hedges are recorded through other comprehensive income. Any ineffectiveness of the hedge is included in current period earnings. The fair value of our interest rate swaps is based on a third party valuation because there is not a readily available quoted price in the market. We record interest rate swap commitments as recurring level 2.
Mortgage Servicing Rights
The fair value of mortgage servicing rights (“MSR”) is dependent upon a number of assumptions including the fee per loan, the cost to service, the expected loan prepayment rate, and the discount rate. In determining the fair value of the existing MSR management reviews the key assumptions, analyzes pricing in the market for comparable MSR, and uses a third party provider to independently calculate the fair value of its MSR. We record mortgage servicing rights as recurring Level 3.
Assets and Liabilities Recorded at Fair Value on a Recurring Basis
Assets and liabilities carried at fair value on a recurring basis at December 31, 2015 are summarized in the following table:
| (dollars in thousands) | Total | Level 1 | Level 2 | Level 3 | ||||||||||||
| Assets: | ||||||||||||||||
| Available-for-sale debt securities: | ||||||||||||||||
| U.S. government sponsored agencies | $ | 2,008 | $ | — | $ | 2,008 | $ | — | ||||||||
| Residential mortgage-backed securities-GSE | 278,107 | — | 278,107 | — | ||||||||||||
| Residential mortgage-backed securities-Private | 33,578 | — | 33,577 | — | ||||||||||||
| Commercial mortgage-backed securities-GSE | 21,611 | — | 21,611 | — | ||||||||||||
| Commercial mortgage-backed securities-Private | 17,575 | — | 17,575 | — | ||||||||||||
| Corporate notes | 37,555 | — | 37,555 | — | ||||||||||||
| Total available-for-sale debt securities | 390,434 | — | 390,433 | — | ||||||||||||
| Mortgage servicing rights | 2,231 | — | — | 2,231 | ||||||||||||
| Interest rate swaps | (755 | ) | $ | — | (755 | ) | $ | — | ||||||||
| Total assets at fair value | $ | 391,910 | $ | — | $ | 389,678 | $ | 2,231 | ||||||||
Assets and liabilities carried at fair value on a recurring basis at December 31, 2014 are summarized in the following table:
| (dollars in thousands) | Total | Level 1 | Level 2 | Level 3 | ||||||||||||
| Assets: | ||||||||||||||||
| Available-for-sale debt securities: | ||||||||||||||||
| U.S. government sponsored agencies | $ | 2,044 | $ | — | $ | 2,044 | $ | — | ||||||||
| Residential mortgage-backed securities-GSE | 290,145 | — | 290,145 | — | ||||||||||||
| Residential mortgage-backed securities-Private | 17,271 | — | 17,271 | — | ||||||||||||
| Commercial mortgage-backed securities-GSE | 21,957 | — | 21,957 | — | ||||||||||||
| Commercial mortgage-backed securities-Private | 10,215 | — | 10,215 | — | ||||||||||||
| Corporate notes | 8,407 | — | 8,407 | — | ||||||||||||
| Total available-for-sale debt securities | 350,039 | — | 350,039 | — | ||||||||||||
| Mortgage servicing rights | 1,726 | — | — | 1,726 | ||||||||||||
| Interest rate swaps | (525 | ) | — | (525 | ) | — | ||||||||||
| Total assets at fair value | $ | 351,240 | $ | — | $ | 349,514 | $ | 1,726 | ||||||||
113
The following tables present a reconciliation of all assets and liabilities measured at fair value on a recurring basis using significant unobservable inputs (Level 3) during the periods indicated:
| Fair Value Measurements Using Significant | ||||||||
| Unobservable Inputs (Level 3) | ||||||||
| Mortgage Servicing Rights | ||||||||
| (dollars in thousands) | Twelve Months Ended December 31, | |||||||
| 2015 | 2014 | |||||||
| Beginning balance at January 1, | $ | 1,726 | $ | 1,552 | ||||
| Total gains or losses (realized/unrealized): | ||||||||
| Included in earnings, gross | 1,088 | 644 | ||||||
| Less amortization | (583 | ) | (470 | ) | ||||
| Balance, end of period | $ | 2,231 | $ | 1,726 | ||||
Assets and Liabilities Recorded at Fair Value on a Nonrecurring Basis
We may be required, from time to time, to measure certain assets at fair value on a nonrecurring basis in accordance with U.S. generally accepted accounting principles. These include assets that are measured at the lower of cost or market that were recognized at fair value below cost at the end of the period. This is due to further deterioration in the value of the assets.
Assets measured at fair value on a nonrecurring basis are included in the following table at December 31, 2015:
| (dollars in thousands) | Total | Level 1 | Level 2 | Level 3 | ||||||||||||
| Impaired loans, net | $ | 3,418 | $ | — | $ | — | $ | 3,418 | ||||||||
| Other real estate owned | 10,630 | — | — | 10,630 | ||||||||||||
| Total assets at fair value | $ | 14,048 | $ | — | $ | — | $ | 14,048 | ||||||||
Assets measured at fair value on a nonrecurring basis are included in the following table at December 31, 2014:
| (dollars in thousands) | Total | Level 1 | Level 2 | Level 3 | ||||||||||||
| Impaired loans, net | $ | 7,433 | $ | — | $ | — | $ | 7,433 | ||||||||
| Other real estate owned | 15,579 | — | — | 15,579 | ||||||||||||
| Total assets at fair value | $ | 23,012 | $ | — | $ | — | $ | 23,012 | ||||||||
Quantitative Information about Level 3 Fair Value Measurements
| (dollars in thousands) | Fair Value at December 31, 2015 | Valuation Techniques | Unobservable Input | Range | ||||||
| Impaired loans, net | $ | 3,418 | Discounted appraisals | Collateral discounts | 1.00% - 30.00% | |||||
| Other real estate owned | 10,630 | Discounted appraisals | Collateral discounts | 1.00% - 30.00% | ||||||
| Mortgage servicing rights | 2,231 | Discounted cash flows | Prepayment rate | 10.00% - 25.00% | ||||||
| Mortgage servicing rights | Discount rate | 6.00% - 10.00% | ||||||||
114
| (dollars in thousands) | Fair Value at December 31, 2014 | Valuation Techniques | Unobservable Input | Range | ||||||
| Impaired loans, net | $ | 7,433 | Discounted appraisals | Collateral discounts | 1.00%-30.00% | |||||
| Other real estate owned | 15,579 | Discounted appraisals | Collateral discounts | 1.00%-30.00% | ||||||
| Mortgage servicing rights | 1,726 | Discounted cash flows | Prepayment rate | 10.00% - 25.00% | ||||||
| Mortgage servicing rights | Discount rate | 6.00% - 10.00% | ||||||||
Level 3 Valuation Methodologies. Following is a description of the unobservable inputs used for Level 3 fair value measurements.
Disclosure of fair value information about financial instruments, whether or not recognized in the balance sheet, for which it is practicable to estimate that value is required. Fair value estimates are made at a specific point in time, based on relevant market information and information about the financial instrument. These estimates do not reflect any premium or discount that could result from offering for sale at one time our entire holdings of a particular financial instrument.
Because no market exists for a portion of our financial instruments, fair value estimates are based on judgments regarding future expected loss experience, current economic conditions, risk characteristics of various financial instruments, and other factors. These estimates are subjective in nature and involve uncertainties and matters of significant judgment and, therefore, cannot be determined with precision. Changes in assumptions could significantly affect the estimates.
Fair Value of Financial Instruments
The following methods and assumptions were used to estimate the fair value for each class of COB's financial instruments.
Cash and cash equivalents. Fair value equals the carrying value of such assets due to their nature and is classified as Level 1.
Investment securities. The fair value of investment securities is based on quoted market prices, if available. If a quoted market price is not available, fair value is estimated using quoted market prices for similar securities. The fair value of equity investments in the restricted stock of the FRBR and FHLB approximates the carrying value. The fair value of investment securities is classified as Level 1 if a quoted market price is available, or Level 2 if a quoted market price is not available.
Loans held for sale. Substantially all residential mortgage loans held for sale are pre-sold and their carrying value approximates fair value. We classified the fair value of loans held for sale as Level 2.
Loans held for investment. The fair value of fixed rate loans is estimated by discounting the future cash flows using the current rates at which similar loans would be made to borrowers with similar credit ratings and for the same remaining maturities. The fair value of variable rate loans with frequent repricing and negligible credit risk approximates book value. The fair value of loans is further discounted by credit and liquidity factors. We classified the fair value of loans as Level 3.
Accrued interest receivable and payable. The carrying amounts of accrued interest payable and receivable approximate fair value and are classified as Level 2 if the related asset or liability is classified as Level 2, or Level 3 if the related asset or liability is classified as Level 3.
Deposits. The fair value of noninterest-bearing and interest-bearing demand deposits and savings are the amounts payable on demand because these products have no stated maturity. The fair value of time deposits is estimated using the rates currently offered for deposits of similar remaining maturities and are classified as Level 2.
Borrowed funds. The carrying value of retail repurchase agreements is considered to be a reasonable estimate of fair value. The fair value of FHLB advances and other borrowed funds is estimated using the rates currently offered for advances of similar remaining maturities and is classified as Level 2. For the long-term note payable, the current market rate for similar debt is substantially equal to the rate on this note, so its fair value approximates its carrying value.
Junior subordinated debentures. Included in junior subordinated debentures are variable rate trust preferred securities issued by COB. Fair values for the trust preferred securities were estimated by developing cash flow estimates for each of these debt instruments based on scheduled principal and interest payments and current interest rates. Once the cash flows were determined, a rate for comparable subordinated debt was used to discount the cash flows to the present value. The estimated fair value for our junior subordinated debentures have declined due to wider credit spreads (i.e. spread to LIBOR) on similar trust preferred issues. This is due, in part, to proposed bank regulatory changes in bank capital structure. We classified the fair value of junior subordinated debentures as Level 3.
Interest rate swaps. The fair value of interest rate swaps are measured based on third party cash flow models discounted to the valuation date and are classified as Level 2.
Financial instruments with off-balance sheet risk. The fair value of financial instruments with off-balance sheet risk is considered to approximate carrying value, since the large majority of these future financing commitments would result in loans that have variable
115
rates and/or relatively short terms to maturity. For other commitments, generally of a short-term nature, the carrying value is considered to be a reasonable estimate of fair value.
The estimated fair values of financial instruments for continuing operations are as follows at the periods indicated:
| At December 31, 2015 | ||||||||||||||||||||
| (dollars in thousands) | Carrying Value | Estimated Fair Value | Level 1 | Level 2 | Level 3 | |||||||||||||||
| Financial Assets of Operations: | ||||||||||||||||||||
| Cash and cash equivalents | $ | 39,175 | $ | 39,175 | $ | 39,175 | $ | — | $ | — | ||||||||||
| Investment securities: Available-for-sale | 390,434 | 390,434 | — | 390,434 | — | |||||||||||||||
| Investment securities: Held-to-maturity | 147,967 | 145,184 | — | 145,184 | — | |||||||||||||||
| Loans held for sale | 5,403 | 5,403 | — | 5,403 | — | |||||||||||||||
| Loans, net | 1,528,600 | 1,513,226 | — | — | 1,513,226 | |||||||||||||||
| Accrued interest receivable | 5,305 | 5,305 | — | 1,630 | 3,675 | |||||||||||||||
| Interest rate swaps | (755 | ) | (755 | ) | — | (755 | ) | — | ||||||||||||
| Financial Liabilities of Operations: | ||||||||||||||||||||
| Deposits | 1,947,537 | 1,945,691 | — | 1,945,691 | — | |||||||||||||||
| Retail repurchase agreements | 7,219 | 7,219 | — | 7,219 | — | |||||||||||||||
| Federal Home Loan Bank advances | 93,681 | 95,781 | — | 95,781 | — | |||||||||||||||
| Long-term notes payable | 5,415 | 5,415 | — | — | 5,415 | |||||||||||||||
| Junior subordinated debentures | 56,702 | 32,536 | — | — | 32,536 | |||||||||||||||
| Accrued interest payable | 367 | 367 | — | 349 | 18 | |||||||||||||||
| At December 31, 2014 | ||||||||||||||||||||
| (dollars in thousands) | Carrying Value | Estimated Fair Value | Level 1 | Level 2 | Level 3 | |||||||||||||||
| Financial Assets of Operations: | ||||||||||||||||||||
| Cash and cash equivalents | $ | 95,882 | $ | 95,882 | $ | 95,882 | $ | — | $ | — | ||||||||||
| Investment securities: Available-for-sale | 350,040 | 350,040 | — | 350,040 | — | |||||||||||||||
| Investment securities: Held-to-maturity | 142,461 | 140,875 | — | 140,875 | — | |||||||||||||||
| Loans held for sale | 2,796 | 2,796 | — | 2,796 | — | |||||||||||||||
| Loans, net | 1,337,443 | 1,328,895 | — | — | 1,328,895 | |||||||||||||||
| Accrued interest receivable | 4,885 | 4,885 | — | 1,262 | 3,623 | |||||||||||||||
| Interest rate swaps | (525 | ) | (525 | ) | — | (525 | ) | — | ||||||||||||
| Financial Liabilities of Operations: | ||||||||||||||||||||
| Deposits | 1,794,420 | 1,793,205 | — | 1,793,205 | — | |||||||||||||||
| Retail repurchase agreements | 9,076 | 9,076 | — | 9,076 | — | |||||||||||||||
| Federal Home Loan Bank advances | 68,234 | 71,462 | — | 71,462 | — | |||||||||||||||
| Long-term notes payable | 5,338 | 5,338 | — | — | 5,338 | |||||||||||||||
| Junior subordinated debentures | 56,702 | 32,341 | — | — | 32,341 | |||||||||||||||
| Accrued interest payable | 3,624 | 3,624 | — | 321 | 3,303 | |||||||||||||||
There were no transfers between valuation levels for any assets during the years ended December 31, 2015 or December 31, 2014. If different valuation techniques are deemed necessary, we would consider those transfers to occur at the end of the period when the assets are valued.
116
20. Common Dividends
COB is a legal entity separate and distinct from its banking and other subsidiaries and has in the past relied on dividends from the Bank as its primary source of liquidity. There are limitations and requirements imposed by applicable law and regulation on the payment of dividends by the Bank to COB, as well as by COB to its shareholders. See “Supervision and Regulation - Dividends.” COB did not declare any dividends with respect to its common stock in 2015.
| Item 9. | CHANGES IN AND DISAGREEMENTS WITH ACCOUNTANTS ON ACCOUNTING AND FINANCIAL DISCLOSURE |
None
| Item 9A. | CONTROLS AND PROCEDURES |
Evaluation of Disclosure Controls and Procedures
COB’s management, with the participation of its Chief Executive Officer and its Chief Financial Officer, has evaluated the effectiveness of COB’s disclosure controls and procedures as of December 31, 2015. Based on that evaluation, COB’s Chief Executive Officer and Chief Financial Officer concluded that COB’s disclosure controls and procedures were effective as of December 31, 2015.
Management’s Report on Internal Control over Financial Reporting
Management of COB is responsible for establishing and maintaining adequate internal control over financial reporting for the Company, as defined in Rule 13a-15(f) of the Exchange Act. COB’s internal control over financial reporting is a process designed to provide reasonable assurance to management and the board of directors regarding the reliability of the financial reporting and the preparation of COB’s financial statements for external reporting purposes in accordance with GAAP. COB’s internal control over financial reporting includes those policies and procedures that (i) pertain to the maintenance of records that, in reasonable detail, accurately and fairly reflect the transactions and disposition of COB’s assets; (ii) provide reasonable assurance that transactions are recorded as necessary to permit preparation of financial statements in accordance with GAAP, and that receipts and expenditures of COB are being made only in accordance with the authorizations of COB’s management and directors; and (iii) provide reasonable assurance regarding prevention or timely detection of unauthorized acquisition, use or disposition of COB’s assets that could have a material effect on the financial statements.
Because of its inherent limitations, internal control over financial reporting may not prevent or detect misstatement. Also projections of any evaluation of effectiveness to future periods are subject to the risk that controls may become inadequate because of changes in conditions, or that the degree of compliance with the policies or procedures may deteriorate.
Management has evaluated the effectiveness of the Company’s internal control over financial reporting as of December 31, 2015 based on criteria established in Internal Control - Integrated Framework issued by the Committee of Sponsoring Organizations of the Treadway Commission (2013 Framework), commonly referred to as the 2013 COSO framework. Based on this evaluation, management has concluded that the Company maintained effective internal control over financial reporting as of December 31, 2015.
COB’s internal control over financial reporting has been audited by Dixon Hughes Goodman LLP, an independent registered public accounting firm. Their report expresses an unqualified opinion on the effectiveness of COB’s internal control over financial reporting as of December 31, 2015.
Management is also responsible for compliance with laws and regulations relating to safety and soundness which are designated by the FDIC and the Office of the Comptroller of the Currency, as the appropriate federal banking agency. Management assessed its compliance with these designated laws and regulations relating to safety and soundness and has concluded that the Company complied, in all significant respects, with such laws and regulations during the year ended December 31, 2015.
Changes in Internal Control over Financial Reporting
The Company quarterly assesses the adequacy of its internal control over financial reporting and enhances its controls in response to internal control assessments and internal and external audit and regulatory recommendations, as well as changes in its processes and procedures and related changes in the control environment. No control enhancements during the year ended December 31, 2015 have materially affected, or are reasonably likely to materially affect, the Company’s internal control over financial reporting.
| Item 9B. | OTHER INFORMATION |
None
117
PART III
| Item 10. | DIRECTORS, EXECUTIVE OFFICERS, AND CORPORATE GOVERNANCE |
Directors
Our current Board of Directors consists of eight members, all of which are elected by the shareholders. The names and ages of our current directors, along with the present position and qualifications, their principal occupations and directorships held with public corporations during the past five years and the year first elected as a director are set forth below.
Scott B. Kauffman, 41, has been a director of the Company and the Bank since October 21, 2011 and serves on the Strategic Planning and the Compensation and Nominating Committee. Mr. Kauffman is a Partner at Oak Hill Capital Management, where since 2009 he has focused on the firm’s business and financial services investments. He is responsible for originating, structuring and managing the investments in the Business and Financial Services Group. Prior to joining Oak Hill, Kauffman was a Managing Director at Goldman, Sachs & Co. in the Financial Institutions Group, where for 13 years he was actively engaged in maintaining and building client relationships, providing strategic advice and transaction execution and expertise to boards of directors and executive and senior management of financial institutions. Mr. Kauffman was the Co-Chief Operating Officer for the America’s Financial Institutions Bank Group and a member of the Merger Leadership Group. Mr. Kauffman currently serves as a director of Tri-Plus Holdings Inc. He holds his Chartered Financial Analyst designation and is a member of The Association for Investment Management and Research and a member of The Investment Analyst Society of Chicago. Mr. Kauffman’s expertise in the financial services investment and transactional area and his investment banking expertise allow him to bring relevant insight and strategic outlook to our operations and business plans.
Jerry R. Licari, 69, has been a director of the Company and the Bank since October 21, 2011. He is Chair of the Audit Committee and serves on the Risk Management Committee. He is currently Partner of Uncle Maddio’s of Charlotte, LLC, a pizza franchise. Prior to that, Mr. Licari was a lead and audit engagement partner for KPMG LLP and served major U.S. banks and insurance companies from 1977 to 2004. Mr. Licari also served as an SEC Reviewing partner (concurring partner) for insurance and bank clients filing with the SEC from 1981-2000, and held numerous leadership positions including the Director of the Global Center for Industry Solutions from 2004-2006, U.S. Banking Partner in Charge from 2002-2004 and U.S. Partner in Charge of the Financial Risk Management Practice from 2000-2001. Mr. Licari’s deep audit experience in the financial services industry brings valuable experience to the Board with respect to accounting and strategic aspects of the Company’s business, and to the Audit Committee on which he serves as “audit committee financial expert.”
J. Chandler Martin, 65, has been a director of the Company and the Bank since October 21, 2011. Mr. Martin serves as Chair of the Board of Directors and Lead Independent Director. He also is a member on the Strategic Planning Committee and the Compensation and Benefits Committee. Mr. Martin retired in 2008 as Treasurer at Bank of America where he was responsible for funding, liquidity and interest rate risk management. Previously, he was the Enterprise Market and Operational Risk Executive and the risk management executive for Global Corporate and Investment Banking. Mr. Martin returned to Bank of America for nine months beginning in October of 2008 to assist the organization in the integration process for enterprise risk management following the company’s acquisition of Merrill Lynch. During that time he served as the Enterprise Credit and Market Risk Executive. In 2008, Mr. Martin served as a Policy Group member of The Counterparty Risk Management Policy Group III and co-chaired the Risk Monitoring and Risk Management Working Group. Mr. Martin is a member of the board of directors of CNL Healthcare Properties, Inc. and CNL Healthcare Properties II, Orlando, Florida based real estate investment trusts, and serves as the chair of the audit committees. Mr. Martin also serves as an Advisory Board Member of Corrum Capital Management, an alternative asset management firm, and on the Board of Directors of Burroughs & Chapin Company, Inc., a South Carolina based real estate investment trust. Mr. Martin’s expertise in the risk management area, both the credit and funding sides, offers valuable experience to the Board and the Compensation and Benefits and Strategic Planning Committees.
T. Gray McCaskill, CPCU, 58, has served as a director of the Company and the Bank since June 20, 2013 and serves on the Audit Committee and the Risk Management Committee. Mr. McCaskill is Chief Executive Officer for the Senn Dunn Insurance North Carolina locations of Greensboro, High Point, Charlotte, Raleigh, and Wilmington. Senn Dunn Insurance is a Marsh & McLennan Agency LLC Company which specializes in business insurance, employee benefits and personal insurance. In that and other executive capacities at Senn Dunn from 1985 until it was purchased by Marsh & McLennan Agency LLC in July 2014, he helped build Senn Dunn into the largest privately-owned insurance agency in North Carolina with over 160 employees. Mr. McCaskill also is active in the community, serving on numerous community and non-profit boards, including the Boy Scouts of America, United Way, Habitat for Humanity, First Tee of the Triad, Guilford Merchants Association, American Red Cross and Juvenile Diabetes Research Foundation. He is a former board member of Carolina Bank, a community bank headquartered in Greensboro, North Carolina. Mr. McCaskill provides the Board with his expertise as a business owner and his perspective on the Greensboro market as well as business prospects and sales throughout our footprint.
118
H. Ray McKenney, Jr., 61, has served as a director of the Company and the Bank since 2006. He is Chair of the Compensation and Nominating Committee and serves on the Audit Committee. Mr. McKenney is President of MBM Auto Management, a multi-franchise automobile and power sports management company he founded in 1981. Mr. McKenney currently serves on the board of trustees of Gaston Christian Schools. He also serves on the board of directors for Carolina Chevrolet and Carolina Cadillac Dealers Association. Mr. McKenney was a founding director of First Gaston Bank of North Carolina and served on the board from 1995 to 2006, with a term as chairman of the board. He also served on the board of its parent holding company, Integrity Financial Corporation, during the same time period. Mr. McKenney’s experience as a director of the Company and its predecessor companies and his expertise as a business owner provide the Board with needed experience on the
Compensation and Nominating Committee and the Audit Committee and perspective on the local markets in which we serve.
John C. Redett, 48, has served as a director of the Company and the Bank since August 15, 2014. He serves on the Strategic Planning Committee and the Compensation and Nominating Committee. Mr. Redett currently is a Partner at The Carlyle Group LP, focusing on opportunities in the global financial services sector. Prior to joining Carlyle in 2007, Mr. Redett served as Vice President in the Financial Institutions Group at The Goldman Sachs Group, Inc. He also has been a Vice President in the Financial Institutions Group at J. P. Morgan, and an Associate, in the Financial Institutions Group at Credit Suisse First Boston. Mr. Redett serves on the Board of The TCW Group, a global asset management firm, where he is a member of the audit committee. Mr. Redett’s expertise in the financial services investment and transactional areas allow him to bring thoughtful and relevant insight and strategic outlook into our operations and business plans.
Robert L. Reid, 60, has been a director of the Company and the Bank since October 21, 2011 and serves on the Strategic Planning Committee. Mr. Reid was appointed President of the Company and CommunityOne Bank upon consummation of the Company’s recapitalization on October 21, 2011, and was appointed Chief Executive Officer effective October 1, 2014. Prior to the recapitalization, Mr. Reid had been advising the Company since October 2010. Mr. Reid spent 30 years with Wachovia Corporation and its predecessor, with extensive leadership roles in community banking, retail banking, corporate banking, commercial banking, business banking, real estate finance, capital management and wealth management. At the time of his retirement in June 2009, Mr. Reid was Executive Vice President/Managing Director: Real Estate Division for Wachovia Corporation. From 2003 to 2008, Mr. Reid was President of the Retirement and Investment Products Group at Wachovia. From December 2000 to April 2003 and from May 1996 to December 1997, Mr. Reid served as the CEO of First Union - Pennsylvania/Delaware, providing direct management and leadership for First Union’s community and branch banking business in Pennsylvania and Delaware. From December 1997 to December 2000, Reid served as the CEO of First Union - Atlantic, overseeing First Union’s community and branch banking business in New Jersey, New York and Connecticut. Mr. Reid has held leadership positions in various community organizations, non-profits and university and community colleges. Mr. Reid’s extensive branch and community banking experience and his role as President and CEO of the Bank provides the Board with unique insight into bank operations and customers.
Boyd C. Wilson, Jr., 63, has served as a Director of the Company and the Bank since October 21, 2011. He is a Chair of the Risk Management Committee and serves on the Audit Committee. Mr. Wilson is Executive Vice President of Broyhill Investments, Inc., an investment company located in Lenoir, North Carolina, where he has served in such capacity since 2005 and has served as a director since 2007. Mr. Wilson also serves as Vice President and Chief Financial Officer of BMC Fund, Inc., a regulated investment company located in Lenoir, North Carolina, where he has served in such capacity since 2006. From 2002 to 2005, Mr. Wilson served as Vice President of Finance and Administration of Kincaid Furniture Company, Incorporated, a furniture manufacturer located in Hudson, North Carolina. Mr. Wilson served as a director of Bank of Granite Corporation and Bank of Granite from 1996 to 2013. Mr. Wilson is active in the community; he serves on the Lenoir-Rhyne University Board of Trustees and the Caldwell Memorial Hospital, Inc. Board of Trustees, and has served the boards of several other community organizations. Mr. Wilson is a Certified Public Accountant and a Chartered Global Management Accountant. Mr. Wilson’s accounting and financial experience provides value to the Audit and Risk Management Committees and his involvement in the communities in the Western area of our franchise provide insights to the Board on the local market in which we serve.
Executive Officers
The names and ages of each of the executive officers of the Company the Bank, along with their qualifications, are set forth below.
Robert L. Reid, 60, President and Chief Executive Officer, Company and CommunityOne Bank since October 2014; President, Company and CommunityOne Bank October 2011-September 2014; President, Bank of Granite Corp. and Bank of Granite, October 2011- June 2013; Independent Consultant, Company and CommunityOne Bank, October 2010 – October 2011; Executive Vice President/Managing Director, Real Estate Division, Wachovia Corp., 2009; President, Retirement and Investment Products Group, Wachovia Corp., 2003 – 2008. Officer of the Company since 2011.
David L. Nielsen, 51, Executive Vice President and Chief Financial Officer, Company and CommunityOne Bank since October 2011; Executive Vice President and Chief Financial Officer, Bank of Granite Corporation and Bank of Granite, October 2011 – June 2013; Independent Consultant, Company and CommunityOne Bank, October 2010 – October 2011; Executive Vice President and Group
119
Risk Officer for Wholesale Banking, Wells Fargo Corp., 2010; Managing Director and Chief Operating Officer, Global Markets and Investment Banking, Wachovia Corp., 2006-2009. Officer of the Company since 2011.
Deborah B. Auman, 59, Executive Vice President and Chief Human Resources Officer, Company since April 2014 and CommunityOne Bank since October 2011; Senior Vice President and Chief Human Resources Officer, CommunityOne Bank, 2001 - October 2011. Officer of the Company since April 2014.
Beth S. DeSimone, 56, Executive Vice President, General Counsel and Secretary, Company and CommunityOne Bank since November 2011; Executive Vice President, General Counsel and Secretary, Bank of Granite Corporation and Bank of Granite, November 2011- June 2013; Counsel, Arnold & Porter, LLP, Washington, D.C. 1986-2011. Officer of the Company since November 2011.
Neil W. Machovec, 60, Chief Credit Officer, Company and CommunityOne Bank since March 2013; Chief Credit Officer, Bank of Granite Corporation and Bank of Granite, March 2013 – June 2013; Commercial Risk Executive, CommunityOne Bank, November 2011-March 2013; Senior Vice President and Credit Manager, Bank of America, 2007-November 2011. Officer of the Company since March 2013.
Angus M. McBryde, III, 53, Executive Vice President and Treasurer, Company and CommunityOne Bank since October 2011; Executive Vice President and Treasurer, Bank of Granite Corporation and Bank of Granite, October 2011 – June 2013; Independent Consultant, Company and CommunityOne Bank, October 2010 - October, 2011; Senior Vice President, Treasury, Wachovia Corp., 2007 - 2009. Officer of the Company since October 2011.
Gregory P. Murphy, 68, Executive Vice President and Chief Workout Officer, Company and CommunityOne Bank since October 2013; Executive Vice President and Chief Workout Officer, Bank of Granite Corporation and Bank of Granite, October 2011 – June 2013; Independent Consultant, Bank of Granite, Company and CommunityOne Bank- September 2010 - October 2011; Managing Director, Helix Financial, LLC 2009-2010; Managing Director, CRG Partners, 2007-2008 (both managers of distressed assets). Officer of the Company since October 2011.
Margaret B. Norris, 59, Executive Vice President and Chief Operating Officer, Company and CommunityOne Bank since November 2014; Executive Vice President, Operations, Technology and Integration Manager, CommunityOne Bank, September 2012-November 2014; Senior Vice President, Integration and Stabilization Manager, CommunityOne Bank, October 2011-September 2012; Independent Consultant, Dover Mortgage Co., February 2011-October 2011; Senior Vice President, Wholesale Merger Conversion Event Manager, Wells Fargo Corp./Wachovia Corp., March 2009-July 2010; Various positions with Wachovia Corp., 1984-2009. Officer of the Company since November 2014.
Our executive officers are elected by the Board on an annual basis and serve until their successors have been duly elected and qualified.
Corporate Governance
The Board and Meetings
The directors of the Company also serve on the board of directors of the Bank. The Board of Directors holds regular meetings to conduct the normal business of the Company and meets on other occasions when required for special circumstances. The Bank board of directors also holds regular meetings and may meet on other occasions as circumstances warrant.
The Board maintains four standing committees: the Audit Committee, Compensation and Nominating Committee, Risk Management Committee and the Strategic Planning Committee. The members and principal functions of each committee are described below under “Board Role in Oversight of Risk.” During the fiscal year ended December 31, 2015, the Board held a total of 11 meetings. Each director attended 75% or more of the total number of meetings of the Board and of the committees on which that director served. Directors are encouraged to attend the annual meeting of shareholders. All of the Company’s directors attended the Company’s last annual meeting of shareholders.
The members of the Board who are independent within the meaning of the NASDAQ listing standards meet regularly in executive session without management present. Although executive sessions are generally held in conjunction with a regularly scheduled Board meeting, other sessions may be called by two or more independent directors in their own discretion or at the request of the Board. Independent directors that were not members of management or representatives of The Carlyle Group or Oak Hill Capital Management met as a group at the request of the Board two times during 2015.
Board Structure
The Board has a separate Chair, which is a non-executive position, and a President and Chief Executive Officer. The Board believes that, as part of its efforts to embrace and adopt good corporate governance practices, different individuals should hold the positions of
120
Chair of the Board and President and Chief Executive Officer to aid in the Board’s oversight of management. We believe that by having a separate Chair, we are better able to protect shareholder interests by providing independent oversight of management.
The duties of the non-executive Chair of the Board include:
| • | presiding over all meetings of the Board; |
| • | overseeing the preparation of the agenda for Board meetings with the Secretary and in consultation with the CEO and other members of the Board; |
| • | assigning tasks to the appropriate committees of the Board; |
| • | ensuring that information flows openly between senior management and the Board; and |
| • | presiding over all meetings of shareholders. |
The Chair of the Board, J. Chandler Martin, also is designated by the Board as the “lead independent director.” We believe that the Board, the Board committees as presently constituted and the leadership structure of the Board enables the Board to fulfill its role in overseeing and monitoring the management and operations of the Company and protecting the interests of the Company and its shareholders.
Board Role in Oversight of Risk
Executive management is ultimately accountable to the Board and Company shareholders for risk management. The Board oversees management’s risk controlled strategies, as well as planning and responding to risks arising from changing business conditions or the initiation of new activities or products. The Board also is responsible for overseeing compliance with laws and regulations, responding to recommendations from auditors and supervisory authorities and overseeing management’s compliance with internal policies and controls addressing the operations and risks of significant activities.
Executive management seeks to implement fully integrated and effective risk management throughout the organization. Executive management has adopted an enterprise risk management (“ERM”) program that is overseen by the Board, designed to identify, objectively measure and manage and control our major risk exposures, which include capital, management, earnings, credit, interest rate, liquidity, market (or price), operational, reputational, legal/compliance and strategic risk. A fundamental part of our ERM program is to understand what level of risk is appropriate for the Company and the Bank, to identify and understand the risks the Company faces in both its current and future activities and monitor the steps management is taking to manage and reduce those risks to the levels the Board and management consider appropriate. By adopting this comprehensive and standardized view of the nature and level of risks to which we are exposed and the interaction of the various risk components identified in our ERM program, we are better able to assess and manage our risks and react to uncertainties. Our ERM program is administered by our General Counsel. In that role, she regularly meets with the President and Chief Executive Officer, and with the Chair of the Board to discuss the Company’s various primary areas of risk identified as part of the ERM program, and how those risks are being measured and controlled. Executive management makes a quarterly ERM presentation to the full Board and regularly reports on corporate governance, compliance and risk-related matters at other Board meetings. The material risks facing the Company are reviewed and overseen by one of the four standing committees of the Board.
The Company also maintains a “three lines of defense” risk management and control model. Under this model, the following three areas within the Company have the following clearly defined and specific roles in identifying, addressing and managing risk:
| • | Operating management, through undertaking periodic assessments and implementing and maintaining effective internal controls processes and procedures on a daily basis. |
| • | The Risk and Compliance Function to review the first line of defense controls to make sure they are designed appropriately and operating as intended, conduct risk assessments and monitor changes in the operating environment. |
| • | The Internal Audit and Loan Review Functions to provide an independent review of controls and risk management procedures and report the results to management and the Board. |
The Company’s General Counsel has the responsibility to ensure that the Company maintains an effective overall internal control system and operational risk management process that adequately measures, monitors and controls risk, and directs the implementation of a sound risk governance and loss prevention program to provide maximum protection to the Company’s assets. In addition, the Company operates an internal loan review function, responsible for managing credit risk by overseeing loan processes and loan portfolio. The Chief Loan Review Officer reports directly to the Risk Management Committee of the Board and provides monthly reports to it. The Company’s Internal Audit function conducts regular audits of various areas of the bank. The Chief Internal Auditor reports directly to the Audit Committee of the Board and provides monthly reports to it.
The Board, as a whole, and through its committees, has responsibility for the oversight of risk management. In its risk oversight role, the Board has the responsibility to satisfy itself that the risk management processes implemented by management are working as designed. While the full Board is charged with ultimate oversight responsibility of risk management, various committees of the Board, to ensure objectivity, have specific responsibilities with respect to the Company’s risk oversight. Executive or senior management has direct involvement in risk management via reporting and regular communications to committees of the Board. Minutes and reports of all committee meetings are reviewed by the full Board. Policies for all major risk areas are reviewed by Board committees and approved by the full Board on at least an annual basis.
121
The Company encourages open communication between management and the Board. Certain members of senior management attend Board meetings and they and other management members are available at all times to address any questions or concerns raised by the Board related to risk measurement and risk management.
Audit Committee. The Audit Committee oversees the integrity of the Company’s financial reporting processes and the audits of its financial statements, oversees the internal audit function as well as all reviews and oversight of the Company’s internal controls, and oversees the Company’s actions relating to operational risk management, and compliance with applicable legal and regulatory requirements and accounting standards. The Audit Committee also is responsible for the engagement, retention and replacement of the independent registered public accounting firm and approval of nonaudit services provided by the Company’s independent registered public accounting firm. Additionally, the Committee reviews the audited consolidated financial statements to be included in the Company’s Annual Report on Form 10-K. Dixon Hughes Goodman LLP, the Company’s independent registered public accounting firm, reports directly to the Audit Committee. It operates under a formal charter, which governs its conduct and responsibilities. A copy of the charter is available through the Investor Relations link on the Company’s website at www.community1.com. Members of the Committee are Jerry R. Licari (Chair), T. Gray McCaskill, H. Ray McKenney, Jr., and Boyd C. Wilson, Jr.
The Audit Committee met 11 times during the 2015 fiscal year. Each of the members of the Committee is independent as defined by NASDAQ listing standards and the Board has determined that Mr. Licari is the Audit Committee’s financial expert. The Board has determined that Mr. Licari meets the qualifications of an audit committee financial expert under SEC regulations adopted under the Sarbanes-Oxley Act of 2002.
Risk Management Committee. The Risk Management Committee oversees the Company’s actions relating to credit risk, interest rate risk, liquidity risk and market risk, including credit quality, loan portfolio performance, adequacy of the allowance for loan losses and resolution of problem assets. The Risk Management Committee also oversees the Company’s interest rate risk exposure, as well as investment and hedging activities. It reviews material trading positions and assesses compliance with established limits. The Committee also reviews credit, interest rate, liquidity and market risks associated with new business lines, products and services where the risk profile of the Company may change. The Risk Management Committee approves the hiring, compensation and replacement of the Chief Loan Review Officer, receives reports from the Chief Loan Review Officer and evaluates the performance of the loan review function. The Committee annually reviews and approves all policies relating to credit risk, and balance sheet management, including capital, interest rate risk, liquidity risk, and market risk. A copy of the charter is available through the Investor Relations link on the Company’s website at www.community1.com. Members of the Committee are Boyd C. Wilson, Jr. (Chair), Jerry R. Licari, and T. Gray McCaskill, The Risk Management Committee met 9 times during the 2015 fiscal year.
Compensation and Nominating Committee. The Compensation and Nominating Committee has oversight over all of the Company’s compensation and benefits programs and evaluates whether the compensation provided by the Company to management is fair based on the level of responsibility and accountability of each person and does not provide excessive benefits or encourage excessive risk taking. The Committee also has oversight of the administration of the Company’s employee compensation and benefit plans and programs, and the evaluation and review of the Company’s management resources, the evaluation of the performance of the President and Chief Executive Officer, including determining and recommending for full Board approval the President and Chief Executive Officer’s compensation, and administration of the Company’s equity-based incentive plans, including recommending to the full Board approval of awards under such plans. The Compensation and Nominating Committee also recommends to the full Board compensation packages for other senior management, including the other Named Executive Officers, and directors. The Compensation and Nominating Committee’s policy is to review such executive officer compensation no less frequently than annually. The Committee also recommends nominees for election as director and oversees the adequacy of the Company’s management succession plans for directors, the Chief Executive Officer and other critical management positions. The Compensation and Nominating Committee also is responsible for overseeing the overall corporate governance of the Company and in that role, it reviews and makes recommendations to the Board regarding the Boards’ composition and structure, establishing criteria for directors, evaluating the corporate policies relating to the recruitment and development of directors and assisting the Board in establishing and maintaining effective corporate governance policies and practices. The Compensation and Nominating Committee operates under a formal charter, a copy of which is available through the Investor Relations link on the Company’s website at www.community1.com.
To assist it in fulfilling its responsibilities, since 2012, the Compensation and Nominating Committee has retained Pearl Meyer & Partners (“PM&P”), a compensation consulting firm for the financial services industry, to advise it on various matters relating to executive compensation and general compensation policies. PM&P reports to the Chair of the Compensation and Nominating Committee.
When evaluating potential nominees to the Board, the Compensation and Nominating Committee considers various factors including their independence, financial expertise and business experience, education, character, judgment and vision. In accordance with the Company’s corporate governance guidelines, the Compensation and Nominating Committee makes its evaluations using a skills matrix, assessing needs in light of the current mix of director skills and attributes, the needs of the Board with respect to those skills and attributes, and an individual candidate’s reputation, age, civic and community relationships, knowledge and experience in matters affecting financial institutions, and the extent to which he or she would bring greater diversity to the Board. The Compensation and Nominating Committee also discusses the qualifications and contributions of each incumbent director.
122
The Compensation and Nominating Committee will consider qualified candidates recommended by shareholders. Shareholders can submit the names of qualified candidates, together with a written description of the candidate’s qualifications and appropriate biographical information, to the Compensation and Nominating Committee at CommunityOne Bancorp, 1017 East Morehead Street, Suite 200, Charlotte, North Carolina 28204. Submissions will be forwarded to the Chair of the Compensation and Nominating Committee for review and consideration. Because of the nature of the company’s shareholder base, the Compensation and Nominating Committee does not have any formal policies regarding the consideration of candidates recommended by shareholders other than any such candidate will be considered at the same time and under the same criteria used to evaluate all other candidates.
Members of the Committee are H. Ray McKenney, Jr. (Chair), J. Chandler Martin, John C. Redett and Scott B. Kauffman, each of whom is independent as defined by NASDAQ listing standards. The Compensation and Nominating Committee met 12 times during the 2015 fiscal year.
The process, policies and specific recommendations of the Compensation and Nominating Committee with respect to compensation of our Named Executive Officers for 2015 are described in greater detail in the CD&A.
Contacting the Board
Any shareholder who desires to contact the Board or a specific director may do so by writing to CommunityOne Bancorp, 1017 East Morehead Street, Suite 200, Charlotte, North Carolina 28204 Attn: Secretary. Any such communication should state the number of shares beneficially owned by the shareholder. The Company’s Secretary will review all communications received and relay them to the appropriate director or directors on a periodic basis unless the Secretary determines that the communication does not relate to the business or affairs of the Company or the functioning or constitution of the Board or any of its committees; is an advertisement or other commercial solicitation or communication; is frivolous or offensive; or is otherwise not appropriate for delivery to directors. The director or directors who receive any such communication will have discretion to determine whether the subject matter of the communication should be brought to the attention of the full Board or one or more of its committees and whether any response to the person sending the communication is appropriate. Any such response will be made in accordance with the Company’s policies and procedures, applicable laws and regulations relating to the disclosure of information.
Codes of Business Ethics
The Company has adopted a Code of Business Ethics that applies to all officers, directors and employees of the Company and its subsidiaries. It contains provisions applicable to the Company’s Chief Executive Officer, principal financial and accounting officer, director of finance and such other officers as the Audit Committee of the Board may designate from time to time. The purposes of this Code of Business Ethics are to (i) promote honest and ethical conduct, full and accurate disclosure in a timely and understandable manner in periodic reports filed by the Company and compliance with applicable laws, rules and regulations (including insider trading laws); (ii) assess corporate opportunities, and promote confidentiality, fair dealing, protection and proper use of the Company’s assets; and (iii) encourage the reporting of any illegal or unethical behavior. A copy of the Code of Business Ethics is available online through the Investor Relations link on the Company’s website at www.community1.com.
| Item 11. | EXECUTIVE COMPENSATION |
Compensation Discussion and Analysis
The Company’s policy is to provide total compensation that will attract and retain qualified management whose goals are aligned with the Company’s goal hierarchy and long-term objectives, as well as with the interests of the shareholders. This Compensation Discussion and Analysis describes the Company’s compensation philosophy, objectives and decision making process related to the compensation provided to Robert L. Reid, our President and Chief Executive Officer, and the other Named Executive Officers, or NEOs, namely, David L. Nielsen, Angus M. McBryde III, Beth S. DeSimone, and Gregory P. Murphy.
Compensation Philosophy
The Company’s compensation philosophy is to align compensation programs with the Company’s goal hierarchy of:
| • | 1st - Risk Management |
| • | 2nd - Profitability |
| • | 3rd - Growth |
Our compensation programs are based on performance, with metrics and measurement periods tailored to the specific job, and to not encourage excessive risk-taking. The programs also reflect an appropriate relationship between executive pay and the Company’s annual and long-term financial performance, and align the interests of management with that of the shareholders. Our compensation programs incorporate a mix of compensation components, which we believe must be competitive to attract and retain qualified and
123
productive employees, and include the use of market-based structures and target amounts and amounts for individuals in similar jobs should be appropriately differentiated to reflect individual contributions. Our compensation program also takes into consideration performance under certain non-economic criteria, such as customer service, compliance and appropriate risk management.
Role of the Board in the Compensation Approval Process
The Company’s Staffing and Compensation Policy, which addresses the Board’s compensation philosophy and program, including the payment, granting or provision of salaries, bonuses, incentive awards, benefits and/or fees to all employees, including the Named Executive Officers, is approved annually by the Board. Oversight of executive compensation and employee benefits is the responsibility of the Compensation and Nominating Committee of the Board. The Committee engages in ongoing dialogue with management and the Board on executive compensation practices and policies and on the type and amount of incentives that are appropriate to achieve the Company’s goals and aligning interests of executives with those of the shareholders.
Components of Compensation
The compensation program for our NEOs incorporates a mix of compensation components, namely:
| • | Base salaries; |
| • | Short-term (cash) Performance Incentives; |
| • | Long-term equity awards under the Amended and Restated 2012 Incentive Plan; and |
| • | Certain other benefits. |
The overall framework and amounts of compensation to the Named Executive Officers did not change for 2015; however, overall compensation was impacted as described below in connection with the Company entering into the Merger Agreement with Capital Bank.
Base Salary
The NEO base salary provides competitive and fair base compensation taking into consideration the scope and impact of the position within the Company, the experience of the officer, and the officer’s performance. The Compensation and Nominating Committee annually reviews and recommends to the Board the base salary for the President and Chief Executive Officer and the other Named Executive Officers.
During 2015, the annual base salaries of the Named Executive Officers was set as follows and was unchanged from 2014: Robert L. Reid, President & Chief Executive Officer, $500,000; David L. Nielsen, Chief Financial Officer, $475,000; Beth S. DeSimone, $400,000; Angus M. McBryde, $350,000; and Gregory P. Murphy, $350,000.
Short-Term Incentives
Short-term bonus incentive payments are designed to reward employees for achieving critical annual operating goals, both financial and non-financial, and for performing strategic activities that contribute to the long-term total return to shareholders, consistent with the Company’s goal hierarchy. As of December 31, 2015, the NEOs were paid 2015 annual bonuses (determined based on actual performance) as follows: Mr. Reid, $150,000; Mr. Nielsen, $124,688; Ms. DeSimone, $105,000; Mr. McBryde, $91,875; and Mr. Murphy, $91,875.
Long-Term (Equity) Incentives
The Company maintains two equity plans under the Amended and Restated 2012 Incentive Plan: a management incentive plan for the Named Executive Offices, and the outside non-executive directors, and a senior equity award plan for senior officers in the Company. The management incentive plan provides for a combination of stock options and restricted stock awards to each of the Named Executive Officers. Fifty percent of the awards of both restricted stock and options are time vested and fifty percent are performance vested over seven years. Options granted under the management incentive plan have a strike price of $16.00 per share, which is the price at which the investors that participated in the recapitalization of the Company purchased their shares, and have a 10 year exercise period from the date of grant. Those Awards are subject to clawback if the objective performance measures that will be used to determine the Awards are later restated or otherwise determined to be illusory by the Board, or if such clawback is otherwise required by applicable law.
On July 31, 2015, a total of 78,608 shares of restricted stock were issued and 207,530 incentive stock options were granted to the NEOs pursuant to the management incentive plan. A portion of the restricted stock was time vested only and valued at the closing of the Company’s Common Stock on the grant date and a portion required the Company Common Stock to reach stock price targets over a ten day period of $22.00 and $24.00 per share of Common Stock, with 50% of the performance awards vesting at each price point. One half of the options granted were time vested only and were valued as of the date of grant using the Black-Scholes option pricing
124
model, and the remainder require the Company’s Common Stock to reach stock price targets over a ten day period of $22.00 and $24.00 per share of Common Stock, with 50% of the performance awards vesting at each price point, and were valued as of the date of grant using a Monte Carlo option pricing model. As described below, for tax planning purposes with respect to Section 280G and 4999 of the Internal Revenue Code, all the unvested restricted stock held by each NEO vested as of December 30, 2015, except for 1,835 shares granted to Ms. DeSimone.
Certain Other Benefits
401(k) Savings Plan: The Company sponsors a qualified 401(k) plan to provide a tax-advantaged savings vehicle for employees. The Company believes that the 401(k) plan, and its contributions to the plan, increases the range of benefits offered to executives and enhances its ability to attract and retain employees. All regular employees are eligible to participate in the plan. A portion of the employee contributions are matched by the Company based on the plan formula, which is $0.50 for each dollar on the first 6% of eligible pay deferred by the employee under the plan. An additional discretionary employer contribution may be made each year. Based on the Company’s performance, no discretionary contribution was made for 2015. The Company established its limit on its matching contributions by reference to market and peer practices. All employer contributions to the 401(k) plan, both matching amounts and discretionary amounts, are made in cash. The 401(k) plan is the Company’s primary retirement benefit plan. The Named Executive Officers participate in this plan, subject to the same rules as all other employees.
Other Core Benefits: The Company strives to provide its employees a set of core benefits, including medical, dental, disability and life insurance coverage that are competitive with those offered by comparable banks and employers. The Company also believes that providing benefits that are usual and customary within its peer group assists the Company in attracting and retaining key executive talent. The Named Executive Officers, with the exception of Mr. Reid, participate in these benefits on the same terms as other eligible employees of the Company. Mr. Reid is not eligible to participate in the Bank’s health, dental or life insurance programs.
Perquisites: Perquisites represent a very small part of the Company’s overall compensation package, and primarily consist of the exclusive use of an automobile, or an automobile allowance. An automobile was provided to Mr. Reid in 2015, with the Company paying all operating and service expenses, including automobile insurance, related to the vehicle. Mr. Reid is responsible for reporting the amount of personal use of his company car to the Company, so that the taxable income from such use can be reported in his compensation. Mr. Nielsen receives an annual car allowance of $7,200 that is fully taxable compensation. The Compensation and Nominating Committee reviews annually the perquisites and other personal benefits provided to senior management.
Employment Agreements
The Company and CommunityOne Bank have entered into an employment agreement with each of the Named Executive Officers. Each of the agreements has a three year term (the “Term”), but if not earlier terminated, the Term may be extended for a one year period at each anniversary of the effective date of the agreement; provided that the Board of Directors of the Company and the Bank (the “Board”) must whether such an extension is appropriate, taking into consideration all relevant factors, including each Named Executive Officer’s performance during the previous year, and either the Company and the Bank or the Named Executive Officer must provide written notice at least 90 days prior to the anniversary that the extension should not be granted. Each Employment Agreement also has substantially similar terms except for the base salaries and potential bonus opportunities. Specifically, subject to the applicable law, including the FDIC’s golden parachute rules (12 U.S.C. § 1828(k) and 12 C.F.R. Part 359) and other applicable restrictions (together the “Compensation Rules”), each Named Executive Officer is eligible to (a) receive annual bonuses at a target level of base salary (subject to the achievement of performance conditions to be established by the Compensation and Nominating Committee), and (b) participate in the Company’s long-term cash and equity award and equity-based programs.
In connection with the Company’s entry into the Merger Agreement with Capital Bank, each of the employment agreements with the Named Executive Officers was amended to provide that the NEO's employment will terminate immediately following (or, in the case of Mr. Reid, immediately prior to) the "effective time" of the merger for “good reason” (as defined in the amended employment agreements) in connection with a “change of control” (as each term is defined in the amended employment agreements). The amended employment agreements further provide that upon such termination the officer will be entitled to receive the following payments and benefits (subject to reduction so that the aggregate value of all payments and benefits received by the officer will not constitute an “excess parachute payment” within the meaning of Section 280G of the Code): (i) a lump sum equal to the aggregate of the following amounts: (A) any unpaid portion of the annual base salary through the date of termination; and (B) other accrued obligations, including reimbursement for out-of-pocket expenses incurred in connection with employment and accrued but unused vacation through the date of termination; and (ii) severance payments of $2,000,000, $1,900,000, $1,600,000, $1,400,000, and $1,400,000, respectively, to Mr. Reid, Mr. Nielsen, Ms. DeSimone, Mr. McBryde, and Mr. Murphy, to be paid in a lump sum on the 30th day after the termination of employment (but subject to a delay in payment until six months after the termination of employment to the extent required under Section 409A of the Code). In each case, the executive officer's entitlement to the severance payment is subject to the officer providing to Capital Bank a general release of claims against Capital Bank and its affiliates. Further, each executive officer will be subject to non-solicit obligations for the two-year period following termination of employment. Mr. Reid also will be subject to non-compete obligations for the same time period. See “Payments Upon Termination or Change in Control” below for more information.
125
Tax Considerations
It is the intent of the Company and the Compensation and Nominating Committee that all incentive payments be deductible unless maintaining such deductibility would undermine the Company’s ability to meet its primary compensation objectives or is otherwise not in its best interests. The Company also takes into account the tax effects of various forms of compensation and the potential for excise taxes to be imposed on the executive officers that might have the effect of frustrating the purpose of the compensation. There are various provisions of the Internal Revenue Code considered when making compensation decisions.
Section 162(m)
Section 162(m) of the Internal Revenue Code limits the deductibility for federal income tax purposes of compensation paid to the President and Chief Executive Officer and the next four most highly compensated executive officers. Under Section 162(m), compensation paid to each of these officers in excess of $1 million per year is not deductible unless it qualifies as “performance based compensation.” The Company was required when it was subject to the TARP standards for executive compensation and corporation governance to agree to lower the tax deduction limit to $500,000 and that the performance based compensation exception would not apply. The Compensation and Nominating Committee did not consider the deductibility limits in making its compensation decisions for any of the Named Executive Officers for the 2015 fiscal year, as the Board determined not to compensate any Named Executive Officer in excess of the deductibility limits. However, the Committee’s policy is to design and administer compensation programs that meet the objectives set forth above and to reward executives for corporate performance that meets established financial goals and, to the extent reasonably practicable and consistent with its other compensation objectives, to maximize the amount of compensation expense that is tax deductible by the Company.
126
Summary Compensation Table
The following table shows the compensation of the Named Executive Officers.
| Name and Principal Position | Year | Salary ($) | Bonus ($) (1) | Stock Awards ($) (2) | Option Awards ($) (3) | Non-Equity Incentive Plan Compensation ($) | Change in Pension Value and Nonqualified Deferred Compensation Earnings ($) | All Other Compensation ($) (4) | Total ($) | ||||||||
| Robert L. Reid | 2015 | 500,000 | 150,000 | 252,536 | 157,206 | — | — | 9,954 | 1,069,696 | ||||||||
| President and Chief Executive Officer | 2014 | 481,250 | — | 188,729 | 140,258 | — | — | 9,805 | 820,042 | ||||||||
| 2013 | 475,000 | — | 202,071 | — | — | — | 9,805 | 686,876 | |||||||||
| David L. Nielsen | 2015 | 475,000 | 124,668 | 252,536 | 157,206 | — | — | 15,150 | 1,024,560 | ||||||||
| Chief Financial Officer | 2014 | 475,000 | — | 188,729 | 140,258 | — | — | 15,000 | 818,987 | ||||||||
| 2013 | 475,000 | — | 202,071 | — | — | — | 15,000 | 692,071 | |||||||||
| Beth S. DeSimone | 2015 | 400,000 | 130,000 | 89,796 | 124,804 | — | — | 7,950 | 752,550 | ||||||||
| General Counsel | 2014 | 400,000 | — | 47,121 | 93,509 | — | — | 7,800 | 548,430 | ||||||||
| 2013 | 400,000 | — | 140,768 | — | — | — | 7,800 | 548,568 | |||||||||
| Angus M. McBryde, III | 2015 | 350,000 | 91,875 | 140,673 | 104,802 | — | — | 6,344 | 693,694 | ||||||||
| Treasurer | 2014 | 350,000 | — | 204,243 | 93,509 | — | — | 7,693 | 655,445 | ||||||||
| 2013 | 350,000 | — | 174,994 | — | — | — | 5,257 | 530,251 | |||||||||
| Gregory P. Murphy | 2015 | 350,000 | 91,875 | 35,846 | 104,802 | — | — | 7,950 | 590,473 | ||||||||
| Chief Workout Officer | 2014 | 350,000 | — | 21,245 | 93,509 | — | — | 7,800 | 472,554 | ||||||||
| 2013 | 350,000 | 100,000 | 158,902 | — | — | — | 7,800 | 616,702 | |||||||||
(1) | No bonuses were awarded to the Named Executive Officers during 2013 or 2014, consistent with the compensation rules of the TARP. Gregory P. Murphy was not a Named Executive Officer in 2013. |
(2) | Pursuant to the 2012 Incentive Plan, a total of 110,387 shares of long-term restricted stock were granted by the Board to the top six officers of the Company on December 19, 2013, pursuant to the Amended and Restated 2012 Incentive Plan. Under the terms of a portion of the 2013 awards, 2/3rds of the restricted stock vest on the second anniversary of the date of grant and the final 1/3 of the stock vest on the third anniversary of the date of grant, and were valued at the closing price of Company Common Stock on the grant date. The remainder of the awards require the Company Common Stock to reach stock price targets over a twenty day period of $22.00, $24.00, $30.00 and $36.00 per share of Common Stock, with 25% of the performance awards vesting at each price point (except that no shares may vest in the two years following the grant date), and were valued as of the date of grant using a Monte Carlo pricing model. On January 30, 2014, a total of 107,086 shares of restricted stock were issued under the management incentive plan of the Amended and Restated 2012 Incentive Plan to the Named Executive Officers of the Company, a portion of which were time vested only and were valued at the closing price of the Company’s Common Stock on the grant date, and the remainder of which require the Company Common Stock to reach stock price targets of $22.00, $24.00, $30.00 and $36.00 per share of Common Stock, with 25% of the performance awards vesting at each price point, and were valued as of the grant date using a Monte Carlo pricing model. The Company canceled 267,937 shares of restricted stock awarded to certain of the Named Executive Officer in connection with the U.S. Treasury sale of the shares it owned in the Company on May 23, 2014. On October 1, 2014, a total of 78,614 shares of restricted stock were issued pursuant to the management incentive plan of the Amended and Restated 2012 Incentive Plan to the Named Executive Officers, a portion of which were time vested only and were valued at the closing of the Company’s Common Stock on the grant date and a portion of which require the Company Common Stock to reach stock price targets over a ten day period of $22.00 and $24.00 per share of Common Stock, with 50% of the performance awards vesting at each price point and were valued as of the grant date using a Monte Carlo pricing mode. On April 15, 2015, 1,835 shares of restricted stock were issued under the senior leader equity award plan of the Amended and Restated 2012 Incentive Plan to Ms. DeSimone, all of which were time vested and were valued at the closing price of the Company's Common Stock on the grant date. On July 31, 2015, a total of 78,608 shares of restricted stock were issued pursuant to the management incentive plan of the Amended and Restated 2012 Incentive Plan to the Named Executive Officers, a portion of which were time vested only and were valued at the closing of the Company’s Common Stock on the grant date and a portion of which require the Company Common Stock to reach stock price targets over a ten day period of $22.00 and $24.00 per share of Common Stock, with 50% of the performance awards vesting at each price point and were valued as of the grant date using a Monte Carlo pricing mode. As provided in amendments to the employments agreements entered into by each NEO with the company in connection with the Merger Agreement with Capital Bank, and for tax planning |
127
purposes with respect to Section 280G and 4999 of the Internal Revenue Code, all the unvested restricted stock held by each NEO, except for 1,835 shares granted to Ms. DeSimone, vested as of December 30, 2015.
(3) | Pursuant to the management incentive plan of the Amended and Restated 2012 Incentive Plan, a total of 207,538 incentive stock options were granted by the Board to the Named Executive Officers on October 1, 2014. One half of the options were time vested only and were valued as of the date of grant using the Black-Scholes option pricing model. The remainder of the option grants require the Company’s Common Stock to reach stock price targets over a ten day period of $22.00 and $24.00 per share of Common Stock, with 50% of the performance awards vesting at each price point, and were valued as of the date of grant using a Monte Carlo option pricing model. No stock options were granted to the Named Executive Officers in 2013. Pursuant to the management incentive plan of the Amended and Restated 2012 Incentive Plan, 4,546 incentive stock options were granted by the Board to Ms. DeSimone on April 15, 2015. The options were time vested and were valued as of the date of grant using the Black-Scholes option pricing mode Pursuant to the management incentive plan of the Amended and Restated 2012 Incentive Plan, a total of 207,530 incentive stock options were granted by the Board to the Named Executive Officers on July 31, 2015. One half of the options were time vested only and were valued as of the date of grant using the Black-Scholes option pricing model. The remainder of the option grants require the Company’s Common Stock to reach stock price targets over a ten day period of $22.00 and $24.00 per share of Common Stock, with 50% of the performance awards vesting at each price point, and were valued as of the date of grant using a Monte Carlo option pricing model. As provided in amendments to the employments agreements entered into by each NEO with the company in connection with the Merger Agreement with Capital Bank, and for tax planning purposes with respect to Section 28G and 4999 of the Internal Revenue Code, the Company may, with the executive’s consent, terminate all or a portion of the stock options held by the executive and/or reduce the period that a stock option remains outstanding following the effective time of the Merger. |
(4) | All Other Compensation for 2015 for the Named Executive Officers includes the total of the following benefits and perquisites: |
| Name and principal position | Automobile Allowance ($) | Employer 401(k) ($) | Severance Payment ($) | Total ($) | ||||
| Robert L. Reid | 2,004 | 7,950 | — | 9,954 | ||||
| President and Chief Executive Officer | ||||||||
| David L. Nielsen | 7,200 | 7,950 | — | 15,150 | ||||
| Chief Financial Officer | ||||||||
| Beth S. DeSimone | — | 7,950 | — | 7,950 | ||||
| General Counsel | ||||||||
| Angus M. McBryde, III | — | 6,344 | — | 6,344 | ||||
| Treasurer | ||||||||
| Gregory P. Murphy | — | 7,950 | — | 7,950 | ||||
| Chief Workout Officer | ||||||||
2015 Grants of Plan-based Awards
| Name | Grant Date | Estimated future payouts under non-equity incentive plan awards | Estimated future payouts under equity incentive plan awards | All other stock awards: Number of shares of stock or units (#) | All other option awards: Number of securities under-lying options (#) | Exercise or base price of option awards ($/Sh) | Grant date fair value of stock and option awards ($) (2) | ||||||||||||||
Threshold ($) | Target ($) | Max ($) | Threshold ($) | Target ($) (1) | Max ($) | ||||||||||||||||
| Robert L. Reid | 7/31/2015 | — | — | — | — | 108,304 | — | 17,294 | 34,589 | 16.00 | 301,438 | ||||||||||
| David L. Nielsen | 7/31/2015 | — | — | — | — | 108,304 | — | 17,294 | 34,589 | 16.00 | 301,438 | ||||||||||
| Beth S. DeSimone | 4/15/2015 | — | — | — | — | — | — | 1,835 | 4,546 | 10.90 | 40,004 | ||||||||||
| Beth S. DeSimone | 7/31/2015 | — | — | — | — | 72,197 | — | 2,545 | 23,059 | 16.00 | 102,399 | ||||||||||
| Angus M. McBryde, III | 7/31/2015 | — | — | — | — | 44,510 | — | 11,530 | 23,059 | 16.00 | 200,965 | ||||||||||
| Gregory P. Murphy | 7/31/2015 | — | — | — | — | 66,167 | — | — | 23,059 | 16.00 | 74,481 | ||||||||||
(1) | This column represents the grant date fair value of the performance based restricted stock and options granted to each Named Executive Officer. |
(2) | This column represents the grant date fair value of the time based restricted stock and options granted each Named Executive Officer. |
128
Outstanding Equity Awards at Fiscal Year End
The following table provides information for each of our Named Executive Officers regarding outstanding equity awards held by those officers as of December 31, 2015.
| Name | Option awards | Stock Awards | ||||||||||||||||
| Grant Date | Number of securities underlying unexercised options exercisable (#) | Number of securities underlying unexercised options unexer-cisable (#) | Equity incentive plan awards: number of securities underlying unexercised unearned options (#) | Option exercise price ($/Sh) | Option expiration date | Number of shares or units of stock that have not vested (#) (1) | Market value of shares or units of stock that have not vested ($) (2) | Equity incentive plan awards: number of unearned shares, units or other rights that have not vested (#) (3) | Equity incentive plan awards: market or payout value of unearned shares, units or other rights that have not vested ($) (4) | |||||||||
| Robert L. Reid | 12/19/13 | — | — | — | — | — | — | — | — | |||||||||
| 01/30/14 | — | — | — | — | — | — | — | — | ||||||||||
| 10/01/14 | 8,647 | 25,942 | 17,295 | 16.00 | 10/01/24 | — | — | — | — | |||||||||
| 07/31/15 | — | 34,589 | 17,294 | 16.00 | 07/31/25 | — | — | — | — | |||||||||
| David L. Nielsen | 12/19/13 | — | — | — | — | — | — | — | — | |||||||||
| 01/30/14 | — | — | — | — | — | — | — | — | ||||||||||
| 10/01/14 | 8,647 | 25,942 | 17,295 | 16.00 | 10/01/24 | — | — | — | — | |||||||||
| 07/31/15 | — | 34,589 | 17,294 | 16.00 | 07/31/25 | — | — | — | — | |||||||||
| Beth S. DeSimone | 12/19/13 | — | — | — | — | — | — | — | — | |||||||||
| 01/30/14 | — | — | — | — | — | — | — | — | ||||||||||
| 10/01/14 | 5,765 | 17,295 | 11,530 | 16.00 | 10/01/24 | — | — | — | — | |||||||||
| 04/15/15 | — | 4,546 | — | 10.90 | 04/15/25 | 1,835 | 24,717 | — | — | |||||||||
| 07/31/15 | — | 23,059 | 11,529 | 16.00 | 07/31/25 | — | — | — | — | |||||||||
| Angus M. McBryde, III | 12/19/13 | — | — | — | — | — | — | — | — | |||||||||
| 01/30/14 | — | — | — | — | — | — | — | — | ||||||||||
| 10/01/14 | 5,765 | 17,295 | 11,530 | 16.00 | 10/01/24 | — | — | — | — | |||||||||
| 07/31/15 | — | 23,059 | 11,529 | 16.00 | 07/31/25 | — | — | — | — | |||||||||
| Gregory P. Murphy | 12/19/13 | — | — | — | — | — | — | — | — | |||||||||
| 01/30/14 | — | — | — | — | — | — | — | — | ||||||||||
| 10/01/14 | 5,765 | 17,295 | 11,530 | 16.00 | 10/01/24 | — | — | — | — | |||||||||
| 07/31/15 | — | 23,059 | 11,529 | 16.00 | 07/31/25 | — | — | — | — | |||||||||
(1) As provided in amendments to the employments agreements entered into by each NEO with the company in connection with the Merger Agreement with Capital Bank, and for tax planning purposes with respect to Section 280G and 4999 of the Internal Revenue Code, all the unvested restricted stock held by each NEO, except 1,835 shares granted to Ms. DeSimone, vested as of December 30, 2015.
The following table sets forth information on outstanding equity awards under the Company’s equity compensation plans as of December 31, 2015.
129
| Plan Category | Number of Securities to Be Issued upon Exercise of Outstanding Options, Warrants and Rights (#) | Weighted-Average Exercise Price of Outstanding Options, Warrants and Rights ($/Sh) | Number of Securities Remaining Available for Future Issuance under Equity Compensation Plans (1) (#) | ||||
| Equity Compensation Plans Approved by Shareholders | 582,314 | 14.56 | 1,588,063 | ||||
Equity Compensation Plans Not Approved by Shareholders (2) | — | — | — | ||||
| Total | 582,314 | 14.56 | 1,588,063 | ||||
(1) | The number of securities remaining available for issuance at December 31, 2015 excludes the number of securities to be issued upon exercise of any outstanding options and reflects 1,576,613 securities issuable under the Company’s Amended and Restated 2012 Incentive Plan and 11,450 securities issuable under the Company’s Amended and Restated 2003 Stock Incentive Plan |
(2) | There were no equity compensation plans at December 31, 2015 that have not been approved by the Company’s shareholders. |
Options Exercised and Stock Vested During 2015
The following table sets forth information regarding the number and value of restricted stock vested during 2015 for our Named Executive Officers.
| Option Awards | Stock Awards | |||||||
| Name | Number of Shares Acquired on Exercise (#) | Value Realized on Exercise ($) | Number of Shares Acquired on Vesting (#) | Value Realized on Vesting ($) (1) | ||||
| Robert L. Reid | — | — | 51,883 | 703,965 | ||||
| David L. Nielsen | — | — | 51,883 | 703,965 | ||||
| Beth S. DeSimone | — | — | 22,611 | 311,729 | ||||
| Angus M. McBryde, III | — | — | 42,212 | 575,428 | ||||
| Gregory P. Murphy | — | — | 14,920 | 196,794 | ||||
(1) The value realized on vesting is based on the average of the high and low price of Company Common Stock on the close of the market on the date of the vesting. As provided in amendments to the employments agreements entered into by each NEO with the company in connection with the Merger Agreement with Capital Bank, and for tax planning purposes with respect to Section 28G and 4999 of the Internal Revenue Code, all the unvested restricted stock held by each NEO, except for 1,835 shares granted to Ms. DeSimone, vested as of December 30, 2015.
Nonqualified Deferred Compensation
The Company does not provide employees with non-qualified deferred compensation opportunities, nor does it offer non-qualified defined contribution plans.
Payments Upon Termination or Change in Control
The discussion and tables below reflect the estimated amount of compensation that each of the Named Executive Officers would be entitled to in the event of termination of such executive’s employment. The amounts shown assume a termination date of December 31, 2015. All amounts shown are estimates. They do not include compensation and benefits available to all of the Company’s general employees on a non-discriminatory basis. “CIC” refers to a change of control event, as defined by the employment agreement with each officer. All agreements are compliant with Internal Revenue Code Section 409A. At the time of separation from service, if a Named Executive Officer is a specified employee as defined under Section 409A, payments will be delayed for six months as necessary to remain compliant with Section 409A.
130
| Compensation and/or Benefits Payable Upon Termination | Multiple of Salary ($) | Value of Vesting Nonstatutory Stock Options ($) | Restricted Stock Awards ($) | Total Value of Payments ($) | ||||
| Robert L. Reid | ||||||||
| President and Chief Executive Officer | ||||||||
| Termination by COB Without Cause or by the Executive for Good Reason for Other Than a CIC | 1,100,000 | 462,024 | — | 1,562,024 | ||||
| Termination by COB Without Cause or by the Executive for Good Reason for a CIC | 2,000,000 | 462,024 | — | 2,462,024 | ||||
| Death or Disability | — | — | — | — | ||||
| David L. Nielsen | ||||||||
| Executive Vice President and Chief Financial Officer | ||||||||
| Termination by COB Without Cause or by the Executive for Good Reason for Other Than a CIC | 1,033,112 | 462,024 | — | 1,495,136 | ||||
| Termination by COB Without Cause or by the Executive for Good Reason for a CIC | 1,900,000 | 462,024 | — | 2,362,024 | ||||
| Death or Disability | — | — | — | — | ||||
| Beth S. DeSimone | ||||||||
| Executive Vice President, Secretary, General Counsel | ||||||||
| Termination by COB Without Cause or by the Executive for Good Reason for Other Than a CIC | 886,667 | 338,018 | 24,717 | 1,249,402 | ||||
| Termination by COB Without Cause or by the Executive for Good Reason for a CIC | 1,600,000 | 338,018 | 24,717 | 1,962,735 | ||||
| Death or Disability | — | — | — | — | ||||
| Angus M. McBryde, III | ||||||||
| Executive Vice President and Treasurer | ||||||||
| Termination by COB Without Cause or by the Executive for Good Reason for Other Than a CIC | 761,250 | 308,014 | — | 1,069,264 | ||||
| Termination by COB Without Cause or by the Executive for Good Reason for a CIC | 1,400,000 | 308,014 | — | 1,708,014 | ||||
| Death or Disability | — | — | — | — | ||||
| Gregory P. Murphy | ||||||||
| Executive Vice President and Chief Workout Officer | ||||||||
| Termination by COB Without Cause or by the Executive for Good Reason for Other Than a CIC | 827,917 | 308,014 | — | 1,135,931 | ||||
| Termination by COB Without Cause or by the Executive for Good Reason for a CIC | 1,400,000 | 308,014 | — | 1,708,014 | ||||
| Death or Disability | — | — | — | — | ||||
In the event that a Named Executive Officer’s employment is terminated by the Company without “cause” or by the Named Executive Officer for “good reason,” in each case for other than a “Change in Control,” under the employment agreements among the Company, CommunityOne Bank and the Named Executive Officers in effect as of December 31, 2015, and subject to the Compensation Rules, the Named Executive Officer is entitled to severance benefits as follows: (a) a cash payment equal to two times the sum of (i) his base salary and (ii) the average of annual bonuses paid for the three most recently completed fiscal years preceding the date of termination; provided, however, that if no annual bonus opportunity was established for the Named Executive Officer for any fiscal year, the target bonus shall be deemed to be the amount of the annual bonus paid for that year; and (b) accelerated vesting of any equity compensation awards held by the Named Executive Officer. If the Named Executive Officer’s employment is terminated by the Company without “cause” or by the Named Executive Officer for “good reason,” in each case in connection with a “Change in Control,” the Named Executive Officer’s cash payment would be equal to two times the sum of (i) his base salary and (ii) the product of (1/Target Bonus Percentage) x the dollar amount of the Named Executive Officer’s target bonus, plus accelerated vesting of any equity compensation awards held by him. If the Company terminates any of the Named Executive Officers for cause, the Company will have no obligations to the executive after the date of termination.
The employee agreements define “good reason” to mean, unless the executive has consented in writing thereto:
| • | A material diminution in the executive’s duties and responsibilities or authority or any material adverse change in the executive’s base compensation; |
131
| • | A relocation of the executive’s primary work location more than thirty (30) miles from Asheboro, North Carolina (other than any relocation to Charlotte, North Carolina or a location within thirty (30) miles thereof); |
| • | A material breach of the Employment Agreement by the Company or CommunityOne Bank; or |
| • | A “Change in Control.” |
A “Change in Control” is deemed to have occurred, if:
| • | any person (other than an employee benefit plan of the Company or its affiliates; or either anchor investor in the Recapitalization) is or becomes the beneficial owner of more than 25% of the Company’s voting stock, if at such time, the voting power of the stock owned by that person exceeds the voting power represented by the stock owned by the anchor investors in the Recapitalization; |
| • | the Company consummates a merger, consolidation, share, exchange, division or other reorganization or transaction with any other corporation, other than a transaction that results in the Company’s voting securities continuing to represent at least 60% of the combined voting power of the surviving entity immediately after the transaction; |
| • | the Company’s shareholders approve a plan of complete liquidation or winding up of the Company; |
| • | the consummation of a sale or disposition of all or substantially all of the Company’s assets; or |
| • | during any 24 consecutive month period, individuals who at the beginning of such period constituted the Company’s Board cease for any reason to constitute at least a majority of the Board. |
In connection with the Company’s entry into the Merger Agreement with Capital Bank, each of the employment agreements with the Named Executive Officers was amended to provide that the NEO's employment will terminate immediately following (or, in the case of Mr. Reid, immediately prior to) the "effective time" of the Merger for “good reason” (as defined above in connection with a “change of control” (as defined above). The amended employment agreements further provide that upon such termination, the officer will be entitled to receive the following payments and benefits (subject to reduction so that the aggregate value of all payments and benefits received by the officer will not constitute an “excess parachute payment” within the meaning of Section 280G of the Code): (i) a lump sum equal to the aggregate of the following amounts: (A) any unpaid portion of the annual base salary through the date of termination; and (B) other accrued obligations, including reimbursement for out-of-pocket expenses incurred in connection with employment and accrued but unused vacation through the date of termination; and (ii) severance payments of $2,000,000, $1,900,000, $1,600,000, $1,400,000, and $1,400,000, respectively, to Mr. Reid, Mr. Nielsen, Ms. DeSimone, Mr. McBryde, and Mr. Murphy, to be paid in a lump sum on the 30th day after the termination of employment (but subject to a delay in payment until six months after the termination of employment to the extent required under Section 409A of the Code). In each case, the executive officer's entitlement to the severance payment is subject to the officer providing to Capital Bank a general release of claims against Capital Bank and its affiliates. Further, Mr. Reid’s amended agreement provides that , for twenty four (24) months following termination of the executives employment without cause or for “good reason,” and a severance payment has been made, the executive may not, without the written consent of the Company or CommunityOne Bank, directly or indirectly own any interest in, manage, operate, control, be employed by, render consulting or advisory services to, or participate in or be connected with the management or control of any company in the banking or financial services business within the territory where the Company operates and contiguous counties thereto, subject to certain exceptions involving passive investment or employment at a banking or financial services business having duties, activities and responsibilities wholly unrelated to those duties activities and responsibilities performed by the executive for the Company, CommunityOne Bank or their affiliates. Each NEO’s amended agreement, including Mr. Reid’s agreement, provides that, for a period of 24 months after termination, the executive may not solicit any Company customer to discontinue using the Company’s, CommunityOne Bank’s or any other affiliate’s services or interfere with or disrupt any relationship between the Company and its affiliates and any employee, customer, supplier, principals, distributor, lessors or licensors.
Under agreements granting incentive stock options to each of the NEOs pursuant to the management incentive plan, in the event of termination of service, unvested options will be immediately and automatically forfeited, with the following exceptions:
| • | In the event of retirement, death or disability, the participant shall be treated as continuing to be employed under the expiration of the option period; |
| • | In the event of termination by the Company without cause or by the participant for “good reason,” any unvested options will become immediately vested. |
| • | In the event of a Change in Control any unvested options will become immediately vested. |
Vested options in existence upon termination of service for other than “good reason” or retirement, disability or death are exercisable until the earlier of 90 days following termination of service and the expiration of the option period.
The grant agreements and the option agreements in each case define “good reason” to mean:
| • | A material diminution in the executive’s duties and responsibilities or authority, or any material adverse change in the executive’s base compensation; |
| • | A relation of the executive’s primary work location more than thirty miles from Asheboro, North Carolina (other than any relocation to Charlotte, North Carolina or a location within thirty miles thereof); or |
132
| • | Any material breach of the grant agreement by the Company, subject in each case to a cure period. |
The definition of Change in Control for purposes of the option agreements is the same as that in the employment agreements. Under the amended employment agreements entered into in connection with the Merger with Capital Bank, the Company may, with the executive’s consent, terminate all or a portion of the stock options held by the executive, and/or reduce the period that a stock option remains outstanding following the effective time of the Merger.
Termination for Cause
If the Company terminates any of the Named Executive Officers for cause, the Company will have no obligations to the executive after the date of termination. The employment agreements, grant agreements and stock option agreements with the Named Executive Officers each defined “cause” as termination (after an opportunity to cure) on account of the executive’s incompetence or dishonesty in his performance, deliberate neglect of, willful malfeasance or misconduct, or continued failure to substantially perform duties reasonably assigned to the executive by the Company or CommunityOne Bank; a material breach of the agreement or any written Company policy; willful violation of any law, rule or regulation (other than traffic violations or similar offenses) or final cease and desist order; or any felony or misdemeanor involving a “presumptive disqualifier,” which is defined to include fraud, moral turpitude, dishonesty, breach of trust or fiduciary duties, organized crime or racketeering, or violation of the securities, financial institution, or housing authority laws or regulations, or violation of the rules, regulations, codes of conduct or ethics of a self-regulatory trade or professional organization.
Report of the Compensation and Nominating Committee
The Compensation and Nominating Committee of the Board has reviewed and discussed the “Compensation Discussion and Analysis” included in the Form 10-K, and based on a recommendation of the Committee, the Board has included the “Compensation Discussion and Analysis” in the Form 10-K.
| Item 12. | SECURITY OWNERSHIP OF CERTAIN BENEFICIAL OWNERS AND MANAGEMENT AND RELATED SHAREHOLDER MATTERS |
Under Section 13(d)-3 of the Securities Exchange Act of 1934, as amended (“Exchange Act”), a beneficial owner of a security is any person who directly or indirectly has or shares voting power or investment power over such security. Such beneficial owner under this definition need not enjoy the economic benefit of such securities. The following are the only shareholders known to the Company to be deemed to be a beneficial owner of 5% or more of COB Common Stock as of December 31, 2015.
| Name and Address of Beneficial Owner | Amount and Nature of Beneficial Ownership | Percent of Class | |
Carlyle Financial Services Harbor, L.P. (1) Cayman Islands c/o The Carlyle Group 1001 Pennsylvania Avenue, N.W. Suite 220 South Washington, DC 20004-2505 | 5,772,376 | 23.8 | % |
Oak Hill Capital Partners III, L.P. (2) Cayman Islands Oak Hill Capital Management Partners III, L.P. c/o Oak Hill Capital Management, LLC 65 East 55th Street, 32nd Floor New York, NY 10022 | 5,772,697 | 23.8 | % |
(1) | Based on information reported on Amendment No. 3 to the Schedule 13D filed with the SEC on November 23, 2015. Carlyle Group Management L.L.C. is the general partner of The Carlyle Group L.P., which is a publicly traded entity listed on NASDAQ. The Carlyle Group L.P. is the managing member of Carlyle Holdings II GP, L.L.C., which is the general partner of Carlyle Holdings II L.P., which is the general partner of TC Group Cayman Investment Holdings, L.P., which is the general partner of TC Group Cayman Investment Holdings Sub L.P., which is the sole shareholder of Carlyle Financial Services, Ltd., which is the general partner of TCG Financial Services, L.P., which is the general partner of Carlyle Financial Services Harbor, L.P. The shares of Common Stock are held directly by Carlyle Financial Services Harbor, L.P. William E. Conway., Jr., Daniel A. D’Aniello, David M. Rubenstein and Glenn Youngkin are the directors of Carlyle Financial Services, Ltd. and, in such capacity, may be deemed to share beneficial ownership of the shares of Common Stock beneficially owned by Carlyle Financial Services, Ltd. These individuals disclaim any such beneficial ownership. |
(2) | Based on information reported on Amendment No. 2 to the Schedule 13D filed with the SEC on November 23, 2015, the general partner of Oak Hill Capital Partners III, L.P. and Oak Hill Capital Management Partners III, L.P. (together the “Oak |
133
Hill Funds”) is OHCP GenPar III, L.P., a Cayman Islands limited partnership. The general partner of OHCP GenPar III, L.P. is OHCP MGP Partners III, L.P., a Cayman Islands limited partnership. The general partner of OHCP MGP Partners III, L.P. is OHCP MGP III, Ltd., a Cayman Islands company. J. Taylor Crandall, Steven Gruber and Denis Nayden are the directors of OHCP MGP III, Ltd. J. Taylor Crandall, Steven Gruber, Denis Nayden, Tyler Wolfram, Kevin Levy, Shawn Hessing and John Monsky are the officers of OHCP MGP III, Ltd. Each of Messrs. Crandall, Gruber, Nayden, Wolfram, Levy, Hessing and Monsky expressly disclaims beneficial ownership of the shares of Common Stock referred to herein. The beneficial ownership reported by the Oak Hill Funds in the table above does not include beneficial ownership of shares of Common Stock held by Oak Hill Capital Management, LLC (“OHCM”). OHCM holds 3,497 shares of Common Stock issued to OHCM in connection with compensation awarded to employees of OHCM or its affiliates who serve as members of our board of directors, and includes 1,385 shares of unvested restricted stock, of which 815 shares vest based on stock performance and 570 shares vest on various dates, in each case in equal annual installments over three years from the dates of respective grants. Each of the Oak Hill Funds disclaims beneficial ownership of the shares of Common Stock which are held by OHCM.
The following table sets forth, as of December 31, 2015, the amount and percentage of our Common Stock beneficially owned by each director and each Named Executive Officer of the Company, as well as the directors and executive officers of the Company as a group. Unless otherwise indicated, all persons listed below have sole voting and investment power of all shares of Common Stock. The business address of each of the Company’s directors and executive officers is 1017 East Morehead Street, Suite 200, Charlotte, North Carolina 28204.
| Name | Shares of Common Stock Beneficially Owned | Percent Owned | |
Beth S. DeSimone (1) | 29,973 | * | |
Scott B. Kauffman (2) | 5,776,294 | 23.8% | |
Jerry R. Licari (3) | 30,602 | * | |
J. Chandler Martin (4) | 28,574 | * | |
Angus M. McBryde, III (5) | 39,161 | * | |
T. Gray McCaskill (6) | 3,300 | * | |
H. Ray McKenney, Jr. (7) | 13,594 | * | |
| Gregory P. Murphy | 53,157 | * | |
David L. Nielsen (8) | 68,563 | * | |
John C. Redett (9) | 5,772,376 | 23.8% | |
Robert L. Reid (10) | 63,220 | * | |
Boyd C. Wilson, Jr. (11) | 10,173 | * | |
| All directors and executive officers as a group (12 persons) | 11,888,987 | 48.9 | |
| * Less than 1% of the outstanding Common Stock. | |||
(1) | Includes 1,892 shares held by her spouse in an IRA. Also includes 1,835 shares of unvested long-term restricted stock that vest equally over three years from the grant date, and all as to which she has sole voting power but no investment power prior to vesting. |
(2) | Includes 5,589,136 shares held by Oak Hill Capital Partners III, L.P. and 183,561 shares held by Oak Hill Capital Management Partners III, L.P. (the “Oak Hill Funds”). Also includes 3,497 shares issued to Oak Hill Capital Management, LLC (OHCM) issued in connection with director service to employees of OHCM and includes 1,385 shares of unvested restricted stock, of which 950 vest based on stock performance and 435 vest on various dates, in each case in equal installments over three years from the respective grant dates, for which there is voting power but no investment power. Mr. Kauffman is a principal of OHCM, the adviser of the Oak Hill Funds, and disclaims beneficial ownership of the shares of Common Stock owned by the Oak Hill Funds. |
(3) | Includes 951 shares of unvested restricted stock that vest based on stock performance and 436 shares of restricted stock that vest on various dates, in each case in equal installments over three years from the respective grant dates, as to which he has sole voting power but no investment power prior to vesting. |
(4) | Includes 950 shares of unvested restricted stock that vest based on stock performance and 437 shares of restricted stock that vest on various dates, in each case in equal installments over three years from the respective grant dates, as to which he has sole voting power but no investment power prior to vesting. |
(5) | Includes 4,688 shares held in an IRA. |
134
(6) | Includes 950 shares of unvested restricted stock that vest based on stock performance and 435 shares of restricted stock that vest on various dates, in each case in equal installments over three years from the respective grant dates, as to which he has sole voting power but no investment power prior to vesting. |
(7) | Includes shares held through an affiliated corporation of Mr. McKenney and 20 shares held in an IRA. Also includes 950 shares of unvested restricted stock that vest based on stock performance and 437 shares of restricted stock that vest on various dates, in each case in equal installments over three years from the respective grant dates, as to which he has sole voting power but no investment power prior to vesting. |
(8) | Includes 29,500 shares held in an IRA. |
(9) | Includes 5,772,376 shares held by Carlyle Financial Services Harbor, L.P. Cayman Islands and The Carlyle Group. Mr. Redett is a principal of The Carlyle Group, and disclaims beneficial ownership of the shares of Common Stock owned by Carlyle Financial Services Harbor, L.P. |
(10) | Includes 21,172 shares held in an IRA. |
(11) | Includes 950 shares of unvested restricted stock that vest based on stock performance and 437 shares of restricted stock that vest on various dates, in each case in equal installments over three years from the respective grant dates, as to which he has sole voting power but no investment power prior to vesting. |
Section 16(a) Beneficial Ownership Reporting Compliance
Section 16(a) of the Exchange Act requires the Company’s directors and executive officers, and persons who own more than 10% of COB’s stock, to report to the SEC certain of their transactions with respect to the Common Stock. The SEC reporting rules require that changes in beneficial ownership generally be reported on Form 4 within two business days after the date on which the change occurs. A Form 3 to report stock holdings in the Company must be filed within ten days of when a director, executive officer or person who owns more than 10% of the Company’s stock becomes subject to Section 16(a) of the Exchange Act.
Officers, directors and greater than ten percent shareholders are required by SEC regulation to furnish us with copies of all Section 16(a) forms they file. To our knowledge, based solely on a review of the copies of such reports furnished to us and written representations that no other reports were required, during the fiscal year ended December 31, 2015 all Section 16(a) filing requirements applicable to our officers, directors and greater than ten percent beneficial owners were filed in a timely manner, except for one report of each of Messrs. Licari and Murphy, which were filed late due to administrative error.
| Item 13. | CERTAIN RELATIONSHIPS AND RELATED TRANSACTIONS AND DIRECTOR INDEPENDENCE |
Director Independence
The Board determines annually that a majority of directors serving on the Board are independent as defined in the NASDAQ listing standards. In addition, the Board considers all direct and indirect transactions described in and “Compensation and Nominating Committee Interlocks and Insider Participation” and “Certain Relationships and Related Transactions” in determining whether the director is independent. The Compensation and Nominating Committee has the delegated responsibility to evaluate each director’s qualifications for independence for the Board and for the committees of the Board. Following review of the objective measures, the Compensation and Nominating Committee and Board also consider on a subjective basis each director’s personal and/or business relationships, regardless of dollar amount.
On March 9, 2016, the Board determined the following seven directors are independent under the NASDAQ listing rules: Mr. Kauffman, Mr. Licari, Mr. Martin, Mr. McCaskill, Mr. McKenney, Mr. Redett and Mr. Wilson, and that all members of the Compensation and Nominating Committee are independent under applicable NASDAQ rules and that all members of the Audit Committee are independent under applicable SEC and NASDAQ rules.
Compensation and Nominating Committee Interlocks and Insider Participation
None of the members of the Compensation and Nominating Committee has ever been an officer or employee of the Company or any of its subsidiaries or performed services for the Company or its subsidiaries other than as a director. None of the executive officers of the Company served during 2015 as a director or member of the compensation committee of any entity of which any executive officer served as a director or member of the Compensation and Nominating Committee of the Company.
135
Certain Relationships and Related Transactions
Certain of the directors and officers of the Company and CommunityOne Bank and companies with which they are affiliated were customers of and borrowers from CommunityOne Bank in the ordinary course of business in 2015. Similar banking transactions may take place in the future. In October 2013, the Board of CommunityOne Bank approved two loans to Waterworx of Greensboro, NC for a five year term in an aggregate amount of $2.15 million as fixed asset financing for a car wash enterprise. The loans, which closed on December 5, 2013, with the first payment due January 5, 2014, were secured by real estate and equipment, with a 20 year amortization on both the real estate and the equipment. The 20 year amortization on the equipment secured loan was a policy exception and was agreed to due to the strength of the guarantors. In March 2014, the Board of CommunityOne Bank approved two additional loans to Waterworx of Greensboro, NC in an aggregate amount of $203.8 thousand, and in July 2015, the Board of CommunityOne Bank approved a line of credit to Waterworx of Greensboro, NC in the amount of $750 thousand. These loans were made on market rate terms and conditions. Director T. Gray McCaskill directly owns 10.17% of Waterworx as well as 33.3% of Moore Mac Properties LLC, which owns 22% of Waterworx. Mr. McCaskill and Moore Mac Properties LLC are two of the 12 guarantors on the loans and each guarantor is liable for 135% of their pro-rata ownership share in Waterworx or 13.73% and 29.7%, respectively. As of February 29, 2016 the total amounts outstanding on the Waterworx loans was $2.296 million. The borrower paid interest totaling $67,735 in 2015. Other than the exception noted, the Bank believes that the loans were made in the ordinary course of business and are on substantially the same terms, including interest rate and collateral, as those prevailing at the time of offer in comparable loans with persons not related to CommunityOne Bank and did not involve more than normal risk of collectability or certain other unfavorable features. In addition, in the opinion of management, all other outstanding loans and commitments included in such transactions were made in the ordinary course of business on substantially the same terms including interest rates and collateral, as those prevailing at the time in comparable loans with persons not related to the Company and did not involve more than normal risk of collectability or certain other unfavorable features.
During 2015, after conducting a request for proposal from four different vendors, the Board approved hiring Senn Dunn Insurance, a Marsh & McLennan Agency LLC Company, as the Benefits Advisor for the Company. Director T. Gray McCaskill is CEO of Senn Dunn Insurance. Total fees for year 2015 paid to Senn Dunn were less than $21,000 and not considered material by the Board of Directors.
The Company recognizes that related party transactions can present actual or potential conflicts of interest and may create the appearance that decisions are based on considerations other than the best interests of the Company. Therefore, the Board has adopted an enhanced, written insider policy, which it applies not only to extensions of credit to executive officers, directors and principal shareholders, but also is guided by that policy with respect to any transaction involving an insider. Under the policy, any actual or potential conflict of interest regarding insiders must be promptly disclosed to the Board for consideration, whether the conflict is intended or unintended. The Board retains final authority to approve or ratify any transaction with an insider. That involved insider is required to abstain from the Board’s approval process with respect to any transaction in which the insider may obtain any direct or indirect benefit.
Director Compensation
During 2015, each non-employee director received an annual retainer fee of $50,000, paid in quarterly installments, plus an annual retainer of $25,000 for each committee Chair, also paid in quarterly installments. Ninety percent of the retainer is paid in cash and 10% of the retainer is paid in Company Common Stock, representing the approximate value of the director’s service to the Bank and Company, respectively. In addition, pursuant to the management incentive plan approved pursuant to the 2012 Incentive Plan, on July 31, 2015, each non-employee director received a grant of 143 shares of restricted stock (with an additional share each issued to the Committee chairs and the Board Chair) some of which were time vesting only, that vests equally over three years, and a portion of which also require Company Common Stock to reach a certain stock price target.
Employee members of the Board receive no additional compensation for participation on the Board. The Compensation and Nominating Committee annually reviews director compensation in order to make sure that such compensation is designed to attract, motivate, and retain high performing members critical to our success.
The following table provides information concerning compensation paid by the Company to its non-employee directors during 2015.
136
| Name | Fees Earned or Paid in Cash ($) | Stock Awards ($)(3) | Options ($)(4) | Non-Equity Incentive Plan Compensation ($) | Change in Pension Value and Nonqualified Deferred Compensation Earnings ($) | All Other Compensation ($) | Total ($) | ||||
Scott B. Kauffman (1) | 49,973 | 1,069 | 5,984 | — | — | — | 57.026 | ||||
| Jerry R. Licari | 74,967 | 1,080 | 5,990 | — | — | — | 82,037 | ||||
| J. Chandler Martin | 74,967 | 1,080 | 5,990 | — | — | — | 82,037 | ||||
| T. Gray McCaskill | 49,973 | 1,069 | 5,990 | — | — | — | 57,032 | ||||
| H. Ray McKenney | 74,967 | 1,080 | 5,990 | — | — | — | 82,037 | ||||
John C. Redett (2) | 46,245 | — | — | — | — | — | 46,245 | ||||
| Boyd C. Wilson, Jr. | 74,967 | 1,080 | 5,990 | — | — | — | 82,037 | ||||
(1) | Mr. Kauffman’s earned director compensation was assigned to Oak Hill Capital Management, LLC. |
(2) | Mr. Redett does not accept any stock compensation for his service and his cash director compensation is assigned to The Carlyle Group. |
(3) | The Board awarded 143 shares of restricted stock to each outside director (with an additional share each issued to the Committee chairs and the Board Chair) on July 31, 2015. Stock awards disclosed in this column include shares of restricted stock, a portion of which vest on stock performance and a portion of which vest on various dates, in each case in equal installments over three years from the respective grant dates. The values for these awards in this column represent the grant date fair value of the restricted stock awards granted in 2015, computed in accordance with FASB ASC Topic 718. |
(4) | Option awards disclosed in this column reflect 1,977 incentive stock options granted by the Board to each non-management director on July 31, 2015, a portion of which are time vested in equal installments over four years from the date of grant and a portion of which vest on stock performance. The fair market value for these awards in this column is estimated as of the date of grant using either the Black-Scholes option pricing model or a Monte Carlo option pricing model, depending on the vesting terms, consistent with FASB ASC Topic 718. |
| Item 14. | PRINCIPAL ACCOUNTANT FEES AND SERVICES |
Fees Paid to Independent Registered Public Accounting Firm
Fees for professional services provided by Dixon Hughes Goodman LLP in each of the last two fiscal years in each of the following categories are:
| 2015 | 2014 | ||||||
| Audit Fees | $ | 348,195 | $ | 402,583 | |||
| Audit-Related Fees | 39,720 | 45,000 | |||||
| Tax Fees | 25,000 | 24,500 | |||||
| All Other Fees | — | — | |||||
| Total | $ | 412,915 | $ | 472,083 | |||
Audit Fees. This category consists of fees billed and expected to be billed for professional services rendered for the audit of our annual financial statements, the audit of internal control over financial reporting, as required by the Sarbanes-Oxley Act of 2002, the reviews of the Company’s quarterly reports on Form 10-Q, and SEC registration statements, including a comfort letter during 2014.
Audit-Related Fees. This category consists of fees billed for services that are reasonably related to the performance of the audit or review of our financial statements and are not otherwise reported under “Audit Fees.” During 2015 and 2014, these fees consisted of the audit of our benefit plans, and routine accounting consultations. Additionally, during 2014 an agreed upon procedures engagement was performed in connection with an S-3 filing, as well as an audit and agreed upon procedures engagement in conjunction with the U.S. Department of Housing and Urban Development, Office of Lender Activities and Program Compliance, requirements.
Tax Fees. This category consists of fees billed for professional services for tax compliance.
137
Audit Committee Pre-Approval Policies and Procedures
The Audit Committee is required to pre-approve all audit and non-audit services performed by the independent auditors to assure that the provision of such services does not impair the registered public accounting firm’s independence. In addition, any proposed services exceeding pre-approved cost levels will require specific approval by the Audit Committee. The Audit Committee may delegate pre-approval authority to one or more of its members. The member or members to whom such authority is delegated will report any pre-approval decisions to the Audit Committee at its next scheduled meeting. The Audit Committee does not delegate its responsibilities to pre-approve services performed by the independent auditors to management.
During fiscal year 2014 and 2015, the Audit Committee pre-approved all services provided by the independent auditors. None of the hours expended on the principal accountant’s engagement to audit the Company’s financial statements for the most recent fiscal year were attributed to work performed by persons other than the principal accountant’s full-time, permanent employees.
Report of the Audit Committee
The Audit Committee oversees the Company’s financial reporting process on behalf of the Board. The Audit Committee also is directly responsible for appointing, compensating and overseeing the work of the Company’s independent auditors. The Audit Committee meets with the Company’s internal and independent auditors, with and without management present, to discuss the results of their examinations, their evaluations of the Company’s internal controls and the overall quality of the Company’s financial reporting. Management has the primary responsibility for the financial statements and the reporting process, including the systems of internal controls.
In fulfilling its oversight responsibilities, the Audit Committee has reviewed and discussed the audited financial statements of the Company as of and for the year ended December 31, 2015 with management and Dixon Hughes Goodman LLP, the corporation’s independent accountants. The Audit Committee also discussed with the Company’s independent auditors all matters required by standards of the Public Company Accounting Oversight Board (PCAOB), including those described in Statement on Auditing Standards No. 16, as amended, “Communication with Audit Committees,” and discussed and reviewed the results of the independent auditors’ examination of the financial statements. The Audit Committee also obtained from the independent auditors the written disclosures and a formal written statement describing all relationships between the auditors and the Company that might bear on the auditors’ independence consistent with PCAOB Rule 3526 “Communication with Audit Committees Concerning Independence.” The Audit Committee discussed with the auditors any relationships that may have an impact on their objectivity and independence and satisfied itself as to the auditors’ independence. The Audit Committee also determined that the provision of the other non-audit services described under “Independent Auditors - Disclosure of Audit Fees” by Dixon Hughes Goodman LLP to the Company is compatible with maintaining Dixon Hughes Goodman LLP’s independence.
In reliance on the reviews and discussions referred to above, the Audit Committee recommended to the Board, and the Board approved, that the Company’s audited financial statements be included in the Company’s Annual Report on Form 10-K for the year ended December 31, 2015, for filing with the Securities and Exchange Commission.
Submitted by the Audit Committee of the Board of Directors:
Audit Committee Members
Jerry R. Licari - Chair
T. Gray McCaskill
H. Ray McKenney, Jr.
Boyd C. Wilson, Jr.
In accordance with and to the extent permitted by applicable law or regulation, the information contained in the Report of the Audit Committee and the Audit Committee Charter will not be incorporated by reference into any future filing under the Securities Act of 1933, as amended, or the Exchange Act, and will not be deemed to be soliciting material or to be filed with the SEC under the Exchange Act.
138
PART IV
| Item 15. | EXHIBITS AND FINANCIAL STATEMENT SCHEDULES |
(a)(1) Financial Statements. The following financial statements and supplementary data are included in Item 8 of this report.
| Financial Statements | Form 10-K Page |
| Quarterly Financial Information | 56 |
| Reports of Independent Registered Public Accounting Firm | 57 |
| Consolidated Balance Sheets as of December 31, 2015 and 2014 | 60 |
| Consolidated Statements of Operations for the Years Ended December 31, 2015, 2014 and 2013 | 61 |
| Consolidated Statements of Comprehensive Income (Loss) for the Years Ended December 31, 2015, 2014 and 2013 | 62 |
| Consolidated Statements of Shareholders’ Equity for the Years Ended December 31, 2015, 2014 and 2013 | 63 |
| Consolidated Statements of Cash Flows for the Years Ended December 31, 2015, 2014 and 2013 | 64 |
| Notes to Consolidated Financial Statements | 66 |
(a)(2) Financial Statement Schedules. All applicable financial statement schedules required under Regulation S-X have been included in the Notes to the Consolidated Financial Statements.
(a)(3) Exhibits. The exhibits required by Item 601 of Regulation S-K are listed below.
139
INDEX TO EXHIBITS
Exhibit No. | Description of Exhibit | |
| 2.01 | Agreement and Plan of Merger, dated April 26, 2011, by and among FNB United Corp., Gamma Merger Corporation and Bank of Granite Corporation, incorporated herein by reference to Exhibit 2.1 to the Registrant’s Current Report on Form 8-K filed April 27, 2011 (the schedules and exhibits have been omitted pursuant to Item 601(b)(2) of Regulation S-K. A copy of any omitted schedule or exhibit will be furnished supplementally to the Securities and Exchange Commission upon request). | |
| 2.02 | Amendment No. 1, dated as of June 16, 2011, to the Agreement and Plan of Merger, dated April 26, 2011, by and among FNB United Corp., Gamma Merger Corporation and Bank of Granite Corporation, incorporated herein by reference to Exhibit 2.1 to the Registrant’s Current Report on Form 8-K filed June 16, 2011. | |
| 2.03 | Amendment No. 2, dated as of August 15, 2011, to the Agreement and Plan of Merger, dated April 26, 2011, by and among FNB United Corp., Gamma Merger Corporation and Bank of Granite Corporation, incorporated herein by reference to Exhibit 2.1 to the Registrant’s Quarterly Report on Form 10-Q filed November 10, 2011. | |
| 2.04 | Agreement and Plan of Merger, dated November 22, 2015, by and between Capital Bank Financial Corp. and CommunityOne Bancorp, incorporated herein by reference to Exhibit 2.1 to the Registrant’s Current Report on Form 8-K filed November 24, 2015 (the schedules and exhibits have been omitted pursuant to Item 601(b)(2) of Regulation S-K. A copy of any omitted schedule or exhibit will be furnished supplementally to the Securities and Exchange Commission upon request. | |
| 3.01 | Articles of Incorporation of the Registrant, incorporated herein by reference to Exhibit 3.1 to the Registrant’s Form S-14 Registration Statement (File No. 2-96498) filed March 16, 1985. | |
| 3.02 | Articles of Amendment to Articles of Incorporation of the Registrant, adopted May 10, 1988, incorporated herein by reference to Exhibit 19.10 to the Registrant’s Quarterly Report on Form 10-Q for the quarter ended June 30, 1988. | |
| 3.03 | Articles of Amendment to Articles of Incorporation of the Registrant, adopted May 12, 1998, incorporated herein by reference to Exhibit 3.12 to the Registrant’s Quarterly Report on Form 10-Q for the quarter ended June 30, 1998. | |
| 3.04 | Articles of Amendment to Articles of Incorporation of the Registrant, adopted May 23, 2003, incorporated herein by reference to Exhibit 3.13 to the Registrant’s Quarterly Report on Form 10-Q for the quarter ended June 30, 2003. | |
| 3.05 | Articles of Amendment to Articles of Incorporation of the Registrant, adopted March 15, 2006, incorporated herein by reference to Exhibit 3.14 to the Registrant’s Quarterly Report on Form 10-Q for the quarter ended March 31, 2006. | |
| 3.06 | Articles of Merger, setting forth amendment to Articles of Incorporation of the Registrant, effective April 28, 2006, incorporated herein by reference to Exhibit 3.15 to the Registrant’s Quarterly Report on Form 10-Q for the quarter ended March 31, 2006. | |
| 3.07 | Articles of Amendment to Articles of Incorporation of the Registrant, adopted January 23, 2009, incorporated herein by reference to Exhibit 3.1 to the Registrant’s Current Report on Form 8-K filed January 23, 2009. | |
| 3.08 | Articles of Amendment to Articles of Incorporation of the Registrant, adopted February 11, 2009, incorporated herein by reference to Exhibit 3.1 to the Registrant’s Current Report on Form 8-K filed February 13, 2009. | |
| 3.09 | Articles of Amendment to the Articles of Incorporation of the Registrant, establishing the Junior Participating Preferred Stock, Series B, incorporated herein by reference to Exhibit 3.1 to the Registrant’s Current Report on Form 8-K filed April 21, 2011. | |
| 3.10 | Articles of Amendment to the Articles of Incorporation of the Registrant, adopted October 19, 2011, incorporated herein by reference to Exhibit 3.1 to the Registrant’s Current Report on Form 8-K filed October 25, 2011. | |
| 3.11 | Articles of Amendment to the Articles of Incorporation of the Registrant, adopted October 31, 2011, incorporated herein by reference to Exhibit 3.2 to the Registrant’s Quarterly Report on Form 10-Q filed November 10, 2011. | |
140
| 3.12 | Articles of Amendment to the Articles of Incorporation of the Registrant, adopted June 20, 2013, incorporated herein by reference to Exhibit 3.1 to the Registrant’s Quarterly Report on Form 10-Q filed August 5, 2013. | |
| 3.13 | Amended and Restated Bylaws of the Registrant, approved by the shareholders of the Registrant on May 7, 2015, incorporated herein by reference to Exhibit 3.1 to the Registrant’s Quarterly Report on Form 10-Q, filed August 7, 2015. | |
| 4.01 | Specimen of Registrant’s Common Stock Certificate, incorporated herein by reference to Exhibit 4.1 to the Registrant’s Quarterly Report on Form 10-Q filed August 5, 2013 | |
| 4.02 | Indenture dated as of November 4, 2005, between FNB Corp. and U.S. Bank, National Association, as trustee, incorporated herein by reference to Exhibit 4.1 to the Registrant’s Current Report on Form 8-K filed November 8, 2005. | |
| 4.03 | Amended and Restated Declaration of Trust of FNB United Statutory Trust I dated as of November 4, 2005, among FNB Corp., as sponsor, U.S. Bank, National Association, as institutional trustee, and Michael C. Miller and Jerry A. Little, as administrators, incorporated herein by reference to Exhibit 4.2 to the Registrant’s Current Report on Form 8-K filed November 8, 2005. | |
| 4.04 | Amended and Restated Declaration of Trust of FNB United Statutory Trust I dated as of November 4, 2005, among FNB Corp., as sponsor, U.S. Bank, National Association, as institutional trustee, and Michael C. Miller and Jerry A. Little, as administrators, incorporated herein by reference to Exhibit 4.2 to the Registrant’s Current Report on Form 8-K filed November 8, 2005. | |
| 4.05 | Amended and Restated Trust Agreement of FNB United Statutory Trust II dated as of April 27, 2006, among FNB Corp., as sponsor, Wilmington Trust Company, as institutional trustee, and Michael C. Miller and Jerry A. Little, as administrators, incorporated herein by reference to Exhibit 4.2 to the Registrant’s Current Report on Form 8-K filed April 28, 2006. | |
| 4.06 | Warrant to purchase up to 2,207,143 shares of common stock issued to the United States Department of the Treasury, incorporated herein by reference to Exhibit 4.2 to the Registrant’s Current Report on Form 8-K filed February 13, 2009. | |
| 4.07 | Amended Warrant to purchase up to 2,207,143 shares of common stock of the Registrant issued to the United States Department of the Treasury, incorporated herein by reference to Exhibit 4.1 to the Registrant’s Quarterly Report on Form 10-Q filed November 10, 2011. | |
| 10.01* | FNB United Corp. 2003 Stock Incentive Plan, as amended and restated as of December 31, 2008, incorporated herein by reference to Exhibit 10.23 to the Registrant’s Form 10-K Annual Report for the fiscal year ended December 31, 2008. | |
| 10.02* | Form of Incentive Stock Option Agreement between FNB Corp. and certain of its key employees, pursuant to the Registrant’s 2003 Stock Incentive Plan, incorporated herein by reference to Exhibit 10.24 to the Registrant’s Quarterly Report on Form 10-Q for the quarter ended September 30, 2003. | |
| 10.03* | Form of Nonqualified Stock Option Agreement between FNB Corp. and certain of its directors, pursuant to the Registrant’s 2003 Stock Incentive Plan, incorporated herein by reference to Exhibit 10.25 to the Registrant’s Form 10-K Annual Report for the fiscal year ended December 31, 2003. | |
141
| 10.04* | Form of Restricted Stock Agreement between FNB United Corp. and certain of its key employees and non-employee directors, pursuant to the Registrant’s 2003 Stock Incentive Plan, incorporated herein by reference to Exhibit 10.26 to the Registrant’s Quarterly Report on Form 10-Q for the quarter ended June 30, 2006. | |
| 10.05* | Carolina Fincorp, Inc. Stock Option Plan (assumed by the Registrant on April 10, 2000), incorporated herein by reference to Exhibit 99.1 to the Registrant’s Form S-8 Registration Statement (File No. 333-54702) filed January 31, 2001. | |
| 10.06 | Guarantee Agreement dated as of November 4, 2005, by FNB Corp. for the benefit of the holders of trust preferred securities, incorporated herein by reference to Exhibit 10.1 to the Registrant’s Current Report on Form 8-K filed November 5, 2005. | |
| 10.07 | Guarantee Agreement dated as of April 27, 2006 between FNB Corp. and Wilmington Trust Company, as guarantee trustee, for the benefit of the holders of trust preferred securities, incorporated herein by reference to Exhibit 10.1 to the Registrant’s Current Report on Form 8-K filed April 28, 2006. | |
| 10.08 | Investment Agreement, dated April 26, 2011, by and between FNB United Corp. and Carlyle Financial Services Harbor, L.P., incorporated herein by reference to Exhibit 10.1 to the Registrant’s Current Report on Form 8-K filed April 27, 2011. | |
| 10.09 | Amendment No. 1 to Investment Agreement, dated as of June 16, 2011, by and between FNB United Corp. and Carlyle Financial Services Harbor, L.P., incorporated herein by reference to Exhibit 10.2 to the Registrant’s Current Report on Form 8-K filed June 16, 2011. | |
| 10.10 | Amendment No. 2 to Investment Agreement, dated as of August 4, 2011, by and between FNB United Corp. and Carlyle Financial Services Harbor, L.P., incorporated herein by reference to Exhibit 10.2 to the Registrant’s Current Report on Form 8-K filed August 5, 2011. | |
| 10.11 | Amendment No. 3 dated October 20, 2011 to Investment Agreement by and between FNB United Corp. and Carlyle Financial Services Harbor, L.P., incorporated herein by reference to Exhibit 10.1 to the Registrant’s Quarterly Report on Form 10-Q filed November 10, 2011. | |
| 10.12 | Investment Agreement, dated April 26, 2011, by and between FNB United Corp. and Oak Hill Capital Partners III, L.P. and Oak Hill Capital Management Partners III, L.P., incorporated herein by reference to Exhibit 10.2 to the Registrant’s Current Report on Form 8-K filed April 27, 2011. | |
| 10.13 | Amendment No. 1 to Investment Agreement, dated as of June 16, 2011, by and between FNB United Corp. and Oak Hill Capital Partners III, L.P. and Oak Hill Capital Management Partners III, L.P., incorporated herein by reference to Exhibit 10.3 to the Registrant’s Current Report on Form 8-K filed June 16, 2011. | |
| 10.14 | Amendment No. 2 to Investment Agreement, dated as of August 4, 2011, by and between FNB United Corp. and Oak Hill Capital Partners III, L.P. and Oak Hill Capital Management Partners III, L.P., incorporated herein by reference to Exhibit 10.2 to the Registrant’s Current Report on Form 8-K filed August 5, 2011. | |
| 10.15 | Amendment No. 3 dated October 20, 2011 to Investment Agreement by and between FNB United Corp., Oak Hill Capital Partners III, L.P. and Oak Hill Capital Management Partners III., L.P., incorporated herein by reference to Exhibit 10.2 to the Registrant’s Quarterly Report on Form 10-Q filed November 10, 2011. | |
| 10.16 | Form of Amended and Restated Subscription Agreement by and between FNB United Corp. and private placement investors, incorporated herein by reference to Exhibit 10.1 to the Registrant’s Current Report on Form 8-K filed August 5, 2011. | |
| 10.17 | Form of Subscription Agreement (Directors and Officers) by and between FNB United Corp. and private placement investors, incorporated herein by reference to Exhibit 10.36 to the Registrant’s Form S-4 Registration Statement (File No. 333-176357) filed August 17, 2011. | |
142
| 10.18 | Form of Subscription Agreement, dated December 29, 2014, by and between CommunityOne Bancorp and private placement investors, incorporated herein by reference to Exhibit 10.1 to the Registrant’s Current Report on Form 8-K filed December 30, 2014. | |
| 10.19 | Exchange Agreement, dated as of August 15, 2011, by and between FNB United Corp. and The United States Department of the Treasury, incorporated herein by reference to Exhibit 10.1 to the Registrant’s Current Report on Form 8-K filed August 18, 2011. | |
| 10.20* | Employment Agreement by and among FNB United Corp., CommunityOne Bank, National Association and Brian E. Simpson, dated as of October 21, 2011, incorporated herein by reference to Exhibit 10.1 to the Registrant’s Current Report on Form 8-K filed October 25, 2011. | |
| 10.21* | Employment Agreement by and among FNB United Corp., CommunityOne Bank, National Association and Robert L. Reid, dated as of October 21, 2011, incorporated herein by reference to Exhibit 10.2 to the Registrant’s Current Report on Form 8-K filed October 25, 2011. | |
| 10.22* | Employment Agreement by and among FNB United Corp., CommunityOne Bank, National Association and David L. Nielsen, dated as of October 21, 2011, incorporated herein by reference to Exhibit 10.3 to the Registrant’s Current Report on Form 8-K filed October 25, 2011. | |
| 10.23* | Separation Agreement by and among CommunityOne Bancorp, CommunityOne Bank, National Association and Brian E. Simpson, dated as of September 11, 2014, incorporated herein by reference to Exhibit 10.1 to the Registrant’s Current Report on Form 8-K filed September 12, 2014. | |
| 10.24* | Consulting Agreement by and among CommunityOne Bancorp, CommunityOne Bank, National Association and Brian E. Simpson, dated as of September 11, 2014, incorporated herein by reference to Exhibit 10.2 to the Registrant’s Current Report on Form 8-K filed September 12, 2014. | |
| 10.25* | Employment Agreement by and among CommunityOne Bancorp, CommunityOne Bank, National Association and Robert L. Reid, dated as of October 1, 2014, incorporated herein by reference to Exhibit 10.1 to the Registrant’s Current Report on Form 8-K, filed October 6, 2014. | |
| 10.26* | Employment Agreement by and among CommunityOne Bancorp, CommunityOne Bank, National Association and certain Named Executive Officers, dated as of October 1, 2014, incorporated herein by reference to Exhibit 10.2 to the Registrant’s Current Report on Form 8-K, filed October 6, 2014. | |
| 10.27* | FNB United Corp. Amended and Restated 2012 Incentive Plan, incorporated herein by reference to Appendix B of Registrant's Proxy Statement on Schedule 14A Information filed April 24, 2013. | |
| 10.28* | Form of Restricted Stock Agreement between FNB United Corp and certain executive officers, pursuant to the Registrant's 2012 Incentive Plan, incorporated herein by reference to Exhibit 10.34 to the Registrant’s Form 10-K Annual Report for the fiscal year ended December 31, 2012. | |
| 10.29* | Form of Stock Incentive Award Agreement between CommunityOne Bancorp and certain officers, pursuant to the Registrant’s Amended and Restated 2012 Incentive Plan. | |
| 10.30* | Form of Restricted Stock Agreement between CommunityOne Bancorp and certain officers, pursuant to the Registrant’s Amended and Restated 2012 Incentive Plan. | |
| 10.31* | Form of Restricted Stock Agreement between CommunityOne Bancorp and the non-executive directors, pursuant to the Registrant’s Amended and Restated 2012 Incentive Plan. | |
| 10.32* | Form of Restricted Stock Agreement between CommunityOne Bancorp and certain Named Executive Officers, pursuant to the Registrant’s 2012 Incentive Plan, incorporated herein by reference to Exhibit 10.3 to the Registrant’s Current Report on Form 8-K, filed October 6, 2014. | |
| 10.33* | Form of Stock Option Agreement between CommunityOne Bancorp and certain Named Executive Officers, pursuant to the Registrant’s 2012 Incentive Plan, incorporated herein by reference to Exhibit 10.4 to the Registrant’s Current Report on Form 8-K, filed October 6, 2014. | |
143
| 10.34* | Form of Change in Control Severance Agreement, dated April 15, 2015, by and between CommunityOne Bank, N.A. and certain officers, incorporated herein by reference to Exhibit 10.1 to the Registrant’s Current Report on Form 8-K, filed April 17, 2015. | |
| 10.35 | Letter Agreement, by and between Carlyle Financial Services Harbor, L.P. and Capital Bank Financial Corp., dated November 22, 2015, incorporated herein by referenced to Exhibit 10.1 to the Registrant’s Current Report on Form 8-K, filed November 24, 2015. | |
| 10.36 | Letter Agreement, by and between Oak Hill Capital Partners III, L.P., Oak Hill Capital Management Partners III, L.P. and Capital Bank Financial Corp., dated November 22, 2015, incorporated herein by referenced to Exhibit 10.2 to the Registrant’s Current Report on Form 8-K, filed November 24, 2015. | |
| 10.37 | Letter Agreement, by and between R. Eugene Taylor and CommunityOne Bancorp, dated November 22, 2015, incorporated herein by referenced to Exhibit 10.3 to the Registrant’s Current Report on Form 8-K, filed November 24, 2015. | |
| 10.38 | Letter Agreement, by and between Crestview-NAHF, LLC and CommunityOne Bancorp, dated November 22, 2015, incorporated herein by referenced to Exhibit 10.4 to the Registrant’s Current Report on Form 8-K, filed November 24, 2015. | |
| 10.39* | Letter Agreement, by and among Robert L. Reid, CommunityOne Bancorp and CommunityOne Bank, N.A., dated November 22, 2015, incorporated herein by referenced to Exhibit 10.5 to the Registrant’s Current Report on Form 8-K, filed November 24, 2015. | |
| 10.40* | Letter Agreement, by and among David L. Nielsen, CommunityOne Bancorp and CommunityOne Bank, N.A., dated November 22, 2015, incorporated herein by referenced to Exhibit 10.6 to the Registrant’s Current Report on Form 8-K, filed November 24, 2015. | |
| 10.41* | Letter Agreement, by and among Beth S. DeSimone, CommunityOne Bancorp and CommunityOne Bank, N.A., dated November 22, 2015, incorporated herein by referenced to Exhibit 10.7 to the Registrant’s Current Report on Form 8-K, filed November 24, 2015. | |
| 10.42* | Letter Agreement, by and among Gregory P. Murphy, CommunityOne Bancorp and CommunityOne Bank, N.A., dated November 22, 2015, incorporated herein by referenced to Exhibit 10.8 to the Registrant’s Current Report on Form 8-K, filed November 24, 2015. | |
| 10.43* | Letter Agreement, by and among Angus M. McBryde, III, CommunityOne Bancorp and CommunityOne Bank, N.A., dated November 22, 2015, incorporated herein by referenced to Exhibit 10.9 to the Registrant’s Current Report on Form 8-K, filed November 24, 2015. | |
| 21.01 | Subsidiaries of the Registrant. | |
| 23.01 | Consent of Independent Registered Public Accounting Firm – Dixon Hughes Goodman LLP | |
| 31.01 | Certification of Chief Executive Officer Pursuant to Section 302 of the Sarbanes-Oxley Act of 2002. | |
| 31.02 | Certification of Chief Financial Officer Pursuant to Section 302 of the Sarbanes-Oxley Act of 2002. | |
| 32.01 | Certification Pursuant to Section 906 of the Sarbanes-Oxley Act of 2002. | |
| * | Management contract, or compensatory plan or arrangement. |
144
SIGNATURES
Pursuant to the requirements of Section 13 or 15(d) of the Securities Exchange Act of 1934, the Registrant has duly caused this report to be signed on its behalf by the undersigned, thereunto duly authorized, as of March 11, 2016.
| CommunityOne Bancorp | ||
(Registrant) | ||
| By: | /s/ ROBERT L. REID | |
| Robert L. Reid | ||
| President and Chief Executive Officer | ||
Pursuant to the requirements of the Securities Exchange Act of 1934, this report has been signed below by the following persons on behalf of the Registrant and in the capacities indicated, as of March 11, 2016.
| Signature | Title | |||
/s/ ROBERT L. REID | President, Chief Executive Officer and Director | |||
| Robert L. Reid | (Principal Executive Officer) | |||
/s/ DAVID L. NIELSEN | Executive Vice President | |||
| David L. Nielsen | (Principal Financial and Accounting Officer) | |||
/s/ SCOTT B. KAUFFMAN | Director | |||
| Scott B. Kauffman | ||||
/s/ JERRY R. LICARI | Director | |||
| Jerry R. Licari | ||||
/s/ J. CHANDLER MARTIN | Director | |||
| J. Chandler Martin | ||||
/s/ T. GRAY MCCASKILL | Director | |||
| T. Gray McCaskill | ||||
/s/ H. RAY MCKENNEY, JR. | Director | |||
| H. Ray McKenney, Jr. | ||||
/s/ JOHN C. REDETT | Director | |||
| John C. Redett | ||||
/s/ BOYD C. WILSON, JR. | Director | |||
| Boyd C. Wilson, Jr. | ||||
145